Notebookcheck Logo

Recensione dell'AMD Radeon RX 6900 XT: Prestazioni vicine alla RTX 3090 per 500 dollari in meno, ma solo marginalmente migliore rispetto alla RX 6800 XT

Radeon è rientrata nella discussione. La Radeon RX 6900 XT segna il rientro di AMD nello spazio delle GPU di punta dopo l'uscita della R9 Fury X nel 2015. La RX 6900 XT offre eccellenti prestazioni raster che la mettono saldamente alla portata della NVIDIA GeForce RTX 3090 nonostante alcune carenze nel ray tracing e la mancanza di super campionamento basato su AI. Sottoponiamo la AMD Radeon RX 6900 XT ad un test drive e vediamo come il Team Red ha fatto progressi con RDNA 2 finora.

AMD è andata giù duro contro Intel nello spazio CPU con la Ryzen, ma l'unità Radeon è rimasta significativamente indietro rispetto alla concorrenza finora. L'ultima volta che abbiamo visto una scheda grafica di punta di AMD essere menzionata nello stesso respiro di quella di NVIDIA è stata la Radeon R9 Fury X che ha gareggiato con la NVIDIA Maxwell GeForce 980 Ti già nel 2015.

Per molto tempo, i dispositivi di punta Turing di NVIDIA sono rimasti incontrastati. Le AMD Vega 56, Vega 64 e la Radeon VII hanno fatto poco per rendere insonni le notti di NVIDIA. È stato solo nel luglio 2019 che AMD ha assaggiato un moderato successo con la Radeon RX 5700 XT ma che era al massimo paragonabile alla GeForce RTX 2070 Super.

Tutto questo ora è storia. Lo scorso ottobre, AMD ha presentato ufficialmente le schede della serie Radeon RX 6000, composta dalle RX 6800, RX 6800 XTla RX 6900 XT e, più recentemente, la RX 6700 XT con la promessa di sfidare le offerte di fascia alta di NVIDIA come le RTX 3070, RTX 3080 e RTX 3090 per i giochi a 1440p e 4K.

La RX 6900 XT è stata indicata come un concorrente della RTX 3090, almeno in termini di prestazioni pure (con limitazioni, naturalmente). Le schede NVIDIA hanno attualmente il sopravvento quando si tratta di caratteristiche come il ray tracing e il super sampling basato sull'AI. Tuttavia, la RX 6900 XT ha anche alcuni assi nella manica.

In questa recensione, abbiamo messo la scheda top dog Navi 21 XTX sui suoi passi per vedere se ha il coraggio di sfidare il Golia Ampere di NVIDIA.

Confronto della Radeon RX 6900 XT con altre GPU AMD

Specifiche RadeonRX 6900 XT RadeonRX 6800 XT Radeon RX6800 RadeonRX 6700 XT RadeonRX 5700 XT RadeonRX 5700 RadeonVII
GPU Navi21 XTX Navi 21 XT Navi 21 XL Navi 22 Navi 10 XT Navi 10 XL Vega 20 XT
Processo di produzione 7nm 7 nm 7 nm 7 nm 7 nm 7 nm 7 nm
ComputeUnits 80 72 60 40 40 36 60
ShadingUnits 5,120 4,608 3,840 2,560 2,560 2,304 3,840
Unità di Texture Mapping 320 288 240 160 160 144 240
RayAccelerators 80 72 60 40 -- -- --
Base Clock 1,825 MHz 1,825 MHz 1,700 MHz 2,321 MHz 1,605 MHz 1,465 MHz 1,400 MHz
Game Clock 2,015 MHz 2,015 MHz 1,815 MHz 2,424 MHz 1,755 MHz 1,625 MHz 1,750 MHz
Boost Clock 2.250 MHz 2.250 MHz 2.105 MHz 2.581 MHz 1.905 MHz 1.725 MHz 1.802 MHz
Infinity Cache 128MB 128 MB 128 MB 96 MB
Memory BusWidth 256-bit 256-bit 256-bit 192-bit 256-bit 256-bit 4096-bit
Larghezza di banda della memoria 512GB/s 512 GB/s 512 GB/s 384 GB/s 448 GB/s 448 GB/s 1,024 GB/s
Dimensione della memoria 16GB GDDR6 16 GB GDDR6 16 GB GDDR6 12 GB GDDR6 8 GB GDDR6 8 GB GDDR6 16 GB HBM2
TBP 300W 300 W 250 W 230 W 225 W 180 W 295 W

Un tour della AMD Radeon RX 6900 XT

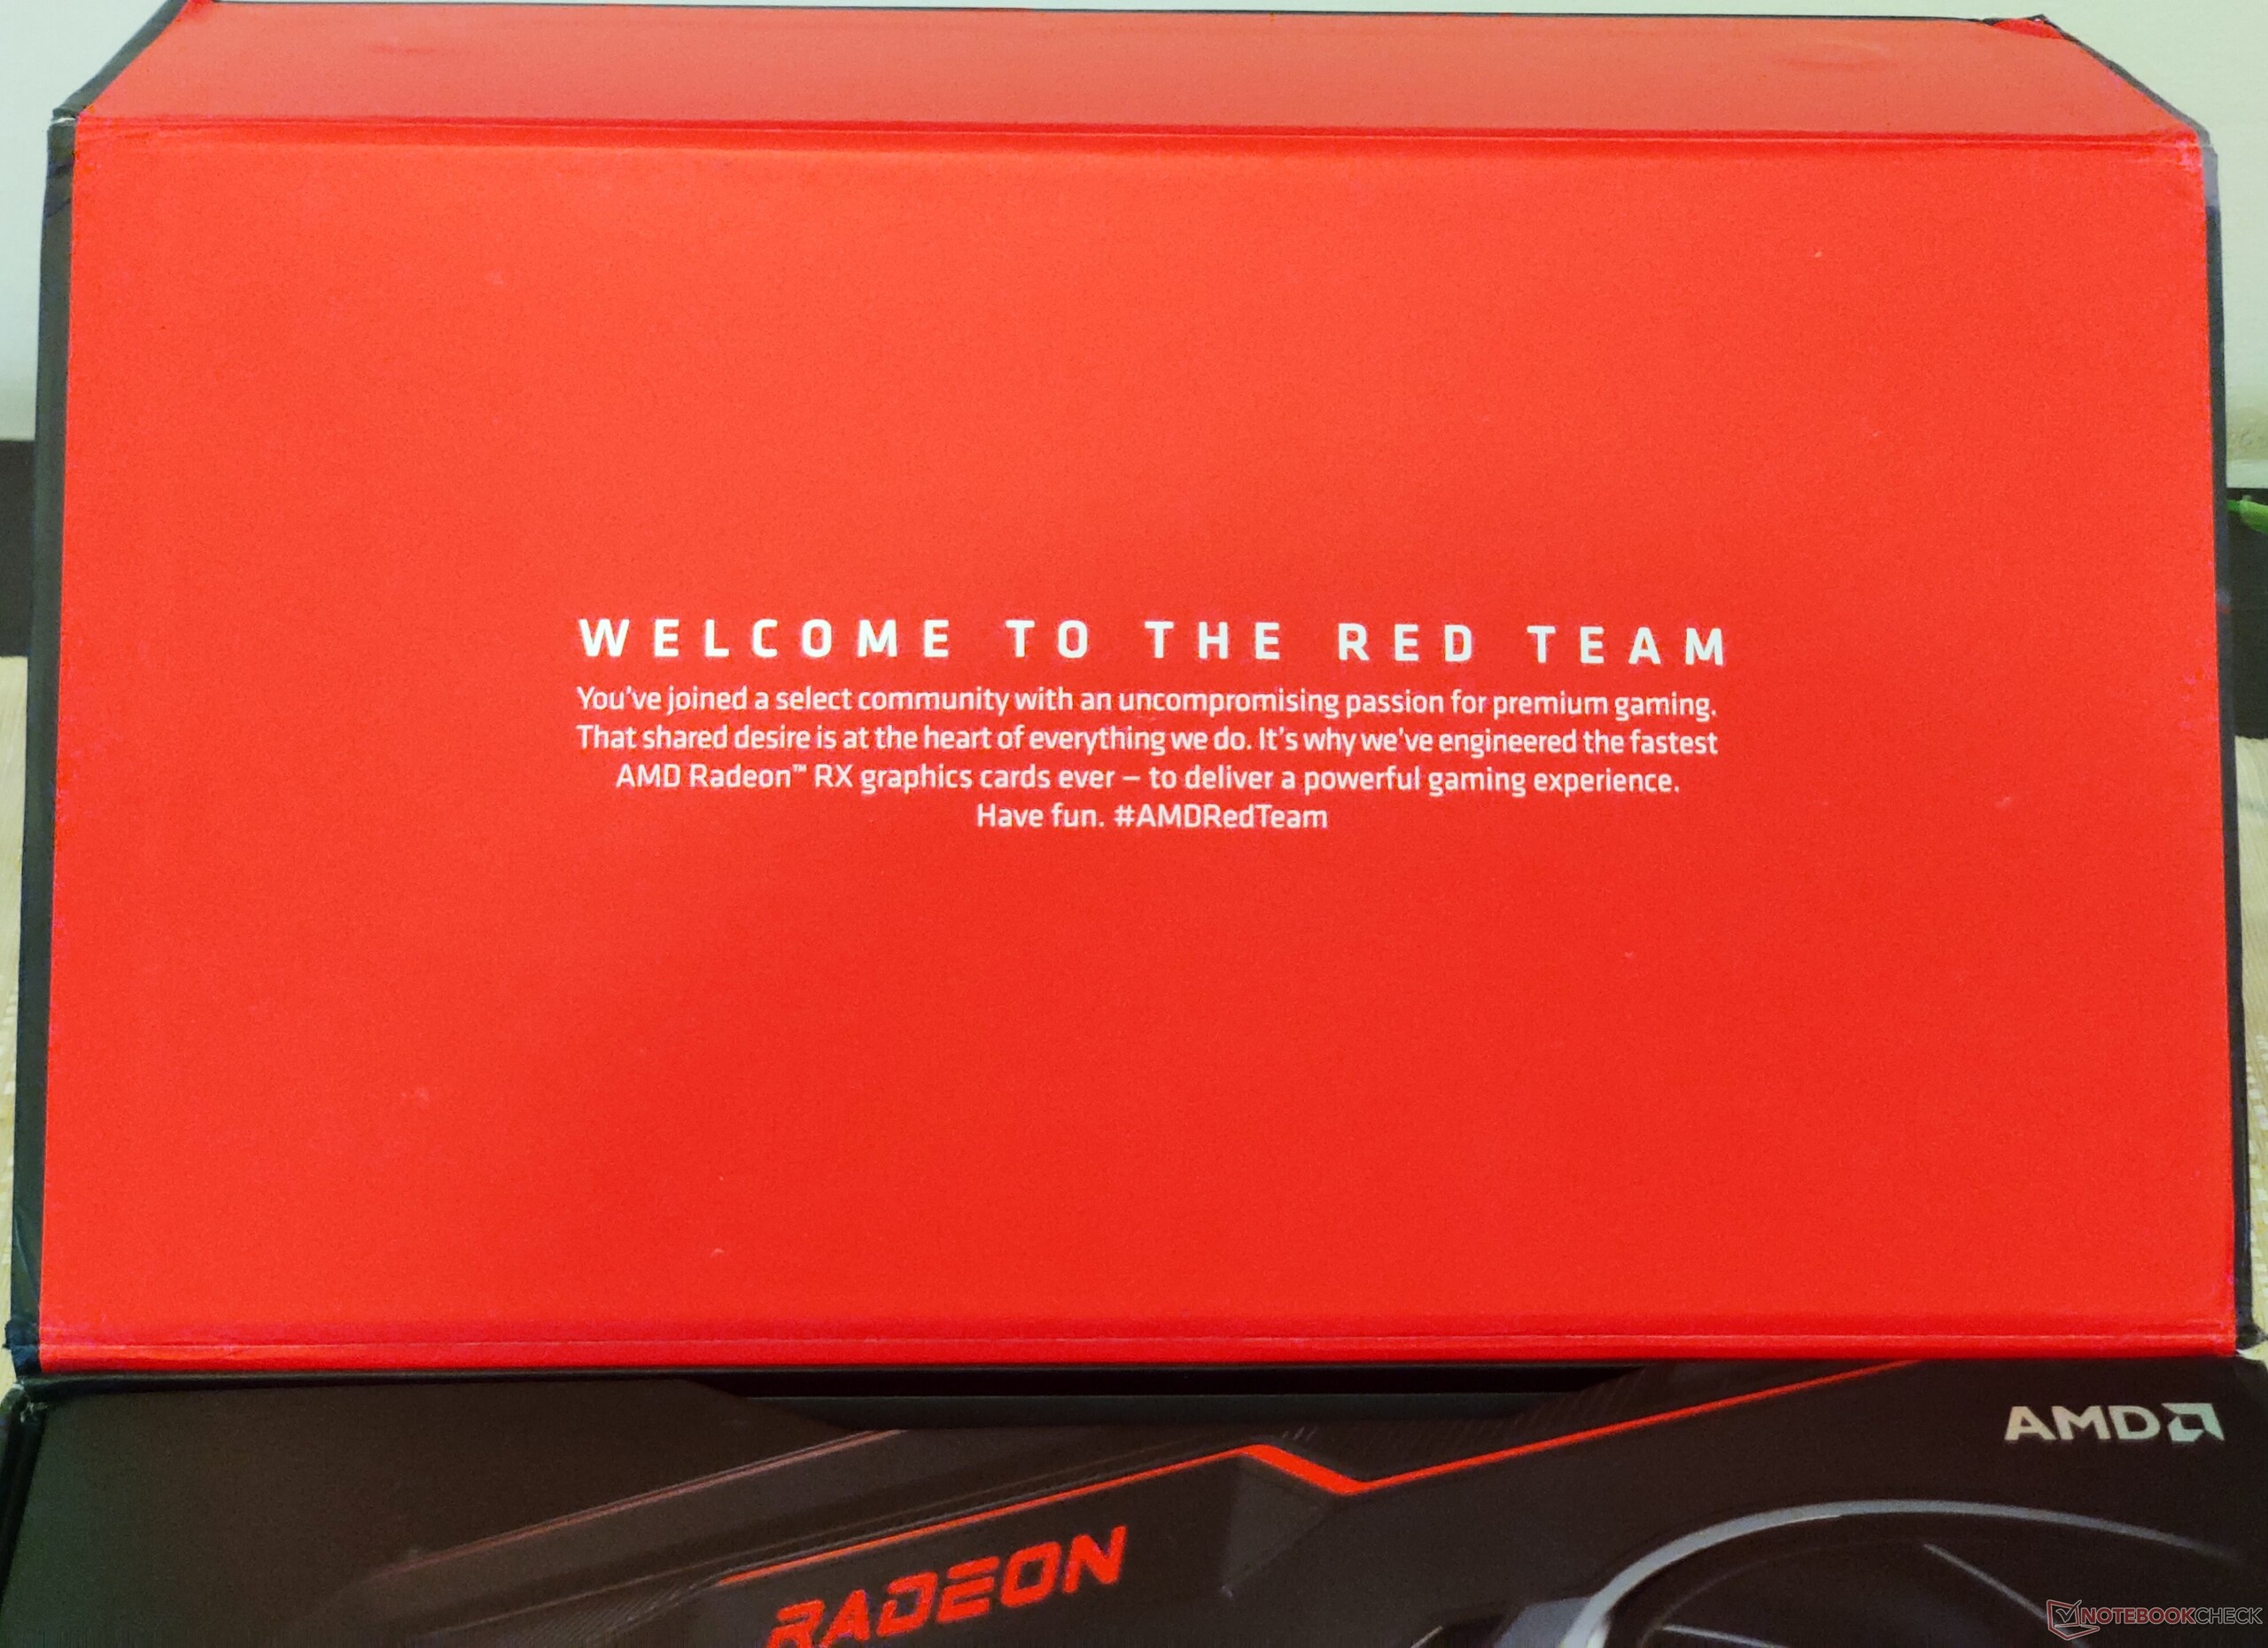
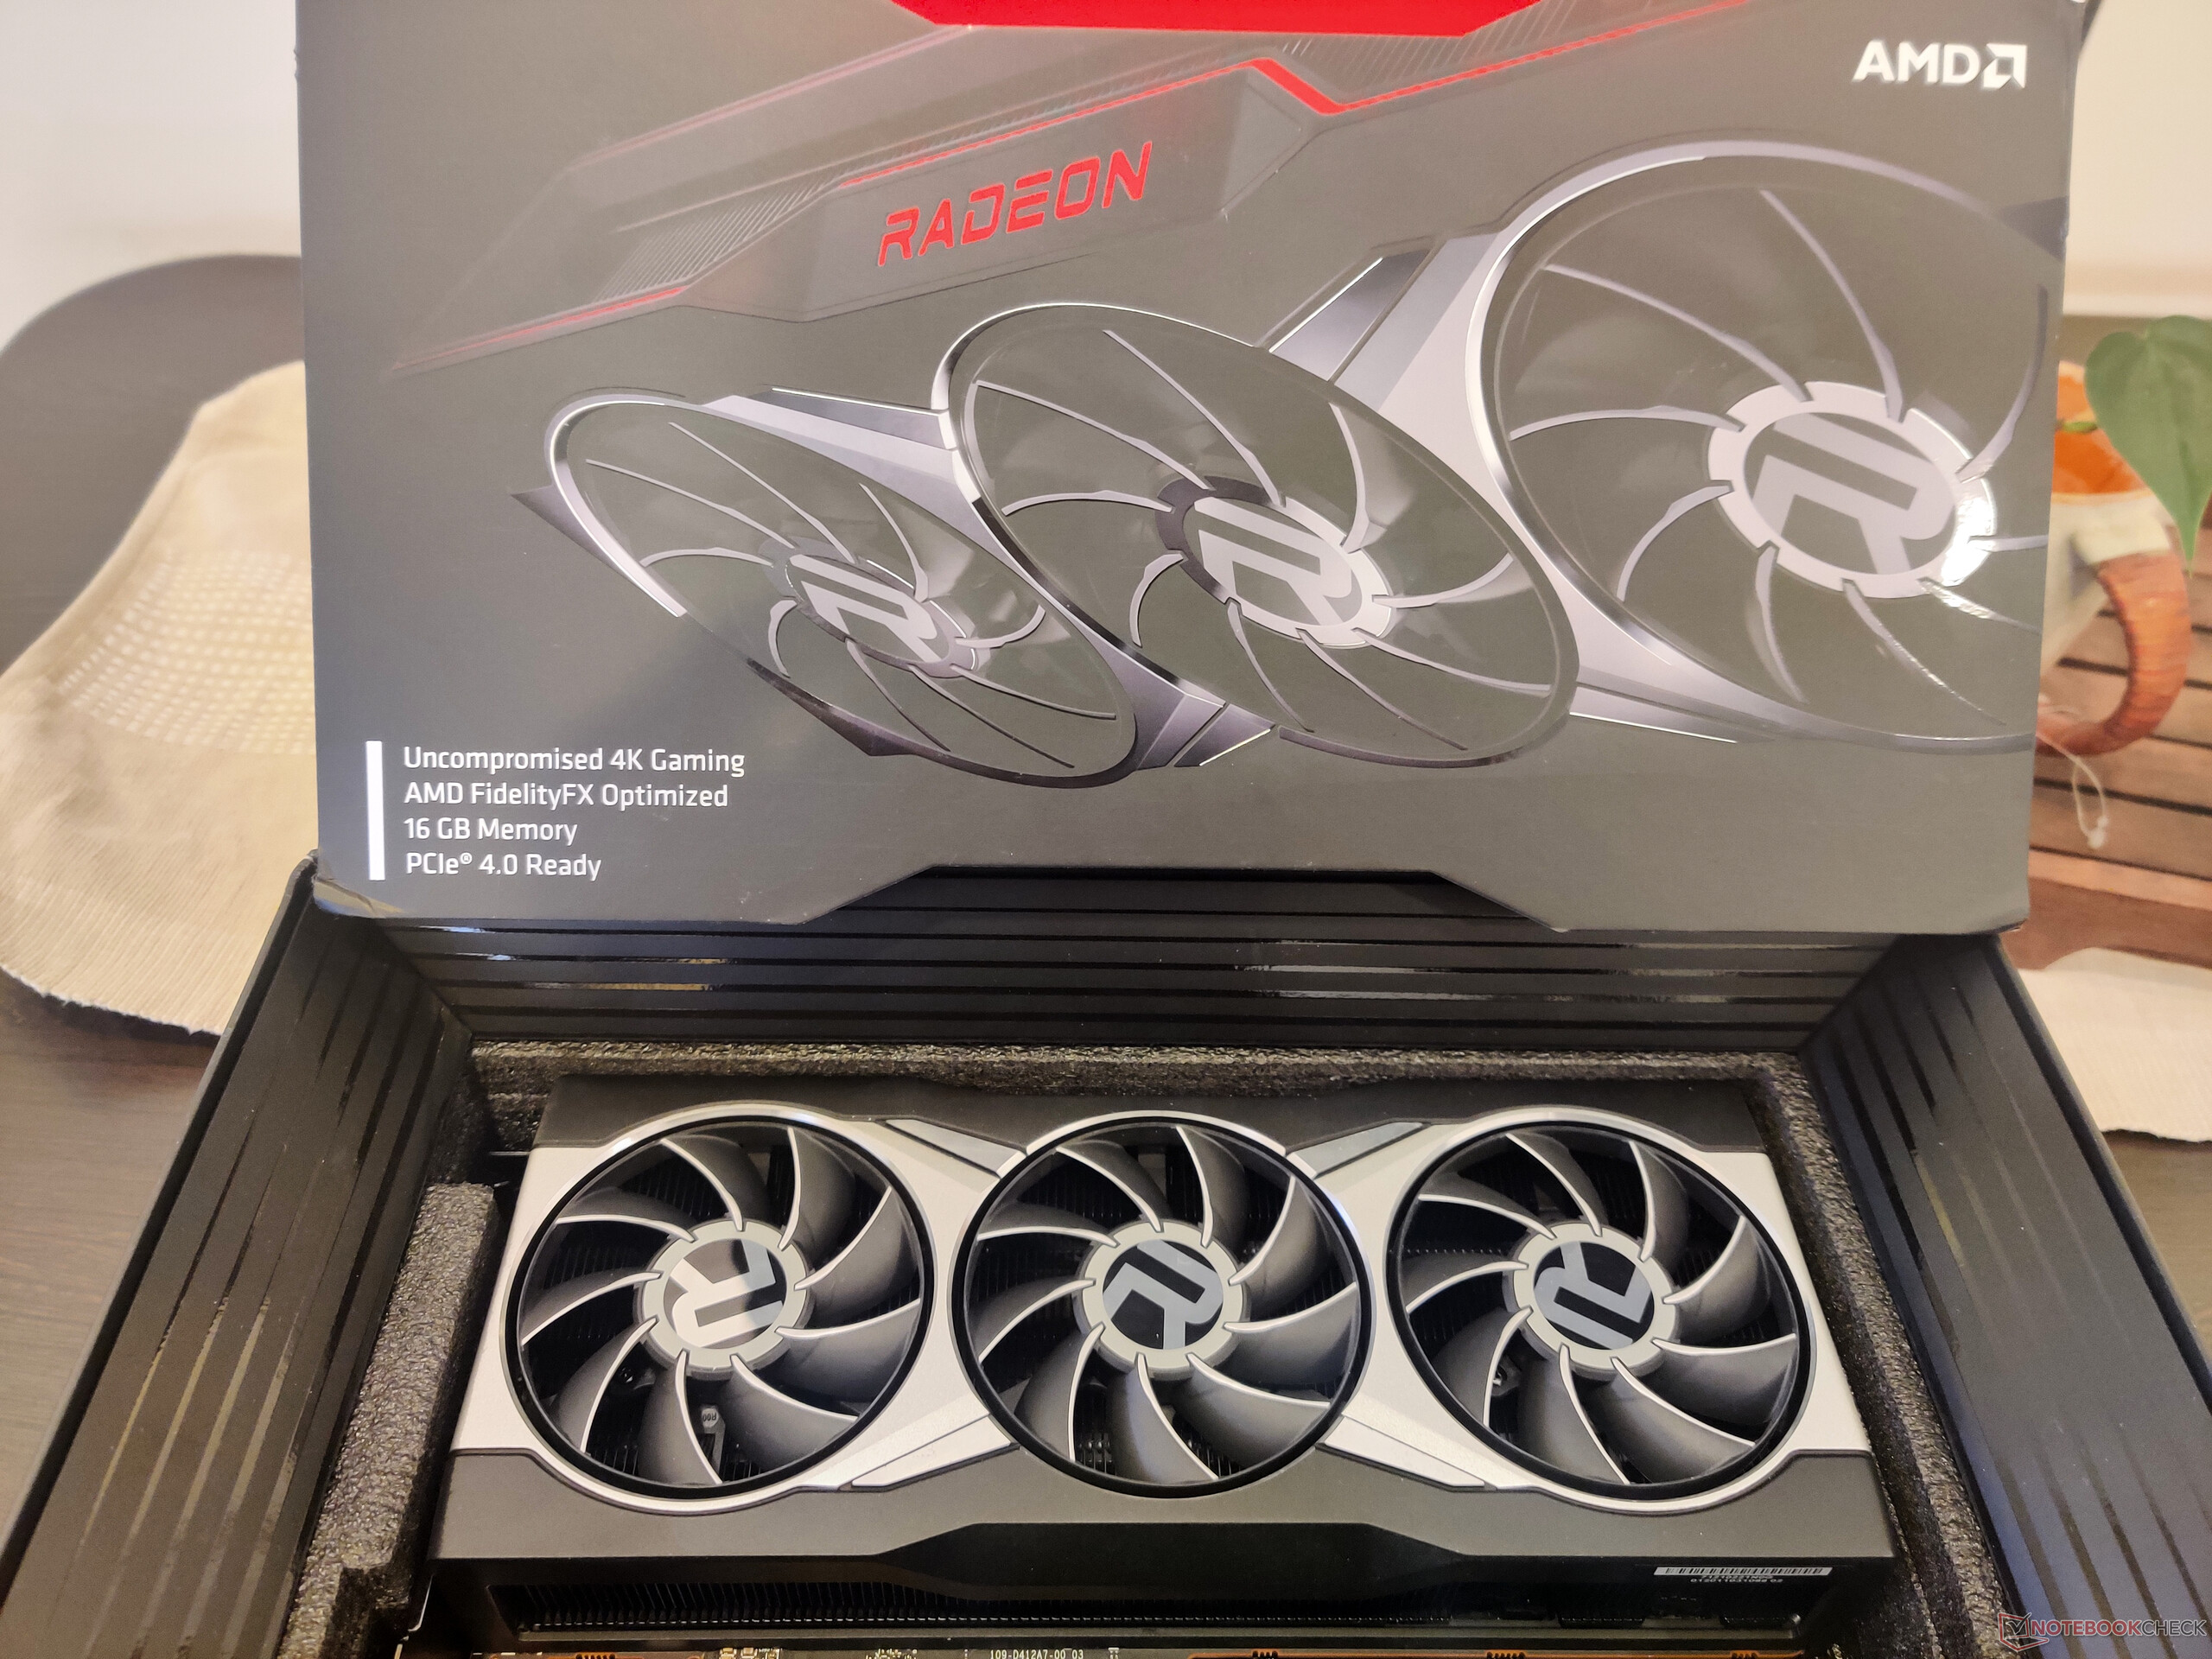
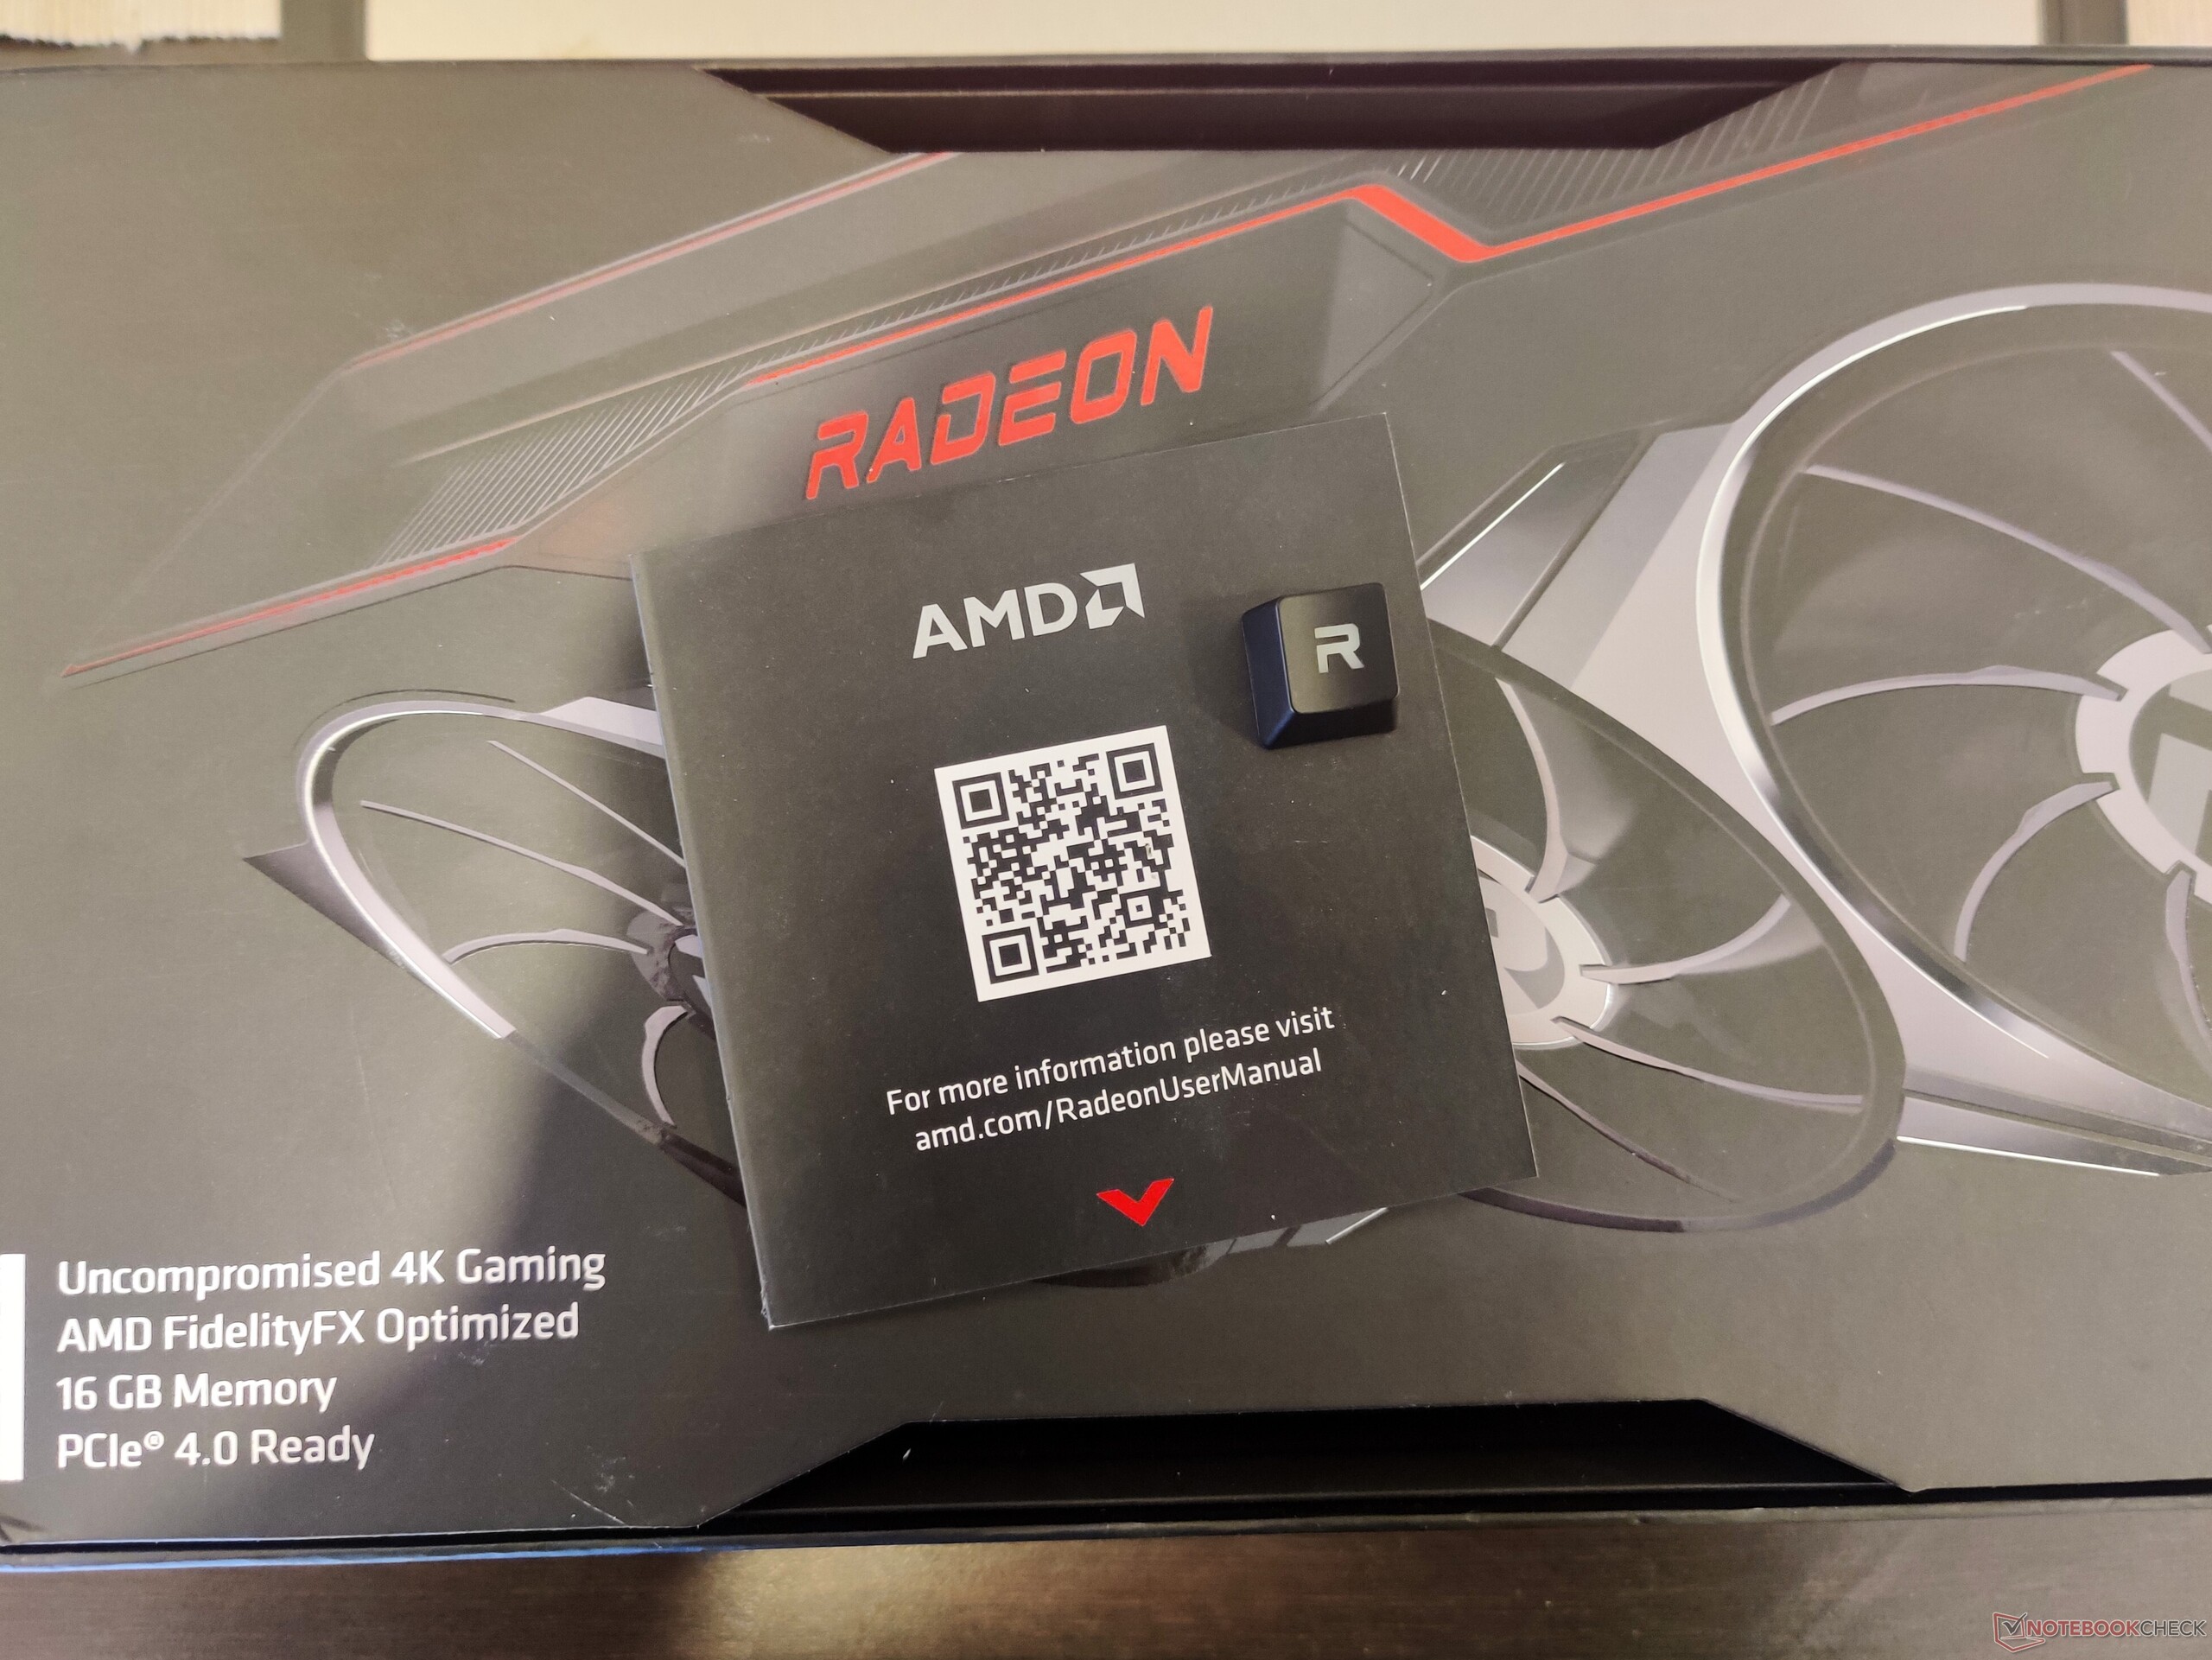
All'apertura della confezione, siamo stati accolti da un messaggio "Welcome to the Red Team". La confezione include un cartone Radeon in cui sono racchiusi una guida rapida e un tasto "R" della tastiera. Il tasto "R" è modellato nel tipico carattere Radeon e permette alla luce RGB di passare attraverso. Sfortunatamente, il nostro pacchetto non aveva un tappetino per il mouse a marchio AMD incluso, che dovrebbe, comunque, essere presente nella confezione.

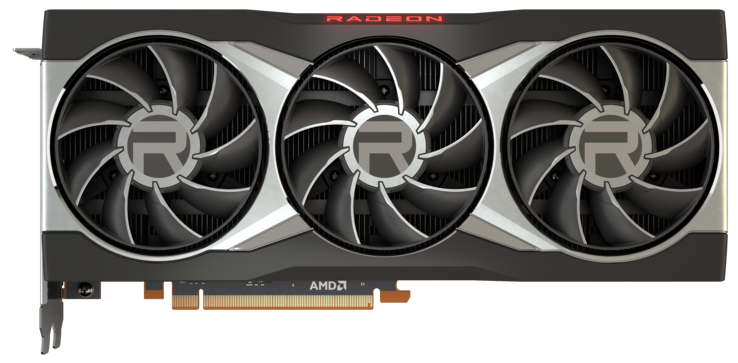
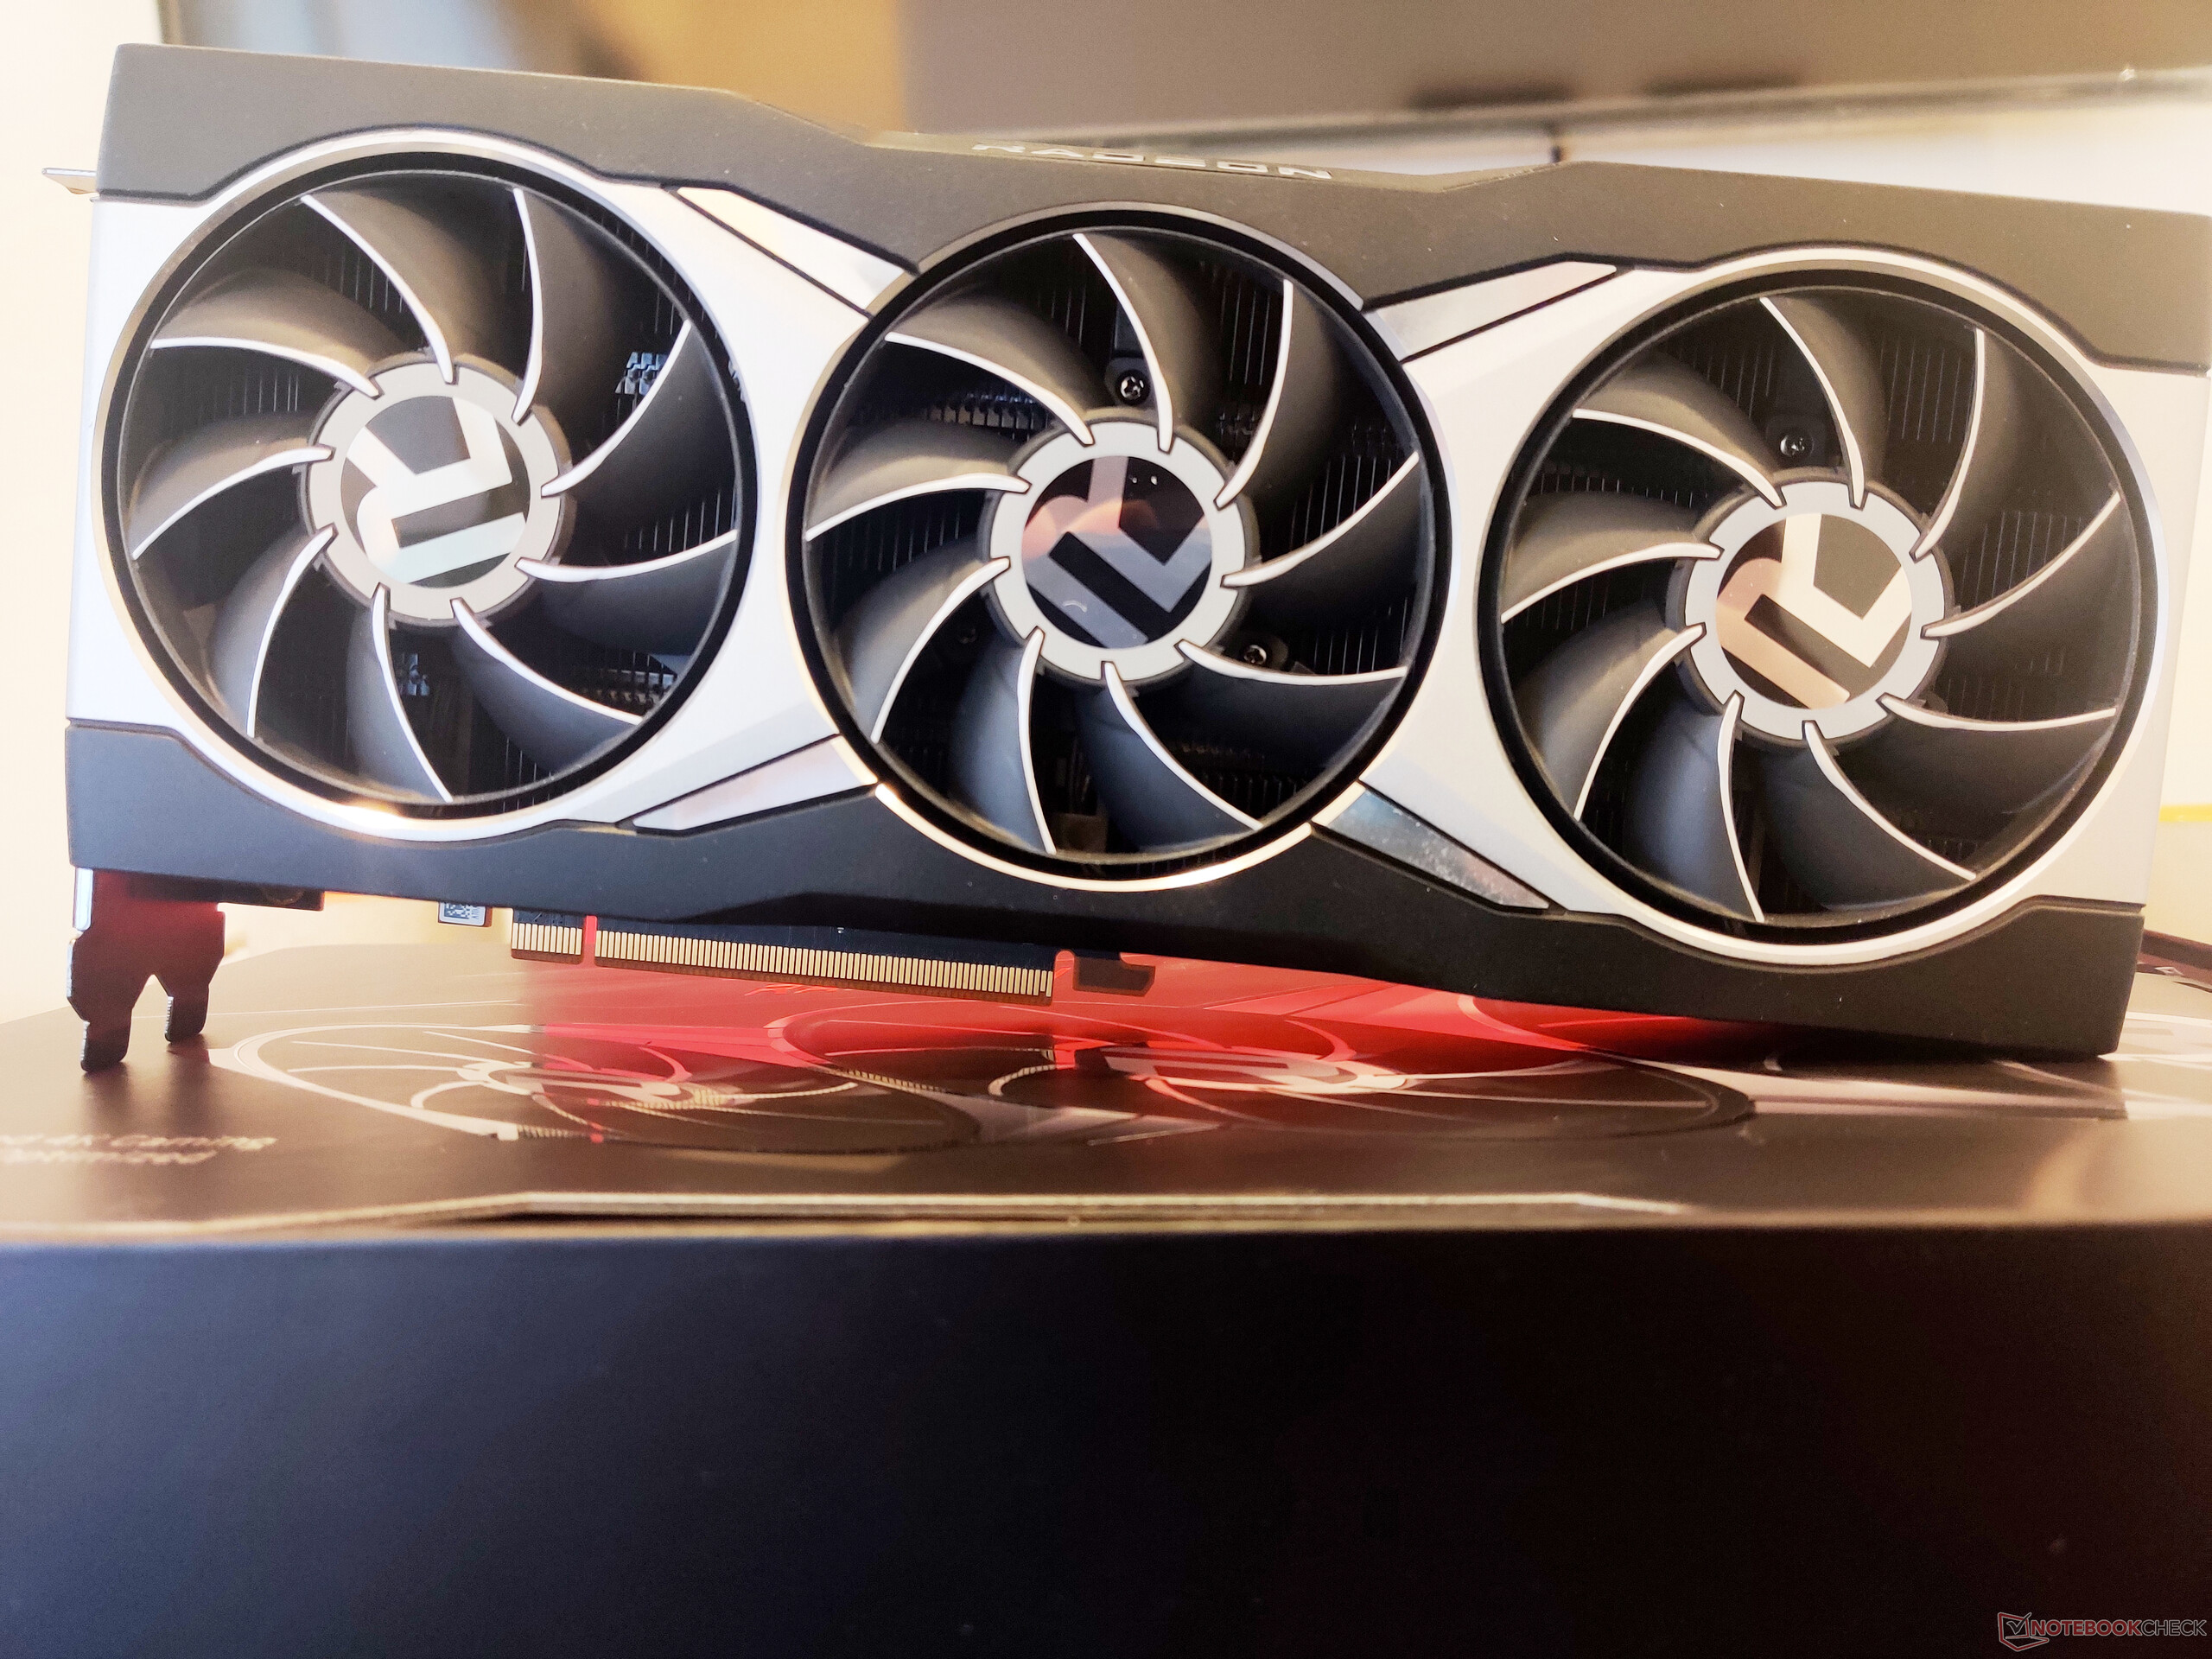
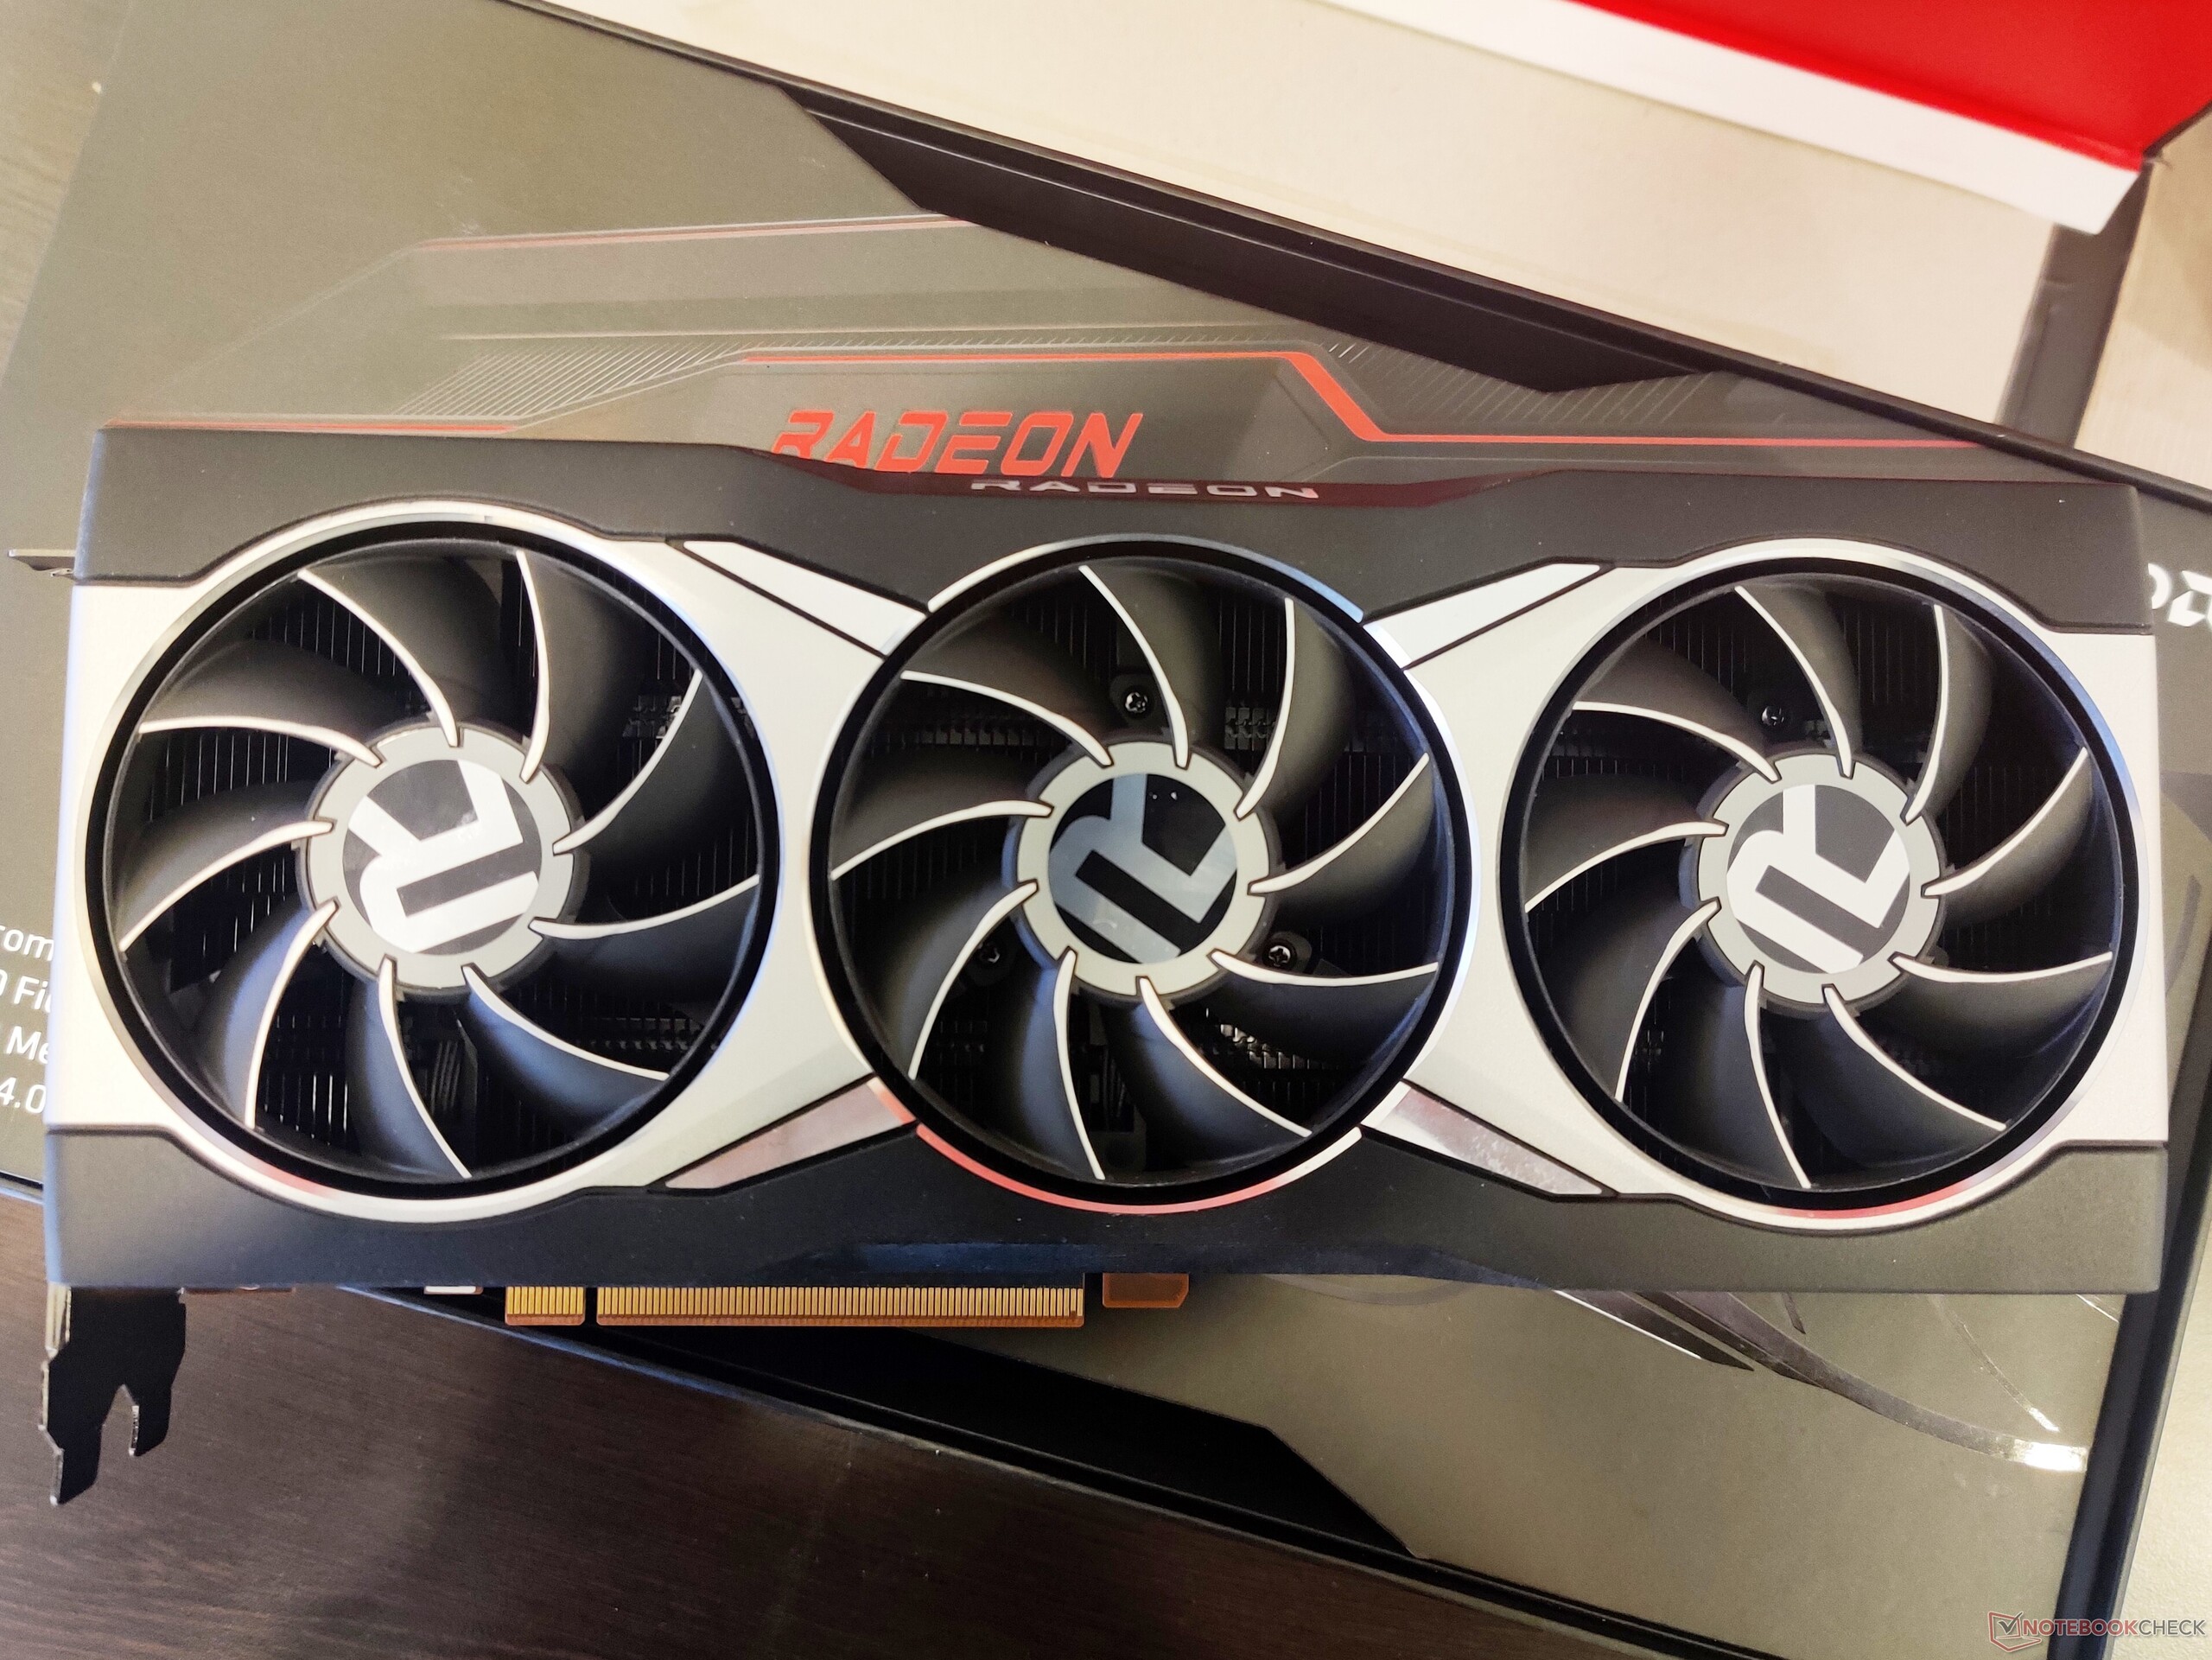
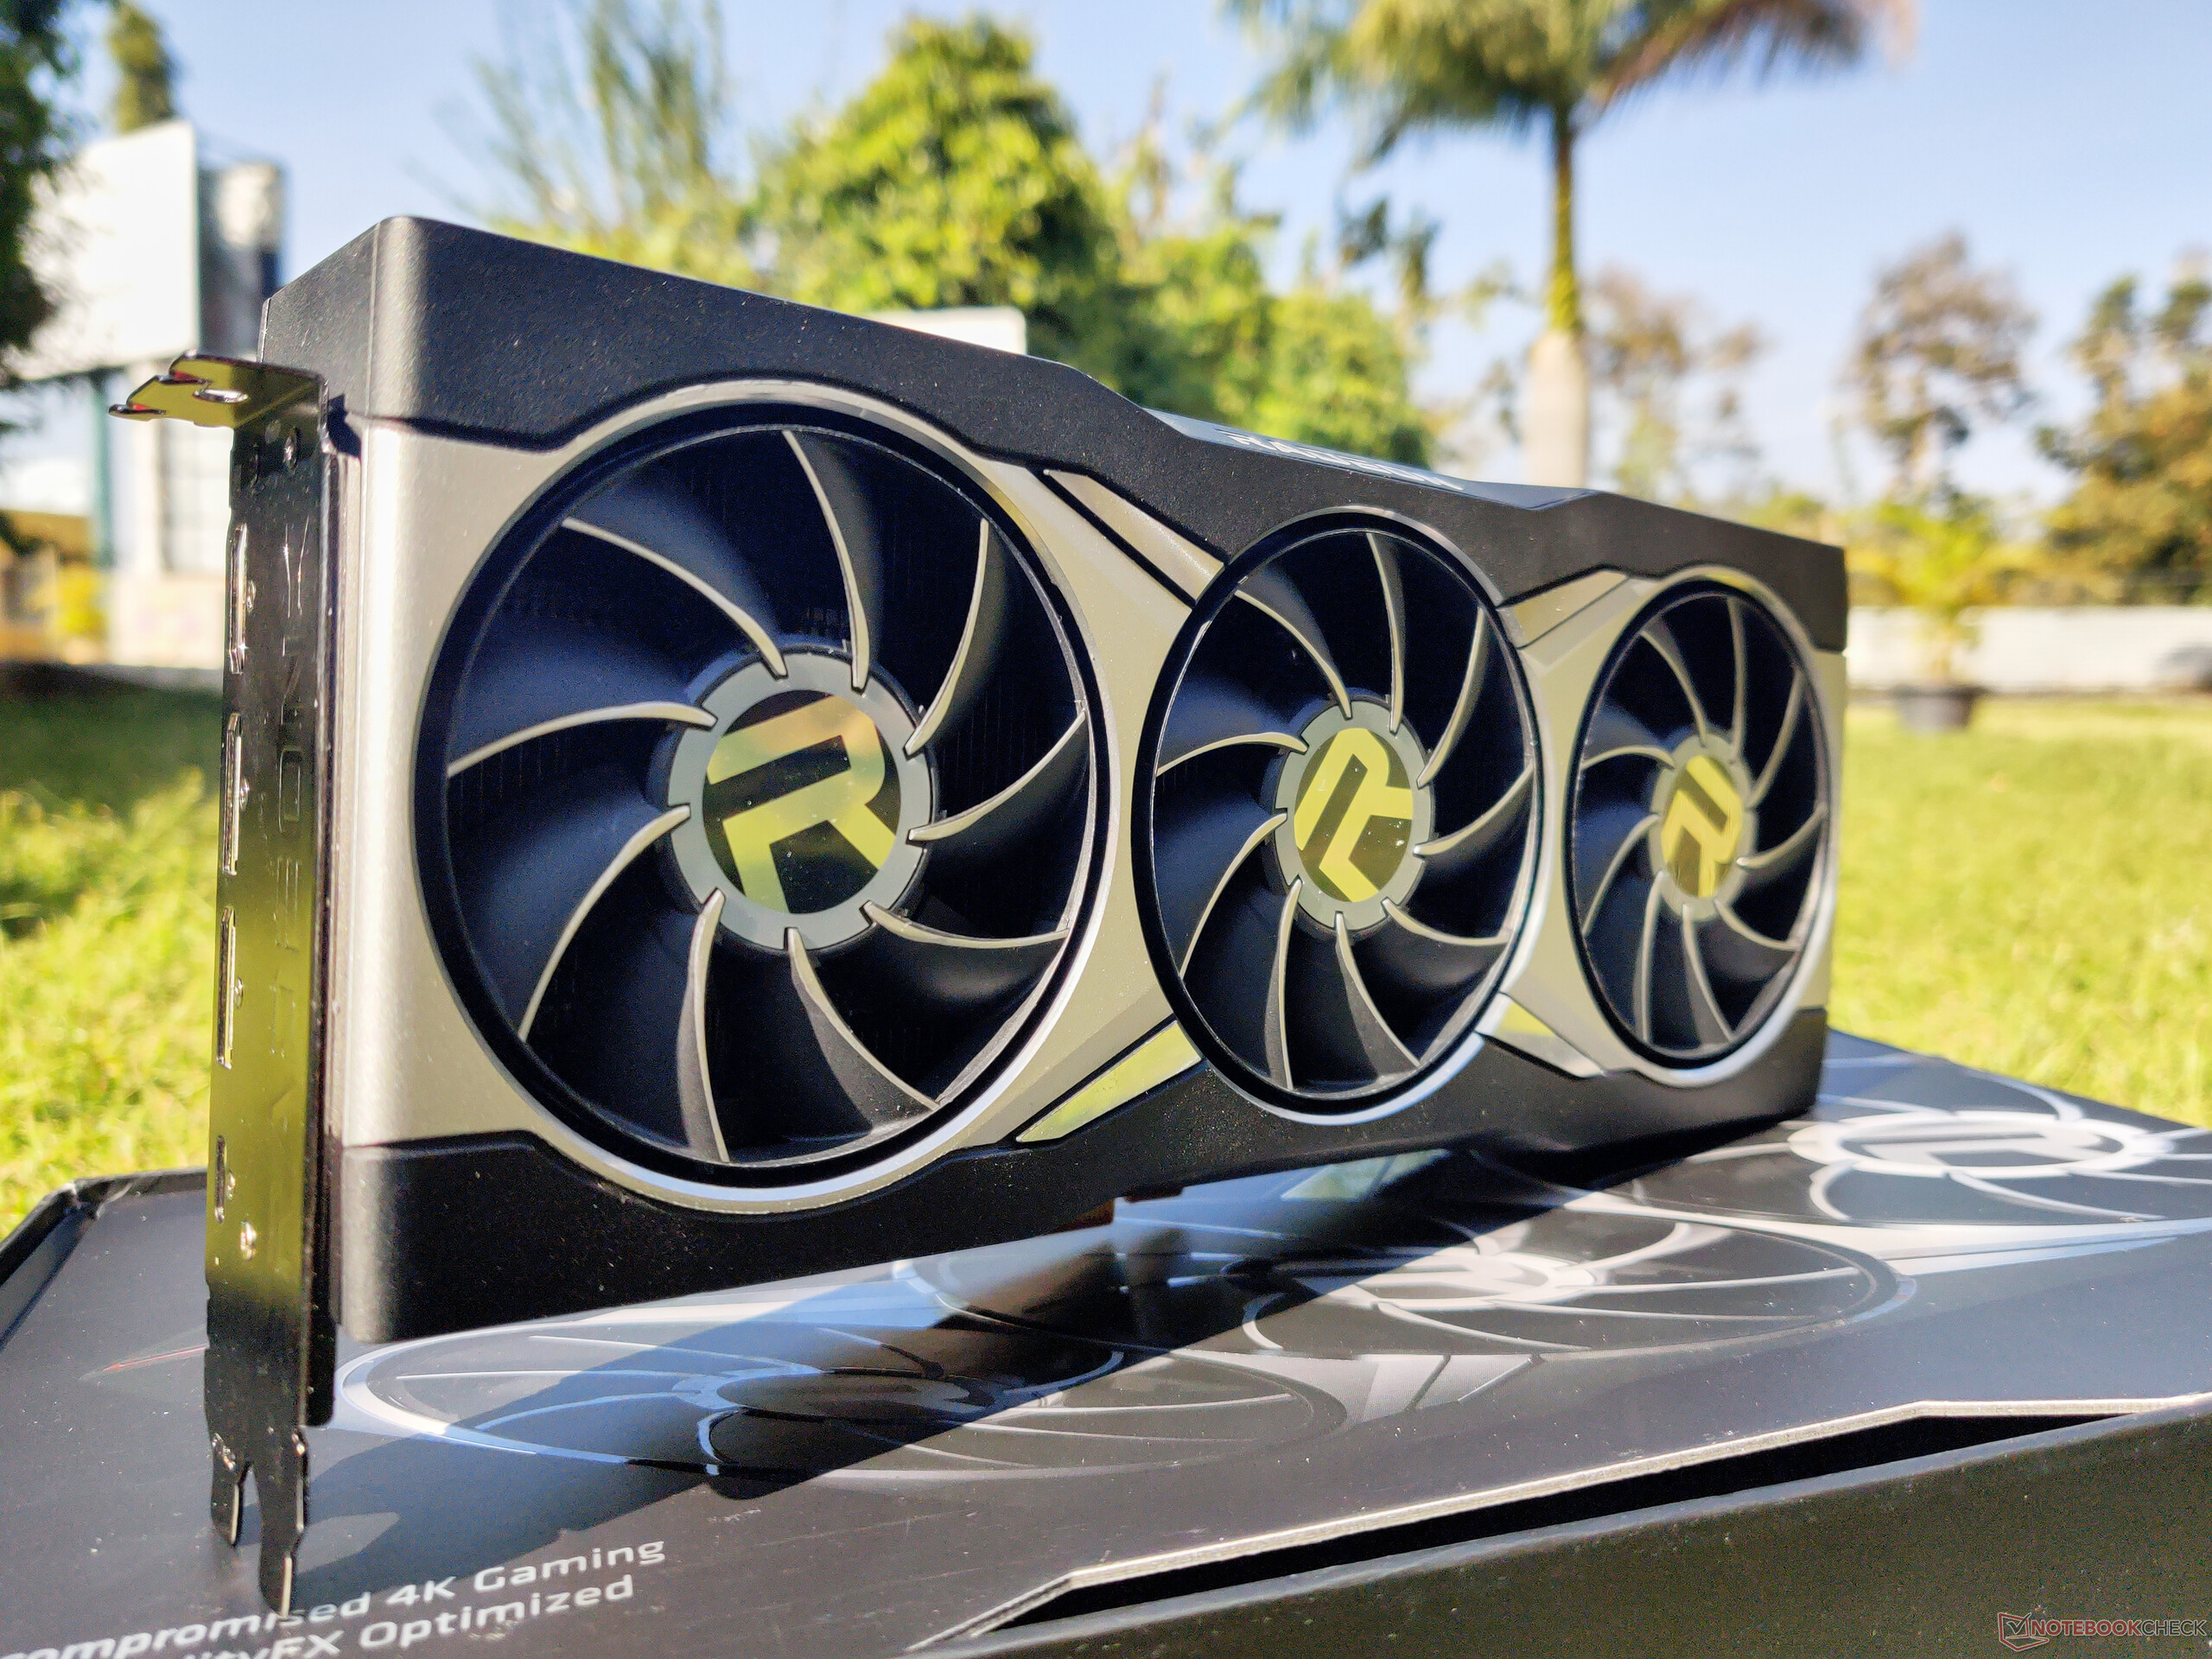
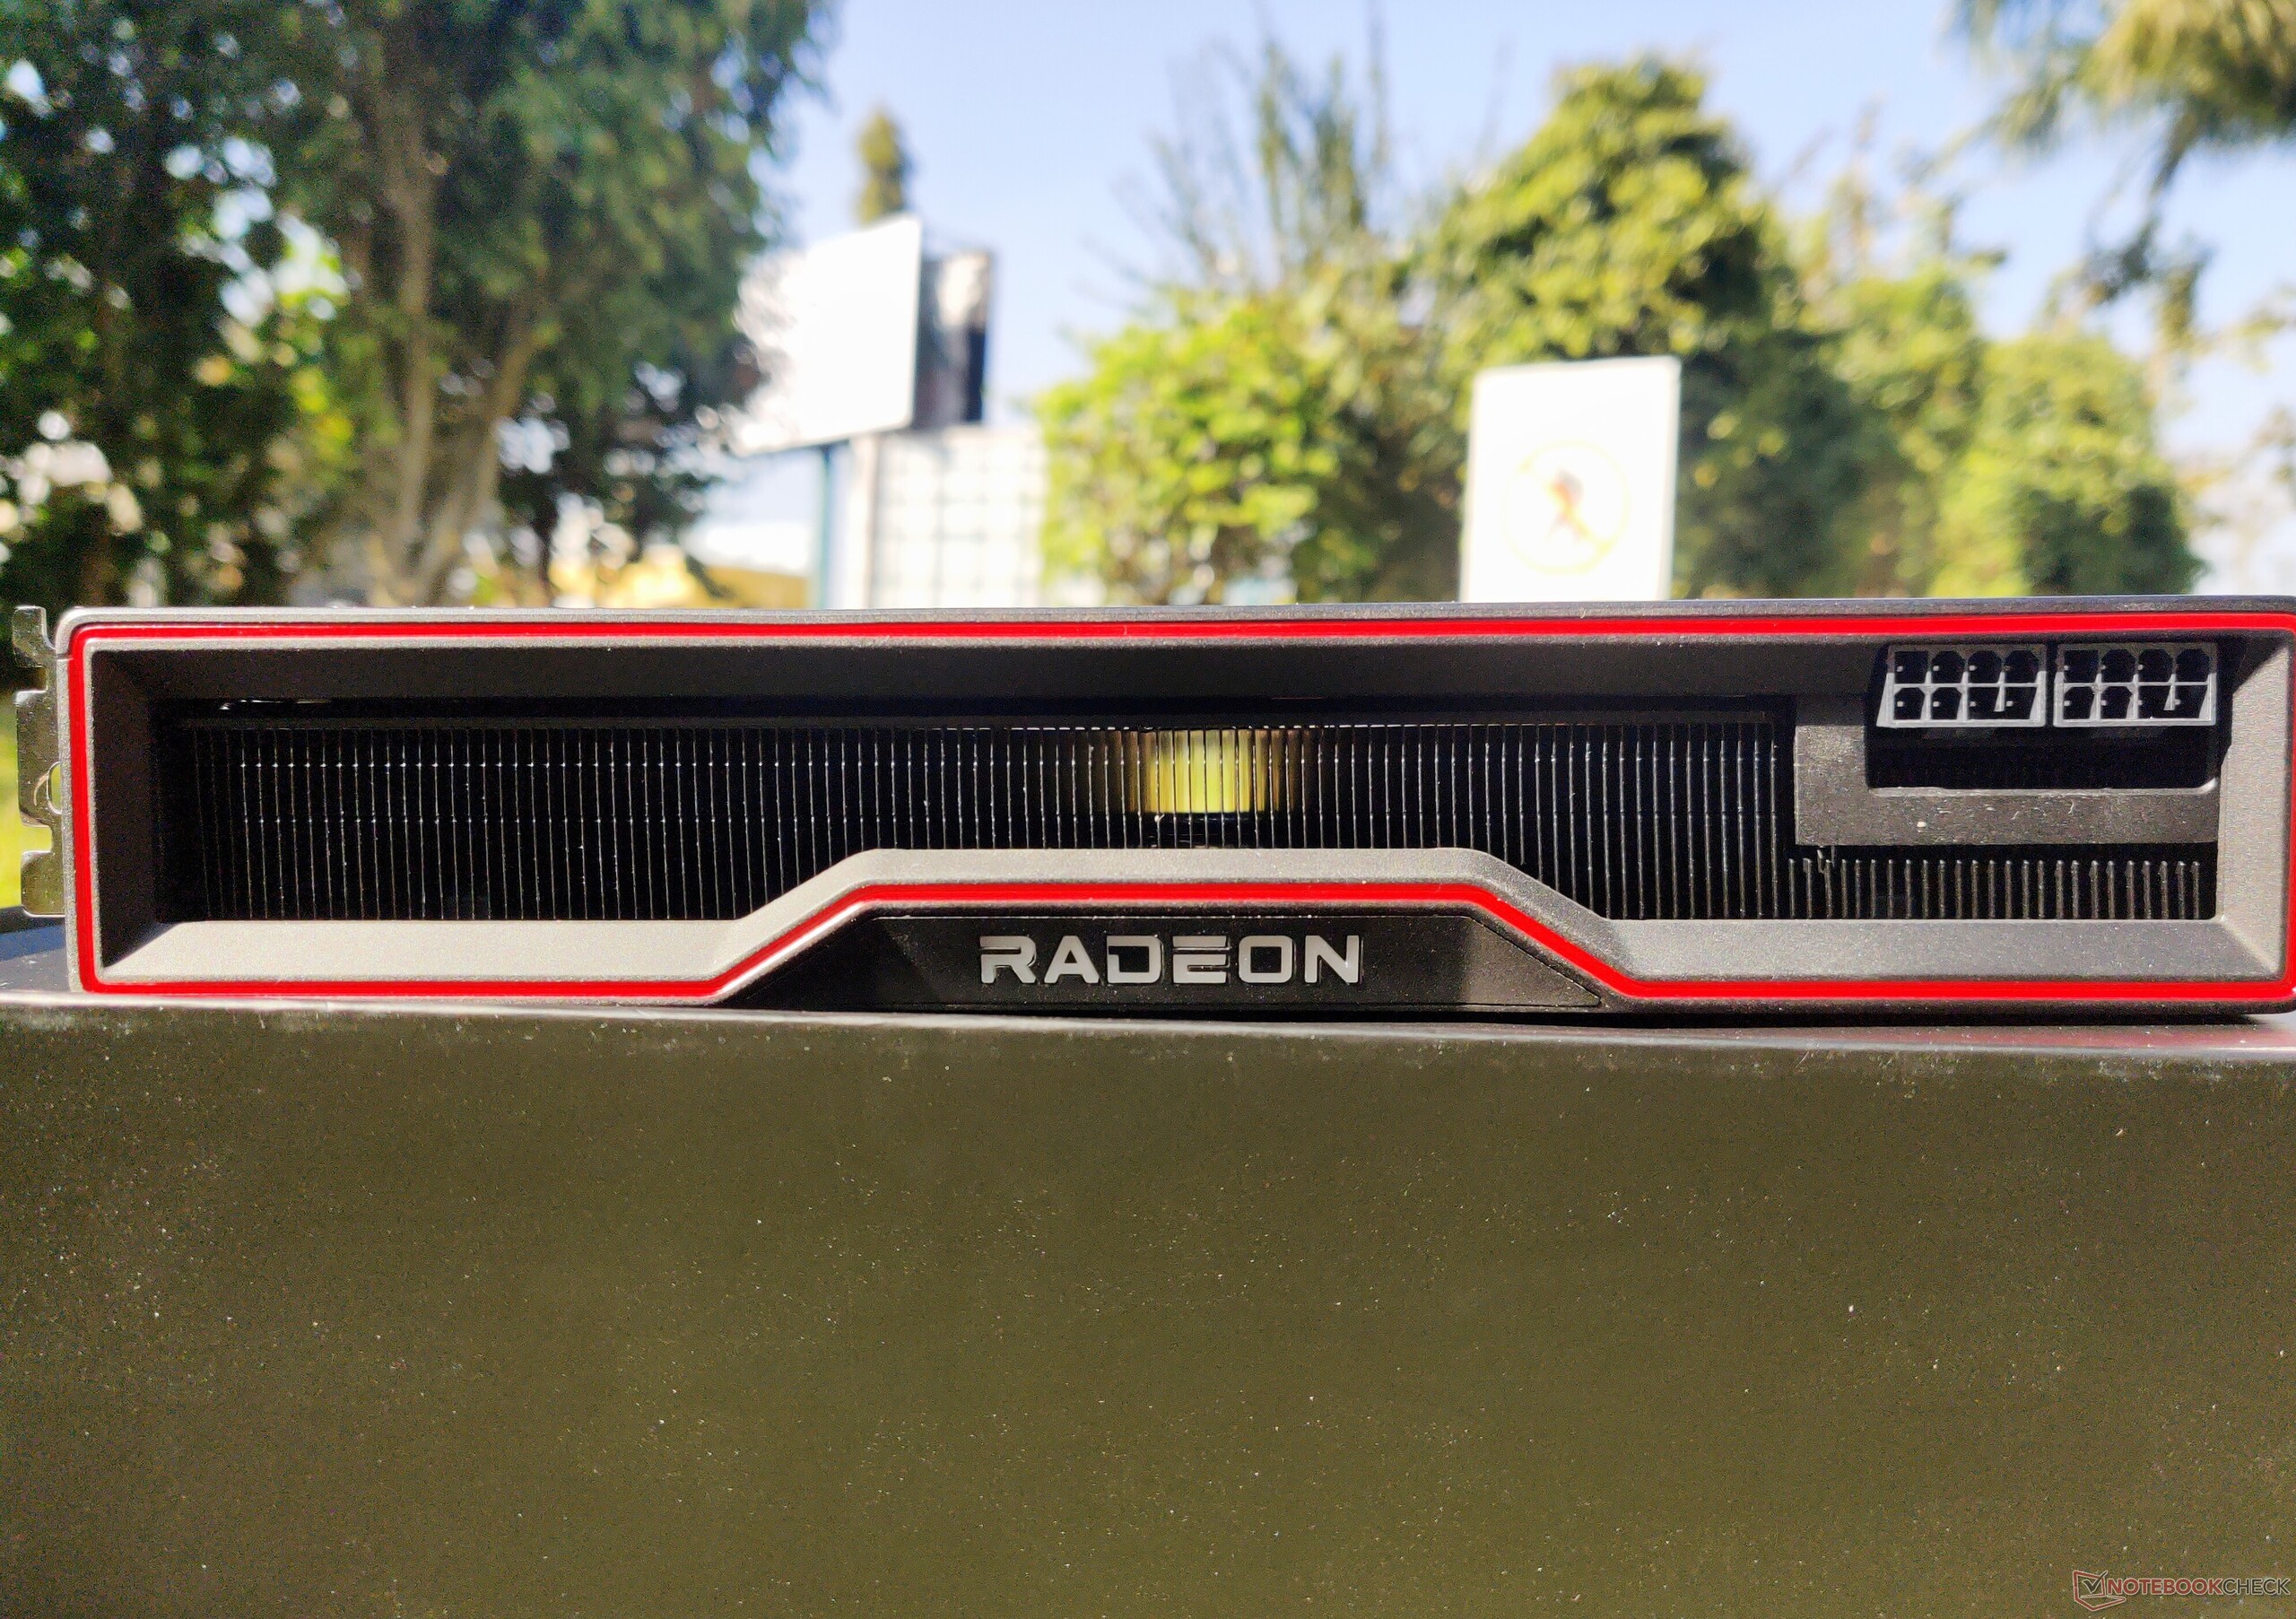
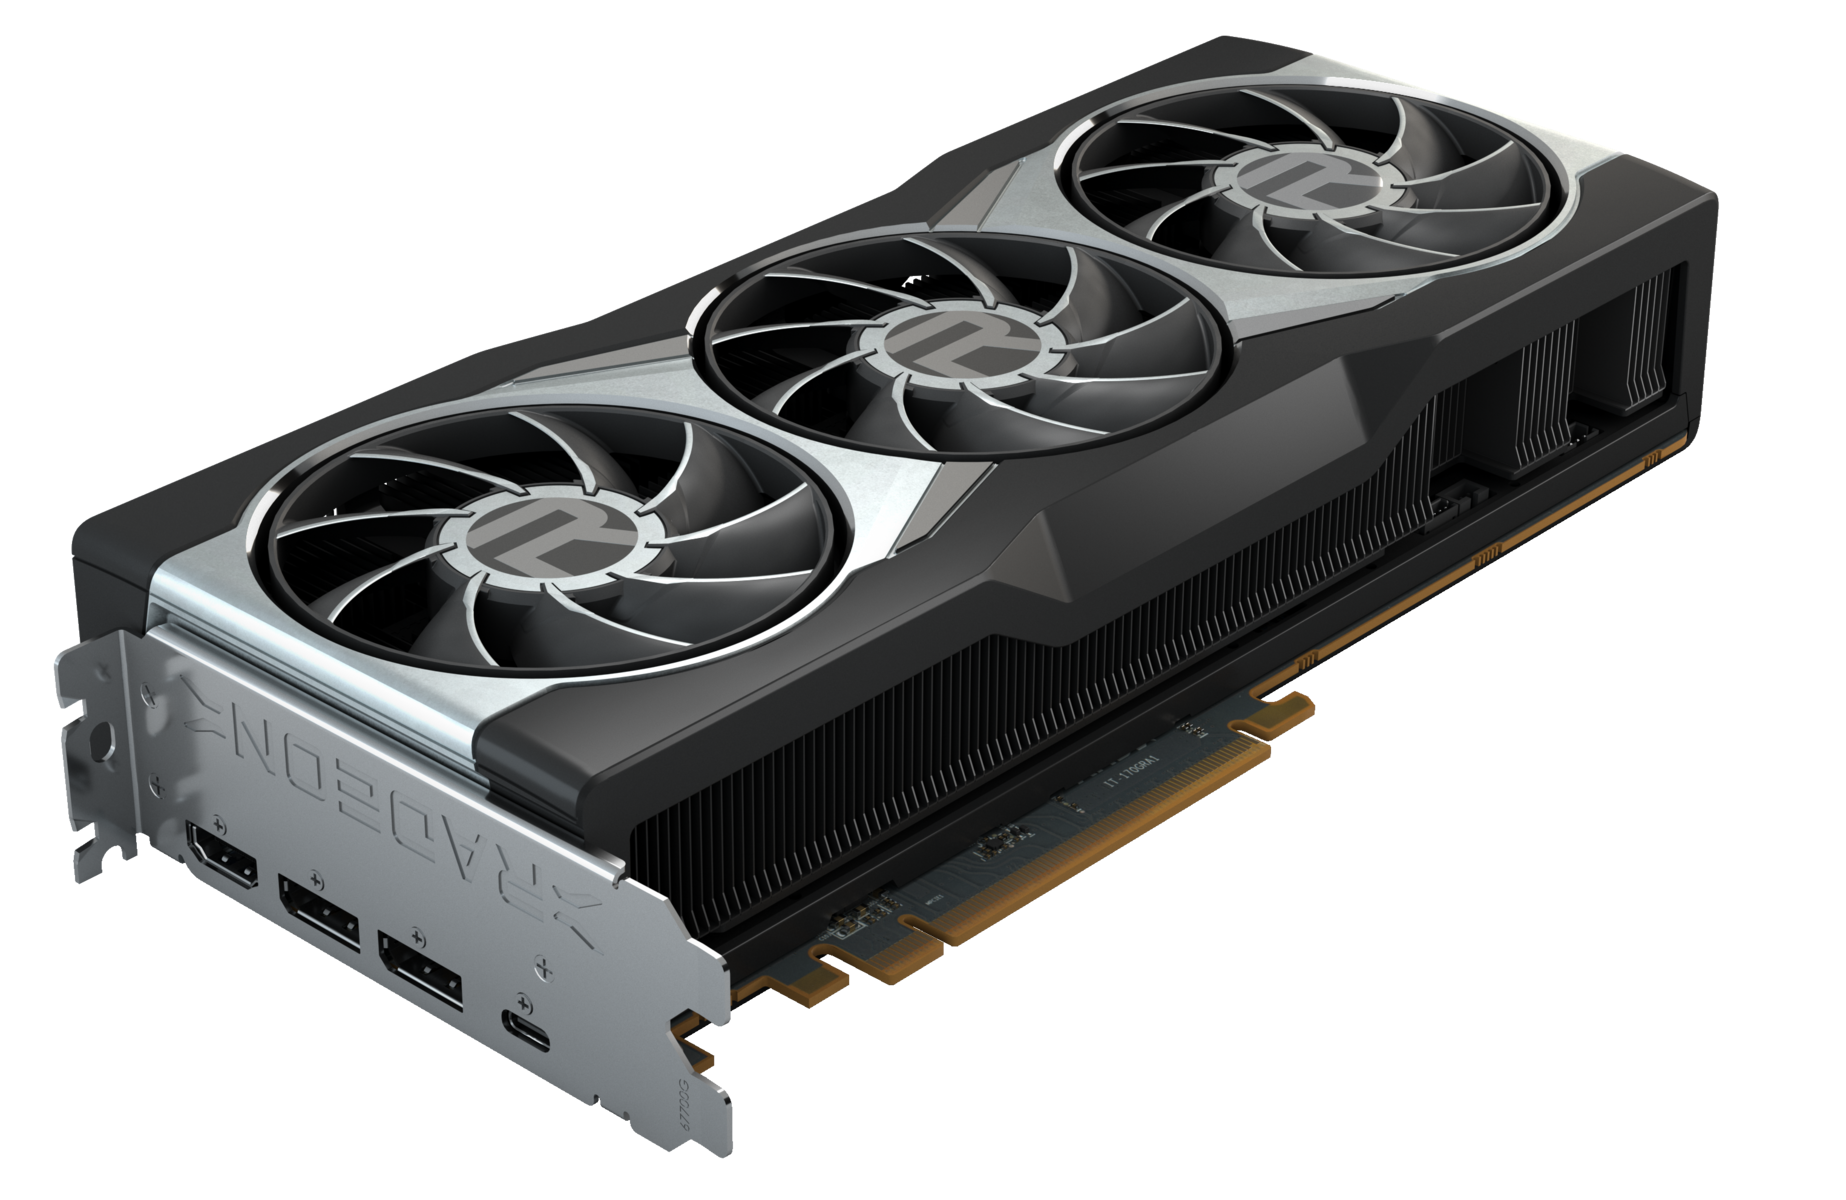
Venendo alla scheda stessa, vediamo che AMD ha abbandonato il sistema di raffreddamento in stile blower che si trova sulla scheda di riferimento RX 5700 XT e ha invece optato per un sistema a tre ventole. Le ventole hanno il distinto logo "R" su di esse e sono integrate in un telaio di metallo argento brillante. Sulla parte superiore, troviamo un bordo rosso che corre lungo la lunghezza della scheda e anche un logo Radeon RGB.

Il logo Radeon si illumina di rosso di default, ma è possibile scaricare uno strumento CoolerMaster RGB LED per passare da un colore all'altro. Potremmo azzardare l'ipotesi che CoolerMaster abbia qualcosa a che fare con il sistema di raffreddamento del design di riferimento, basandoci su quello che abbiamo visto prima con il cooler stock Wraith Prism di Ryzen.

Rimanendo sulla parte superiore, vediamo due connettori di alimentazione a 8-pin che sono posizionati verso il bordo destro - nessuna roba a 12-pin fantasiosa antenna aliena come NVIDIA, che può essere buona o cattiva a seconda delle vostre preferenze.

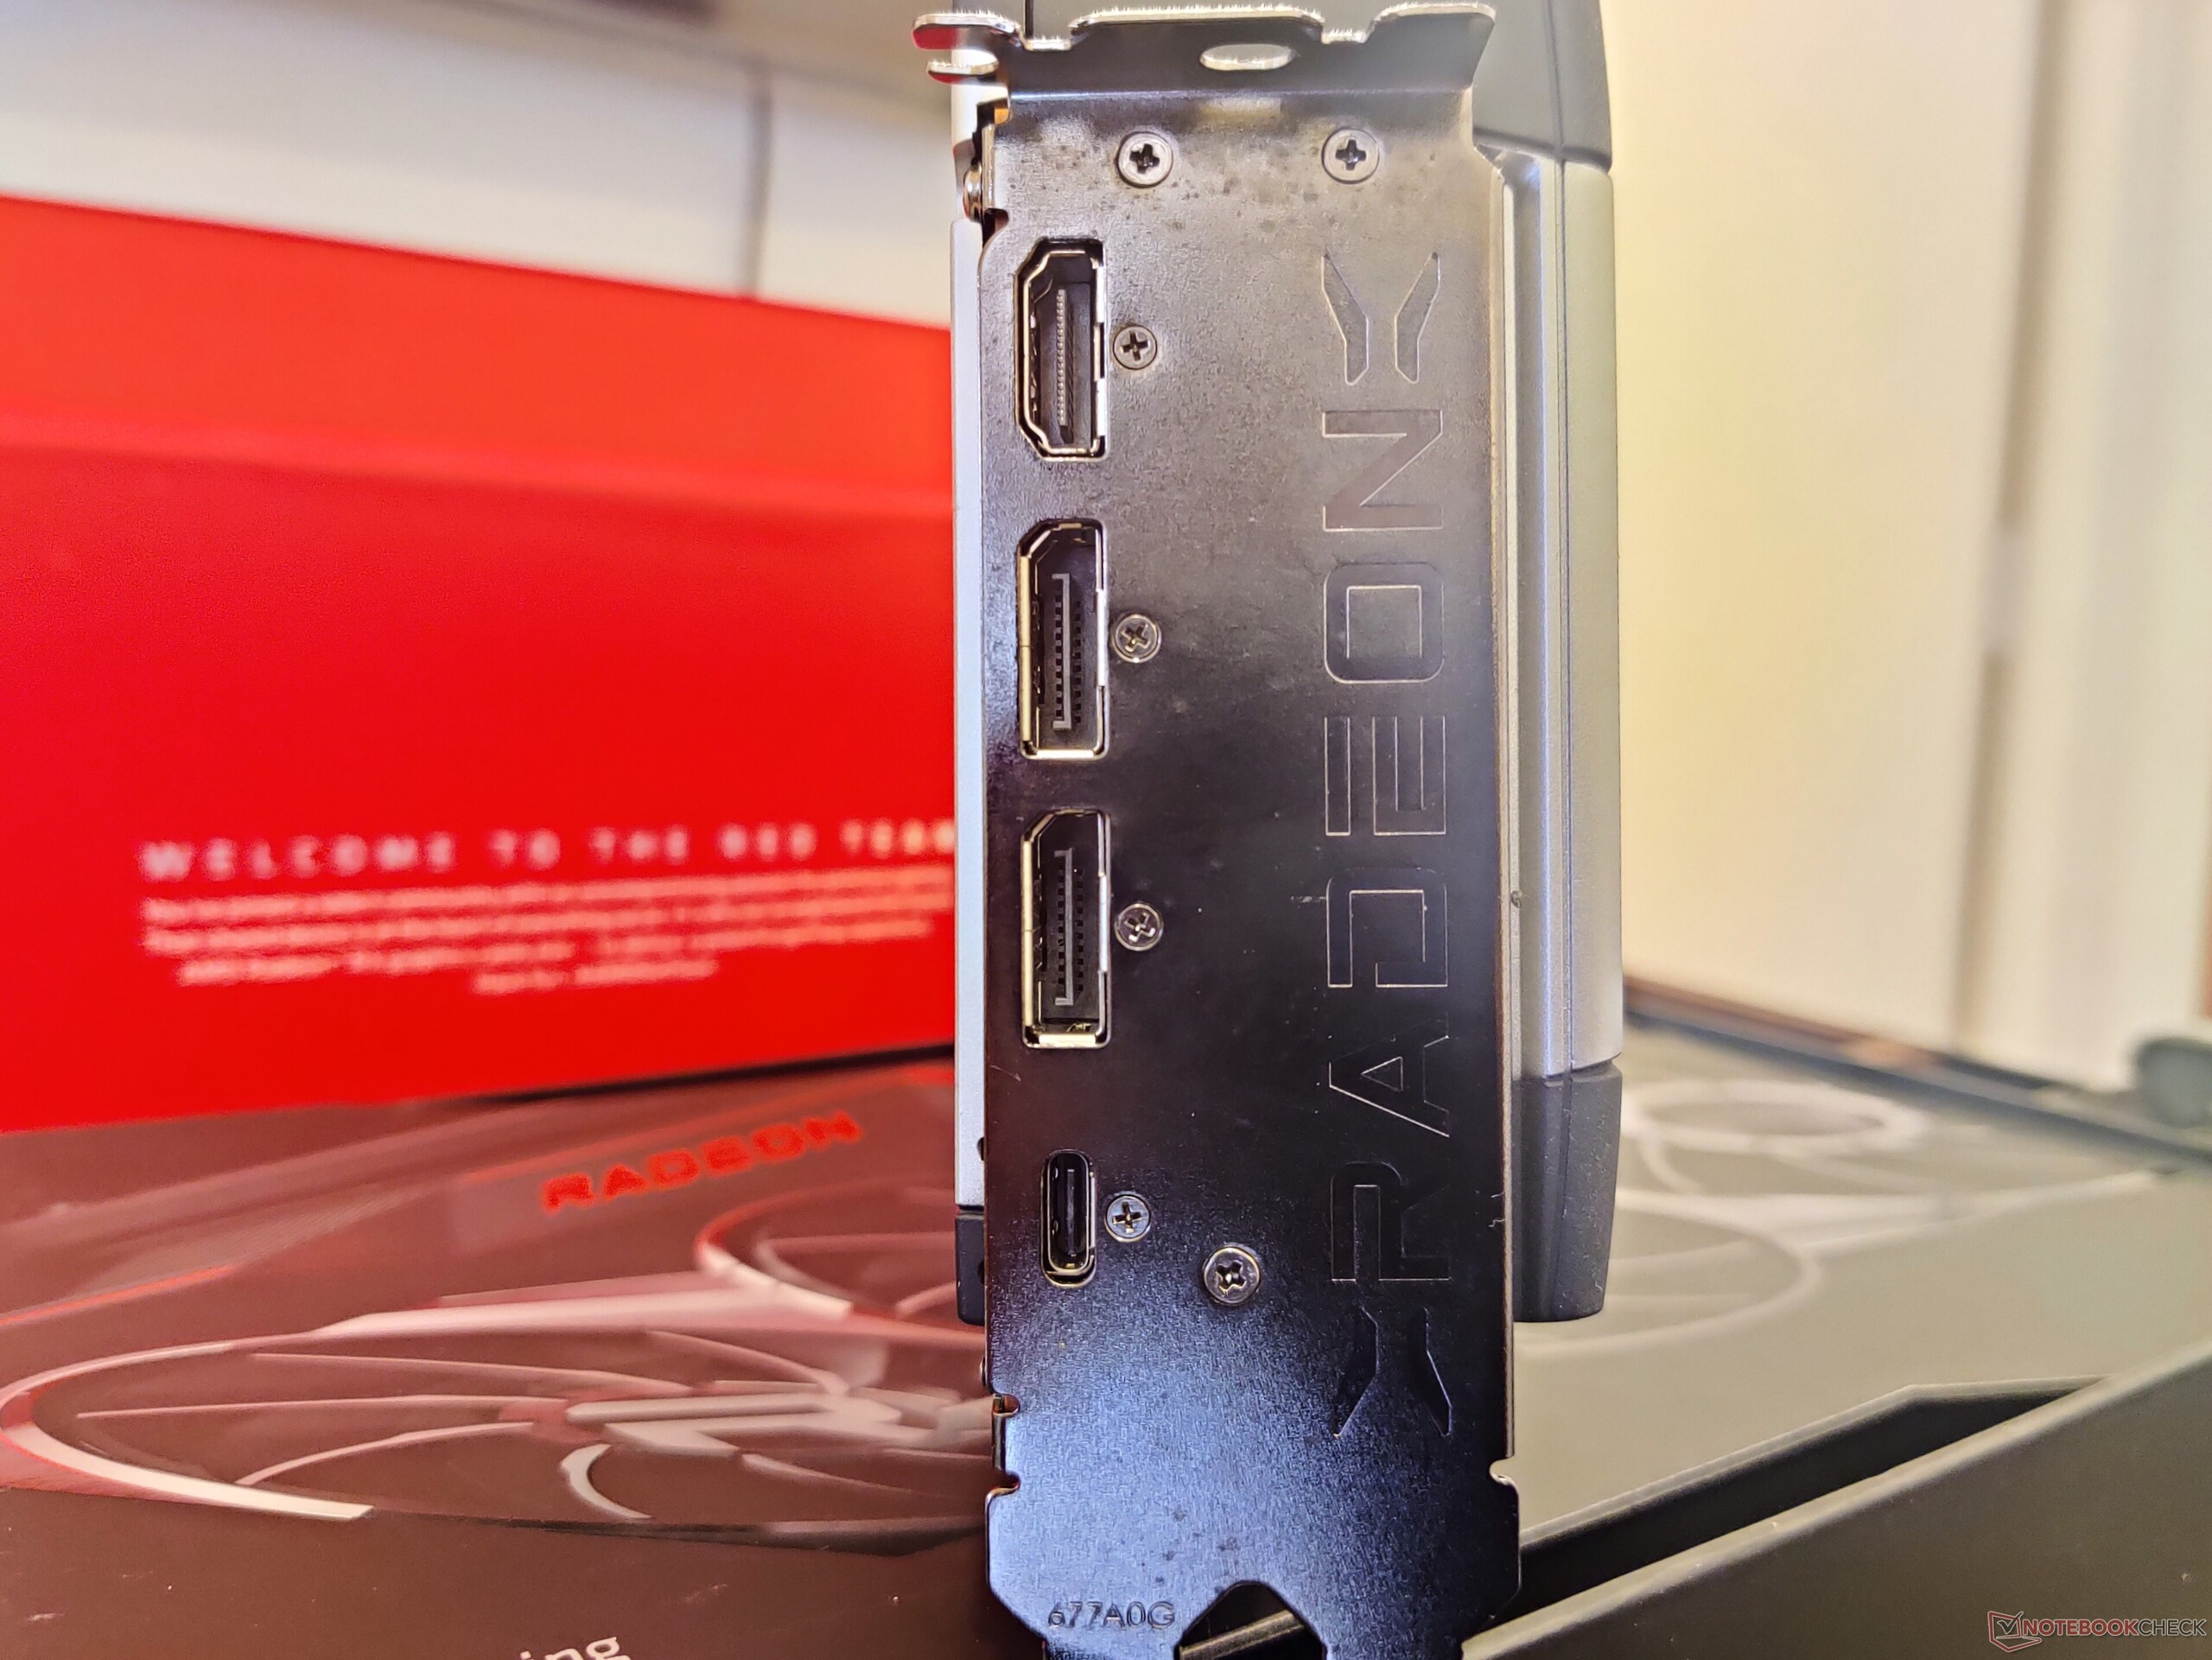
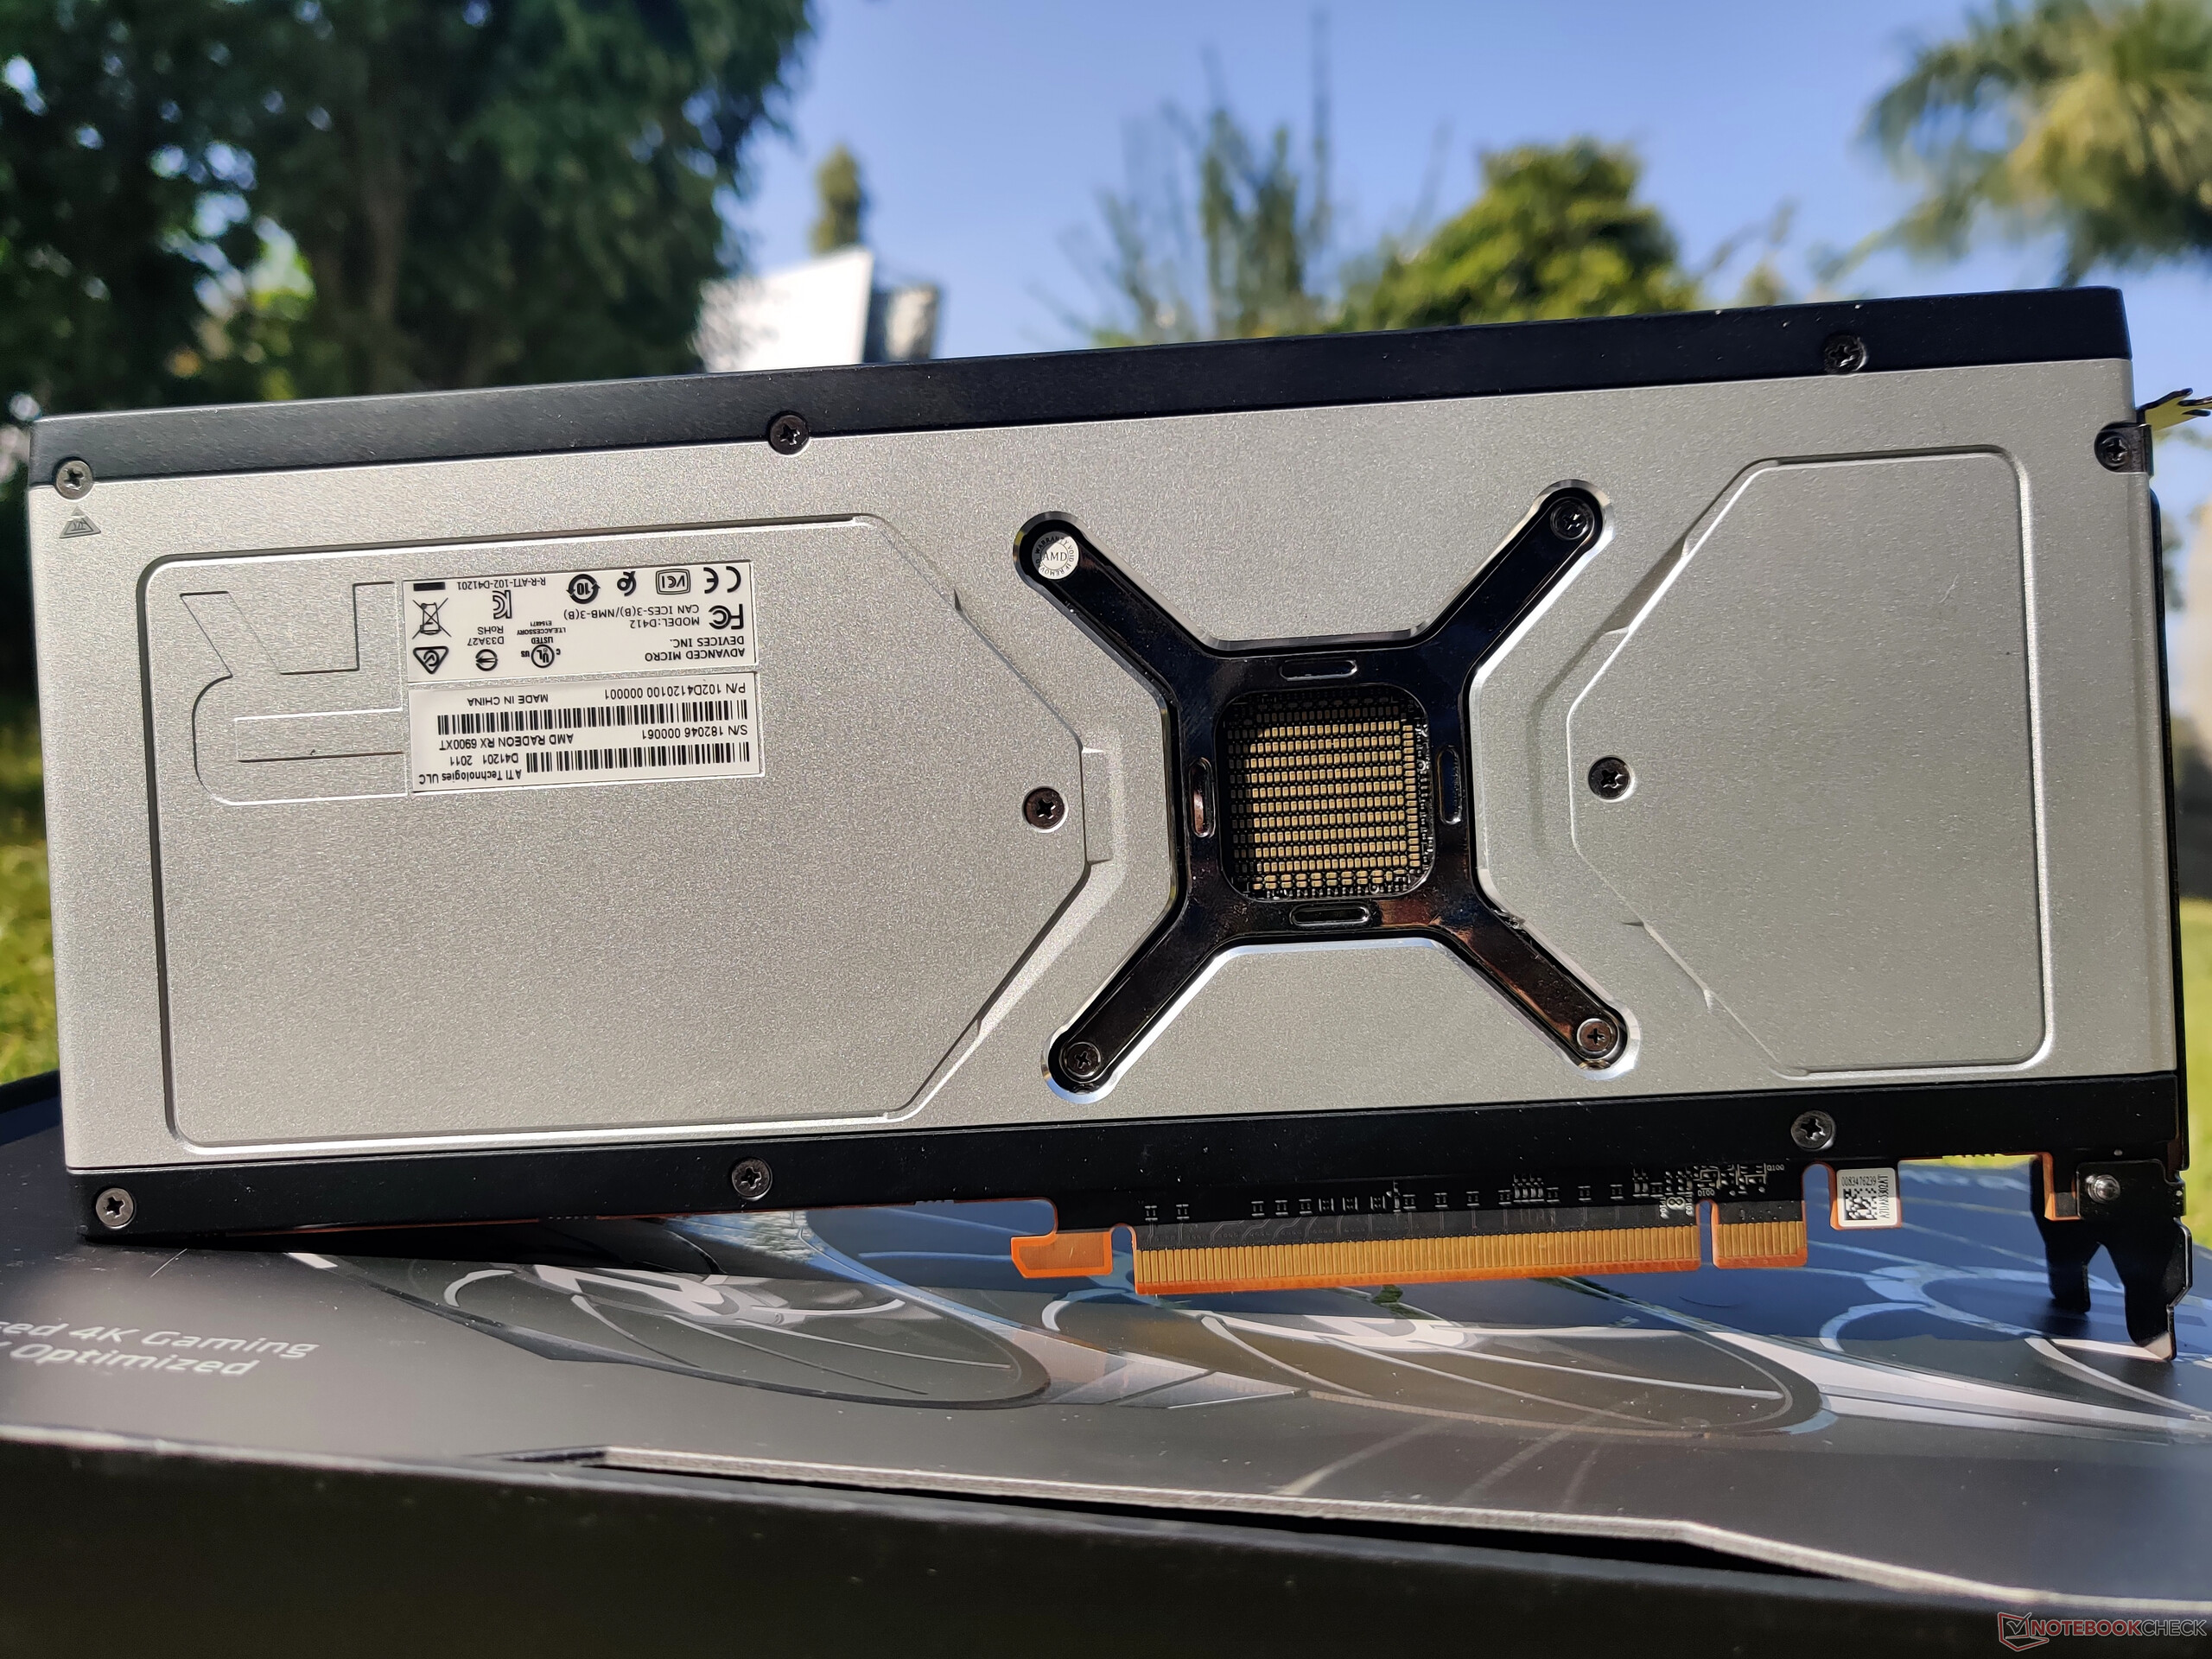
Sul retro, abbiamo due uscite DisplayPort 1.4, una HDMI 2.1 e una USB Type-C con DisplayPort. È bello vedere AMD offrire una porta USB Type-C in un momento in cui NVIDIA l'ha abbandonata apparentemente per risparmiare un po' di energia sulle schede Ampere.

Non è esattamente una novità, ma è passato del tempo da quando AMD ha abbandonato il supporto al supporto CrossFire, quindi non c'è nessuna porta CrossFire Bridge disponibile. NVIDIA, d'altra parte, offre ancora un connettore NVLink sulla RTX 3090.

Nel complesso, la RX 6900 XT sfoggia un design di riferimento pulito a 2,7 slot, che dovrebbe avere un appeal quasi universale.

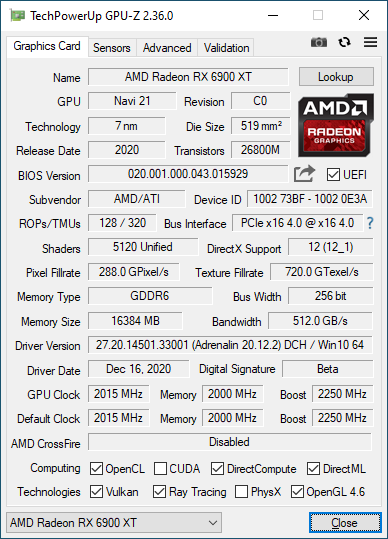
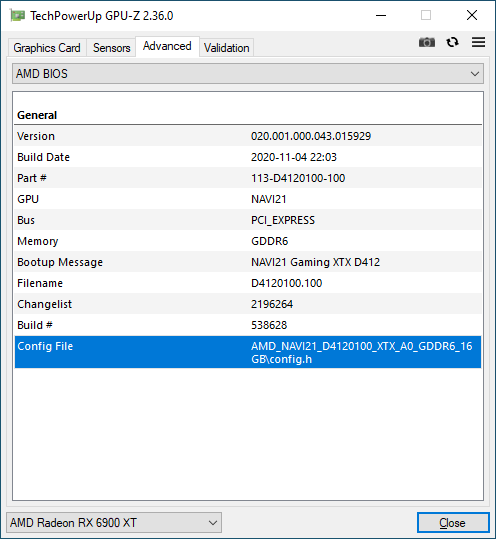
La Radeon RX 6900 XT è basata sulla GPU RDNA 2 Navi 21 XTX - una parte a 7 nm che offre 80 unità di calcolo (CU) cioè 5.120 unità di shading. La scheda ha un clock di base di 1.825 MHz. Per la maggior parte delle applicazioni, la GPU funziona a 2.015 MHz, che AMD pubblicizza come Game Clock, mentre il boosting arriva fino a 2.250 MHz. A seconda del carico di lavoro e dello spazio termico disponibile, sono possibili anche boost più elevati.

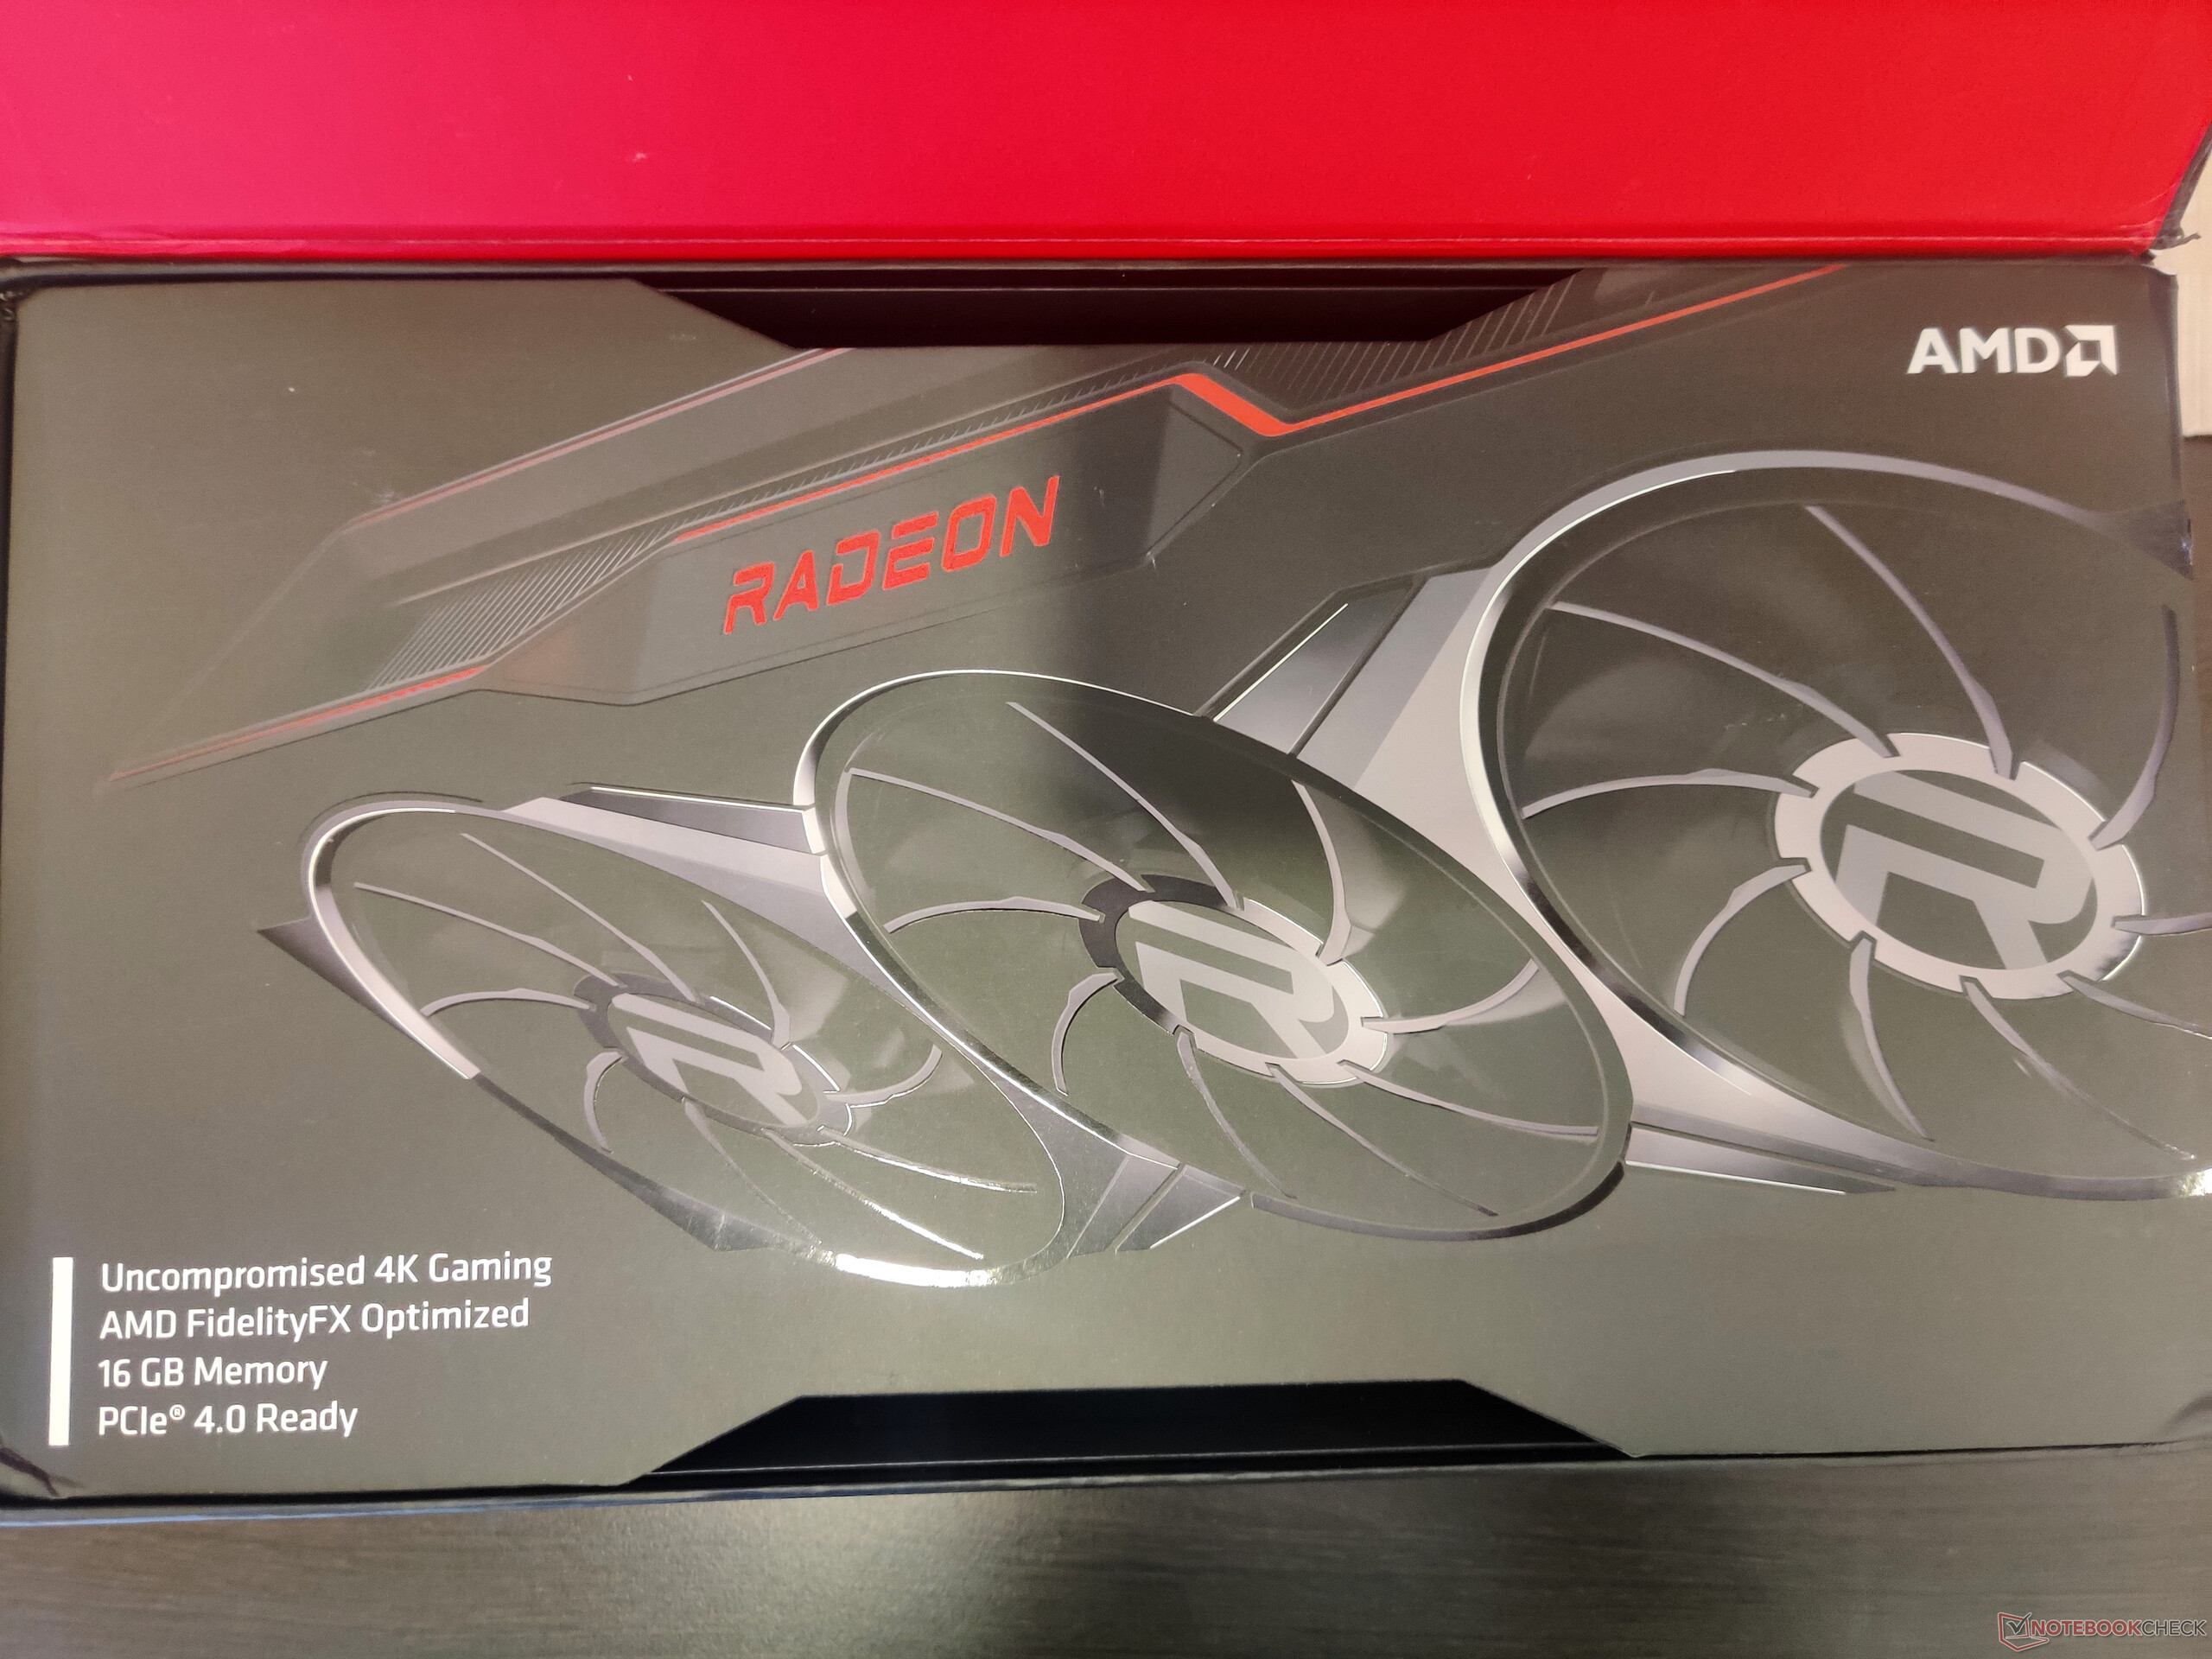
Come la RX 6800 XT, anche la RX 6900 XT offre 16 GB di GDDR6 VRAM su un bus a 256 bit che produce una larghezza di banda di memoria fino a 512 GB/s. AMD ha equipaggiato la Radeon RX 6900 XT con una Infinity Cache da 128 MB che in un certo senso copre la GDDR6 VRAM più lenta (ma più facilmente disponibile) e il più piccolo bus di memoria a 256 bit per raggiungere livelli di prestazioni simili a quelli che NVIDIA può ottenere con un bus più grande, una GDDR6X VRAM più costosa e una maggiore larghezza di banda della memoria.

La Radeon RX 6900 XT è valutata per una potenza totale della scheda di 300 W. Durante lo stress test, abbiamo osservato che il solo core può assorbire fino a 255 W.

Sistema di test

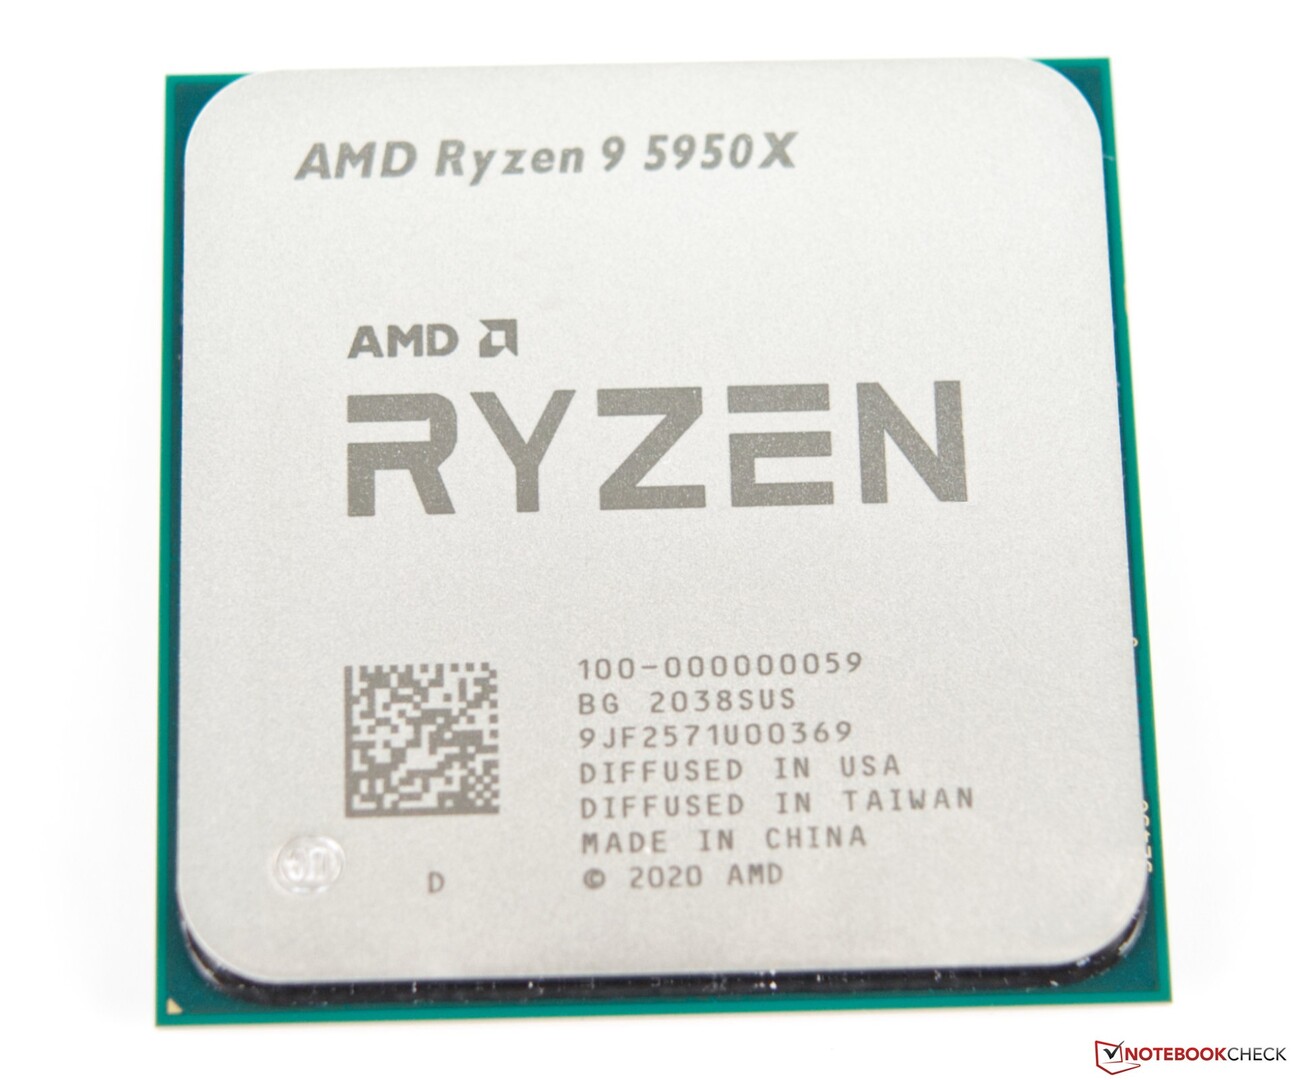
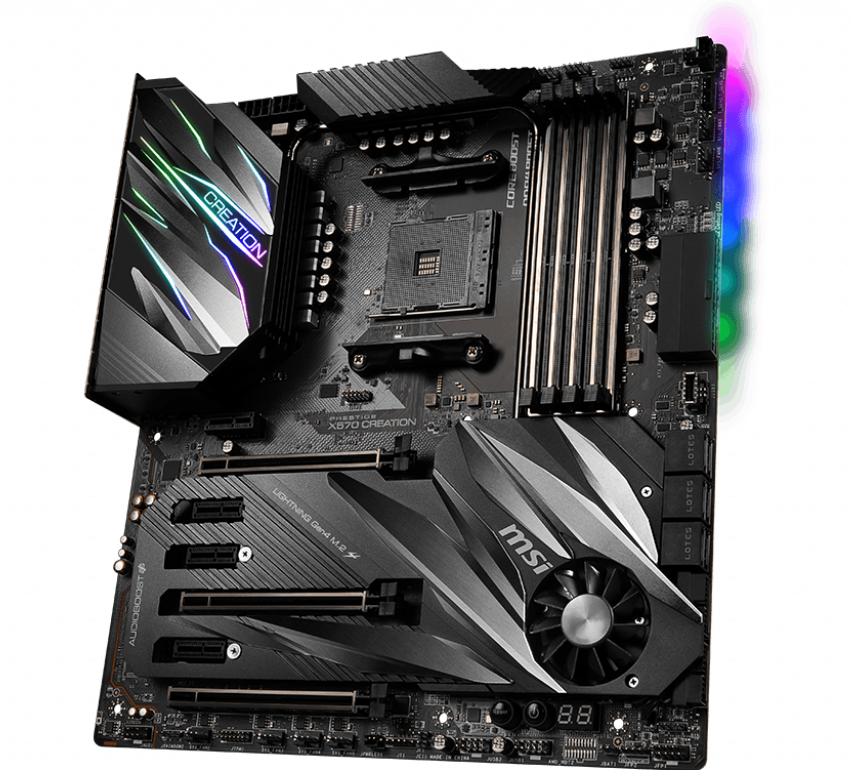
Abbiamo usato una piattaforma AMD X570 come sistema di test per valutare la RX 6900 XT. La nostra configurazione include un AMD Ryzen 9 5950X abbinato a 32 GB (16 GB x) di RAM G.SKILL Trident Z Neo DDR4-3200 (timing 16-19-19-39) su una scheda madre MSI Prestige X570 Creation

Un SSD Gigabyte Aorus NVMe Gen4 da 1 TB è stato utilizzato per eseguire Windows 10 20H2 con le ultime patches cumulative mentre i benchmarks e i giochi sono stati installati su due SSD Crucial MX500 SATA da 1 TB.

A mantenere fresco il Ryzen 9 5950X 16C/32T c'era un dispositivo di raffreddamento Corsair iCUE H115i Capellix AIO. La configurazione era alloggiata in un case Corsair iCUE 4000X RGB con un Thermaltake Toughpower 850 W 80 Plus Gold come alimentatore.

La RX 6900 XT è stata abbinata a una smart TV OnePlus U Series 55U1 che funziona a 4K 60 Hz. L'output del colore è stato impostato sul formato pixel Full RGB 4:4:4 nel software Radeon e lo scaling del desktop di Windows è stato impostato al 100%.

Vogliamo ringraziare AMD per aver fornito la RX 6900 XT e il Ryzen 9 5950X, Corsair per il dispositivo di raffreddamento iCUE Elite Capellix AIO e il case iCUE 4000X, e OnePlus per la TV serie U 55U1 4K.

CPU AMD Ryzen 9 5950X
Scheda madre MSI Prestige X570 Creation. (Fonte immagine: MSI)
SSD Gigabyte Aorus NVMe Gen4. (Fonte immagine: Gigabyte)
G.SKILL Trident Z Neo DDR4-3600 RAM. (Fonte di immagine: G.SKILL)

Benchmarks sintetici

Nella maggior parte dei test di 3DMark, la RX 6900 XT è alla pari o addirittura migliore della NVIDIA RTX 3090. I massimi vantaggi si vedono in 3DMark Fire Strike fino a 1440p. Nel 4K Fire Strike Ultra, il vantaggio si riduce a circa l'11% rispetto alla media della RTX 3090. Time Spy , tuttavia, mostra che le ammiraglie AMD e NVIDIA sono più o meno alla pari.

Le capacità dell'architettura RDNA2 quando si tratta di ray tracing non sono scarse di per sé, ma le carenze diventano abbastanza evidenti nel test di Port Royal dove la RX 6900 XT è percepibilmente in ritardo rispetto alla RTX 3080 del 15% e significativamente dietro la RTX 3090 del 24%. Detto questo, vediamo la RX 6900 XT andare circa il 9% meglio della media della RTX 2080 Ti in questo benchmark.

I benchmarks Unigine mostrano punteggi migliori nei test DirectX rispetto a quelli OpenGL, soprattutto nei benchmark Valley e Heaven. In Superposition, la RX 6900 XT prende una batosta nel test 8K Optimized che segue la RTX 3090 del 20%. Questo divario si riduce significativamente a risoluzioni inferiori, e vediamo la GPU in ritardo solo di circa l'8% nel benchmark 4K Optimized.

3DMark
2560x1440 Time Spy Graphics
Media NVIDIA GeForce RTX 3090
  (18685 - 20433, n=16)
19254 Points +6%
Nvidia GeForce RTX 3090 Founders Edition
NVIDIA GeForce RTX 3090, R9 5900X
18685 Points +3%
AMD Radeon RX 6900 XT
AMD Radeon RX 6900 XT, R9 5950X
18210 Points
AMD Radeon RX 6800 XT
AMD Radeon RX 6800 XT, R9 5950X
17603 Points -3%
Media NVIDIA GeForce RTX 3080
  (17467 - 17604, n=2)
17536 Points -4%
ASUS GeForce RTX 3080 ROG STRIX OC GAMING
NVIDIA GeForce RTX 3080, R9 5900X
17467 Points -4%
AMD Ryzen 9 5900X
NVIDIA Titan RTX, R9 5900X
15283 Points -16%
Media NVIDIA Titan RTX
  (14216 - 15283, n=29)
14884 Points -18%
Media NVIDIA GeForce RTX 2080 Ti (Desktop)
  (13744 - 14645, n=4)
14283 Points -22%
KFA2 GeForce RTX 2080 Ti EX
NVIDIA GeForce RTX 2080 Ti (Desktop), R9 3900X
13744 Points -25%
MSI GeForce RTX 3070 Gaming X Trio
NVIDIA GeForce RTX 3070, R9 5900X
13579 Points -25%
Media NVIDIA GeForce RTX 3070
  (11043 - 13579, n=7)
12616 Points -31%
Nvidia GeForce RTX 2080 Super
NVIDIA GeForce RTX 2080 Super (Desktop), R7 2700X
11477 Points -37%
Media NVIDIA GeForce RTX 2080 Super (Desktop)
  (11313 - 11542, n=4)
11439 Points -37%
Nvidia GeForce RTX 2070 Super
NVIDIA GeForce RTX 2070 Super (Desktop), R7 2700X
10094 Points -45%
Media NVIDIA GeForce RTX 2070 Super (Desktop)
  (9564 - 10094, n=8)
9846 Points -46%
AMD Radeon RX 5700 XT
AMD Radeon RX 5700 XT (Desktop), R7 2700X
8673 Points -52%
Media AMD Radeon RX 5700 XT (Desktop)
  (6050 - 9371, n=7)
8574 Points -53%
AMD Radeon RX 5700
AMD Radeon RX 5700 (Desktop), R7 2700X
7675 Points -58%
1920x1080 Fire Strike Graphics
AMD Radeon RX 6900 XT
AMD Radeon RX 6900 XT, R9 5950X
50587 Points
AMD Radeon RX 6800 XT
AMD Radeon RX 6800 XT, R9 5950X
49735 Points -2%
Media NVIDIA GeForce RTX 3090
  (41298 - 49282, n=16)
46854 Points -7%
Nvidia GeForce RTX 3090 Founders Edition
NVIDIA GeForce RTX 3090, R9 5900X
41298 Points -18%
ASUS GeForce RTX 3080 ROG STRIX OC GAMING
NVIDIA GeForce RTX 3080, R9 5900X
40910 Points -19%
Media NVIDIA GeForce RTX 3080
  (37604 - 40910, n=2)
39257 Points -22%
Media NVIDIA Titan RTX
  (33377 - 40910, n=30)
36062 Points -29%
AMD Ryzen 9 5900X
NVIDIA Titan RTX, R9 5900X
34722 Points -31%
Media NVIDIA GeForce RTX 2080 Ti (Desktop)
  (32081 - 35851, n=4)
34141 Points -33%
KFA2 GeForce RTX 2080 Ti EX
NVIDIA GeForce RTX 2080 Ti (Desktop), R9 3900X
32081 Points -37%
MSI GeForce RTX 3070 Gaming X Trio
NVIDIA GeForce RTX 3070, R9 5900X
31096 Points -39%
Media NVIDIA GeForce RTX 3070
  (20357 - 33270, n=7)
28949 Points -43%
Media NVIDIA GeForce RTX 2080 Super (Desktop)
  (26824 - 28968, n=4)
27647 Points -45%
Nvidia GeForce RTX 2080 Super
NVIDIA GeForce RTX 2080 Super (Desktop), R7 2700X
27075 Points -46%
AMD Radeon RX 5700 XT
AMD Radeon RX 5700 XT (Desktop), R7 2700X
25383 Points -50%
Media AMD Radeon RX 5700 XT (Desktop)
  (19850 - 27164, n=7)
25322 Points -50%
Media NVIDIA GeForce RTX 2070 Super (Desktop)
  (22819 - 25799, n=8)
24645 Points -51%
Nvidia GeForce RTX 2070 Super
NVIDIA GeForce RTX 2070 Super (Desktop), R7 2700X
24151 Points -52%
AMD Radeon RX 5700
AMD Radeon RX 5700 (Desktop), R7 2700X
22457 Points -56%
3840x2160 Fire Strike Ultra Graphics
AMD Radeon RX 6900 XT
AMD Radeon RX 6900 XT, R9 5950X
13370 Points
AMD Radeon RX 6800 XT
AMD Radeon RX 6800 XT, R9 5950X
12626 Points -6%
Media NVIDIA GeForce RTX 3090
  (11613 - 12587, n=13)
12305 Points -8%
Nvidia GeForce RTX 3090 Founders Edition
NVIDIA GeForce RTX 3090, R9 5900X
11613 Points -13%
ASUS GeForce RTX 3080 ROG STRIX OC GAMING
NVIDIA GeForce RTX 3080, R9 5900X
10793 Points -19%
Media NVIDIA GeForce RTX 3080
  (10645 - 10793, n=2)
10719 Points -20%
Media NVIDIA Titan RTX
  (8461 - 10793, n=29)
8868 Points -34%
AMD Ryzen 9 5900X
NVIDIA Titan RTX, R9 5900X
8649 Points -35%
MSI GeForce RTX 3070 Gaming X Trio
NVIDIA GeForce RTX 3070, R9 5900X
8483 Points -37%
Media NVIDIA GeForce RTX 3070
  (8043 - 8483, n=5)
8250 Points -38%
Media NVIDIA GeForce RTX 2080 Ti (Desktop)
  (7925 - 8504, n=4)
8226 Points -38%
KFA2 GeForce RTX 2080 Ti EX
NVIDIA GeForce RTX 2080 Ti (Desktop), R9 3900X
7925 Points -41%
Media NVIDIA GeForce RTX 2080 Super (Desktop)
  (6500 - 6700, n=3)
6585 Points -51%
Nvidia GeForce RTX 2080 Super
NVIDIA GeForce RTX 2080 Super (Desktop), R7 2700X
6500 Points -51%
Media AMD Radeon RX 5700 XT (Desktop)
  (4989 - 6500, n=7)
6119 Points -54%
AMD Radeon RX 5700 XT
AMD Radeon RX 5700 XT (Desktop), R7 2700X
5955 Points -55%
Nvidia GeForce RTX 2070 Super
NVIDIA GeForce RTX 2070 Super (Desktop), R7 2700X
5786 Points -57%
Media NVIDIA GeForce RTX 2070 Super (Desktop)
  (2290 - 5882, n=7)
5313 Points -60%
AMD Radeon RX 5700
AMD Radeon RX 5700 (Desktop), R7 2700X
5292 Points -60%
Fire Strike Extreme Graphics
AMD Radeon RX 6900 XT
AMD Radeon RX 6900 XT, R9 5950X
26650 Points
AMD Radeon RX 6800 XT
AMD Radeon RX 6800 XT, R9 5950X
25015 Points -6%
Media NVIDIA GeForce RTX 3090
  (22075 - 24730, n=13)
23822 Points -11%
Nvidia GeForce RTX 3090 Founders Edition
NVIDIA GeForce RTX 3090, R9 5900X
22075 Points -17%
ASUS GeForce RTX 3080 ROG STRIX OC GAMING
NVIDIA GeForce RTX 3080, R9 5900X
20861 Points -22%
Media NVIDIA GeForce RTX 3080
  (20007 - 20861, n=2)
20434 Points -23%
Media NVIDIA Titan RTX
  (16484 - 20861, n=29)
17649 Points -34%
AMD Ryzen 9 5900X
NVIDIA Titan RTX, R9 5900X
17176 Points -36%
Media NVIDIA GeForce RTX 2080 Ti (Desktop)
  (15603 - 16856, n=3)
16416 Points -38%
MSI GeForce RTX 3070 Gaming X Trio
NVIDIA GeForce RTX 3070, R9 5900X
16196 Points -39%
Media NVIDIA GeForce RTX 3070
  (15503 - 16276, n=5)
15859 Points -40%
KFA2 GeForce RTX 2080 Ti EX
NVIDIA GeForce RTX 2080 Ti (Desktop), R9 3900X
15603 Points -41%
Media NVIDIA GeForce RTX 2080 Super (Desktop)
  (12968 - 13551, n=3)
13172 Points -51%
Nvidia GeForce RTX 2080 Super
NVIDIA GeForce RTX 2080 Super (Desktop), R7 2700X
12968 Points -51%
Media AMD Radeon RX 5700 XT (Desktop)
  (12178 - 12921, n=6)
12611 Points -53%
AMD Radeon RX 5700 XT
AMD Radeon RX 5700 XT (Desktop), R7 2700X
12209 Points -54%
Media NVIDIA GeForce RTX 2070 Super (Desktop)
  (11382 - 12044, n=7)
11850 Points -56%
Nvidia GeForce RTX 2070 Super
NVIDIA GeForce RTX 2070 Super (Desktop), R7 2700X
11634 Points -56%
AMD Radeon RX 5700
AMD Radeon RX 5700 (Desktop), R7 2700X
10876 Points -59%
2560x1440 Port Royal Graphics
Media NVIDIA GeForce RTX 3090
  (12255 - 13075, n=5)
12728 Points +33%
Nvidia GeForce RTX 3090 Founders Edition
NVIDIA GeForce RTX 3090, R9 5900X
12384 Points +29%
Media NVIDIA GeForce RTX 3080
  (11238 - 11433, n=2)
11336 Points +18%
ASUS GeForce RTX 3080 ROG STRIX OC GAMING
NVIDIA GeForce RTX 3080, R9 5900X
11238 Points +17%
AMD Radeon RX 6900 XT
AMD Radeon RX 6900 XT, R9 5950X
9585 Points
AMD Ryzen 9 5900X
NVIDIA Titan RTX, R9 5900X
9335 Points -3%
AMD Ryzen 9 5900X
NVIDIA Titan RTX, R9 5900X
9239 Points -4%
Media NVIDIA Titan RTX
  (8945 - 9528, n=24)
9303 Points -3%
Media NVIDIA GeForce RTX 2080 Ti (Desktop)
  (8537 - 9021, n=2)
8779 Points -8%
KFA2 GeForce RTX 2080 Ti EX
NVIDIA GeForce RTX 2080 Ti (Desktop), R9 3900X
8537 Points -11%
MSI GeForce RTX 3070 Gaming X Trio
NVIDIA GeForce RTX 3070, R9 5900X
8191 Points -15%
Media NVIDIA GeForce RTX 3070
  (7796 - 8191, n=5)
7941 Points -17%
Media NVIDIA GeForce RTX 2080 Super (Desktop)
  (6745 - 6947, n=3)
6873 Points -28%
Nvidia GeForce RTX 2080 Super
NVIDIA GeForce RTX 2080 Super (Desktop), R7 2700X
6745 Points -30%
Nvidia GeForce RTX 2070 Super
NVIDIA GeForce RTX 2070 Super (Desktop), R7 2700X
5840 Points -39%
Media NVIDIA GeForce RTX 2070 Super (Desktop)
  (5725 - 5988, n=5)
5838 Points -39%
Unigine Heaven 4.0
Extreme Preset DX11
Media NVIDIA GeForce RTX 3090
  (272 - 315, n=10)
299 fps +15%
Nvidia GeForce RTX 3090 Founders Edition
NVIDIA GeForce RTX 3090, R9 5900X
274 fps +6%
AMD Radeon RX 6900 XT
AMD Radeon RX 6900 XT, R9 5950X
259.5 (49.3min - 537.2max) fps
AMD Radeon RX 6800 XT
AMD Radeon RX 6800 XT, R9 5950X
247.9 fps -4%
Media NVIDIA GeForce RTX 3080
  (233 - 253, n=2)
243 fps -6%
AMD Ryzen 9 5900X
NVIDIA Titan RTX, R9 5900X
237.1 fps -9%
Media NVIDIA Titan RTX
  (207 - 248, n=12)
236 fps -9%
ASUS GeForce RTX 3080 ROG STRIX OC GAMING
NVIDIA GeForce RTX 3080, R9 5900X
232.6 fps -10%
Media NVIDIA GeForce RTX 2080 Ti (Desktop)
  (215 - 226, n=3)
222 fps -14%
KFA2 GeForce RTX 2080 Ti EX
NVIDIA GeForce RTX 2080 Ti (Desktop), R9 3900X
215.2 fps -17%
Media NVIDIA GeForce RTX 3070
  (196.4 - 214, n=5)
206 fps -21%
MSI GeForce RTX 3070 Gaming X Trio
NVIDIA GeForce RTX 3070, R9 5900X
202.5 fps -22%
Nvidia GeForce RTX 2080 Super
NVIDIA GeForce RTX 2080 Super (Desktop), R7 2700X
175.2 fps -32%
Media NVIDIA GeForce RTX 2080 Super (Desktop)
 
175.2 fps -32%
Media NVIDIA GeForce RTX 2070 Super (Desktop)
  (160.1 - 172.3, n=4)
167.1 fps -36%
Nvidia GeForce RTX 2070 Super
NVIDIA GeForce RTX 2070 Super (Desktop), R7 2700X
160.1 fps -38%
Media AMD Radeon RX 5700 XT (Desktop)
  (132.5 - 144.7, n=5)
136.8 fps -47%
AMD Radeon RX 5700 XT
AMD Radeon RX 5700 XT (Desktop), R7 2700X
132.5 fps -49%
AMD Radeon RX 5700
AMD Radeon RX 5700 (Desktop), R7 2700X
119.9 fps -54%
Extreme Preset OpenGL
Media NVIDIA GeForce RTX 3090
  (188.2 - 284, n=9)
268 fps +30%
Media NVIDIA GeForce RTX 3080
  (232 - 243, n=2)
238 fps +15%
ASUS GeForce RTX 3080 ROG STRIX OC GAMING
NVIDIA GeForce RTX 3080, R9 5900X
232.4 fps +13%
Media NVIDIA Titan RTX
  (203 - 299, n=12)
223 fps +8%
AMD Ryzen 9 5900X
NVIDIA Titan RTX, R9 5900X
215.1 fps +4%
AMD Radeon RX 6900 XT
AMD Radeon RX 6900 XT, R9 5950X
206.5 (8.2min - 453.7max) fps
Media NVIDIA GeForce RTX 2080 Ti (Desktop)
  (202 - 213, n=3)
206 fps 0%
KFA2 GeForce RTX 2080 Ti EX
NVIDIA GeForce RTX 2080 Ti (Desktop), R9 3900X
204.4 fps -1%
AMD Radeon RX 6800 XT
AMD Radeon RX 6800 XT, R9 5950X
204 fps -1%
MSI GeForce RTX 3070 Gaming X Trio
NVIDIA GeForce RTX 3070, R9 5900X
196.1 fps -5%
Media NVIDIA GeForce RTX 3070
  (187.5 - 196.1, n=4)
192.5 fps -7%
Nvidia GeForce RTX 3090 Founders Edition
NVIDIA GeForce RTX 3090, R9 5900X
188.2 fps -9%
Nvidia GeForce RTX 2080 Super
NVIDIA GeForce RTX 2080 Super (Desktop), R7 2700X
167.5 fps -19%
Media NVIDIA GeForce RTX 2080 Super (Desktop)
 
167.5 fps -19%
Media NVIDIA GeForce RTX 2070 Super (Desktop)
  (153.5 - 157.1, n=4)
155.4 fps -25%
Nvidia GeForce RTX 2070 Super
NVIDIA GeForce RTX 2070 Super (Desktop), R7 2700X
153.5 fps -26%
Media AMD Radeon RX 5700 XT (Desktop)
  (97.8 - 161.9, n=6)
124.7 fps -40%
AMD Radeon RX 5700 XT
AMD Radeon RX 5700 XT (Desktop), R7 2700X
110.2 fps -47%
AMD Radeon RX 5700
AMD Radeon RX 5700 (Desktop), R7 2700X
100.7 fps -51%
Unigine Valley 1.0
1920x1080 Extreme HD DirectX AA:x8
Media NVIDIA GeForce RTX 3090
  (184.2 - 245, n=10)
223 fps +11%
AMD Radeon RX 6900 XT
AMD Radeon RX 6900 XT, R9 5950X
200.8 (53.4min - 359.1max) fps
Nvidia GeForce RTX 3090 Founders Edition
NVIDIA GeForce RTX 3090, R9 5900X
192.4 fps -4%
AMD Radeon RX 6800 XT
AMD Radeon RX 6800 XT, R9 5950X
190.6 fps -5%
AMD Ryzen 9 5900X
NVIDIA Titan RTX, R9 5900X
180.1 fps -10%
Media NVIDIA GeForce RTX 3080
  (176.2 - 181.8, n=2)
179 fps -11%
ASUS GeForce RTX 3080 ROG STRIX OC GAMING
NVIDIA GeForce RTX 3080, R9 5900X
176.2 fps -12%
Media NVIDIA Titan RTX
  (135 - 191.4, n=12)
173.3 fps -14%
Media NVIDIA GeForce RTX 2080 Ti (Desktop)
  (159.4 - 164.1, n=3)
162.2 fps -19%
Media NVIDIA GeForce RTX 3070
  (155.1 - 168.5, n=5)
161.2 fps -20%
KFA2 GeForce RTX 2080 Ti EX
NVIDIA GeForce RTX 2080 Ti (Desktop), R9 3900X
159.4 fps -21%
MSI GeForce RTX 3070 Gaming X Trio
NVIDIA GeForce RTX 3070, R9 5900X
155.1 fps -23%
Media NVIDIA GeForce RTX 2070 Super (Desktop)
  (113.7 - 127.4, n=4)
122.5 fps -39%
Nvidia GeForce RTX 2080 Super
NVIDIA GeForce RTX 2080 Super (Desktop), R7 2700X
120.2 fps -40%
Media NVIDIA GeForce RTX 2080 Super (Desktop)
 
120.2 fps -40%
Nvidia GeForce RTX 2070 Super
NVIDIA GeForce RTX 2070 Super (Desktop), R7 2700X
113.7 fps -43%
Media AMD Radeon RX 5700 XT (Desktop)
  (106.3 - 116, n=4)
111.5 fps -44%
AMD Radeon RX 5700 XT
AMD Radeon RX 5700 XT (Desktop), R7 2700X
106.3 fps -47%
AMD Radeon RX 5700
AMD Radeon RX 5700 (Desktop), R7 2700X
99.3 fps -51%
1920x1080 Extreme HD Preset OpenGL AA:x8
Media NVIDIA GeForce RTX 3090
  (158.8 - 211, n=9)
201 fps +20%
Media NVIDIA GeForce RTX 3080
  (163.8 - 172, n=2)
167.9 fps 0%
AMD Radeon RX 6900 XT
AMD Radeon RX 6900 XT, R9 5950X
167.4 (56.7min - 375.7max) fps
ASUS GeForce RTX 3080 ROG STRIX OC GAMING
NVIDIA GeForce RTX 3080, R9 5900X
163.8 fps -2%
Nvidia GeForce RTX 3090 Founders Edition
NVIDIA GeForce RTX 3090, R9 5900X
158.8 fps -5%
AMD Ryzen 9 5900X
NVIDIA Titan RTX, R9 5900X
158.5 fps -5%
AMD Radeon RX 6800 XT
AMD Radeon RX 6800 XT, R9 5950X
158.2 fps -5%
Media NVIDIA Titan RTX
  (139.2 - 181.2, n=12)
158.1 fps -6%
Media NVIDIA GeForce RTX 2080 Ti (Desktop)
  (144.5 - 147.8, n=3)
145.8 fps -13%
KFA2 GeForce RTX 2080 Ti EX
NVIDIA GeForce RTX 2080 Ti (Desktop), R9 3900X
145.1 fps -13%
MSI GeForce RTX 3070 Gaming X Trio
NVIDIA GeForce RTX 3070, R9 5900X
142.9 fps -15%
Media NVIDIA GeForce RTX 3070
  (140.2 - 144.9, n=4)
142.7 fps -15%
Nvidia GeForce RTX 2080 Super
NVIDIA GeForce RTX 2080 Super (Desktop), R7 2700X
114.5 fps -32%
Media NVIDIA GeForce RTX 2080 Super (Desktop)
 
114.5 fps -32%
Media NVIDIA GeForce RTX 2070 Super (Desktop)
  (105.6 - 112, n=4)
109.5 fps -35%
Nvidia GeForce RTX 2070 Super
NVIDIA GeForce RTX 2070 Super (Desktop), R7 2700X
105.6 fps -37%
Media AMD Radeon RX 5700 XT (Desktop)
  (88.5 - 108.5, n=5)
92.8 fps -45%
AMD Radeon RX 5700 XT
AMD Radeon RX 5700 XT (Desktop), R7 2700X
89.1 fps -47%
AMD Radeon RX 5700
AMD Radeon RX 5700 (Desktop), R7 2700X
82.7 fps -51%
Unigine Superposition
1280x720 720p Low
Media NVIDIA GeForce RTX 3090
  (33329 - 54879, n=9)
45093 Points +22%
AMD Ryzen 9 5900X
NVIDIA Titan RTX, R9 5900X
40994 Points +11%
Media NVIDIA Titan RTX
  (25622 - 50876, n=9)
40891 Points +10%
Media NVIDIA GeForce RTX 2070 Super (Desktop)
  (26742 - 45424, n=3)
38495 Points +4%
Media AMD Radeon RX 5700 XT (Desktop)
  (28674 - 42884, n=3)
37187 Points 0%
AMD Radeon RX 6900 XT
AMD Radeon RX 6900 XT, R9 5950X
37023 Points
AMD Radeon RX 6800 XT
AMD Radeon RX 6800 XT, R9 5950X
36452 Points -2%
Nvidia GeForce RTX 3090 Founders Edition
NVIDIA GeForce RTX 3090, R9 5900X
34649 Points -6%
Media NVIDIA GeForce RTX 3070
  (27330 - 40007, n=5)
34576 Points -7%
MSI GeForce RTX 3070 Gaming X Trio
NVIDIA GeForce RTX 3070, R9 5900X
31666 Points -14%
Media NVIDIA GeForce RTX 3080
  (30851 - 32183, n=2)
31517 Points -15%
ASUS GeForce RTX 3080 ROG STRIX OC GAMING
NVIDIA GeForce RTX 3080, R9 5900X
30851 Points -17%
Media NVIDIA GeForce RTX 2080 Super (Desktop)
 
26907 Points -27%
1920x1080 1080p High
Media NVIDIA GeForce RTX 3090
  (23626 - 27207, n=10)
25978 Points +4%
AMD Radeon RX 6900 XT
AMD Radeon RX 6900 XT, R9 5950X
25029 Points
Nvidia GeForce RTX 3090 Founders Edition
NVIDIA GeForce RTX 3090, R9 5900X
23853 Points -5%
AMD Radeon RX 6800 XT
AMD Radeon RX 6800 XT, R9 5950X
22265 Points -11%
Media NVIDIA GeForce RTX 3080
  (21333 - 21912, n=2)
21623 Points -14%
ASUS GeForce RTX 3080 ROG STRIX OC GAMING
NVIDIA GeForce RTX 3080, R9 5900X
21333 Points -15%
AMD Ryzen 9 5900X
NVIDIA Titan RTX, R9 5900X
20315 Points -19%
Media NVIDIA Titan RTX
  (19460 - 20658, n=9)
20301 Points -19%
MSI GeForce RTX 3070 Gaming X Trio
NVIDIA GeForce RTX 3070, R9 5900X
17346 Points -31%
Media NVIDIA GeForce RTX 3070
  (17054 - 17491, n=5)
17312 Points -31%
Media NVIDIA GeForce RTX 2080 Super (Desktop)
 
15558 Points -38%
Media NVIDIA GeForce RTX 2070 Super (Desktop)
  (13655 - 13832, n=3)
13765 Points -45%
Media AMD Radeon RX 5700 XT (Desktop)
  (11874 - 11902, n=3)
11886 Points -53%
1920x1080 1080p Extreme
Media NVIDIA GeForce RTX 3090
  (11806 - 12694, n=10)
12227 Points +14%
Nvidia GeForce RTX 3090 Founders Edition
NVIDIA GeForce RTX 3090, R9 5900X
11806 Points +11%
Media NVIDIA GeForce RTX 3080
  (10572 - 10822, n=2)
10697 Points 0%
AMD Radeon RX 6900 XT
AMD Radeon RX 6900 XT, R9 5950X
10683 Points
ASUS GeForce RTX 3080 ROG STRIX OC GAMING
NVIDIA GeForce RTX 3080, R9 5900X
10572 Points -1%
AMD Radeon RX 6800 XT
AMD Radeon RX 6800 XT, R9 5950X
10046 Points -6%
AMD Ryzen 9 5900X
NVIDIA Titan RTX, R9 5900X
9056 Points -15%
Media NVIDIA Titan RTX
  (8916 - 9285, n=9)
9051 Points -15%
MSI GeForce RTX 3070 Gaming X Trio
NVIDIA GeForce RTX 3070, R9 5900X
8507 Points -20%
Media NVIDIA GeForce RTX 3070
  (8276 - 8507, n=5)
8354 Points -22%
Media NVIDIA GeForce RTX 2080 Super (Desktop)
 
7080 Points -34%
Media NVIDIA GeForce RTX 2070 Super (Desktop)
  (6161 - 6178, n=3)
6169 Points -42%
Media AMD Radeon RX 5700 XT (Desktop)
  (4901 - 4967, n=3)
4927 Points -54%
3840x2160 4k Optimized
Media NVIDIA GeForce RTX 3090
  (15794 - 16868, n=10)
16352 Points +9%
Nvidia GeForce RTX 3090 Founders Edition
NVIDIA GeForce RTX 3090, R9 5900X
15794 Points +6%
AMD Radeon RX 6900 XT
AMD Radeon RX 6900 XT, R9 5950X
14955 Points
Media NVIDIA GeForce RTX 3080
  (13984 - 14243, n=2)
14114 Points -6%
ASUS GeForce RTX 3080 ROG STRIX OC GAMING
NVIDIA GeForce RTX 3080, R9 5900X
13984 Points -6%
AMD Radeon RX 6800 XT
AMD Radeon RX 6800 XT, R9 5950X
13471 Points -10%
Media NVIDIA Titan RTX
  (11937 - 12644, n=9)
12203 Points -18%
AMD Ryzen 9 5900X
NVIDIA Titan RTX, R9 5900X
12186 Points -19%
MSI GeForce RTX 3070 Gaming X Trio
NVIDIA GeForce RTX 3070, R9 5900X
10755 Points -28%
Media NVIDIA GeForce RTX 3070
  (10544 - 10755, n=5)
10667 Points -29%
Media NVIDIA GeForce RTX 2080 Super (Desktop)
 
9338 Points -38%
Media NVIDIA GeForce RTX 2070 Super (Desktop)
  (8096 - 8111, n=3)
8101 Points -46%
Media AMD Radeon RX 5700 XT (Desktop)
  (6885 - 7034, n=3)
6973 Points -53%
7680x4320 8k Optimized
Media NVIDIA GeForce RTX 3090
  (6969 - 7521, n=10)
7160 Points +24%
Nvidia GeForce RTX 3090 Founders Edition
NVIDIA GeForce RTX 3090, R9 5900X
7002 Points +21%
Media NVIDIA GeForce RTX 3080
  (6243 - 6346, n=2)
6295 Points +9%
ASUS GeForce RTX 3080 ROG STRIX OC GAMING
NVIDIA GeForce RTX 3080, R9 5900X
6243 Points +8%
AMD Radeon RX 6900 XT
AMD Radeon RX 6900 XT, R9 5950X
5764 Points
AMD Ryzen 9 5900X
NVIDIA Titan RTX, R9 5900X
5402 Points -6%
Media NVIDIA Titan RTX
  (5255 - 5571, n=9)
5393 Points -6%
AMD Radeon RX 6800 XT
AMD Radeon RX 6800 XT, R9 5950X
5256 Points -9%
MSI GeForce RTX 3070 Gaming X Trio
NVIDIA GeForce RTX 3070, R9 5900X
4695 Points -19%
Media NVIDIA GeForce RTX 3070
  (4587 - 4695, n=5)
4624 Points -20%
Media NVIDIA GeForce RTX 2080 Super (Desktop)
 
3989 Points -31%
Media NVIDIA GeForce RTX 2070 Super (Desktop)
  (3419 - 3435, n=3)
3429 Points -41%
Media AMD Radeon RX 5700 XT (Desktop)
  (2867 - 2887, n=3)
2877 Points -50%
3DMark 11 Performance
42418 punti
3DMark Fire Strike Score
39057 punti
3DMark Fire Strike Extreme Score
25197 punti
3DMark Time Spy Score
17549 punti
Aiuto

Benchmarks per il calcolo

La RX 6900 XT offre uno spettacolo decente contro la RTX 3090 nei benchmarks di calcolo. In ComputeMark, vediamo l'offerta di punta di AMD trainare tra il 3% e il 26% dietro la RTX 3090 a seconda del test. È interessante notare che LuxMark sembra mostrare tutta la potenza della prodezza di calcolo di RDNA 2 con la RX 6900 XT che mostra un enorme 114% di vantaggio sulla RTX 3090 nel test Sala GPU-only, anche se la scheda subisce un colpo di circa il 12% nel benchmark Room GPU-only.

Le prestazioni in Geekbench 5.3 compute usando OpenCL e Vulkan non sembrano essere impressionanti con anche la RTX 3080 che offre prestazioni marginalmente migliori della RX 6900 XT in OpenCL. Anche se la fortuna si inverte nella parte Vulkan del test rispetto alla RTX 3080, la RTX 3090 Founders Edition qui riesce ancora ad avere un comodo vantaggio del 67% sulla RX 6900 XT.

ComputeMark v2.1
1024x600 Normal, QJuliaRayTrace
Media NVIDIA GeForce RTX 3090
  (16403 - 18223, n=9)
17439 Points +42%
Nvidia GeForce RTX 3090 Founders Edition
NVIDIA GeForce RTX 3090, R9 5900X
16543 Points +35%
Media NVIDIA GeForce RTX 3080
  (14718 - 15508, n=2)
15113 Points +23%
ASUS GeForce RTX 3080 ROG STRIX OC GAMING
NVIDIA GeForce RTX 3080, R9 5900X
14718 Points +20%
AMD Radeon RX 6900 XT
AMD Radeon RX 6900 XT, R9 5950X
12255 Points
MSI GeForce RTX 3070 Gaming X Trio
NVIDIA GeForce RTX 3070, R9 5900X
11816 Points -4%
Media NVIDIA GeForce RTX 3070
  (11510 - 11816, n=3)
11665 Points -5%
AMD Radeon RX 6800 XT
AMD Radeon RX 6800 XT, R9 5950X
11304 Points -8%
Media NVIDIA Titan RTX
  (9418 - 10129, n=3)
9748 Points -20%
Media NVIDIA GeForce RTX 2080 Ti (Desktop)
  (9104 - 9690, n=3)
9492 Points -23%
KFA2 GeForce RTX 2080 Ti EX
NVIDIA GeForce RTX 2080 Ti (Desktop), R9 3900X
9104 Points -26%
Nvidia GeForce RTX 2080 Super
NVIDIA GeForce RTX 2080 Super (Desktop), R7 2700X
7258 Points -41%
Media NVIDIA GeForce RTX 2080 Super (Desktop)
 
7258 Points -41%
Media NVIDIA GeForce RTX 2070 Super (Desktop)
  (6155 - 6158, n=2)
6157 Points -50%
Nvidia GeForce RTX 2070 Super
NVIDIA GeForce RTX 2070 Super (Desktop), R7 2700X
6155 Points -50%
AMD Radeon RX 5700 XT
AMD Radeon RX 5700 XT (Desktop), R7 2700X
5761 Points -53%
Media AMD Radeon RX 5700 XT (Desktop)
  (5677 - 5761, n=2)
5719 Points -53%
AMD Radeon RX 5700
AMD Radeon RX 5700 (Desktop), R7 2700X
4703 Points -62%
1024x600 Normal, Mandel Scalar
Media NVIDIA GeForce RTX 3090
  (10650 - 11564, n=9)
11171 Points +3%
AMD Radeon RX 6900 XT
AMD Radeon RX 6900 XT, R9 5950X
10834 Points
Nvidia GeForce RTX 3090 Founders Edition
NVIDIA GeForce RTX 3090, R9 5900X
10650 Points -2%
AMD Radeon RX 6800 XT
AMD Radeon RX 6800 XT, R9 5950X
10018 Points -8%
Media NVIDIA GeForce RTX 3080
  (9554 - 9938, n=2)
9746 Points -10%
ASUS GeForce RTX 3080 ROG STRIX OC GAMING
NVIDIA GeForce RTX 3080, R9 5900X
9554 Points -12%
MSI GeForce RTX 3070 Gaming X Trio
NVIDIA GeForce RTX 3070, R9 5900X
7314 Points -32%
Media NVIDIA GeForce RTX 3070
  (7042 - 7314, n=3)
7169 Points -34%
Media NVIDIA Titan RTX
  (5977 - 6406, n=3)
6184 Points -43%
Media NVIDIA GeForce RTX 2080 Ti (Desktop)
  (5679 - 6226, n=3)
6010 Points -45%
KFA2 GeForce RTX 2080 Ti EX
NVIDIA GeForce RTX 2080 Ti (Desktop), R9 3900X
5679 Points -48%
AMD Radeon RX 5700 XT
AMD Radeon RX 5700 XT (Desktop), R7 2700X
4869 Points -55%
Media AMD Radeon RX 5700 XT (Desktop)
  (4846 - 4869, n=2)
4858 Points -55%
Nvidia GeForce RTX 2080 Super
NVIDIA GeForce RTX 2080 Super (Desktop), R7 2700X
4525 Points -58%
Media NVIDIA GeForce RTX 2080 Super (Desktop)
 
4525 Points -58%
AMD Radeon RX 5700
AMD Radeon RX 5700 (Desktop), R7 2700X
4043 Points -63%
Nvidia GeForce RTX 2070 Super
NVIDIA GeForce RTX 2070 Super (Desktop), R7 2700X
3782 Points -65%
Media NVIDIA GeForce RTX 2070 Super (Desktop)
  (3748 - 3782, n=2)
3765 Points -65%
1024x600 Normal, Mandel Vector
Media NVIDIA GeForce RTX 3090
  (8038 - 10097, n=9)
9437 Points +9%
Nvidia GeForce RTX 3090 Founders Edition
NVIDIA GeForce RTX 3090, R9 5900X
9236 Points +6%
AMD Radeon RX 6900 XT
AMD Radeon RX 6900 XT, R9 5950X
8690 Points
AMD Radeon RX 6800 XT
AMD Radeon RX 6800 XT, R9 5950X
8399 Points -3%
Media NVIDIA GeForce RTX 3080
  (7148 - 7540, n=2)
7344 Points -15%
ASUS GeForce RTX 3080 ROG STRIX OC GAMING
NVIDIA GeForce RTX 3080, R9 5900X
7148 Points -18%
Media NVIDIA GeForce RTX 3070
  (5364 - 6266, n=3)
5707 Points -34%
MSI GeForce RTX 3070 Gaming X Trio
NVIDIA GeForce RTX 3070, R9 5900X
5490 Points -37%
Media NVIDIA Titan RTX
  (4944 - 5440, n=3)
5158 Points -41%
Media NVIDIA GeForce RTX 2080 Ti (Desktop)
  (4695 - 5092, n=3)
4941 Points -43%
KFA2 GeForce RTX 2080 Ti EX
NVIDIA GeForce RTX 2080 Ti (Desktop), R9 3900X
4695 Points -46%
Media AMD Radeon RX 5700 XT (Desktop)
  (4246 - 4371, n=2)
4309 Points -50%
AMD Radeon RX 5700 XT
AMD Radeon RX 5700 XT (Desktop), R7 2700X
4246 Points -51%
Nvidia GeForce RTX 2080 Super
NVIDIA GeForce RTX 2080 Super (Desktop), R7 2700X
3835 Points -56%
Media NVIDIA GeForce RTX 2080 Super (Desktop)
 
3835 Points -56%
AMD Radeon RX 5700
AMD Radeon RX 5700 (Desktop), R7 2700X
3532 Points -59%
Nvidia GeForce RTX 2070 Super
NVIDIA GeForce RTX 2070 Super (Desktop), R7 2700X
3358 Points -61%
Media NVIDIA GeForce RTX 2070 Super (Desktop)
  (3348 - 3358, n=2)
3353 Points -61%
1024x600 Normal, Fluid 2DTexArr
Media NVIDIA GeForce RTX 3090
  (4344 - 4608, n=9)
4497 Points +15%
Nvidia GeForce RTX 3090 Founders Edition
NVIDIA GeForce RTX 3090, R9 5900X
4344 Points +11%
Media NVIDIA GeForce RTX 3080
  (4087 - 4159, n=2)
4123 Points +5%
ASUS GeForce RTX 3080 ROG STRIX OC GAMING
NVIDIA GeForce RTX 3080, R9 5900X
4087 Points +4%
AMD Radeon RX 6800 XT
AMD Radeon RX 6800 XT, R9 5950X
3947 Points +1%
AMD Radeon RX 6900 XT
AMD Radeon RX 6900 XT, R9 5950X
3924 Points
Media NVIDIA Titan RTX
  (3691 - 3828, n=3)
3757 Points -4%
Media NVIDIA GeForce RTX 2080 Ti (Desktop)
  (3444 - 3539, n=3)
3499 Points -11%
KFA2 GeForce RTX 2080 Ti EX
NVIDIA GeForce RTX 2080 Ti (Desktop), R9 3900X
3444 Points -12%
MSI GeForce RTX 3070 Gaming X Trio
NVIDIA GeForce RTX 3070, R9 5900X
2704 Points -31%
Media NVIDIA GeForce RTX 3070
  (2666 - 2706, n=3)
2692 Points -31%
Nvidia GeForce RTX 2080 Super
NVIDIA GeForce RTX 2080 Super (Desktop), R7 2700X
2655 Points -32%
Media NVIDIA GeForce RTX 2080 Super (Desktop)
 
2655 Points -32%
Media NVIDIA GeForce RTX 2070 Super (Desktop)
  (2331 - 2354, n=2)
2343 Points -40%
Nvidia GeForce RTX 2070 Super
NVIDIA GeForce RTX 2070 Super (Desktop), R7 2700X
2331 Points -41%
Media AMD Radeon RX 5700 XT (Desktop)
  (1960 - 2005, n=2)
1983 Points -49%
AMD Radeon RX 5700 XT
AMD Radeon RX 5700 XT (Desktop), R7 2700X
1960 Points -50%
AMD Radeon RX 5700
AMD Radeon RX 5700 (Desktop), R7 2700X
1810 Points -54%
1024x600 Normal, Fluid 3DTex
Media NVIDIA GeForce RTX 3090
  (5246 - 5520, n=9)
5444 Points +6%
Nvidia GeForce RTX 3090 Founders Edition
NVIDIA GeForce RTX 3090, R9 5900X
5246 Points +2%
AMD Radeon RX 6800 XT
AMD Radeon RX 6800 XT, R9 5950X
5154 Points 0%
AMD Radeon RX 6900 XT
AMD Radeon RX 6900 XT, R9 5950X
5154 Points
Media NVIDIA GeForce RTX 3080
  (4417 - 4450, n=2)
4434 Points -14%
ASUS GeForce RTX 3080 ROG STRIX OC GAMING
NVIDIA GeForce RTX 3080, R9 5900X
4417 Points -14%
Media NVIDIA Titan RTX
  (3877 - 4027, n=3)
3955 Points -23%
Media NVIDIA GeForce RTX 2080 Ti (Desktop)
  (3589 - 3653, n=3)
3625 Points -30%
KFA2 GeForce RTX 2080 Ti EX
NVIDIA GeForce RTX 2080 Ti (Desktop), R9 3900X
3589 Points -30%
MSI GeForce RTX 3070 Gaming X Trio
NVIDIA GeForce RTX 3070, R9 5900X
2776 Points -46%
Media NVIDIA GeForce RTX 3070
  (2749 - 2791, n=3)
2772 Points -46%
Nvidia GeForce RTX 2080 Super
NVIDIA GeForce RTX 2080 Super (Desktop), R7 2700X
2736 Points -47%
Media NVIDIA GeForce RTX 2080 Super (Desktop)
 
2736 Points -47%
Media NVIDIA GeForce RTX 2070 Super (Desktop)
  (2456 - 2486, n=2)
2471 Points -52%
Nvidia GeForce RTX 2070 Super
NVIDIA GeForce RTX 2070 Super (Desktop), R7 2700X
2456 Points -52%
Media AMD Radeon RX 5700 XT (Desktop)
  (2349 - 2376, n=2)
2363 Points -54%
AMD Radeon RX 5700 XT
AMD Radeon RX 5700 XT (Desktop), R7 2700X
2349 Points -54%
AMD Radeon RX 5700
AMD Radeon RX 5700 (Desktop), R7 2700X
2294 Points -55%
1024x600 Normal, Score
Media NVIDIA GeForce RTX 3090
  (44948 - 49118, n=8)
47736 Points +17%
Nvidia GeForce RTX 3090 Founders Edition
NVIDIA GeForce RTX 3090, R9 5900X
46018 Points +13%
AMD Radeon RX 6900 XT
AMD Radeon RX 6900 XT, R9 5950X
40857 Points
Media NVIDIA GeForce RTX 3080
  (39924 - 41594, n=2)
40759 Points 0%
ASUS GeForce RTX 3080 ROG STRIX OC GAMING
NVIDIA GeForce RTX 3080, R9 5900X
39924 Points -2%
AMD Radeon RX 6800 XT
AMD Radeon RX 6800 XT, R9 5950X
38823 Points -5%
MSI GeForce RTX 3070 Gaming X Trio
NVIDIA GeForce RTX 3070, R9 5900X
30100 Points -26%
Media NVIDIA GeForce RTX 3070
  (29330 - 30581, n=3)
30004 Points -27%
Media NVIDIA Titan RTX
  (27907 - 29830, n=3)
28802 Points -30%
Media NVIDIA GeForce RTX 2080 Ti (Desktop)
  (26510 - 28145, n=3)
27567 Points -33%
KFA2 GeForce RTX 2080 Ti EX
NVIDIA GeForce RTX 2080 Ti (Desktop), R9 3900X
26510 Points -35%
Nvidia GeForce RTX 2080 Super
NVIDIA GeForce RTX 2080 Super (Desktop), R7 2700X
21009 Points -49%
Media NVIDIA GeForce RTX 2080 Super (Desktop)
 
21009 Points -49%
Media AMD Radeon RX 5700 XT (Desktop)
  (19184 - 19274, n=2)
19229 Points -53%
AMD Radeon RX 5700 XT
AMD Radeon RX 5700 XT (Desktop), R7 2700X
19184 Points -53%
Media NVIDIA GeForce RTX 2070 Super (Desktop)
  (18083 - 18095, n=2)
18089 Points -56%
Nvidia GeForce RTX 2070 Super
NVIDIA GeForce RTX 2070 Super (Desktop), R7 2700X
18083 Points -56%
AMD Radeon RX 5700
AMD Radeon RX 5700 (Desktop), R7 2700X
16383 Points -60%
LuxMark v2.0 64Bit
Room GPUs-only
Media NVIDIA GeForce RTX 3090
  (5727 - 5974, n=8)
5881 Samples/s +16%
Nvidia GeForce RTX 3090 Founders Edition
NVIDIA GeForce RTX 3090, R9 5900X
5808 Samples/s +14%
Media NVIDIA GeForce RTX 3080
  (5112 - 5198, n=2)
5155 Samples/s +1%
ASUS GeForce RTX 3080 ROG STRIX OC GAMING
NVIDIA GeForce RTX 3080, R9 5900X
5112 Samples/s +1%
AMD Radeon RX 6900 XT
AMD Radeon RX 6900 XT, R9 5950X
5084 Samples/s
AMD Radeon RX 6800 XT
AMD Radeon RX 6800 XT, R9 5950X
5057 Samples/s -1%
Media NVIDIA Titan RTX
  (4643 - 4703, n=2)
4673 Samples/s -8%
Media NVIDIA GeForce RTX 2080 Ti (Desktop)
  (4425 - 4494, n=3)
4449 Samples/s -12%
KFA2 GeForce RTX 2080 Ti EX
NVIDIA GeForce RTX 2080 Ti (Desktop), R9 3900X
4429 Samples/s -13%
MSI GeForce RTX 3070 Gaming X Trio
NVIDIA GeForce RTX 3070, R9 5900X
4293 Samples/s -16%
Media NVIDIA GeForce RTX 3070
  (2187 - 4293, n=3)
3588 Samples/s -29%
Nvidia GeForce RTX 2080 Super
NVIDIA GeForce RTX 2080 Super (Desktop), R7 2700X
3430 Samples/s -33%
Media NVIDIA GeForce RTX 2080 Super (Desktop)
 
3430 Samples/s -33%
Nvidia GeForce RTX 2070 Super
NVIDIA GeForce RTX 2070 Super (Desktop), R7 2700X
3404 Samples/s -33%
Media NVIDIA GeForce RTX 2070 Super (Desktop)
 
3404 Samples/s -33%
AMD Radeon RX 5700 XT
AMD Radeon RX 5700 XT (Desktop), R7 2700X
2104 Samples/s -59%
Media AMD Radeon RX 5700 XT (Desktop)
  (1915 - 2104, n=2)
2010 Samples/s -60%
AMD Radeon RX 5700
AMD Radeon RX 5700 (Desktop), R7 2700X
1856 Samples/s -63%
Sala GPUs-only
AMD Radeon RX 6900 XT
AMD Radeon RX 6900 XT, R9 5950X
31400 Samples/s
AMD Radeon RX 6800 XT
AMD Radeon RX 6800 XT, R9 5950X
28023 Samples/s -11%
Media NVIDIA GeForce RTX 3090
  (14590 - 15088, n=8)
14908 Samples/s -53%
Nvidia GeForce RTX 3090 Founders Edition
NVIDIA GeForce RTX 3090, R9 5900X
14670 Samples/s -53%
Media NVIDIA GeForce RTX 3080
  (12797 - 12980, n=2)
12889 Samples/s -59%
ASUS GeForce RTX 3080 ROG STRIX OC GAMING
NVIDIA GeForce RTX 3080, R9 5900X
12797 Samples/s -59%
Media NVIDIA Titan RTX
  (10799 - 10996, n=2)
10898 Samples/s -65%
Media NVIDIA GeForce RTX 2080 Ti (Desktop)
  (9999 - 10291, n=3)
10156 Samples/s -68%
MSI GeForce RTX 3070 Gaming X Trio
NVIDIA GeForce RTX 3070, R9 5900X
10115 Samples/s -68%
Media NVIDIA GeForce RTX 3070
  (10096 - 10115, n=3)
10107 Samples/s -68%
KFA2 GeForce RTX 2080 Ti EX
NVIDIA GeForce RTX 2080 Ti (Desktop), R9 3900X
9999 Samples/s -68%
Nvidia GeForce RTX 2080 Super
NVIDIA GeForce RTX 2080 Super (Desktop), R7 2700X
7878 Samples/s -75%
Media NVIDIA GeForce RTX 2080 Super (Desktop)
 
7878 Samples/s -75%
Nvidia GeForce RTX 2070 Super
NVIDIA GeForce RTX 2070 Super (Desktop), R7 2700X
7594 Samples/s -76%
Media NVIDIA GeForce RTX 2070 Super (Desktop)
 
7594 Samples/s -76%
AMD Radeon RX 5700 XT
AMD Radeon RX 5700 XT (Desktop), R7 2700X
6188 Samples/s -80%
Media AMD Radeon RX 5700 XT (Desktop)
  (4650 - 6188, n=2)
5419 Samples/s -83%
AMD Radeon RX 5700
AMD Radeon RX 5700 (Desktop), R7 2700X
5312 Samples/s -83%
Geekbench 5.5
OpenCL Score
Media NVIDIA GeForce RTX 3090
  (199930 - 224611, n=19)
214008 Points +24%
Nvidia GeForce RTX 3090 Founders Edition
NVIDIA GeForce RTX 3090, R9 5900X
199930 Points +16%
ASUS GeForce RTX 3080 ROG STRIX OC GAMING
NVIDIA GeForce RTX 3080, R9 5900X
192091 Points +11%
Media NVIDIA GeForce RTX 3080
  (164477 - 192091, n=2)
178284 Points +3%
AMD Radeon RX 6900 XT
AMD Radeon RX 6900 XT, R9 5950X
172661 Points
AMD Radeon RX 6800 XT
AMD Radeon RX 6800 XT, R9 5950X
159072 Points -8%
AMD Ryzen 9 5900X
NVIDIA Titan RTX, R9 5900X
149070 Points -14%
Media NVIDIA Titan RTX
  (132850 - 153940, n=20)
140450 Points -19%
Media NVIDIA GeForce RTX 3070
  (134961 - 138625, n=4)
136574 Points -21%
MSI GeForce RTX 3070 Gaming X Trio
NVIDIA GeForce RTX 3070, R9 5900X
136521 Points -21%
Media NVIDIA GeForce RTX 2080 Super (Desktop)
  (118695 - 127035, n=3)
122884 Points -29%
Media NVIDIA GeForce RTX 2070 Super (Desktop)
  (102914 - 132850, n=2)
117882 Points -32%
Media AMD Radeon RX 5700 XT (Desktop)
  (56327 - 84682, n=2)
70505 Points -59%
Vulkan Score
Nvidia GeForce RTX 3090 Founders Edition
NVIDIA GeForce RTX 3090, R9 5900X
147831 Points +67%
Media NVIDIA GeForce RTX 3090
  (62516 - 168974, n=19)
128422 Points +45%
Media NVIDIA Titan RTX
  (70085 - 138172, n=20)
92754 Points +5%
AMD Radeon RX 6900 XT
AMD Radeon RX 6900 XT, R9 5950X
88587 Points
AMD Radeon RX 6800 XT
AMD Radeon RX 6800 XT, R9 5950X
81098 Points -8%
Media NVIDIA GeForce RTX 3080
  (76596 - 83486, n=2)
80041 Points -10%
Media NVIDIA GeForce RTX 2080 Super (Desktop)
  (62324 - 91321, n=3)
78667 Points -11%
Media NVIDIA GeForce RTX 2070 Super (Desktop)
  (76596 - 80530, n=2)
78563 Points -11%
AMD Ryzen 9 5900X
NVIDIA Titan RTX, R9 5900X
76596 Points -14%
ASUS GeForce RTX 3080 ROG STRIX OC GAMING
NVIDIA GeForce RTX 3080, R9 5900X
76596 Points -14%
Media NVIDIA GeForce RTX 3070
  (27460 - 107958, n=4)
71908 Points -19%
MSI GeForce RTX 3070 Gaming X Trio
NVIDIA GeForce RTX 3070, R9 5900X
62516 Points -29%
Media AMD Radeon RX 5700 XT (Desktop)
  (14776 - 57117, n=2)
35947 Points -59%

Applicazioni professionali

Navi 2x sembra mostrare buoni guadagni di prestazioni in applicazioni professionali rispetto alle parti Navi 1x, e anche la migliore delle offerte consumer Ampere di NVIDIA. Anche se la Titan RTX e Quadro RTX 5000 siano complessivamente migliori quando si tratta di applicazioni CAD/CAM, energetiche, automobilistiche e mediche, i punteggi dei singoli componenti nei test SPECviewperf mostrano che la RX 6900 XT non è da meno, almeno quando si tratta di specifici flussi di lavoro CAD e di authoring 3D.

AMD Radeon RX 6900 XT
AMD Radeon RX 6900 XT, R9 5950X
AMD Radeon RX 6800 XT
AMD Radeon RX 6800 XT, R9 5950X
AMD Radeon RX 5700 XT
AMD Radeon RX 5700 XT (Desktop), R7 2700X
Nvidia GeForce RTX 3090 Founders Edition
NVIDIA GeForce RTX 3090, R9 5900X
ASUS GeForce RTX 3080 ROG STRIX OC GAMING
NVIDIA GeForce RTX 3080, R9 5900X
AMD Ryzen 9 5900X
NVIDIA Titan RTX, R9 5900X
Acer ConceptD 9 Pro
NVIDIA Quadro RTX 5000 (Laptop), i9-9980HK
SPECviewperf 12
-15%
-45%
-31%
-35%
55%
49%
1900x1060 Solidworks (sw-03)
167
150
-10%
89.6
-46%
71.4
-57%
71.1
-57%
174.9
5%
230.1
38%
1900x1060 Siemens NX (snx-02)
47.7
45.07
-6%
35.27
-26%
14.8
-69%
13.27
-72%
273.2
473%
258.1
441%
1900x1060 Showcase (showcase-01)
241
223
-7%
137.8
-43%
239
-1%
199.9
-17%
191.1
-21%
126.4
-48%
1900x1060 Medical (medical-01)
88.4
77.3
-13%
46.9
-47%
47.2
-47%
50.8
-43%
90.7
3%
109.3
24%
1900x1060 Maya (maya-04)
151
118
-22%
86.5
-43%
190
26%
184.6
22%
188.3
25%
179
19%
1900x1060 Energy (energy-01)
30.8
28.39
-8%
12.72
-59%
20.6
-33%
18.47
-40%
28.31
-8%
26
-16%
1900x1060 Creo (creo-01)
127
119
-6%
66.9
-47%
74.8
-41%
74.2
-42%
173
36%
172.1
36%
1900x1060 Catia (catia-04)
292
238
-18%
158.8
-46%
127
-57%
126.1
-57%
262.7
-10%
220
-25%
1900x1060 3ds Max (3dsmax-05)
318
167
-47%
173.8
-45%
320
1%
275.6
-13%
292.6
-8%
235.8
-26%
SPECviewperf 13
-8%
-45%
-57%
-38%
44%
35%
Solidworks (sw-04)
214
193
-10%
114.4
-47%
82.9
-61%
92.4
-57%
196.4
-8%
203.8
-5%
Siemens NX (snx-03)
85.8
81.4
-5%
61.3
-29%
15.6
-82%
23.22
-73%
493.4
475%
465.3
442%
Showcase (showcase-02)
241
232
-4%
137.6
-43%
114
-53%
190.5
-21%
127.1
-47%
Medical (medical-02)
148
130
-12%
82.8
-44%
49.3
-67%
91.8
-38%
90.8
-39%
133.4
-10%
Maya (maya-05)
395
348
-12%
220.3
-44%
253
-36%
360.2
-9%
458
16%
340.8
-14%
Energy (energy-02)
60.6
58.4
-4%
26.82
-56%
26.6
-56%
36.08
-40%
52
-14%
57.3
-5%
Creo (creo-02)
292
276
-5%
157
-46%
176
-40%
281.2
-4%
346.5
19%
319.8
10%
Catia (catia-05)
468
412
-12%
242.8
-48%
111
-76%
190.4
-59%
374.8
-20%
338.9
-28%
3ds Max (3dsmax-06)
317
284
-10%
175.6
-45%
180
-43%
238.2
-25%
291.3
-8%
232.2
-27%
SPECviewperf 2020
5%
-37%
64%
3840x2160 Solidworks (solidworks-05)
112
108
-4%
93.1
-17%
153
37%
3840x2160 Siemens NX (snx-04)
85
81.7
-4%
13.2
-84%
347
308%
3840x2160 Medical (medical-03)
30.4
27.84
-8%
9.95
-67%
16.42
-46%
3840x2160 Maya (maya-06)
266
224
-16%
181
-32%
257
-3%
3840x2160 Energy (energy-03)
32.6
60.8
87%
22.3
-32%
58.2
79%
3840x2160 Creo (creo-03)
65.4
65
-1%
68.1
4%
113
73%
3840x2160 CATIA (catia-06)
44.6
42.4
-5%
32.3
-28%
78.2
75%
3840x2160 3ds Max (3dsmax-07)
121
114
-6%
70.2
-42%
108
-11%
Media totale (Programma / Settaggio)
-6% / -6%
-45% / -45%
-42% / -42%
-37% / -37%
54% / 54%
42% / 42%

Gaming Benchmarks

Nella stragrande maggioranza dei giochi testati, la RX 6900 XT si comporta come previsto con impostazioni 4K Ultra. La RX 6900 XT sembra avere un vantaggio sulle schede NVIDIA nei titoli ottimizzati per l'hardware AMD come Assassin's Creed Odyssey e Assassin's Creed Valhalla. La scheda di punta di AMD ha guidato le classifiche in Battlefield V, Hitman 3, F1 2020e Forza Horizon 4 e Forza Horizon 4.

Detto questo, la RTX 3090 ha mostrato ovunque tra il 9% e il 20% di vantaggio nella maggior parte dei titoli che abbiamo testato, a volte arrivando fino al 30% a 4K Ultra in Mafia Edizione Definitiva. La presenza di otto unità di calcolo (CU) aggiuntive nella RX 6900 XT non sembra conferire un vantaggio significativo rispetto alla RX 6800 XT nel gaming.

Il Ray tracing, anche se disponibile, impallidisce in confronto alle schede Ampere di attuale generazione. Tuttavia, AMD deve ancora essere lodata per aver raggiunto prestazioni di ray tracing che sono per lo più alla pari o a volte un po' meglio della RTX 2080 Ti.

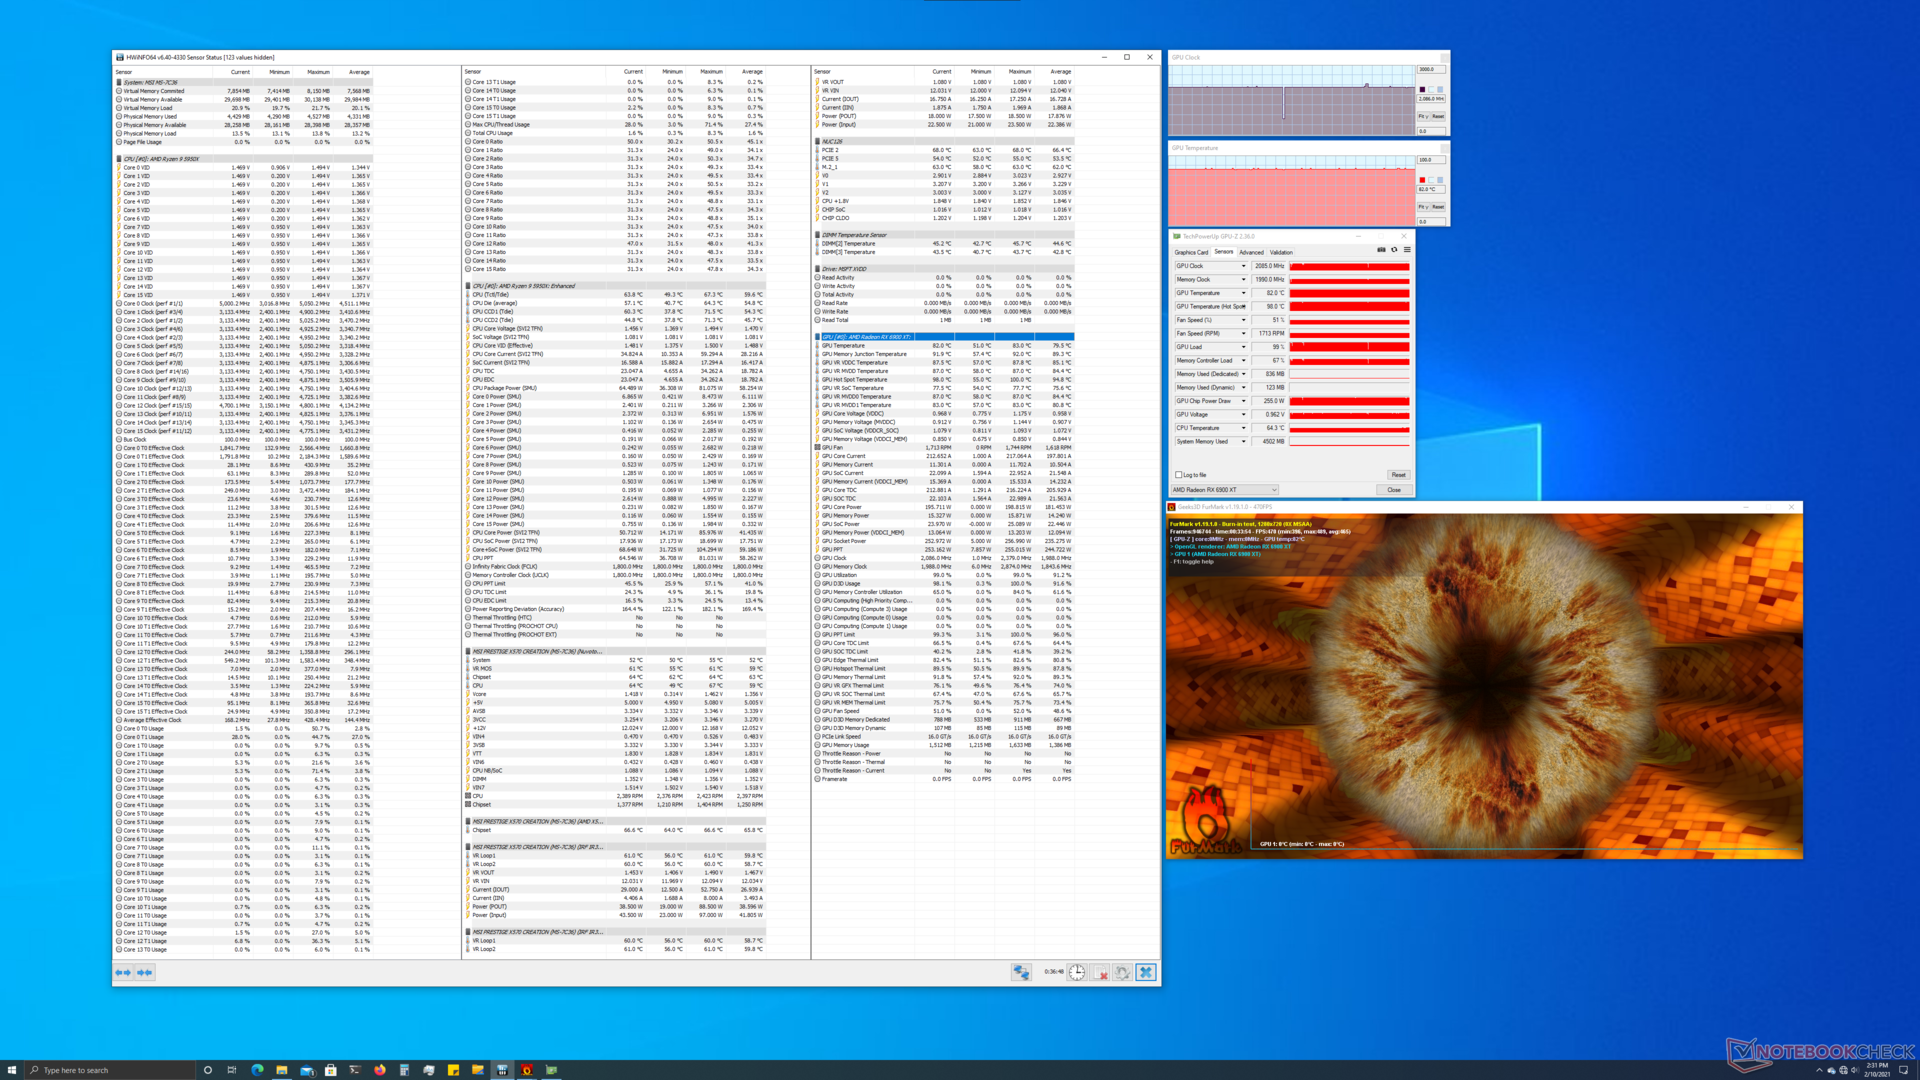
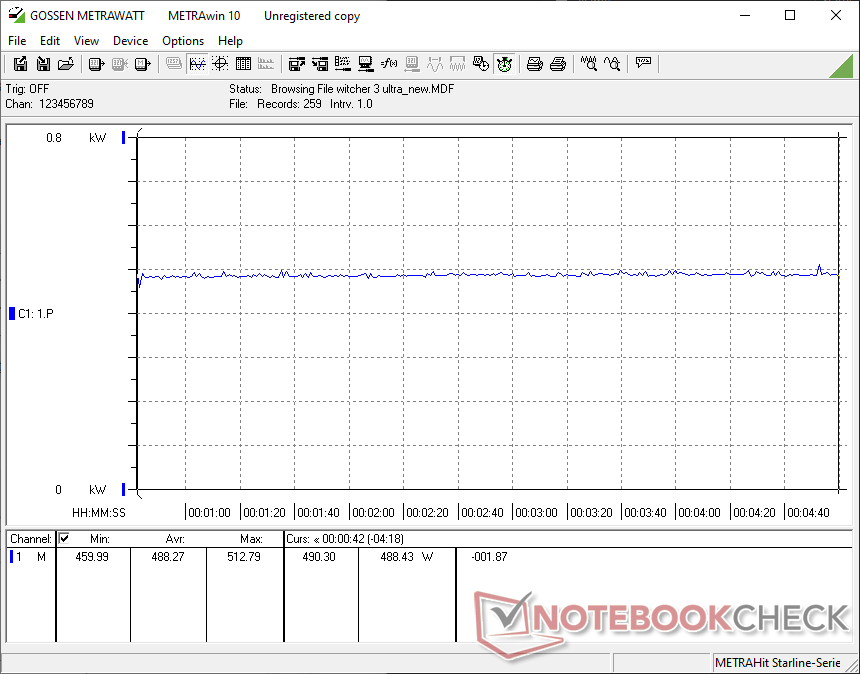
Nello stress test The Witcher 3 con impostazioni Ultra a 1080p, la RX 6900 XT offre una prestazione sostenuta abbastanza buona vicino ai 172 fps per la maggior parte. Tuttavia, vediamo l'occasionale throttling, che fa diminuire gli fps in modo significativo. Questo può probabilmente essere attribuito a un calo dei clock quando la scheda si avvicina al punto caldo o alla temperatura di 110 °C.

0102030405060708090100110120130140150160170Tooltip
AMD Radeon RX 6900 XT Radeon RX 6900 XT, R9 5950X: Ø171.1 (125-176)
The Witcher 3
3840x2160 High Graphics & Postprocessing (Nvidia HairWorks Off)
Media NVIDIA GeForce RTX 3090
  (128 - 160.2, n=12)
151.5 fps +24%
Nvidia GeForce RTX 3090 Founders Edition
NVIDIA GeForce RTX 3090, R9 5900X
148 fps +21%
AMD Radeon RX 6900 XT
AMD Radeon RX 6900 XT, R9 5950X
122 (105min, 105P1 - 134max) fps
ASUS GeForce RTX 3080 ROG STRIX OC GAMING
NVIDIA GeForce RTX 3080, R9 5900X
115 (107min - 124max) fps -6%
Media NVIDIA GeForce RTX 3080
  (114 - 115, n=2)
114.5 fps -6%
AMD Radeon RX 6800 XT
AMD Radeon RX 6800 XT, R9 5950X
110 (97min - 117max) fps -10%
AMD Ryzen 9 5900X
NVIDIA Titan RTX, R9 5900X
104 (97min - 112max) fps -15%
Media NVIDIA Titan RTX
  (94 - 107.1, n=28)
102.4 fps -16%
Media NVIDIA GeForce RTX 2080 Ti (Desktop)
  (96 - 101, n=3)
98.3 fps -19%
KFA2 GeForce RTX 2080 Ti EX
NVIDIA GeForce RTX 2080 Ti (Desktop), R9 3900X
96 (87min - 109max) fps -21%
Media NVIDIA GeForce RTX 3070
  (84 - 93.9, n=5)
89.3 fps -27%
MSI GeForce RTX 3070 Gaming X Trio
NVIDIA GeForce RTX 3070, R9 5900X
88.2 (82min - 97max) fps -28%
Nvidia GeForce RTX 2080 Super
NVIDIA GeForce RTX 2080 Super (Desktop), R7 2700X
79 (71min - 87max) fps -35%
Media NVIDIA GeForce RTX 2080 Super (Desktop)
 
79 fps -35%
Nvidia GeForce RTX 2070 Super
NVIDIA GeForce RTX 2070 Super (Desktop), R7 2700X
68 (61min - 74max) fps -44%
Media NVIDIA GeForce RTX 2070 Super (Desktop)
  (65.5 - 71, n=5)
68 fps -44%
AMD Radeon RX 5700 XT
AMD Radeon RX 5700 XT (Desktop), R7 2700X
52.1 (47min - 57max) fps -57%
Media AMD Radeon RX 5700 XT (Desktop)
  (44 - 55.9, n=5)
52.1 fps -57%
AMD Radeon RX 5700
AMD Radeon RX 5700 (Desktop), R7 2700X
46.8 (42min - 51max) fps -62%
3840x2160 Ultra Graphics & Postprocessing (HBAO+)
Media NVIDIA GeForce RTX 3090
  (85.4 - 98.5, n=8)
93.4 fps +22%
Nvidia GeForce RTX 3090 Founders Edition
NVIDIA GeForce RTX 3090, R9 5900X
91.8 fps +20%
Media NVIDIA GeForce RTX 3080
  (78 - 85.7, n=2)
81.9 fps +7%
ASUS GeForce RTX 3080 ROG STRIX OC GAMING
NVIDIA GeForce RTX 3080, R9 5900X
78 (72min - 83max) fps +2%
AMD Radeon RX 6900 XT
AMD Radeon RX 6900 XT, R9 5950X
76.6 (70min, 70P1 - 84max) fps
Media NVIDIA Titan RTX
 
71.8 fps -6%
Media NVIDIA GeForce RTX 2080 Ti (Desktop)
  (65 - 67, n=3)
65.7 fps -14%
KFA2 GeForce RTX 2080 Ti EX
NVIDIA GeForce RTX 2080 Ti (Desktop), R9 3900X
65 (59min - 71max) fps -15%
Media NVIDIA GeForce RTX 3070
  (59 - 60.3, n=2)
59.7 fps -22%
Nvidia GeForce RTX 2080 Super
NVIDIA GeForce RTX 2080 Super (Desktop), R7 2700X
55.2 (49min - 61max) fps -28%
Media NVIDIA GeForce RTX 2080 Super (Desktop)
  (55.2 - 55.2, n=2)
55.2 fps -28%
Media NVIDIA GeForce RTX 2070 Super (Desktop)
  (46.3 - 49.3, n=4)
47.4 fps -38%
Nvidia GeForce RTX 2070 Super
NVIDIA GeForce RTX 2070 Super (Desktop), R7 2700X
46.3 (41min - 50max) fps -40%
AMD Radeon RX 5700 XT
AMD Radeon RX 5700 XT (Desktop), R7 2700X
39.7 (35min - 43max) fps -48%
Media AMD Radeon RX 5700 XT (Desktop)
  (38.9 - 40.4, n=3)
39.7 fps -48%
AMD Radeon RX 5700
AMD Radeon RX 5700 (Desktop), R7 2700X
35.6 (32min - 40max) fps -54%
1920x1080 Ultra Graphics & Postprocessing (HBAO+)
Media NVIDIA GeForce RTX 3090
  (160 - 192.6, n=16)
179.9 fps +10%
Nvidia GeForce RTX 3090 Founders Edition
NVIDIA GeForce RTX 3090, R9 5900X
171.5 fps +5%
AMD Radeon RX 6900 XT
AMD Radeon RX 6900 XT, R9 5950X
163.6 (139min - 179max) fps
AMD Radeon RX 6800 XT
AMD Radeon RX 6800 XT, R9 5950X
160 (138min - 179max) fps -2%
ASUS GeForce RTX 3080 ROG STRIX OC GAMING
NVIDIA GeForce RTX 3080, R9 5900X
152 (138min - 171max) fps -7%
Media NVIDIA GeForce RTX 3080
  (145 - 152, n=2)
148.5 fps -9%
AMD Ryzen 9 5900X
NVIDIA Titan RTX, R9 5900X
141 (127min - 154max) fps -14%
Media NVIDIA Titan RTX
  (124 - 150, n=28)
137.7 fps -16%
KFA2 GeForce RTX 2080 Ti EX
NVIDIA GeForce RTX 2080 Ti (Desktop), R9 3900X
135 (118min - 158max) fps -17%
Media NVIDIA GeForce RTX 2080 Ti (Desktop)
  (131 - 136, n=3)
134 fps -18%
MSI GeForce RTX 3070 Gaming X Trio
NVIDIA GeForce RTX 3070, R9 5900X
122 (110min - 138max) fps -25%
Nvidia GeForce RTX 2080 Super
NVIDIA GeForce RTX 2080 Super (Desktop), R7 2700X
109 (81min - 123max) fps -33%
Media NVIDIA GeForce RTX 2080 Super (Desktop)
 
109 fps -33%
Media NVIDIA GeForce RTX 3070
  (52.8 - 132.2, n=7)
106.1 fps -35%
Media NVIDIA GeForce RTX 2070 Super (Desktop)
  (95.6 - 109.6, n=6)
100.9 fps -38%
Nvidia GeForce RTX 2070 Super
NVIDIA GeForce RTX 2070 Super (Desktop), R7 2700X
97 (83min - 109max) fps -41%
AMD Radeon RX 5700 XT
AMD Radeon RX 5700 XT (Desktop), R7 2700X
92 (79min - 99max) fps -44%
Media AMD Radeon RX 5700 XT (Desktop)
  (71.6 - 102.4, n=6)
92 fps -44%
AMD Radeon RX 5700
AMD Radeon RX 5700 (Desktop), R7 2700X
80 (70min - 87max) fps -51%
Assassin´s Creed Odyssey
3840x2160 Ultra High Preset
AMD Radeon RX 6900 XT
AMD Radeon RX 6900 XT, R9 5950X
68 (14min - 149max) fps
Media NVIDIA GeForce RTX 3090
 
65 fps -4%
Media NVIDIA Titan RTX
 
52 fps -24%
Media NVIDIA GeForce RTX 2080 Ti (Desktop)
  (46 - 53, n=2)
49.5 fps -27%
Media NVIDIA GeForce RTX 3070
 
48 fps -29%
KFA2 GeForce RTX 2080 Ti EX
NVIDIA GeForce RTX 2080 Ti (Desktop), R9 3900X
46 fps -32%
Nvidia GeForce RTX 2080 Super
NVIDIA GeForce RTX 2080 Super (Desktop), R7 2700X
41 fps -40%
Media NVIDIA GeForce RTX 2080 Super (Desktop)
 
41 fps -40%
Nvidia GeForce RTX 2070 Super
NVIDIA GeForce RTX 2070 Super (Desktop), R7 2700X
39 fps -43%
Media NVIDIA GeForce RTX 2070 Super (Desktop)
  (38 - 39, n=2)
38.5 fps -43%
AMD Radeon RX 5700 XT
AMD Radeon RX 5700 XT (Desktop), R7 2700X
35 fps -49%
Media AMD Radeon RX 5700 XT (Desktop)
 
35 fps -49%
AMD Radeon RX 5700
AMD Radeon RX 5700 (Desktop), R7 2700X
31 fps -54%
2560x1440 Ultra High Preset
AMD Radeon RX 6900 XT
AMD Radeon RX 6900 XT, R9 5950X
99 (37min - 156max) fps
Media NVIDIA GeForce RTX 3090
 
82 fps -17%
Media NVIDIA GeForce RTX 2080 Ti (Desktop)
  (71 - 72, n=2)
71.5 fps -28%
KFA2 GeForce RTX 2080 Ti EX
NVIDIA GeForce RTX 2080 Ti (Desktop), R9 3900X
71 fps -28%
Media NVIDIA GeForce RTX 3070
 
68 fps -31%
Nvidia GeForce RTX 2080 Super
NVIDIA GeForce RTX 2080 Super (Desktop), R7 2700X
58 fps -41%
Media NVIDIA GeForce RTX 2080 Super (Desktop)
 
58 fps -41%
Media NVIDIA GeForce RTX 2070 Super (Desktop)
  (56 - 57, n=2)
56.5 fps -43%
Nvidia GeForce RTX 2070 Super
NVIDIA GeForce RTX 2070 Super (Desktop), R7 2700X
56 fps -43%
AMD Radeon RX 5700 XT
AMD Radeon RX 5700 XT (Desktop), R7 2700X
53 fps -46%
Media AMD Radeon RX 5700 XT (Desktop)
 
53 fps -46%
AMD Radeon RX 5700
AMD Radeon RX 5700 (Desktop), R7 2700X
51 fps -48%
1920x1080 Ultra High Preset
AMD Radeon RX 6900 XT
AMD Radeon RX 6900 XT, R9 5950X
98 (37min - 162max) fps
Media NVIDIA GeForce RTX 3090
 
92 fps -6%
Media NVIDIA GeForce RTX 2080 Ti (Desktop)
  (80 - 83, n=2)
81.5 fps -17%
Media NVIDIA GeForce RTX 3070
 
81 fps -17%
KFA2 GeForce RTX 2080 Ti EX
NVIDIA GeForce RTX 2080 Ti (Desktop), R9 3900X
80 fps -18%
Media NVIDIA Titan RTX
 
79 fps -19%
Nvidia GeForce RTX 2080 Super
NVIDIA GeForce RTX 2080 Super (Desktop), R7 2700X
68 fps -31%
Media NVIDIA GeForce RTX 2080 Super (Desktop)
 
68 fps -31%
Media NVIDIA GeForce RTX 2070 Super (Desktop)
  (64 - 66, n=2)
65 fps -34%
Nvidia GeForce RTX 2070 Super
NVIDIA GeForce RTX 2070 Super (Desktop), R7 2700X
64 fps -35%
AMD Radeon RX 5700 XT
AMD Radeon RX 5700 XT (Desktop), R7 2700X
62 fps -37%
Media AMD Radeon RX 5700 XT (Desktop)
 
62 fps -37%
AMD Radeon RX 5700
AMD Radeon RX 5700 (Desktop), R7 2700X
60 fps -39%
Battlefield V
1920x1080 Ultra Preset DXR
ASUS GeForce RTX 3080 ROG STRIX OC GAMING
NVIDIA GeForce RTX 3080, R9 5900X
128 (95min - 161max) fps +27%
Media NVIDIA GeForce RTX 3080
  (122.1 - 128, n=2)
125.1 fps +24%
Nvidia GeForce RTX 3090 Founders Edition
NVIDIA GeForce RTX 3090, R9 5900X
124.8 fps +24%
Media NVIDIA GeForce RTX 3090
  (106 - 128, n=3)
119.6 fps +18%
AMD Radeon RX 6900 XT
AMD Radeon RX 6900 XT, R9 5950X
101 (18.7min, 50.6P0.1, 65.1P1 - 290max) fps
Media NVIDIA GeForce RTX 3070
  (87.7 - 104.5, n=2)
96.1 fps -5%
Media NVIDIA GeForce RTX 2080 Ti (Desktop)
  (94 - 96, n=2)
95 fps -6%
AMD Radeon RX 6800 XT
AMD Radeon RX 6800 XT, R9 5950X
94.5 fps -6%
KFA2 GeForce RTX 2080 Ti EX
NVIDIA GeForce RTX 2080 Ti (Desktop), R9 3900X
94 (74min - 129max) fps -7%
MSI GeForce RTX 3070 Gaming X Trio
NVIDIA GeForce RTX 3070, R9 5900X
87.7 fps -13%
Nvidia GeForce RTX 2070 Super
NVIDIA GeForce RTX 2070 Super (Desktop), R7 2700X
80 (57min - 103max) fps -21%
Nvidia GeForce RTX 2080 Super
NVIDIA GeForce RTX 2080 Super (Desktop), R7 2700X
80 (47min - 111max) fps -21%
Media NVIDIA GeForce RTX 2080 Super (Desktop)
 
80 fps -21%
Media NVIDIA GeForce RTX 2070 Super (Desktop)
  (70.8 - 80, n=3)
75.6 fps -25%
3840x2160 Ultra Preset
AMD Radeon RX 6900 XT
AMD Radeon RX 6900 XT, R9 5950X
134 (28.5min, 44.9P0.1, 89P1 - 463max) fps
Media NVIDIA GeForce RTX 3090
  (94 - 130, n=4)
112.5 fps -16%
AMD Radeon RX 6800 XT
AMD Radeon RX 6800 XT, R9 5950X
102.5 fps -24%
Media NVIDIA Titan RTX
 
97.3 fps -27%
Nvidia GeForce RTX 3090 Founders Edition
NVIDIA GeForce RTX 3090, R9 5900X
95.8 fps -29%
ASUS GeForce RTX 3080 ROG STRIX OC GAMING
NVIDIA GeForce RTX 3080, R9 5900X
94.2 (78min - 135max) fps -30%
Media NVIDIA GeForce RTX 3080
  (87.2 - 94.2, n=2)
90.7 fps -32%
Media NVIDIA GeForce RTX 2080 Ti (Desktop)
  (73 - 99, n=2)
86 fps -36%
KFA2 GeForce RTX 2080 Ti EX
NVIDIA GeForce RTX 2080 Ti (Desktop), R9 3900X
73 (61min - 110max) fps -46%
Media NVIDIA GeForce RTX 3070
  (69 - 70.9, n=2)
70 fps -48%
MSI GeForce RTX 3070 Gaming X Trio
NVIDIA GeForce RTX 3070, R9 5900X
69 fps -49%
Media NVIDIA GeForce RTX 2080 Super (Desktop)
  (55.7 - 80, n=2)
67.9 fps -49%
AMD Radeon RX 5700 XT
AMD Radeon RX 5700 XT (Desktop), R7 2700X
59.5 (49min - 92max) fps -56%
Media AMD Radeon RX 5700 XT (Desktop)
 
59.5 fps -56%
Nvidia GeForce RTX 2080 Super
NVIDIA GeForce RTX 2080 Super (Desktop), R7 2700X
55.7 (33min - 81max) fps -58%
AMD Radeon RX 5700
AMD Radeon RX 5700 (Desktop), R7 2700X
53.5 (44min - 83max) fps -60%
Media NVIDIA GeForce RTX 2070 Super (Desktop)
  (50.9 - 54.4, n=3)
52.7 fps -61%
Nvidia GeForce RTX 2070 Super
NVIDIA GeForce RTX 2070 Super (Desktop), R7 2700X
50.9 (41min - 73max) fps -62%
2560x1440 Ultra Preset
AMD Radeon RX 6900 XT
AMD Radeon RX 6900 XT, R9 5950X
196 (24.2min, 63.2P0.1, 120P1 - 512max) fps
AMD Radeon RX 6800 XT
AMD Radeon RX 6800 XT, R9 5950X
153.7 fps -22%
Media NVIDIA GeForce RTX 3090
  (124 - 178, n=3)
143.8 fps -27%
Media NVIDIA GeForce RTX 2080 Ti (Desktop)
  (108 - 159, n=2)
133.5 fps -32%
ASUS GeForce RTX 3080 ROG STRIX OC GAMING
NVIDIA GeForce RTX 3080, R9 5900X
132 (109min - 179max) fps -33%
Nvidia GeForce RTX 3090 Founders Edition
NVIDIA GeForce RTX 3090, R9 5900X
129.5 fps -34%
Media NVIDIA GeForce RTX 3080
  (116.1 - 132, n=2)
124.1 fps -37%
KFA2 GeForce RTX 2080 Ti EX
NVIDIA GeForce RTX 2080 Ti (Desktop), R9 3900X
108 (87min - 153max) fps -45%
Media NVIDIA GeForce RTX 2080 Super (Desktop)
  (85 - 131, n=2)
108 fps -45%
Media NVIDIA GeForce RTX 3070
  (98.8 - 106.8, n=2)
102.8 fps -48%
MSI GeForce RTX 3070 Gaming X Trio
NVIDIA GeForce RTX 3070, R9 5900X
98.8 fps -50%
AMD Radeon RX 5700 XT
AMD Radeon RX 5700 XT (Desktop), R7 2700X
89 (70min - 130max) fps -55%
Media AMD Radeon RX 5700 XT (Desktop)
 
89 fps -55%
Nvidia GeForce RTX 2080 Super
NVIDIA GeForce RTX 2080 Super (Desktop), R7 2700X
85 (43min - 122max) fps -57%
Media NVIDIA GeForce RTX 2070 Super (Desktop)
  (78 - 94, n=3)
85 fps -57%
AMD Radeon RX 5700
AMD Radeon RX 5700 (Desktop), R7 2700X
81 (64min - 122max) fps -59%
Nvidia GeForce RTX 2070 Super
NVIDIA GeForce RTX 2070 Super (Desktop), R7 2700X
78 (65min - 110max) fps -60%
1920x1080 Ultra Preset
AMD Radeon RX 6900 XT
AMD Radeon RX 6900 XT, R9 5950X
197 (46.7min, 68.3P0.1, 114P1 - 501max) fps
AMD Radeon RX 6800 XT
AMD Radeon RX 6800 XT, R9 5950X
175.4 fps -11%
Media NVIDIA Titan RTX
 
160.4 fps -19%
Media NVIDIA GeForce RTX 2080 Ti (Desktop)
  (127 - 190, n=2)
158.5 fps -20%
Media NVIDIA GeForce RTX 3090
  (141 - 187, n=3)
157.9 fps -20%
ASUS GeForce RTX 3080 ROG STRIX OC GAMING
NVIDIA GeForce RTX 3080, R9 5900X
152 (126min - 199max) fps -23%
Nvidia GeForce RTX 3090 Founders Edition
NVIDIA GeForce RTX 3090, R9 5900X
145.8 fps -26%
Media NVIDIA GeForce RTX 3080
  (137.9 - 152, n=2)
145 fps -26%
Media NVIDIA GeForce RTX 2080 Super (Desktop)
  (101 - 160, n=2)
130.5 fps -34%
KFA2 GeForce RTX 2080 Ti EX
NVIDIA GeForce RTX 2080 Ti (Desktop), R9 3900X
127 (102min - 175max) fps -36%
Media NVIDIA GeForce RTX 3070
  (113.6 - 125.2, n=2)
119.4 fps -39%
MSI GeForce RTX 3070 Gaming X Trio
NVIDIA GeForce RTX 3070, R9 5900X
113.6 fps -42%
AMD Radeon RX 5700 XT
AMD Radeon RX 5700 XT (Desktop), R7 2700X
105 (81min - 150max) fps -47%
Media AMD Radeon RX 5700 XT (Desktop)
 
105 fps -47%
Media NVIDIA GeForce RTX 2070 Super (Desktop)
  (93.2 - 123, n=3)
103.7 fps -47%
Nvidia GeForce RTX 2080 Super
NVIDIA GeForce RTX 2080 Super (Desktop), R7 2700X
101 (63min - 139max) fps -49%
AMD Radeon RX 5700
AMD Radeon RX 5700 (Desktop), R7 2700X
97 (76min - 140max) fps -51%
Nvidia GeForce RTX 2070 Super
NVIDIA GeForce RTX 2070 Super (Desktop), R7 2700X
95 (77min - 133max) fps -52%
The Division 2
3840x2160 Ultra Preset
Media NVIDIA GeForce RTX 3090
  (71.9 - 77.5, n=3)
73.8 fps +11%
Nvidia GeForce RTX 3090 Founders Edition
NVIDIA GeForce RTX 3090, R9 5900X
72 fps +8%
AMD Radeon RX 6900 XT
AMD Radeon RX 6900 XT, R9 5950X
66.6 (40.2min, 54.6P1) fps
ASUS GeForce RTX 3080 ROG STRIX OC GAMING
NVIDIA GeForce RTX 3080, R9 5900X
65 fps -2%
Media NVIDIA GeForce RTX 3080
 
65 fps -2%
AMD Radeon RX 6800 XT
AMD Radeon RX 6800 XT, R9 5950X
63.2 (34.5min, 54.1P1) fps -5%
Media NVIDIA Titan RTX
 
62 fps -7%
Media NVIDIA GeForce RTX 2080 Ti (Desktop)
  (53 - 57, n=3)
55.3 fps -17%
KFA2 GeForce RTX 2080 Ti EX
NVIDIA GeForce RTX 2080 Ti (Desktop), R9 3900X
53 fps -20%
MSI GeForce RTX 3070 Gaming X Trio
NVIDIA GeForce RTX 3070, R9 5900X
49 fps -26%
Media NVIDIA GeForce RTX 3070
 
49 fps -26%
Nvidia GeForce RTX 2080 Super
NVIDIA GeForce RTX 2080 Super (Desktop), R7 2700X
45 fps -32%
Media NVIDIA GeForce RTX 2080 Super (Desktop)
  (43 - 45, n=2)
44 fps -34%
Nvidia GeForce RTX 2070 Super
NVIDIA GeForce RTX 2070 Super (Desktop), R7 2700X
39 fps -41%
Media NVIDIA GeForce RTX 2070 Super (Desktop)
  (37 - 39, n=2)
38 fps -43%
AMD Radeon RX 5700 XT
AMD Radeon RX 5700 XT (Desktop), R7 2700X
34.1 (16.9min, 21.4P1) fps -49%
Media AMD Radeon RX 5700 XT (Desktop)
  (26 - 34.1, n=2)
30.1 fps -55%
AMD Radeon RX 5700
AMD Radeon RX 5700 (Desktop), R7 2700X
30 (2.5min, 24.3P1) fps -55%
2560x1440 Ultra Preset
Media NVIDIA GeForce RTX 3090
  (120 - 128, n=3)
123 fps +4%
Nvidia GeForce RTX 3090 Founders Edition
NVIDIA GeForce RTX 3090, R9 5900X
121 fps +3%
AMD Radeon RX 6900 XT
AMD Radeon RX 6900 XT, R9 5950X
118 (51.3min, 70.9P1) fps
AMD Radeon RX 6800 XT
AMD Radeon RX 6800 XT, R9 5950X
114 (52.4min, 73P1) fps -3%
ASUS GeForce RTX 3080 ROG STRIX OC GAMING
NVIDIA GeForce RTX 3080, R9 5900X
107 fps -9%
Media NVIDIA GeForce RTX 3080
 
107 fps -9%
Media NVIDIA Titan RTX
 
102 fps -14%
Media NVIDIA GeForce RTX 2080 Ti (Desktop)
  (92 - 100, n=3)
96.3 fps -18%
KFA2 GeForce RTX 2080 Ti EX
NVIDIA GeForce RTX 2080 Ti (Desktop), R9 3900X
92 fps -22%
MSI GeForce RTX 3070 Gaming X Trio
NVIDIA GeForce RTX 3070, R9 5900X
82 fps -31%
Media NVIDIA GeForce RTX 3070
 
82 fps -31%
Nvidia GeForce RTX 2080 Super
NVIDIA GeForce RTX 2080 Super (Desktop), R7 2700X
79 fps -33%
Media NVIDIA GeForce RTX 2080 Super (Desktop)
 
79 fps -33%
Nvidia GeForce RTX 2070 Super
NVIDIA GeForce RTX 2070 Super (Desktop), R7 2700X
69 fps -42%
Media NVIDIA GeForce RTX 2070 Super (Desktop)
  (67 - 69, n=2)
68 fps -42%
AMD Radeon RX 5700 XT
AMD Radeon RX 5700 XT (Desktop), R7 2700X
64 (33.2min, 45.2P1) fps -46%
AMD Radeon RX 5700
AMD Radeon RX 5700 (Desktop), R7 2700X
56.9 (22.8min, 39.8P1) fps -52%
Media AMD Radeon RX 5700 XT (Desktop)
  (49 - 64, n=2)
56.5 fps -52%
1920x1080 Ultra Preset
Nvidia GeForce RTX 3090 Founders Edition
NVIDIA GeForce RTX 3090, R9 5900X
152 fps +10%
Media NVIDIA GeForce RTX 3090
  (140 - 160, n=3)
150.7 fps +9%
ASUS GeForce RTX 3080 ROG STRIX OC GAMING
NVIDIA GeForce RTX 3080, R9 5900X
140 fps +1%
Media NVIDIA GeForce RTX 3080
 
140 fps +1%
AMD Radeon RX 6800 XT
AMD Radeon RX 6800 XT, R9 5950X
138 (45.5min, 74.1P1) fps 0%
AMD Radeon RX 6900 XT
AMD Radeon RX 6900 XT, R9 5950X
138 (54.9min, 75.2P1) fps
Media NVIDIA GeForce RTX 2080 Ti (Desktop)
  (123 - 133, n=3)
127 fps -8%
KFA2 GeForce RTX 2080 Ti EX
NVIDIA GeForce RTX 2080 Ti (Desktop), R9 3900X
123 fps -11%
Media NVIDIA Titan RTX
 
113 fps -18%
MSI GeForce RTX 3070 Gaming X Trio
NVIDIA GeForce RTX 3070, R9 5900X
112 fps -19%
Media NVIDIA GeForce RTX 3070
 
112 fps -19%
Nvidia GeForce RTX 2080 Super
NVIDIA GeForce RTX 2080 Super (Desktop), R7 2700X
106 fps -23%
Media NVIDIA GeForce RTX 2080 Super (Desktop)
 
106 fps -23%
Media NVIDIA GeForce RTX 2070 Super (Desktop)
  (90 - 96, n=2)
93 fps -33%
Nvidia GeForce RTX 2070 Super
NVIDIA GeForce RTX 2070 Super (Desktop), R7 2700X
90 fps -35%
AMD Radeon RX 5700 XT
AMD Radeon RX 5700 XT (Desktop), R7 2700X
88 (30.2min, 50P1) fps -36%
Media AMD Radeon RX 5700 XT (Desktop)
  (69 - 88, n=2)
78.5 fps -43%
AMD Radeon RX 5700
AMD Radeon RX 5700 (Desktop), R7 2700X
78 (14.6min, 42.2P1) fps -43%
Red Dead Redemption 2
3840x2160 Maximum Settings
Media NVIDIA GeForce RTX 3090
  (61.9 - 67, n=3)
64.1 fps +17%
Nvidia GeForce RTX 3090 Founders Edition
NVIDIA GeForce RTX 3090, R9 5900X
63.5 (29min - 85max) fps +16%
Media NVIDIA GeForce RTX 3080
  (56 - 56.4, n=2)
56.2 fps +3%
ASUS GeForce RTX 3080 ROG STRIX OC GAMING
NVIDIA GeForce RTX 3080, R9 5900X
56 fps +3%
AMD Radeon RX 6900 XT
AMD Radeon RX 6900 XT, R9 5950X
54.6 (36.2min, 47.6P1 - 67max) fps
AMD Radeon RX 6800 XT
AMD Radeon RX 6800 XT, R9 5950X
52.9 (41min, 45.5P1 - 65.3max) fps -3%
MSI GeForce RTX 3070 Gaming X Trio
NVIDIA GeForce RTX 3070, R9 5900X
44 (32min - 55max) fps -19%
Media NVIDIA GeForce RTX 3070
  (42.1 - 44, n=3)
42.9 fps -21%
Media NVIDIA GeForce RTX 2080 Ti (Desktop)
 
42.3 fps -23%
Media NVIDIA Titan RTX
 
41 fps -25%
Media NVIDIA GeForce RTX 2080 Super (Desktop)
 
33 fps -40%
Media NVIDIA GeForce RTX 2070 Super (Desktop)
  (28 - 28.7, n=2)
28.4 fps -48%
Media AMD Radeon RX 5700 XT (Desktop)
 
27 fps -51%
2560x1440 Maximum Settings
Media NVIDIA GeForce RTX 3090
  (91.9 - 96, n=3)
93.4 fps +14%
Nvidia GeForce RTX 3090 Founders Edition
NVIDIA GeForce RTX 3090, R9 5900X
92.3 (33min - 132max) fps +12%
Media NVIDIA GeForce RTX 3080
  (81 - 86.4, n=2)
83.7 fps +2%
AMD Radeon RX 6800 XT
AMD Radeon RX 6800 XT, R9 5950X
82.7 (59min, 66.7P1 - 103max) fps +1%
AMD Radeon RX 6900 XT
AMD Radeon RX 6900 XT, R9 5950X
82.1 (34min, 66.7P1 - 104max) fps
ASUS GeForce RTX 3080 ROG STRIX OC GAMING
NVIDIA GeForce RTX 3080, R9 5900X
81 fps -1%
MSI GeForce RTX 3070 Gaming X Trio
NVIDIA GeForce RTX 3070, R9 5900X
65 (33min - 100max) fps -21%
Media NVIDIA GeForce RTX 3070
  (63.2 - 65, n=3)
63.9 fps -22%
Media NVIDIA GeForce RTX 2080 Ti (Desktop)
 
63 fps -23%
Media NVIDIA Titan RTX
 
63 fps -23%
Media NVIDIA GeForce RTX 2080 Super (Desktop)
 
50.6 fps -38%
Media NVIDIA GeForce RTX 2070 Super (Desktop)
  (43.3 - 44, n=2)
43.7 fps -47%
Media AMD Radeon RX 5700 XT (Desktop)
 
41.8 fps -49%
1920x1080 Maximum Settings
Media NVIDIA GeForce RTX 3090
  (109.9 - 115, n=3)
111.6 fps +14%
Nvidia GeForce RTX 3090 Founders Edition
NVIDIA GeForce RTX 3090, R9 5900X
109.9 (37min - 148max) fps +12%
AMD Radeon RX 6800 XT
AMD Radeon RX 6800 XT, R9 5950X
102 (68.7min, 76.9P1 - 129max) fps +4%
Media NVIDIA GeForce RTX 3080
  (96 - 103, n=2)
99.5 fps +2%
AMD Radeon RX 6900 XT
AMD Radeon RX 6900 XT, R9 5950X
98 (34.2min, 76.9P1 - 125max) fps
ASUS GeForce RTX 3080 ROG STRIX OC GAMING
NVIDIA GeForce RTX 3080, R9 5900X
96 fps -2%
MSI GeForce RTX 3070 Gaming X Trio
NVIDIA GeForce RTX 3070, R9 5900X
78 (38min - 126max) fps -20%
Media NVIDIA GeForce RTX 3070
  (76.2 - 78, n=3)
77.4 fps -21%
Media NVIDIA GeForce RTX 2080 Ti (Desktop)
 
76 fps -22%
Media NVIDIA Titan RTX
 
76 fps -22%
Media NVIDIA GeForce RTX 2080 Super (Desktop)
 
61 fps -38%
Media NVIDIA GeForce RTX 2070 Super (Desktop)
  (53 - 54.6, n=2)
53.8 fps -45%
Media AMD Radeon RX 5700 XT (Desktop)
 
51.5 fps -47%
Mafia Definitive Edition
3840x2160 High Preset
Media NVIDIA GeForce RTX 3090
  (84.5 - 89.1, n=2)
86.8 fps +30%
Nvidia GeForce RTX 3090 Founders Edition
NVIDIA GeForce RTX 3090, R9 5900X
84.5 fps +26%
ASUS GeForce RTX 3080 ROG STRIX OC GAMING
NVIDIA GeForce RTX 3080, R9 5900X
78.2 (17.9min, 31P0.1, 59.3P1 - 292max) fps +17%
Media NVIDIA GeForce RTX 3080
  (78.1 - 78.2, n=2)
78.2 fps +17%
AMD Radeon RX 6900 XT
AMD Radeon RX 6900 XT, R9 5950X
67 (32.3min, 41.7P0.1, 44.7P1 - 211max) fps
Media NVIDIA Titan RTX
 
63.4 fps -5%
AMD Radeon RX 6800 XT
AMD Radeon RX 6800 XT, R9 5950X
62.6 (28min, 37.6P0.1, 49.2P1 - 87.3max) fps -7%
Media NVIDIA GeForce RTX 2080 Ti (Desktop)
 
62.4 fps -7%
MSI GeForce RTX 3070 Gaming X Trio
NVIDIA GeForce RTX 3070, R9 5900X
56.6 (34.7min, 37.9P0.1, 44.2P1 - 177max) fps -16%
Media NVIDIA GeForce RTX 3070
  (55.2 - 56.6, n=2)
55.9 fps -17%
Media NVIDIA GeForce RTX 2080 Super (Desktop)
 
48.5 fps -28%
Media NVIDIA GeForce RTX 2070 Super (Desktop)
 
41.8 fps -38%
Media AMD Radeon RX 5700 XT (Desktop)
 
36.4 fps -46%
2560x1440 High Preset
Media NVIDIA GeForce RTX 3090
  (142.3 - 149, n=2)
145.7 fps +21%
Nvidia GeForce RTX 3090 Founders Edition
NVIDIA GeForce RTX 3090, R9 5900X
142.3 fps +19%
ASUS GeForce RTX 3080 ROG STRIX OC GAMING
NVIDIA GeForce RTX 3080, R9 5900X
137 (26.5min, 66.2P0.1, 95.7P1 - 265max) fps +14%
Media NVIDIA GeForce RTX 3080
  (127 - 137, n=2)
132 fps +10%
AMD Radeon RX 6900 XT
AMD Radeon RX 6900 XT, R9 5950X
120 (17.6min, 61.2P0.1, 83.1P1 - 238max) fps
AMD Radeon RX 6800 XT
AMD Radeon RX 6800 XT, R9 5950X
112 (23.5min, 64P0.1, 80.8P1 - 169max) fps -7%
Media NVIDIA Titan RTX
 
109 fps -9%
Media NVIDIA GeForce RTX 2080 Ti (Desktop)
 
105 fps -12%
MSI GeForce RTX 3070 Gaming X Trio
NVIDIA GeForce RTX 3070, R9 5900X
98.7 (45.2min, 55.9P0.1, 69.4P1 - 191max) fps -18%
Media NVIDIA GeForce RTX 3070
  (98.1 - 98.7, n=2)
98.4 fps -18%
Media NVIDIA GeForce RTX 2080 Super (Desktop)
 
88.8 fps -26%
Media NVIDIA GeForce RTX 2070 Super (Desktop)
 
78.1 fps -35%
Media AMD Radeon RX 5700 XT (Desktop)
 
67.7 fps -44%
1920x1080 High Preset
ASUS GeForce RTX 3080 ROG STRIX OC GAMING
NVIDIA GeForce RTX 3080, R9 5900X
169 (32.7min, 75.7P0.1, 112P1 - 361max) fps +22%
Nvidia GeForce RTX 3090 Founders Edition
NVIDIA GeForce RTX 3090, R9 5900X
158.8 fps +15%
Media NVIDIA GeForce RTX 3090
  (157 - 158.8, n=2)
157.9 fps +14%
Media NVIDIA GeForce RTX 3080
  (144 - 169, n=2)
156.5 fps +13%
AMD Radeon RX 6900 XT
AMD Radeon RX 6900 XT, R9 5950X
138 (32.8min, 68.1P0.1, 90.2P1 - 334max) fps
Media NVIDIA GeForce RTX 3070
  (124 - 132, n=2)
128 fps -7%
MSI GeForce RTX 3070 Gaming X Trio
NVIDIA GeForce RTX 3070, R9 5900X
124 (57.4min, 62.8P0.1, 82P1 - 251max) fps -10%
Media NVIDIA Titan RTX
 
123.7 fps -10%
AMD Radeon RX 6800 XT
AMD Radeon RX 6800 XT, R9 5950X
121 (23.7min, 68P0.1, 83.3P1 - 223max) fps -12%
Media NVIDIA GeForce RTX 2080 Super (Desktop)
 
118.1 fps -14%
Media NVIDIA GeForce RTX 2080 Ti (Desktop)
 
117 fps -15%
Media NVIDIA GeForce RTX 2070 Super (Desktop)
 
111.6 fps -19%
Media AMD Radeon RX 5700 XT (Desktop)
 
92.3 fps -33%
Cyberpunk 2077 1.0
3840x2160 Ultra Preset
Media NVIDIA GeForce RTX 3090
  (41.5 - 45.3, n=2)
43.4 fps +25%
Nvidia GeForce RTX 3090 Founders Edition
NVIDIA GeForce RTX 3090, R9 5900X
41.5 fps +19%
Media NVIDIA GeForce RTX 3080
 
38.9 fps +12%
AMD Radeon RX 6900 XT
AMD Radeon RX 6900 XT, R9 5950X
34.8 (19.4min, 22.8P0.1, 29.7P1 - 177max) fps
Media NVIDIA GeForce RTX 2080 Ti (Desktop)
 
32.2 fps -7%
AMD Ryzen 9 5900X
NVIDIA Titan RTX, R9 5900X
30.9 fps -11%
Media NVIDIA Titan RTX
 
30.9 fps -11%
Media NVIDIA GeForce RTX 3070
  (26.6 - 27.9, n=2)
27.3 fps -22%
Media NVIDIA GeForce RTX 2080 Super (Desktop)
 
24.1 fps -31%
Media NVIDIA GeForce RTX 2070 Super (Desktop)
 
21.5 fps -38%
Media AMD Radeon RX 5700 XT (Desktop)
 
16.5 fps -53%
2560x1440 Ultra Preset
Media NVIDIA GeForce RTX 3090
  (78.1 - 85.3, n=2)
81.7 fps +13%
Nvidia GeForce RTX 3090 Founders Edition
NVIDIA GeForce RTX 3090, R9 5900X
78.1 fps +8%
Media NVIDIA GeForce RTX 3080
 
72.5 fps 0%
AMD Radeon RX 6900 XT
AMD Radeon RX 6900 XT, R9 5950X
72.3 (21min, 36.7P0.1, 58.6P1 - 231max) fps
Media NVIDIA GeForce RTX 2080 Ti (Desktop)
 
64 fps -11%
AMD Ryzen 9 5900X
NVIDIA Titan RTX, R9 5900X
58.4 fps -19%
Media NVIDIA Titan RTX
 
58.4 fps -19%
Media NVIDIA GeForce RTX 3070
  (53.7 - 54.8, n=2)
54.3 fps -25%
Media NVIDIA GeForce RTX 2080 Super (Desktop)
 
49.1 fps -32%
Media NVIDIA GeForce RTX 2070 Super (Desktop)
 
43.7 fps -40%
Media AMD Radeon RX 5700 XT (Desktop)
 
36.9 fps -49%
1920x1080 Ultra Preset
Nvidia GeForce RTX 3090 Founders Edition
NVIDIA GeForce RTX 3090, R9 5900X
109.7 fps +3%
Media NVIDIA GeForce RTX 3090
  (108 - 109.7, n=2)
108.9 fps +3%
AMD Radeon RX 6900 XT
AMD Radeon RX 6900 XT, R9 5950X
106 (23.2min, 48.3P0.1, 76.1P1 - 189max) fps
Media NVIDIA GeForce RTX 3080
 
103 fps -3%
Media NVIDIA GeForce RTX 2080 Ti (Desktop)
 
95.4 fps -10%
AMD Ryzen 9 5900X
NVIDIA Titan RTX, R9 5900X
82.3 fps -22%
Media NVIDIA Titan RTX
 
82.3 fps -22%
Media NVIDIA GeForce RTX 3070
  (80.6 - 81, n=2)
80.8 fps -24%
Media NVIDIA GeForce RTX 2080 Super (Desktop)
 
72.1 fps -32%
Media NVIDIA GeForce RTX 2070 Super (Desktop)
 
65.4 fps -38%
Media AMD Radeon RX 5700 XT (Desktop)
 
58.9 fps -44%
Call of Duty Black Ops Cold War
1920x1080 Highest Settings + Ultra Ray Tracing
AMD Ryzen 9 5900X
NVIDIA Titan RTX, R9 5900X
119 fps +71%
Media NVIDIA Titan RTX
 
119 fps +71%
Nvidia GeForce RTX 3090 Founders Edition
NVIDIA GeForce RTX 3090, R9 5900X
89 fps +28%
Media NVIDIA GeForce RTX 3090
  (88.3 - 89, n=2)
88.7 fps +28%
Media NVIDIA GeForce RTX 3080
 
81.9 fps +18%
Media NVIDIA GeForce RTX 2080 Ti (Desktop)
 
77.2 fps +11%
AMD Radeon RX 6900 XT
AMD Radeon RX 6900 XT, R9 5950X
69.5 (40.4min, 48.2P0.1, 54.5P1 - 302max) fps
MSI GeForce RTX 3070 Gaming X Trio
NVIDIA GeForce RTX 3070, R9 5900X
68.5 (19.1min, 22.3P0.1, 30.4P1 - 229max) fps -1%
Media NVIDIA GeForce RTX 3070
  (49.8 - 70.1, n=3)
62.8 fps -10%
Media NVIDIA GeForce RTX 2080 Super (Desktop)
 
59 fps -15%
Media NVIDIA GeForce RTX 2070 Super (Desktop)
 
55.6 fps -20%
AMD Radeon RX 6800 XT
AMD Radeon RX 6800 XT, R9 5950X
21.8 (8.8min, 9.61P0.1, 16.2P1 - 49.5max) fps -69%
3840x2160 Highest Settings
Media NVIDIA GeForce RTX 3090
  (74.6 - 76.1, n=2)
75.4 fps +11%
Nvidia GeForce RTX 3090 Founders Edition
NVIDIA GeForce RTX 3090, R9 5900X
74.6 fps +10%
MSI GeForce RTX 3070 Gaming X Trio
NVIDIA GeForce RTX 3070, R9 5900X
74 (32.6min, 43.5P0.1, 50.6P1 - 270max) fps +9%
AMD Radeon RX 6900 XT
AMD Radeon RX 6900 XT, R9 5950X
68.1 (42.2min, 50.7P0.1, 56.8P1 - 172max) fps
Media NVIDIA GeForce RTX 3080
 
65.6 fps -4%
AMD Radeon RX 6800 XT
AMD Radeon RX 6800 XT, R9 5950X
64 (10.8min, 11.6P0.1, 50.8P1 - 159max) fps -6%
Media NVIDIA GeForce RTX 3070
  (43.8 - 74, n=3)
56 fps -18%
Media NVIDIA GeForce RTX 2080 Ti (Desktop)
 
54.4 fps -20%
AMD Ryzen 9 5900X
NVIDIA Titan RTX, R9 5900X
52.9 fps -22%
Media NVIDIA Titan RTX
 
52.9 fps -22%
Media NVIDIA GeForce RTX 2080 Super (Desktop)
  (38 - 44.5, n=2)
41.3 fps -39%
Media NVIDIA GeForce RTX 2070 Super (Desktop)
 
37.6 fps -45%
Media AMD Radeon RX 5700 XT (Desktop)
 
33.3 fps -51%
2560x1440 Highest Settings
Nvidia GeForce RTX 3090 Founders Edition
NVIDIA GeForce RTX 3090, R9 5900X
124.7 fps +8%
Media NVIDIA GeForce RTX 3090
  (122 - 124.7, n=2)
123.4 fps +7%
AMD Radeon RX 6900 XT
AMD Radeon RX 6900 XT, R9 5950X
115 (54.9min, 82.8P0.1, 92.3P1 - 314max) fps
MSI GeForce RTX 3070 Gaming X Trio
NVIDIA GeForce RTX 3070, R9 5900X
107 (43.6min, 54P0.1, 62.7P1 - 272max) fps -7%
Media NVIDIA GeForce RTX 3080
 
104 fps -10%
Media NVIDIA GeForce RTX 3070
  (83 - 107, n=3)
93.2 fps -19%
Media NVIDIA GeForce RTX 2080 Ti (Desktop)
 
89.2 fps -22%
AMD Ryzen 9 5900X
NVIDIA Titan RTX, R9 5900X
87.6 fps -24%
Media NVIDIA Titan RTX
 
87.6 fps -24%
AMD Radeon RX 6800 XT
AMD Radeon RX 6800 XT, R9 5950X
80.4 (16.5min, 31.8P0.1, 64.3P1 - 285max) fps -30%
Media NVIDIA GeForce RTX 2070 Super (Desktop)
 
67.7 fps -41%
Media NVIDIA GeForce RTX 2080 Super (Desktop)
  (51 - 77.6, n=2)
64.3 fps -44%
Media AMD Radeon RX 5700 XT (Desktop)
 
59.6 fps -48%
1920x1080 Highest Settings
Nvidia GeForce RTX 3090 Founders Edition
NVIDIA GeForce RTX 3090, R9 5900X
161.1 fps +5%
Media NVIDIA GeForce RTX 3090
  (161 - 161.1, n=2)
161.1 fps +5%
AMD Radeon RX 6900 XT
AMD Radeon RX 6900 XT, R9 5950X
153 (60.9min, 98.1P0.1, 117P1 - 437max) fps
AMD Ryzen 9 5900X
NVIDIA Titan RTX, R9 5900X
144 fps -6%
AMD Radeon RX 6800 XT
AMD Radeon RX 6800 XT, R9 5950X
144 (58.7min, 90.7P0.1, 105P1 - 365max) fps -6%
Media NVIDIA Titan RTX
 
144 fps -6%
Media NVIDIA GeForce RTX 3080
 
127 fps -17%
MSI GeForce RTX 3070 Gaming X Trio
NVIDIA GeForce RTX 3070, R9 5900X
122 (45min, 57.3P0.1, 67.9P1 - 301max) fps -20%
Media NVIDIA GeForce RTX 2080 Ti (Desktop)
 
118 fps -23%
Media NVIDIA GeForce RTX 3070
  (95.7 - 122, n=3)
112.6 fps -26%
Media NVIDIA GeForce RTX 2070 Super (Desktop)
 
92.7 fps -39%
Media NVIDIA GeForce RTX 2080 Super (Desktop)
  (59 - 106, n=2)
82.5 fps -46%
Media AMD Radeon RX 5700 XT (Desktop)
 
81.3 fps -47%
Metro Exodus
1920x1080 Ultra Quality DXR AF:16x
Media NVIDIA GeForce RTX 3090
  (68.6 - 122.2, n=12)
111.4 fps +23%
Media NVIDIA GeForce RTX 3080
  (91.5 - 102, n=2)
96.8 fps +7%
ASUS GeForce RTX 3080 ROG STRIX OC GAMING
NVIDIA GeForce RTX 3080, R9 5900X
91.5 (51.03min - 134.52max) fps +1%
AMD Radeon RX 6900 XT
AMD Radeon RX 6900 XT, R9 5950X
90.5 (55.53min - 126.79max) fps
AMD Ryzen 9 5900X
NVIDIA Titan RTX, R9 5900X
87.9 (49.32min - 136.76max) fps -3%
Media NVIDIA Titan RTX
  (69 - 95.5, n=23)
86.1 fps -5%
AMD Radeon RX 6800 XT
AMD Radeon RX 6800 XT, R9 5950X
85.5 (52.71min - 120.38max) fps -6%
Media NVIDIA GeForce RTX 2080 Ti (Desktop)
  (78.6 - 84.9, n=3)
81.8 fps -10%
Media NVIDIA GeForce RTX 3070
  (80.4 - 83, n=5)
81.6 fps -10%
MSI GeForce RTX 3070 Gaming X Trio
NVIDIA GeForce RTX 3070, R9 5900X
80.4 (43.5min - 124.3max) fps -11%
KFA2 GeForce RTX 2080 Ti EX
NVIDIA GeForce RTX 2080 Ti (Desktop), R9 3900X
78.6 (43min - 115max) fps -13%
Nvidia GeForce RTX 3090 Founders Edition
NVIDIA GeForce RTX 3090, R9 5900X
68.6 (37.68min - 117.88max) fps -24%
Nvidia GeForce RTX 2080 Super
NVIDIA GeForce RTX 2080 Super (Desktop), R7 2700X
65 (37.62min - 97.62max) fps -28%
Media NVIDIA GeForce RTX 2080 Super (Desktop)
 
65 fps -28%
Media NVIDIA GeForce RTX 2070 Super (Desktop)
  (56.3 - 62.1, n=4)
58.5 fps -35%
Nvidia GeForce RTX 2070 Super
NVIDIA GeForce RTX 2070 Super (Desktop), R7 2700X
57.5 (34min - 85max) fps -36%
3840x2160 Ultra Quality AF:16x
Media NVIDIA GeForce RTX 3090
  (70.6 - 77.3, n=12)
75 fps +12%
Nvidia GeForce RTX 3090 Founders Edition
NVIDIA GeForce RTX 3090, R9 5900X
70.6 (41.43min - 118.98max) fps +6%
AMD Radeon RX 6900 XT
AMD Radeon RX 6900 XT, R9 5950X
66.7 (42.71min - 92.25max) fps
Media NVIDIA GeForce RTX 3080
  (64.1 - 65.9, n=2)
65 fps -3%
ASUS GeForce RTX 3080 ROG STRIX OC GAMING
NVIDIA GeForce RTX 3080, R9 5900X
64.1 (36.54min - 108.57max) fps -4%
AMD Radeon RX 6800 XT
AMD Radeon RX 6800 XT, R9 5950X
56.3 (40.14min - 64.28max) fps -16%
AMD Ryzen 9 5900X
NVIDIA Titan RTX, R9 5900X
54.9 (34.88min - 89.73max) fps -18%
Media NVIDIA Titan RTX
  (51.3 - 57.9, n=27)
54.9 fps -18%
Media NVIDIA GeForce RTX 2080 Ti (Desktop)
  (47.5 - 51, n=3)
49.7 fps -25%
MSI GeForce RTX 3070 Gaming X Trio
NVIDIA GeForce RTX 3070, R9 5900X
49.1 (30.24min - 89.89max) fps -26%
Media NVIDIA GeForce RTX 3070
  (48.3 - 49.7, n=5)
48.9 fps -27%
KFA2 GeForce RTX 2080 Ti EX
NVIDIA GeForce RTX 2080 Ti (Desktop), R9 3900X
47.5 (31min - 69max) fps -29%
Media NVIDIA GeForce RTX 2080 Super (Desktop)
  (40 - 40.4, n=2)
40.2 fps -40%
Nvidia GeForce RTX 2080 Super
NVIDIA GeForce RTX 2080 Super (Desktop), R7 2700X
40 (25.84min - 59.35max) fps -40%
Media NVIDIA GeForce RTX 2070 Super (Desktop)
  (35 - 38.1, n=5)
36.8 fps -45%
Nvidia GeForce RTX 2070 Super
NVIDIA GeForce RTX 2070 Super (Desktop), R7 2700X
35 (23min - 51max) fps -48%
Media AMD Radeon RX 5700 XT (Desktop)
  (29.6 - 35.7, n=3)
33.6 fps -50%
AMD Radeon RX 5700 XT
AMD Radeon RX 5700 XT (Desktop), R7 2700X
29.6 (20.7min - 36.64max) fps -56%
AMD Radeon RX 5700
AMD Radeon RX 5700 (Desktop), R7 2700X
28.6 (19.67min - 36.24max) fps -57%
2560x1440 Ultra Quality AF:16x
Media NVIDIA GeForce RTX 3090
  (102 - 118.2, n=12)
113.2 fps +11%
Nvidia GeForce RTX 3090 Founders Edition
NVIDIA GeForce RTX 3090, R9 5900X
106 (54.88min - 173.25max) fps +4%
AMD Radeon RX 6900 XT
AMD Radeon RX 6900 XT, R9 5950X
102 (59.52min - 156.84max) fps
Media NVIDIA GeForce RTX 3080
  (92.2 - 97.4, n=2)
94.8 fps -7%
AMD Radeon RX 6800 XT
AMD Radeon RX 6800 XT, R9 5950X
94.6 (55.44min - 143.68max) fps -7%
ASUS GeForce RTX 3080 ROG STRIX OC GAMING
NVIDIA GeForce RTX 3080, R9 5900X
92.2 (46.62min - 155.93max) fps -10%
AMD Ryzen 9 5900X
NVIDIA Titan RTX, R9 5900X
84.9 (46.03min - 152.65max) fps -17%
Media NVIDIA Titan RTX
  (69 - 92.9, n=26)
84 fps -18%
Media NVIDIA GeForce RTX 3070
  (74.4 - 78.3, n=5)
75.8 fps -26%
Media NVIDIA GeForce RTX 2080 Ti (Desktop)
  (71.9 - 77.9, n=3)
75.3 fps -26%
MSI GeForce RTX 3070 Gaming X Trio
NVIDIA GeForce RTX 3070, R9 5900X
74.4 (38.95min - 129.85max) fps -27%
KFA2 GeForce RTX 2080 Ti EX
NVIDIA GeForce RTX 2080 Ti (Desktop), R9 3900X
71.9 (40min - 108max) fps -30%
Media NVIDIA GeForce RTX 2080 Super (Desktop)
  (61 - 65, n=2)
63 fps -38%
Nvidia GeForce RTX 2080 Super
NVIDIA GeForce RTX 2080 Super (Desktop), R7 2700X
61 (35.51min - 95.82max) fps -40%
Media NVIDIA GeForce RTX 2070 Super (Desktop)
  (54.3 - 61.9, n=5)
57.6 fps -44%
Media AMD Radeon RX 5700 XT (Desktop)
  (54.5 - 57.7, n=3)
56.4 fps -45%
AMD Radeon RX 5700 XT
AMD Radeon RX 5700 XT (Desktop), R7 2700X
54.5 (31.85min - 78.06max) fps -47%
Nvidia GeForce RTX 2070 Super
NVIDIA GeForce RTX 2070 Super (Desktop), R7 2700X
54.3 (32min - 83max) fps -47%
AMD Radeon RX 5700
AMD Radeon RX 5700 (Desktop), R7 2700X
48.4 (28.7min - 68.51max) fps -53%
1920x1080 Ultra Quality AF:16x
Media NVIDIA GeForce RTX 3090
  (108 - 145, n=12)
135.3 fps +10%
Nvidia GeForce RTX 3090 Founders Edition
NVIDIA GeForce RTX 3090, R9 5900X
124 (65.58min - 188.71max) fps +1%
AMD Radeon RX 6900 XT
AMD Radeon RX 6900 XT, R9 5950X
123 (67.67min - 199.52max) fps
AMD Radeon RX 6800 XT
AMD Radeon RX 6800 XT, R9 5950X
115 (64.52min - 181.92max) fps -7%
Media NVIDIA GeForce RTX 3080
  (111 - 116, n=2)
113.5 fps -8%
ASUS GeForce RTX 3080 ROG STRIX OC GAMING
NVIDIA GeForce RTX 3080, R9 5900X
111 (57.16min - 183.25max) fps -10%
AMD Ryzen 9 5900X
NVIDIA Titan RTX, R9 5900X
106 (52.66min - 176.55max) fps -14%
Media NVIDIA Titan RTX
  (73 - 116, n=27)
102.2 fps -17%
Media NVIDIA GeForce RTX 3070
  (91.3 - 97.7, n=5)
93.9 fps -24%
Media NVIDIA GeForce RTX 2080 Ti (Desktop)
  (89.7 - 98.6, n=3)
93.8 fps -24%
MSI GeForce RTX 3070 Gaming X Trio
NVIDIA GeForce RTX 3070, R9 5900X
91.3 (46.36min - 152.74max) fps -26%
KFA2 GeForce RTX 2080 Ti EX
NVIDIA GeForce RTX 2080 Ti (Desktop), R9 3900X
89.7 (46min - 140max) fps -27%
Media NVIDIA GeForce RTX 2080 Super (Desktop)
  (76 - 82, n=2)
79 fps -36%
Nvidia GeForce RTX 2080 Super
NVIDIA GeForce RTX 2080 Super (Desktop), R7 2700X
76 (38.54min - 122.4max) fps -38%
Media NVIDIA GeForce RTX 2070 Super (Desktop)
  (67.8 - 79.1, n=5)
72.3 fps -41%
Media AMD Radeon RX 5700 XT (Desktop)
  (61 - 73.8, n=3)
69.3 fps -44%
Nvidia GeForce RTX 2070 Super
NVIDIA GeForce RTX 2070 Super (Desktop), R7 2700X
67.8 (36min - 110max) fps -45%
AMD Radeon RX 5700 XT
AMD Radeon RX 5700 XT (Desktop), R7 2700X
61 (36.09min - 86.1max) fps -50%
AMD Radeon RX 5700
AMD Radeon RX 5700 (Desktop), R7 2700X
58.6 (32.67min - 85.8max) fps -52%

Memoria ad accesso intelligente AMD

Impostazioni BAR ridimensionabili sulla scheda madre MSI Prestige X570 Creation.

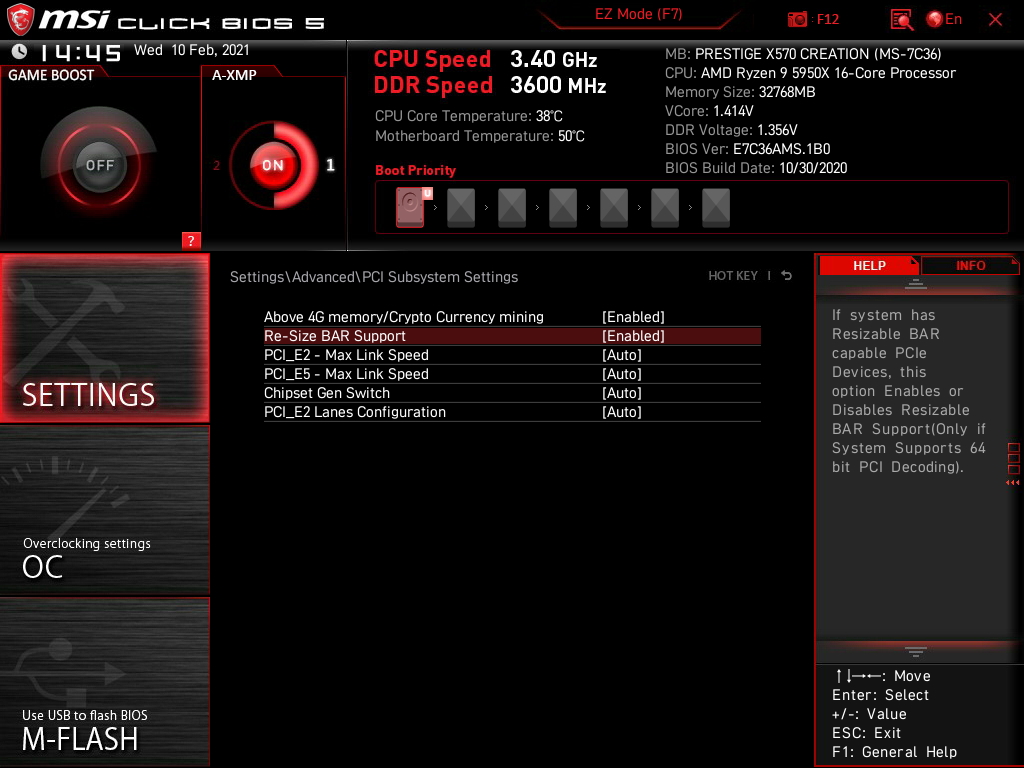
Smart access memory (SAM) è il termine di fantasia di AMD per resizable base address register (BAR), una specifica PCIe che permette alla CPU di accedere all'intera GPU VRAM in ogni momento (originariamente limitata a 256 MB di memoria GPU per la compatibilità con i sistemi operativi a 32 bit). Anche se tutte le GPU RDNA 2 supportano SAM out-of-the-box, devono essere accoppiate con una CPU Ryzen serie 5000 e una scheda madre con un chipset B550 o X570 (anche le CPU Ryzen 3000 su queste schede madri ora sono upportate). Potreste anche dover cercare gli aggiornamenti del BIOS (AGESA 1.1.0.0 o più recente) dal vostro fornitore di schede madri che abilitano questa funzione.

Per abilitare la SAM, è necessario navigare nel BIOS e abilitare sia "Above 4G Memory/Crypto Currency Mining" che "Re-Size BAR Support" sotto PCIe Subsystem Settings. Sfortunatamente, non c'è modo di controllare lo stato di SAM tramite il driver.

Mentre AMD sembrava piuttosto entusiasta di SAM durante il suo keynote di lancio Big Navi, i guadagni di prestazioni nel mondo reale, se ci sono, si vedono solo in qualche gioco al momento. Nei nostri test, abbiamo trovato SAM per offrire aumenti marginali di fps in Borderlands 3 e Shadow of the Tomb Raider alle impostazioni QHD Ultra e 4K Ultra.

Tuttavia, l'abilitazione di SAM ha mostrato +18% a 1080p Ultra, +13% a 1440p Ultra, e +8% di guadagno a 4K Ultra in Assassin's Creed Valhalla. SAM non sembra essere di alcun beneficio a 1080p Ultra in Forza Horizon 4, ma vediamo +11% e +13% di benefici a 1440p Ultra e 4K Ultra, rispettivamente. F1 2020 ha mostrato solo piccoli guadagni a 1080p Ultra. Giochi come Control, Hitman 3e Watch Dogs Legion non hanno mostrato alcun miglioramento o regressione delle prestazioni con SAM attivato.

Con tutte le nuove GPU e schede madri che ora supportano la BAR ridimensionabile, ci aspettiamo che più giochi approfittino di questa caratteristica a breve.

Borderlands 3
3840x2160 Badass Overall Quality (DX11)
Media NVIDIA GeForce RTX 3090
  (68 - 75.3, n=12)
72.8 fps +22%
Nvidia GeForce RTX 3090 Founders Edition
NVIDIA GeForce RTX 3090, R9 5900X
68 fps +14%
Media NVIDIA GeForce RTX 3080
  (61.5 - 61.9, n=2)
61.7 fps +3%
ASUS GeForce RTX 3080 ROG STRIX OC GAMING
NVIDIA GeForce RTX 3080, R9 5900X
61.5 fps +3%
AMD Radeon RX 6900 XT
AMD Radeon RX 6900 XT, R9 5950X (SAM ENABLED)
59.8 fps
AMD Radeon RX 6900 XT
AMD Radeon RX 6900 XT, R9 5950X
57.1 fps -5%
AMD Radeon RX 6800 XT
AMD Radeon RX 6800 XT, R9 5950X
53.6 fps -10%
Media NVIDIA Titan RTX
  (46 - 52.8, n=29)
47.3 fps -21%
AMD Ryzen 9 5900X
NVIDIA Titan RTX, R9 5900X
46.7 fps -22%
Media NVIDIA GeForce RTX 2080 Ti (Desktop)
  (43.6 - 47, n=2)
45.3 fps -24%
Media NVIDIA GeForce RTX 3070
  (42.7 - 46.3, n=5)
44.3 fps -26%
MSI GeForce RTX 3070 Gaming X Trio
NVIDIA GeForce RTX 3070, R9 5900X
44.2 fps -26%
KFA2 GeForce RTX 2080 Ti EX
NVIDIA GeForce RTX 2080 Ti (Desktop), R9 3900X
43.6 fps -27%
Media NVIDIA GeForce RTX 2080 Super (Desktop)
 
35.9 fps -40%
Media NVIDIA GeForce RTX 2070 Super (Desktop)
  (29.5 - 32.7, n=5)
31.3 fps -48%
Media AMD Radeon RX 5700 XT (Desktop)
  (28.1 - 30.5, n=3)
29.6 fps -51%
2560x1440 Badass Overall Quality (DX11)
Media NVIDIA GeForce RTX 3090
  (105 - 131.6, n=12)
123.2 fps +15%
AMD Radeon RX 6900 XT
AMD Radeon RX 6900 XT, R9 5950X (SAM ENABLED)
107 fps
AMD Radeon RX 6900 XT
AMD Radeon RX 6900 XT, R9 5950X
105 fps -2%
Nvidia GeForce RTX 3090 Founders Edition
NVIDIA GeForce RTX 3090, R9 5900X
105 fps -2%
ASUS GeForce RTX 3080 ROG STRIX OC GAMING
NVIDIA GeForce RTX 3080, R9 5900X
103 fps -4%
Media NVIDIA GeForce RTX 3080
  (95.7 - 103, n=2)
99.4 fps -7%
AMD Radeon RX 6800 XT
AMD Radeon RX 6800 XT, R9 5950X
93.6 fps -13%
AMD Ryzen 9 5900X
NVIDIA Titan RTX, R9 5900X
84.7 fps -21%
Media NVIDIA Titan RTX
  (74 - 93.1, n=29)
84.7 fps -21%
Media NVIDIA GeForce RTX 2080 Ti (Desktop)
  (78 - 83, n=2)
80.5 fps -25%
KFA2 GeForce RTX 2080 Ti EX
NVIDIA GeForce RTX 2080 Ti (Desktop), R9 3900X
78 fps -27%
Media NVIDIA GeForce RTX 3070
  (75.1 - 82.9, n=5)
77.7 fps -27%
MSI GeForce RTX 3070 Gaming X Trio
NVIDIA GeForce RTX 3070, R9 5900X
75.9 fps -29%
Media NVIDIA GeForce RTX 2080 Super (Desktop)
 
65.5 fps -39%
Media NVIDIA GeForce RTX 2070 Super (Desktop)
  (53.7 - 60.3, n=5)
57.3 fps -46%
Media AMD Radeon RX 5700 XT (Desktop)
  (51.1 - 56.1, n=3)
54.3 fps -49%
1920x1080 Badass Overall Quality (DX11)
Media NVIDIA GeForce RTX 3090
  (117 - 165, n=12)
149.1 fps +14%
AMD Radeon RX 6900 XT
AMD Radeon RX 6900 XT, R9 5950X (SAM ENABLED)
131 fps
AMD Radeon RX 6900 XT
AMD Radeon RX 6900 XT, R9 5950X
130 fps -1%
ASUS GeForce RTX 3080 ROG STRIX OC GAMING
NVIDIA GeForce RTX 3080, R9 5900X
128 fps -2%
Media NVIDIA GeForce RTX 3080
  (117 - 128, n=2)
122.5 fps -6%
AMD Radeon RX 6800 XT
AMD Radeon RX 6800 XT, R9 5950X
120 fps -8%
Nvidia GeForce RTX 3090 Founders Edition
NVIDIA GeForce RTX 3090, R9 5900X
119 fps -9%
AMD Ryzen 9 5900X
NVIDIA Titan RTX, R9 5900X
118 fps -10%
Media NVIDIA Titan RTX
  (77.2 - 128.7, n=29)
112 fps -15%
Media NVIDIA GeForce RTX 2080 Ti (Desktop)
  (101.3 - 109, n=2)
105.2 fps -20%
KFA2 GeForce RTX 2080 Ti EX
NVIDIA GeForce RTX 2080 Ti (Desktop), R9 3900X
101.3 fps -23%
Media NVIDIA GeForce RTX 3070
  (95.3 - 108.9, n=5)
100.6 fps -23%
MSI GeForce RTX 3070 Gaming X Trio
NVIDIA GeForce RTX 3070, R9 5900X
95.8 fps -27%
Media NVIDIA GeForce RTX 2080 Super (Desktop)
 
91 fps -31%
Media NVIDIA GeForce RTX 2070 Super (Desktop)
  (74.3 - 86, n=5)
80.9 fps -38%
Media AMD Radeon RX 5700 XT (Desktop)
  (71.7 - 79.1, n=3)
76.6 fps -42%
Control
1920x1080 High Quality Preset & High Ray Tracing Preset (DX12)
Media NVIDIA GeForce RTX 3090
  (91.4 - 120.4, n=4)
108.2 fps +42%
Nvidia GeForce RTX 3090 Founders Edition
NVIDIA GeForce RTX 3090, R9 5900X
106.9 fps +40%
ASUS GeForce RTX 3080 ROG STRIX OC GAMING
NVIDIA GeForce RTX 3080, R9 5900X
103 (94min - 116max) fps +35%
Media NVIDIA GeForce RTX 3080
  (98.1 - 103, n=2)
100.6 fps +32%
Media NVIDIA Titan RTX
  (63 - 120, n=3)
88.1 fps +16%
AMD Radeon RX 6900 XT
AMD Radeon RX 6900 XT, R9 5950X (SAM ENABLED)
76.2 (38.7min, 43.3P0.1, 62.8P1 - 142max) fps
AMD Radeon RX 6900 XT
AMD Radeon RX 6900 XT, R9 5950X
73.1 (31.6min, 40.9P0.1, 62.6P1 - 149max) fps -4%
Media NVIDIA GeForce RTX 2080 Ti (Desktop)
  (72 - 76, n=2)
74 fps -3%
KFA2 GeForce RTX 2080 Ti EX
NVIDIA GeForce RTX 2080 Ti (Desktop), R9 3900X
72 (67min - 80max) fps -6%
Media NVIDIA GeForce RTX 3070
  (57.9 - 75.1, n=3)
68.5 fps -10%
AMD Radeon RX 6800 XT
AMD Radeon RX 6800 XT, R9 5950X
66.9 (60min - 75max) fps -12%
MSI GeForce RTX 3070 Gaming X Trio
NVIDIA GeForce RTX 3070, R9 5900X
57.9 (29min - 79max) fps -24%
Media NVIDIA GeForce RTX 2080 Super (Desktop)
 
53.2 fps -30%
Media NVIDIA GeForce RTX 2070 Super (Desktop)
  (51.1 - 54.2, n=4)
52.7 fps -31%
3840x2160 High Quality Preset (DX11)
Media NVIDIA GeForce RTX 3090
  (61.3 - 66, n=4)
63 fps +15%
Nvidia GeForce RTX 3090 Founders Edition
NVIDIA GeForce RTX 3090, R9 5900X
61.3 fps +12%
Media NVIDIA GeForce RTX 3080
  (56.2 - 56.7, n=2)
56.5 fps +3%
ASUS GeForce RTX 3080 ROG STRIX OC GAMING
NVIDIA GeForce RTX 3080, R9 5900X
56.2 (49min - 64max) fps +3%
AMD Radeon RX 6900 XT
AMD Radeon RX 6900 XT, R9 5950X
54.7 (39.8min, 41.7P0.1, 44.9P1 - 65.8max) fps
AMD Radeon RX 6900 XT
AMD Radeon RX 6900 XT, R9 5950X (SAM ENABLED)
53.9 (36.6min, 41.7P0.1, 43.5P1 - 64.9max) fps -1%
AMD Radeon RX 6800 XT
AMD Radeon RX 6800 XT, R9 5950X
51.6 (46min - 58max) fps -6%
Media NVIDIA Titan RTX
  (45.2 - 47.3, n=3)
46.5 fps -15%
Media NVIDIA GeForce RTX 2080 Ti (Desktop)
  (42.6 - 45.8, n=2)
44.2 fps -19%
KFA2 GeForce RTX 2080 Ti EX
NVIDIA GeForce RTX 2080 Ti (Desktop), R9 3900X
42.6 (37min - 49max) fps -22%
MSI GeForce RTX 3070 Gaming X Trio
NVIDIA GeForce RTX 3070, R9 5900X
42.3 (37min - 49max) fps -23%
Media NVIDIA GeForce RTX 3070
  (40.6 - 42.3, n=3)
41.3 fps -24%
Media AMD Radeon RX 5700 XT (Desktop)
  (26.3 - 55.2, n=2)
40.8 fps -25%
Media NVIDIA GeForce RTX 2080 Super (Desktop)
 
30.4 fps -44%
Media NVIDIA GeForce RTX 2070 Super (Desktop)
  (29.2 - 30.7, n=4)
30.1 fps -45%
2560x1440 High Quality Preset (DX11)
Media NVIDIA GeForce RTX 3090
  (115.8 - 123.7, n=4)
120.1 fps +6%
Nvidia GeForce RTX 3090 Founders Edition
NVIDIA GeForce RTX 3090, R9 5900X
115.8 fps +2%
AMD Radeon RX 6900 XT
AMD Radeon RX 6900 XT, R9 5950X
113 (71.5min, 73.2P0.1, 79.6P1 - 164max) fps
AMD Radeon RX 6900 XT
AMD Radeon RX 6900 XT, R9 5950X (SAM ENABLED)
113 (68min, 71.3P0.1, 81.1P1 - 193max) fps 0%
AMD Radeon RX 6800 XT
AMD Radeon RX 6800 XT, R9 5950X
108 (93min - 123max) fps -4%
ASUS GeForce RTX 3080 ROG STRIX OC GAMING
NVIDIA GeForce RTX 3080, R9 5900X
106 (92min - 123max) fps -6%
Media NVIDIA GeForce RTX 3080
  (105 - 106, n=2)
105.5 fps -7%
Media NVIDIA Titan RTX
  (89 - 93.6, n=3)
91.5 fps -19%
Media NVIDIA GeForce RTX 2080 Ti (Desktop)
  (84 - 89, n=2)
86.5 fps -23%
KFA2 GeForce RTX 2080 Ti EX
NVIDIA GeForce RTX 2080 Ti (Desktop), R9 3900X
84 (75min - 95max) fps -26%
MSI GeForce RTX 3070 Gaming X Trio
NVIDIA GeForce RTX 3070, R9 5900X
82.5 (72min - 96max) fps -27%
Media NVIDIA GeForce RTX 3070
  (79.8 - 82.5, n=3)
81.2 fps -28%
Media AMD Radeon RX 5700 XT (Desktop)
  (53.4 - 91, n=2)
72.2 fps -36%
Media NVIDIA GeForce RTX 2080 Super (Desktop)
 
62 fps -45%
Media NVIDIA GeForce RTX 2070 Super (Desktop)
  (56.9 - 62.6, n=4)
60.6 fps -46%
1920x1080 High Quality Preset (DX11)
Media NVIDIA GeForce RTX 3090
  (172.2 - 189.2, n=4)
178.1 fps +2%
AMD Radeon RX 6900 XT
AMD Radeon RX 6900 XT, R9 5950X
175 (56.8min, 96P0.1, 112P1 - 314max) fps
AMD Radeon RX 6900 XT
AMD Radeon RX 6900 XT, R9 5950X (SAM ENABLED)
174 (54min, 99P0.1, 112P1 - 335max) fps -1%
Nvidia GeForce RTX 3090 Founders Edition
NVIDIA GeForce RTX 3090, R9 5900X
172.2 fps -2%
AMD Radeon RX 6800 XT
AMD Radeon RX 6800 XT, R9 5950X
168 (145min - 194max) fps -4%
ASUS GeForce RTX 3080 ROG STRIX OC GAMING
NVIDIA GeForce RTX 3080, R9 5900X
155 (133min - 178max) fps -11%
Media NVIDIA GeForce RTX 3080
  (151 - 155, n=2)
153 fps -13%
Media NVIDIA Titan RTX
  (135 - 141.9, n=3)
137.3 fps -22%
Media NVIDIA GeForce RTX 2080 Ti (Desktop)
  (126 - 132, n=2)
129 fps -26%
KFA2 GeForce RTX 2080 Ti EX
NVIDIA GeForce RTX 2080 Ti (Desktop), R9 3900X
126 (111min - 143max) fps -28%
MSI GeForce RTX 3070 Gaming X Trio
NVIDIA GeForce RTX 3070, R9 5900X
122 (103min - 138max) fps -30%
Media NVIDIA GeForce RTX 3070
  (117 - 124.9, n=3)
121.3 fps -31%
Media AMD Radeon RX 5700 XT (Desktop)
  (83 - 121.9, n=2)
102.5 fps -41%
Media NVIDIA GeForce RTX 2080 Super (Desktop)
 
95 fps -46%
Media NVIDIA GeForce RTX 2070 Super (Desktop)
  (88 - 97.3, n=4)
93.3 fps -47%
Assassin´s Creed Valhalla
3840x2160 Ultra High Preset
AMD Radeon RX 6900 XT
AMD Radeon RX 6900 XT, R9 5950X (SAM ENABLED)
68 (33min - 230max) fps
AMD Radeon RX 6900 XT
AMD Radeon RX 6900 XT, R9 5950X
63 (32min - 219max) fps -7%
AMD Radeon RX 6800 XT
AMD Radeon RX 6800 XT, R9 5950X
65 (33min - 179max) fps -4%
Nvidia GeForce RTX 3090 Founders Edition
NVIDIA GeForce RTX 3090, R9 5900X
57 (36min - 113max) fps -16%
Media NVIDIA GeForce RTX 3090
  (55 - 57, n=2)
56 fps -18%
Media NVIDIA GeForce RTX 3080
 
52 fps -24%
MSI GeForce RTX 3070 Gaming X Trio
NVIDIA GeForce RTX 3070, R9 5900X
47 (31min - 92max) fps -31%
Media NVIDIA GeForce RTX 2080 Ti (Desktop)
 
46 fps -32%
Media NVIDIA GeForce RTX 3070
  (42 - 47, n=3)
44 fps -35%
AMD Ryzen 9 5900X
NVIDIA Titan RTX, R9 5900X
43 fps -37%
Media NVIDIA Titan RTX
 
43 fps -37%
Media NVIDIA GeForce RTX 2080 Super (Desktop)
 
36 fps -47%
Media AMD Radeon RX 5700 XT (Desktop)
 
33 fps -51%
Media NVIDIA GeForce RTX 2070 Super (Desktop)
 
32 fps -53%
2560x1440 Ultra High Preset
AMD Radeon RX 6900 XT
AMD Radeon RX 6900 XT, R9 5950X (SAM ENABLED)
115 (41min - 242max) fps
AMD Radeon RX 6900 XT
AMD Radeon RX 6900 XT, R9 5950X
102 (40min - 239max) fps -11%
AMD Radeon RX 6800 XT
AMD Radeon RX 6800 XT, R9 5950X
98 (25min - 211max) fps -15%
Nvidia GeForce RTX 3090 Founders Edition
NVIDIA GeForce RTX 3090, R9 5900X
79 (44min - 135max) fps -31%
Media NVIDIA GeForce RTX 3090
  (76 - 79, n=2)
77.5 fps -33%
Media NVIDIA GeForce RTX 3080
 
76 fps -34%
MSI GeForce RTX 3070 Gaming X Trio
NVIDIA GeForce RTX 3070, R9 5900X
67 (39min - 124max) fps -42%
Media NVIDIA GeForce RTX 2080 Ti (Desktop)
 
67 fps -42%
AMD Ryzen 9 5900X
NVIDIA Titan RTX, R9 5900X
66 fps -43%
Media NVIDIA Titan RTX
 
66 fps -43%
Media NVIDIA GeForce RTX 3070
  (65 - 67, n=3)
65.7 fps -43%
Media AMD Radeon RX 5700 XT (Desktop)
 
59 fps -49%
Media NVIDIA GeForce RTX 2080 Super (Desktop)
 
57 fps -50%
Media NVIDIA GeForce RTX 2070 Super (Desktop)
 
53 fps -54%
1920x1080 Ultra High Preset
AMD Radeon RX 6900 XT
AMD Radeon RX 6900 XT, R9 5950X (SAM ENABLED)
148 (44min - 248max) fps
AMD Radeon RX 6900 XT
AMD Radeon RX 6900 XT, R9 5950X
125 (43min - 252max) fps -16%
AMD Radeon RX 6800 XT
AMD Radeon RX 6800 XT, R9 5950X
118 (29min - 255max) fps -20%
Nvidia GeForce RTX 3090 Founders Edition
NVIDIA GeForce RTX 3090, R9 5900X
91 (48min - 158max) fps -39%
Media NVIDIA GeForce RTX 3090
  (88 - 91, n=2)
89.5 fps -40%
Media NVIDIA GeForce RTX 3080
 
88 fps -41%
AMD Ryzen 9 5900X
NVIDIA Titan RTX, R9 5900X
80 fps -46%
Media NVIDIA GeForce RTX 2080 Ti (Desktop)
 
80 fps -46%
Media NVIDIA Titan RTX
 
80 fps -46%
Media NVIDIA GeForce RTX 3070
  (77 - 80, n=3)
78.3 fps -47%
MSI GeForce RTX 3070 Gaming X Trio
NVIDIA GeForce RTX 3070, R9 5900X
78 (15min - 139max) fps -47%
Media AMD Radeon RX 5700 XT (Desktop)
 
78 fps -47%
Media NVIDIA GeForce RTX 2080 Super (Desktop)
 
70 fps -53%
Media NVIDIA GeForce RTX 2070 Super (Desktop)
 
66 fps -55%
Shadow of the Tomb Raider
3840x2160 Highest Preset AA:T
Media NVIDIA GeForce RTX 3090
  (89.3 - 99.7, n=12)
96.4 fps +12%
Nvidia GeForce RTX 3090 Founders Edition
NVIDIA GeForce RTX 3090, R9 5900X
94 fps +9%
AMD Radeon RX 6900 XT
AMD Radeon RX 6900 XT, R9 5950X (SAM ENABLED)
86 fps
AMD Radeon RX 6900 XT
AMD Radeon RX 6900 XT, R9 5950X
84 fps -2%
Media NVIDIA GeForce RTX 3080
  (83.9 - 87.9, n=2)
85.9 fps 0%
ASUS GeForce RTX 3080 ROG STRIX OC GAMING
NVIDIA GeForce RTX 3080, R9 5900X
83.9 fps -2%
AMD Radeon RX 6800 XT
AMD Radeon RX 6800 XT, R9 5950X
79.6 fps -7%
Media NVIDIA Titan RTX
  (59 - 71.1, n=24)
66.9 fps -22%
AMD Ryzen 9 5900X
NVIDIA Titan RTX, R9 5900X
66.3 fps -23%
Media NVIDIA GeForce RTX 3070
  (61 - 63.5, n=4)
62.3 fps -28%
MSI GeForce RTX 3070 Gaming X Trio
NVIDIA GeForce RTX 3070, R9 5900X
61 fps -29%
Media NVIDIA GeForce RTX 2080 Ti (Desktop)
  (60 - 61, n=2)
60.5 fps -30%
KFA2 GeForce RTX 2080 Ti EX
NVIDIA GeForce RTX 2080 Ti (Desktop), R9 3900X
60 fps -30%
Nvidia GeForce RTX 2080 Super
NVIDIA GeForce RTX 2080 Super (Desktop), R7 2700X
49 fps -43%
Media NVIDIA GeForce RTX 2080 Super (Desktop)
  (49 - 49, n=2)
49 fps -43%
Media NVIDIA GeForce RTX 2070 Super (Desktop)
  (43 - 47.9, n=5)
45.5 fps -47%
Nvidia GeForce RTX 2070 Super
NVIDIA GeForce RTX 2070 Super (Desktop), R7 2700X
43 fps -50%
AMD Radeon RX 5700 XT
AMD Radeon RX 5700 XT (Desktop), R7 2700X
38 fps -56%
Media AMD Radeon RX 5700 XT (Desktop)
  (32 - 40.9, n=4)
37.9 fps -56%
AMD Radeon RX 5700
AMD Radeon RX 5700 (Desktop), R7 2700X
34 fps -60%
2560x1440 Highest Preset AA:T
Media NVIDIA GeForce RTX 3090
  (137 - 172.3, n=12)
165.6 fps +2%
AMD Radeon RX 6900 XT
AMD Radeon RX 6900 XT, R9 5950X (SAM ENABLED)
163 fps
AMD Radeon RX 6900 XT
AMD Radeon RX 6900 XT, R9 5950X
155 fps -5%
Nvidia GeForce RTX 3090 Founders Edition
NVIDIA GeForce RTX 3090, R9 5900X
159 fps -2%
Media NVIDIA GeForce RTX 3080
  (147 - 152, n=2)
149.5 fps -8%
AMD Radeon RX 6800 XT
AMD Radeon RX 6800 XT, R9 5950X
148 fps -9%
ASUS GeForce RTX 3080 ROG STRIX OC GAMING
NVIDIA GeForce RTX 3080, R9 5900X
147 fps -10%
AMD Ryzen 9 5900X
NVIDIA Titan RTX, R9 5900X
120 fps -26%
Media NVIDIA Titan RTX
  (98 - 128, n=23)
117.8 fps -28%
Media NVIDIA GeForce RTX 3070
  (108 - 116, n=4)
113.2 fps -31%
Media NVIDIA GeForce RTX 2080 Ti (Desktop)
  (108 - 112, n=2)
110 fps -33%
KFA2 GeForce RTX 2080 Ti EX
NVIDIA GeForce RTX 2080 Ti (Desktop), R9 3900X
108 fps -34%
MSI GeForce RTX 3070 Gaming X Trio
NVIDIA GeForce RTX 3070, R9 5900X
108 fps -34%
Media NVIDIA GeForce RTX 2080 Super (Desktop)
  (91 - 92, n=2)
91.5 fps -44%
Nvidia GeForce RTX 2080 Super
NVIDIA GeForce RTX 2080 Super (Desktop), R7 2700X
91 fps -44%
Media NVIDIA GeForce RTX 2070 Super (Desktop)
  (81 - 89.6, n=5)
85.4 fps -48%
Nvidia GeForce RTX 2070 Super
NVIDIA GeForce RTX 2070 Super (Desktop), R7 2700X
81 fps -50%
AMD Radeon RX 5700 XT
AMD Radeon RX 5700 XT (Desktop), R7 2700X
76 fps -53%
Media AMD Radeon RX 5700 XT (Desktop)
  (61 - 79.2, n=4)
73.8 fps -55%
AMD Radeon RX 5700
AMD Radeon RX 5700 (Desktop), R7 2700X
68 fps -58%
1920x1080 Highest Preset AA:T
Media NVIDIA GeForce RTX 3090
  (145 - 240, n=14)
204 fps +1%
AMD Radeon RX 6900 XT
AMD Radeon RX 6900 XT, R9 5950X
202 fps
AMD Radeon RX 6900 XT
AMD Radeon RX 6900 XT, R9 5950X (SAM ENABLED)
199 fps -1%
AMD Radeon RX 6800 XT
AMD Radeon RX 6800 XT, R9 5950X
194 fps -4%
Nvidia GeForce RTX 3090 Founders Edition
NVIDIA GeForce RTX 3090, R9 5900X
187 fps -7%
ASUS GeForce RTX 3080 ROG STRIX OC GAMING
NVIDIA GeForce RTX 3080, R9 5900X
185 fps -8%
Media NVIDIA GeForce RTX 3080
  (177 - 185, n=2)
181 fps -10%
AMD Ryzen 9 5900X
NVIDIA Titan RTX, R9 5900X
166 fps -18%
Media NVIDIA GeForce RTX 3070
  (138 - 160, n=4)
151.3 fps -25%
Media NVIDIA Titan RTX
  (106 - 178.8, n=24)
149.5 fps -26%
MSI GeForce RTX 3070 Gaming X Trio
NVIDIA GeForce RTX 3070, R9 5900X
138 fps -32%
Media NVIDIA GeForce RTX 2080 Ti (Desktop)
  (130 - 142, n=2)
136 fps -33%
KFA2 GeForce RTX 2080 Ti EX
NVIDIA GeForce RTX 2080 Ti (Desktop), R9 3900X
130 fps -36%
Media NVIDIA GeForce RTX 2070 Super (Desktop)
  (104 - 131.1, n=5)
119.7 fps -41%
Media NVIDIA GeForce RTX 2080 Super (Desktop)
  (110 - 118, n=2)
114 fps -44%
Media AMD Radeon RX 5700 XT (Desktop)
  (89 - 119, n=6)
110.8 fps -45%
Nvidia GeForce RTX 2080 Super
NVIDIA GeForce RTX 2080 Super (Desktop), R7 2700X
110 fps -46%
AMD Radeon RX 5700 XT
AMD Radeon RX 5700 XT (Desktop), R7 2700X
110 fps -46%
Nvidia GeForce RTX 2070 Super
NVIDIA GeForce RTX 2070 Super (Desktop), R7 2700X
104 fps -49%
AMD Radeon RX 5700
AMD Radeon RX 5700 (Desktop), R7 2700X
90 fps -55%
Forza Horizon 4
3840x2160 Ultra Preset AA:2xMS
AMD Radeon RX 6900 XT
AMD Radeon RX 6900 XT, R9 5950X (SAM ENABLED)
172 fps
AMD Radeon RX 6900 XT
AMD Radeon RX 6900 XT, R9 5950X
152 fps -12%
Media NVIDIA GeForce RTX 3090
 
147 fps -15%
Media NVIDIA Titan RTX
  (90 - 121, n=17)
112.9 fps -34%
KFA2 GeForce RTX 2080 Ti EX
NVIDIA GeForce RTX 2080 Ti (Desktop), R9 3900X
107 fps -38%
Media NVIDIA GeForce RTX 2080 Ti (Desktop)
  (98 - 111, n=3)
105.3 fps -39%
Media NVIDIA GeForce RTX 2070 Super (Desktop)
  (76 - 85, n=3)
81.7 fps -52%
Nvidia GeForce RTX 2080 Super
NVIDIA GeForce RTX 2080 Super (Desktop), R7 2700X
81 fps -53%
Media NVIDIA GeForce RTX 2080 Super (Desktop)
 
81 fps -53%
AMD Radeon RX 5700 XT
AMD Radeon RX 5700 XT (Desktop), R7 2700X
79 fps -54%
Media AMD Radeon RX 5700 XT (Desktop)
 
79 fps -54%
Nvidia GeForce RTX 2070 Super
NVIDIA GeForce RTX 2070 Super (Desktop), R7 2700X
76 fps -56%
AMD Radeon RX 5700
AMD Radeon RX 5700 (Desktop), R7 2700X
70 fps -59%
2560x1440 Ultra Preset AA:2xMS
AMD Radeon RX 6900 XT
AMD Radeon RX 6900 XT, R9 5950X (SAM ENABLED)
243 fps
AMD Radeon RX 6900 XT
AMD Radeon RX 6900 XT, R9 5950X
218 fps -10%
Media NVIDIA GeForce RTX 3090
 
164 fps -33%
Media NVIDIA Titan RTX
  (127 - 171, n=16)
154.8 fps -36%
KFA2 GeForce RTX 2080 Ti EX
NVIDIA GeForce RTX 2080 Ti (Desktop), R9 3900X
147 fps -40%
Media NVIDIA GeForce RTX 2080 Ti (Desktop)
  (131 - 150, n=3)
142.7 fps -41%
Media NVIDIA GeForce RTX 2070 Super (Desktop)
  (108 - 125, n=3)
119.3 fps -51%
AMD Radeon RX 5700 XT
AMD Radeon RX 5700 XT (Desktop), R7 2700X
119 fps -51%
Media AMD Radeon RX 5700 XT (Desktop)
 
119 fps -51%
Nvidia GeForce RTX 2080 Super
NVIDIA GeForce RTX 2080 Super (Desktop), R7 2700X
117 fps -52%
Media NVIDIA GeForce RTX 2080 Super (Desktop)
 
117 fps -52%
Nvidia GeForce RTX 2070 Super
NVIDIA GeForce RTX 2070 Super (Desktop), R7 2700X
108 fps -56%
AMD Radeon RX 5700
AMD Radeon RX 5700 (Desktop), R7 2700X
103 fps -58%
1920x1080 Ultra Preset AA:2xMS
AMD Radeon RX 6900 XT
AMD Radeon RX 6900 XT, R9 5950X
248 fps
AMD Radeon RX 6900 XT
AMD Radeon RX 6900 XT, R9 5950X (SAM ENABLED)
247 fps 0%
Media NVIDIA Titan RTX
  (129 - 196, n=17)
169.8 fps -32%
KFA2 GeForce RTX 2080 Ti EX
NVIDIA GeForce RTX 2080 Ti (Desktop), R9 3900X
168 fps -32%
Media NVIDIA GeForce RTX 3090
 
166 fps -33%
Media NVIDIA GeForce RTX 2080 Ti (Desktop)
  (153 - 169, n=3)
163.3 fps -34%
Media AMD Radeon RX 5700 XT (Desktop)
  (138 - 149, n=3)
145 fps -42%
Media NVIDIA GeForce RTX 2070 Super (Desktop)
  (129 - 153, n=3)
145 fps -42%
AMD Radeon RX 5700 XT
AMD Radeon RX 5700 XT (Desktop), R7 2700X
138 fps -44%
Nvidia GeForce RTX 2080 Super
NVIDIA GeForce RTX 2080 Super (Desktop), R7 2700X
133 fps -46%
Media NVIDIA GeForce RTX 2080 Super (Desktop)
 
133 fps -46%
Nvidia GeForce RTX 2070 Super
NVIDIA GeForce RTX 2070 Super (Desktop), R7 2700X
129 fps -48%
AMD Radeon RX 5700
AMD Radeon RX 5700 (Desktop), R7 2700X
118 fps -52%
Hitman 3
3840x2160 Maximum Settings AF:16x
AMD Radeon RX 6900 XT
AMD Radeon RX 6900 XT, R9 5950X
128.4 fps
AMD Radeon RX 6900 XT
AMD Radeon RX 6900 XT, R9 5950X (SAM ENABLED)
127.8 fps 0%
Media NVIDIA GeForce RTX 3090
  (115 - 122, n=2)
118.5 fps -8%
Nvidia GeForce RTX 3090 Founders Edition
NVIDIA GeForce RTX 3090, R9 5900X
115 fps -10%
Media NVIDIA GeForce RTX 3080
 
109 fps -15%
Media NVIDIA GeForce RTX 2080 Ti (Desktop)
 
85.2 fps -34%
AMD Ryzen 9 5900X
NVIDIA Titan RTX, R9 5900X
82 fps -36%
Media NVIDIA Titan RTX
 
82 fps -36%
Media NVIDIA GeForce RTX 3070
 
77.5 fps -40%
Media NVIDIA GeForce RTX 2080 Super (Desktop)
 
64 fps -50%
Media NVIDIA GeForce RTX 2070 Super (Desktop)
 
55 fps -57%
Media AMD Radeon RX 5700 XT (Desktop)
 
53 fps -59%
2560x1440 Maximum Settings AF:16x
AMD Radeon RX 6900 XT
AMD Radeon RX 6900 XT, R9 5950X
213.1 fps
AMD Radeon RX 6900 XT
AMD Radeon RX 6900 XT, R9 5950X (SAM ENABLED)
213.1 fps 0%
Nvidia GeForce RTX 3090 Founders Edition
NVIDIA GeForce RTX 3090, R9 5900X
190 fps -11%
Media NVIDIA GeForce RTX 3090
  (166 - 190, n=2)
178 fps -16%
Media NVIDIA GeForce RTX 3080
 
164 fps -23%
Media NVIDIA GeForce RTX 2080 Ti (Desktop)
 
147 fps -31%
AMD Ryzen 9 5900X
NVIDIA Titan RTX, R9 5900X
145 fps -32%
Media NVIDIA Titan RTX
 
145 fps -32%
Media NVIDIA GeForce RTX 3070
 
140 fps -34%
Media NVIDIA GeForce RTX 2080 Super (Desktop)
 
115 fps -46%
Media NVIDIA GeForce RTX 2070 Super (Desktop)
 
101 fps -53%
Media AMD Radeon RX 5700 XT (Desktop)
 
95 fps -55%
1920x1080 Maximum Settings AF:16x
AMD Radeon RX 6900 XT
AMD Radeon RX 6900 XT, R9 5950X
276.2 fps
AMD Radeon RX 6900 XT
AMD Radeon RX 6900 XT, R9 5950X (SAM ENABLED)
269.4 fps -2%
Nvidia GeForce RTX 3090 Founders Edition
NVIDIA GeForce RTX 3090, R9 5900X
223 fps -19%
AMD Ryzen 9 5900X
NVIDIA Titan RTX, R9 5900X
202 fps -27%
Media NVIDIA Titan RTX
 
202 fps -27%
Media NVIDIA GeForce RTX 3090
  (167 - 223, n=2)
195 fps -29%
Media NVIDIA GeForce RTX 3080
 
166 fps -40%
Media NVIDIA GeForce RTX 2080 Super (Desktop)
 
166 fps -40%
Media NVIDIA GeForce RTX 3070
 
165 fps -40%
Media NVIDIA GeForce RTX 2080 Ti (Desktop)
 
162 fps -41%
Media NVIDIA GeForce RTX 2070 Super (Desktop)
 
148 fps -46%
Media AMD Radeon RX 5700 XT (Desktop)
 
141 fps -49%
Watch Dogs Legion
1920x1080 Ultra Preset + Ultra Ray Tracing (DX12)
Media NVIDIA GeForce RTX 3090
  (75.7 - 78.2, n=2)
77 fps +38%
Nvidia GeForce RTX 3090 Founders Edition
NVIDIA GeForce RTX 3090, R9 5900X
75.7 (33.41min, 58.92P1 - 126.05max) fps +36%
AMD Radeon RX 6800 XT
AMD Radeon RX 6800 XT, R9 5950X
71.4 (47.71min, 55.63P1 - 113.42max) fps +28%
Media NVIDIA GeForce RTX 3080
  (70.9 - 71.3, n=2)
71.1 fps +28%
ASUS GeForce RTX 3080 ROG STRIX OC GAMING
NVIDIA GeForce RTX 3080, R9 5900X
70.9 (37.64min, 58.05P1 - 113.63max) fps +28%
Media NVIDIA GeForce RTX 2080 Ti (Desktop)
 
55.8 fps 0%
AMD Radeon RX 6900 XT
AMD Radeon RX 6900 XT, R9 5950X
55.6 (35.81min, 41.86P1 - 76.28max) fps
AMD Radeon RX 6900 XT
AMD Radeon RX 6900 XT, R9 5950X (SAM ENABLED)
55.5 (36.48min, 43.27P1 - 76.42max) fps 0%
Media NVIDIA Titan RTX
 
55.4 fps 0%
Media NVIDIA GeForce RTX 3070
  (51.7 - 61, n=4)
55.1 fps -1%
MSI GeForce RTX 3070 Gaming X Trio
NVIDIA GeForce RTX 3070, R9 5900X
54.3 (18.74min, 40.53P1 - 81.06max) fps -2%
Media NVIDIA GeForce RTX 2080 Super (Desktop)
 
45.4 fps -18%
Media NVIDIA GeForce RTX 2070 Super (Desktop)
 
39.2 fps -29%
3840x2160 Ultra Preset (DX12)
Media NVIDIA GeForce RTX 3090
  (57.6 - 60.3, n=2)
59 fps +10%
Nvidia GeForce RTX 3090 Founders Edition
NVIDIA GeForce RTX 3090, R9 5900X
57.6 (24.58min, 45.93P1 - 114.36max) fps +7%
ASUS GeForce RTX 3080 ROG STRIX OC GAMING
NVIDIA GeForce RTX 3080, R9 5900X
54.1 (24.72min, 44.97P1 - 114.7max) fps +1%
Media NVIDIA GeForce RTX 3080
  (53.5 - 54.1, n=2)
53.8 fps 0%
AMD Radeon RX 6900 XT
AMD Radeon RX 6900 XT, R9 5950X (SAM ENABLED)
53.6 (34.78min, 44.93P1 - 72.47max) fps
AMD Radeon RX 6900 XT
AMD Radeon RX 6900 XT, R9 5950X
53.5 (33.75min, 44.2P1 - 82.3max) fps 0%
AMD Radeon RX 6800 XT
AMD Radeon RX 6800 XT, R9 5950X
49.3 (32.85min, 41.54P1 - 76.12max) fps -8%
Media NVIDIA GeForce RTX 2080 Ti (Desktop)
 
44 fps -18%
Media NVIDIA Titan RTX
 
43.4 fps -19%
Media NVIDIA GeForce RTX 3070
  (37 - 39.2, n=4)
38 fps -29%
MSI GeForce RTX 3070 Gaming X Trio
NVIDIA GeForce RTX 3070, R9 5900X
37 (17.44min, 25.32P1 - 81.3max) fps -31%
Media NVIDIA GeForce RTX 2080 Super (Desktop)
 
34.4 fps -36%
Media NVIDIA GeForce RTX 2070 Super (Desktop)
 
29.2 fps -46%
Media AMD Radeon RX 5700 XT (Desktop)
 
12.7 fps -76%
2560x1440 Ultra Preset (DX12)
AMD Radeon RX 6900 XT
AMD Radeon RX 6900 XT, R9 5950X (SAM ENABLED)
91.4 (38.16min, 73.25P1 - 135.95max) fps
AMD Radeon RX 6900 XT
AMD Radeon RX 6900 XT, R9 5950X
91.1 (31.59min, 72.21P1 - 151.03max) fps 0%
Media NVIDIA GeForce RTX 3090
  (88.3 - 89.7, n=2)
89 fps -3%
Nvidia GeForce RTX 3090 Founders Edition
NVIDIA GeForce RTX 3090, R9 5900X
88.3 (48.36min, 68.18P1 - 160.5max) fps -3%
AMD Radeon RX 6800 XT
AMD Radeon RX 6800 XT, R9 5950X
84.5 (58.88min, 69.45P1 - 137.16max) fps -8%
ASUS GeForce RTX 3080 ROG STRIX OC GAMING
NVIDIA GeForce RTX 3080, R9 5900X
81.6 (44.31min, 65.35P1 - 139.28max) fps -11%
Media NVIDIA GeForce RTX 3080
  (81.1 - 81.6, n=2)
81.4 fps -11%
Media NVIDIA GeForce RTX 2080 Ti (Desktop)
 
72.9 fps -20%
Media NVIDIA Titan RTX
 
69.9 fps -24%
Media NVIDIA GeForce RTX 3070
  (65.3 - 67, n=4)
66.1 fps -28%
MSI GeForce RTX 3070 Gaming X Trio
NVIDIA GeForce RTX 3070, R9 5900X
65.7 (25.01min, 51.86P1 - 96.9max) fps -28%
Media NVIDIA GeForce RTX 2080 Super (Desktop)
 
57.3 fps -37%
Media NVIDIA GeForce RTX 2070 Super (Desktop)
 
51.4 fps -44%
Media AMD Radeon RX 5700 XT (Desktop)
 
46.4 fps -49%
1920x1080 Ultra Preset (DX12)
AMD Radeon RX 6900 XT
AMD Radeon RX 6900 XT, R9 5950X (SAM ENABLED)
121 (67.26min, 95.56P1 - 184.97max) fps
AMD Radeon RX 6900 XT
AMD Radeon RX 6900 XT, R9 5950X
120 (81.32min, 93.02P1 - 209.32max) fps -1%
AMD Radeon RX 6800 XT
AMD Radeon RX 6800 XT, R9 5950X
112 (75.12min, 87.97P1 - 181.69max) fps -7%
Nvidia GeForce RTX 3090 Founders Edition
NVIDIA GeForce RTX 3090, R9 5900X
107 (24.35min, 77.46P1 - 174.03max) fps -12%
Media NVIDIA GeForce RTX 3090
  (103 - 107, n=2)
105 fps -13%
ASUS GeForce RTX 3080 ROG STRIX OC GAMING
NVIDIA GeForce RTX 3080, R9 5900X
103 (55.63min, 83.65P1 - 156.57max) fps -15%
Media NVIDIA GeForce RTX 3080
  (99.3 - 103, n=2)
101.2 fps -16%
Media NVIDIA GeForce RTX 2080 Ti (Desktop)
 
89.6 fps -26%
Media NVIDIA Titan RTX
 
85.5 fps -29%
Media NVIDIA GeForce RTX 3070
  (79 - 89, n=4)
84.7 fps -30%
MSI GeForce RTX 3070 Gaming X Trio
NVIDIA GeForce RTX 3070, R9 5900X
79 (42.91min, 56.59P1 - 121.27max) fps -35%
Media NVIDIA GeForce RTX 2080 Super (Desktop)
 
75.4 fps -38%
Media NVIDIA GeForce RTX 2070 Super (Desktop)
 
68.3 fps -44%
Media AMD Radeon RX 5700 XT (Desktop)
 
66.8 fps -45%
F1 2020
3840x2160 Ultra High Preset AA:T AF:16x
Media NVIDIA GeForce RTX 3090
  (133 - 149.6, n=10)
141.8 fps +4%
AMD Radeon RX 6900 XT
AMD Radeon RX 6900 XT, R9 5950X (SAM ENABLED)
137 (109min - 165max) fps
AMD Radeon RX 6900 XT
AMD Radeon RX 6900 XT, R9 5950X
136 (110min - 161max) fps -1%
Nvidia GeForce RTX 3090 Founders Edition
NVIDIA GeForce RTX 3090, R9 5900X
135 (116min - 157max) fps -1%
AMD Radeon RX 6800 XT
AMD Radeon RX 6800 XT, R9 5950X (704326)
128 (106min - 152max) fps -7%
ASUS GeForce RTX 3080 ROG STRIX OC GAMING
NVIDIA GeForce RTX 3080, R9 5900X (692646)
118 (102min - 137max) fps -14%
Media NVIDIA GeForce RTX 3080
  (114 - 118, n=2)
116 fps -15%
Media NVIDIA Titan RTX
  (97.4 - 103.4, n=6)
101.5 fps -26%
Media NVIDIA GeForce RTX 2080 Ti (Desktop)
 
100 fps -27%
Media NVIDIA GeForce RTX 3070
  (88.7 - 92.7, n=3)
90.2 fps -34%
MSI GeForce RTX 3070 Gaming X Trio
NVIDIA GeForce RTX 3070, R9 5900X (692646)
89.2 (73min - 104max) fps -35%
Media NVIDIA GeForce RTX 2080 Super (Desktop)
 
77.2 fps -44%
Media NVIDIA GeForce RTX 2070 Super (Desktop)
  (67.6 - 71.4, n=3)
69.2 fps -49%
Media AMD Radeon RX 5700 XT (Desktop)
  (47 - 65, n=4)
59.3 fps -57%
2560x1440 Ultra High Preset AA:T AF:16x
AMD Radeon RX 6900 XT
AMD Radeon RX 6900 XT, R9 5950X (SAM ENABLED)
228 (178min - 275max) fps
AMD Radeon RX 6900 XT
AMD Radeon RX 6900 XT, R9 5950X
220 (173min - 264max) fps -4%
Media NVIDIA GeForce RTX 3090
  (204 - 240, n=10)
226 fps -1%
AMD Radeon RX 6800 XT
AMD Radeon RX 6800 XT, R9 5950X (704326)
215 (166min - 264max) fps -6%
Nvidia GeForce RTX 3090 Founders Edition
NVIDIA GeForce RTX 3090, R9 5900X
207 (171min - 241max) fps -9%
Media NVIDIA Titan RTX
  (153 - 175.8, n=6)
167.4 fps -27%
Media NVIDIA GeForce RTX 2080 Ti (Desktop)
 
162 fps -29%
ASUS GeForce RTX 3080 ROG STRIX OC GAMING
NVIDIA GeForce RTX 3080, R9 5900X (692646)
155 (128min - 184max) fps -32%
Media NVIDIA GeForce RTX 3080
  (146 - 155, n=2)
150.5 fps -34%
Media NVIDIA GeForce RTX 3070
  (143 - 162.2, n=3)
150.4 fps -34%
MSI GeForce RTX 3070 Gaming X Trio
NVIDIA GeForce RTX 3070, R9 5900X (692646)
146 (121min - 168max) fps -36%
Media NVIDIA GeForce RTX 2080 Super (Desktop)
 
127 fps -44%
Media NVIDIA GeForce RTX 2070 Super (Desktop)
  (117.6 - 121.1, n=3)
118.9 fps -48%
Media AMD Radeon RX 5700 XT (Desktop)
  (80 - 109, n=4)
99.3 fps -56%
1920x1080 Ultra High Preset AA:T AF:16x
AMD Radeon RX 6900 XT
AMD Radeon RX 6900 XT, R9 5950X (SAM ENABLED)
291 (222min - 355max) fps
AMD Radeon RX 6900 XT
AMD Radeon RX 6900 XT, R9 5950X
275 (213min - 338max) fps -5%
AMD Radeon RX 6800 XT
AMD Radeon RX 6800 XT, R9 5950X (704326)
279 (211min - 345max) fps -4%
Media NVIDIA GeForce RTX 3090
  (227 - 311, n=10)
279 fps -4%
Nvidia GeForce RTX 3090 Founders Edition
NVIDIA GeForce RTX 3090, R9 5900X
250 (214min - 304max) fps -14%
Media NVIDIA Titan RTX
  (194 - 231, n=7)
216 fps -26%
Media NVIDIA GeForce RTX 2080 Ti (Desktop)
 
202 fps -31%
Media NVIDIA GeForce RTX 3070
  (179 - 215, n=3)
191.7 fps -34%
ASUS GeForce RTX 3080 ROG STRIX OC GAMING
NVIDIA GeForce RTX 3080, R9 5900X (692646)
185 (158min - 218max) fps -36%
Media NVIDIA GeForce RTX 3080
  (179 - 185, n=2)
182 fps -37%
MSI GeForce RTX 3070 Gaming X Trio
NVIDIA GeForce RTX 3070, R9 5900X (692646)
179 (153min - 213max) fps -38%
Media NVIDIA GeForce RTX 2080 Super (Desktop)
 
162 fps -44%
Media NVIDIA GeForce RTX 2070 Super (Desktop)
  (153 - 163, n=3)
157.4 fps -46%
Media AMD Radeon RX 5700 XT (Desktop)
  (108 - 149, n=4)
131.9 fps -55%
basso medio alto ultraQHD4K
The Witcher 3 (2015) 589 375 323 163.6 122
Shadow of the Tomb Raider (2018) 248 222 213 199 163 86
Forza Horizon 4 (2018) 350 283 279 247 243 172
Assassin´s Creed Odyssey (2018) 124 117 106 98 99 68
Battlefield V (2018) 196 195 196 197 196 134
Far Cry New Dawn (2019) 141 126 123 118 117 101
Metro Exodus (2019) 274 214 154 123 102 66.7
The Division 2 (2019) 217 190 157 138 118 66.6
Anno 1800 (2019) 223 162 139 87.1 70.7 52
Total War: Three Kingdoms (2019) 429.7 263 180.3 141.3 92.9 44.9
Control (2019) 240 234 174 113 53.9
Borderlands 3 (2019) 197 169 152 131 107 59.8
Red Dead Redemption 2 (2019) 208 196 150 98 82.1 54.6
Doom Eternal (2020) 624 480 416 411 328 185
Gears Tactics (2020) 495.8 338.1 249 175.1 136.4 74.1
F1 2020 (2020) 520 442 395 291 228 137
Horizon Zero Dawn (2020) 245 205 184 164 136 76
Mafia Definitive Edition (2020) 160 142 138 120 67
Watch Dogs Legion (2020) 191 190 170 121 91.4 53.6
Assassin´s Creed Valhalla (2020) 227 169 142 148 115 68
Call of Duty Black Ops Cold War (2020) 298 198 169 153 115 68.1
Immortals Fenyx Rising (2020) 139 126 127 122 121 83
Cyberpunk 2077 1.0 (2020) 160 152 127 106 72.3 34.8
Hitman 3 (2021) 352.8 283.2 279.9 269.4 213.1 127.8

Emissioni

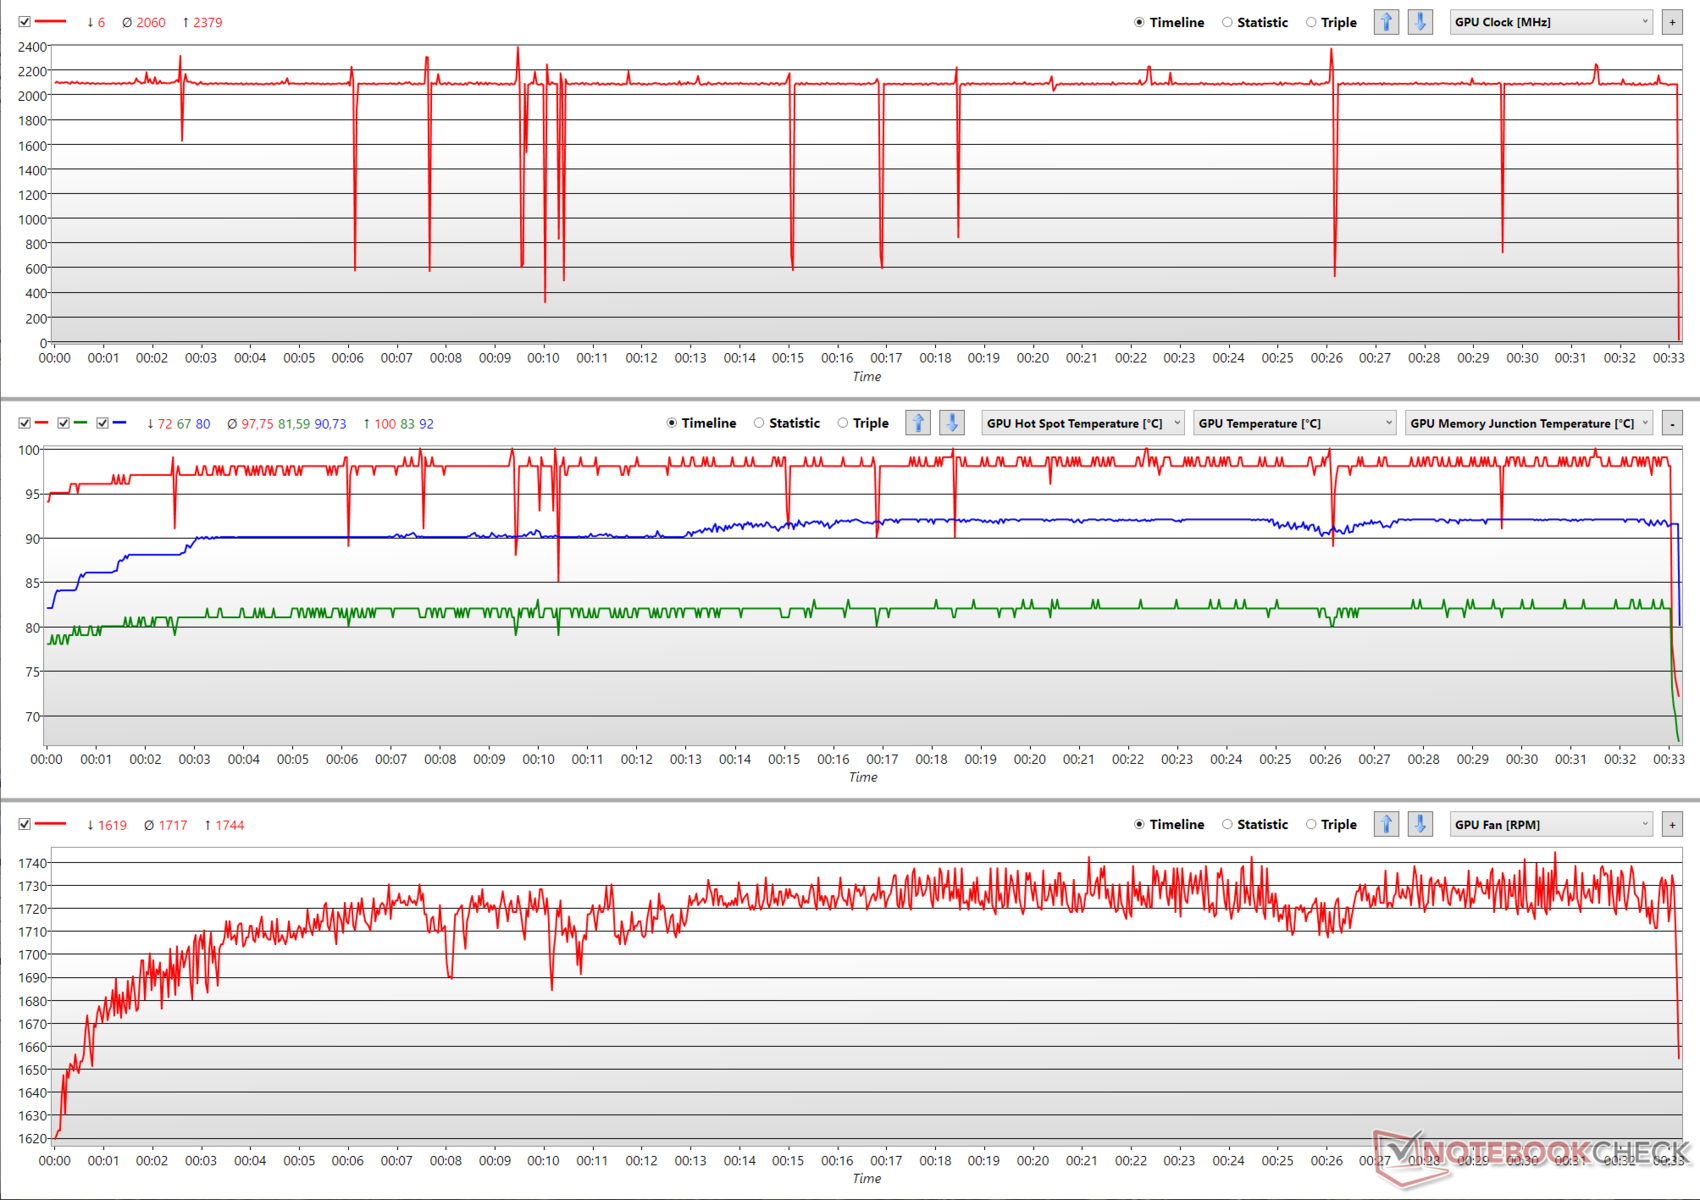
Con la serie RX 6000, AMD ha abbandonato il suo raffreddamento tradizionale per un sistema di raffreddamento a tre ventole più capace. Mentre questo nuovo sistema di raffreddamento consente sicuramente migliori clock sostenuti, troviamo la scheda che si avvicina ai 100 °C di temperatura spesso sotto stress FurMark. Anche il core gira abbastanza caldo a 82 °C.

Per la maggior parte, la RX 6900 XT può offrire un boost abbastanza sostenuto a 2.086 MHz e a volte può anche raggiungere i 2.379 MHz. Tuttavia, vediamo occasionalmente il throttling quando la temperatura del punto caldo raggiunge i 100 °C, anche se i clock si riprendono abbastanza rapidamente.

Abbiamo usato FurMark stress per determinare i livelli di rumore e temperatura. FuMark e The Witcher 3 a 1080p Ultra preset sono stati utilizzati per misurare il consumo energetico.

Stress
Stress
Clock dei core, temperature (GPU hot spot temp. - rosso, GPU temp. - verde, GDDR6 junction temp. - blu), e grafici della velocità della ventola durante lo stress FurMark

Temperature

Mappa termica AMD Radeon RX 6900 XT.

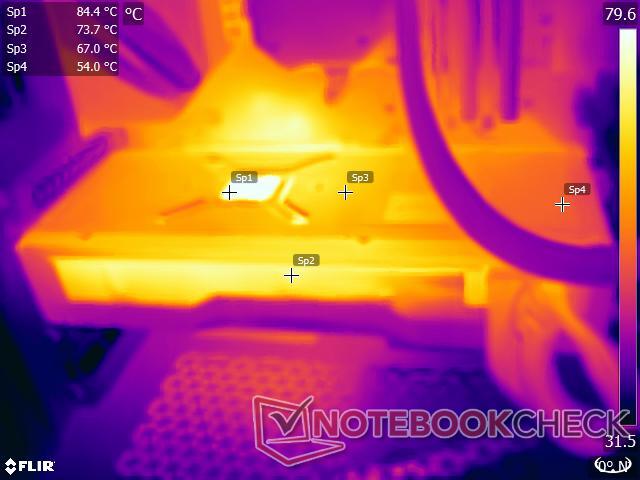
Anche le temperature di superficie sembrano rendere verso l'alto. Abbiamo registrato quasi 85 °C vicino alla zona della GPU e 67 °C vicino alla sezione VRM dell'alimentatore durante lo stress test FurMark.

Le bocchette di scarico dell'aria sulla parte superiore della scheda possono raggiungere quasi 74 °C. Pertanto, raccomandiamo di usare una buona ventola di scarico per evitare l'accumulo di calore all'interno del case, specialmente se il case ha un pannello laterale in vetro temperato. I power user potrebbero trovare utile sottovoltare la scheda e impostare un limite di potenza più basso. Questo può potenzialmente ridurre la temperatura del punto caldo e prevenire alcuni dei cali di clock che abbiamo visto prima.

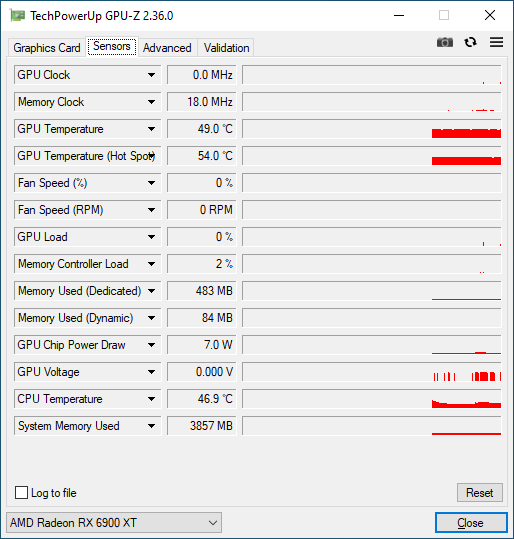
Abbiamo registrato 49 °C e 54 °C come temperature della GPU e dell'hot spot, rispettivamente in idle. A differenza della scheda di riferimento Radeon RX 5700 XT, la RX 6900 XT ora dispone di idle-fan-stop, il che significa che le ventole si spengono completamente quando non c'è carico.

Consumo di energia

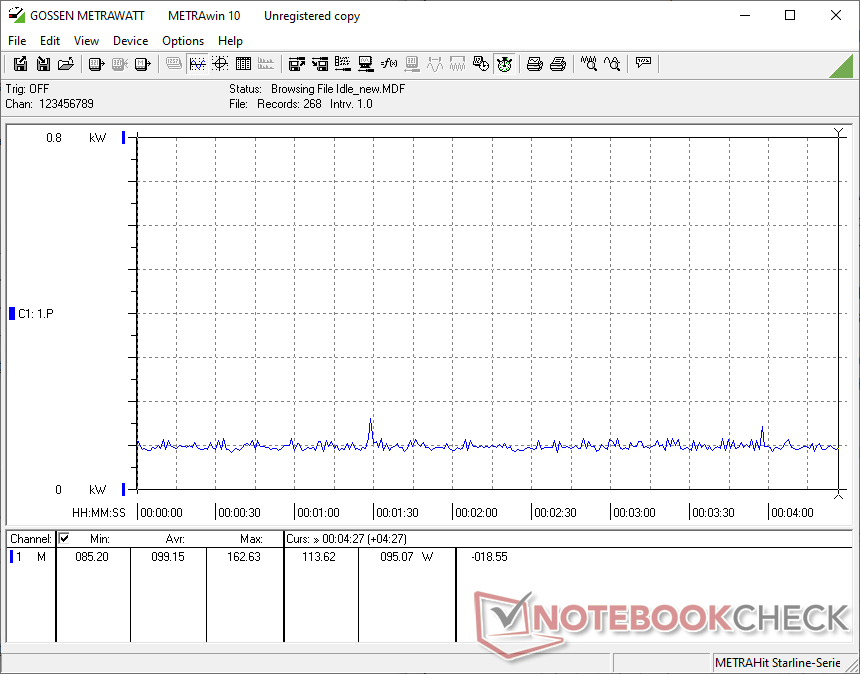
Il test consuma una media di 99 W di potenza in idle con tutta l'illuminazione RGB spenta e un totale di cinque ventole (tre ventole Corsair SP 120 mm del case e due ventole Corsair ML 120 mm del radiatore) e la pompa Elite Capellix AIO in funzione con un profilo bilanciato.

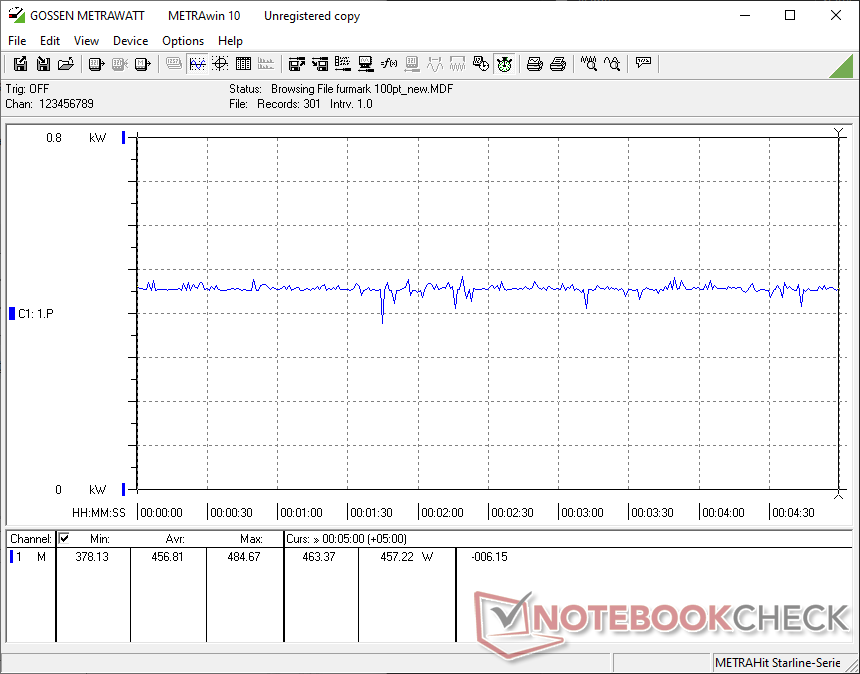
Il nostro sistema basato su RX 6900 XT consuma una media di 456,8 W e 488 W durante gli stress test FurMark e The Witcher 3 Ultra, rispettivamente. Il consumo di energia durante lo stress FurMark mostra un calo occasionale coerente con i cali di velocità del clock che abbiamo descritto prima.

Mentre le nuove schede RDNA 2 mostrano sicuramente un maggiore consumo energetico rispetto alla RX 5700 XT, è interessante notare che non c'è molta differenza tra la RX 6800 XT e la RX 6900 XT a questo proposito. La RTX 3090 Founders Edition, d'altra parte, consuma il 10% in più rispetto alla RX 6900 XT in FurMark stress anche mentre è più economica del 5% in The Witcher 3 Ultra.

Consumo di energia del sistema - Idle
Consumo energetico del sistema - stress FurMark
Consumo energetico del sistema - Il preset Witcher 3 1080p Ultra
Power Consumption
1280x720 FurMark 1.19 GPU Stress Test (external Monitor)
ASUS GeForce RTX 3080 ROG STRIX OC GAMING
NVIDIA GeForce RTX 3080, R9 5900X (Idle: 88.3 W)
505 (493min - 541max) Watt * -11%
Nvidia GeForce RTX 3090 Founders Edition
NVIDIA GeForce RTX 3090, R9 5900X (Idle: 91.1 W)
502 (425min - 525max) Watt * -10%
Media NVIDIA GeForce RTX 3080
  (Idle: 492 - 505, n=2 W)
499 Watt * -9%
Media NVIDIA GeForce RTX 3090
  (Idle: 281 - 551, n=8 W)
469 Watt * -3%
AMD Radeon RX 6900 XT
AMD Radeon RX 6900 XT, R9 5950X (Idle: 99.15 W)
456.8 (378.13min - 484.67max) Watt *
AMD Radeon RX 6800 XT
AMD Radeon RX 6800 XT, R9 5950X (Idle: 99.5 W)
447.9 (413min - 484max) Watt * +2%
Media NVIDIA Titan RTX
 
419 Watt * +8%
KFA2 GeForce RTX 2080 Ti EX
NVIDIA GeForce RTX 2080 Ti (Desktop), R9 3900X (Idle: 100.5 W)
400.8 (354min - 432max) Watt * +12%
Media NVIDIA GeForce RTX 2080 Ti (Desktop)
  (Idle: 330 - 439, n=3 W)
390 Watt * +15%
MSI GeForce RTX 3070 Gaming X Trio
NVIDIA GeForce RTX 3070, R9 5900X (Idle: 95.1 W)
376.9 (369min - 433max) Watt * +17%
Nvidia GeForce RTX 2080 Super
NVIDIA GeForce RTX 2080 Super (Desktop), R7 2700X (Idle: 78.87 W)
376.8 (331min - 409max) Watt * +18%
Media NVIDIA GeForce RTX 2080 Super (Desktop)
  (Idle: 328 - 414, n=4 W)
362 Watt * +21%
Media NVIDIA GeForce RTX 3070
  (Idle: 281 - 393, n=6 W)
348 Watt * +24%
Media AMD Radeon RX 5700 XT (Desktop)
  (Idle: 327 - 352, n=3 W)
339 Watt * +26%
Media NVIDIA GeForce RTX 2070 Super (Desktop)
  (Idle: 280 - 358, n=6 W)
329 Watt * +28%
AMD Radeon RX 5700 XT
AMD Radeon RX 5700 XT (Desktop), R7 2700X (239 fps, Idle: 69.8 W)
326.6 (313min - 351max) Watt * +29%
Nvidia GeForce RTX 2070 Super
NVIDIA GeForce RTX 2070 Super (Desktop), R7 2700X (283 fps, Idle: 80.5 W)
326 (315min - 348max) Watt * +29%
AMD Radeon RX 5700
AMD Radeon RX 5700 (Desktop), R7 2700X (207 fps, Idle: 64.5 W)
280.5 (271min - 312max) Watt * +39%
1920x1080 The Witcher 3 ultra (external Monitor)
Media NVIDIA GeForce RTX 3090
  (Idle: 464 - 597, n=17 W)
524 Watt * -7%
ASUS GeForce RTX 3080 ROG STRIX OC GAMING
NVIDIA GeForce RTX 3080, R9 5900X (Idle: 88.3 W)
505 (389min - 543max) Watt * -3%
AMD Radeon RX 6800 XT
AMD Radeon RX 6800 XT, R9 5950X (Idle: 99.5 W)
505 (389min - 543max) Watt * -3%
Media NVIDIA GeForce RTX 3080
  (Idle: 498 - 505, n=2 W)
502 Watt * -3%
AMD Radeon RX 6900 XT
AMD Radeon RX 6900 XT, R9 5950X (Idle: 99.15 W)
488.3 (459.99min - 512.79max) Watt *
Nvidia GeForce RTX 3090 Founders Edition
NVIDIA GeForce RTX 3090, R9 5900X (Idle: 91.1 W)
463.7 (450min - 487max) Watt * +5%
AMD Ryzen 9 5900X
NVIDIA Titan RTX, R9 5900X (Idle: 78.1 W)
439.6 (419min - 497max) Watt * +10%
KFA2 GeForce RTX 2080 Ti EX
NVIDIA GeForce RTX 2080 Ti (Desktop), R9 3900X (Idle: 100.5 W)
438.8 (431min - 463max) Watt * +10%
Media NVIDIA GeForce RTX 2080 Ti (Desktop)
  (Idle: 359 - 467, n=3 W)
422 Watt * +14%
Media NVIDIA Titan RTX
  (Idle: 371 - 463, n=27 W)
408 Watt * +16%
Media NVIDIA GeForce RTX 3070
  (Idle: 317 - 550, n=5 W)
401 Watt * +18%
MSI GeForce RTX 3070 Gaming X Trio
NVIDIA GeForce RTX 3070, R9 5900X (Idle: 95.1 W)
394.5 (381min - 430max) Watt * +19%
Nvidia GeForce RTX 2080 Super
NVIDIA GeForce RTX 2080 Super (Desktop), R7 2700X (Idle: 78.87 W)
382.8 (360min - 410max) Watt * +22%
Media NVIDIA GeForce RTX 2080 Super (Desktop)
  (Idle: 336 - 416, n=5 W)
363 Watt * +26%
Media AMD Radeon RX 5700 XT (Desktop)
  (Idle: 326 - 376, n=3 W)
350 Watt * +28%
AMD Radeon RX 5700 XT
AMD Radeon RX 5700 XT (Desktop), R7 2700X (Idle: 69.8 W)
348.7 (341min - 359max) Watt * +29%
Nvidia GeForce RTX 2070 Super
NVIDIA GeForce RTX 2070 Super (Desktop), R7 2700X (96.8 fps, Idle: 80.5 W)
344.7 (335min - 370max) Watt * +29%
Media NVIDIA GeForce RTX 2070 Super (Desktop)
  (Idle: 296 - 377, n=6 W)
342 Watt * +30%
AMD Radeon RX 5700
AMD Radeon RX 5700 (Desktop), R7 2700X (84.2 fps, Idle: 64.5 W)
295.9 (284min - 304max) Watt * +39%

* ... Meglio usare valori piccoli

Rumorosità

Il nuovo sistema di raffreddamento a tre ventole di AMD sembra funzionare con livelli di rumore decenti. Con la disponibilità di una modalità di arresto completo della ventola, il livello di rumorosità (SPL) è quasi lo stesso dei livelli ambientali a 28.70 db(A) ad una distanza di 20 cm dal case chiuso.

Durante lo stress test FurMark, l'SPL è salito a 44.13 db(A), che è abbastanza tollerabile quando il case è chiuso. Gli utenti possono essere in grado di ottimizzare ulteriormente le temperature e le curve delle ventole utilizzando Radeon Software Adrenalin Edition o tramite strumenti di terze parti come MSI Afterburner.

Livelli di rumore - al minimo con le ventole del case spente
Livelli di rumore - FurMark stress con le ventole del case spente

Pro

+ Buona qualità costruttiva
+ Piastra posteriore in alluminio
+ Sistema di raffreddamento a tre ventole
+ Porta USB Type-C
+ Prestazioni tra una RTX 3080 e una RTX 3090 nella maggior parte dei benchmarks di gioco sintetici e 4K
+ Buono spettacolo nelle applicazioni 3D professionali
+ Consumo energetico alla pari con una RX 6800 XT e meno della RTX 3090
+ Ventole ferme in idle
+ Livelli di rumore tollerabili sotto stress
+ 500 dollari in meno al prezzo di una RTX 3090

Contro

- Le prestazioni di calcolo potrebbero essere migliori
- Ray tracing significativamente indietro rispetto a RTX 3080 e RTX 3090
- Ancora nessun supporto per il super campionamento basato sull'AI
- Memoria ad accesso intelligente di poca importanza nella maggior parte dei giochi
- Elevata temperature del core e della superficie sotto carico
- Sporadico throttling sotto carico
- Prestazioni complessive solo marginalmente migliori della RX 6800 XT
- Scorte molto limitate

Valutazione complessiva della AMD Radeon RX 6900 XT

AMD Radeon RX 6900 XT. Dispositivo di test gentilmente fornito da AMD India.

I giorni in cui AMD era sfavorita nel mercato delle GPU sono ufficialmente finiti con la Radeon RX 6900 XT. La RX 6900 XT ha il coraggio di sfidare veramente le offerte di punta di NVIDIA, e lo vediamo riflesso nella maggior parte dei test. Con le ultime schede Navi 2x, AMD sembra aver adottato un design più appariscente completo di un logo Radeon RGB e un sistema di raffreddamento a tripla ventola per migliorare le prestazioni termiche rispetto ai sistemi a soffietto che abbiamo visto finora.

La RX 6900 XT tiene abbastanza bene, battendo anche la RTX 3090 in alcuni benchmarks sintetici. Considerando il prezzo di 999 dollari della RX 6900 XT contro il prezzo di 1.499 dollari della RTX 3090, il leggero deficit di prestazioni è ben compensato dalla differenza di prezzo di 500 dollari. Inoltre, vediamo numeri eccellenti anche nelle applicazioni professionali, rendendo la RX 6900 XT una buona scelta se il vostro carico di lavoro non dipende da CUDA.

I giocatori che vogliono scegliere una scheda AMD di punta che può essere una valida alternativa a quella di NVIDIA troveranno la RX 6900 XT utile, soprattutto se i giochi sono ottimizzati per l'hardware AMD. I driver Radeon Software Adrenalin hanno fatto molta strada in termini di offerta di un esperienza stabile e l'inclusione di entrambi i Ryzen e Radeon tuning nella ultima versione è sicuramente un passo nella giusta direzione. La memoria ad accesso intelligente, anche se buona da avere, è attualmente di poca importanza nella stragrande maggioranza dei giochi di oggi.

AMD, tuttavia, è attualmente in ritardo rispetto a NVIDIA in due tecnologie, che sono ora abbracciate velocemente dagli sviluppatori di giochi - il ray tracing e il super sampling basato sull'AI. Le prestazioni di ray tracing della RX 6900 XT sono sicuramente di classe RTX 2080 Ti, ma non sono realmente competitive con ciò che possono offrire le RTX 3080 e RTX 3090. Inoltre, AMD deve ancora venire fuori con una soluzione di super campionamento sulla falsariga del Deep Learning Super Sampling (DLSS) di NVIDIA.

Le otto CU aggiuntive nella RX 6900 XT non sembrano offrire un guadagno significativo in termini di prestazioni rispetto alle 72 CU della RX 6800 XT. Pertanto, se siete alla ricerca principalmente di una scheda di gaming puro, la RX 6800 XT che costa 649 dollari probabilmente è un investimento migliore.

La AMD Radeon RX 6900 XT è proprio quello che i fan del Team Red hanno chiesto a gran voce da molto tempo per tenere sotto controllo la concorrenza. Anche se la RX 6900 XT non batte completamente la NVIDIA GeForce RTX 3090, è a breve distanza e a volte può battere il top dog di NVIDIA con un discreto margine, rendendola una buona scelta se le tecnologie di nuova generazione come il ray tracing e il super sampling basato su AI non sono preoccupazioni primarie".

La RX 6900 XT non aiuta esattamente a risparmiare sulle bollette elettriche. Tuttavia, è comunque relativamente più economica nel consumo di energia rispetto alla RTX 3080 e alla RTX 3090. Mentre i livelli di rumore sotto carico sono tollerabili, le temperature sembrano essere sul lato più alto portando a sporadici throttling durante i nostri stress test.

Con RDNA 2 che diventa l'hardware grafico di base nelle console next-gen come la Xbox Series X/S e la PlayStation 5, c'è tanto potenziale vantaggio cross-platform che gli sviluppatori possono sfruttare. Speriamo che AMD migliori anche tutto ciò che può sul fronte del ray tracing e offra una valida alternativa DLSS nei mesi a venire.

Prezzo e disponibilità

AMD è attualmente a corto di schede Radeon RX 6900 XT, ma ha promesso a di continuare a offrire il design di riferimento. Mentre le scorte di schede di riferimento dovrebbero ricostituirsi presto, le schede partner add-in board (AiB) di artisti del calibro di MSI, Sapphire, XFX e PowerColor possono essere disponibili online a seconda della situazione delle scorte.

Al momento della pubblicazione, la Sapphire RX 6900 XT è disponibile su Amazon per 2.388 dollari, mentre la XFX Speedster MERC 319 Radeon RX 6900 XT è disponibile per 2.661,99 dollari su Walmart. Le schede AiB su Best Buy e Newegg continuano ad essere esaurite al momento della pubblicazione.

Raccomandiamo di tenere d'occhio la disponibilità delle schede di riferimento AMD e di aspettare che i prezzi delle versioni AiB scendano nelle prossime settimane prima di fare il grande passo.

Pricecompare

Please share our article, every link counts!
> Recensioni e prove di notebook, tablets e smartphones > Recensioni e prove > Recensioni e prove > Recensione dell'AMD Radeon RX 6900 XT: Prestazioni vicine alla RTX 3090 per 500 dollari in meno, ma solo marginalmente migliore rispetto alla RX 6800 XT
Vaidyanathan Subramaniam, 2021-05- 5 (Update: 2021-05- 8)