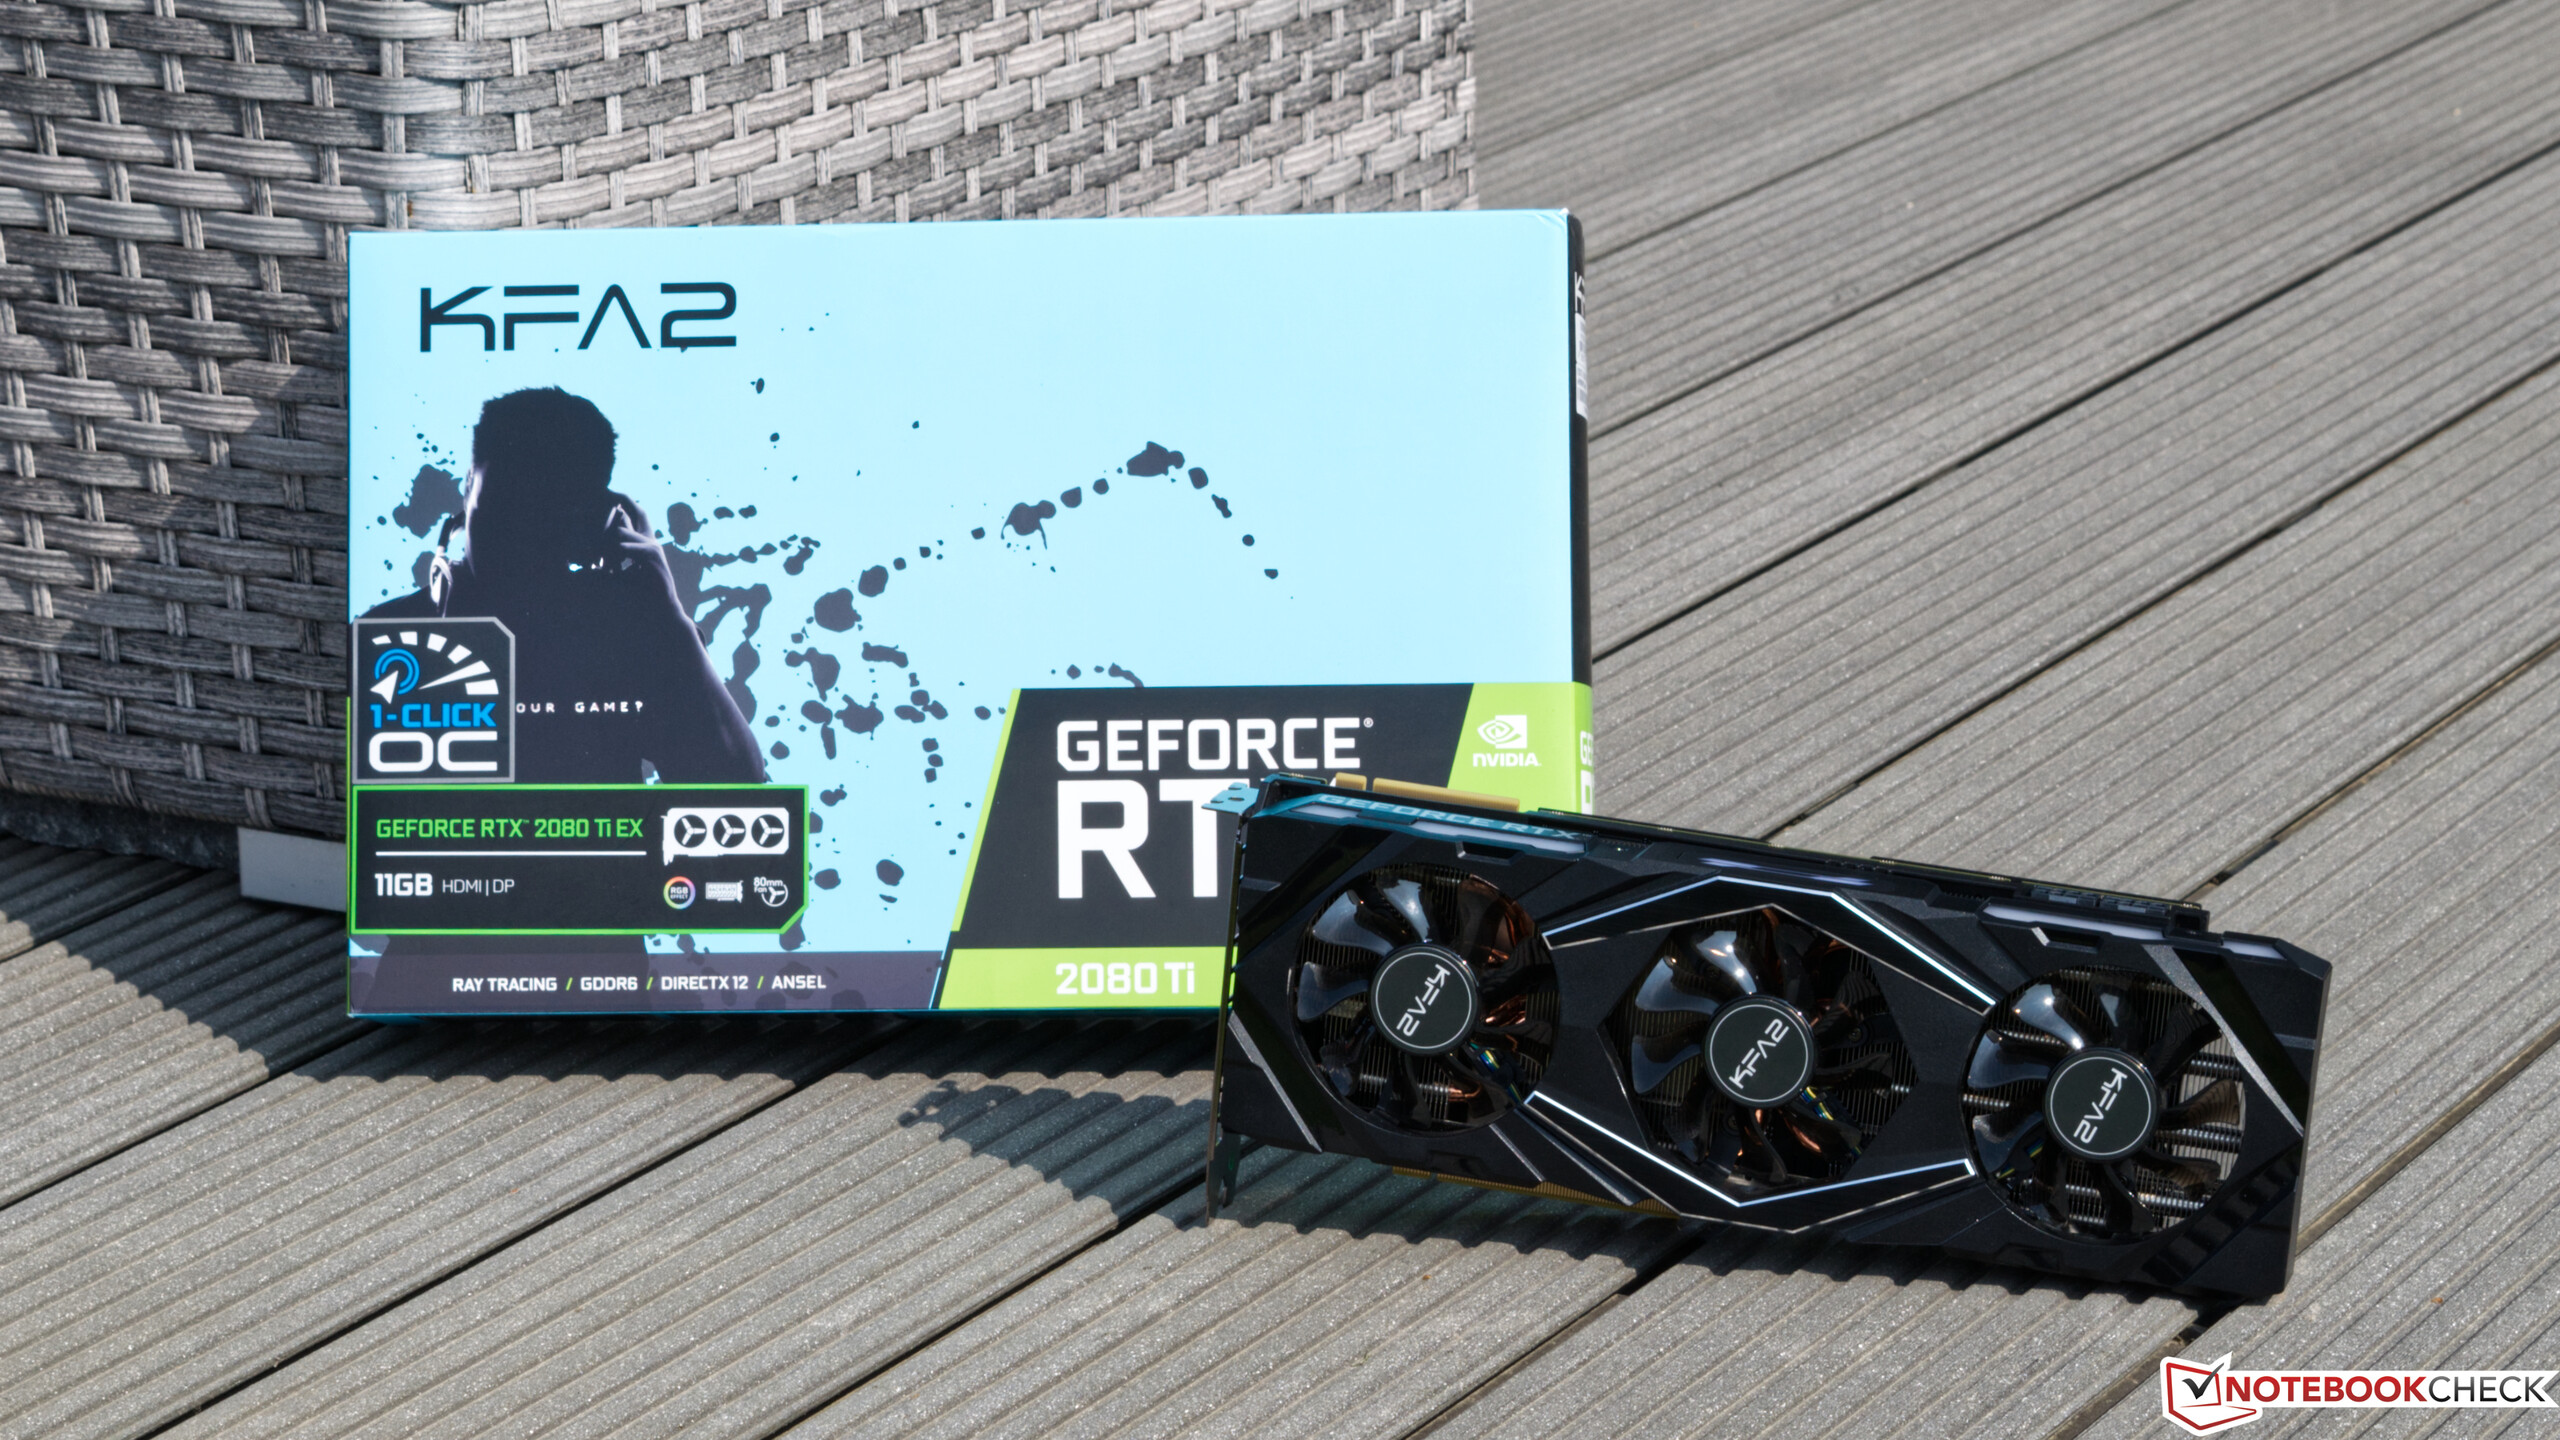
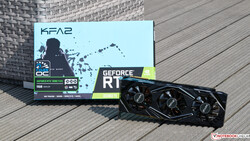
Recensione della GPU GeForce RTX 2080 Ti EX KFA2 - High-end Nvidia GPU con una soluzione di raffreddamento particolare
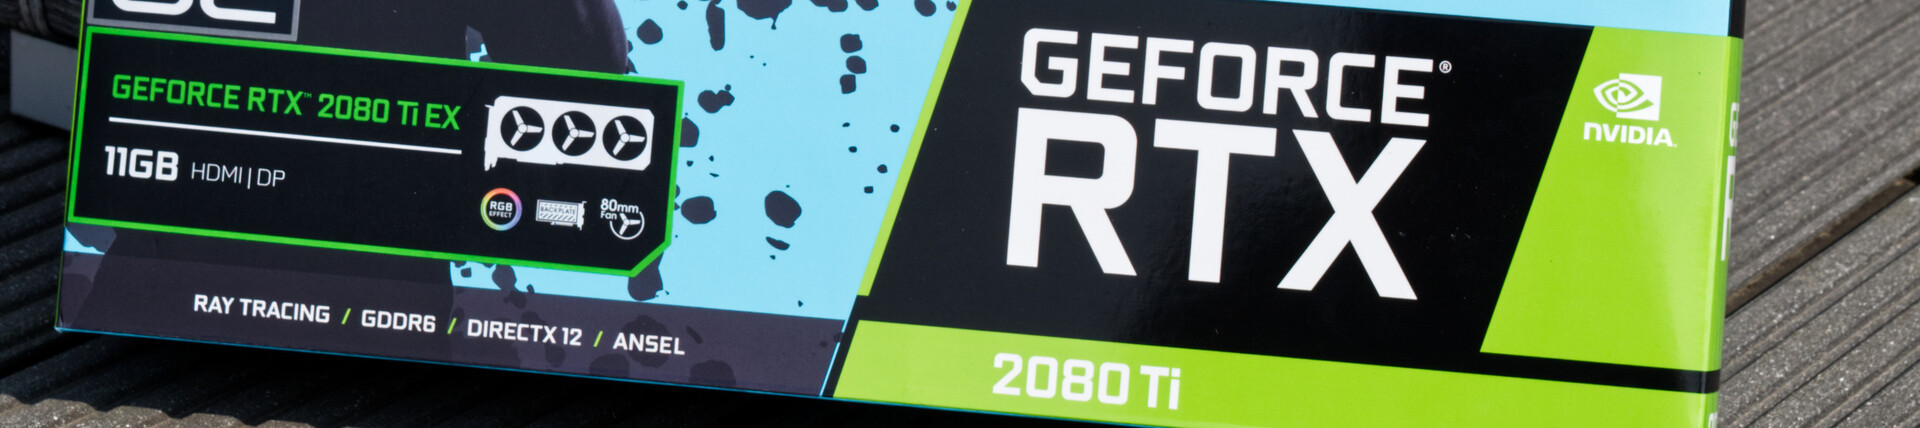

Dopo che Nvidia ha rilasciato le schede grafiche Super-branded, che erano in realtà solo versioni leggermente migliorate delle RTX 2060, RTX 2070 e la RTX 2080, la GeForce RTX 2080 Ti rimane l'unica GPU di fascia alta di Nvidia che non è stata aggiornata. Tuttavia, con 11 GB di VRAM, questo modello offre più memoria video di tutti gli altri modelli. Abbiamo recentemente recensito una GeForce RTX 2060 Super di KFA2 e ora abbiamo l'opportunità di dare un'occhiata più da vicino alla GeForce RTX 2080 Ti EX di KFA2.
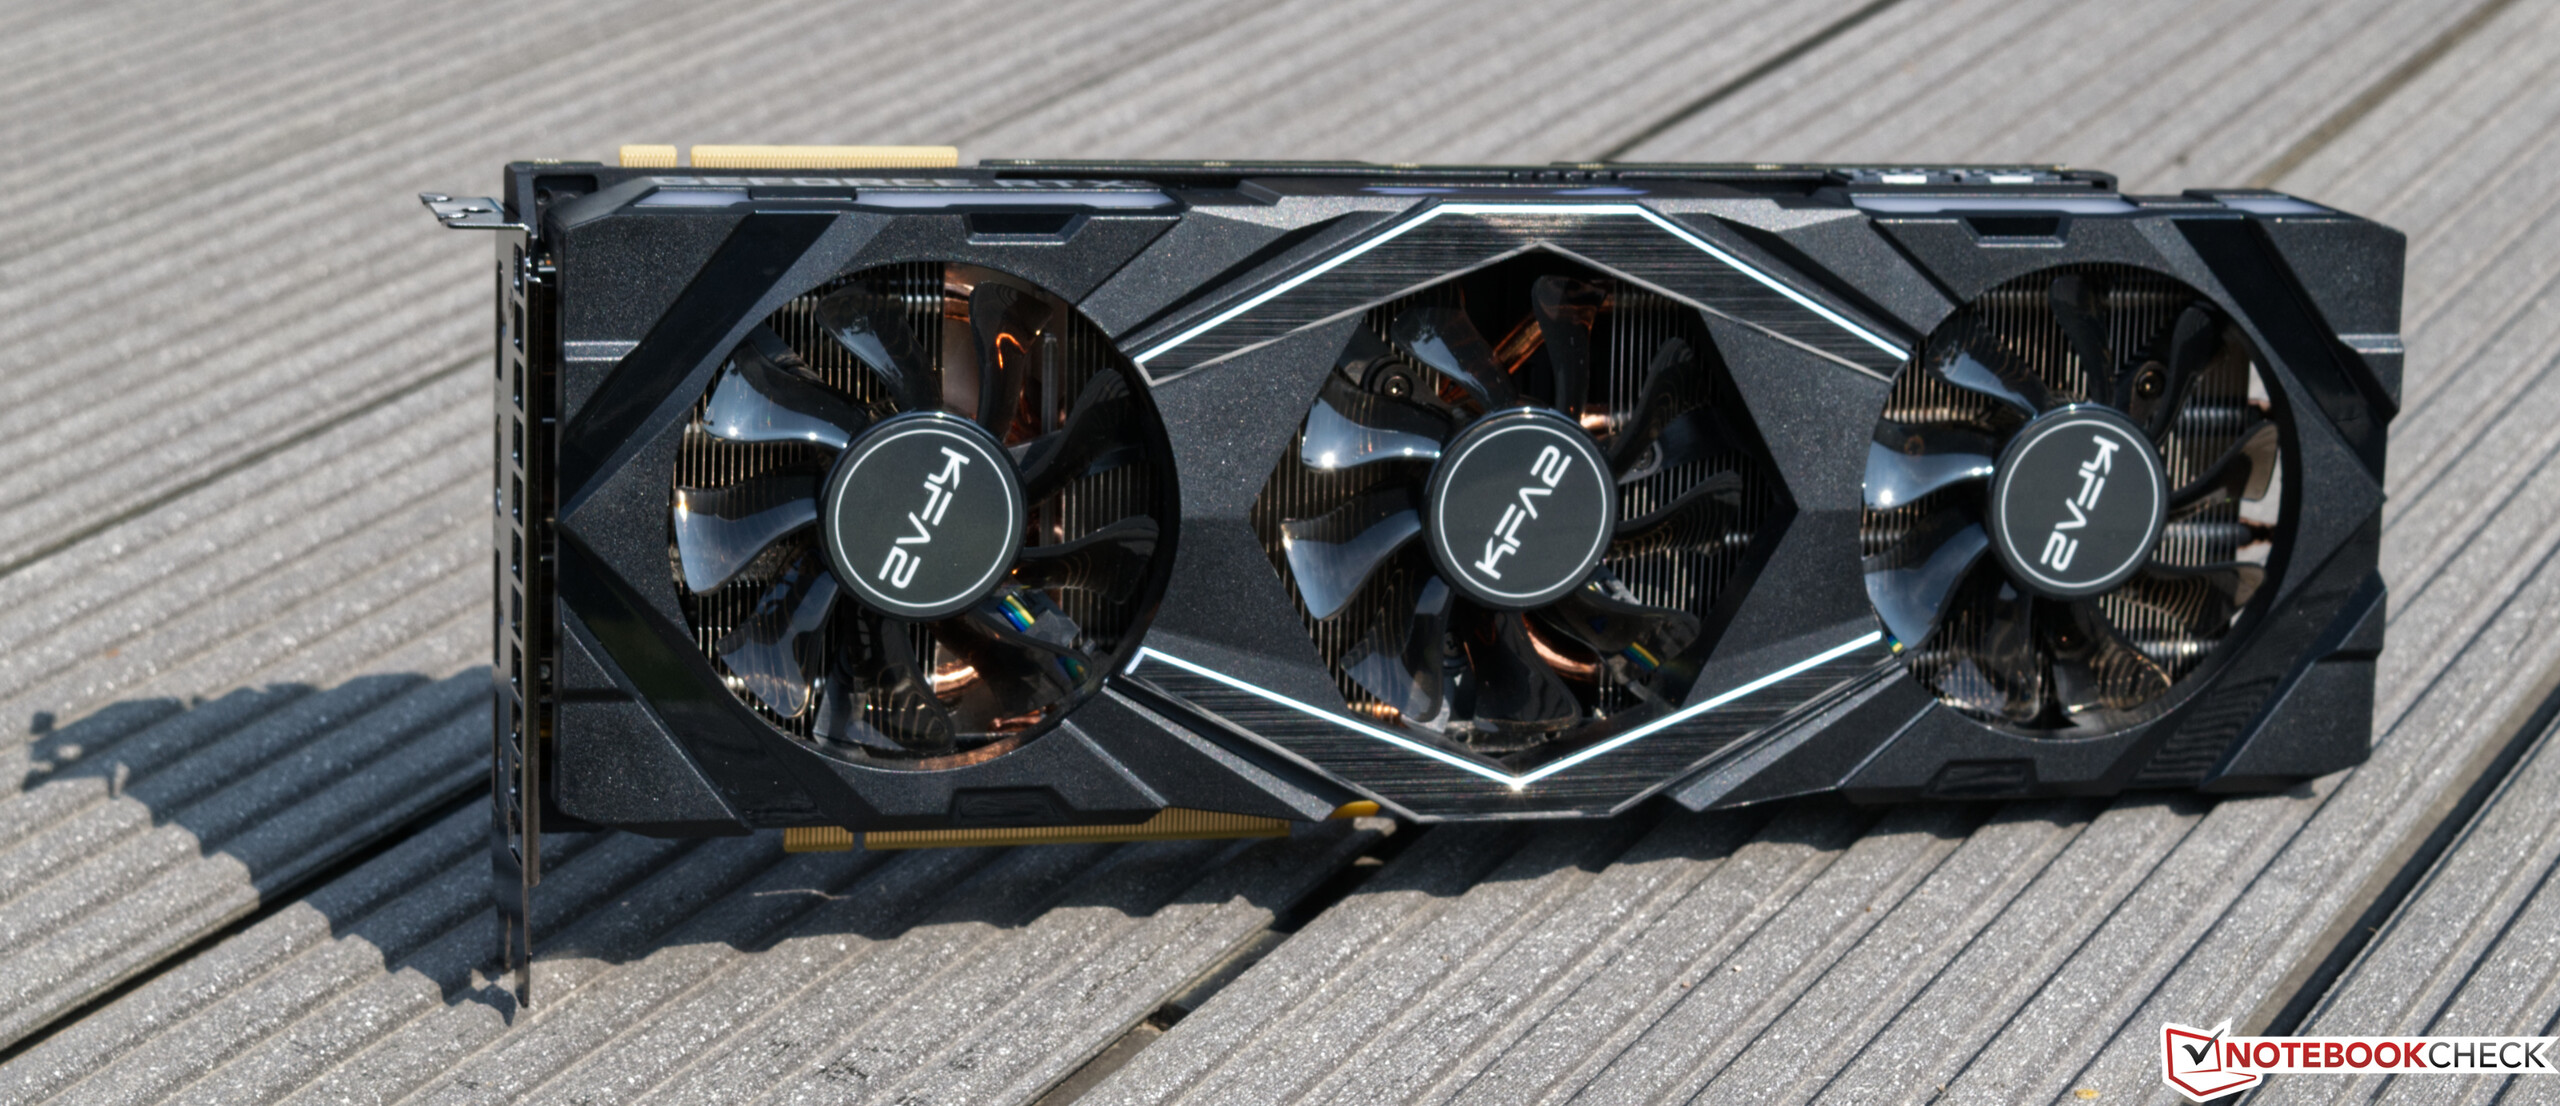
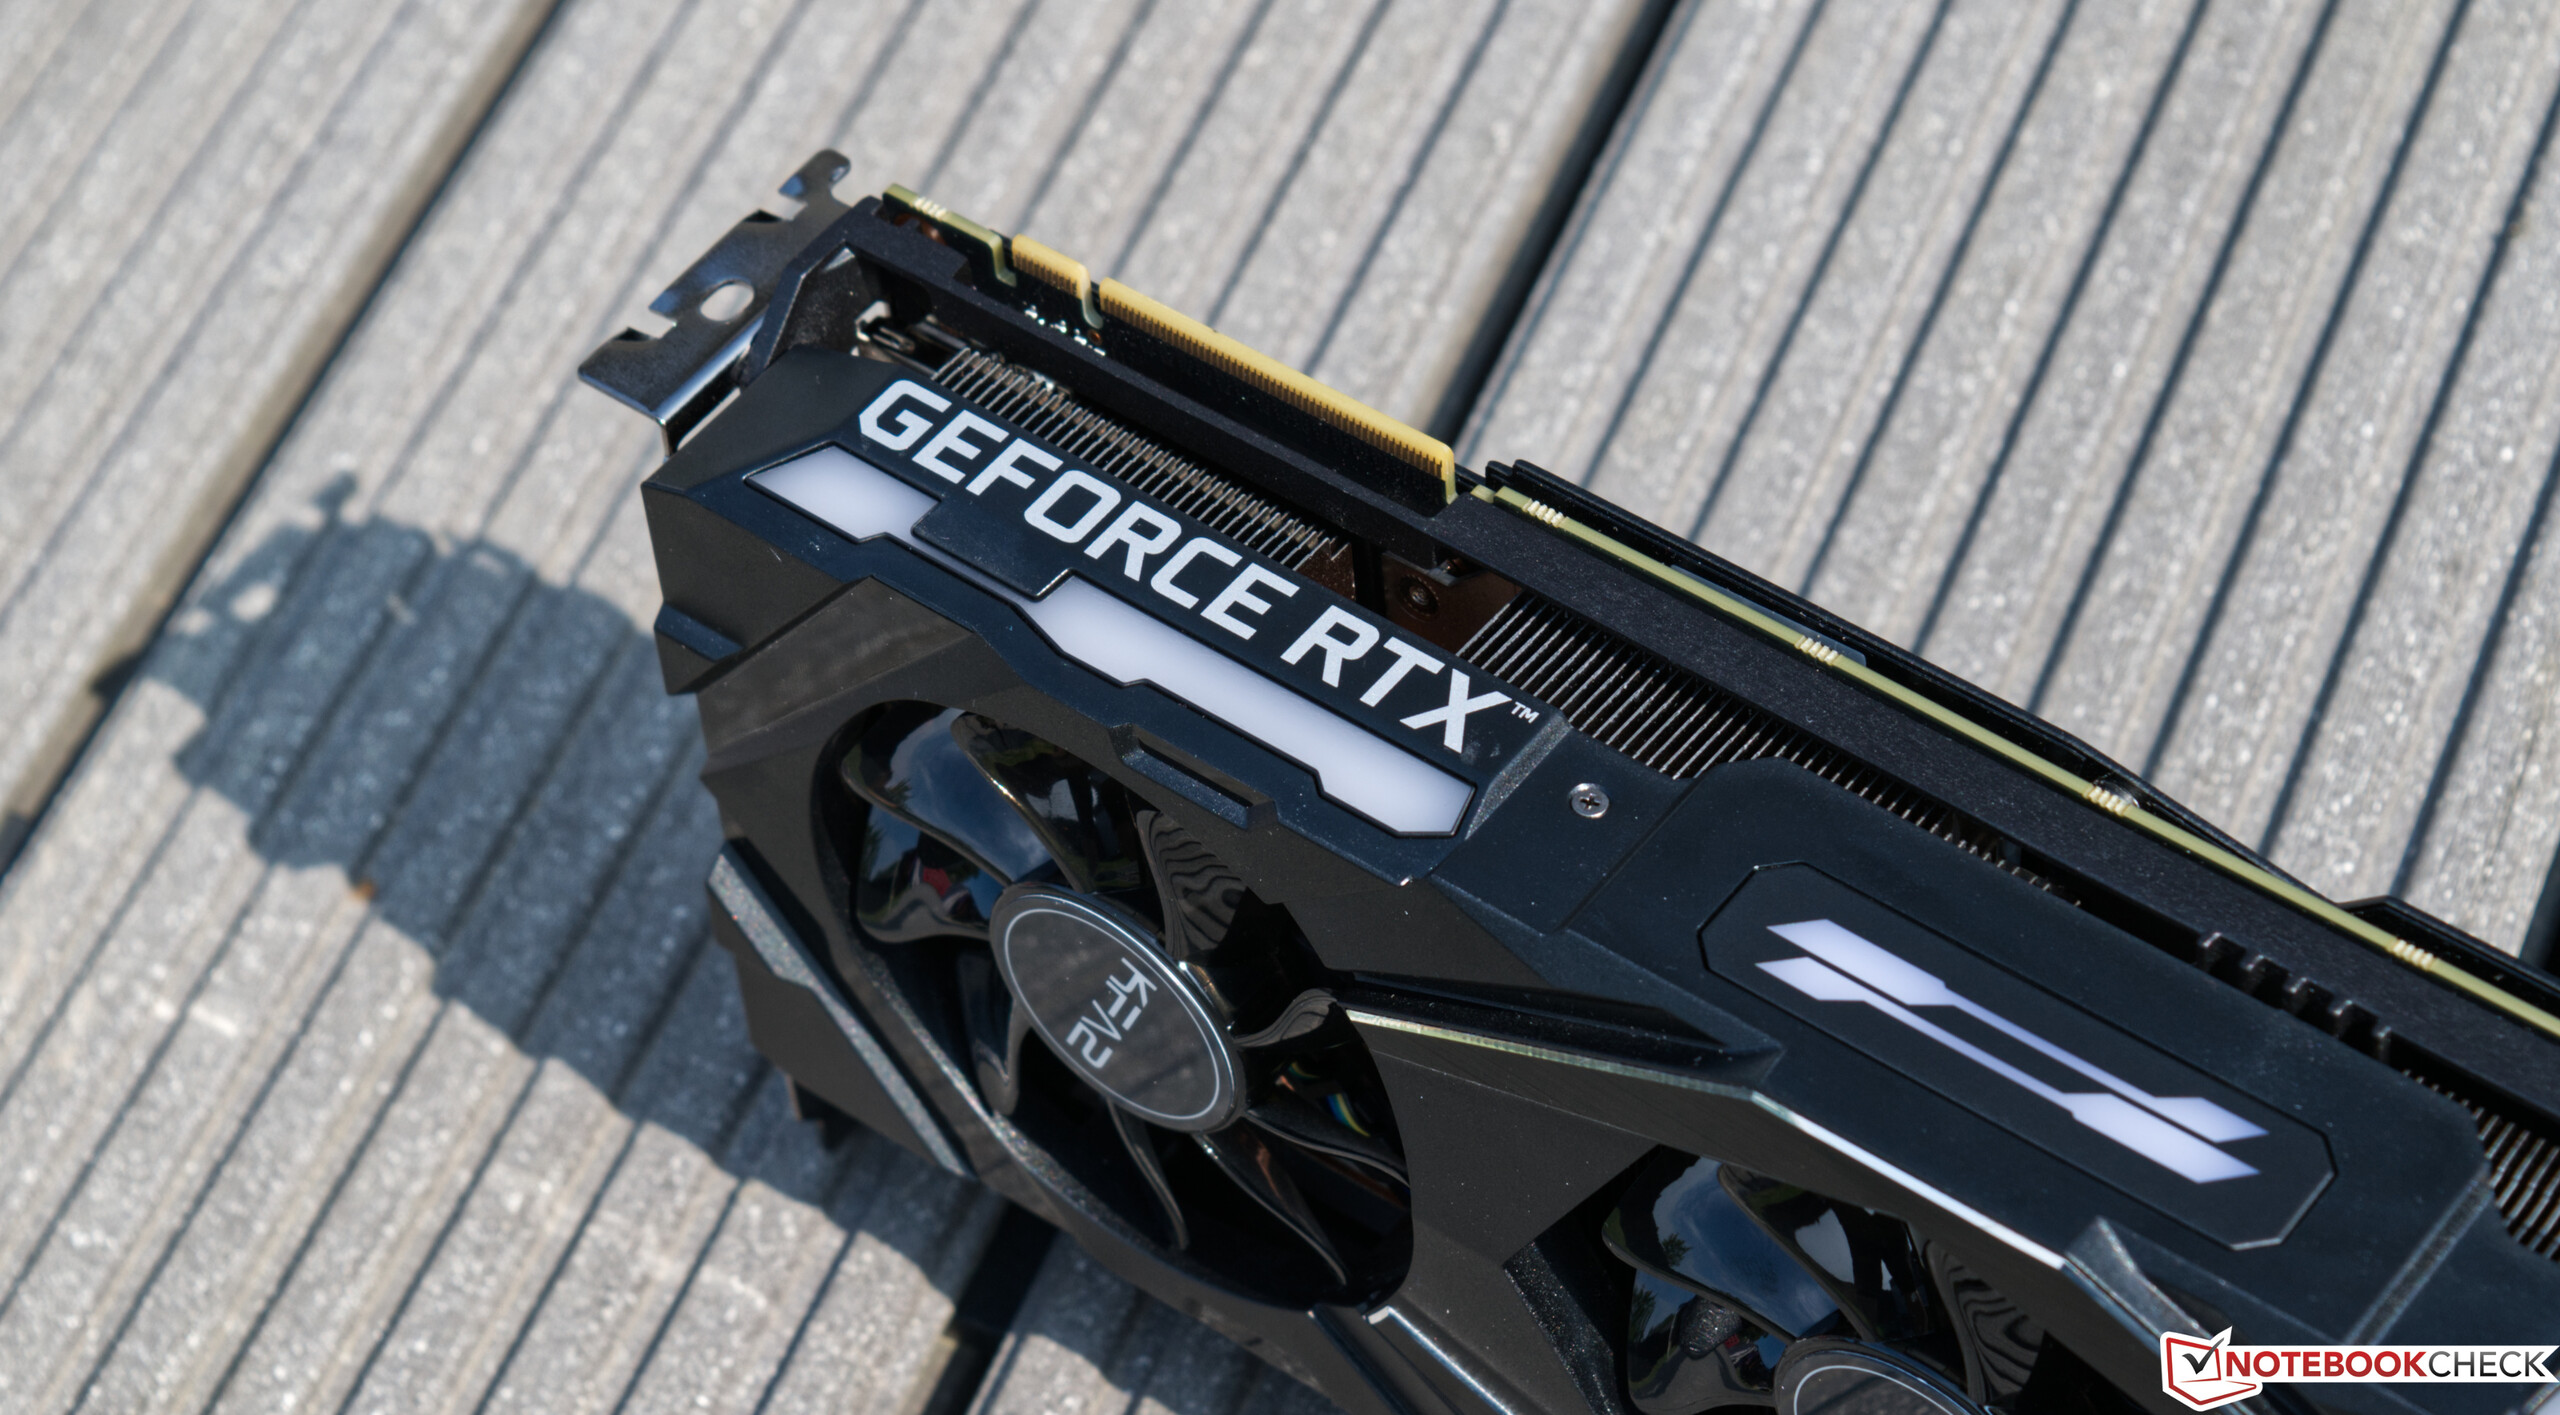
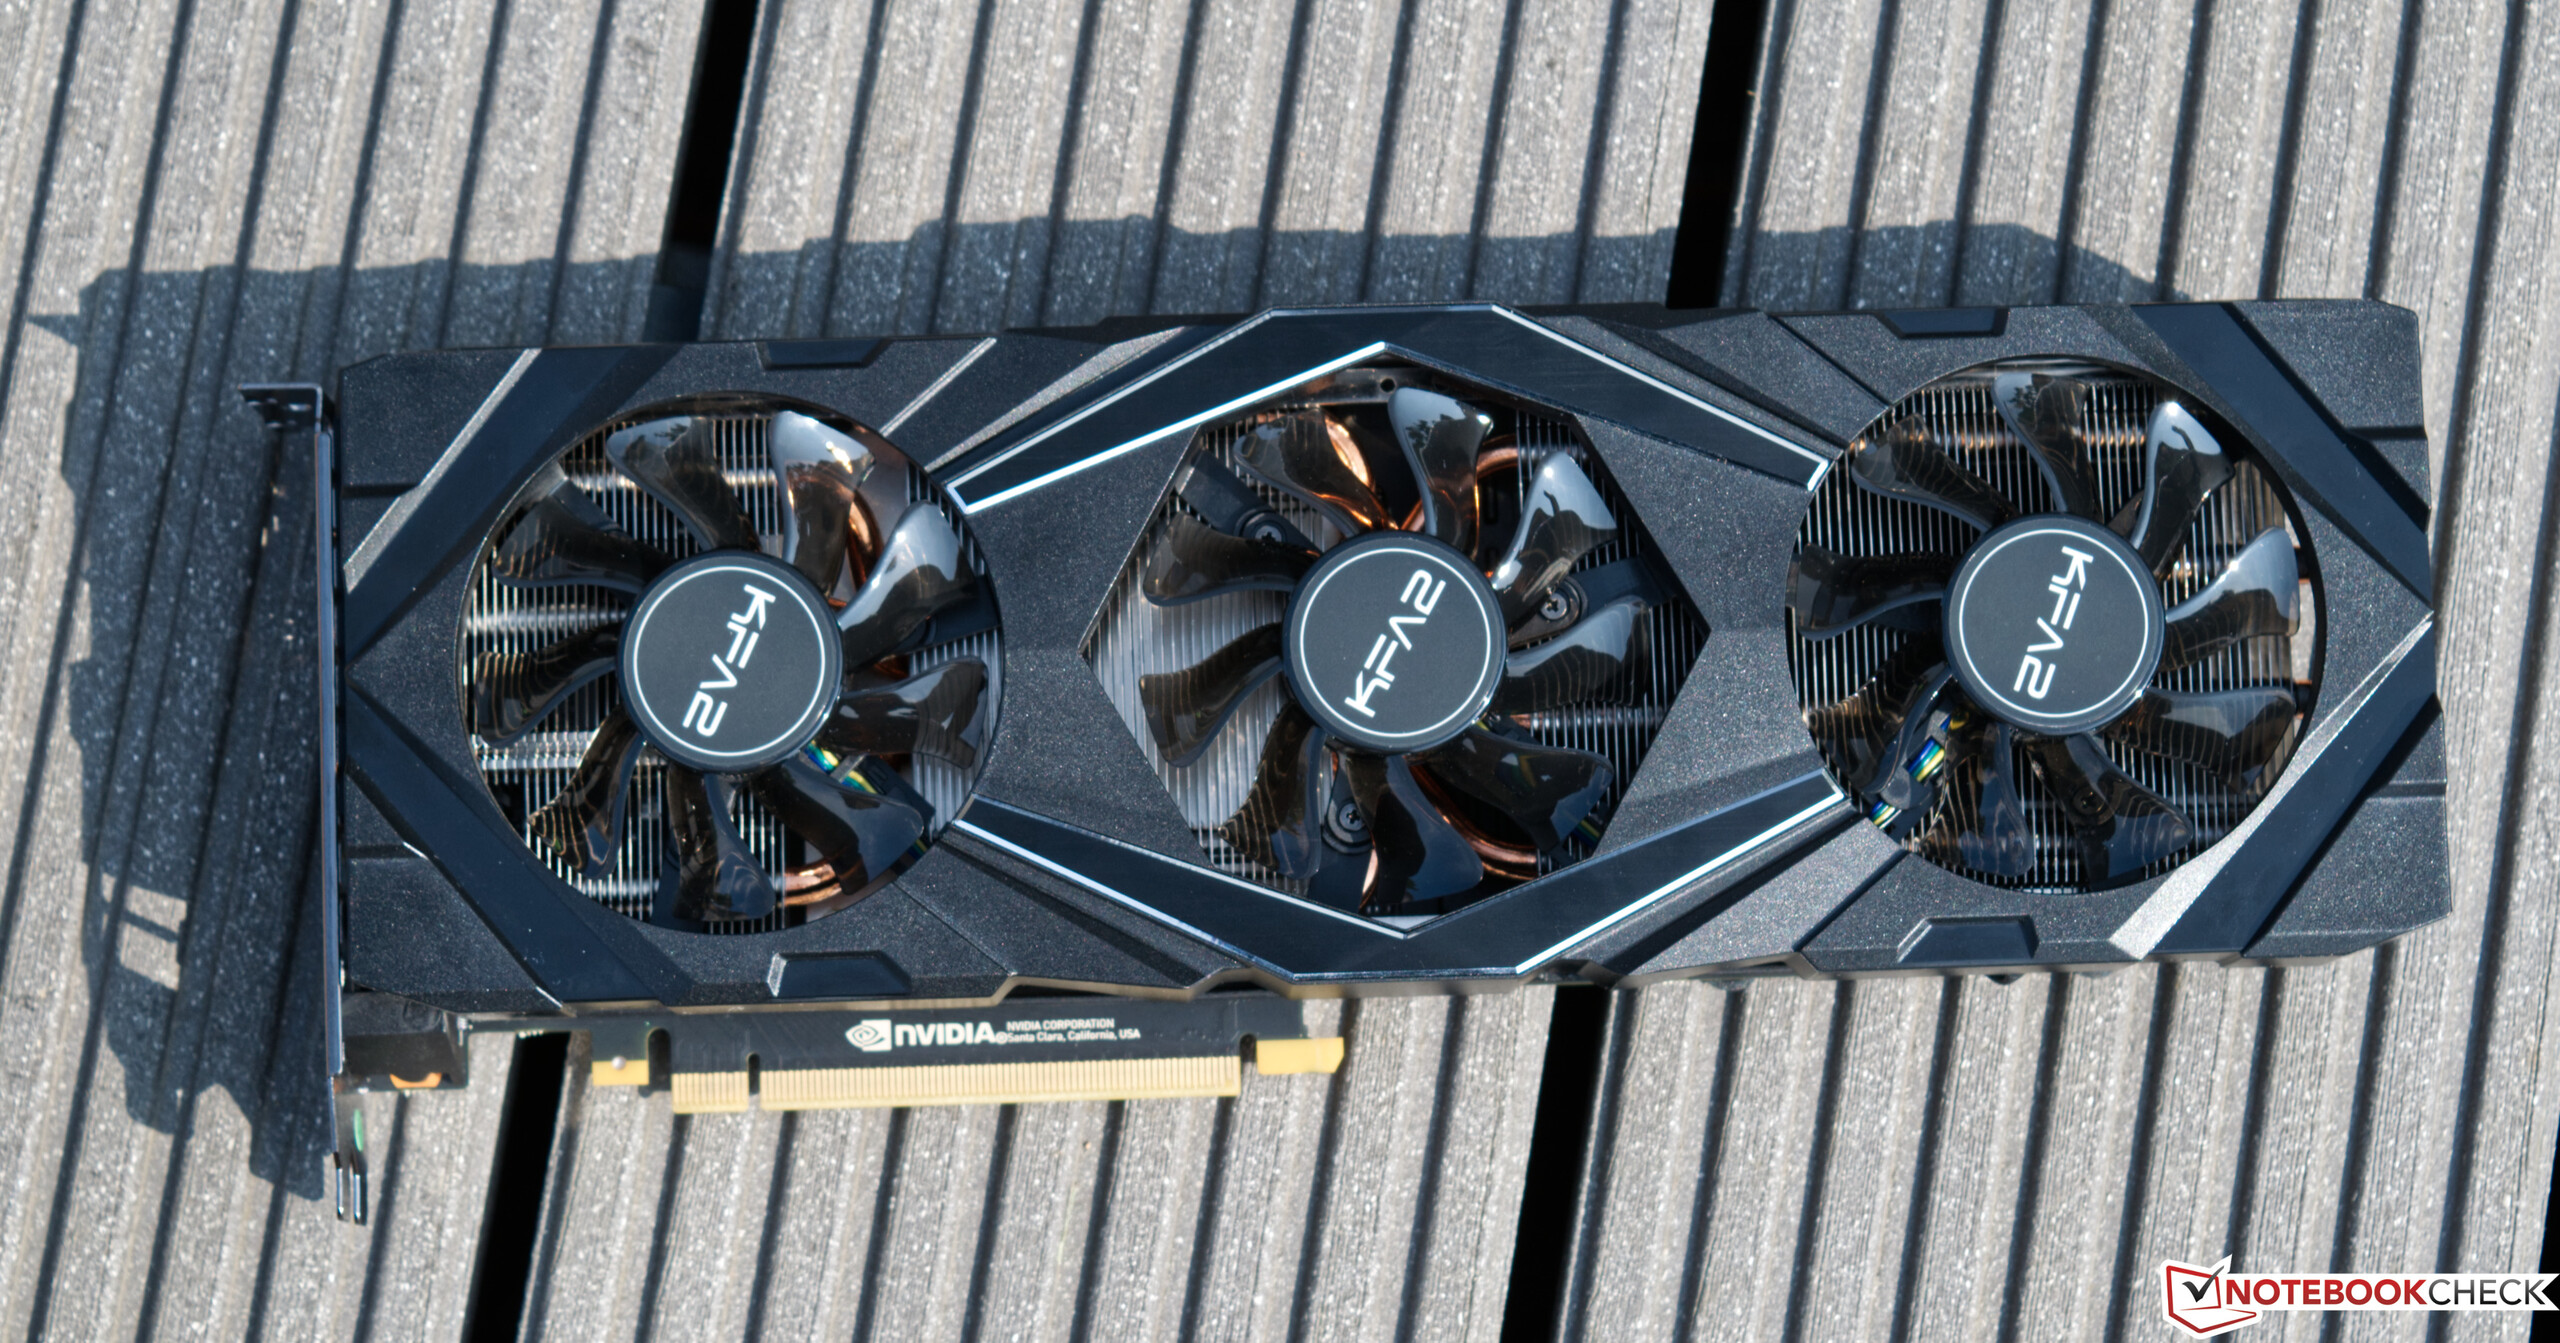
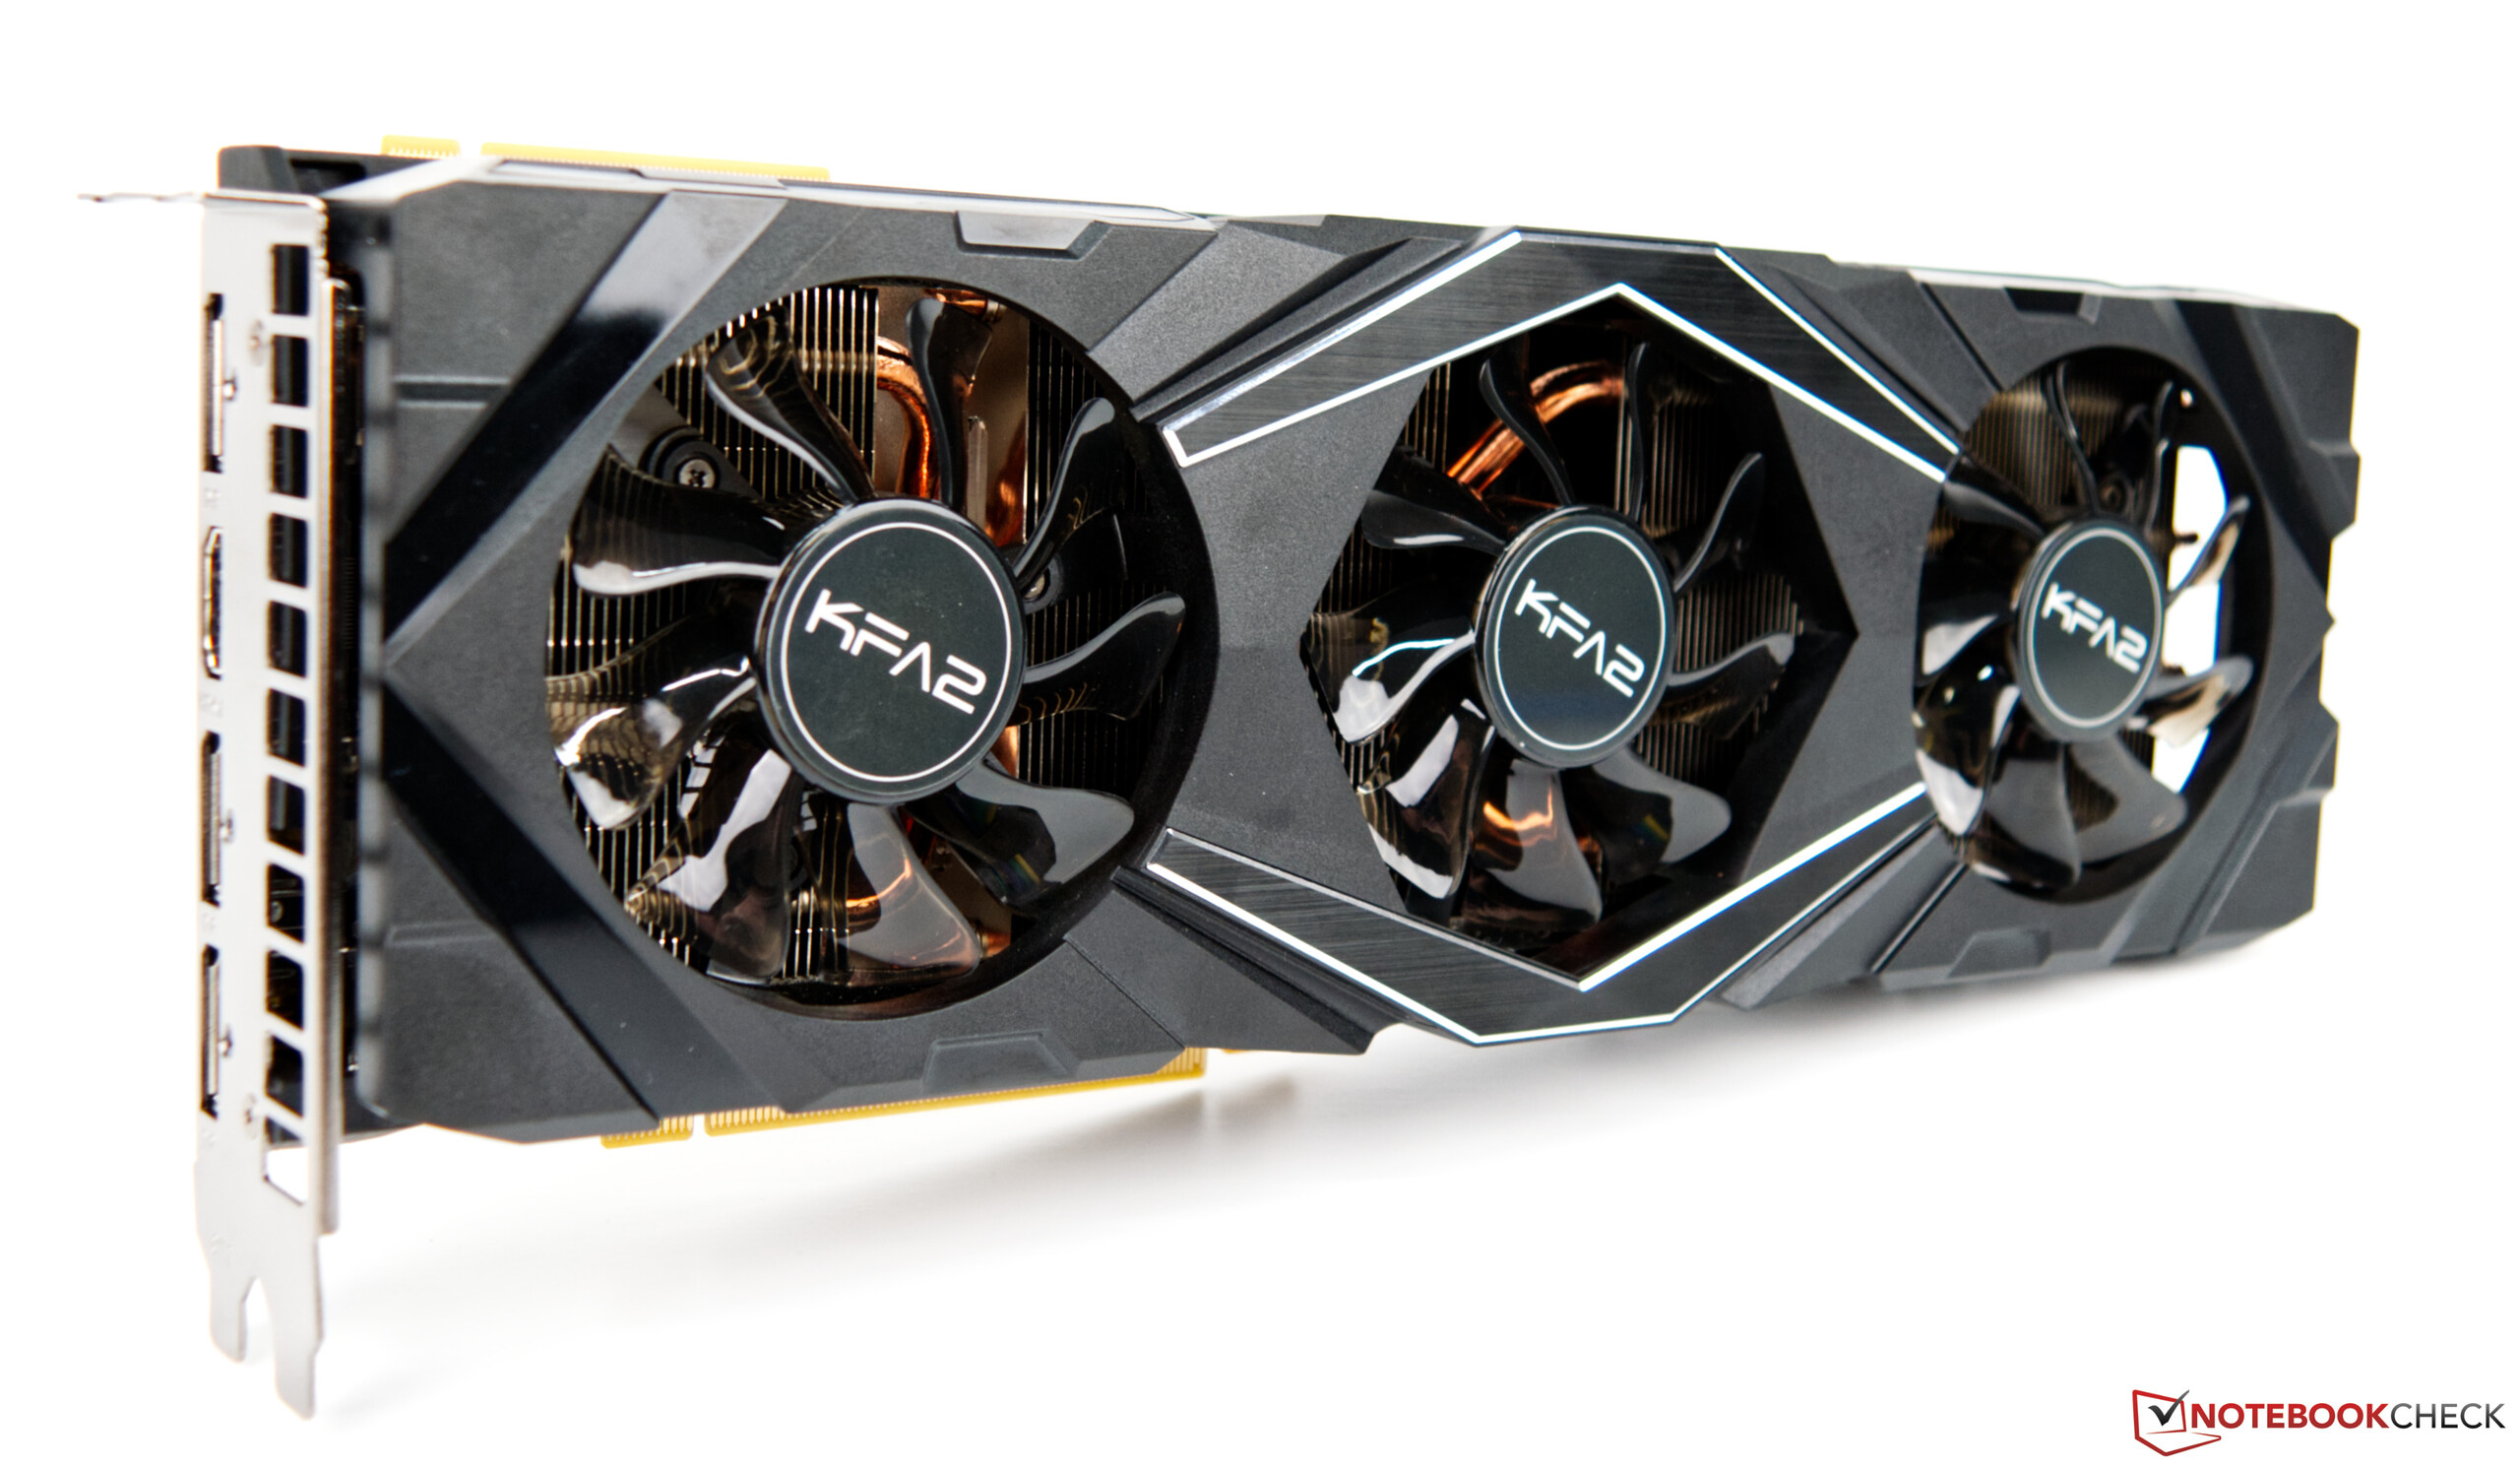
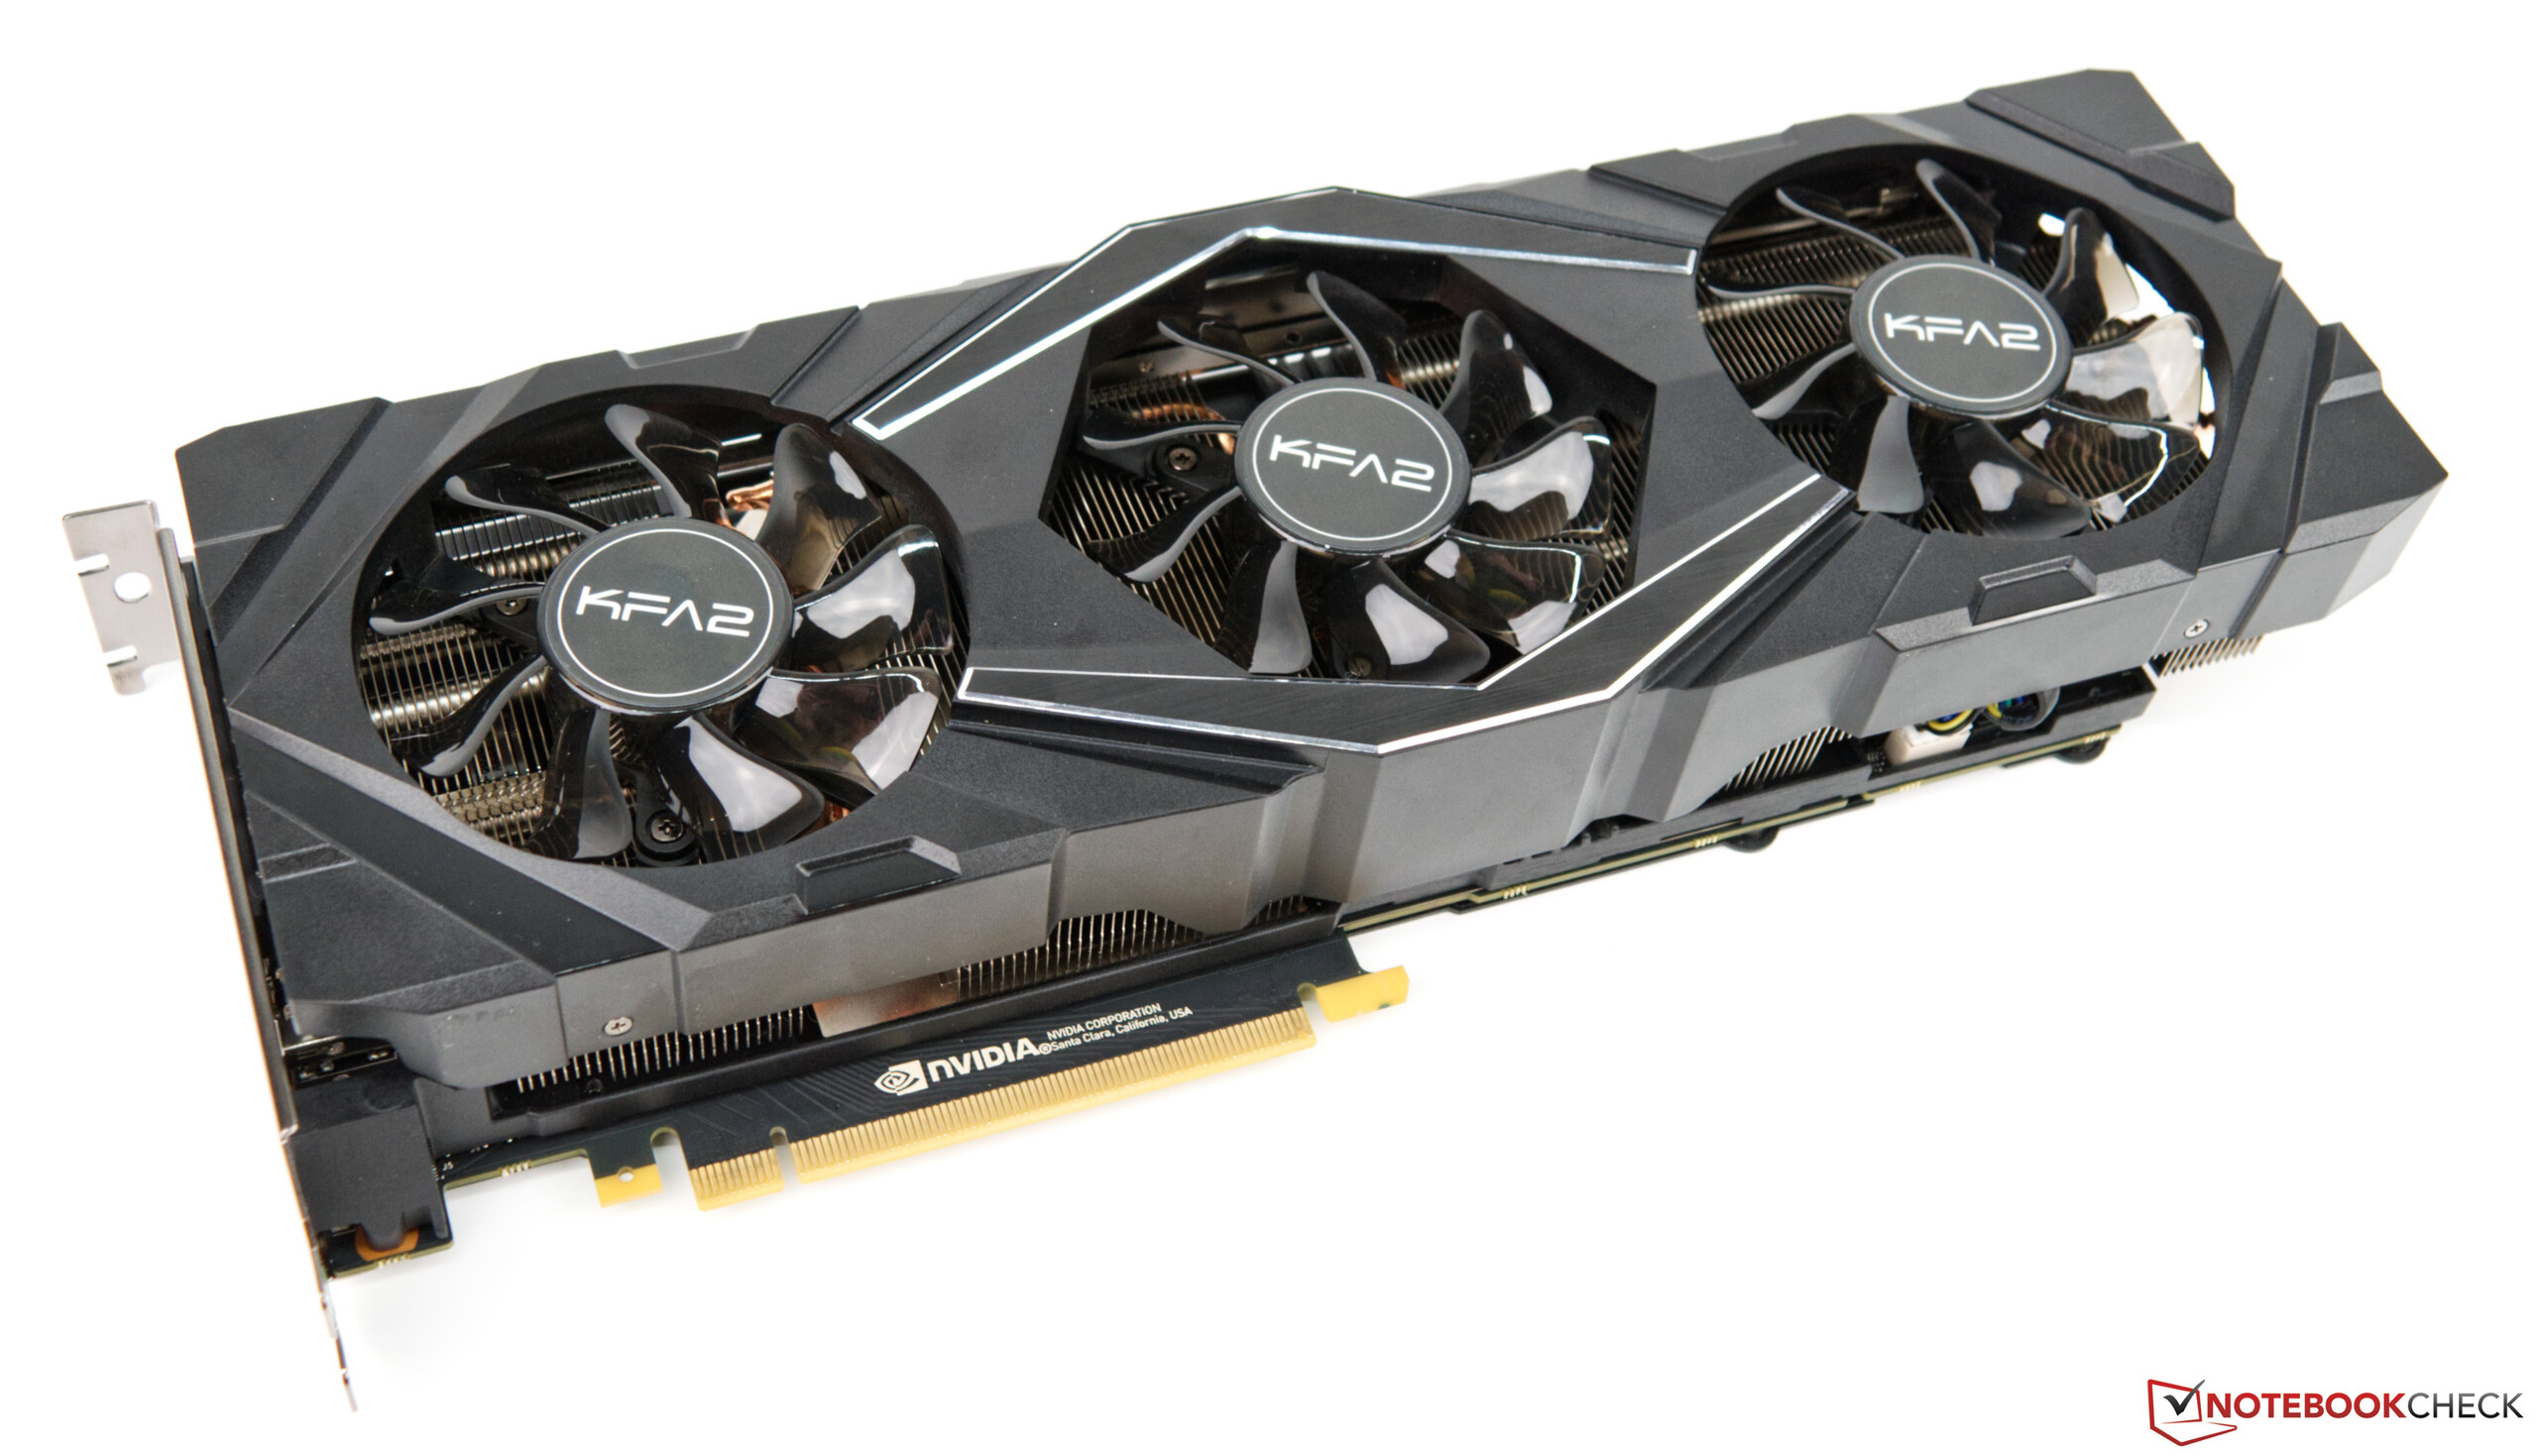
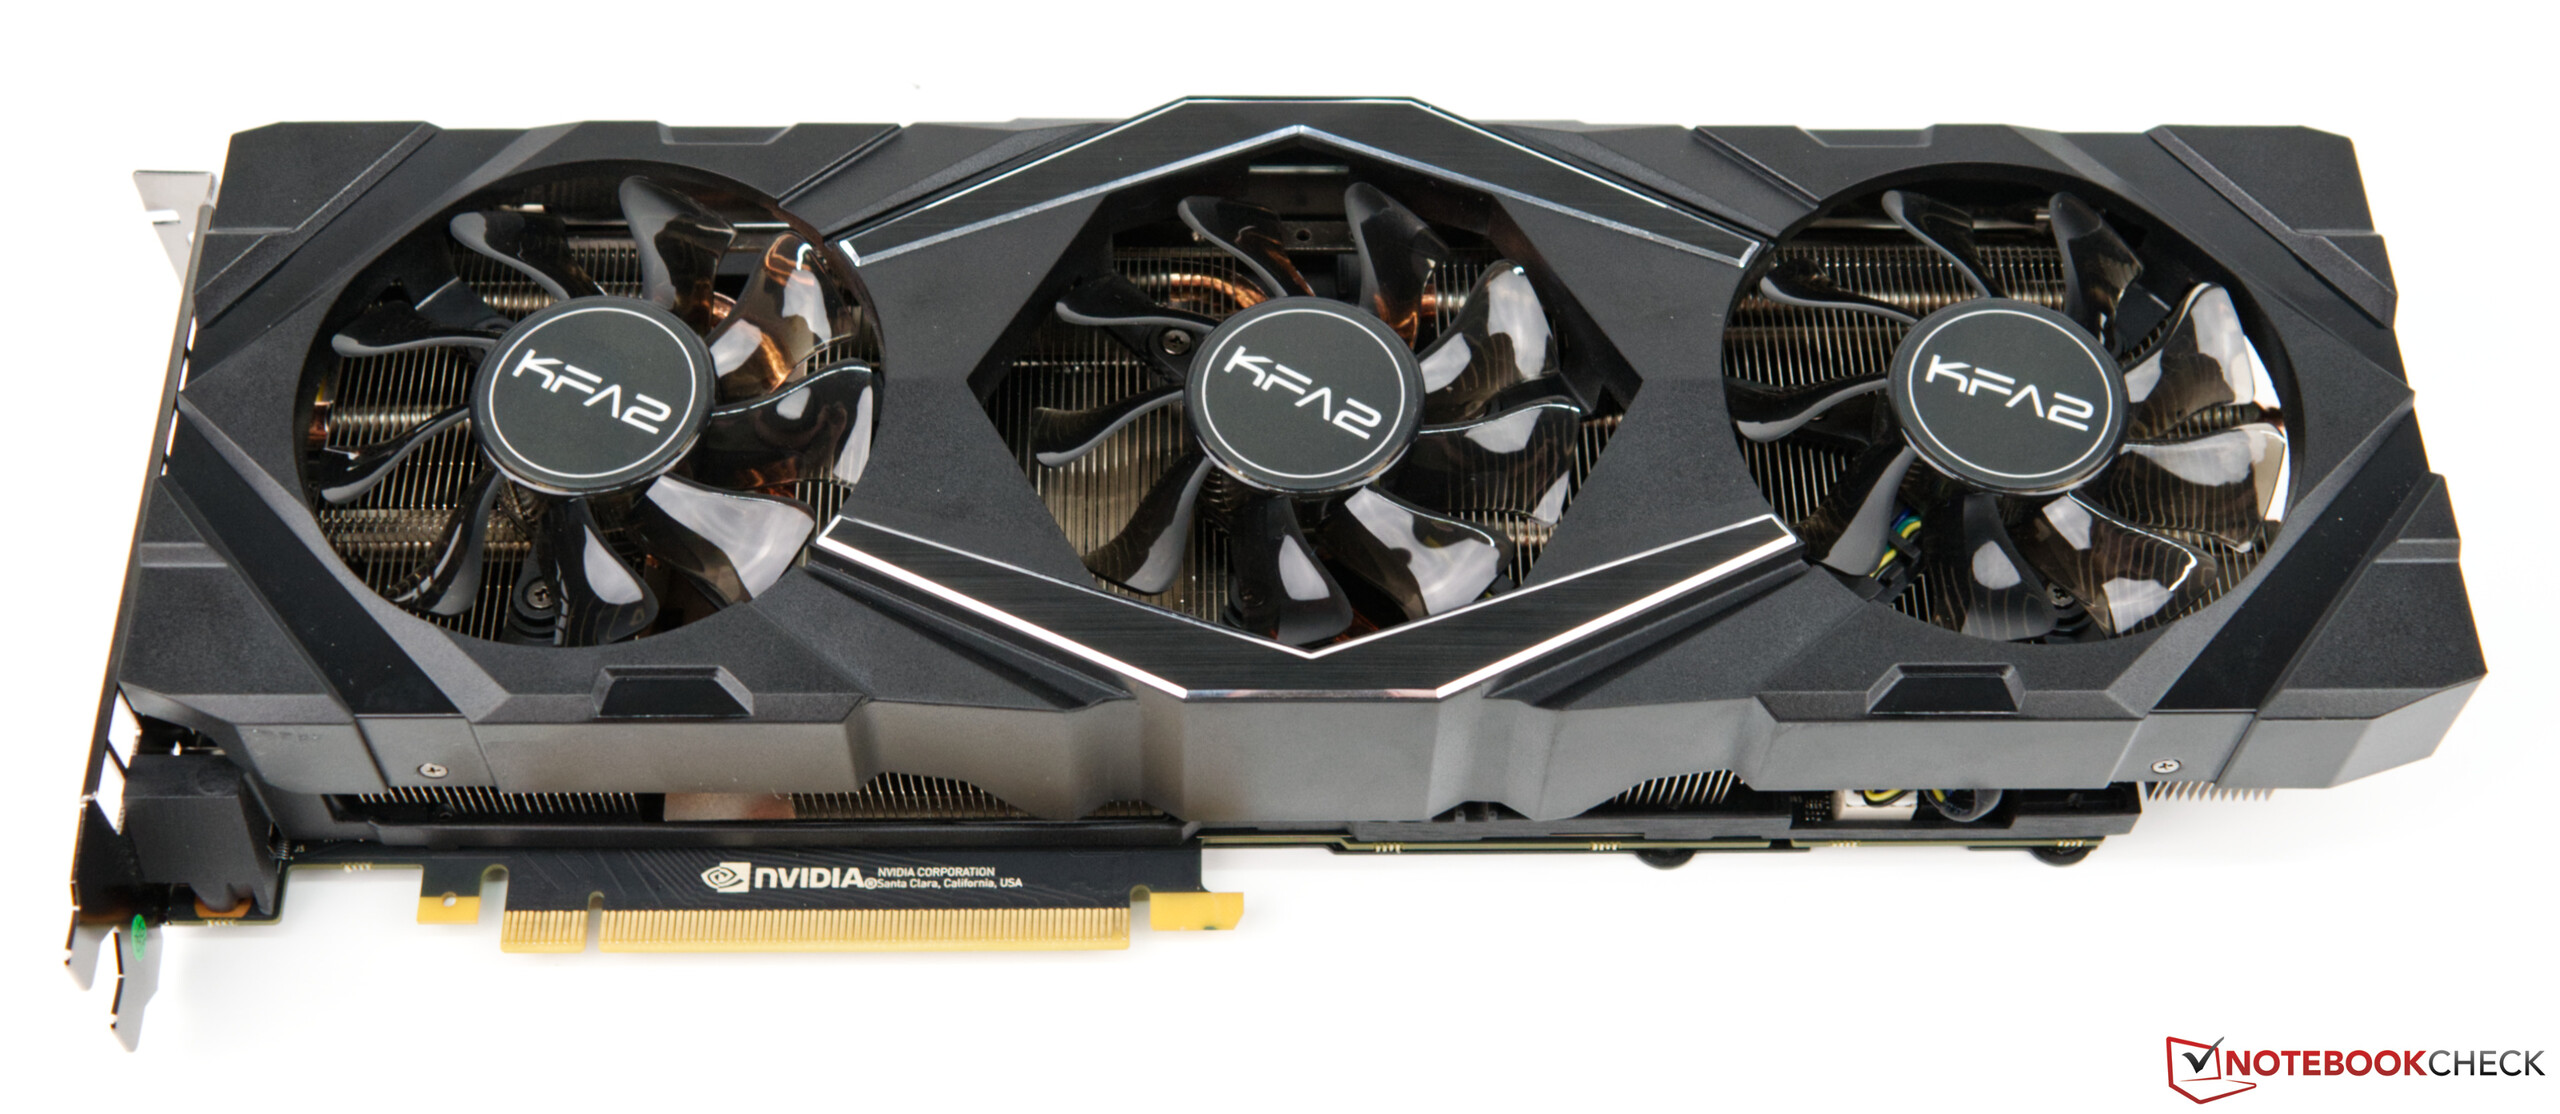
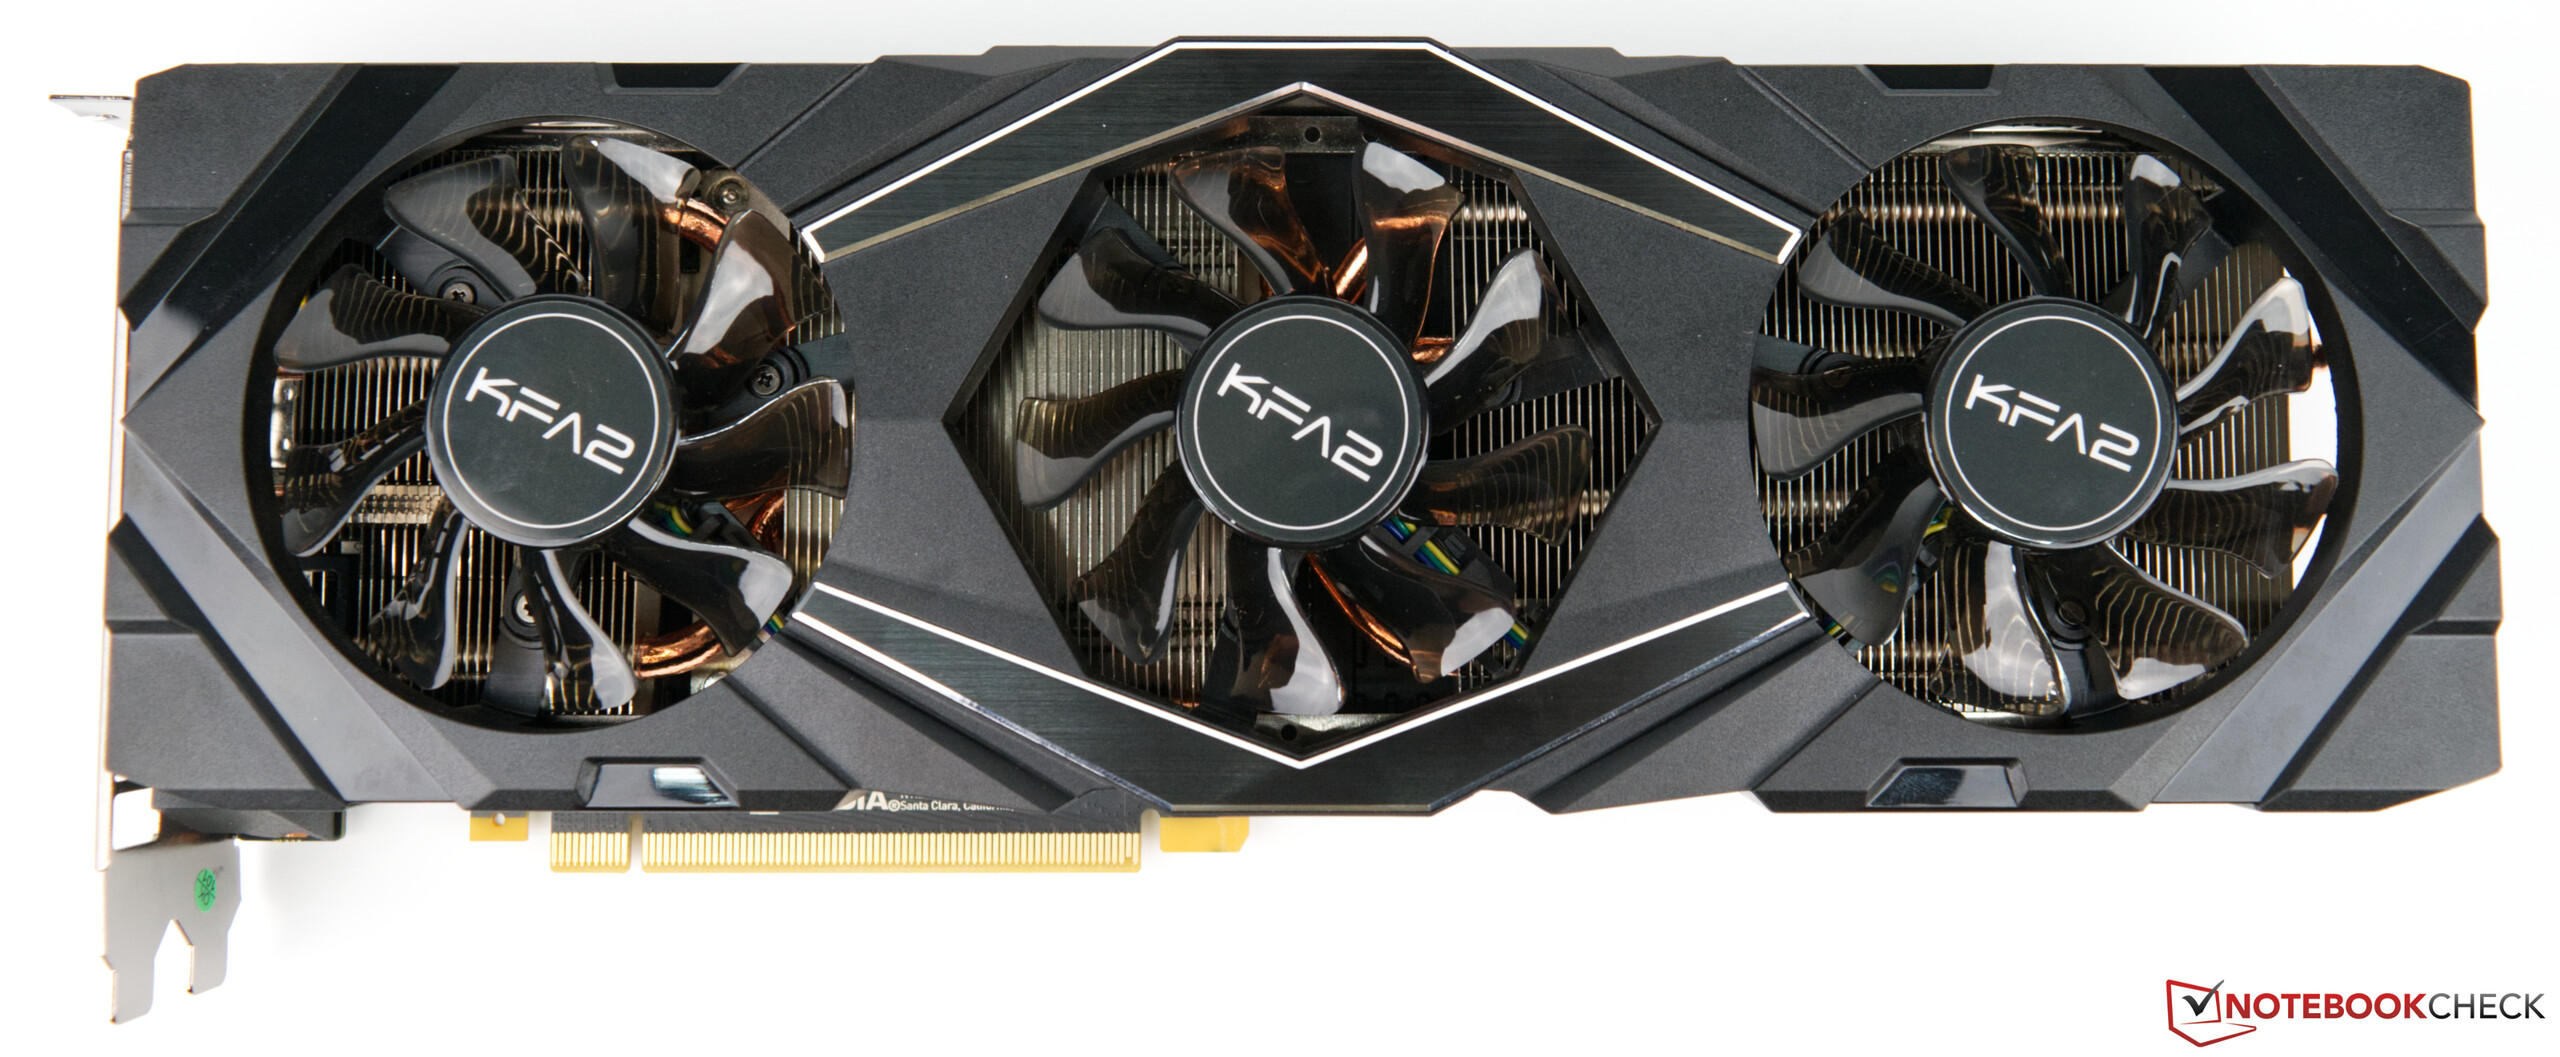
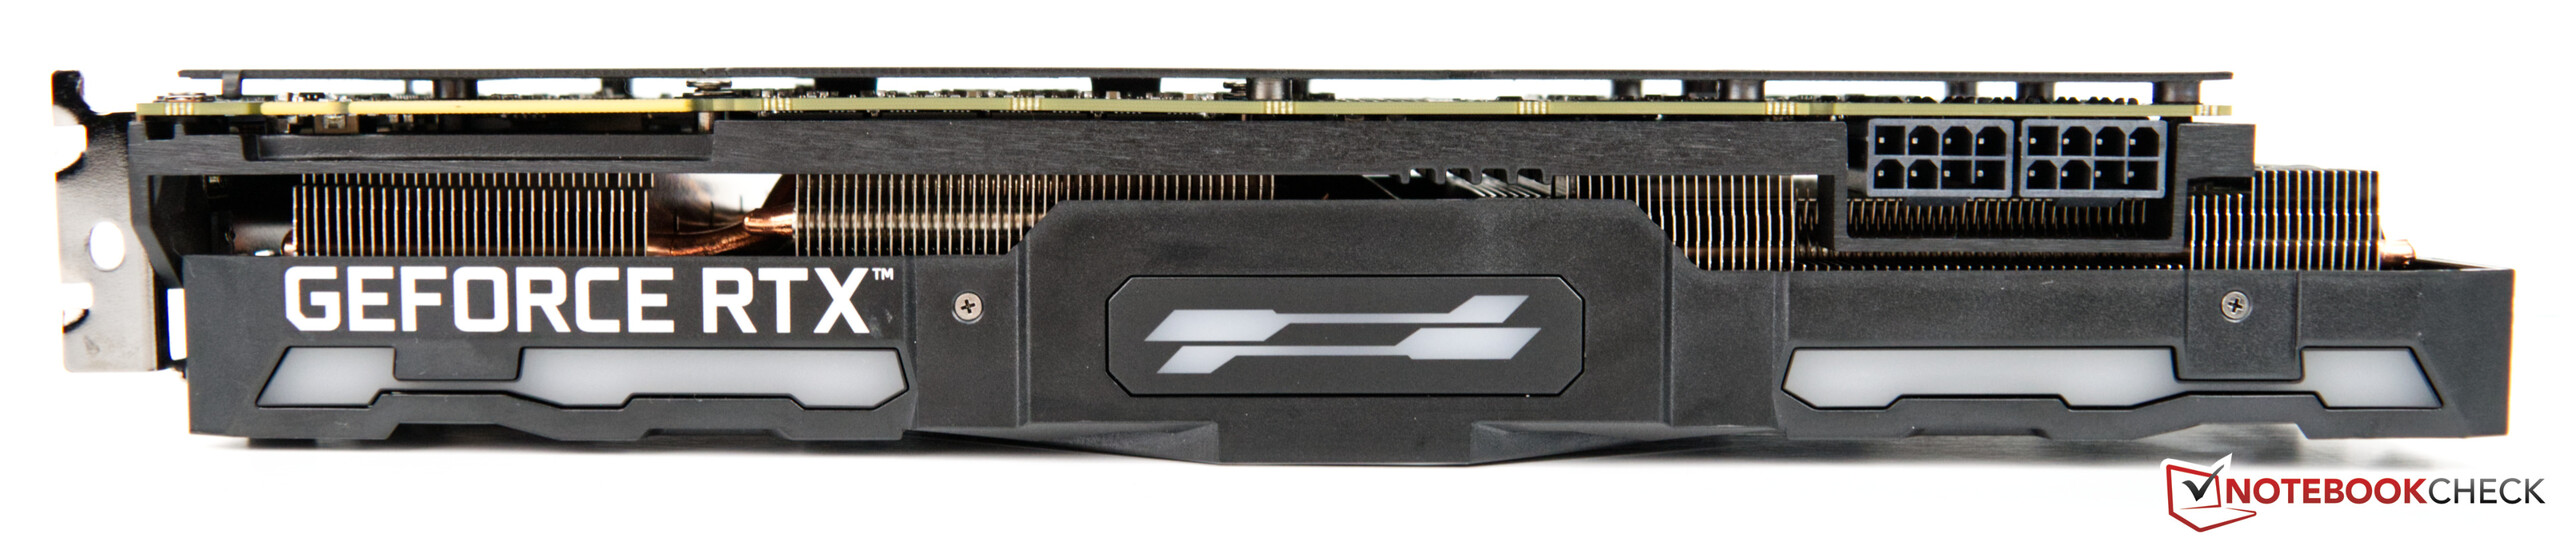
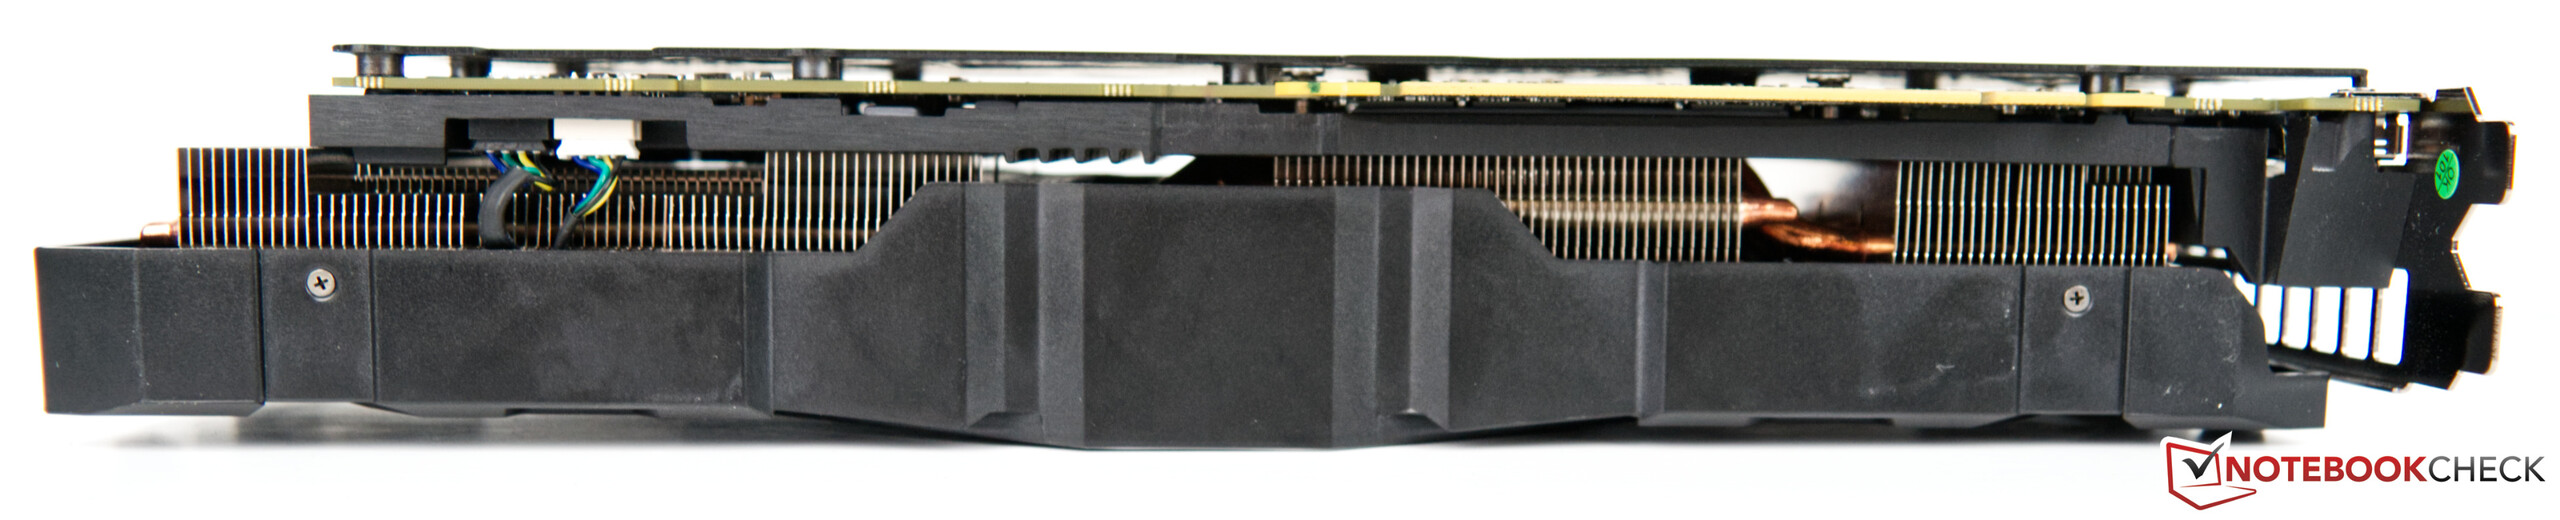
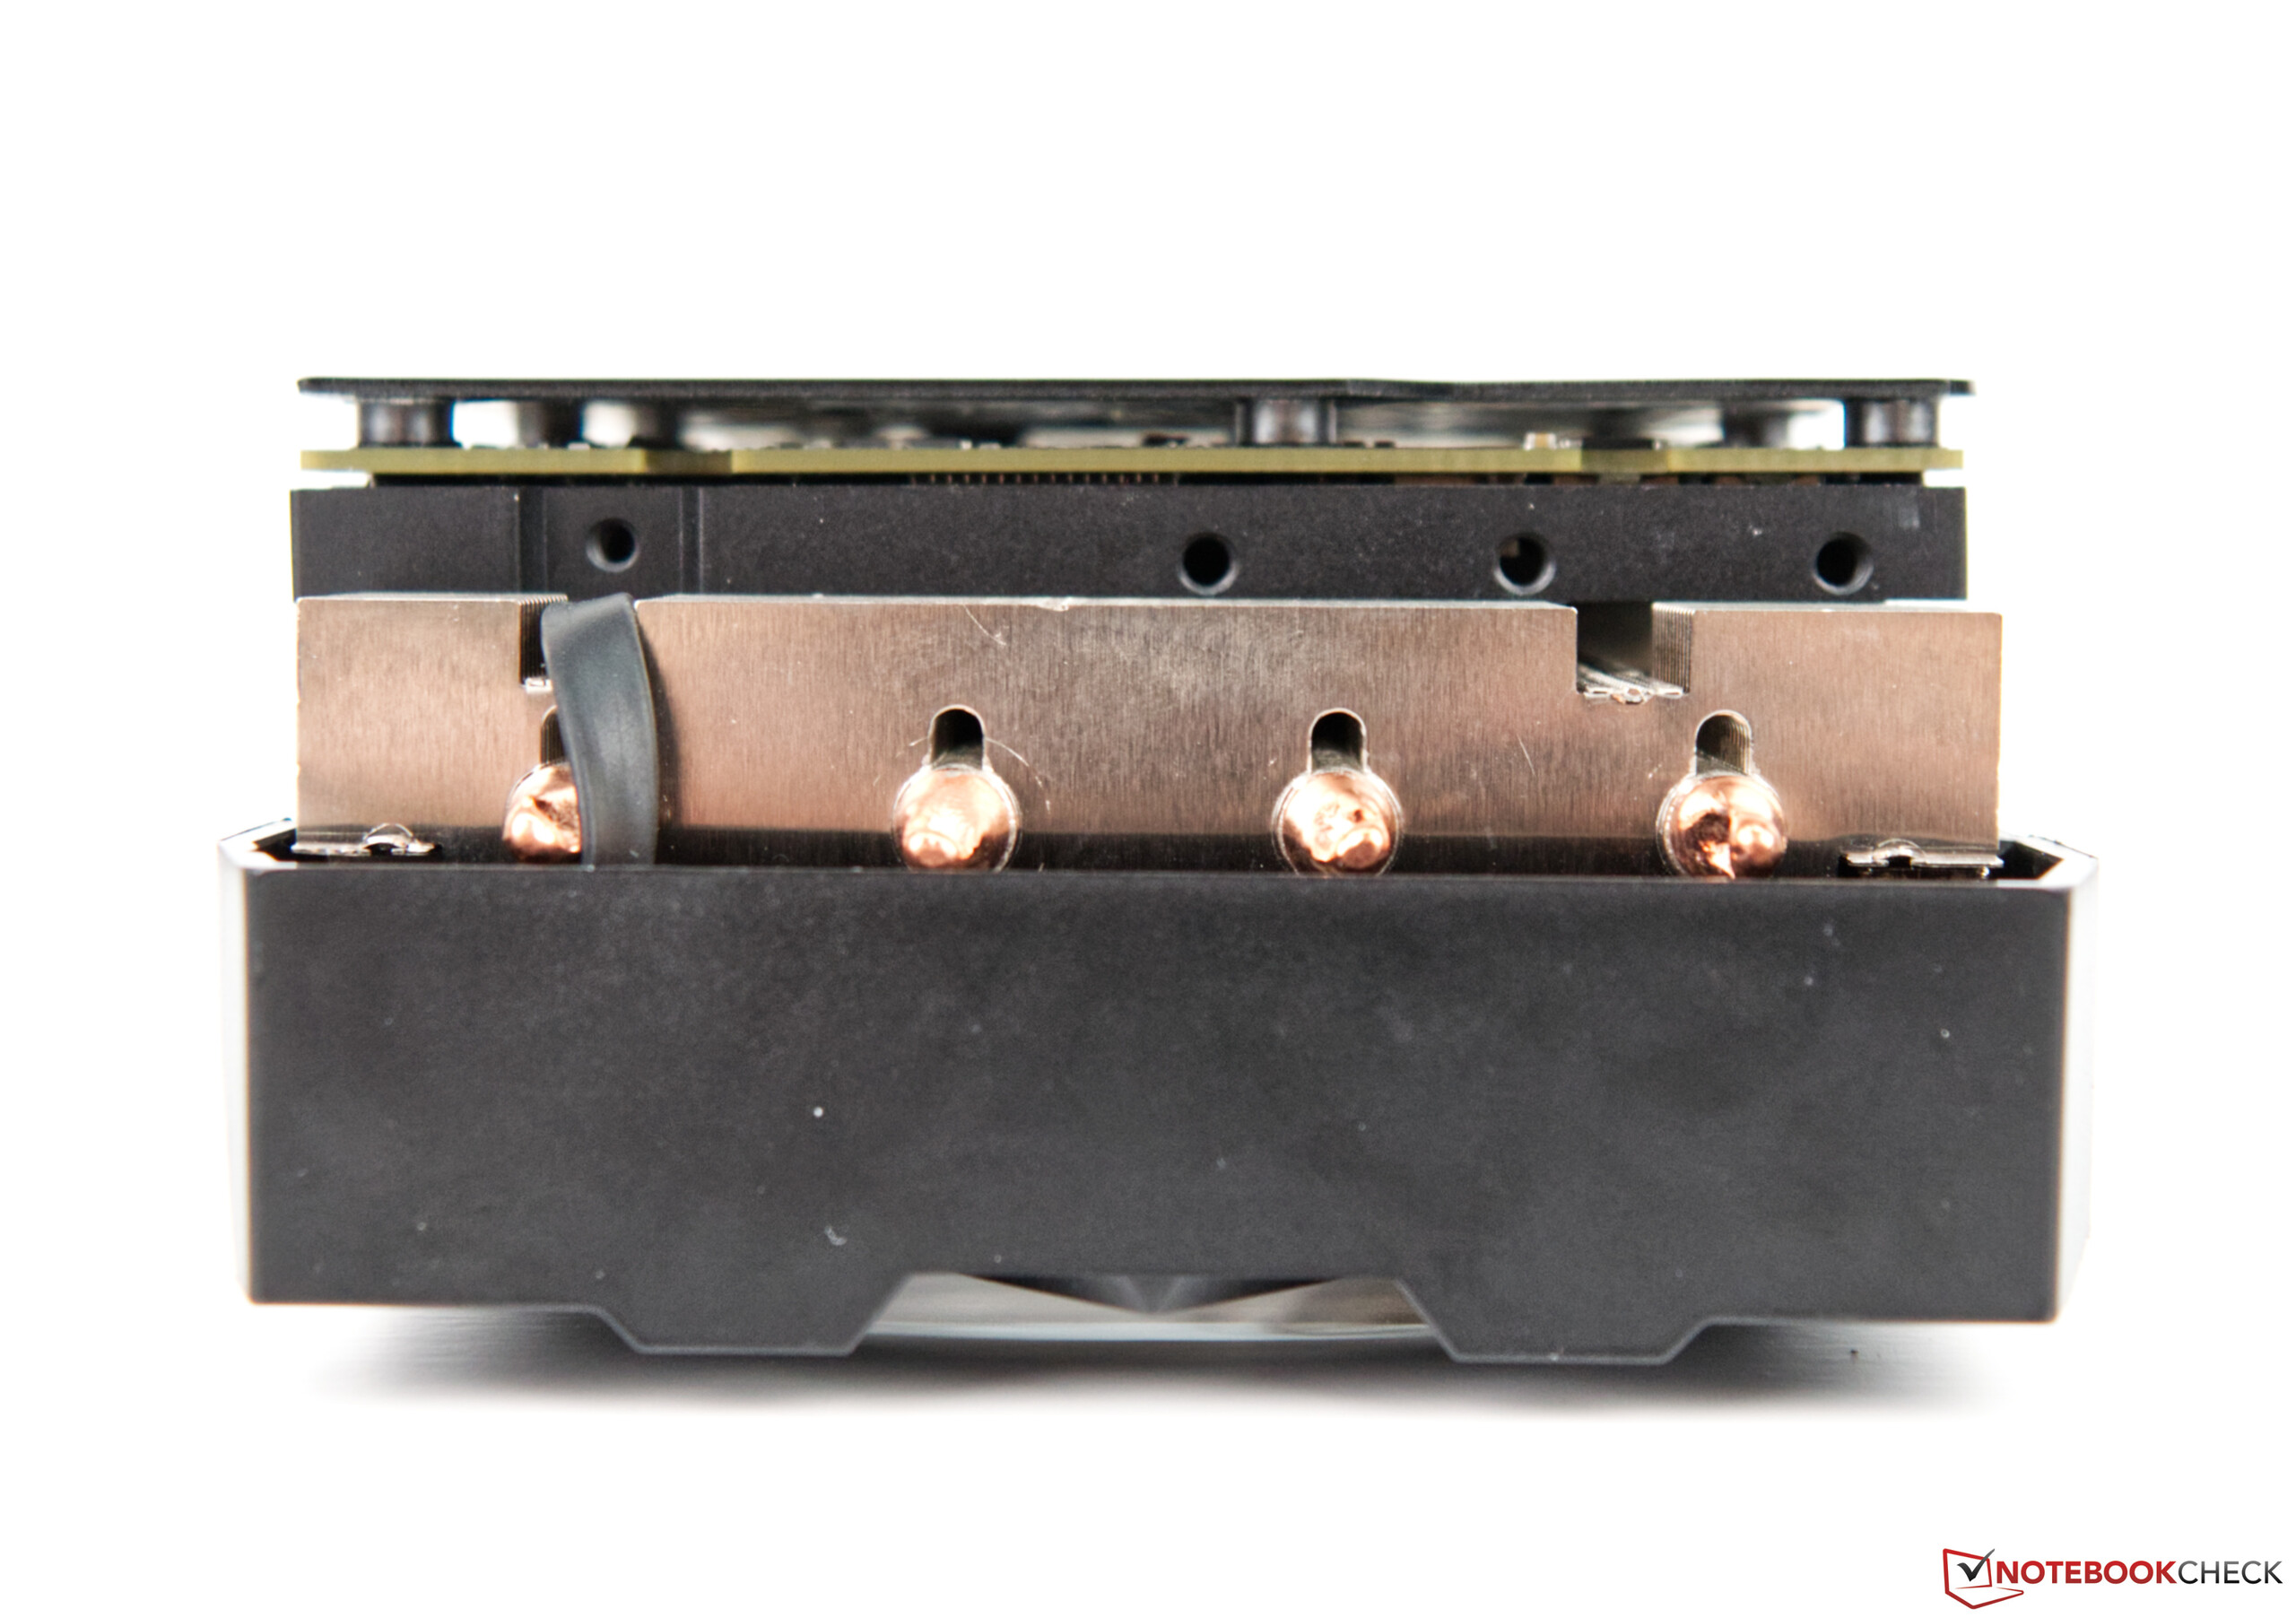
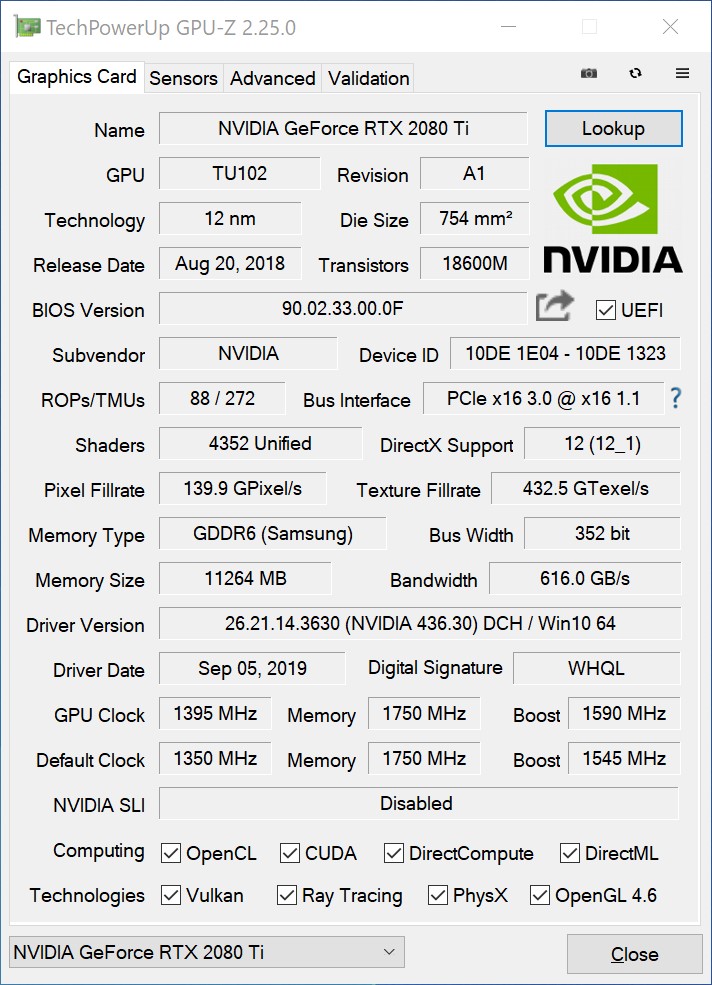
Non ci sono differenze in termini di specifiche tra il modello KFA2 e il modello di riferimento. Tuttavia, la scheda video KFA2 ha un aspetto diverso, perché presenta una soluzione di raffreddamento personalizzato più potente con tre ventole assiali. La scheda grafica KFA2 utilizza la scheda di riferimento, motivo per cui non dovrebbero esserci problemi di compatibilità se si decide di raffreddare ad acqua la GPU. Tuttavia, è necessario assicurarsi che la propria GPU soddisfi i requisiti per il raffreddamento ad acqua prima di procedere all'acquisto.
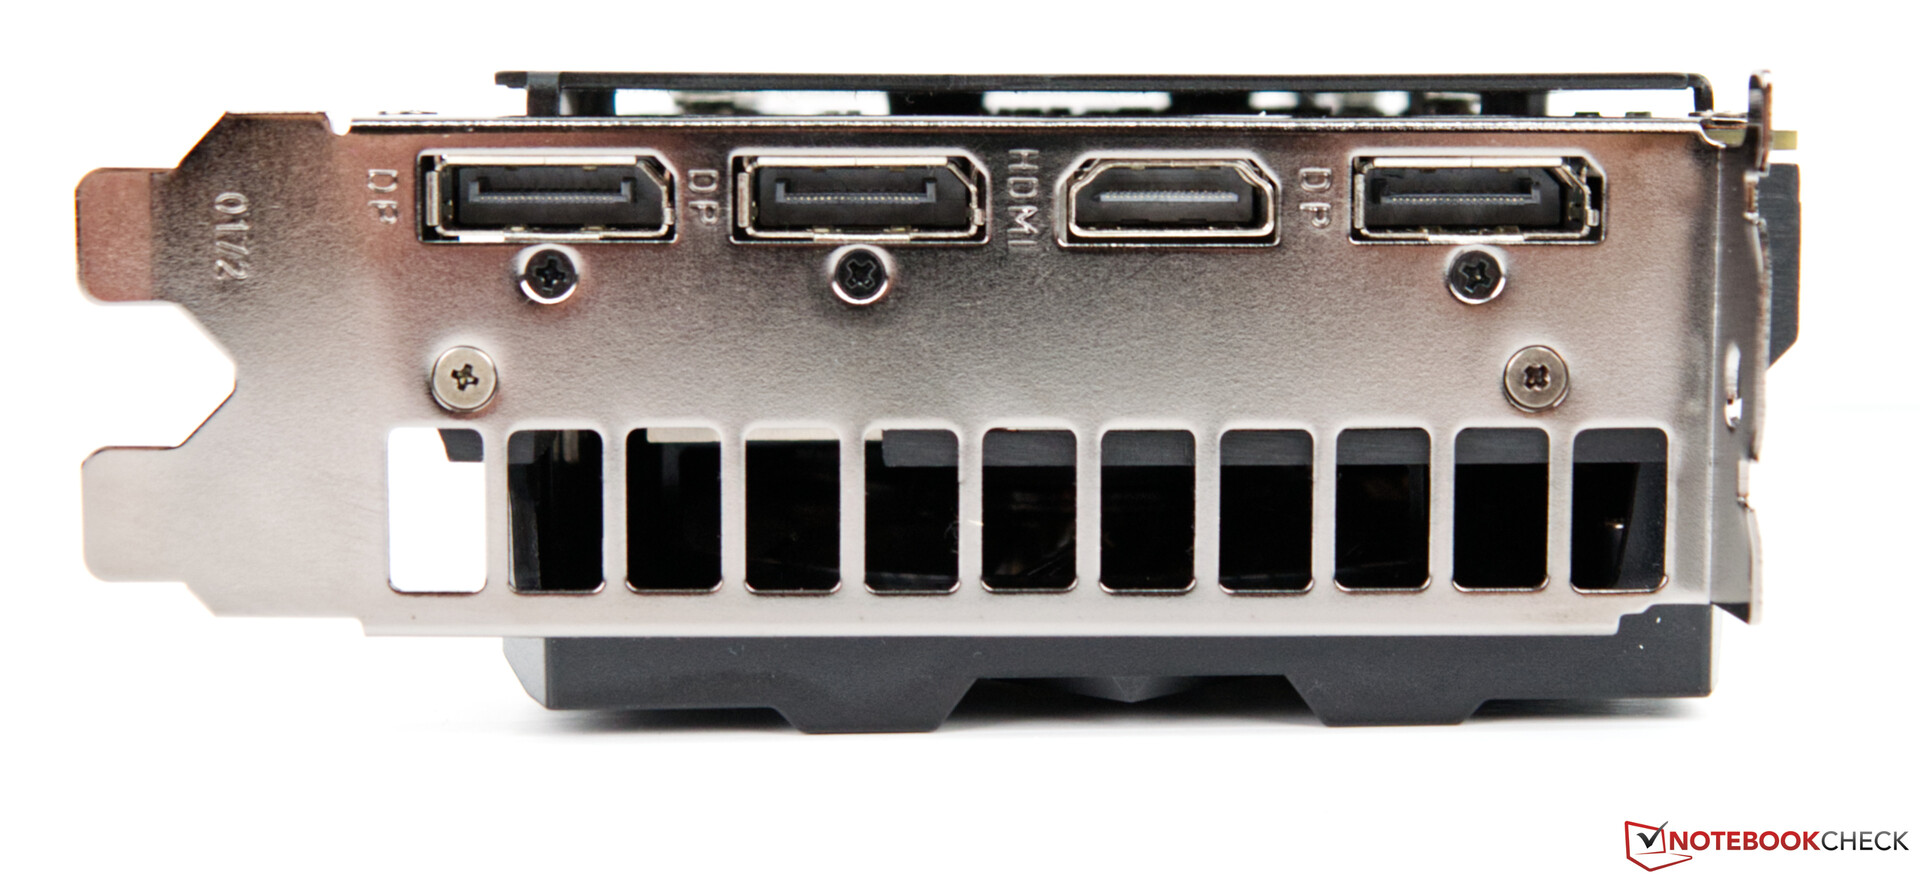
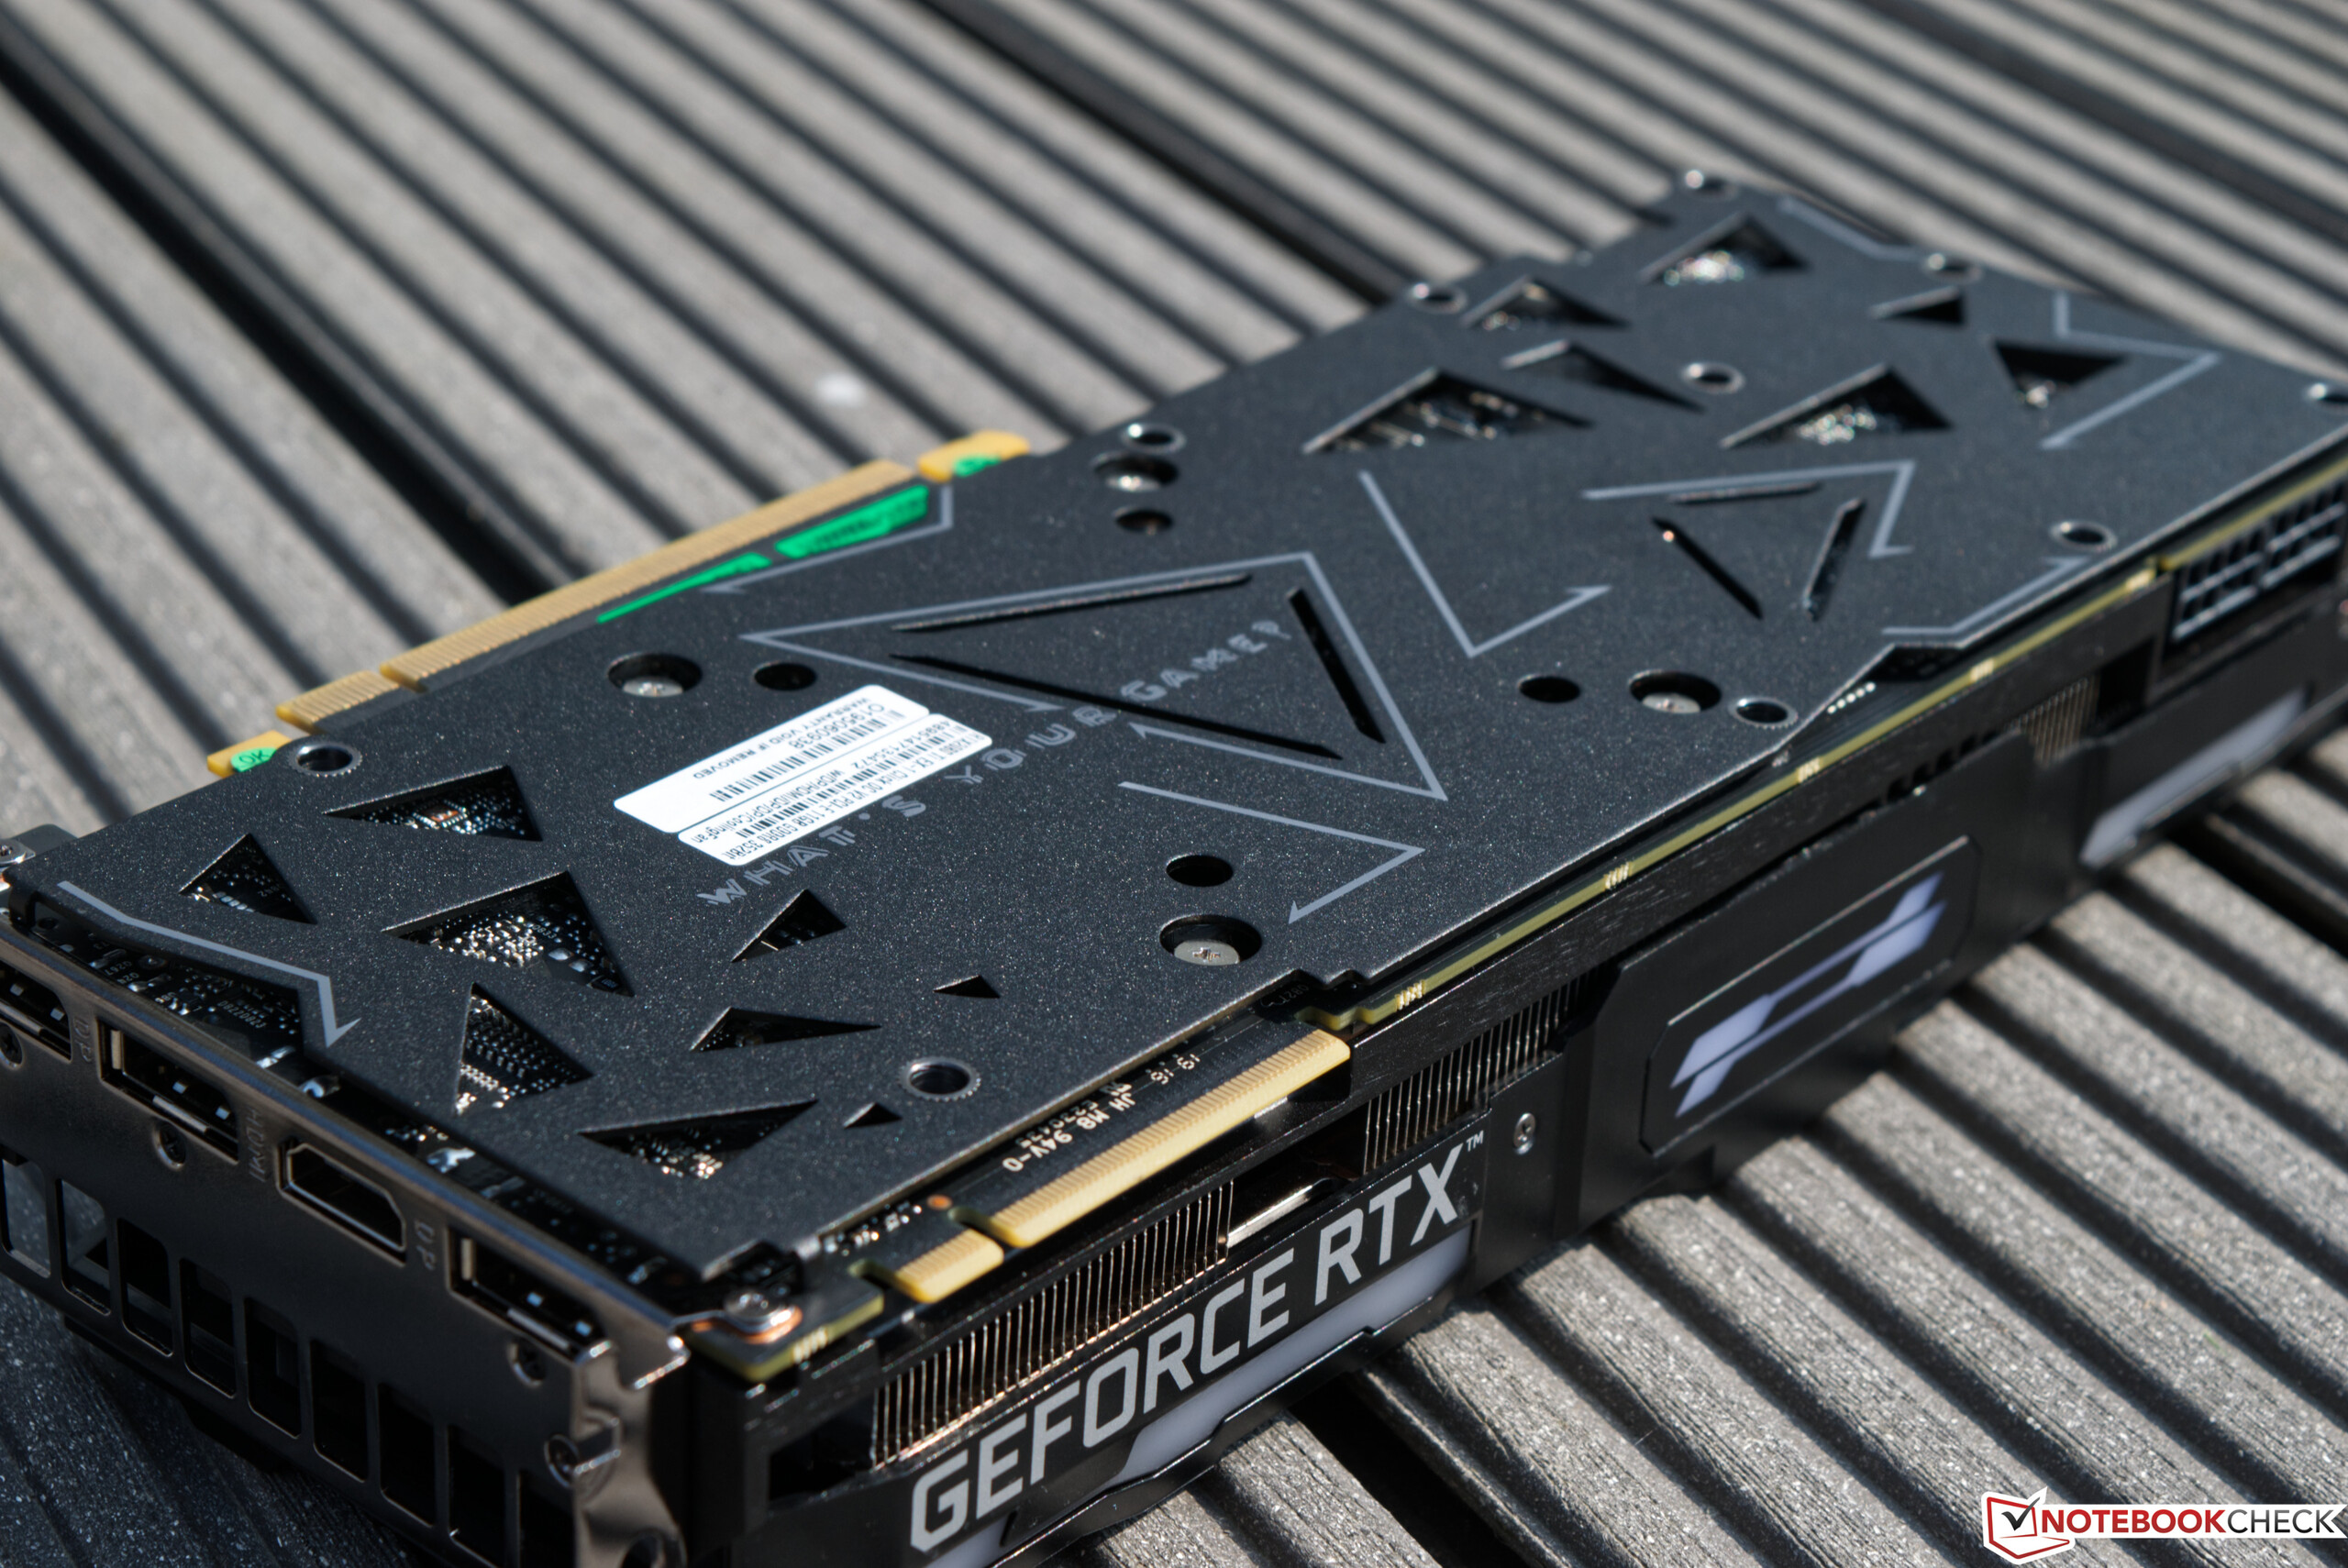
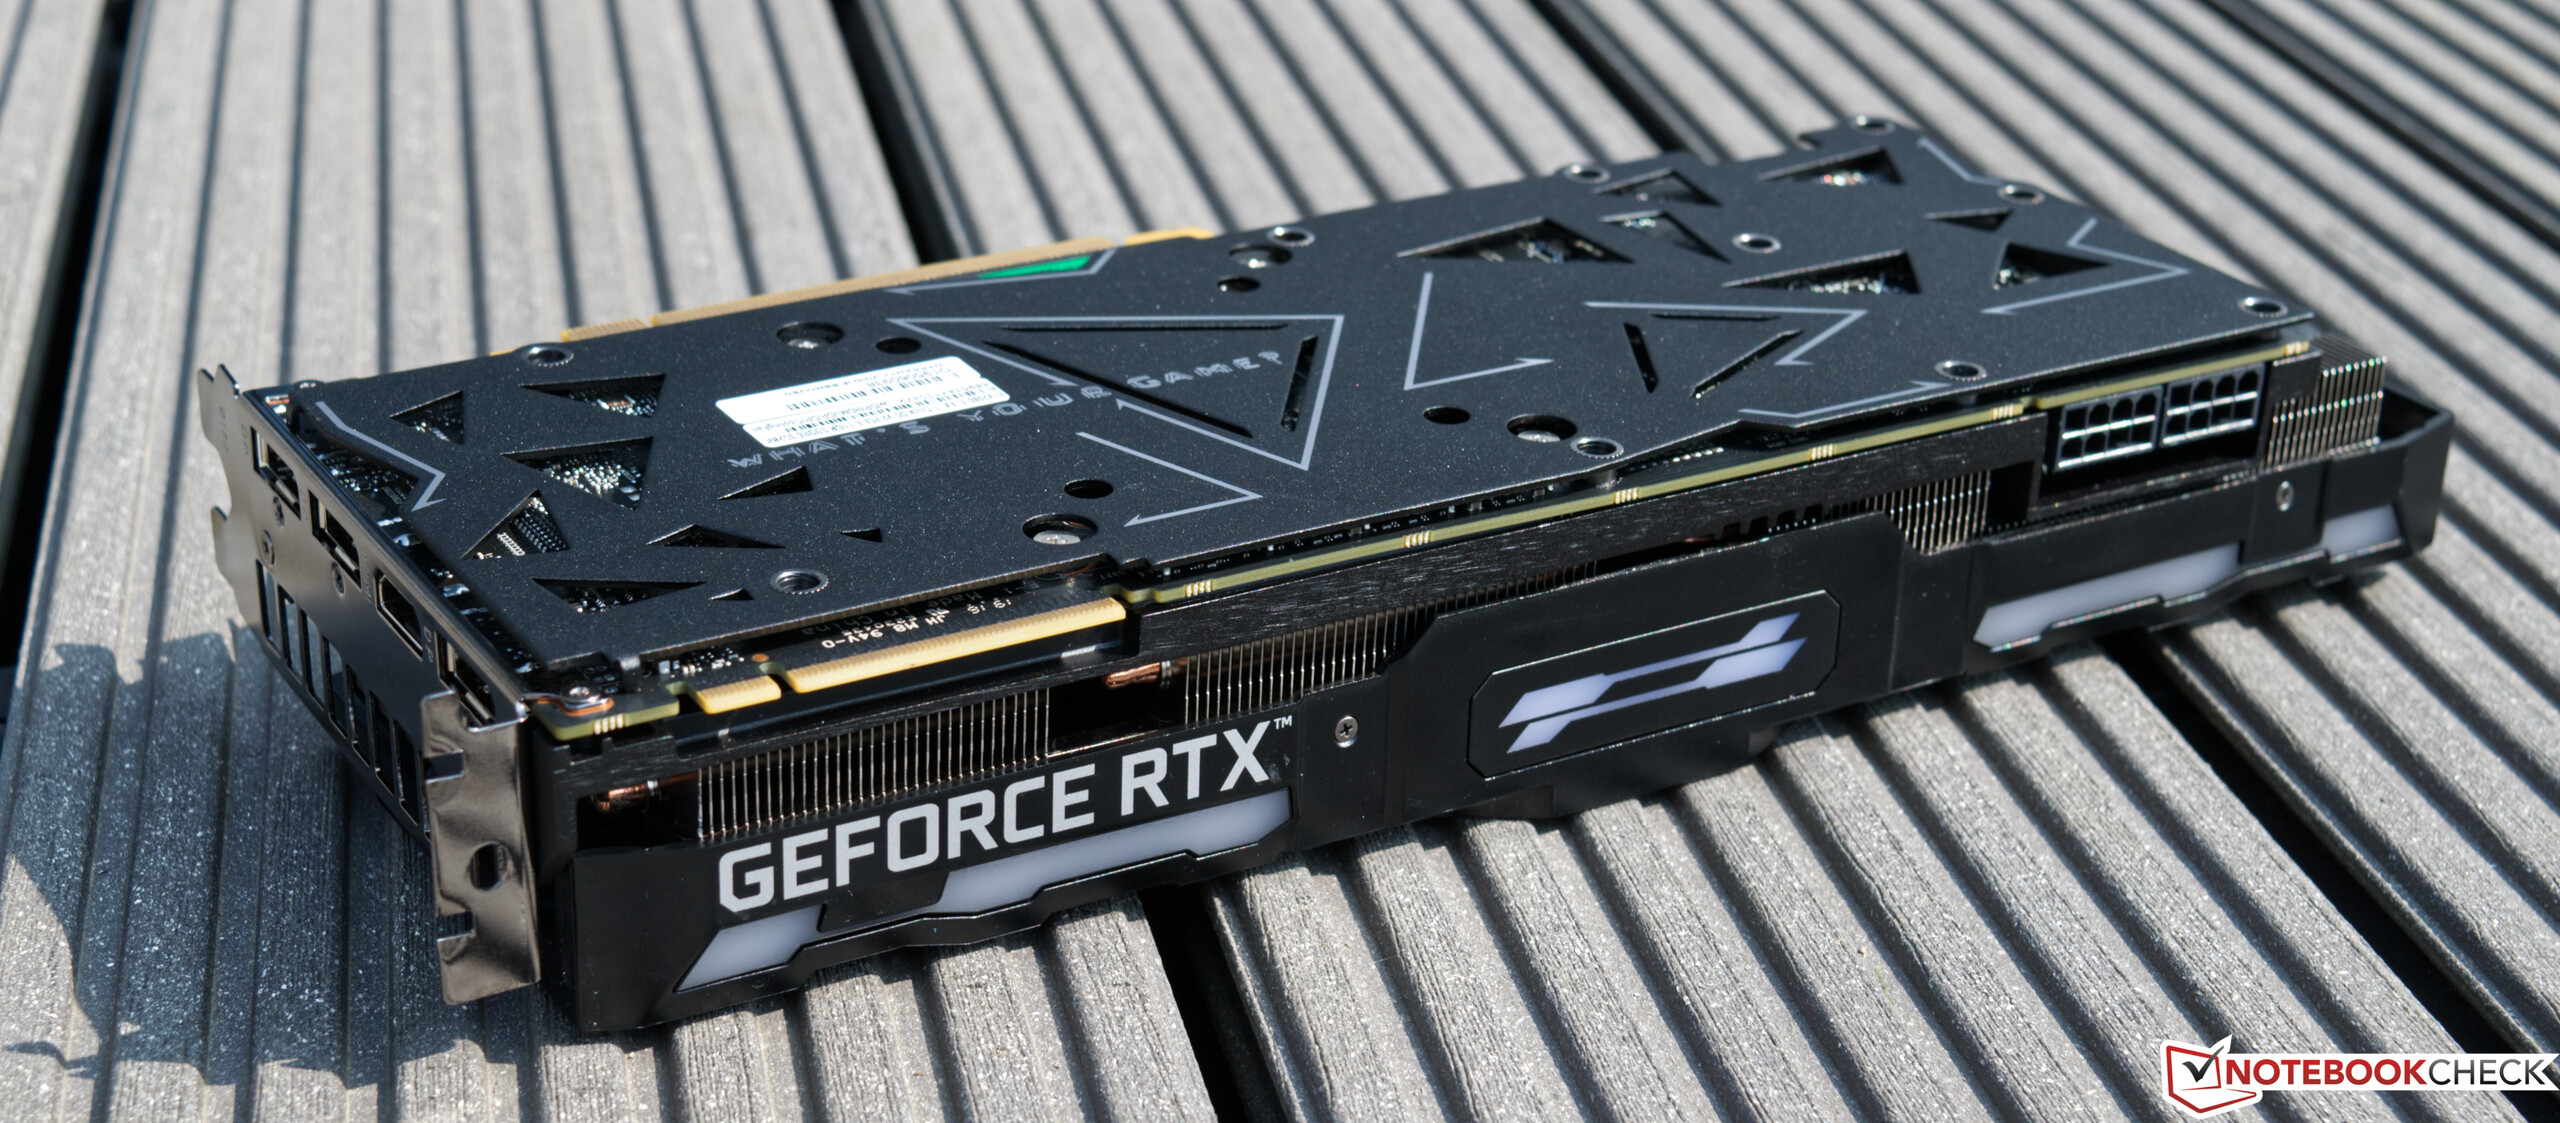
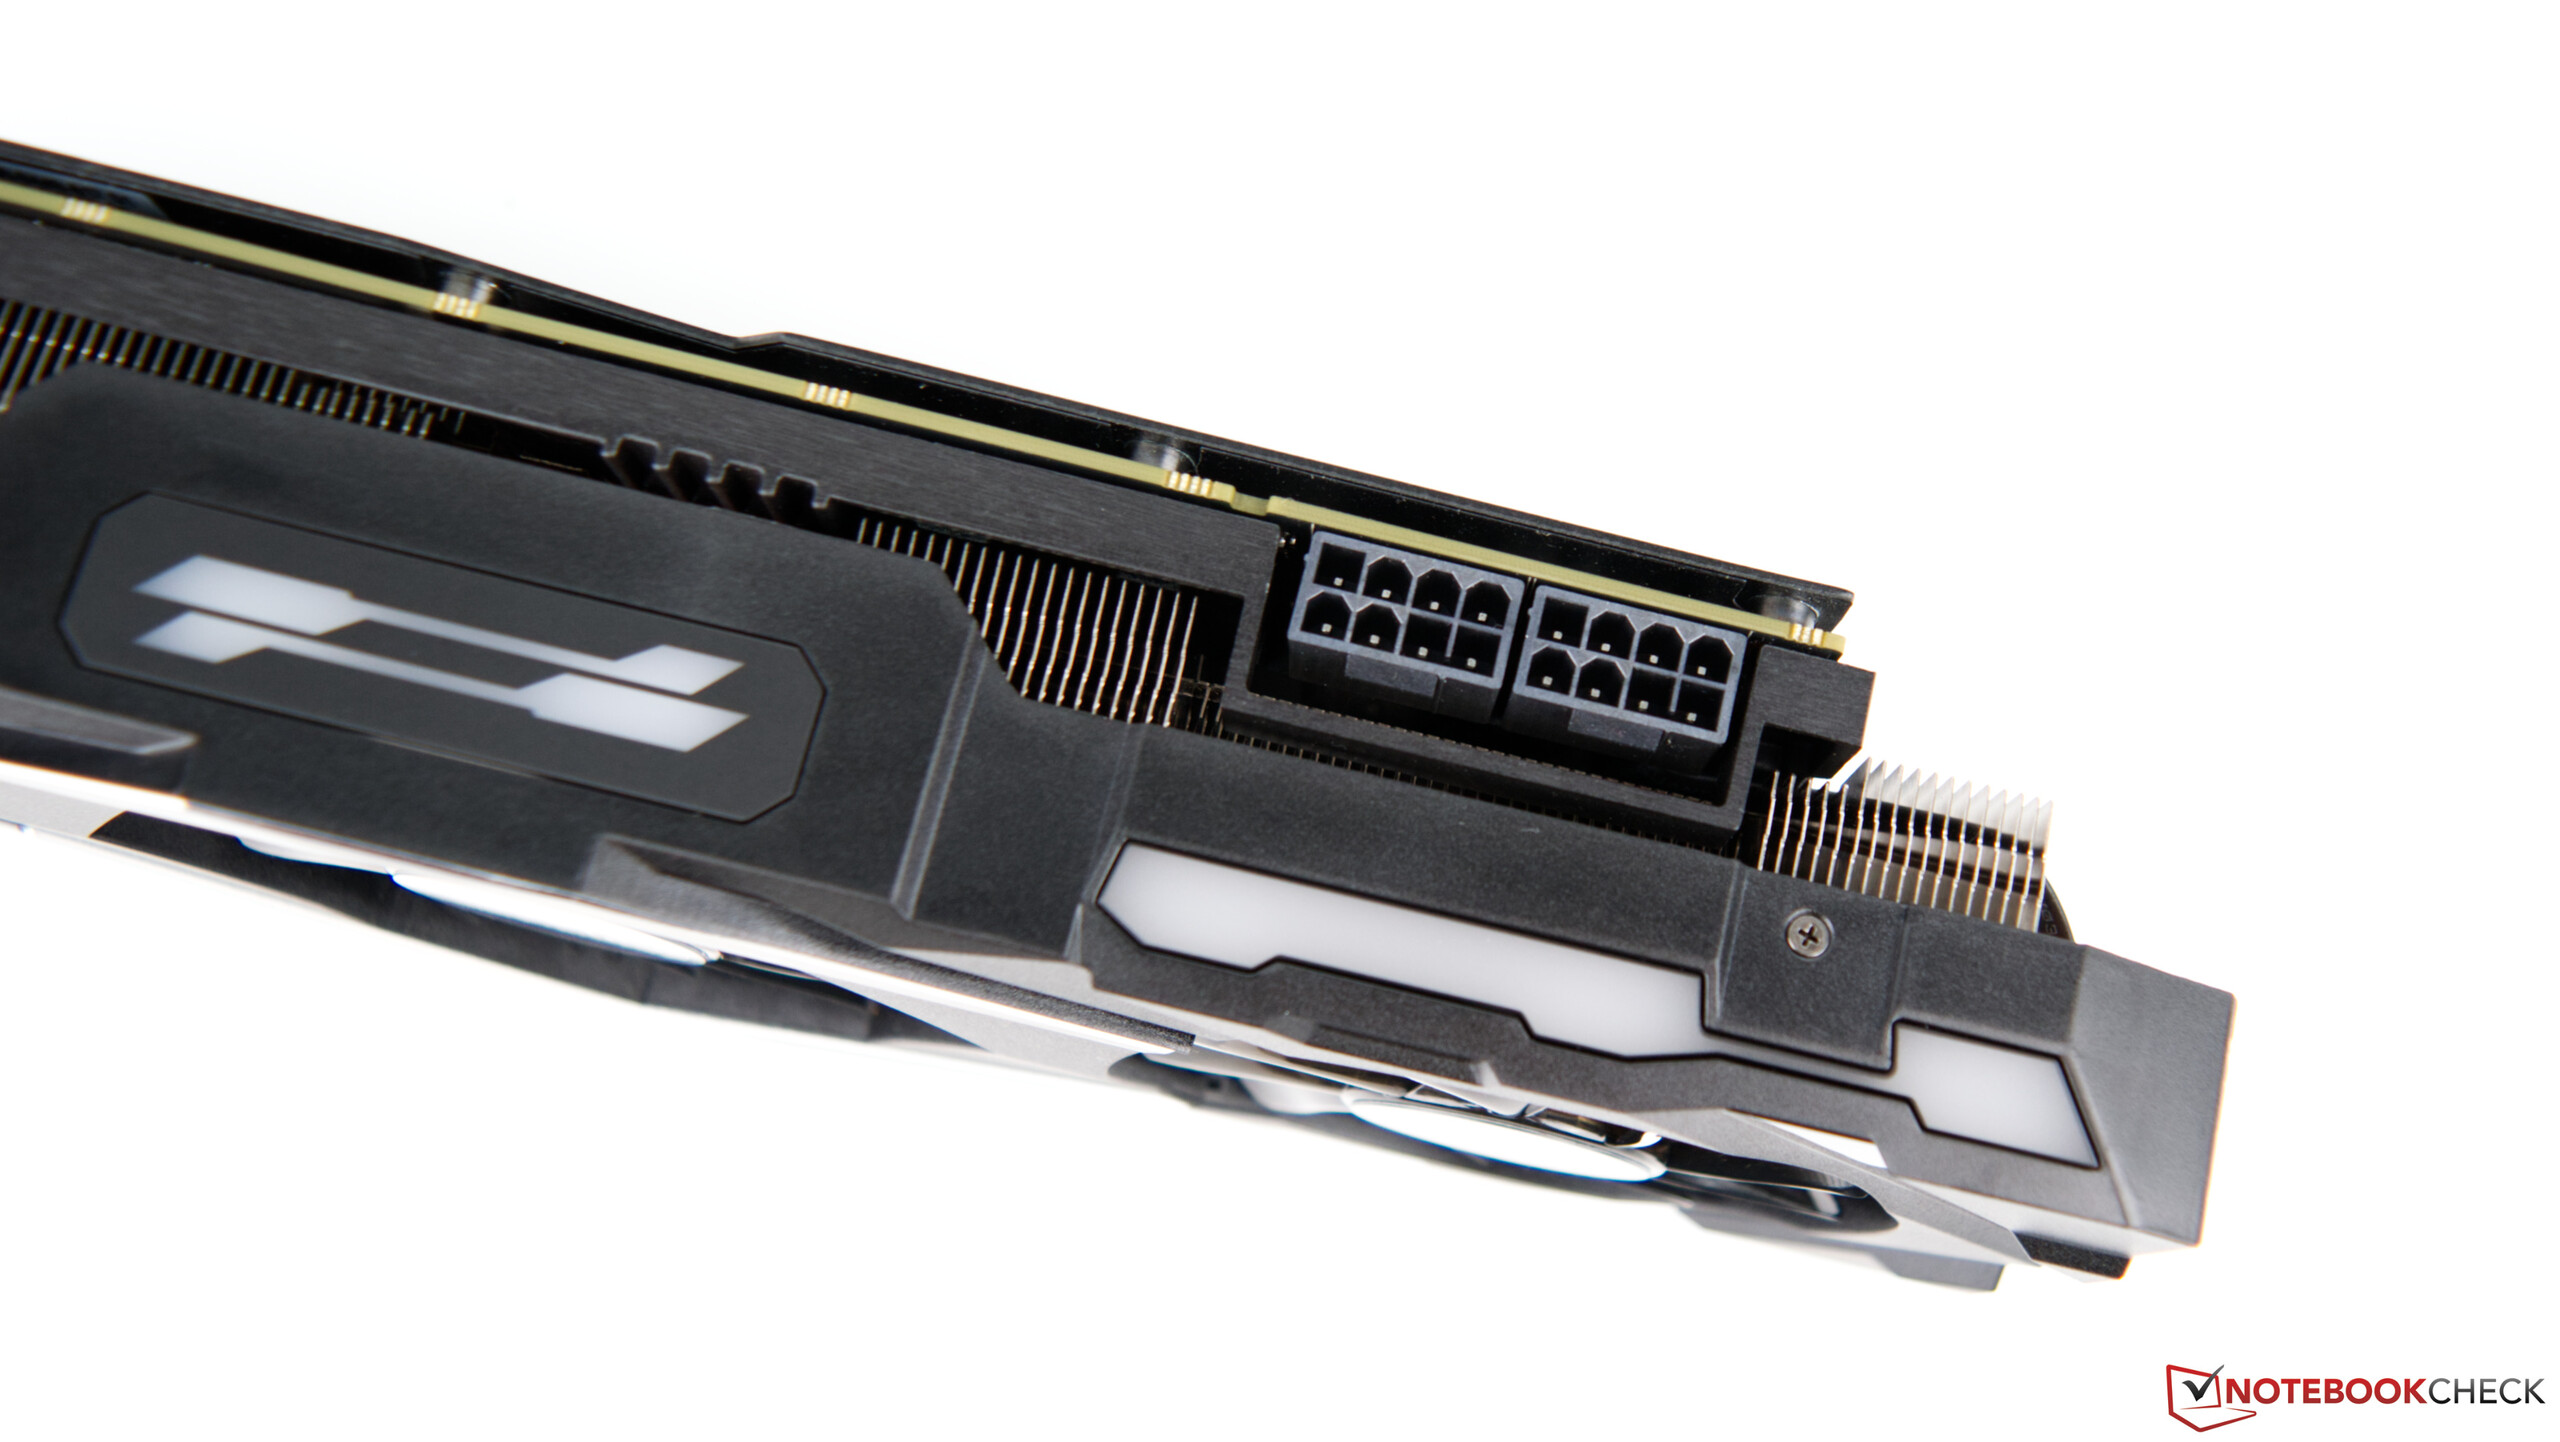
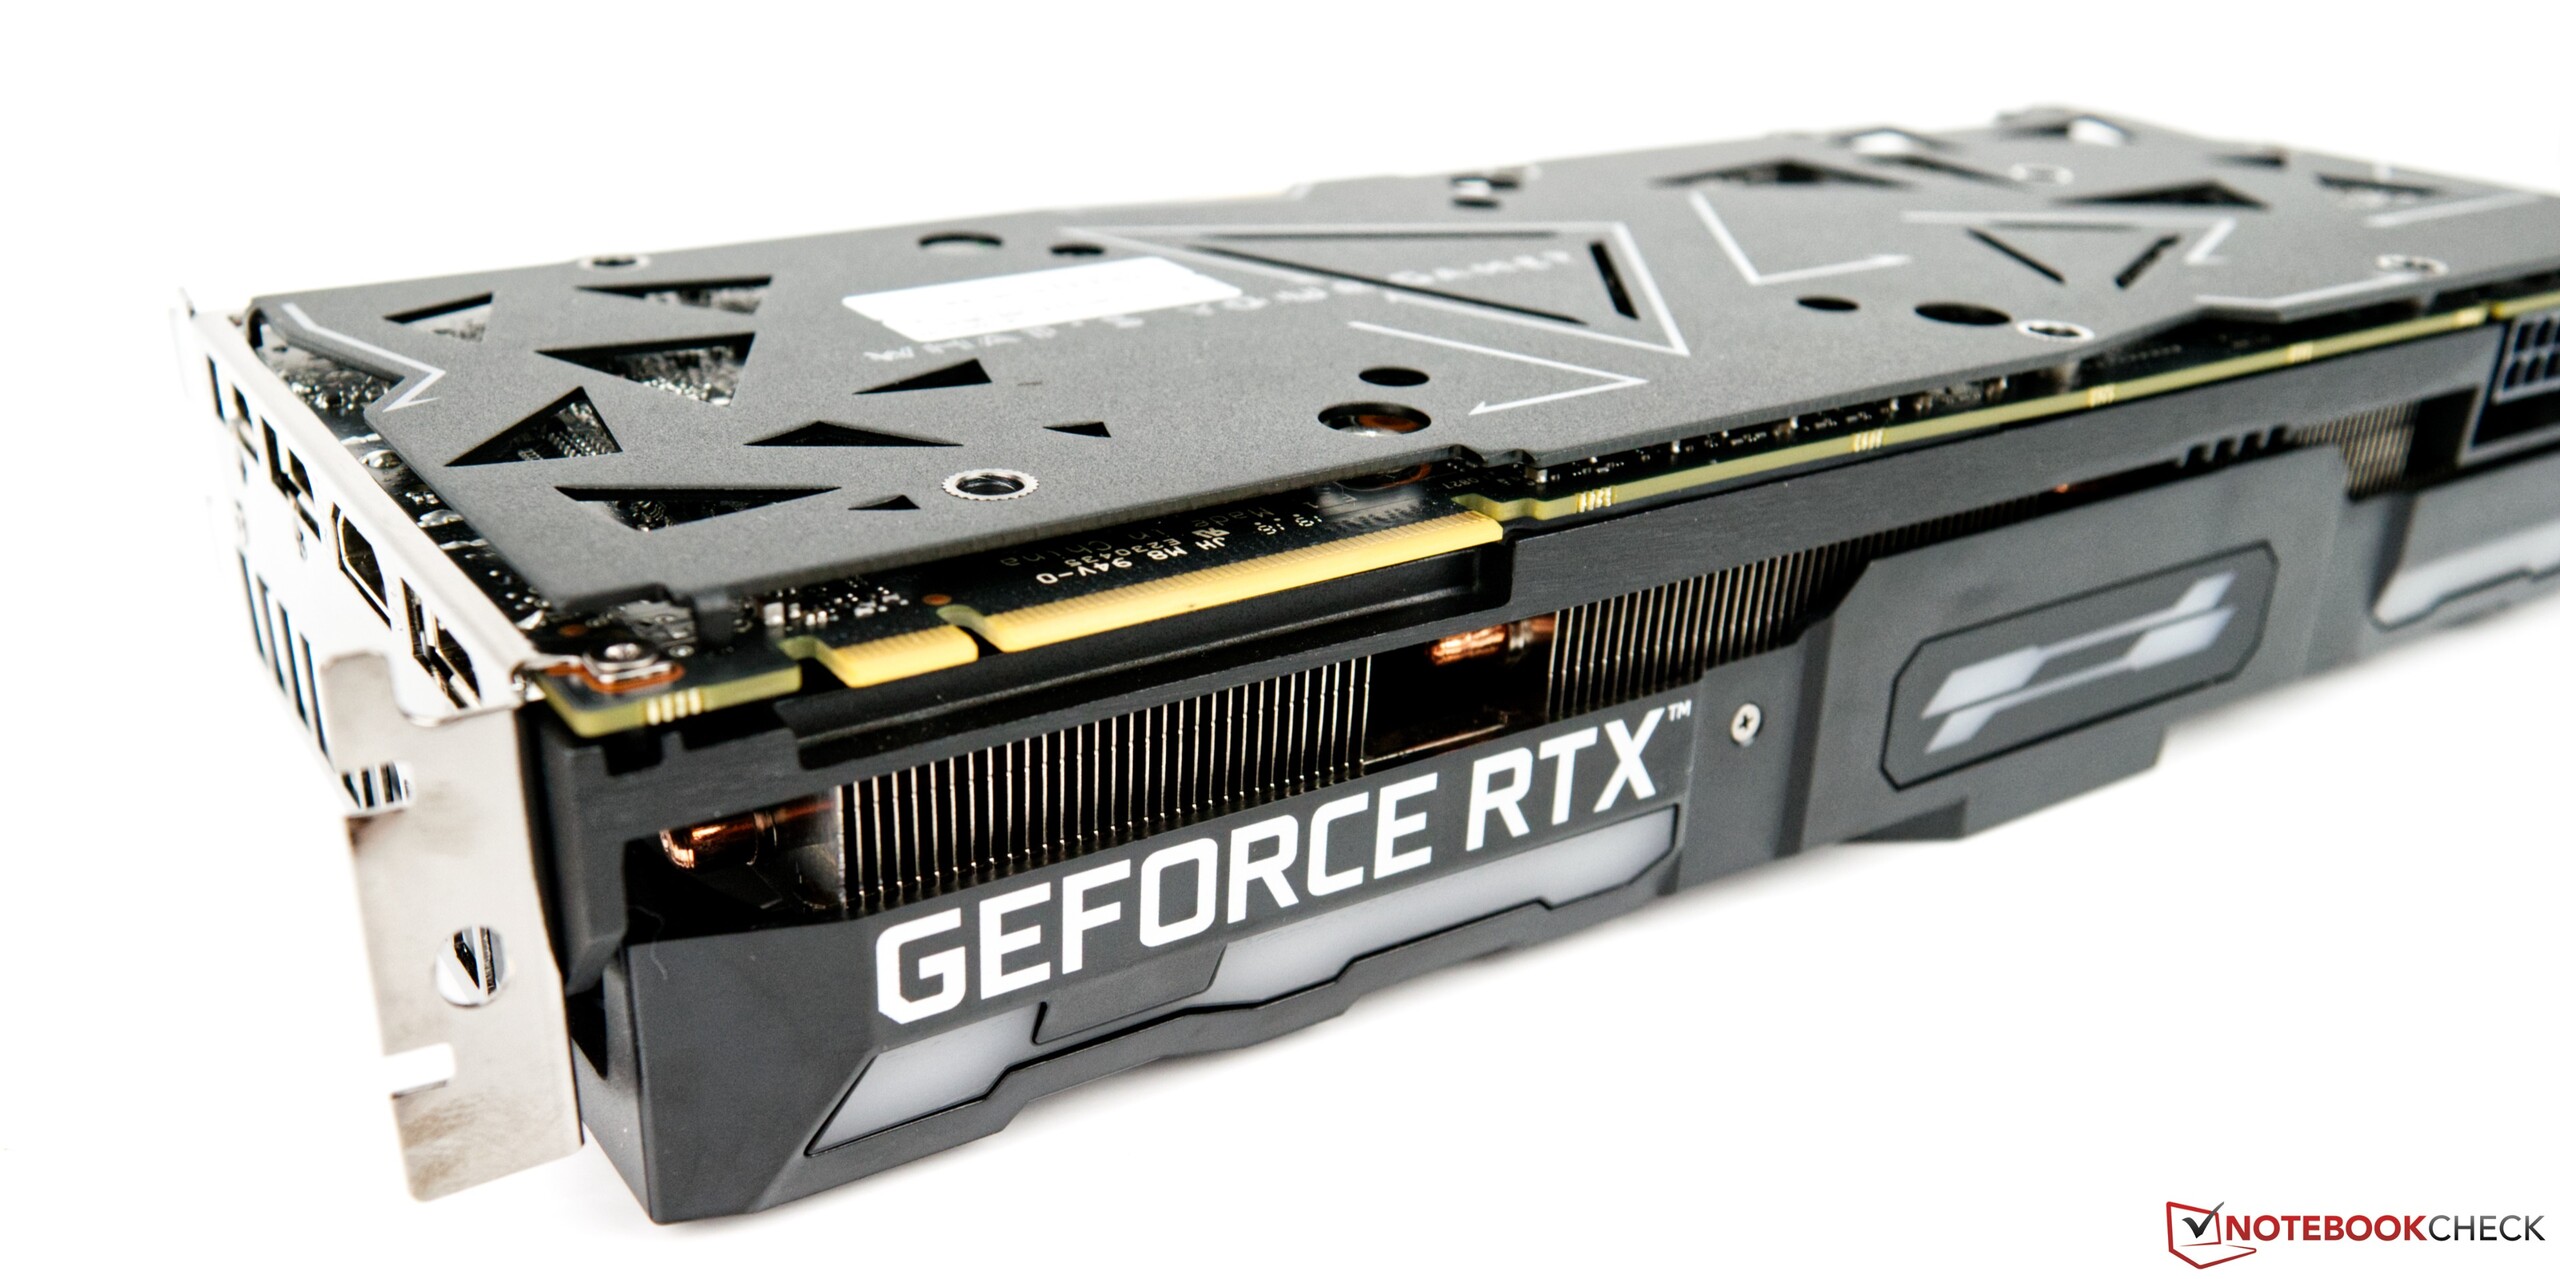
Al momento la KFA2 GeForce RTX 2080 Ti EX costa circa 1070 euro ($1097), che è abbastanza per una GPU. Tuttavia, il modello Founders Edition costa molto di più. Qui Nvidia richiede 1259 euro ($1381). Questo mette le cose in prospettiva e rende il modello KFA2 più attraente, dato che è uno dei modelli più economici sul mercato. Chi decide di scegliere un modello KFA2 otterrà una scheda grafica molto potente con un buon sistema di raffreddamento che è estremamente silenzioso nel funzionamento 2D. Non dovrete rinunciare neanche all'illuminazione RGB, dato che ci sono diversi elementi RGB sul lato, che possono essere configurati attraverso l'utility Xtreme Tuner. Purtroppo, il modello KFA2 non dispone di una porta USB Type-C, che sarebbe utile per le applicazioni VR. Coloro che non usano il VR e non hanno intenzione di usarlo nel prossimo futuro non saranno disturbati dall'assenza di una porta USB Type-C. Inoltre, la KFA2 GeForce RTX 2080 Ti EX offre tre porte DP e una porta HDMI. La GPU assorbe 250 watt di energia e ha due connettori di alimentazione a 8 pin.
Poiché la soluzione di raffreddamento sovradimensionata si estende sul PCB, dovrete assicurarvi che il vostro case abbia abbastanza spazio libero. Rispetto al modello di riferimento, la GPU KFA2 è più lunga di sei centimetri (~2.4 in).

The Turing Specifications in Detail
| Specifiche | RTX 2060 | RTX 2060S | RTX 2070 | RTX 2070S | RTX 2080 | RTX 2080S | RTX 2080 Ti | KFA2 RTX 2080 Ti | Titan RTX |
| Architettura GPU | TU106 | TU106 | TU106 | TU104 | TU104 | TU104 | TU102 | TU102 | TU102 |
| Processo di produzione | 12 nm | 12 nm | 12 nm | 12 nm | 12 nm | 12 nm | 12 nm | 12 nm | 12 nm |
| CUDA Cores | 1.920 | 2.176 | 2.304 | 2.560 | 2.944 | 3.072 | 4.352 | 4.352 | 4.608 |
| Texture Mapping Units | 120 | 136 | 144 | 160 | 184 | 192 | 272 | 272 | 288 |
| Tensor Cores | 240 | 272 | 288 | 320 | 368 | 384 | 544 | 544 | 572 |
| RT Cores | 30 | 34 | 36 | 40 | 46 | 48 | 68 | 68 | 72 |
| Base Core Clock | 1.365 MHz | 1.470 MHz | 1.410 MHz | 1.605 MHz | 1.515 MHz | 1.650 MHz | 1.350 MHz | 1.350 MHz | 1.350 MHz |
| Boost Core Clock | 1.680 MHz | 1.650 MHz | 1.620 MHz | 1.770 MHz | 1.710 MHz | 1.815 MHz | 1.545 MHz | 1.545 MHz | 1.770 MHz |
| Interfaccia Memoria | 192 Bit | 256 Bit | 256 Bit | 256 Bit | 256 Bit | 256 Bit | 352 Bit | 352 Bit | 384 Bit |
| Banda Memoria | 336 GB/s | 448 GB/s | 448 GB/s | 448 GB/s | 448 GB/s | 496,1 GB/s | 616 GB/s | 616 GB/s | 672 GB/s |
| Capacità Memoria | 6 GB GDDR6 | 8 GB GDDR6 | 8 GB GDDR6 | 8 GB GDDR6 | 8 GB GDDR6 | 8 GB GDDR6 | 11 GB GDDR6 | 11 GB GDDR6 | 24 GB GDDR6 |
| TDP | 160 W | 175 W | 175 W | 215 W | 215 W | 250 W | 250 W | 250 W | 280 W |
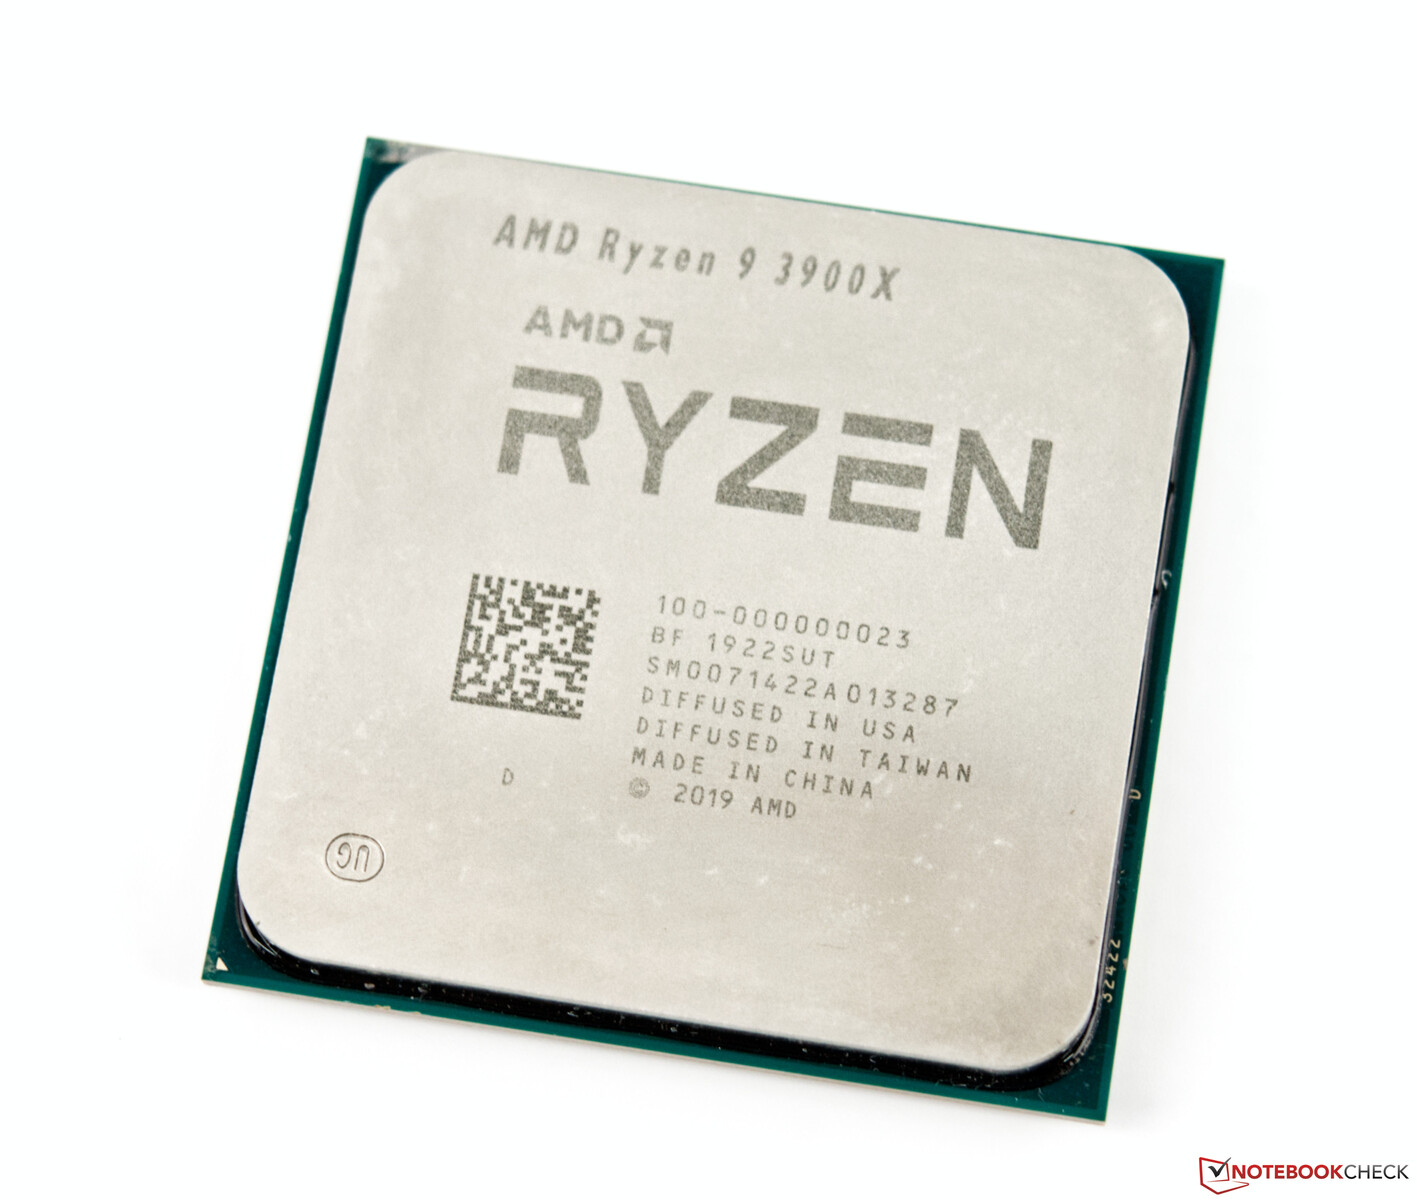
Il Test Bench - Basato su AMD Ryzen 9 3900X
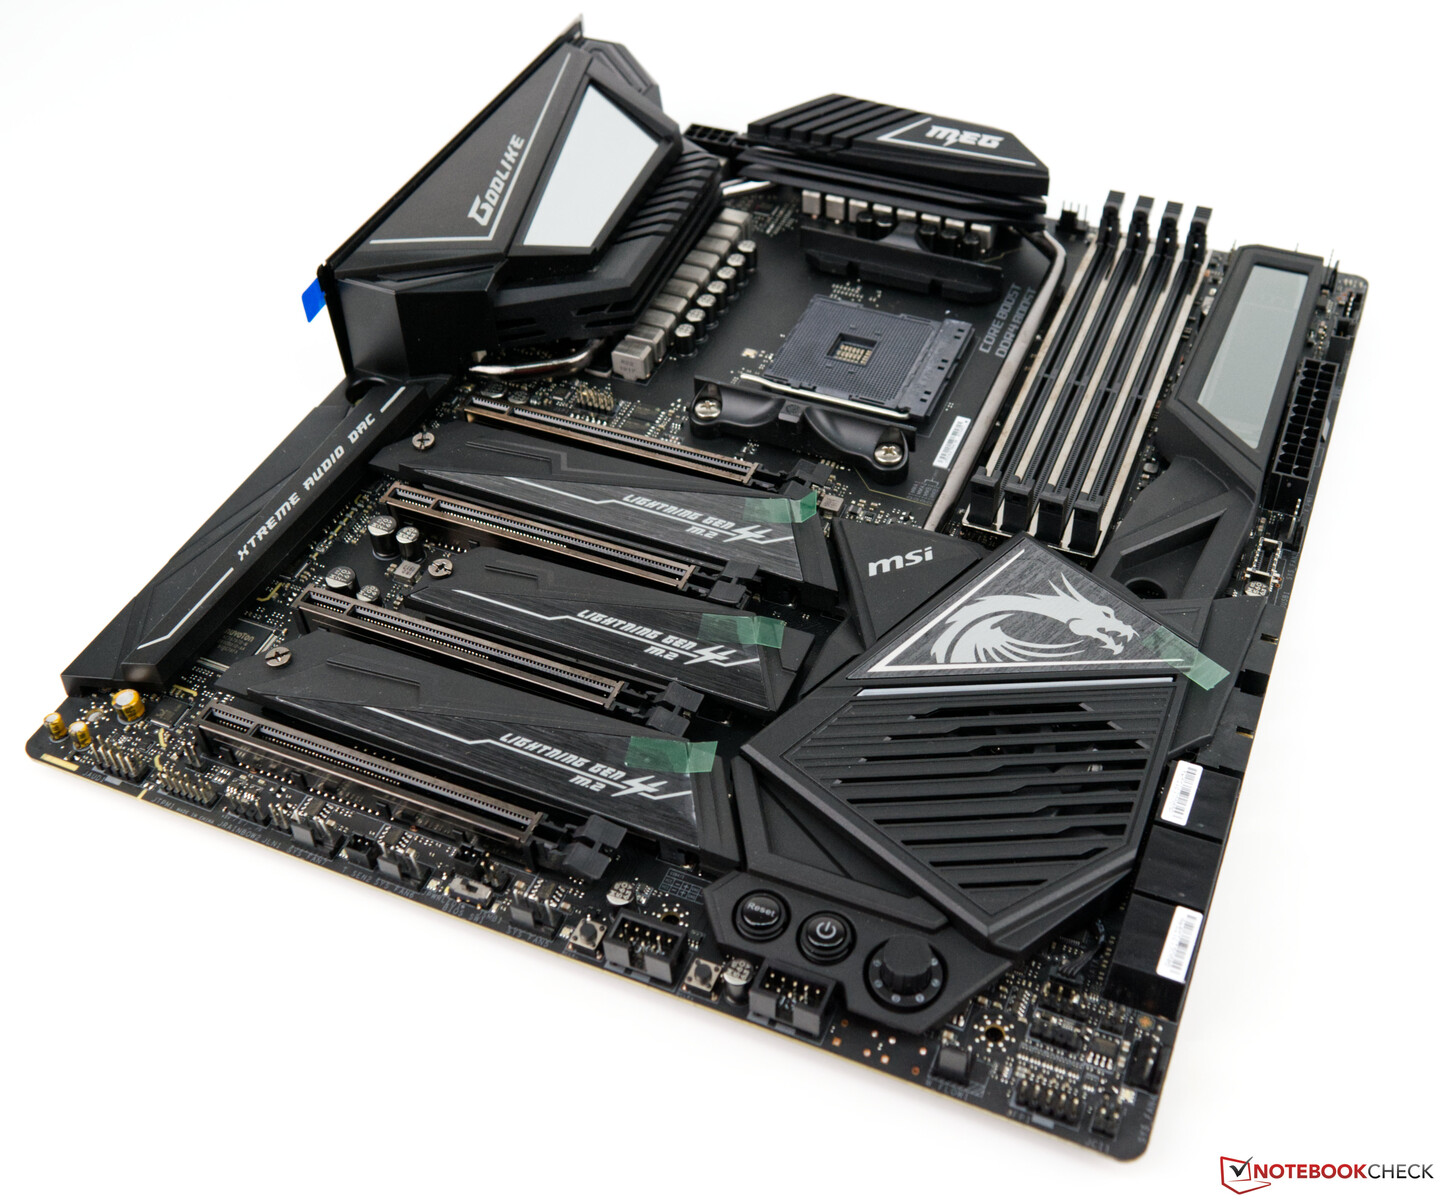
Il nostro benchmark si basa su una piattaforma AMD. La MSI MEG X570 Godlike è usata come scheda madre. La CPU, nota come AMD Ryzen 9 3900X, offre molte prestazioni. Il sistema è raffreddato da un sistema di raffreddamento all-in-one di Be Quiet (Silent Loop 280mm). I 16 GB di RAM da 3600 MHz provengono da G-Skill. L'Acer Predator XB321HK non rappresenta un collo di bottiglia, grazie alla sua risoluzione 4K. Siamo molto grati ad AMD per averci fornito questo sistema.
Per i seguenti benchmarks abbiamo usato questo sistema:
- Corsair Carbide Air 540 ATX Cube
- AMD Ryzen 9 3900X
- KFA2 GeForce RTX 2080 Ti EX 1-Click-OC (GeForce 436.30 driver)
- MSI MEG X570 Godlike (BIOS 1.20, impostazioni di default, XMP 1 for DDR4-3600 CL16)
- Alimentatore Antec 1200-watt
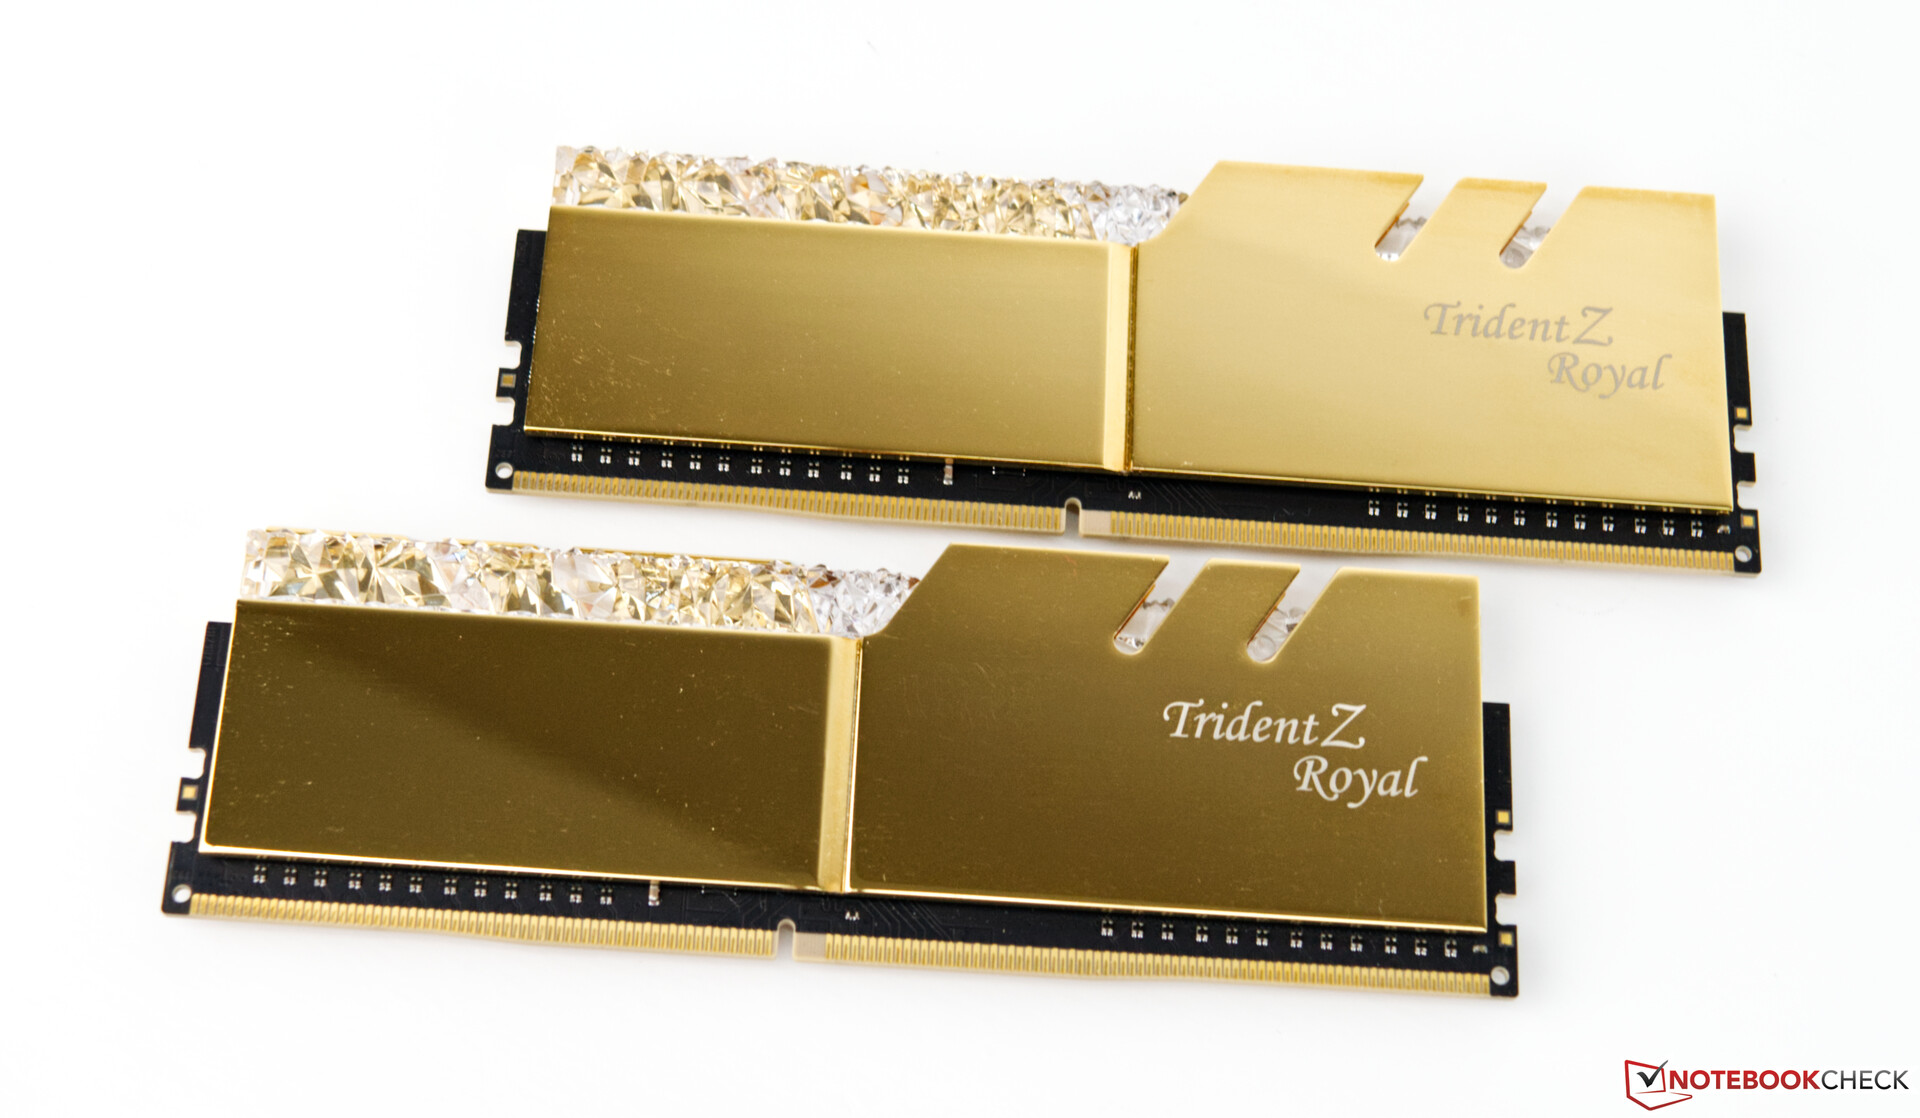
- G-Skill Trident Z Royal gold DDR4-3600 16 GB (2 x 8 GB) kit, a 3600 MHz; timings: CL16-16-16-36
- Corsair MP600 2TB M.2 PCIe 4.0 SSD
- Crucial MX500 2TB (per i giochi)
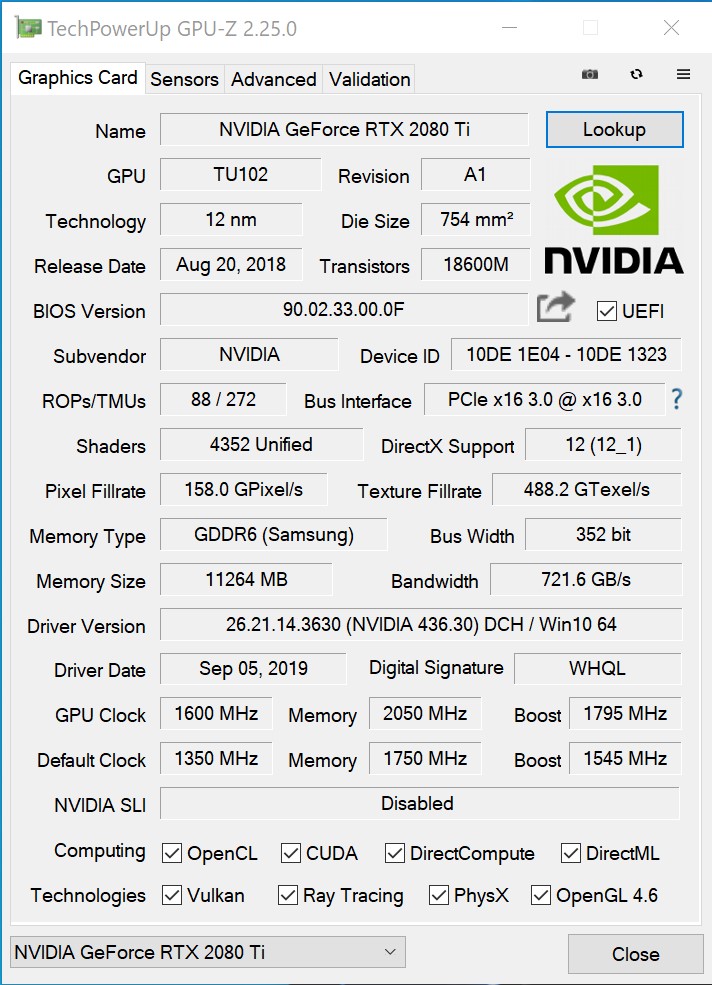
I Core Clocks della KFA2 GeForce RTX 2080 Ti EX
Il modello KFA2 ha gli stessi core clocks del modello di riferimento. Secondo la scheda tecnica, il clock di base è di 1350 MHz e il boost clock è di 1545 MHz. Tuttavia, quando si gioca la GPU gira a 1800-1900 MHz. L'RTX 2080 Ti ha 11 GB di VRAM, con clock a 1750 MHz (velocità di memoria effettiva: 14 GHz). Grazie al bus a 352 bit, la larghezza di banda di memoria è pari a 616 GB/s.
Il TDP della GPU KFA2 è di 250 watt, ossia 10 watt in meno rispetto al modello di riferimento. Il modello KFA2 raggiunge quasi sempre il limite di potenza, il che significa che la GPU funziona a piena velocità. Il limite di potenza può essere aumentato con l'utilità di ottimizzazione. Questo porta ad un boost clock più alto e più stabile. La KFA2 GeForce RTX 2080 Ti EX viene fornita con la funzione 1 Click OC, che aumenta il clock di base di 45 MHz e imposta l'obiettivo di potenza al 108%.
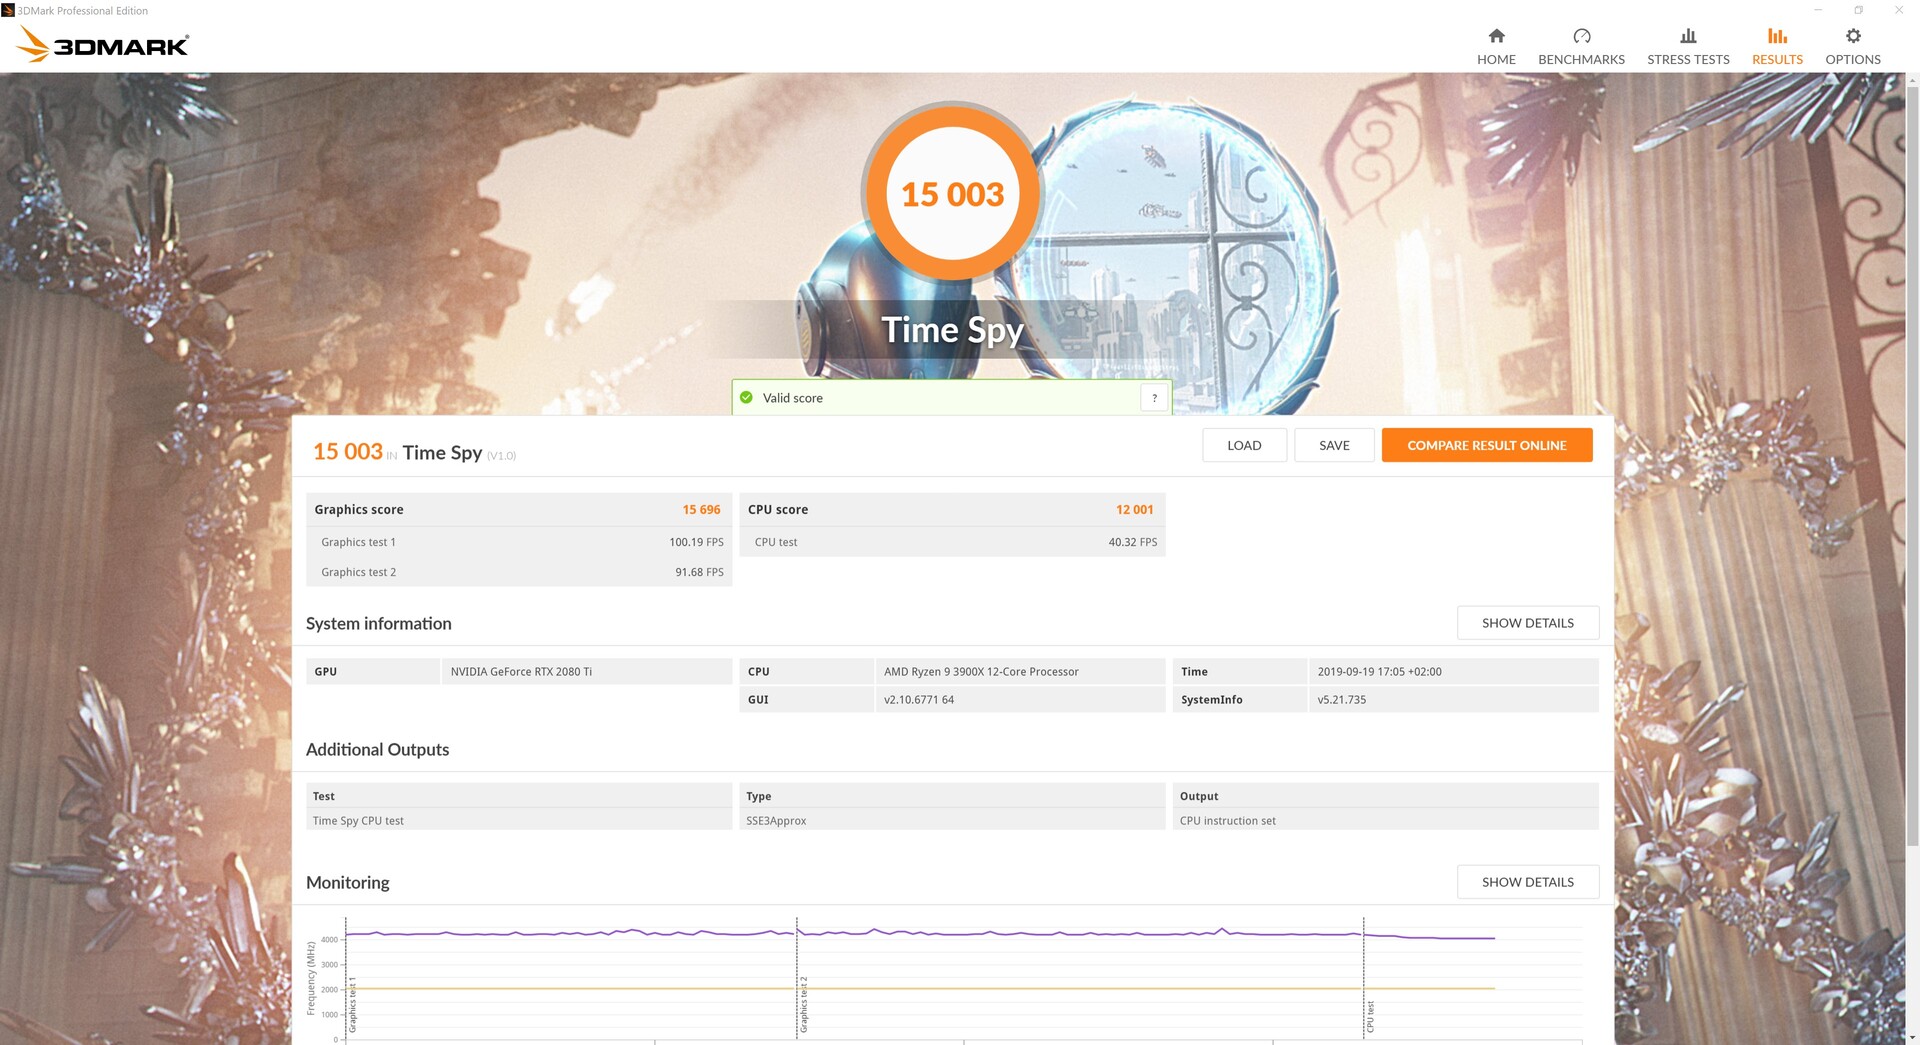
Benchmarks Sintetici
I benchmark sintetici confermano che la KFA2 GeForce RTX 2080 Ti EX offre ottime prestazioni. Tuttavia, la GeForce RTX 2080 Ti nel Corsair One i160 riesce a battere il nostro modello di prova. Questo dimostra che un sistema basato su Intel è ancora il miglior sistema per il gioco. Detto questo, con una differenza del 4%, il nostro sistema basato su Ryzen 9 eguaglia quasi il PC basato su Intel. La GeForce RTX 2080 Ti è del 23% più veloce della GeForce RTX 2080 Super.
| 3DMark 11 - 1280x720 Performance GPU | |
| Corsair One i160 | |
| KFA2 GeForce RTX 2080 Ti EX | |
| Nvidia Titan RTX | |
| MSI RTX 2080 Gaming X Trio | |
| Nvidia GeForce RTX 2080 Super | |
| AMD Radeon VII | |
| AMD Radeon RX 5700 XT | |
| Nvidia GeForce RTX 2070 Super | |
| AMD Radeon RX 5700 | |
| MSI RTX 2070 Gaming Z 8G | |
| Nvidia GeForce RTX 2060 Super | |
| AMD Radeon RX Vega 64 | |
| MSI RTX 2060 Gaming Z 6G | |
| Unigine Valley 1.0 | |
| 1920x1080 Extreme HD DirectX AA:x8 | |
| Corsair One i160 | |
| KFA2 GeForce RTX 2080 Ti EX | |
| Nvidia Titan RTX | |
| Nvidia GeForce RTX 2080 Super | |
| MSI RTX 2080 Gaming X Trio | |
| Nvidia GeForce RTX 2070 Super | |
| MSI RTX 2070 Gaming Z 8G | |
| AMD Radeon VII | |
| Nvidia GeForce RTX 2060 Super | |
| AMD Radeon RX 5700 XT | |
| AMD Radeon RX 5700 | |
| MSI RTX 2060 Gaming Z 6G | |
| 1920x1080 Extreme HD Preset OpenGL AA:x8 | |
| KFA2 GeForce RTX 2080 Ti EX | |
| Corsair One i160 | |
| Nvidia Titan RTX | |
| Nvidia GeForce RTX 2080 Super | |
| MSI RTX 2080 Gaming X Trio | |
| Nvidia GeForce RTX 2070 Super | |
| MSI RTX 2070 Gaming Z 8G | |
| Nvidia GeForce RTX 2060 Super | |
| AMD Radeon RX 5700 XT | |
| MSI RTX 2060 Gaming Z 6G | |
| AMD Radeon RX 5700 | |
| AMD Radeon VII | |
| 3DMark 05 Standard | 52639 punti | |
| 3DMark 06 Standard Score | 44825 punti | |
| 3DMark Vantage P Result | 82093 punti | |
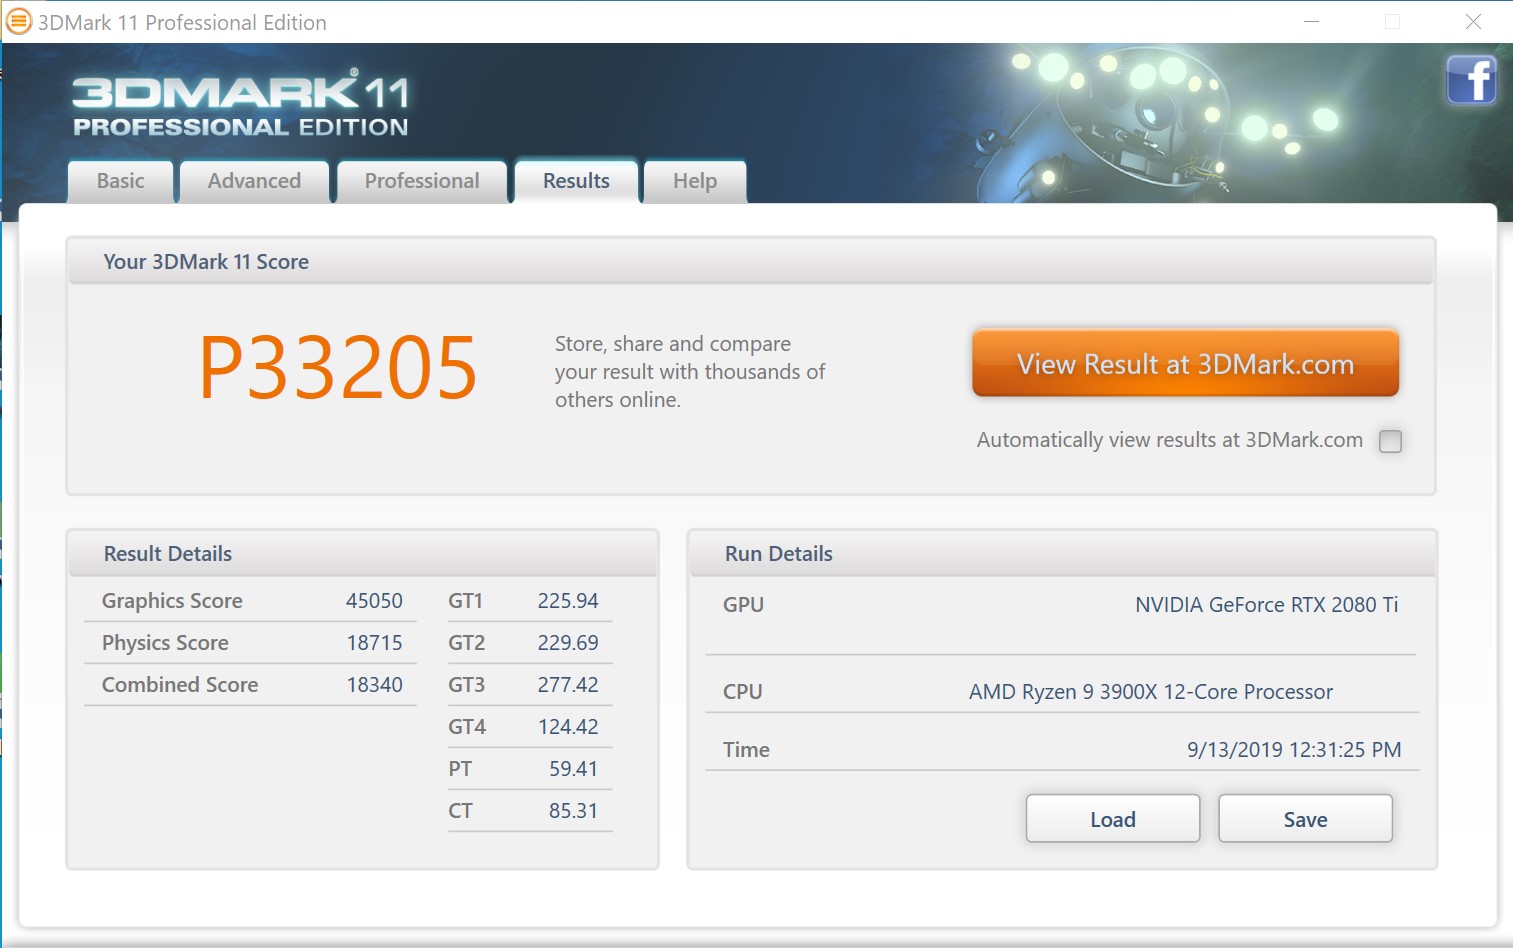
| 3DMark 11 Performance | 33205 punti | |
| 3DMark Ice Storm Standard Score | 209400 punti | |
| 3DMark Cloud Gate Standard Score | 57827 punti | |
| 3DMark Fire Strike Score | 25890 punti | |
| 3DMark Fire Strike Extreme Score | 15211 punti | |
| 3DMark Time Spy Score | 13424 punti | |
Aiuto | ||
Gaming Benchmarks
I benchmark di gioco non lasciano dubbi sul fatto che la KFA2 GeForce RTX 2080 Ti è una scheda grafica molto veloce. Non importa se si utilizza un sistema basato su Intel o un PC con alimentazione Ryzen. Naturalmente, ci sono giochi che funzionano meglio con una CPU o l'altra. Quando si confrontano i giochi a risoluzioni molto elevate, la CPU smette di essere il collo di bottiglia principale, che è a risoluzioni più basse. La GeForce RTX 2080 Ti può gestire tutti i titoli attuali in 4K senza problemi. Inoltre, le caratteristiche aggiuntive della RTX rendono i giochi molto più impressionanti.
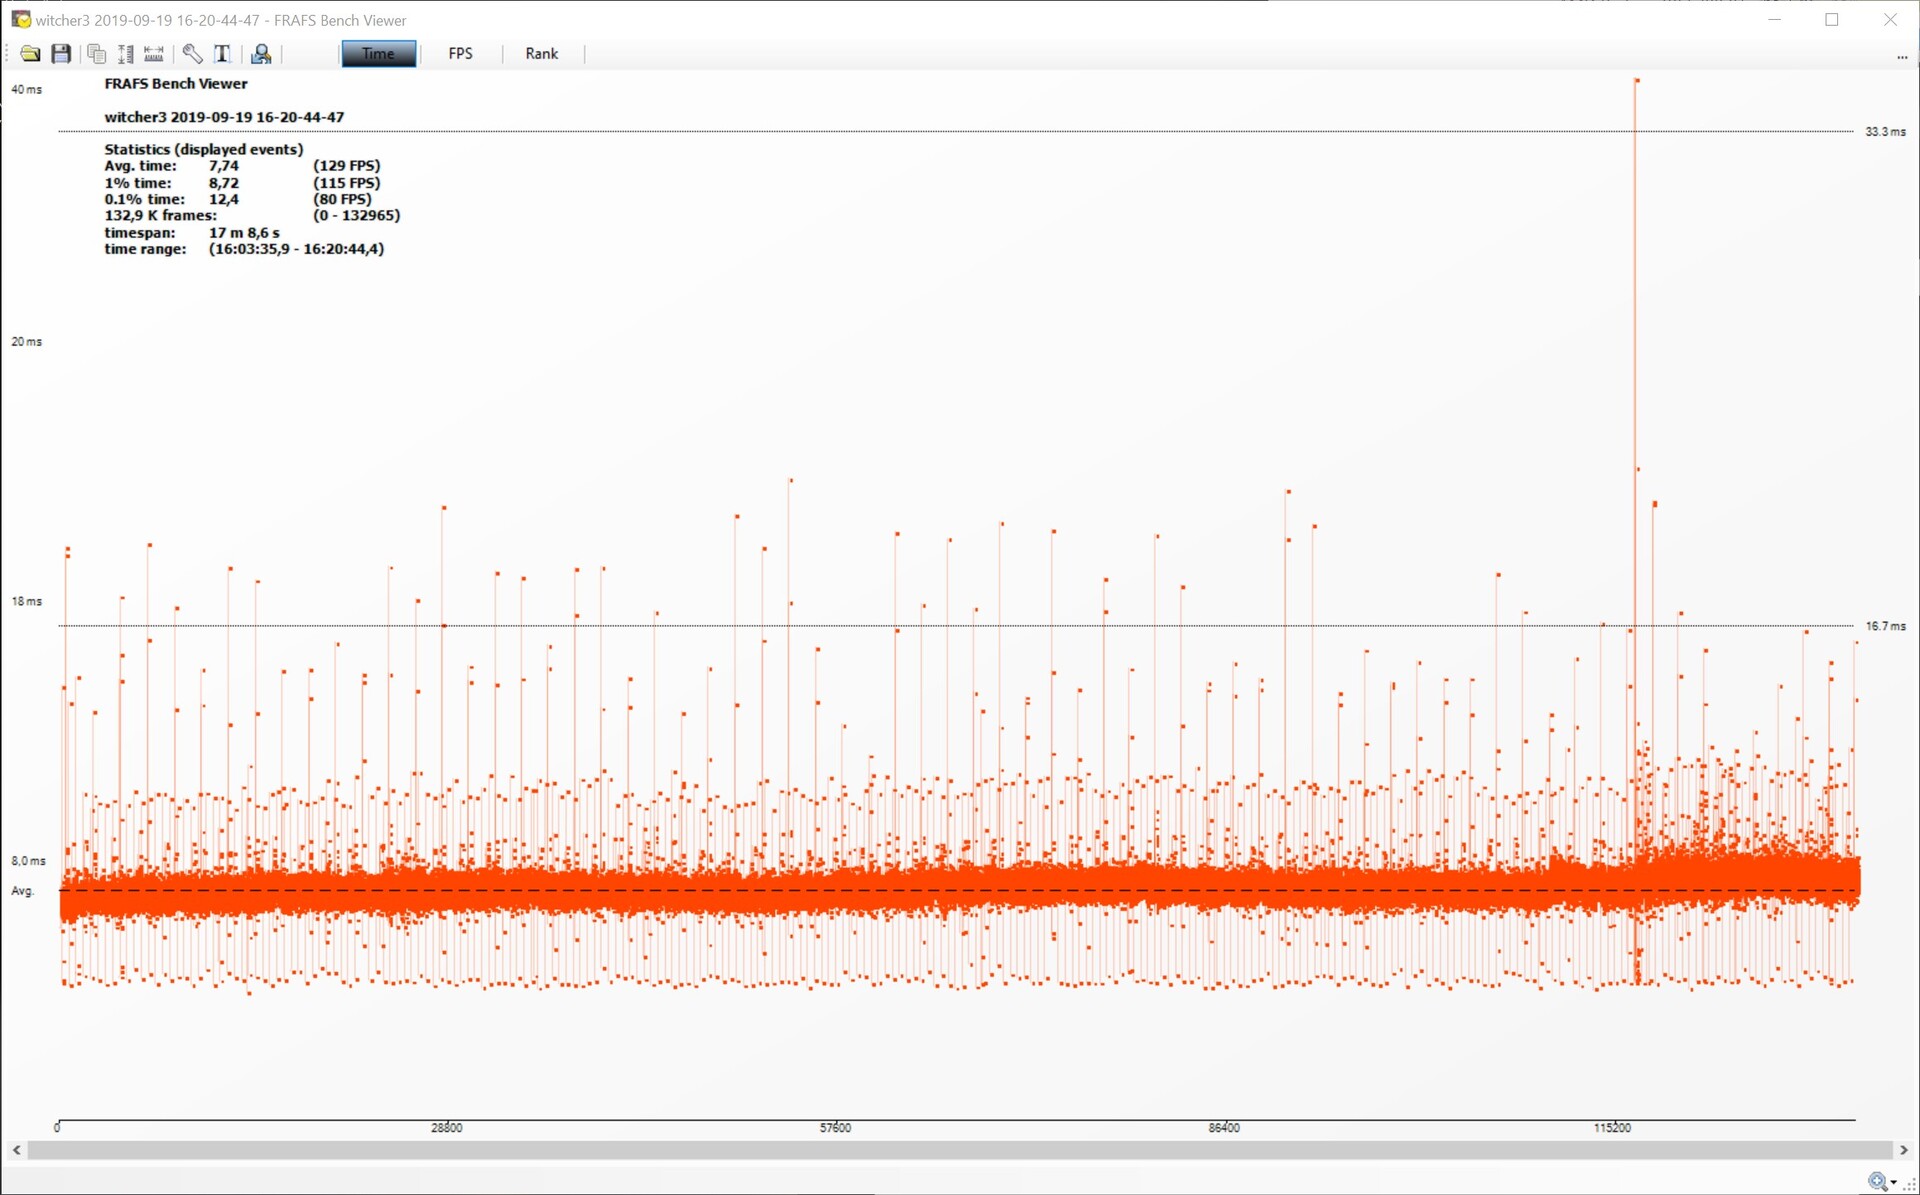
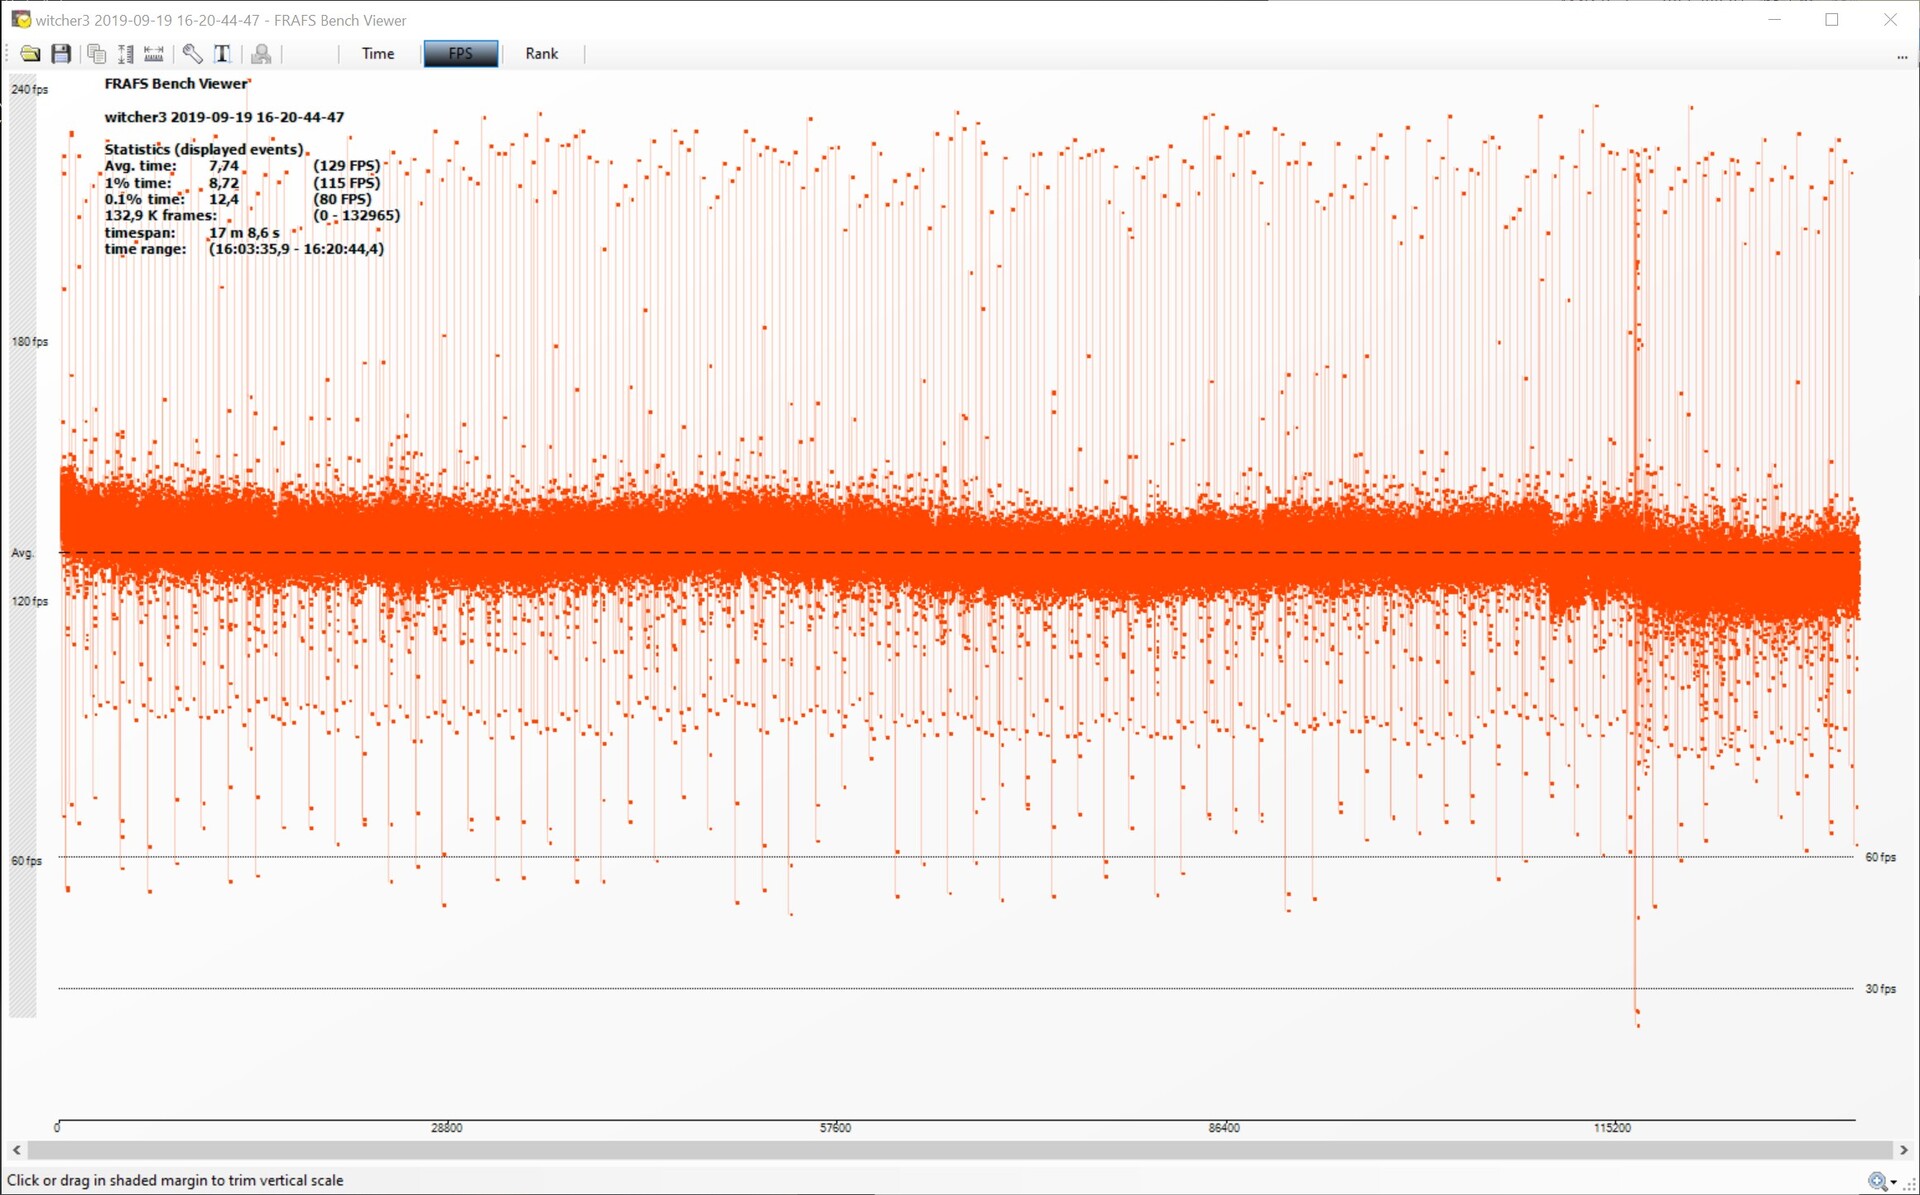
Non abbiamo riscontrato alcun comportamento anomalo quando si tratta di frametime e frame rate. Ci sono picchi e cali occasionali nei frame rate, ma questi sono molto brevi e non si notano durante il gioco. Raccogliamo i dati di frametime e frame rate con il videogioco conosciuto come "The Witcher 3" (preset: Ultra). Le prestazioni del modello KFA2 sono leggermente diminuite nel corso della nostra prova, passando da 135 FPS a 130 FPS. Questi sono ancora frame rate molto elevati, il che significa che il gioco rimarrà più che giocabile anche durante sessioni di gioco molto lunghe.
The Witcher 3 frame rate in ultra
| Forza Horizon 4 | |
| 1920x1080 Ultra Preset AA:2xMS | |
| KFA2 GeForce RTX 2080 Ti EX | |
| Corsair One i160 | |
| AMD Radeon RX 5700 XT | |
| MSI RTX 2080 Gaming X Trio | |
| AMD Radeon RX 5700 XT | |
| Nvidia GeForce RTX 2080 Super | |
| Nvidia Titan RTX | |
| AMD Radeon VII | |
| Nvidia GeForce RTX 2070 Super | |
| AMD Radeon RX Vega 64 | |
| AMD Radeon RX 5700 | |
| MSI RTX 2070 Gaming Z 8G | |
| Nvidia GeForce RTX 2060 Super | |
| MSI RTX 2060 Gaming Z 6G | |
| 3840x2160 Ultra Preset AA:2xMS | |
| KFA2 GeForce RTX 2080 Ti EX | |
| Corsair One i160 | |
| Nvidia Titan RTX | |
| MSI RTX 2080 Gaming X Trio | |
| Nvidia GeForce RTX 2080 Super | |
| AMD Radeon RX 5700 XT | |
| AMD Radeon VII | |
| Nvidia GeForce RTX 2070 Super | |
| AMD Radeon RX 5700 | |
| MSI RTX 2070 Gaming Z 8G | |
| AMD Radeon RX Vega 64 | |
| Nvidia GeForce RTX 2060 Super | |
| MSI RTX 2060 Gaming Z 6G | |
| 2560x1440 Ultra Preset AA:2xMS | |
| KFA2 GeForce RTX 2080 Ti EX | |
| Corsair One i160 | |
| AMD Radeon RX 5700 XT | |
| MSI RTX 2080 Gaming X Trio | |
| Nvidia GeForce RTX 2080 Super | |
| Nvidia GeForce RTX 2070 Super | |
| AMD Radeon RX 5700 | |
| MSI RTX 2070 Gaming Z 8G | |
| Nvidia GeForce RTX 2060 Super | |
| F1 2018 | |
| 1920x1080 Ultra High Preset AA:T AF:16x | |
| Corsair One i160 | |
| Nvidia Titan RTX | |
| MSI RTX 2080 Gaming X Trio | |
| AMD Radeon VII | |
| Nvidia GeForce RTX 2070 Super | |
| Nvidia GeForce RTX 2080 Super | |
| MSI RTX 2070 Gaming Z 8G | |
| Nvidia GeForce RTX 2060 Super | |
| KFA2 GeForce RTX 2080 Ti EX | |
| MSI RTX 2060 Gaming Z 6G | |
| AMD Radeon RX Vega 64 | |
| 3840x2160 Ultra High Preset AA:T AF:16x | |
| Nvidia Titan RTX | |
| Corsair One i160 | |
| KFA2 GeForce RTX 2080 Ti EX | |
| MSI RTX 2080 Gaming X Trio | |
| Nvidia GeForce RTX 2080 Super | |
| AMD Radeon VII | |
| Nvidia GeForce RTX 2070 Super | |
| MSI RTX 2070 Gaming Z 8G | |
| Nvidia GeForce RTX 2060 Super | |
| MSI RTX 2060 Gaming Z 6G | |
| AMD Radeon RX Vega 64 | |
| 2560x1440 Ultra High Preset AA:T AF:16x | |
| Corsair One i160 | |
| MSI RTX 2080 Gaming X Trio | |
| Nvidia GeForce RTX 2080 Super | |
| KFA2 GeForce RTX 2080 Ti EX | |
| Nvidia GeForce RTX 2070 Super | |
| MSI RTX 2070 Gaming Z 8G | |
| Nvidia GeForce RTX 2060 Super | |
| Monster Hunter World | |
| 1920x1080 Highest Preset (Image Quality High) | |
| Corsair One i160 | |
| Nvidia Titan RTX | |
| MSI RTX 2080 Gaming X Trio | |
| Nvidia GeForce RTX 2080 Super | |
| Nvidia GeForce RTX 2070 Super | |
| MSI RTX 2070 Gaming Z 8G | |
| AMD Radeon VII | |
| Nvidia GeForce RTX 2060 Super | |
| AMD Radeon RX 5700 XT | |
| MSI RTX 2060 Gaming Z 6G | |
| AMD Radeon RX Vega 64 | |
| AMD Radeon RX 5700 | |
| 3840x2160 Highest Preset (Image Quality High) | |
| Nvidia Titan RTX | |
| Corsair One i160 | |
| MSI RTX 2080 Gaming X Trio | |
| Nvidia GeForce RTX 2080 Super | |
| Nvidia GeForce RTX 2070 Super | |
| AMD Radeon VII | |
| MSI RTX 2070 Gaming Z 8G | |
| AMD Radeon RX 5700 XT | |
| AMD Radeon RX Vega 64 | |
| Nvidia GeForce RTX 2060 Super | |
| AMD Radeon RX 5700 | |
| MSI RTX 2060 Gaming Z 6G | |
| 2560x1440 Highest Preset (Image Quality High) | |
| Corsair One i160 | |
| MSI RTX 2080 Gaming X Trio | |
| Nvidia GeForce RTX 2080 Super | |
| Nvidia GeForce RTX 2070 Super | |
| MSI RTX 2070 Gaming Z 8G | |
| AMD Radeon RX 5700 XT | |
| Nvidia GeForce RTX 2060 Super | |
| AMD Radeon RX 5700 | |
| Destiny 2 | |
| 1920x1080 Highest Preset AA:SM AF:16x | |
| Corsair One i160 | |
| KFA2 GeForce RTX 2080 Ti EX | |
| Nvidia Titan RTX | |
| MSI RTX 2070 Gaming Z 8G | |
| Nvidia GeForce RTX 2080 Super | |
| MSI RTX 2080 Gaming X Trio | |
| Nvidia GeForce RTX 2060 Super | |
| Nvidia GeForce RTX 2070 Super | |
| AMD Radeon RX 5700 XT | |
| AMD Radeon RX 5700 | |
| AMD Radeon VII | |
| MSI RTX 2060 Gaming Z 6G | |
| 3840x2160 Highest Preset AA:SM AF:16x | |
| Nvidia Titan RTX | |
| Corsair One i160 | |
| KFA2 GeForce RTX 2080 Ti EX | |
| Nvidia GeForce RTX 2080 Super | |
| MSI RTX 2080 Gaming X Trio | |
| Nvidia GeForce RTX 2070 Super | |
| MSI RTX 2070 Gaming Z 8G | |
| AMD Radeon RX 5700 XT | |
| Nvidia GeForce RTX 2060 Super | |
| AMD Radeon VII | |
| MSI RTX 2060 Gaming Z 6G | |
| AMD Radeon RX 5700 | |
| 2560x1440 Highest Preset AA:SM AF:16x | |
| Corsair One i160 | |
| KFA2 GeForce RTX 2080 Ti EX | |
| Nvidia GeForce RTX 2080 Super | |
| MSI RTX 2080 Gaming X Trio | |
| Nvidia GeForce RTX 2070 Super | |
| MSI RTX 2070 Gaming Z 8G | |
| AMD Radeon RX 5700 XT | |
| Nvidia GeForce RTX 2060 Super | |
| AMD Radeon RX 5700 | |
| The Witcher 3 | |
| 1920x1080 Ultra Graphics & Postprocessing (HBAO+) | |
| KFA2 GeForce RTX 2080 Ti EX | |
| Corsair One i160 | |
| Nvidia Titan RTX | |
| MSI RTX 2080 Gaming X Trio | |
| Nvidia GeForce RTX 2080 Super | |
| Nvidia GeForce RTX 2070 Super | |
| AMD Radeon RX 5700 XT | |
| AMD Radeon RX 5700 XT | |
| MSI RTX 2070 Gaming Z 8G | |
| AMD Radeon RX 5700 | |
| Nvidia GeForce RTX 2060 Super | |
| AMD Radeon RX Vega 64 | |
| AMD Radeon VII | |
| MSI RTX 2060 Gaming Z 6G | |
| 3840x2160 High Graphics & Postprocessing (Nvidia HairWorks Off) | |
| Nvidia Titan RTX | |
| Corsair One i160 | |
| KFA2 GeForce RTX 2080 Ti EX | |
| Nvidia GeForce RTX 2080 Super | |
| MSI RTX 2080 Gaming X Trio | |
| Nvidia GeForce RTX 2070 Super | |
| MSI RTX 2070 Gaming Z 8G | |
| Nvidia GeForce RTX 2060 Super | |
| AMD Radeon VII | |
| AMD Radeon RX 5700 XT | |
| MSI RTX 2060 Gaming Z 6G | |
| AMD Radeon RX Vega 64 | |
| AMD Radeon RX 5700 | |
| Watch Dogs 2 | |
| 1920x1080 Ultra Preset | |
| Corsair One i160 | |
| KFA2 GeForce RTX 2080 Ti EX | |
| Nvidia Titan RTX | |
| Nvidia GeForce RTX 2080 Super | |
| MSI RTX 2080 Gaming X Trio | |
| Nvidia GeForce RTX 2070 Super | |
| MSI RTX 2070 Gaming Z 8G | |
| Nvidia GeForce RTX 2060 Super | |
| AMD Radeon RX Vega 64 | |
| MSI RTX 2060 Gaming Z 6G | |
| AMD Radeon VII | |
| 3840x2160 High Preset | |
| Nvidia Titan RTX | |
| Corsair One i160 | |
| KFA2 GeForce RTX 2080 Ti EX | |
| Nvidia GeForce RTX 2080 Super | |
| MSI RTX 2080 Gaming X Trio | |
| Nvidia GeForce RTX 2070 Super | |
| MSI RTX 2070 Gaming Z 8G | |
| Nvidia GeForce RTX 2060 Super | |
| AMD Radeon VII | |
| MSI RTX 2060 Gaming Z 6G | |
| AMD Radeon RX Vega 64 | |
| Battlefield 1 | |
| 1920x1080 Ultra Preset AA:T | |
| Corsair One i160 | |
| KFA2 GeForce RTX 2080 Ti EX | |
| Nvidia Titan RTX | |
| Nvidia GeForce RTX 2070 Super | |
| Nvidia GeForce RTX 2080 Super | |
| MSI RTX 2080 Gaming X Trio | |
| AMD Radeon RX Vega 64 | |
| Nvidia GeForce RTX 2060 Super | |
| MSI RTX 2070 Gaming Z 8G | |
| AMD Radeon VII | |
| MSI RTX 2060 Gaming Z 6G | |
| 3840x2160 High Preset AA:T | |
| Corsair One i160 | |
| KFA2 GeForce RTX 2080 Ti EX | |
| Nvidia Titan RTX | |
| Nvidia GeForce RTX 2080 Super | |
| MSI RTX 2080 Gaming X Trio | |
| AMD Radeon VII | |
| Nvidia GeForce RTX 2070 Super | |
| MSI RTX 2070 Gaming Z 8G | |
| Nvidia GeForce RTX 2060 Super | |
| AMD Radeon RX Vega 64 | |
| MSI RTX 2060 Gaming Z 6G | |
| For Honor | |
| 1920x1080 Extreme Preset AA:T AF:16x | |
| Nvidia Titan RTX | |
| Corsair One i160 | |
| KFA2 GeForce RTX 2080 Ti EX | |
| Nvidia GeForce RTX 2080 Super | |
| MSI RTX 2080 Gaming X Trio | |
| AMD Radeon RX 5700 XT | |
| AMD Radeon RX 5700 XT | |
| Nvidia GeForce RTX 2070 Super | |
| AMD Radeon RX 5700 | |
| MSI RTX 2070 Gaming Z 8G | |
| Nvidia GeForce RTX 2060 Super | |
| AMD Radeon RX Vega 64 | |
| MSI RTX 2060 Gaming Z 6G | |
| AMD Radeon VII | |
| 3840x2160 High Preset AA:T AF:8x | |
| Nvidia Titan RTX | |
| KFA2 GeForce RTX 2080 Ti EX | |
| Corsair One i160 | |
| Nvidia GeForce RTX 2080 Super | |
| MSI RTX 2080 Gaming X Trio | |
| Nvidia GeForce RTX 2070 Super | |
| AMD Radeon VII | |
| AMD Radeon RX 5700 XT | |
| MSI RTX 2070 Gaming Z 8G | |
| Nvidia GeForce RTX 2060 Super | |
| AMD Radeon RX 5700 | |
| MSI RTX 2060 Gaming Z 6G | |
| AMD Radeon RX Vega 64 | |
| Ghost Recon Wildlands | |
| 1920x1080 Ultra Preset AA:T AF:16x | |
| Corsair One i160 | |
| Nvidia Titan RTX | |
| KFA2 GeForce RTX 2080 Ti EX | |
| Nvidia GeForce RTX 2080 Super | |
| MSI RTX 2080 Gaming X Trio | |
| Nvidia GeForce RTX 2070 Super | |
| AMD Radeon RX 5700 XT | |
| MSI RTX 2070 Gaming Z 8G | |
| Nvidia GeForce RTX 2060 Super | |
| AMD Radeon RX 5700 | |
| MSI RTX 2060 Gaming Z 6G | |
| AMD Radeon RX Vega 64 | |
| AMD Radeon VII | |
| 3840x2160 Ultra Preset AA:T AF:16x | |
| Nvidia Titan RTX | |
| Corsair One i160 | |
| KFA2 GeForce RTX 2080 Ti EX | |
| Nvidia GeForce RTX 2080 Super | |
| MSI RTX 2080 Gaming X Trio | |
| Nvidia GeForce RTX 2070 Super | |
| AMD Radeon RX 5700 XT | |
| MSI RTX 2070 Gaming Z 8G | |
| AMD Radeon RX 5700 | |
| Nvidia GeForce RTX 2060 Super | |
| GTA V | |
| 1920x1080 Highest AA:4xMSAA + FX AF:16x | |
| Nvidia Titan RTX | |
| MSI RTX 2080 Gaming X Trio | |
| AMD Radeon VII | |
| MSI RTX 2070 Gaming Z 8G | |
| Corsair One i160 | |
| MSI RTX 2060 Gaming Z 6G | |
| KFA2 GeForce RTX 2080 Ti EX | |
| Nvidia GeForce RTX 2060 Super | |
| Nvidia GeForce RTX 2070 Super | |
| Nvidia GeForce RTX 2080 Super | |
| AMD Radeon RX 5700 | |
| AMD Radeon RX 5700 XT | |
| 3840x2160 High/On (Advanced Graphics Off) AA:FX AF:8x | |
| Corsair One i160 | |
| Nvidia Titan RTX | |
| KFA2 GeForce RTX 2080 Ti EX | |
| Nvidia GeForce RTX 2080 Super | |
| Nvidia GeForce RTX 2070 Super | |
| AMD Radeon RX 5700 XT | |
| MSI RTX 2080 Gaming X Trio | |
| Nvidia GeForce RTX 2060 Super | |
| AMD Radeon RX 5700 | |
| AMD Radeon VII | |
| MSI RTX 2070 Gaming Z 8G | |
| MSI RTX 2060 Gaming Z 6G | |
| Battlefield 4 - 3840x2160 High Preset | |
| Nvidia Titan RTX | |
| Corsair One i160 | |
| KFA2 GeForce RTX 2080 Ti EX | |
| Nvidia GeForce RTX 2080 Super | |
| MSI RTX 2080 Gaming X Trio | |
| Nvidia GeForce RTX 2070 Super | |
| MSI RTX 2070 Gaming Z 8G | |
| AMD Radeon RX Vega 64 | |
| AMD Radeon VII | |
| Nvidia GeForce RTX 2060 Super | |
| MSI RTX 2060 Gaming Z 6G | |
| Rage 2 | |
| 3840x2160 Ultra Preset (Resolution Scale Off) | |
| Corsair One i160 | |
| KFA2 GeForce RTX 2080 Ti EX | |
| Nvidia Titan RTX 24 GB | |
| Nvidia GeForce RTX 2080 Super | |
| MSI RTX 2080 Gaming X Trio | |
| Nvidia GeForce RTX 2070 Super | |
| MSI RTX 2070 Gaming Z 8G | |
| AMD Radeon RX 5700 XT | |
| Nvidia GeForce RTX 2060 Super | |
| AMD Radeon RX Vega 64 | |
| AMD Radeon RX 5700 | |
| MSI RTX 2060 Gaming Z 6G | |
| 1920x1080 Ultra Preset (Resolution Scale Off) | |
| Corsair One i160 | |
| KFA2 GeForce RTX 2080 Ti EX | |
| Nvidia Titan RTX 24 GB | |
| Nvidia GeForce RTX 2080 Super | |
| MSI RTX 2080 Gaming X Trio | |
| Nvidia GeForce RTX 2070 Super | |
| MSI RTX 2070 Gaming Z 8G | |
| AMD Radeon RX Vega 64 | |
| Nvidia GeForce RTX 2060 Super | |
| AMD Radeon RX 5700 XT | |
| MSI RTX 2060 Gaming Z 6G | |
| 2560x1440 Ultra Preset (Resolution Scale Off) | |
| Corsair One i160 | |
| KFA2 GeForce RTX 2080 Ti EX | |
| Nvidia Titan RTX 24 GB | |
| Nvidia GeForce RTX 2080 Super | |
| MSI RTX 2080 Gaming X Trio | |
| Nvidia GeForce RTX 2070 Super | |
| MSI RTX 2070 Gaming Z 8G | |
| AMD Radeon RX Vega 64 | |
| Nvidia GeForce RTX 2060 Super | |
| AMD Radeon RX 5700 XT | |
| AMD Radeon RX 5700 | |
| MSI RTX 2060 Gaming Z 6G | |
| F1 2019 | |
| 3840x2160 Ultra High Preset AA:T AF:16x | |
| Nvidia Titan RTX 24 GB | |
| Corsair One i160 | |
| KFA2 GeForce RTX 2080 Ti EX | |
| Nvidia GeForce RTX 2080 Super | |
| Nvidia GeForce RTX 2070 Super | |
| AMD Radeon RX 5700 XT | |
| AMD Radeon RX 5700 | |
| Nvidia GeForce RTX 2060 Super | |
| AMD Radeon RX Vega 64 | |
| 1920x1080 Ultra High Preset AA:T AF:16x | |
| Corsair One i160 | |
| KFA2 GeForce RTX 2080 Ti EX | |
| AMD Radeon RX 5700 XT | |
| Nvidia GeForce RTX 2080 Super | |
| AMD Radeon RX 5700 XT | |
| Nvidia GeForce RTX 2070 Super | |
| Nvidia Titan RTX 24 GB | |
| AMD Radeon RX Vega 64 | |
| AMD Radeon RX 5700 | |
| Nvidia GeForce RTX 2060 Super | |
| 2560x1440 Ultra High Preset AA:T AF:16x | |
| KFA2 GeForce RTX 2080 Ti EX | |
| Corsair One i160 | |
| Nvidia Titan RTX 24 GB | |
| Nvidia GeForce RTX 2080 Super | |
| Nvidia GeForce RTX 2070 Super | |
| AMD Radeon RX 5700 XT | |
| AMD Radeon RX 5700 | |
| Nvidia GeForce RTX 2060 Super | |
| AMD Radeon RX Vega 64 | |
| FIFA 20 | |
| 3840x2160 Ultra Preset AA:4xMS | |
| KFA2 GeForce RTX 2080 Ti EX | |
| Nvidia GeForce RTX 2080 Super | |
| Nvidia GeForce RTX 2070 Super | |
| AMD Radeon RX 5700 XT | |
| Nvidia GeForce RTX 2060 Super | |
| AMD Radeon RX 5700 | |
| 2560x1440 Ultra Preset AA:4xMS | |
| AMD Radeon RX 5700 XT | |
| AMD Radeon RX 5700 | |
| Nvidia GeForce RTX 2080 Super | |
| KFA2 GeForce RTX 2080 Ti EX | |
| Nvidia GeForce RTX 2070 Super | |
| Nvidia GeForce RTX 2060 Super | |
| 1920x1080 Ultra Preset AA:4xMS | |
| AMD Radeon RX 5700 | |
| AMD Radeon RX 5700 XT | |
| KFA2 GeForce RTX 2080 Ti EX | |
| Nvidia GeForce RTX 2080 Super | |
| Nvidia GeForce RTX 2070 Super | |
| Nvidia GeForce RTX 2060 Super | |
| Control | |
| 3840x2160 High Quality Preset | |
| Nvidia Titan RTX 24 GB | |
| KFA2 GeForce RTX 2080 Ti EX | |
| Nvidia GeForce RTX 2070 Super | |
| Nvidia GeForce RTX 2080 Super | |
| AMD Radeon RX 5700 XT | |
| Nvidia GeForce RTX 2060 Super | |
| AMD Radeon RX 5700 | |
| 2560x1440 High Quality Preset | |
| Nvidia Titan RTX 24 GB | |
| KFA2 GeForce RTX 2080 Ti EX | |
| Nvidia GeForce RTX 2070 Super | |
| Nvidia GeForce RTX 2080 Super | |
| AMD Radeon RX 5700 XT | |
| Nvidia GeForce RTX 2060 Super | |
| AMD Radeon RX 5700 | |
| 1920x1080 High Quality Preset | |
| Nvidia Titan RTX 24 GB | |
| KFA2 GeForce RTX 2080 Ti EX | |
| Nvidia GeForce RTX 2070 Super | |
| Nvidia GeForce RTX 2080 Super | |
| AMD Radeon RX 5700 XT | |
| Nvidia GeForce RTX 2060 Super | |
| AMD Radeon RX 5700 | |
| Borderlands 3 | |
| 3840x2160 Badass Overall Quality (DX11) | |
| Nvidia Titan RTX 24 GB | |
| KFA2 GeForce RTX 2080 Ti EX | |
| Nvidia GeForce RTX 2080 Super | |
| Nvidia GeForce RTX 2070 Super | |
| AMD Radeon RX 5700 XT | |
| Nvidia GeForce RTX 2060 Super | |
| AMD Radeon RX 5700 | |
| 2560x1440 Badass Overall Quality (DX11) | |
| KFA2 GeForce RTX 2080 Ti EX | |
| Nvidia Titan RTX 24 GB | |
| Nvidia GeForce RTX 2080 Super | |
| Nvidia GeForce RTX 2070 Super | |
| AMD Radeon RX 5700 XT | |
| Nvidia GeForce RTX 2060 Super | |
| AMD Radeon RX 5700 | |
| 1920x1080 Badass Overall Quality (DX11) | |
| KFA2 GeForce RTX 2080 Ti EX | |
| Nvidia GeForce RTX 2080 Super | |
| Nvidia GeForce RTX 2070 Super | |
| Nvidia Titan RTX 24 GB | |
| AMD Radeon RX 5700 XT | |
| Nvidia GeForce RTX 2060 Super | |
| AMD Radeon RX 5700 | |
| basso | medio | alto | ultra | QHD | 4K | |
|---|---|---|---|---|---|---|
| BioShock Infinite (2013) | 394 | 349 | 325 | 233 | ||
| Battlefield 4 (2013) | 200 | 200 | 200 | 200 | 148.5 | |
| GTA V (2015) | 177 | 172 | 162 | 99 | 138 | |
| The Witcher 3 (2015) | 403 | 341 | 245 | 135 | 96 | |
| Dota 2 Reborn (2015) | 163.7 | 148.9 | 143.9 | 141.2 | 139.6 | |
| Rainbow Six Siege (2015) | 470 | 379 | 332 | 313 | 173 | |
| Rise of the Tomb Raider (2016) | 324 | 223 | 212 | 198 | 93 | |
| Far Cry Primal (2016) | 129 | 116 | 107 | 100 | 88 | |
| The Division (2016) | 328 | 279 | 196 | 160 | 86 | |
| Doom (2016) | 194 | 178 | 163 | 167 | 131 | |
| Overwatch (2016) | 300 | 300 | 300 | 295 | 188 | |
| Deus Ex Mankind Divided (2016) | 167 | 156 | 135 | 100 | 67 | |
| Battlefield 1 (2016) | 200 | 196 | 184 | 171 | 112 | |
| Dishonored 2 (2016) | 92 | 89 | 88 | 82 | 86 | |
| Watch Dogs 2 (2016) | 155 | 141 | 126 | 101 | 66 | |
| For Honor (2017) | 358 | 257 | 246 | 195 | 99 | |
| Ghost Recon Wildlands (2017) | 147 | 122 | 120 | 82 | 64 | |
| Rocket League (2017) | 250 | 250 | 249 | 209 | ||
| Dirt 4 (2017) | 269 | 207 | 183 | 170 | 123 | |
| Playerunknown's Battlegrounds (PUBG) (2017) | 214 | 190 | 183 | 180 | 86 | |
| Destiny 2 (2017) | 181 | 178 | 178 | 178 | 157 | 89 |
| Assassin´s Creed Origins (2017) | 145 | 127 | 121 | 104 | 89 | 62 |
| Call of Duty WWII (2017) | 305 | 302 | 221 | 200 | 166 | 110 |
| Fortnite (2018) | 349 | 290 | 218 | 197 | 141 | 76 |
| Final Fantasy XV Benchmark (2018) | 185 | 155 | 118 | 55.6 | ||
| Kingdom Come: Deliverance (2018) | 175 | 155 | 122 | 85 | 83 | 50 |
| X-Plane 11.11 (2018) | 127 | 113 | 91 | 79 | ||
| Far Cry 5 (2018) | 139 | 124 | 119 | 111 | 109 | 74 |
| The Crew 2 (2018) | 60 | 60 | 60 | 60 | 60 | 60 |
| F1 2018 (2018) | 201 | 172 | 143 | 116 | 114 | 95 |
| Shadow of the Tomb Raider (2018) | 148 | 138 | 136 | 130 | 108 | 60 |
| FIFA 19 (2018) | 364 | 358 | 330 | 323 | 319 | 298 |
| Forza Horizon 4 (2018) | 207 | 182 | 180 | 168 | 147 | 107 |
| Assassin´s Creed Odyssey (2018) | 135 | 121 | 105 | 80 | 71 | 46 |
| Call of Duty Black Ops 4 (2018) | 288 | 241 | 232 | 223 | 159 | 84 |
| Hitman 2 (2018) | 66 | 63 | 56.8 | 55.8 | 55.1 | 54.8 |
| Battlefield V (2018) | 181 | 147 | 137 | 127 | 108 | 73 |
| Farming Simulator 19 (2018) | 220 | 163 | 143 | 133 | 132 | 104 |
| Darksiders III (2018) | 159 | 100 | 96 | 91 | 91 | 68 |
| Just Cause 4 (2018) | 227 | 195 | 153 | 148 | 111 | 67 |
| Apex Legends (2019) | 144 | 144 | 144 | 144 | 144 | 109 |
| Far Cry New Dawn (2019) | 128 | 110 | 106 | 96 | 92 | 73 |
| Metro Exodus (2019) | 143.9 | 122.9 | 104.4 | 89.7 | 71.9 | 47.5 |
| Anthem (2019) | 127 | 121 | 120 | 113 | 105 | 65 |
| Dirt Rally 2.0 (2019) | 302 | 212 | 200 | 139 | 112 | 70 |
| The Division 2 (2019) | 208 | 172 | 124 | 123 | 92 | 53 |
| Anno 1800 (2019) | 100 | 100 | 77 | 43.3 | 41.8 | 37.6 |
| Rage 2 (2019) | 212 | 181 | 164 | 159 | 110 | 55.7 |
| F1 2019 (2019) | 238 | 217 | 178 | 164 | 147 | 95 |
| Control (2019) | 239 | 163 | 126 | 84 | 42.6 | |
| Borderlands 3 (2019) | 147.8 | 131.1 | 116.5 | 101.3 | 78 | 43.6 |
| FIFA 20 (2019) | 269 | 269 | 255 | 253 | 247 | 249 |
Prestazioni di calcolo
Le prestazioni di calcolo spesso dipendono dalla CPU. L'Intel Core i9-9900K in combinazione con l'RTX 2080 Ti è la scelta migliore, ed è per questo che il nostro modello di recensione di KFA2 è stato battuto nei benchmarks di produttività. La GeForce RTX 2080 Ti non è in grado di stare al passo con la Nvidia Titan RTX. Coloro che hanno davvero bisogno di utilizzare applicazioni ad alta intensità di calcolo dovrebbero dare un'occhiata alle GPU Quadro professionali. Queste schede offrono prestazioni nettamente superiori grazie a driver ottimizzati.
| SiSoft Sandra 2016 | |
| Image Processing | |
| AMD Radeon VII | |
| Corsair One i160 | |
| KFA2 GeForce RTX 2080 Ti EX | |
| Nvidia GeForce RTX 2080 Super | |
| MSI RTX 2080 Gaming X Trio | |
| Nvidia GeForce RTX 2070 Super | |
| MSI RTX 2070 Gaming Z 8G | |
| Nvidia GeForce RTX 2060 Super | |
| AMD Radeon RX 5700 XT | |
| MSI RTX 2060 Gaming Z 6G | |
| AMD Radeon RX 5700 | |
| GP Cryptography (Higher Security AES256+SHA2-512) | |
| KFA2 GeForce RTX 2080 Ti EX | |
| Corsair One i160 | |
| MSI RTX 2080 Gaming X Trio | |
| AMD Radeon VII | |
| Nvidia GeForce RTX 2080 Super | |
| Nvidia GeForce RTX 2070 Super | |
| MSI RTX 2070 Gaming Z 8G | |
| Nvidia GeForce RTX 2060 Super | |
| MSI RTX 2060 Gaming Z 6G | |
| GP Financial Analysis (FP High/Double Precision) | |
| AMD Radeon VII | |
| Corsair One i160 | |
| KFA2 GeForce RTX 2080 Ti EX | |
| MSI RTX 2080 Gaming X Trio | |
| Nvidia GeForce RTX 2080 Super | |
| Nvidia GeForce RTX 2070 Super | |
| MSI RTX 2070 Gaming Z 8G | |
| Nvidia GeForce RTX 2060 Super | |
| MSI RTX 2060 Gaming Z 6G | |
| AMD Radeon RX 5700 XT | |
| AMD Radeon RX 5700 | |
Emissioni della KFA2 GeForce RTX 2080 Ti EX
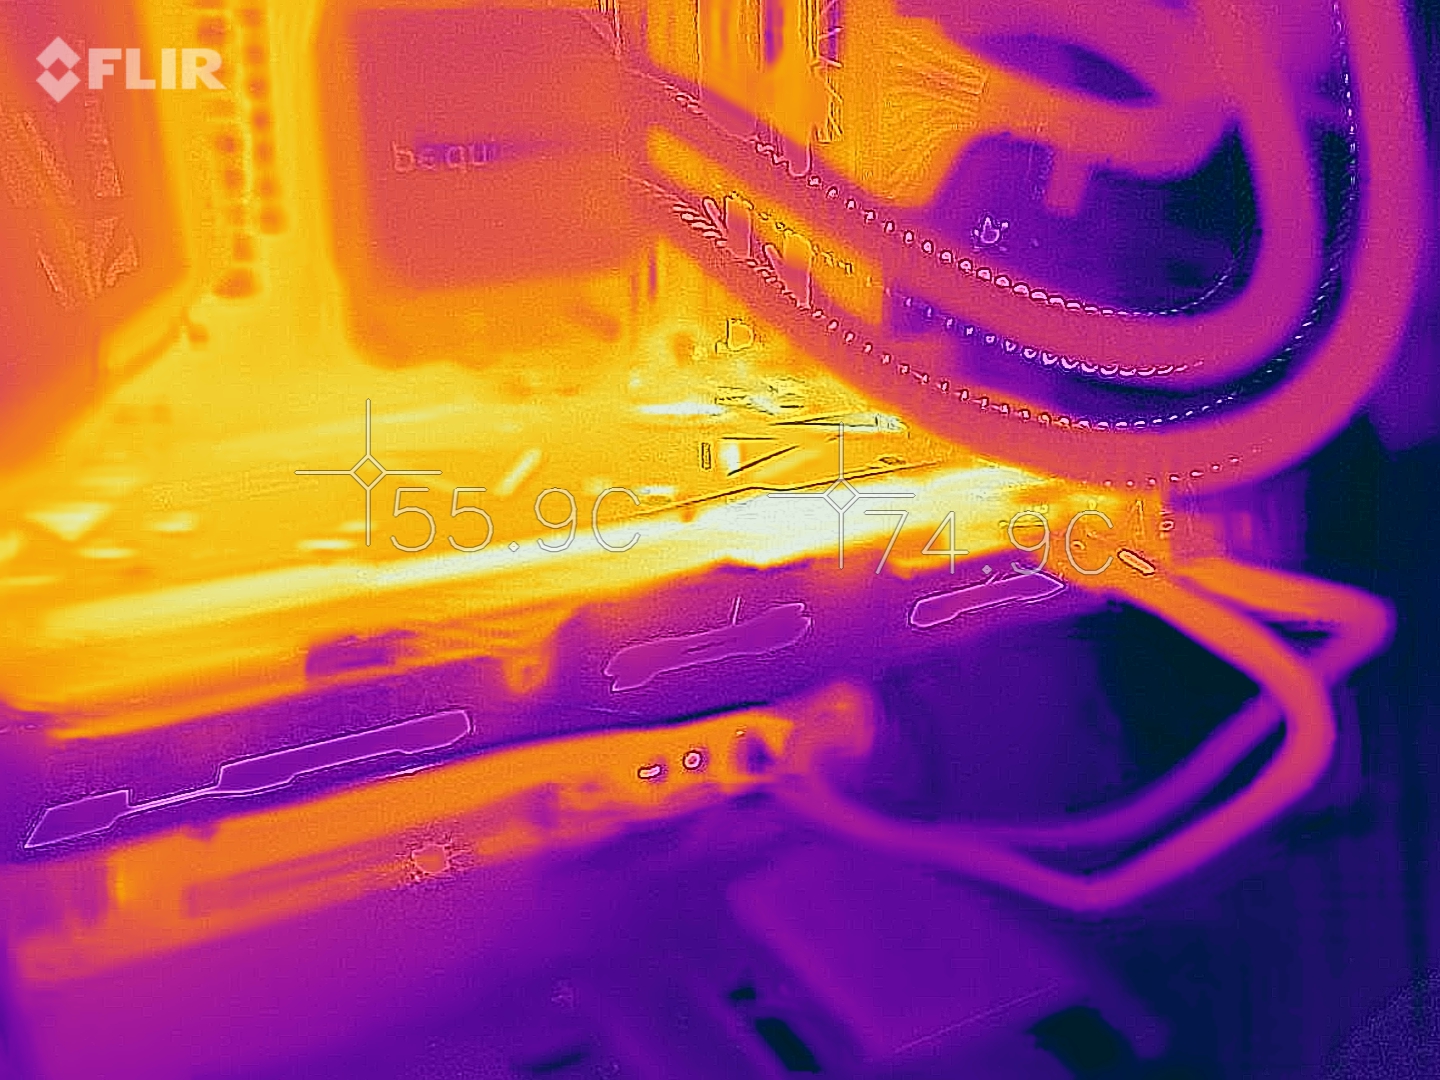
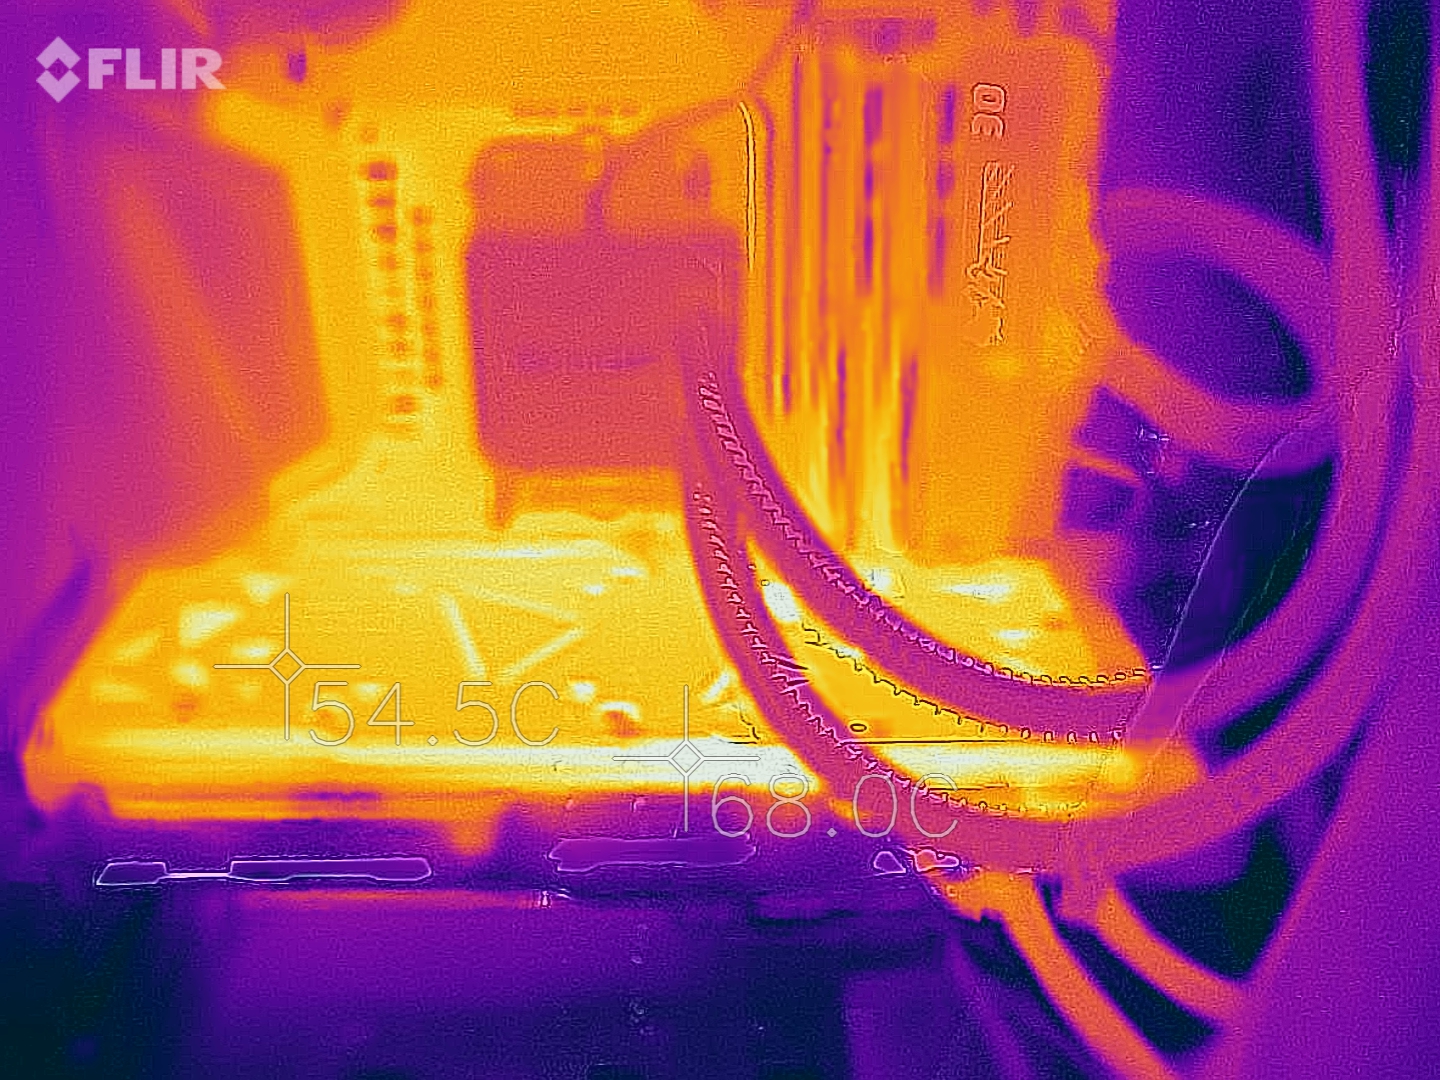
La GeForce RTX 2080 Ti EX di KFA2 ha le stesse specifiche del modello di riferimento. L'unico fattore di differenziazione è la soluzione di raffreddamento. A differenza del modello di riferimento, il modello RTX 2080 Ti della KFA2 è dotato di tre ventole di raffreddamento assiale. Le due ventole nella parte anteriore della GPU sono sempre attive. Tuttavia, girano a 1200 RPM (34%) in funzionamento 2D, motivo per cui sono molto silenziose. La ventola posteriore interviene solo quando la GPU è stressata.
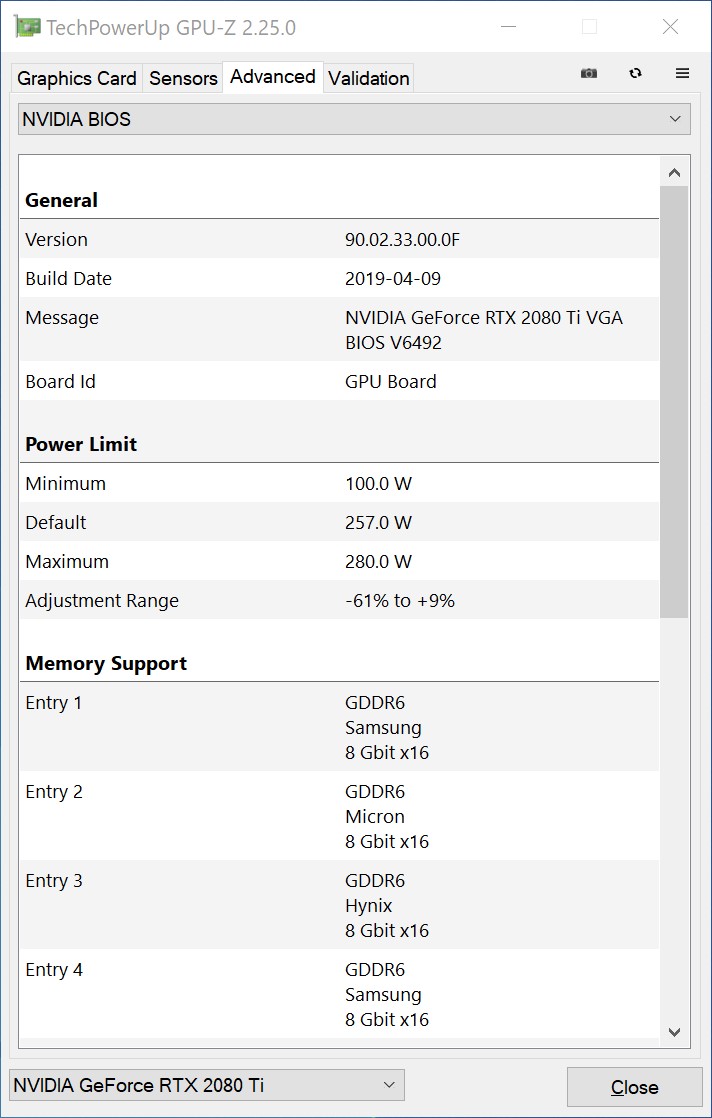
La GPU KFA2 ha un TDP di 250 watt. Si tratta di 10 watt in meno rispetto al TDP della scheda grafica Founders Edition, che richiede 260 watt di energia. L'obiettivo di potenza del nostro modello può essere aumentato dell'8%, il che porta a un TDP di 270 watt.
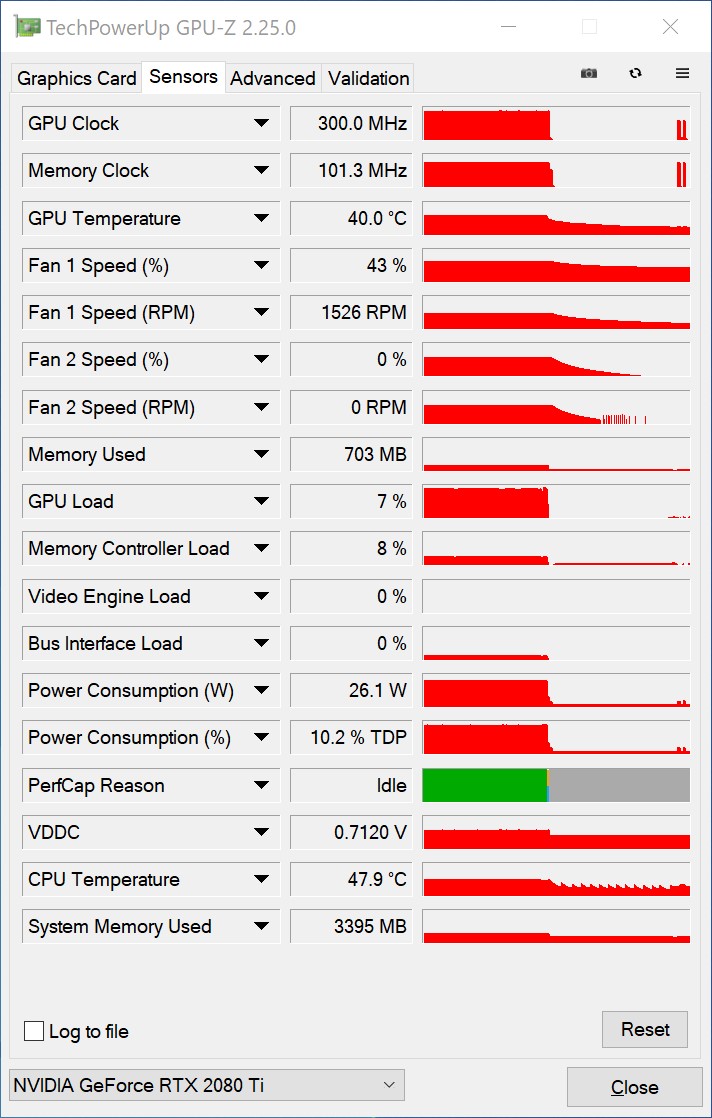
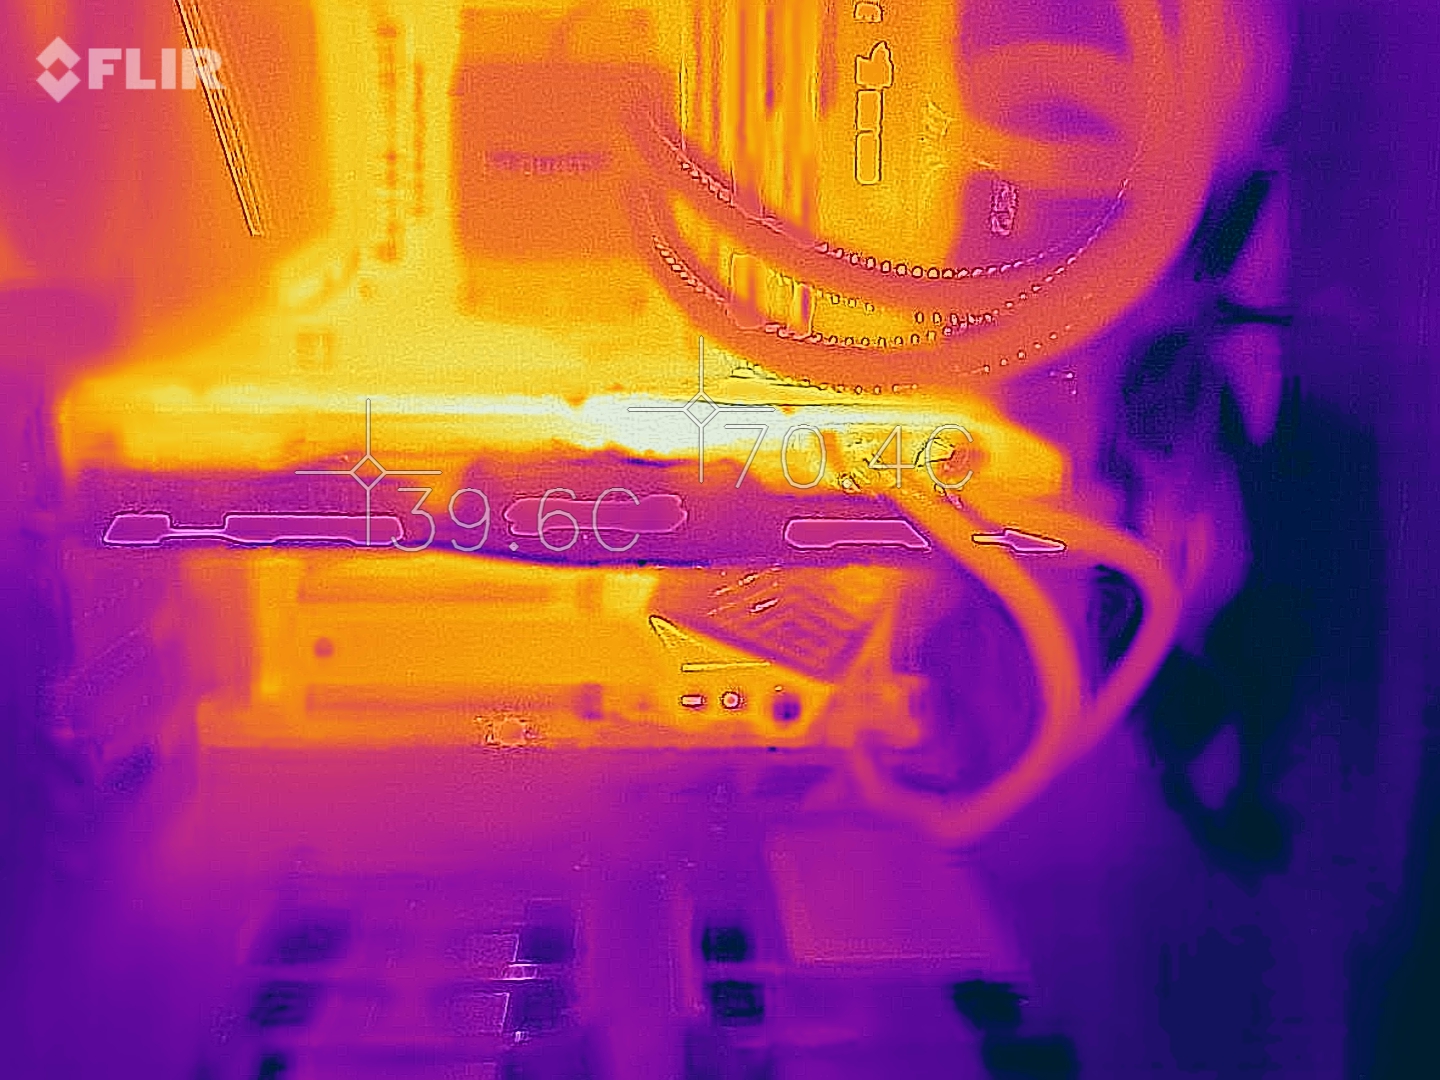
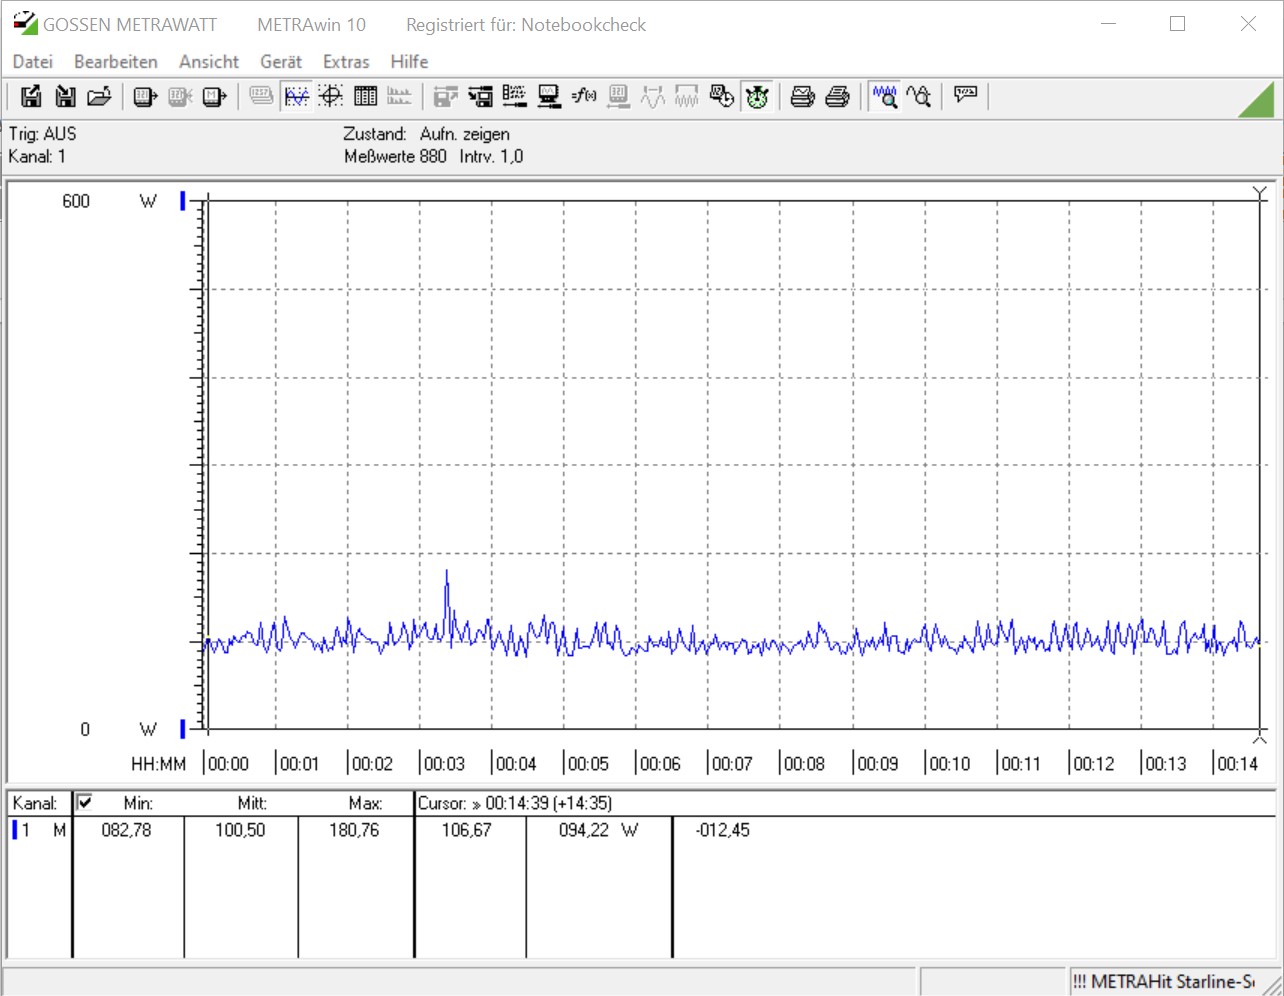
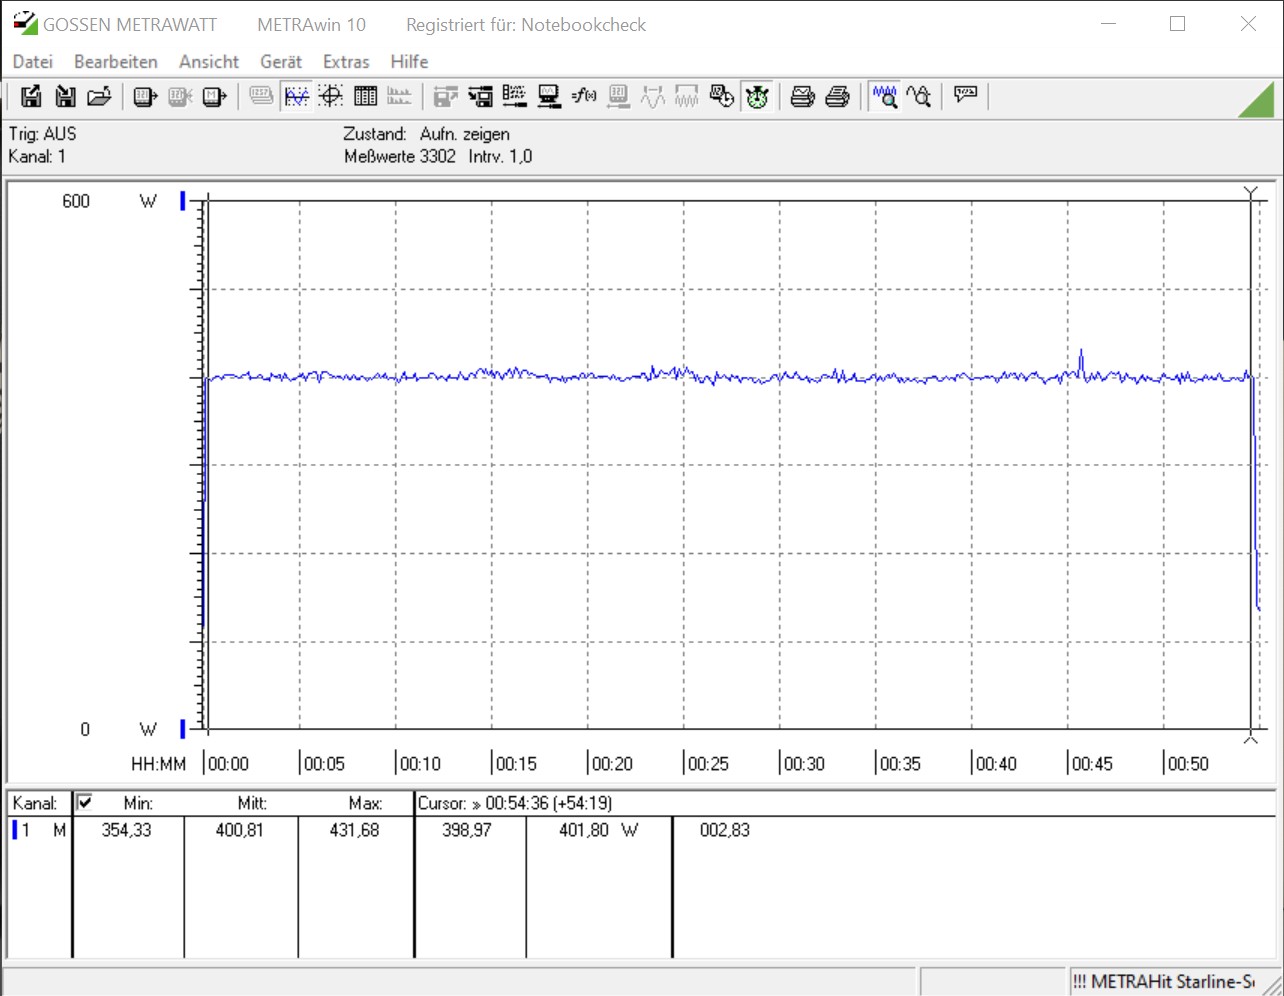
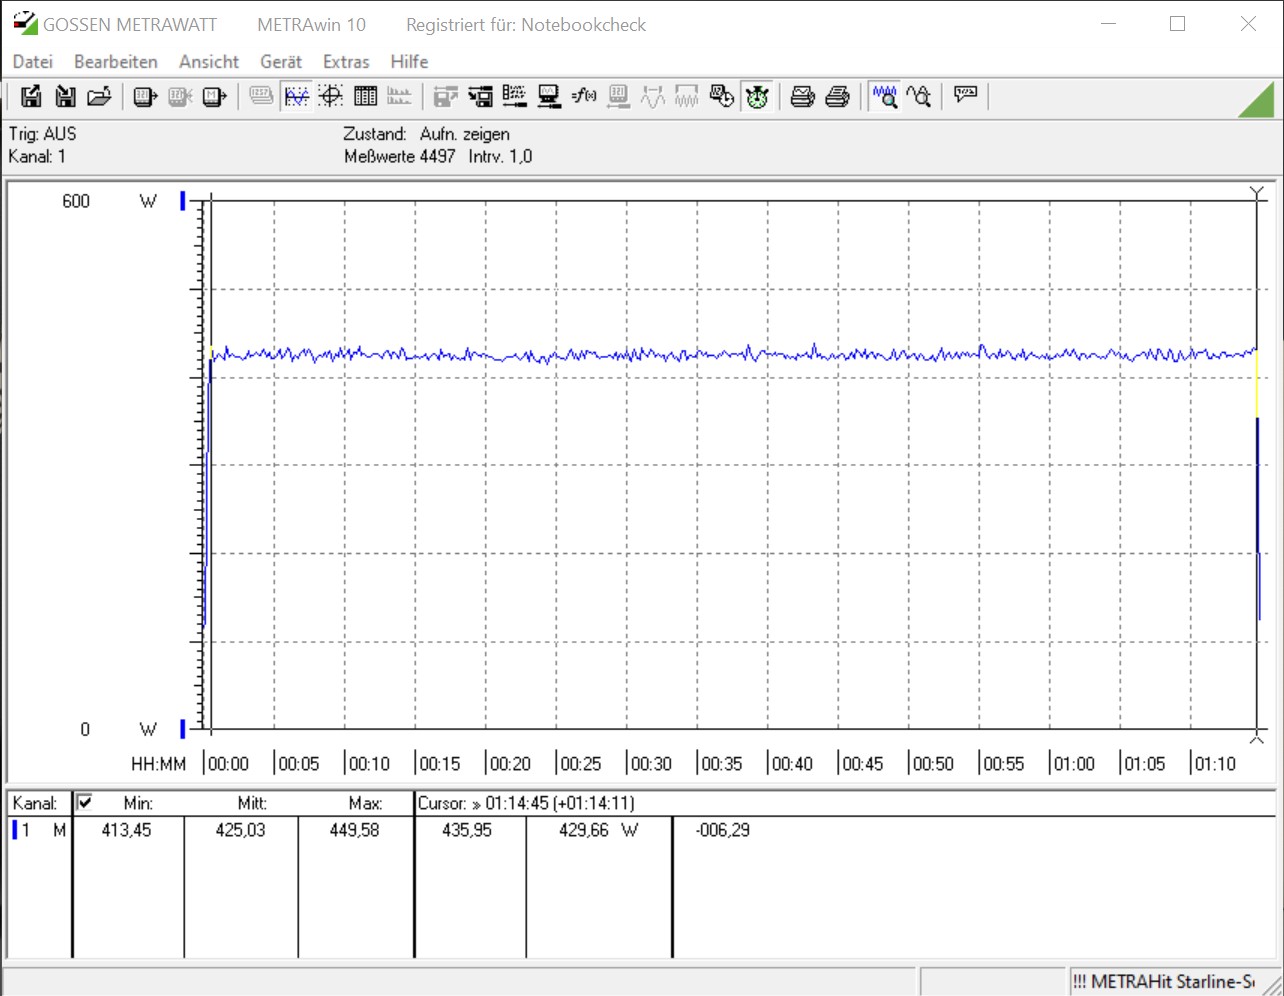
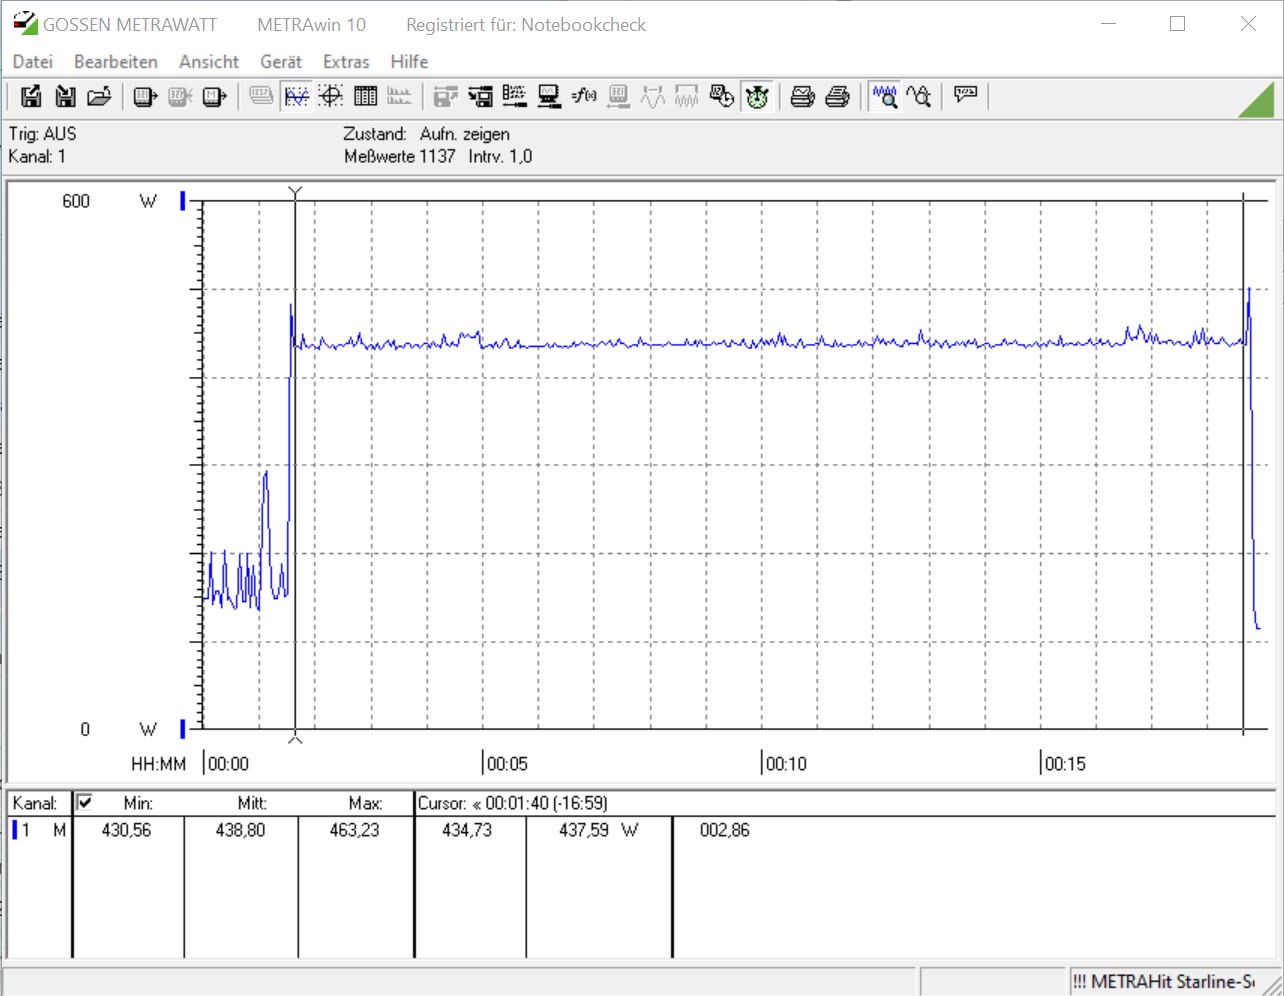
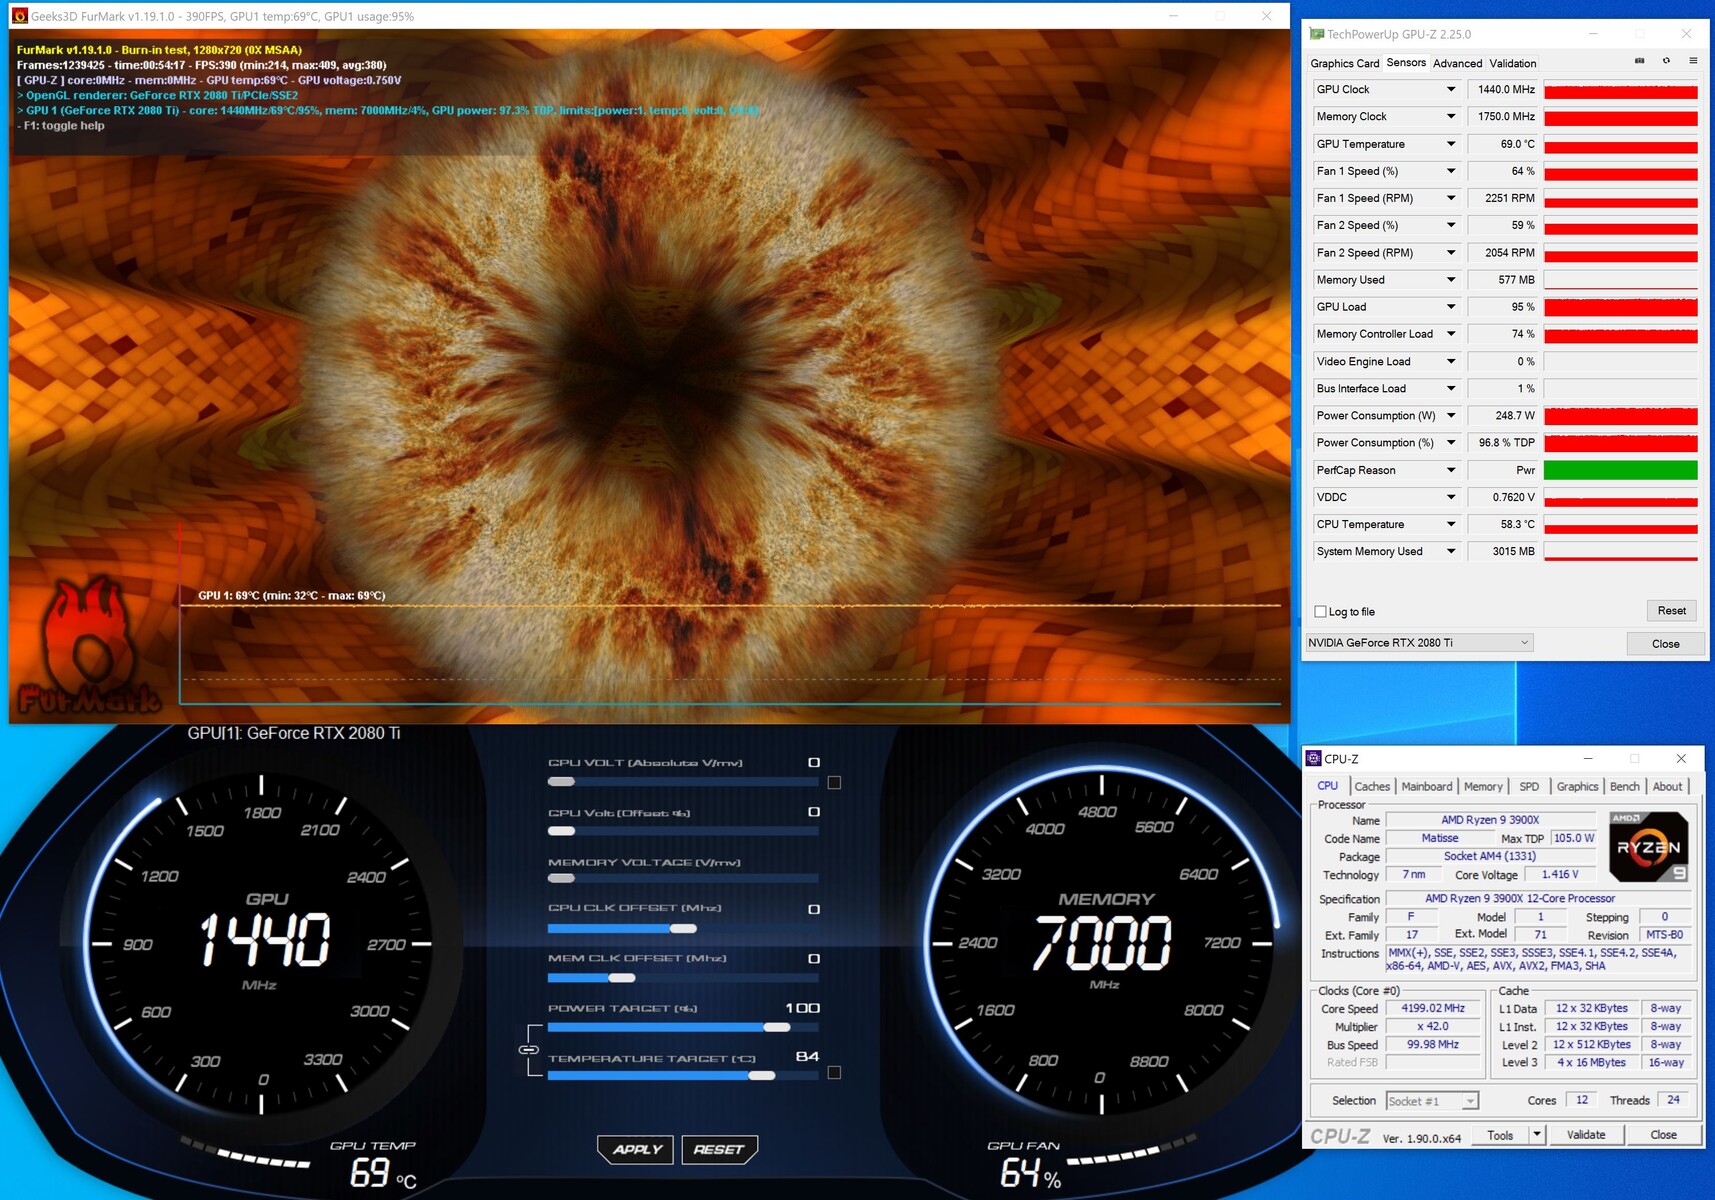
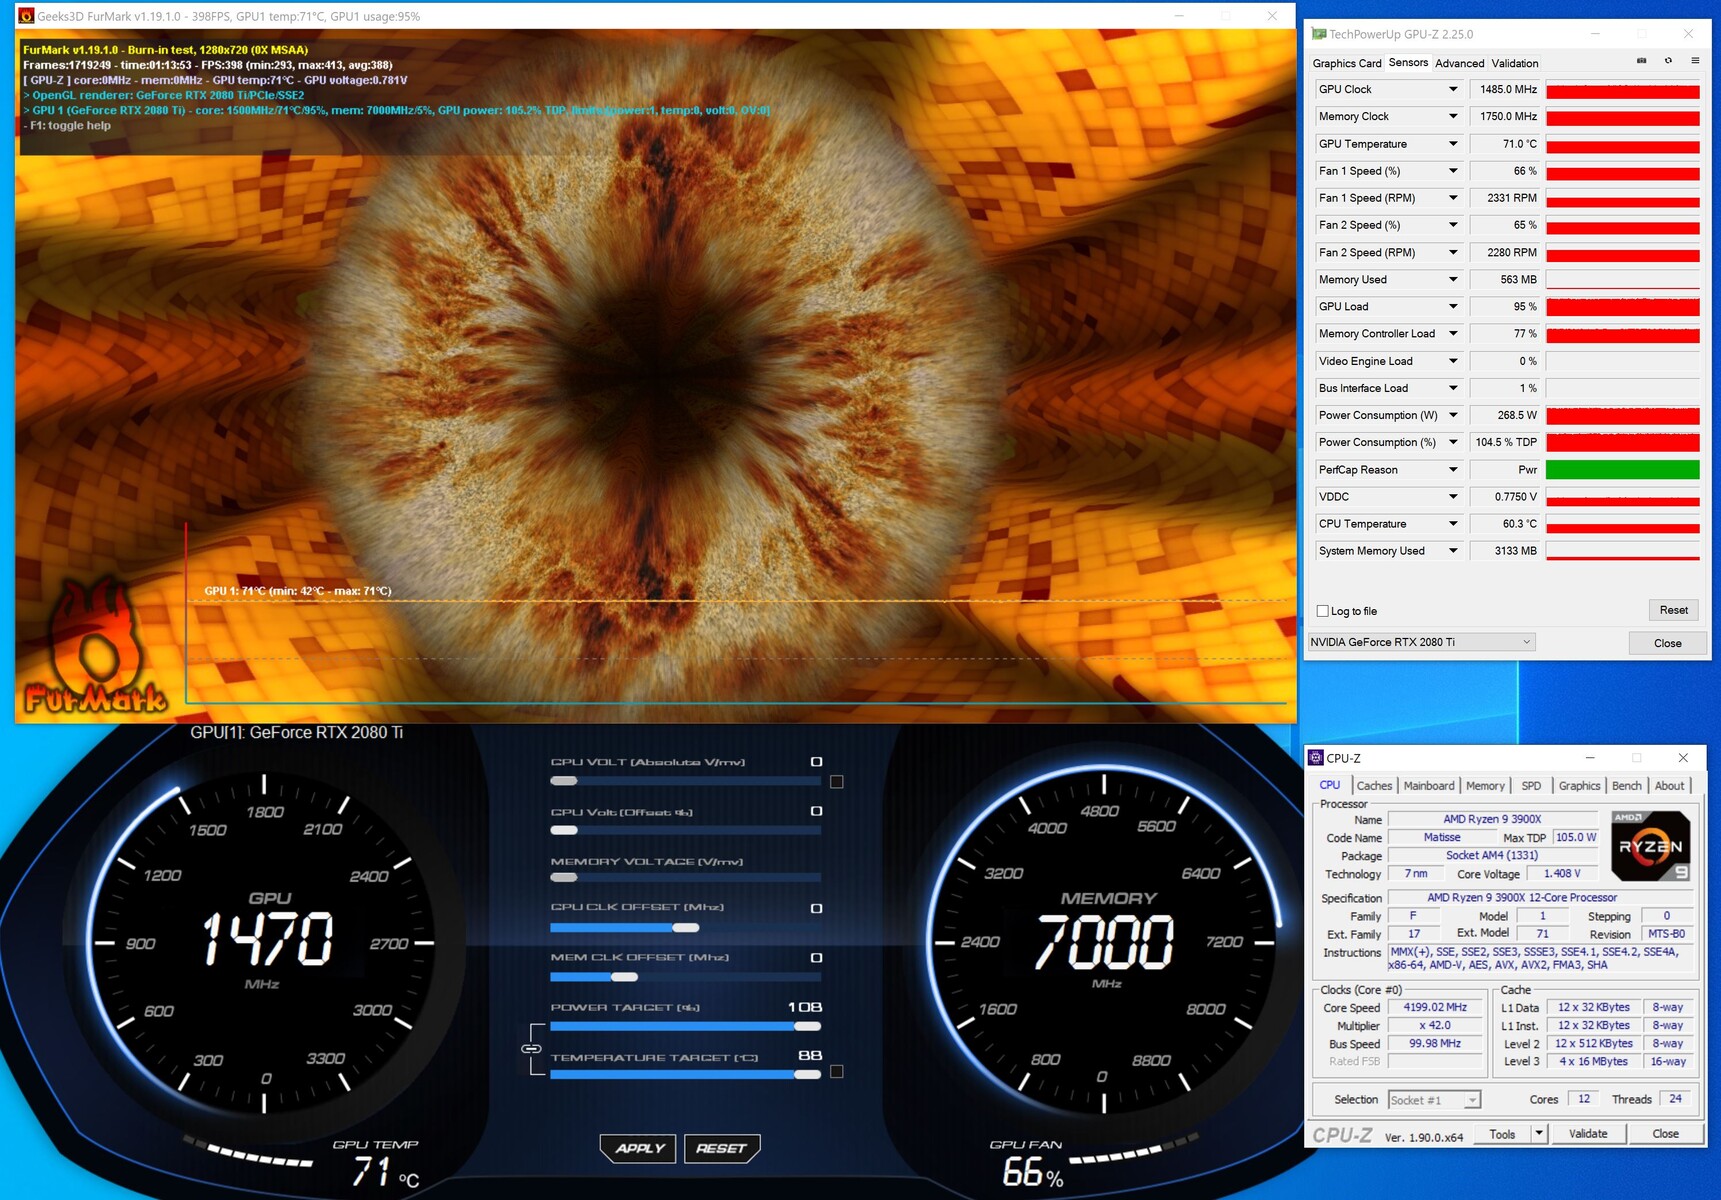
Quando è inattivo, il consumo energetico del sistema è pari a 100,5 watt. In condizioni di carico pesante, il consumo energetico del sistema (senza monitor) ha raggiunto il picco di circa 401 watt. Queste cifre sono ulteriormente confermate dalla GPU-Z, che porta il consumo energetico della scheda grafica a circa 250 watt. Con il target di potenza maggiore, la GPU consuma fino a 268,5 watt. Non ci sono problemi termici con la GPU KFA2. Sotto carico, le temperature raggiungono i 69 °C (156,2 °F). Con il target di potenza impostato al 108%, le temperature sono solo 2 °C (3,6 °F) più elevate.
Tutti i benchmarks sono stati condotti con il case chiuso per simulare uno scenario di utilizzo realistico.
| Power Consumption | |
| 1920x1080 The Witcher 3 ultra (external Monitor) | |
| KFA2 GeForce RTX 2080 Ti EX (Idle: 100.5 W) | |
| Nvidia Titan RTX | |
| Nvidia GeForce RTX 2080 Super (Idle: 86.2 W) | |
| AMD Radeon RX Vega 64 (Idle: 81.56 W) | |
| Nvidia GeForce RTX 2070 Super (Idle: 92.6 W) | |
| AMD Radeon RX 5700 XT (Idle: 83.2 W) | |
| Corsair One i160 (Idle: 51.5 W) | |
| KFA2 GeForce RTX 2060 Super (81.7 fps, Idle: 93.8 W) | |
| Nvidia GeForce RTX 2060 Super (Idle: 86.7 W) | |
| AMD Radeon RX 5700 (Idle: 77.9 W) | |
| 1280x720 FurMark 1.19 GPU Stress Test (external Monitor) | |
| Nvidia GeForce RTX 2080 Super (Idle: 86.2 W) | |
| KFA2 GeForce RTX 2080 Ti EX (Idle: 100.5 W) | |
| Nvidia GeForce RTX 2070 Super (Idle: 92.6 W) | |
| AMD Radeon RX 5700 XT (Idle: 83.2 W) | |
| Corsair One i160 (Idle: 51.5 W) | |
| KFA2 GeForce RTX 2060 Super (234 fps, Idle: 93.8 W) | |
| Nvidia GeForce RTX 2060 Super (Idle: 86.7 W) | |
| AMD Radeon RX 5700 (Idle: 77.9 W) | |
* ... Meglio usare valori piccoli
Overclocking - RTX 2080 Ti con un potenziale overclocking
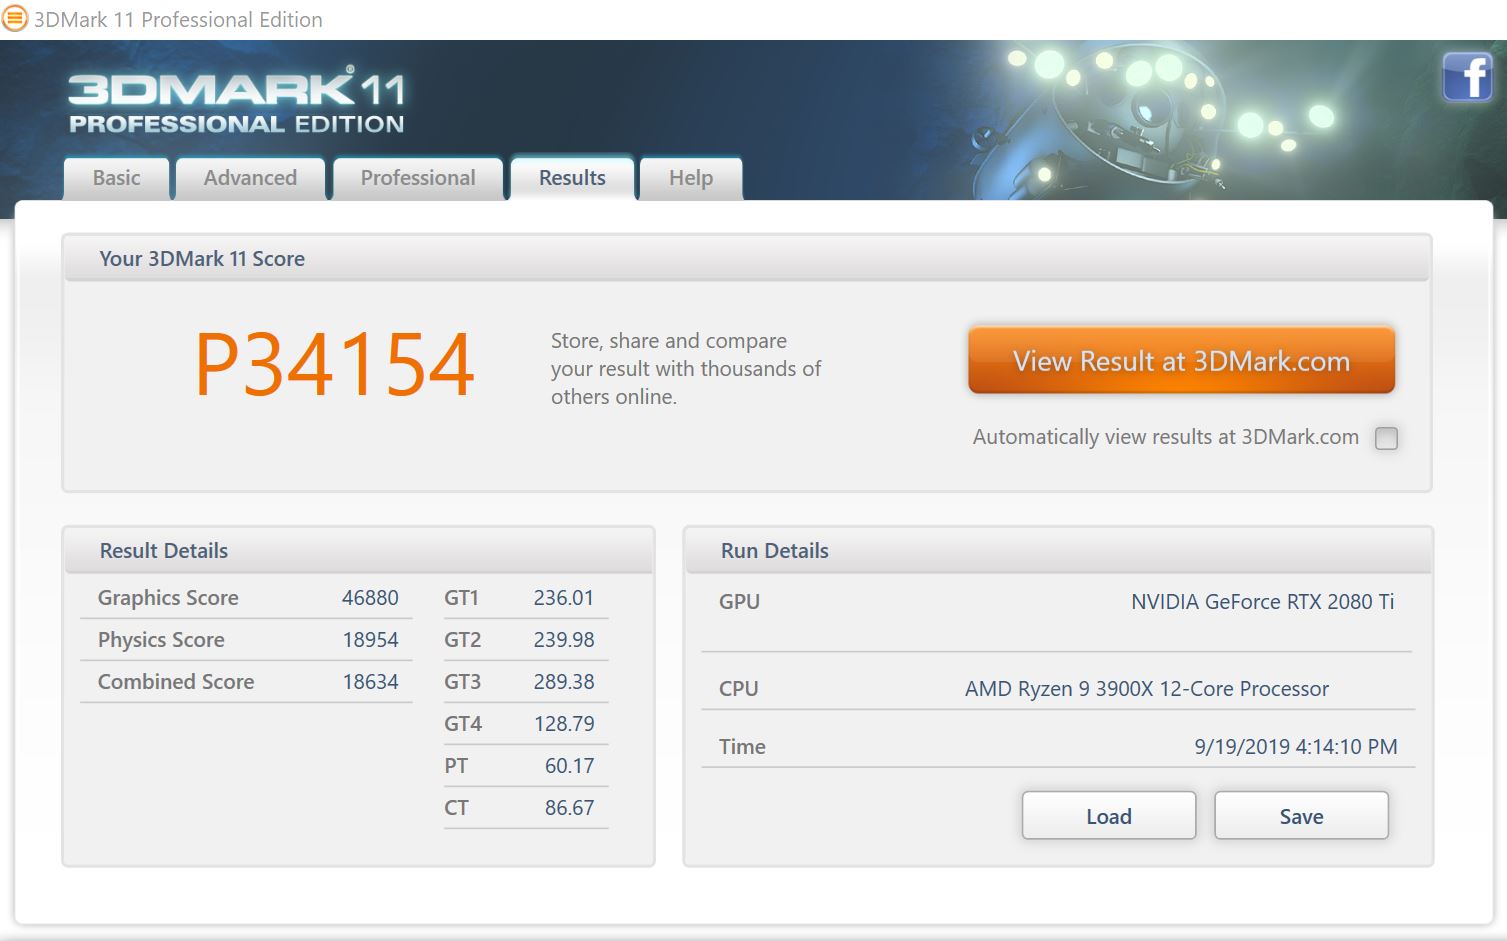
Anche se la KFA2 GeForce RTX 2080 Ti EX ha fatto una bella figura nella nostra recensione in termini di prestazioni, abbiamo comunque deciso di esplorare il suo potenziale di overclocking. La GPU KFA2 è dotata della funzione OC con un solo clic, che innalza il clock di base di 45 MHz e il power target al 108%. Questo porta ad un boost clock più alto e più stabile. Con la funzione OC 1-click OC attivata, la GPU offre prestazioni migliori del 4% in 3DMark 11.
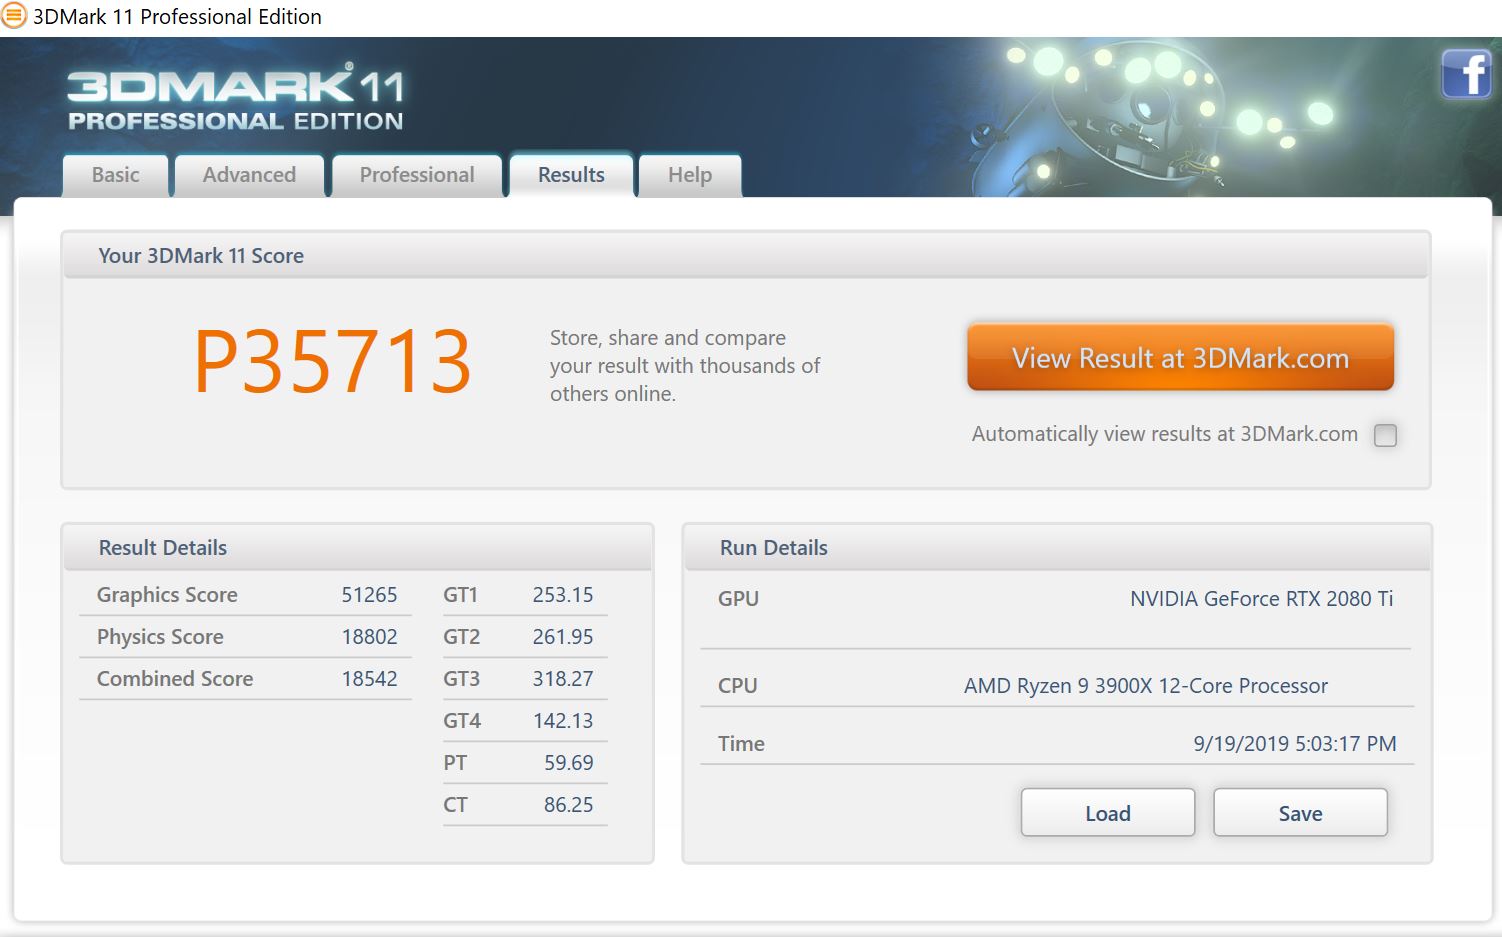
Tuttavia, questo non è stato sufficiente per noi. Grazie all'overclocking manuale siamo stati in grado di aumentare il core clock di 250 MHz e la velocità di memoria di 1250 MHz. I risultati parlano da soli. La GPU offre prestazioni migliori del 13% nelle applicazioni 3D dopo l'overclock manuale. Nel benchmark Time Spy basato su DirectX 12, si assiste effettivamente a un aumento del 14% delle prestazioni.
Naturalmente, la scheda grafica è abbastanza veloce così com'è, ed è per questo che non c'è davvero bisogno di overclocking. Tuttavia, il potenziale di overclocking sarà sicuramente utile con l'invecchiamento della GPU. In realtà, se la GPU assorbe 250 o 270 watt sotto carico non fa molta differenza nello schema generale delle cose.
Chi decide di raffreddare ad acqua la GPU sarà in grado di ottenere un po' di prestazioni in più. Tuttavia, in questo caso, si dovrà rinunciare all'illuminazione RGB.
Pro
Contro
Giudizio Complessivo - Un modello assolutamente di fascia alta
Prima di menzionare il prezzo vorremmo dire che la KFA2 GeForce RTX 2080 Ti EX è una scheda grafica desktop molto potente. A causa della lunghezza, gli utenti dovranno assicurarsi che questo mostro si adatti al loro case prima di acquistarla. Inoltre, la GPU richiede un alimentatore da 650 watt e due connettori a 8 pin.
In termini di prestazioni, questa scheda grafica è allo stesso livello delle altre RTX 2080 Ti ed è battuta solo dalla (molto) più costosa Nvidia Titan RTX. Chi vuole questa GPU dovrebbe farlo solo se ha intenzione di giocare a risoluzioni di gran lunga superiori a 1080p, perché attualmente la GeForce RTX 2080 Ti entra in gioco solo a risoluzioni molto elevate.
Pagare più di 1000 euro (1097 dollari) per una scheda grafica non è facile da digerire, ma se si vuole davvero giocare a 4K, allora si dovrebbe prendere in seria considerazione questa GPU.
Tuttavia, la KFA2 GeForce RTX 2080 Ti EX non sparirà dagli scaffali, perché un prezzo a quattro cifre sembra spaventoso per una GPU. Tuttavia, il modello KFA2 è un po' più economico del modello di riferimento, che costa 1259 euro ($1381). Inoltre, la GPU KFA2 offre anche un sistema di raffreddamento più grande e un'illuminazione RGB. La scheda grafica KFA2 è una delle versioni più economiche della RTX 2080 Ti.
Nel complesso, la GeForce RTX 2080 Ti offre prestazioni sufficienti per eseguire qualsiasi titolo moderno a 2160p. L'RTX 2080 Ti potrebbe essere interessante per chi aggiorna la propria GPU ogni due anni, perché sarà ancora abbastanza capace anche tra due anni, specialmente a 1080p o 1440p e con Raytracing disabilitato.
Anche la GeForce RTX 2080 Ti ha ottenuto dei punti importanti con le sue caratteristiche RTX. Tuttavia, alcuni titoli come Control richiedono già una GPU molto potente per poter essere riprodotti con Raytracing abilitato. Qui, la KFA2 GeForce RTX 2080 Ti EX raggiunge un frame rate medio di 72 FPS a 1080p, mentre la GeForce RTX 2080 Super riesce a raggiungere solo 53 FPS in media.
Benchmarks of all GeForce RTX 2080 Ti GPUs
Benchmark
3DM Vant. Perf. total +
specvp12 sw-03 +
Cinebench R15 OpenGL 64 Bit +
* Numeri più piccoli rappresentano prestazioni supeiori
Benchmarks per i giochi
I seguenti benchmarks deirivano dai benchmarks dei portatili recensiti. Le prestazioni dipendono dalla scheda grafica utilizzata, dal clock rate, dal processore, dai settaggi di sistema, dai drivers, e dai sistemi operativi. Quindi i risultati non sono rappresentativi per i portatili con questa GPU. Per informazioni dettagliate sui risultati del benchmark, cliccate sul numero di fps.

F1 2021
2021
Days Gone
2021


Outriders
2021
Hitman 3
2021
Cyberpunk 2077 1.0
2020

Yakuza Like a Dragon
2020


Dirt 5
2020
Watch Dogs Legion
2020
FIFA 21
2020
Star Wars Squadrons
2020

Serious Sam 4
2020
Crysis Remastered
2020

Horizon Zero Dawn
2020
Death Stranding
2020
F1 2020
2020
Valorant
2020
Gears Tactics
2020
Doom Eternal
2020
Hunt Showdown
2020
Escape from Tarkov
2020


Need for Speed Heat
2019

GRID 2019
2019

FIFA 20
2019
Borderlands 3
2019
Control
2019
F1 2019
2019

Rage 2
2019
Anno 1800
2019
The Division 2
2019
Dirt Rally 2.0
2019
Anthem
2019
Far Cry New Dawn
2019
Metro Exodus
2019
Apex Legends
2019
Just Cause 4
2018
Darksiders III
2018
Battlefield V
2018
Farming Simulator 19
2018
Hitman 2
2018


Forza Horizon 4
2018
FIFA 19
2018

F1 2018
2018
Monster Hunter World
2018
The Crew 2
2018
Far Cry 5
2018
World of Tanks enCore
2018
X-Plane 11.11
2018


Fortnite
2018


Call of Duty WWII
2017

Destiny 2
2017
ELEX
2017

Dirt 4
2017Rocket League
2017Prey
2017For Honor
2017
Resident Evil 7
2017Watch Dogs 2
2016
Dishonored 2
2016
Battlefield 1
2016
Overwatch
2016
Doom
2016

The Division
2016
Far Cry Primal
2016

Rainbow Six Siege
2015
World of Warships
2015Dota 2 Reborn
2015
The Witcher 3
2015
GTA V
2015
Battlefield 4
2013BioShock Infinite
2013Counter-Strike: GO
2012| basso | medio | alto | ultra | QHD | 4K | |
|---|---|---|---|---|---|---|
| F1 2021 | 254 | 237 | 147 | 119 | 68 | |
| Days Gone | 163 | 158 | 135 | 105 | 63.9 | |
| Mass Effect Legendary Edition | 132 | 126 | 125 | 115 | ||
| Resident Evil Village | 183 | 181 | 181 | 147 | 74.3 | |
| Outriders | 135 | 135 | 132 | 114 | 61.8 | |
| Hitman 3 | 171 | 164 | 162 | 147 | 85.2 | |
| Cyberpunk 2077 1.0 | 114 | 107 | 95.4 | 64 | 32.2 | |
| Immortals Fenyx Rising | 113 | 102 | 93 | 81 | 59 | |
| Yakuza Like a Dragon | 161 | 156 | 139 | 100 | 53.8 | |
| Call of Duty Black Ops Cold War | 155 | 133 | 118 | 89.2 | 54.4 | |
| Assassin´s Creed Valhalla | 107 | 91 | 80 | 67 | 46 | |
| Dirt 5 | 134 | 112 | 73.4 | 64.8 | 50 | |
| Watch Dogs Legion | 111 | 98.7 | 89.6 | 72.9 | 44 | |
| FIFA 21 | 269 | 266 | 255 | 254 | 251 | 247 |
| Star Wars Squadrons | 360 | 354 | 331 | 326 | 246 | 144 |
| Mafia Definitive Edition | 131 | 120 | 117 | 105 | 62.4 | |
| Serious Sam 4 | 185 | 123 | 117 | 108 | 107 | 86.3 |
| Crysis Remastered | 179 | 106 | 71.3 | 57.9 | 37.6 | |
| Flight Simulator 2020 | 84.4 | 70.8 | 58.6 | 47.3 | 46.5 | 32.7 |
| Horizon Zero Dawn | 159 | 146 | 133 | 115 | 94 | 54 |
| Death Stranding | 174 | 173 | 170 | 169 | 133 | 78.8 |
| F1 2020 | 289 | 247 | 240 | 202 | 162 | 100 |
| Valorant | 290 | 285 | 267 | 266 | 259 | |
| Gears Tactics | 321 | 243 | 166 | 126 | 101 | 64.7 |
| Doom Eternal | 315 | 290 | 266 | 259 | 204 | 113 |
| Hunt Showdown | 235 | 200 | 170 | 125 | 60.4 | |
| Escape from Tarkov | 121 | 121 | 121 | 121 | 120 | 73.4 |
| Red Dead Redemption 2 | 127 | 119 | 103 | 76 | 63 | 42.3 |
| Star Wars Jedi Fallen Order | 106 | 106 | 104 | 105 | 73 | |
| Need for Speed Heat | 93 | 91 | 67 | |||
| Call of Duty Modern Warfare 2019 | 162 | 127 | 77 | |||
| GRID 2019 | 141 | 118 | 77 | |||
| Ghost Recon Breakpoint | 103 | 82 | 52 | |||
| FIFA 20 | 269 | 269 | 255 | 253 | 247 | 249 |
| Borderlands 3 | 155 | 137 | 122 | 105 | 81 | 45 |
| Control | 240 | 166 | 129 | 87 | 44 | |
| F1 2019 | 269 | 243 | 192 | 171 | 145 | 96 |
| Total War: Three Kingdoms | 96.3 | 81.1 | 43.8 | |||
| Rage 2 | 287 | 195 | 171 | 166 | 114 | 58 |
| Anno 1800 | 108 | 106 | 81 | 45 | 43 | 40 |
| The Division 2 | 211 | 180 | 144 | 127 | 96 | 55 |
| Dirt Rally 2.0 | 304 | 228 | 220 | 166 | 133 | 83 |
| Anthem | 117 | 120 | 118 | 112 | 106 | 69 |
| Far Cry New Dawn | 133 | 114 | 110 | 100 | 98 | 76 |
| Metro Exodus | 154 | 131 | 109 | 94 | 75 | 50 |
| Apex Legends | 144 | 144 | 144 | 144 | 144 | 111 |
| Just Cause 4 | 232 | 197 | 156 | 149 | 112 | 66 |
| Darksiders III | 208 | 135 | 127 | 121 | 112 | 71 |
| Battlefield V | 189 | 170 | 164 | 159 | 134 | 86 |
| Farming Simulator 19 | 245 | 184 | 159 | 146 | 146 | 107 |
| Hitman 2 | 88 | 85 | 77 | 74 | 74 | 62 |
| Call of Duty Black Ops 4 | 285 | 244 | 235 | 213 | 166 | 87 |
| Assassin´s Creed Odyssey | 137 | 125 | 108 | 82 | 72 | 50 |
| Forza Horizon 4 | 212 | 184 | 182 | 163 | 143 | 105 |
| FIFA 19 | 361 | 346 | 321 | 317 | 313 | 300 |
| Shadow of the Tomb Raider | 158 | 144 | 143 | 136 | 110 | 61 |
| F1 2018 | 248 | 216 | 167 | 141 | 133 | 97 |
| Monster Hunter World | 188 | 182 | 179 | 145 | 102 | 49 |
| The Crew 2 | 60 | 60 | 60 | 60 | 60 | 60 |
| Far Cry 5 | 153 | 136 | 130 | 121 | 116 | 77 |
| World of Tanks enCore | 105 | |||||
| X-Plane 11.11 | 130 | 117 | 92 | 78 | ||
| Kingdom Come: Deliverance | 187 | 163 | 132 | 91 | 84 | 50 |
| Final Fantasy XV Benchmark | 198 | 162 | 121 | 57 | ||
| Fortnite | 381 | 302 | 232 | 216 | 151 | 79 |
| Star Wars Battlefront 2 | 198 | 190 | 179 | 138 | 76.9 | |
| Need for Speed Payback | 163 | 157 | 154 | 151 | 95.6 | |
| Call of Duty WWII | 313 | 308 | 224 | 203 | 172 | 113 |
| Assassin´s Creed Origins | 146 | 131 | 126 | 107 | 93 | 64 |
| Destiny 2 | 193 | 191 | 190 | 190 | 162 | 91 |
| ELEX | 121 | 121 | 121 | 116 | 62.3 | |
| Middle-earth: Shadow of War | 204 | 180 | 153 | 78 | ||
| Playerunknown's Battlegrounds (PUBG) | 221 | 201 | 193 | 191 | 88 | |
| Dirt 4 | 364 | 268 | 231 | 183 | 125 | |
| Rocket League | 250 | 250 | 249 | 209 | ||
| Prey | 144 | 144 | 144 | 123 | ||
| Ghost Recon Wildlands | 169 | 139 | 135 | 86 | 66 | |
| For Honor | 369 | 270 | 258 | 206 | 99 | |
| Resident Evil 7 | 599 | 382 | 316 | 117 | ||
| Watch Dogs 2 | 166 | 156 | 135 | 107 | 68 | |
| Dishonored 2 | 106 | 105 | 104 | 101 | 96 | |
| Battlefield 1 | 200 | 198 | 192 | 185 | 115 | |
| Deus Ex Mankind Divided | 177 | 165 | 143 | 103 | 69 | |
| Overwatch | 300 | 300 | 300 | 297 | 193 | |
| Doom | 191 | 176 | 164 | 162 | 138 | |
| Ashes of the Singularity | 89.4 | 83.4 | ||||
| The Division | 341 | 282 | 196 | 158 | 90 | |
| Far Cry Primal | 139 | 126 | 116 | 107 | 90 | |
| Rise of the Tomb Raider | 335 | 231 | 217 | 200 | 95 | |
| Rainbow Six Siege | 448 | 370 | 338 | 320 | 180 | |
| World of Warships | 168 | |||||
| Dota 2 Reborn | 154 | 145 | 146 | 140 | 137 | |
| The Witcher 3 | 399 | 342 | 247 | 134 | 98 | |
| GTA V | 180 | 174 | 165 | 103 | 142 | |
| Battlefield 4 | 200 | 200 | 200 | 200 | 152 | |
| BioShock Infinite | 419 | 384 | 355 | 246 | ||
| Counter-Strike: GO | 270 | |||||
| basso | medio | alto | ultra | QHD | 4K | < 30 fps < 60 fps < 120 fps ≥ 120 fps | 6 62 | 13 74 | 1 21 66 | 2 29 55 | 3 38 27 | 23 57 16 |
Per conoscere altri giochi che potrebbero essere utilizzabili e per una lista completa di tutti i giochi e delle schede grafiche visitate la nostra Gaming List