Notebookcheck Logo

NVIDIA GeForce GTX 1080 (Desktop)

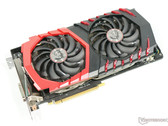
La Nvidia GeForce GTX 1080 è una veloce scheda grafica desktop basata sull'architettura Pascal. È stata annunciata nel maggio 2016 e offre tutti i 2.560 shader del chip GP104 utilizzato. Inoltre, la GPU è accoppiata con 8 GB di memoria grafica GDDR5X utilizzando un'interfaccia a 256 Bit (10 GHz, 320 GB/s). Il chip è prodotto da TSMC in 16nm (FinFET). Il TDP è specificato a 180 Watt e quindi leggermente superiore al predecessore, la GTX 980 con 165 Watt.

GeForce GTX 1000 Serie

GeForce GTX 1080 Ti 3584 @ 1.48 - 1.6 GHz352 Bit @ 11000 MHz
GeForce GTX 1080 SLI (Laptop) 5120 @ 1.56 - 1.73 GHz256 Bit @ 10000 MHz
GeForce GTX 1070 SLI (Desktop) 3840 @ 1.51 - 1.68 GHz256 Bit @ 8000 MHz
GeForce GTX 1070 SLI (Laptop) 4096 @ 1.44 - 1.65 GHz256 Bit @ 8000 MHz
GeForce GTX 1080 (Desktop) 2560 @ 1.61 - 1.73 GHz256 Bit @ 10000 MHz
GeForce GTX 1080 Mobile 2560 @ 1.57 - 1.73 GHz256 Bit @ 10000 MHz
GeForce GTX 1070 Ti (Desktop) 2432 @ 1.61 - 1.68 GHz256 Bit @ 8000 MHz
GeForce GTX 1070 (Desktop) 1920 @ 1.51 - 1.68 GHz256 Bit @ 8000 MHz
GeForce GTX 1080 Max-Q 2560 @ 1.1 - 1.28 GHz256 Bit @ 10000 MHz
GeForce GTX 1070 Mobile 2048 @ 1.44 - 1.65 GHz256 Bit @ 8000 MHz
GeForce GTX 1070 Max-Q 2048 @ 1.1 - 1.27 GHz256 Bit @ 8000 MHz
GeForce GTX 1060 (Desktop) 1280 @ 1.51 - 1.71 GHz192 Bit @ 8000 MHz
GeForce GTX 1060 Mobile 1280 @ 1.4 - 1.67 GHz192 Bit @ 8000 MHz
GeForce GTX 1060 Max-Q 1280 @ 1.06 - 1.34 GHz192 Bit @ 8000 MHz
GeForce GTX 1050 Ti Mobile 768 @ 1.49 - 1.62 GHz128 Bit @ 7000 MHz
GeForce GTX 1050 Ti (Desktop) 768 @ 1.29 - 1.39 GHz128 Bit @ 7008 MHz
GeForce GTX 1050 Ti Max-Q 768 @ 1.15 - 1.29 GHz128 Bit @ 7000 MHz
GeForce GTX 1050 (Desktop) 640 @ 1.35 - 1.46 GHz128 Bit @ 7008 MHz
GeForce GTX 1050 Mobile 640 @ 1.35 - 1.49 GHz128 Bit @ 7000 MHz
GeForce GTX 1050 Max-Q 640 @ 1 - 1.14 GHz128 Bit @ 7000 MHz
GeForce GT 1030 (Desktop) 384 @ 1.23 - 1.67 GHz64 Bit @ 6000 MHz
Nome in codicePascal GP104
ArchitetturaPascal
Pipelines2560 - unified
Velocità del core1607 - 1733 (Boost) MHz
Velocità della memoria10000 MHz
Larghezza del bus di memoria256 Bit
Tipo di memoriaGDDR5X
Max. quantità di memoria8 GB
Memoria condivisano
APIDirectX 12_1, OpenGL 4.5
Consumo di corrente180 Watt
Transistor Count7.2 Billion
tecnologia16 nm
CaratteristicheMulti-Projection, VR Ready, G-SYNC, Vulkan, Multi Monitor, 500 Watt system power recommended
Data dell'annuncio06.05.2016

Benchmark

Performance Rating - 3DMark 11 + Fire Strike + Time Spy
31.7 pt (32%)
3DMark - 3DMark Time Spy Score
min: 6423     media: 6926     media: 6902 (21%)     massimo: 7922 Points
3DMark - 3DMark Time Spy Graphics
min: 6867     media: 7227     media: 7185 (19%)     massimo: 7592 Points
112 -98%
...
6274 -13%
6422 -11%
AMD Radeon RX Vega 56
6482 -10%
6531 -10%
6745 -7%
6764 -6%
6867 -5%
7044 -3%
7129 -1%
NVIDIA GeForce GTX 1080 (Desktop)
7227
7284 1%
7432 3%
NVIDIA GeForce RTX 2070 Super Max-Q
7445 3%
7651 6%
AMD Radeon RX 5600 XT (Desktop)
7696 6%
7732 7%
7873 9%
7903 9%
NVIDIA GeForce RTX 3060 Laptop GPU
8044 11%
...
35930 397%
0%
100%
3DMark - 3DMark Ice Storm Unlimited Graphics
min: 358774     media: 417948     media: 421474 (49%)     massimo: 470072 Points
3DMark - 3DMark Ice Storm Extreme Graphics
min: 239440     media: 248992     media: 248992 (34%)     massimo: 258543 Points
3DMark - 3DMark Cloud Gate Score
min: 27092     media: 30829     media: 31475 (34%)     massimo: 35343 Points
3DMark - 3DMark Cloud Gate Graphics
min: 79091     media: 115297     media: 119971 (32%)     massimo: 129042 Points
3DMark - 3DMark Fire Strike Standard Score
min: 13278     media: 16733     media: 16623 (29%)     massimo: 20814 Points
3DMark - 3DMark Fire Strike Standard Graphics
min: 15834     media: 20727     media: 21408.5 (24%)     massimo: 22887 Points
3DMark - 3DMark Ice Storm Graphics
min: 255021     media: 272250     media: 272250 (35%)     massimo: 289478 Points
3DMark 11 - 3DM11 Performance Score
min: 15758     media: 20943     media: 21289.5 (31%)     massimo: 26308 Points
3DMark 11 - 3DM11 Performance GPU
min: 19910     media: 28484     media: 29263 (25%)     massimo: 32126 Points
171.8 -99%
...
25897 -9%
26602 -7%
NVIDIA GeForce RTX 3060 Laptop GPU
26750 -6%
NVIDIA GeForce RTX 2070 Super Max-Q
27104 -5%
27163 -5%
27503 -3%
NVIDIA GeForce RTX 3060
27785 -2%
27852 -2%
28106 -1%
NVIDIA GeForce GTX 1080 (Desktop)
28484
AMD Radeon RX Vega 56
29086 2%
Intel Arc A730M
29144 2%
NVIDIA GeForce RTX 2070 Super Mobile
29416 3%
29642 4%
29663 4%
29866 5%
30407 7%
30962 9%
AMD Radeon RX 5700 (Desktop)
31059 9%
...
105202 269%
0%
100%
3DMark Vantage
3DM Vant. Perf. total +
3DMark Vantage - 3DM Vant. Perf. total
53598 Points (16%)
3DM Vant. Perf. GPU no PhysX +
3DMark Vantage - 3DM Vant. Perf. GPU no PhysX
68463 Points (39%)
62 -100%
...
63088 -8%
63137 -8%
AMD Radeon VII
63240 -8%
Intel Arc A730M
64146 -6%
64543 -6%
66360 -3%
66735 -3%
67486 -1%
68082 -1%
NVIDIA GeForce GTX 1080 (Desktop)
68463
68614 0%
NVIDIA GeForce RTX 3060 Laptop GPU
68627 0%
NVIDIA GeForce RTX 2070 Super Max-Q
69136 1%
69467 1%
70700 3%
73171 7%
74008 8%
74946 9%
NVIDIA GeForce RTX 2070 Super Mobile
75429 10%
...
169569 148%
0%
100%
3DMark 2001SE - 3DMark 2001 - Standard
94578 Points (98%)
3DMark 03 - 3DMark 03 - Standard
176008 Points (92%)
3DMark 05 - 3DMark 05 - Standard
46728 Points (51%)
Intel Graphics Media Accelerator (GMA) 500
133.4 -100%
...
AMD Radeon Pro W6800
38177 -18%
38243 -18%
38535 -18%
NVIDIA GeForce GTX 1070 SLI (Desktop)
38635 -17%
43011 -8%
43361 -7%
46145 -1%
NVIDIA GeForce RTX 3070 Laptop GPU
46269 -1%
46380 -1%
NVIDIA GeForce GTX 1080 (Desktop)
46728
48523 4%
NVIDIA GeForce RTX 3060 Laptop GPU
48758 4%
49414 6%
AMD Radeon 680M
49504 6%
50971 9%
52117 12%
52987 13%
54279 16%
55811 19%
...
NVIDIA GeForce RTX 3070 Ti
86144 84%
0%
100%
3DMark 06 3DMark 06 - Standard 1280x1024 +
3DMark 06
37251 Points (52%)
Unigine Valley 1.0 - Unigine Valley 1.0 DX
min: 106.9     media: 108.4     media: 108.4 (37%)     massimo: 109.8 fps
Unigine Heaven 3.0 - Unigine Heaven 3.0 DX 11
269 fps (89%)
SPECviewperf 12
specvp12 sw-03 +
SPECviewperf 12 - specvp12 sw-03
min: 53.7     media: 60.7     media: 60.7 (17%)     massimo: 67.7 fps
specvp12 snx-02 +
SPECviewperf 12 - specvp12 snx-02
min: 7.78     media: 8.2     media: 8.2 (2%)     massimo: 8.67 fps
specvp12 showcase-01 +
SPECviewperf 12 - specvp12 showcase-01
min: 83.4     media: 97.7     media: 97.7 (21%)     massimo: 112 fps
specvp12 mediacal-01 +
SPECviewperf 12 - specvp12 mediacal-01
min: 23.04     media: 34.3     media: 34.3 (10%)     massimo: 45.6 fps
specvp12 maya-04 +
SPECviewperf 12 - specvp12 maya-04
min: 117.9     media: 140.5     media: 140.5 (38%)     massimo: 163 fps
specvp12 energy-01 +
specvp12 creo-01 +
SPECviewperf 12 - specvp12 creo-01
min: 47.97     media: 54.4     media: 54.4 (28%)     massimo: 60.9 fps
specvp12 catia-04 +
SPECviewperf 12 - specvp12 catia-04
min: 66.1     media: 76.2     media: 76.2 (14%)     massimo: 86.3 fps
Cinebench R10 Cinebench R10 Shading (32bit) +
Cinebench R10 - Cinebench R10 Shading (32bit)
min: 6206     media: 6497     media: 6496.5 (5%)     massimo: 6787 punti
Cinebench R11.5 Cinebench R11.5 OpenGL 64 Bit +
Cinebench R15
Cinebench R15 OpenGL 64 Bit +
Cinebench R15 - Cinebench R15 OpenGL 64 Bit
min: 104.8     media: 127.9     media: 121.8 (31%)     massimo: 157 fps
Cinebench R15 OpenGL Ref. Match 64 Bit +
Cinebench R15 - Cinebench R15 OpenGL Ref. Match 64 Bit
99.6 % (100%)
LuxMark v2.0 64Bit - LuxMark v2.0 Room GPU
min: 2136     media: 2566     media: 2327 (11%)     massimo: 3235 Samples/s
LuxMark v2.0 64Bit - LuxMark v2.0 Sala GPU
min: 4708     media: 5412     media: 4791 (8%)     massimo: 6736 Samples/s
ComputeMark v2.1 - ComputeMark v2.1 Result
min: 16203     media: 16777     media: 16548.5 (18%)     massimo: 17806 punti
Power Consumption - Furmark Stress Test Power Consumption - external Monitor *
min: 229.7     media: 280.4     media: 267.5 (38%)     massimo: 357 Watt
Power Consumption - The Witcher 3 Power Consumption - external Monitor *
min: 243.1     media: 280.3     media: 273.5 (38%)     massimo: 331 Watt
Power Consumption - Witcher 3 Power Consumption *
min: 150.3     media: 196.7     media: 196.7 (43%)     massimo: 243.1 Watt
Power Consumption - Witcher 3 ultra Power Efficiency
min: 0.2708     media: 0.3     media: 0.3 (34%)     massimo: 0.3867 Points per Watt
Power Consumption - Witcher 3 ultra Power Efficiency - external Monitor
min: 0.2477     media: 0.3     media: 0.3 (28%)     massimo: 0.3867 Points per Watt
Clock Speed - GPU Clock Witcher 3 ultra
min: 1764     media: 1768     media: 1768 (74%)     massimo: 1772 MHz
Clock Speed - GPU Clock Speed Furmark
min: 1508     media: 1519     media: 1518.5 (60%)     massimo: 1529 MHz
- Valori di benchmark per questa scheda grafica
- Valori medi di benchmark per questa scheda grafica
* Numeri più piccoli rappresentano prestazioni supeiori

Benchmarks per i giochi

I seguenti benchmarks deirivano dai benchmarks dei portatili recensiti. Le prestazioni dipendono dalla scheda grafica utilizzata, dal clock rate, dal processore, dai settaggi di sistema, dai drivers, e dai sistemi operativi. Quindi i risultati non sono rappresentativi per i portatili con questa GPU. Per informazioni dettagliate sui risultati del benchmark, cliccate sul numero di fps.

ultra 1920x1080
58  fps    + Confronta
QHD 2560x1440
37  fps    + Confronta
4K 3840x2160
23  fps    + Confronta
» Giocabile con tutti i portatili testati con dettagli ultra.
basso 1280x720
68.4  fps    + Confronta
medio 1920x1080
62.3  fps    + Confronta
alto 1920x1080
49  fps    + Confronta
ultra 1920x1080
33.7  fps    + Confronta
QHD 2560x1440
26.3  fps    + Confronta
4K 3840x2160
14.9  fps    + Confronta
» Giocabile con tutti i portatili testati con dettagli alto.
F1 2020

F1 2020

2020
basso 1280x720
236  fps    + Confronta
medio 1920x1080
201  fps    + Confronta
alto 1920x1080
174  fps    + Confronta
ultra 1920x1080
121  fps    + Confronta
QHD 2560x1440
91.6  fps    + Confronta
4K 3840x2160
53.3  fps    + Confronta
» Giocabile con tutti i portatili testati con dettagli ultra.
QHD 2560x1440
60   fps    + Confronta
4K 3840x2160
30.2  fps    + Confronta
basso 1280x720
152  fps    + Confronta
medio 1920x1080
96.4  fps    + Confronta
alto 1920x1080
64.3  fps    + Confronta
ultra 1920x1080
41.1  fps    + Confronta
QHD 2560x1440
34.7  fps    + Confronta
4K 3840x2160
21.3  fps    + Confronta
» Giocabile con tutti i portatili testati con dettagli ultra.
medio 1920x1080
114  fps    + Confronta
alto 1920x1080
108  fps    + Confronta
ultra 1920x1080
105  fps    + Confronta
QHD 2560x1440
80.9  fps    + Confronta
4K 3840x2160
41.8  fps    + Confronta
» Giocabile con tutti i portatili testati con dettagli ultra.
basso 1280x720
128  fps    + Confronta