Recensioni Notebook con NVIDIA GeForce RTX 4060 Laptop GPU la scheda grafica
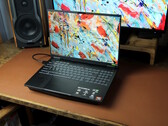
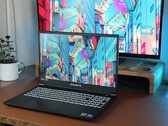
Recensione dell'Asus TUF Gaming A16: Un portatile per il gaming, silenzioso ed ecoomico, con un punto debole importante, ma superabile
Un Ryzen AI 9 HX 370 più una RTX 4060 e un display da 144 Hz con risoluzione di 1.200p sono le principali attrattive di Asus TUF Gaming A16. Testiamo questo portatile da gioco da 16 pollici relativamente conveniente e diamo un'occhiata alle sue prestazioni rispetto alla concorrenza.
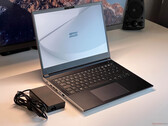
AMD Ryzen AI 9 HX 370, NVIDIA GeForce RTX 4060 Laptop GPU, 16", 2.2 kgRecensione dello Schenker Key 14 - 100 W RTX 4060 in un portatile multimediale compatto
Con Key 14, Schenker ha inserito nella sua gamma un notebook compatto da 14 pollici con un display pre-calibrato a 120 Hz e una scelta di schede grafiche dedicate veloci di Nvidia. Abbiamo testato la SKU costruita intorno alla GeForce RTX 4060 Laptop con un TGP di 100 watt.
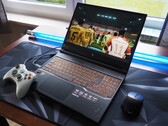
Intel Core Ultra 7 155H, NVIDIA GeForce RTX 4060 Laptop GPU, 14", 1.7 kgRecensione dell'Acer Nitro V 16 ANV16-41: Un portatile gaming economico ma con un intoppo
Nitro V16 è un computer portatile da gioco intorno ai 1.000 dollari che offre prestazioni più che dignitose per il suo prezzo (Ryzen 8000 & RTX 4060). Scopra qui se il dispositivo da 16 pollici si è comportato altrettanto bene in tutte le altre categorie. Prima di tutto: Acer ha purtroppo fallito in un aspetto importante.
AMD Ryzen 7 8845HS, NVIDIA GeForce RTX 4060 Laptop GPU, 16", 2.5 kgRecensione del computer portatile Gigabyte G5 KF5 2024: gaming con una RTX 4060 a un prezzo stracciato. Un buon affare?
Intel Core i7-13620H, una RTX 4060, più 16 GB di RAM e un SSD da 1 TB - tutto per 899 euro. Al momento non è possibile trovare un gamer RTX 4060 molto più economico. Verifichiamo se l'ultimo G5 vale il prezzo e si candida per la nostra lista dei portatili da gioco più convenienti.
Intel Core i7-13620H, NVIDIA GeForce RTX 4060 Laptop GPU, 15.6", 2 kgRecensione del notebook Lenovo ThinkBook 16p Gen 5: Il Lenovo Legion nascosto per i creativi
Il Lenovo ThinkBook 16p Gen 5 IRX è il modello più potente della serie di laptop ThinkBook per le PMI. Con un display wide gamut, l'i9 più potente per i computer portatili e la Nvidia GeForce RTX 4060, si rivolge al mercato dei creatori e dei multimedia. Ma non solo i creatori potrebbero trovarlo interessante: il ThinkBook è anche pronto per il gioco.
Intel Core i9-14900HX, NVIDIA GeForce RTX 4060 Laptop GPU, 16", 2.2 kgLenovo ThinkPad P1 Gen 7 21KV001SGE: Intel Core Ultra 7 155H, 16.00", 2 kg
recensione » Recensione del Lenovo ThinkPad P1 Gen 7: Senza pulsanti TrackPoint, con Nvidia GeForce RTX 4060
Acer Nitro 14 AN14-41-R3MX: AMD Ryzen 5 8645HS, 14.50", 2 kg
recensione » Recensione dell'Acer Nitro 14 (2024): Notebook compatto per il gaming con RTX 4060 e ampia durata della batteria
Asus TUF Gaming A14 FA401WV-WB94: AMD Ryzen AI 9 HX 370, 14.00", 1.5 kg
recensione » Recensione dell'Asus TUF Gaming A14 FA401WV: la Ryzen 9 Zen 5 continua a stupire
Nubia RedMagic Titan 16 Pro: Intel Core i9-14900HX, 16.00", 2.4 kg
recensione » Recensione del RedMagic Titan 16 Pro: Un portatile per il gaming realizzato da un produttore di smartphone
Asus ROG Zephyrus G16 GA605WV: AMD Ryzen AI 9 HX 370, 16.00", 1.8 kg
recensione » Recensione dell'Asus ROG Zephyrus G16 2024 - un portatile gaming con AMD Zen 5
Asus TUF Gaming A15 FA507UV: AMD Ryzen 9 8945H, 15.60", 2.1 kg
recensione » Recensione dell'Asus TUF Gaming A15 (2024): Potenza RTX 4060, prezzo moderato, ampia autonomia
Lenovo LOQ 15IRX9: Intel Core i5-13450HX, 15.60", 2.4 kg
recensione » Recensione del Lenovo LOQ 15: Il computer portatile per il gaming FHD con RTX 4060 da circa 1.000 dollari
Lenovo Legion Pro 5 16IRX9 G9: Intel Core i7-14700HX, 16.00", 2.5 kg
recensione » Recensione del computer portatile Lenovo Legion Pro 5i: Prestazioni super potenti con i7-14700HX e RTX 4060
Dell Inspiron 16 Plus 7640: Intel Core Ultra 7 155H, 16.00", 2.2 kg
recensione » Recensione del laptop Dell Inspiron 16 Plus 7640: Piccoli ma importanti cambiamenti rispetto al modello dello scorso anno
Schenker XMG Core 15 (M24): AMD Ryzen 7 8845HS, 15.30", 2.1 kg
recensione » Recensione del computer portatile SCHENKER XMG Core 15 (M24): Una macchina da gioco premium con struttura in metallo dalla Germania
Tulpar T7 V20.6: Intel Core i7-13700H, 17.30", 2.6 kg
recensione » Recensione del computer portatile Tulpar T7 V20.6 (Tongfang GM7PG0R): Attualmente uno dei più economici gamer RTX 4060
HP Victus 16 (2024): Intel Core i7-14700HX, 16.10", 2.4 kg
recensione » Recensione del notebook HP Victus 16 (2024): Potenza RTX 4060 abbinata a una buona autonomia
Gigabyte G6X 9KG (2024): Intel Core i7-13650HX, 16.00", 2.6 kg
recensione » Recensione del Gigabyte G6X 9KG (2024): economico Notebook per gaming con RTX 4060
HP Omen Transcend 14-fb0014: Intel Core Ultra 7 155H, 14.00", 1.6 kg
recensione » Recensione del portatile HP Omen Transcend 14: Un'alternativa a Razer Blade che vale la pena di prendere in considerazione
Honor MagicBook Pro 16 2024: Intel Core Ultra 7 155H, 16.00", 1.9 kg
recensione » Honor MagicBook Pro 16 2024 - Un computer portatile multimediale con un pannello IPS da 165 Hz e RTX 4060
Dell G16, i7-13650HX, RTX 4060: Intel Core i7-13650HX, 16.00", 2.8 kg
recensione » Recensione del computer portatile Dell G16 (2024): Un'alternativa economica ad Alienware dello stesso produttore?
Lenovo Legion 5 16IRX G9: Intel Core i7-14650HX, 16.00", 2.4 kg
recensione » Recensione del Lenovo Legion 5i 16 G9 - portatile gaming veloce con Raptor Lake-HX e un motore AI
Colorful EVOL X15 AT 23: Intel Core i7-13700HX, 15.60", 2.3 kg
recensione » Recensione di EVOL X15 AT 23 colorato: Impressionante gamer QHD con Raptor Lake-HX e alcune imperdibili stranezze
Lenovo Legion Slim 7 16APH8: AMD Ryzen 7 7840HS, 16.00", 2.1 kg
recensione » Recensione del portatile gaming Lenovo Legion Slim 7 16: Convincente anche con AMD Ryzen
Gigabyte G5 KF: Intel Core i5-12500H, 15.60", 1.9 kg
recensione » Recensione del Gigabyte G5 KF: gaming Laptop con RTX 4060 a 969 euro
Schenker XMG Apex 17 (Late 23): AMD Ryzen 7 7840HS, 17.30", 2.5 kg
recensione » Recensione dell'XMG Apex 17 (late 23): un portatile gaming QHD con RTX 4060
Asus ROG Flow X13 GV302XV: AMD Ryzen 9 7940HS, 13.40", 1.3 kg
recensione » Recensione dell'Asus ROG Flow X13 GV302XV (2023): Un convertibile gaming sottile che fa centro con AMD Zen 4 Ryzen 9 7940HS e Nvidia RTX 4060 da 60 W
Microsoft Surface Laptop Studio 2 RTX 4060: Intel Core i7-13700H, 14.40", 2 kg
recensione » Recensione del Microsoft Surface Laptop Studio 2 - Convertibile multimediale con componenti più veloci
MSI Raider GE68HX 13VF: Intel Core i9-13950HX, 16.00", 2.7 kg
recensione » Recensione del portatile MSI Raider GE68 HX 13VF: Un cambiamento completo del design
Lenovo LOQ 16IRH8: Intel Core i7-13620H, 16.00", 2.7 kg
recensione » Recensione del portatile gaming Lenovo LOQ 16: Dov'è l'intoppo rispetto al più costoso Legion?
Captiva Advanced Gaming I74-121: Intel Core i5-13500H, 15.60", 2.3 kg
recensione » Recensione del Captiva Advanced Gaming I74-121 (Clevo V150RND): Un portatile gaming economico con una potente RTX 4060
Lenovo Legion Slim 5 14APH8: AMD Ryzen 7 7840HS, 14.50", 1.7 kg
recensione » Recensione del laptop Lenovo Legion Slim 5 14APH8: punto di forza dell'OLED a 120 Hz e 2,8K
Alienware m16 R1 Intel: Intel Core i7-13700HX, 16.00", 3 kg
recensione » Recensione dell'Alienware m16 R1: Macchina gaming QHD con RTX 4060 e Thunderbolt 4
Dell Inspiron 16 Plus 7630: Intel Core i7-13700H, 16.00", 2.2 kg
recensione » Recensione del laptop Dell Inspiron 16 Plus 7630: 60 W GeForce RTX 4060 non è poi così male
Lenovo Legion Slim 5 16APH8: AMD Ryzen 7 7840HS, 16.00", 2.4 kg
recensione » Recensione del portatile Lenovo Legion Slim 5 16APH8: Un design poco apprezzato con una GPU poco performante
Lenovo Yoga Pro 9 16-IRP G8: Intel Core i7-13705H, 16.00", 2.2 kg
recensione » Recensione del notebook Lenovo Yoga Pro 9i 16: Ottimo pannello mini-LED, ma hanno risparmiato un po' troppo
Asus Vivobook Pro 16X K6604JV-MX016W: Intel Core i9-13980HX, 16.00", 2.1 kg
recensione » Recensione dell'Asus Vivobook Pro 16X: Notebook per creators con un processore eccezionale
Acer Predator Helios 16 PH16-71-731Q: Intel Core i7-13700HX, 16.00", 2.6 kg
recensione » Recensione del portatile Acer Predator Helios 16: Un portatile gaming silenzioso con molti punti di forza
Schenker XMG Pro 15 (E23): Intel Core i9-13900HX, 15.60", 2.4 kg
recensione » Recensione del portatile gaming Schenker XMG Pro 15 E23 (PD50SND-G): Ecco l'equilibrio tra lavoro e gioco!
Acer Nitro 17 AN17-51-71ER: Intel Core i7-13700H, 17.30", 3 kg
recensione » Recensione del silenzioso portatile Acer Nitro 17: La RTX 4060 è configurata perfettamente
Dell G15 5530: Intel Core i7-13650HX, 15.60", 3 kg
recensione » Recensione del Dell G15 5530: Una valida alternativa ad Alienware ora con Raptor Lake-HX
Asus ROG Flow X16 GV601V: Intel Core i9-13900H, 16.00", 2.1 kg
recensione » Recensione del sottile portatile Asus ROG Flow X16: Una potente workstation per il gaming 2-in-1 da 16 pollici con display touchscreen
Asus ZenBook Pro 14 Duo UX8402VV-P1021W: Intel Core i9-13900H, 14.50", 1.8 kg
recensione » Recensione del portatile Asus ZenBook Pro 14 Duo con secondo display per i creativi: Maggiore produttività
Medion Erazer Defender P40: Intel Core i7-13700HX, 17.30", 2.9 kg
recensione » Recensione del Medion Erazer Defender P40: gaming laptop QHD economico e con una RTX 4060
Lenovo Legion Pro 5 16IRX8: Intel Core i7-13700HX, 16.00", 2.5 kg
recensione » Recensione del portatile Lenovo Legion Pro 5 16IRX8: 1600 dollari per la GeForce RTX 4060
Asus ROG Flow Z13 GZ301V: Intel Core i9-13900H, 13.40", 1.6 kg
recensione » Recensione dell'Asus ROG Flow Z13: una RTX 4060 in un impressionante tablet per il gaming
MSI Cyborg 15 A12VF: Intel Core i7-12650H, 15.60", 2 kg
recensione » Recensione dell'MSI Cyborg 15 A12VF: gaming Laptop con RTX 4060 a bassa potenza
MSI Katana 17 B13VFK: Intel Core i7-13620H, 17.30", 2.8 kg
recensione » Recensione del portatile MSI Katana 17 B13V: la Nvidia GeForce RTX 4060 fa il suo debutto
MSI Thin A15 B7VF: AMD Ryzen 7 7735HS, 15.60", 1.9 kg
Recensioni esterne » MSI Thin A15 B7VF
MSI Creator A16 AI+ A3HVFG: AMD Ryzen AI 9 HX 370, 16.00", 2.1 kg
Recensioni esterne » MSI Creator A16 AI+ A3HVFG
Acer Nitro V16 AI ANV16-61: AMD Ryzen AI 7 350, 16.00", 2.4 kg
Recensioni esterne » Acer Nitro V16 AI ANV16-61
Asus TUF Gaming F15 FX507VV, i7-13620H: Intel Core i7-13620H, 15.60", 2.2 kg
Recensioni esterne » Asus TUF Gaming F15 FX507VV, i7-13620H
Acer Nitro 5 AN515-58, i9-12900H RTX 4060: Intel Core i9-12900H, 15.60", 2.6 kg
Recensioni esterne » Acer Nitro 5 AN515-58, i9-12900H RTX 4060
Asus TUF Gaming A17 FA707NVR: AMD Ryzen 7 7435HS, 17.30", 2.6 kg
Recensioni esterne » Asus TUF Gaming A17 FA707NVR
HP Omen Transcend 14-fb0000ng, Ultra 9 185H: Intel Core Ultra 9 185H, 14.00", 1.6 kg
Recensioni esterne » HP Omen Transcend 14-fb0000ng, Ultra 9 185H
Schenker XMG Core 15 (M24): AMD Ryzen 7 8845HS, 15.30", 2.1 kg
Recensioni esterne » SCHENKER XMG Core 15 (M24)
Acer Nitro 16 AN16-42, RTX 4060: AMD Ryzen 7 8845HS, 16.00", 2.7 kg
Recensioni esterne » Acer Nitro 16 AN16-42, RTX 4060
Acer Nitro V 16 ANV16-41-R5AT: AMD Ryzen 7 8845HS, 16.00", 2.5 kg
Recensioni esterne » Acer Nitro V 16 ANV16-41-R5AT
Acer Predator Triton Neo 16 PTN16-51, Ultra 9 185H: Intel Core Ultra 9 185H, 16.00", 2.1 kg
Recensioni esterne » Acer Predator Triton Neo 16 PTN16-51, Ultra 9 185H
MSI VenturePro 16 AI A1VFG: Intel Core Ultra 7 155H, 16.00", 1.9 kg
Recensioni esterne » MSI VenturePro 16 AI A1VFG
Lenovo Legion 5 15IRX9: Intel Core i7-13650HX, 15.60", 2.3 kg
Recensioni esterne » Lenovo Legion 5 15IRX9
MSI Stealth A16 AI+ A3XVFG: AMD Ryzen AI 9 365, 16.00", 2.1 kg
Recensioni esterne » MSI Stealth A16 AI+ A3XVFG
Acer Nitro V16 ANV16-71: Intel Core i7-14650HX, 16.00", 2.5 kg
Recensioni esterne » Acer Nitro V16 ANV16-71
Acer Nitro V15 ANV15-41: AMD Ryzen 7 7735HS, 15.60", 2.1 kg
Recensioni esterne » Acer Nitro V15 ANV15-41
Acer Nitro V15 ANV15-41, R5 7535HS: AMD Ryzen 5 7535HS, 15.60", 2.1 kg
Recensioni esterne » Acer Nitro V15 ANV15-41, R5 7535HS
MSI Sword 16 HX B14VFKG, i7-14700HX: Intel Core i7-14700HX, 16.00", 2.3 kg
Recensioni esterne » MSI Sword 16 HX B14VFKG, i7-14700HX
Asus TUF Gaming A16 FA608WV: AMD Ryzen AI 9 HX 370, 16.00", 2.2 kg
Recensioni esterne » Asus TUF Gaming A16 FA608WV
MSI Prestige 14 AI Studio C1VFG, Ultra 9 185H: Intel Core Ultra 9 185H, 14.00", 1.7 kg
Recensioni esterne » MSI Prestige 14 AI Studio C1VFG, Ultra 9 185H
Lenovo Legion 5 16IRX9, i9-14900HX: Intel Core i9-14900HX, 16.00", 2.3 kg
Recensioni esterne » Lenovo Legion 5 16IRX9, i9-14900HX
MSI Cyborg 15 AI A1VFK: Intel Core Ultra 7 155H, 15.60", 2 kg
Recensioni esterne » MSI Cyborg 15 AI A1VFK
Lenovo Yoga Pro 9 16IMH9, Ultra 7 155H: Intel Core Ultra 7 155H, 16.00", 2.1 kg
Recensioni esterne » Lenovo Yoga Pro 9 16IMH9, Ultra 7 155H
MSI Sword 16 HX B14VFKG, i7-14650HX: Intel Core i7-14650HX, 16.00", 2.3 kg
Recensioni esterne » MSI Sword 16 HX B14VFKG, i7-14650HX
MSI Prestige 14 AI Studio C1VFG: Intel Core Ultra 7 155H, 14.00", 1.7 kg
Recensioni esterne » MSI Prestige 14 AI Studio C1VFG
Acer Predator Helios Neo 14 PHN14-51, RTX 4060: Intel Core Ultra 9 185H, 14.50", 1.9 kg
Recensioni esterne » Acer Predator Helios Neo 14 PHN14-51, RTX 4060
Acer Nitro 16 AN16-73, i7-14700HX: Intel Core i7-14700HX, 16.00", 2.5 kg
Recensioni esterne » Acer Nitro 16 AN16-73, i7-14700HX
Lenovo LOQ 15IRX9, i7-13650HX RTX 4060: Intel Core i7-13650HX, 15.60", 2.4 kg
Recensioni esterne » Lenovo LOQ 15IRX9, i7-13650HX RTX 4060
Acer Nitro V16 ANV16-41, R7 8845HS RTX 4060: AMD Ryzen 7 8845HS, 16.00", 2.5 kg
Recensioni esterne » Acer Nitro V16 ANV16-41, R7 8845HS RTX 4060
Alienware x14 R2: Intel Core i7-13620H, 14.00", 1.9 kg
Recensioni esterne » Alienware x14 R2
Gigabyte Aero 16 OLED BKF: Intel Core i7-13700H, 16.00", 2.1 kg
Recensioni esterne » Gigabyte Aero 16 OLED BKF
Asus TUF Gaming A14 FA401UV: AMD Ryzen 7 8845HS, 14.00", 1.5 kg
Recensioni esterne » Asus TUF Gaming A14 FA401UV
Acer Nitro 16 AN16-73: Intel Core i7-14650HX, 16.00", 2.5 kg
Recensioni esterne » Acer Nitro 16 AN16-73
Asus ProArt PX13 HN7306WV: AMD Ryzen AI 9 HX 370, 13.30", 1.4 kg
Recensioni esterne » Asus ProArt PX13 HN7306, RTX 4060
MSI Crosshair 16 HX D14VFKG: Intel Core i7-14700HX, 16.00", 2.5 kg
Recensioni esterne » MSI Crosshair 16 HX D14VFKG
Acer Nitro V16 ANV16-41, RTX 4060: AMD Ryzen 5 8645HS, 16.00", 2.5 kg
Recensioni esterne » Acer Nitro V16 ANV16-41, RTX 4060
Asus TUF Gaming A14 FA401WV-WB94: AMD Ryzen AI 9 HX 370, 14.00", 1.5 kg
Recensioni esterne » Asus TUF Gaming A14 FA401WV-WB94
Lenovo ThinkBook 16p G5 IRX 21N50011GE: Intel Core i9-14900HX, 16.00", 2.2 kg
Recensioni esterne » Lenovo ThinkBook 16p G5 IRX 21N50011GE
Lenovo ThinkPad P1 Gen 7 21KV001SGE: Intel Core Ultra 7 155H, 16.00", 2 kg
Recensioni esterne » Lenovo ThinkPad P1 Gen 7 21KV001SGE
HP Omen 16-wf1: Intel Core i9-14900HX, 16.10", 2.4 kg
Recensioni esterne » HP Omen 16-wf1
Nubia RedMagic Titan 16 Pro: Intel Core i9-14900HX, 16.00", 2.4 kg
Recensioni esterne » Nubia RedMagic Titan 16 Pro
MSI Prestige 16 AI Studio B1VFG, Ultra 7 155H: Intel Core Ultra 7 155H, 16.00", 1.6 kg
Recensioni esterne » MSI Prestige 16 AI Studio B1VFG, Ultra 7 155H
Acer Nitro 16 AN16-41, R7 7840HS RTX 4060: AMD Ryzen 7 7840HS, 16.00", 2.7 kg
Recensioni esterne » Acer Nitro 16 AN16-41, R7 7840HS RTX 4060
HP Victus 16-r1300: Intel Core i5-14500HX, 16.10", 2.3 kg
Recensioni esterne » HP Victus 16-r1300
HP Omen 17-db0000: AMD Ryzen 9 8945HS, 17.30", 3 kg
Recensioni esterne » HP Omen 17-db0000
Lenovo Legion Slim 5 16AHP9, RTX 4060: AMD Ryzen 7 8845HS, 16.00", 2.3 kg
Recensioni esterne » Lenovo Legion Slim 5 16AHP9, RTX 4060
Acer Nitro 17 AN17-41-R38P: AMD Ryzen 7 7735HS, 17.30", 3.1 kg
Recensioni esterne » Acer Nitro 17 AN17-41-R38P
Gigabyte G6 KF: Intel Core i7-13620H, 16.00", 2.3 kg
Recensioni esterne » Gigabyte G6 KF
Acer Nitro 14 AN14-41: AMD Ryzen 7 8845HS, 14.50", 2 kg
Recensioni esterne » Acer Nitro 14 AN14-41
Aorus 16X 2024 9KG: Intel Core i7-13650HX, 16.00", 2.3 kg
Recensioni esterne » Aorus 16X 2024 9KG
Lenovo Yoga Pro 7 14IMH9, Ultra 9 185H RTX 4060: Intel Core Ultra 9 185H, 14.50", 1.6 kg
Recensioni esterne » Lenovo Yoga Pro 7 14IMH9, Ultra 9 185H RTX 4060
Acer Nitro V 15 ANV15-51, i9-13900H: Intel Core i9-13900H, 15.60", 2.1 kg
Recensioni esterne » Acer Nitro V 15 ANV15-51, i9-13900H
Lenovo Yoga Pro 9 16IMH9, RTX 4060: Intel Core Ultra 9 185H, 16.00", 2.1 kg
Recensioni esterne » Lenovo Yoga Pro 9 16IMH9, RTX 4060
Asus ROG Zephyrus G16 GU605MV: Intel Core Ultra 7 155H, 16.00", 1.9 kg
Recensioni esterne » Asus ROG Zephyrus G16 GU605MV
Lenovo Legion Pro 5 16IRX9, i9-14900HX RTX 4060: Intel Core i9-14900HX, 16.00", 2.5 kg
Recensioni esterne » Lenovo Legion Pro 5 16IRX9, i9-14900HX RTX 4060
Acer Nitro 17 AN17-42: AMD Ryzen 7 8845HS, 17.30", 3.1 kg
Recensioni esterne » Acer Nitro 17 AN17-42
MSI Sword 16 HX B14VFKG, i9-14900HX: Intel Core i9-14900HX, 16.00", 2.3 kg
Recensioni esterne » MSI Sword 16 HX B14VFKG, i9-14900HX
Asus ROG Zephyrus G16 2024 GU605MV: Intel Core Ultra 9 185H, 16.00", 1.9 kg
Recensioni esterne » Asus ROG Zephyrus G16 2024 GU605MV
Acer Predator Triton Neo 16 PTN16-51: Intel Core Ultra 7 155H, 16.00", 2.1 kg
Recensioni esterne » Acer Predator Triton Neo 16 PTN16-51
Asus ROG Zephyrus G16 GA605WV: AMD Ryzen AI 9 HX 370, 16.00", 1.8 kg
Recensioni esterne » Asus ROG Zephyrus G16 GA605WV
Asus TUF Gaming A14 FA401: AMD Ryzen AI 9 HX 370, 14.00", 1.5 kg
Recensioni esterne » Asus TUF Gaming A14 FA401
Acer Predator Helios Neo 16 PHN16-72, RTX 4060: Intel Core i9-14900HX, 16.00", 2.5 kg
Recensioni esterne » Acer Predator Helios Neo 16 PHN16-72, RTX 4060
Infinix GT Book 16: Intel Core i9-13900H, 16.00", 2 kg
Recensioni esterne » Infinix GT Book 16
Asus VivoBook Pro 15 OLED N6506, Ultra 5 125H: Intel Core Ultra 5 125H, 15.60", 1.8 kg
Recensioni esterne » Asus VivoBook Pro 15 OLED N6506, Ultra 5 125H
Acer Predator Helios Neo 16 PHN16-72, i7-14650HX RTX 4060: Intel Core i7-14650HX, 16.00", 2.5 kg
Recensioni esterne » Acer Predator Helios Neo 16 PHN16-72, i7-14650HX RTX 4060
Lenovo Yoga Pro 7 14IMH9, RTX 4060: Intel Core Ultra 5 125H, 14.50", 1.6 kg
Recensioni esterne » Lenovo Yoga Pro 7 14IMH9, RTX 4060
Asus ProArt P16 H7606: AMD Ryzen AI 9 HX 370, 16.00", 1.9 kg
Recensioni esterne » Asus ProArt P16 H7606
Dell Inspiron 16 Plus 7640: Intel Core Ultra 7 155H, 16.00", 2.2 kg
Recensioni esterne » Dell Inspiron 16 Plus 7640
Acer Predator Helios Neo 18 PHN18-71, i7-14650HX RTX 4060: Intel Core i7-14650HX, 18.00", 3.4 kg
Recensioni esterne » Acer Predator Helios Neo 18 PHN18-71, i7-14650HX RTX 4060
Acer Predator Helios 18 PH18-71: Intel Core i9-13900HX, 18.00", 3.3 kg
Recensioni esterne » Acer Predator Helios 18 PH18-71
MSI Prestige 16 AI Studio B1VFG: Intel Core Ultra 9 185H, 16.00", 1.6 kg
Recensioni esterne » MSI Prestige 16 AI Studio B1VFG
Lenovo Legion Pro 5 16IRX9, i7-14650HX: Intel Core i7-14650HX, 16.00", 2.5 kg
Recensioni esterne » Lenovo Legion Pro 5 16IRX9, i7-14650HX
Asus TUF Gaming F16 FX607JV: Intel Core i7-13650HX, 16.00", 2.3 kg
Recensioni esterne » Asus TUF Gaming F16 FX607JV
Asus ROG Zephyrus G14 2024 GA403UV: AMD Ryzen 9 8945HS, 14.00", 1.5 kg
Recensioni esterne » Asus ROG Zephyrus G14 2024 GA403UV
Asus VivoBook Pro 15 OLED N6506M: Intel Core Ultra 7 155H, 15.60", 1.8 kg
Recensioni esterne » Asus VivoBook Pro 15 OLED N6506M
MSI Sword 16 HX B14VFKG: Intel Core Ultra 9 185H, 16.00", 2.3 kg
Recensioni esterne » MSI Sword 16 HX B14VFKG
Asus TUF Gaming A15 FA507UI : AMD Ryzen 9 8945HS, 15.60", 2.2 kg
Recensioni esterne » Asus TUF Gaming A15 FA507UI
HP Omen Transcend 16-u1000ng: Intel Core i7-14700HX, 16.00", 2.2 kg
Recensioni esterne » HP Omen Transcend 16-u1000ng
HP Omen 16-wf1000: Intel Core i7-14700HX, 16.10", 2.4 kg
Recensioni esterne » HP Omen 16-wf1000
MSI Raider GE68 HX 14VFG: Intel Core i7-14700HX, 16.00", 2.8 kg
Recensioni esterne » MSI Raider GE68 HX 14VFG
Dell XPS 16 9640, RTX 4060: Intel Core Ultra 7 155H, 16.30", 2.1 kg
Recensioni esterne » Dell XPS 16 9640, RTX 4060
Aorus 15 BKG: Intel Core Ultra 7 155H, 15.60", 2.4 kg
Recensioni esterne » Aorus 15 BKG
Asus TUF Gaming A16 FA607PV: AMD Ryzen 9 7845HX, 16.00", 2.3 kg
Recensioni esterne » Asus TUF Gaming A16 FA607PV
Asus ROG Zephyrus G14 OLED GA403UV: AMD Ryzen 9 8945HS, 14.00", 1.5 kg
Recensioni esterne » Asus ROG Zephyrus G14 OLED GA403UV
Lenovo Legion 5 16IRX9: Intel Core i5-13450HX, 16.00", 2.3 kg
Recensioni esterne » Lenovo Legion 5 16IRX9
Lenovo LOQ 15IRX9, i7-14700HX: Intel Core i7-14700HX, 16.00", 2.3 kg
Recensioni esterne » Lenovo LOQ 15IRX9
Xiaomi Redmi G Pro 2024: Intel Core i9-14900HX, 16.00", 2.7 kg
Recensioni esterne » Xiaomi Redmi G Pro 2024
Acer Nitro 16 AN16-41, R7 7735HS RTX 4060: AMD Ryzen 7 7735HS, 16.00", 2.7 kg
Recensioni esterne » Acer Nitro 16 AN16-41, R7 7735HS RTX 4060
Honor MagicBook Pro 16 2024: Intel Core Ultra 7 155H, 16.00", 1.9 kg
Recensioni esterne » Honor MagicBook Pro 16 2024
MSI Cyborg 14 A13VE: Intel Core i7-13620H, 14.00", 1.6 kg
Recensioni esterne » MSI Cyborg 14 A13VE
Asus Vivobook Pro 15 OLED N6506: Intel Core Ultra 9 185H, 15.60", 1.8 kg
Recensioni esterne » Asus Vivobook Pro 15 OLED N6506
Gigabyte G6X 9KG (2024): Intel Core i7-13650HX, 16.00", 2.6 kg
Recensioni esterne » Gigabyte G6X 9KG (2024)
Lenovo Legion 5 16IRX G9: Intel Core i7-14650HX, 16.00", 2.4 kg
Recensioni esterne » Lenovo Legion 5 16IRX G9
HP Omen Transcend 14-fb0014: Intel Core Ultra 7 155H, 14.00", 1.6 kg
Recensioni esterne » HP Omen Transcend 14-fb0014
Acer Nitro 5 AN517-55-96S6: Intel Core i9-12900H, 17.30", 3 kg
Recensioni esterne » Acer Nitro 5 AN517-55-96S6
Aorus 15X BKF: Intel Core i7-13700H, 15.60", 2.3 kg
Recensioni esterne » Aorus 15X BKF
MSI Creator Z16 HX Studio B13VFT: Intel Core i7-13700H, 16.00", 2.4 kg
Recensioni esterne » MSI Creator Z16 HX Studio B13VFT
Lenovo LOQ 16APH8: AMD Ryzen 5 7640HS, 16.00", 2.6 kg
Recensioni esterne » Lenovo LOQ 16APH8
Acer Nitro 17 AN17-72: Intel Core i7-14700HX, 17.30", 3.2 kg
Recensioni esterne » Acer Nitro 17 AN17-72
Asus VivoBook Pro 15 M6500XV: AMD Ryzen 9 7940HS, 15.60", 1.8 kg
Recensioni esterne » Asus VivoBook Pro 15 M6500XV
Asus Zenbook Pro 14 OLED UX6404VV, i5-13500H: Intel Core i5-13500H, 14.50", 1.6 kg
Recensioni esterne » Asus Zenbook Pro 14 OLED UX6404VV, i5-13500H
HP Victus 16-s0475ng: AMD Ryzen 7 7840HS, 16.10", 2.3 kg
Recensioni esterne » HP Victus 16-s0475ng
Lenovo Legion Slim 5 16IRH8, i7-13700H RTX 4060: Intel Core i7-13700H, 16.00", 2.4 kg
Recensioni esterne » Lenovo Legion Slim 5 16IRH8, i7-13700H RTX 4060
Asus ZenBook Pro 14 Duo UX8402VV: Intel Core i7-13700H, 14.50", 1.8 kg
Recensioni esterne » Asus ZenBook Pro 14 Duo UX8402VV
HP Omen 16-wf0000ng: Intel Core i5-13500HX, 16.10", 2.4 kg
Recensioni esterne » HP Omen 16-wf0000ng
MSI Stealth 16 Studio A13VG, i7-13620H: Intel Core i7-13620H, 17.30", 2.8 kg
Recensioni esterne » MSI Stealth 16 Studio A13VG, i7-13620H
Acer Nitro 17 AN17-41-R182: AMD Ryzen 7 7840HS, 17.30", 3 kg
Recensioni esterne » Acer Nitro 17 AN17-41-R182
Acer Nitro 17 AN17-51-71ER: Intel Core i7-13700H, 17.30", 3 kg
Recensioni esterne » Acer Nitro 17 AN17-51-71ER
HP Omen Transcend 16-u0000ng: Intel Core i7-13700HX, 16.00", 2.2 kg
Recensioni esterne » HP Omen Transcend 16-u0000ng
Lenovo LOQ 15IRH8, i5-13500H RTX 4060: Intel Core i5-13500H, 15.60", 2.4 kg
Recensioni esterne » Lenovo LOQ 15IRH8, i5-13500H RTX 4060
HP Victus 16-s0000ax: AMD Ryzen 5 7640HS, 16.10", 2.3 kg
Recensioni esterne » HP Victus 16-s0000ax
MSI Bravo 15 C7VF: AMD Ryzen 7 7735HS, 15.60", 2.3 kg
Recensioni esterne » MSI Bravo 15 C7VF
Asus Zenbook Pro 14 OLED UX6404VV, i7-13700H: Intel Core i7-13700H, 14.50", 1.6 kg
Recensioni esterne » Asus Zenbook Pro 14 OLED UX6404VV, i7-13700H
Asus VivoBook Pro 16X K6604JV: Intel Core i9-13980HX, 16.00", 1.9 kg
Recensioni esterne » Asus VivoBook Pro 16X K6604JV
Asus TUF Gaming F17 FX707VV: Intel Core i9-13900H, 17.30", 2.6 kg
Recensioni esterne » Asus TUF Gaming F17 FX707VV
HP Omen 16-xf0000: AMD Ryzen 7 7840HS, 16.10", 2.4 kg
Recensioni esterne » HP Omen 16-xf0000
Lenovo LOQ 15, R7 7840HS RTX 4060: AMD Ryzen 7 7840HS, 15.60", 2.4 kg
Recensioni esterne » Lenovo LOQ 15, R7 7840HS RTX 4060
MSI Stealth 16 Studio A13VF, i9-13900H: Intel Core i9-13900H, 16.00", 2 kg
Recensioni esterne » MSI Stealth 16 Studio A13VF, i9-13900H
HP Victus 16-r0017ns: Intel Core i7-13700H, 16.10", 2.3 kg
Recensioni esterne » HP Victus 16-r0017ns
Lenovo ThinkBook 16p G4: Intel Core i7-13700H, 16.00", 2.2 kg
Recensioni esterne » Lenovo ThinkBook 16p G4
Dell Inspiron 16 Plus 7630, i7-13700H: Intel Core i7-13700H, 16.00", 2.1 kg
Recensioni esterne » Dell Inspiron 16 Plus 7630, i7-13700H
Lenovo Legion Slim 5 14APH8: AMD Ryzen 7 7840HS, 14.50", 1.7 kg
Recensioni esterne » Lenovo Legion Slim 5 14APH8
Microsoft Surface Laptop Studio 2 RTX 4060: Intel Core i7-13700H, 14.40", 2 kg
Recensioni esterne » Microsoft Surface Laptop Studio 2 RTX 4060
Dell Inspiron 16 Plus 7630: Intel Core i7-13700H, 16.00", 2.2 kg
Recensioni esterne » Dell Inspiron 16 Plus 7630
Asus VivoBook 16X OLED K3605VV: Intel Core i9-13900H, 16.00", 1.8 kg
Recensioni esterne » Asus VivoBook 16X OLED K3605VV
MSI Stealth 15 A13VF: Intel Core i7-13620H, 15.60", 2.1 kg
Recensioni esterne » MSI Stealth 15 A13VF
MSI Raider GE68 HX 13VF: Intel Core i9-13950HX, 16.00", 2.7 kg
Recensioni esterne » MSI Raider GE68 HX 13VF
Alienware x14 R2 2023, RTX 4060: Intel Core i7-13620H, 14.00", 1.9 kg
Recensioni esterne » Alienware x14 R2 2023, RTX 4060
Lenovo ThinkPad P1 G6: Intel Core i7-13700H, 16.00", 1.9 kg
Recensioni esterne » Lenovo ThinkPad P1 G6
Aorus 15 9KF: Intel Core i5-12500H, 15.60", 2.3 kg
Recensioni esterne » Aorus 15 9KF
Asus ROG Strix G17 G713PV: AMD Ryzen 9 7845HX, 17.30", 2.8 kg
Recensioni esterne » Asus ROG Strix G17 G713PV
Lenovo Legion Slim 5 16IRH8: Intel Core i5-13500H, 16.00", 2.4 kg
Recensioni esterne » Lenovo Legion Slim 5 16IRH8
Razer Blade 15 2023: Intel Core i7-13800H, 15.60", 2 kg
Recensioni esterne » Razer Blade 15 2023
Asus ZenBook Pro 14 Duo UX8402VV-P1021W: Intel Core i9-13900H, 14.50", 1.8 kg
Recensioni esterne » Asus ZenBook Pro 14 Duo UX8402VV-P1021W
Razer Blade 14 RTX 4060: AMD Ryzen 9 7940HS, 14.00", 1.8 kg
Recensioni esterne » Razer Blade 14 RTX 4060
Lenovo LOQ 15IRH8, i7-13700H RTX 4060: Intel Core i7-13700H, 15.60", 2.4 kg
Recensioni esterne » Lenovo LOQ 15IRH8, i7-13700H RTX 4060
Lenovo LOQ 16IRH8, i7-13700H RTX 4060: Intel Core i7-13700H, 16.00", 2.6 kg
Recensioni esterne » Lenovo LOQ 16IRH8, i7-13700H RTX 4060
Asus ROG Zephyrus G14 GA402XV: AMD Ryzen 9 7940HS, 14.00", 1.7 kg
Recensioni esterne » Asus ROG Zephyrus G14 GA402XV
Acer Predator Helios Neo 16 PHN16-71, i5-13500HX RTX 4060: Intel Core i5-13500HX, 16.00", 2.6 kg
Recensioni esterne » Acer Predator Helios Neo 16 PHN16-71, i5-13500HX RTX 4060
HP Envy 16-h1000: Intel Core i9-13900H, 16.00", 2.7 kg
Recensioni esterne » HP Envy 16-h1000
Acer Predator Helios 16 PH16-71-74UU: Intel Core i7-13700HX, 16.00", 2.7 kg
Recensioni esterne » Acer Predator Helios 16 PH16-71-74UU
MSI Cyborg 15 A12VF, i5-12450H: Intel Core i5-12450H, 15.60", 2 kg
Recensioni esterne » MSI Cyborg 15 A12VF, i5-12450H
Asus TUF Gaming F15 FX507VV: Intel Core i7-13700H, 15.60", 2.2 kg
Recensioni esterne » Asus TUF Gaming F15 FX507VV
Lenovo Yoga Pro 9 14IRP G8, i9-13905H RTX 4060: Intel Core i9-13905H, 14.50", 1.7 kg
Recensioni esterne » Lenovo Yoga Pro 9 14IRP G8, i9-13905H RTX 4060
MSI Cyborg 15 A12VF-248: Intel Core i7-12700H, 15.60", 2 kg
Recensioni esterne » MSI Cyborg 15 A12VF-248
Lenovo Legion Slim 5 16APH8: AMD Ryzen 7 7840HS, 16.00", 2.4 kg
Recensioni esterne » Lenovo Legion Slim 5 16APH8
Lenovo LOQ 16IRH8: Intel Core i7-13620H, 16.00", 2.7 kg
Recensioni esterne » Lenovo LOQ 16IRH8
Acer Predator Helios 18 PH18-71-74ET: Intel Core i7-13700HX, 18.00", 3.3 kg
Recensioni esterne » Acer Predator Helios 18 PH18-71-74ET
Medion Erazer Defender P40: Intel Core i7-13700HX, 17.30", 2.9 kg
Recensioni esterne » Medion Erazer Defender P40
MSI Prestige 16 Studio A13VF: Intel Core i7-13700H, 16.00", 2.1 kg
Recensioni esterne » MSI Prestige 16 Studio A13VF
MSI Cyborg 15 A13VF: Intel Core i7-13620H, 15.60", 2 kg
Recensioni esterne » MSI Cyborg 15 A13VF
Dell XPS 15 9530 RTX 4060: Intel Core i7-13700H, 15.60", 1.9 kg
Recensioni esterne » Dell XPS 15 9530 RTX 4060
Medion Erazer Deputy P50: Intel Core i7-13700HX, 15.60", 2.1 kg
Recensioni esterne » Medion Erazer Deputy P50
Asus TUF Gaming A15 FA507NV: AMD Ryzen 7 7735HS, 15.60", 2.2 kg
Recensioni esterne » Asus TUF Gaming A15 FA507NV
Dell G16 7630: Intel Core i7-13650HX, 15.60", 2.9 kg
Recensioni esterne » Dell G16 7630
Asus TUF Gaming A15 FA507XV: AMD Ryzen 9 7940HS, 15.60", 2.2 kg
Recensioni esterne » Asus TUF Gaming A15 FA507XV
Acer Nitro 17 AN17-71: Intel Core i7-13700HX, 17.30", 3.3 kg
Recensioni esterne » Acer Nitro 17 AN17-71
MSI Stealth 14 Studio A13VF: Intel Core i7-13700H, 14.00", 1.7 kg
Recensioni esterne » MSI Stealth 14 Studio A13VF
Asus VivoBook Pro 16 OLED K6602VV: Intel Core i9-13900H, 16.00", 1.9 kg
Recensioni esterne » Asus VivoBook Pro 16 OLED K6602VV
Asus Zenbook Pro 14 OLED UX6404VV: Intel Core i9-13900H, 14.50", 1.6 kg
Recensioni esterne » Asus Zenbook Pro 14 OLED UX6404VV
MSI Katana 17 B12VFK: Intel Core i7-12650H, 17.30", 2.6 kg
Recensioni esterne » MSI Katana 17 B12VFK
Asus ROG Strix G16 G614JV, i7-13650HX: Intel Core i7-13650HX, 16.00", 2.5 kg
Recensioni esterne » Asus ROG Strix G16 G614JV, i7-13650HX
Dell G15 5530: Intel Core i7-13650HX, 15.60", 3 kg
Recensioni esterne » Dell G15 5530
MSI Summit E16 Flip A13 VFT: Intel Core i7-1360P, 16.00", 2.1 kg
Recensioni esterne » MSI Summit E16 Flip A13 VFT
MSI Vector GP77 13VF: Intel Core i7-13700H, 17.30", 2.8 kg
Recensioni esterne » MSI Vector GP77 13VF
MSI Stealth 16 Studio A13VF: Intel Core i7-13620H, 16.00", 2 kg
Recensioni esterne » MSI Stealth 16 Studio A13VF
Alienware m16 R1 Intel: Intel Core i7-13700HX, 16.00", 3 kg
Recensioni esterne » Alienware m16 R1, i7-13700HX RTX 4060
Acer Predator Helios 16 PH16-71-731Q: Intel Core i7-13700HX, 16.00", 2.6 kg
Recensioni esterne » Acer Predator Helios 16 PH16-71-731Q
Lenovo LOQ 15IRH8, i7-13620H: Intel Core i7-13620H, 15.60", 2.4 kg
Recensioni esterne » Lenovo LOQ 15IRH8, i7-13620H
Razer Blade 18 2023 RTX 4060: Intel Core i9-13950HX, 18.00", 3.2 kg
Recensioni esterne » Razer Blade 18 2023 RTX 4060
Asus ROG Flow X13 GV302XV: AMD Ryzen 9 7940HS, 13.40", 1.3 kg
Recensioni esterne » Asus ROG Flow X13 GV302XV
MSI Pulse 15 B13VFK: Intel Core i9-13900H, 15.60", 2.3 kg
Recensioni esterne » MSI Pulse 15 B13VFK
MSI Pulse 17 B13VFK: Intel Core i7-13700H, 17.30", 2.7 kg
Recensioni esterne » MSI Pulse 17 B13VFK
MSI Cyborg 15 A12VF: Intel Core i7-12650H, 15.60", 2 kg
Recensioni esterne » MSI Cyborg 15 A12VF
MSI Katana 17 B13VFK: Intel Core i7-13620H, 17.30", 2.8 kg
Recensioni esterne » MSI Katana 17 B13VFK
Acer Predator Helios Neo 16 PHN16-71-702Z: Intel Core i7-13700HX, 16.00", 2.6 kg
Recensioni esterne » Acer Predator Helios Neo 16 PHN16-71-702Z
Asus ROG Strix G18 G814JV: Intel Core i7-13700HX, 18.00", 3 kg
Recensioni esterne » Asus ROG Strix G18 G814JV
Asus ROG Strix G16 G614JV: Intel Core i9-13980HX, 16.00", 2.5 kg
Recensioni esterne » Asus ROG Strix G16 G614JV
Asus ROG Flow X16 GV601V: Intel Core i9-13900H, 16.00", 2.1 kg
Recensioni esterne » Asus ROG Flow X16 GV601V
Lenovo Legion Pro 5 16IRX8, i5-13500HX RTX 4060: Intel Core i5-13500HX, 16.00", 2.6 kg
Recensioni esterne » Lenovo Legion Pro 5 16IRX8, i5-13500HX RTX 4060
Lenovo Legion Slim 7 16IRH8: Intel Core i7-13700H, 16.00", 2 kg
Recensioni esterne » Lenovo Legion Slim 7 16IRH8
MSI Katana 15 B13VFK: Intel Core i7-13620H, 15.60", 2.3 kg
Recensioni esterne » MSI Katana 15 B13VFK
Gigabyte G5 KF: Intel Core i5-12500H, 15.60", 1.9 kg
Recensioni esterne » Gigabyte G5 KF
Asus ROG Flow Z13 GZ301V: Intel Core i9-13900H, 13.40", 1.6 kg
Recensioni esterne » Asus ROG Flow Z13 GZ301V
Asus ROG Zephyrus G16 GU603VV: Intel Core i7-13620H, 16.00", 2 kg
Recensioni esterne » Asus ROG Zephyrus G16 GU603VV
Lenovo Legion Pro 5 16IRX8: Intel Core i7-13700HX, 16.00", 2.5 kg
Recensioni esterne » Lenovo Legion Pro 5 16IRX8
Asus ROG Zephyrus G16 GU603VV-N4007W: Intel Core i9-13900H, 16.00", 2 kg
Recensioni esterne » Asus ROG Zephyrus G16 2023 GU603VV-N4007W
MSI Prestige 16 AI Studio B1VFG, Ultra 7 155H: Intel Core Ultra 7 155H, 16.00", 1.6 kg
» Il leak di Intel Core 200 Geekbench suggerisce che la nuova CPU per laptop è un processore da gioco Raptor Lake ribattezzato
Acer Nitro 14 AN14-41-R3MX: AMD Ryzen 5 8645HS, 14.50", 2 kg
» L'Acer Nitro 14 è un notebook da gioco QHD con termiche decenti e un'autonomia di 18 ore
Microsoft Surface Laptop Studio 2 RTX 4060: Intel Core i7-13700H, 14.40", 2 kg
» I nuovi laptop Surface di Microsoft sono costosi, ma i prodotti non sono sufficientemente buoni