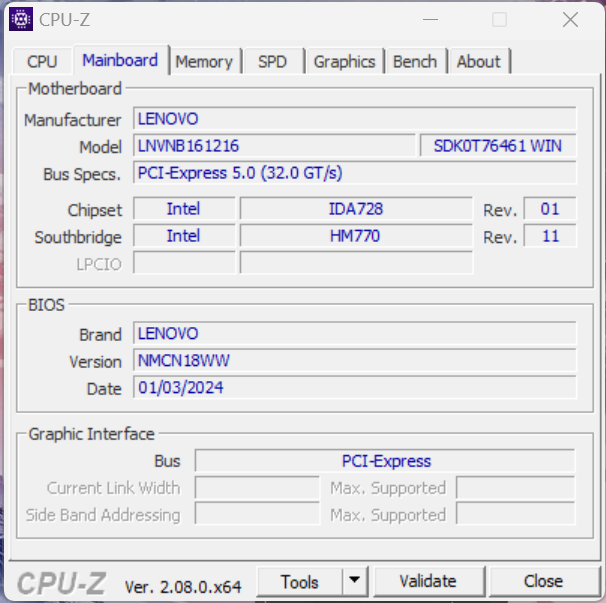
Recensione del Lenovo Legion 5i 16 G9 - portatile gaming veloce con Raptor Lake-HX e un motore AI
Lenovo ha appena presentato il suo nuovo gamer, Legion 5i 16 G9, al CES di quest'anno - e noi abbiamo già avuto modo di testarlo. Il portatile da gioco di fascia media di Lenovo si colloca tra la serie LOQ, più economica, e il più costoso Legion 5 Pro. Con il suo nuovo processore Raptor-Lake-HX, il Core i7-14650HXuna versione da 115 watt del RTX 4060 Laptop (incluso Advanced Optimus) e un veloce pannello WQXGA a 240 Hz, il nuovo Legion 5i 16 si concentra interamente sulle prestazioni, tralasciando aspetti come l'illuminazione estesa del case. Inoltre, il produttore si avvale di uno speciale chip AI - presumibilmente, l'AI Engine+ di Lenovo migliorerà ulteriormente l'esperienza di gioco degli utenti.
Abbiamo testato la versione di Legion 5i 16IRX G9 con processore Core-i7, RTX 4060 Laptop, display a 240 Hz, 16 GB di RAM e un SSD PCIe da 1 TB al prezzo di 1.610 dollari.
Potenziali concorrenti a confrontos
Punteggio | Data | Modello | Peso | Altezza | Dimensione | Risoluzione | Prezzo |
|---|---|---|---|---|---|---|---|
| 89.1 % v7 (old) | 02/2024 | Lenovo Legion 5 16IRX G9 i7-14650HX, GeForce RTX 4060 Laptop GPU | 2.4 kg | 25.2 mm | 16.00" | 2560x1600 | |
| 89.2 % v7 (old) | 10/2023 | Schenker XMG CORE 16 (L23) R7 7840HS, GeForce RTX 4070 Laptop GPU | 2.4 kg | 26.1 mm | 16.00" | 2560x1600 | |
| 85.1 % v7 (old) | 09/2023 | HP Victus 16-r0077ng i7-13700H, GeForce RTX 4070 Laptop GPU | 2.4 kg | 24 mm | 16.10" | 1920x1080 | |
| 87.3 % v7 (old) | 09/2023 | Lenovo LOQ 16IRH8 i7-13620H, GeForce RTX 4060 Laptop GPU | 2.7 kg | 25.9 mm | 16.00" | 2560x1600 | |
| 87.7 % v7 (old) | 08/2023 | Lenovo Legion Slim 5 16APH8 R7 7840HS, GeForce RTX 4060 Laptop GPU | 2.4 kg | 25.2 mm | 16.00" | 2560x1600 | |
| 85.6 % v7 (old) | 09/2023 | HP Victus 16-r0076TX i5-13500HX, GeForce RTX 4050 Laptop GPU | 2.3 kg | 22.9 mm | 16.10" | 1920x1080 | |
| 88.3 % v7 (old) | 09/2023 | Alienware m16 R1 Intel i7-13700HX, GeForce RTX 4060 Laptop GPU | 3 kg | 25.4 mm | 16.00" | 2560x1600 | |
| 87.9 % v7 (old) | 05/2023 | Lenovo Legion Pro 5 16IRX8 i7-13700HX, GeForce RTX 4060 Laptop GPU | 2.5 kg | 26.8 mm | 16.00" | 2560x1600 |
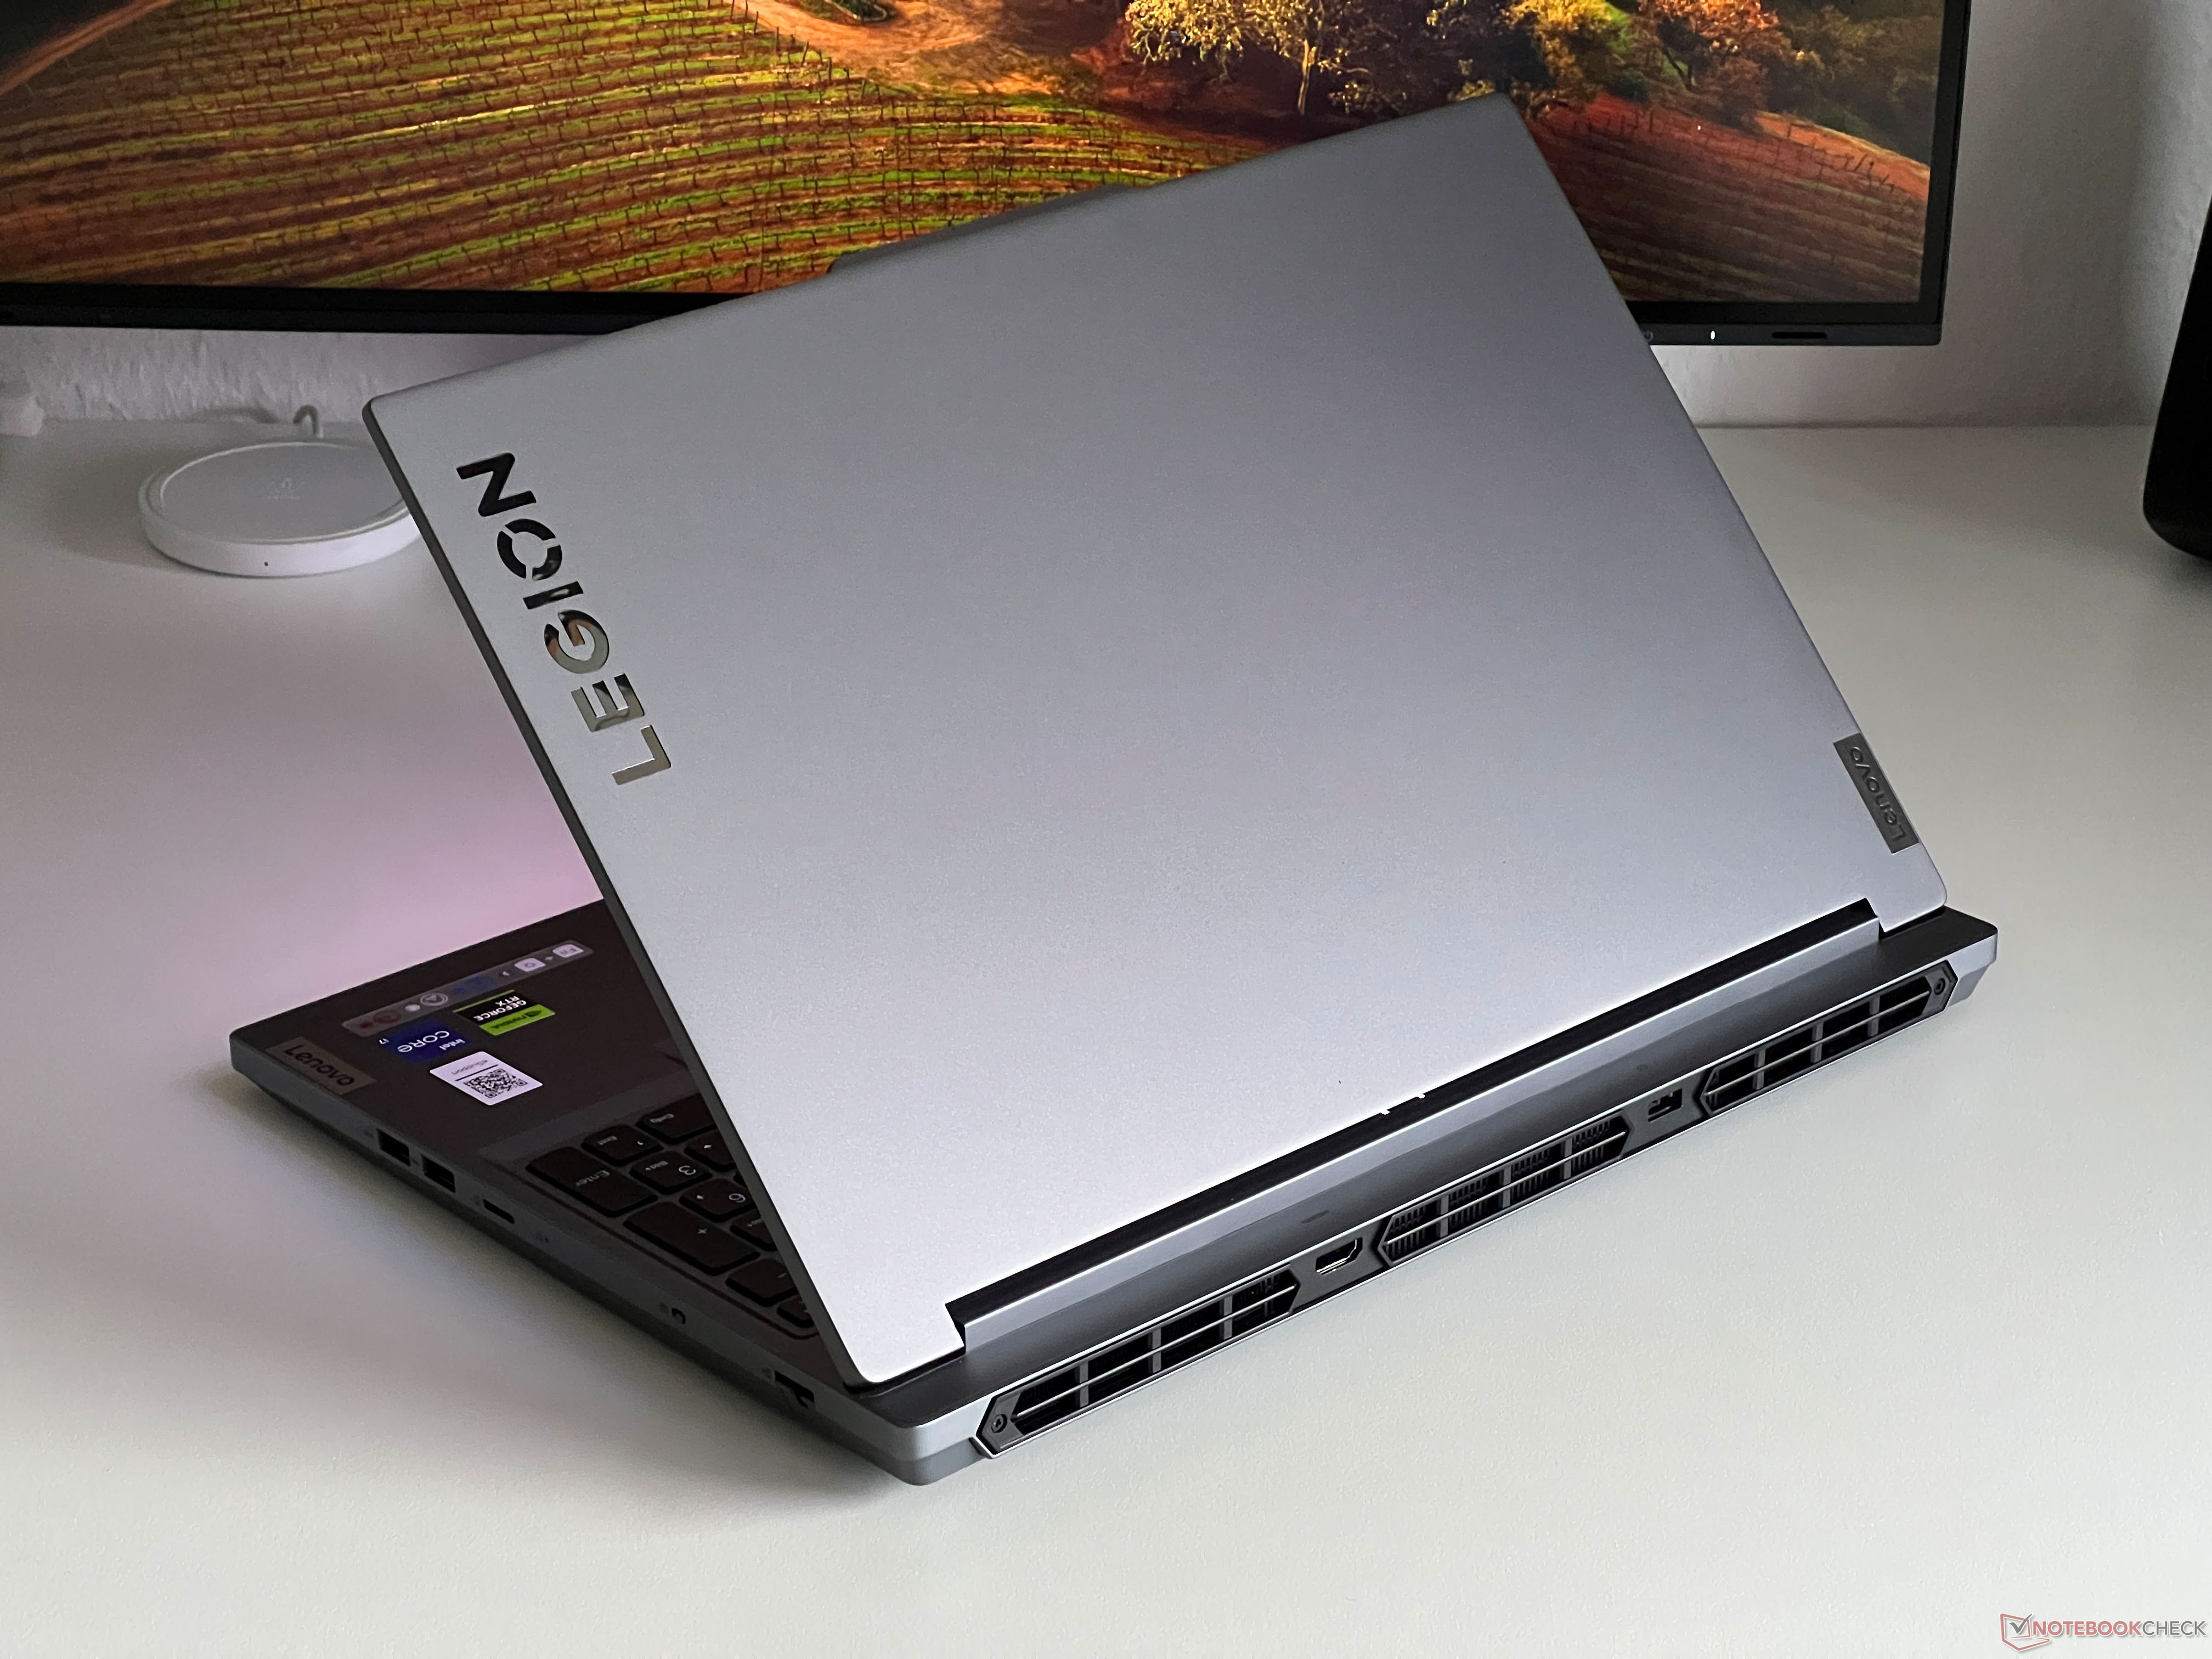
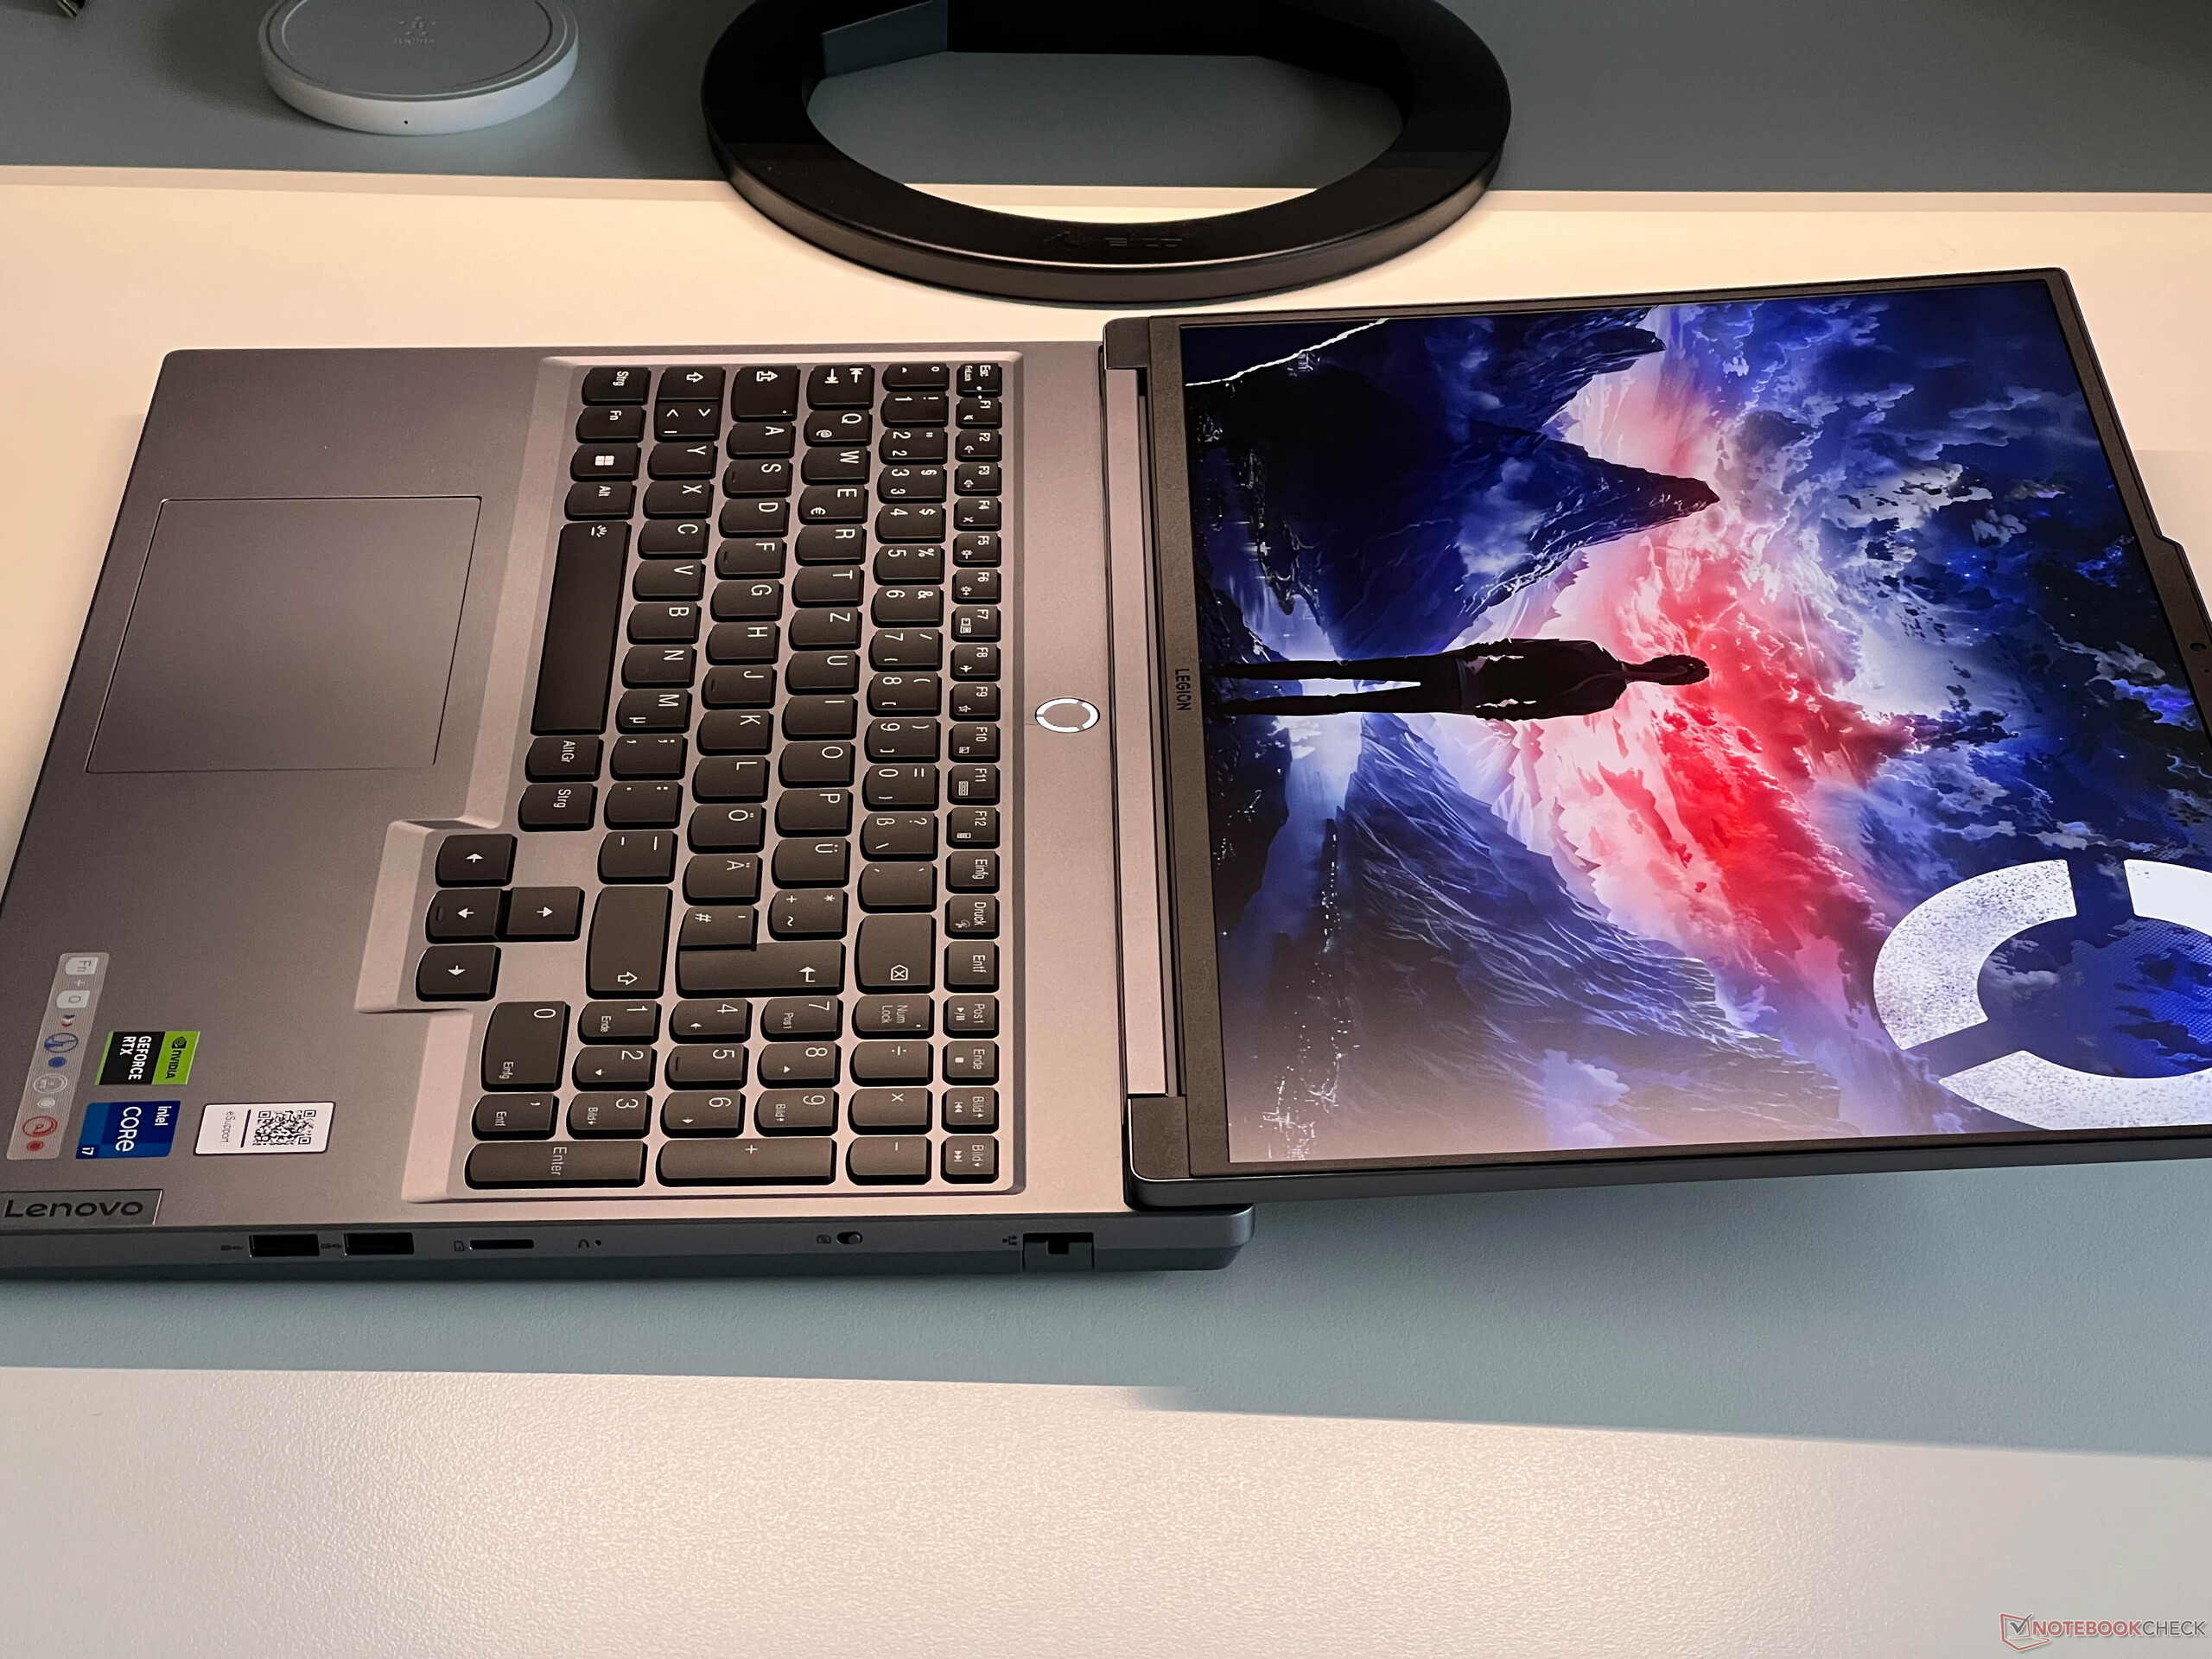
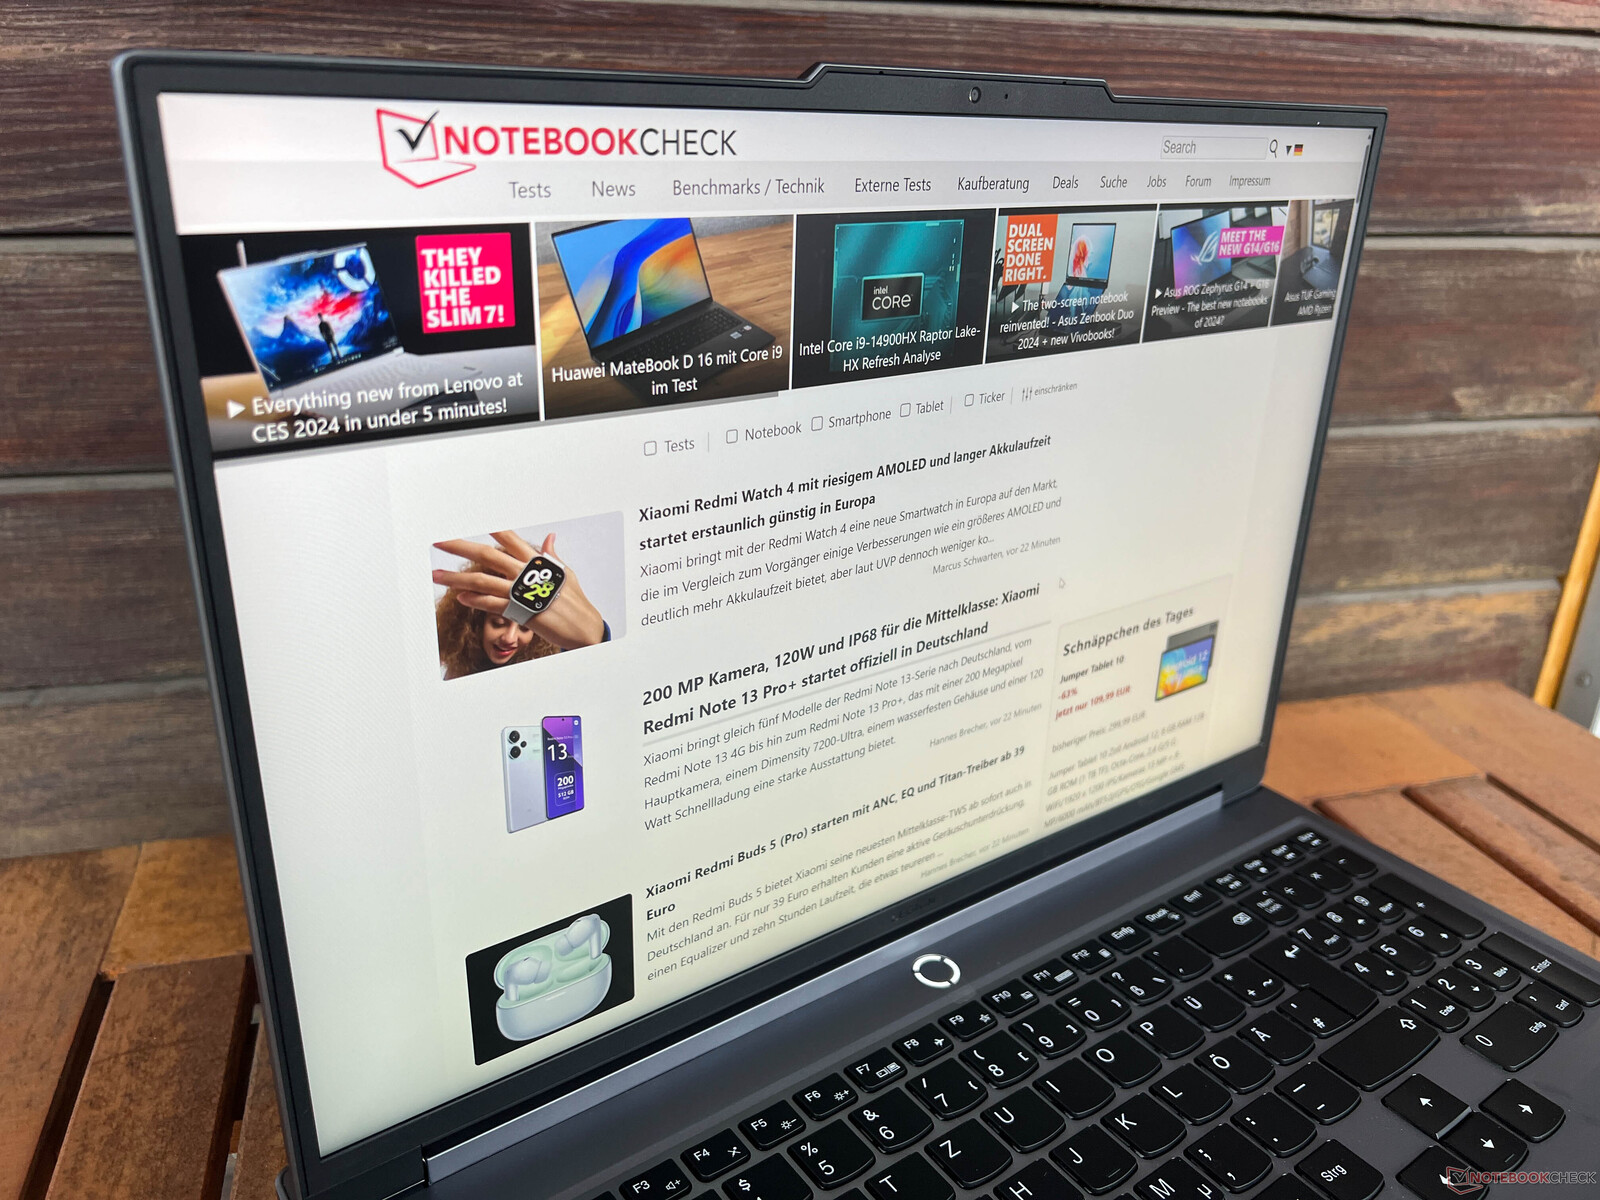
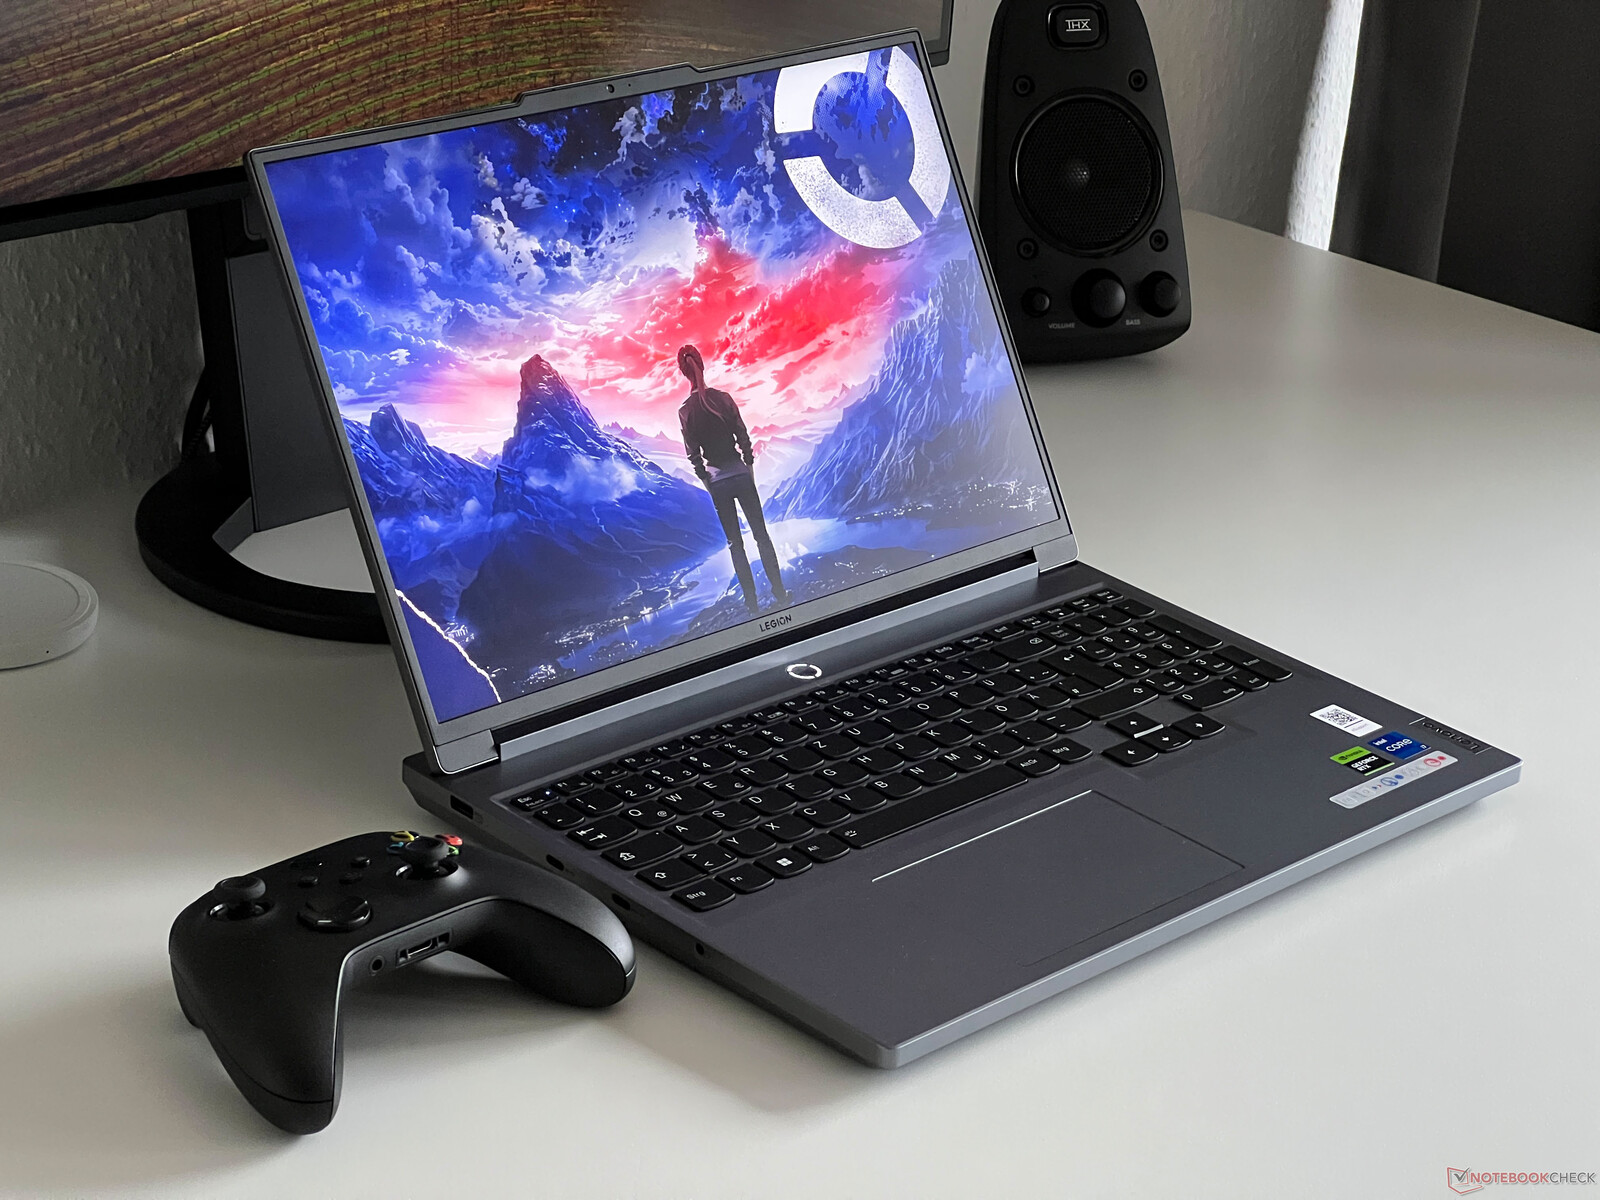
Custodia - Il sito Legion è in parte dotato di alluminio
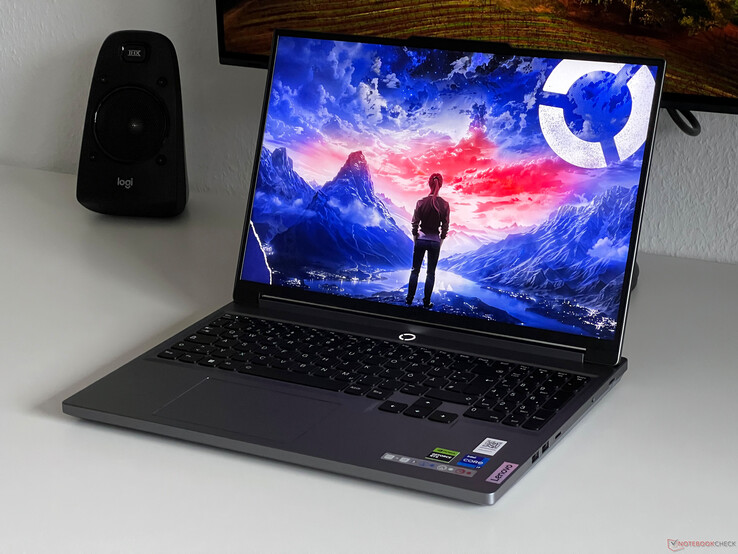
Il case del dispositivo è molto elegante per un portatile da gioco e se preferisce che le cose siano più accattivanti, allora Legion 5i potrebbe deluderla. A parte la tastiera e le cornici nere, non presenta altri contrasti di colore e, inoltre, Lenovo ha deciso di non installare alcuna illuminazione nel case. Solo il LED di stato che circonda il pulsante di accensione si illumina in quattro colori che dipendono dal profilo energetico in uso. Almeno questo significa che potrà utilizzare il portatile anche in contesti più professionali, come ad esempio all'università.
In termini di qualità, il case ha una sensazione di fascia alta, anche se solo il coperchio è realizzato in alluminio. L'unità di base è interamente in plastica, ma la parte superiore è comunque molto bella. Solo la parte inferiore della custodia è un po' più ruvida e dà un'impressione un po' più economica. Un vantaggio della custodia è che attira poco lo sporco e le impronte digitali. La stabilità è complessivamente buona, ma non è una sorpresa visto lo spessore dell'unità base (massimo 2 cm sul retro). Le cerniere del display sono state impostate bene e consentono di aprire il portatile con una sola mano; l'angolo di apertura massimo è di 180 gradi.
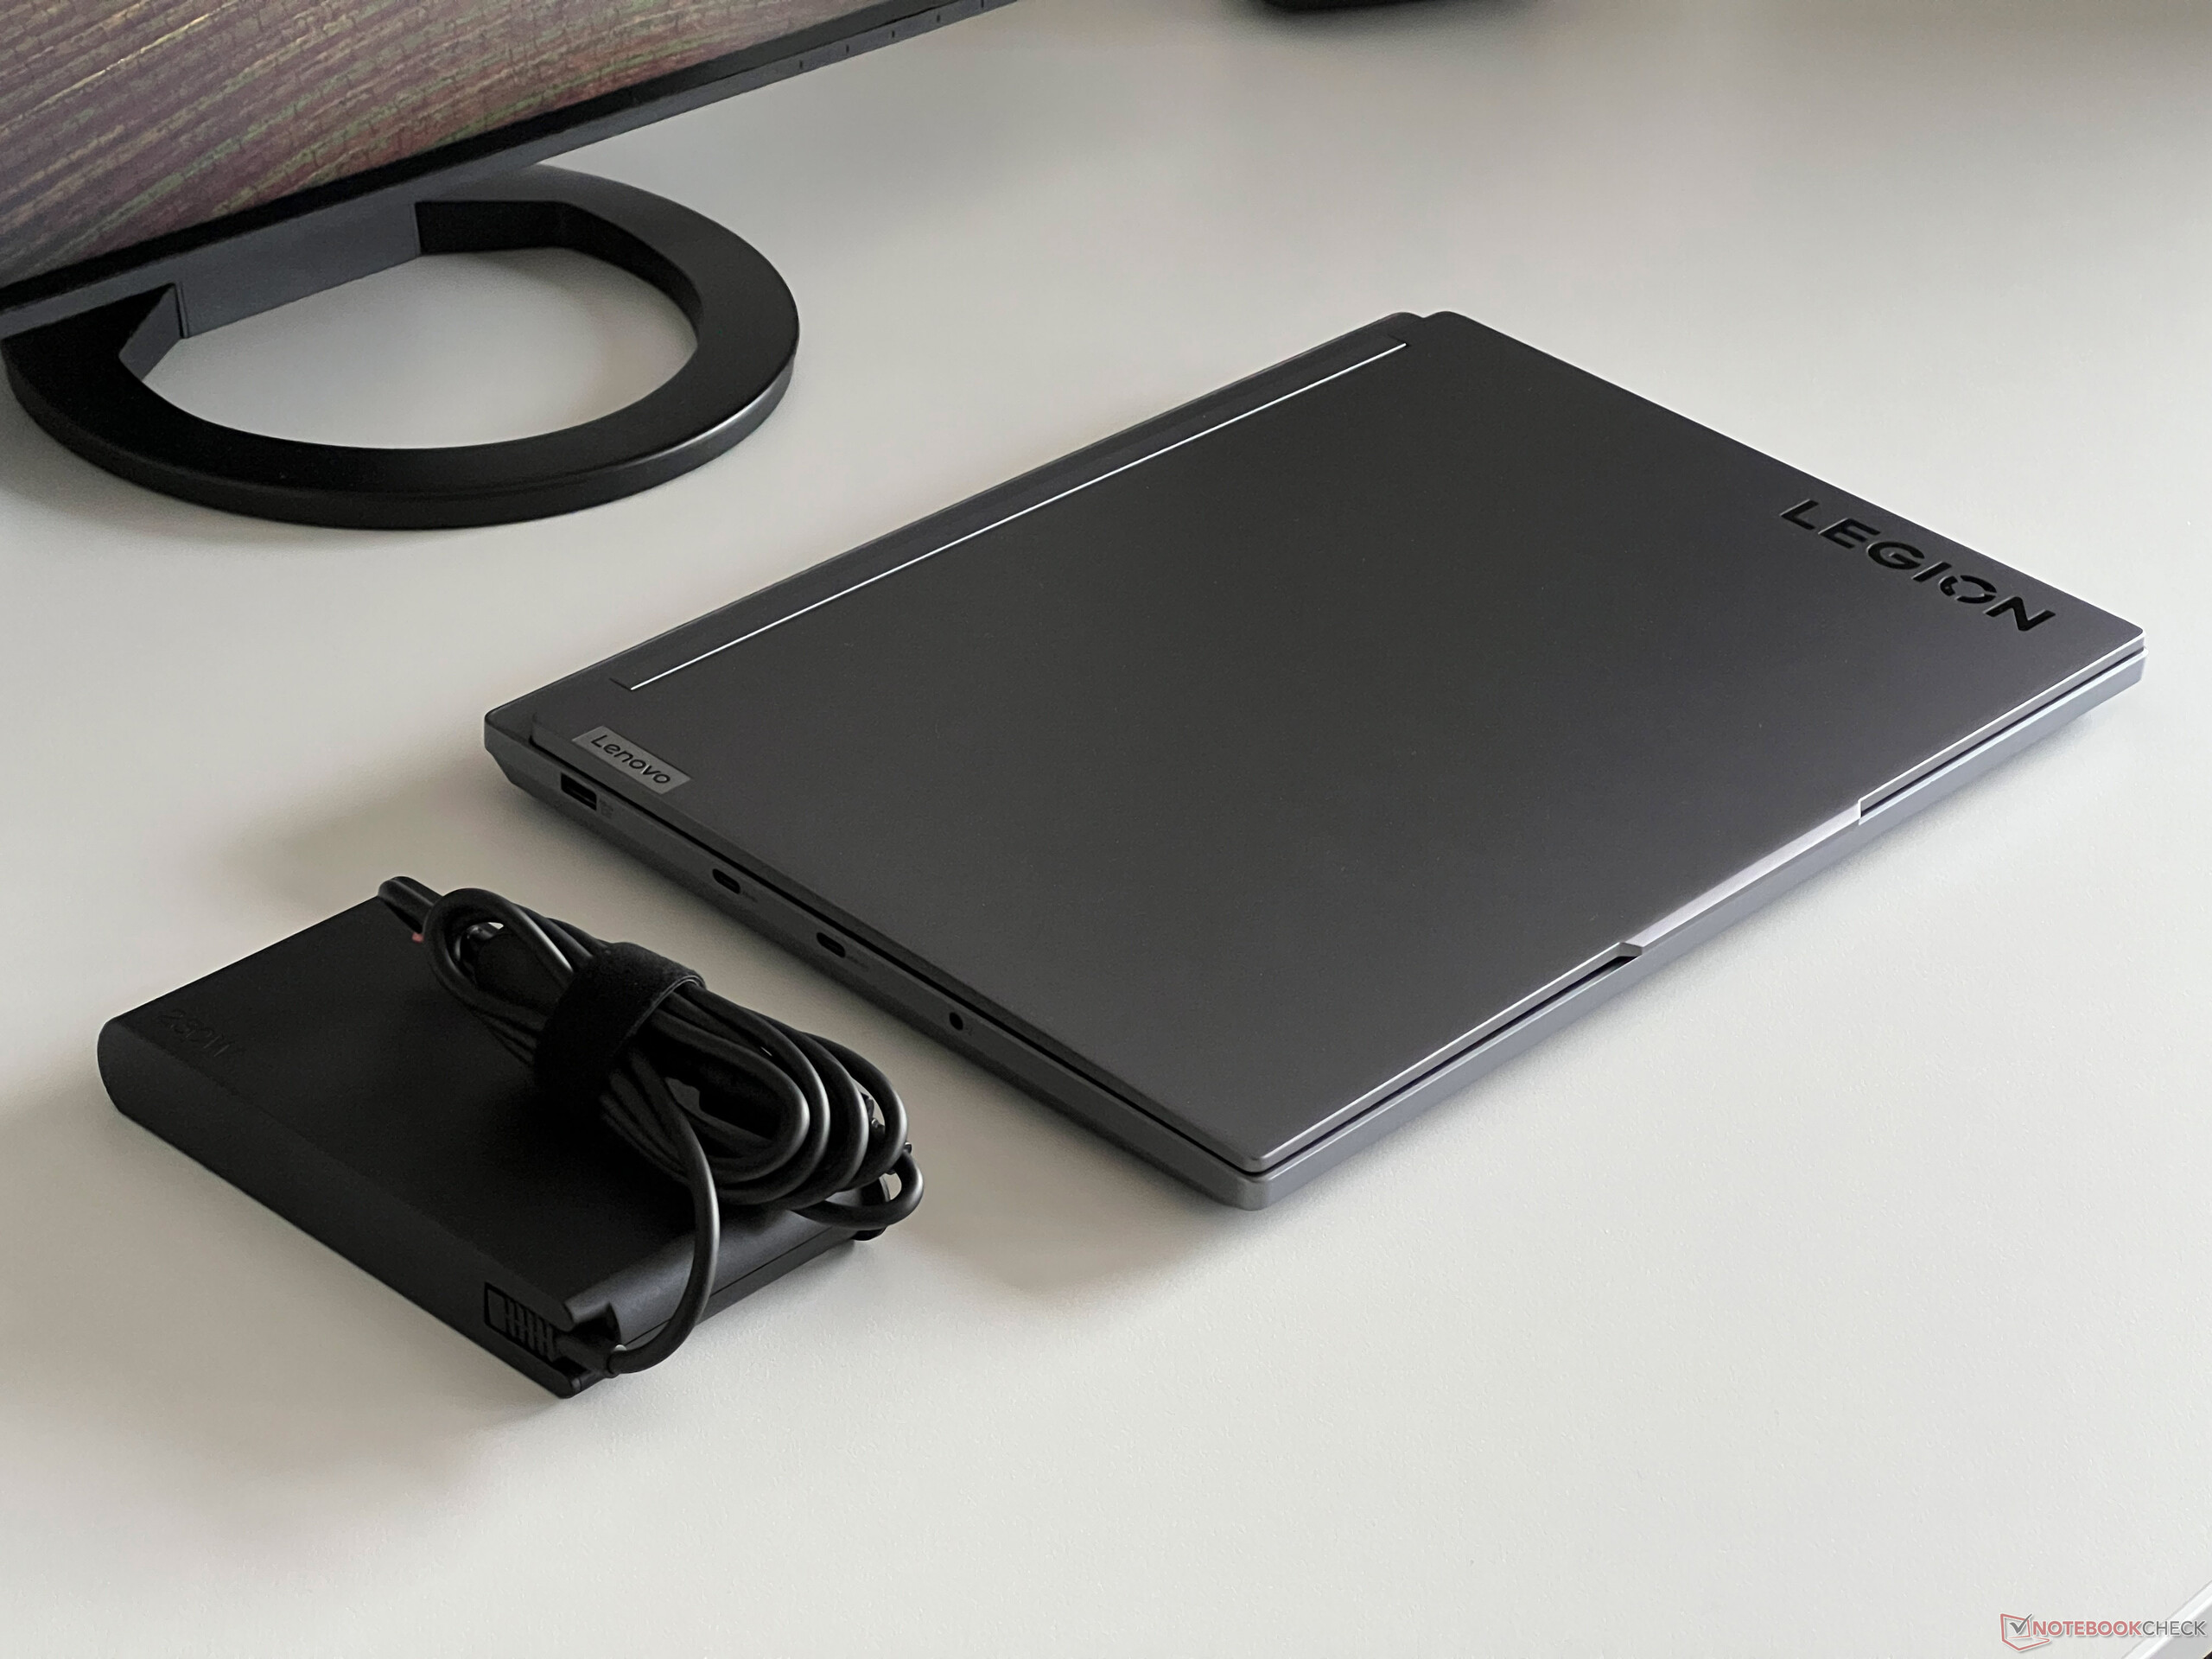
Con un peso di 2,4 kg, non è affatto leggero come una piuma, ma nell'ambito del confronto, il nostro campione di prova si comporta bene. Il suo ingombro lo rende anche uno dei modelli più compatti. Dovrà prevedere 869 grammi in più per l'alimentatore da 230 watt.
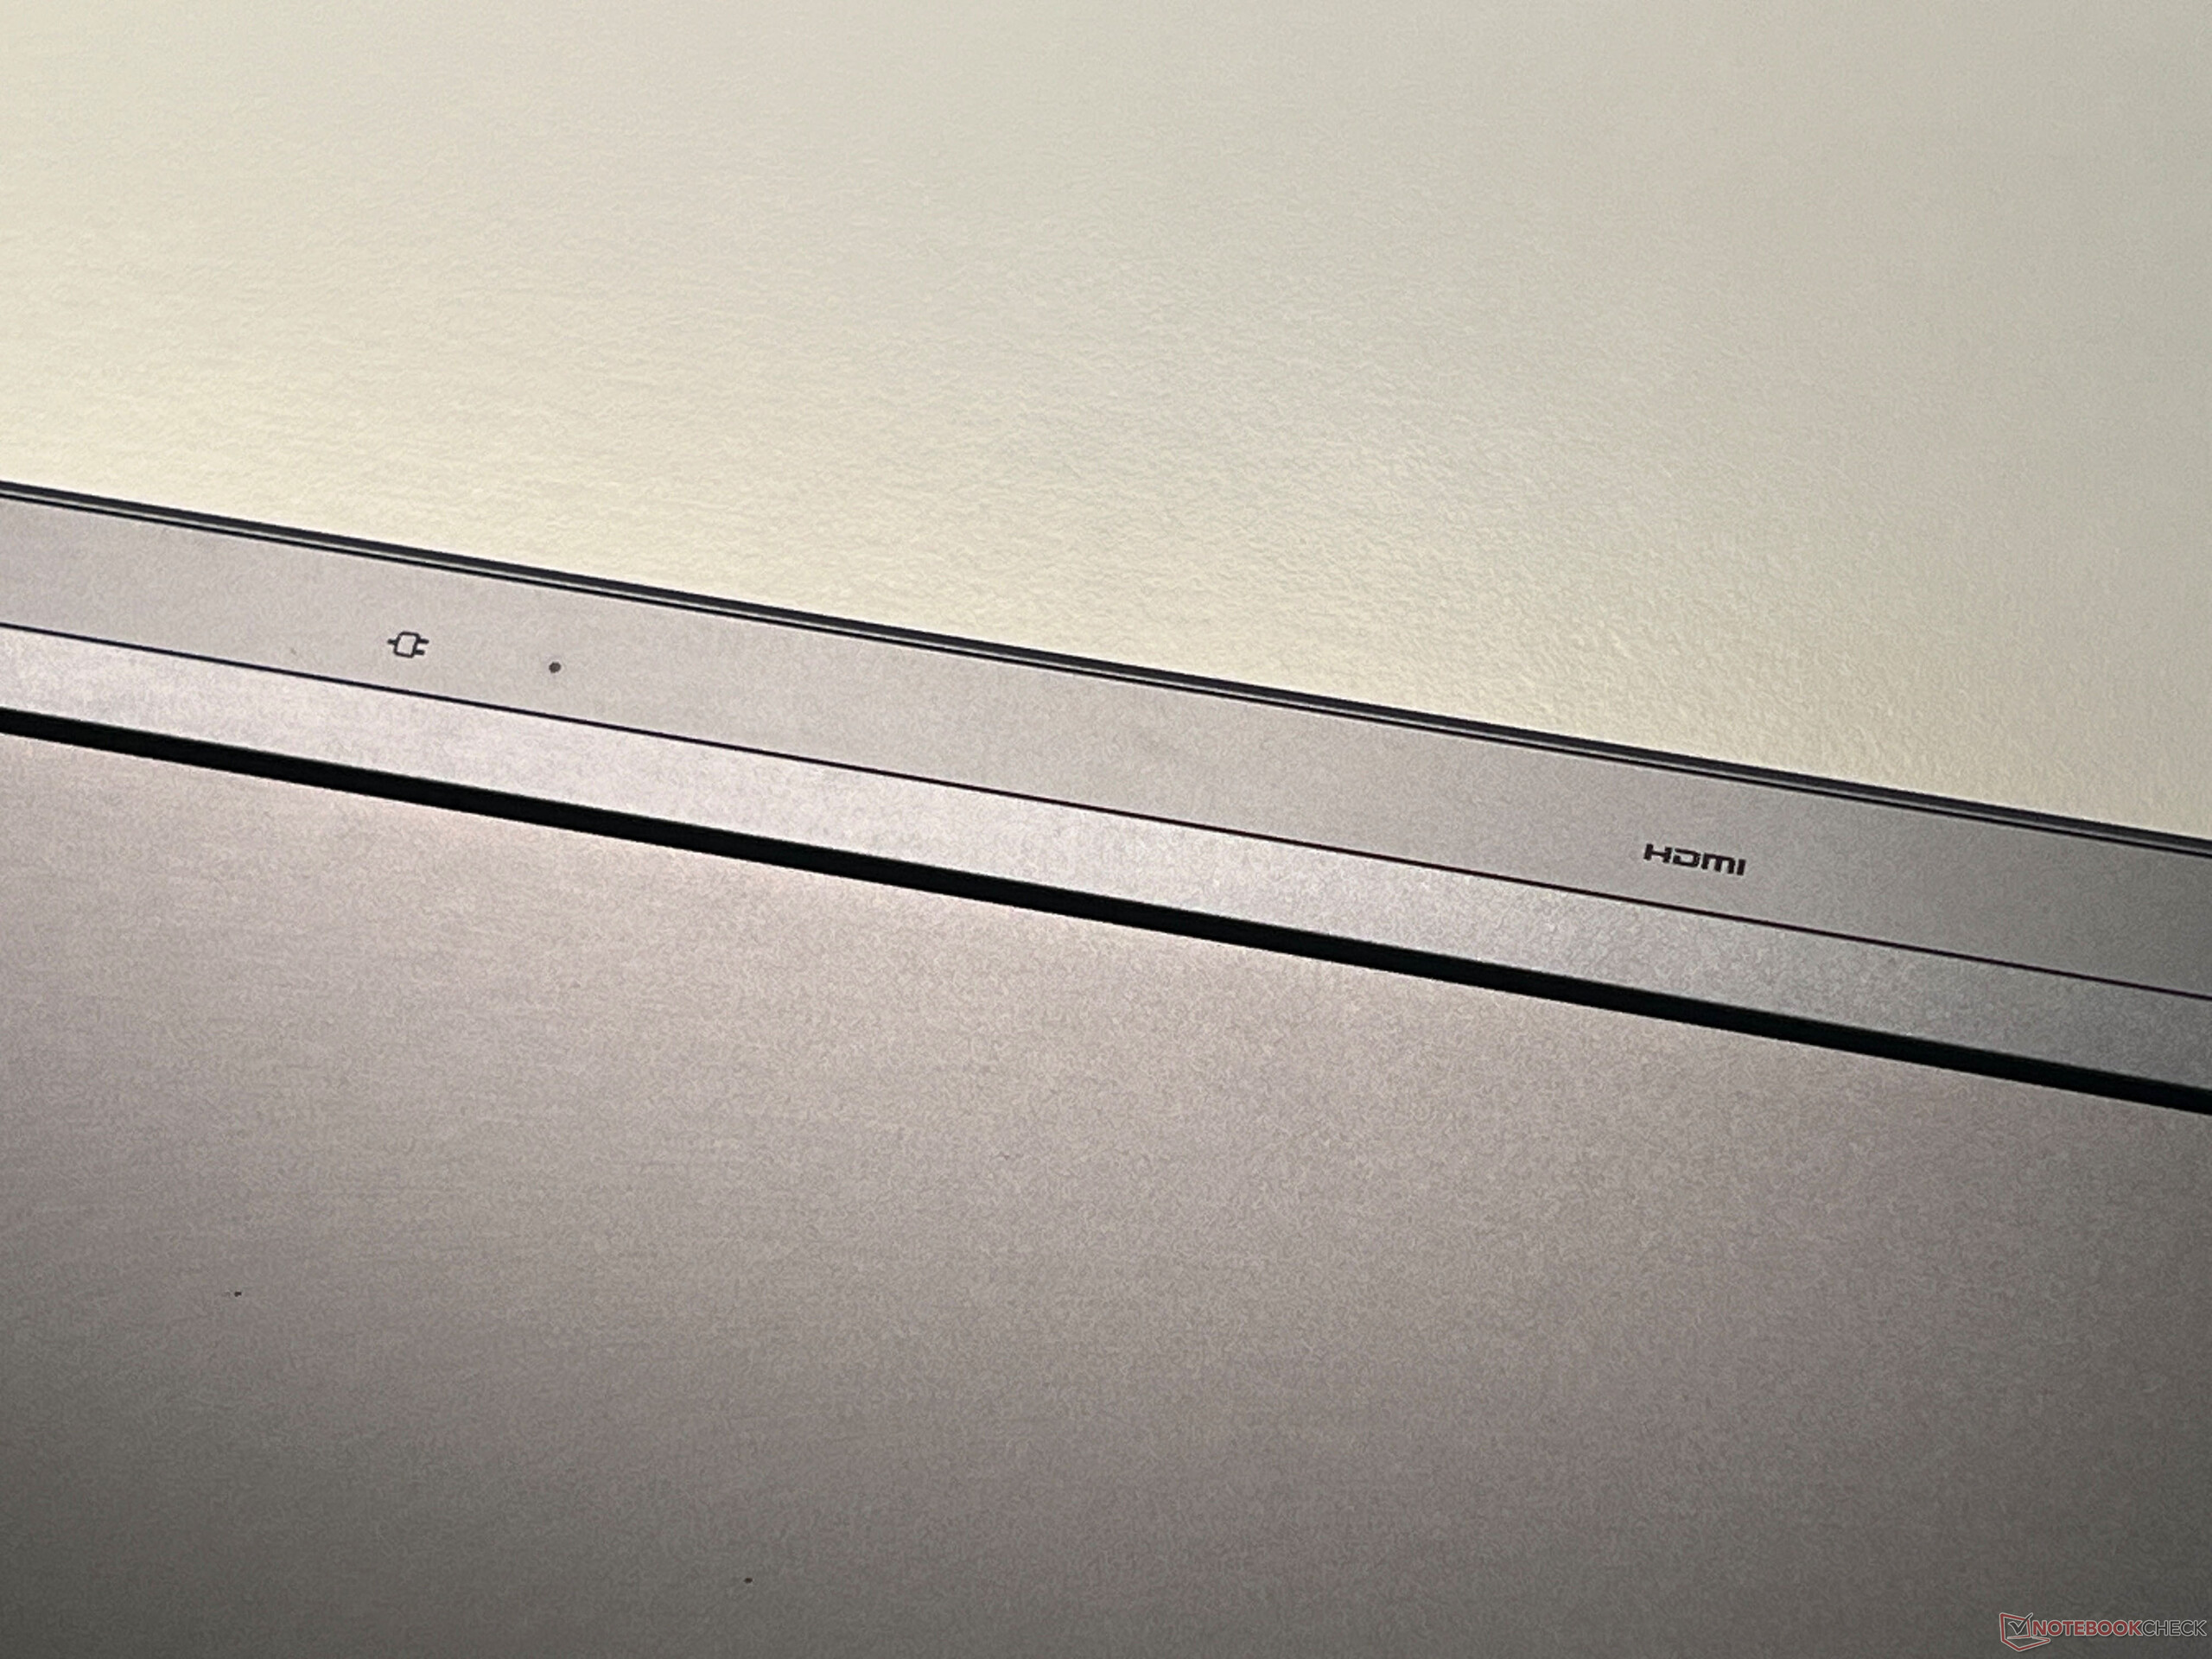
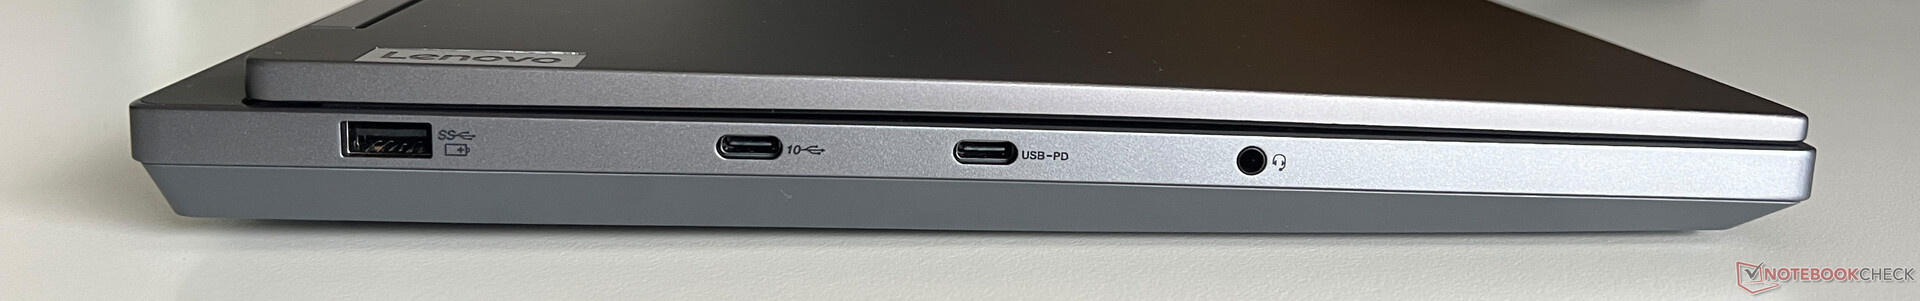
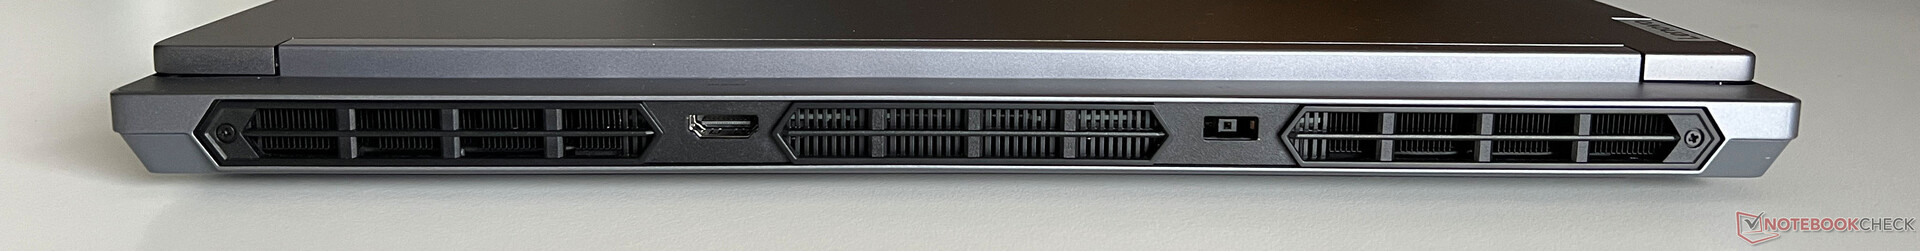
Connettività - Lenovo ha rinunciato alla Thunderbolt
Su Legion 5i 16 (così come su Legion Pro 5i), Lenovo ha deciso di non installare Thunderbolt 4, ma a sua volta presenta una buona selezione di porte distribuite su tutti e tre i lati. Il retro ospita la connessione di alimentazione e la porta HDMI, la parte sinistra presenta tre porte USB e ci sono altre due connessioni USB sul lato destro. Tutte le uscite video sono collegate tramite la dGPU, il che significa che la GPU Nvidia è sempre attiva quando si collega un monitor esterno.
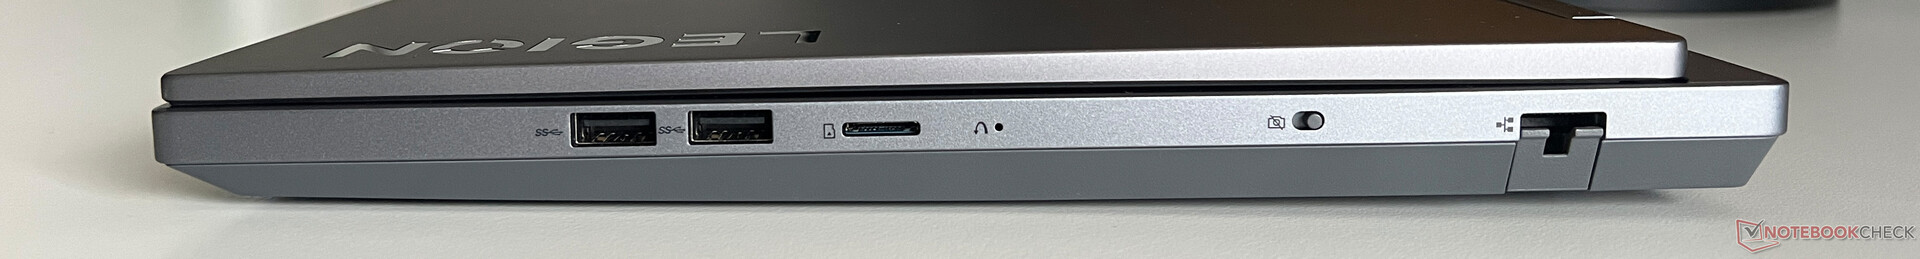
Lettore di schede SD
Il lettore di schede microSD sul lato destro del dispositivo non accetta completamente le schede e non è particolarmente veloce. In combinazione con la nostra scheda di riferimento (Angelibird AV Pro V60), abbiamo misurato una bassa velocità di trasferimento di circa 30 MB/s.
| SD Card Reader | |
| average JPG Copy Test (av. of 3 runs) | |
| Alienware m16 R1 Intel (AV PRO microSD 128 GB V60) | |
| Media della classe Gaming (20.9 - 210, n=55, ultimi 2 anni) | |
| Lenovo Legion Slim 5 16APH8 (PNY EliteX-Pro60 V60 256 GB) | |
| Schenker XMG CORE 16 (L23) | |
| Lenovo Legion 5 16IRX G9 | |
| maximum AS SSD Seq Read Test (1GB) | |
| Alienware m16 R1 Intel (AV PRO microSD 128 GB V60) | |
| Media della classe Gaming (25.5 - 261, n=52, ultimi 2 anni) | |
| Lenovo Legion Slim 5 16APH8 (PNY EliteX-Pro60 V60 256 GB) | |
| Schenker XMG CORE 16 (L23) | |
| Lenovo Legion 5 16IRX G9 | |
Comunicazione
Lenovo ha dotato il Legion del modulo WLAN AX211 di Intel che, oltre al Bluetooth 5.3, padroneggia anche l'attuale standard Wi-Fi-6E per le reti a 6-GHz. In combinazione con il nostro router di riferimento di Asus, le sue velocità di trasferimento sono state ottime in totale, anche se la concorrenza è stata ancora più veloce in alcuni momenti. Tuttavia, non dovrebbe essere in grado di notarlo nell'uso pratico e durante il nostro test non abbiamo mai avuto problemi con la qualità del segnale. Inoltre, il portatile dispone di una porta Gigabit-Ethernet per le connessioni cablate.
| Networking | |
| Lenovo Legion 5 16IRX G9 | |
| iperf3 transmit AXE11000 | |
| iperf3 receive AXE11000 | |
| Schenker XMG CORE 16 (L23) | |
| iperf3 transmit AXE11000 | |
| iperf3 receive AXE11000 | |
| HP Victus 16-r0077ng | |
| iperf3 transmit AXE11000 | |
| iperf3 receive AXE11000 | |
| Lenovo LOQ 16IRH8 | |
| iperf3 transmit AXE11000 | |
| iperf3 receive AXE11000 | |
| Lenovo Legion Slim 5 16APH8 | |
| iperf3 transmit AXE11000 | |
| iperf3 receive AXE11000 | |
| iperf3 transmit AXE11000 6GHz | |
| iperf3 receive AXE11000 6GHz | |
| HP Victus 16-r0076TX | |
| iperf3 transmit AXE11000 | |
| iperf3 receive AXE11000 | |
| iperf3 transmit AXE11000 6GHz | |
| iperf3 receive AXE11000 6GHz | |
| Alienware m16 R1 Intel | |
| iperf3 transmit AXE11000 | |
| iperf3 receive AXE11000 | |
| Lenovo Legion Pro 5 16IRX8 | |
| iperf3 transmit AXE11000 | |
| iperf3 receive AXE11000 | |
| iperf3 transmit AXE11000 6GHz | |
| iperf3 receive AXE11000 6GHz | |
Webcam
La webcam 1080p di Legion 5i svolge il suo compito, scattando foto decenti in buone condizioni di luce. Il rovescio della medaglia è che non supporta alcun effetto di studio aggiuntivo e non dispone di un sensore IR per il riconoscimento facciale tramite Windows Hello. Sul lato destro è presente un interruttore che disattiva la webcam.


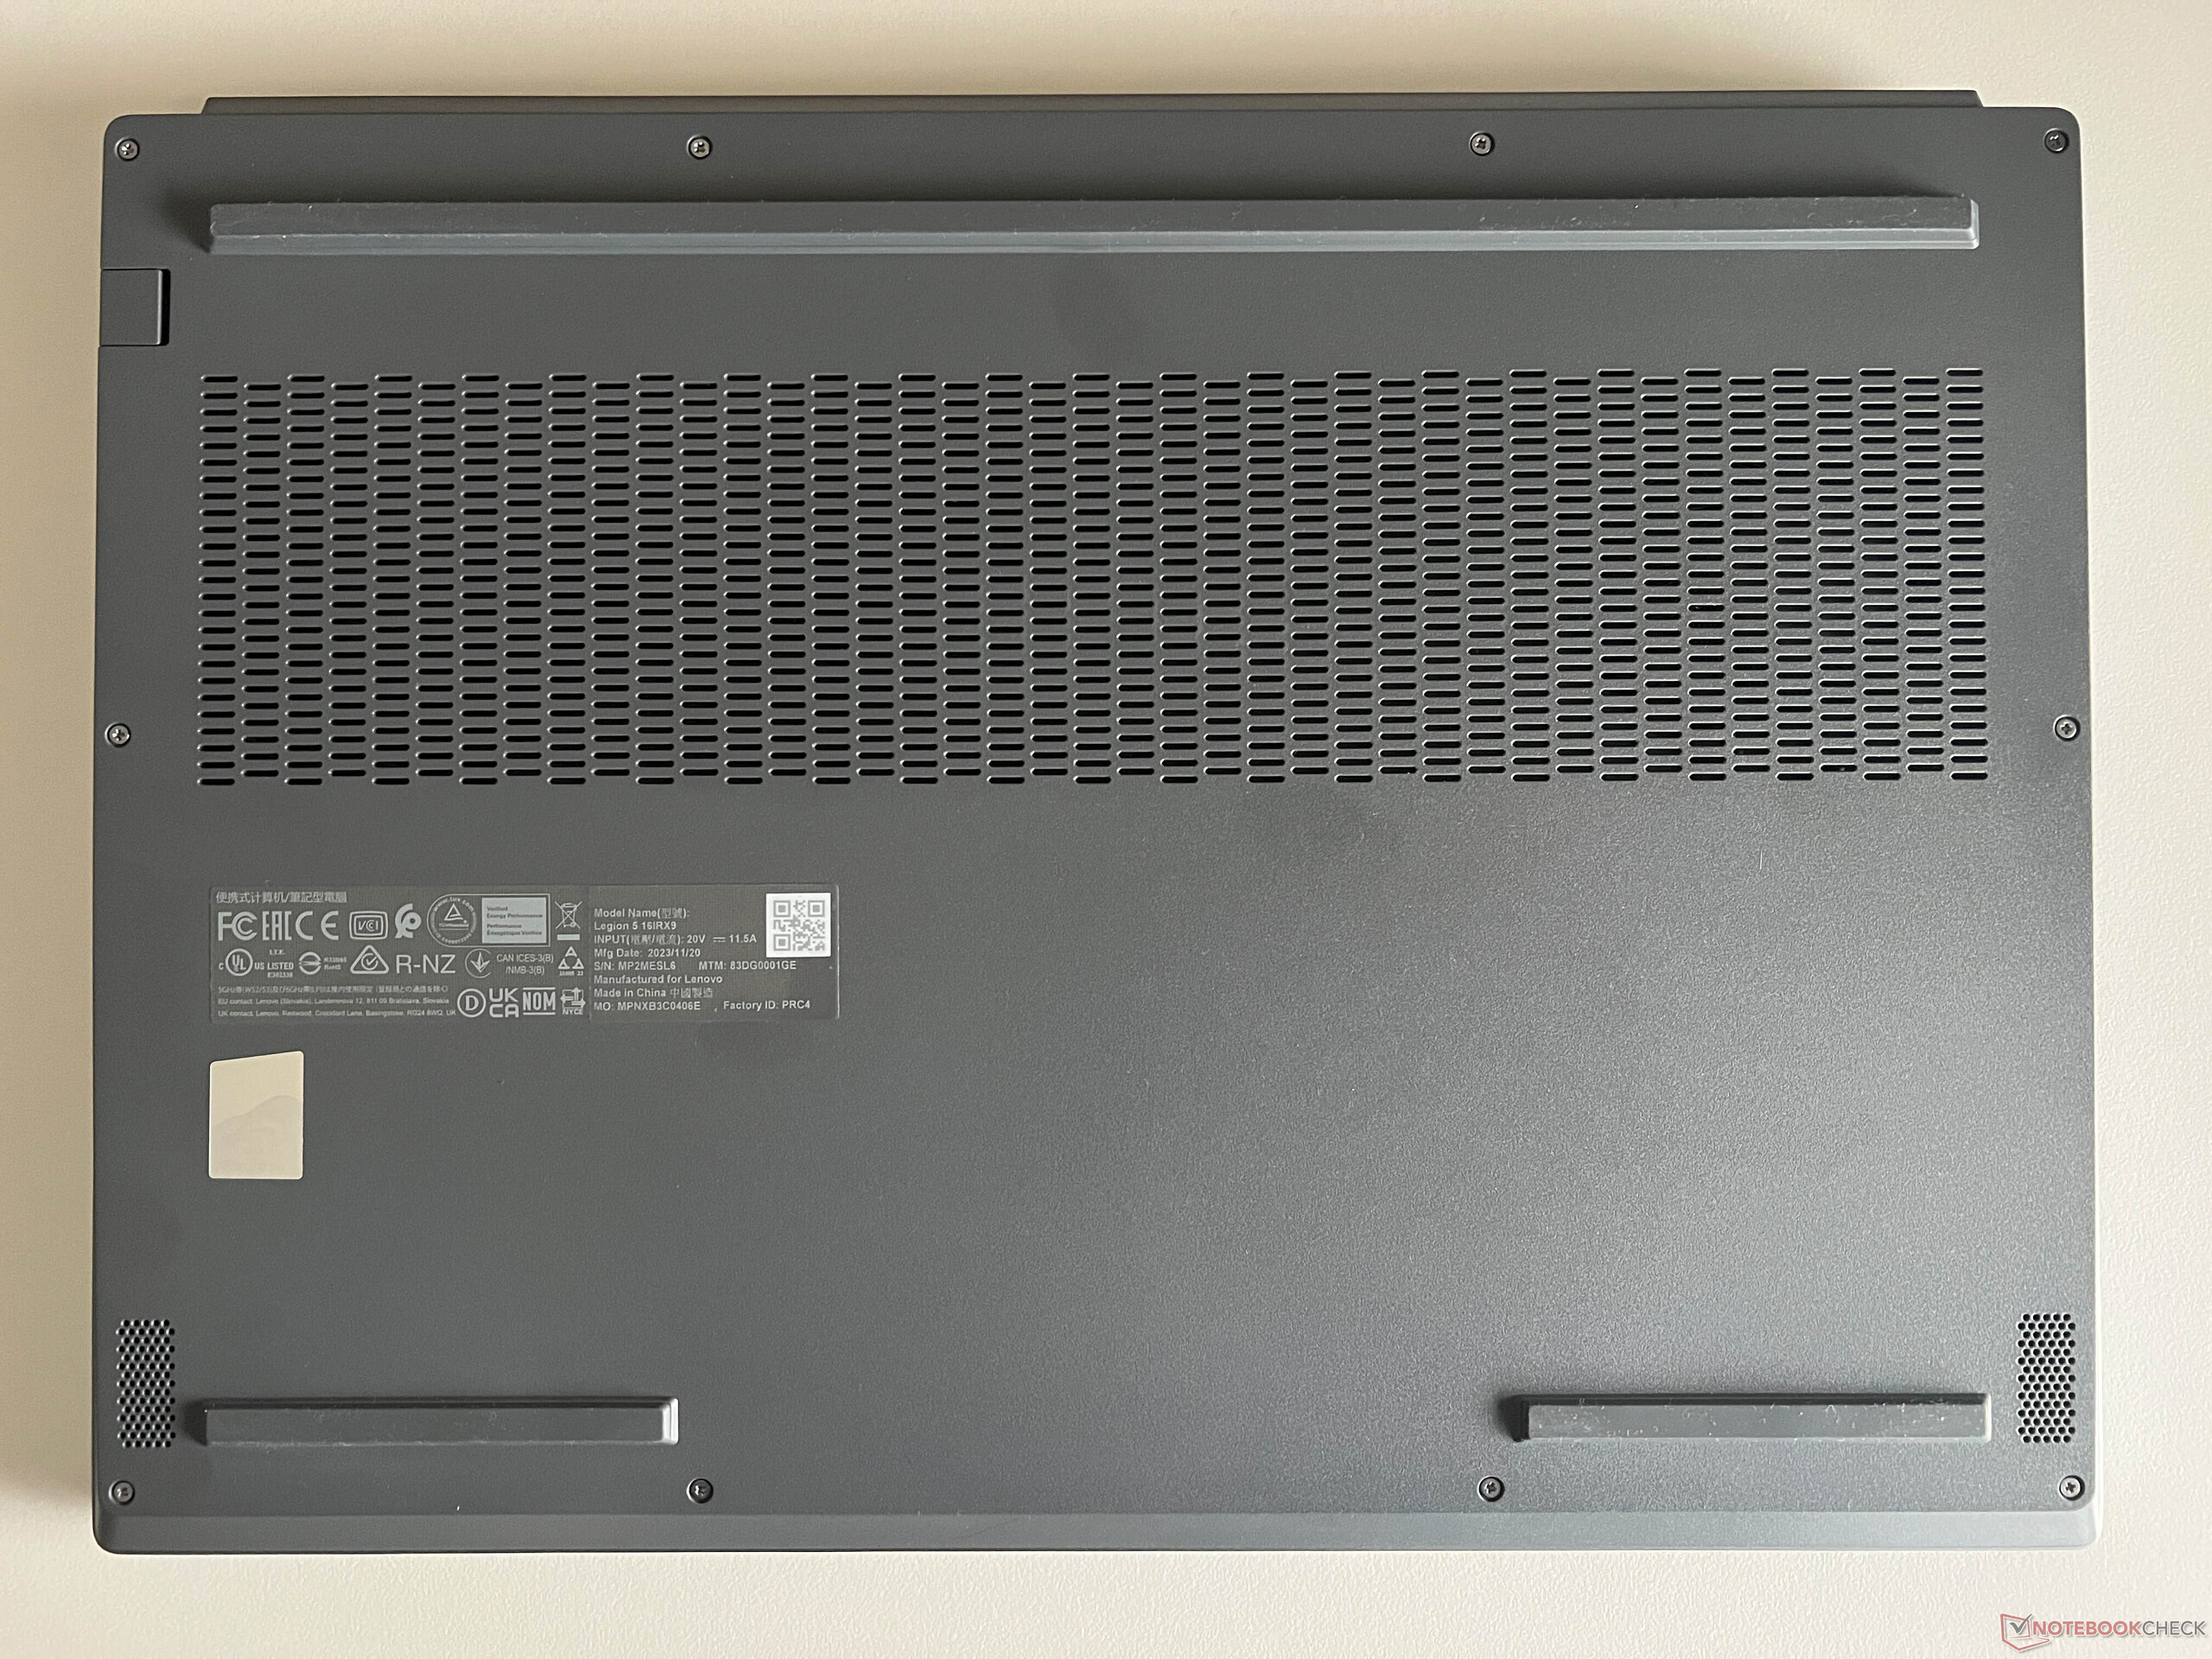
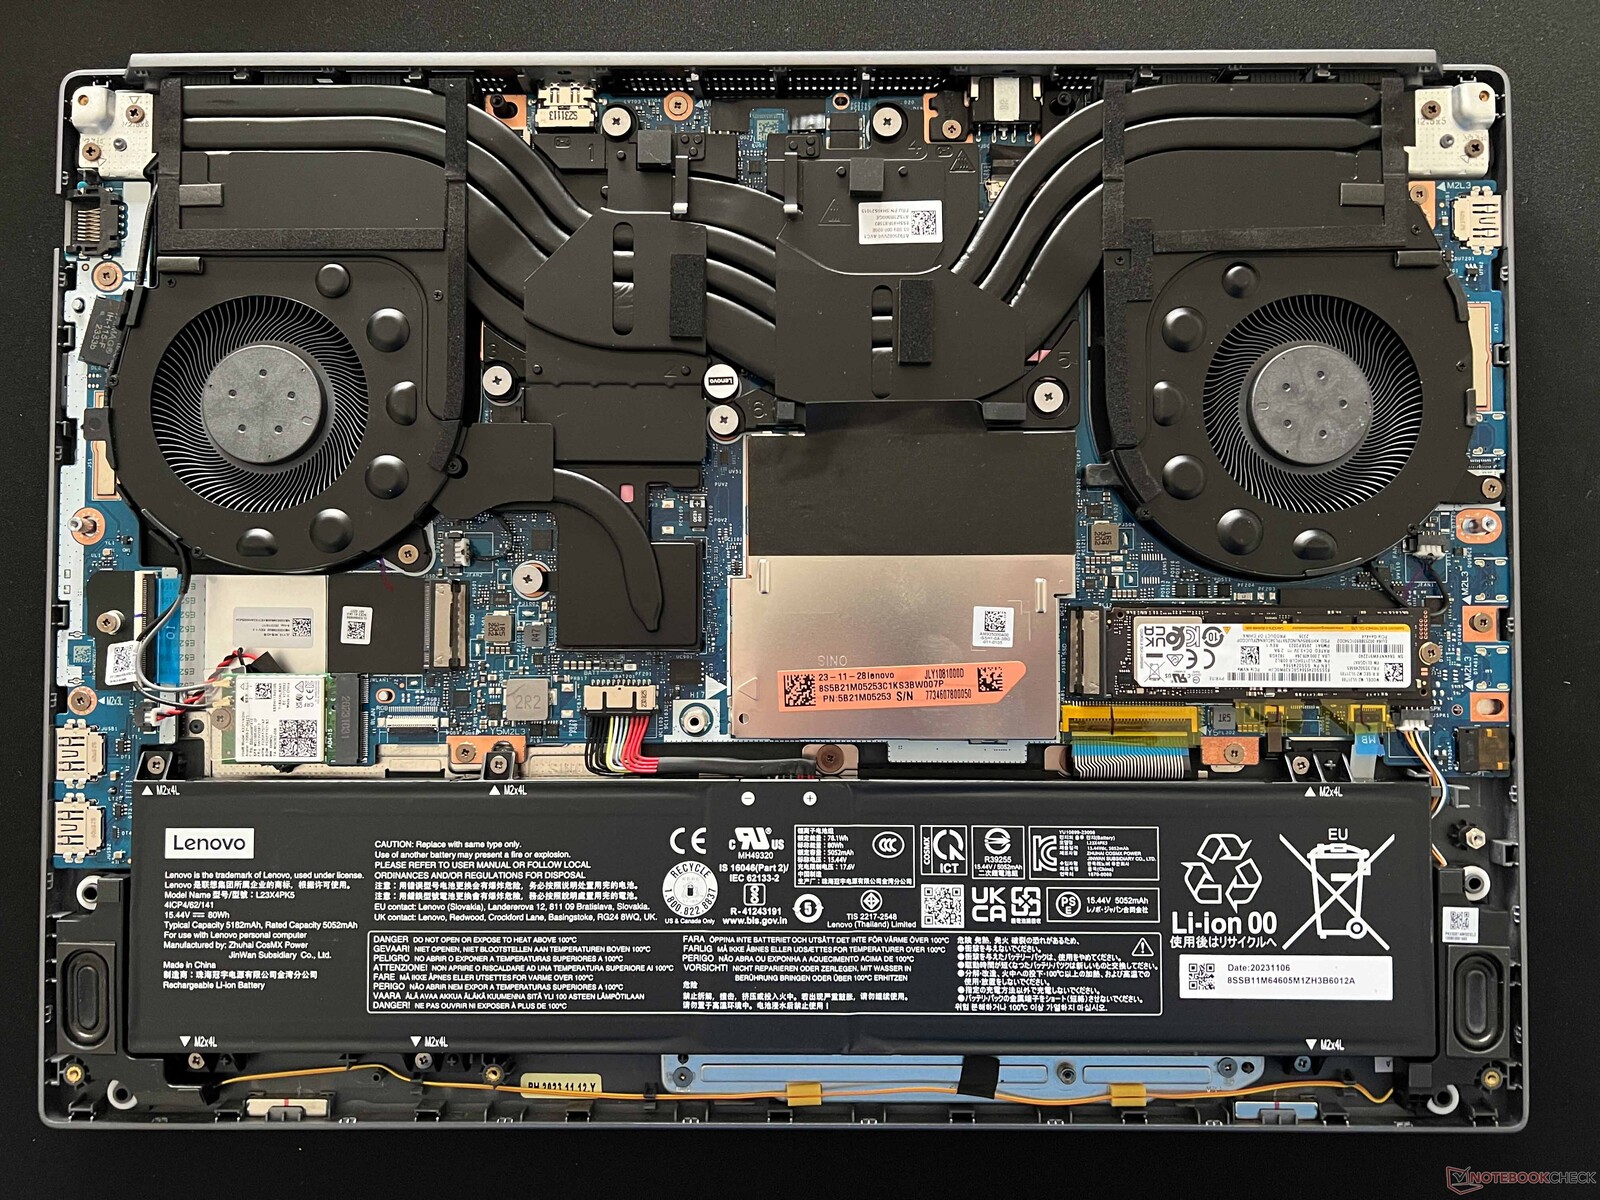
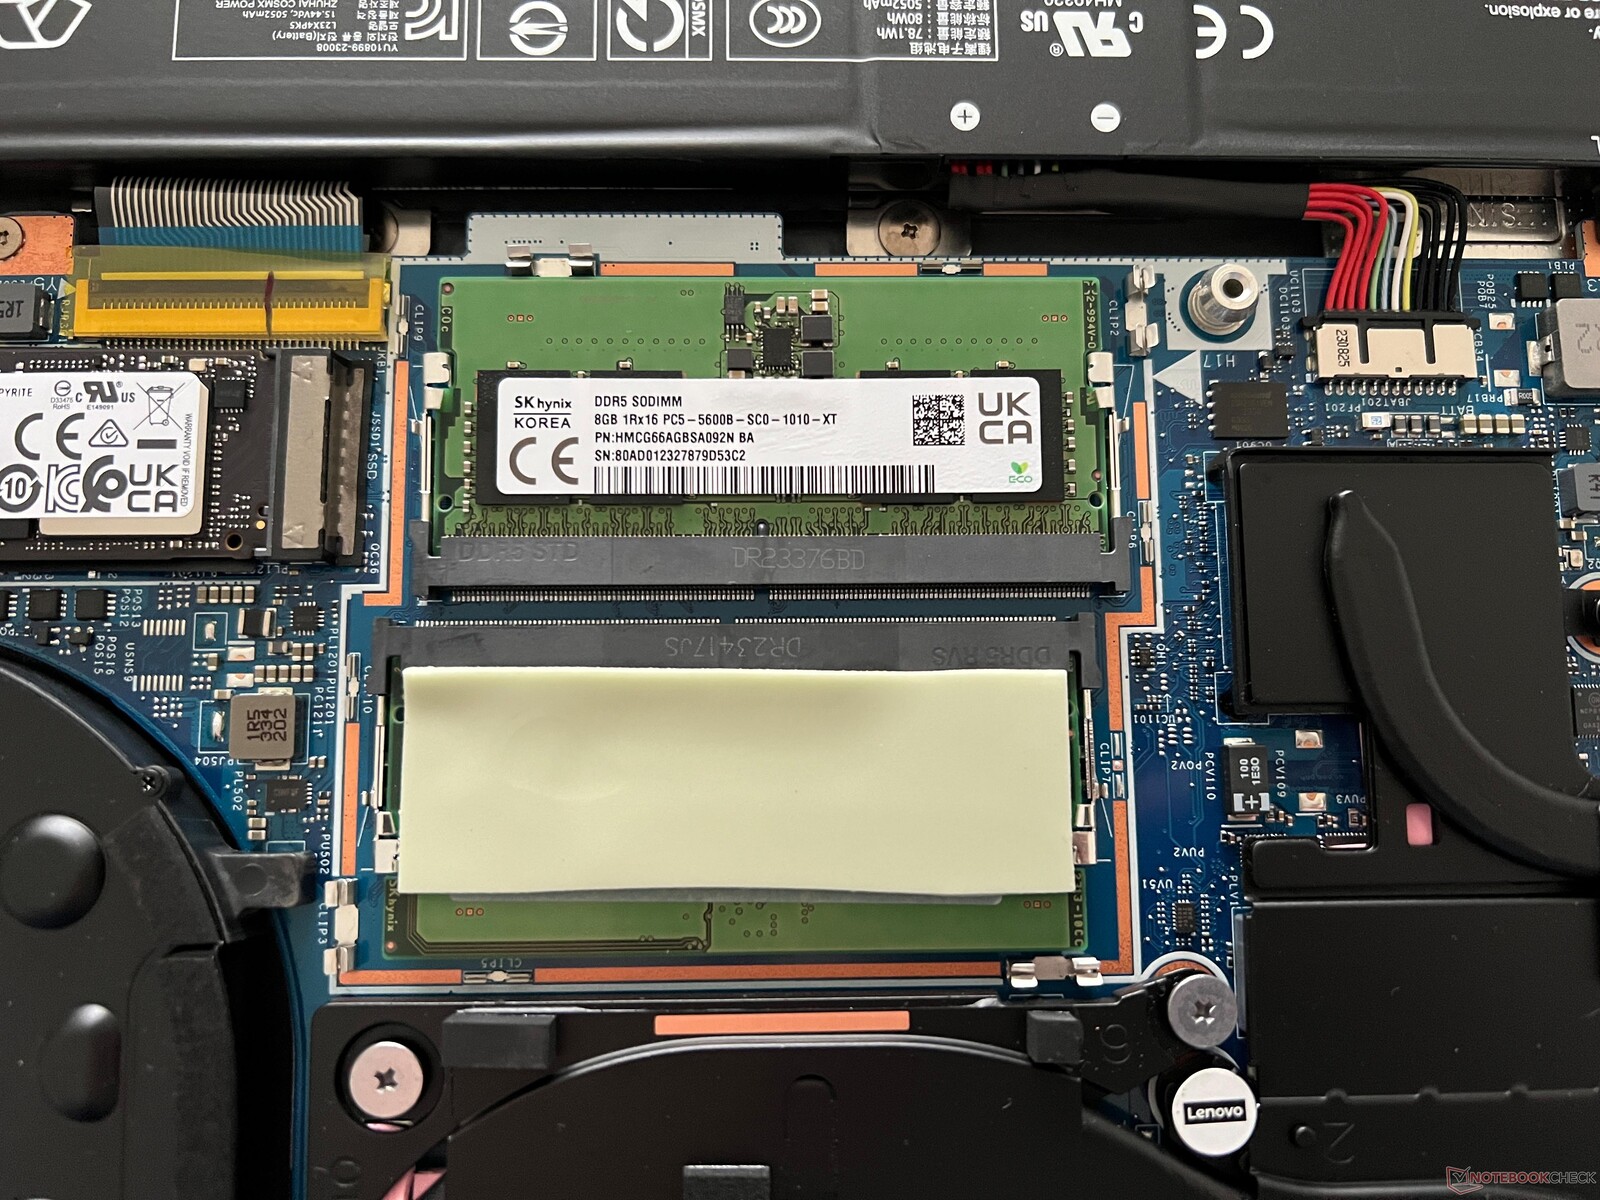
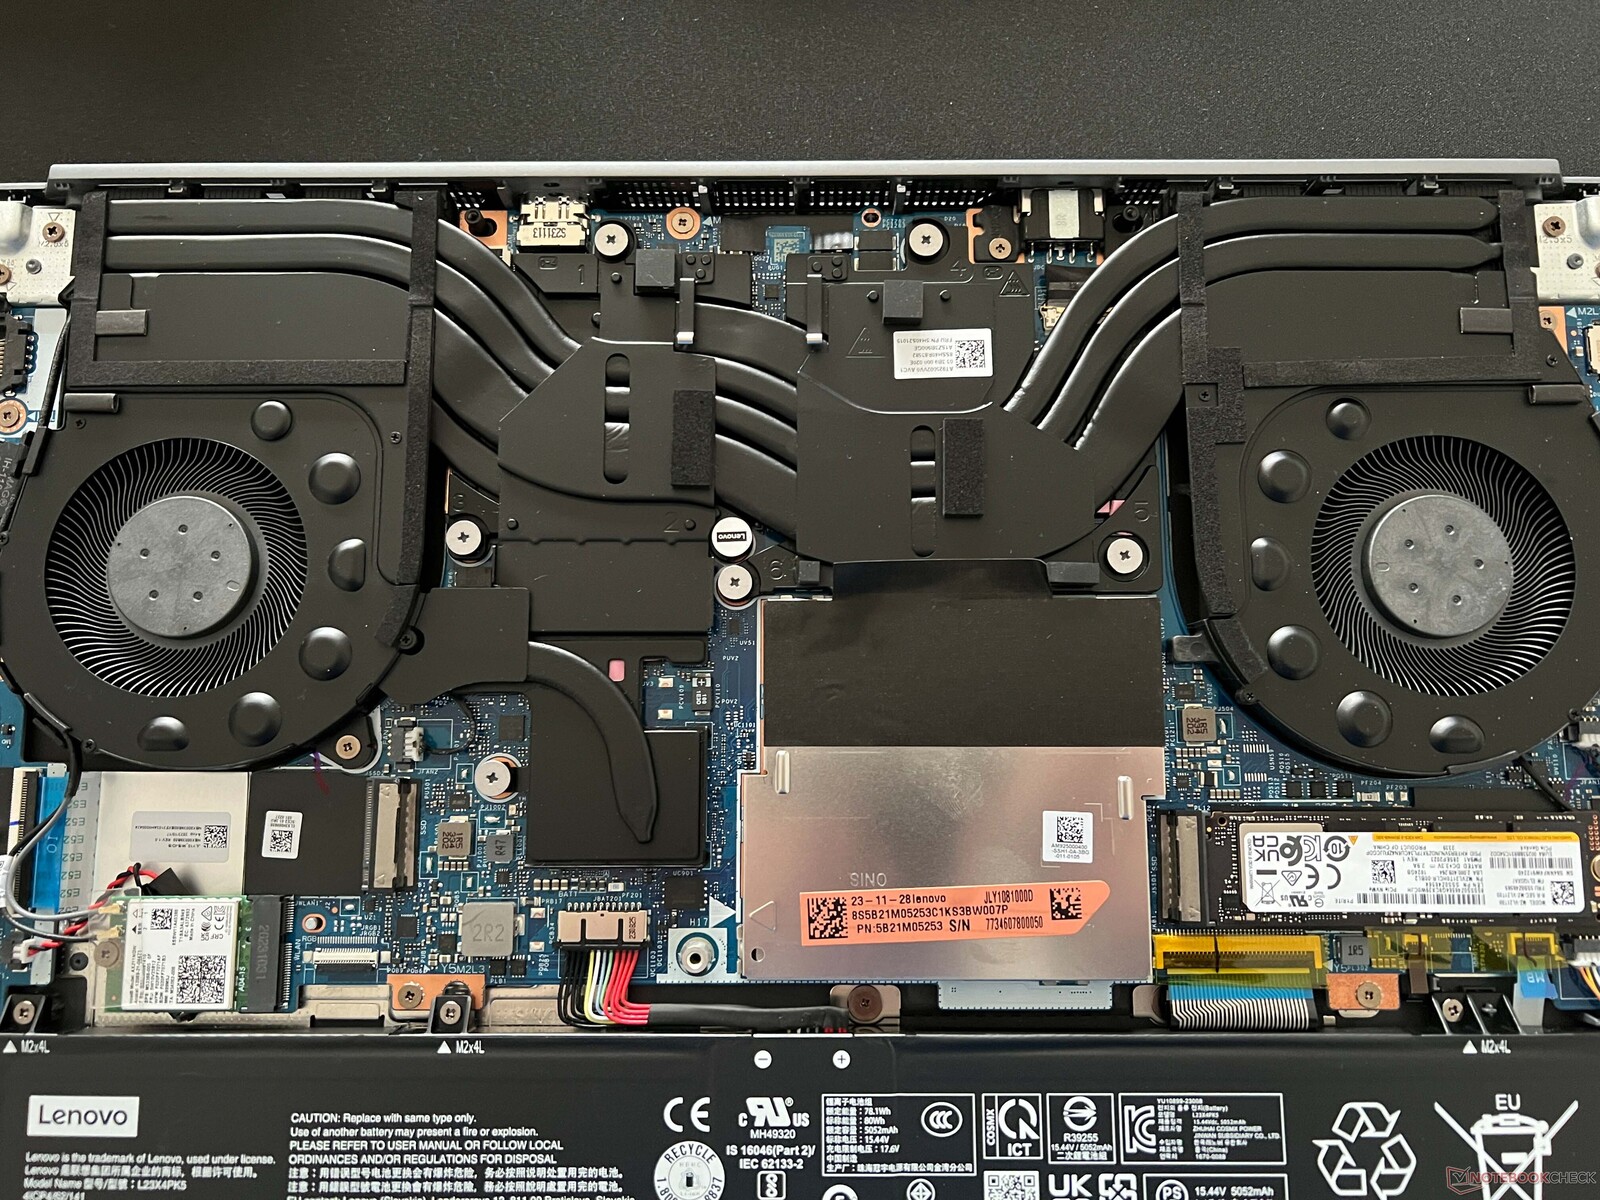
Manutenzione
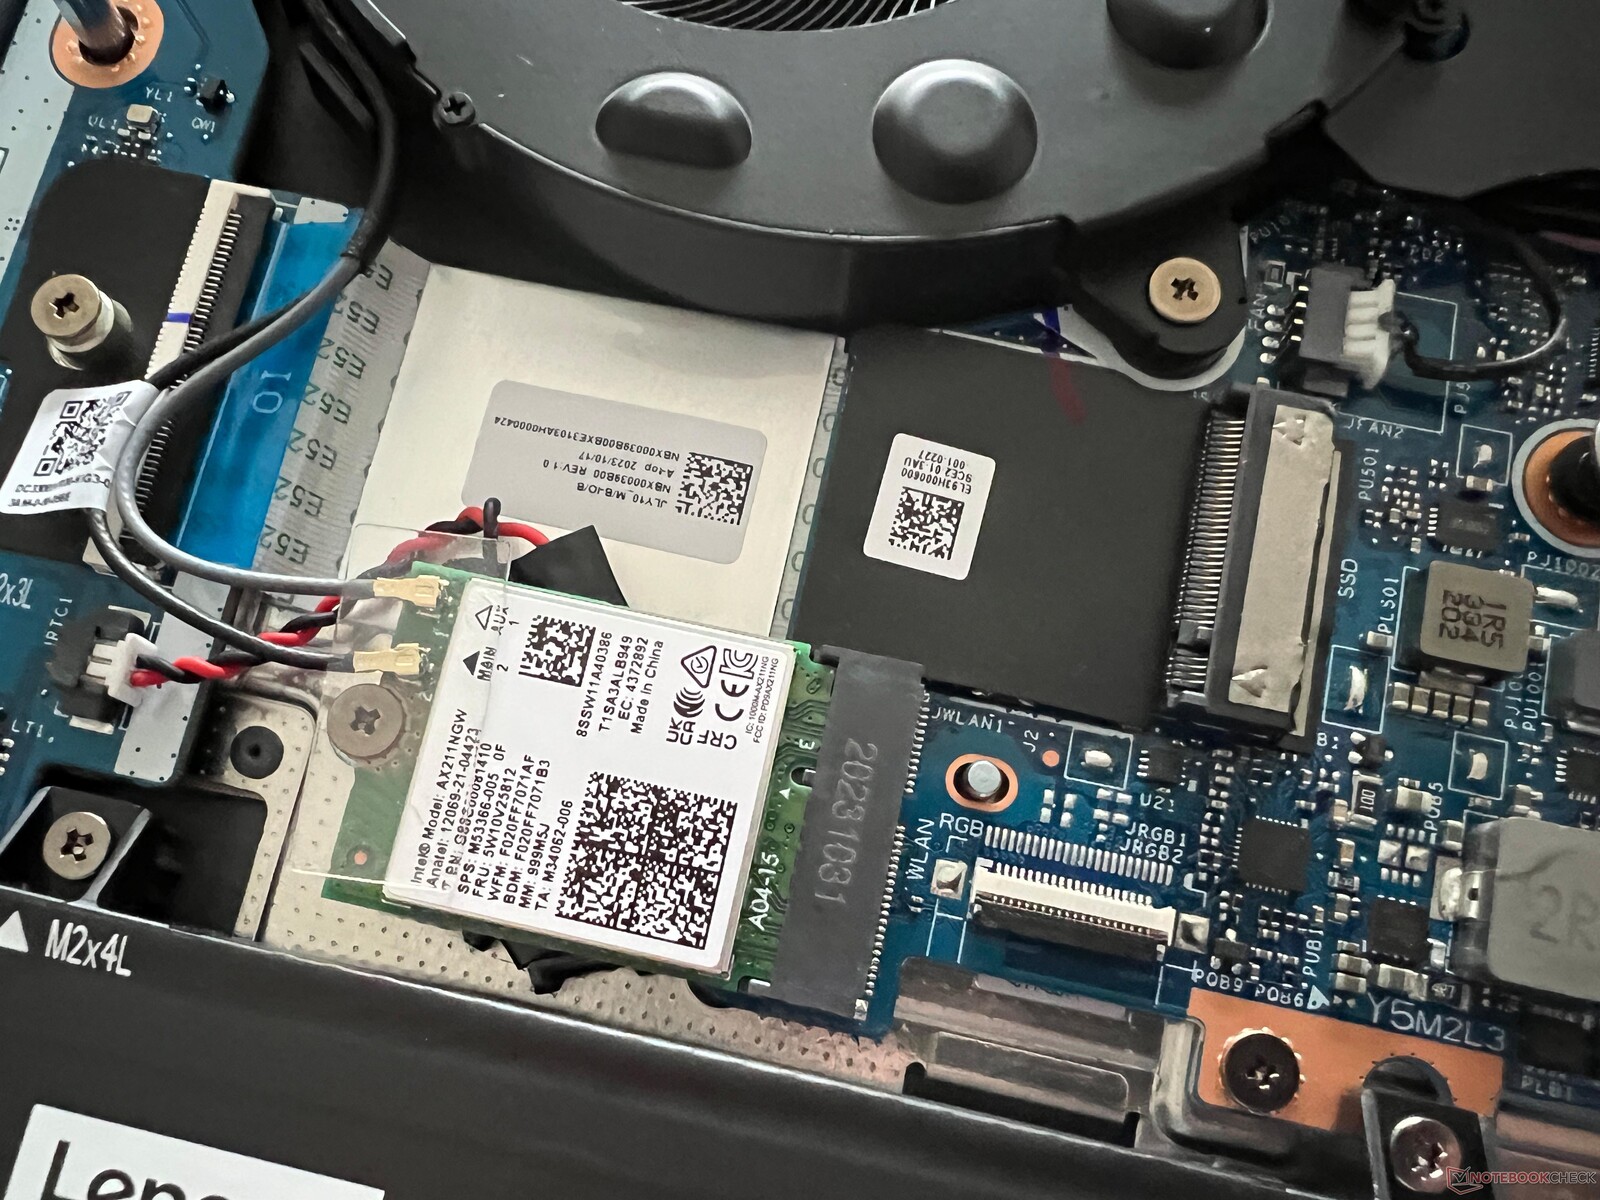
La parte inferiore della cassa è collegata con normali viti a croce, ma rimane saldamente in posizione quando queste vengono rimosse. È necessario utilizzare uno strumento adatto per aiutarla a fare leva. All'interno, le opzioni di manutenzione del portatile sono buone, in quanto oltre a entrambi gli slot per la RAM, dispone anche di due slot per SSD M.2-2280. Anche il modulo WLAN e la batteria (avvitata) possono essere sostituiti.
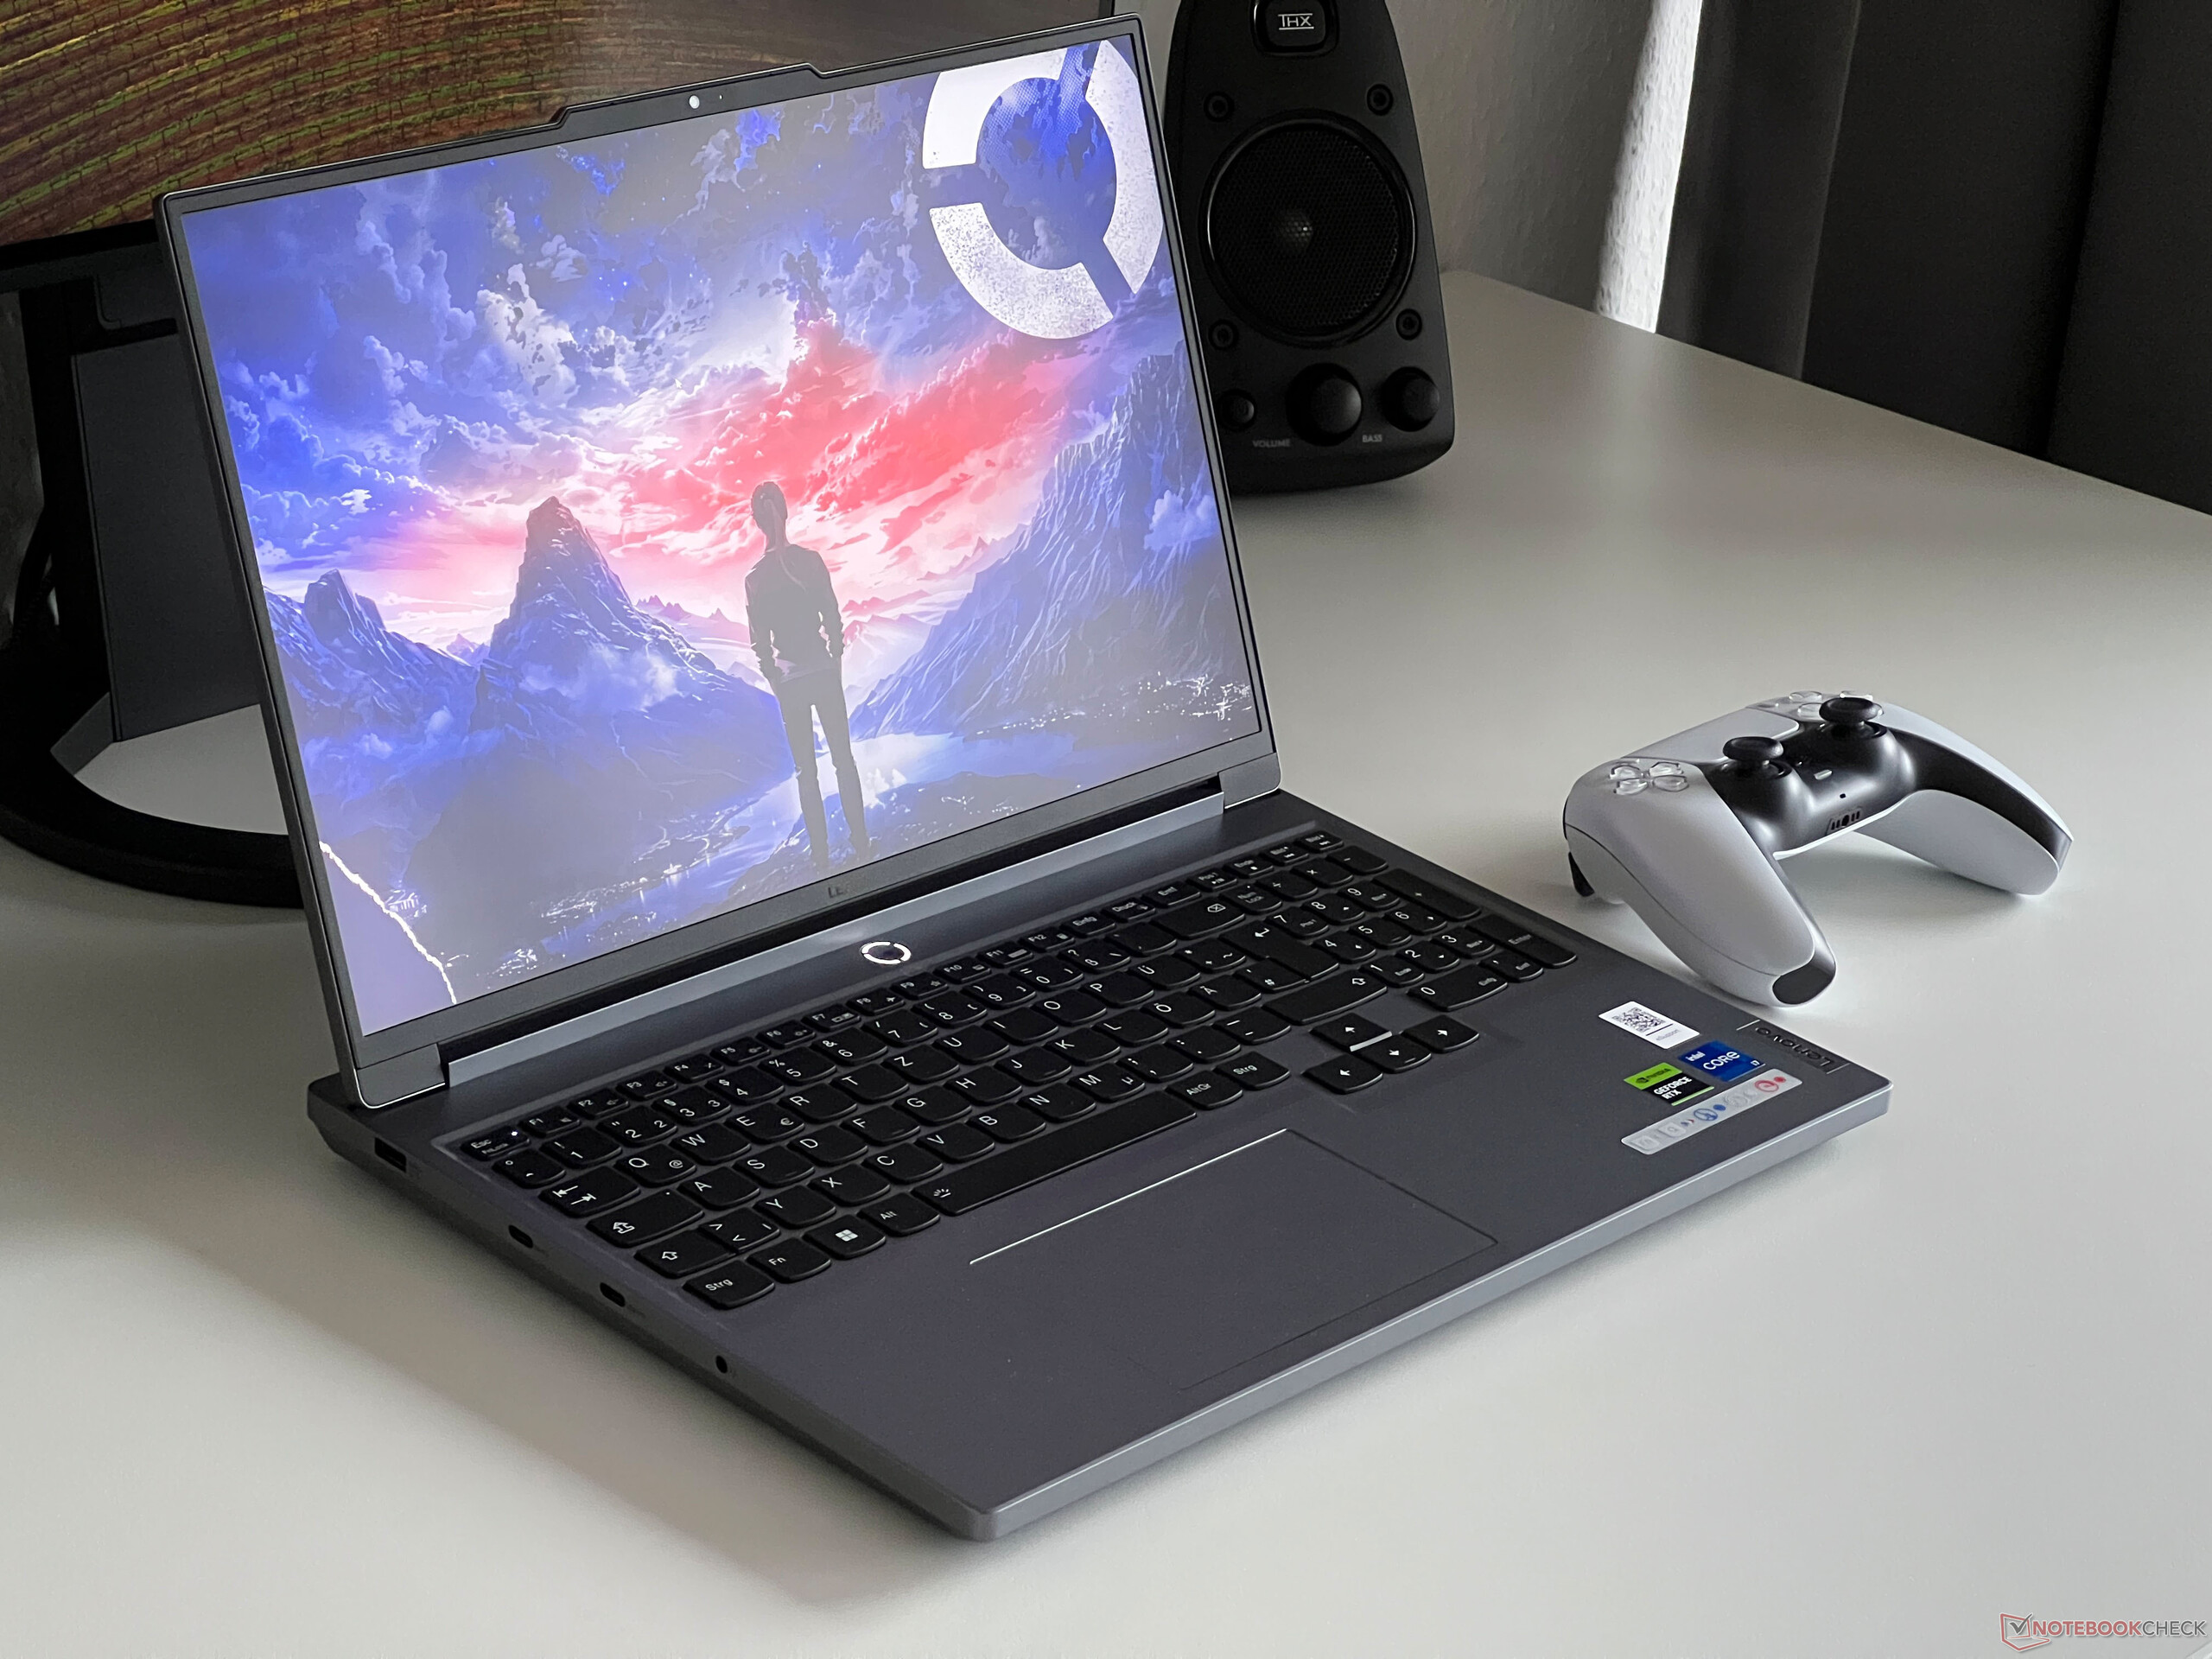
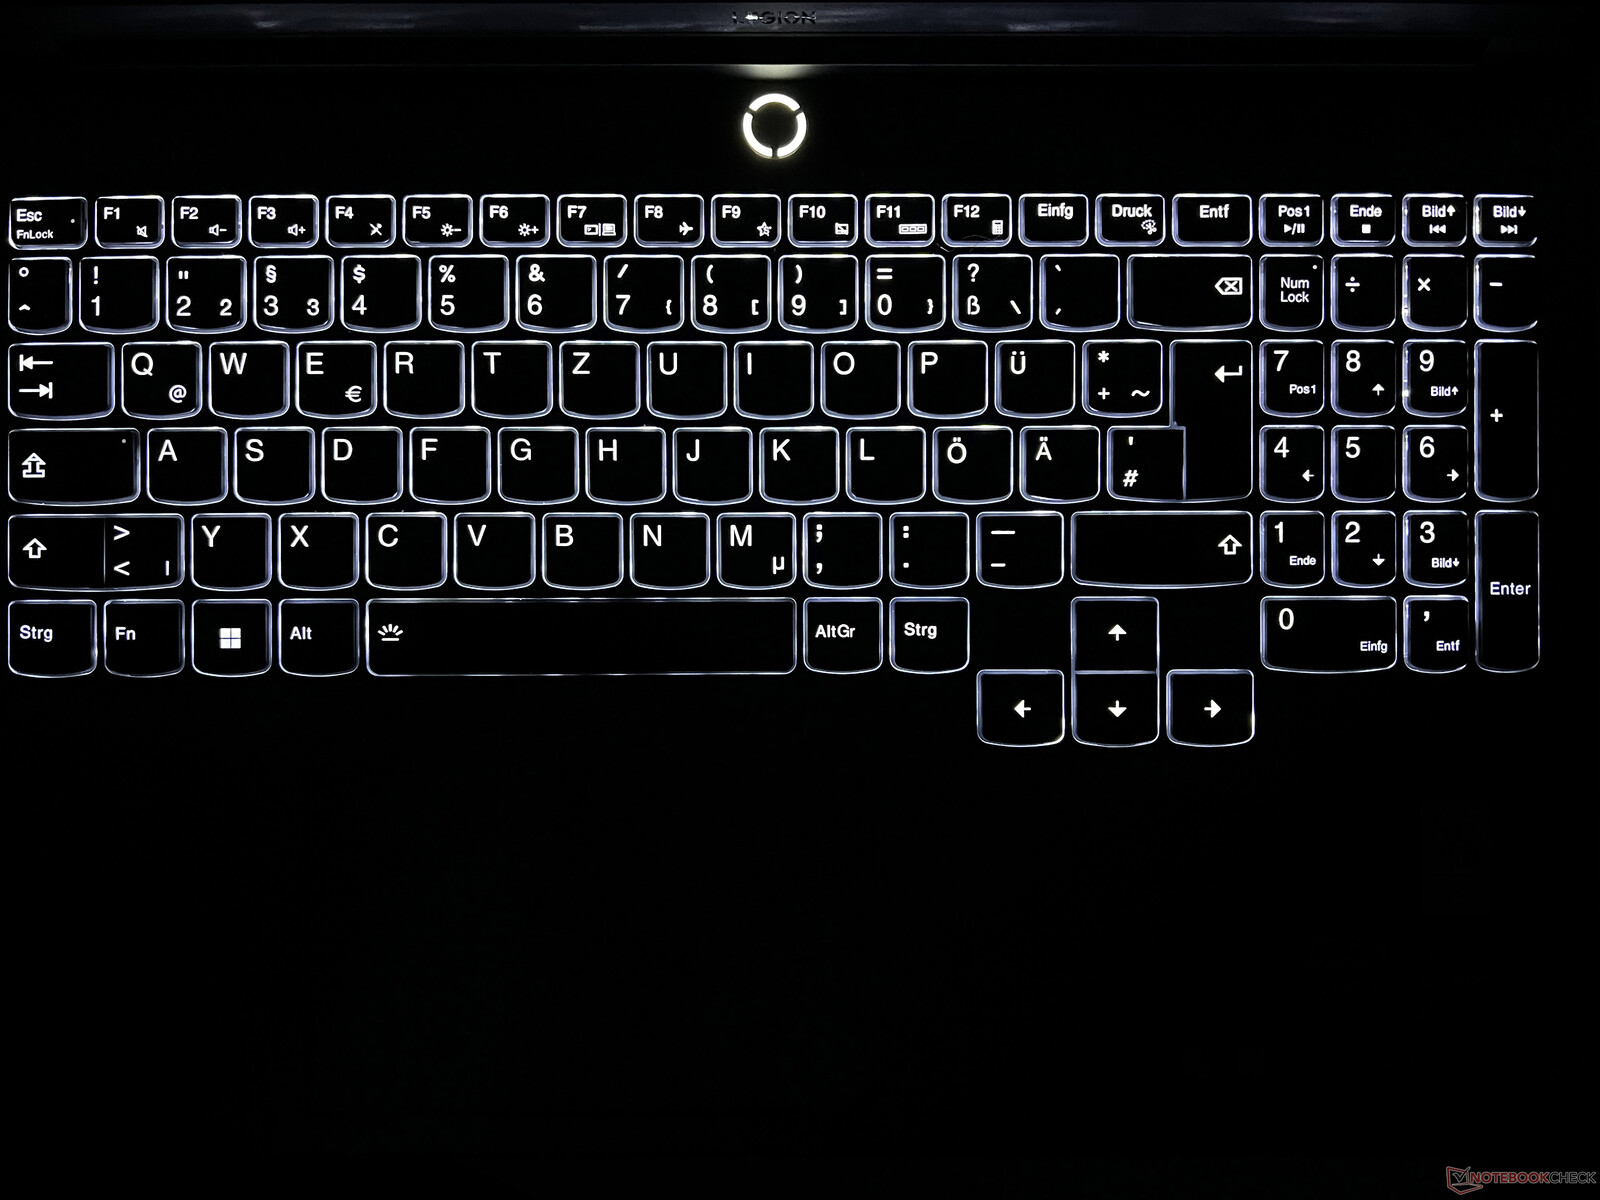
Dispositivi di ingresso - alzata da 1,5 mm senza illuminazione RGB
La tastiera nera - che include un tastierino numerico dedicato e tasti freccia sfalsati - è quella che già conosciamo in altri modelli Legion. I suoi tasti hanno un sollevamento di 1,5 mm e, in totale, la digitazione è confortevole. Oltre al gioco, non è un problema digitare testi lunghi su questa tastiera. La nostra configurazione di prova è dotata di una tastiera retroilluminata con due impostazioni di luminosità; inoltre, può optare per una tastiera con retroilluminazione colorata a 4 zone.
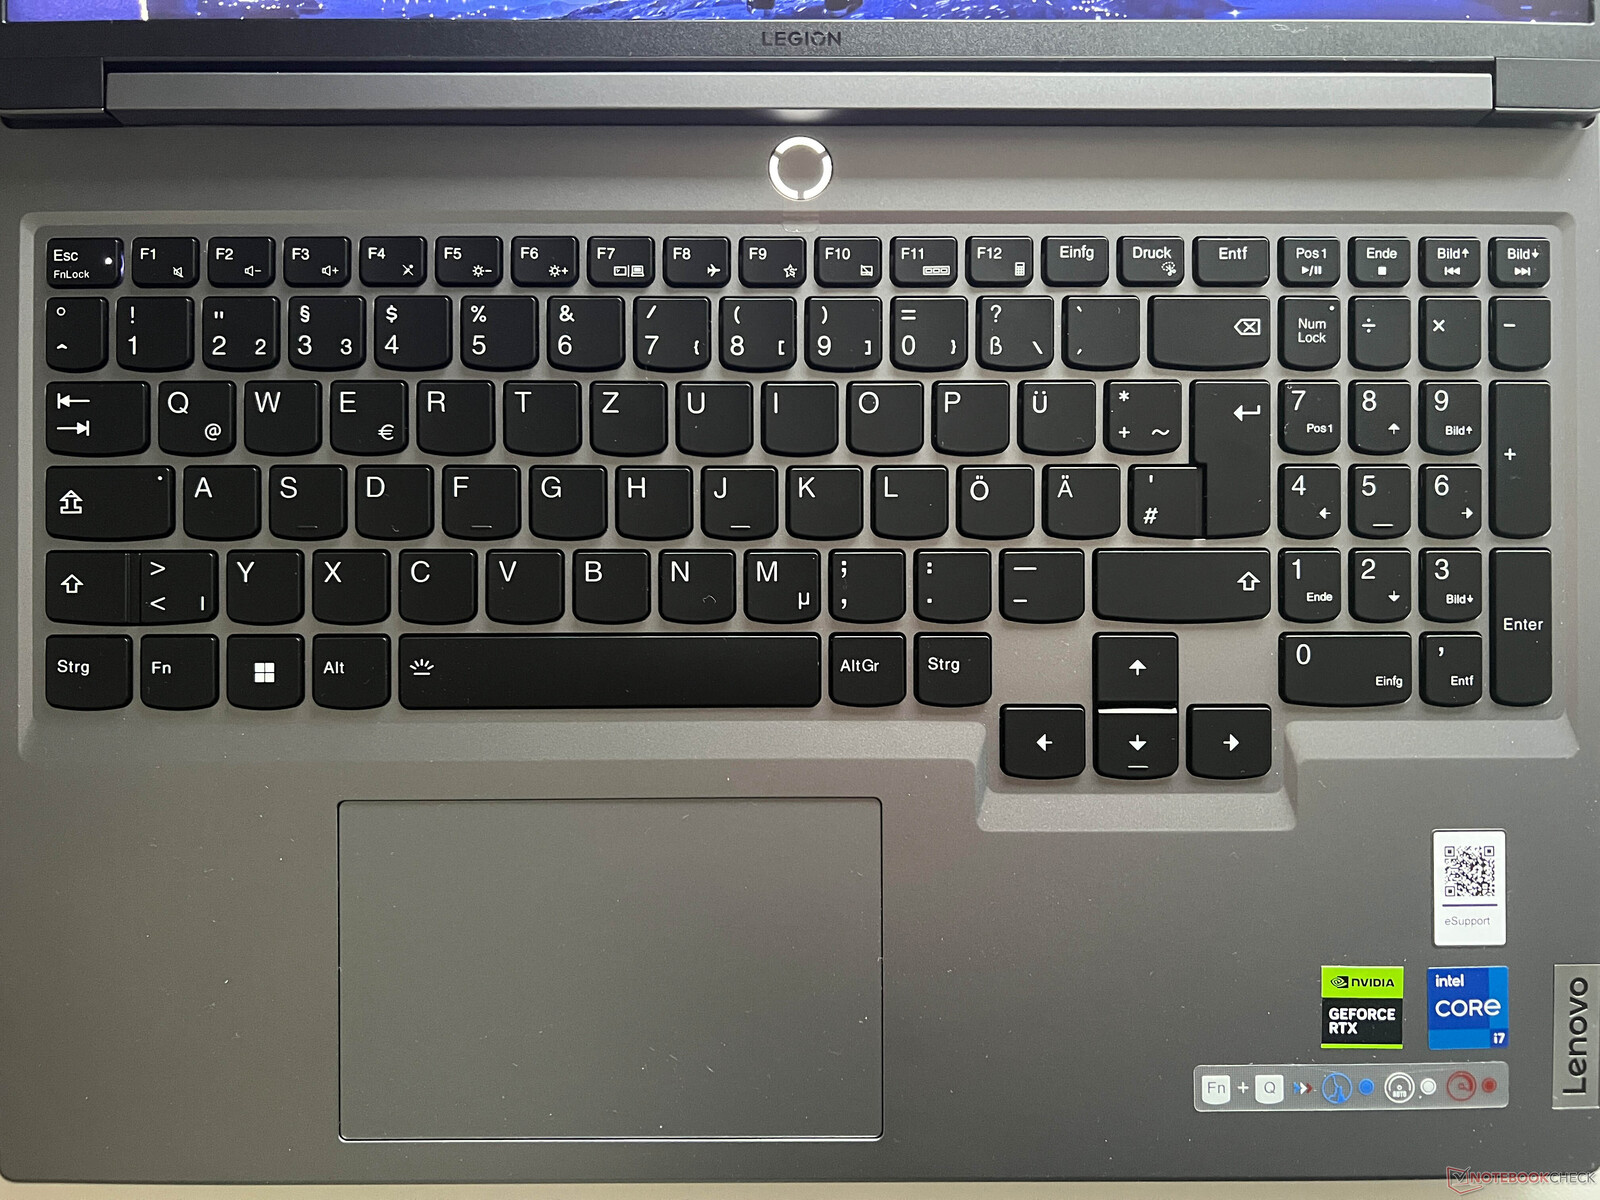
Il clickpad è posizionato leggermente a sinistra e le sue dimensioni (12 x 7,5 cm) sono perfette per il normale funzionamento del puntatore, che funziona assolutamente bene. La parte inferiore del pad può essere premuta, il che, purtroppo, si traduce in un forte rumore. Durante il gioco, la maggior parte degli utenti prenderà comunque un gamepad o un mouse. Questi possono essere collegati su entrambi i lati del dispositivo.
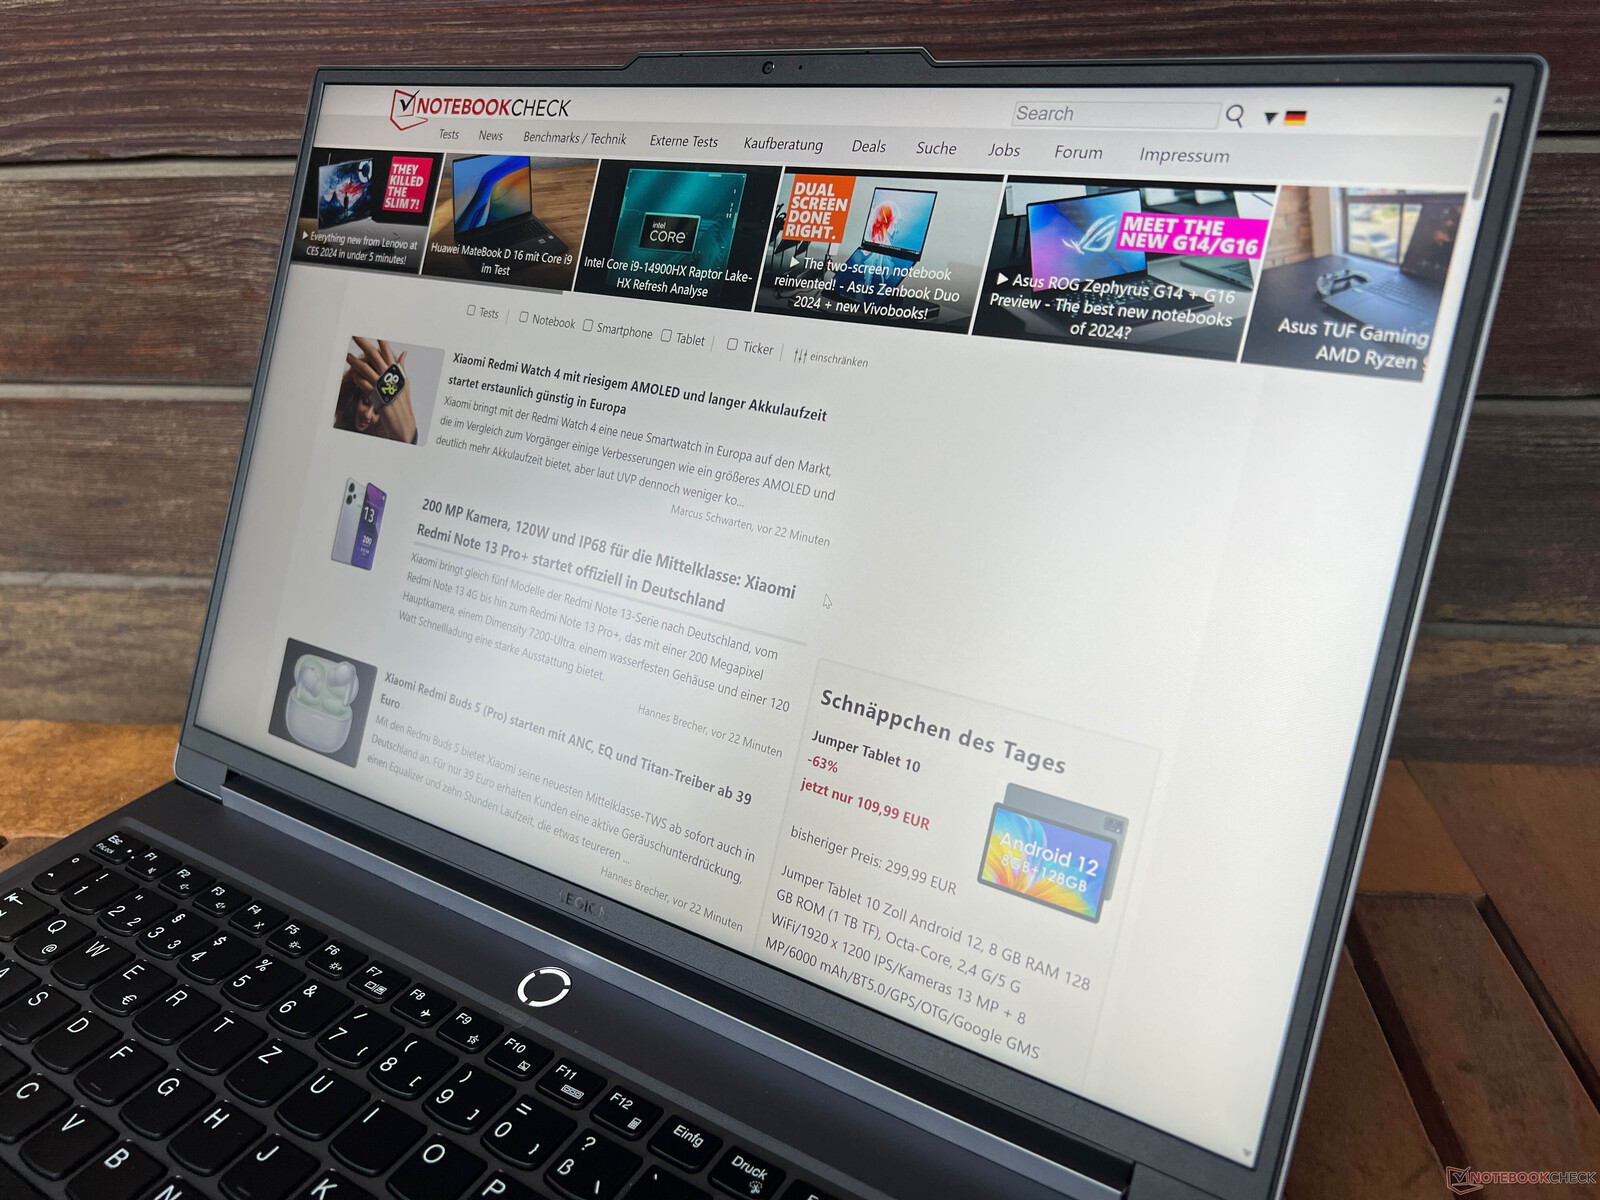
Display - 240-Hz IPS

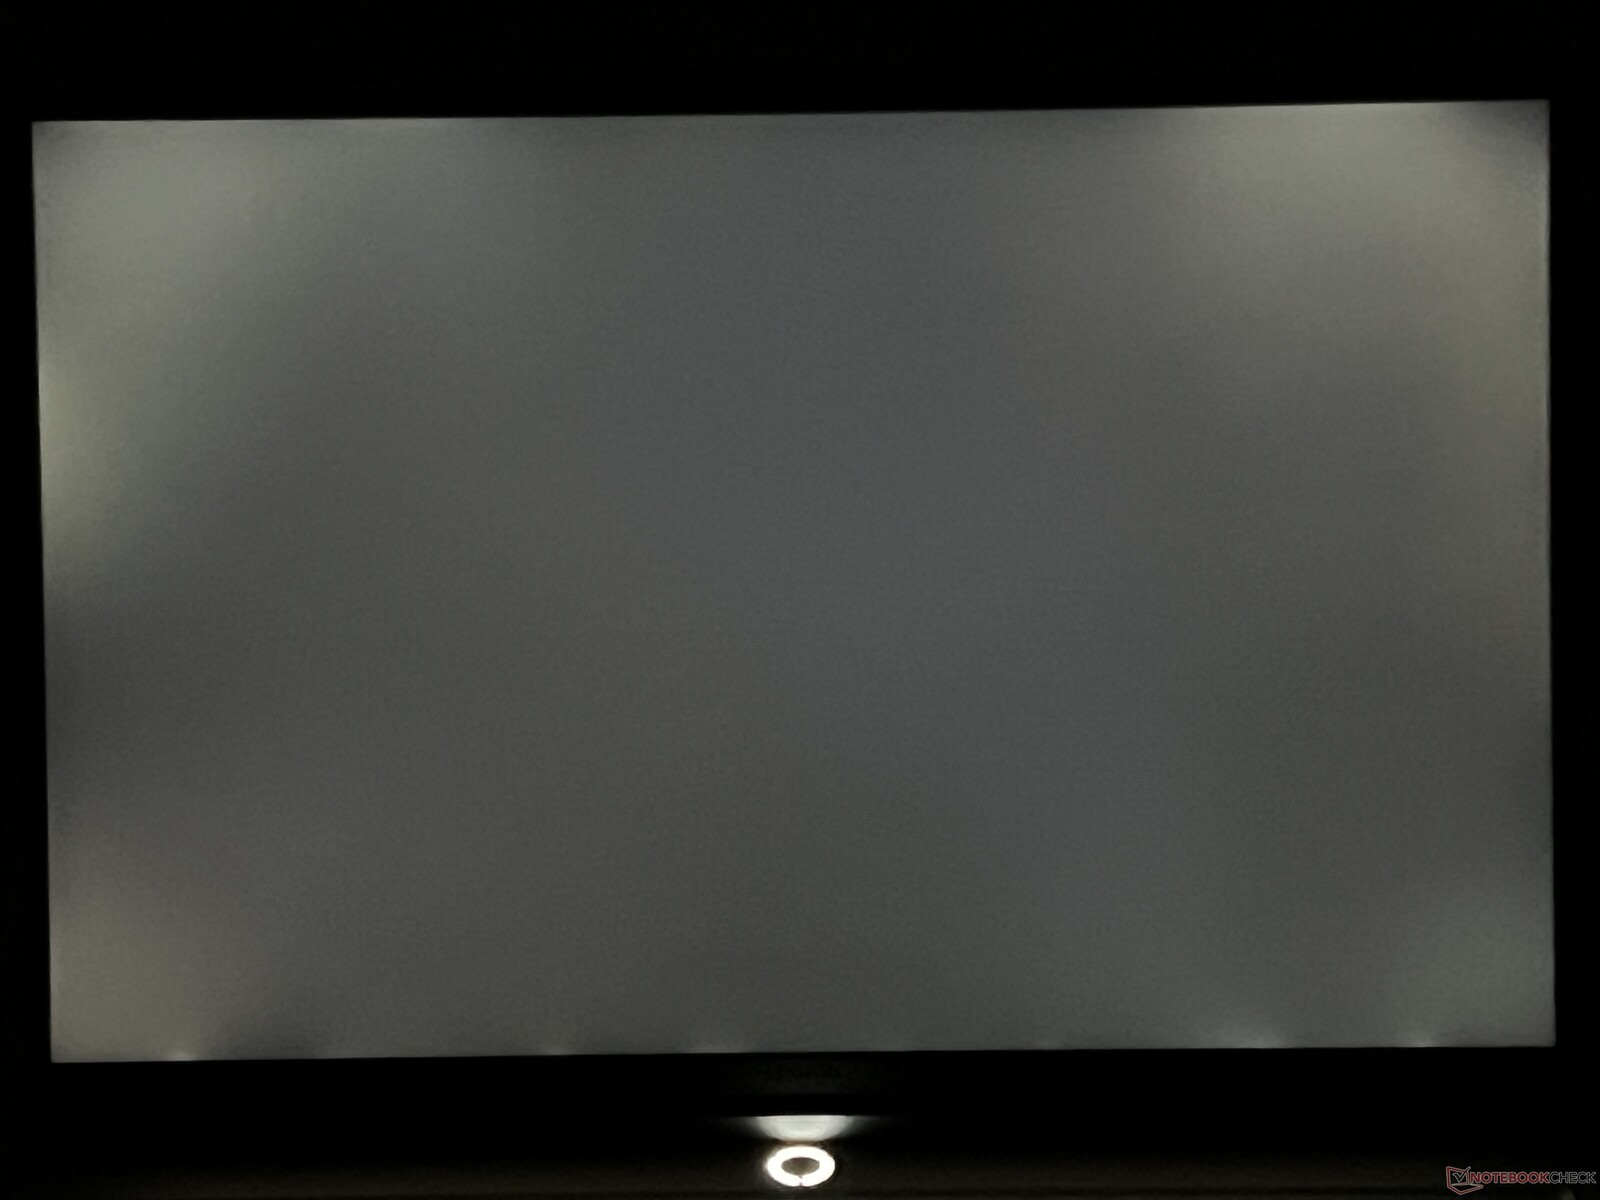
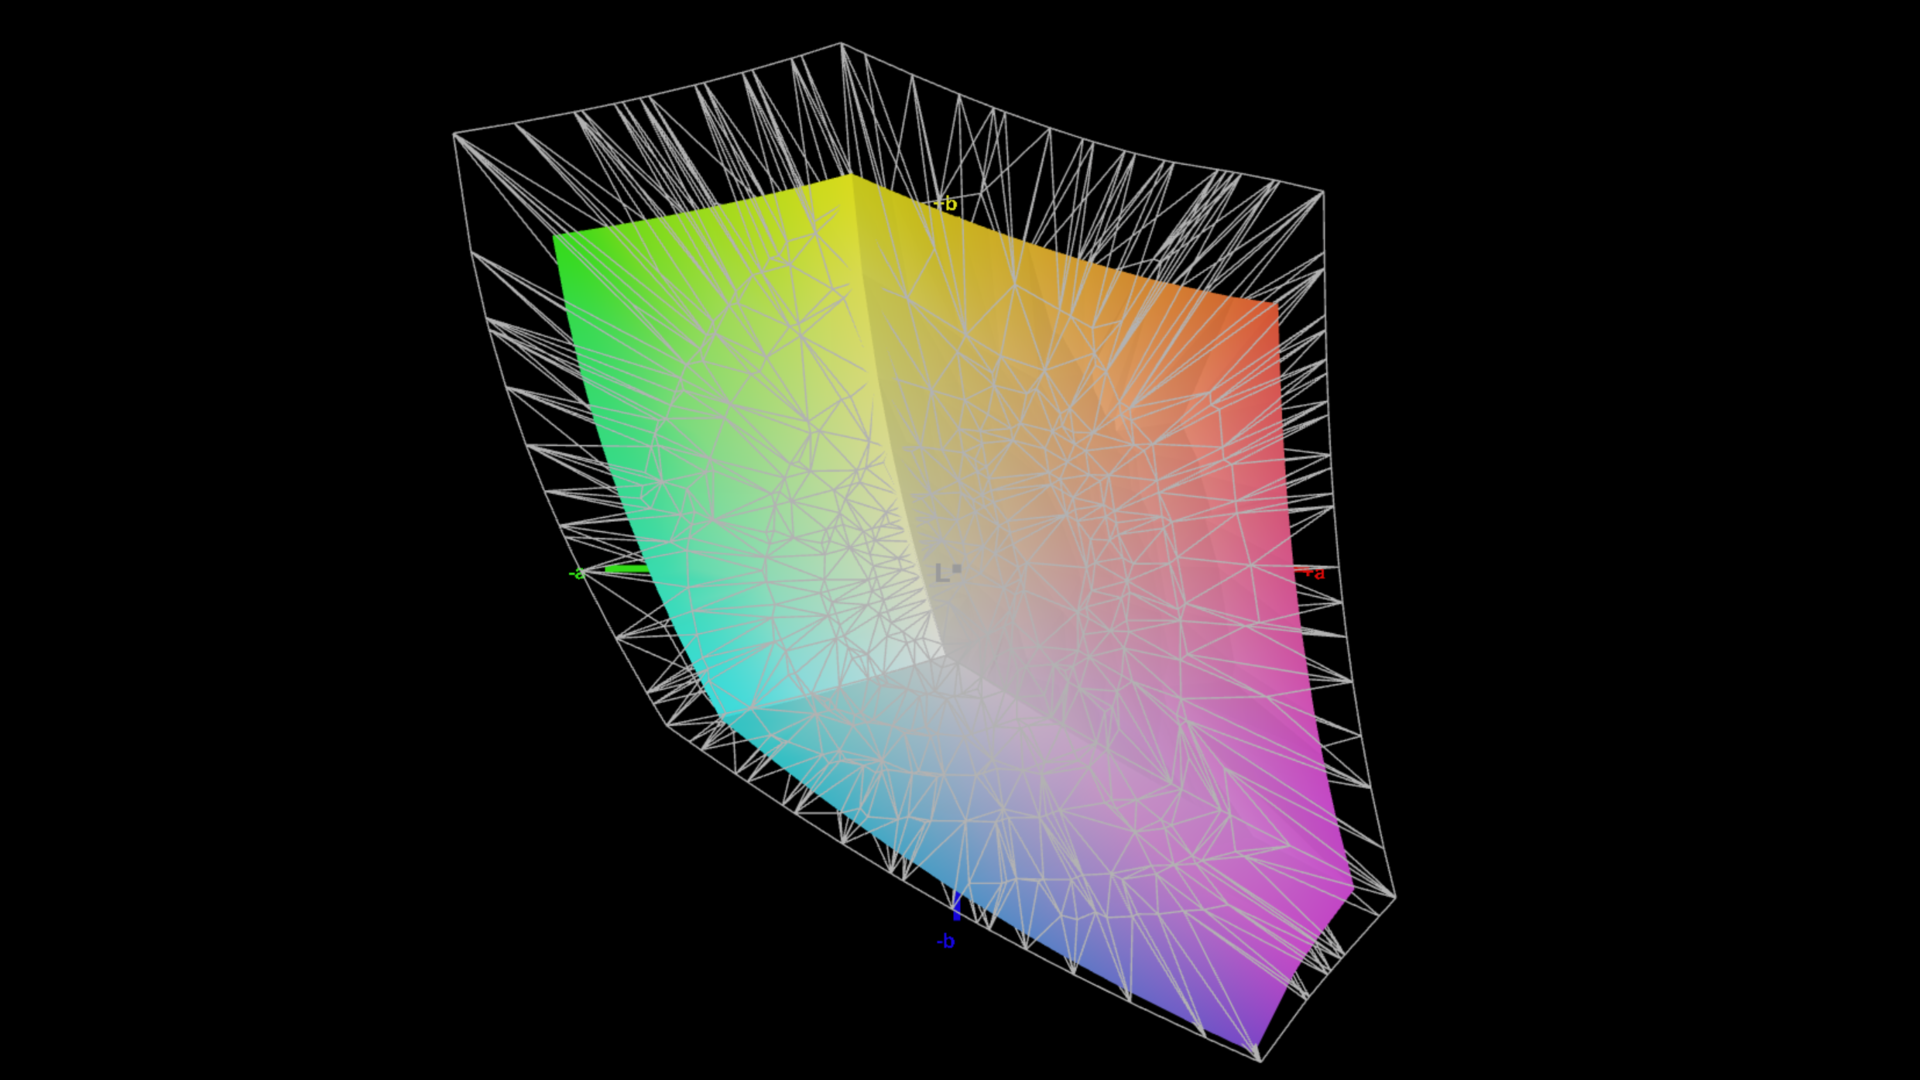
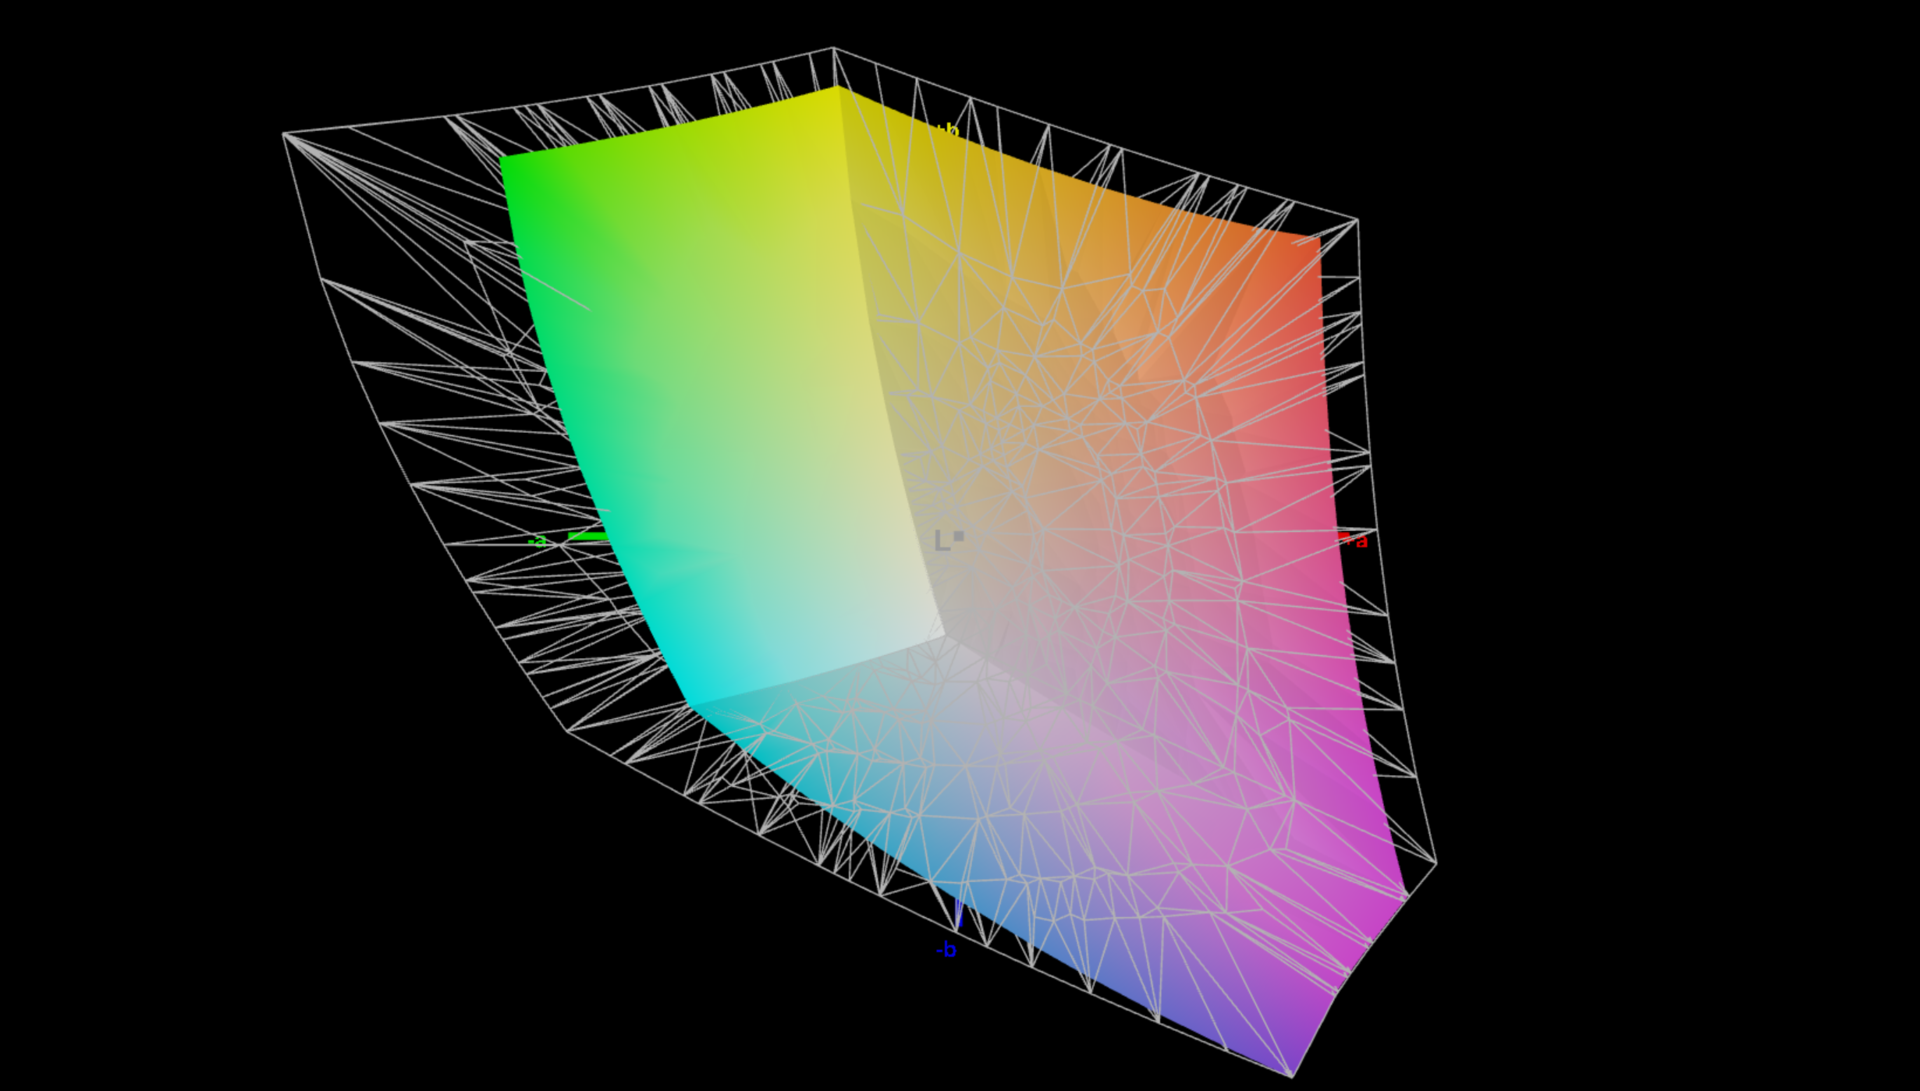
Lenovo offre due diversi display WQXGA opachi con una risoluzione di 2.560 x 1.600 pixel. Oltre alla versione con una frequenza di aggiornamento di 165 Hz e una luminosità di 300 nit, è possibile selezionare anche una variante più luminosa da 500 nit con una frequenza di aggiornamento di 240 Hz. Quest'ultima supporta anche l'HDR ed è quella installata nel nostro dispositivo di prova. Soggettivamente, lo schermo è ottimo; i contenuti appaiono molto nitidi, i colori sono vividi e anche le aree più chiare non appaiono sgranate. Tuttavia, si possono notare alcuni chiari aloni quando si guardano immagini scure con la luminosità alzata.
Il nostro pannello ha raggiunto un massimo di 528 cd/m² e una media di 500 cd/m², il che significa che il suo obiettivo è stato raggiunto. Il suo valore del nero di 0,33 è buono e il suo rapporto di contrasto massimo è superiore a 1.500:1. La velocità di reazione del display è veloce e allo stesso livello di altri concorrenti IPS. Nel complesso, lo schermo è adatto ai giochi e i suoi valori sono migliori rispetto alla concorrenza. Sono supportati anche i contenuti HDR (ma l'HDR deve essere attivato manualmente tramite le impostazioni di Windows).
| |||||||||||||||||||||||||
Distribuzione della luminosità: 87 %
Al centro con la batteria: 519 cd/m²
Contrasto: 1594:1 (Nero: 0.33 cd/m²)
ΔE ColorChecker Calman: 1.2 | ∀{0.5-29.43 Ø4.71}
calibrated: 1
ΔE Greyscale Calman: 1.3 | ∀{0.09-98 Ø4.96}
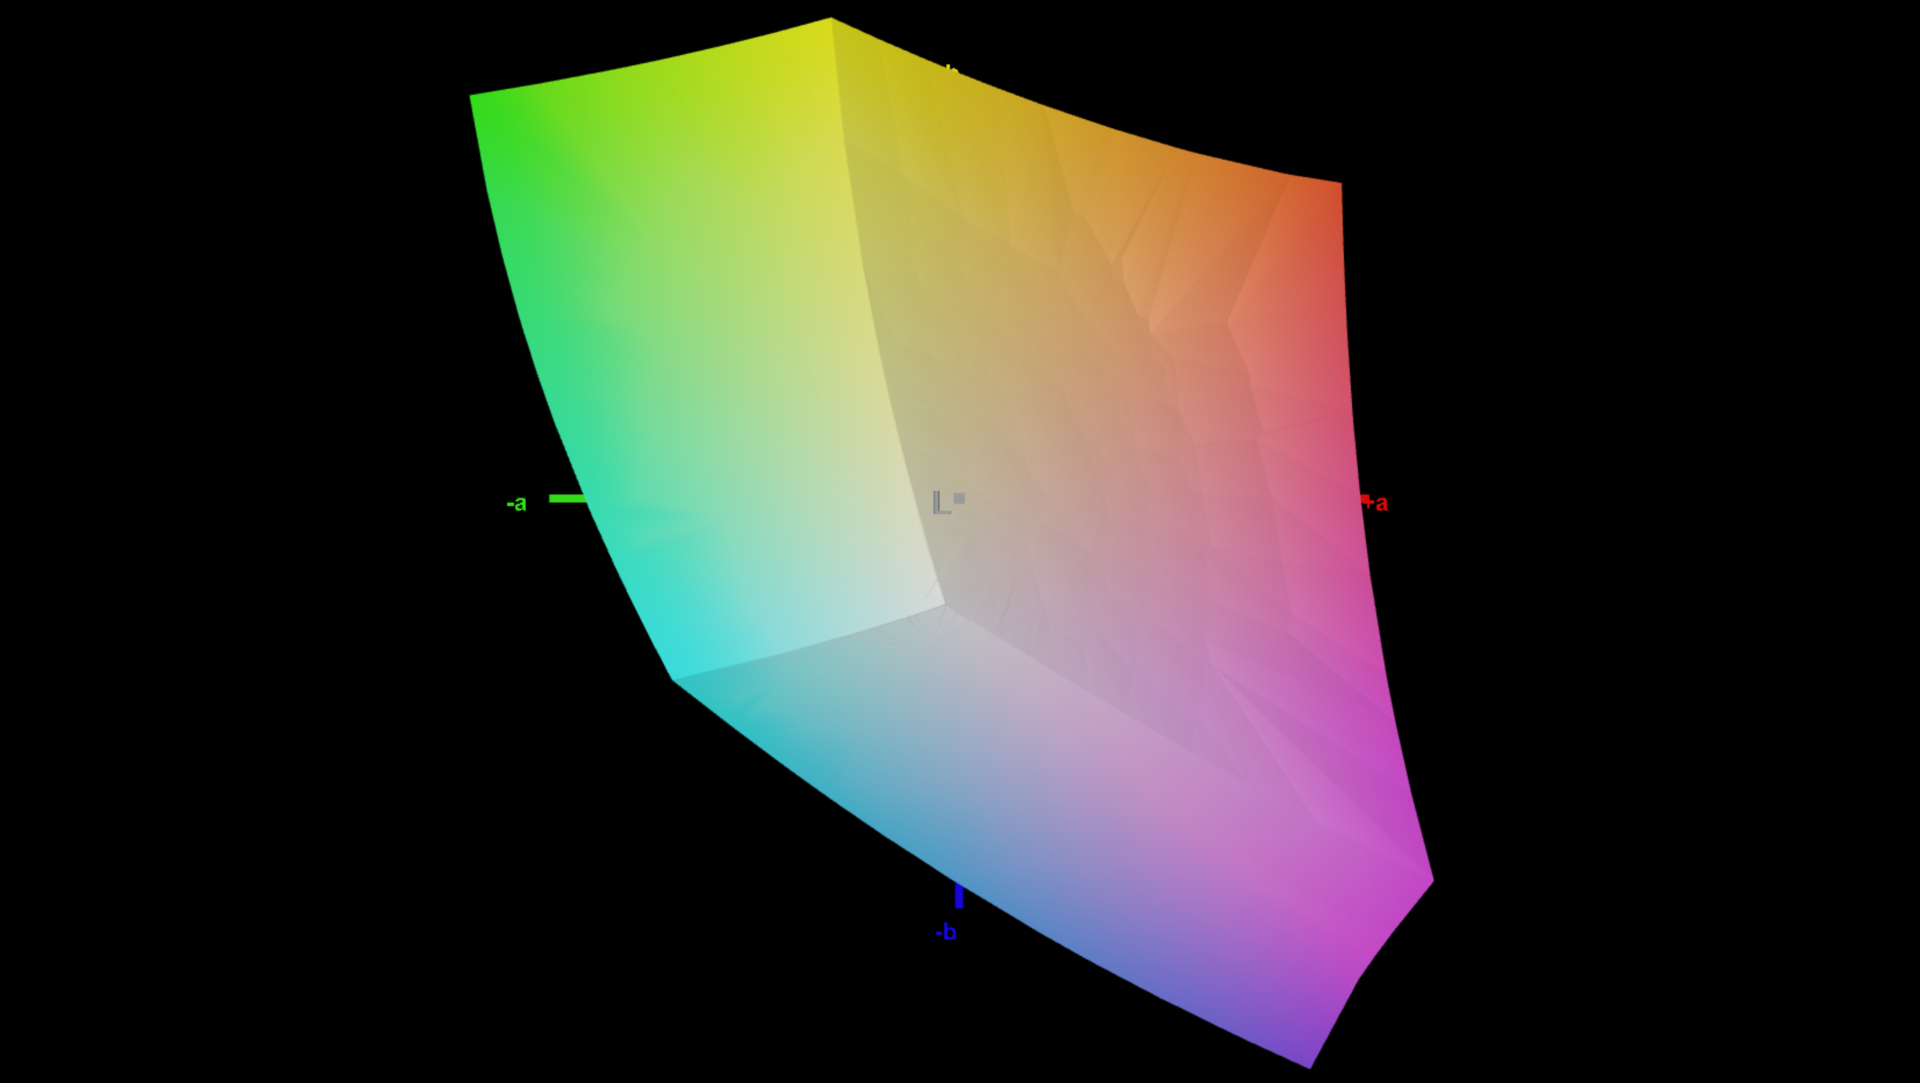
74.1% AdobeRGB 1998 (Argyll 3D)
100% sRGB (Argyll 3D)
72.4% Display P3 (Argyll 3D)
Gamma: 2.23
CCT: 6391 K
| Lenovo Legion 5 16IRX G9 NE160QDM-NZ3, IPS, 2560x1600, 16" | Schenker XMG CORE 16 (L23) BOE0AF0 (), IPS, 2560x1600, 16" | HP Victus 16-r0077ng CMN162D, IPS, 1920x1080, 16.1" | Lenovo LOQ 16IRH8 AUOC1A5 (B160QAN03.L), IPS, 2560x1600, 16" | Lenovo Legion Slim 5 16APH8 BOE NJ NE160QDM-NYC, IPS, 2560x1600, 16" | HP Victus 16-r0076TX Chi Mei CMN1629, IPS, 1920x1080, 16.1" | Alienware m16 R1 Intel BOE NE16NYB, IPS, 2560x1600, 16" | Lenovo Legion Pro 5 16IRX8 AU Optronics B160QAN03.1, IPS, 2560x1600, 16" | |
|---|---|---|---|---|---|---|---|---|
| Display | -4% | -6% | -2% | -3% | -5% | -5% | -1% | |
| Display P3 Coverage (%) | 72.4 | 68.3 -6% | 66.7 -8% | 70.5 -3% | 69.3 -4% | 67.5 -7% | 67.7 -6% | 71.2 -2% |
| sRGB Coverage (%) | 100 | 98.6 -1% | 98 -2% | 98.9 -1% | 100 0% | 97.5 -2% | 97.2 -3% | 98.8 -1% |
| AdobeRGB 1998 Coverage (%) | 74.1 | 69.6 -6% | 69 -7% | 72.6 -2% | 70 -6% | 69.7 -6% | 70 -6% | 73.3 -1% |
| Response Times | 9% | 0% | 29% | 12% | 32% | 42% | -18% | |
| Response Time Grey 50% / Grey 80% * (ms) | 12.5 ? | 13.2 ? -6% | 13.3 ? -6% | 7.2 ? 42% | 10.7 ? 14% | 6.18 ? 51% | 4 ? 68% | 14.5 ? -16% |
| Response Time Black / White * (ms) | 8.7 ? | 6.6 ? 24% | 8.2 ? 6% | 7.4 ? 15% | 7.8 ? 10% | 7.62 ? 12% | 7.3 ? 16% | 10.4 ? -20% |
| PWM Frequency (Hz) | ||||||||
| Screen | -67% | -16% | -24% | -14% | -21% | -51% | -20% | |
| Brightness middle (cd/m²) | 526 | 376 -29% | 308 -41% | 407 -23% | 371.6 -29% | 290 -45% | 306 -42% | 405.7 -23% |
| Brightness (cd/m²) | 500 | 358 -28% | 285 -43% | 369 -26% | 343 -31% | 275 -45% | 302 -40% | 368 -26% |
| Brightness Distribution (%) | 87 | 88 1% | 85 -2% | 85 -2% | 84 -3% | 82 -6% | 89 2% | 87 0% |
| Black Level * (cd/m²) | 0.33 | 0.33 -0% | 0.25 24% | 0.45 -36% | 0.44 -33% | 0.21 36% | 0.3 9% | 0.38 -15% |
| Contrast (:1) | 1594 | 1139 -29% | 1232 -23% | 904 -43% | 845 -47% | 1381 -13% | 1020 -36% | 1068 -33% |
| Colorchecker dE 2000 * | 1.2 | 2.74 -128% | 1.3 -8% | 1.43 -19% | 1.52 -27% | 1.7 -42% | 2.57 -114% | 1.65 -38% |
| Colorchecker dE 2000 max. * | 2.1 | 6.78 -223% | 2.76 -31% | 3.58 -70% | 2.68 -28% | 3.57 -70% | 4.26 -103% | 4.2 -100% |
| Colorchecker dE 2000 calibrated * | 1 | 0.88 12% | 0.92 8% | 1.07 -7% | 0.33 67% | 0.93 7% | 0.85 15% | 0.53 47% |
| Greyscale dE 2000 * | 1.3 | 3.57 -175% | 1.7 -31% | 1.13 13% | 1.2 8% | 1.5 -15% | 3.3 -154% | 1.2 8% |
| Gamma | 2.23 99% | 2.4 92% | 2.167 102% | 2.5 88% | 2.1 105% | 2.1 105% | 1.997 110% | 2.3 96% |
| CCT | 6391 102% | 7246 90% | 6767 96% | 6526 100% | 6503 100% | 6538 99% | 6895 94% | 6453 101% |
| Media totale (Programma / Settaggio) | -21% /
-42% | -7% /
-12% | 1% /
-12% | -2% /
-8% | 2% /
-10% | -5% /
-28% | -13% /
-16% |
* ... Meglio usare valori piccoli
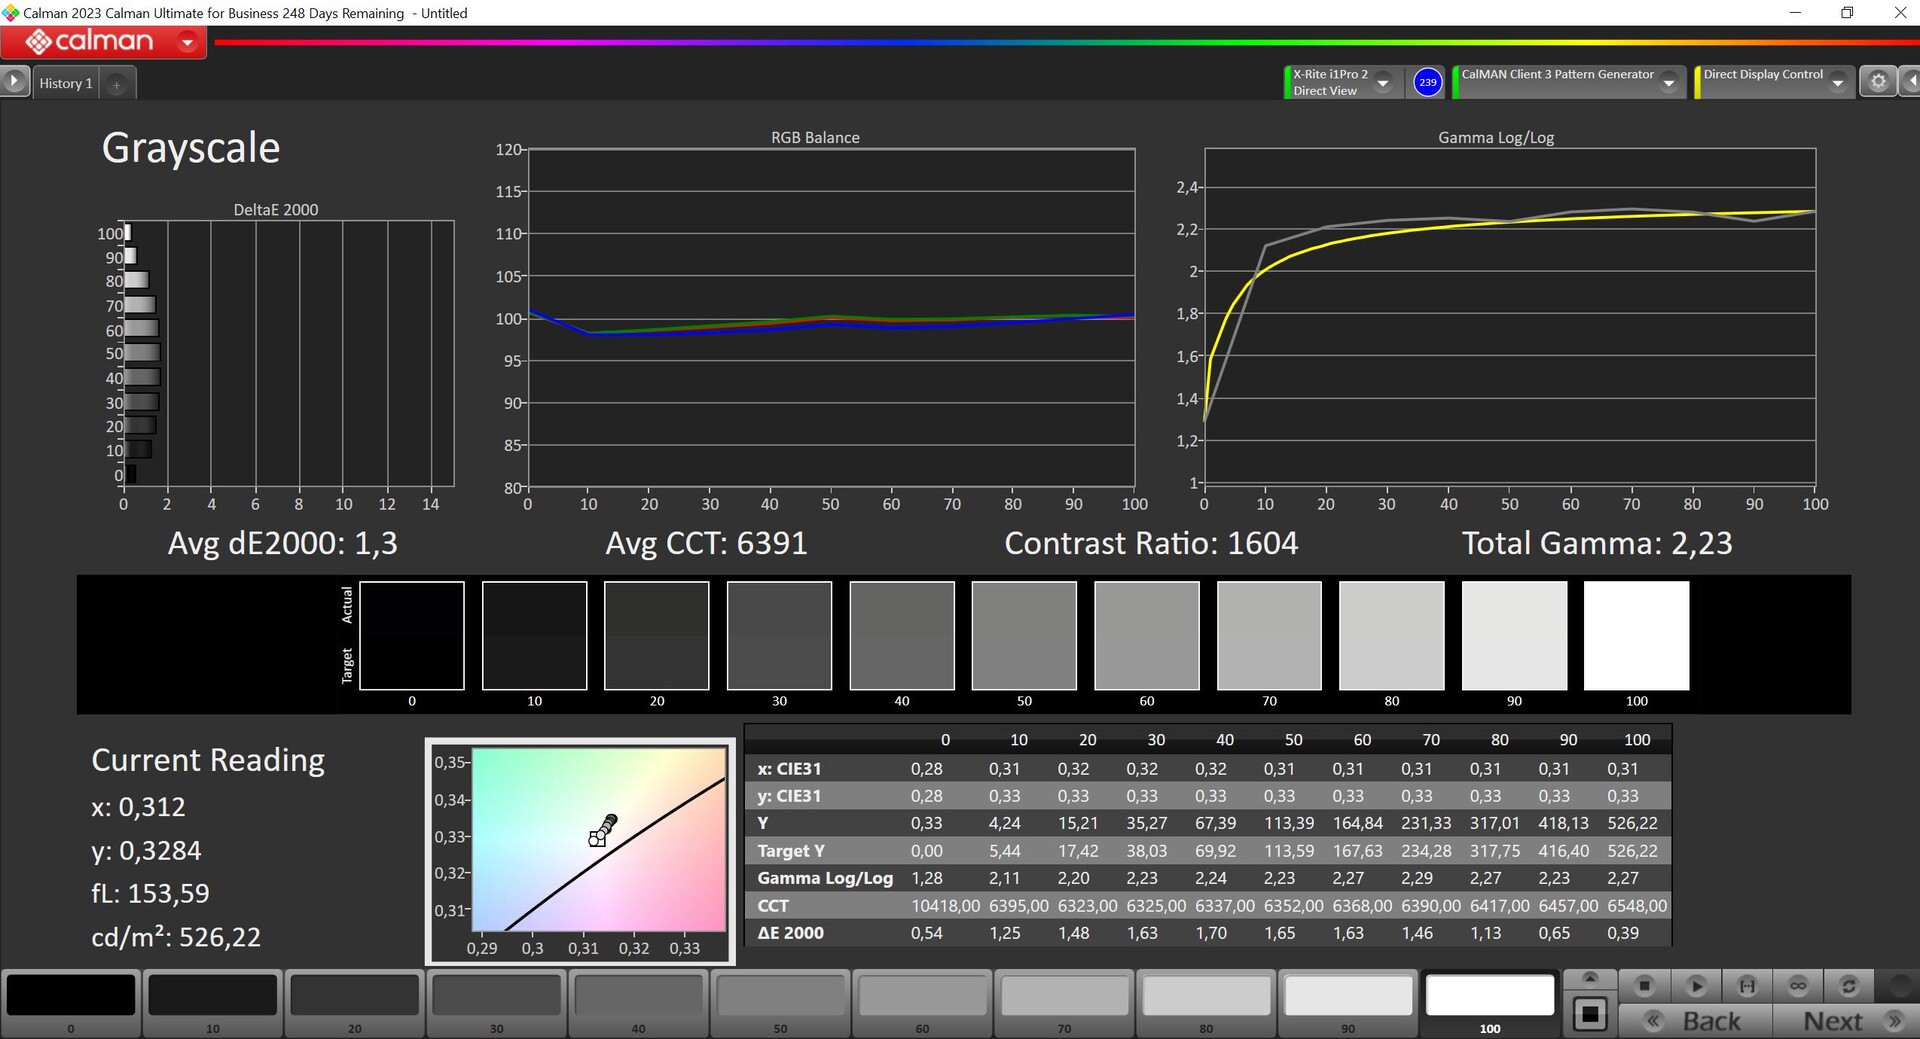
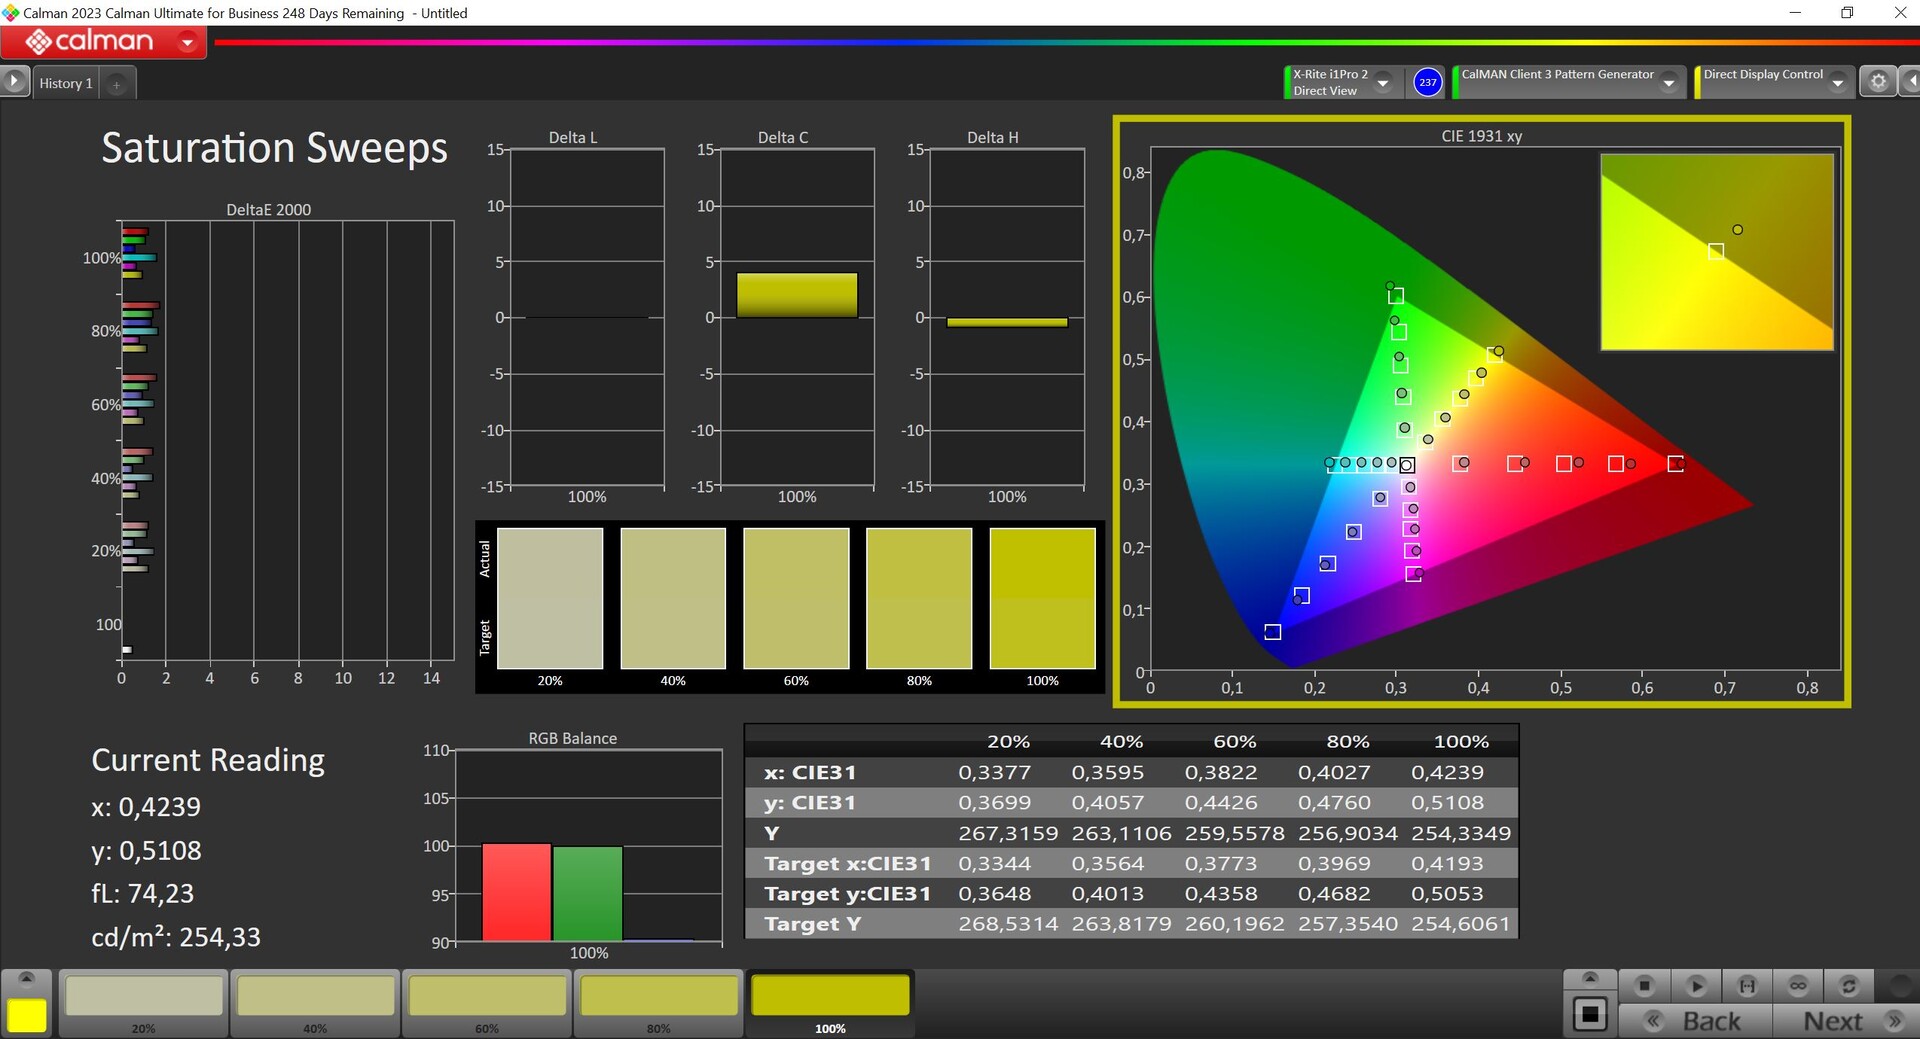
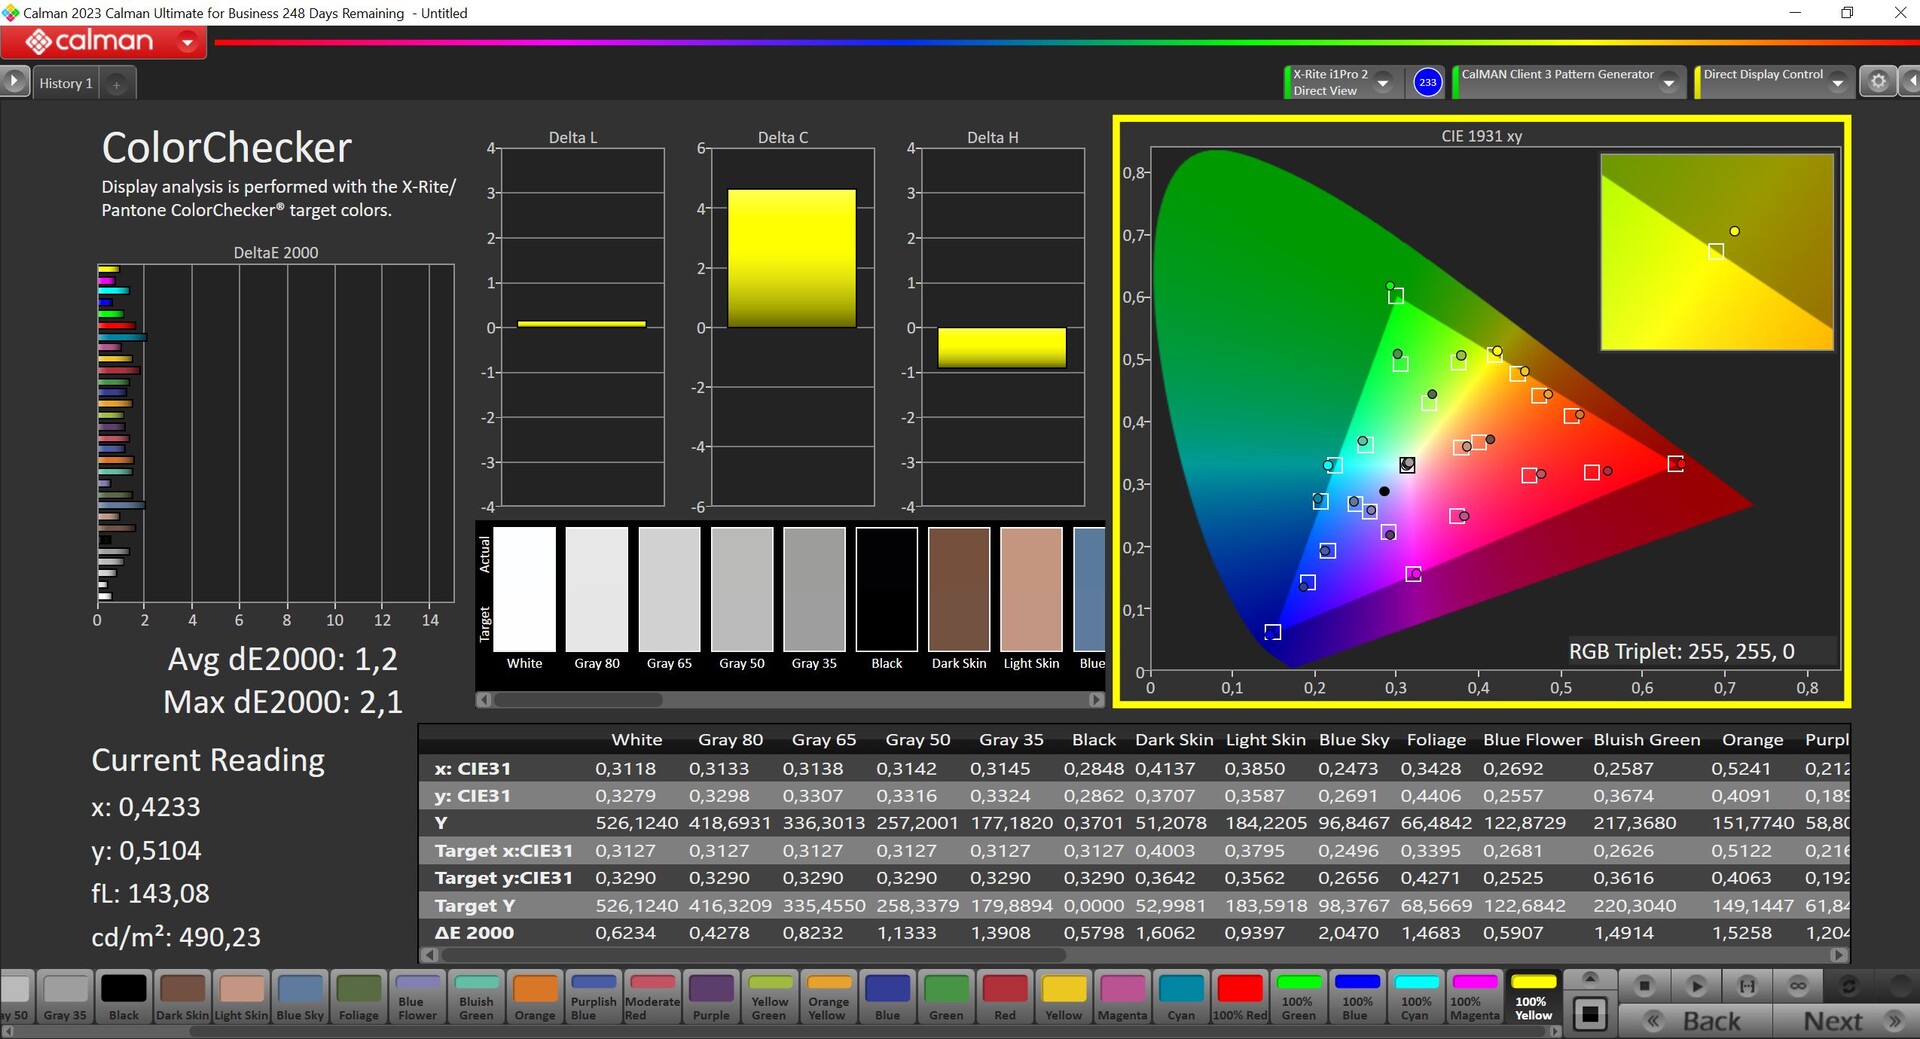


Ex funziona, il display di Legion 5i viene fornito pre-calibrato e sono disponibili alcuni profili di colore diversi. Lo abbiamo analizzato con il software professionale CalMAN (X-Rite i1 Pro2) utilizzando il profilo "nativo". La sua rappresentazione è già superba, in quanto né la scala di grigi né i colori mostrano deviazioni del DeltaE-2000 superiori a 3. Inoltre, non abbiamo notato una tinta di colore e una calibrazione da parte dell'utente potrebbe persino essere superflua. Potremmo essere stati in grado di migliorare la qualità della rappresentazione attraverso la nostra calibrazione (scaricabile gratuitamente più sopra), ma questo è solo misurabile, non visibile. Insieme alla copertura sRGB completa, il pannello può essere utilizzato con fiducia per l'editing di foto o video.
Tempi di risposta del Display
| ↔ Tempi di risposta dal Nero al Bianco | ||
|---|---|---|
| 8.7 ms ... aumenta ↗ e diminuisce ↘ combinato | ↗ 4.6 ms Incremento | 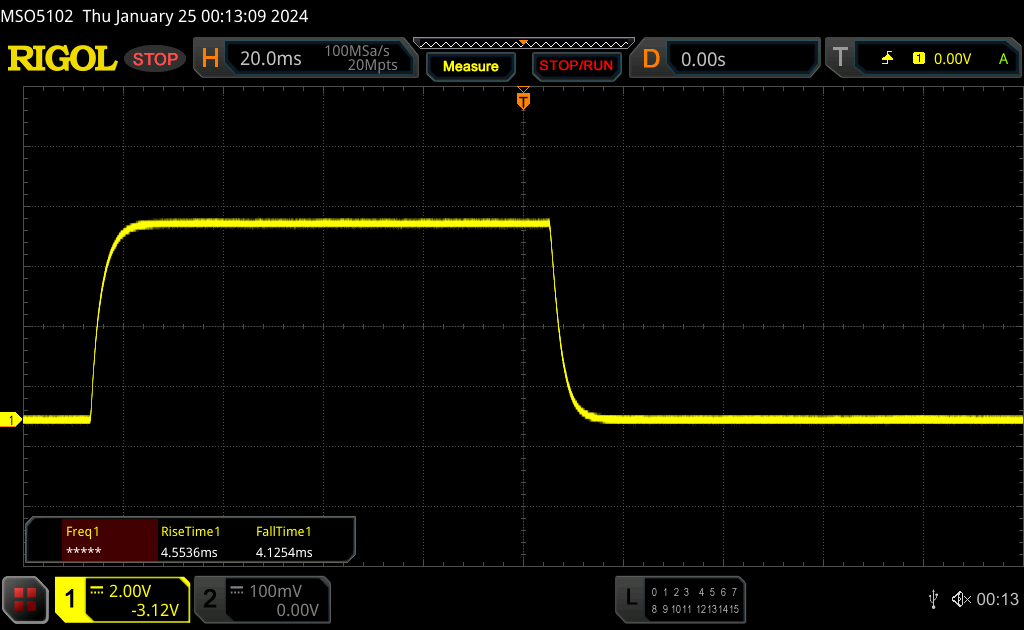 |
| ↘ 4.1 ms Calo | ||
| Lo schermo mostra veloci tempi di risposta durante i nostri tests e dovrebbe esere adatto al gaming In confronto, tutti i dispositivi di test variano da 0.1 (minimo) a 240 (massimo) ms. » 24 % di tutti i dispositivi è migliore. Questo significa che i tempi di risposta rilevati sono migliori rispettto alla media di tutti i dispositivi testati (19.8 ms). | ||
| ↔ Tempo di risposta dal 50% Grigio all'80% Grigio | ||
| 12.5 ms ... aumenta ↗ e diminuisce ↘ combinato | ↗ 6.1 ms Incremento | 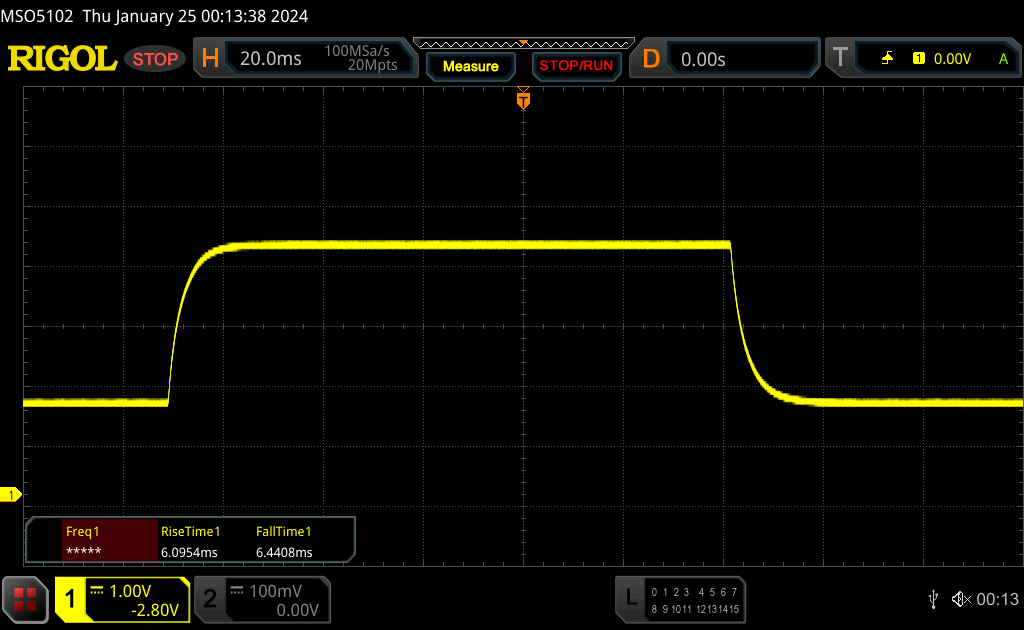 |
| ↘ 6.4 ms Calo | ||
| Lo schermo mostra buoni tempi di risposta durante i nostri tests, ma potrebbe essere troppo lento per i gamers competitivi. In confronto, tutti i dispositivi di test variano da 0.165 (minimo) a 636 (massimo) ms. » 26 % di tutti i dispositivi è migliore. Questo significa che i tempi di risposta rilevati sono migliori rispettto alla media di tutti i dispositivi testati (30.9 ms). | ||
Sfarfallio dello schermo / PWM (Pulse-Width Modulation)
| flickering dello schermo / PWM non rilevato |  | ||
In confronto: 52 % di tutti i dispositivi testati non utilizza PWM per ridurre la luminosita' del display. Se è rilevato PWM, una media di 7748 (minimo: 5 - massimo: 343500) Hz è stata rilevata. | |||

Grazie all'elevata luminosità e alla superficie opaca del display, Legion 5i 16 può essere utilizzato molto bene all'esterno o in ambienti luminosi. La stabilità dell'angolo di visione dell'IPS è buona, ma se lo guarda dall'alto in diagonale, l'immagine si schiarisce un po'.

Prestazioni - Raptor Lake-HX Refresh & Ada Lovelace
Lenovo offre il Legion 5i 16 G9 con cinque diversi processori HX di Intel, anche se le due varianti più deboli appartengono ancora alla 13esima generazione dello scorso anno. L'ammiraglia può essere equipaggiata con un Core i9-14900HX nella migliore delle ipotesi, e il nostro esemplare di prova monta il Core i7-14650HX. Le schede grafiche disponibili includono gli attuali modelli Nvidia GeForce RTX 4050 Laptop, 4060 Laptop e 4070 Laptop con un TGP massimo di 115 watt e un interruttore MUX per la commutazione grafica Advanced Optimus.
Condizioni di test
Lenovo offre tre diverse modalità di prestazioni all'interno dell'app Vantage preinstallata, oltre a una modalità personalizzata che l'utente può regolare ampiamente (limiti di potenza CPU/GPU, limiti di temperatura CPU/GPU, boost dinamico CPU/GPU). Quindi, può giocare con questi parametri quanto vuole. Nella tabella seguente abbiamo elencato i rispettivi parametri delle tre impostazioni predefinite(modalità silenziosa, modalità bilanciata e modalità prestazioni).
| Profilo energetico | Carico CPU | CB R23 Multi | Carico GPU | Time Spy Grafica | Cyberpunk 2077 QHD Ultra | Emissioni massime della ventola |
|---|---|---|---|---|---|---|
| Modalità silenziosa | 65->55 watt | 16.720 punti | 65 watt | 8.443 punti | 35,4 fps | 34,6 dB(A) |
| Modalità bilanciata | 120->70 watt | 19.897 punti | 80 watt | 9.749 punti | 43,4 fps | 49,8 dB(A) |
| Modalità Performance | 140->100 watt | 24.455 punti | 125 watt | 11.267 punti | 49,7 fps | 55,7 dB(A) |
Abbiamo effettuato i seguenti benchmark e misurazioni utilizzando la modalità prestazioni, in quanto le prestazioni di gioco del dispositivo, in particolare, sono molto più elevate con questa modalità. Naturalmente, le ventole finiscono per essere più rumorose, ma anche in modalità bilanciata, le ventole possono diventare molto rumorose durante il gioco e probabilmente avrà bisogno di un paio di cuffie, quindi tanto vale usare la modalità prestazioni. I profili possono essere selezionati tramite la combinazione di tasti Fn+Q, mentre il LED di stato colorato sul pulsante di accensione mostra quale modalità è attualmente in uso (rosso: prestazioni, bianco: bilanciato, blu: silenzioso, viola: regolato). Durante le semplici attività quotidiane, può facilmente utilizzare la modalità silenziosa e spesso può godere di un dispositivo completamente silenzioso. Nell'uso della batteria, non è possibile utilizzare la modalità prestazioni.
Lenovo ha dotato l'AI Engine+ di Legion 5i 16 del proprio chip LA1 AI, che può essere attivato insieme alla modalità bilanciata. Si suppone che riconosca automaticamente i giochi e ottimizzi le prestazioni del portatile, per cui le temperature e le emissioni di rumore della ventola possono aumentare. In generale, tuttavia, non si tratta di una vera e propria novità e una funzione simile era già presente nei modelli precedenti, dove l'esecuzione di giochi attivava un passaggio automatico alla modalità prestazioni. D'altra parte, non abbiamo notato alcuna differenza rispetto alla modalità bilanciata quando utilizziamo questo nuovo AI Engine+, e le prestazioni del dispositivo erano spesso uguali o addirittura peggiori rispetto alla modalità prestazioni.
Processore - Core i7-14650HX
Il nuovo Core i7-14650HX è il successore del vecchio Core i7-13700HXoffrendo la stessa configurazione di core (prestazioni 8x + efficienza 8x) con velocità di clock leggermente superiori (fino a 5,2 GHz), ma in termini di architettura generale non è cambiato nulla. All'interno di Legion 5i 16, la nuova CPU HX consuma 140 watt per un breve periodo di tempo, prima di bilanciarsi a 100 watt. Le prestazioni risultanti sono eccellenti, con un vantaggio del 10% rispetto al vecchio 13700HX. Anche i modelli AMD hanno fatto sensibilmente peggio. Anche durante i test single-core, Legion ha ottenuto il massimo. Nell'uso a batteria, il suo consumo energetico è limitato a 50 watt, motivo per cui le sue prestazioni multi-core sono calate di circa il 40% (CB R23 Multi: 14.202 punti).
Ulteriori benchmark della CPU sono disponibili nella nostra sezione tecnica.
Cinebench R15 Multi continuous test
Cinebench R23: Multi Core | Single Core
Cinebench R20: CPU (Multi Core) | CPU (Single Core)
Cinebench R15: CPU Multi 64Bit | CPU Single 64Bit
Blender: v2.79 BMW27 CPU
7-Zip 18.03: 7z b 4 | 7z b 4 -mmt1
Geekbench 6.7: Multi-Core | Single-Core
Geekbench 5.5: Multi-Core | Single-Core
HWBOT x265 Benchmark v2.2: 4k Preset
LibreOffice : 20 Documents To PDF
R Benchmark 2.5: Overall mean
| CPU Performance rating | |
| Media della classe Gaming | |
| Lenovo Legion 5 16IRX G9 | |
| Alienware m16 R1 Intel | |
| Media Intel Core i7-14650HX | |
| Lenovo Legion Pro 5 16IRX8 -2! | |
| Lenovo Legion Slim 5 16APH8 -2! | |
| Schenker XMG CORE 16 (L23) | |
| HP Victus 16-r0076TX -3! | |
| Lenovo LOQ 16IRH8 | |
| HP Victus 16-r0077ng | |
| Cinebench R23 / Multi Core | |
| Media della classe Gaming (10488 - 42661, n=108, ultimi 2 anni) | |
| Lenovo Legion 5 16IRX G9 | |
| Alienware m16 R1 Intel | |
| Media Intel Core i7-14650HX (16453 - 24455, n=2) | |
| Lenovo Legion Pro 5 16IRX8 | |
| HP Victus 16-r0076TX | |
| Schenker XMG CORE 16 (L23) | |
| Lenovo Legion Slim 5 16APH8 | |
| HP Victus 16-r0077ng | |
| Lenovo LOQ 16IRH8 | |
| Cinebench R23 / Single Core | |
| Media della classe Gaming (1166 - 2415, n=108, ultimi 2 anni) | |
| Media Intel Core i7-14650HX (1963 - 1975, n=2) | |
| Lenovo Legion 5 16IRX G9 | |
| Alienware m16 R1 Intel | |
| Lenovo LOQ 16IRH8 | |
| Lenovo Legion Slim 5 16APH8 | |
| Schenker XMG CORE 16 (L23) | |
| HP Victus 16-r0076TX | |
| HP Victus 16-r0077ng | |
| Lenovo Legion Pro 5 16IRX8 | |
| Cinebench R20 / CPU (Multi Core) | |
| Media della classe Gaming (4029 - 16433, n=107, ultimi 2 anni) | |
| Lenovo Legion 5 16IRX G9 | |
| Alienware m16 R1 Intel | |
| Media Intel Core i7-14650HX (6236 - 9349, n=2) | |
| HP Victus 16-r0076TX | |
| Lenovo Legion Pro 5 16IRX8 | |
| Lenovo Legion Slim 5 16APH8 | |
| Schenker XMG CORE 16 (L23) | |
| HP Victus 16-r0077ng | |
| Lenovo LOQ 16IRH8 | |
| Cinebench R20 / CPU (Single Core) | |
| Media della classe Gaming (442 - 913, n=107, ultimi 2 anni) | |
| Media Intel Core i7-14650HX (754 - 762, n=2) | |
| Lenovo Legion 5 16IRX G9 | |
| Alienware m16 R1 Intel | |
| Lenovo LOQ 16IRH8 | |
| Lenovo Legion Slim 5 16APH8 | |
| Schenker XMG CORE 16 (L23) | |
| Lenovo Legion Pro 5 16IRX8 | |
| HP Victus 16-r0077ng | |
| HP Victus 16-r0076TX | |
| Cinebench R15 / CPU Multi 64Bit | |
| Media della classe Gaming (1578 - 6330, n=106, ultimi 2 anni) | |
| Lenovo Legion 5 16IRX G9 | |
| Media Intel Core i7-14650HX (3142 - 3799, n=2) | |
| Lenovo Legion Pro 5 16IRX8 | |
| Alienware m16 R1 Intel | |
| HP Victus 16-r0076TX | |
| Lenovo Legion Slim 5 16APH8 | |
| Schenker XMG CORE 16 (L23) | |
| Lenovo LOQ 16IRH8 | |
| HP Victus 16-r0077ng | |
| Cinebench R15 / CPU Single 64Bit | |
| Media della classe Gaming (188.8 - 350, n=107, ultimi 2 anni) | |
| Lenovo Legion 5 16IRX G9 | |
| Media Intel Core i7-14650HX (284 - 287, n=2) | |
| Lenovo Legion Slim 5 16APH8 | |
| Alienware m16 R1 Intel | |
| Schenker XMG CORE 16 (L23) | |
| Lenovo Legion Pro 5 16IRX8 | |
| Lenovo LOQ 16IRH8 | |
| HP Victus 16-r0077ng | |
| HP Victus 16-r0076TX | |
| Blender / v2.79 BMW27 CPU | |
| Lenovo LOQ 16IRH8 | |
| HP Victus 16-r0077ng | |
| HP Victus 16-r0076TX | |
| Schenker XMG CORE 16 (L23) | |
| Lenovo Legion Slim 5 16APH8 | |
| Media Intel Core i7-14650HX (141 - 206, n=2) | |
| Alienware m16 R1 Intel | |
| Lenovo Legion Pro 5 16IRX8 | |
| Media della classe Gaming (79 - 330, n=105, ultimi 2 anni) | |
| Lenovo Legion 5 16IRX G9 | |
| 7-Zip 18.03 / 7z b 4 | |
| Lenovo Legion 5 16IRX G9 | |
| Media della classe Gaming (33491 - 148086, n=106, ultimi 2 anni) | |
| Alienware m16 R1 Intel | |
| Media Intel Core i7-14650HX (68711 - 93686, n=2) | |
| Lenovo Legion Pro 5 16IRX8 | |
| Schenker XMG CORE 16 (L23) | |
| HP Victus 16-r0076TX | |
| Lenovo Legion Slim 5 16APH8 | |
| HP Victus 16-r0077ng | |
| Lenovo LOQ 16IRH8 | |
| 7-Zip 18.03 / 7z b 4 -mmt1 | |
| Lenovo Legion 5 16IRX G9 | |
| Schenker XMG CORE 16 (L23) | |
| Media Intel Core i7-14650HX (6364 - 6695, n=2) | |
| Lenovo Legion Slim 5 16APH8 | |
| Media della classe Gaming (4199 - 7436, n=106, ultimi 2 anni) | |
| Alienware m16 R1 Intel | |
| Lenovo LOQ 16IRH8 | |
| Lenovo Legion Pro 5 16IRX8 | |
| HP Victus 16-r0077ng | |
| HP Victus 16-r0076TX | |
| Geekbench 6.7 / Multi-Core | |
| Media della classe Gaming (6625 - 22850, n=107, ultimi 2 anni) | |
| Lenovo Legion 5 16IRX G9 | |
| Media Intel Core i7-14650HX (12892 - 16010, n=2) | |
| Alienware m16 R1 Intel | |
| Schenker XMG CORE 16 (L23) | |
| Lenovo LOQ 16IRH8 | |
| HP Victus 16-r0077ng | |
| Geekbench 6.7 / Single-Core | |
| Media della classe Gaming (1490 - 3259, n=107, ultimi 2 anni) | |
| Lenovo Legion 5 16IRX G9 | |
| Media Intel Core i7-14650HX (2744 - 2761, n=2) | |
| Schenker XMG CORE 16 (L23) | |
| Alienware m16 R1 Intel | |
| Lenovo LOQ 16IRH8 | |
| HP Victus 16-r0077ng | |
| Geekbench 5.5 / Multi-Core | |
| Media della classe Gaming (6460 - 28263, n=106, ultimi 2 anni) | |
| Lenovo Legion 5 16IRX G9 | |
| Media Intel Core i7-14650HX (12584 - 16810, n=2) | |
| Alienware m16 R1 Intel | |
| Lenovo Legion Pro 5 16IRX8 | |
| HP Victus 16-r0076TX | |
| Lenovo LOQ 16IRH8 | |
| Schenker XMG CORE 16 (L23) | |
| Lenovo Legion Slim 5 16APH8 | |
| HP Victus 16-r0077ng | |
| Geekbench 5.5 / Single-Core | |
| Media della classe Gaming (986 - 2474, n=106, ultimi 2 anni) | |
| Lenovo Legion Slim 5 16APH8 | |
| Schenker XMG CORE 16 (L23) | |
| Media Intel Core i7-14650HX (1933 - 1940, n=2) | |
| Lenovo Legion 5 16IRX G9 | |
| Alienware m16 R1 Intel | |
| Lenovo LOQ 16IRH8 | |
| Lenovo Legion Pro 5 16IRX8 | |
| HP Victus 16-r0076TX | |
| HP Victus 16-r0077ng | |
| HWBOT x265 Benchmark v2.2 / 4k Preset | |
| Media della classe Gaming (11.5 - 44.4, n=106, ultimi 2 anni) | |
| Lenovo Legion 5 16IRX G9 | |
| Lenovo Legion Pro 5 16IRX8 | |
| Alienware m16 R1 Intel | |
| Lenovo Legion Slim 5 16APH8 | |
| Schenker XMG CORE 16 (L23) | |
| HP Victus 16-r0076TX | |
| Media Intel Core i7-14650HX (12.6 - 25.6, n=2) | |
| Lenovo LOQ 16IRH8 | |
| HP Victus 16-r0077ng | |
| LibreOffice / 20 Documents To PDF | |
| Schenker XMG CORE 16 (L23) | |
| HP Victus 16-r0077ng | |
| Media della classe Gaming (33.2 - 88.8, n=106, ultimi 2 anni) | |
| Media Intel Core i7-14650HX (43.8 - 55.6, n=2) | |
| Lenovo LOQ 16IRH8 | |
| Alienware m16 R1 Intel | |
| Lenovo Legion 5 16IRX G9 | |
| Lenovo Legion Slim 5 16APH8 | |
| Lenovo Legion Pro 5 16IRX8 | |
| R Benchmark 2.5 / Overall mean | |
| HP Victus 16-r0077ng | |
| HP Victus 16-r0076TX | |
| Lenovo Legion Pro 5 16IRX8 | |
| Lenovo LOQ 16IRH8 | |
| Alienware m16 R1 Intel | |
| Schenker XMG CORE 16 (L23) | |
| Lenovo Legion Slim 5 16APH8 | |
| Media della classe Gaming (0.3439 - 0.759, n=107, ultimi 2 anni) | |
| Media Intel Core i7-14650HX (0.4195 - 0.4244, n=2) | |
| Lenovo Legion 5 16IRX G9 | |
* ... Meglio usare valori piccoli
AIDA64: FP32 Ray-Trace | FPU Julia | CPU SHA3 | CPU Queen | FPU SinJulia | FPU Mandel | CPU AES | CPU ZLib | FP64 Ray-Trace | CPU PhotoWorxx
| Performance rating | |
| Media della classe Gaming | |
| Schenker XMG CORE 16 (L23) | |
| Lenovo Legion Slim 5 16APH8 | |
| Alienware m16 R1 Intel | |
| Lenovo Legion Pro 5 16IRX8 | |
| Lenovo Legion 5 16IRX G9 | |
| HP Victus 16-r0076TX | |
| Media Intel Core i7-14650HX | |
| HP Victus 16-r0077ng | |
| Lenovo LOQ 16IRH8 | |
| AIDA64 / FP32 Ray-Trace | |
| Media della classe Gaming (10227 - 85542, n=106, ultimi 2 anni) | |
| Lenovo Legion Slim 5 16APH8 | |
| Schenker XMG CORE 16 (L23) | |
| Lenovo Legion Pro 5 16IRX8 | |
| Alienware m16 R1 Intel | |
| Lenovo Legion 5 16IRX G9 | |
| Media Intel Core i7-14650HX (13096 - 19044, n=2) | |
| HP Victus 16-r0076TX | |
| HP Victus 16-r0077ng | |
| Lenovo LOQ 16IRH8 | |
| AIDA64 / FPU Julia | |
| Media della classe Gaming (51376 - 372155, n=106, ultimi 2 anni) | |
| Lenovo Legion Slim 5 16APH8 | |
| Schenker XMG CORE 16 (L23) | |
| Lenovo Legion Pro 5 16IRX8 | |
| Alienware m16 R1 Intel | |
| Lenovo Legion 5 16IRX G9 | |
| HP Victus 16-r0076TX | |
| Media Intel Core i7-14650HX (67335 - 95271, n=2) | |
| HP Victus 16-r0077ng | |
| Lenovo LOQ 16IRH8 | |
| AIDA64 / CPU SHA3 | |
| Media della classe Gaming (2180 - 10115, n=106, ultimi 2 anni) | |
| Schenker XMG CORE 16 (L23) | |
| Lenovo Legion Slim 5 16APH8 | |
| Alienware m16 R1 Intel | |
| Lenovo Legion Pro 5 16IRX8 | |
| Lenovo Legion 5 16IRX G9 | |
| HP Victus 16-r0076TX | |
| Media Intel Core i7-14650HX (3109 - 4214, n=2) | |
| HP Victus 16-r0077ng | |
| Lenovo LOQ 16IRH8 | |
| AIDA64 / CPU Queen | |
| Lenovo Legion Slim 5 16APH8 | |
| Media della classe Gaming (49785 - 173351, n=90, ultimi 2 anni) | |
| Alienware m16 R1 Intel | |
| Lenovo Legion Pro 5 16IRX8 | |
| HP Victus 16-r0076TX | |
| Schenker XMG CORE 16 (L23) | |
| Lenovo Legion 5 16IRX G9 | |
| Media Intel Core i7-14650HX (89907 - 101500, n=2) | |
| HP Victus 16-r0077ng | |
| Lenovo LOQ 16IRH8 | |
| AIDA64 / FPU SinJulia | |
| Schenker XMG CORE 16 (L23) | |
| Lenovo Legion Slim 5 16APH8 | |
| Media della classe Gaming (4424 - 33636, n=106, ultimi 2 anni) | |
| Alienware m16 R1 Intel | |
| Lenovo Legion Pro 5 16IRX8 | |
| Lenovo Legion 5 16IRX G9 | |
| Media Intel Core i7-14650HX (9159 - 11913, n=2) | |
| HP Victus 16-r0076TX | |
| HP Victus 16-r0077ng | |
| Lenovo LOQ 16IRH8 | |
| AIDA64 / FPU Mandel | |
| Media della classe Gaming (25115 - 196829, n=106, ultimi 2 anni) | |
| Lenovo Legion Slim 5 16APH8 | |
| Schenker XMG CORE 16 (L23) | |
| Lenovo Legion Pro 5 16IRX8 | |
| Alienware m16 R1 Intel | |
| Lenovo Legion 5 16IRX G9 | |
| Media Intel Core i7-14650HX (32747 - 47097, n=2) | |
| HP Victus 16-r0076TX | |
| HP Victus 16-r0077ng | |
| Lenovo LOQ 16IRH8 | |
| AIDA64 / CPU AES | |
| Alienware m16 R1 Intel | |
| Media della classe Gaming (39258 - 247074, n=106, ultimi 2 anni) | |
| Lenovo Legion Pro 5 16IRX8 | |
| Schenker XMG CORE 16 (L23) | |
| Lenovo Legion 5 16IRX G9 | |
| HP Victus 16-r0076TX | |
| Media Intel Core i7-14650HX (63627 - 86485, n=2) | |
| Lenovo Legion Slim 5 16APH8 | |
| HP Victus 16-r0077ng | |
| Lenovo LOQ 16IRH8 | |
| AIDA64 / CPU ZLib | |
| Media della classe Gaming (574 - 2531, n=106, ultimi 2 anni) | |
| Alienware m16 R1 Intel | |
| Lenovo Legion Pro 5 16IRX8 | |
| Lenovo Legion 5 16IRX G9 | |
| Media Intel Core i7-14650HX (924 - 1289, n=2) | |
| Lenovo Legion Slim 5 16APH8 | |
| HP Victus 16-r0076TX | |
| Schenker XMG CORE 16 (L23) | |
| HP Victus 16-r0077ng | |
| Lenovo LOQ 16IRH8 | |
| AIDA64 / FP64 Ray-Trace | |
| Media della classe Gaming (5509 - 45446, n=106, ultimi 2 anni) | |
| Lenovo Legion Slim 5 16APH8 | |
| Schenker XMG CORE 16 (L23) | |
| Lenovo Legion Pro 5 16IRX8 | |
| Alienware m16 R1 Intel | |
| Lenovo Legion 5 16IRX G9 | |
| Media Intel Core i7-14650HX (7064 - 10316, n=2) | |
| HP Victus 16-r0076TX | |
| HP Victus 16-r0077ng | |
| Lenovo LOQ 16IRH8 | |
| AIDA64 / CPU PhotoWorxx | |
| Media della classe Gaming (12271 - 89891, n=106, ultimi 2 anni) | |
| Schenker XMG CORE 16 (L23) | |
| HP Victus 16-r0077ng | |
| HP Victus 16-r0076TX | |
| Lenovo Legion Pro 5 16IRX8 | |
| Alienware m16 R1 Intel | |
| Media Intel Core i7-14650HX (33763 - 34470, n=2) | |
| Lenovo Legion 5 16IRX G9 | |
| Lenovo LOQ 16IRH8 | |
| Lenovo Legion Slim 5 16APH8 | |
Prestazioni del sistema
Non sorprende che il nuovo Legion 5i 16 sia un dispositivo dalla reazione molto rapida e che tutti gli input siano implementati senza esitazione. Il sistema si blocca brevemente all'avvio dei giochi, ma questo è dovuto alla commutazione grafica Advanced Optimus. È possibile evitare questo problema attivando la commutazione Optimus normale, ma in questo caso non si ottengono le migliori prestazioni. Durante il test, non abbiamo mai avuto problemi con il nostro dispositivo di prova (crash, ecc.).
CrossMark: Overall | Productivity | Creativity | Responsiveness
WebXPRT 3: Overall
WebXPRT 4: Overall
Mozilla Kraken 1.1: Total
| PCMark 10 / Score | |
| Media della classe Gaming (5828 - 12414, n=94, ultimi 2 anni) | |
| Schenker XMG CORE 16 (L23) | |
| Lenovo Legion Slim 5 16APH8 | |
| Lenovo Legion Pro 5 16IRX8 | |
| Lenovo Legion 5 16IRX G9 | |
| Media Intel Core i7-14650HX, NVIDIA GeForce RTX 4060 Laptop GPU (n=1) | |
| Alienware m16 R1 Intel | |
| HP Victus 16-r0077ng | |
| Lenovo LOQ 16IRH8 | |
| HP Victus 16-r0076TX | |
| PCMark 10 / Essentials | |
| Lenovo Legion Slim 5 16APH8 | |
| Schenker XMG CORE 16 (L23) | |
| Lenovo Legion Pro 5 16IRX8 | |
| Lenovo Legion 5 16IRX G9 | |
| Media Intel Core i7-14650HX, NVIDIA GeForce RTX 4060 Laptop GPU (n=1) | |
| Alienware m16 R1 Intel | |
| HP Victus 16-r0077ng | |
| Media della classe Gaming (8810 - 11935, n=98, ultimi 2 anni) | |
| Lenovo LOQ 16IRH8 | |
| HP Victus 16-r0076TX | |
| PCMark 10 / Productivity | |
| Media della classe Gaming (6845 - 25323, n=96, ultimi 2 anni) | |
| Schenker XMG CORE 16 (L23) | |
| Lenovo Legion Slim 5 16APH8 | |
| Alienware m16 R1 Intel | |
| Lenovo Legion 5 16IRX G9 | |
| Media Intel Core i7-14650HX, NVIDIA GeForce RTX 4060 Laptop GPU (n=1) | |
| Lenovo Legion Pro 5 16IRX8 | |
| HP Victus 16-r0077ng | |
| Lenovo LOQ 16IRH8 | |
| HP Victus 16-r0076TX | |
| PCMark 10 / Digital Content Creation | |
| Media della classe Gaming (7602 - 19954, n=96, ultimi 2 anni) | |
| Schenker XMG CORE 16 (L23) | |
| Lenovo Legion Pro 5 16IRX8 | |
| Lenovo Legion 5 16IRX G9 | |
| Media Intel Core i7-14650HX, NVIDIA GeForce RTX 4060 Laptop GPU (n=1) | |
| Lenovo Legion Slim 5 16APH8 | |
| HP Victus 16-r0077ng | |
| Alienware m16 R1 Intel | |
| Lenovo LOQ 16IRH8 | |
| HP Victus 16-r0076TX | |
| CrossMark / Overall | |
| Lenovo Legion 5 16IRX G9 | |
| Media Intel Core i7-14650HX, NVIDIA GeForce RTX 4060 Laptop GPU (n=1) | |
| Alienware m16 R1 Intel | |
| Media della classe Gaming (1366 - 2409, n=95, ultimi 2 anni) | |
| Lenovo LOQ 16IRH8 | |
| Lenovo Legion Slim 5 16APH8 | |
| HP Victus 16-r0076TX | |
| Schenker XMG CORE 16 (L23) | |
| Lenovo Legion Pro 5 16IRX8 | |
| CrossMark / Productivity | |
| Alienware m16 R1 Intel | |
| Lenovo Legion 5 16IRX G9 | |
| Media Intel Core i7-14650HX, NVIDIA GeForce RTX 4060 Laptop GPU (n=1) | |
| Lenovo LOQ 16IRH8 | |
| Media della classe Gaming (1386 - 2254, n=95, ultimi 2 anni) | |
| Lenovo Legion Slim 5 16APH8 | |
| Schenker XMG CORE 16 (L23) | |
| Lenovo Legion Pro 5 16IRX8 | |
| HP Victus 16-r0076TX | |
| CrossMark / Creativity | |
| Lenovo Legion 5 16IRX G9 | |
| Media Intel Core i7-14650HX, NVIDIA GeForce RTX 4060 Laptop GPU (n=1) | |
| Media della classe Gaming (1343 - 2786, n=95, ultimi 2 anni) | |
| Alienware m16 R1 Intel | |
| Lenovo LOQ 16IRH8 | |
| Lenovo Legion Slim 5 16APH8 | |
| HP Victus 16-r0076TX | |
| Schenker XMG CORE 16 (L23) | |
| Lenovo Legion Pro 5 16IRX8 | |
| CrossMark / Responsiveness | |
| Lenovo Legion 5 16IRX G9 | |
| Media Intel Core i7-14650HX, NVIDIA GeForce RTX 4060 Laptop GPU (n=1) | |
| Alienware m16 R1 Intel | |
| Lenovo LOQ 16IRH8 | |
| Media della classe Gaming (1226 - 2334, n=95, ultimi 2 anni) | |
| Lenovo Legion Pro 5 16IRX8 | |
| Lenovo Legion Slim 5 16APH8 | |
| HP Victus 16-r0076TX | |
| Schenker XMG CORE 16 (L23) | |
| WebXPRT 3 / Overall | |
| Lenovo Legion Slim 5 16APH8 | |
| Lenovo LOQ 16IRH8 | |
| Lenovo LOQ 16IRH8 | |
| Media della classe Gaming (220 - 532, n=99, ultimi 2 anni) | |
| Lenovo Legion 5 16IRX G9 | |
| Media Intel Core i7-14650HX, NVIDIA GeForce RTX 4060 Laptop GPU (n=1) | |
| Alienware m16 R1 Intel | |
| Schenker XMG CORE 16 (L23) | |
| HP Victus 16-r0077ng | |
| HP Victus 16-r0077ng | |
| HP Victus 16-r0076TX | |
| Lenovo Legion Pro 5 16IRX8 | |
| WebXPRT 4 / Overall | |
| Media della classe Gaming (165 - 354, n=99, ultimi 2 anni) | |
| Lenovo Legion 5 16IRX G9 | |
| Media Intel Core i7-14650HX, NVIDIA GeForce RTX 4060 Laptop GPU (n=1) | |
| Alienware m16 R1 Intel | |
| Lenovo Legion Slim 5 16APH8 | |
| Lenovo Legion Pro 5 16IRX8 | |
| HP Victus 16-r0077ng | |
| HP Victus 16-r0077ng | |
| HP Victus 16-r0076TX | |
| Mozilla Kraken 1.1 / Total | |
| HP Victus 16-r0076TX | |
| HP Victus 16-r0077ng | |
| HP Victus 16-r0077ng | |
| Lenovo Legion Pro 5 16IRX8 | |
| Schenker XMG CORE 16 (L23) | |
| Lenovo LOQ 16IRH8 | |
| Lenovo LOQ 16IRH8 | |
| Alienware m16 R1 Intel | |
| Lenovo Legion Slim 5 16APH8 | |
| Lenovo Legion 5 16IRX G9 | |
| Media Intel Core i7-14650HX, NVIDIA GeForce RTX 4060 Laptop GPU (n=1) | |
| Media della classe Gaming (391 - 590, n=101, ultimi 2 anni) | |
* ... Meglio usare valori piccoli
| PCMark 10 Score | 7645 punti | |
Aiuto | ||
| AIDA64 / Memory Copy | |
| Media della classe Gaming (21750 - 129946, n=106, ultimi 2 anni) | |
| Schenker XMG CORE 16 (L23) | |
| Lenovo Legion Slim 5 16APH8 | |
| HP Victus 16-r0077ng | |
| Lenovo Legion 5 16IRX G9 | |
| Media Intel Core i7-14650HX (58978 - 59727, n=2) | |
| Lenovo Legion Pro 5 16IRX8 | |
| Alienware m16 R1 Intel | |
| HP Victus 16-r0076TX | |
| Lenovo LOQ 16IRH8 | |
| AIDA64 / Memory Read | |
| Media della classe Gaming (22956 - 118858, n=106, ultimi 2 anni) | |
| Lenovo Legion 5 16IRX G9 | |
| Media Intel Core i7-14650HX (70720 - 71455, n=2) | |
| HP Victus 16-r0077ng | |
| Lenovo Legion Pro 5 16IRX8 | |
| Alienware m16 R1 Intel | |
| HP Victus 16-r0076TX | |
| Lenovo LOQ 16IRH8 | |
| Lenovo Legion Slim 5 16APH8 | |
| Schenker XMG CORE 16 (L23) | |
| AIDA64 / Memory Write | |
| Schenker XMG CORE 16 (L23) | |
| Lenovo Legion Slim 5 16APH8 | |
| Media della classe Gaming (22297 - 135096, n=106, ultimi 2 anni) | |
| Lenovo Legion Pro 5 16IRX8 | |
| HP Victus 16-r0077ng | |
| Alienware m16 R1 Intel | |
| HP Victus 16-r0076TX | |
| Media Intel Core i7-14650HX (51138 - 56811, n=2) | |
| Lenovo LOQ 16IRH8 | |
| Lenovo Legion 5 16IRX G9 | |
| AIDA64 / Memory Latency | |
| Lenovo LOQ 16IRH8 | |
| Media della classe Gaming (75.3 - 259, n=106, ultimi 2 anni) | |
| HP Victus 16-r0076TX | |
| HP Victus 16-r0077ng | |
| Lenovo Legion Slim 5 16APH8 | |
| Media Intel Core i7-14650HX (89.8 - 95.2, n=2) | |
| Lenovo Legion 5 16IRX G9 | |
| Alienware m16 R1 Intel | |
| Schenker XMG CORE 16 (L23) | |
| Lenovo Legion Pro 5 16IRX8 | |
* ... Meglio usare valori piccoli
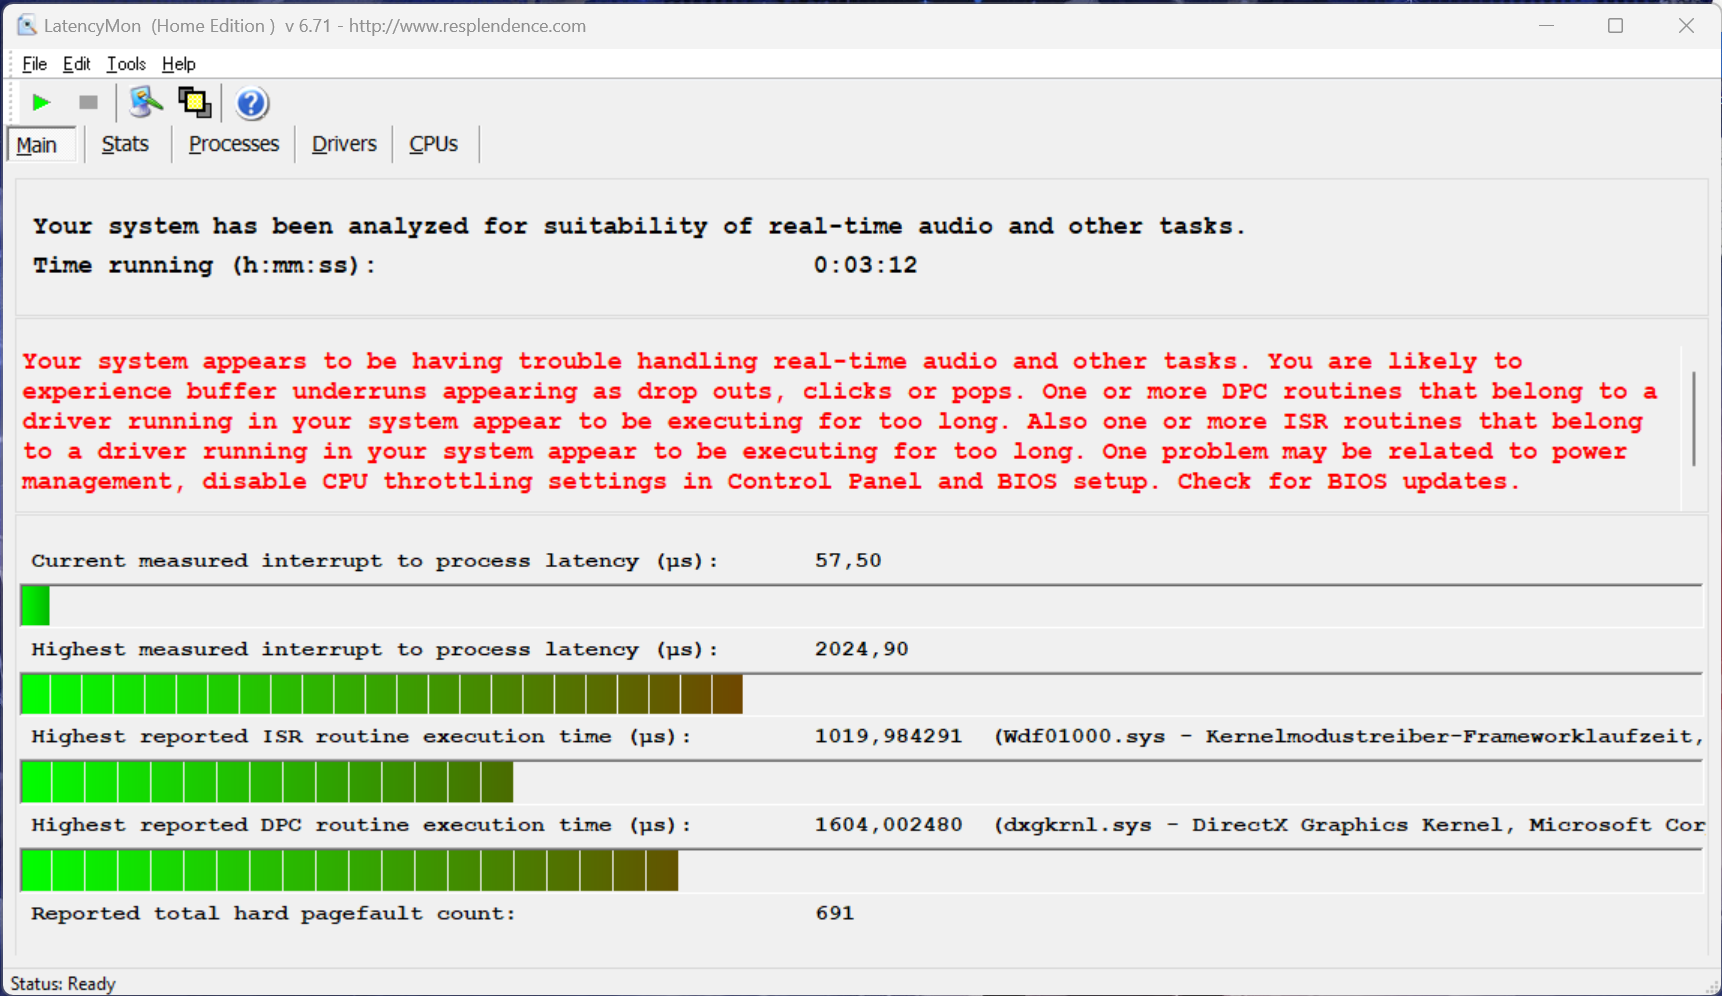
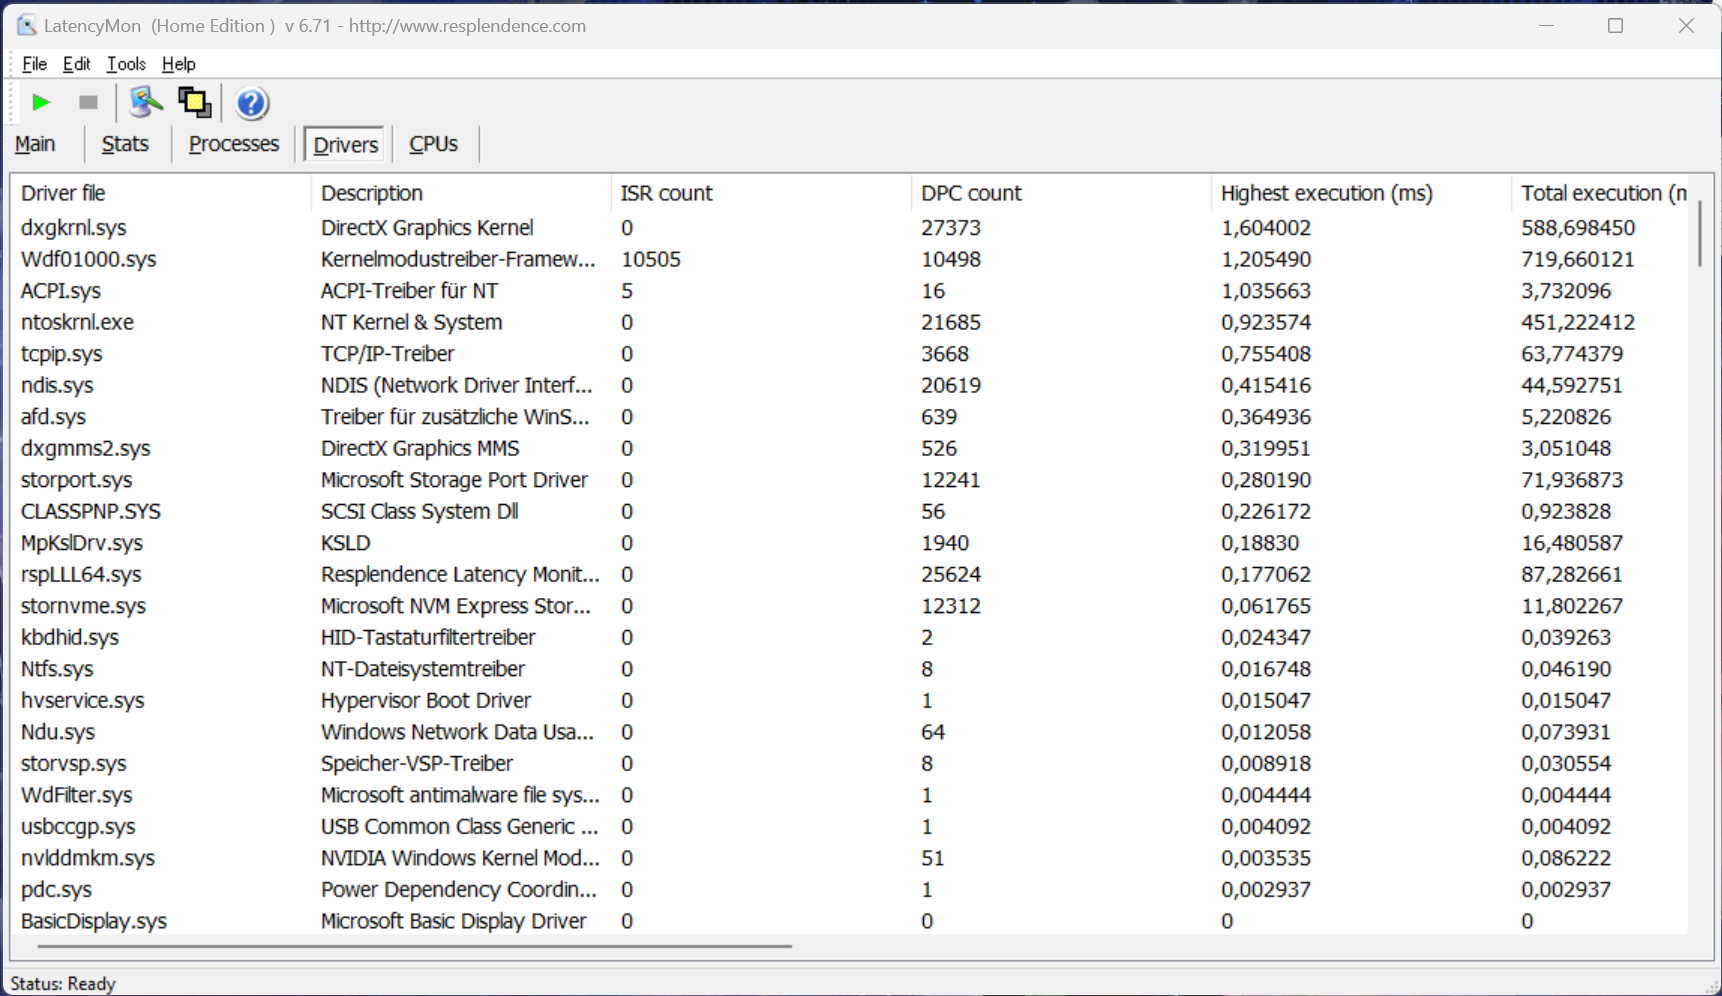
Latenza DPC
Nel nostro test di latenza standardizzato (navigazione web, riproduzione YouTube 4K, carico della CPU), il dispositivo di prova con l'attuale versione del BIOS ha mostrato alcune limitazioni quando si utilizzano applicazioni audio in tempo reale.
| DPC Latencies / LatencyMon - interrupt to process latency (max), Web, Youtube, Prime95 | |
| Alienware m16 R1 Intel | |
| Lenovo Legion 5 16IRX G9 | |
| HP Victus 16-r0076TX | |
| HP Victus 16-r0077ng | |
| Lenovo LOQ 16IRH8 | |
| Lenovo Legion Slim 5 16APH8 | |
| Lenovo Legion Pro 5 16IRX8 | |
| Schenker XMG CORE 16 (L23) | |
* ... Meglio usare valori piccoli
Dispositivi di archiviazione
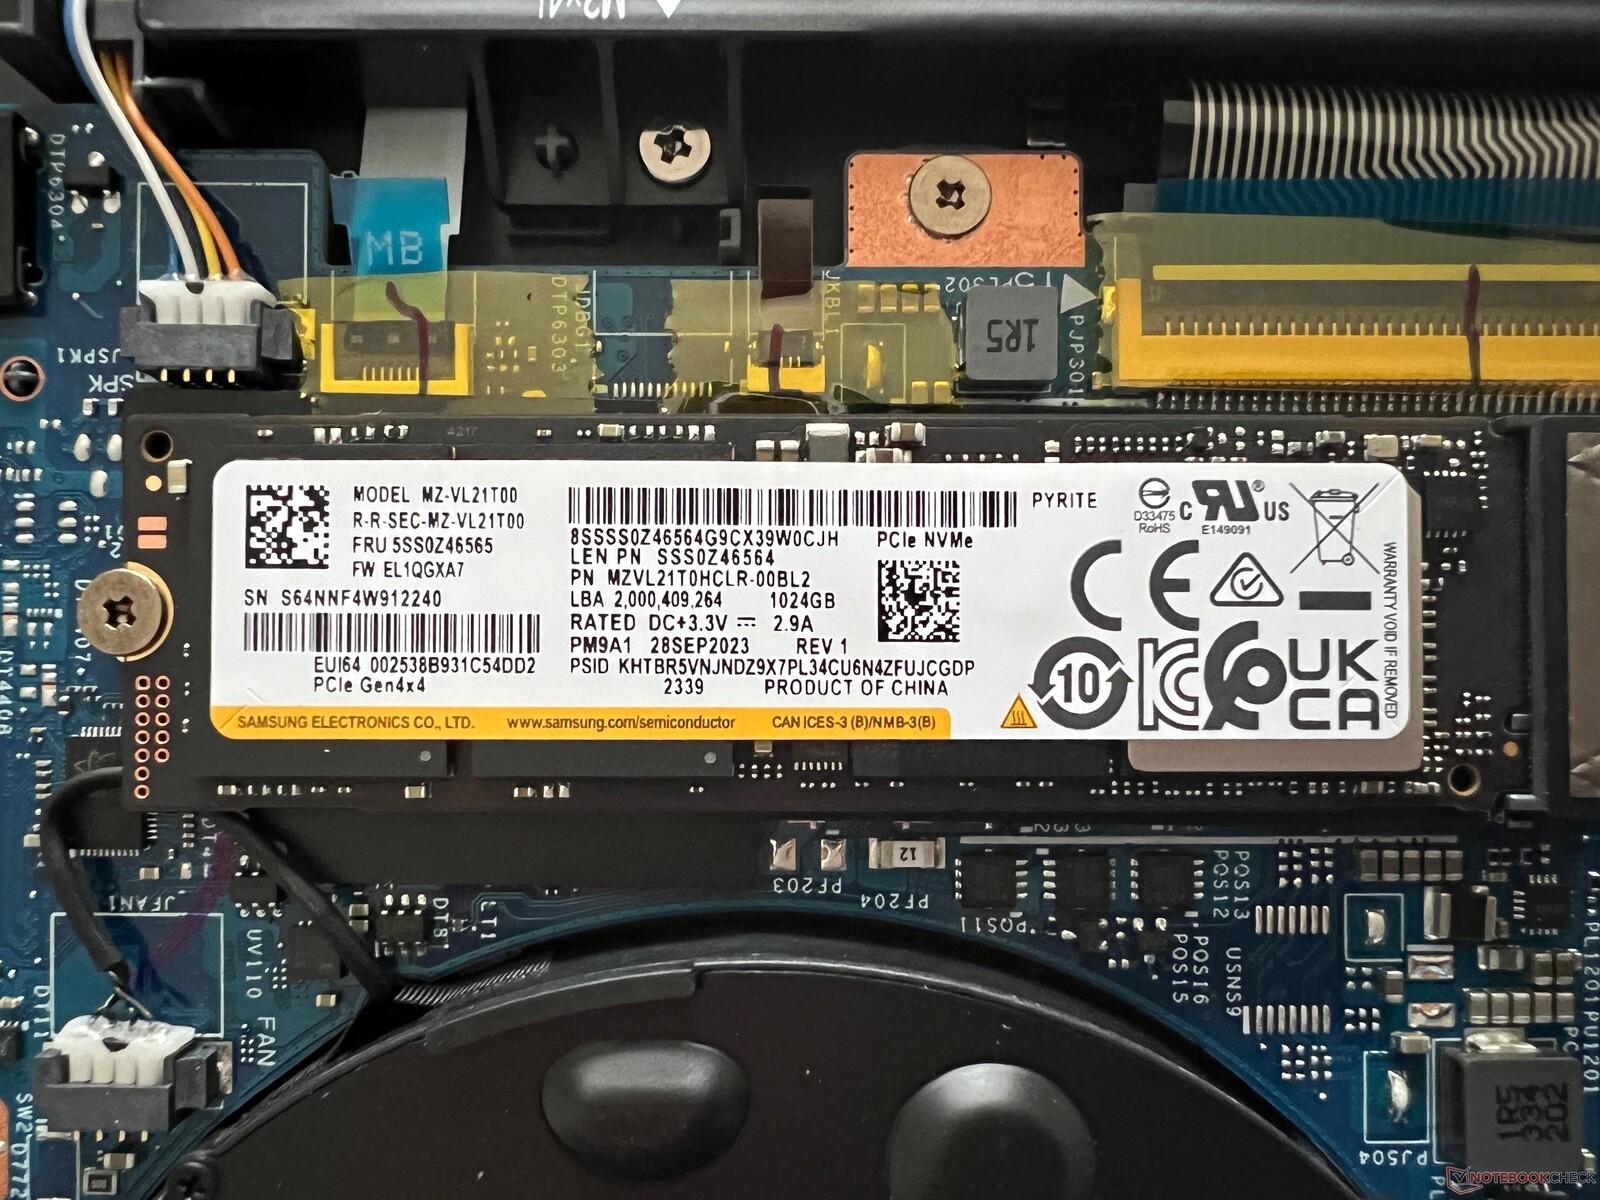
Come già accennato, Legion dispone di due slot SSD e il nostro dispositivo di prova è dotato della versione da 1 TB di Samsung PM9A1 (versione OEM del 980 Pro), lasciando agli utenti 888 GB liberi da utilizzare dopo il primo avvio del portatile. Le prestazioni dell'SSD PCIe-4.0 sono ottime in generale, ma sotto carico permanente non rimangono stabili. Nell'uso quotidiano, questo non dovrebbe causare limitazioni, ma un raffreddatore (o dissipatore) aggiuntivo avrebbe potuto risolvere il problema. Ulteriori benchmark dell'SSD sono disponibili qui.

* ... Meglio usare valori piccoli
Reading continuous performance: DiskSpd Read Loop, Queue Depth 8
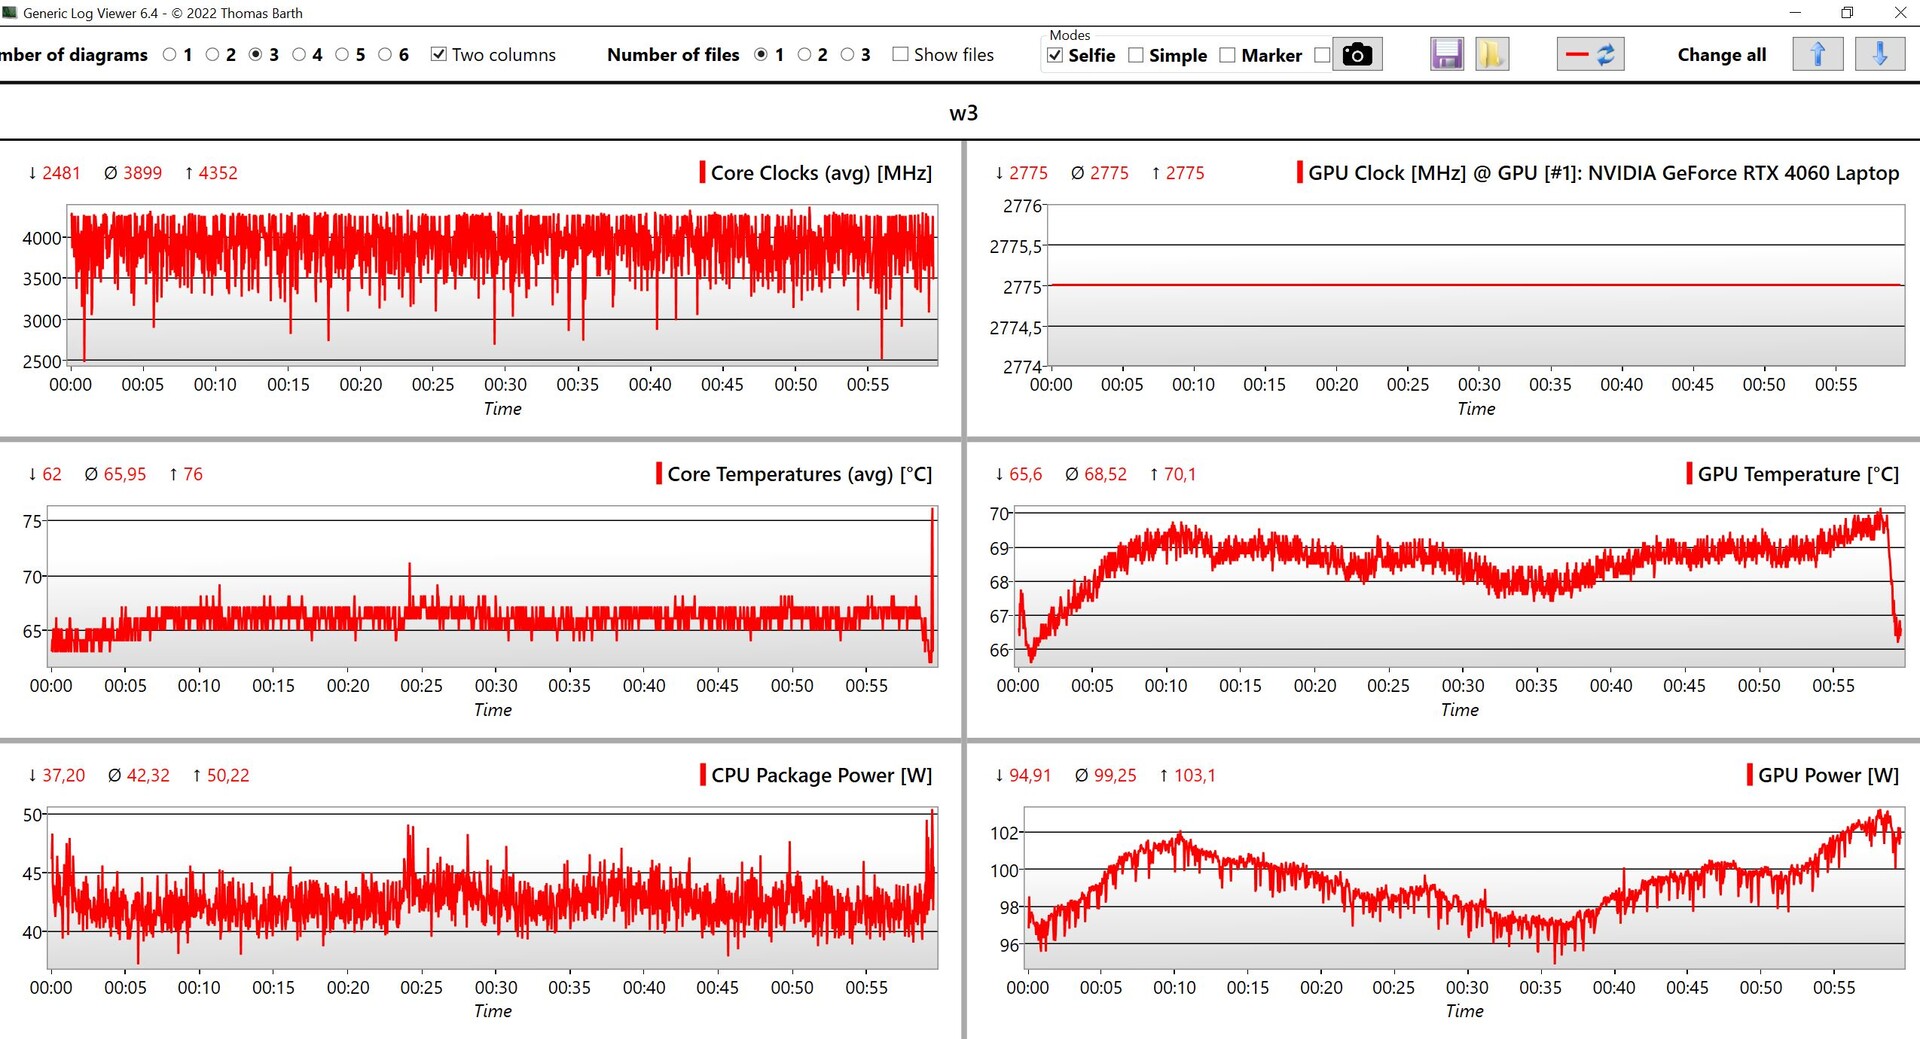
Scheda grafica
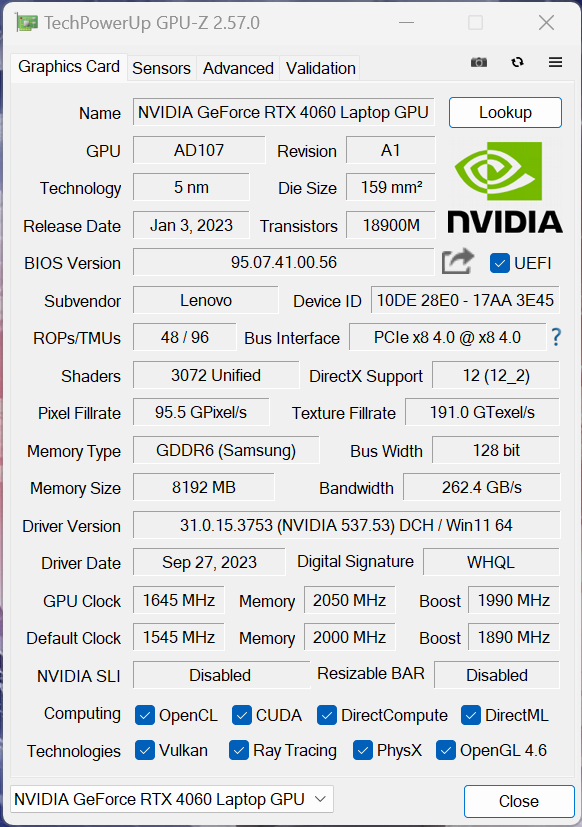
All'interno del dispositivo di prova, Lenovo ha installato l'attuale Nvidia GeForce RTX 4060 Laptop con un TGP di 115 watt - in realtà può anche overcloccare la GPU tramite l'applicazione Vantage. Durante il nostro test, la sua frequenza di clock massima era di 2.430 MHz. È supportato l'Optimus avanzato tramite un interruttore MUX, che ha funzionato in modo affidabile durante il nostro test, ma è anche possibile disattivare completamente l'iGPU del processore.
Il laptop RTX 4060 si è comportato molto bene nei benchmark, perdendo solo rispetto a entrambi i modelli RTX-4070 di NVIDIA NVIDIA GeForce RTX 4070 Laptop GPU - anche se la differenza con l'HP Victus Recensione del portatile HP Victus 16: gamer Full HD con RTX 4070 non è affatto grande. Le prestazioni della GPU rimangono totalmente stabili sotto carico permanente, ma nell'uso della batteria, la GPU può consumare solo 50 watt. Ciò comporta una perdita di prestazioni di poco superiore al 30%. Ulteriori benchmark della GPU sono disponibili qui .
| 3DMark 11 Performance | 32891 punti | |
| 3DMark Fire Strike Score | 25376 punti | |
| 3DMark Time Spy Score | 11731 punti | |
Aiuto | ||
| Blender / v3.3 Classroom OPTIX/RTX | |
| HP Victus 16-r0076TX | |
| Alienware m16 R1 Intel | |
| HP Victus 16-r0077ng | |
| Lenovo Legion 5 16IRX G9 | |
| Media NVIDIA GeForce RTX 4060 Laptop GPU (19 - 28, n=53) | |
| Lenovo Legion Slim 5 16APH8 | |
| Lenovo LOQ 16IRH8 | |
| Lenovo Legion Pro 5 16IRX8 | |
| Schenker XMG CORE 16 (L23) | |
| Media della classe Gaming (9 - 32, n=107, ultimi 2 anni) | |
| Blender / v3.3 Classroom CUDA | |
| HP Victus 16-r0076TX | |
| Lenovo Legion Slim 5 16APH8 | |
| Media NVIDIA GeForce RTX 4060 Laptop GPU (39 - 53, n=53) | |
| Lenovo LOQ 16IRH8 | |
| Lenovo Legion 5 16IRX G9 | |
| Lenovo Legion Pro 5 16IRX8 | |
| Alienware m16 R1 Intel | |
| HP Victus 16-r0077ng | |
| Media della classe Gaming (15 - 228, n=107, ultimi 2 anni) | |
| Schenker XMG CORE 16 (L23) | |
| Blender / v3.3 Classroom CPU | |
| Lenovo LOQ 16IRH8 | |
| HP Victus 16-r0077ng | |
| HP Victus 16-r0076TX | |
| Media NVIDIA GeForce RTX 4060 Laptop GPU (189 - 452, n=53) | |
| Lenovo Legion Slim 5 16APH8 | |
| Schenker XMG CORE 16 (L23) | |
| Lenovo Legion Pro 5 16IRX8 | |
| Alienware m16 R1 Intel | |
| Lenovo Legion 5 16IRX G9 | |
| Media della classe Gaming (122 - 565, n=103, ultimi 2 anni) | |
* ... Meglio usare valori piccoli
Prestazioni di gioco
In totale, le prestazioni di gioco del portatile sono ottime e nella fascia alta per un portatile RTX 4060. Tutti i giochi attuali possono essere eseguiti senza problemi in QHD e con i massimi dettagli, anche quelli più impegnativi come Cyberpunk 2077 o Modern Warfare 3. Solo il raytracing può causare alcuni problemi e sarebbe opportuno utilizzare la tecnologia di upscaling come il DLSS. Solo il raytracing potrebbe causare alcuni problemi e sarebbe opportuno utilizzare una tecnologia di upscaling come DLSS. Inoltre, le sue prestazioni di gioco rimangono del tutto stabili, anche durante le sessioni più lunghe. Ulteriori benchmark di gioco sono disponibili qui.
| The Witcher 3 - 1920x1080 Ultra Graphics & Postprocessing (HBAO+) | |
| Media della classe Gaming (104.7 - 240, n=7, ultimi 2 anni) | |
| Schenker XMG CORE 16 (L23) | |
| HP Victus 16-r0077ng | |
| Lenovo Legion Pro 5 16IRX8 | |
| Alienware m16 R1 Intel | |
| Lenovo LOQ 16IRH8 | |
| Lenovo Legion 5 16IRX G9 | |
| HP Victus 16-r0076TX | |
| Lenovo Legion Slim 5 16APH8 | |
| GTA V - 1920x1080 Highest AA:4xMSAA + FX AF:16x | |
| Media della classe Gaming (48.3 - 186.9, n=94, ultimi 2 anni) | |
| Lenovo Legion 5 16IRX G9 | |
| Lenovo Legion Pro 5 16IRX8 | |
| Schenker XMG CORE 16 (L23) | |
| Lenovo LOQ 16IRH8 | |
| HP Victus 16-r0077ng | |
| Lenovo Legion Slim 5 16APH8 | |
Witcher 3 FPS diagram
| basso | medio | alto | ultra | QHD | |
|---|---|---|---|---|---|
| GTA V (2015) | 186 | 182.8 | 120.2 | 89 | |
| The Witcher 3 (2015) | 229 | 97.2 | 83 | ||
| Dota 2 Reborn (2015) | 209 | 189.7 | 179.9 | 168.7 | |
| Final Fantasy XV Benchmark (2018) | 154.2 | 106.3 | 77.5 | ||
| X-Plane 11.11 (2018) | 180.8 | 171 | 130.9 | ||
| Far Cry 5 (2018) | 161 | 155 | 147 | 111 | |
| Strange Brigade (2018) | 243 | 210 | 130 | ||
| F1 2021 (2021) | 464 | 380 | 292 | 146.7 | 104.6 |
| F1 22 (2022) | 296 | 287 | 217 | 71.4 | 45.2 |
| F1 23 (2023) | 306 | 292 | 207 | 63.7 | 39.4 |
| Cyberpunk 2077 (2023) | 133.1 | 110.4 | 95.3 | 81.8 | 49.7 |
| Assassin's Creed Mirage (2023) | 93 | 72 | |||
| Call of Duty Modern Warfare 3 2023 (2023) | 134 | 121 | 92 | 86 | 58 |
Emissioni - rumorose ma fresche
Emissioni di rumore
Entrambe le ventole di Legion 5i 16 hanno molto lavoro da fare e se non si utilizza la modalità silenziosa, spesso girano durante le attività più semplici. Sotto carico elevato, il dispositivo diventa molto rumoroso, con 55 dB(A), ma ad essere onesti, i quasi 50 dB(A) che abbiamo misurato utilizzando la modalità bilanciata sono semplicemente troppo forti per giocare correttamente senza cuffie. Quindi, a seconda del gioco, potrebbe essere opportuno verificare le prestazioni in modalità silenziosa, poiché i suoi 35 dB(A) sono molto più confortevoli. Non abbiamo notato altri rumori elettronici provenienti dal nostro dispositivo di prova.
| Profilo energetico | 3DMark 06 | Witcher 3 | Cyberpunk 2077 Phantom Liberty | Test di stress |
|---|---|---|---|---|
| Modalità silenziosa | 34,6 dB(A) | 34,6 dB(A) | 30,4 dB(A) | 34,6 dB(A) |
| Modalità bilanciata | 34,6 dB(A) | 49,8 dB(A) | 49,8 dB(A) | 49,8 dB(A) |
| Modalità Performance | 45,5 dB(A) | 55,7 dB(A) | 53,1 dB(A) | 55,7 dB(A) |
Rumorosità
| Idle |
| 24 / 28.8 / 32 dB(A) |
| Sotto carico |
| 45.5 / 55.7 dB(A) |
 | ||
30 dB silenzioso 40 dB(A) udibile 50 dB(A) rumoroso |
||
min: | ||
| Lenovo Legion 5 16IRX G9 GeForce RTX 4060 Laptop GPU, i7-14650HX, Samsung PM9A1 MZVL21T0HCLR | Schenker XMG CORE 16 (L23) GeForce RTX 4070 Laptop GPU, R7 7840HS, Samsung 990 Pro 1 TB | HP Victus 16-r0077ng GeForce RTX 4070 Laptop GPU, i7-13700H, Kioxia XG8 KXG80ZNV1T02 | Lenovo LOQ 16IRH8 GeForce RTX 4060 Laptop GPU, i7-13620H, Solidigm SSDPFINW512GZL | Lenovo Legion Slim 5 16APH8 GeForce RTX 4060 Laptop GPU, R7 7840HS, SK hynix PC801 HFS512GEJ9X115N | HP Victus 16-r0076TX GeForce RTX 4050 Laptop GPU, i5-13500HX, SK hynix PC801 HFS512GEJ9X101N BF | Alienware m16 R1 Intel GeForce RTX 4060 Laptop GPU, i7-13700HX, Kioxia KXG70ZNV512G | Lenovo Legion Pro 5 16IRX8 GeForce RTX 4060 Laptop GPU, i7-13700HX, SK hynix PC801 HFS512GEJ9X115N | |
|---|---|---|---|---|---|---|---|---|
| Noise | 8% | 2% | 4% | 10% | 9% | 2% | 12% | |
| off /ambiente * (dB) | 24 | 23 4% | 25 -4% | 23 4% | 22.9 5% | 21.57 10% | 25 -4% | 23 4% |
| Idle Minimum * (dB) | 24 | 23 4% | 28 -17% | 23 4% | 23.1 4% | 23.68 1% | 25 -4% | 23.1 4% |
| Idle Average * (dB) | 28.8 | 28.48 1% | 29 -1% | 23 20% | 23.1 20% | 23.68 18% | 26 10% | 23.1 20% |
| Idle Maximum * (dB) | 32 | 28.48 11% | 30 6% | 27.66 14% | 27.7 13% | 23.68 26% | 27 16% | 26.6 17% |
| Load Average * (dB) | 45.5 | 30 34% | 43 5% | 53.62 -18% | 33.3 27% | 39.44 13% | 52 -14% | 34.7 24% |
| Witcher 3 ultra * (dB) | 53.1 | 54.12 -2% | 46 13% | 53.5 -1% | 54 -2% | 55.4 -4% | 51 4% | 47.6 10% |
| Load Maximum * (dB) | 55.7 | 54.12 3% | 48 14% | 53.5 4% | 54 3% | 55.37 1% | 53 5% | 54.8 2% |
* ... Meglio usare valori piccoli
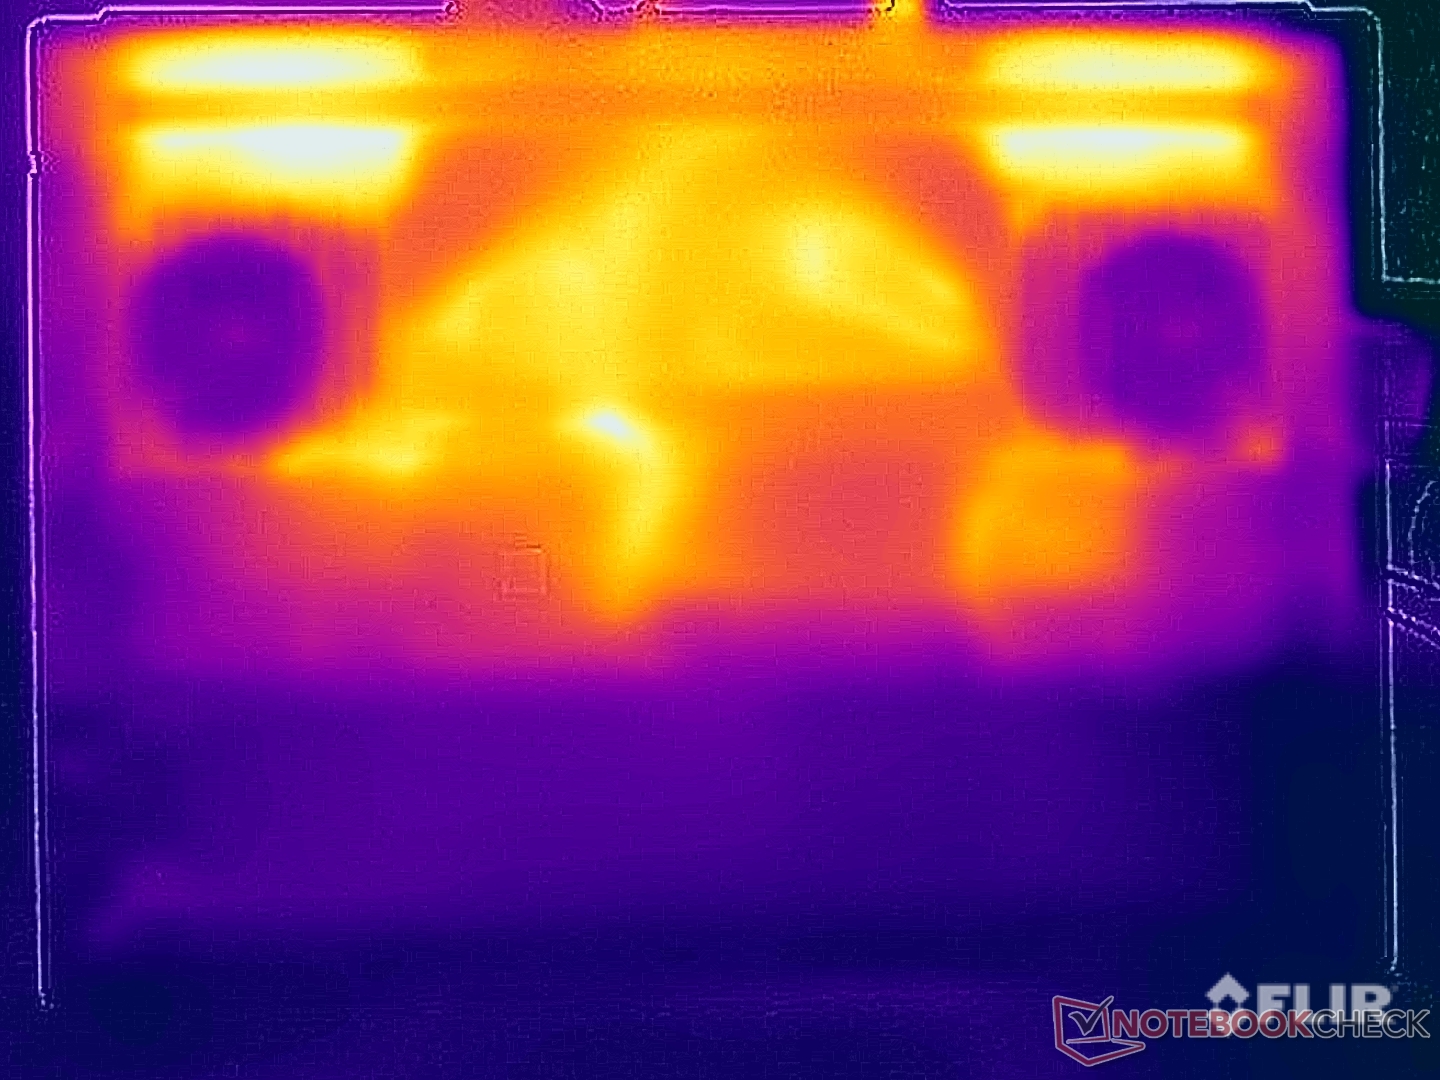
Temperatura
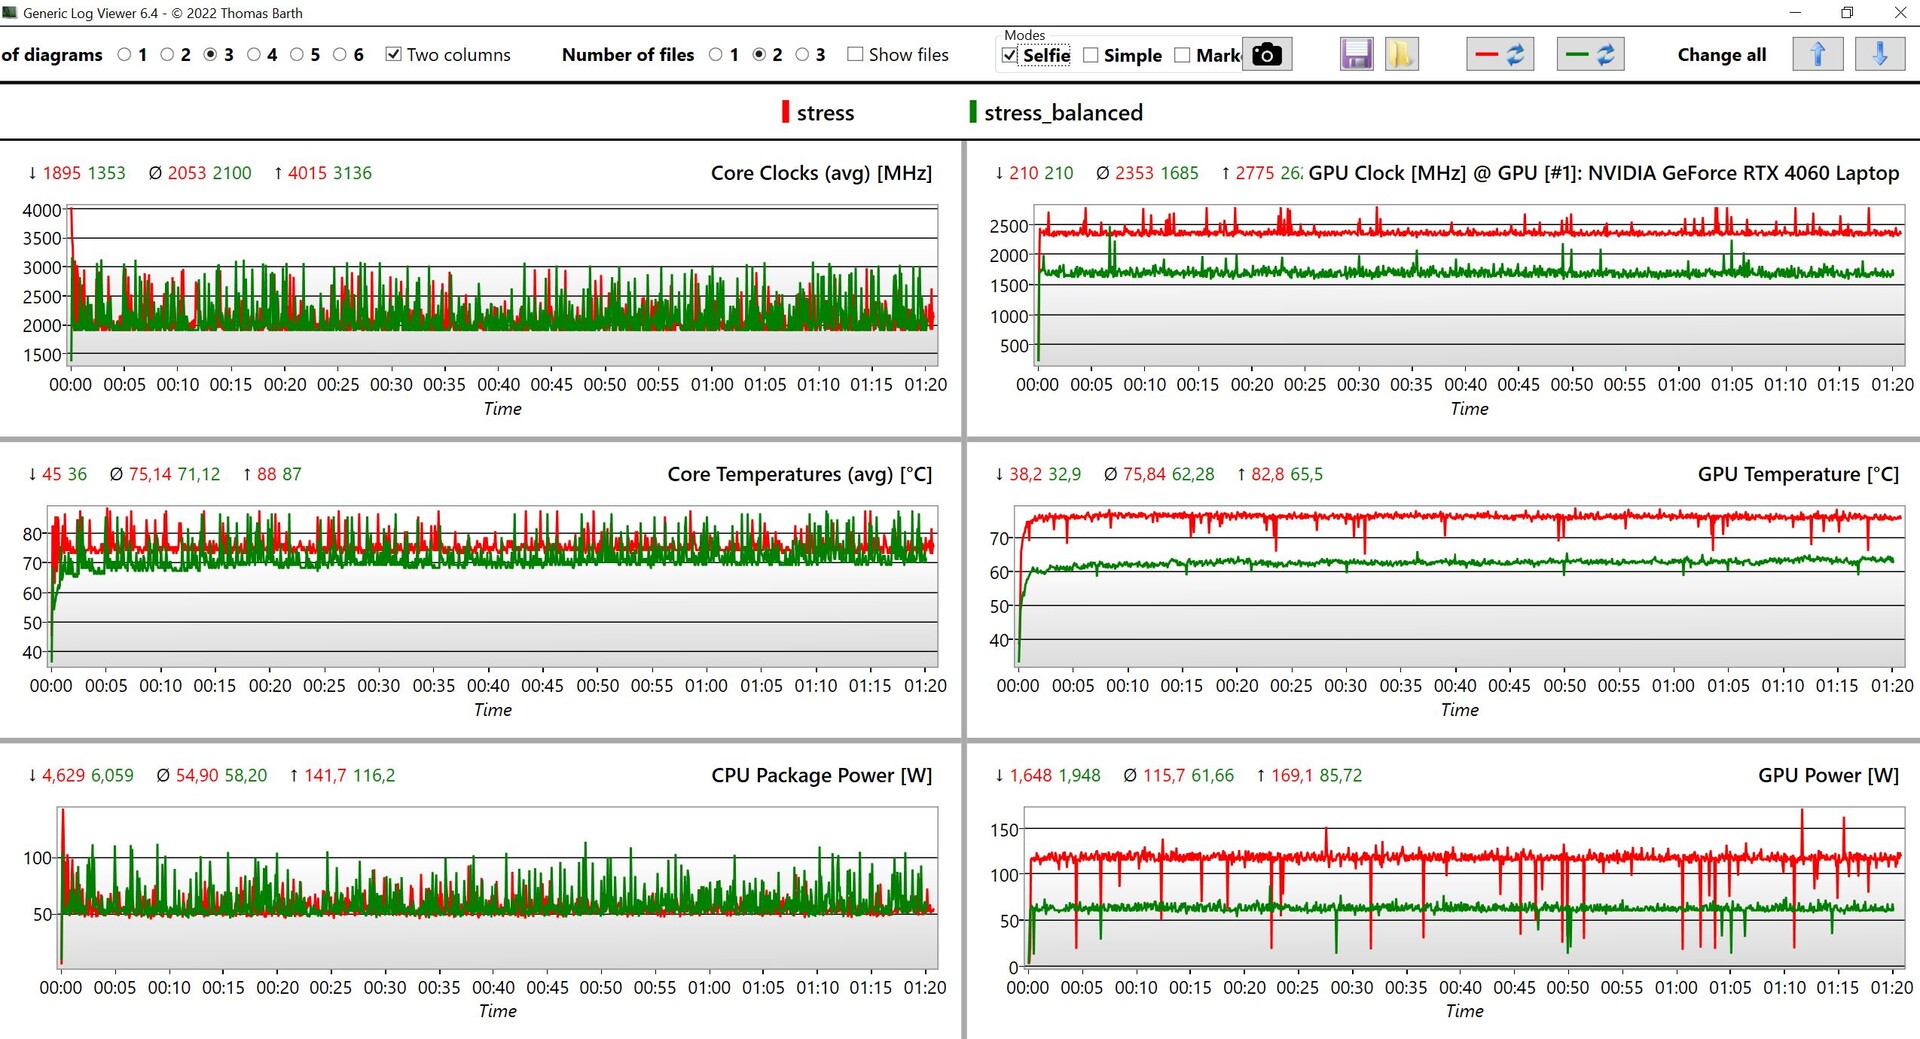
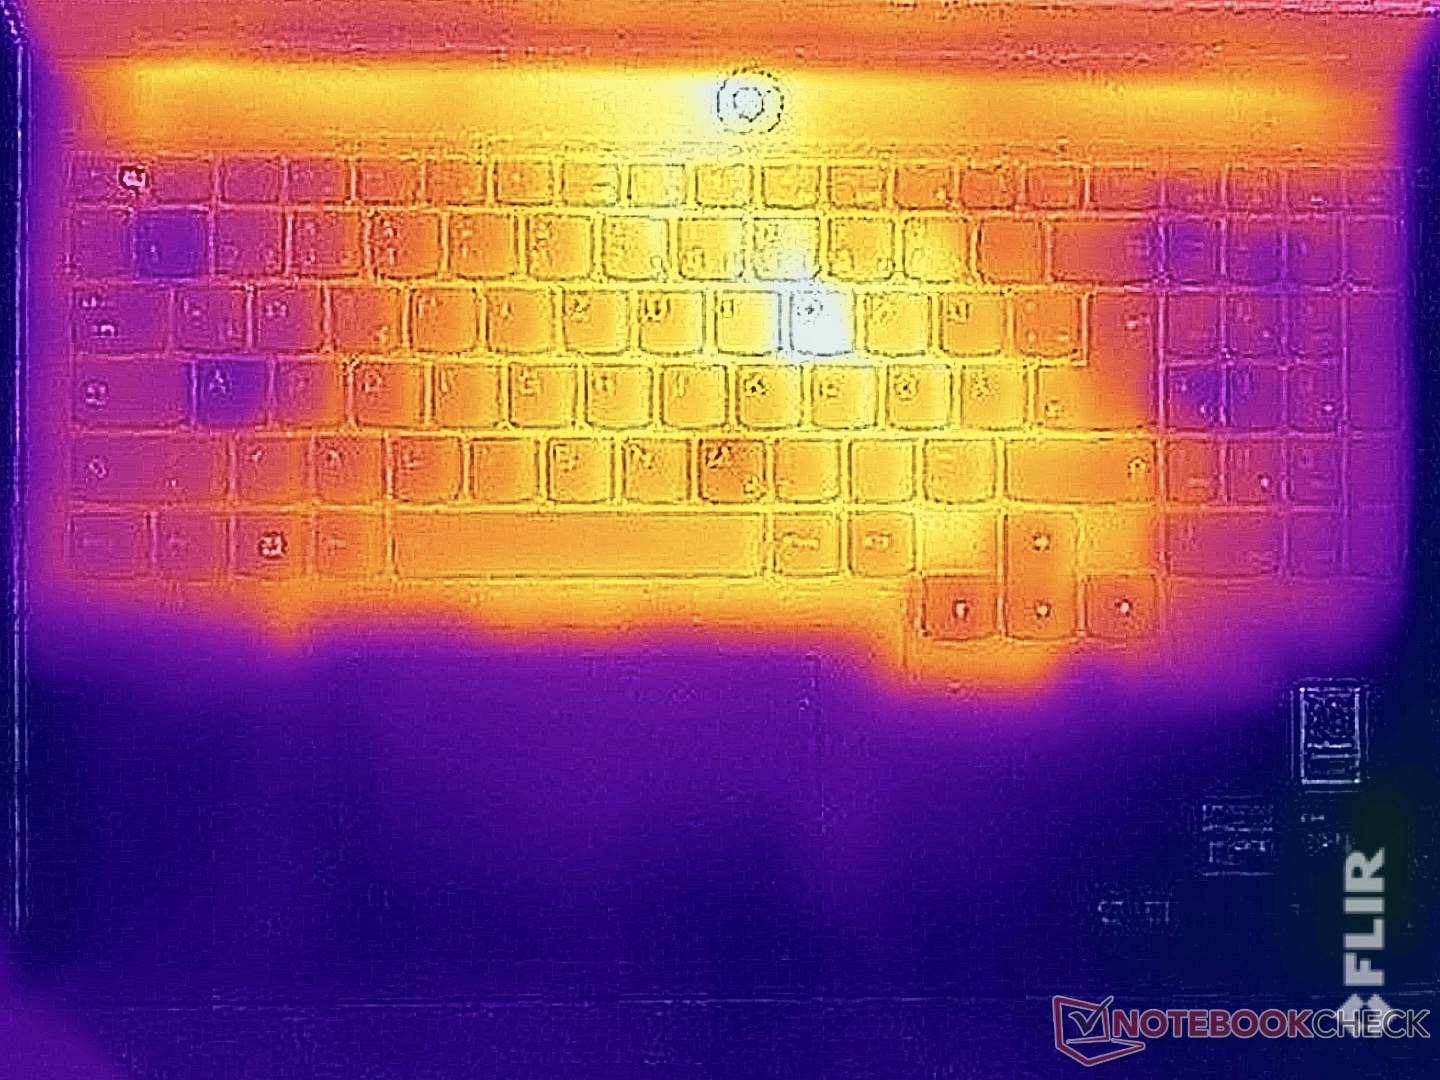
Alcuni punti del Legion si scaldano sensibilmente già in modalità idle, ma le sue basse temperature superficiali sotto carico ci hanno sorpreso. Anche durante lo stress test, abbiamo misurato solo poco più di 40 °C sulla parte superiore e sulla parte inferiore dell'unità base, abbiamo notato poco più di 43 °C. Si tratta di risultati superbi e non ci sono restrizioni quando si tratta di maneggiare il dispositivo.
Oltre a utilizzare la modalità prestazioni, abbiamo eseguito lo stress test utilizzando la modalità bilanciata e abbiamo raccolto i risultati nel seguente diagramma. In entrambi i profili, si può notare la fluttuazione del consumo del processore, ma la GPU rimane costante ed è qui che si nota la netta differenza tra i due profili. In modalità prestazioni, la GPU opera a 115 watt e in modalità bilanciata abbiamo misurato poco più di 60 watt.
(±) La temperatura massima sul lato superiore è di 40.4 °C / 105 F, rispetto alla media di 40.4 °C / 105 F, che varia da 21.2 a 68.8 °C per questa classe Gaming.
(±) Il lato inferiore si riscalda fino ad un massimo di 43.8 °C / 111 F, rispetto alla media di 43.2 °C / 110 F
(+) In idle, la temperatura media del lato superiore è di 28 °C / 82 F, rispetto alla media deld ispositivo di 33.9 °C / 93 F.
(±) Riproducendo The Witcher 3, la temperatura media per il lato superiore e' di 33.2 °C / 92 F, rispetto alla media del dispositivo di 33.9 °C / 93 F.
(+) I poggiapolsi e il touchpad sono piu' freddi della temperatura della pelle con un massimo di 26.9 °C / 80.4 F e sono quindi freddi al tatto.
(±) La temperatura media della zona del palmo della mano di dispositivi simili e'stata di 28.8 °C / 83.8 F (+1.9 °C / 3.4 F).
| Lenovo Legion 5 16IRX G9 Intel Core i7-14650HX, NVIDIA GeForce RTX 4060 Laptop GPU | Schenker XMG CORE 16 (L23) AMD Ryzen 7 7840HS, NVIDIA GeForce RTX 4070 Laptop GPU | HP Victus 16-r0077ng Intel Core i7-13700H, NVIDIA GeForce RTX 4070 Laptop GPU | Lenovo LOQ 16IRH8 Intel Core i7-13620H, NVIDIA GeForce RTX 4060 Laptop GPU | Lenovo Legion Slim 5 16APH8 AMD Ryzen 7 7840HS, NVIDIA GeForce RTX 4060 Laptop GPU | HP Victus 16-r0076TX Intel Core i5-13500HX, NVIDIA GeForce RTX 4050 Laptop GPU | Alienware m16 R1 Intel Intel Core i7-13700HX, NVIDIA GeForce RTX 4060 Laptop GPU | Lenovo Legion Pro 5 16IRX8 Intel Core i7-13700HX, NVIDIA GeForce RTX 4060 Laptop GPU | |
|---|---|---|---|---|---|---|---|---|
| Heat | -3% | -13% | -6% | 9% | -3% | -18% | -4% | |
| Maximum Upper Side * (°C) | 40.4 | 46 -14% | 51 -26% | 48 -19% | 40.6 -0% | 48 -19% | 49 -21% | 42.8 -6% |
| Maximum Bottom * (°C) | 43.8 | 44 -0% | 54 -23% | 59 -35% | 42 4% | 48 -10% | 48 -10% | 50 -14% |
| Idle Upper Side * (°C) | 30.3 | 32 -6% | 37 -22% | 28 8% | 27.8 8% | 29.6 2% | 40 -32% | 29.6 2% |
| Idle Bottom * (°C) | 35.3 | 33 7% | 29 18% | 28 21% | 26.6 25% | 30.2 14% | 39 -10% | 34 4% |
* ... Meglio usare valori piccoli
Altoparlanti
I due altoparlanti stereo (2 watt ciascuno) offrono solo un suono medio, sufficiente per alcuni video e musica di sottofondo. Tuttavia, non potrà beneficiare degli altoparlanti quando gioca, perché le ventole sono troppo rumorose.
Lenovo Legion 5 16IRX G9 analisi audio
(+) | gli altoparlanti sono relativamente potenti (84.4 dB)
Bassi 100 - 315 Hz
(-) | quasi nessun basso - in media 25.7% inferiori alla media
(±) | la linearità dei bassi è media (8.3% delta rispetto alla precedente frequenza)
Medi 400 - 2000 Hz
(+) | medi bilanciati - solo only 4.3% rispetto alla media
(+) | medi lineari (5.2% delta rispetto alla precedente frequenza)
Alti 2 - 16 kHz
(+) | Alti bilanciati - appena 1.9% dalla media
(+) | alti lineari (2.1% delta rispetto alla precedente frequenza)
Nel complesso 100 - 16.000 Hz
(±) | la linearità complessiva del suono è media (16.1% di differenza rispetto alla media
Rispetto alla stessa classe
» 39% di tutti i dispositivi testati in questa classe è stato migliore, 7% simile, 54% peggiore
» Il migliore ha avuto un delta di 6%, medio di 18%, peggiore di 132%
Rispetto a tutti i dispositivi testati
» 26% di tutti i dispositivi testati in questa classe è stato migliore, 5% similare, 69% peggiore
» Il migliore ha avuto un delta di 4%, medio di 23%, peggiore di 134%
Schenker XMG CORE 16 (L23) analisi audio
(±) | potenza degli altiparlanti media ma buona (79.4 dB)
Bassi 100 - 315 Hz
(-) | quasi nessun basso - in media 21.6% inferiori alla media
(±) | la linearità dei bassi è media (11.4% delta rispetto alla precedente frequenza)
Medi 400 - 2000 Hz
(±) | medi elevati - circa 5.4% superiore alla media
(+) | medi lineari (6.7% delta rispetto alla precedente frequenza)
Alti 2 - 16 kHz
(+) | Alti bilanciati - appena 2.3% dalla media
(+) | alti lineari (6.6% delta rispetto alla precedente frequenza)
Nel complesso 100 - 16.000 Hz
(±) | la linearità complessiva del suono è media (17.1% di differenza rispetto alla media
Rispetto alla stessa classe
» 46% di tutti i dispositivi testati in questa classe è stato migliore, 12% simile, 42% peggiore
» Il migliore ha avuto un delta di 6%, medio di 18%, peggiore di 132%
Rispetto a tutti i dispositivi testati
» 31% di tutti i dispositivi testati in questa classe è stato migliore, 8% similare, 61% peggiore
» Il migliore ha avuto un delta di 4%, medio di 23%, peggiore di 134%
Alienware m16 R1 Intel analisi audio
(+) | gli altoparlanti sono relativamente potenti (87 dB)
Bassi 100 - 315 Hz
(-) | quasi nessun basso - in media 24% inferiori alla media
(±) | la linearità dei bassi è media (13.5% delta rispetto alla precedente frequenza)
Medi 400 - 2000 Hz
(+) | medi bilanciati - solo only 1.4% rispetto alla media
(+) | medi lineari (3.3% delta rispetto alla precedente frequenza)
Alti 2 - 16 kHz
(+) | Alti bilanciati - appena 3.5% dalla media
(+) | alti lineari (4.6% delta rispetto alla precedente frequenza)
Nel complesso 100 - 16.000 Hz
(+) | suono nel complesso lineare (13.4% differenza dalla media)
Rispetto alla stessa classe
» 19% di tutti i dispositivi testati in questa classe è stato migliore, 7% simile, 74% peggiore
» Il migliore ha avuto un delta di 6%, medio di 18%, peggiore di 132%
Rispetto a tutti i dispositivi testati
» 14% di tutti i dispositivi testati in questa classe è stato migliore, 4% similare, 82% peggiore
» Il migliore ha avuto un delta di 4%, medio di 23%, peggiore di 134%
Gestione dell'energia
Consumo di energia
Non abbiamo notato grandi sorprese per quanto riguarda il consumo del dispositivo e abbiamo misurato un massimo di circa 20 watt in modalità idle, un valore accettabile visto il grande display e l'elevata luminosità. Durante lo stress test, il consumo massimo è stato brevemente di ~247 watt, ma si è subito stabilizzato a 230 watt. Di conseguenza, l'alimentatore da 230 watt sarà al limite se si utilizza la modalità prestazioni. In modalità bilanciata, il consumo del portatile si è stabilizzato a circa 180 watt.
| Off / Standby | |
| Idle | |
| Sotto carico |
|
Leggenda:
min: | |
| Lenovo Legion 5 16IRX G9 i7-14650HX, GeForce RTX 4060 Laptop GPU, Samsung PM9A1 MZVL21T0HCLR, IPS, 2560x1600, 16" | Schenker XMG CORE 16 (L23) R7 7840HS, GeForce RTX 4070 Laptop GPU, Samsung 990 Pro 1 TB, IPS, 2560x1600, 16" | HP Victus 16-r0077ng i7-13700H, GeForce RTX 4070 Laptop GPU, Kioxia XG8 KXG80ZNV1T02, IPS, 1920x1080, 16.1" | Lenovo LOQ 16IRH8 i7-13620H, GeForce RTX 4060 Laptop GPU, Solidigm SSDPFINW512GZL, IPS, 2560x1600, 16" | Lenovo Legion Slim 5 16APH8 R7 7840HS, GeForce RTX 4060 Laptop GPU, SK hynix PC801 HFS512GEJ9X115N, IPS, 2560x1600, 16" | HP Victus 16-r0076TX i5-13500HX, GeForce RTX 4050 Laptop GPU, SK hynix PC801 HFS512GEJ9X101N BF, IPS, 1920x1080, 16.1" | Alienware m16 R1 Intel i7-13700HX, GeForce RTX 4060 Laptop GPU, Kioxia KXG70ZNV512G, IPS, 2560x1600, 16" | Lenovo Legion Pro 5 16IRX8 i7-13700HX, GeForce RTX 4060 Laptop GPU, SK hynix PC801 HFS512GEJ9X115N, IPS, 2560x1600, 16" | Media NVIDIA GeForce RTX 4060 Laptop GPU | Media della classe Gaming | |
|---|---|---|---|---|---|---|---|---|---|---|
| Power Consumption | 18% | 21% | 4% | 21% | 2% | 3% | -27% | 14% | -2% | |
| Idle Minimum * (Watt) | 15.4 | 11 29% | 8 48% | 17.2 -12% | 9.4 39% | 16.12 -5% | 10 35% | 24.5 -59% | 11.5 ? 25% | 13 ? 16% |
| Idle Average * (Watt) | 19.7 | 15.2 23% | 13 34% | 19.3 2% | 15.5 21% | 20.47 -4% | 14 29% | 29.2 -48% | 16 ? 19% | 19 ? 4% |
| Idle Maximum * (Watt) | 20.7 | 16 23% | 22 -6% | 21.2 -2% | 24.4 -18% | 22.11 -7% | 21 -1% | 34.3 -66% | 20.3 ? 2% | 24.5 ? -18% |
| Load Average * (Watt) | 102.6 | 64 38% | 86 16% | 90 12% | 74.1 28% | 94.8 8% | 119 -16% | 98.7 4% | 92.9 ? 9% | 111.1 ? -8% |
| Witcher 3 ultra * (Watt) | 191.3 | 179 6% | 141.8 26% | 168 12% | 112.9 41% | 166.9 13% | 186.7 2% | 178.6 7% | ||
| Load Maximum * (Watt) | 246.6 | 280 -14% | 233 6% | 211 14% | 206.5 16% | 237 4% | 323 -31% | 249.6 -1% | 210 ? 15% | 260 ? -5% |
* ... Meglio usare valori piccoli
Power consumption Witcher 3 / stress test
Power consumption with external monitor
Tempi di esecuzione
Il Legion 5i 16 ha una batteria da 80 Wh, che è la capacità più piccola nel nostro campo di confronto. A sua volta, i suoi risultati non sono poi così male e a 150 cd/m² (61% della luminosità massima del nostro dispositivo di test), un video ha funzionato per circa 9,5 ore e il nostro test WLAN è durato circa 7,5 ore (~5,5 ore alla massima luminosità). Sotto carico, il portatile si spegne già dopo 46 minuti e un video HDR è stato riprodotto solo per 2:14 ore alla massima luminosità. Con 240 Hz selezionati, i tempi di esecuzione del nostro test WLAN sono scesi a 5:27 ore (150 cd/m²) e 4:33 ore (luminosità massima).
Una carica completa richiede 106 minuti con il dispositivo acceso, mentre l'80 % viene raggiunto dopo circa 60 minuti. All'interno dell'app Vantage, è disponibile anche un'opzione chiamata "ricarica express", che consente di caricare più velocemente il primo 60 %. Una carica completa richiede solo 69 minuti con questa modalità (80 % dopo 31 minuti).
| Lenovo Legion 5 16IRX G9 i7-14650HX, GeForce RTX 4060 Laptop GPU, 80 Wh | Schenker XMG CORE 16 (L23) R7 7840HS, GeForce RTX 4070 Laptop GPU, 99 Wh | HP Victus 16-r0077ng i7-13700H, GeForce RTX 4070 Laptop GPU, 83 Wh | Lenovo LOQ 16IRH8 i7-13620H, GeForce RTX 4060 Laptop GPU, 80 Wh | Lenovo Legion Slim 5 16APH8 R7 7840HS, GeForce RTX 4060 Laptop GPU, 80 Wh | HP Victus 16-r0076TX i5-13500HX, GeForce RTX 4050 Laptop GPU, 83 Wh | Alienware m16 R1 Intel i7-13700HX, GeForce RTX 4060 Laptop GPU, 86 Wh | Lenovo Legion Pro 5 16IRX8 i7-13700HX, GeForce RTX 4060 Laptop GPU, 80 Wh | Media della classe Gaming | |
|---|---|---|---|---|---|---|---|---|---|
| Autonomia della batteria | 73% | -4% | 13% | 23% | 17% | -17% | -34% | 24% | |
| H.264 (h) | 9.6 | 10.2 6% | 6.4 -33% | 7.7 -20% | 5.6 -42% | 8.32 ? -13% | |||
| WiFi v1.3 (h) | 7.4 | 8.4 14% | 7.1 -4% | 6.3 -15% | 7.1 -4% | 8.9 20% | 4.8 -35% | 3.4 -54% | 7.11 ? -4% |
| Load (h) | 0.8 | 2.4 200% | 1.5 88% | 1.2 50% | 1.2 50% | 1 25% | 0.7 -13% | 1.502 ? 88% | |
| Witcher 3 ultra (h) | 1.5 |
Pro
Contro
Verdetto - Il Legion 5i 16 punta tutto sulle prestazioni

Nel complesso, il nuovo Lenovo Legion 5i 16 ha fatto un'ottima impressione durante il nostro test. Lenovo si è concentrata sulle caratteristiche più importanti, offrendo componenti veloci in combinazione con un eccellente display IPS a 240 Hz, che rappresenta i colori in modo accurato già a partire dalla scatola e fa a meno del PWM. Le sue prestazioni di gioco sono ottime e si possono eseguire i giochi attuali alle risoluzioni e alle impostazioni più elevate, ma non si può fare a meno dell'upscaling DLSS quando si tratta di ray tracing. Il nuovo processore Raptor-Lake-HX non è assolutamente un miracolo di efficienza, ma le sue prestazioni sono buone.
Allo stesso tempo, l'unità di raffreddamento del portatile assicura che le sue prestazioni possano essere sfruttate in ogni momento. Inoltre, abbiamo apprezzato la diffusione di tutti i vari profili energetici e Lenovo offre agli utenti molte opzioni di personalizzazione per quanto riguarda le impostazioni della CPU e della GPU. Durante l'esecuzione dei giochi, il dispositivo rimane sorprendentemente fresco ma, a sua volta, entrambe le ventole diventano piuttosto rumorose, il che significa che le cuffie sono un po' indispensabili per le sessioni di gioco.
Ottime prestazioni e un impressionante display a 240 Hz: Legion 5i 16 di Lenovo è un gamer veloce di fascia media che pone le prestazioni in primo piano. Tuttavia, le sue funzioni AI sono solo un espediente per ora.
Il nuovo AI Engine+ di Lenovo, che dovrebbe migliorare le prestazioni di gioco con l'aiuto di un chip AI, non ha funzionato durante il nostro test. Potrebbe essere migliorato con un aggiornamento, ma per il momento è meglio attivare la modalità di prestazioni manuale. Ci sono alcuni punti che fanno capire che Lenovo ha risparmiato un po' di soldi, dato che il portatile non è dotato di Thunderbolt o di una porta Ethernet da 2,5-GBit/s.
Al prezzo di 1.610 dollari, il nuovo Legion 5i 16 non è un affare e per questo prezzo si possono già trovare modelli con RTX 4070 Laptop (in particolare i laptop del 2023), ma anche in questo caso non si può evitare di dover scendere a certi compromessi di visualizzazione.
Prezzo e disponibilità
Il nuovo Lenovo Legion 5i 16IRX G9 può essere acquistato direttamente dal sito web di Lenovo al prezzo di 1.609,99 dollari.
Lenovo Legion 5 16IRX G9
- 01/29/2024 v7 (old)
Andreas Osthoff
Transparency
La selezione dei dispositivi da recensire viene effettuata dalla nostra redazione. Il campione di prova è stato fornito all'autore come prestito dal produttore o dal rivenditore ai fini di questa recensione. L'istituto di credito non ha avuto alcuna influenza su questa recensione, né il produttore ne ha ricevuto una copia prima della pubblicazione. Non vi era alcun obbligo di pubblicare questa recensione. In quanto società mediatica indipendente, Notebookcheck non è soggetta all'autorità di produttori, rivenditori o editori.
Ecco come Notebookcheck esegue i test
Ogni anno, Notebookcheck esamina in modo indipendente centinaia di laptop e smartphone utilizzando procedure standardizzate per garantire che tutti i risultati siano comparabili. Da circa 20 anni sviluppiamo continuamente i nostri metodi di prova e nel frattempo stabiliamo gli standard di settore. Nei nostri laboratori di prova, tecnici ed editori esperti utilizzano apparecchiature di misurazione di alta qualità. Questi test comportano un processo di validazione in più fasi. Il nostro complesso sistema di valutazione si basa su centinaia di misurazioni e parametri di riferimento ben fondati, che mantengono l'obiettività.Price comparison

