Recensioni Notebook con NVIDIA GeForce RTX 4070 Laptop GPU la scheda grafica
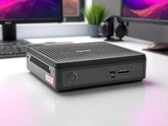
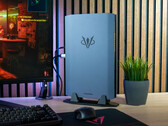
Recensione di Zotac Zbox Magnus EN374070 - Un mini PC da gioco in un case da 2,65 litri con Nvidia GeForce RTX 4070
Zotac Zbox Magnus EN374070 combina un hardware potente con un ingombro ridotto: L'Intel Core i7-13700HX e la GPU Nvidia GeForce RTX 4070 Laptop promettono prestazioni potenti per il gioco e l'uso quotidiano. Durante il nostro test, abbiamo esaminato le sue prestazioni, le emissioni acustiche e il consumo energetico, e abbiamo dimostrato se il mini PC può tenere il passo con la concorrenza.
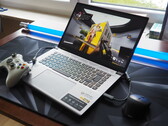
Intel Core i7-13700HX, NVIDIA GeForce RTX 4070 Laptop GPU, 1.6 kgRecensione del portatile MSI Katana A17 AI: Una grafica potente mortificata da un display debole
Katana A17 è un'alternativa più economica alle serie GE, GS o GT, pur offrendo eccellenti prestazioni grafiche con la sua GPU RTX 4070 da 105 W GeForce. Sfortunatamente, il suo pannello da 1080p manca di colori sRGB completi, tempi di risposta rapidi e supporto G-Sync.
AMD Ryzen 7 8845HS, NVIDIA GeForce RTX 4070 Laptop GPU, 17.3", 2.7 kgRecensione del laptop MSI Katana A15 AI: gamer RTX 4070 penalizzato dalle misure di risparmio
MSI si avventura nel competitivo settore dei laptop da gioco di fascia media con il Katana A15 AI. Questo laptop da 15 pollici è dotato di un potente processore Ryzen e di una GeForce RTX 4060 o RTX 4070 - e delude enormemente in un'area cruciale.
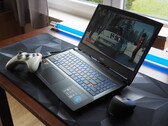
AMD Ryzen 9 8945HS, NVIDIA GeForce RTX 4070 Laptop GPU, 15.6", 2.3 kgRecensione dell'Acer Predator Triton Neo 16: Un laptop premium con RTX 4070 per gamers e creators
Mentre il Nitro V 16 che abbiamo testato di recente ci ha impressionato solo in misura limitata a causa del suo display scadente, il Predator Triton Neo 16 ha fatto una figura molto migliore. Abbiamo messo alla prova il gamer da 16 pollici con una CPU Meteor Lake e una RTX 4070 di GeForce.
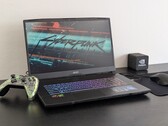
Intel Core Ultra 9 185H, NVIDIA GeForce RTX 4070 Laptop GPU, 16", 2 kgRecensione del Minisforum AtomMan G7 Ti: portatile gaming senza schermo come alternativa salvaspazio al PC desktop
Minisforum AtomMan G7 Ti promette prestazioni desktop in un formato compatto. Dotato del potente Intel Core i9-14900HX e della GPU per laptop Nvidia GeForce RTX 4070, si rivolge a giocatori, creativi e professionisti che hanno bisogno delle massime prestazioni in uno spazio minimo. In questo test, esaminiamo da vicino il mini PC e verifichiamo se è all'altezza delle alte aspettative.
Intel Core i9-14900HX, NVIDIA GeForce RTX 4070 Laptop GPU, 2.6 kgMSI Sword 16 HX B14VGKG: Intel Core i7-14700HX, 16.00", 2.3 kg
recensione » Recensione del portatile MSI Sword 16 HX: Una potenza di gioco soffocata da uno schermo insignificante
Maingear ML-16 MK2: Intel Core Ultra 7 155H, 16.00", 2.1 kg
recensione » Recensione del laptop Maingear ML-16 MK2: prestante GeForce RTX 4070 a un prezzo decente
Acer Predator Helios Neo 14 (2024): Intel Core Ultra 9 185H, 14.50", 1.9 kg
recensione » Recensione dell'Acer Predator Helios Neo 14 (2024): un portatile RTX 4070 con una elevata autonomia
Asus ROG NUC 14-90AS0051: Intel Core Ultra 9 185H, 2.6 kg
recensione » Recensione del mini PC da gioco Asus ROG NUC: Intel Core Ultra 9 185H e Nvidia GeForce RTX 4070 in un case da 2,5 litri
Asus ProArt P16 H7606WI: AMD Ryzen AI 9 HX 370, 16.00", 1.8 kg
recensione » Recensione del portatile Asus ProArt P16 - AMD Zen 5 incontra RTX 4070 e OLED 4K
Asus ProArt PX13 HN7306: AMD Ryzen AI 9 HX 370, 13.30", 1.4 kg
recensione » Analisi della CPU AMD Zen 5 Strix Point - Ryzen AI 9 HX 370 contro Intel Core Ultra, Apple M3 e Qualcomm Snapdragon X Elite
recensione » Recensione dell'Asus ProArt PX13 - Il 2-in-1 da 13,3 pollici più veloce al mondo grazie al laptop AMD Zen 5 e RTX 4070
Schenker XMG Pro 16 Studio (Mid 24): Intel Core i9-14900HX, 16.00", 2.3 kg
recensione » Recensione dell'XMG Pro 16 Studio (Mid 24): Core i9 e RTX 4070 per gamers e creators
HP Omen 17-db0079ng: AMD Ryzen 7 8845HS, 17.30", 2.8 kg
recensione » Recensione dell'HP Omen 17 (2024): RTX 4070 e Ryzen 7 mostrano la loro grandezza in questo portatile gaming
Acer Predator Helios Neo 16 (2024): Intel Core i7-14700HX, 16.00", 2.6 kg
recensione » Recensione dell'Acer Predator Helios Neo 16 (2024): Computer portatile per il gaming con RTX 4070 e pannello DCI-P3
Schenker XMG Fusion 15 (Early 24): Intel Core i9-14900HX, 15.30", 2.1 kg
recensione » Recensione dell'XMG Fusion 15 (Early 24): Un portatile RTX 4070 compatto per gamers e creators
Lenovo Yoga Pro 9 16IMH9: Intel Core Ultra 9 185H, 16.00", 2.1 kg
recensione » Recensione del laptop Lenovo Yoga Pro 9i 16 G9: MiniLED con 1200 nit e Core Ultra 9
Lenovo Legion 7 16 IRX G9: Intel Core i9-14900HX, 16.00", 2.3 kg
recensione » Recensione del portatile Lenovo Legion 7 16 G9 - Una macchina gaming con display 3.2K, CPU HX e RTX 4070 overcloccata
Aorus 16X 2024: Intel Core i9-14900HX, 16.00", 2.3 kg
recensione » Recensione dell'Aorus 16X (2024): Core i9 e RTX 4070 per US$2.000
Dell XPS 16 9640: Intel Core Ultra 7 155H, 16.30", 2.3 kg
recensione » Recensione del Dell XPS 16 9640 - un portatile multimediale con OLED 4K e una fastidiosa touch bar
Lenovo Legion Pro 5 16IRX9: Intel Core i9-14900HX, 16.00", 2.5 kg
recensione » Recensione del computer portatile Lenovo Legion Pro 5 16IRX9: Ottime prestazioni, ma un po' pesante
Alienware m16 R2: Intel Core Ultra 7 155H, 16.00", 2.5 kg
recensione » Recensione del computer portatile Alienware m16 R2: Cambiamenti grandi e rischiosi
Razer Blade 14 RZ09-0508: AMD Ryzen 9 8945HS, 14.00", 1.9 kg
recensione » Recensione del portatile Razer Blade 14 2024: A prova di futuro con Ryzen AI
HP Omen Transcend 16-u1095ng: Intel Core i9-14900HX, 16.00", 2.3 kg
recensione » Recensione del notebook HP Omen Transcend 16 (2024): Una macchina per il gaming con RTX 4070 e un display OLED
Asus ROG Zephyrus G14 2024 GA403U: AMD Ryzen 9 8945HS, 14.00", 1.5 kg
recensione » Recensione dell'Asus ROG Zephyrus G14 2024 - Il portatile gaming/multimedia con Ryzen 8000 e G-Sync OLED
Asus ROG Zephyrus G16 2024 GU605M: Intel Core Ultra 7 155H, 16.00", 1.8 kg
recensione » Recensione dell'Asus ROG Zephyrus G16 2024 - Il portatile da gaming ora con G-Sync OLED e Intel Meteor Lake
Asus TUF Gaming A17 FA707XI-NS94: AMD Ryzen 9 7940HS, 17.30", 2.5 kg
recensione » Recensione del computer portatile Asus TUF Gaming A17 FA707XI: GeForce RTX 4070 da 140 W per $1400
MSI Stealth 16 Mercedes-AMG Motorsport A13VG: Intel Core i9-13900H, 16.00", 1.9 kg
recensione » Recensione dell'MSI Stealth 16 Mercedes-AMG Motorsport: Auto da corsa mobile con display OLED
Schenker XMG Pro 16 Studio (Mid 23): Intel Core i9-13900H, 16.00", 2.6 kg
recensione » Recensione dell'XMG Pro 16 Studio (Mid 23): Il portatile RTX 4070 per gamers e creators
Schenker XMG CORE 16 (L23): AMD Ryzen 7 7840HS, 16.00", 2.4 kg
recensione » Recensione del portatile gaming SCHENKER XMG Core 16 - Un vero concorrente del Lenovo Legion Pro 5 16
HP Victus 16-r0077ng: Intel Core i7-13700H, 16.10", 2.4 kg
recensione » Recensione del portatile HP Victus 16: gamer Full HD con RTX 4070
HP Omen 16-xf0376ng: AMD Ryzen 7 7840HS, 16.10", 2.4 kg
recensione » Recensione del portatile HP Omen 16: Una buona scelta per i gamers anche con Zen 4
Acer Nitro 17 AN17-41-R9LN: AMD Ryzen 7 7735HS, 17.30", 3 kg
recensione » Recensione dell'Acer Nitro 17 Ryzen edition: portatile per il gaming QHD con RTX 4070
Aorus 15 BSF: Intel Core i7-13700H, 15.60", 2.4 kg
recensione » Recensione dell'Aorus 15 BSF: gaming laptop QHD con RTX 4070 e ottima autonomia
HP Omen Transcend 16: Intel Core i9-13900HX, 16.00", 2.3 kg
recensione » Recensione del portatile HP Omen Transcend 16: Più di una piccola differenza di nome
Schenker VISION 16 Pro (M23): Intel Core i7-13700H, 16.00", 1.6 kg
recensione » Recensione dello Schenker Vision 16 Pro 2023: un pacchetto leggero e potente da 1.6 kg con RTX 4070 Laptop
MSI Pulse 17 B13VGK: Intel Core i7-13700H, 17.30", 2.7 kg
recensione » Recensione del portatile gaming MSI Pulse 17 B13V: Con ali silenziose
MSI Stealth 16 Studio A13VG: Intel Core i7-13700H, 16.00", 2 kg
recensione » Recensione del laptop MSI Stealth 16 Studio: Un dispositivo da 16 pollici, estremamente leggero, con Core i7 e RTX 4070 per gamers e creators
Lenovo Legion Slim 7i 16 Gen 8: Intel Core i9-13900H, 16.00", 2.1 kg
recensione » Recensione del laptop Lenovo Legion Slim 7i 16 Gen 8: Più sottile del Razer Blade 16
Asus ProArt Studiobook 16 OLED H7604: Intel Core i9-13980HX, 16.00", 2.4 kg
recensione » Recensione dell'Asus ProArt Studiobook 16 OLED: Laptop multimediale con prestazioni della CPU estreme
Razer Blade 14 RTX 4070: AMD Ryzen 9 7940HS, 14.00", 1.8 kg
recensione » Recensione del portatile Razer Blade 14 Zen 4: Tanti cambiamenti che contano
Acer Nitro 16 AN16-41: AMD Ryzen 7 7735HS, 16.00", 2.7 kg
recensione » Recensione dell'Acer Nitro 16 AN16-41: Un portatile gaming RTX 4070 con una buona durata della batteria
Schenker XMG Focus 17 (E23): Intel Core i9-13900HX, 17.30", 2.9 kg
recensione » Recensione dello Schenker XMG Focus 17 (E23): un portatile gaming con RTX 4070 che non lesina sulle prestazioni
Asus Zenbook Pro 14 OLED UX6404VI: Intel Core i9-13900H, 14.50", 1.7 kg
recensione » Recensione del portatile Asus Zenbook Pro 14 OLED: Rivale del MacBook Pro con display OLED da 120 Hz
Dell XPS 17 9730 RTX 4070: Intel Core i7-13700H, 17.00", 2.5 kg
recensione » Recensione del portatile Dell XPS 17 9730: un mostro del multimedia con GeForce RTX 4070
Lenovo Legion Pro 5 16ARX8: AMD Ryzen 7 7745HX, 16.00", 2.5 kg
recensione » Recensione del laptop Lenovo Legion Pro 5 16 Gen 8: Debutto delle prestazioni della Ryzen 7 7745HX
Samsung Galaxy Book3 Ultra 16, i9-13900H RTX 4070: Intel Core i9-13900H, 16.00", 1.8 kg
recensione » Recensione del Samsung Galaxy Book3 Ultra 16 con RTX 4070: Prestazioni grafiche elevate in un notebook di tipo business
Medion Erazer Major X20: Intel Core i9-13900HX, 16.00", 2.4 kg
recensione » Recensione del Medion Erazer Major X20: Notebook per il gaming con RTX 4070 e hardware solido
Dell XPS 15 9530 RTX 4070: Intel Core i7-13700H, 15.60", 1.9 kg
recensione » Recensione del laptop Dell XPS 15 9530 RTX 4070: Impressionante e insoddisfacente al tempo stesso
Asus ROG Flow Z13 ACRNM: Intel Core i9-13900H, 13.40", 1.7 kg
recensione » Recensione dell'Asus ROG Flow Z13 ACRNM - Laptop convertibile per il gaming con RTX 4070
Aorus 15X ASF: Intel Core i7-13700HX, 15.60", 2.3 kg
recensione » Recensione dell'Aorus 15X ASF: Laptop per il gaming con potenza e resistenza e una RTX 4070
Asus ROG Strix G17 G713PI: AMD Ryzen 9 7945HX, 17.30", 2.8 kg
recensione » Analisi dell'AMD Ryzen 9 7945HX - La Zen4 Dragon Range è più veloce e più efficiente dell'Intel Raptor Lake-HX
Uniwill GM6PX7X RTX 4070: Intel Core i7-13700HX, 16.00", 2.2 kg
recensione » Debutto delle prestazioni del Core i7-13700HX: Recensione del portatile Uniwill GM6PX7X IDX
Asus ROG Strix G17 G713PI: AMD Ryzen 9 7945HX, 17.30", 2.8 kg
recensione » Asus ROG Strix G17 G713PI: portatile gaming che convince nel test con il nuovo Ryzen 9
Gigabyte AERO 16 OLED BSF: Intel Core i9-13900H, 16.00", 2.1 kg
recensione » Recensione del Gigabyte AERO 16 OLED: portatile sottile con RTX 4070 efficiente per gamers e creators
Asus ROG Strix G18 G814JI: Intel Core i7-13650HX, 18.00", 3 kg
recensione » Recensione del portatile Asus ROG Strix G18 G814JI: Luci e ombre con il computer per il gaming da 18 pollici
Razer Blade 18 RTX 4070: Intel Core i9-13950HX, 18.00", 3 kg
recensione » Recensione del portatile Razer Blade 18: Più piccolo di molti portatili gaming da 17 pollici
Schenker XMG Neo 17 2023 Engineering Sample: Intel Core i9-13900HX
recensione » Analisi dei laptop GeForce RTX 4070, 4060 e 4050 - Le nuove GPU per laptop mainstream di Nvidia in esame
MSI Creator A16 AI+ A3XVFG: AMD Ryzen AI 9 365, 16.00", 2.1 kg
Recensioni esterne » MSI Creator A16 AI+ A3XVFG
MSI Katana 15 B13VGK, i7-13700H: Intel Core i7-13700H, 15.60", 2.3 kg
Recensioni esterne » MSI Katana 15 B13VGK, i7-13700H
HP Victus 16-s1000: AMD Ryzen 7 8845HS, 16.10", 2.3 kg
Recensioni esterne » HP Victus 16-s1000
Tulpar 6 V3.2.2: Intel Core i7-13700HX, 16.00", 2.3 kg
Recensioni esterne » Tulpar 6 V3.2.2
MSI Creator A16 AI+ A3HVGG: AMD Ryzen AI 9 365, 16.00", 2.1 kg
Recensioni esterne » MSI Creator A16 AI+ A3HVGG
Lenovo Legion 5 16IRX9, i7-14700HX: Intel Core i7-14700HX, 6.00", 2.5 kg
Recensioni esterne » Lenovo Legion 5 16IRX9, i7-14700HX
MSI Prestige 16 AI Studio B1VGG: Intel Core Ultra 9 185H, 16.00", 1.6 kg
Recensioni esterne » MSI Prestige 16 AI Studio B1VGG
MSI Sword 16 HX B14VGKG, i7-14650HX: Intel Core i7-14650HX, 16.00", 2.3 kg
Recensioni esterne » MSI Sword 16 HX B14VGKG, i7-14650HX
MSI Pulse 17 AI C1VGKG: Intel Core Ultra 7 155H, 17.00", 2.8 kg
Recensioni esterne » MSI Pulse 17 AI C1VGKG
MSI Stealth A16 AI+ A3XVGG: AMD Ryzen AI 9 365, 16.00", 2.1 kg
Recensioni esterne » MSI Stealth A16 AI+ A3XVGG
MSI Stealth 16 AI Studio A1VGG, Ultra 7 155H: Intel Core Ultra 7 155H, 16.00", 2 kg
Recensioni esterne » MSI Stealth 16 AI Studio A1VGG, Ultra 7 155H
Asus ROG Zephyrus G16 GA605WI: AMD Ryzen AI 9 HX 370, 16.00", 1.9 kg
Recensioni esterne » Asus ROG Zephyrus G16 GA605WI
Acer Predator Helios Neo 14 (2024): Intel Core Ultra 9 185H, 14.50", 1.9 kg
Recensioni esterne » Acer Predator Helios Neo 14 (2024)
Asus TUF Gaming F15 FX507VI: Intel Core i7-13620H, 15.60", 2.2 kg
Recensioni esterne » Asus TUF Gaming F15 FX507VI
HP Omen Transcend 14-fb: Intel Core Ultra 7 155H, 14.00", 1.6 kg
Recensioni esterne » HP Omen Transcend 14-fb
MSI Stealth 16 AI Studio A1VGG: Intel Core Ultra 9 185H, 16.00", 2 kg
Recensioni esterne » MSI Stealth 16 AI Studio A1VGG
Asus ProArt P16 H7606WI: AMD Ryzen AI 9 HX 370, 16.00", 1.8 kg
Recensioni esterne » Asus ProArt P16 H7606WI
MSI Creator M16 HX C14VGG: Intel Core i9-14900HX, 16.00", 2.4 kg
Recensioni esterne » MSI Creator M16 HX C14VGG
Aorus 16X 9SG: Intel Core i7-13650HX, 16.00", 2.3 kg
Recensioni esterne » Aorus 16X 9SG
HP Omen 17-db0079ng: AMD Ryzen 7 8845HS, 17.30", 2.8 kg
Recensioni esterne » HP Omen 17-db0079ng
Lenovo Legion 7 16IRX9, i7-14700HX: Intel Core i7-14700HX, 16.00", 2.2 kg
Recensioni esterne » Lenovo Legion 7 16IRX9, i7-14700HX
Asus ProArt PX13 HN7306: AMD Ryzen AI 9 HX 370, 13.30", 1.4 kg
Recensioni esterne » Asus ProArt PX13 HN7306
Maingear ML-16 MK2: Intel Core Ultra 7 155H, 16.00", 2.1 kg
Recensioni esterne » Maingear ML-16 MK2
Schenker XMG Fusion 15 (Early 24): Intel Core i9-14900HX, 15.30", 2.1 kg
Recensioni esterne » SCHENKER XMG Fusion 15 (Early 24)
Acer Nitro 16 AN16-42: AMD Ryzen 7 8845HS, 16.00", 2.7 kg
Recensioni esterne » Acer Nitro 16 AN16-42
HP Omen 16-wf0000: Intel Core i7-13650HX, 16.10", 2.4 kg
Recensioni esterne » HP Omen 16-wf0000
Acer Predator Triton Neo 16 PTN16-51, RTX 4070: Intel Core Ultra 9 185H, 16.00", 2.1 kg
Recensioni esterne » Acer Predator Triton Neo 16 PTN16-51, RTX 4070
Medion Erazer Beast X40 2024, RTX 4070: Intel Core i9-14900HX, 17.00", 2.9 kg
Recensioni esterne » Medion Erazer Beast X40 2024, RTX 4070
Acer Swift X OLED SFX14-72G, RTX 4070: Intel Core Ultra 7 155H, 14.50", 1.6 kg
Recensioni esterne » Acer Swift X OLED SFX14-72G, RTX 4070
MSI Katana A17 AI B8VG: AMD Ryzen 9 8945HS, 17.30", 2.7 kg
Recensioni esterne » MSI Katana A17 AI B8VG
Medion Erazer Deputy P60: Intel Core i7-12650H, 15.60", 2.1 kg
Recensioni esterne » Medion Erazer Deputy P60
Acer Nitro 17 AN17-41-R3S4: AMD Ryzen 9 7940HS, 17.30", 3.1 kg
Recensioni esterne » Acer Nitro 17 AN17-41-R3S4
Asus ROG Strix G16 G614JZR: Intel Core i9-14900HX, 16.00", 2.8 kg
Recensioni esterne » Asus ROG Strix G16 G614JZR
HP Victus 16-r1000: Intel Core i7-14700HX, 16.10", 2.3 kg
Recensioni esterne » HP Victus 16-r1000
MSI Katana A15 AI B8VG: AMD Ryzen 9 8945HS, 15.60", 2.3 kg
Recensioni esterne » MSI Katana A15 AI B8VG
Asus ROG Strix G18 G814JIR: Intel Core i9-14900HX, 18.00", 3 kg
Recensioni esterne » Asus ROG Strix G18 G814JIR
Asus TUF Gaming A16 FA608: AMD Ryzen AI 9 HX 370, 16.00", 2.2 kg
Recensioni esterne » Asus TUF Gaming A16 FA608
Asus ROG Strix G16 G614JIR: Intel Core i9-14900HX, 16.00", 2.8 kg
Recensioni esterne » Asus ROG Strix G16 G614JIR
MSI Pulse 16 AI C1VGKG: Intel Core Ultra 9 185H, 16.00", 2.5 kg
Recensioni esterne » MSI Pulse 16 AI C1VGKG
Acer Predator Helios Neo 14 PHN14-51: Intel Core Ultra 7 155H, 14.50", 1.9 kg
Recensioni esterne » Acer Predator Helios Neo 14 PHN14-51
MSI Stealth 14 AI Studio A1VGG: Intel Core Ultra 9 185H, 14.00", 1.7 kg
Recensioni esterne » MSI Stealth 14 AI Studio A1VGG
MSI Sword 16 HX B14VGKG: Intel Core i7-14700HX, 16.00", 2.3 kg
Recensioni esterne » MSI Sword 16 HX B14VGKG
MSI Sword 17 HX B14VGKG: Intel Core i7-14700HX, 17.00", 2.6 kg
Recensioni esterne » MSI Sword 17 HX B14VGKG
Lenovo Legion 7 16IRX9, i9-14900HX: Intel Core i9-14900HX, 16.00", 2.2 kg
Recensioni esterne » Lenovo Legion 7 16IRX9, i9-14900HX
Acer Nitro 16 AN16-41-R6KQ: AMD Ryzen 7 7840HS, 16.00", 2.7 kg
Recensioni esterne » Acer Nitro 16 AN16-41-R6KQ
Samsung Galaxy Book4 Ultra, RTX 4070: Intel Core Ultra 9 185H, 16.00", 1.9 kg
Recensioni esterne » Samsung Galaxy Book4 Ultra, RTX 4070
Lenovo Legion Slim 5 16AHP9: AMD Ryzen 7 8845HS, 16.00", 2.3 kg
Recensioni esterne » Lenovo Legion Slim 5 16AHP9
Lenovo Legion 5 16IRX9, i7-14650HX: Intel Core i7-14650HX, 16.00", 2.3 kg
Recensioni esterne » Lenovo Legion 5 16IRX9, i7-14650HX
Asus ROG Zephyrus G16 GU605MI, Ultra 9 185H: Intel Core Ultra 9 185H, 16.00", 1.8 kg
Recensioni esterne » Asus ROG Zephyrus G16 GU605MI, Ultra 9 185H
Asus TUF Gaming A16 FA607PI: AMD Ryzen 9 7845HX, 16.00", 2.3 kg
Recensioni esterne » Asus TUF Gaming A16 FA607PI
Dell XPS 16 9640, Ultra 7 165H RTX 4070: Intel Core Ultra 7 165H, 16.30", 2.1 kg
Recensioni esterne » Dell XPS 16 9640, Ultra 7 165H RTX 4070
HP Omen 16-xf0079ng: AMD Ryzen 7 7840HS, 16.10", 2.4 kg
Recensioni esterne » HP Omen 16-xf0079ng
HP Omen Transcend 16-u1095ng: Intel Core i9-14900HX, 16.00", 2.3 kg
Recensioni esterne » HP Omen Transcend 16-u1095ng
MSI Vector 17 HX A14VGG: Intel Core i9-14900HX, 17.30", 3 kg
Recensioni esterne » MSI Vector 17 HX A14VGG
Lenovo Legion Pro 5 16IRX9, i7-14700HX: Intel Core i7-14700HX, 16.00", 2.5 kg
Recensioni esterne » Lenovo Legion Pro 5 16IRX9, i7-14700HX
Lenovo Legion Slim 7 16IRH8, i9-13900H RTX 4070: Intel Core i9-13900H, 16.00", 2 kg
Recensioni esterne » Lenovo Legion Slim 7 16IRH8, i9-13900H RTX 4070
Lenovo Yoga Pro 9 16IMH9: Intel Core Ultra 9 185H, 16.00", 2.1 kg
Recensioni esterne » Lenovo Yoga Pro 9 16IMH9
Lenovo Legion 7 16IRX9: Intel Core i7-14650HX, 16.00", 2.3 kg
Recensioni esterne » Lenovo Legion 7 16IRX9
Lenovo ThinkPad P1 G6, i7-13800H RTX 4070: Intel Core i7-13800H, 16.00", 1.8 kg
Recensioni esterne » Lenovo ThinkPad P1 G6, i7-13800H RTX 4070
Acer Nitro 16 AN16-41, R9 7940HS: AMD Ryzen 9 7940HS, 16.00", 2.7 kg
Recensioni esterne » Acer Nitro 16 AN16-41, R9 7940HS
HP Omen Transcend 14-fb0000ng: Intel Core Ultra 9 185H, 14.00", 1.6 kg
Recensioni esterne » HP Omen Transcend 14-fb0000ng
Aorus 16X 2024: Intel Core i9-14900HX, 16.00", 2.3 kg
Recensioni esterne » Aorus 16X 2024
Lenovo Legion Pro 5 16IRX9: Intel Core i9-14900HX, 16.00", 2.5 kg
Recensioni esterne » Lenovo Legion Pro 5 16IRX9
Razer Blade 14 RZ09-0508: AMD Ryzen 9 8945HS, 14.00", 1.9 kg
Recensioni esterne » Razer Blade 14 RZ09-0508
Acer Predator Helios Neo 18 PHN18-71: Intel Core i9-14900HX, 18.00", 3.4 kg
Recensioni esterne » Acer Predator Helios Neo 18 PHN18-71
Acer Predator Helios Neo 16 (2024): Intel Core i7-14700HX, 16.00", 2.6 kg
Recensioni esterne » Acer Predator Helios Neo 16 PHN16-72
Alienware m16 R2: Intel Core Ultra 7 155H, 16.00", 2.5 kg
Recensioni esterne » Alienware m16 R2
Asus ROG Zephyrus G16 2024 GU605M: Intel Core Ultra 7 155H, 16.00", 1.8 kg
Recensioni esterne » Asus ROG Zephyrus G16 2024 GU605M
Asus ROG Zephyrus G14 2024 GA403U: AMD Ryzen 9 8945HS, 14.00", 1.5 kg
Recensioni esterne » Asus ROG Zephyrus G14 2024 GA403U
Acer Predator Helios Neo 16 PHN16-71, i5-13700HX RTX 4070: Intel Core i7-13700HX, 16.00", 2.6 kg
Recensioni esterne » Acer Predator Helios Neo 16 PHN16-71, i5-13700HX RTX 4070
Dell XPS 16 9640: Intel Core Ultra 7 155H, 16.30", 2.3 kg
Recensioni esterne » Dell XPS 16 9640
Aorus 16X ASG: Intel Core i7-14650HX, 16.00", 2.3 kg
Recensioni esterne » Aorus 16X ASG
MSI Alpha 17 C7VG: AMD Ryzen 9 7945HX, 17.30", 2.8 kg
Recensioni esterne » MSI Alpha 17 C7VG
Dell XPS 17 9730, i9-13900H: Intel Core i9-13900H, 17.00", 2.4 kg
Recensioni esterne » Dell XPS 17 9730, i9-13900H
Dell G16 7630, i9-13900HX RTX 4070: Intel Core i9-13900HX, 16.00", 2.9 kg
Recensioni esterne » Dell G16 7630, i9-13900HX RTX 4070
Acer Nitro 17 AN17-41: AMD Ryzen 7 7840HS, 17.30", 3 kg
Recensioni esterne » Acer Nitro 17 AN17-41
HP Omen 16-xf0000ng: AMD Ryzen 9 7940HS, 16.10", 2.4 kg
Recensioni esterne » HP Omen 16-xf0000ng
Schenker XMG CORE 16 (L23): AMD Ryzen 7 7840HS, 16.00", 2.4 kg
Recensioni esterne » SCHENKER XMG CORE 16 (L23)
Asus ROG Zephyrus G14 GA402XI: AMD Ryzen 9 7940HS, 14.00", 1.7 kg
Recensioni esterne » Asus ROG Zephyrus G14 GA402XI
MSI Creator Z17 HX Studio A13VGT, i7-13700HX: Intel Core i7-13700HX, 17.00", 2.5 kg
Recensioni esterne » MSI Creator Z17 HX Studio A13VGT, i7-13700HX
Acer Predator Helios 16 PH16-71-97H2: Intel Core i9-13900HX, 16.00", 2.7 kg
Recensioni esterne » Acer Predator Helios 16 PH16-71-97H2
HP Victus 16-s0000: AMD Ryzen 7 7840HS, 16.10", 2.3 kg
Recensioni esterne » HP Victus 16-s0000
Schenker VISION 16 Pro (M23): Intel Core i7-13700H, 16.00", 1.6 kg
Recensioni esterne » SCHENKER VISION 16 Pro (M23)
Lenovo Yoga Pro 9i RTX4070: Intel Core i9-13905H, 16.00"
Recensioni esterne » Lenovo Yoga Pro 9i RTX4070
HP Victus 16-r0077ng: Intel Core i7-13700H, 16.10", 2.4 kg
Recensioni esterne » HP Victus 16-r0077ng
Asus TUF Gaming A15 FA507XI: AMD Ryzen 9 7940HS, 15.60", 2.2 kg
Recensioni esterne » Asus TUF Gaming A15 FA507XI
Lenovo Legion Pro 5 16IRX8, i7-13700HX RTX 4070: Intel Core i7-13700HX, 16.00", 2.6 kg
Recensioni esterne » Lenovo Legion Pro 5 16IRX8, i7-13700HX RTX 4070
Acer Predator Helios 16 PH16-71-76FS: Intel Core i7-13700HX, 16.00", 2.7 kg
Recensioni esterne » Acer Predator Helios 16 PH16-71-76FS
Lenovo Yoga Pro 9 16IRP8, RTX 4070: Intel Core i9-13905H, 16.00", 2.2 kg
Recensioni esterne » Lenovo Yoga Pro 9 16IRP8, RTX 4070
MSI Katana 17 B13VGK: Intel Core i7-13620H, 17.30", 2.6 kg
Recensioni esterne » MSI Katana 17 B13VGK
Acer Predator Helios 16 PH16-71-74AS: Intel Core i7-13700HX, 16.00", 2.6 kg
Recensioni esterne » Acer Predator Helios 16 PH16-71-74AS
Lenovo Legion 5 Pro 16ARX8: AMD Ryzen 7 7745HX, 16.00", 2.5 kg
Recensioni esterne » Lenovo Legion 5 Pro 16ARX8
HP Omen Transcend 16-u0027TX: Intel Core i7-13700HX, 16.00", 2.2 kg
Recensioni esterne » HP Omen Transcend 16-u0027TX
Acer Predator Triton 14 PT14-51, i7-13700H RTX 4070: Intel Core i7-13700H, 14.00", 1.7 kg
Recensioni esterne » Acer Predator Triton 14 PT14-51, i7-13700H RTX 4070
HP Omen Transcend 16-u0000: Intel Core i9-13900HX, 16.00", 2.2 kg
Recensioni esterne » HP Omen Transcend 16-u0000
Lenovo Legion Pro 7 16IRX8, i7-13700HX RTX 4070: Intel Core i7-13700HX, 16.00", 2.8 kg
Recensioni esterne » Lenovo Legion Pro 7 16IRX8, i7-13700HX RTX 4070
Acer Nitro 16 AN16-41: AMD Ryzen 7 7735HS, 16.00", 2.7 kg
Recensioni esterne » Acer Nitro 16 AN16-41
Asus TUF Gaming A17 FA707XI: AMD Ryzen 9 7940HS, 17.30", 2.6 kg
Recensioni esterne » Asus TUF Gaming A17 FA707XI
Alienware m16 R1 AMD, RTX 4070: AMD Ryzen 9 7845HX, 16.00", 3.1 kg
Recensioni esterne » Alienware m16 R1 AMD, RTX 4070
Acer Nitro 16 AN16-41-R8UR: AMD Ryzen 7 7735HS, 16.00", 2.7 kg
Recensioni esterne » Acer Nitro 16 AN16-41-R8UR
HP Victus 16-r0000ns: Intel Core i7-13700H, 16.10", 2.3 kg
Recensioni esterne » HP Victus 16-r0000ns
Asus ROG Flow X13 GV302XI: AMD Ryzen 9 7940HS, 13.40", 1.3 kg
Recensioni esterne » Asus ROG Flow X13 GV302XI
Asus ProArt StudioBook 16 OLED H7604JI: Intel Core i9-13980HX, 16.00", 2.4 kg
Recensioni esterne » Asus ProArt StudioBook 16 OLED H7604JI
Asus VivoBook Pro 16 OLED K6604JI: Intel Core i9-13980HX, 16.00", 2 kg
Recensioni esterne » Asus VivoBook Pro 16 OLED K6604JI
Origin PC EON14-S 2023: Intel Core i9-13900H, 14.00", 1.8 kg
Recensioni esterne » Origin PC EON14-S 2023
MSI Katana 15 B12VGK: Intel Core i7-12650H, 15.60", 2.3 kg
Recensioni esterne » MSI Katana 15 B12VGK
HP Omen Transcend 16: Intel Core i9-13900HX, 16.00", 2.3 kg
Recensioni esterne » HP Omen Transcend 16
Lenovo Legion Slim 7i 16 Gen 8: Intel Core i9-13900H, 16.00", 2.1 kg
Recensioni esterne » Lenovo Legion Slim 7i 16 Gen 8
HP Omen Transcend 16-u0095ng: Intel Core i9-13900HX, 16.00", 2.2 kg
Recensioni esterne » HP Omen Transcend 16-u0095ng
MSI Crosshair 15 C12VG: Intel Core i7-12650H, 15.60", 2.3 kg
Recensioni esterne » MSI Crosshair 15 C12VG
Hyperbook SL606, i9-13900H RTX 4070: Intel Core i9-13900H, 16.00", 2.7 kg
Recensioni esterne » Hyperbook SL606, i9-13900H RTX 4070
MSI Alpha 17 C7VF: AMD Ryzen 9 7945HX, 17.30", 2.8 kg
Recensioni esterne » MSI Alpha 17 C7VF
Lenovo Legion Pro 5 16ARX8: AMD Ryzen 7 7745HX, 16.00", 2.5 kg
Recensioni esterne » Lenovo Legion Pro 5 16ARX8
MSI Creator Z17 HX Studio A13VGT: Intel Core i9-13950HX, 17.00", 2.5 kg
Recensioni esterne » MSI Creator Z17 HX Studio A13VGT
Origin PC EVO16-S 2023: Intel Core i9-13900H, 16.10", 2.5 kg
Recensioni esterne » Origin PC EVO16-S 2023
Acer Nitro 17 AN17-41-R9LN: AMD Ryzen 7 7735HS, 17.30", 3 kg
Recensioni esterne » Acer Nitro 17 AN17-41-R9LN
Razer Blade 14 RTX 4070: AMD Ryzen 9 7940HS, 14.00", 1.8 kg
Recensioni esterne » Razer Blade 14 RTX 4070
MSI Stealth 14 Studio A13VG, i7-13620H: Intel Core i7-13620H, 14.00", 1.7 kg
Recensioni esterne » MSI Stealth 14 Studio A13VG, i7-13620H
Dell XPS 17 9730 RTX 4070: Intel Core i7-13700H, 17.00", 2.5 kg
Recensioni esterne » Dell XPS 17 9730 RTX 4070
Asus ProArt Studiobook 16 OLED H7604: Intel Core i9-13980HX, 16.00", 2.4 kg
Recensioni esterne » Asus ProArt Studiobook 16 OLED H7604
Lenovo Legion Pro 5 16IRX8, i9-13900HX RTX 4070: Intel Core i9-13900HX, 16.00", 2.6 kg
Recensioni esterne » Lenovo Legion Pro 5 16IRX8, i9-13900HX RTX 4070
Asus ROG Zephyrus M16 GU604VI: Intel Core i9-13900H, 16.00", 2.3 kg
Recensioni esterne » Asus ROG Zephyrus M16 GU604VI
Lenovo Legion Pro 7 16IRX8H, i9-13900HX RTX 4070: Intel Core i9-13900HX, 16.00", 2.5 kg
Recensioni esterne » Lenovo Legion Pro 7 16IRX8H, i9-13900HX RTX 4070
Asus Zenbook Pro 14 OLED UX6404VI: Intel Core i9-13900H, 14.50", 1.7 kg
Recensioni esterne » Asus Zenbook Pro 14 OLED UX6404VI
Lenovo Yoga Pro 9i 14 2023: Intel Core i9-13905H, 14.50", 1.7 kg
Recensioni esterne » Lenovo Yoga Pro 9i 14 2023
Razer Blade 16 Early 2023 RTX 4070: Intel Core i9-13950HX, 16.00", 2.5 kg
Recensioni esterne » Razer Blade 16 Early 2023 RTX 4070
MSI Stealth 14 Studio A13VG: Intel Core i7-13700H, 14.00", 1.7 kg
Recensioni esterne » MSI Stealth 14 Studio A13VG
Acer Predator Helios 16 PH16-71: Intel Core i9-13900HX, 16.00", 2.7 kg
Recensioni esterne » Acer Predator Helios 16 PH16-71
Acer Predator Helios 16 PH16-71-96HK: Intel Core i9-13900HK, 16.00", 2.7 kg
Recensioni esterne » Acer Predator Helios 16 PH16-71-96HK
Dell XPS 15 9530 RTX 4070: Intel Core i7-13700H, 15.60", 1.9 kg
Recensioni esterne » Dell XPS 15 9530 RTX 4070
Asus ROG Strix G17 G713PI: AMD Ryzen 9 7945HX, 17.30", 2.8 kg
Recensioni esterne » Asus ROG Strix G17 G713PI
Asus ROG Strix G18 G814JI, i9-13980HX: Intel Core i9-13980HX, 18.00", 3 kg
Recensioni esterne » Asus ROG Strix G18 G814JI, i9-13980HX
Gigabyte Aorus 15 BSF: Intel Core i7-13700H, 15.60", 2.3 kg
Recensioni esterne » Gigabyte Aorus 15 BSF
MSI Raider GE68 HX 13VG: Intel Core i9-13950HX, 15.60", 2.7 kg
Recensioni esterne » MSI Raider GE68 HX 13VG
MSI Raider GE68 HX 13VG, i7-13700HX: Intel Core i7-13700HX, 16.00", 2.7 kg
Recensioni esterne » MSI Raider GE68 HX 13VG, i7-13700HX
Medion Erazer Major X20: Intel Core i9-13900HX, 16.00", 2.4 kg
Recensioni esterne » Medion Erazer Major X20
MSI Stealth 16 Studio A13VG: Intel Core i7-13700H, 16.00", 2 kg
Recensioni esterne » MSI Stealth 16 Studio A13VG
Asus ROG Strix G16 G614JI: Intel Core i9-13980HX, 16.00", 2.5 kg
Recensioni esterne » Asus ROG Strix G16 G614JI
Asus ROG Flow X16 GV601VI: Intel Core i9-13900H, 16.00", 2.2 kg
Recensioni esterne » Asus ROG Flow X16 GV601VI
MSI Pulse 15 B13VGK: Intel Core i7-13700H, 17.30", 2.7 kg
Recensioni esterne » MSI Pulse 15 B13VGK
Gigabyte AERO 16 OLED BSF: Intel Core i9-13900H, 16.00", 2.1 kg
Recensioni esterne » Gigabyte AERO 16 OLED BSF
Asus ROG Flow Z13 ACRNM: Intel Core i9-13900H, 13.40", 1.7 kg
Recensioni esterne » Asus ROG Flow Z13 ACRNM
MSI Katana 15 B13VGK: Intel Core i7-13620H, 15.60", 2.3 kg
Recensioni esterne » MSI Katana 15 2023 B13VGK
MSI Vector GP77 13VG: Intel Core i7-13700H, 17.30", 2.8 kg
Recensioni esterne » MSI Vector GP77 13VG
MSI Pulse 17 B13VGK: Intel Core i7-13700H, 17.30", 2.7 kg
Recensioni esterne » MSI Pulse 17 B13VGK
Asus ROG Strix G18 G814JI: Intel Core i7-13650HX, 18.00", 3 kg
Recensioni esterne » Asus ROG Strix G18 G814JI
Aorus 15X ASF: Intel Core i7-13700HX, 15.60", 2.3 kg
Recensioni esterne » Aorus 15X ASF
Razer Blade 18 RTX 4070: Intel Core i9-13950HX, 18.00", 3 kg
Recensioni esterne » Razer Blade 18 RTX 4070
Samsung Galaxy Book3 Ultra 16, i9-13900H RTX 4070: Intel Core i9-13900H, 16.00", 1.8 kg
Recensioni esterne » Samsung Galaxy Book3 Ultra 16, i9-13900H RTX 4070
Lenovo Yoga Pro 9 16IMH9: Intel Core Ultra 9 185H, 16.00", 2.1 kg
» Lenovo Yoga Pro 9 con Nvidia RTX 5060, display OLED da 2,8 K, 120 Hz trapela con un prezzo da capogiro
Asus ROG Zephyrus G14 2024 GA403U: AMD Ryzen 9 8945HS, 14.00", 1.5 kg
» 2025 Asus ROG Zephyrus G14 annunciato con GPU RTX 5080 per laptop, display OLED ROG Nebula e struttura più sottile
Asus ProArt PX13 HN7306: AMD Ryzen AI 9 HX 370, 13.30", 1.4 kg
» Simulazione delle prestazioni dell'APU Strix Point: Ryzen AI 9 HX 370 brilla nel gioco anche quando viene testato a soli 17 W
HP Omen 17-db0079ng: AMD Ryzen 7 8845HS, 17.30", 2.8 kg
» Meno potenza, più prestazioni e quasi nessun rumore: HP Omen 17 (2024) valutato
Lenovo Yoga Pro 9 16IMH9: Intel Core Ultra 9 185H, 16.00", 2.1 kg
» Lenovo Yoga Pro 9i 16 G9 è ancora dotato di un ottimo pannello mini LED a 1200 nit, ma anche di nuovi problemi
Asus ROG Zephyrus G14 2024 GA403U: AMD Ryzen 9 8945HS, 14.00", 1.5 kg
» Asus ROG Zephyrus G14 e G16 sono in vendita con display OLED a partire da €1.899
Asus ROG Zephyrus G16 2024 GU605M: Intel Core Ultra 7 155H, 16.00", 1.8 kg
» Asus ROG Zephyrus G14 e G16 sono in vendita con display OLED a partire da €1.899
HP Omen Transcend 16: Intel Core i9-13900HX, 16.00", 2.3 kg
» HP Omen Transcend 16 è tre passi avanti e uno indietro per la serie
Lenovo Legion Slim 7i 16 Gen 8: Intel Core i9-13900H, 16.00", 2.1 kg
» Una piccola attenzione ai dettagli sul Lenovo Legion Slim Gen 8 risolve un fastidioso problema sull'Alienware x16 r1