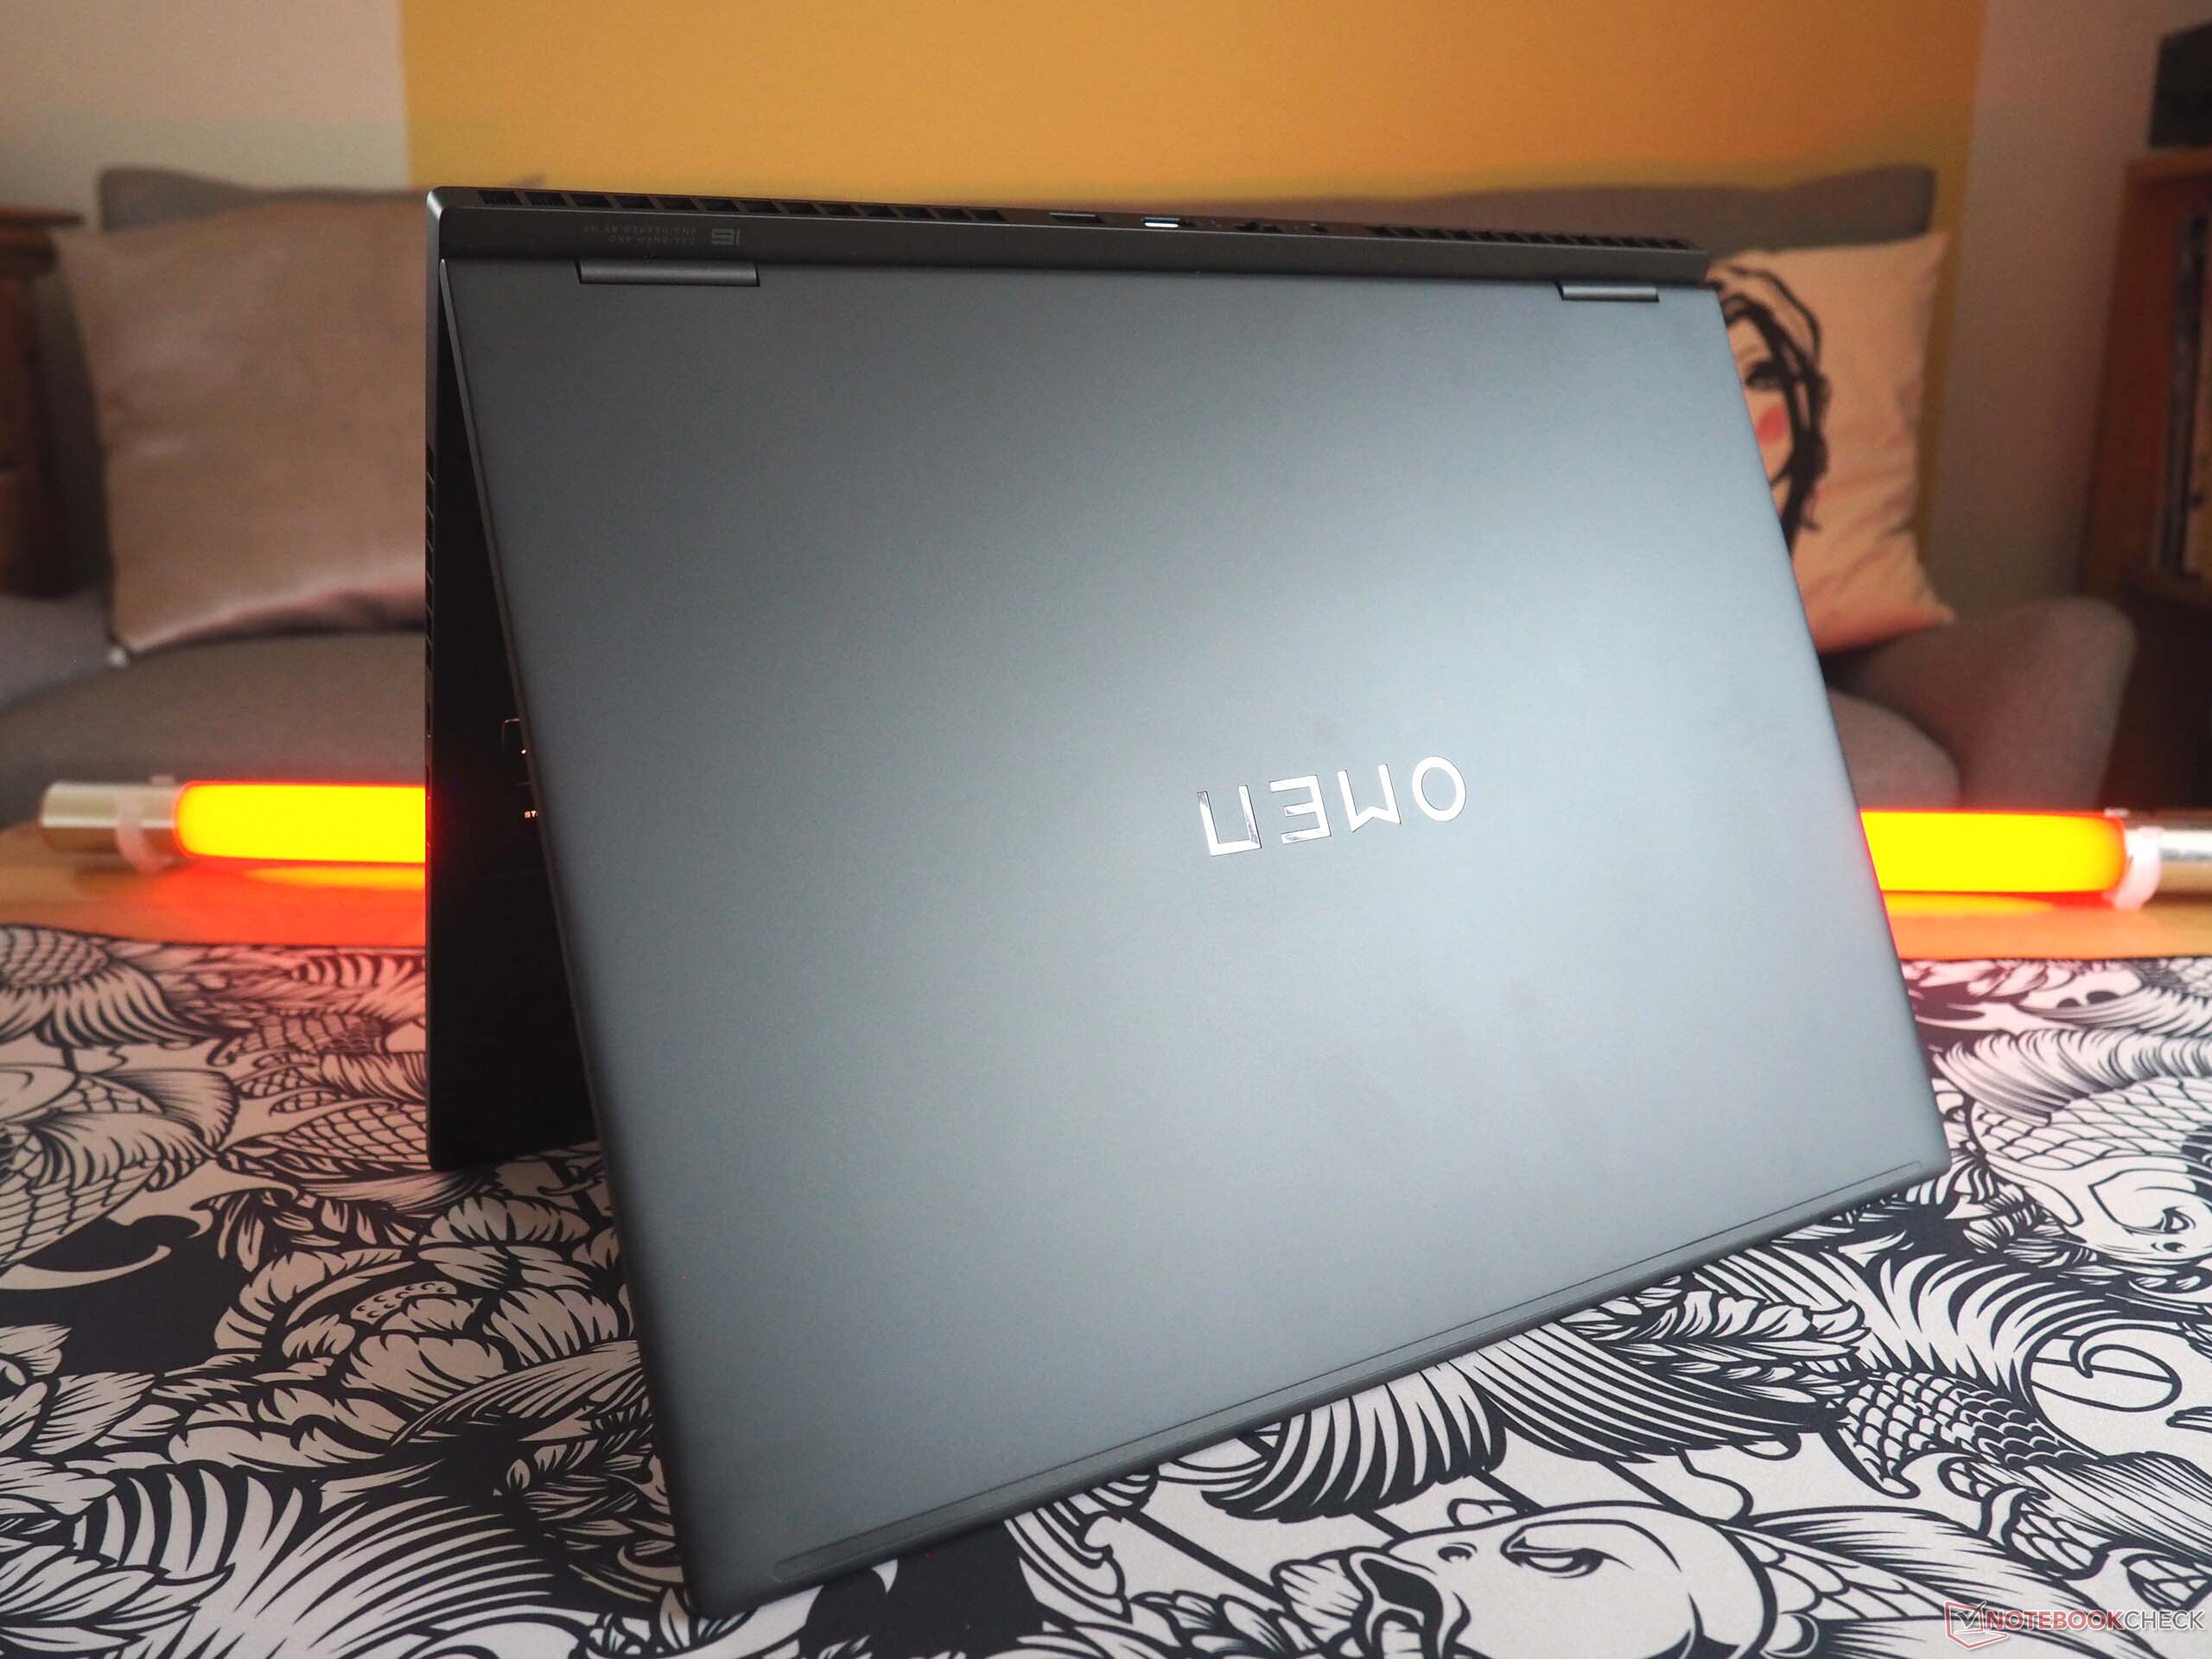
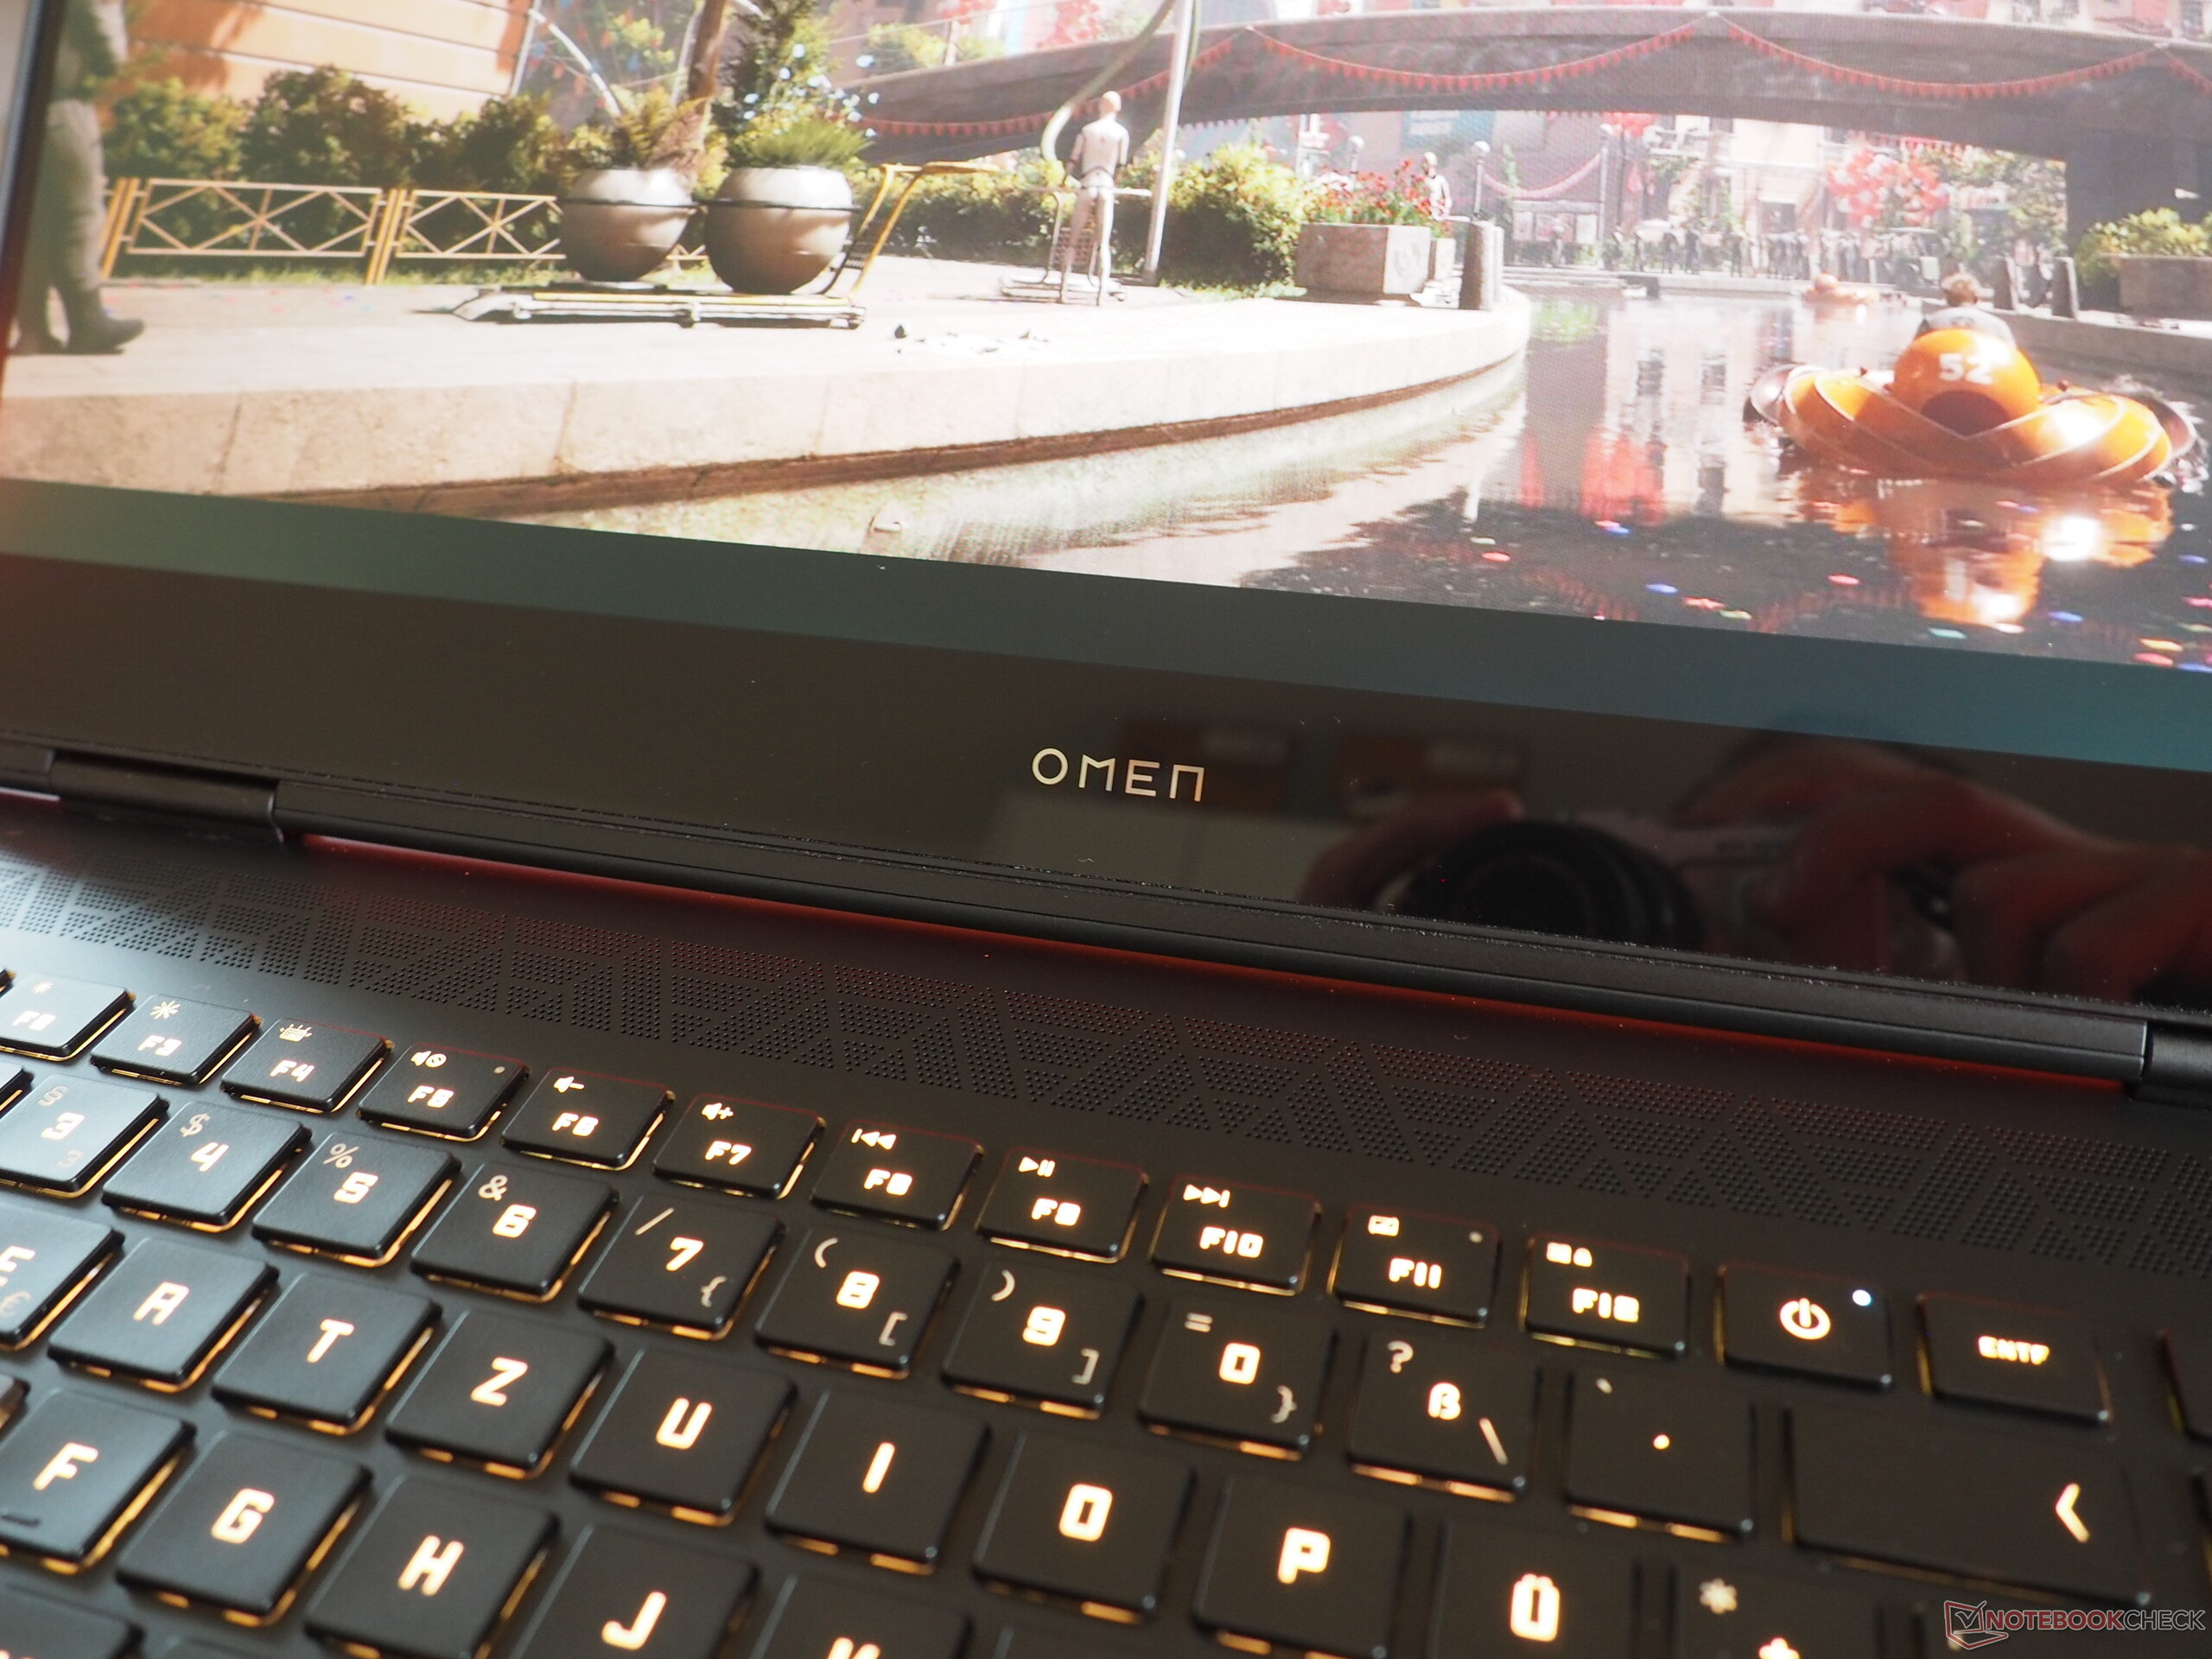
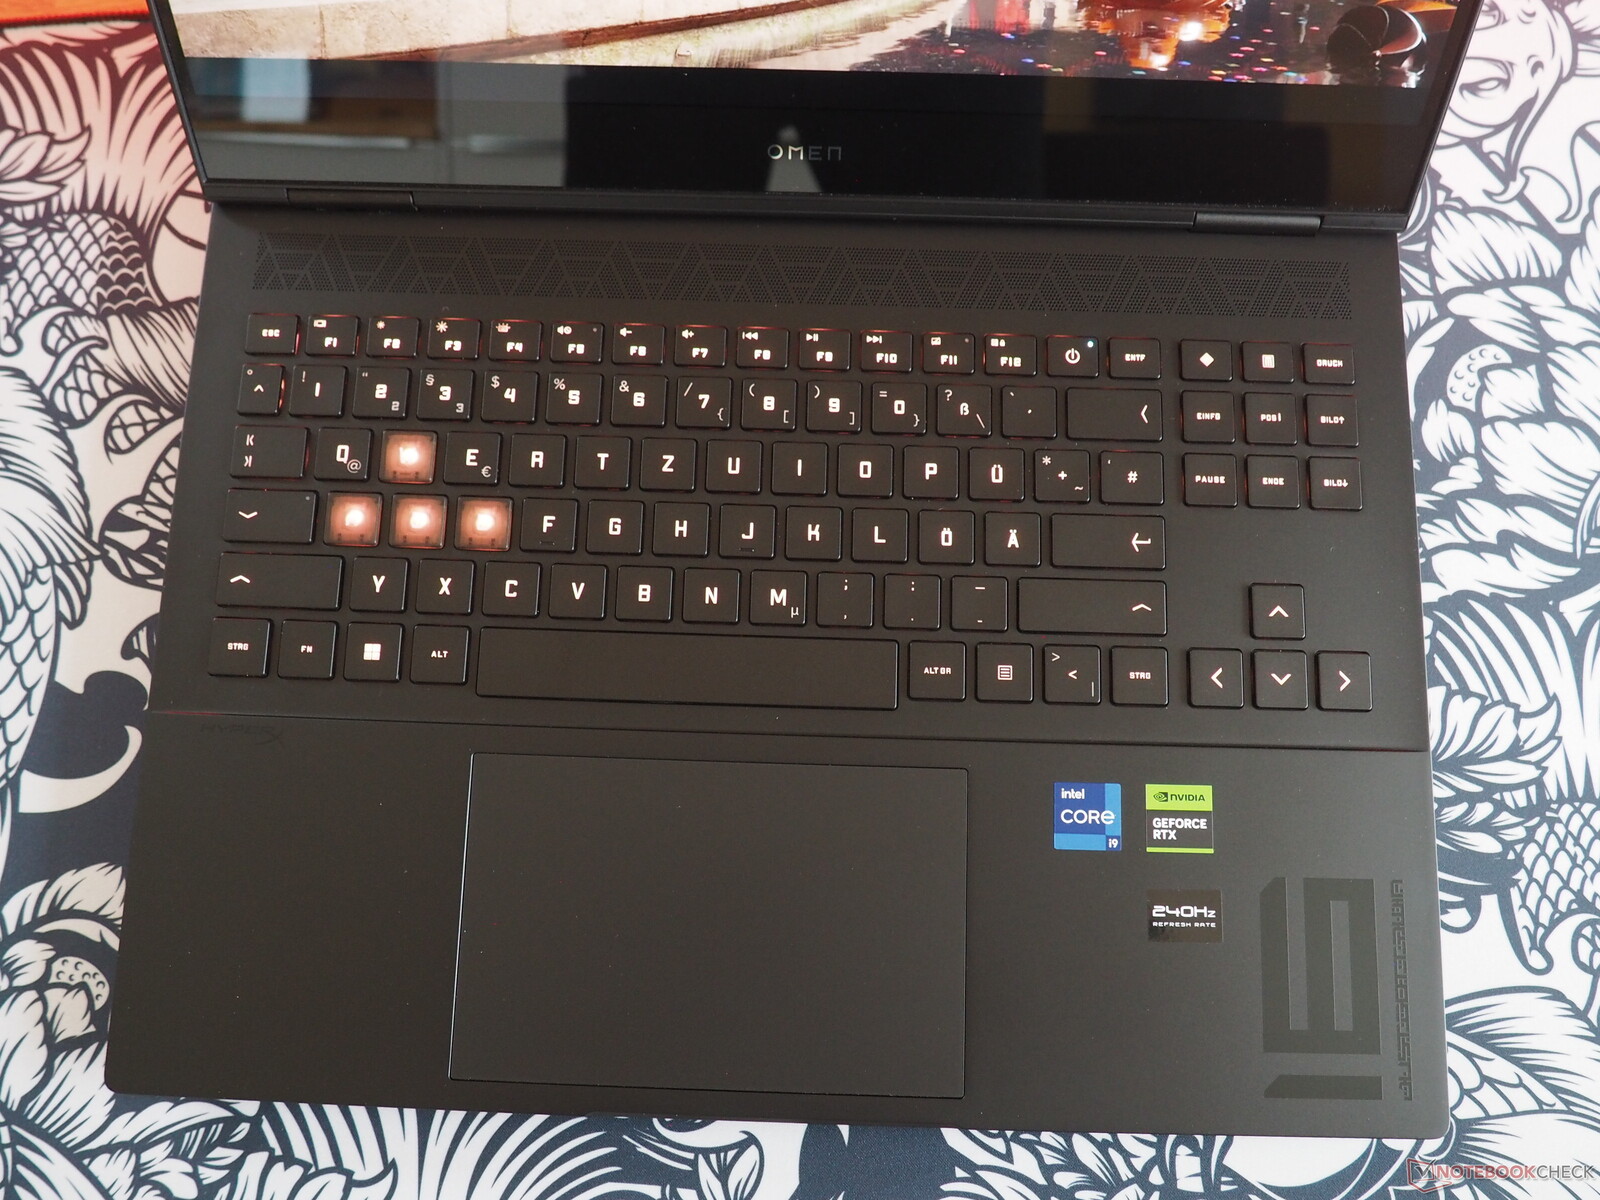
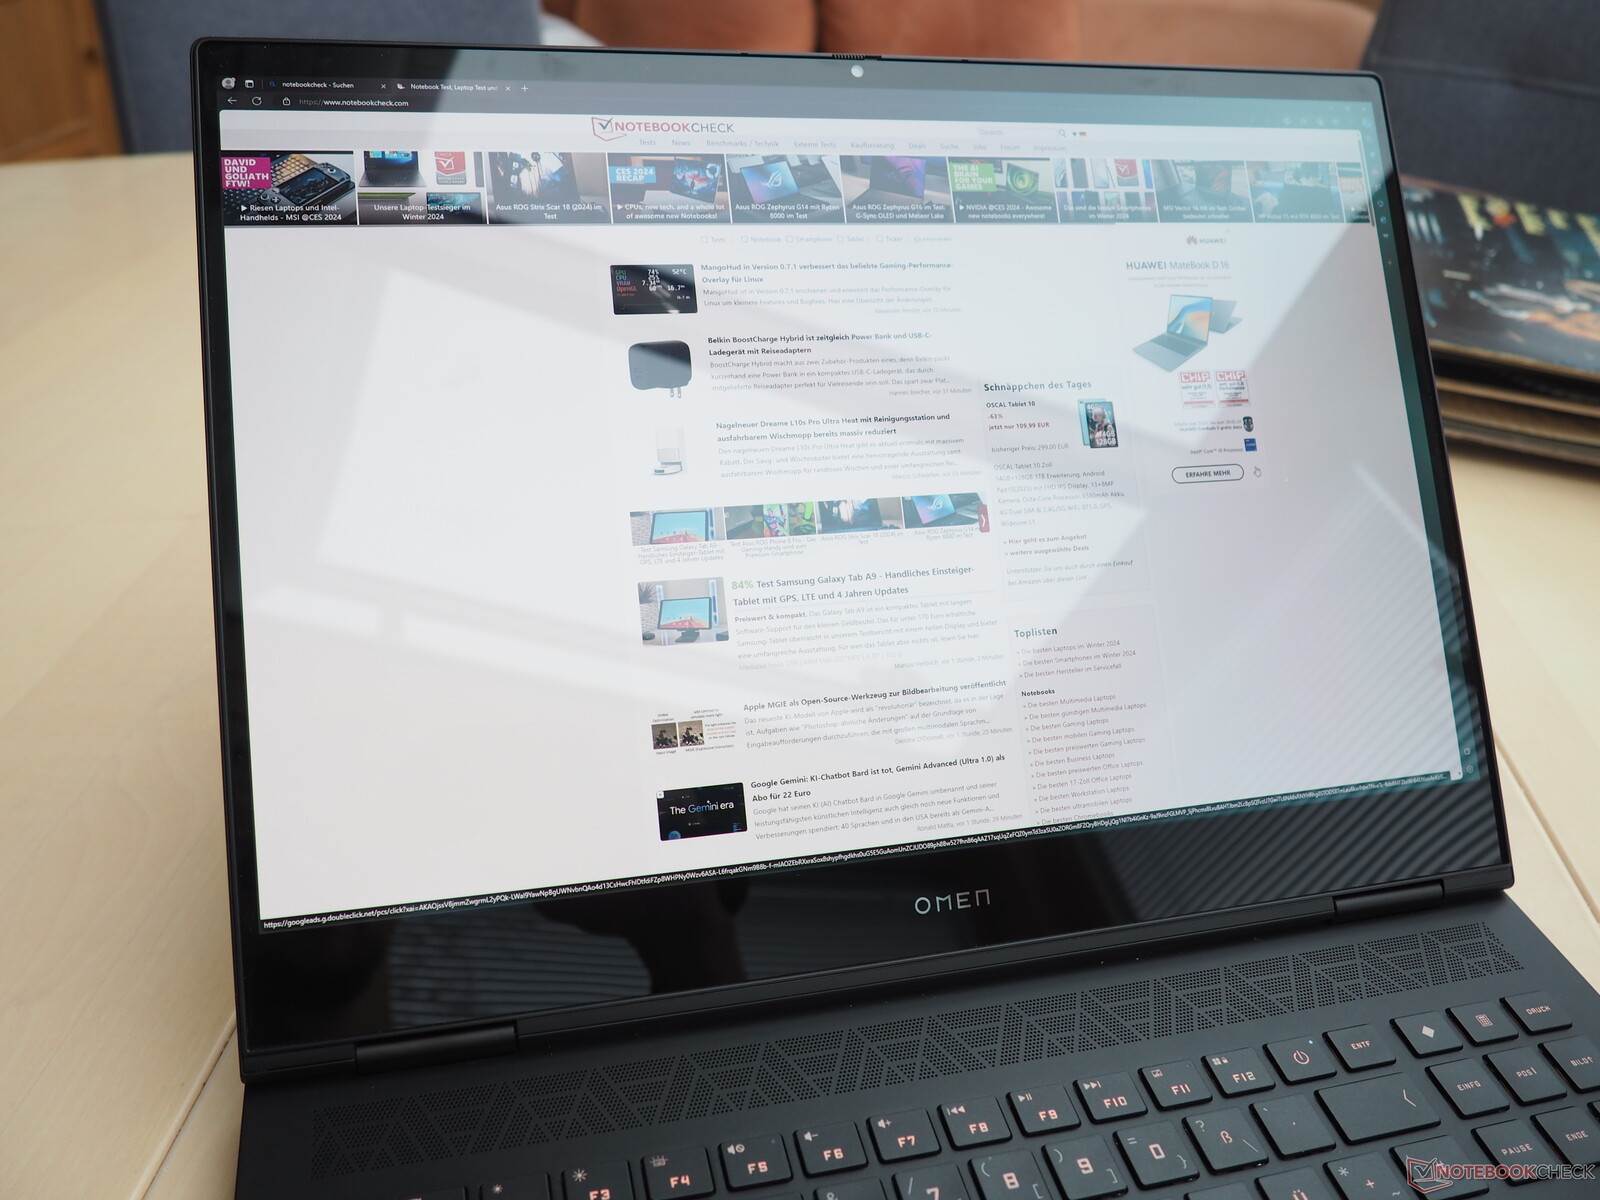
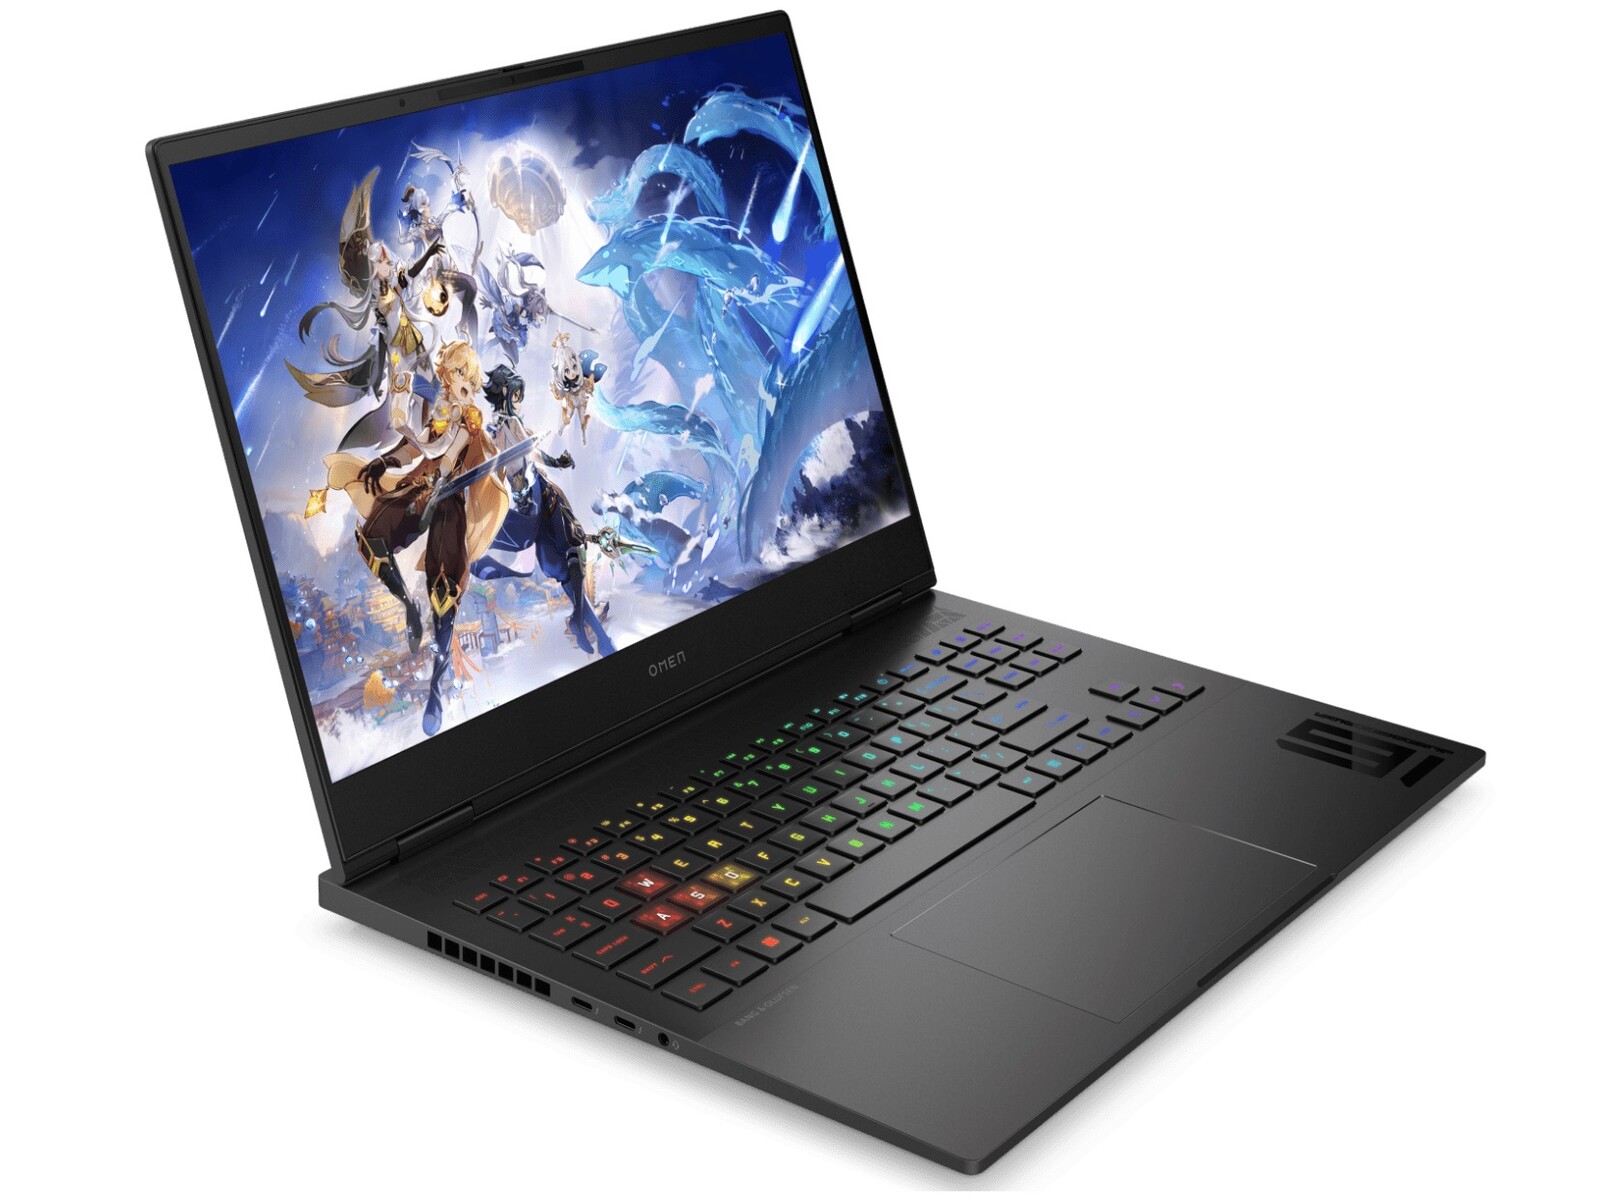
Recensione del notebook HP Omen Transcend 16 (2024): Una macchina per il gaming con RTX 4070 e un display OLED

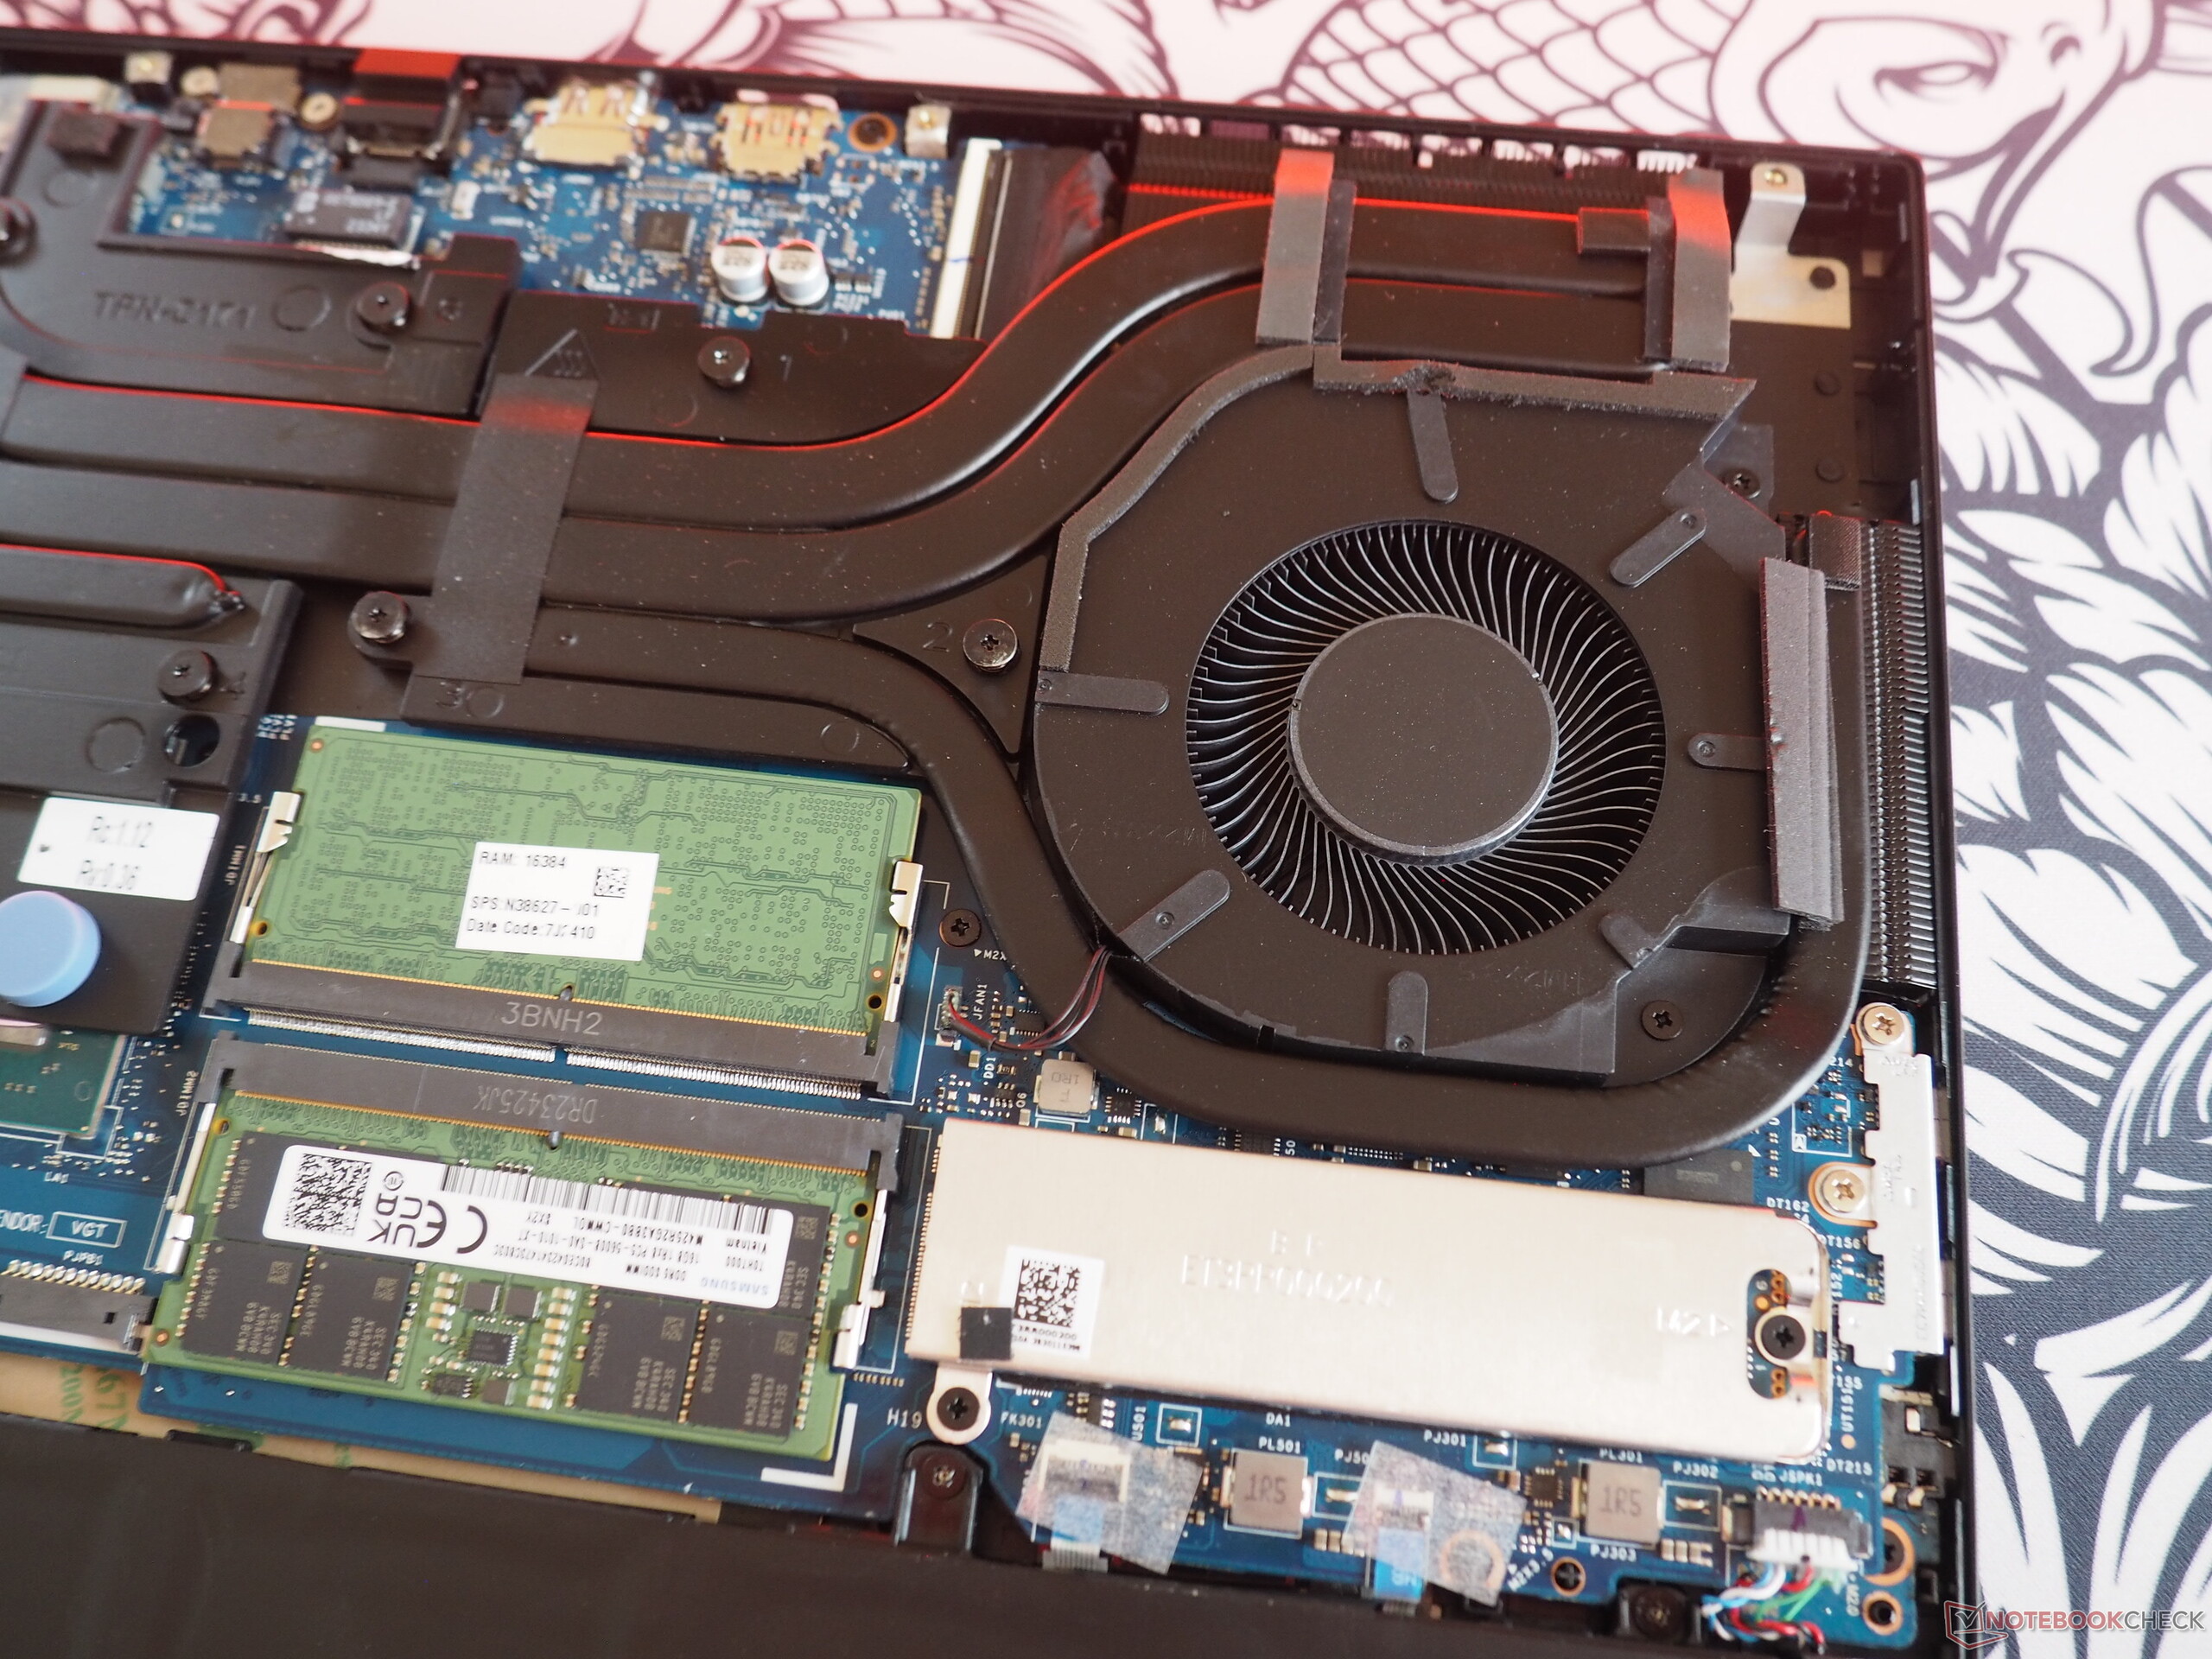
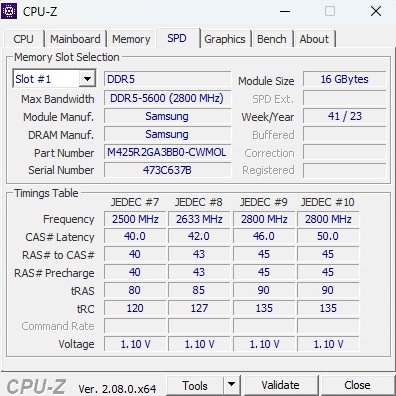
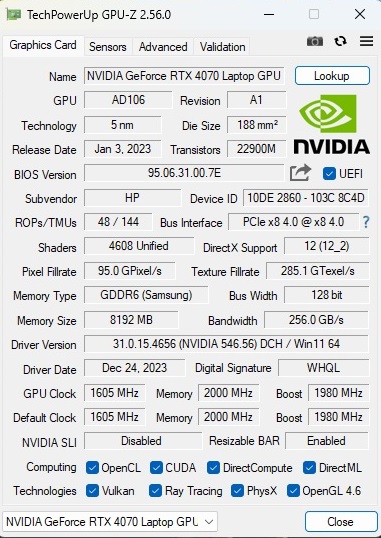
Il modello di recensione Omen Transcend 16 - che termina con u1095ng - può essere acquistato a poco meno di 3.000 dollari. A questo prezzo, l'acquirente ottiene un Core i9-14900HX combinato con una GeForce RTX 4070 che tende ad appartenere più alla fascia media e non a quella alta, a causa dei suoi 8 GB di VRAM piuttosto scarsi. A questo si aggiungono 32 GB di RAM DDR5-5600 (2x 16 GB SO-DIMM) e un SSD M.2 NVMe da 1 TB. Il punto forte è il vibrante pannello OLED, che si dice abbia 2.560 x 1.600 pixel, 240 Hz, 400 cd/m² e 100% DCI P3. Il pacchetto è completato da Windows 11 Home.
Il concorrente di Omen Transcend 16 può essere trovato sotto forma di altri gamer da 16 pollici equipaggiati con la RTX 4070 di GeForce, così come la Asus ROG Zephyrus G16 2024 (Ultra 7 155H), il Schenker XMG Core 16 L23 (Ryzen 7 7840HS) e il Lenovo Legion Pro 5 16ARX8 (Ryzen 7 7745HX), tutti presenti nella nostra tabella di confronto dei dispositivi.
Poiché il telaio è per lo più identico a quello del predecessore, che aveva un Core i9-13900HX (vedere la nostra recensione), ci soffermeremo solo brevemente sulle categorie del case, delle caratteristiche e del dispositivo di input.
Potenziali concorrenti a confrontos
Punteggio | Data | Modello | Peso | Altezza | Dimensione | Risoluzione | Prezzo |
|---|---|---|---|---|---|---|---|
| 88.4 % v7 (old) | 02/2024 | HP Omen Transcend 16-u1095ng i9-14900HX, GeForce RTX 4070 Laptop GPU | 2.3 kg | 20 mm | 16.00" | 2560x1600 | |
| 87.9 % v7 (old) | 08/2023 | HP Omen Transcend 16 i9-13900HX, GeForce RTX 4070 Laptop GPU | 2.3 kg | 19.8 mm | 16.00" | 2560x1600 | |
| 92.3 % v7 (old) | 02/2024 | Asus ROG Zephyrus G16 2024 GU605M Ultra 7 155H, GeForce RTX 4070 Laptop GPU | 1.8 kg | 16.4 mm | 16.00" | 2560x1600 | |
| 89.2 % v7 (old) | 10/2023 | Schenker XMG CORE 16 (L23) R7 7840HS, GeForce RTX 4070 Laptop GPU | 2.4 kg | 26.1 mm | 16.00" | 2560x1600 | |
| 88.4 % v7 (old) | 05/2023 | Lenovo Legion Pro 5 16ARX8 R7 7745HX, GeForce RTX 4070 Laptop GPU | 2.5 kg | 26.8 mm | 16.00" | 2560x1600 |
Caso
Transcend 16 offre un design accattivante e, da un punto di vista visivo, è incredibilmente sottile (tutti i dispositivi concorrenti sono più spessi, a parte Zephyrus G16). Per quanto riguarda la stabilità, l'unità di base riesce almeno a fornire prestazioni solide. Al contrario, il coperchio, come molti altri dispositivi, avrebbe potuto avere una migliore rigidità torsionale. A prima vista, la superficie opaca ha un aspetto premium, tuttavia HP ha utilizzato per lo più solo plastica. Non ci si può lamentare in termini di qualità costruttiva. Il produttore merita un elogio per il generoso angolo di apertura di 180°, anche se le cerniere potrebbero essere più robuste. Per quanto riguarda il peso, con 2,3 kg, il dispositivo si colloca a metà del gruppo e questo fa sì che il 16 pollici non sia né particolarmente leggero né pesante.

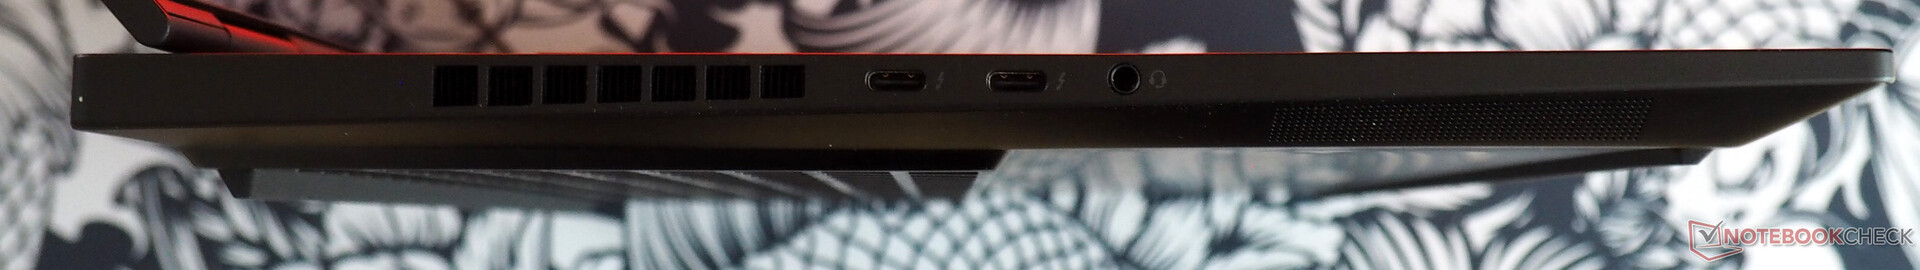
Caratteristiche
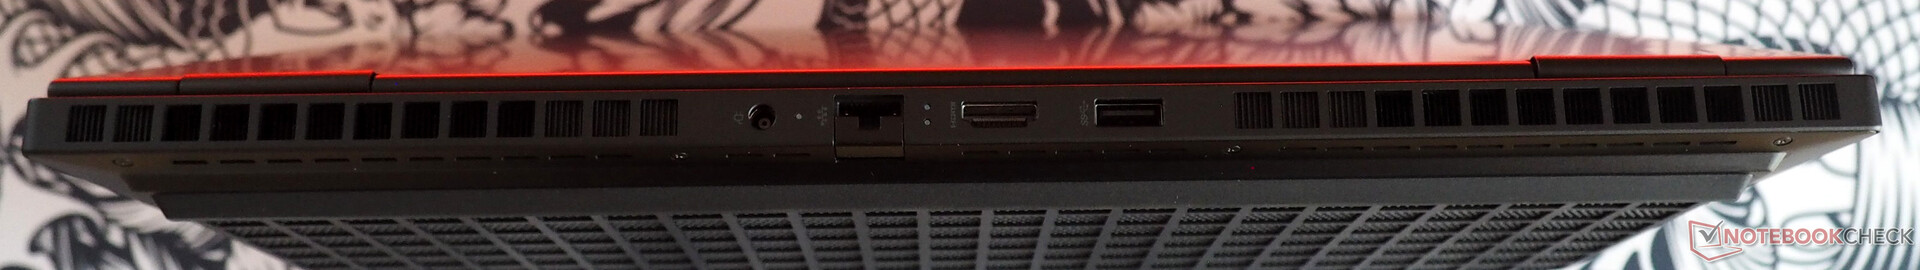
La selezione delle porte può essere descritta come molto moderna. Mentre la parte posteriore ospita una porta RJ45 (purtroppo non LAN da 2,5 Gbit), un'uscita HDMI 2.1 e una porta USB 3.0 (tipo A), il lato sinistro ospita due porte Thunderbolt 4 (inclusa Power Delivery) e un jack audio. Sul lato destro, c'è solo una porta USB 3.0 solitaria (tipo A). Gli acquirenti devono fare a meno di un lucchetto Kensington e di un lettore di schede.

Comunicazione
Le prestazioni Wi-Fi sono di alto livello e con una velocità di invio di quasi 1.400 Mbit/s e circa 1.700 Mbit/s quando si tratta di ricevere dati (a 1 m di distanza dal router di riferimento), le prestazioni sono tra buone e ottime. Con il Wi-Fi 6E AX211, HP ha installato un modulo wireless Intel aggiornato.
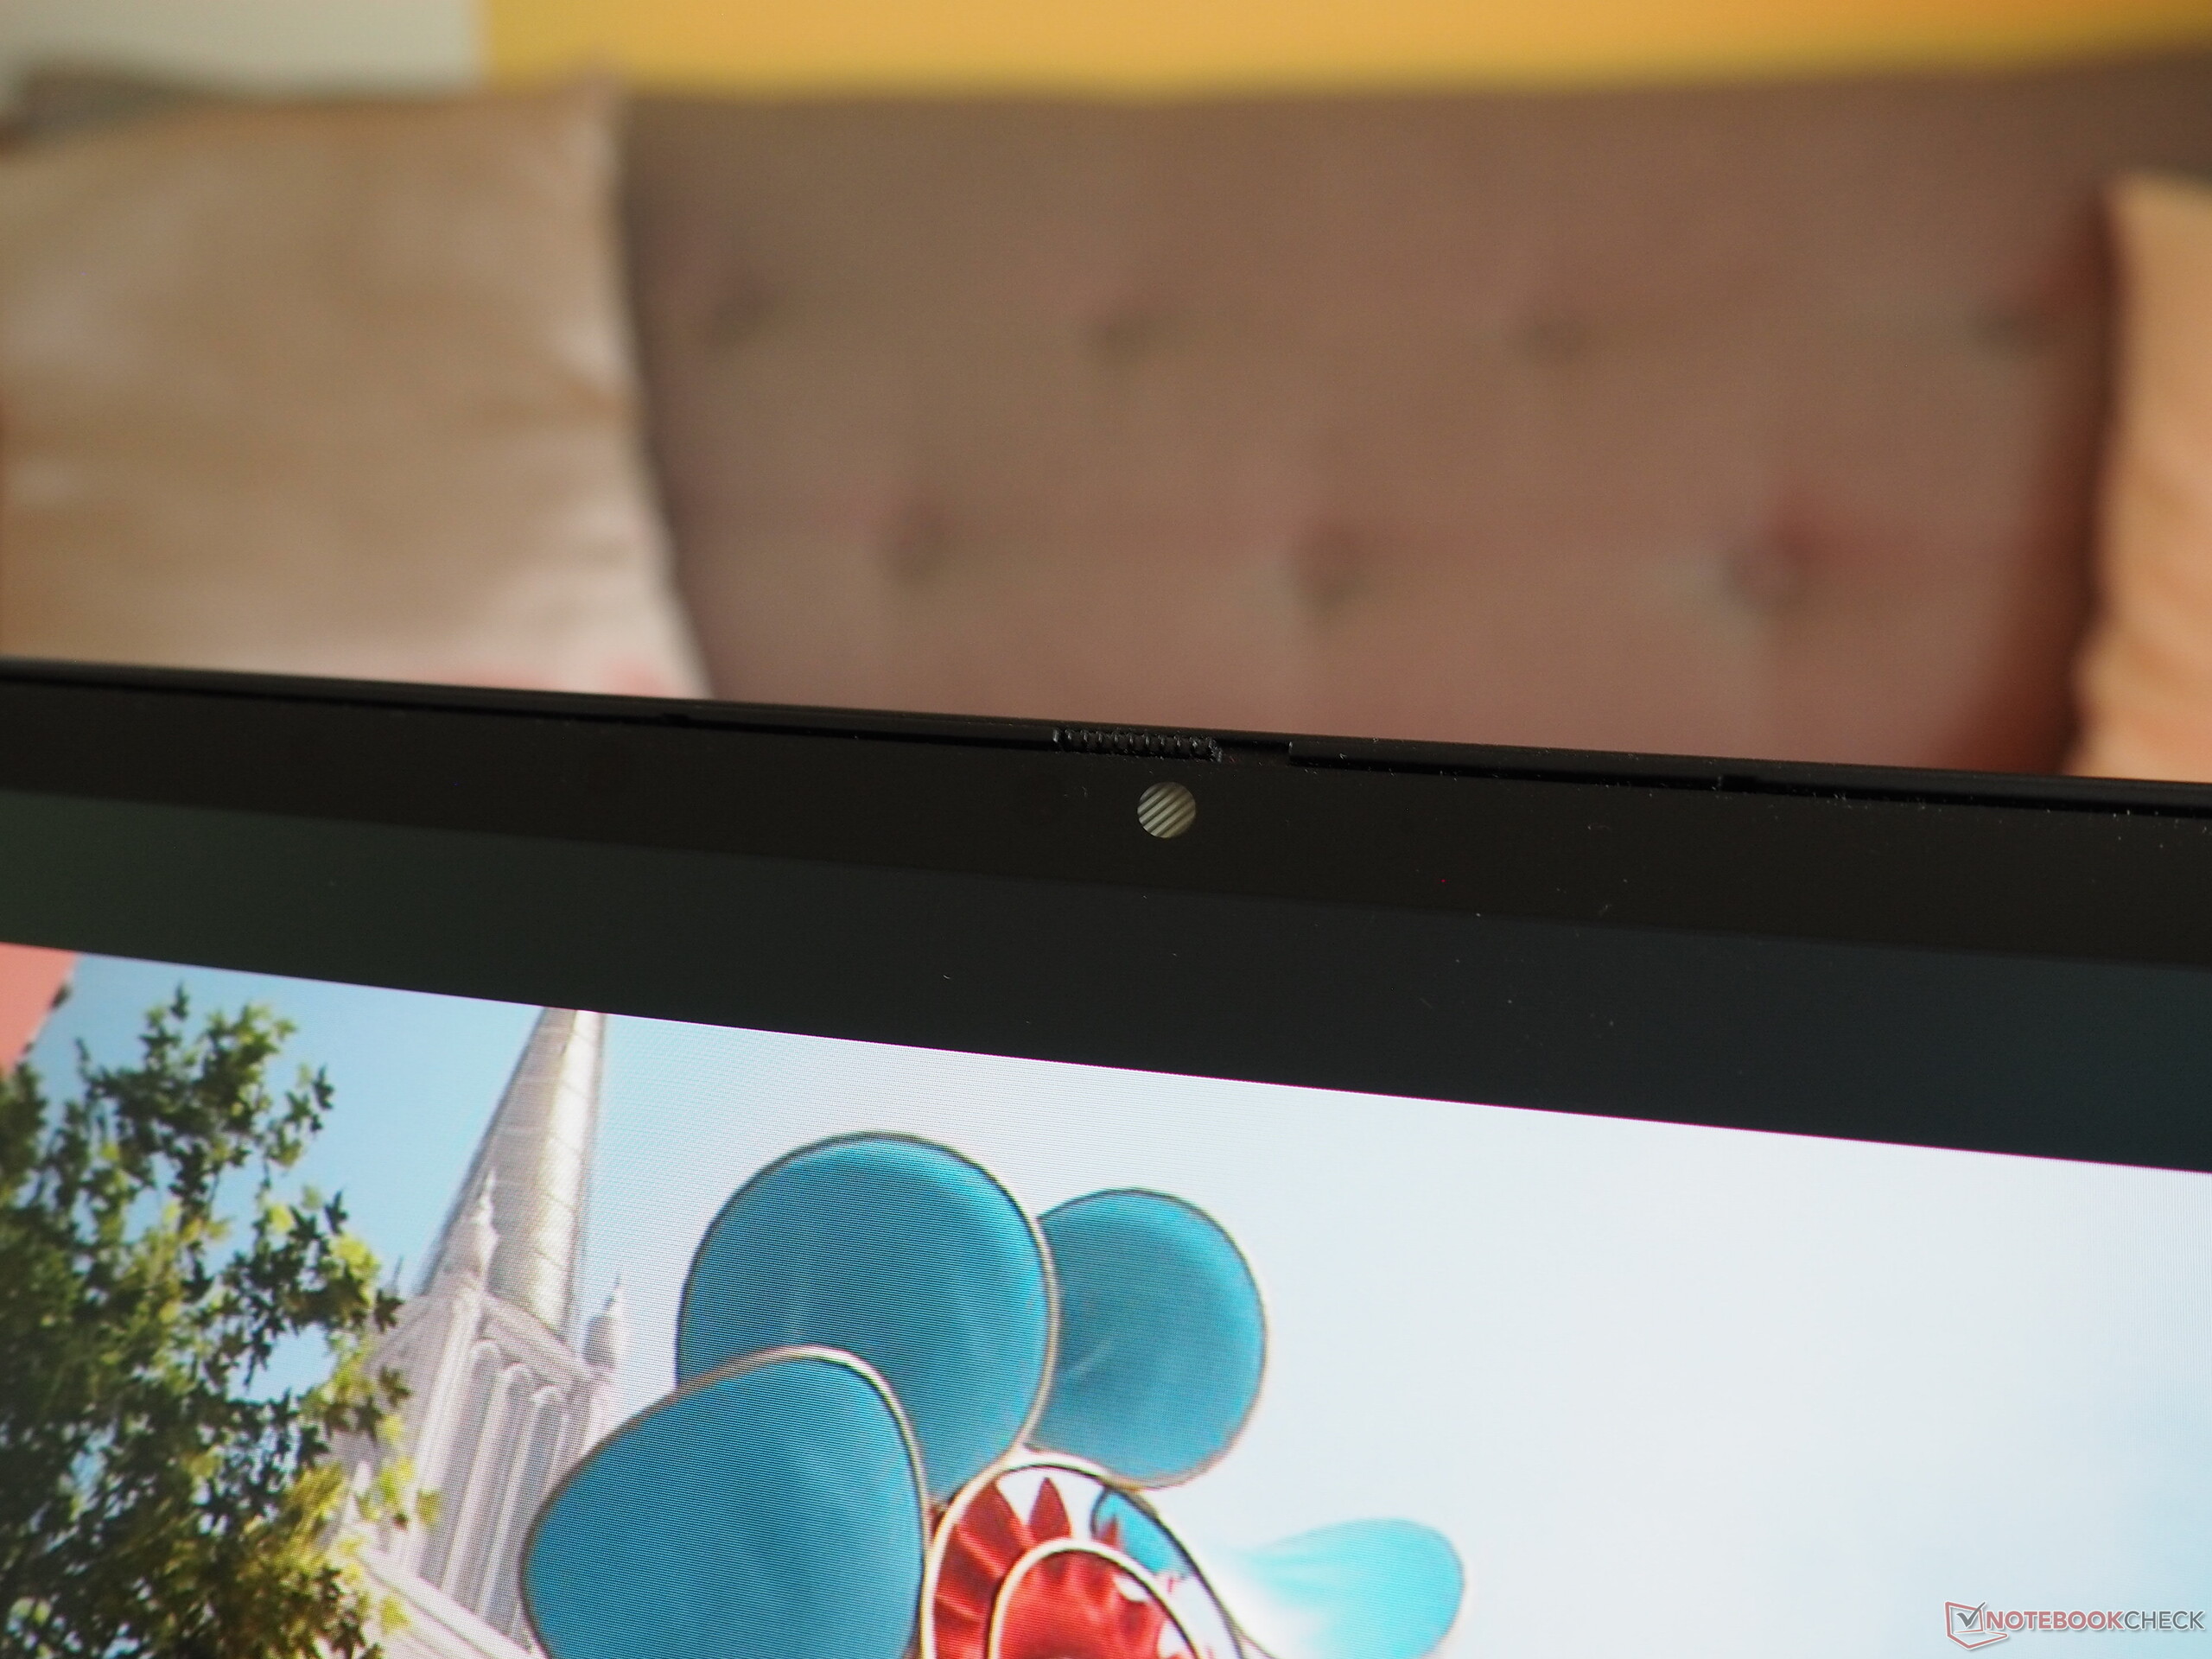
Webcam
Abbiamo sentimenti contrastanti riguardo alla webcam da 2 MP. Mentre la nitidezza dell'immagine è superiore alla media, la precisione del colore lascia molto a desiderare. L'aspetto positivo è l'otturatore manuale per la privacy.


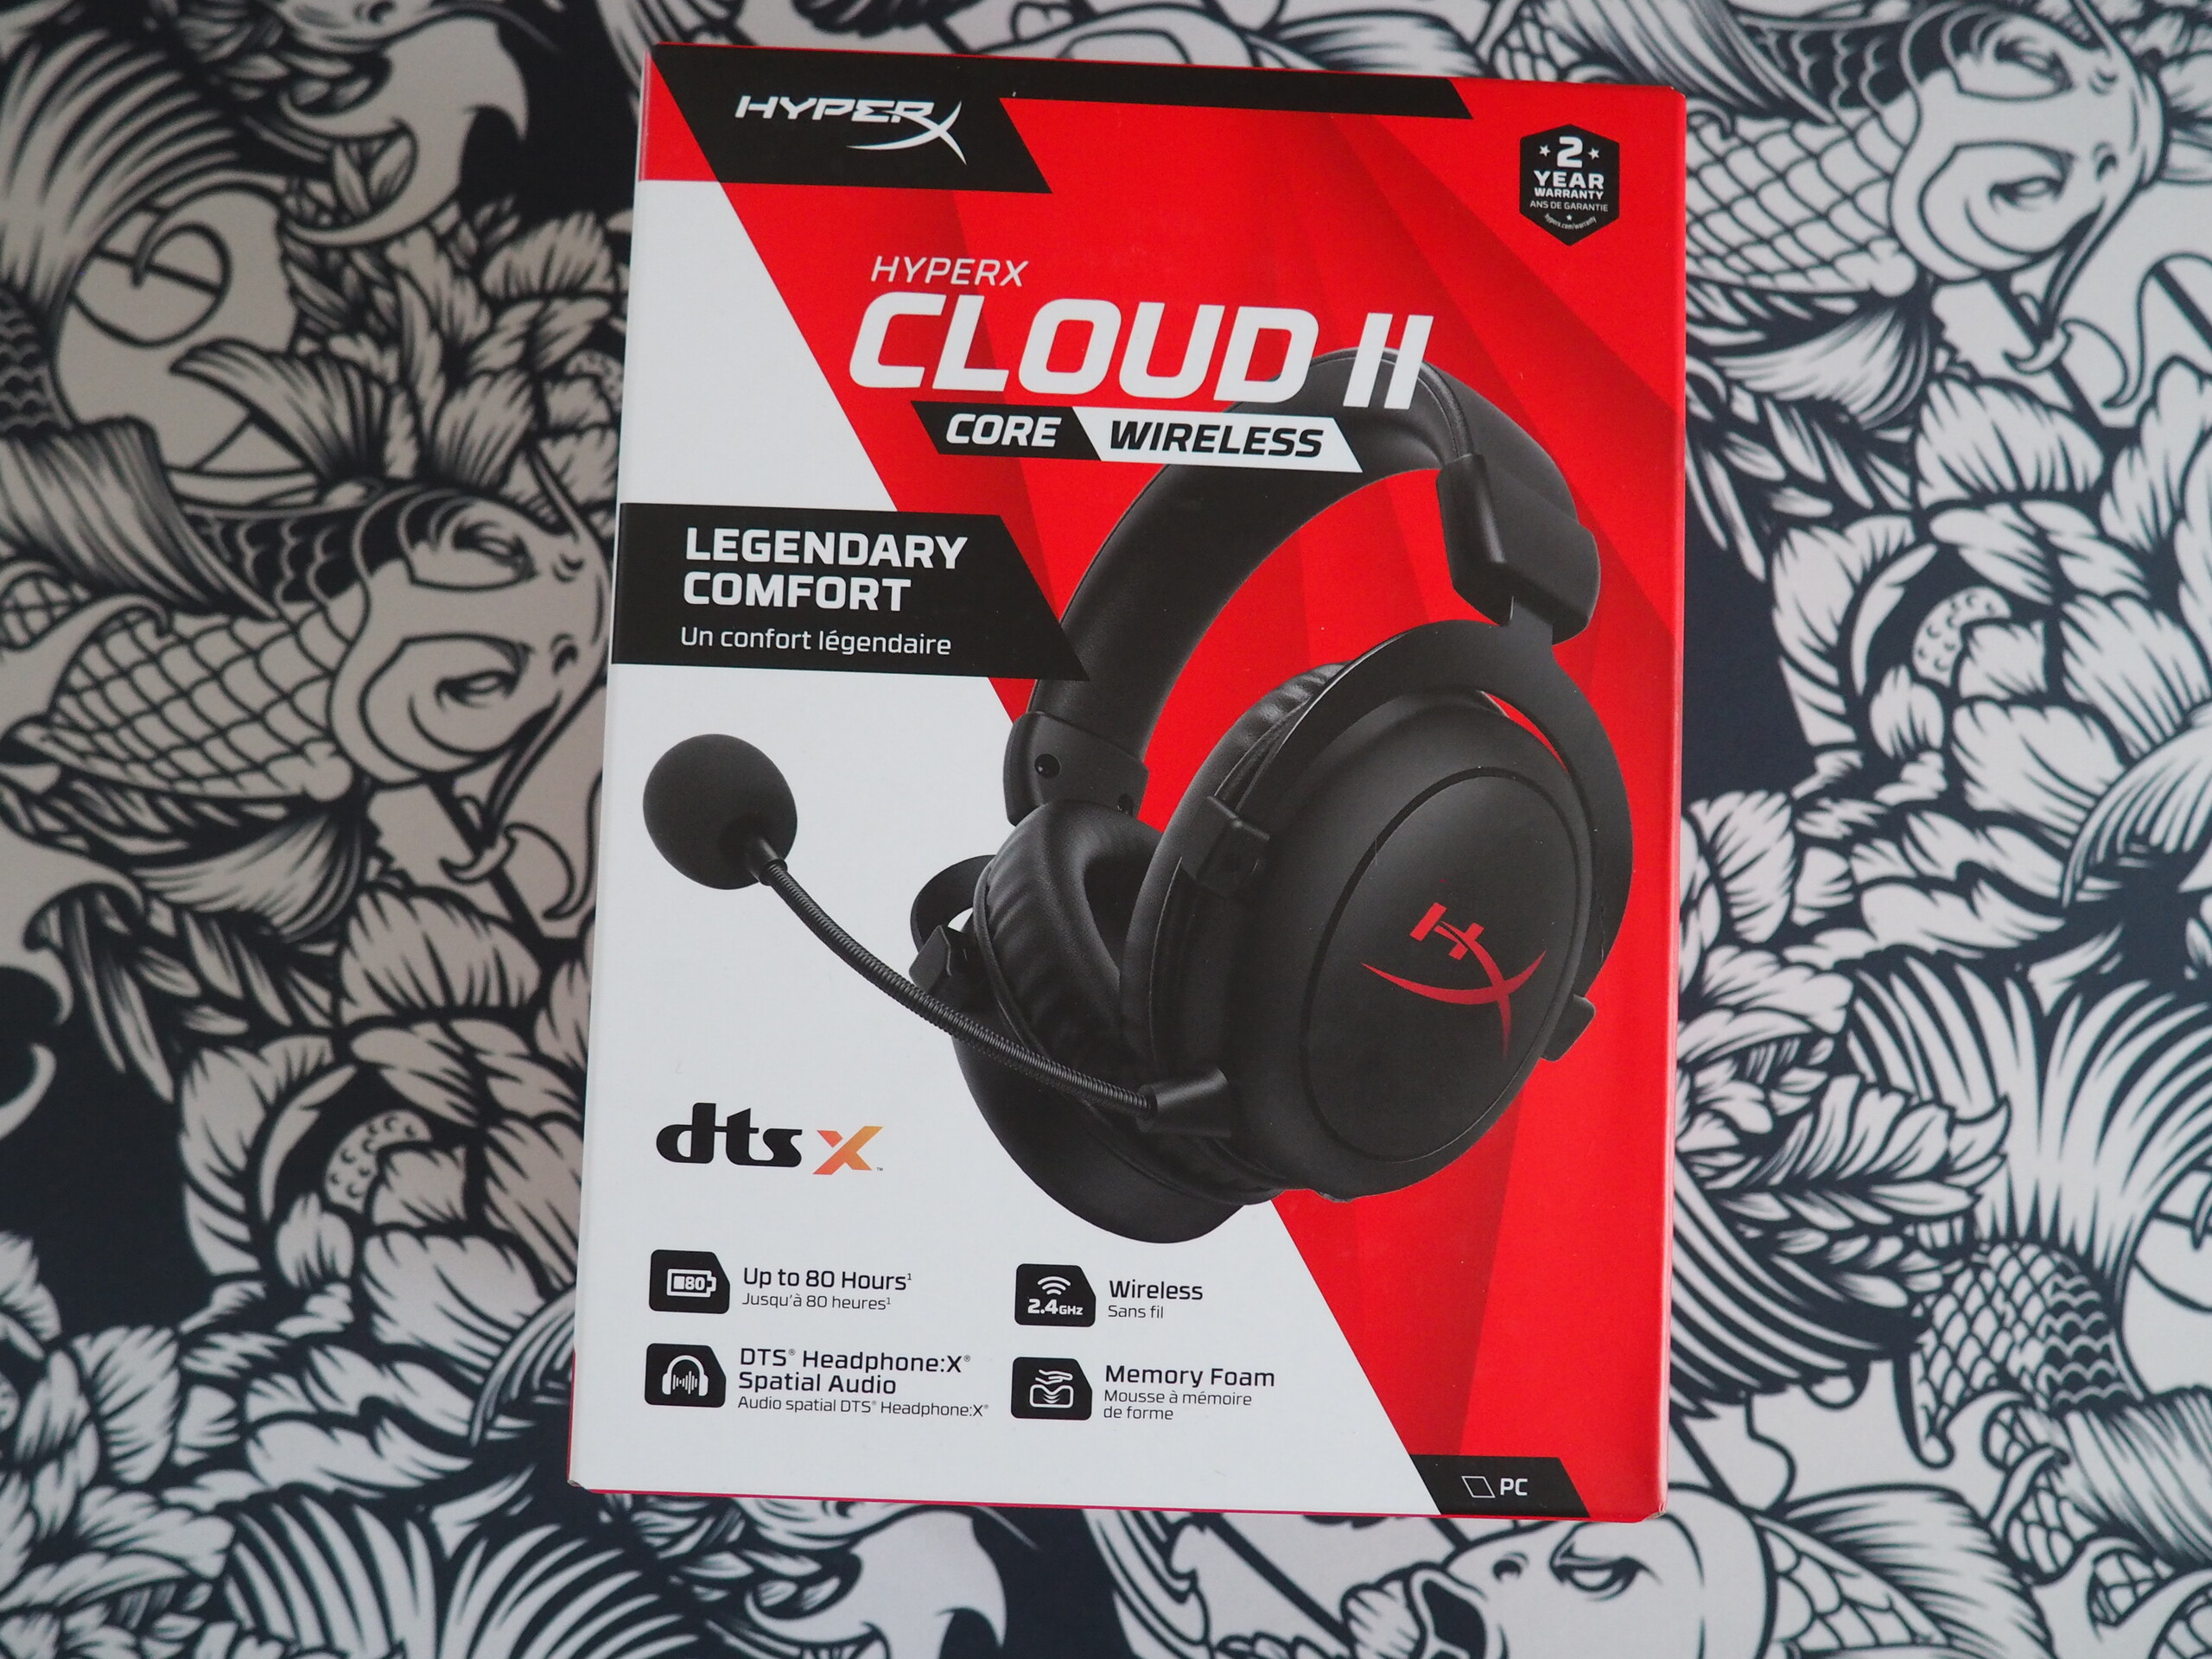
Accessori
Il nostro dispositivo di recensione è stato fornito anche con una PSU molto sottile da 230 watt e con le cuffie HyperX (Cloud II Core wireless).
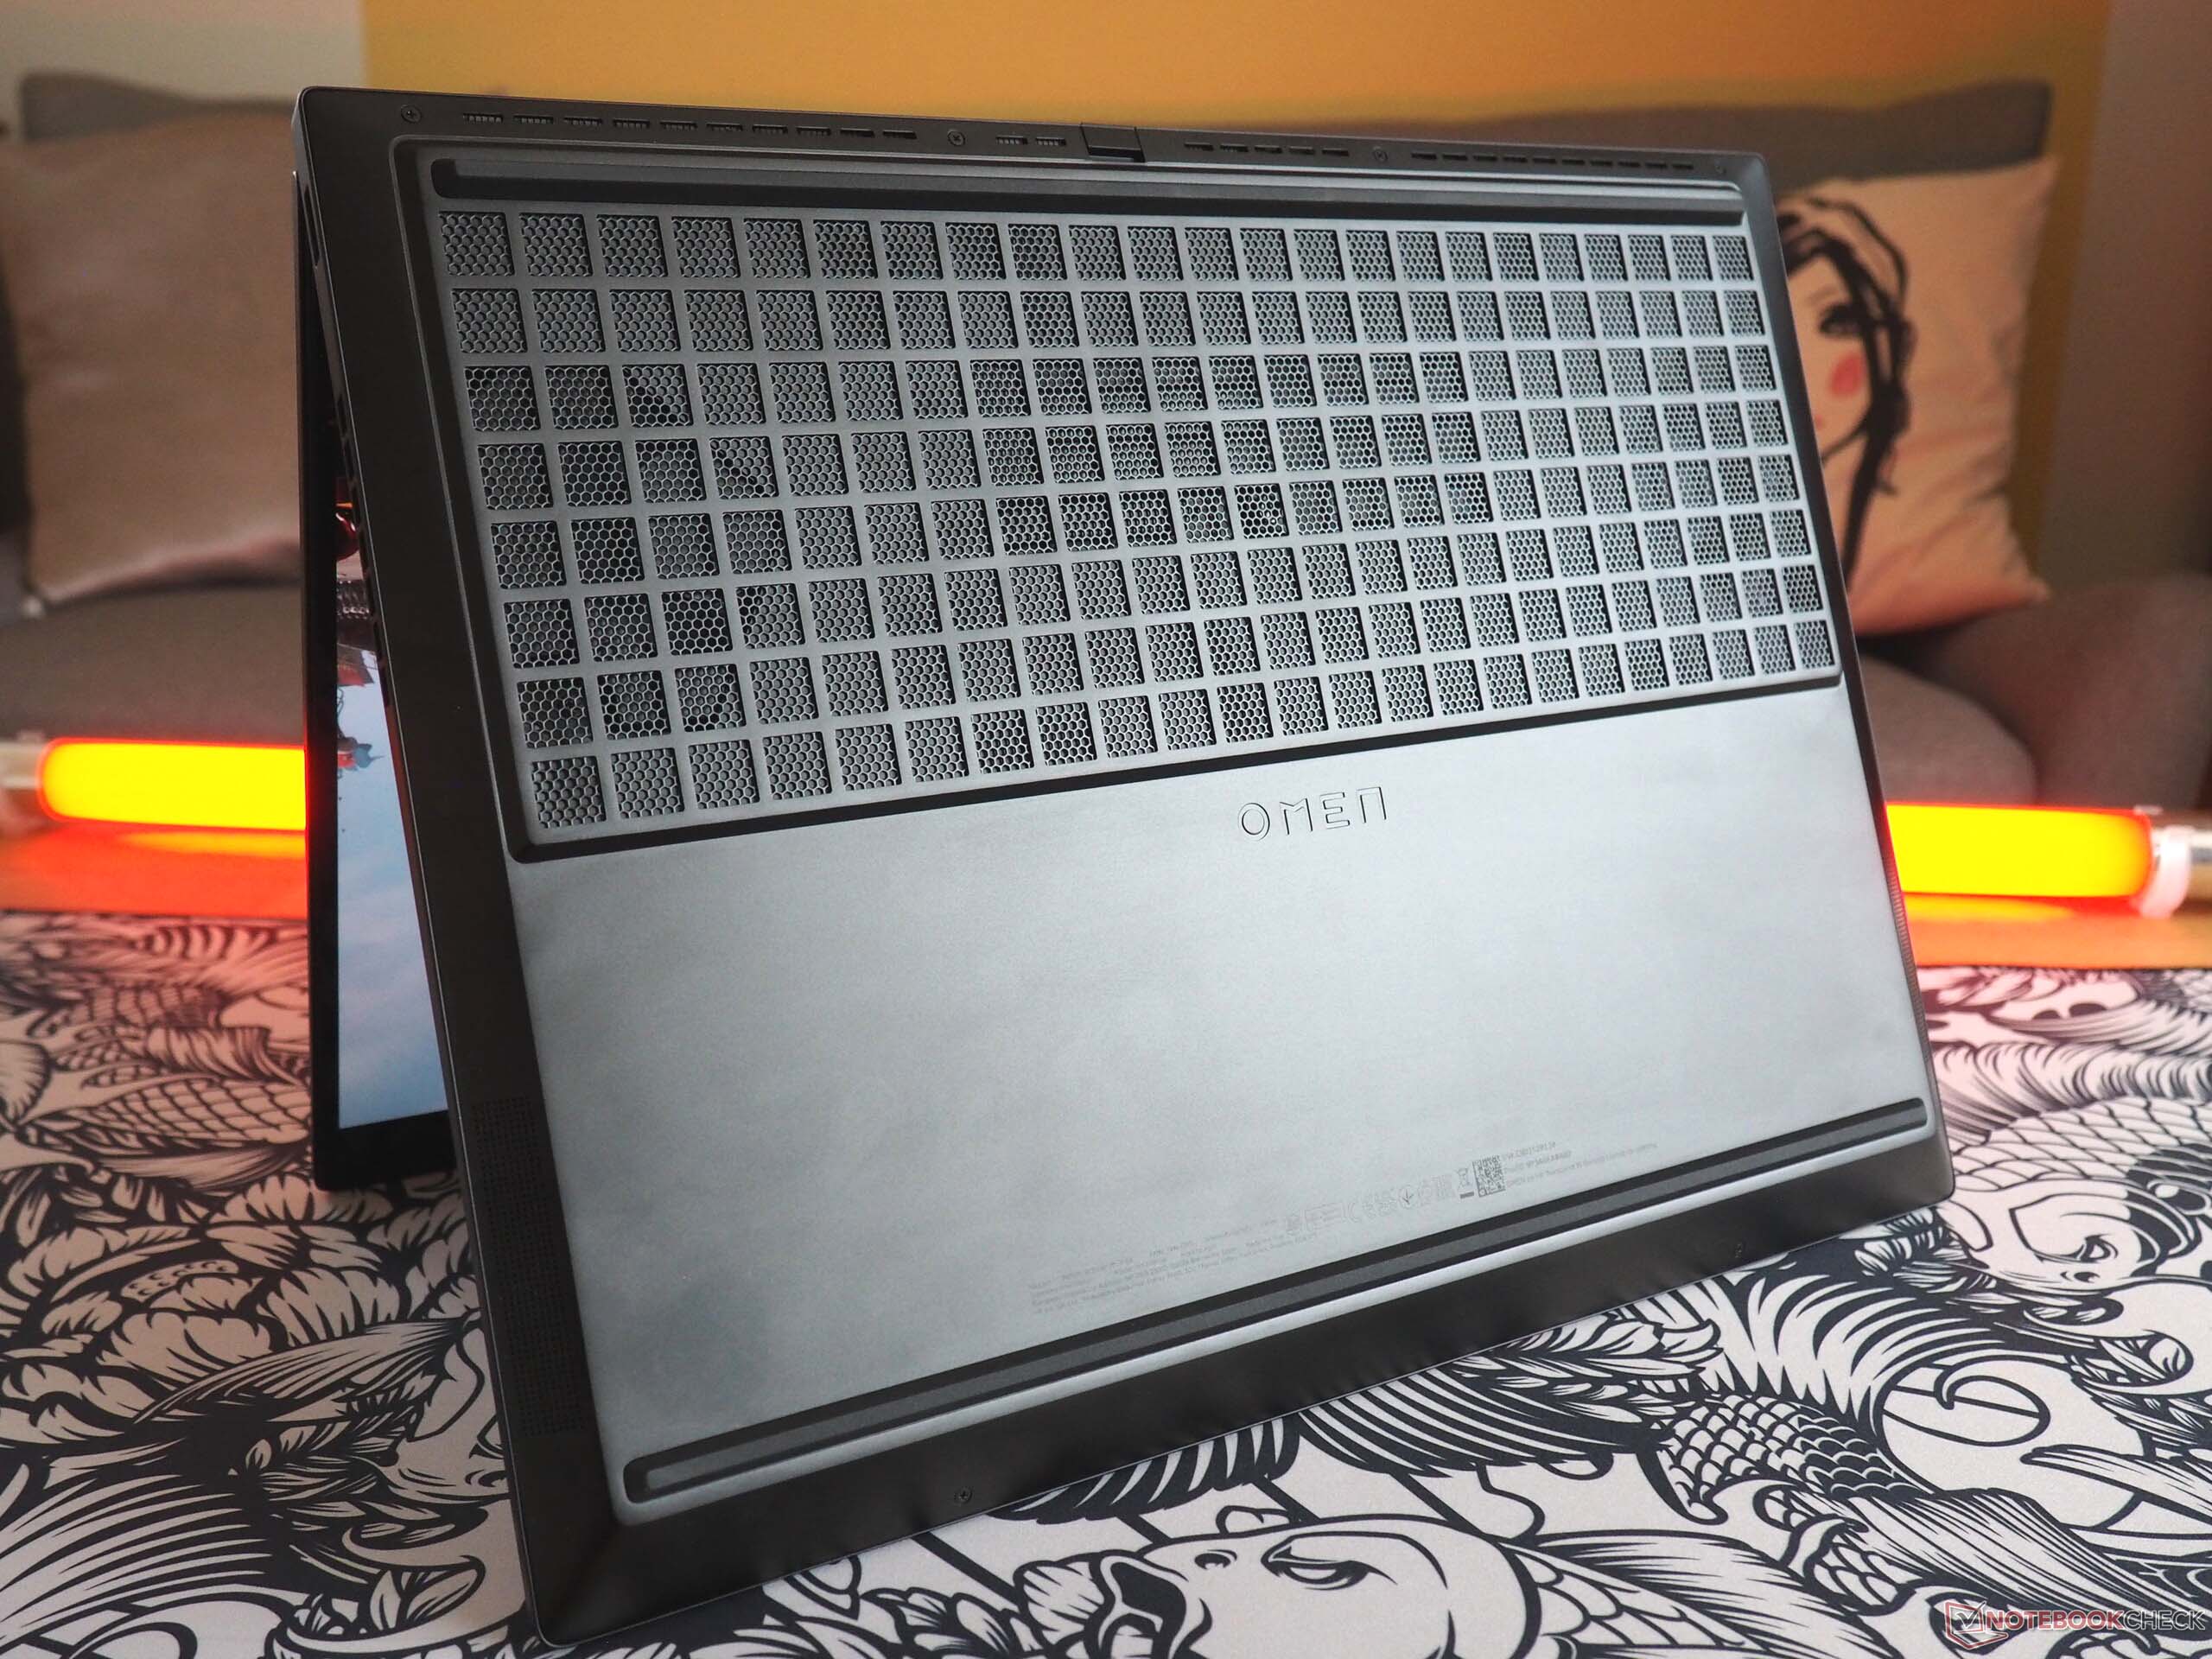
Manutenzione
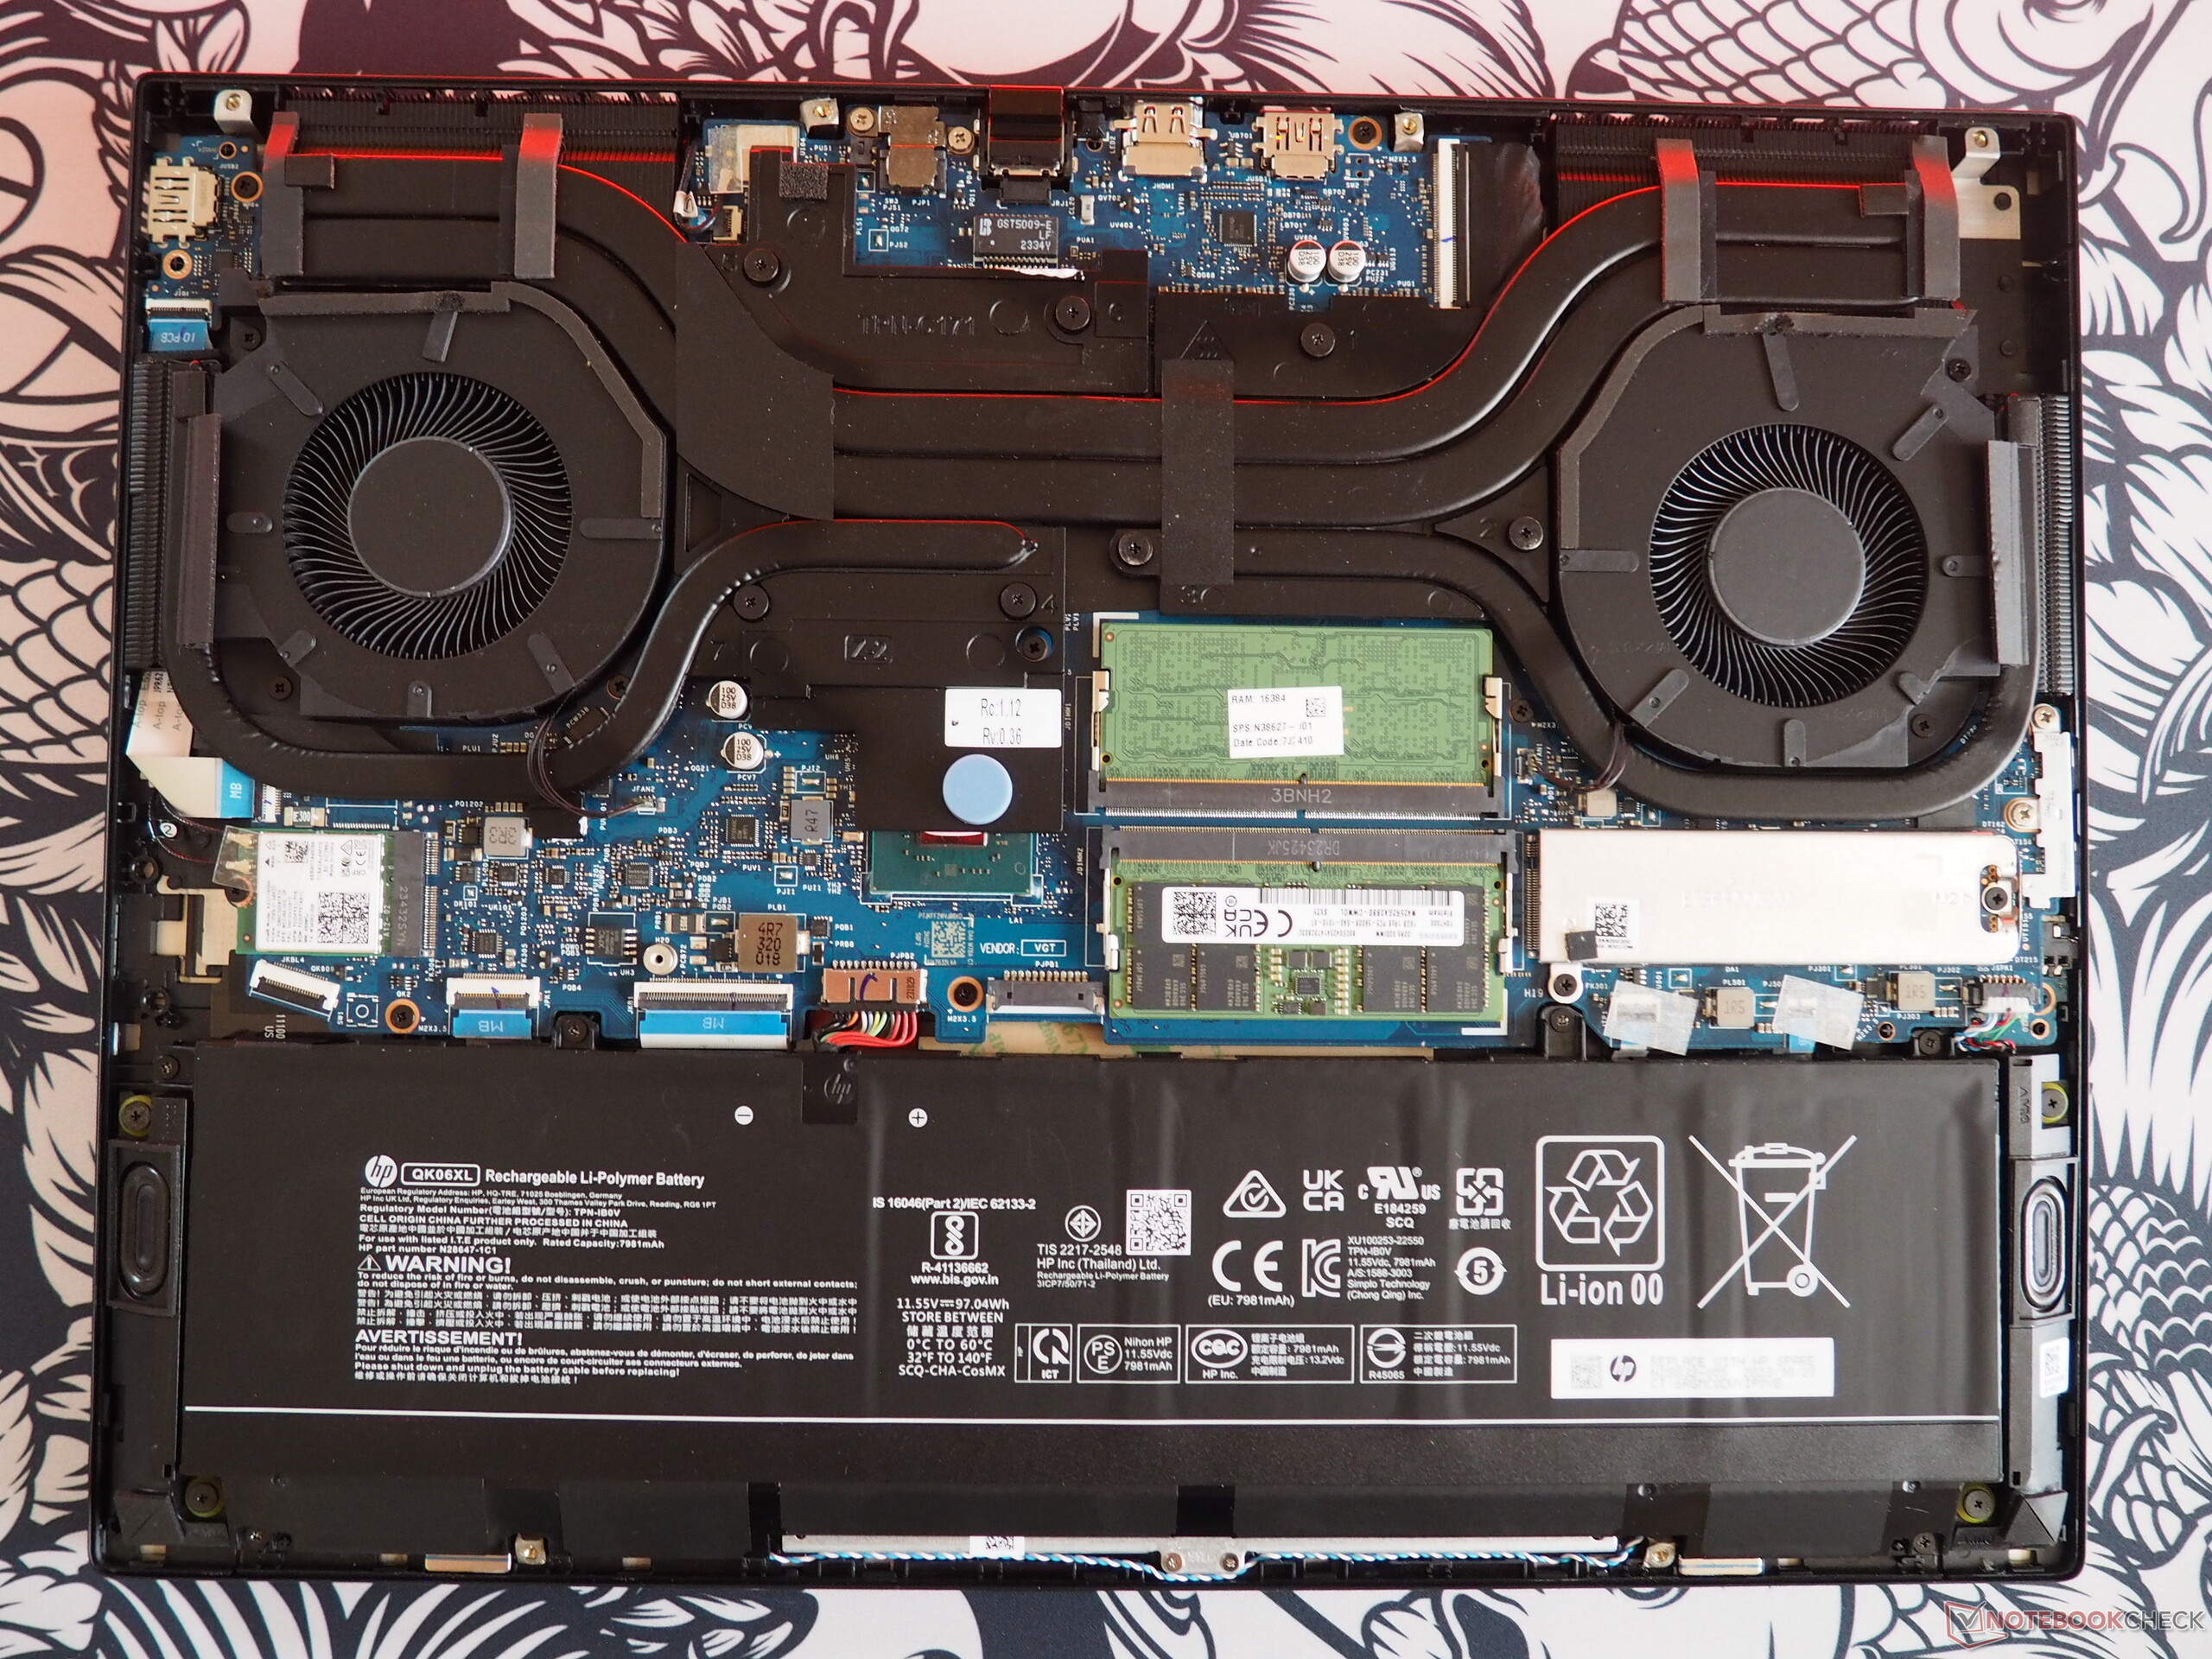
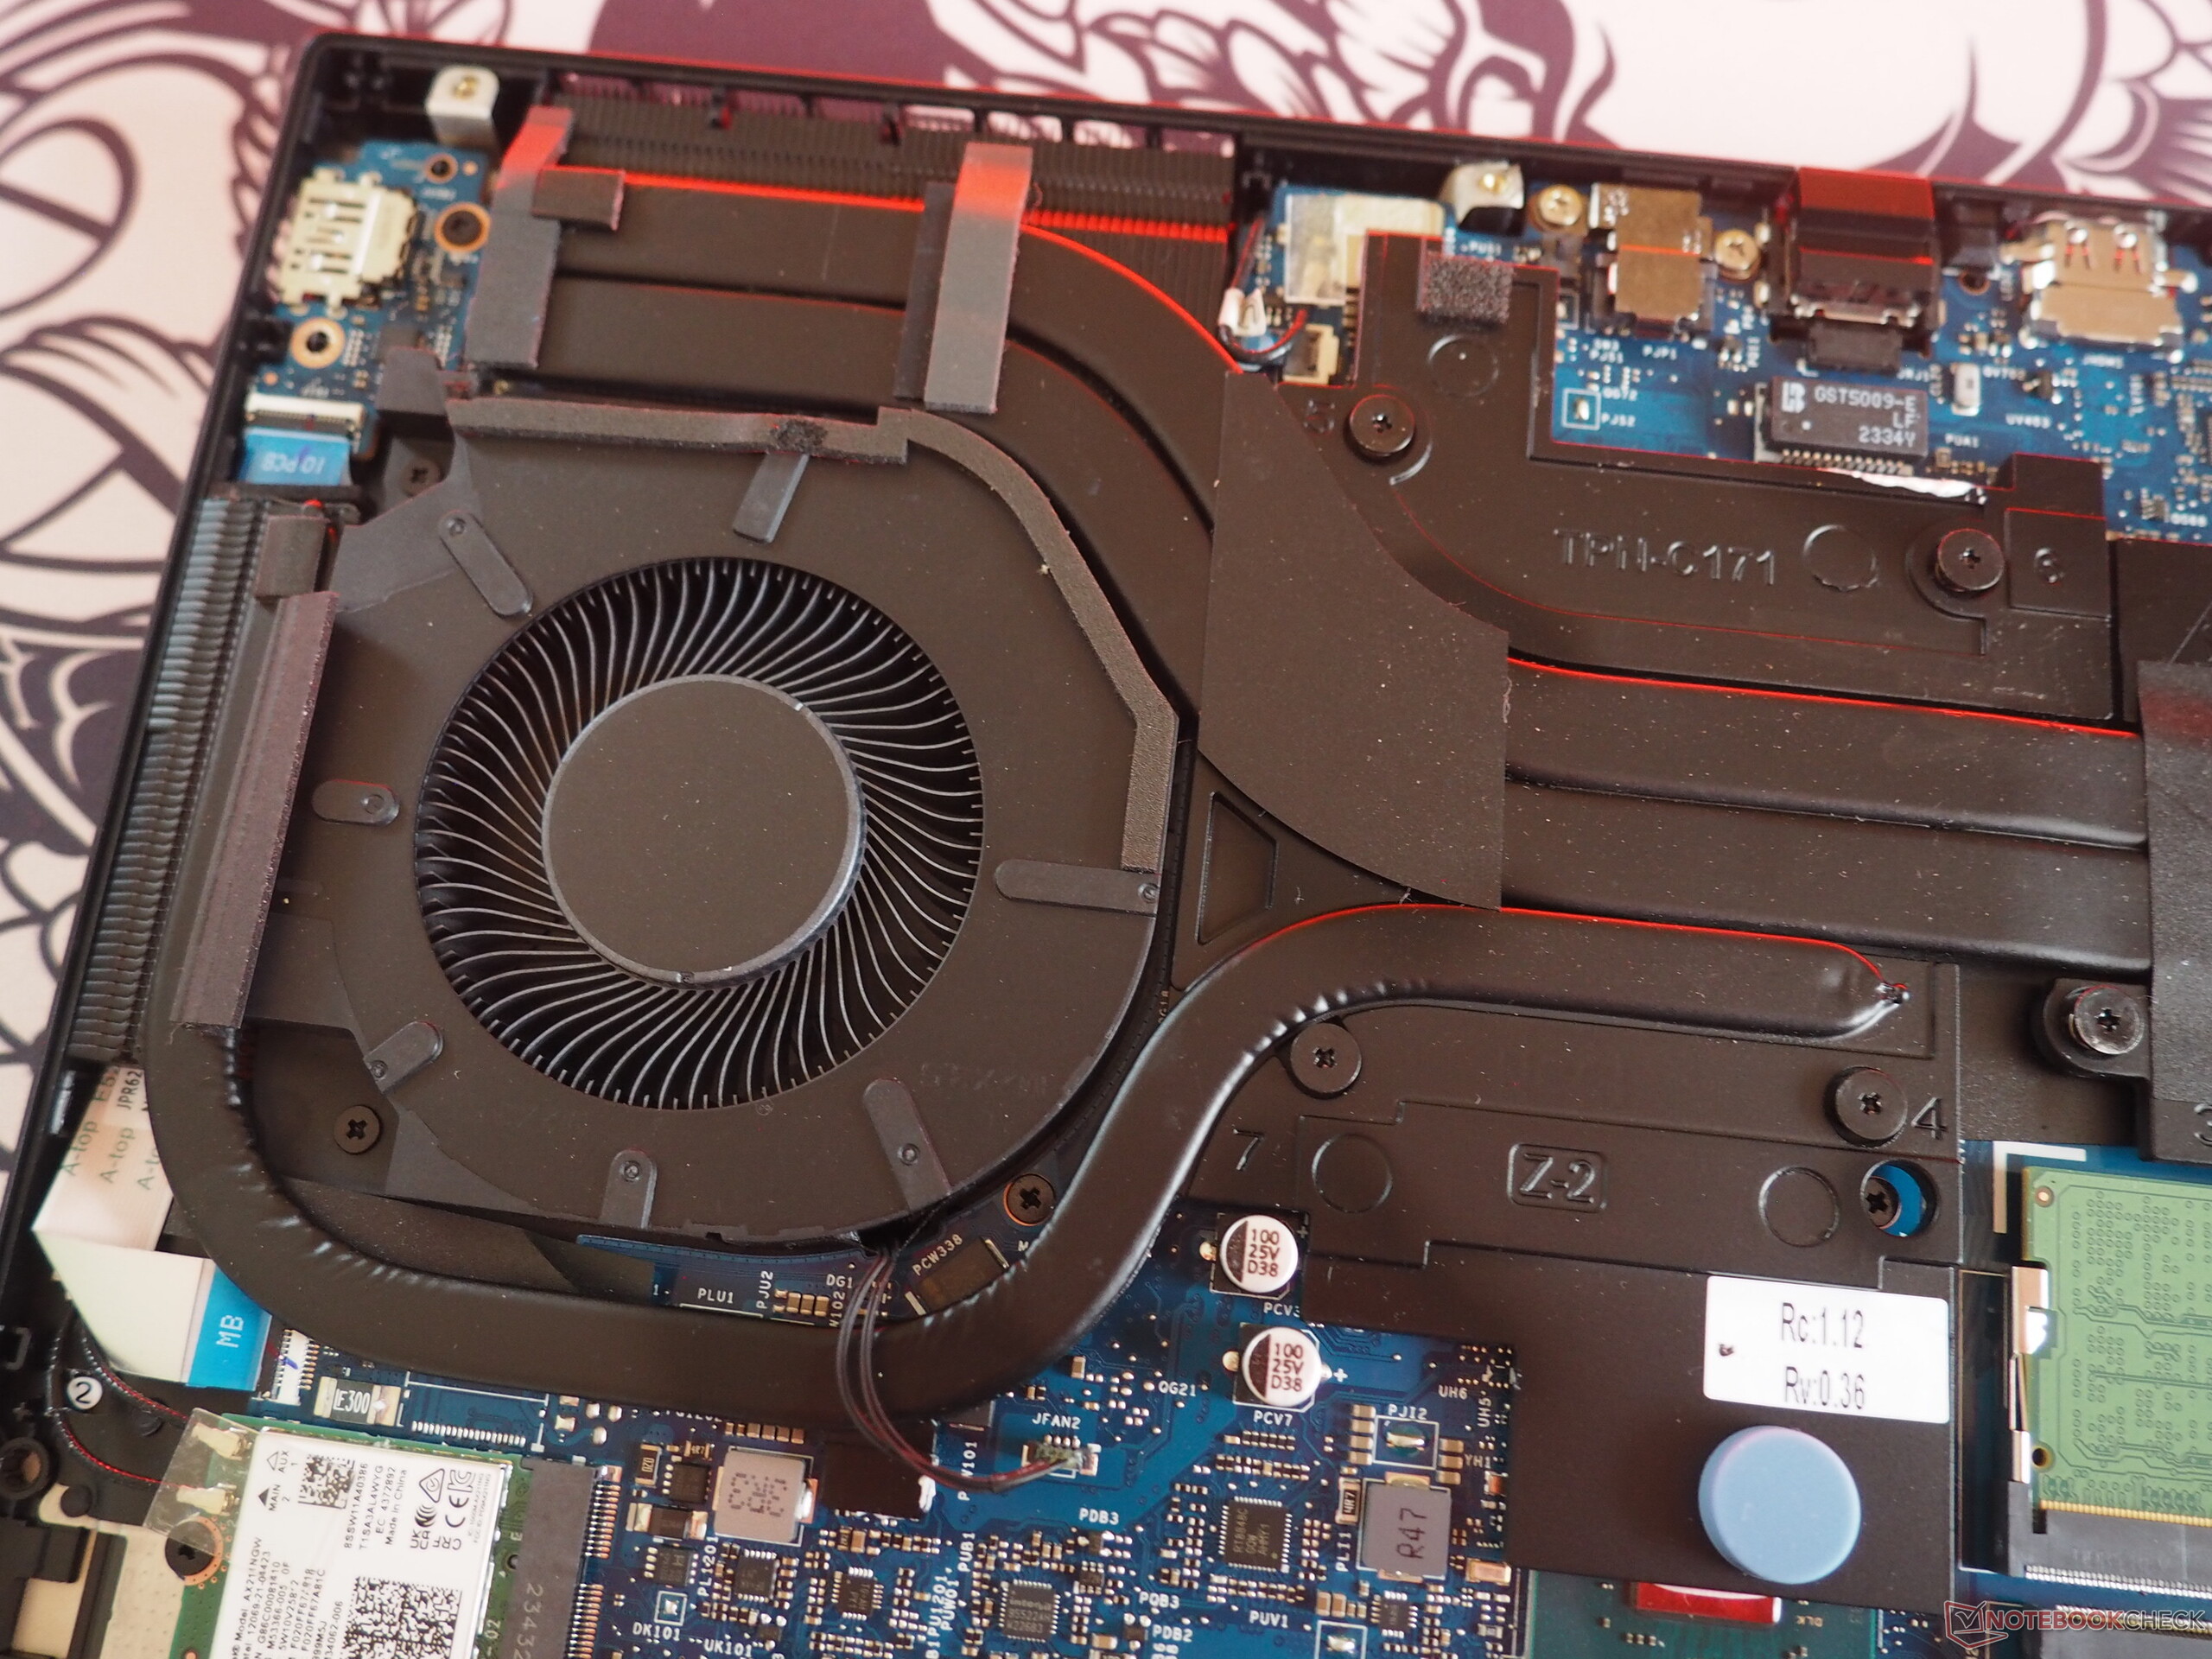
In termini di manutenzione, Omen 16 non è particolarmente complicato. Dopo essersi occupati di sei piccole viti con testa a croce, la piastra di base può essere sollevata dalla sua posizione di ancoraggio con l'aiuto di uno strumento piatto. All'interno del dispositivo, tutti i componenti importanti sono accessibili, come i banchi di RAM, la batteria, lo slot M.2, le ventole o il modulo wireless.
Garanzia
La garanzia è di 24 mesi.
Dispositivi di ingresso
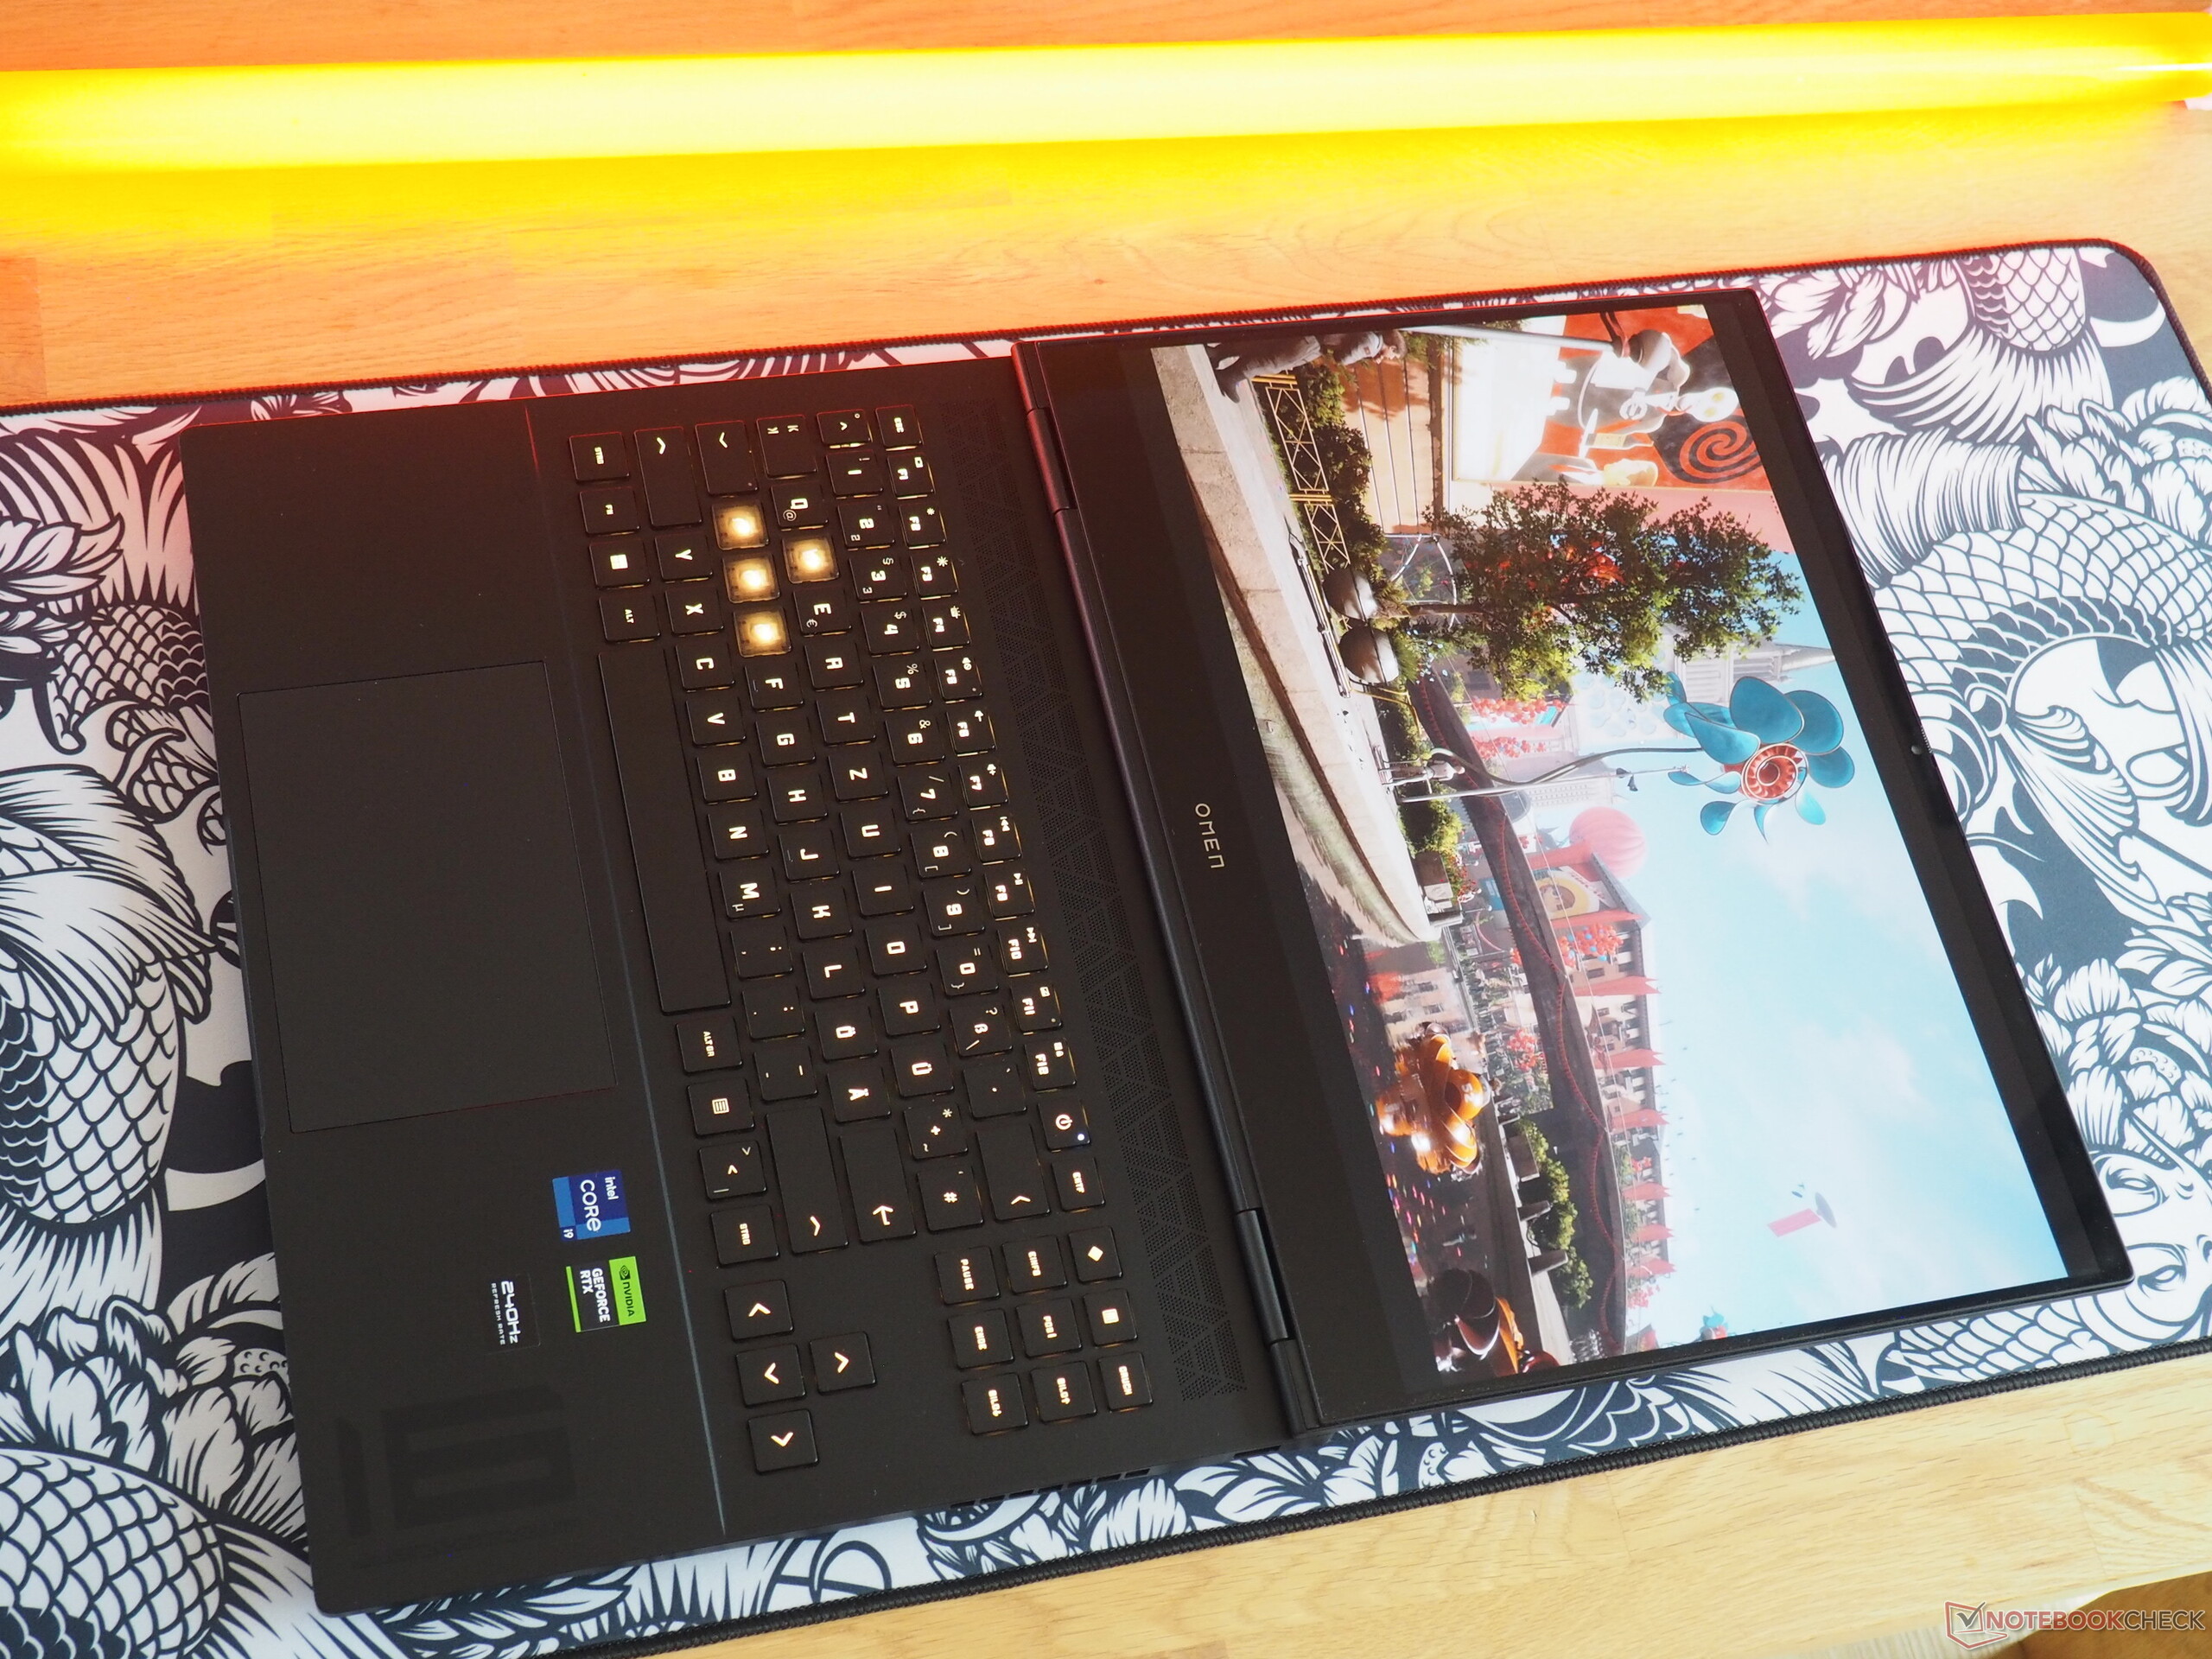
Tastiera
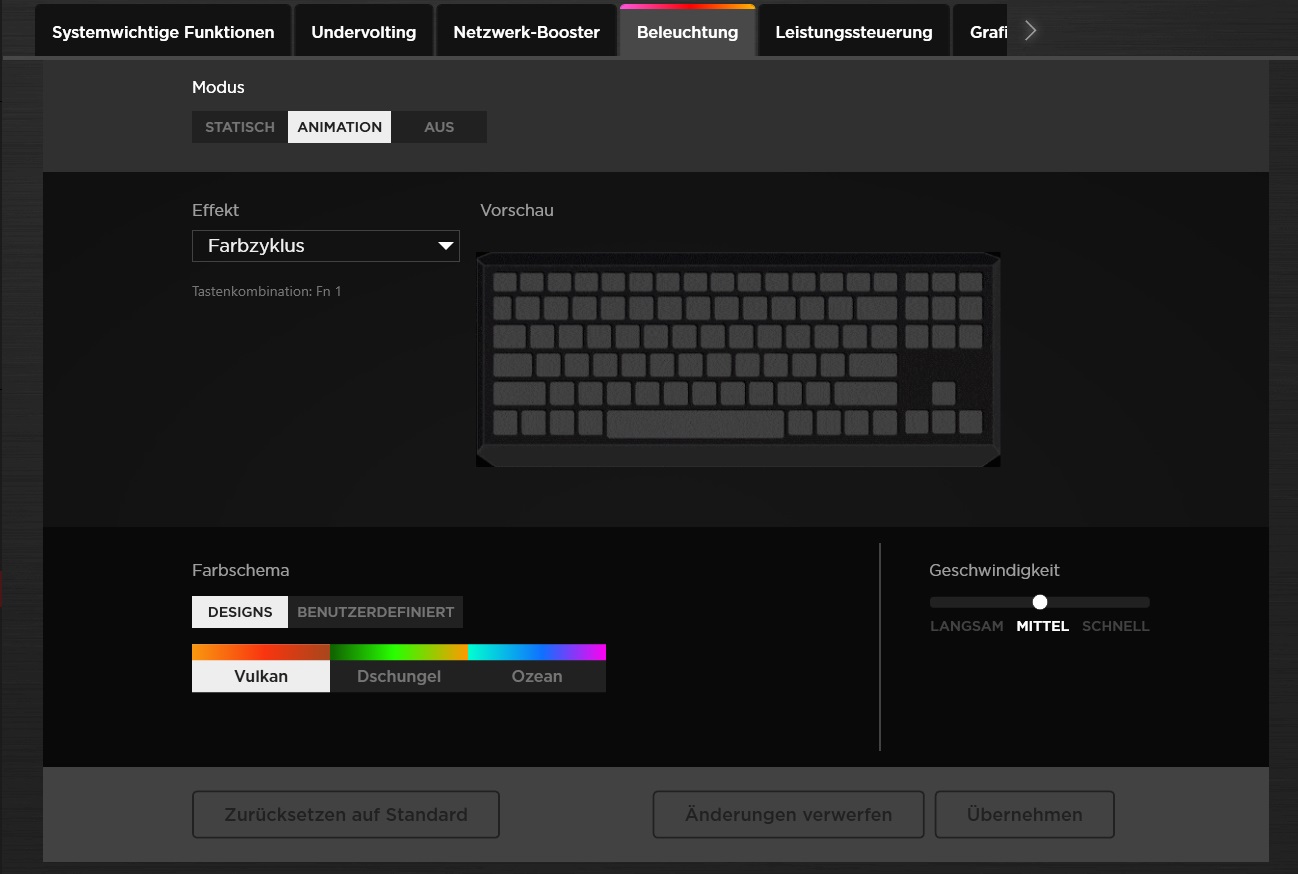
Con i suoi tasti WASD trasparenti, HP ha scelto un look da giocatore. Il layout è molto particolare e ci vuole un po' di tempo per abituarsi. Il produttore ha scelto di non installare un tastierino numerico e, invece, ha dotato il dispositivo da 16 pollici di tasti freccia separati e ben dimensionati. Altre decisioni (ad esempio, la posizione del pulsante di accensione) sono davvero difficili da comprendere. L'esperienza di digitazione è mediocre e HP ha dovuto utilizzare un modello meccanico per ottenere un feedback migliore. I fan dei tasti retroilluminati potranno contare su più colori.
Touchpad
Con una dimensione di circa 13,5 x 8,5 cm, il touchpad, piacevolmente grande, può essere definito senza pretese, per quanto riguarda la precisione, la scorrevolezza e le aree di clic. Allo stesso modo, il supporto dei gesti è intuitivo.
Display
Le opinioni divergono quando si tratta di pannelli OLED. Tra gli aspetti negativi, alcuni problemi sono le superfici molto riflettenti (che possono rendere tortuoso l'uso all'aperto), lo schermo che sfarfalla ad ogni livello di luminosità e il problema del potenziale burn-in.
| |||||||||||||||||||||||||
Distribuzione della luminosità: 98 %
Al centro con la batteria: 390 cd/m²
Contrasto: 19500:1 (Nero: 0.02 cd/m²)
ΔE ColorChecker Calman: 1.94 | ∀{0.5-29.43 Ø4.72}
calibrated: 4.21
ΔE Greyscale Calman: 1.5 | ∀{0.09-98 Ø4.97}
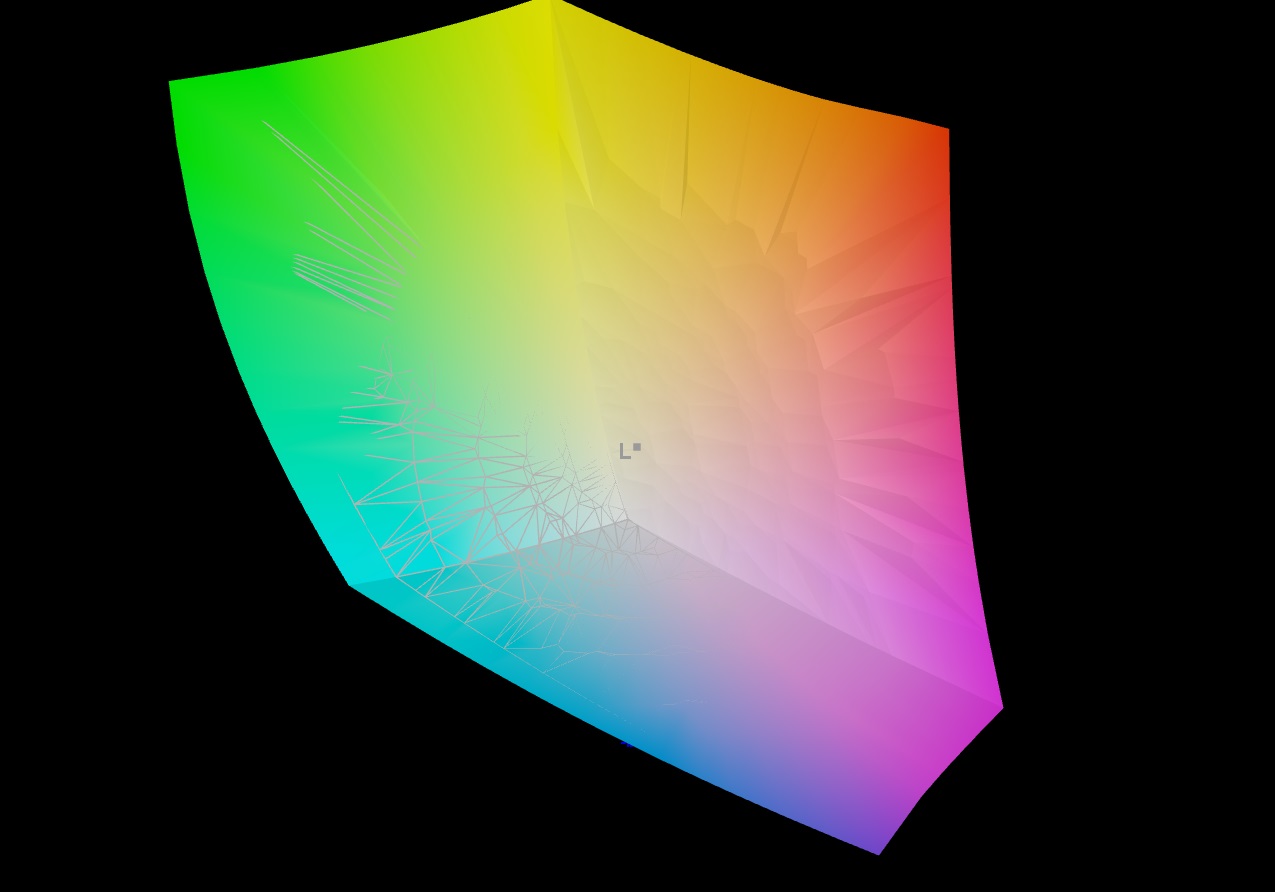
97% AdobeRGB 1998 (Argyll 3D)
100% sRGB (Argyll 3D)
99.8% Display P3 (Argyll 3D)
Gamma: 2.221
CCT: 6395 K
| HP Omen Transcend 16-u1095ng ATNA60DL02-0 (SDC41A4), OLED, 2560x1600, 16" | HP Omen Transcend 16 AUOA3A6, Mini-LED, 2560x1600, 16" | Asus ROG Zephyrus G16 2024 GU605M ATNA60DL01-0, OLED, 2560x1600, 16" | Schenker XMG CORE 16 (L23) BOE0AF0 (), IPS, 2560x1600, 16" | Lenovo Legion Pro 5 16ARX8 CSOT T3 MNG007DA1-Q, IPS, 2560x1600, 16" | |
|---|---|---|---|---|---|
| Display | -4% | 0% | -20% | -18% | |
| Display P3 Coverage (%) | 99.8 | 99.2 -1% | 99.9 0% | 68.3 -32% | 70.4 -29% |
| sRGB Coverage (%) | 100 | 100 0% | 100 0% | 98.6 -1% | 99.6 0% |
| AdobeRGB 1998 Coverage (%) | 97 | 87.6 -10% | 96.9 0% | 69.6 -28% | 72.6 -25% |
| Response Times | -13550% | -18% | -4850% | -3925% | |
| Response Time Grey 50% / Grey 80% * (ms) | 0.2 ? | 26.4 ? -13100% | 0.22 ? -10% | 13.2 ? -6500% | 7 ? -3400% |
| Response Time Black / White * (ms) | 0.2 ? | 28.2 ? -14000% | 0.25 ? -25% | 6.6 ? -3200% | 9.1 ? -4450% |
| PWM Frequency (Hz) | 120 ? | 3506 ? | 960 ? | ||
| Screen | -47% | 0% | -203% | -161% | |
| Brightness middle (cd/m²) | 390 | 791.1 103% | 416 7% | 376 -4% | 355.3 -9% |
| Brightness (cd/m²) | 392 | 800 104% | 418 7% | 358 -9% | 340 -13% |
| Brightness Distribution (%) | 98 | 95 -3% | 96 -2% | 88 -10% | 91 -7% |
| Black Level * (cd/m²) | 0.02 | 0.04 -100% | 0.33 -1550% | 0.32 -1500% | |
| Contrast (:1) | 19500 | 19778 1% | 1139 -94% | 1110 -94% | |
| Colorchecker dE 2000 * | 1.94 | 4.37 -125% | 1.6 18% | 2.74 -41% | 1.13 42% |
| Colorchecker dE 2000 max. * | 4.26 | 10.39 -144% | 2.1 51% | 6.78 -59% | 2.78 35% |
| Colorchecker dE 2000 calibrated * | 4.21 | 1.04 75% | 0.88 79% | 0.32 92% | |
| Greyscale dE 2000 * | 1.5 | 6.5 -333% | 2.7 -80% | 3.57 -138% | 1.4 7% |
| Gamma | 2.221 99% | 2.28 96% | 2.16 102% | 2.4 92% | 2.24 98% |
| CCT | 6395 102% | 6000 108% | 6331 103% | 7246 90% | 6372 102% |
| Media totale (Programma / Settaggio) | -4534% /
-1967% | -6% /
-3% | -1691% /
-828% | -1368% /
-668% |
* ... Meglio usare valori piccoli
In cambio, la tecnologia OLED ottiene un ottimo punteggio con livelli di nero meravigliosi (quasi 0,0 cd/m²) che portano ad un eccellente rapporto di contrasto a cui i pannelli IPS non si avvicinano. Lo stesso vale per la stabilità dell'angolo di visione.
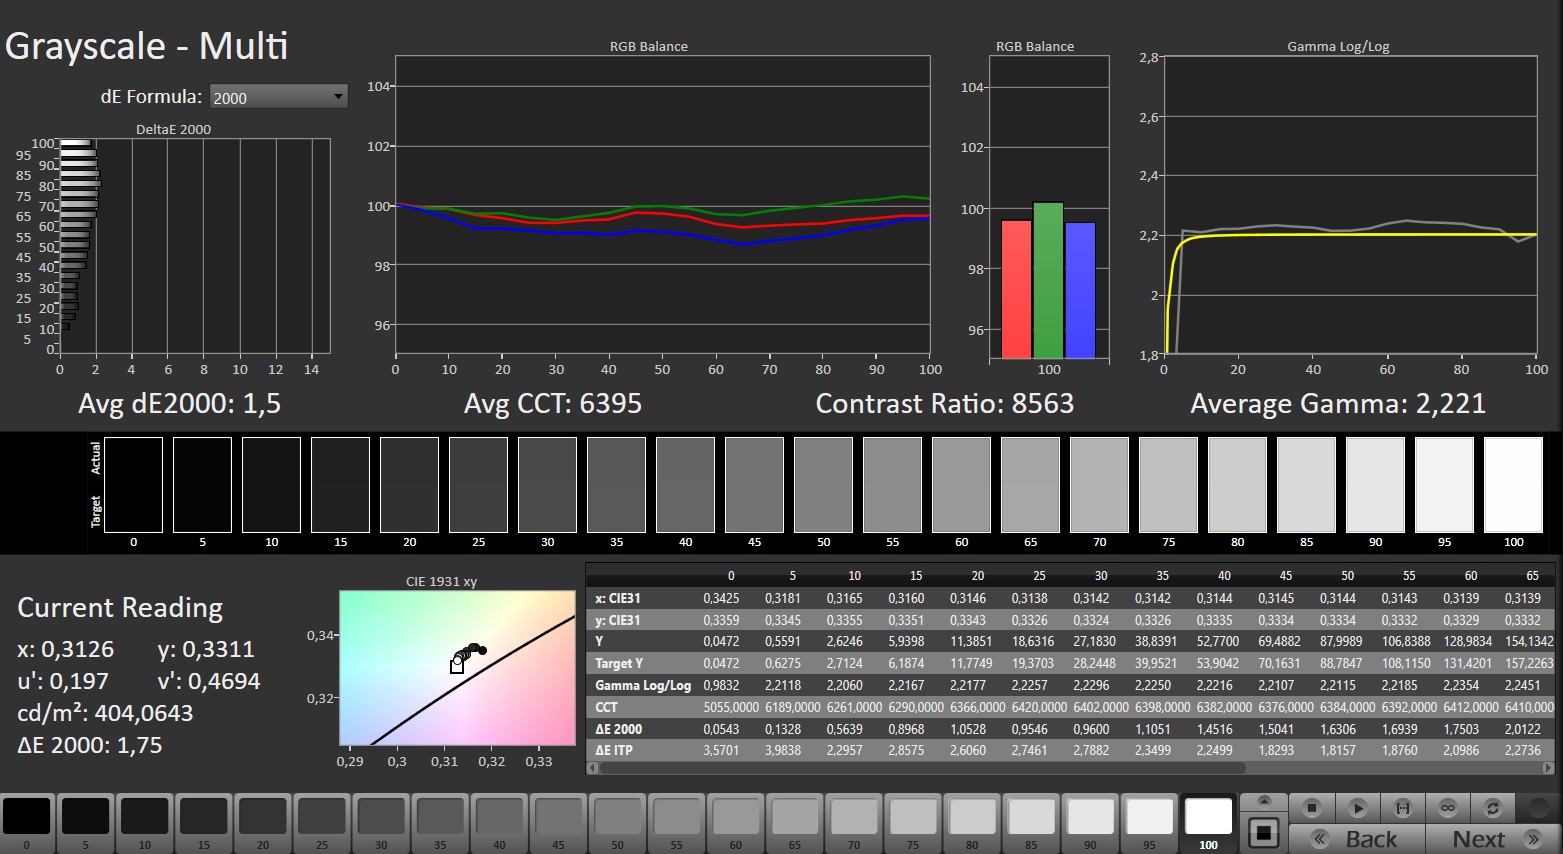
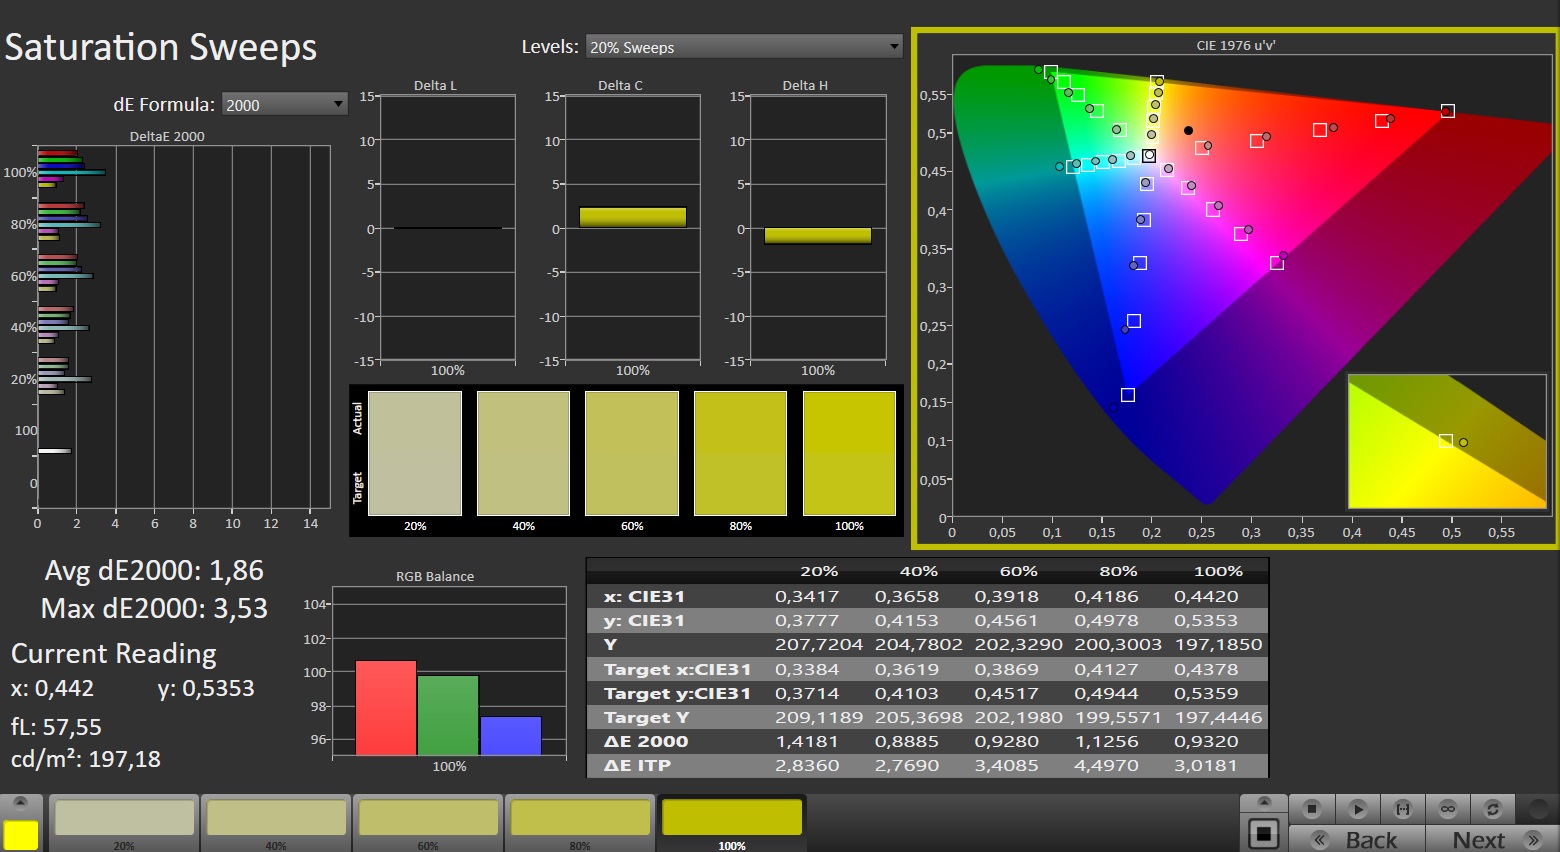
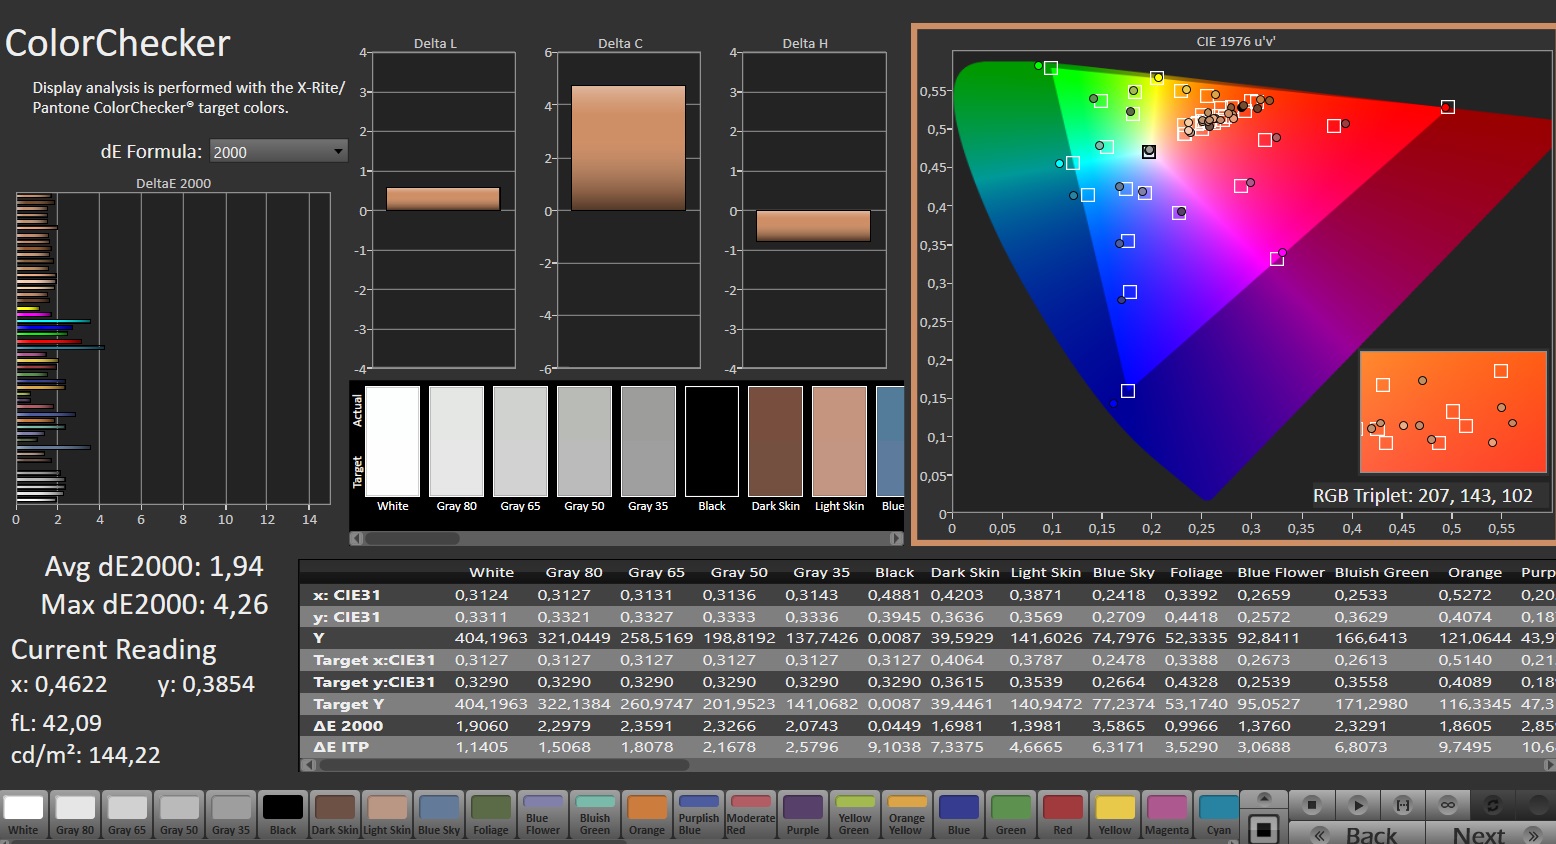
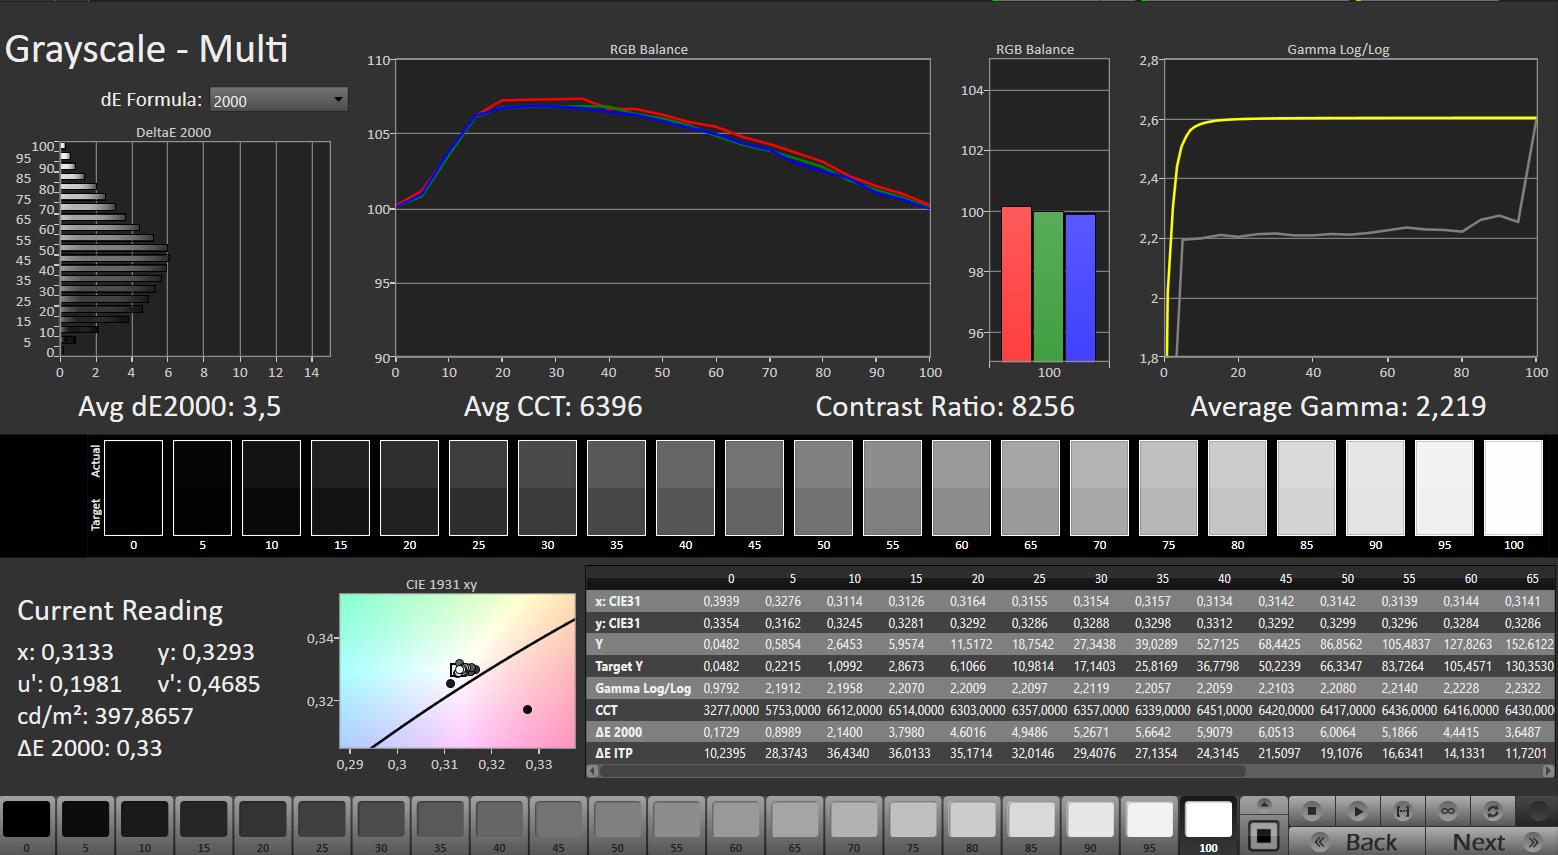
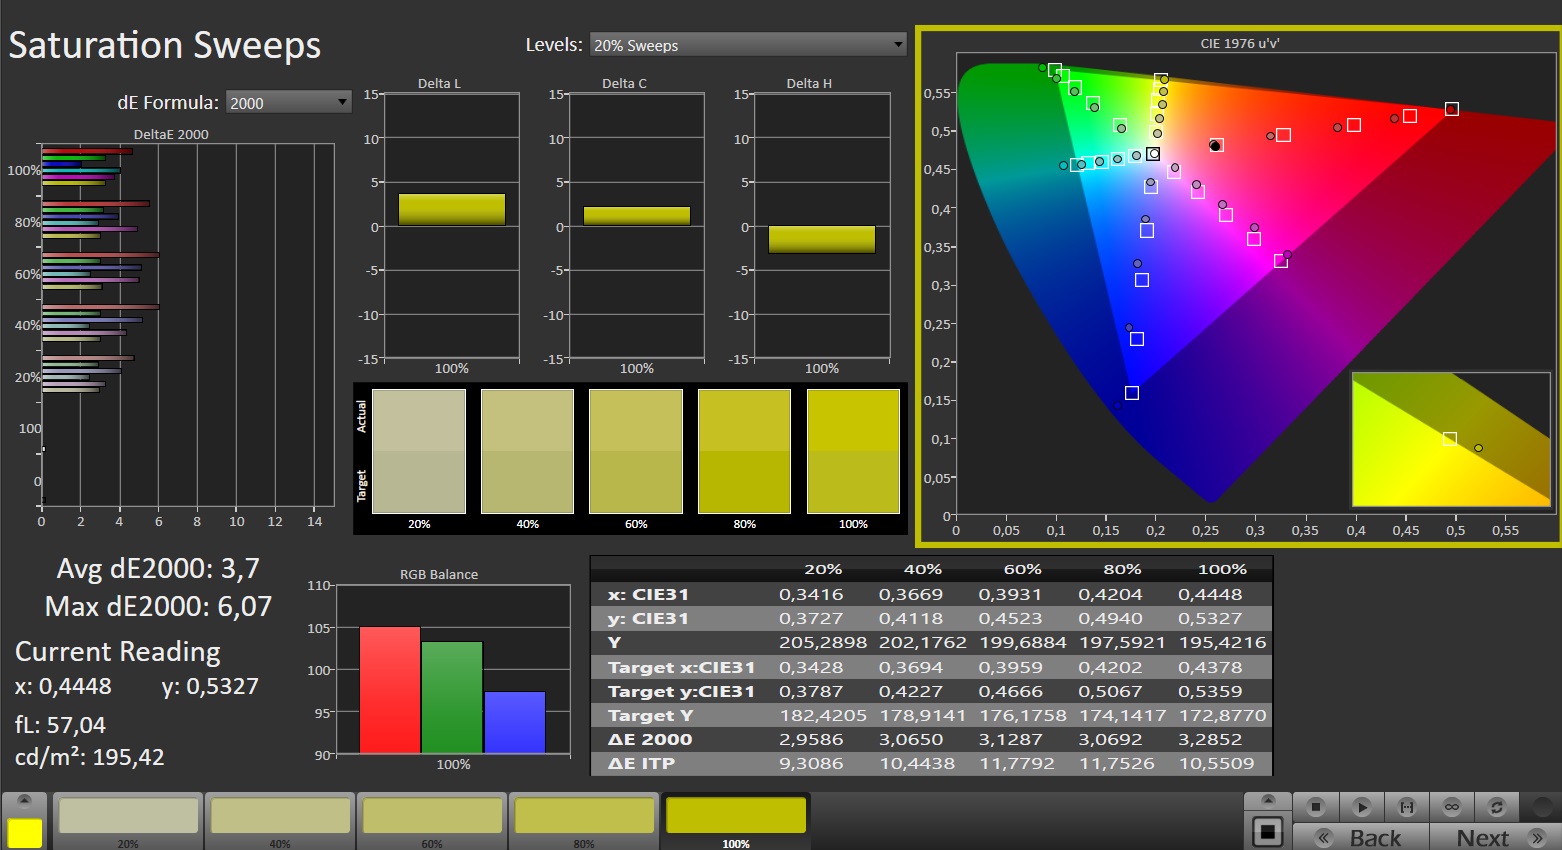
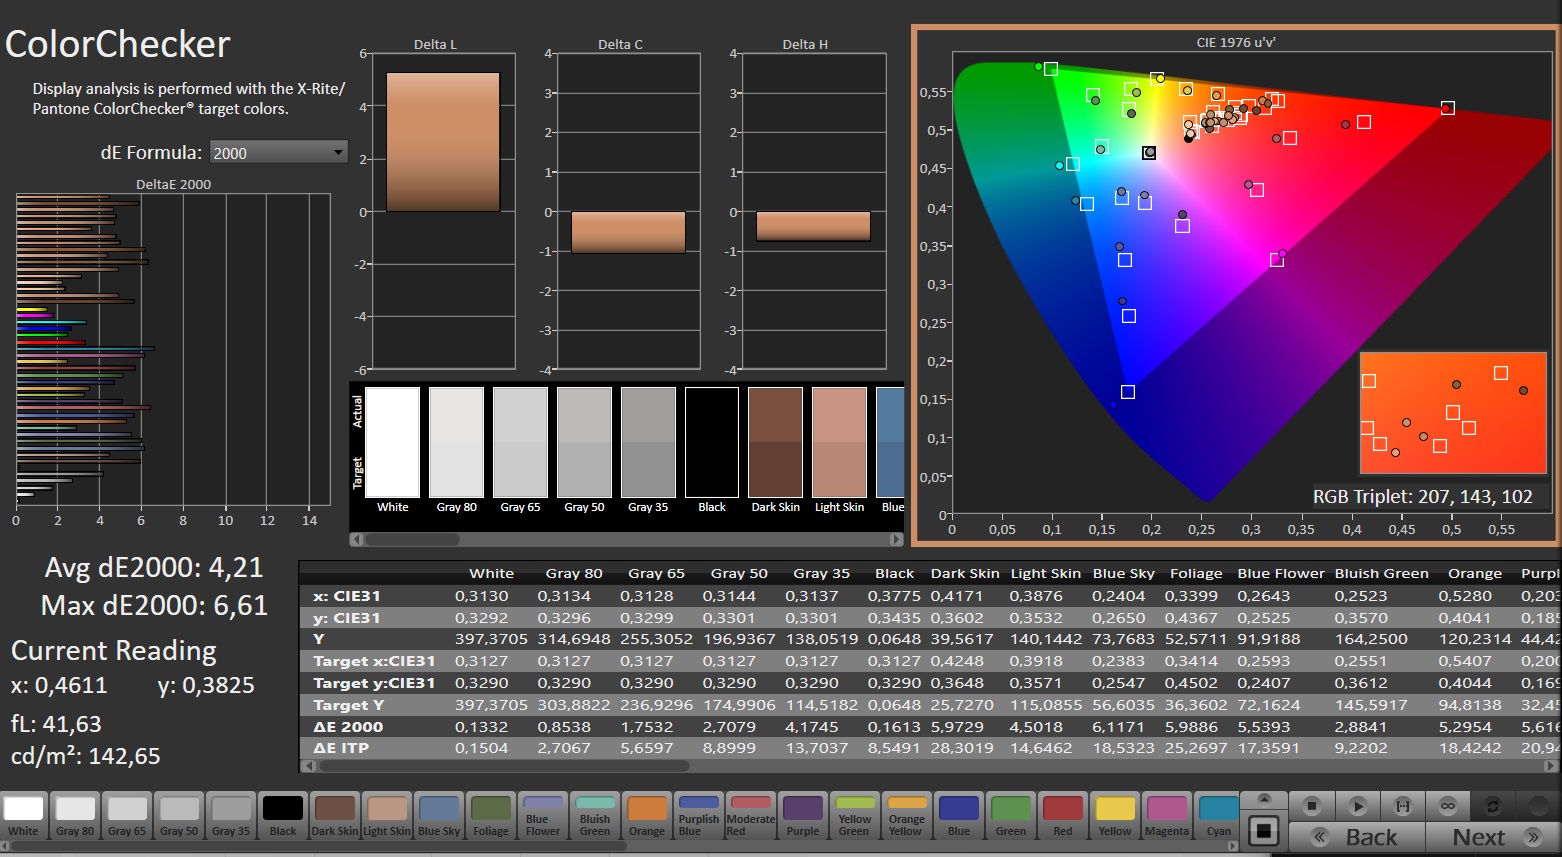
Un ulteriore punto di forza è la ricchezza dello spazio colore: il 100% di DCI P3 e il 97% di AdobeRGB non sono qualcosa di scontato nel mondo dei giochi. Le cose sono simili nell'area dell'accuratezza del colore, che era già impressionante prima della calibrazione.


Un plauso va anche ai brevi tempi di risposta: I pannelli IPS classici possono solo sognare 0,2 ms. Il display mini LED del predecessore era notevolmente più luminoso (800 contro 392 cd/m²), ma anche molto più lento.

Tempi di risposta del Display
| ↔ Tempi di risposta dal Nero al Bianco | ||
|---|---|---|
| 0.2 ms ... aumenta ↗ e diminuisce ↘ combinato | ↗ 0.1 ms Incremento | 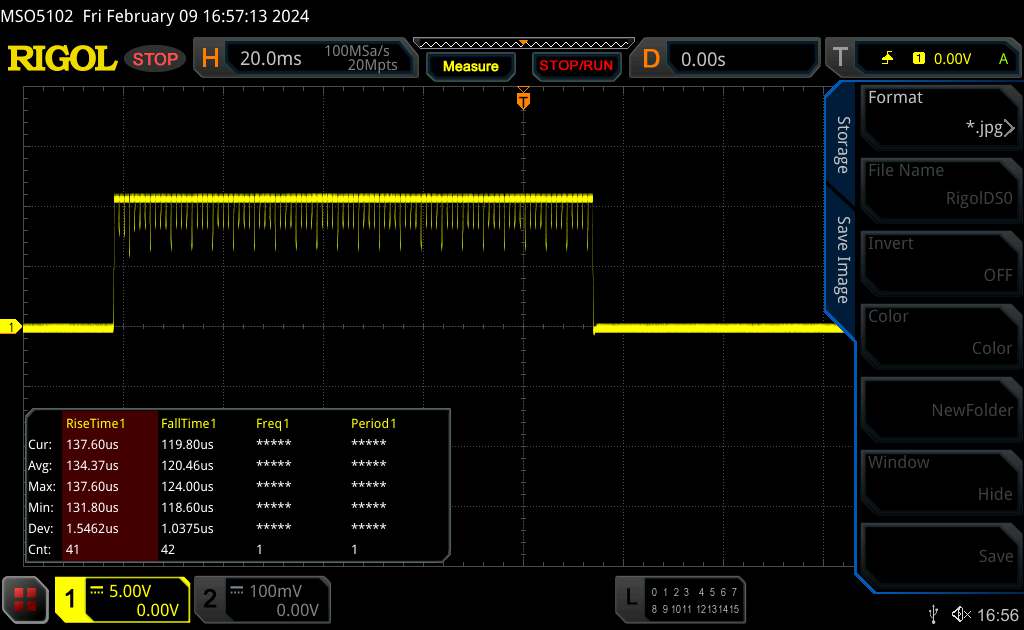 |
| ↘ 0.1 ms Calo | ||
| Lo schermo ha mostrato valori di risposta molto veloci nei nostri tests ed è molto adatto per i gaming veloce. In confronto, tutti i dispositivi di test variano da 0.1 (minimo) a 240 (massimo) ms. » 0 % di tutti i dispositivi è migliore. Questo significa che i tempi di risposta rilevati sono migliori rispettto alla media di tutti i dispositivi testati (19.8 ms). | ||
| ↔ Tempo di risposta dal 50% Grigio all'80% Grigio | ||
| 0.2 ms ... aumenta ↗ e diminuisce ↘ combinato | ↗ 0.1 ms Incremento | 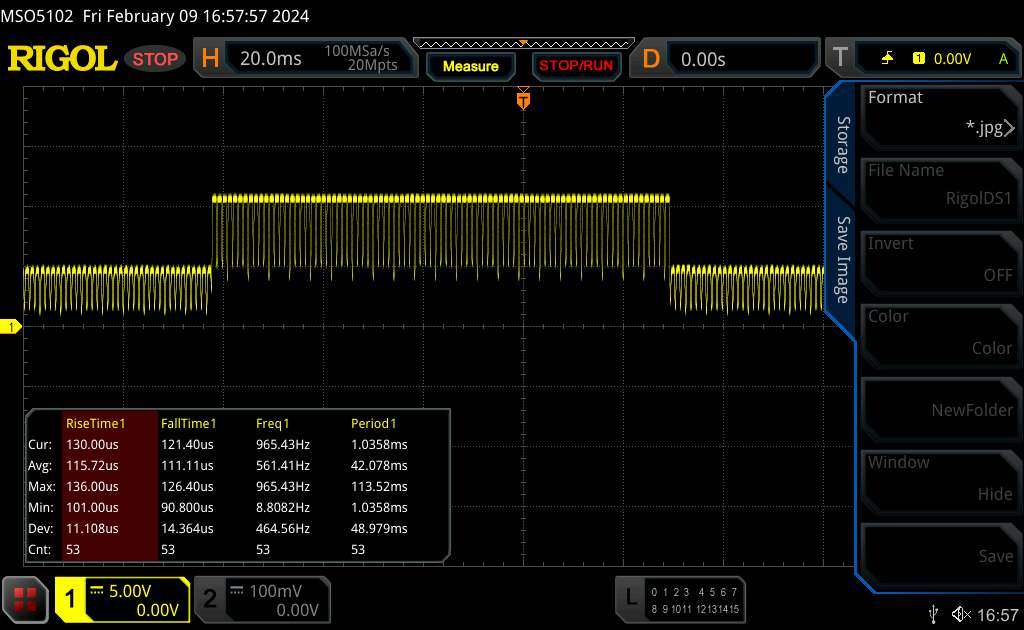 |
| ↘ 0.1 ms Calo | ||
| Lo schermo ha mostrato valori di risposta molto veloci nei nostri tests ed è molto adatto per i gaming veloce. In confronto, tutti i dispositivi di test variano da 0.165 (minimo) a 636 (massimo) ms. » 0 % di tutti i dispositivi è migliore. Questo significa che i tempi di risposta rilevati sono migliori rispettto alla media di tutti i dispositivi testati (31 ms). | ||
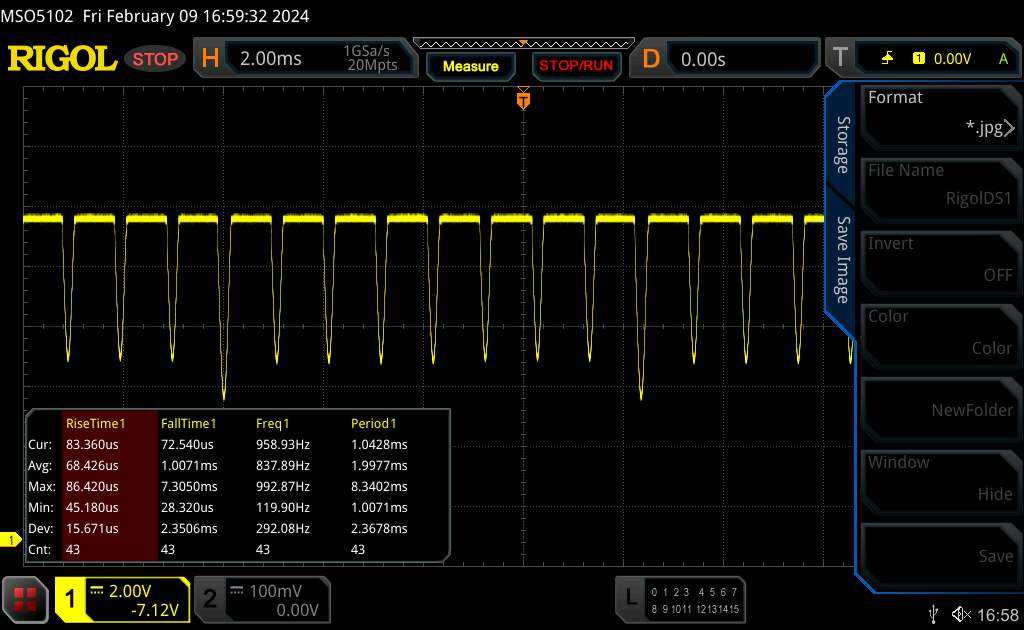
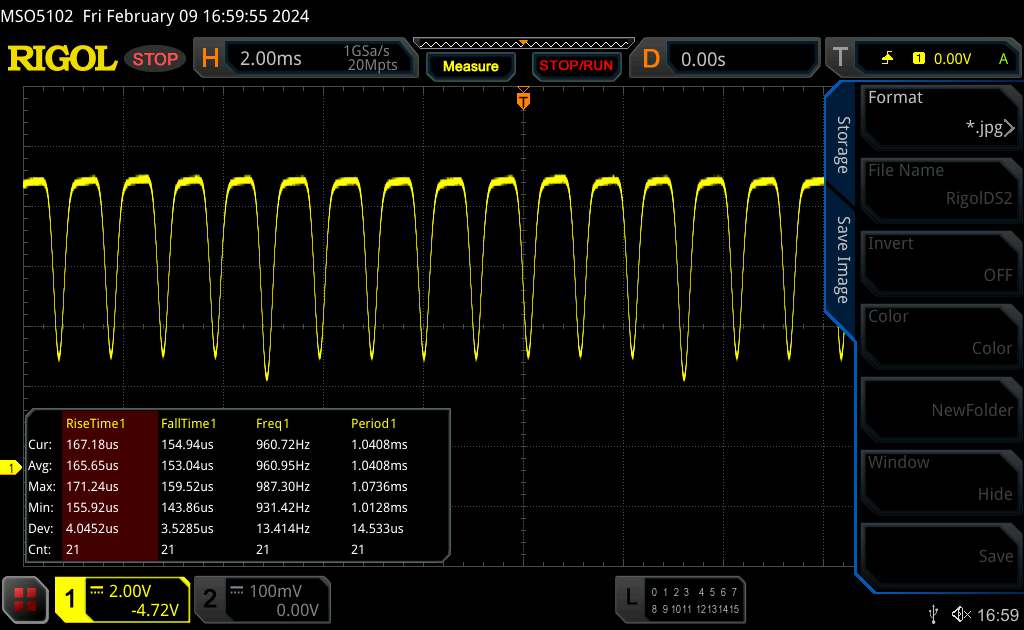
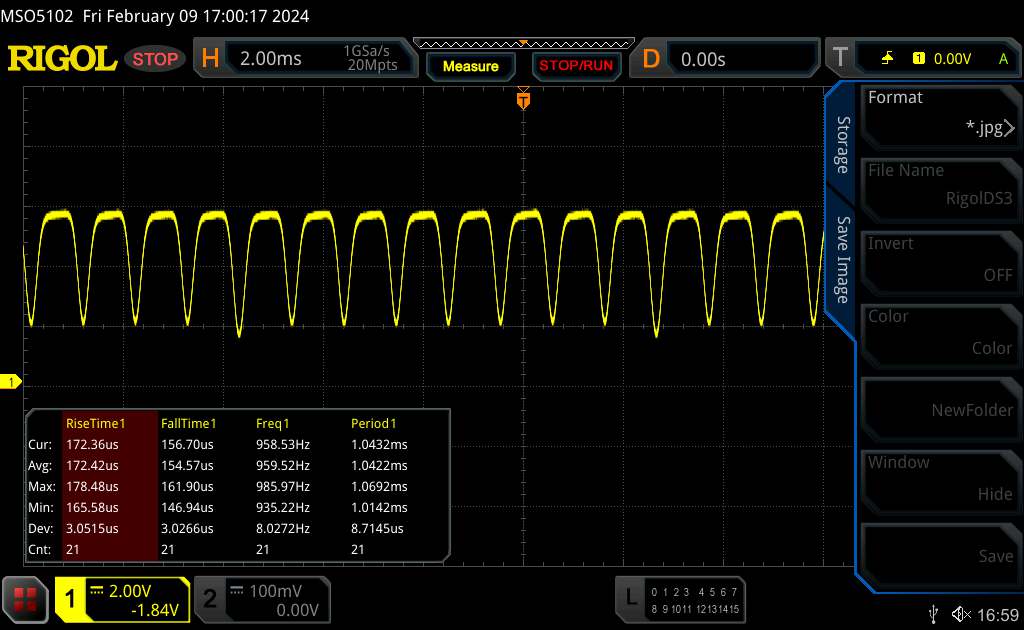
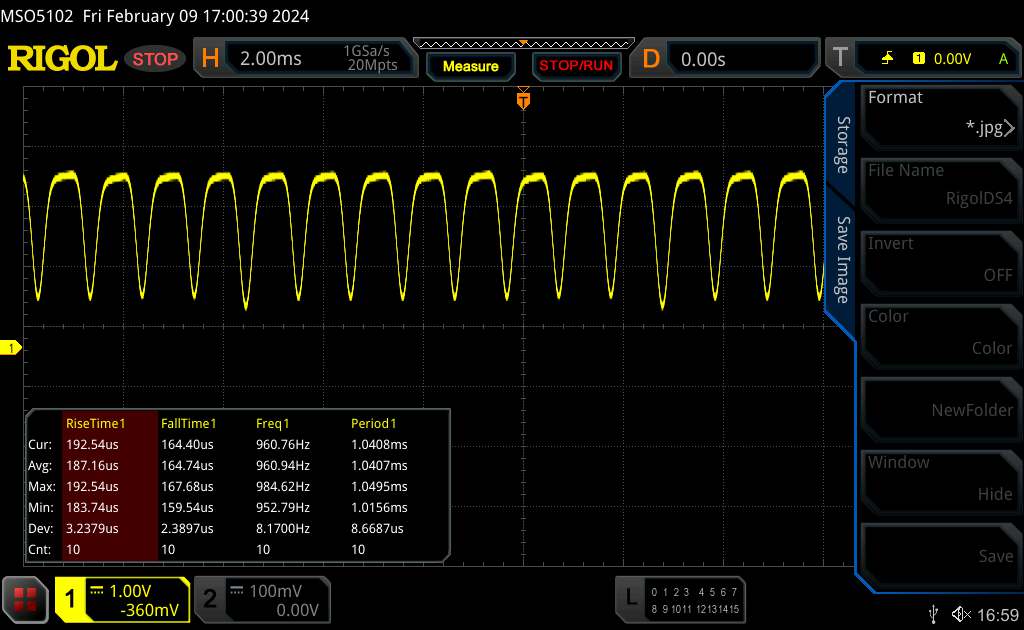
Sfarfallio dello schermo / PWM (Pulse-Width Modulation)
| flickering dello schermo / PWM rilevato | 120 Hz | ≤ 100 % settaggio luminosita' | 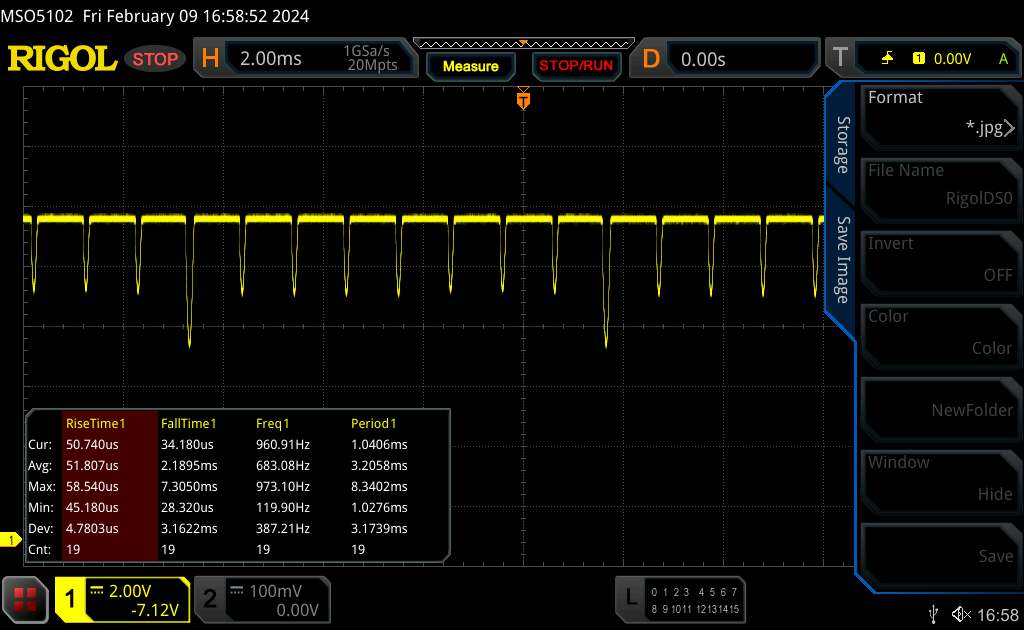 |
Il display sfarfalla a 120 Hz (Probabilmente a causa dell'uso di PWM) Flickering rilevato ad una luminosita' di 100 % o inferiore. Non dovrebbe verificarsi flickering o PWM sopra questo valore di luminosita'. La frequenza di 120 Hz è molto bassa, quindi il flickering potrebbe causare stanchezza agli occhi e mal di testa con un utilizzo prolungato. In confronto: 52 % di tutti i dispositivi testati non utilizza PWM per ridurre la luminosita' del display. Se è rilevato PWM, una media di 7772 (minimo: 5 - massimo: 343500) Hz è stata rilevata. | |||
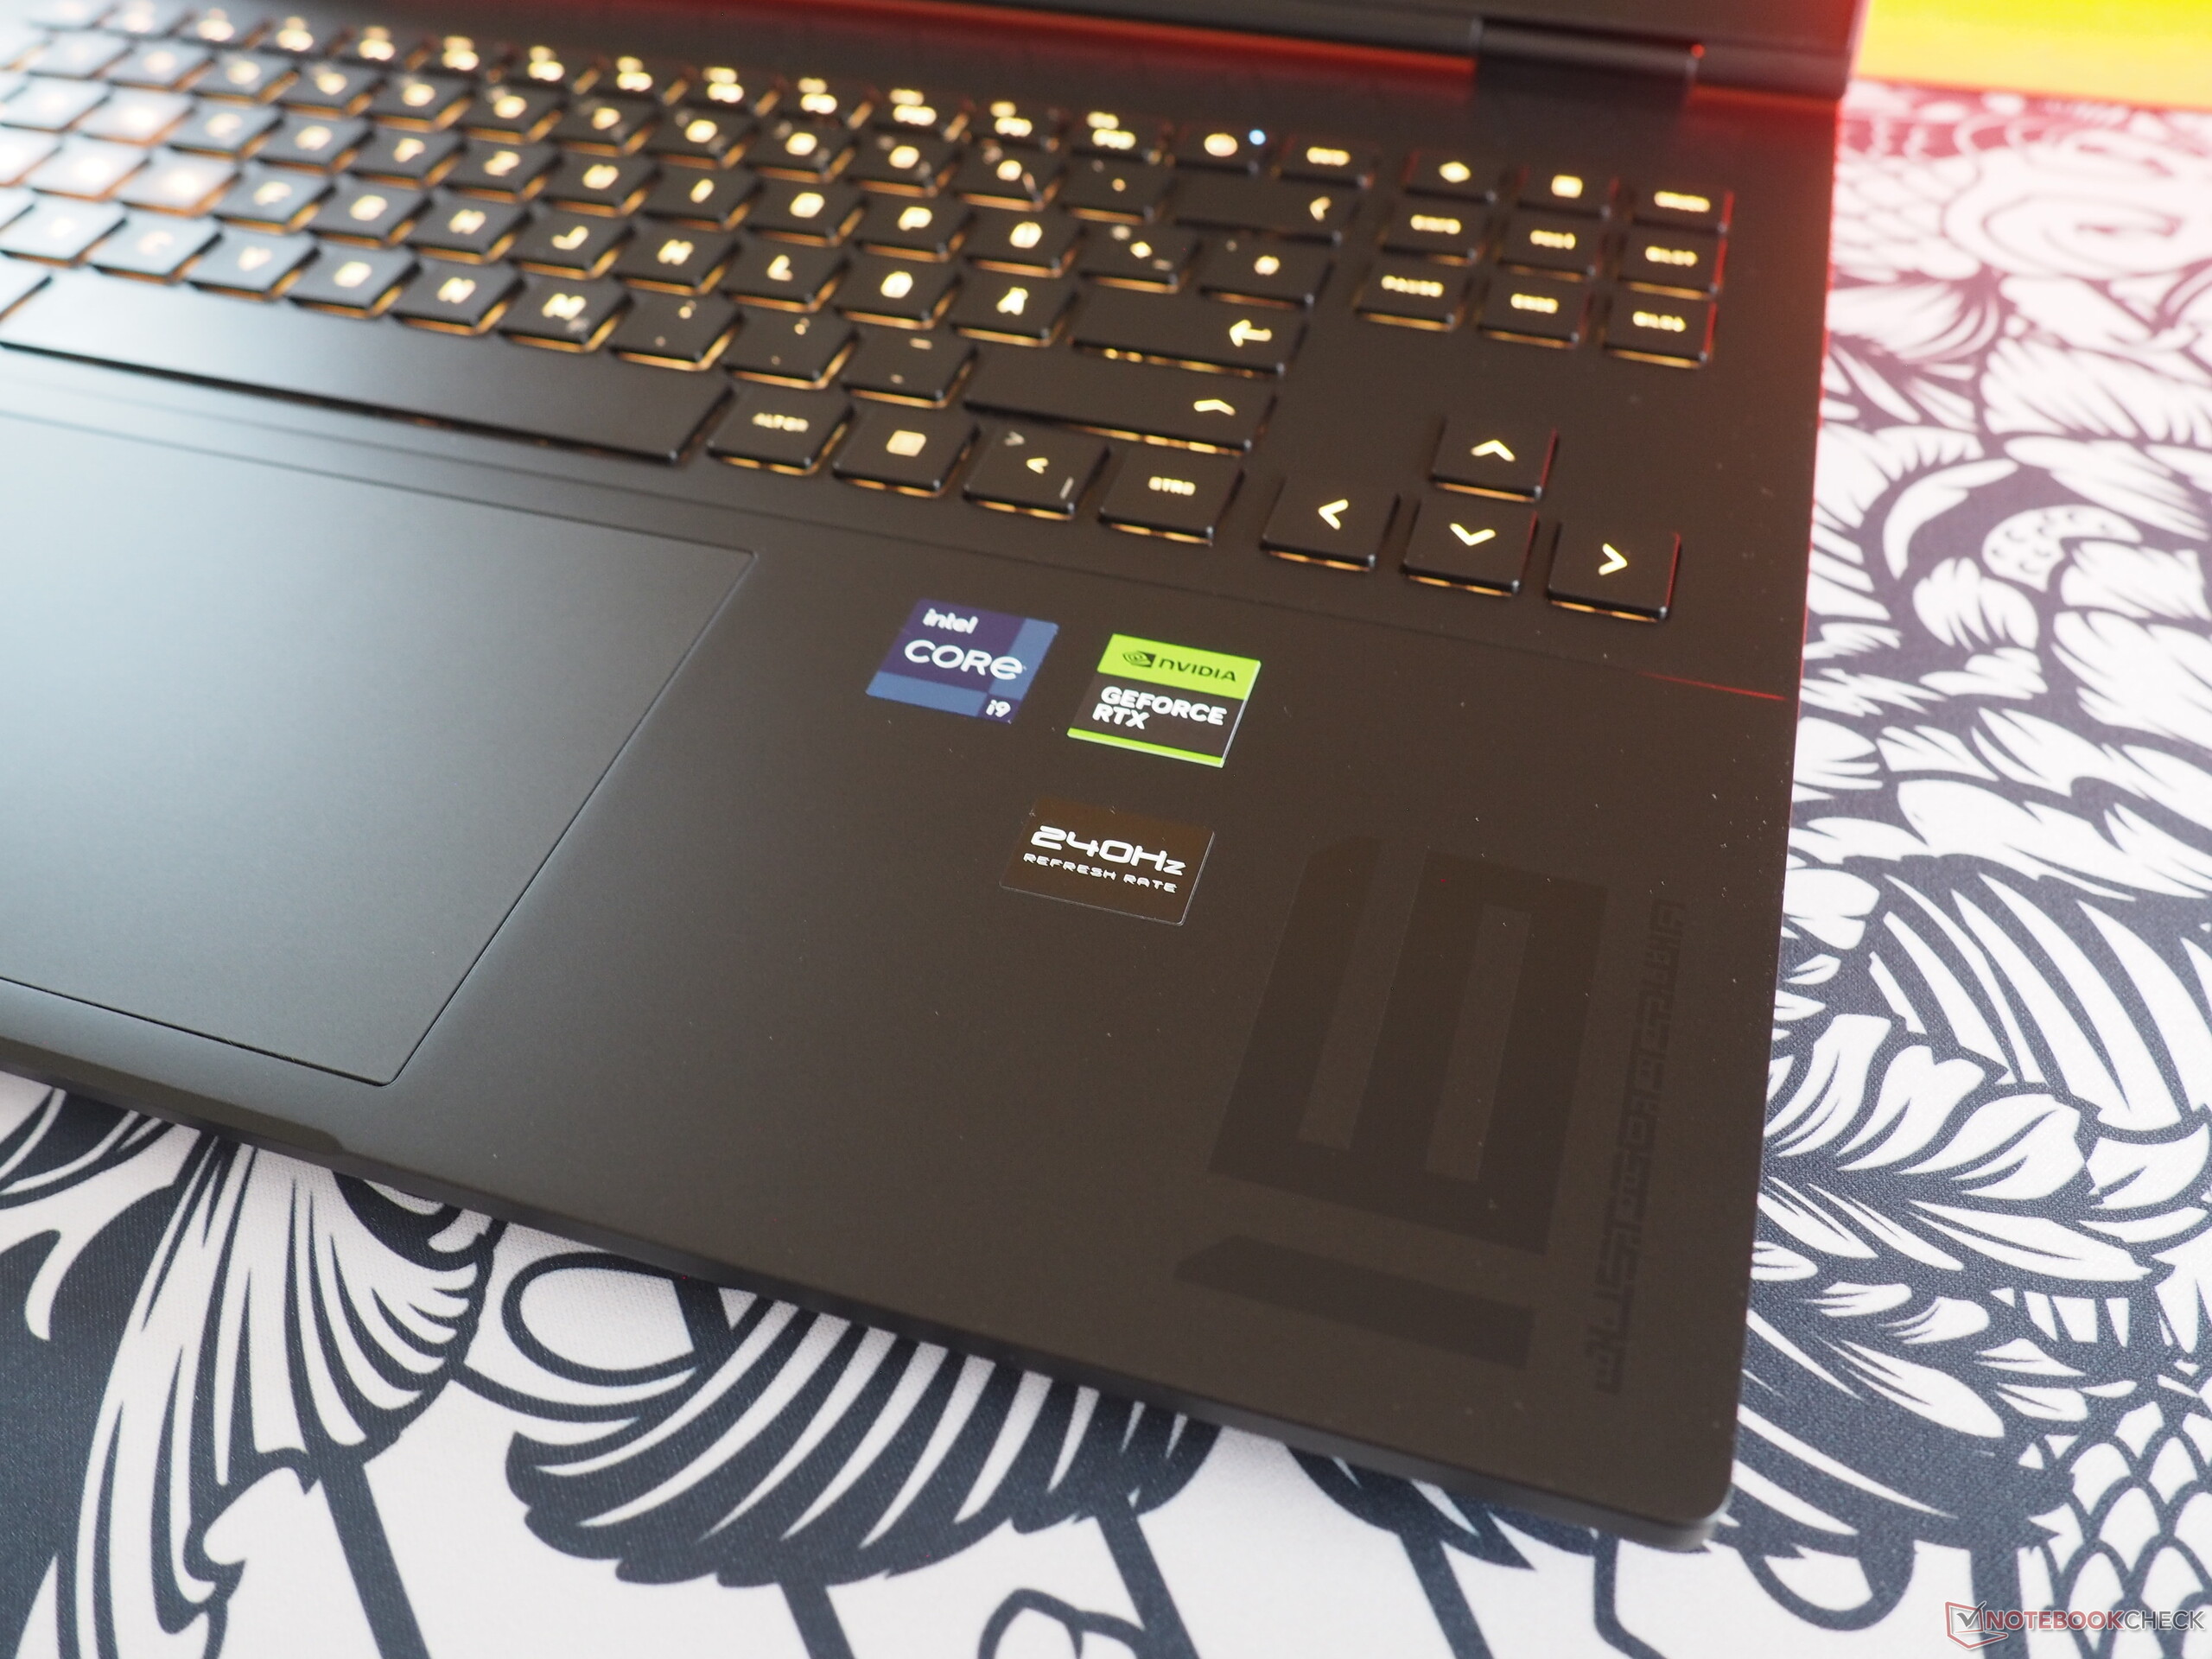
Prestazioni
Il prezzo di Omen Transcend 16 parte da circa 1.600 dollari. La variante entry-level è dotata di un Core i7-13700HX, a GeForce RTX 406016 GB di RAM e un display IPS a bassa risoluzione. Il nostro modello di recensione si trova più nella fascia alta della scala dei prezzi e delle specifiche.
Condizioni del test
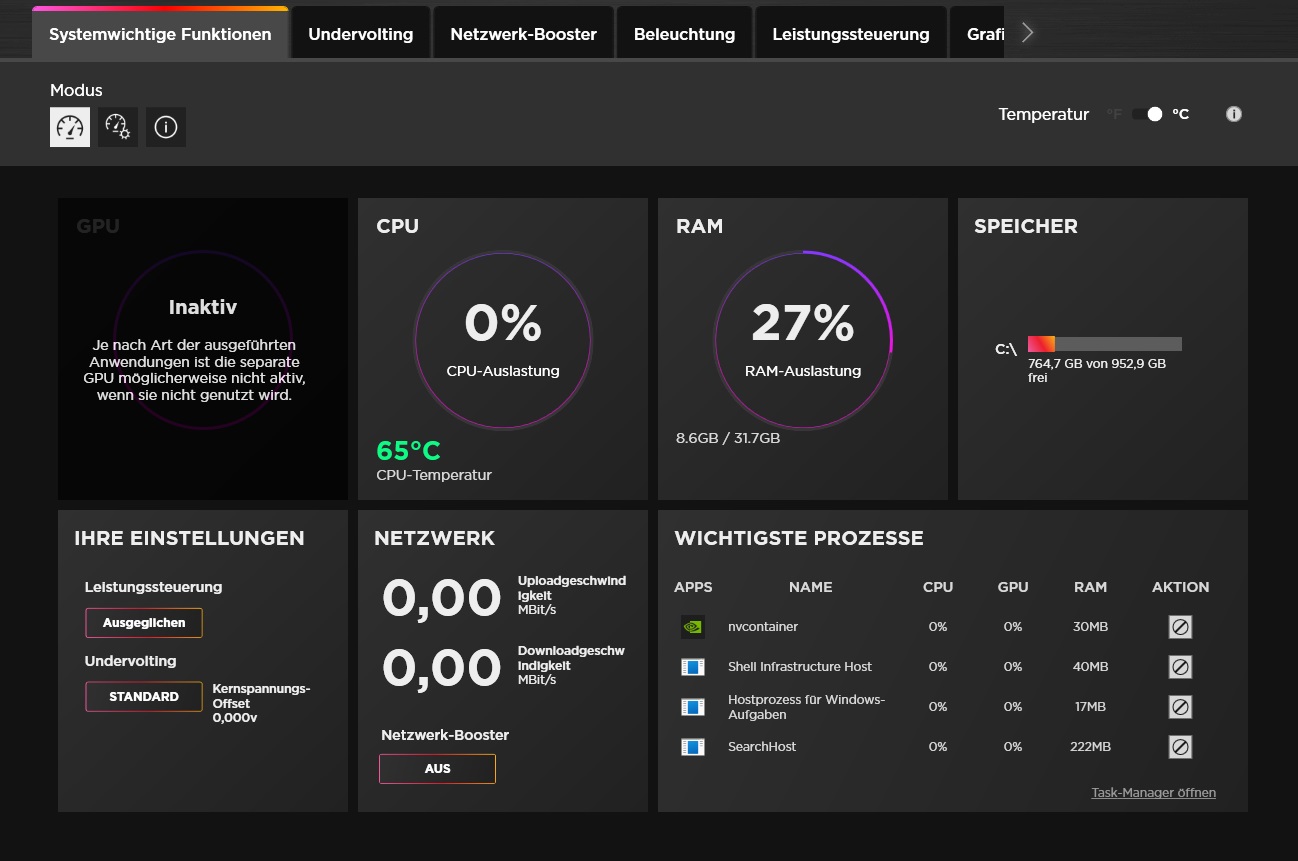
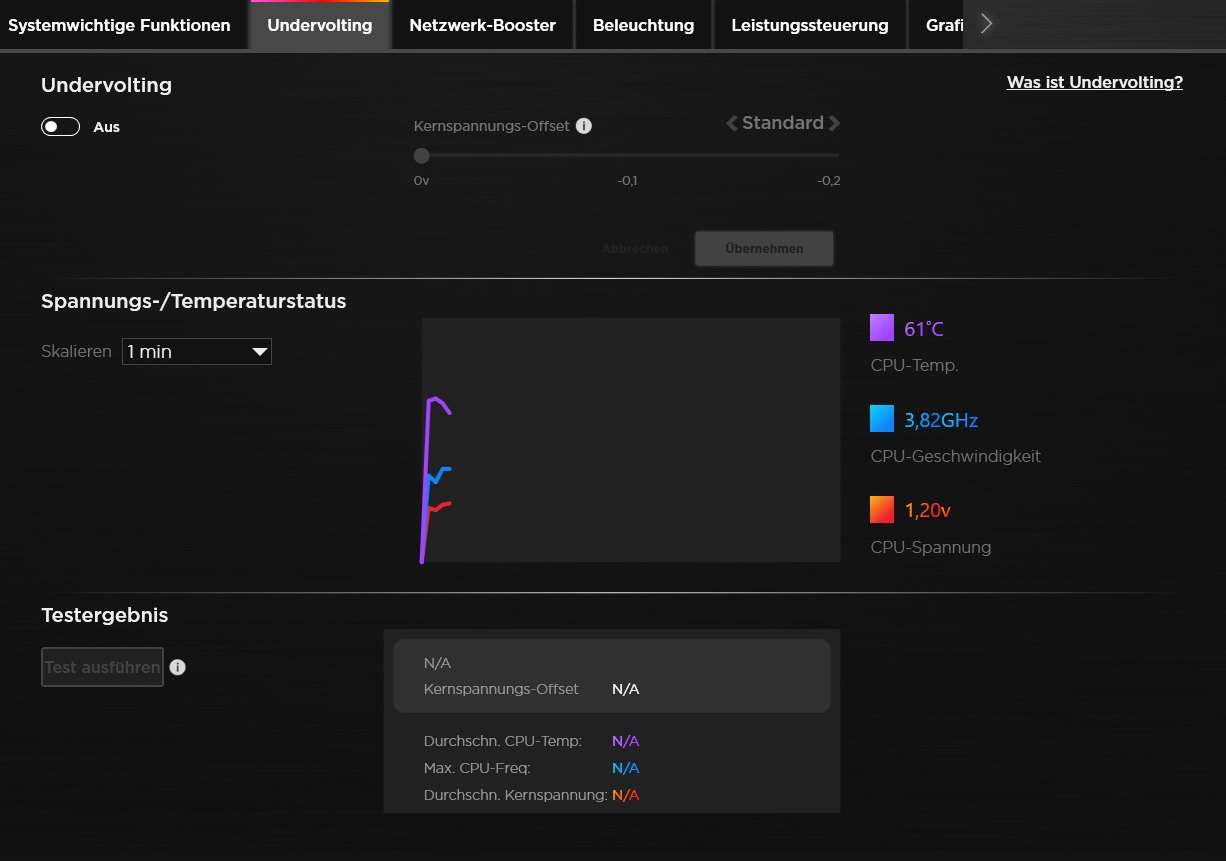
La gestione delle prestazioni dell'hub di gioco preinstallato è un po' difficile da raggiungere. Nel menu secondario, attendono tre modalità energetiche e un gestore di calore. Poiché la modalità prestazioni - analoga alla maggior parte dei computer portatili da gioco - garantisce sia prestazioni migliori che una produzione di rumore sproporzionata, tutte le misurazioni sono state effettuate utilizzando la modalità bilanciata. Pertanto, i valori determinati possono essere confrontati con il predecessore solo in misura limitata. Inoltre, il controllo automatico della ventola e la commutazione grafica automatica erano entrambi attivi.
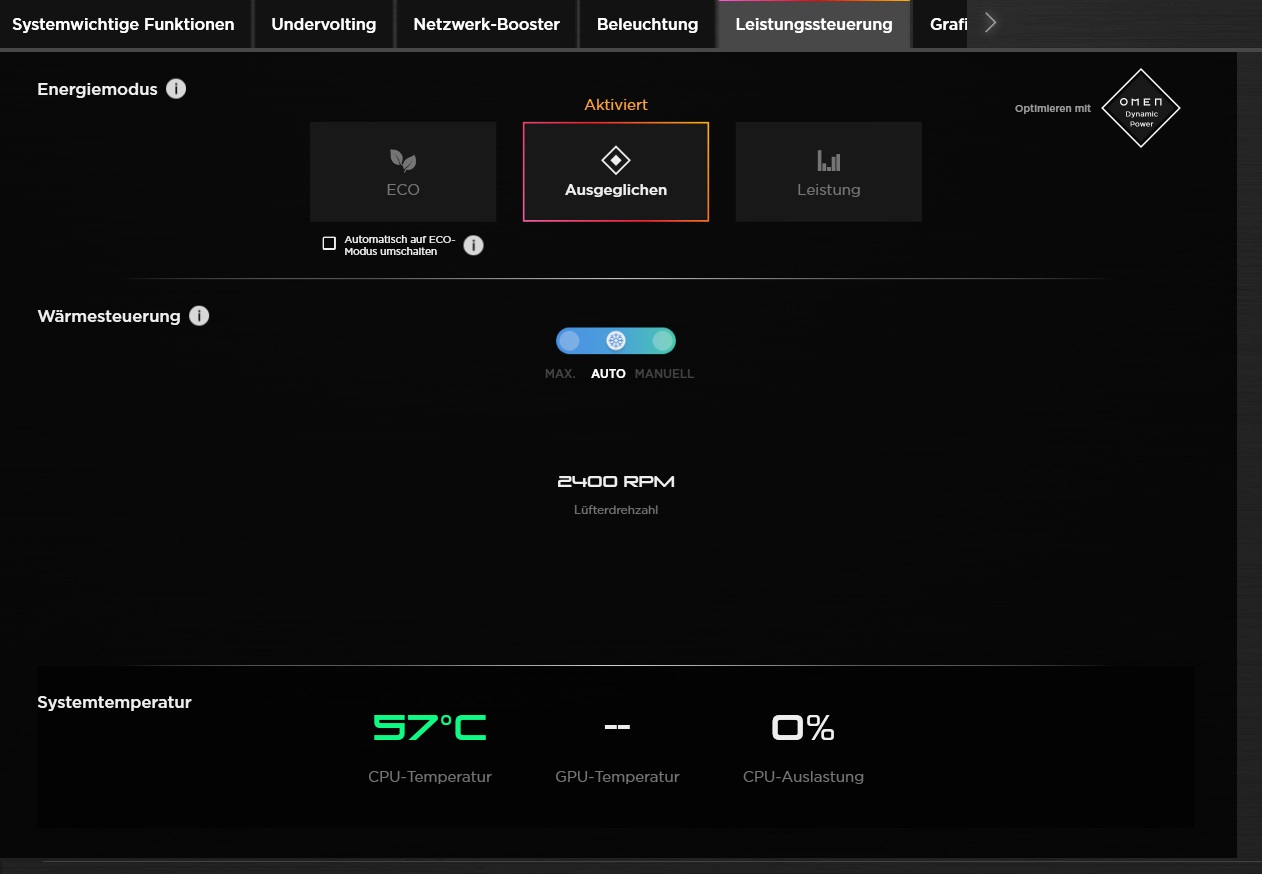

| Witcher 3 (FHD/Ultra) | Eco | Ausgegleichen | Leistung |
| Rumore | 39 dB(A) | 44 dB(A) | 53 dB(A) |
| Prestazioni | 60 fps lock | 114 fps | 126 fps |
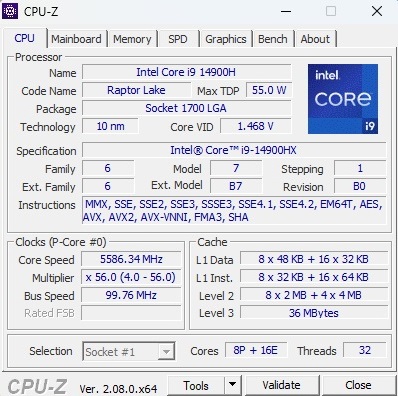
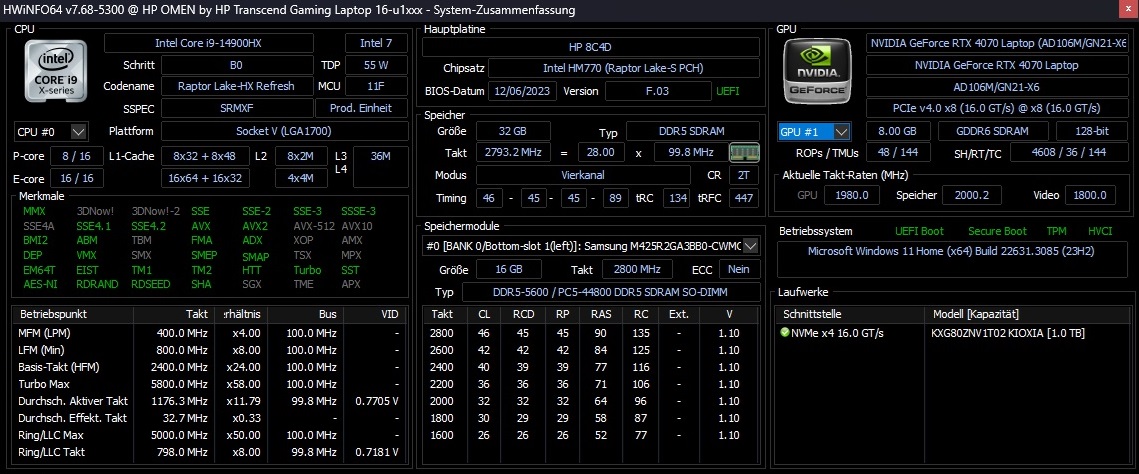
Processore
Il Core i9-14900HX è quasi fuori misura rispetto alla potenza della GPU e allo spessore del case. Il modello a 10 nm della serie Raptor Lake offre 8 core di prestazioni con hyper threading e 16 core di efficienza senza HT, per un totale di 32 thread. Nella modalità bilanciata, la CPU raggiunge il suo potenziale solo in misura limitata. L'esempio migliore è il nostro ciclo Cinebench: Sebbene le prestazioni fossero relativamente elevate nelle prime esecuzioni, dopo poco tempo il punteggio è calato in modo abbastanza netto (ma poi è rimasto su un livello costante). Nel complesso, è sufficiente solo per raggiungere il livello dell'Ultra 7 155H (ROG Zephyrus G16) o del Ryzen 7 7840HS (Schenker XMG Core 16).
Cinebench R15 Multi Continuous Test
* ... Meglio usare valori piccoli
AIDA64: FP32 Ray-Trace | FPU Julia | CPU SHA3 | CPU Queen | FPU SinJulia | FPU Mandel | CPU AES | CPU ZLib | FP64 Ray-Trace | CPU PhotoWorxx
| Performance rating | |
| Media della classe Gaming | |
| Media Intel Core i9-14900HX | |
| HP Omen Transcend 16 | |
| Lenovo Legion Pro 5 16ARX8 | |
| Schenker XMG CORE 16 (L23) | |
| HP Omen Transcend 16-u1095ng | |
| Asus ROG Zephyrus G16 2024 GU605M | |
| AIDA64 / FP32 Ray-Trace | |
| Media della classe Gaming (10227 - 85542, n=108, ultimi 2 anni) | |
| Lenovo Legion Pro 5 16ARX8 | |
| Schenker XMG CORE 16 (L23) | |
| Media Intel Core i9-14900HX (13098 - 33474, n=36) | |
| HP Omen Transcend 16 | |
| HP Omen Transcend 16-u1095ng | |
| Asus ROG Zephyrus G16 2024 GU605M | |
| AIDA64 / FPU Julia | |
| Media della classe Gaming (51376 - 238426, n=108, ultimi 2 anni) | |
| Media Intel Core i9-14900HX (67573 - 166040, n=36) | |
| Lenovo Legion Pro 5 16ARX8 | |
| Schenker XMG CORE 16 (L23) | |
| HP Omen Transcend 16 | |
| HP Omen Transcend 16-u1095ng | |
| Asus ROG Zephyrus G16 2024 GU605M | |
| AIDA64 / CPU SHA3 | |
| Media della classe Gaming (2180 - 9817, n=108, ultimi 2 anni) | |
| Media Intel Core i9-14900HX (3589 - 7979, n=36) | |
| HP Omen Transcend 16 | |
| Lenovo Legion Pro 5 16ARX8 | |
| Schenker XMG CORE 16 (L23) | |
| HP Omen Transcend 16-u1095ng | |
| Asus ROG Zephyrus G16 2024 GU605M | |
| AIDA64 / CPU Queen | |
| Media Intel Core i9-14900HX (118405 - 148966, n=36) | |
| Lenovo Legion Pro 5 16ARX8 | |
| HP Omen Transcend 16 | |
| HP Omen Transcend 16-u1095ng | |
| Media della classe Gaming (49785 - 173351, n=96, ultimi 2 anni) | |
| Schenker XMG CORE 16 (L23) | |
| Asus ROG Zephyrus G16 2024 GU605M | |
| AIDA64 / FPU SinJulia | |
| Lenovo Legion Pro 5 16ARX8 | |
| Media Intel Core i9-14900HX (10475 - 18517, n=36) | |
| Schenker XMG CORE 16 (L23) | |
| Media della classe Gaming (4424 - 33636, n=108, ultimi 2 anni) | |
| HP Omen Transcend 16 | |
| HP Omen Transcend 16-u1095ng | |
| Asus ROG Zephyrus G16 2024 GU605M | |
| AIDA64 / FPU Mandel | |
| Media della classe Gaming (25115 - 128721, n=108, ultimi 2 anni) | |
| Lenovo Legion Pro 5 16ARX8 | |
| Schenker XMG CORE 16 (L23) | |
| Media Intel Core i9-14900HX (32543 - 83662, n=36) | |
| HP Omen Transcend 16 | |
| HP Omen Transcend 16-u1095ng | |
| Asus ROG Zephyrus G16 2024 GU605M | |
| AIDA64 / CPU AES | |
| Media Intel Core i9-14900HX (86964 - 241777, n=36) | |
| HP Omen Transcend 16 | |
| Media della classe Gaming (39258 - 247074, n=108, ultimi 2 anni) | |
| Schenker XMG CORE 16 (L23) | |
| HP Omen Transcend 16-u1095ng | |
| Asus ROG Zephyrus G16 2024 GU605M | |
| Lenovo Legion Pro 5 16ARX8 | |
| AIDA64 / CPU ZLib | |
| Media Intel Core i9-14900HX (1054 - 2292, n=36) | |
| HP Omen Transcend 16 | |
| Media della classe Gaming (574 - 2531, n=108, ultimi 2 anni) | |
| HP Omen Transcend 16-u1095ng | |
| Lenovo Legion Pro 5 16ARX8 | |
| Asus ROG Zephyrus G16 2024 GU605M | |
| Schenker XMG CORE 16 (L23) | |
| AIDA64 / FP64 Ray-Trace | |
| Media della classe Gaming (5509 - 45446, n=108, ultimi 2 anni) | |
| Lenovo Legion Pro 5 16ARX8 | |
| Schenker XMG CORE 16 (L23) | |
| Media Intel Core i9-14900HX (6809 - 18349, n=36) | |
| HP Omen Transcend 16 | |
| HP Omen Transcend 16-u1095ng | |
| Asus ROG Zephyrus G16 2024 GU605M | |
| AIDA64 / CPU PhotoWorxx | |
| HP Omen Transcend 16 | |
| HP Omen Transcend 16-u1095ng | |
| Asus ROG Zephyrus G16 2024 GU605M | |
| Media Intel Core i9-14900HX (23903 - 54702, n=36) | |
| Media della classe Gaming (12271 - 89891, n=108, ultimi 2 anni) | |
| Schenker XMG CORE 16 (L23) | |
| Lenovo Legion Pro 5 16ARX8 | |
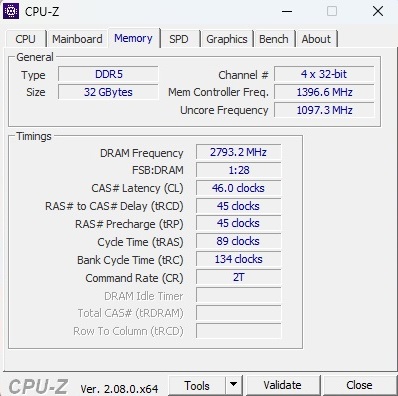
Prestazioni del sistema
Le prestazioni del sistema fanno una buona figura, senza essere tra i primi posti. Per quanto riguarda la velocità della RAM, Transcend si assicura il secondo posto nel confronto.
CrossMark: Overall | Productivity | Creativity | Responsiveness
WebXPRT 3: Overall
WebXPRT 4: Overall
Mozilla Kraken 1.1: Total
| PCMark 10 / Score | |
| Media della classe Gaming (5828 - 11574, n=96, ultimi 2 anni) | |
| Lenovo Legion Pro 5 16ARX8 | |
| Media Intel Core i9-14900HX, NVIDIA GeForce RTX 4070 Laptop GPU (7768 - 8550, n=8) | |
| Schenker XMG CORE 16 (L23) | |
| HP Omen Transcend 16 | |
| HP Omen Transcend 16-u1095ng | |
| Asus ROG Zephyrus G16 2024 GU605M | |
| PCMark 10 / Essentials | |
| HP Omen Transcend 16 | |
| Lenovo Legion Pro 5 16ARX8 | |
| Schenker XMG CORE 16 (L23) | |
| Media Intel Core i9-14900HX, NVIDIA GeForce RTX 4070 Laptop GPU (10104 - 11815, n=8) | |
| Media della classe Gaming (8810 - 12600, n=100, ultimi 2 anni) | |
| HP Omen Transcend 16-u1095ng | |
| Asus ROG Zephyrus G16 2024 GU605M | |
| PCMark 10 / Productivity | |
| Media della classe Gaming (6845 - 21327, n=98, ultimi 2 anni) | |
| Schenker XMG CORE 16 (L23) | |
| Media Intel Core i9-14900HX, NVIDIA GeForce RTX 4070 Laptop GPU (9577 - 11103, n=8) | |
| HP Omen Transcend 16-u1095ng | |
| Lenovo Legion Pro 5 16ARX8 | |
| HP Omen Transcend 16 | |
| Asus ROG Zephyrus G16 2024 GU605M | |
| PCMark 10 / Digital Content Creation | |
| Media della classe Gaming (7602 - 19657, n=98, ultimi 2 anni) | |
| HP Omen Transcend 16 | |
| Lenovo Legion Pro 5 16ARX8 | |
| Media Intel Core i9-14900HX, NVIDIA GeForce RTX 4070 Laptop GPU (12114 - 14827, n=8) | |
| Schenker XMG CORE 16 (L23) | |
| HP Omen Transcend 16-u1095ng | |
| Asus ROG Zephyrus G16 2024 GU605M | |
| CrossMark / Overall | |
| Media Intel Core i9-14900HX, NVIDIA GeForce RTX 4070 Laptop GPU (2002 - 2312, n=7) | |
| Lenovo Legion Pro 5 16ARX8 | |
| Media della classe Gaming (1366 - 2409, n=96, ultimi 2 anni) | |
| HP Omen Transcend 16 | |
| Asus ROG Zephyrus G16 2024 GU605M | |
| Schenker XMG CORE 16 (L23) | |
| CrossMark / Productivity | |
| Media Intel Core i9-14900HX, NVIDIA GeForce RTX 4070 Laptop GPU (1827 - 2191, n=7) | |
| Lenovo Legion Pro 5 16ARX8 | |
| Media della classe Gaming (1386 - 2254, n=96, ultimi 2 anni) | |
| HP Omen Transcend 16 | |
| Schenker XMG CORE 16 (L23) | |
| Asus ROG Zephyrus G16 2024 GU605M | |
| CrossMark / Creativity | |
| Media Intel Core i9-14900HX, NVIDIA GeForce RTX 4070 Laptop GPU (2258 - 2458, n=7) | |
| HP Omen Transcend 16 | |
| Media della classe Gaming (1343 - 2729, n=96, ultimi 2 anni) | |
| Lenovo Legion Pro 5 16ARX8 | |
| Asus ROG Zephyrus G16 2024 GU605M | |
| Schenker XMG CORE 16 (L23) | |
| CrossMark / Responsiveness | |
| Media Intel Core i9-14900HX, NVIDIA GeForce RTX 4070 Laptop GPU (1734 - 2330, n=7) | |
| Lenovo Legion Pro 5 16ARX8 | |
| Media della classe Gaming (1226 - 2334, n=96, ultimi 2 anni) | |
| HP Omen Transcend 16 | |
| Schenker XMG CORE 16 (L23) | |
| Asus ROG Zephyrus G16 2024 GU605M | |
| WebXPRT 3 / Overall | |
| Lenovo Legion Pro 5 16ARX8 | |
| HP Omen Transcend 16-u1095ng | |
| HP Omen Transcend 16 | |
| Media Intel Core i9-14900HX, NVIDIA GeForce RTX 4070 Laptop GPU (269 - 342, n=8) | |
| Media della classe Gaming (220 - 532, n=101, ultimi 2 anni) | |
| Schenker XMG CORE 16 (L23) | |
| Asus ROG Zephyrus G16 2024 GU605M | |
| WebXPRT 4 / Overall | |
| HP Omen Transcend 16 | |
| Media Intel Core i9-14900HX, NVIDIA GeForce RTX 4070 Laptop GPU (291 - 304, n=6) | |
| Media della classe Gaming (165 - 354, n=101, ultimi 2 anni) | |
| Lenovo Legion Pro 5 16ARX8 | |
| Asus ROG Zephyrus G16 2024 GU605M | |
| Mozilla Kraken 1.1 / Total | |
| Asus ROG Zephyrus G16 2024 GU605M | |
| Schenker XMG CORE 16 (L23) | |
| Lenovo Legion Pro 5 16ARX8 | |
| Media della classe Gaming (391 - 590, n=106, ultimi 2 anni) | |
| HP Omen Transcend 16 | |
| Media Intel Core i9-14900HX, NVIDIA GeForce RTX 4070 Laptop GPU (431 - 469, n=8) | |
| HP Omen Transcend 16-u1095ng | |
* ... Meglio usare valori piccoli
| PCMark 10 Score | 7866 punti | |
Aiuto | ||
| AIDA64 / Memory Copy | |
| Asus ROG Zephyrus G16 2024 GU605M | |
| HP Omen Transcend 16-u1095ng | |
| HP Omen Transcend 16 | |
| Media Intel Core i9-14900HX (38028 - 83392, n=36) | |
| Media della classe Gaming (21750 - 129946, n=108, ultimi 2 anni) | |
| Schenker XMG CORE 16 (L23) | |
| Lenovo Legion Pro 5 16ARX8 | |
| AIDA64 / Memory Read | |
| Asus ROG Zephyrus G16 2024 GU605M | |
| HP Omen Transcend 16-u1095ng | |
| HP Omen Transcend 16 | |
| Media Intel Core i9-14900HX (43306 - 87568, n=36) | |
| Media della classe Gaming (22956 - 118858, n=108, ultimi 2 anni) | |
| Schenker XMG CORE 16 (L23) | |
| Lenovo Legion Pro 5 16ARX8 | |
| AIDA64 / Memory Write | |
| Schenker XMG CORE 16 (L23) | |
| HP Omen Transcend 16-u1095ng | |
| HP Omen Transcend 16 | |
| Media della classe Gaming (22297 - 135096, n=108, ultimi 2 anni) | |
| Asus ROG Zephyrus G16 2024 GU605M | |
| Media Intel Core i9-14900HX (37146 - 80589, n=36) | |
| Lenovo Legion Pro 5 16ARX8 | |
| AIDA64 / Memory Latency | |
| Asus ROG Zephyrus G16 2024 GU605M | |
| Media della classe Gaming (75.3 - 259, n=108, ultimi 2 anni) | |
| Schenker XMG CORE 16 (L23) | |
| HP Omen Transcend 16 | |
| Lenovo Legion Pro 5 16ARX8 | |
| HP Omen Transcend 16-u1095ng | |
| Media Intel Core i9-14900HX (76.1 - 105, n=36) | |
* ... Meglio usare valori piccoli
Latenze DPC
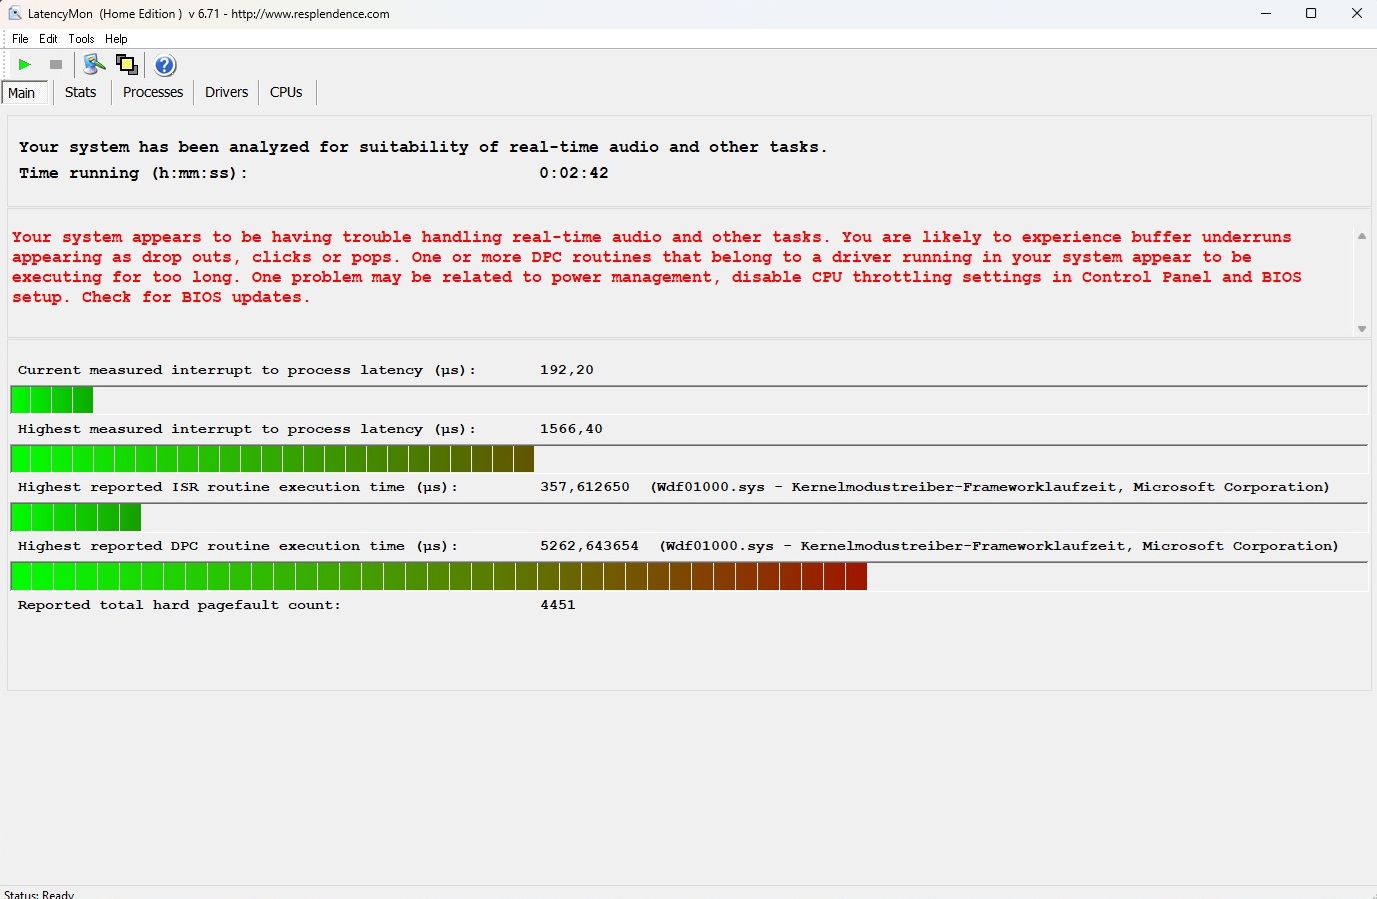
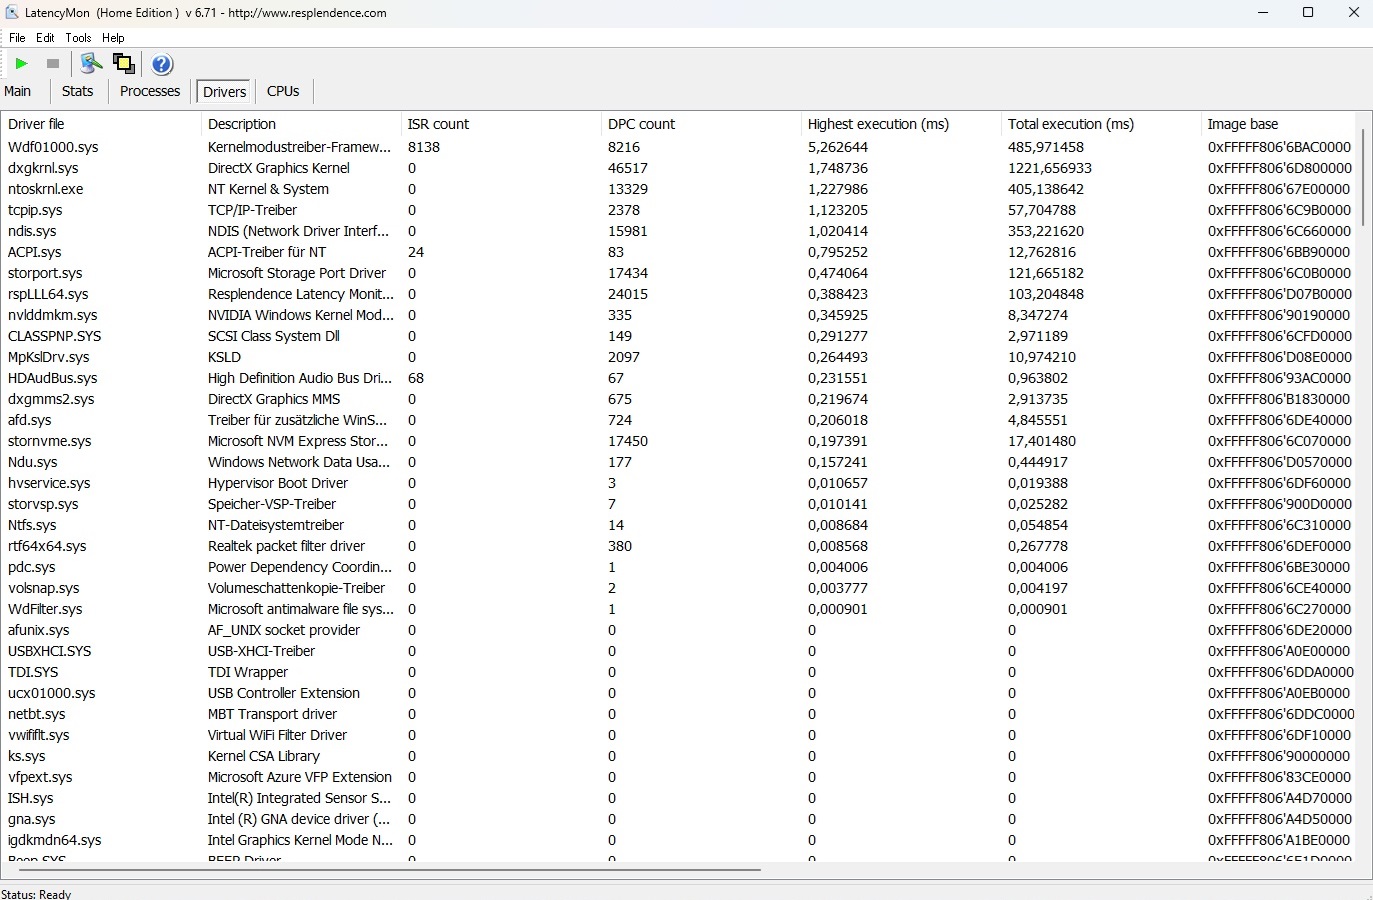
Come il predecessore, anche il nuovo Omen 16 deve lottare con latenze relativamente elevate e questo potrebbe causare problemi in alcuni scenari applicativi (ad esempio, l'elaborazione di audio e video in tempo reale).
| DPC Latencies / LatencyMon - interrupt to process latency (max), Web, Youtube, Prime95 | |
| Asus ROG Zephyrus G16 2024 GU605M | |
| HP Omen Transcend 16-u1095ng | |
| HP Omen Transcend 16 | |
| Schenker XMG CORE 16 (L23) | |
| Lenovo Legion Pro 5 16ARX8 | |
* ... Meglio usare valori piccoli
Memoria di massa
Rispetto alle prestazioni della CPU, non abbiamo osservato alcun calo nelle prestazioni dell'SSD. L'unità Kioxia installata è un po' più lenta dell'unità SK hynix presente nel vecchio Transcend ma, nonostante questo, offre velocità sufficientemente elevate. Peccato che l'unità da 16 pollici abbia solo uno slot M.2 e questo significa che l'SSD integrato dovrà essere sostituito per espandere lo spazio di archiviazione.

* ... Meglio usare valori piccoli
Continuous Performance Read: DiskSpd Read Loop, Queue Depth 8
Scheda grafica
La RTX 4070 di GeForce si basa sull'architettura Ada Lovelace e, dal punto di vista delle prestazioni, si posiziona più vicino alla RTX 4060 rispetto alla RTX 4080. Nonostante il generoso TGP da 130 watt, Omen 16 ha navigato nel nostro benchmark in modo leggermente inferiore alla media, anche se la differenza con la concorrenza è talvolta molto ridotta. La resistenza al futuro della RTX 4070 è piuttosto scarsa a causa della scarsa quantità di VRAM. In alcuni giochi, 8 GB potrebbero già diventare un fattore limitante. A nostro avviso, Nvidia avrebbe dovuto dotare la GPU di almeno 12 GB, soprattutto perché i computer portatili di questo tipo non sono esattamente economici.
| 3DMark Performance rating - Percent | |
| Media della classe Gaming | |
| Schenker XMG CORE 16 (L23) | |
| Lenovo Legion Pro 5 16ARX8 -1! | |
| Media NVIDIA GeForce RTX 4070 Laptop GPU | |
| HP Omen Transcend 16 -1! | |
| HP Omen Transcend 16-u1095ng | |
| Asus ROG Zephyrus G16 2024 GU605M -1! | |
| 3DMark 11 Performance | 32528 punti | |
| 3DMark Cloud Gate Standard Score | 53528 punti | |
| 3DMark Fire Strike Score | 23683 punti | |
| 3DMark Time Spy Score | 11682 punti | |
Aiuto | ||
* ... Meglio usare valori piccoli
Prestazioni di gioco
Transcend 16 è abbastanza veloce da poter giocare a quasi tutti i giochi con la risoluzione nativa di 2.560 x 1.600 e con impostazioni alte o massime. Le cose diventano problematiche solo con giochi molto impegnativi o poco ottimizzati, come ad esempio Enshrouded. Per i monitor 4K, consigliamo almeno una RTX 4080.
| The Witcher 3 - 1920x1080 Ultra Graphics & Postprocessing (HBAO+) | |
| Media della classe Gaming (95 - 240, n=8, ultimi 2 anni) | |
| Schenker XMG CORE 16 (L23) | |
| Lenovo Legion Pro 5 16ARX8 | |
| HP Omen Transcend 16-u1095ng | |
| Media NVIDIA GeForce RTX 4070 Laptop GPU (69.8 - 133.7, n=57) | |
| HP Omen Transcend 16 | |
| Asus ROG Zephyrus G16 2024 GU605M | |
| Final Fantasy XV Benchmark - 1920x1080 High Quality | |
| Media della classe Gaming (41 - 215, n=100, ultimi 2 anni) | |
| Schenker XMG CORE 16 (L23) | |
| Lenovo Legion Pro 5 16ARX8 | |
| Media NVIDIA GeForce RTX 4070 Laptop GPU (41 - 131.9, n=65) | |
| HP Omen Transcend 16-u1095ng | |
| Asus ROG Zephyrus G16 2024 GU605M | |
| Enshrouded - 2560x1440 Max. Quality AA:FX | |
| HP Omen Transcend 16-u1095ng | |
| Media NVIDIA GeForce RTX 4070 Laptop GPU (38.9 - 42.3, n=2) | |
| XMG Pro 15 E23 | |
| Palworld - 2560x1440 Epic Preset AA:TSR | |
| XMG Pro 15 E23 | |
| Media NVIDIA GeForce RTX 4070 Laptop GPU (69.1 - 81.3, n=2) | |
| HP Omen Transcend 16-u1095ng | |
| Prince of Persia The Lost Crown - 2560x1440 Ultra Preset AA:SM | |
| Media della classe Gaming (352 - 357, n=4, ultimi 2 anni) | |
| XMG Pro 15 E23 | |
| Media NVIDIA GeForce RTX 4070 Laptop GPU (325 - 354, n=2) | |
| HP Omen Transcend 16-u1095ng | |
| Ready or Not - 2560x1440 Epic Preset | |
| XMG Pro 15 E23 | |
| Media NVIDIA GeForce RTX 4070 Laptop GPU (84.8 - 95.6, n=2) | |
| HP Omen Transcend 16-u1095ng | |
| The Finals - 2560x1440 Epic Preset | |
| XMG Pro 15 E23 | |
| Media NVIDIA GeForce RTX 4070 Laptop GPU (82.8 - 94.6, n=3) | |
| HP Omen Transcend 16-u1095ng | |
| Media della classe Gaming (n=1ultimi 2 anni) | |
Abbiamo usato il gioco di ruolo, Il Witcher 3 (FHD/Ultra) per vedere come si comportano le prestazioni 3D in un periodo di tempo più lungo e anche dopo circa un'ora, il frame rate è rimasto molto stabile.
Witcher 3 FPS diagram
| basso | medio | alto | ultra | QHD | |
|---|---|---|---|---|---|
| GTA V (2015) | 181.2 | 175.3 | 115.8 | ||
| The Witcher 3 (2015) | 114 | ||||
| Dota 2 Reborn (2015) | 202 | 178.9 | 167 | 154.1 | |
| Final Fantasy XV Benchmark (2018) | 147.5 | 108.3 | |||
| X-Plane 11.11 (2018) | 166.6 | 141.7 | 114.9 | ||
| Strange Brigade (2018) | 272 | 220 | 194.2 | ||
| The Finals (2023) | 168 | 130.2 | 82.8 | ||
| Ready or Not (2023) | 194.2 | 134 | 84.8 | ||
| Prince of Persia The Lost Crown (2024) | 358 | 358 | 325 | ||
| Palworld (2024) | 102.2 | 96.6 | 69.1 | ||
| Enshrouded (2024) | 66.6 | 56.5 | 42.3 | ||
| Helldivers 2 (2024) | 91.5 | 91.1 | 69.2 |
Emissioni
Emissioni di rumore
Se si limita a utilizzare la modalità bilanciata, il dispositivo da 16 pollici non diventa troppo rumoroso. Il livello di rumore 3D di 44-47 dB(A) è udibile ma non fastidioso (quest'ultimo vale per la modalità Performance, con una registrazione di oltre 50 dB). In modalità idle, le ventole sono continuamente attive e funzionano a un livello udibile di 29-31 dB(A), che non è del tutto ottimale.
Rumorosità
| Idle |
| 29 / 30 / 31 dB(A) |
| Sotto carico |
| 45 / 47 dB(A) |
 | ||
30 dB silenzioso 40 dB(A) udibile 50 dB(A) rumoroso |
||
min: | ||
| HP Omen Transcend 16-u1095ng i9-14900HX, GeForce RTX 4070 Laptop GPU | HP Omen Transcend 16 i9-13900HX, GeForce RTX 4070 Laptop GPU | Asus ROG Zephyrus G16 2024 GU605M Ultra 7 155H, GeForce RTX 4070 Laptop GPU | Schenker XMG CORE 16 (L23) R7 7840HS, GeForce RTX 4070 Laptop GPU | Lenovo Legion Pro 5 16ARX8 R7 7745HX, GeForce RTX 4070 Laptop GPU | |
|---|---|---|---|---|---|
| Noise | -4% | 7% | 5% | 10% | |
| off /ambiente * (dB) | 24 | 22.9 5% | 23.9 -0% | 23 4% | 23.2 3% |
| Idle Minimum * (dB) | 29 | 29.1 -0% | 23.9 18% | 23 21% | 23.2 20% |
| Idle Average * (dB) | 30 | 29.1 3% | 27.8 7% | 28.48 5% | 23.2 23% |
| Idle Maximum * (dB) | 31 | 29.1 6% | 30.1 3% | 28.48 8% | 26.2 15% |
| Load Average * (dB) | 45 | 45.7 -2% | 34.2 24% | 30 33% | 31.4 30% |
| Witcher 3 ultra * (dB) | 44 | 54.3 -23% | 46.4 -5% | 54.12 -23% | 48.4 -10% |
| Load Maximum * (dB) | 47 | 54.3 -16% | 46.4 1% | 54.12 -15% | 53.8 -14% |
* ... Meglio usare valori piccoli
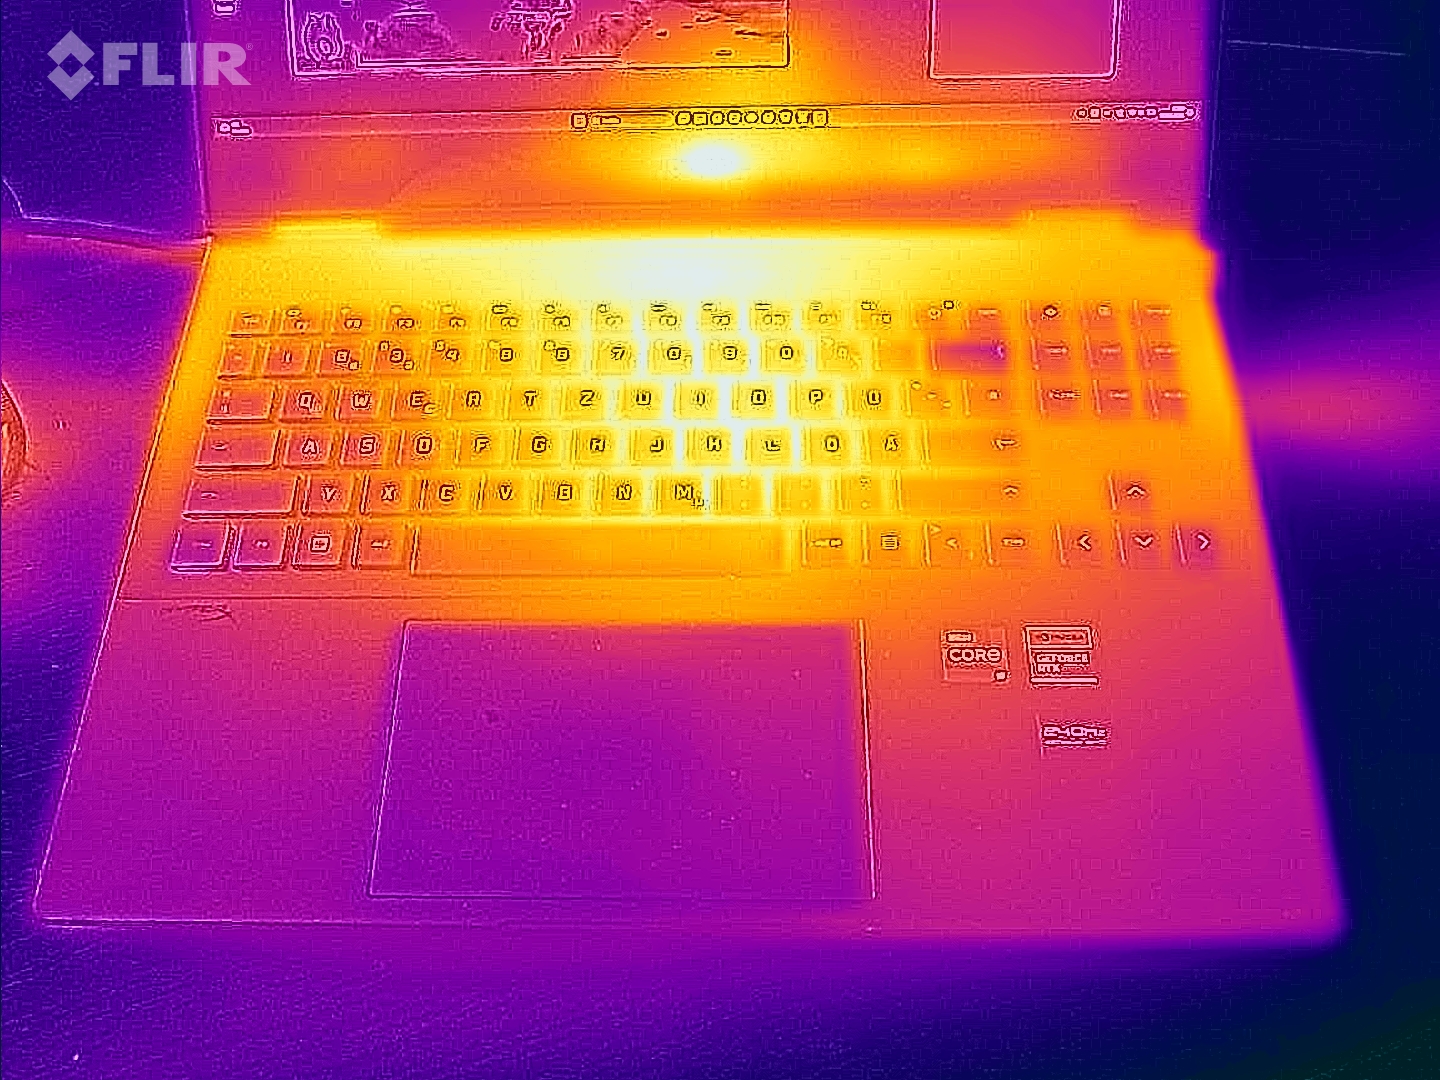
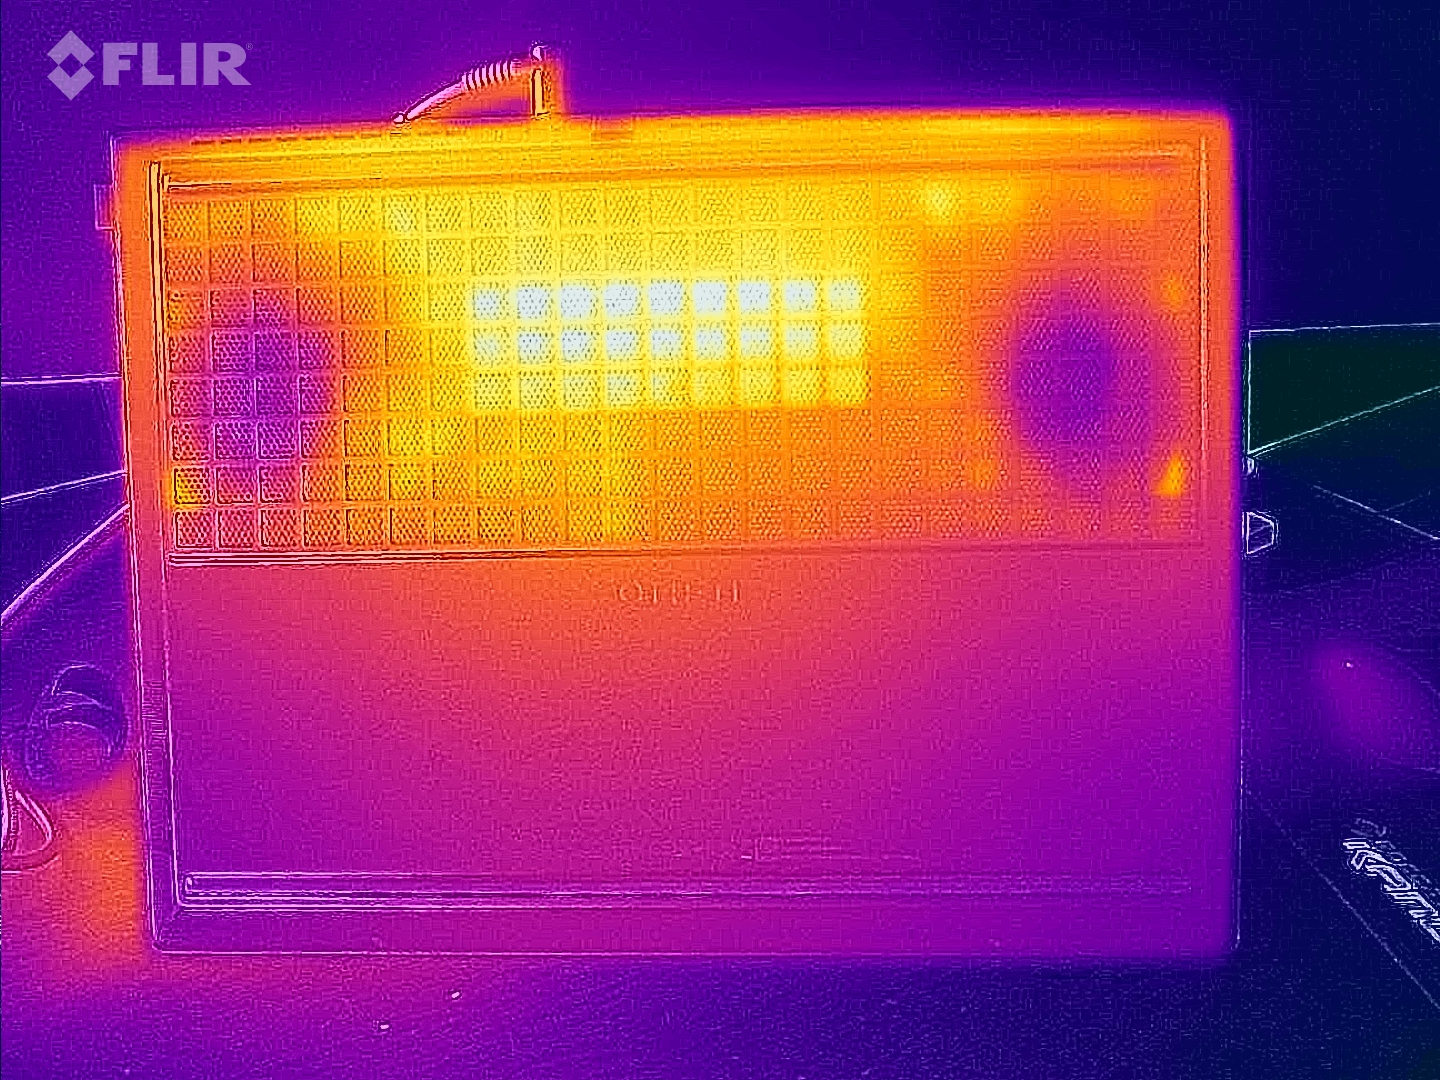
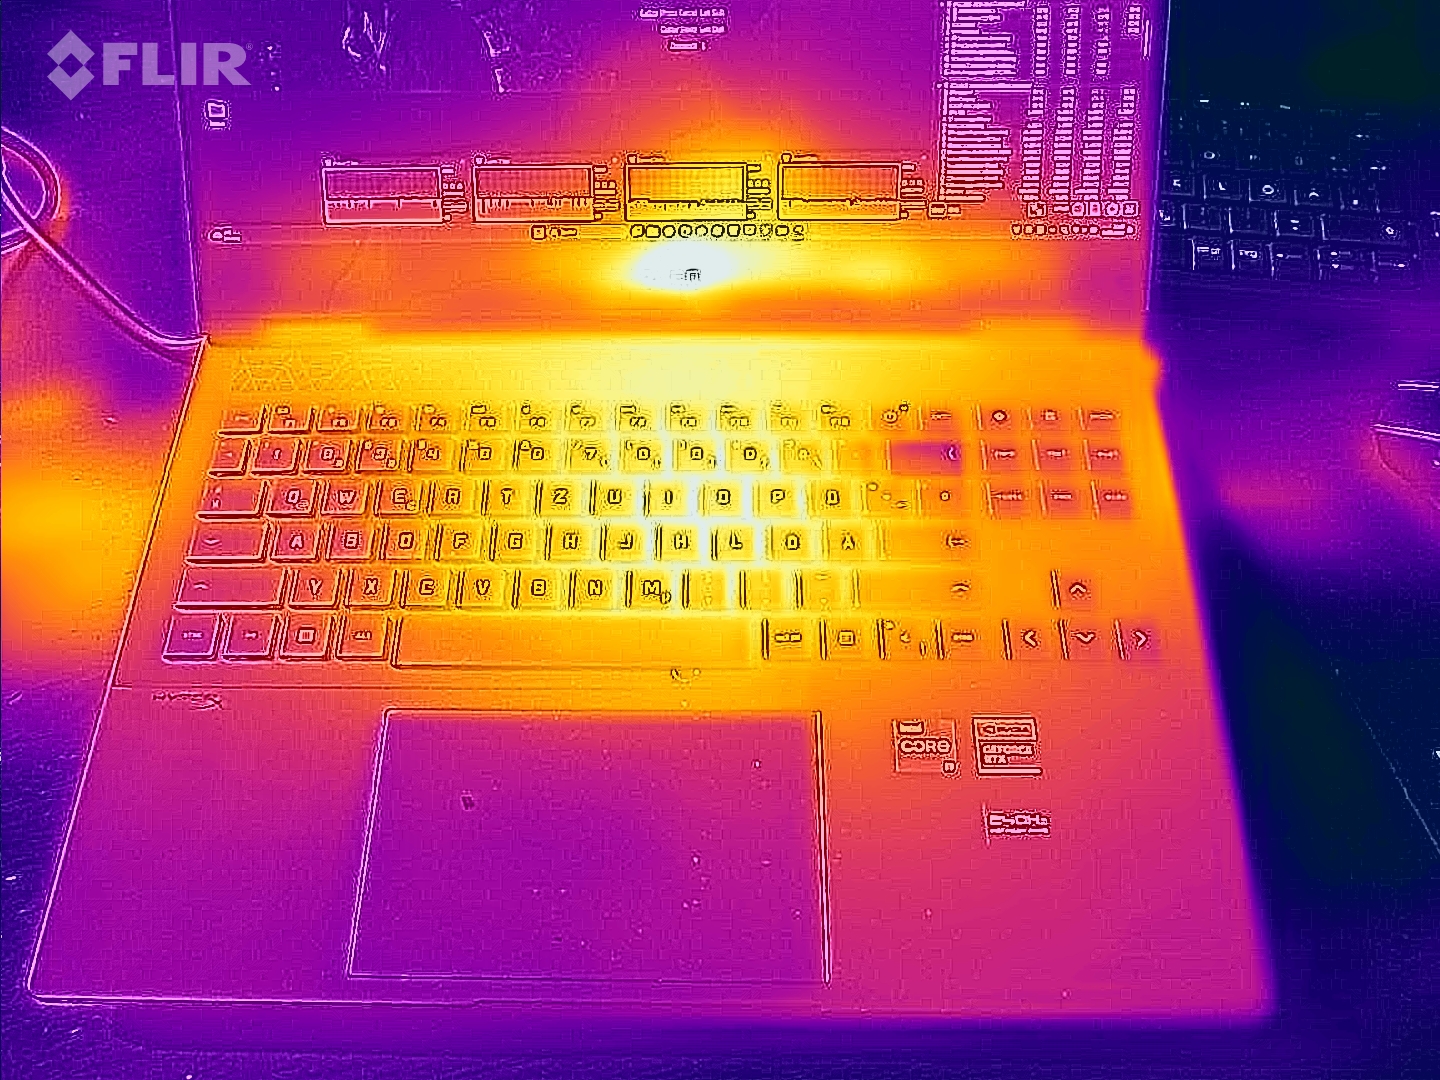
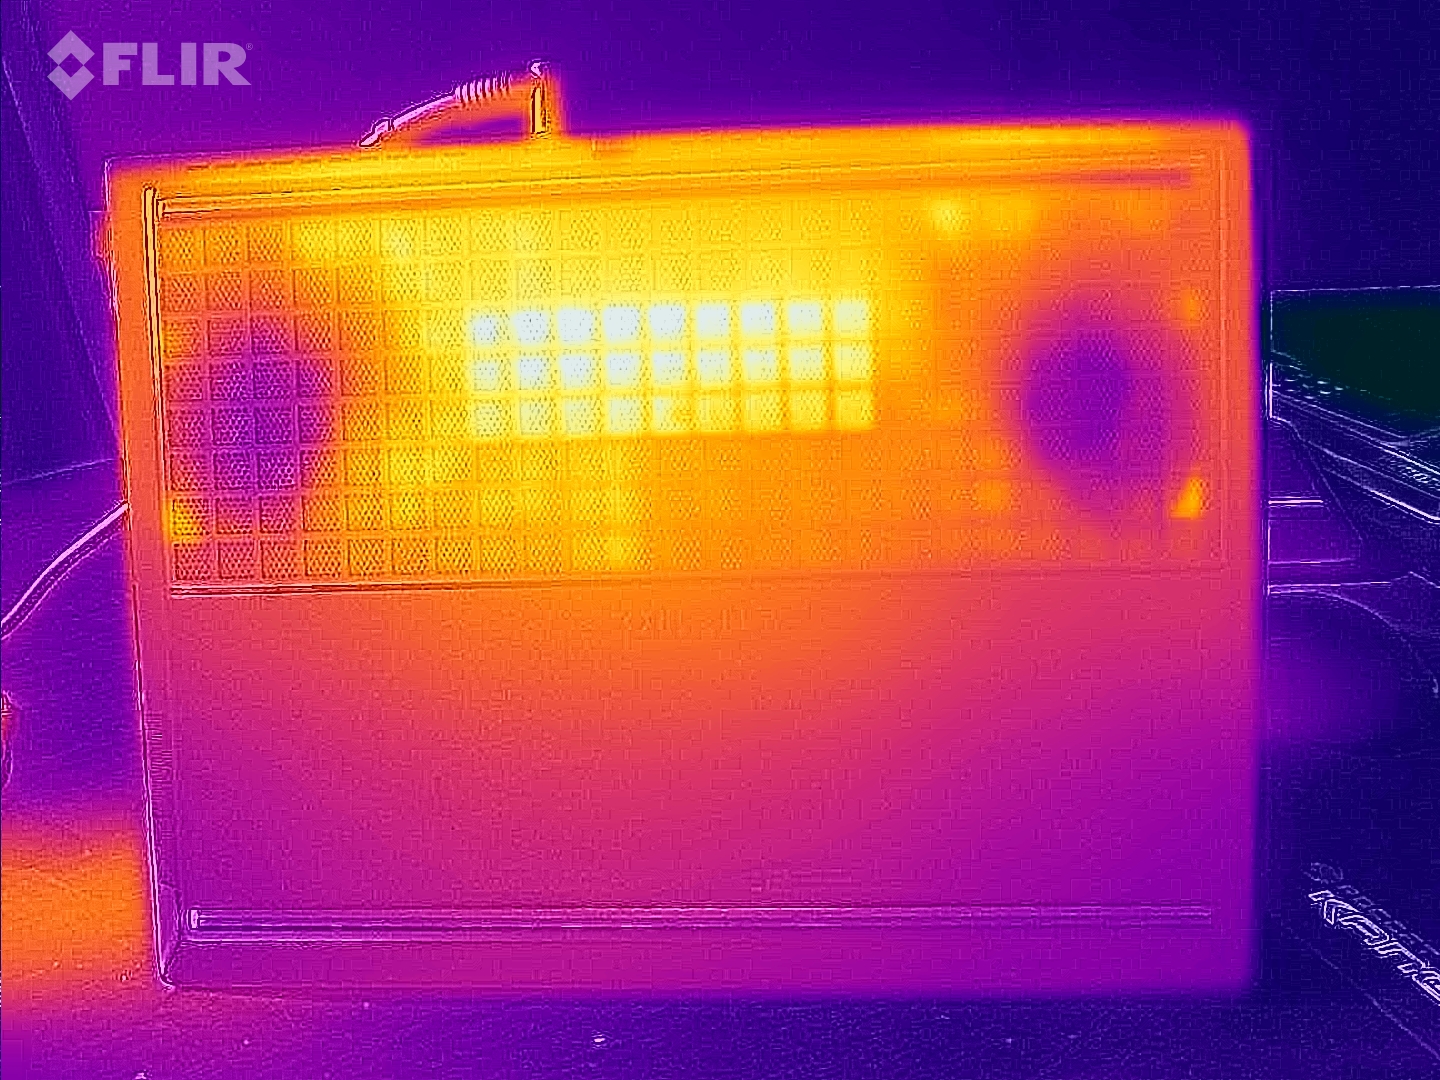
Temperatura
Mentre le temperature sulla parte superiore del portatile si collocano a metà del gruppo, la base del case si scalda più della concorrenza sotto carico. Un massimo di 63 °C (durante il gioco) impedirà agli utenti di utilizzare il dispositivo appoggiato sulle ginocchia. In condizioni di inattività, la situazione è molto più confortevole, con lo chassis che rimane piacevolmente fresco a un massimo di 30 °C.
(-) La temperatura massima sul lato superiore è di 49 °C / 120 F, rispetto alla media di 40.4 °C / 105 F, che varia da 21.2 a 68.8 °C per questa classe Gaming.
(-) Il lato inferiore si riscalda fino ad un massimo di 63 °C / 145 F, rispetto alla media di 43.2 °C / 110 F
(+) In idle, la temperatura media del lato superiore è di 26.6 °C / 80 F, rispetto alla media deld ispositivo di 33.9 °C / 93 F.
(-) Riproducendo The Witcher 3, la temperatura media per il lato superiore e' di 40.3 °C / 105 F, rispetto alla media del dispositivo di 33.9 °C / 93 F.
(+) I poggiapolsi e il touchpad raggiungono la temperatura massima della pelle (35 °C / 95 F) e quindi non sono caldi.
(-) La temperatura media della zona del palmo della mano di dispositivi simili e'stata di 28.8 °C / 83.8 F (-6.2 °C / -11.2 F).
| HP Omen Transcend 16-u1095ng i9-14900HX, GeForce RTX 4070 Laptop GPU | HP Omen Transcend 16 i9-13900HX, GeForce RTX 4070 Laptop GPU | Asus ROG Zephyrus G16 2024 GU605M Ultra 7 155H, GeForce RTX 4070 Laptop GPU | Schenker XMG CORE 16 (L23) R7 7840HS, GeForce RTX 4070 Laptop GPU | Lenovo Legion Pro 5 16ARX8 R7 7745HX, GeForce RTX 4070 Laptop GPU | |
|---|---|---|---|---|---|
| Heat | 5% | 6% | 4% | 12% | |
| Maximum Upper Side * (°C) | 49 | 47.4 3% | 50.3 -3% | 46 6% | 41.8 15% |
| Maximum Bottom * (°C) | 63 | 54.4 14% | 48 24% | 44 30% | 41.4 34% |
| Idle Upper Side * (°C) | 30 | 28.4 5% | 28.8 4% | 32 -7% | 29 3% |
| Idle Bottom * (°C) | 29 | 29.2 -1% | 29.8 -3% | 33 -14% | 30.4 -5% |
* ... Meglio usare valori piccoli
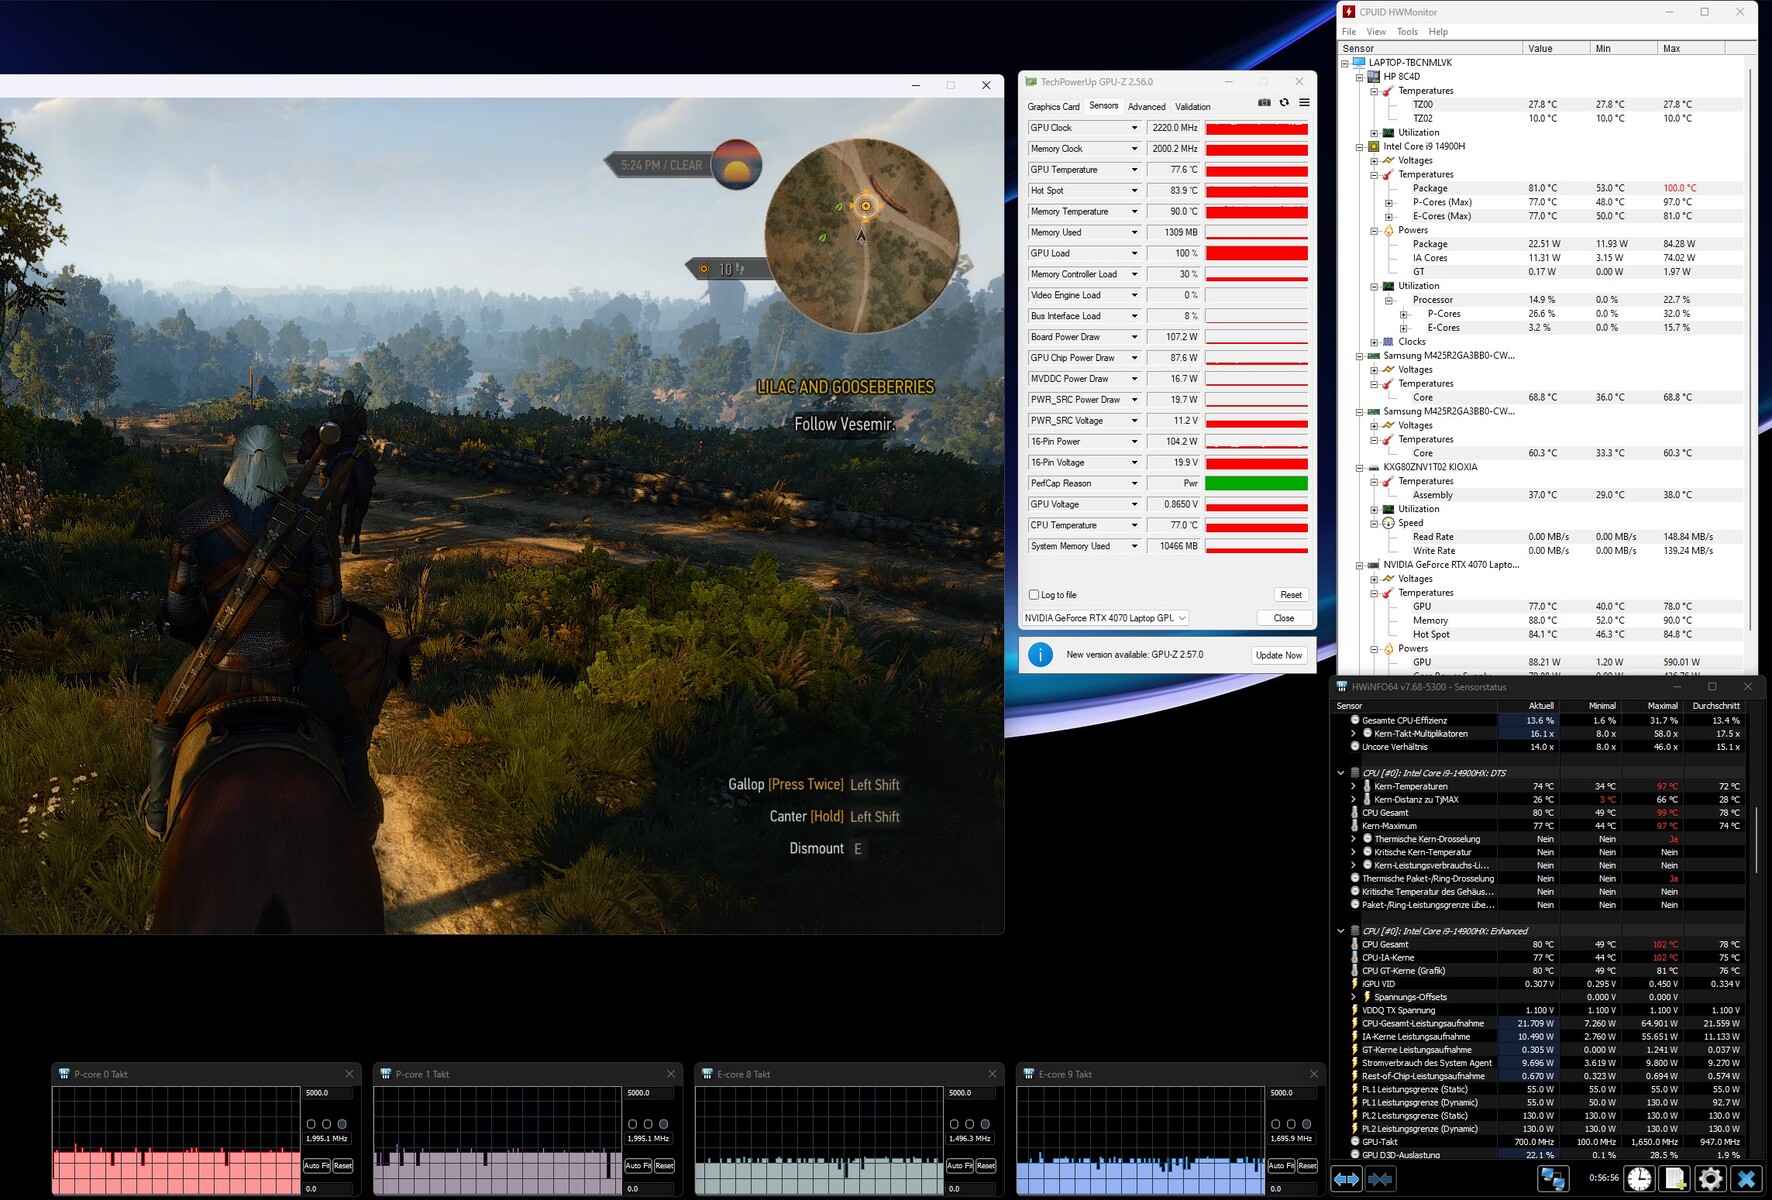
Test da sforzo
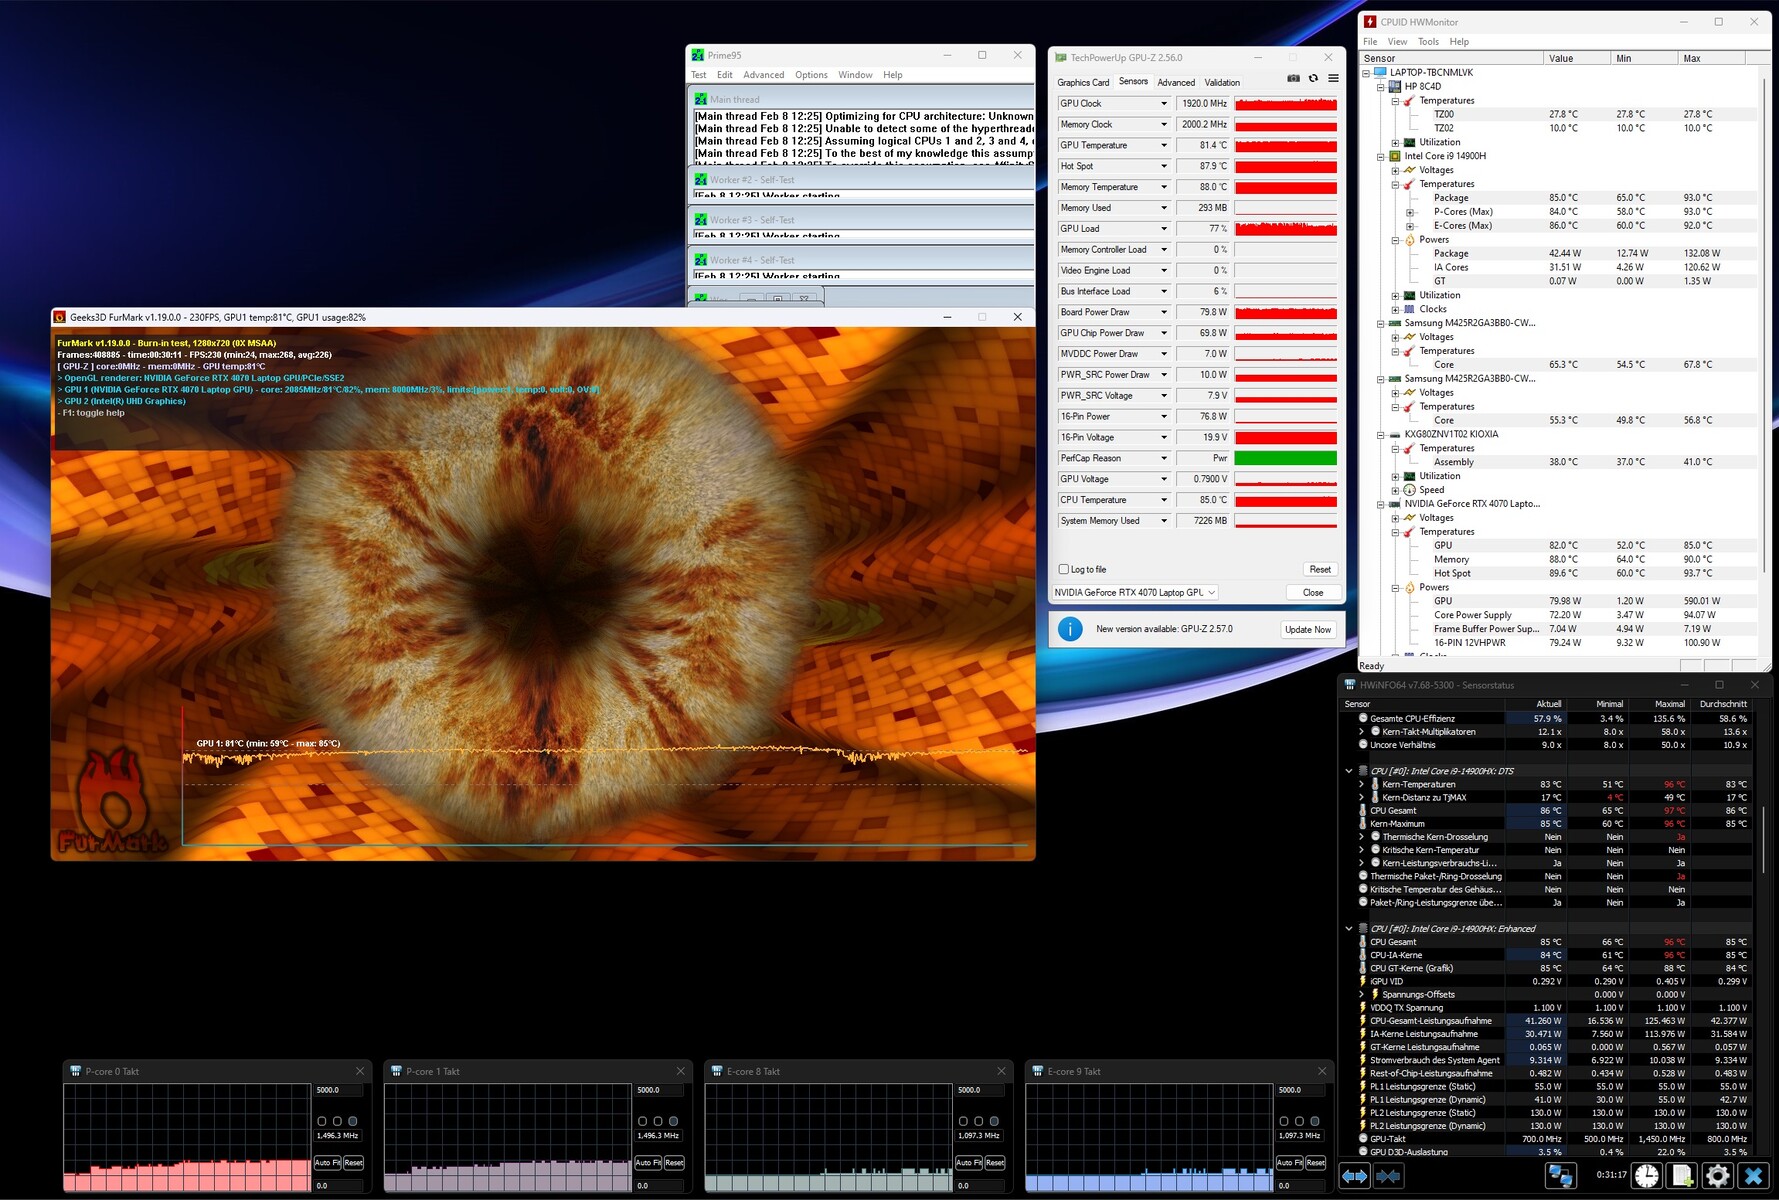
Nel test di stress utilizzando gli strumenti Furmark e Prime95, dopo 60 minuti, la CPU si è assestata a circa 85 °C, mentre la GPU ha raggiunto 81 °C (un hotspot di 88 °C) - entrambi valori relativamente alti ma innocui.
Altoparlanti
La qualità del suono è leggermente migliore rispetto alla media dei portatili da gioco, anche se, come spesso accade, i bassi faticano e potrebbero essere più potenti e precisi. Il volume massimo di 82 dB(A) è più che discreto.
HP Omen Transcend 16-u1095ng analisi audio
(+) | gli altoparlanti sono relativamente potenti (82 dB)
Bassi 100 - 315 Hz
(-) | quasi nessun basso - in media 21.9% inferiori alla media
(±) | la linearità dei bassi è media (11% delta rispetto alla precedente frequenza)
Medi 400 - 2000 Hz
(+) | medi bilanciati - solo only 3.2% rispetto alla media
(+) | medi lineari (5.3% delta rispetto alla precedente frequenza)
Alti 2 - 16 kHz
(+) | Alti bilanciati - appena 1.4% dalla media
(+) | alti lineari (5.2% delta rispetto alla precedente frequenza)
Nel complesso 100 - 16.000 Hz
(+) | suono nel complesso lineare (14.5% differenza dalla media)
Rispetto alla stessa classe
» 27% di tutti i dispositivi testati in questa classe è stato migliore, 7% simile, 66% peggiore
» Il migliore ha avuto un delta di 6%, medio di 18%, peggiore di 132%
Rispetto a tutti i dispositivi testati
» 18% di tutti i dispositivi testati in questa classe è stato migliore, 4% similare, 78% peggiore
» Il migliore ha avuto un delta di 4%, medio di 24%, peggiore di 134%
Asus ROG Zephyrus G16 2024 GU605M analisi audio
(+) | gli altoparlanti sono relativamente potenti (83.3 dB)
Bassi 100 - 315 Hz
(+) | bassi buoni - solo 3.8% dalla media
(±) | la linearità dei bassi è media (8.1% delta rispetto alla precedente frequenza)
Medi 400 - 2000 Hz
(+) | medi bilanciati - solo only 3.5% rispetto alla media
(+) | medi lineari (2.4% delta rispetto alla precedente frequenza)
Alti 2 - 16 kHz
(+) | Alti bilanciati - appena 2.2% dalla media
(+) | alti lineari (3.7% delta rispetto alla precedente frequenza)
Nel complesso 100 - 16.000 Hz
(+) | suono nel complesso lineare (7.3% differenza dalla media)
Rispetto alla stessa classe
» 1% di tutti i dispositivi testati in questa classe è stato migliore, 0% simile, 99% peggiore
» Il migliore ha avuto un delta di 6%, medio di 18%, peggiore di 132%
Rispetto a tutti i dispositivi testati
» 1% di tutti i dispositivi testati in questa classe è stato migliore, 0% similare, 99% peggiore
» Il migliore ha avuto un delta di 4%, medio di 24%, peggiore di 134%
Gestione dell'energia
Consumo di energia
I requisiti energetici sono simili ai valori standard riscontrati in questa categoria di prestazioni. il consumo da 10 a 32 watt al minimo e il consumo da 128 a 242 watt sotto carico non sono né particolarmente alti né bassi.
| Off / Standby | |
| Idle | |
| Sotto carico |
|
Leggenda:
min: | |
| HP Omen Transcend 16-u1095ng i9-14900HX, GeForce RTX 4070 Laptop GPU | HP Omen Transcend 16 i9-13900HX, GeForce RTX 4070 Laptop GPU | Asus ROG Zephyrus G16 2024 GU605M Ultra 7 155H, GeForce RTX 4070 Laptop GPU | Schenker XMG CORE 16 (L23) R7 7840HS, GeForce RTX 4070 Laptop GPU | Lenovo Legion Pro 5 16ARX8 R7 7745HX, GeForce RTX 4070 Laptop GPU | Media della classe Gaming | |
|---|---|---|---|---|---|---|
| Power Consumption | -42% | 33% | 12% | 1% | -0% | |
| Idle Minimum * (Watt) | 10 | 19.2 -92% | 8.3 17% | 11 -10% | 8.1 19% | 13.1 ? -31% |
| Idle Average * (Watt) | 18 | 22.7 -26% | 12.5 31% | 15.2 16% | 15.9 12% | 18.8 ? -4% |
| Idle Maximum * (Watt) | 32 | 55.4 -73% | 12.8 60% | 16 50% | 37.2 -16% | 24.4 ? 24% |
| Load Average * (Watt) | 128 | 128.4 -0% | 71.3 44% | 64 50% | 90.9 29% | 108.5 ? 15% |
| Witcher 3 ultra * (Watt) | 148.4 | 206 -39% | 127.5 14% | 179 -21% | 189.6 -28% | |
| Load Maximum * (Watt) | 242 | 292 -21% | 169.1 30% | 280 -16% | 263.5 -9% | 254 ? -5% |
* ... Meglio usare valori piccoli
Power consumption Witcher 3 / stress test
Power consumption with an external monitor
Durata della batteria
Per quanto riguarda i requisiti energetici in modalità batteria, HP ha ancora del lavoro da fare. Nonostante la potente batteria da 97 Wh, il 16 pollici è riuscito a durare solo poco meno di 5 ore nel nostro test Wi-Fi con una luminosità ridotta di 150 cd/m². Per fare un confronto: Il ROG Zyphrus G16 ha superato le 7 ore e l'XMG Core 16 ha superato le 8 ore.
| HP Omen Transcend 16-u1095ng i9-14900HX, GeForce RTX 4070 Laptop GPU, 97 Wh | HP Omen Transcend 16 i9-13900HX, GeForce RTX 4070 Laptop GPU, 97 Wh | Asus ROG Zephyrus G16 2024 GU605M Ultra 7 155H, GeForce RTX 4070 Laptop GPU, 90 Wh | Schenker XMG CORE 16 (L23) R7 7840HS, GeForce RTX 4070 Laptop GPU, 99 Wh | Lenovo Legion Pro 5 16ARX8 R7 7745HX, GeForce RTX 4070 Laptop GPU, 80 Wh | Media della classe Gaming | |
|---|---|---|---|---|---|---|
| Autonomia della batteria | -14% | 49% | 71% | -18% | 42% | |
| WiFi v1.3 (h) | 4.9 | 4.2 -14% | 7.3 49% | 8.4 71% | 4 -18% | 6.98 ? 42% |
| Reader / Idle (h) | 6.3 | 6.5 | 8.71 ? | |||
| Load (h) | 1.2 | 1.2 | 2.4 | 1 | 1.47 ? | |
| H.264 (h) | 11.2 | 10.2 | 8.26 ? |
Pro
Contro
Il verdetto
Innanzitutto, Omen Transcend 16-u1095ng cerca di attirare i potenziali clienti con un brillante display OLED che si rivolge sia ai giocatori che ai creatori.
Se può sopportare uno schermo molto riflettente e non ha problemi di sfarfallio, ottiene un display colorato con un eccellente rapporto di contrasto e ottimi tempi di risposta, oltre a livelli di nero e angoli di visione superbi.
Ci sono alcuni punti negativi per quanto riguarda le emissioni e la velocità. Mentre la macchina da 16 pollici diventa fastidiosamente rumorosa in modalità prestazioni, le prestazioni della modalità bilanciata sembrano un po' sotto la media. A parte questo, Omen Transcend 16 è simile ad altri portatili da gioco per quanto riguarda la qualità del case, i dispositivi di input e la selezione delle porte.
Nel complesso, il punteggio totale è paragonabile a quello di XMG Core 16 L23 o del Legion Pro 5 16ARX8. Chi è alla ricerca di un dispositivo particolarmente leggero e compatto nella categoria dei 16 pollici dovrebbe guardare al nuovo ROG Zeyphrus G16.
Prezzo e disponibilità
Al momento della nostra recensione, HP Omen Transcend 16-u1095ng con Core i9-14900HX e GeForce RTX 4070 non è attualmente disponibile sul negozio online di HP, su Amazon o Best Buy.
HP Omen Transcend 16-u1095ng
- 02/12/2024 v7 (old)
Florian Glaser
Transparency
La selezione dei dispositivi da recensire viene effettuata dalla nostra redazione. Il campione di prova è stato fornito all'autore come prestito dal produttore o dal rivenditore ai fini di questa recensione. L'istituto di credito non ha avuto alcuna influenza su questa recensione, né il produttore ne ha ricevuto una copia prima della pubblicazione. Non vi era alcun obbligo di pubblicare questa recensione. In quanto società mediatica indipendente, Notebookcheck non è soggetta all'autorità di produttori, rivenditori o editori.
Ecco come Notebookcheck esegue i test
Ogni anno, Notebookcheck esamina in modo indipendente centinaia di laptop e smartphone utilizzando procedure standardizzate per garantire che tutti i risultati siano comparabili. Da circa 20 anni sviluppiamo continuamente i nostri metodi di prova e nel frattempo stabiliamo gli standard di settore. Nei nostri laboratori di prova, tecnici ed editori esperti utilizzano apparecchiature di misurazione di alta qualità. Questi test comportano un processo di validazione in più fasi. Il nostro complesso sistema di valutazione si basa su centinaia di misurazioni e parametri di riferimento ben fondati, che mantengono l'obiettività.Price comparison

