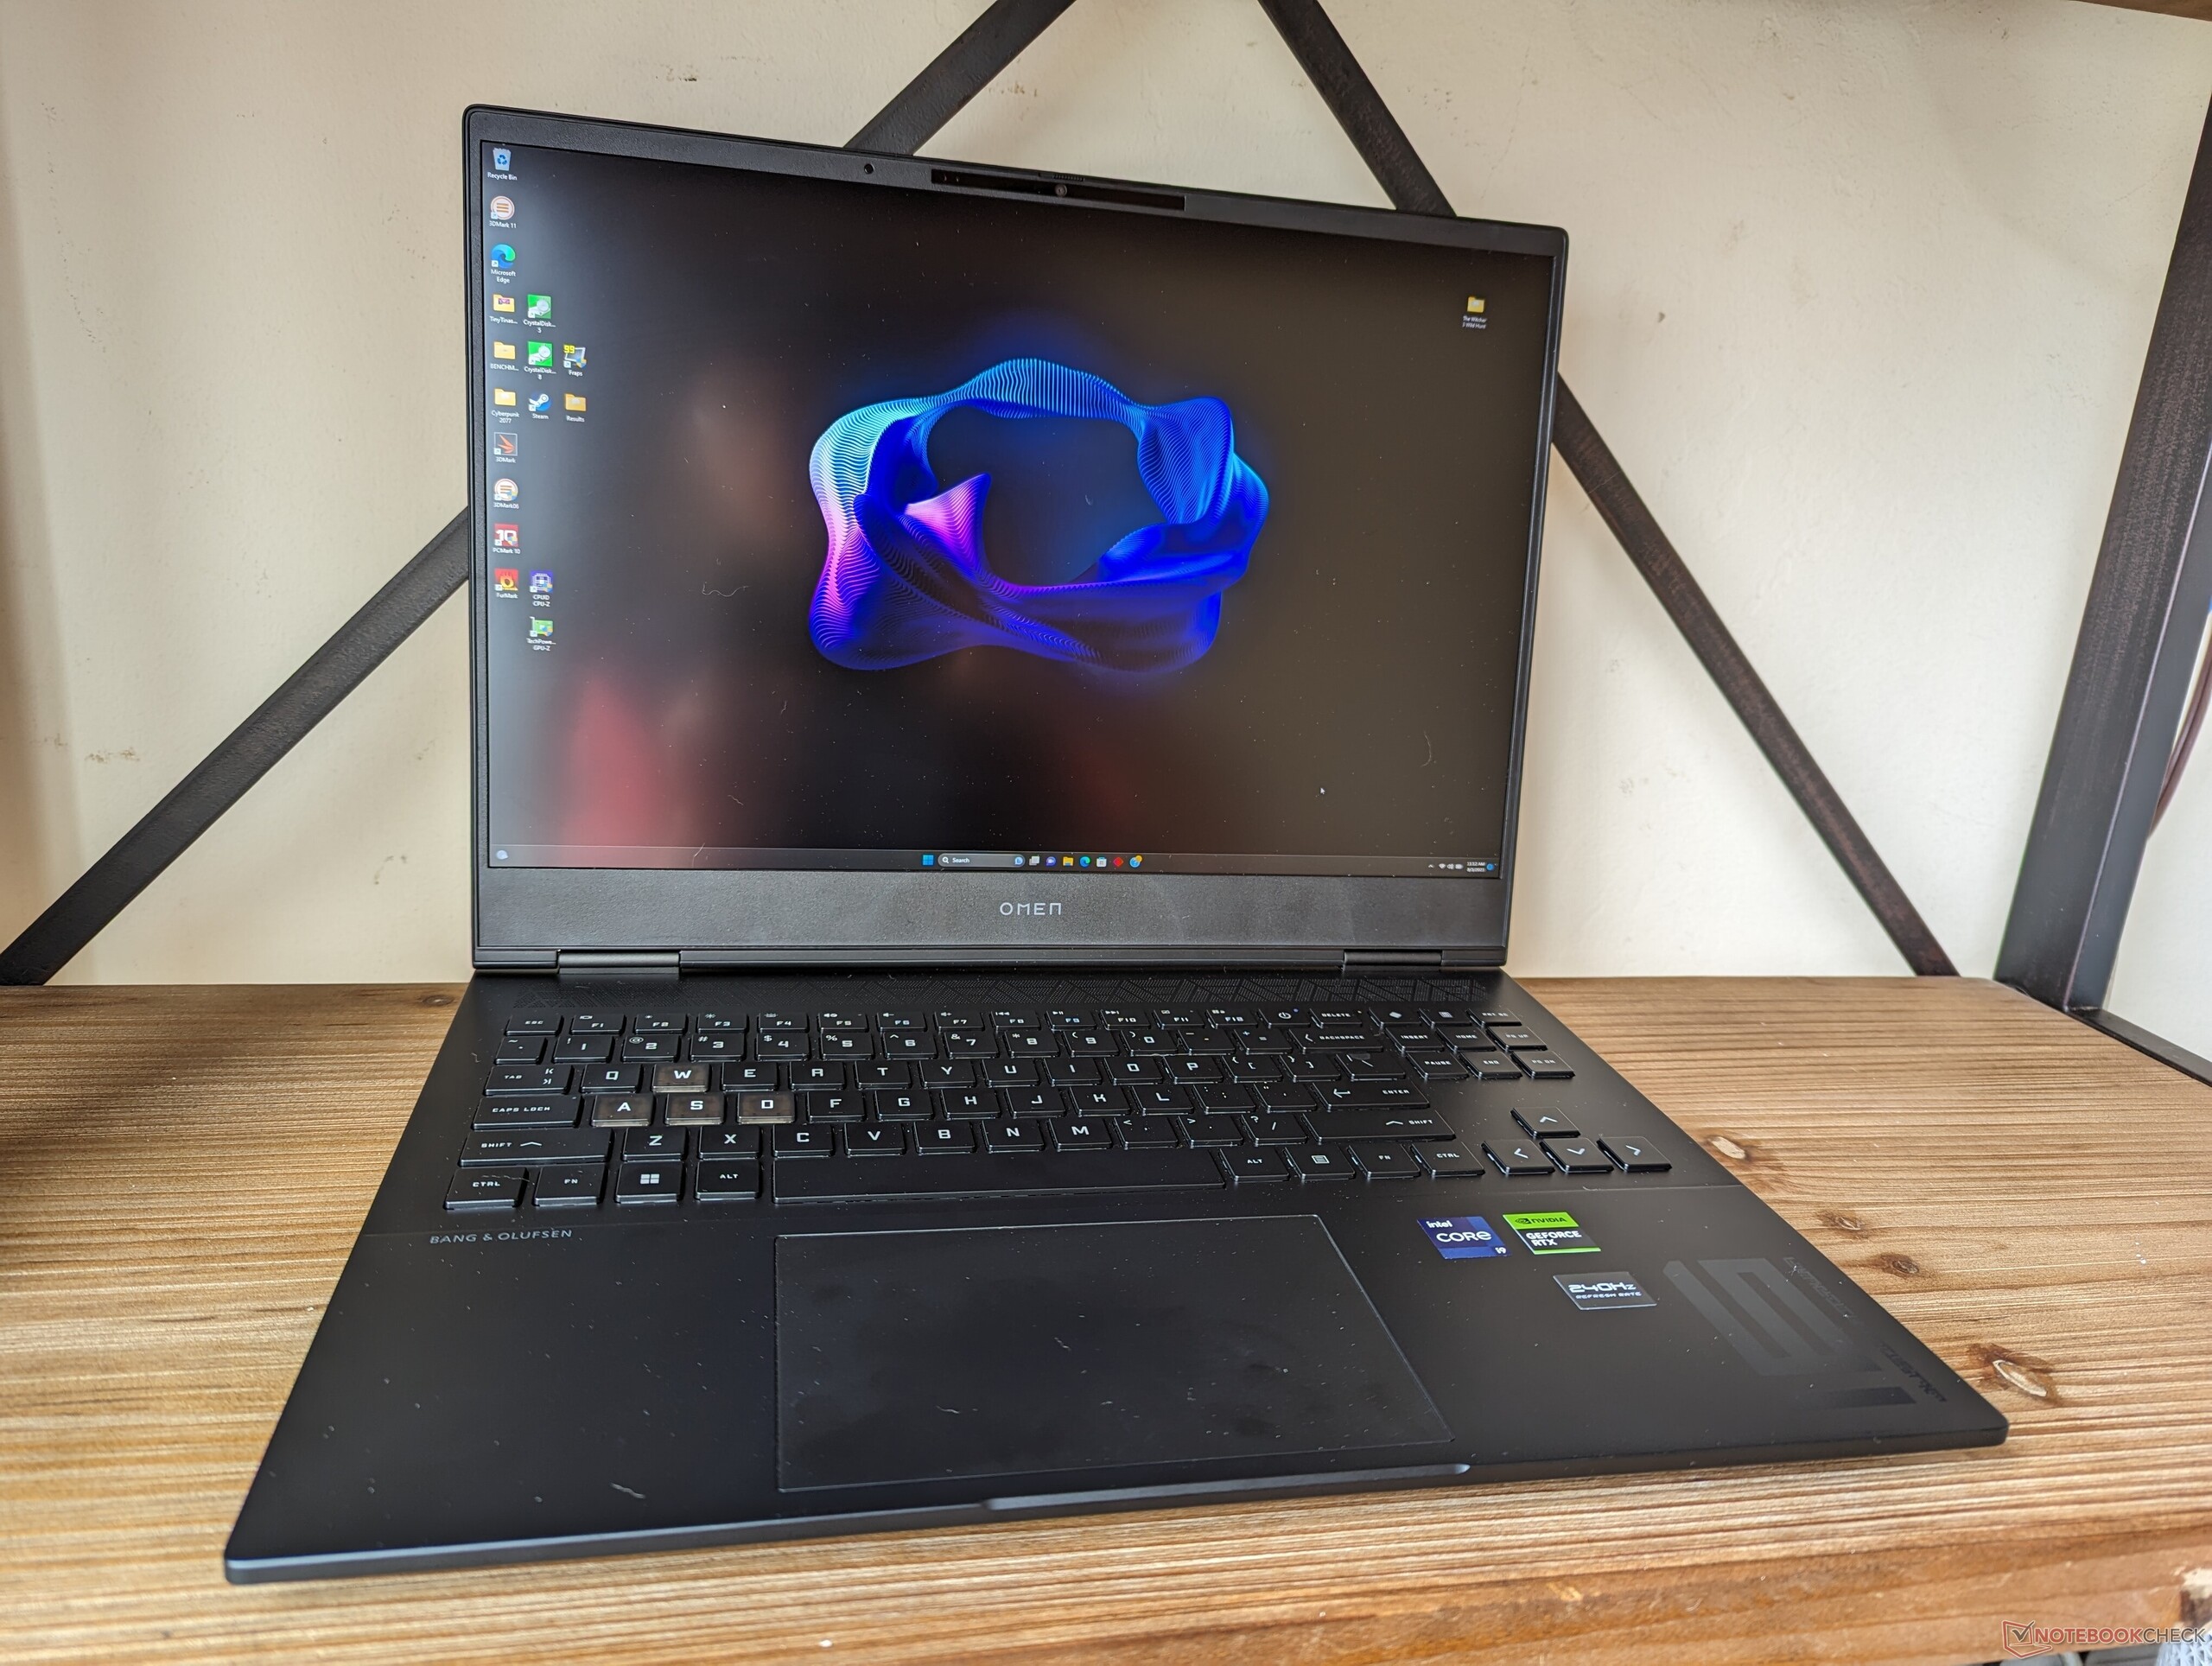
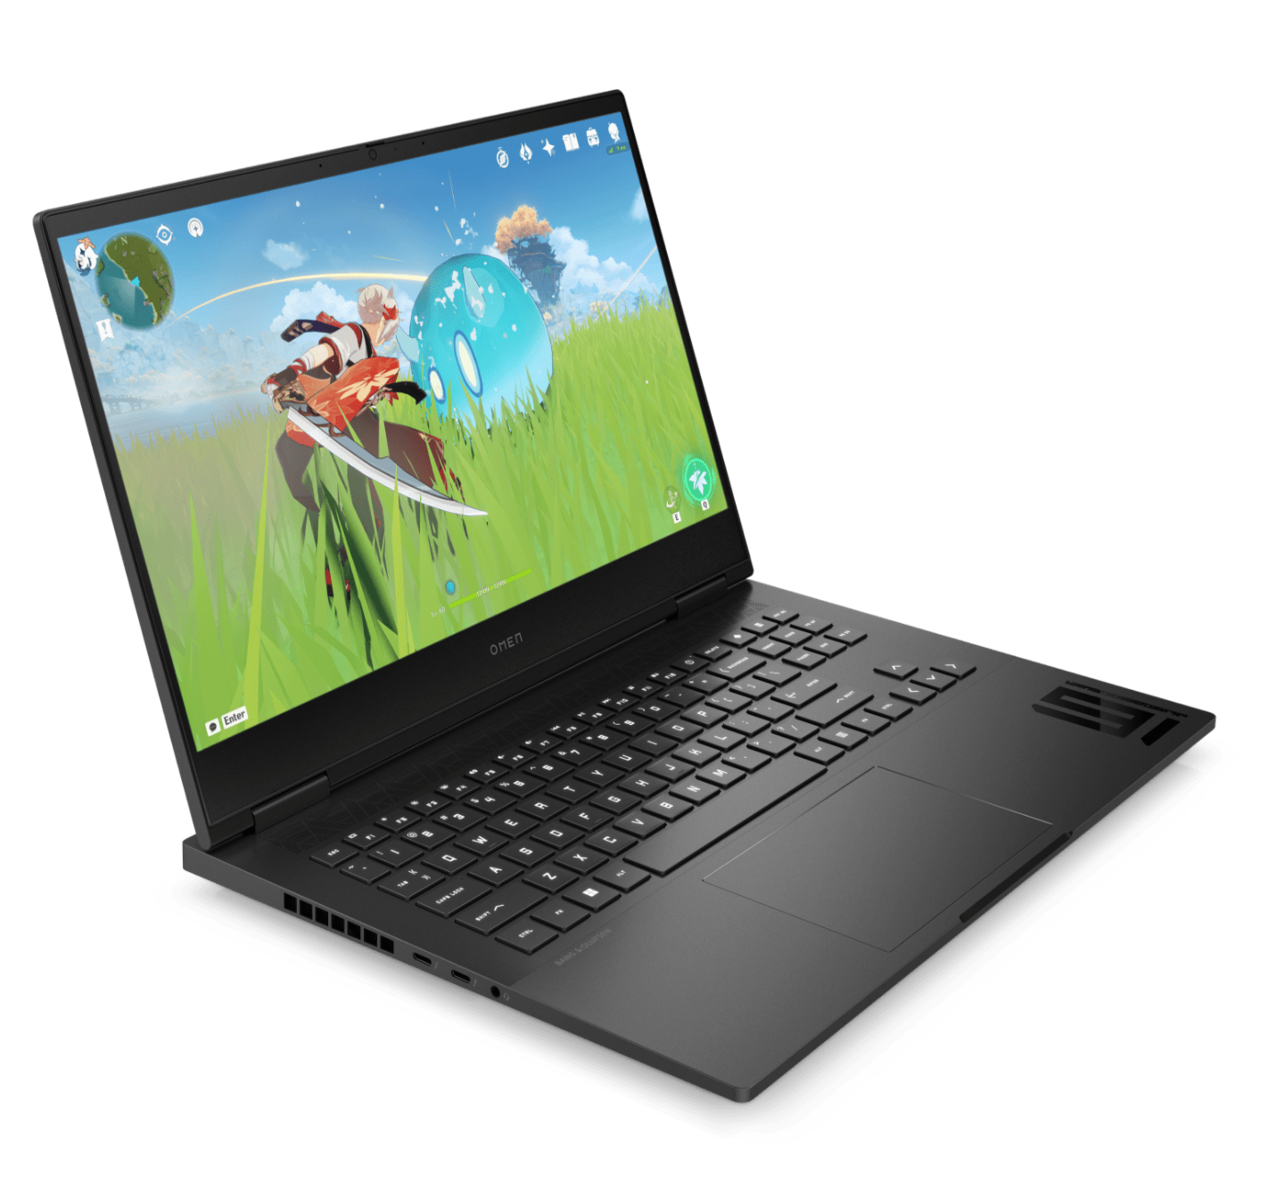
Recensione del portatile HP Omen Transcend 16: Più di una piccola differenza di nome

L'Omen Transcend 16 è una variante dell'Omen 16 standard. Sebbene utilizzino chassis e materiali simili, l'Omen Transcend 16 presenta diverse differenze importanti che i potenziali acquirenti dovrebbero conoscere.
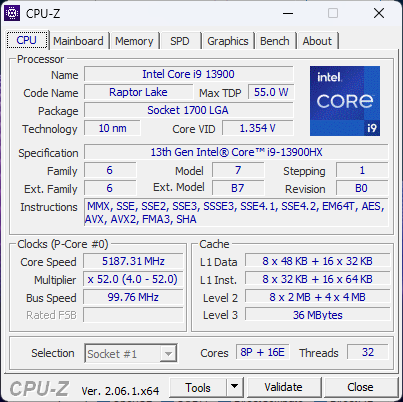
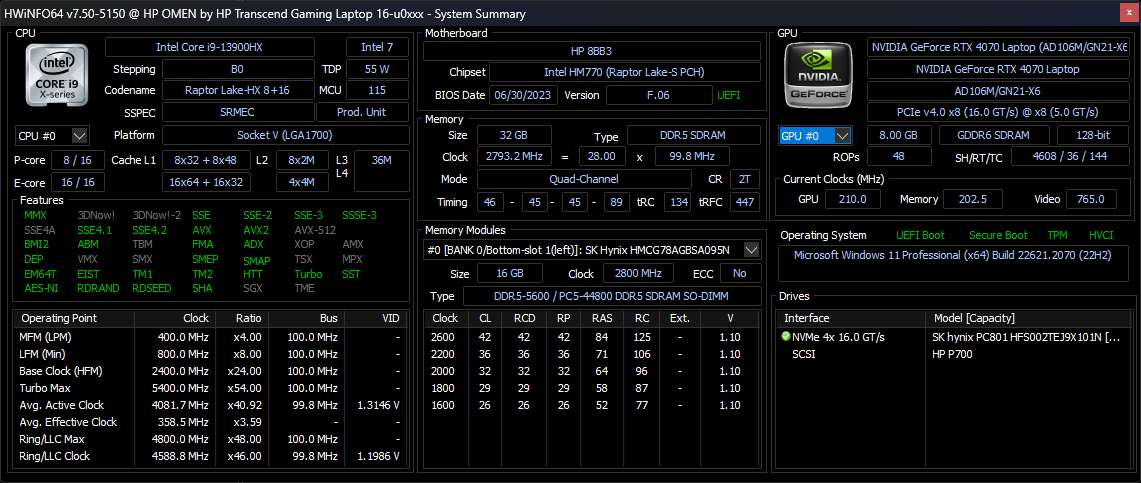
La nostra specifica unità di recensione è la configurazione più alta disponibile con CPU Raptor Lake Core i9-13900HX di 13a generazione, GPU RTX 4070 da 130 W GeForce e display mini-LED QHD+ (2560 x 1600) a 240 Hz con colori DCI-P3 completi per un prezzo al dettaglio di circa 2500 dollari. Sono disponibili SKU inferiori con Core i7-13700HX, GPU RTX 4050 e IPS 1200p a 165 Hz per circa 1250 dollari.
I concorrenti in questo spazio includono altri portatili da gioco di fascia alta da 16 pollici come Lenovo Legion Slim 7i 16 G8, Acer Nitro 16, Alienware x16 R1, o Asus ROG Zephyrus M16.
Altre recensioni di HP:
Potenziali concorrenti a confronto
Punteggio | Data | Modello | Peso | Altezza | Dimensione | Risoluzione | Prezzo |
|---|---|---|---|---|---|---|---|
| 87.9 % v7 (old) | 08/2023 | HP Omen Transcend 16 i9-13900HX, GeForce RTX 4070 Laptop GPU | 2.3 kg | 19.8 mm | 16.00" | 2560x1600 | |
| 90 % v7 (old) | 07/2023 | Lenovo Legion Slim 7i 16 Gen 8 i9-13900H, GeForce RTX 4070 Laptop GPU | 2.1 kg | 19.9 mm | 16.00" | 2560x1600 | |
| 87.4 % v7 (old) | 07/2023 | HP Omen 16-wf000 i7-13700HX, GeForce RTX 4080 Laptop GPU | 2.4 kg | 23.6 mm | 16.10" | 2560x1440 | |
| 88.4 % v7 (old) | 06/2023 | Alienware x16 R1 i9-13900HK, GeForce RTX 4080 Laptop GPU | 2.6 kg | 18.57 mm | 16.00" | 2560x1600 | |
| 88.1 % v7 (old) | 06/2023 | Acer Nitro 16 AN16-41 R7 7735HS, GeForce RTX 4070 Laptop GPU | 2.7 kg | 27.9 mm | 16.00" | 2560x1600 | |
| 87.8 % v7 (old) | 02/2023 | Asus ROG Zephyrus M16 GU603Z i9-12900H, GeForce RTX 3070 Ti Laptop GPU | 2.1 kg | 19.9 mm | 16.00" | 2560x1600 |
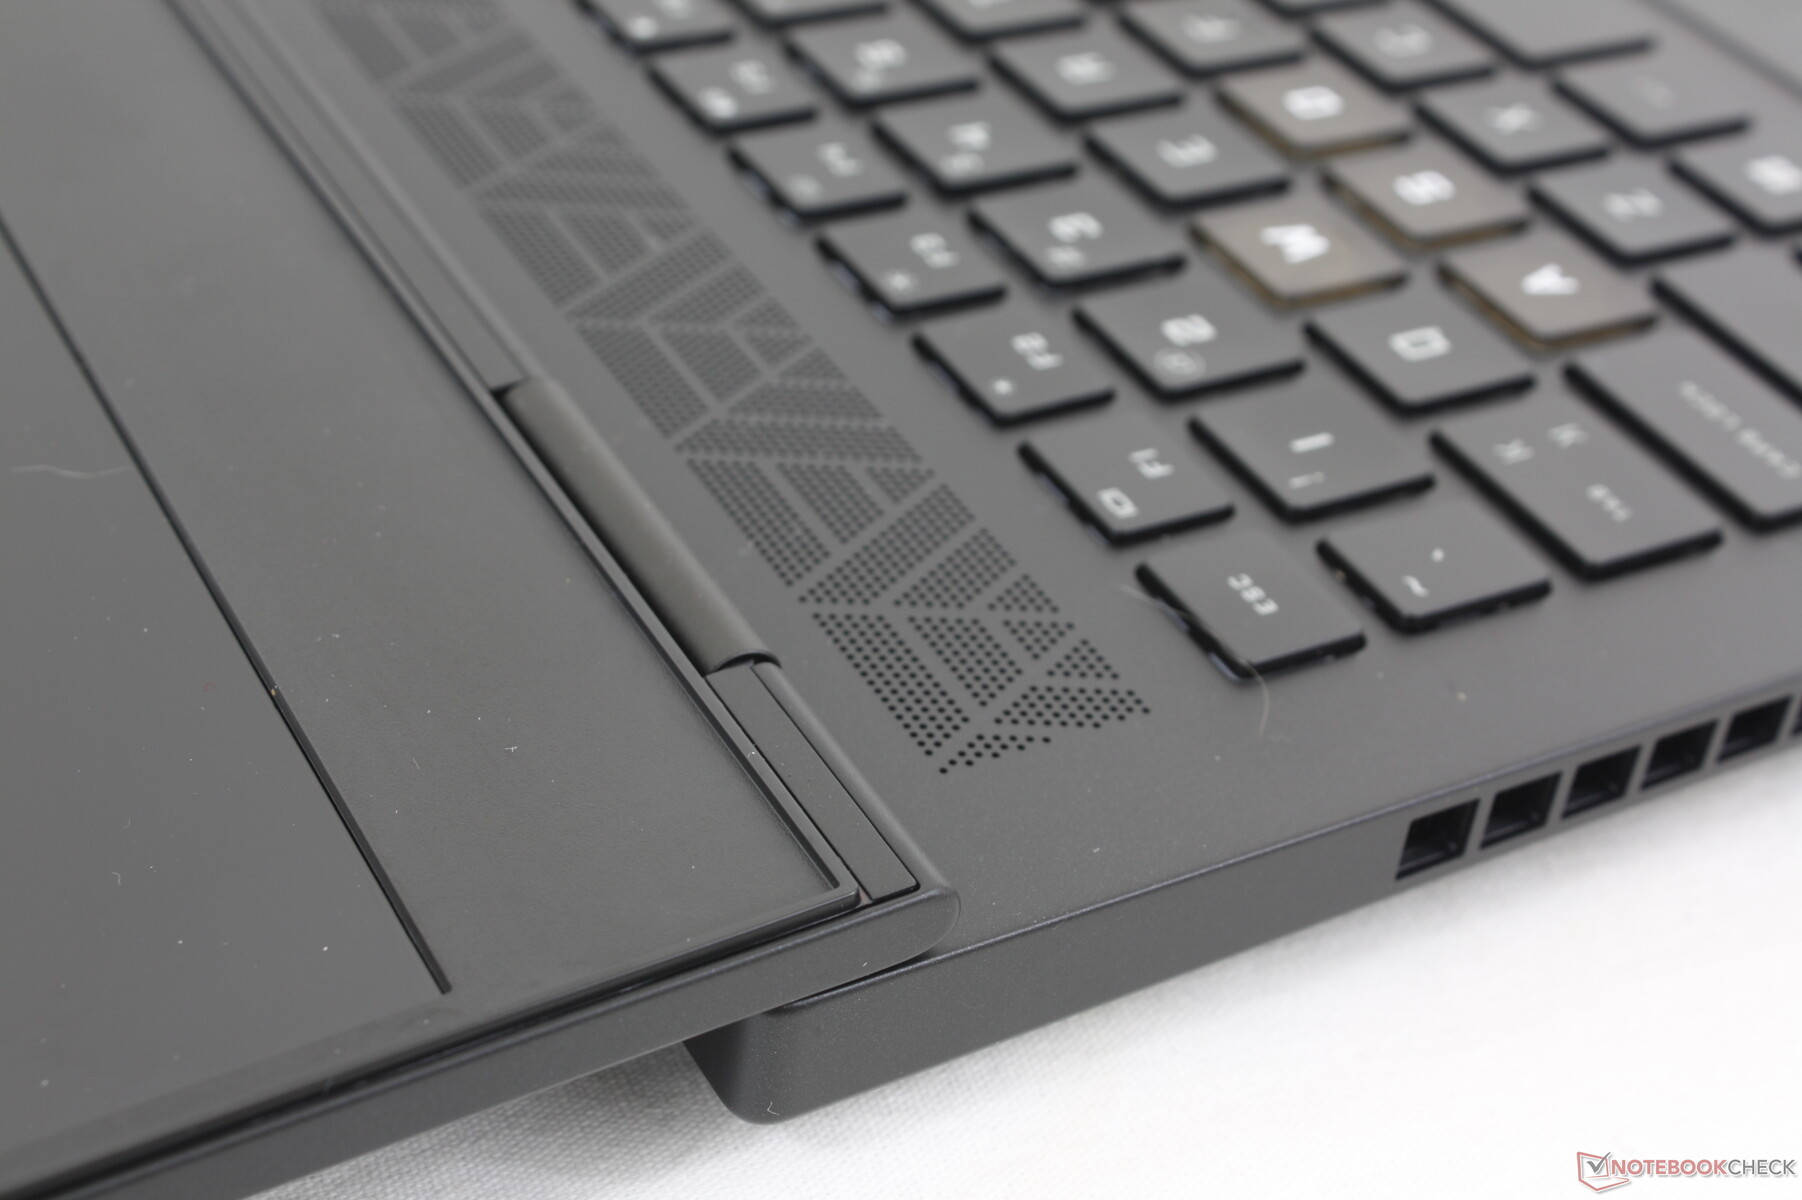
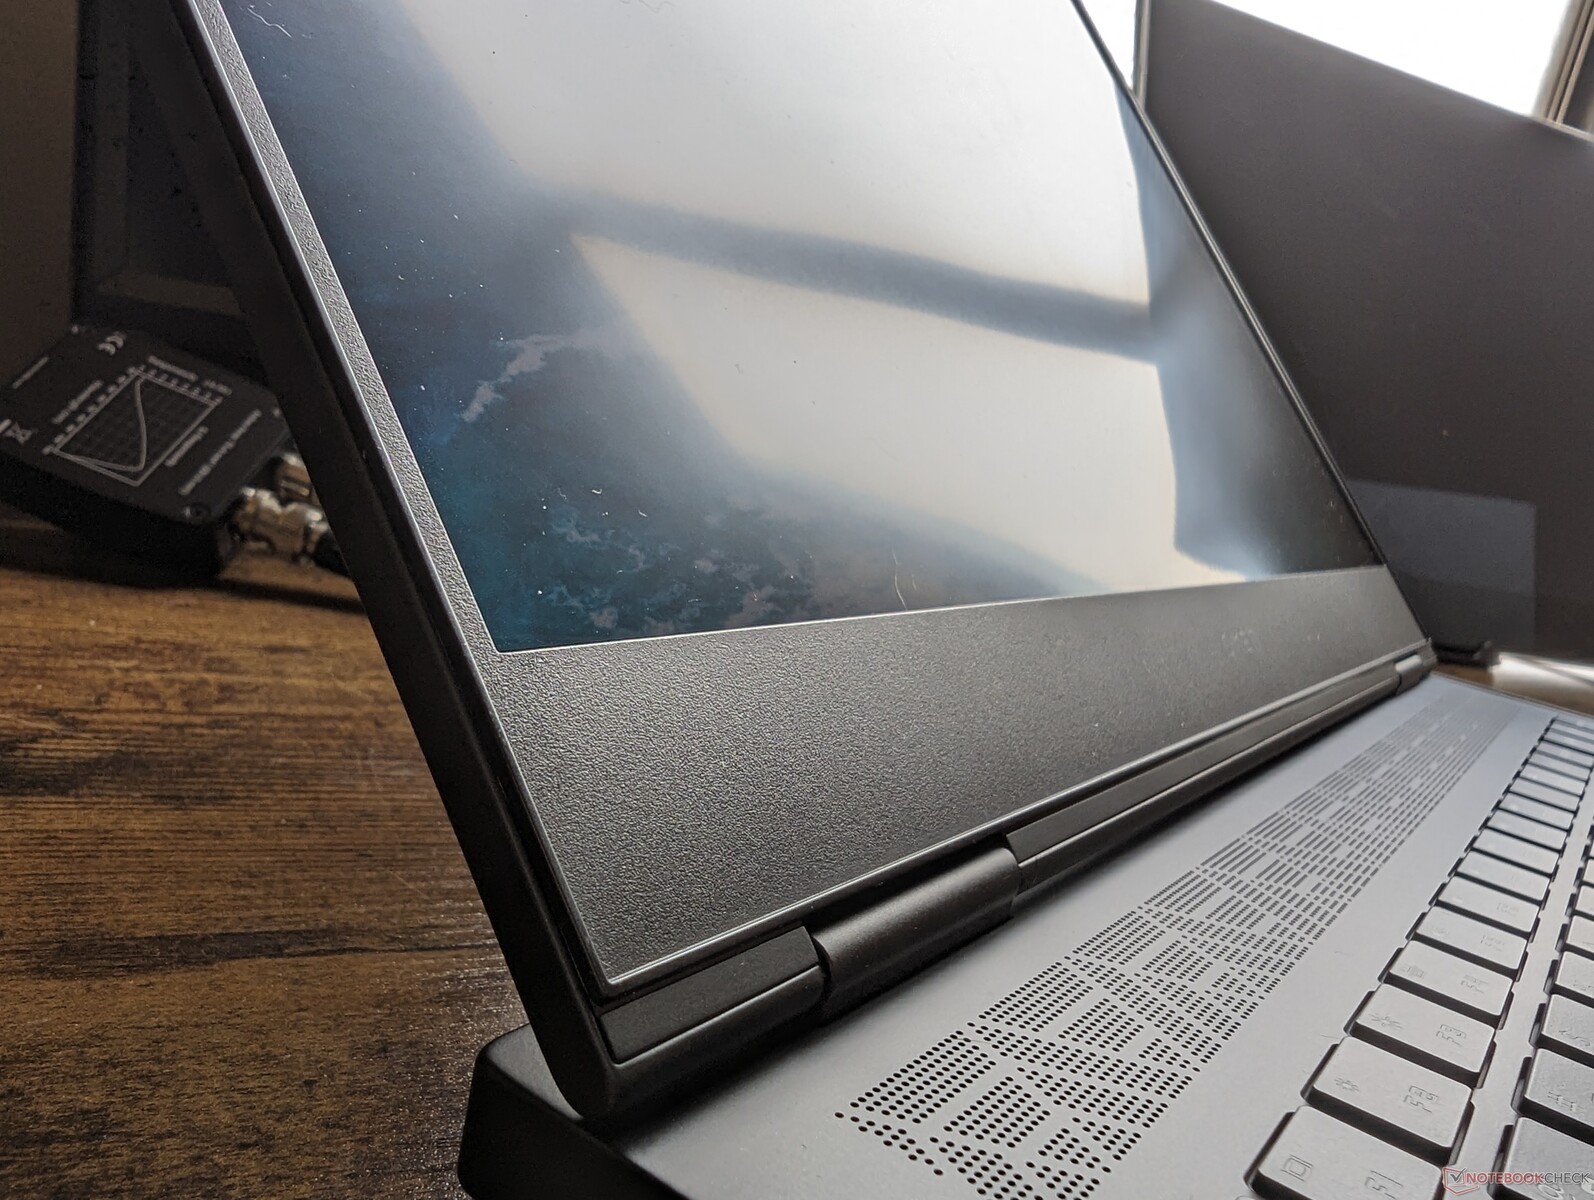
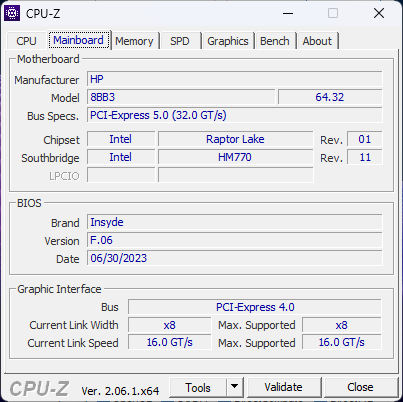
Custodia - Stessi materiali, dimensioni diverse
Una delle maggiori differenze esterne tra l'Omen 16 e l'Omen Transcend 16 è il passaggio da 16:9 a 16:10 e quindi le loro impronte sono leggermente diverse. Per il resto, entrambi i modelli condividono materiali metallici e texture simili. Vale la pena notare che la cornice lungo il bordo inferiore dello schermo non è più stretta rispetto al normale Omen 16, nonostante il cambio di rapporto d'aspetto.
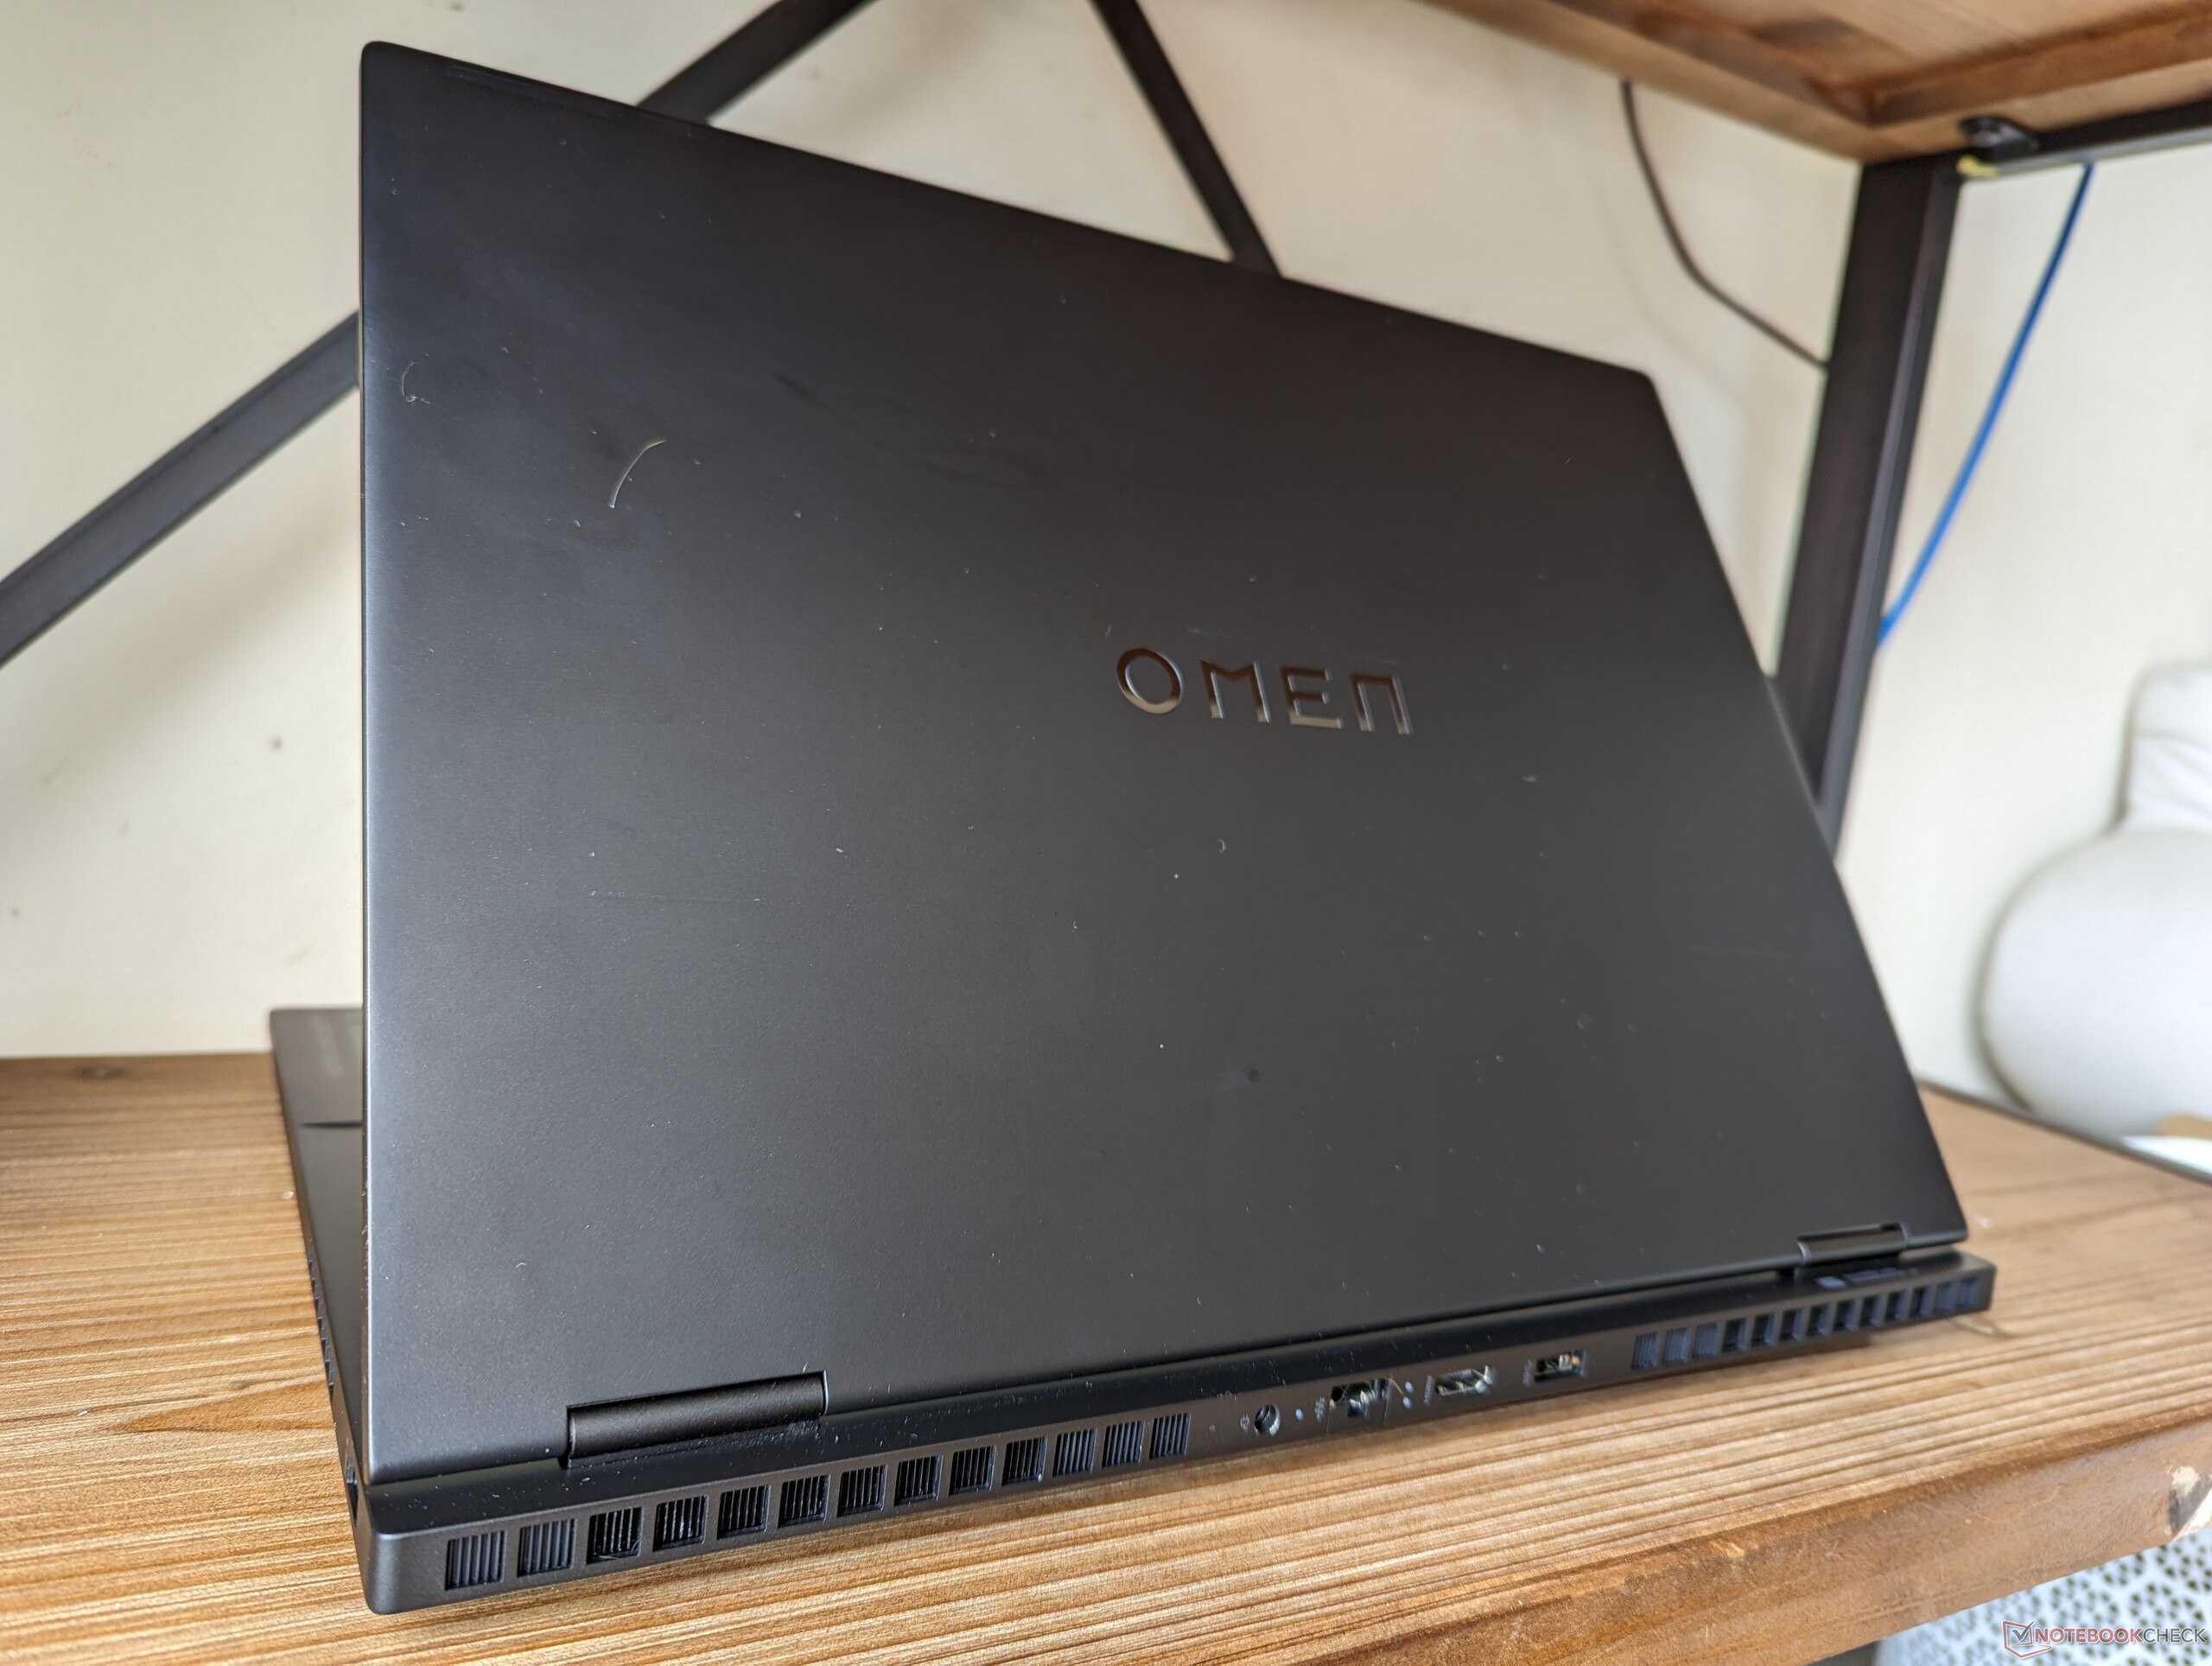
Il nuovo formato 16:10 rende l'Omen Transcend 16 più squadrato del normale Omen 16, ma con un profilo complessivamente più sottile di quasi 4 mm. Di conseguenza è un po' più leggero, ma non è ancora all'altezza dell'Asus ROG Zephyrus M16 Asus ROG Zephyrus M16 oLenovo Legion Slim 7i 16 G8.
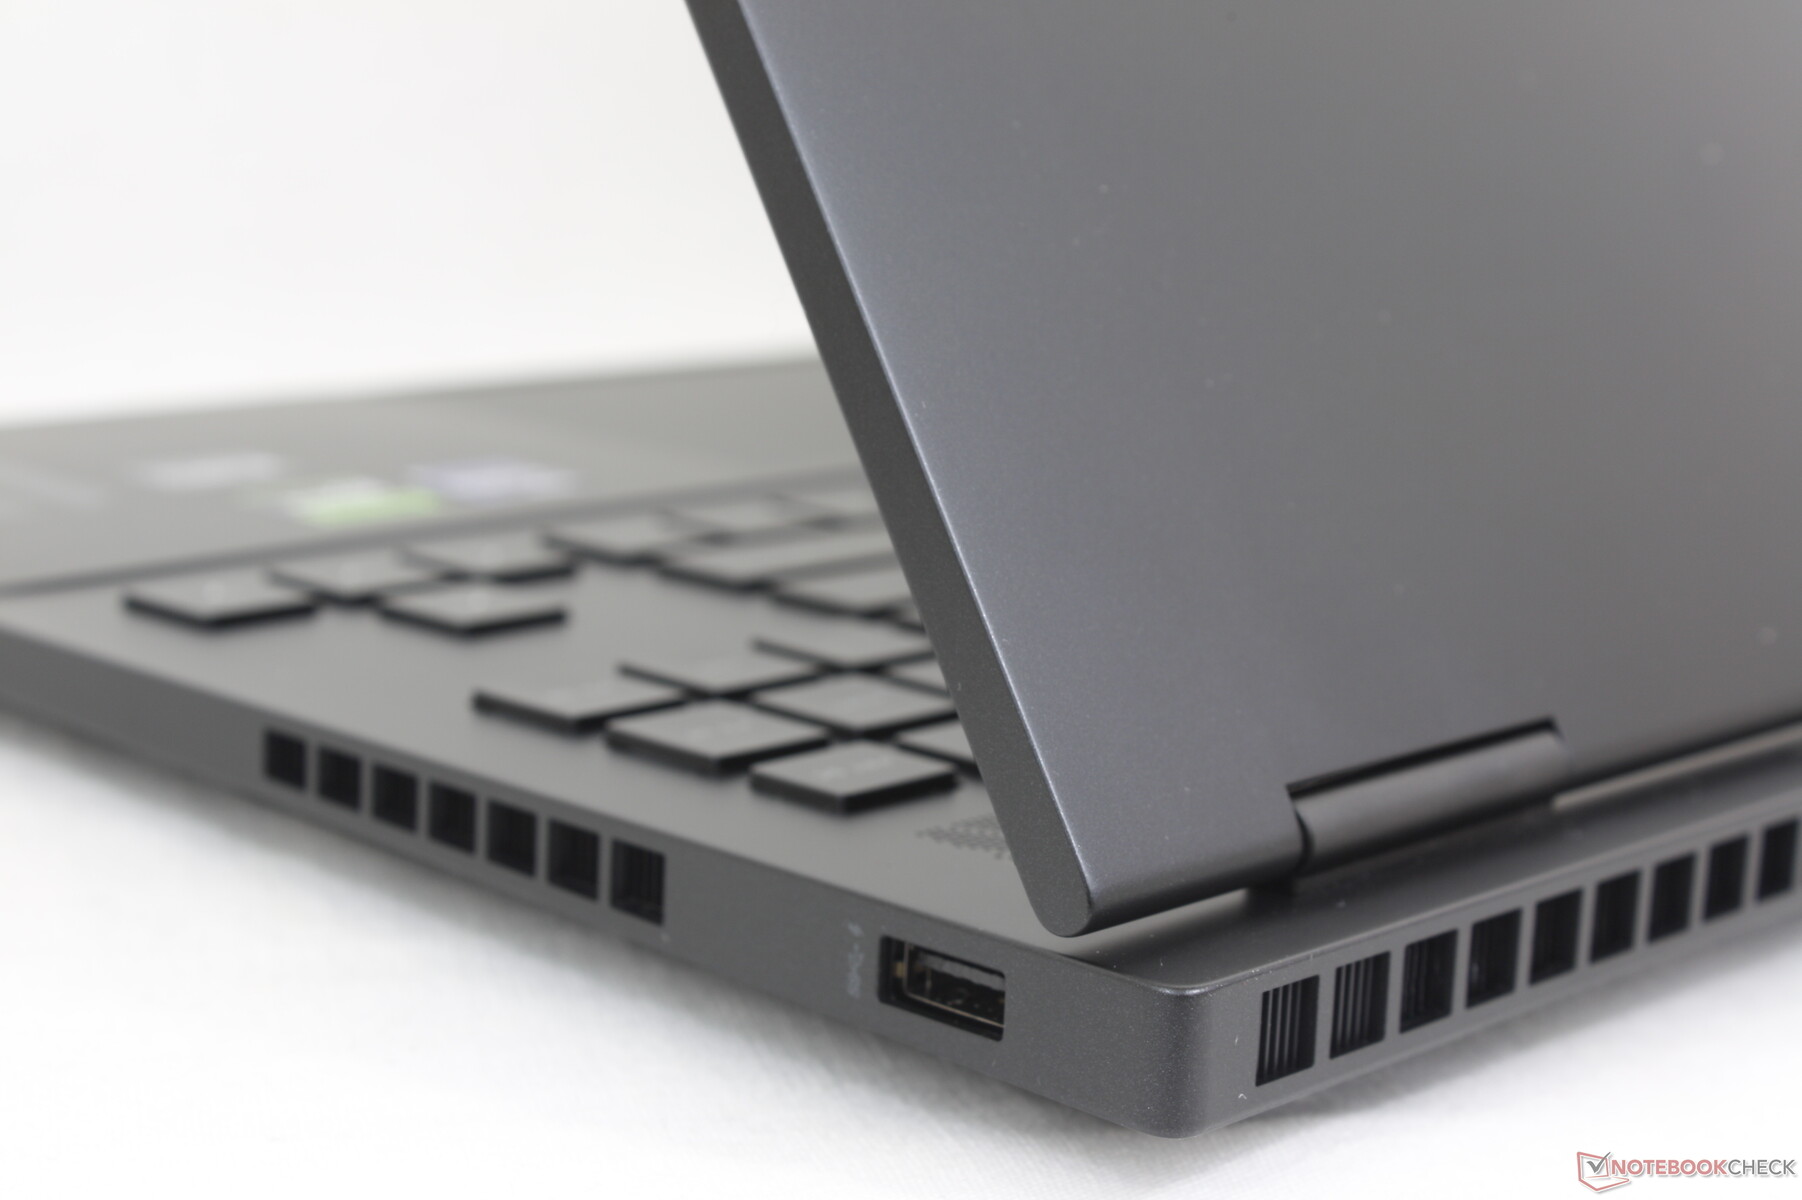
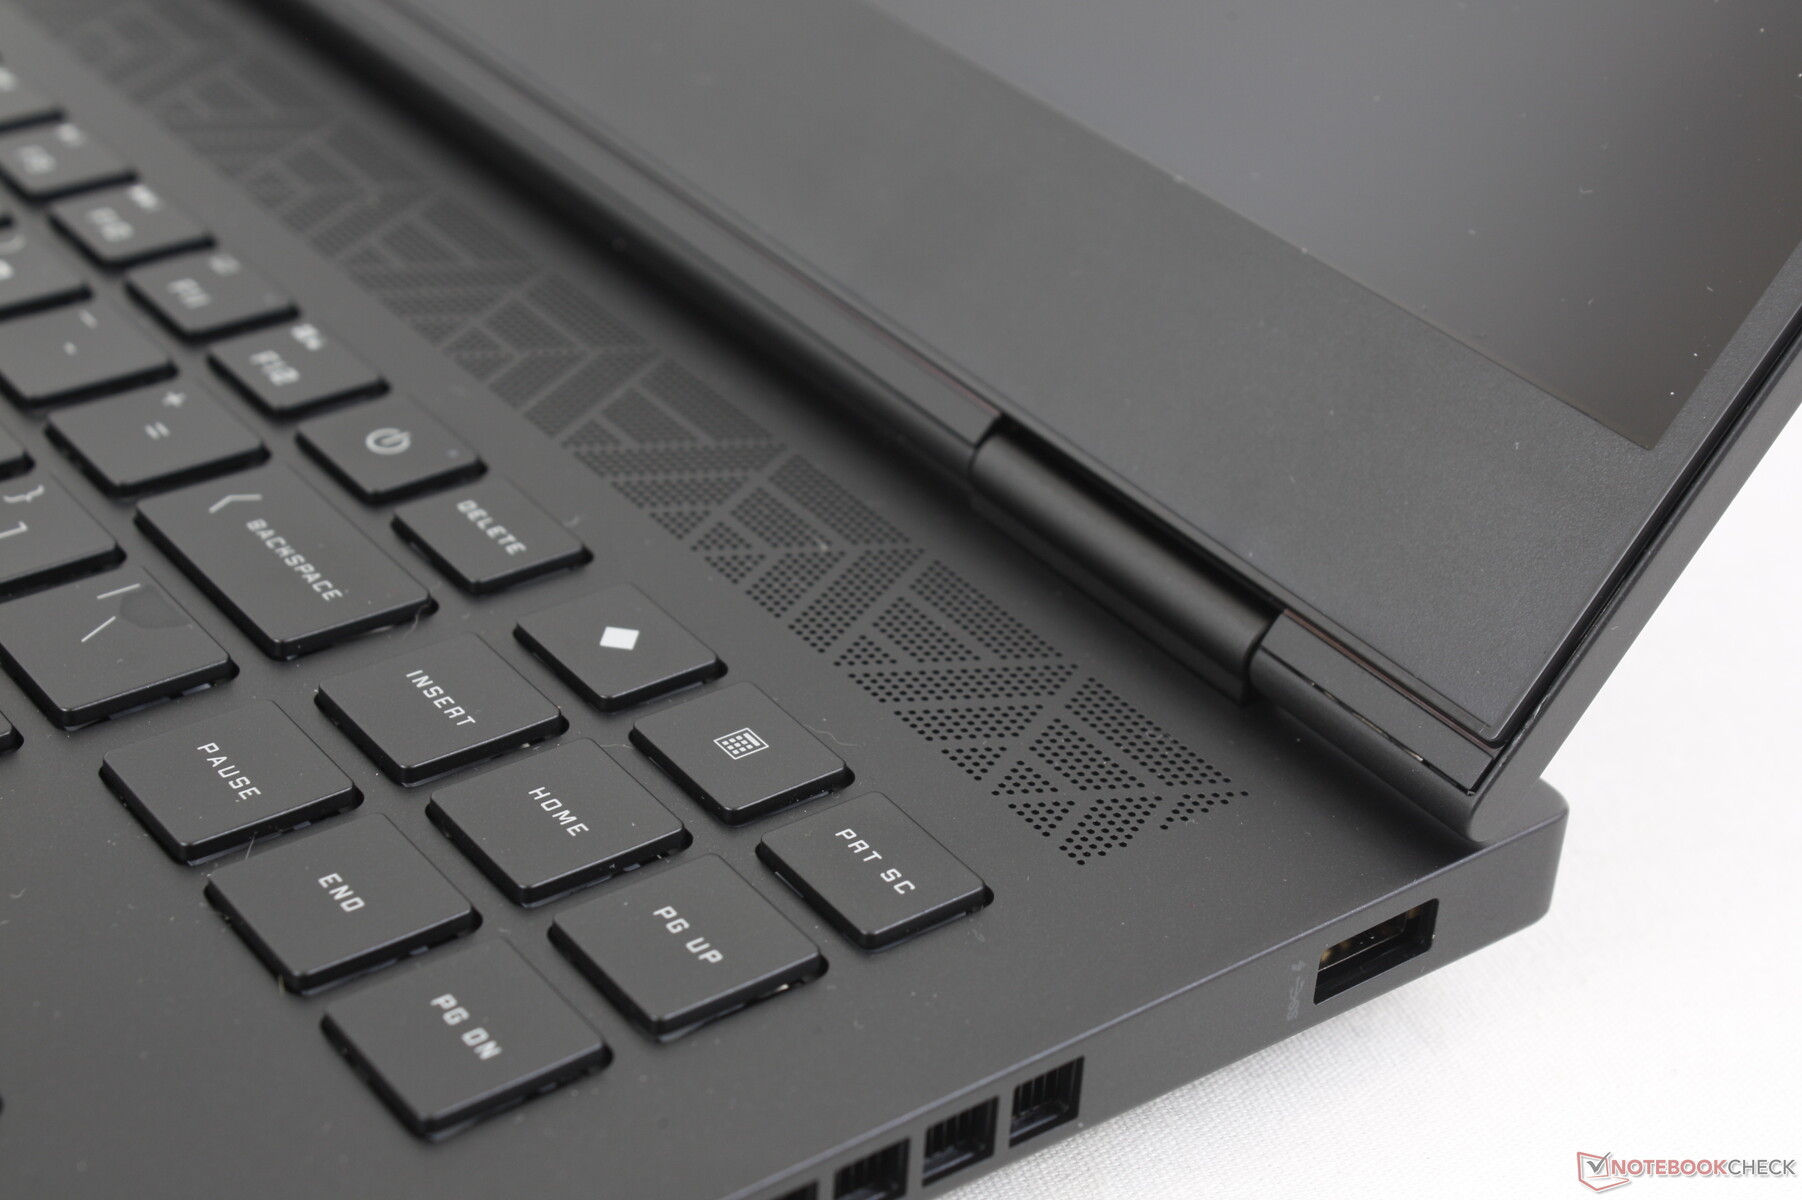
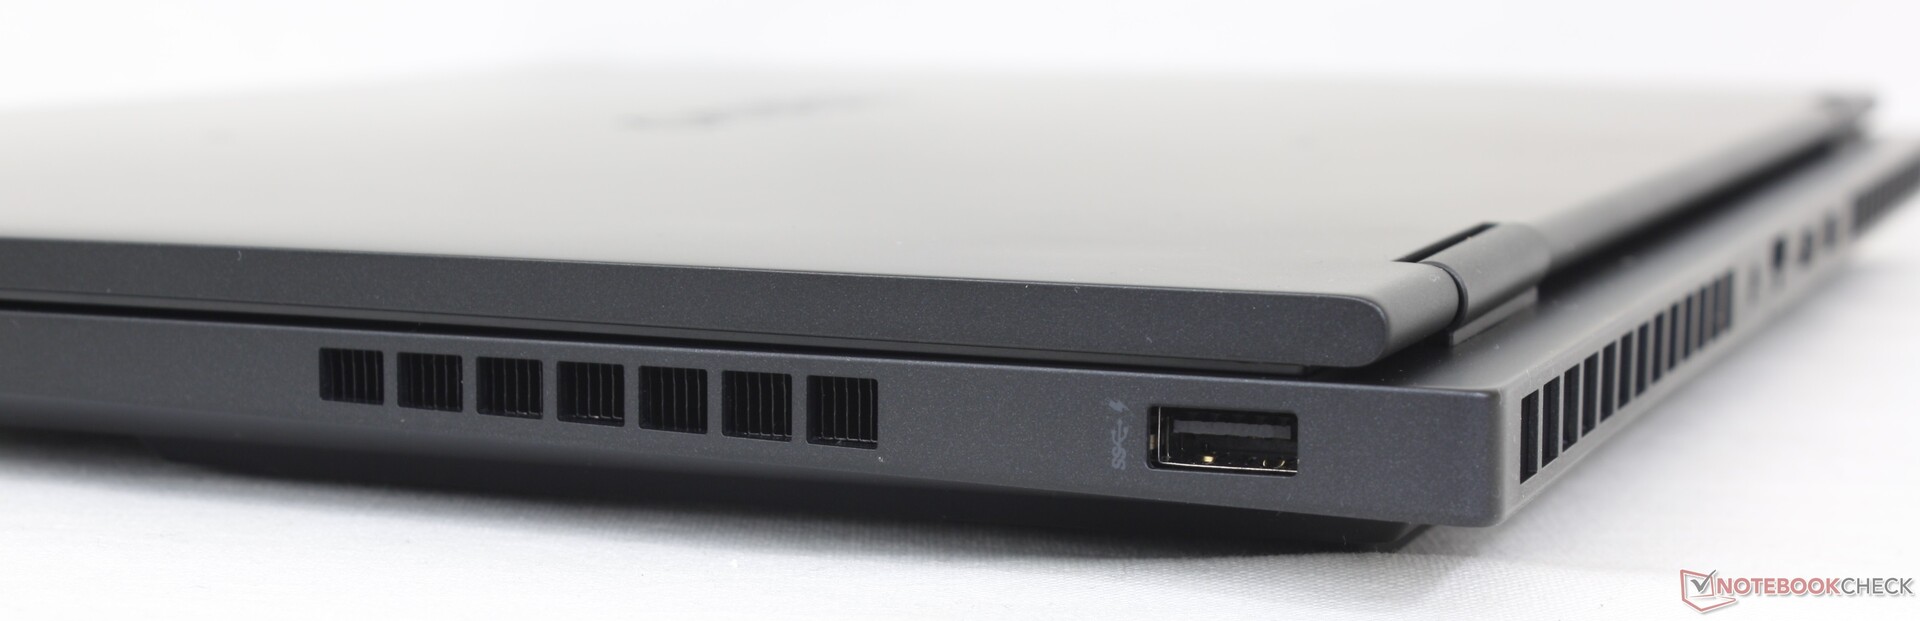
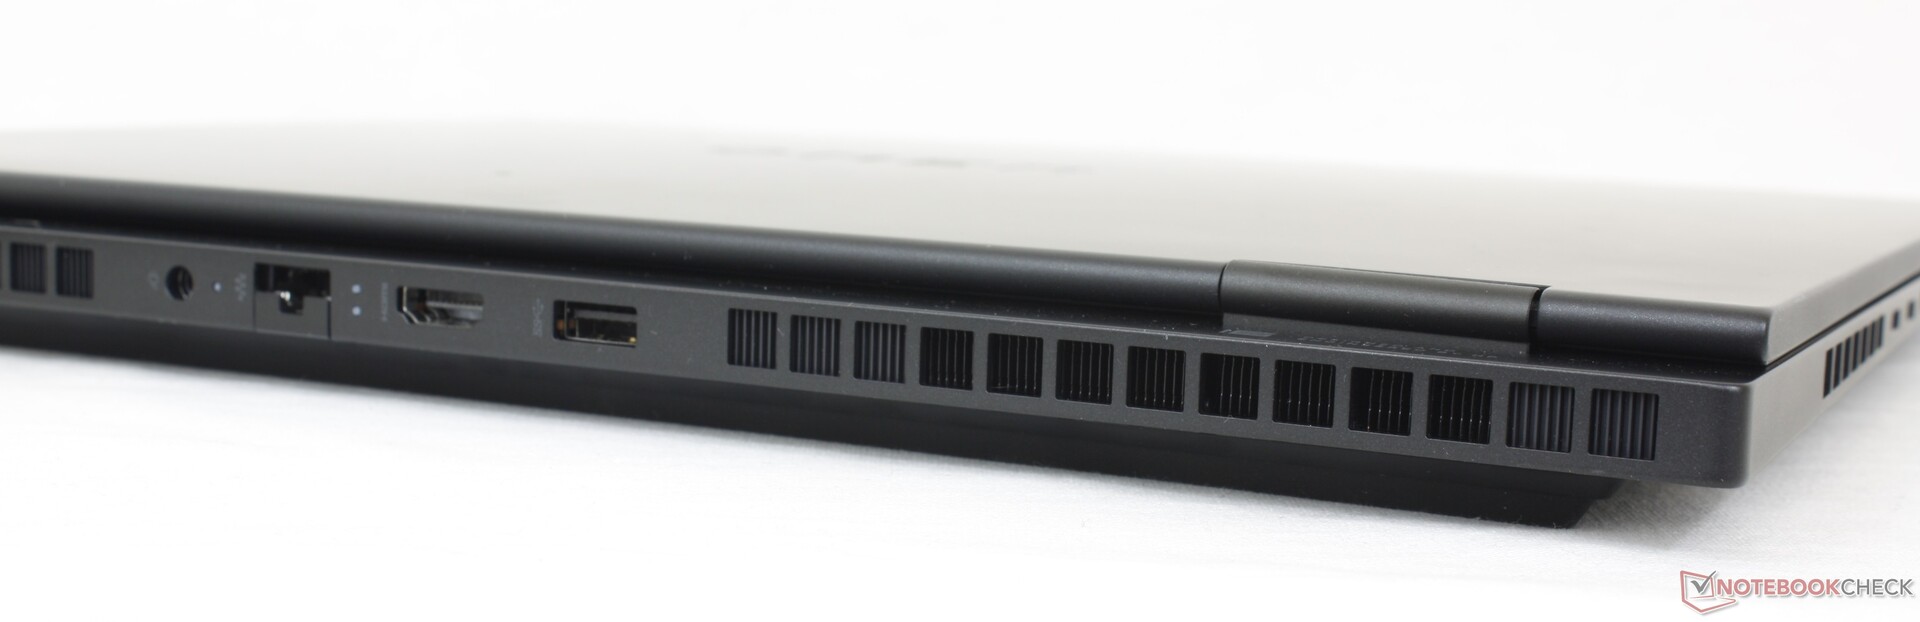
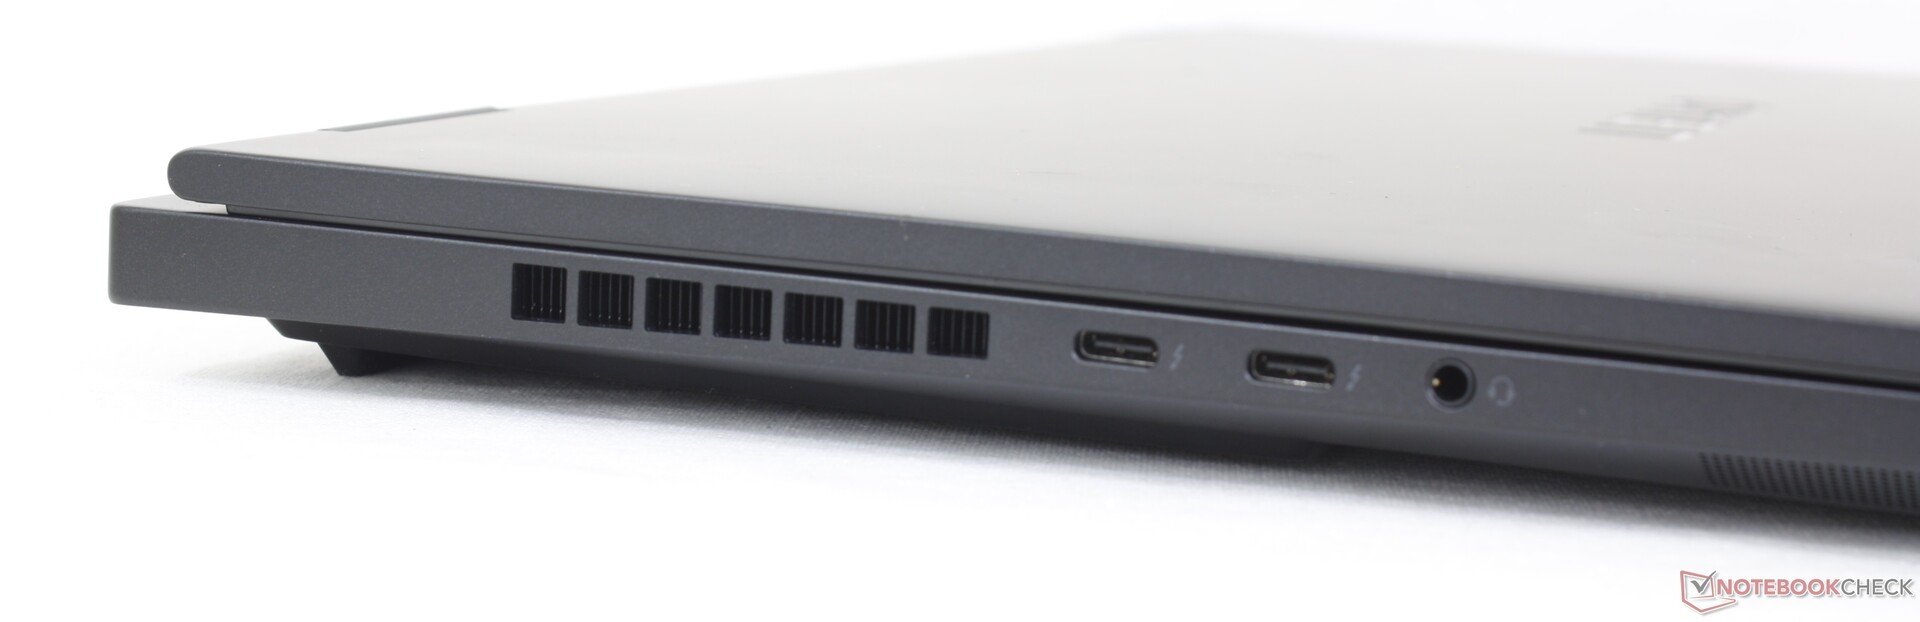
Connettività
Le opzioni delle porte rimangono identiche a quelle dell'Omen 16, nonostante i cambiamenti fisici sopra descritti. Tuttavia, sarebbe stato gradito almeno un aggiornamento da 1 Gbps RJ-45 a 2,5 Gbps.

Comunicazione
La connettività Wi-Fi 6E e Bluetooth 5.3 è garantita da un Intel AX211. Abbiamo riscontrato velocità di trasferimento costanti e affidabili quando siamo stati accoppiati alla nostra rete Asus AXE11000 a 6GHz.
Webcam
L'IR è incluso per il supporto di Hello, mentre è assente sul normale Omen 16. Per il resto, la webcam da 2 MP e l'otturatore privacy sono gli stessi tra i due modelli Omen.


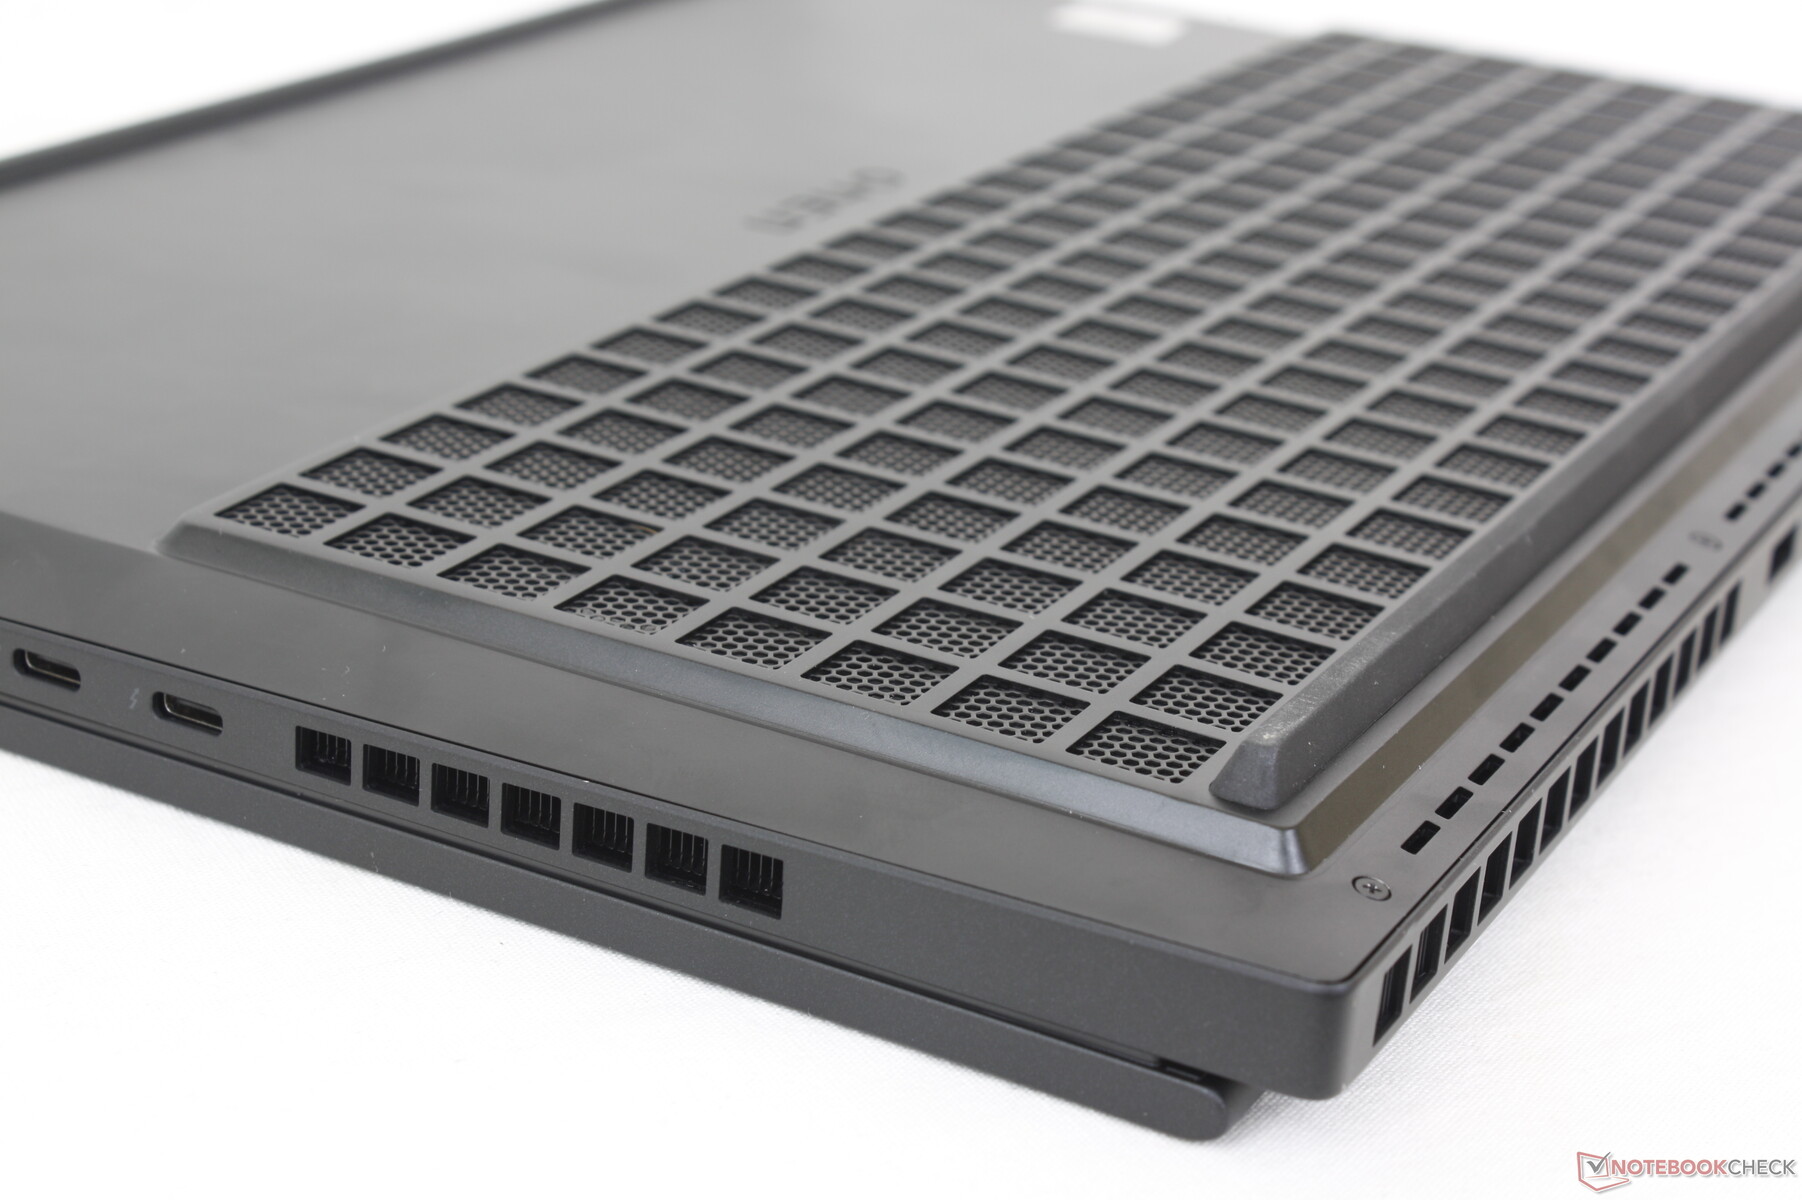
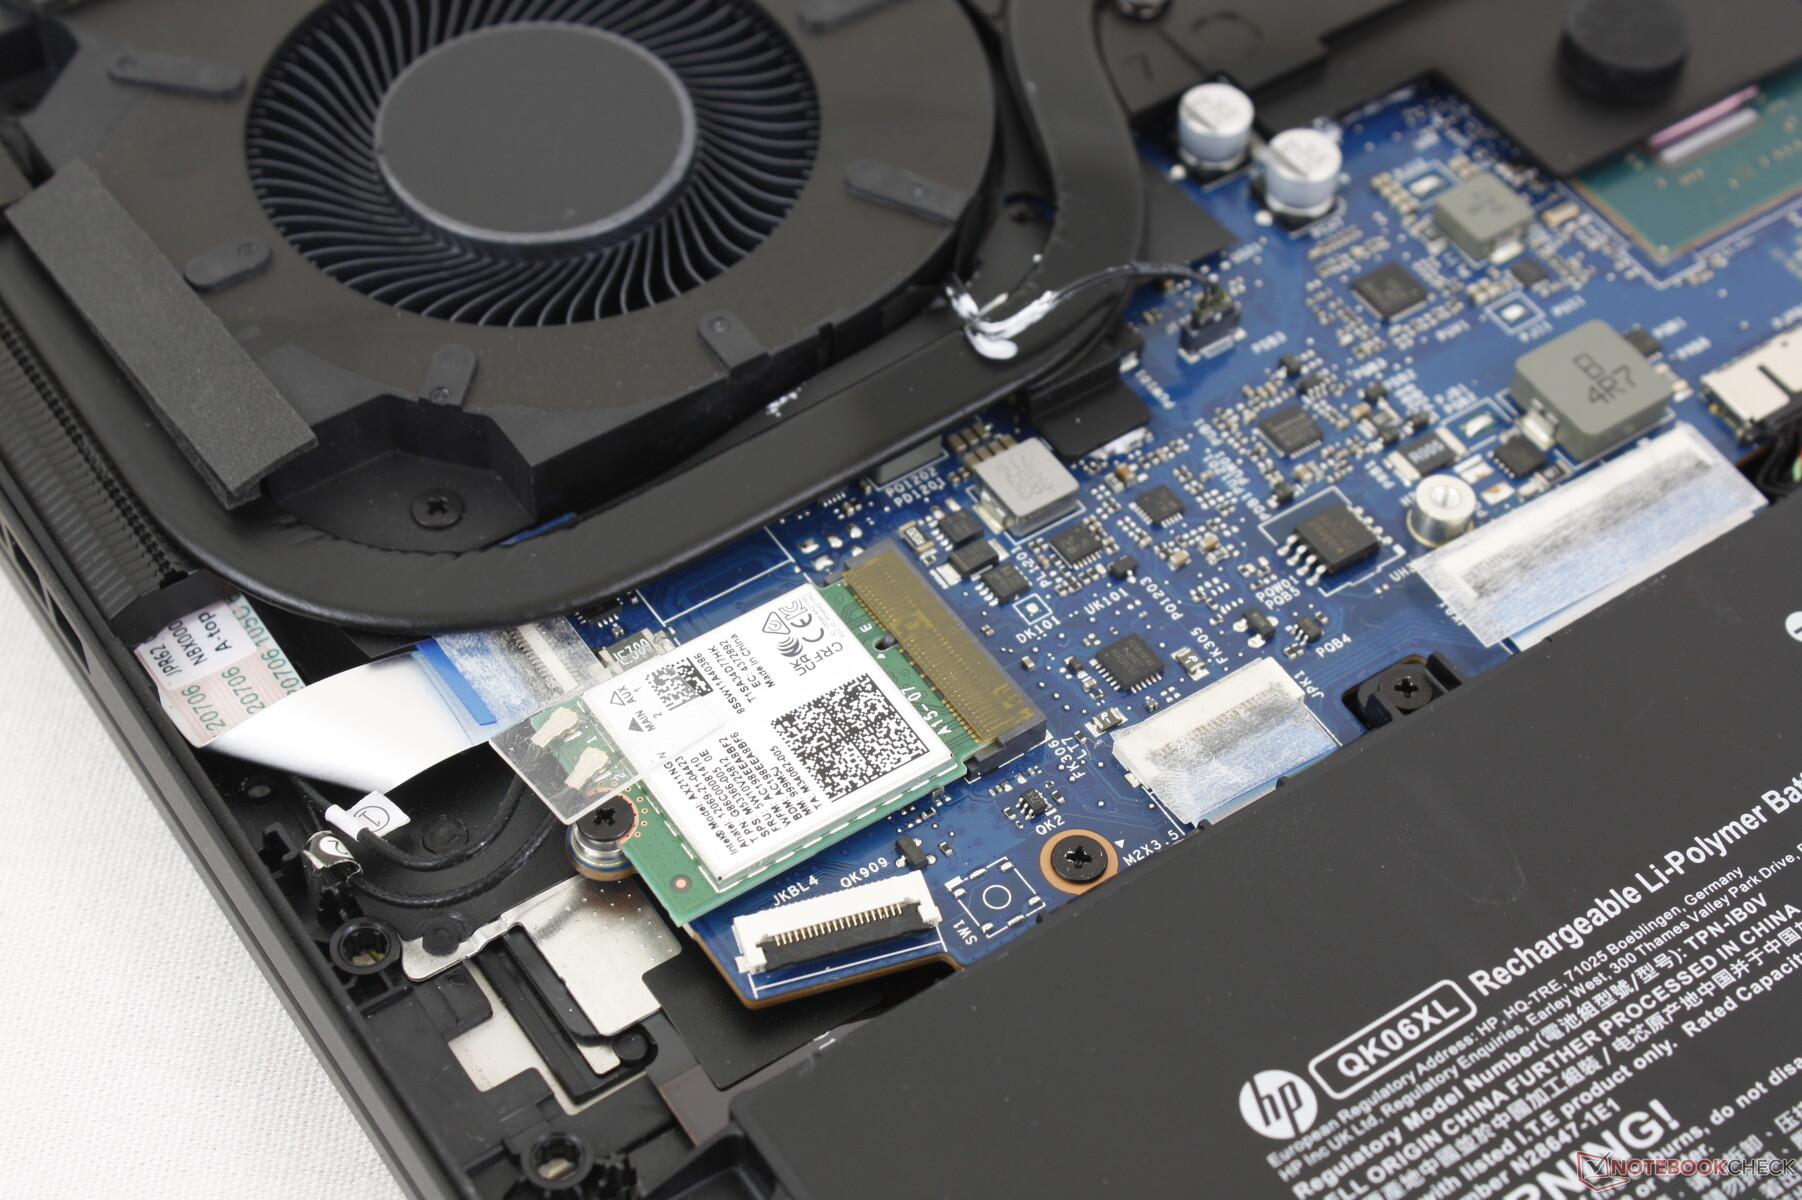
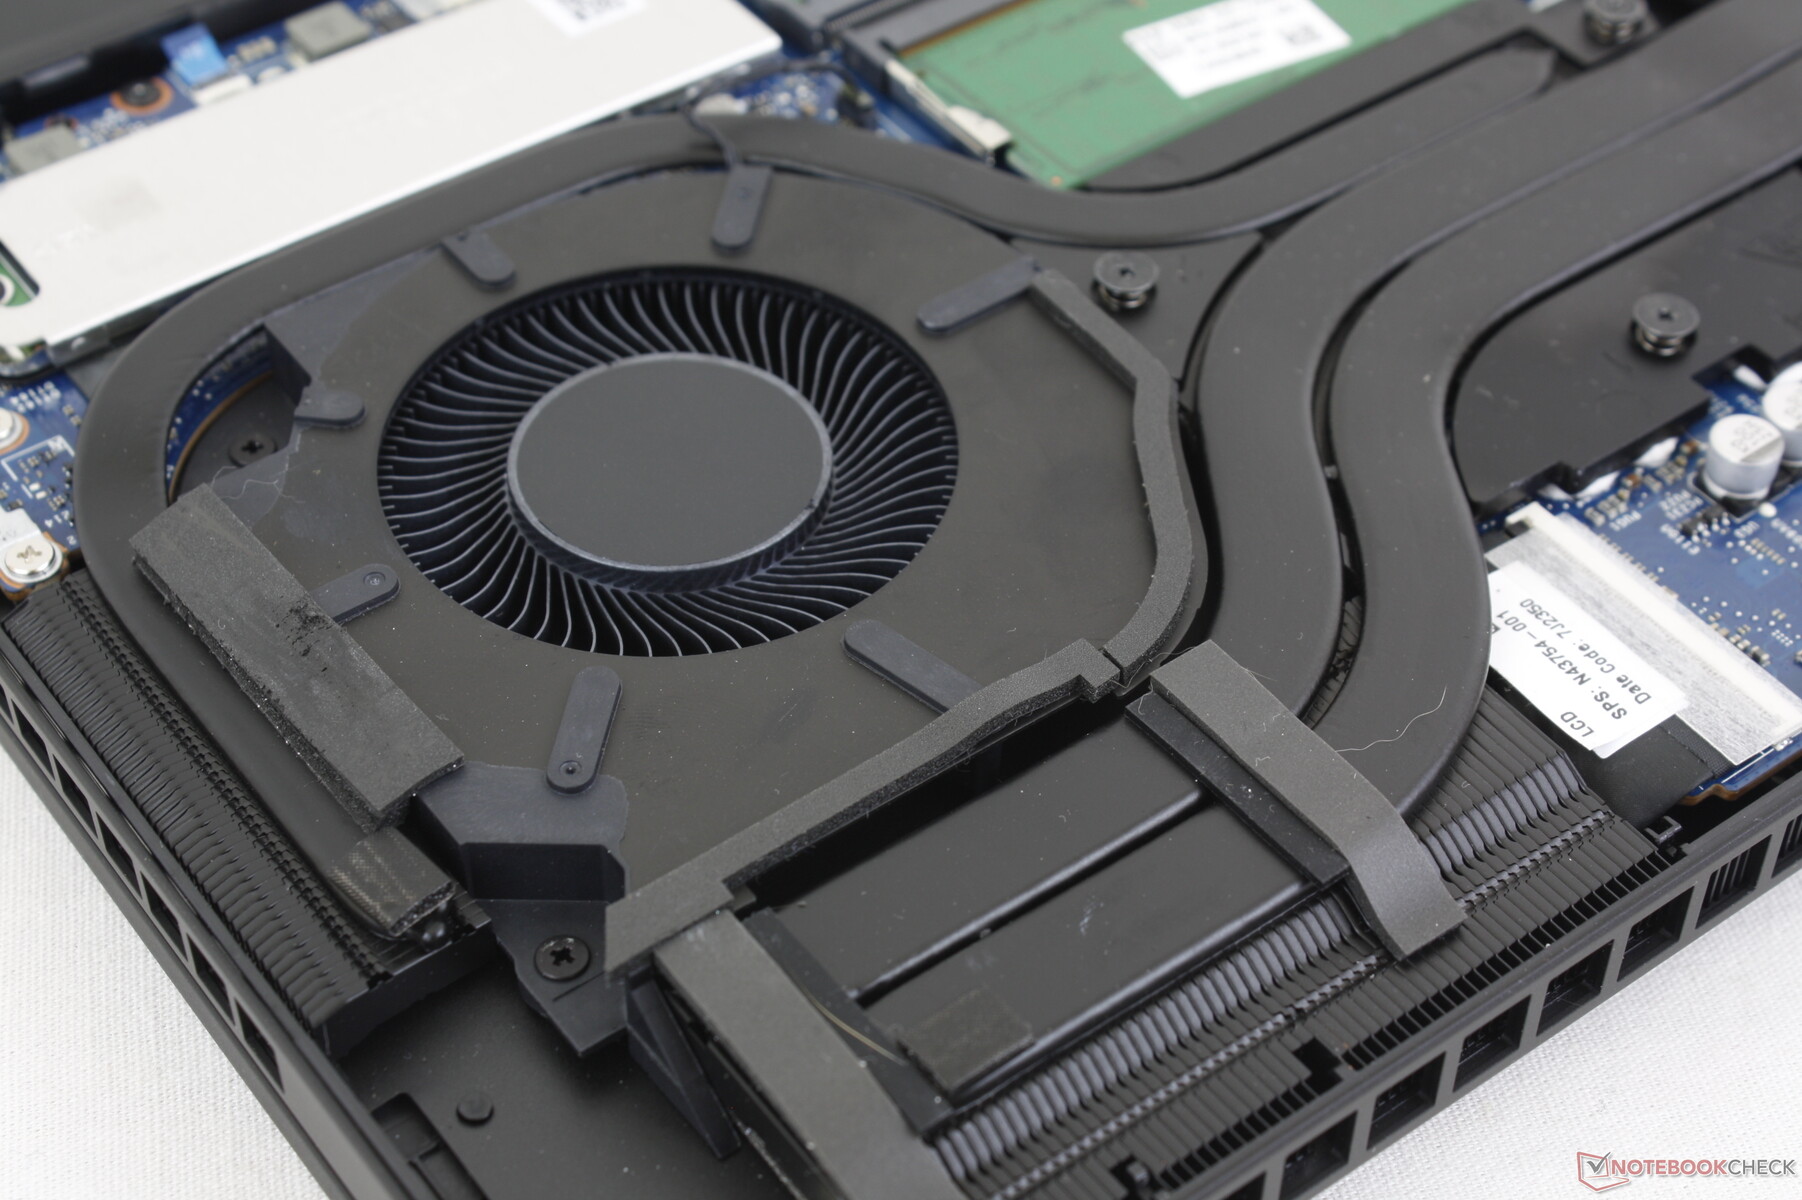
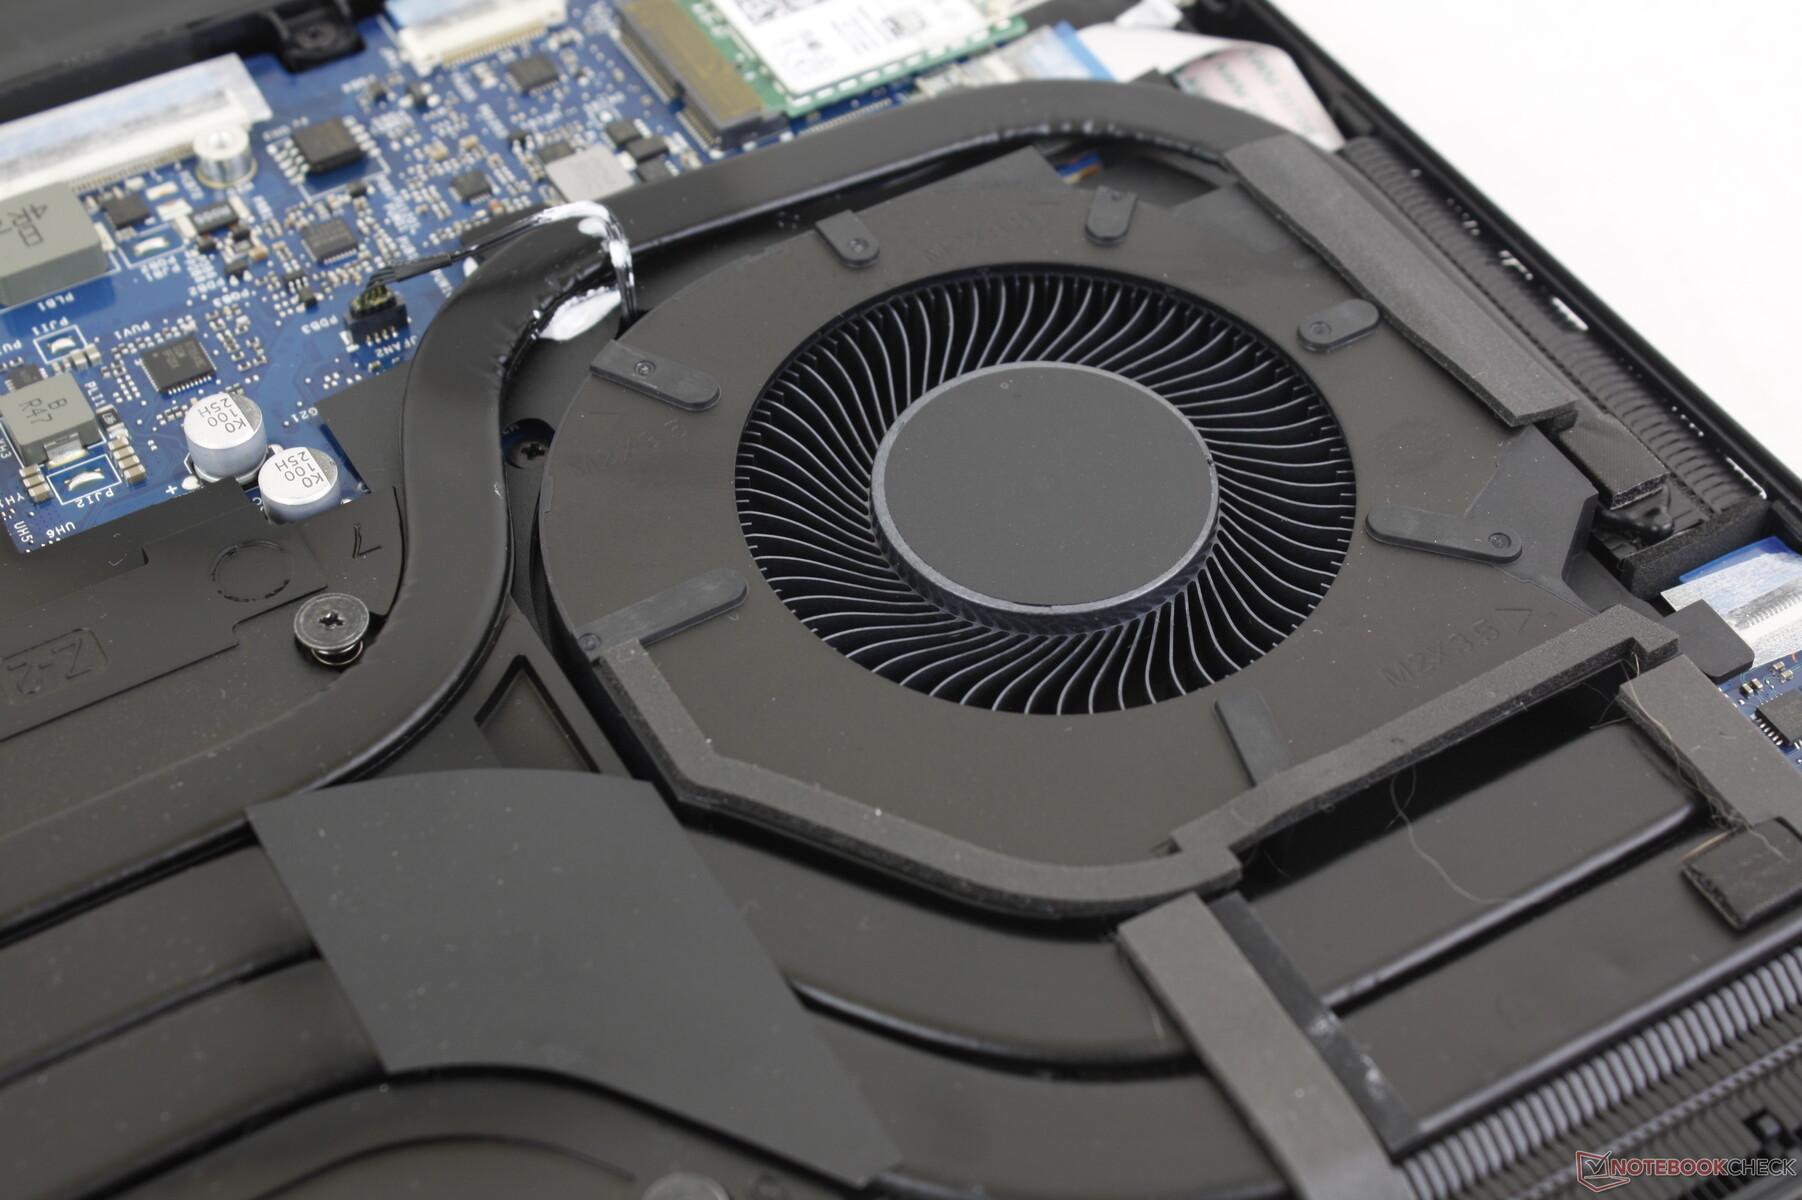
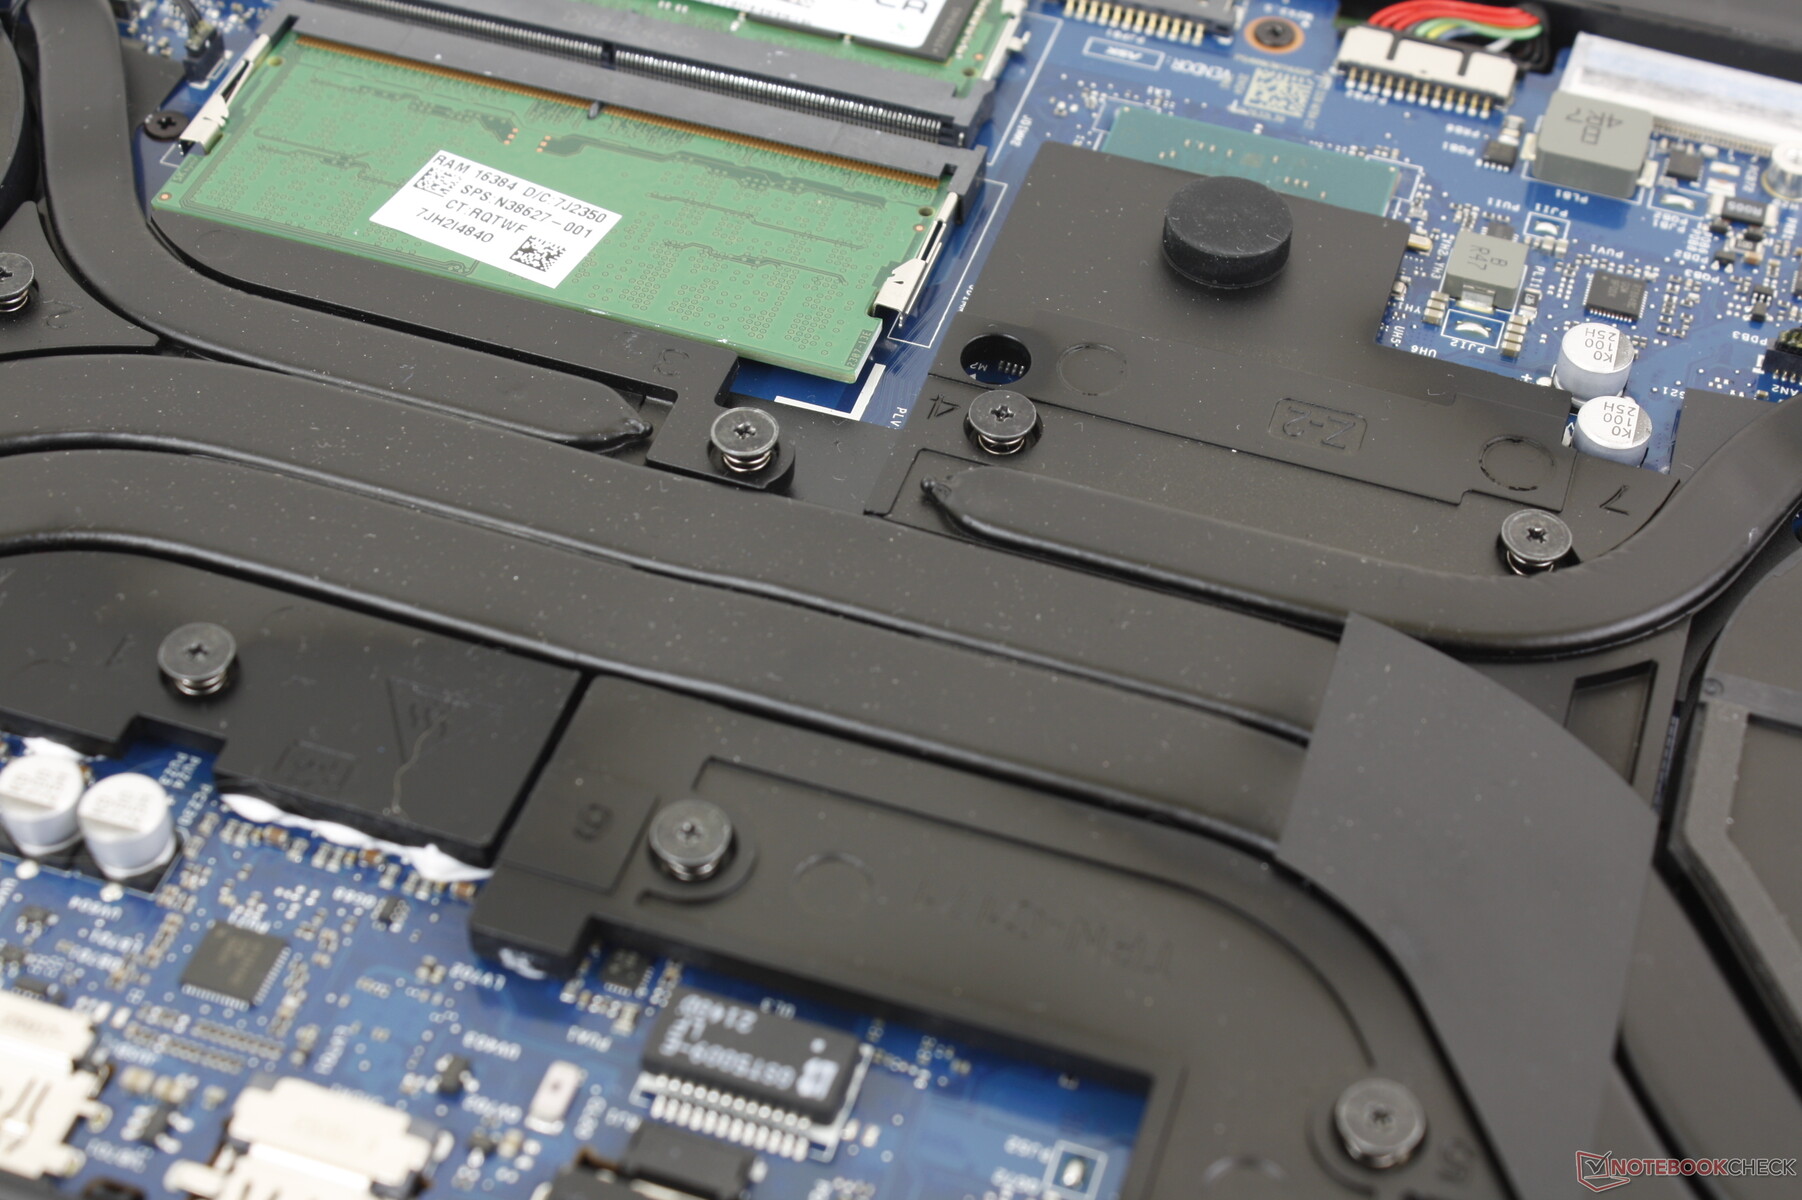
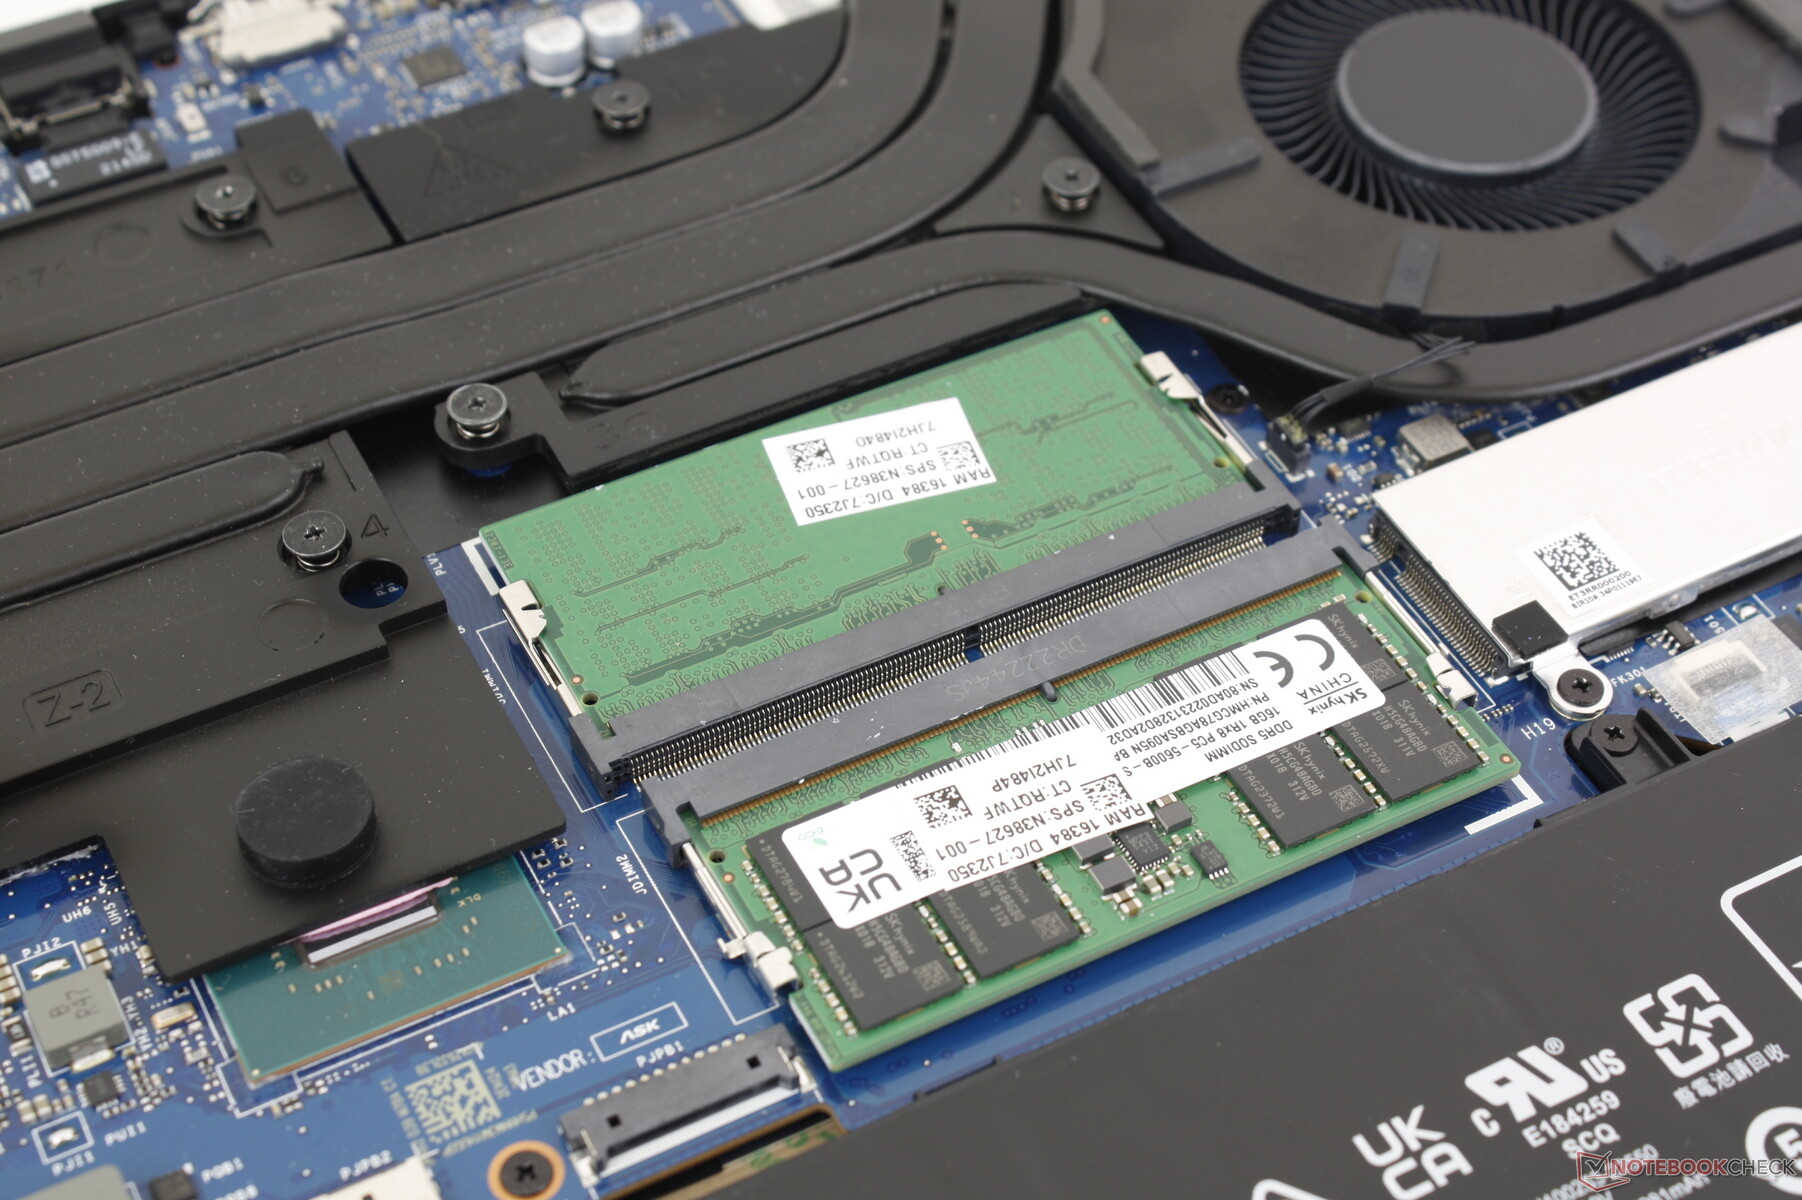
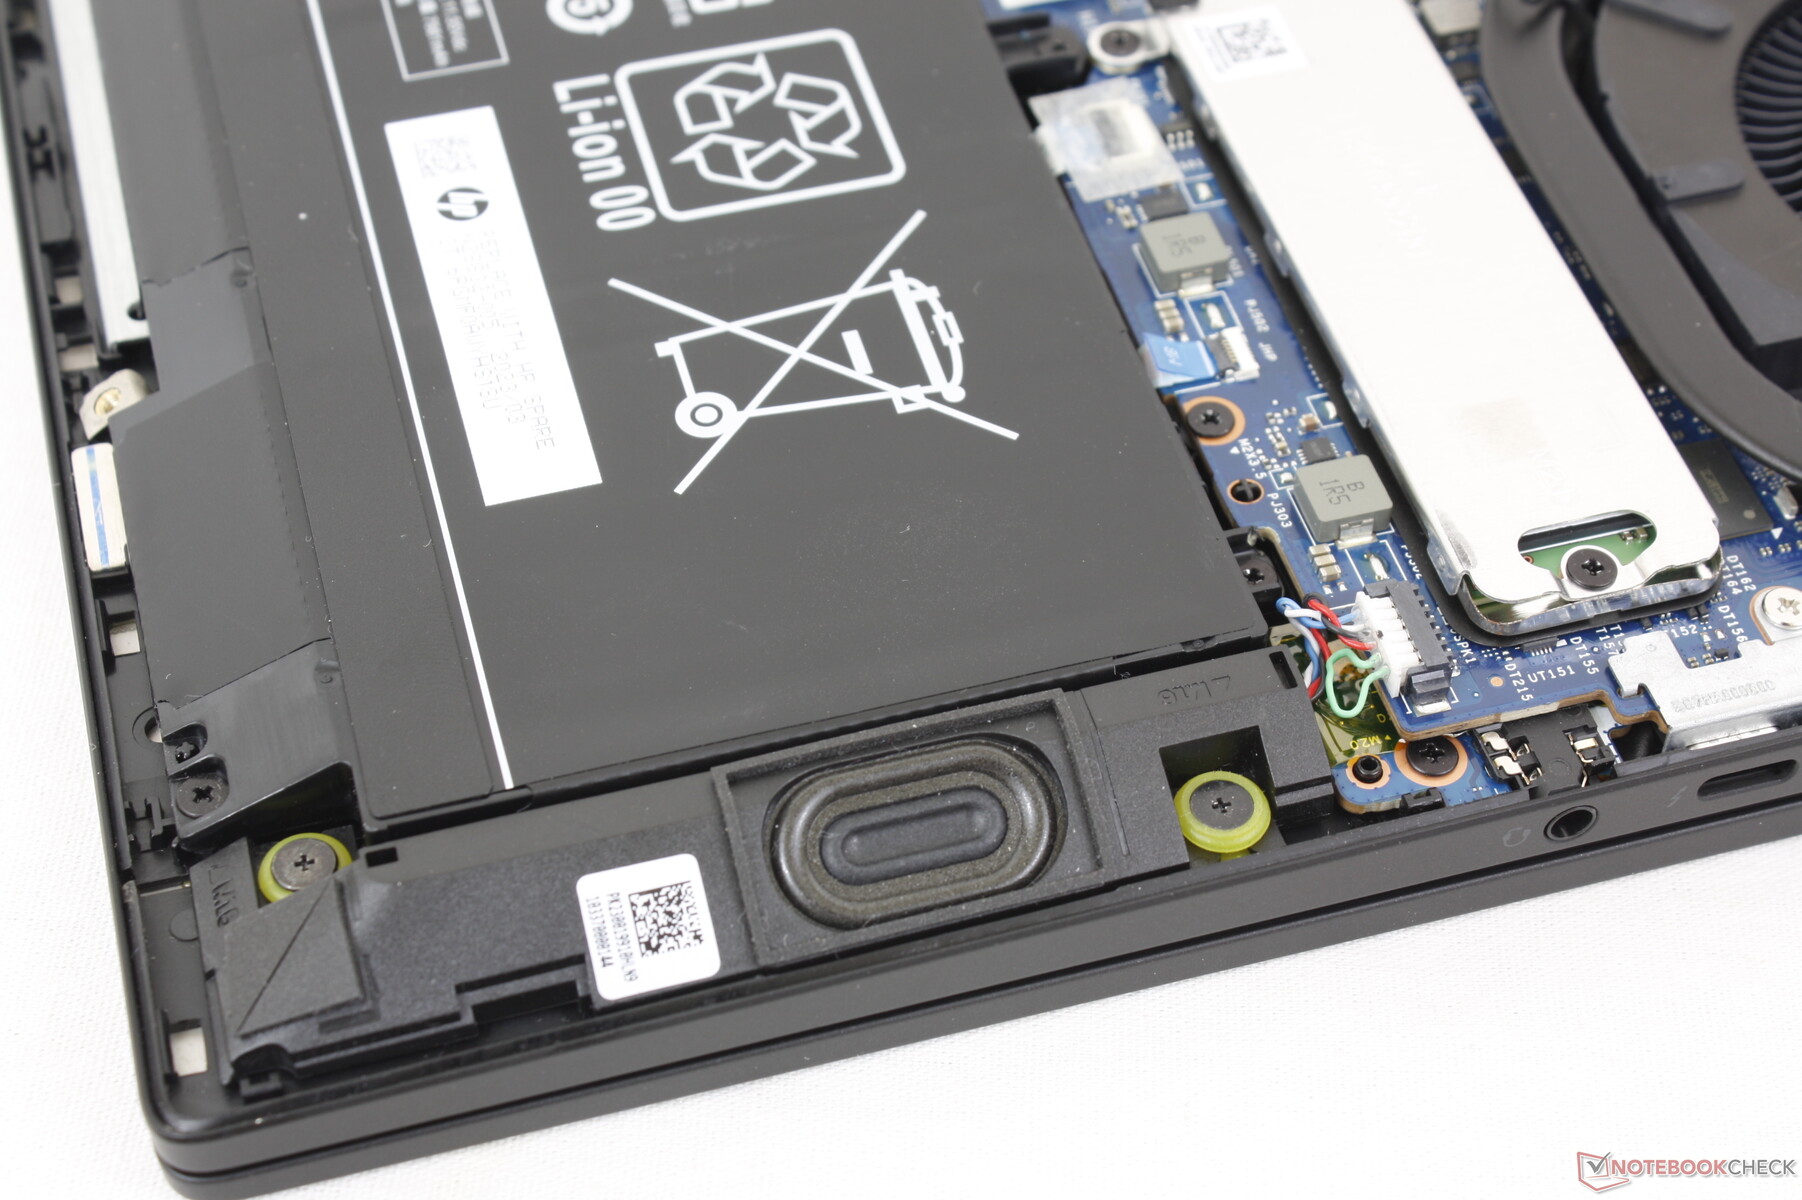
Manutenzione
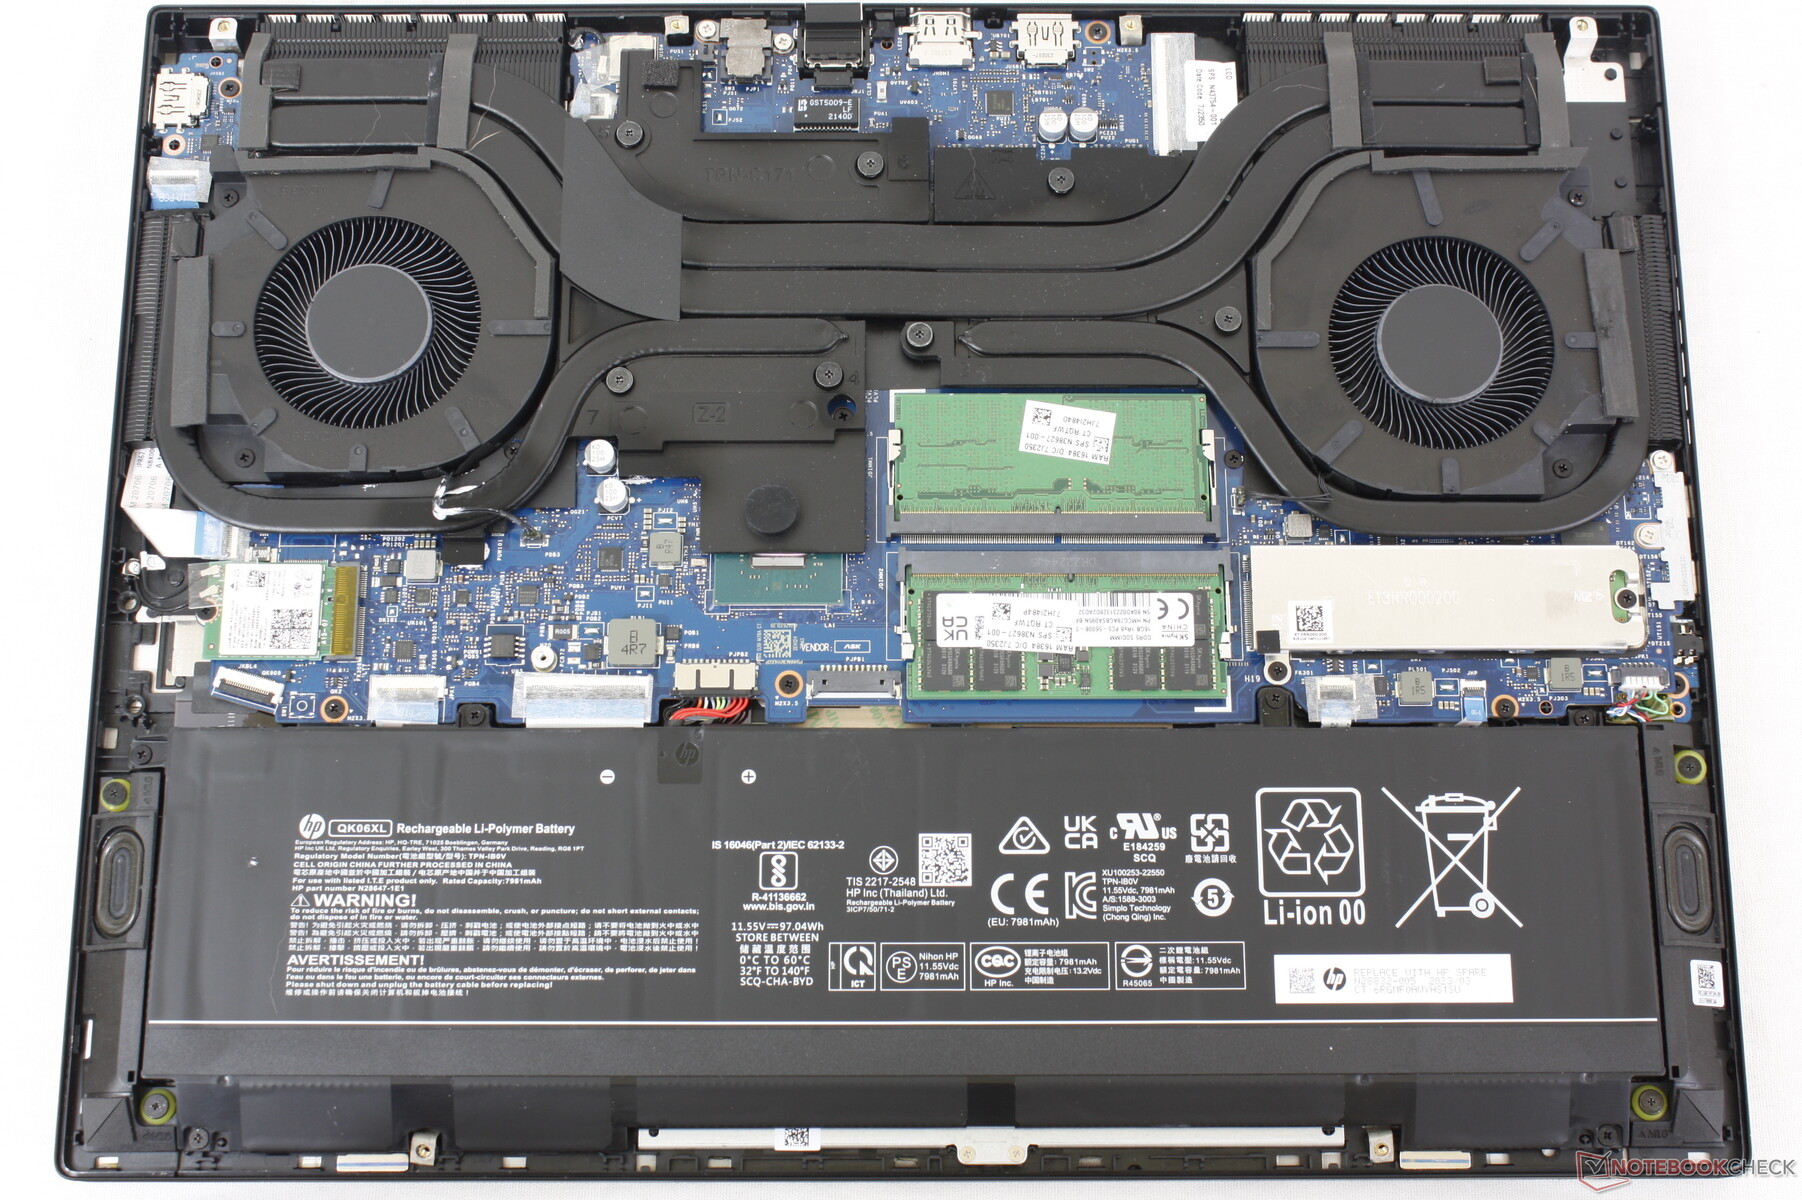
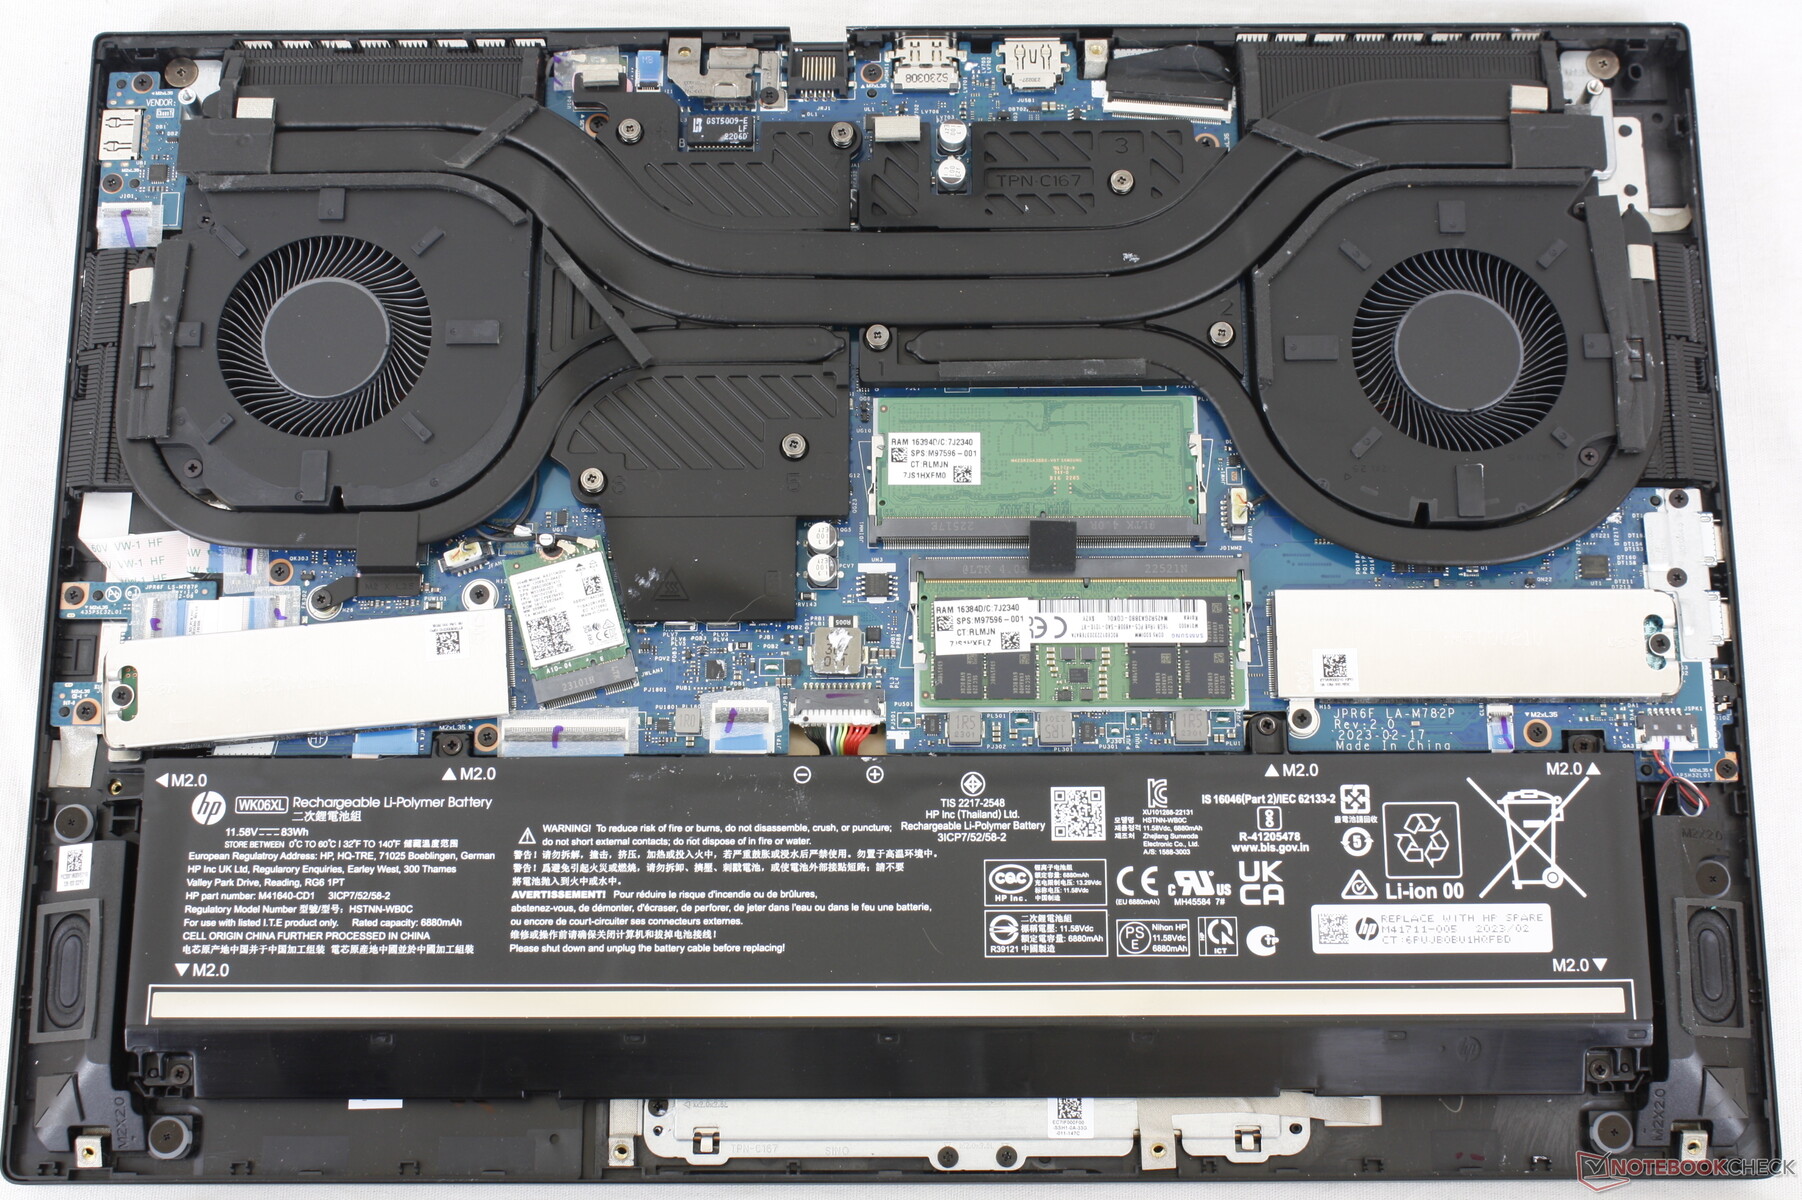
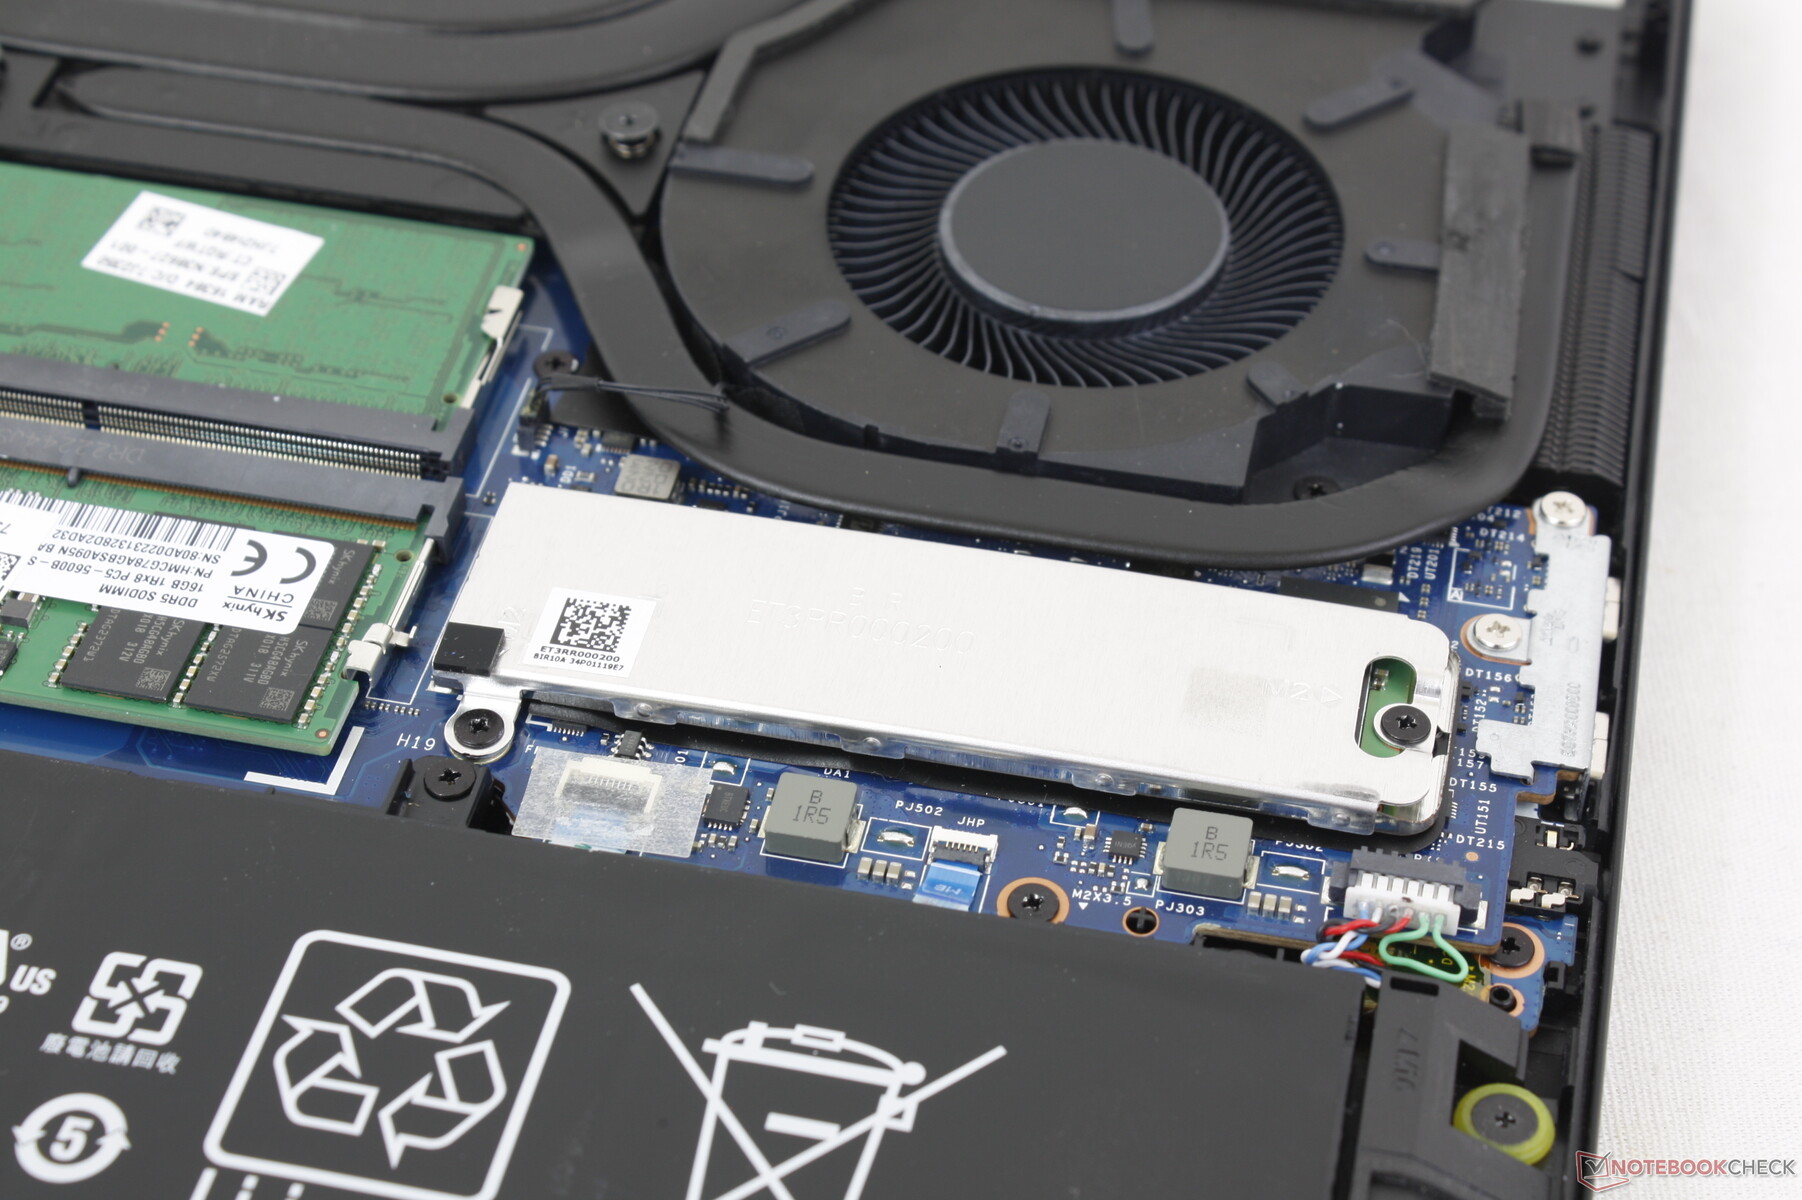
Il pannello inferiore è fissato da sole sei viti Phillips per un facile accesso. Un cambiamento notevole rispetto all'Omen 16, tuttavia, è la rimozione del secondo slot SSD M.2 a causa del riposizionamento dello slot WLAN M.2, come mostrato dalle immagini di confronto qui sotto. Pertanto, l'Omen Transcend 16 può supportare solo un SSD interno invece di due. Sono state apportate anche altre piccole modifiche agli altoparlanti e alla soluzione di raffreddamento.
Accessori e garanzia
Alcune configurazioni includono gratuitamente le cuffie wireless HyperX Cloud II Core. Altrimenti, la confezione di vendita include solo l'adattatore CA standard e la documentazione.
Si applica la garanzia limitata standard di un anno del produttore.
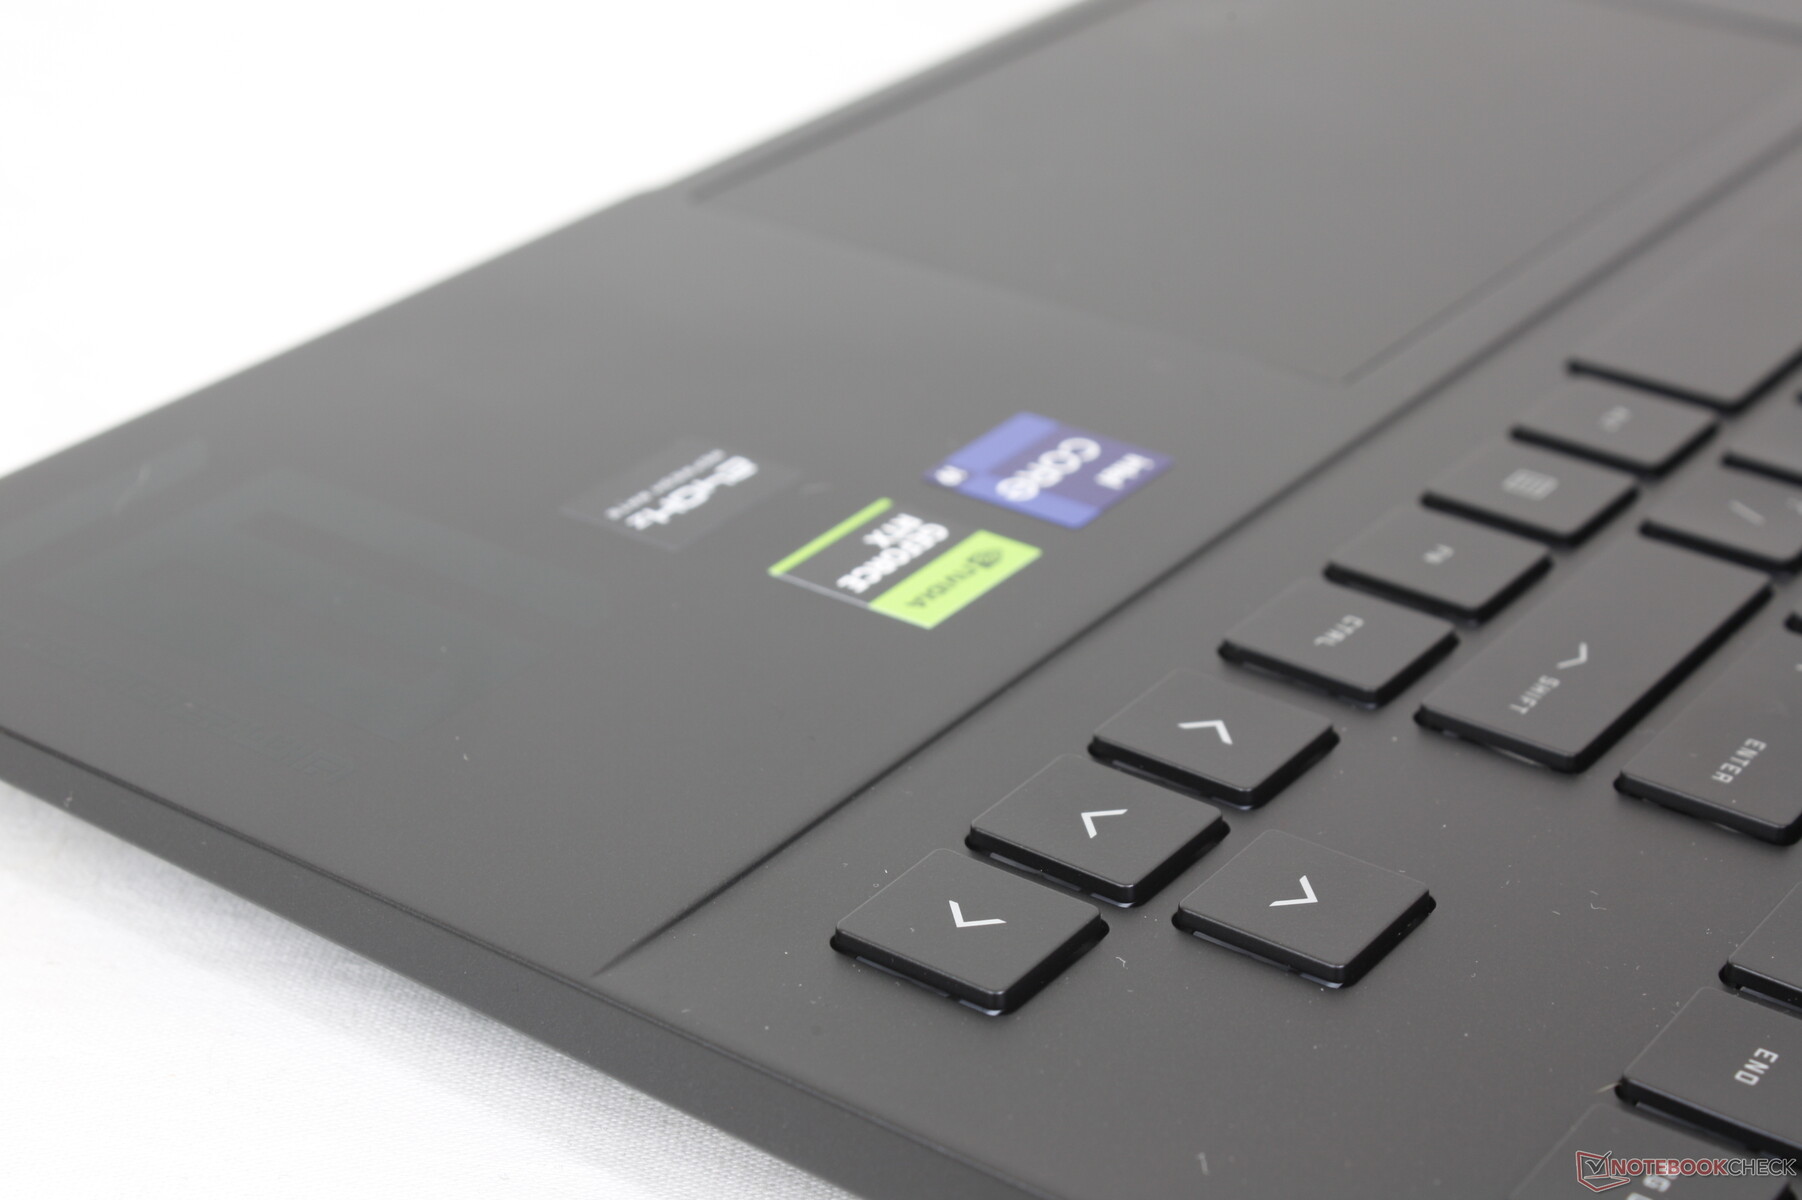
Dispositivi di input - Aspetto e sensazione familiare di Omen
Tastiera
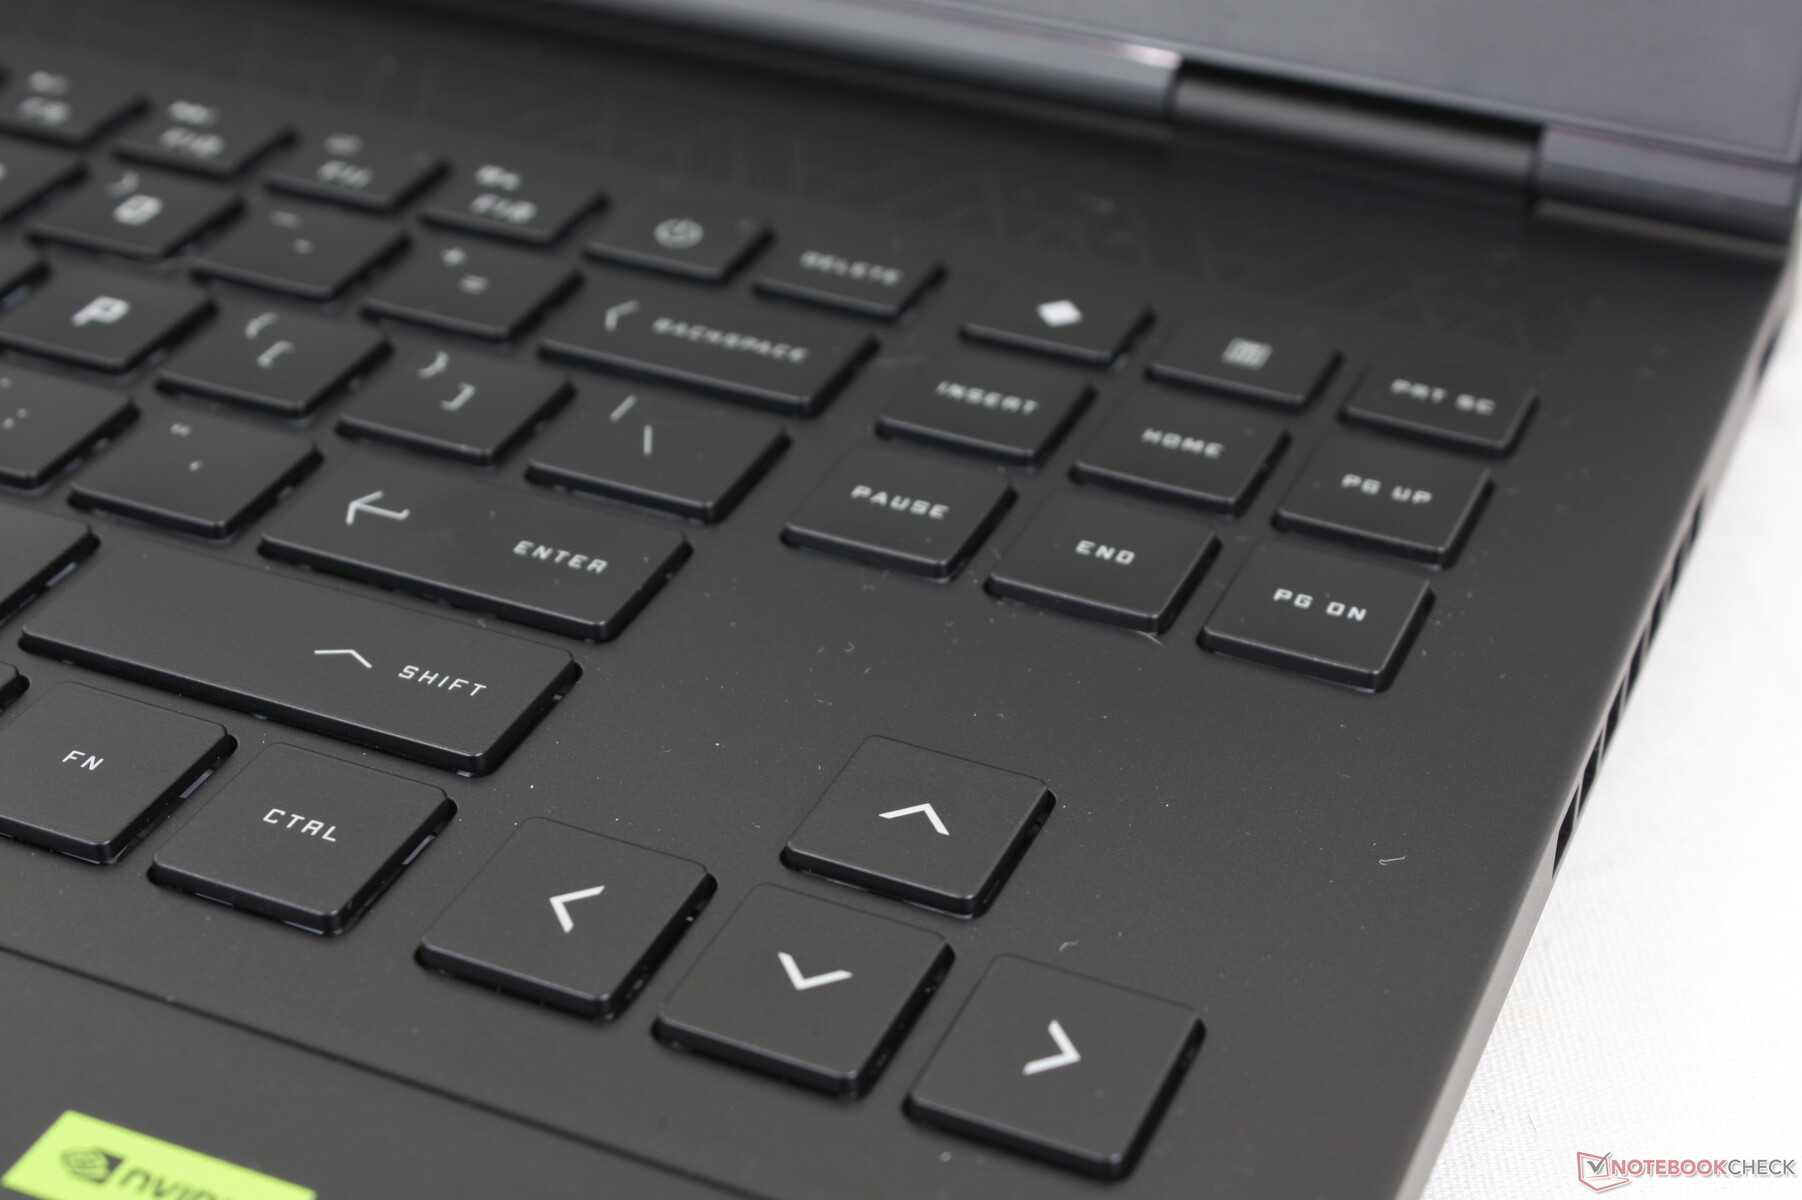
I tasti WASD sono ora stilizzati con keycaps traslucidi per un'estetica più da giocatore. Tutti i nostri commenti sulla tastiera dell'Omen 16 sono ancora valide per l'Omen Transcend 16.
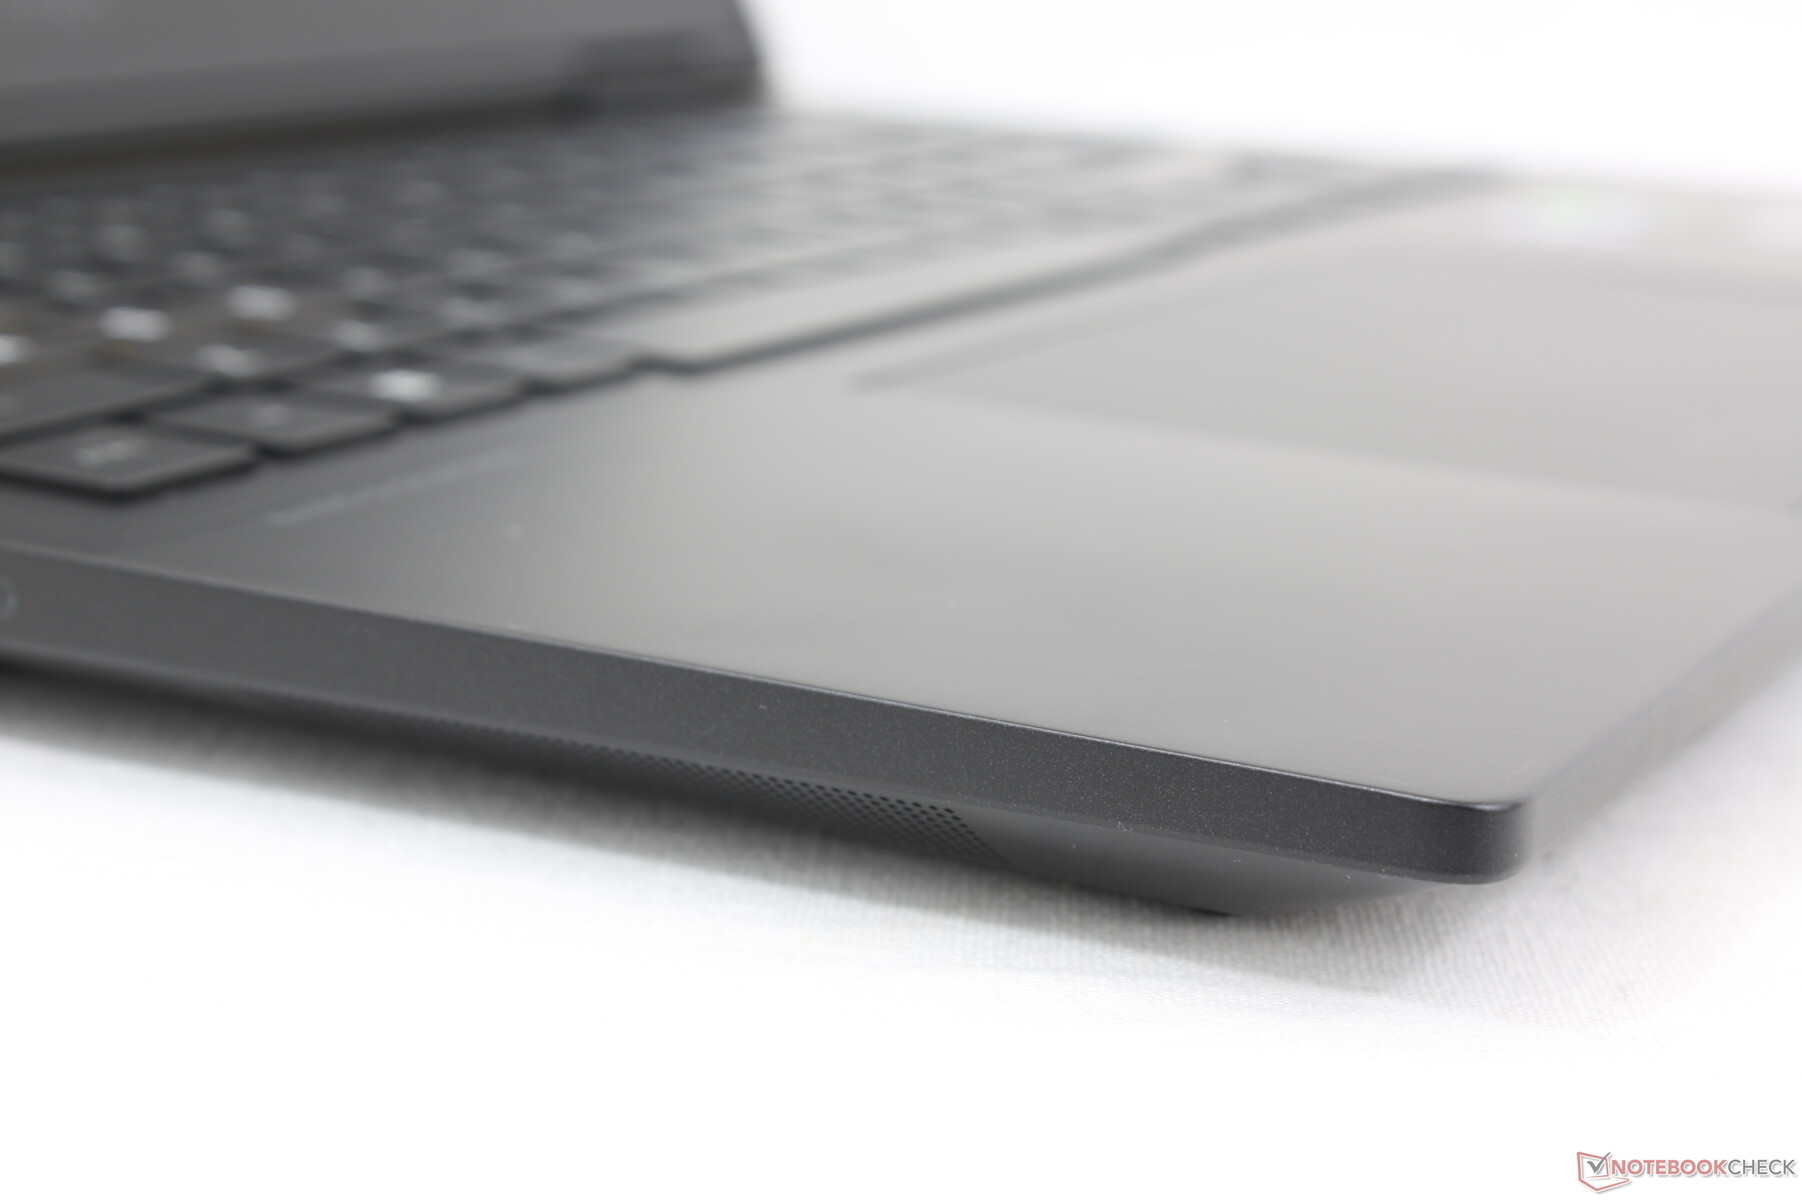
Touchpad
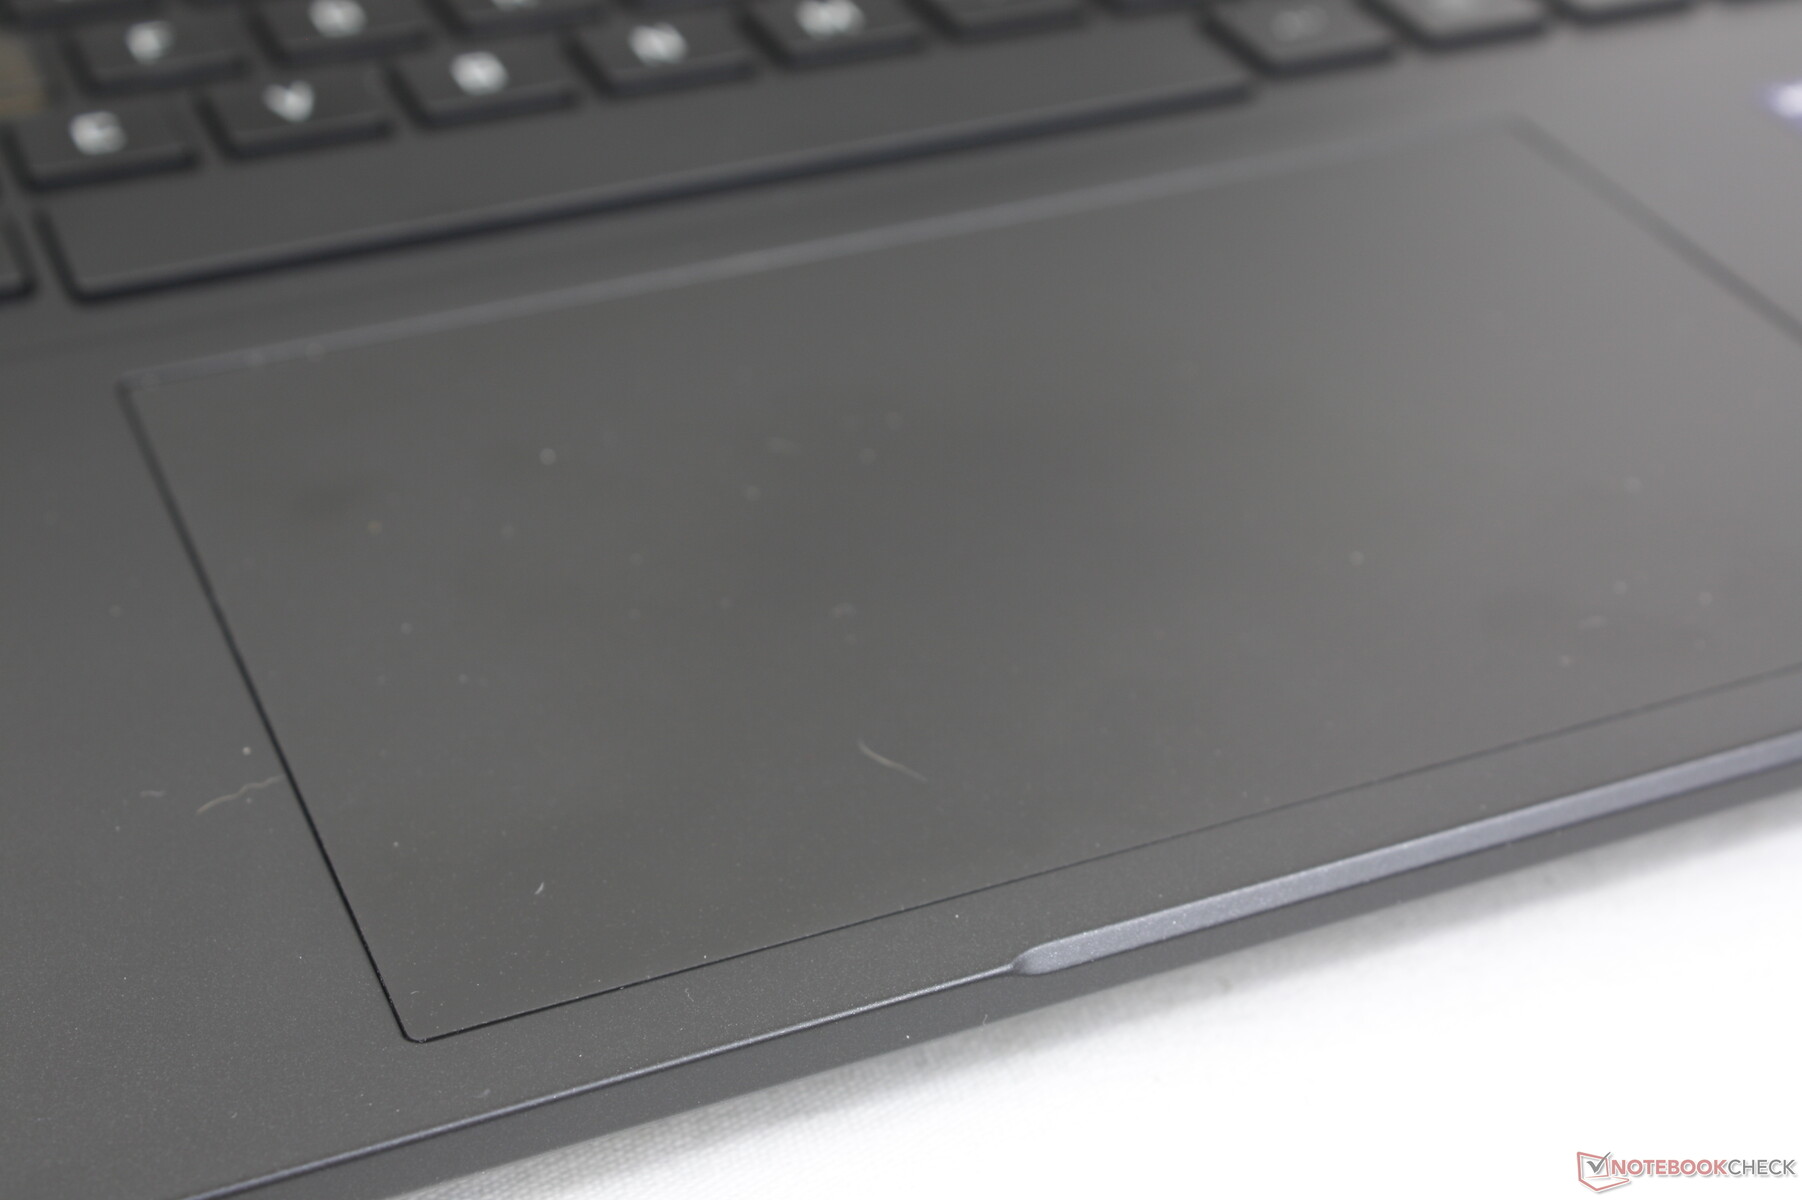
Le dimensioni del clickpad sono cambiate da 12,5 x 8 cm del recente Omen 16 a un più grande 13,5 x 8,6 cm dell'Omen Transcend 16. Sebbene sia reattivo e molto spazioso per lo scorrimento, il feedback quando si fa clic è poco profondo e avrebbe potuto essere più deciso per un clic più soddisfacente.


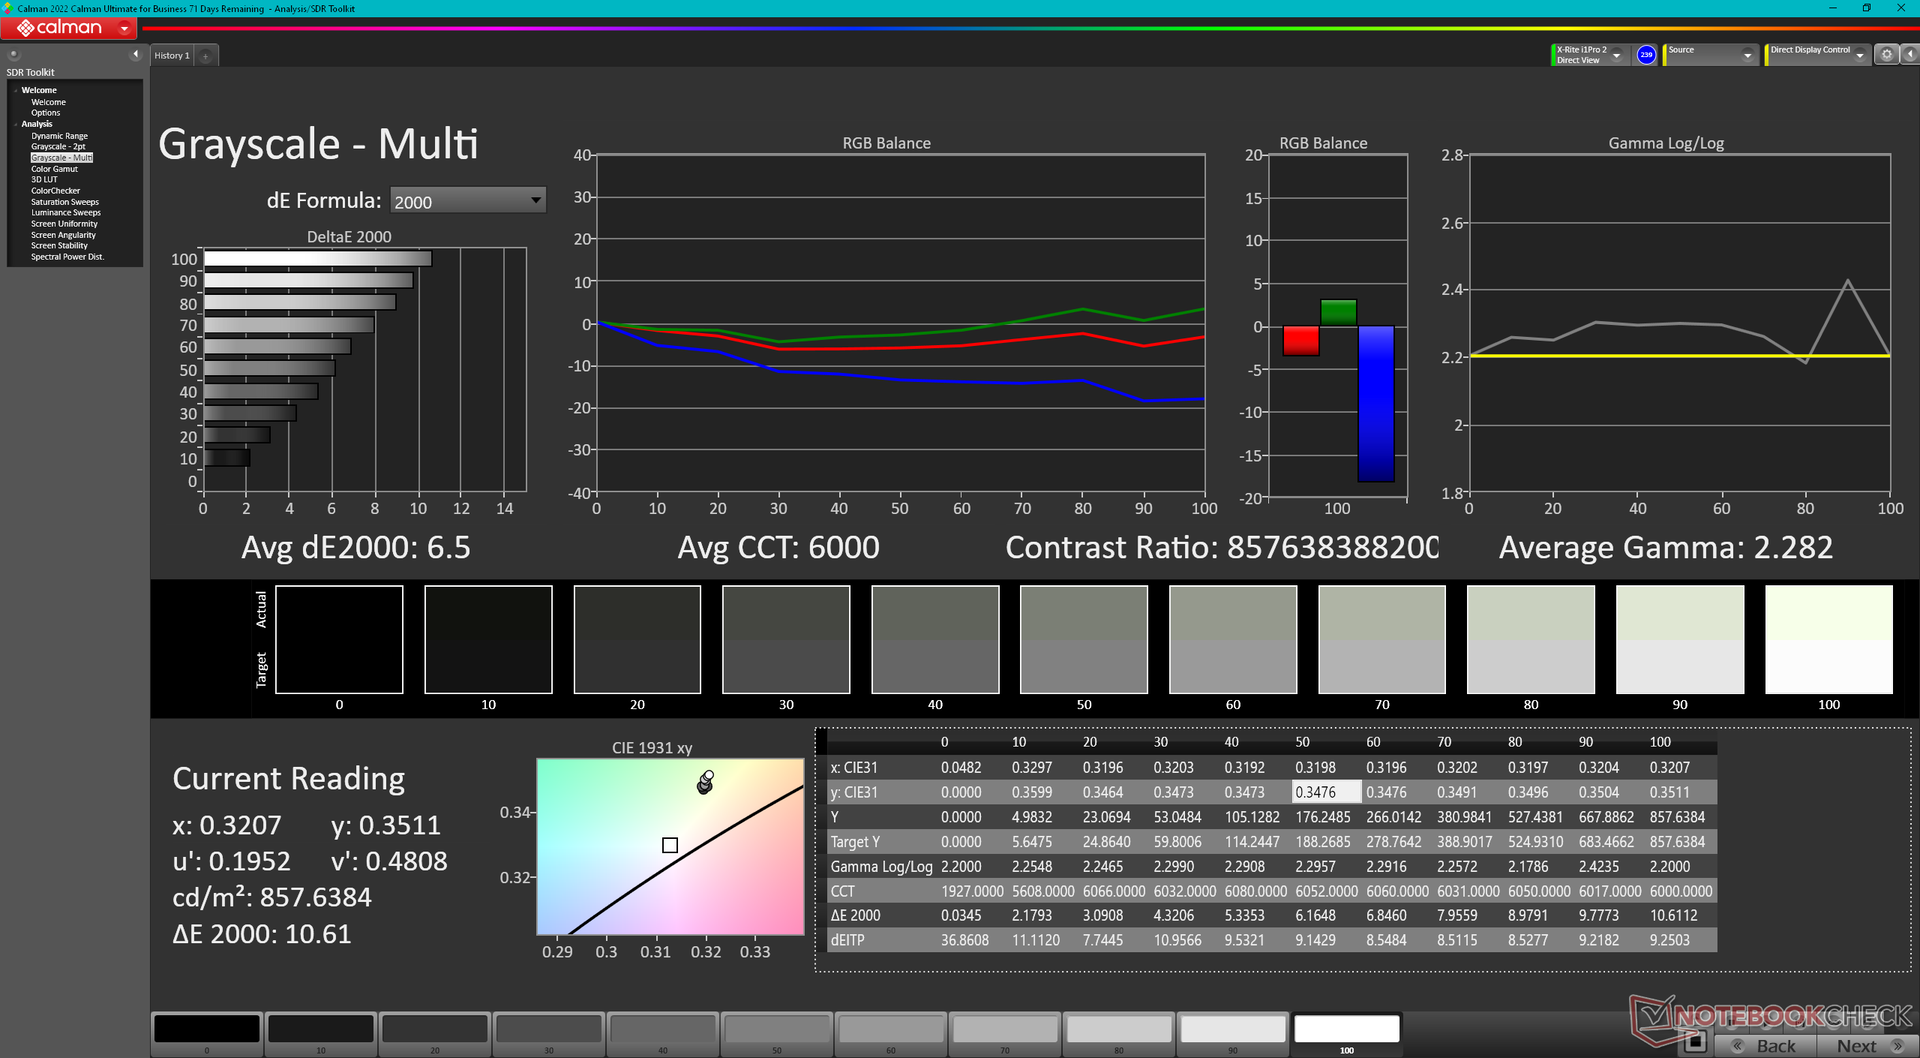
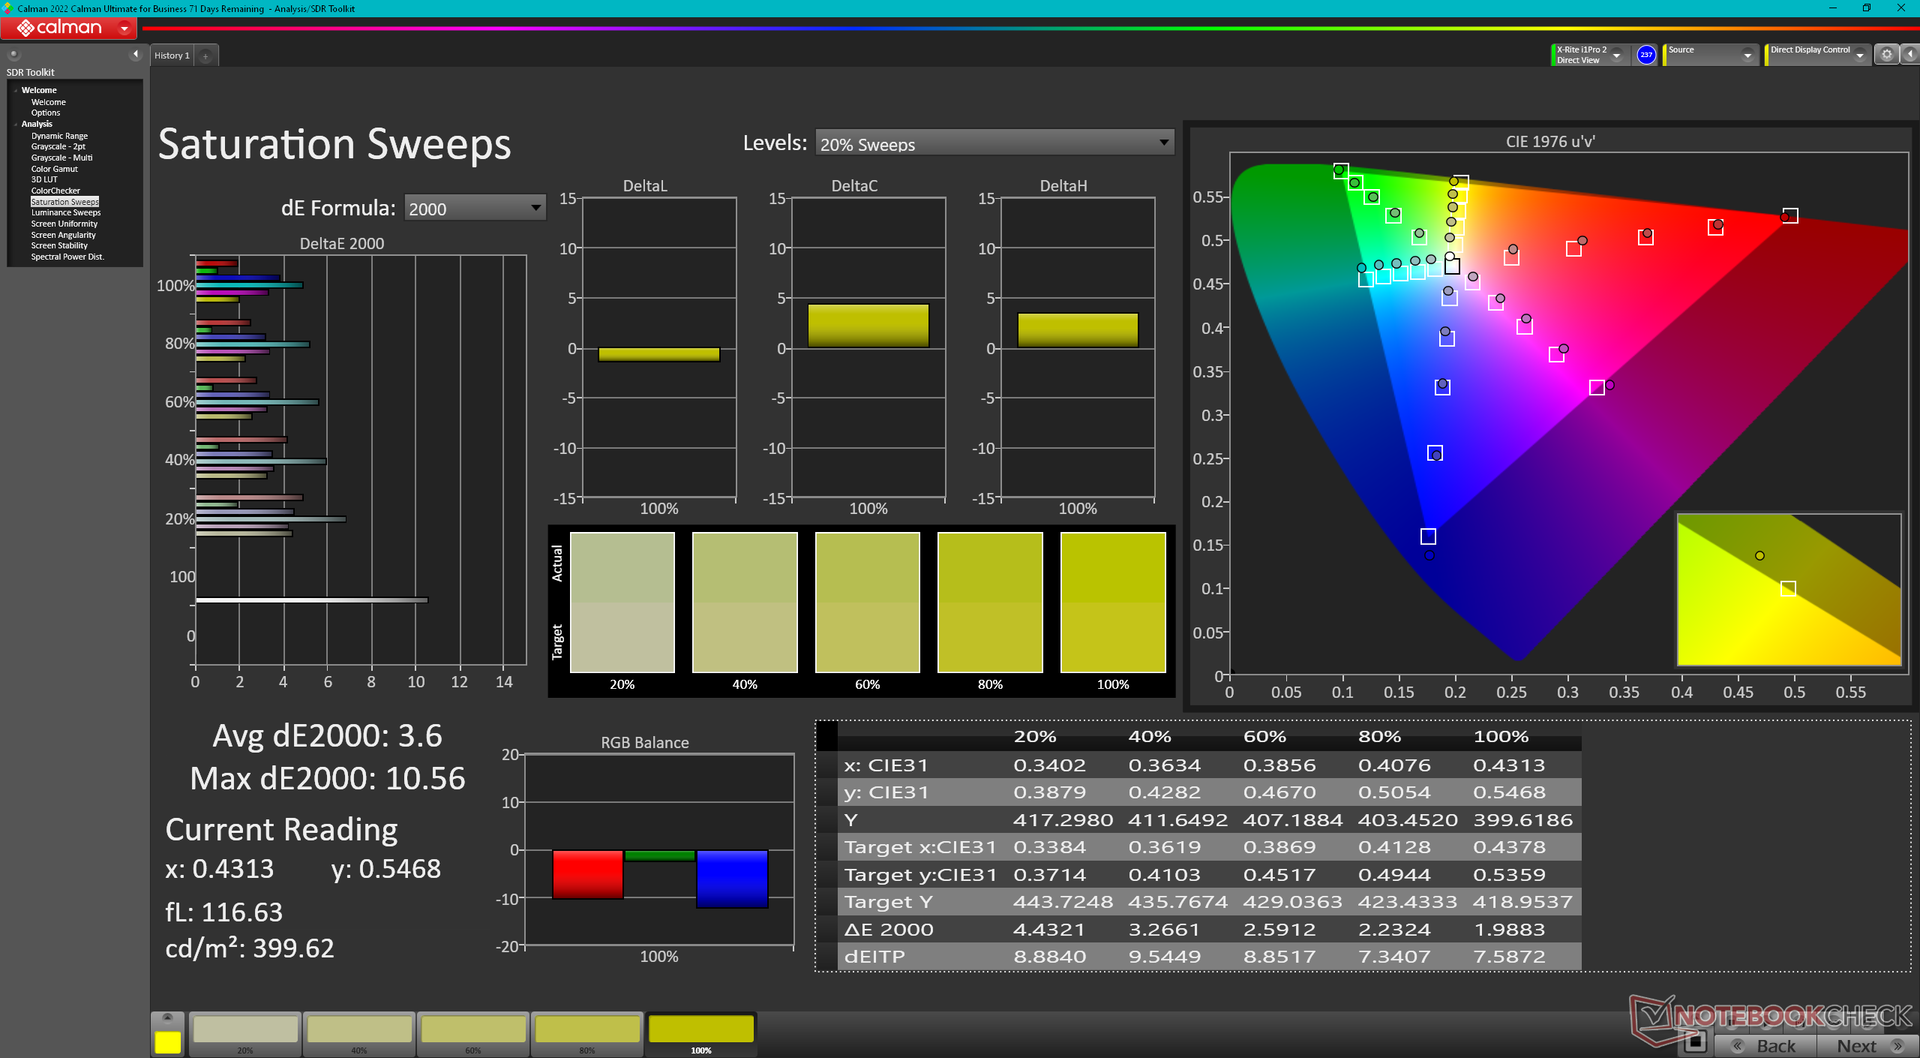
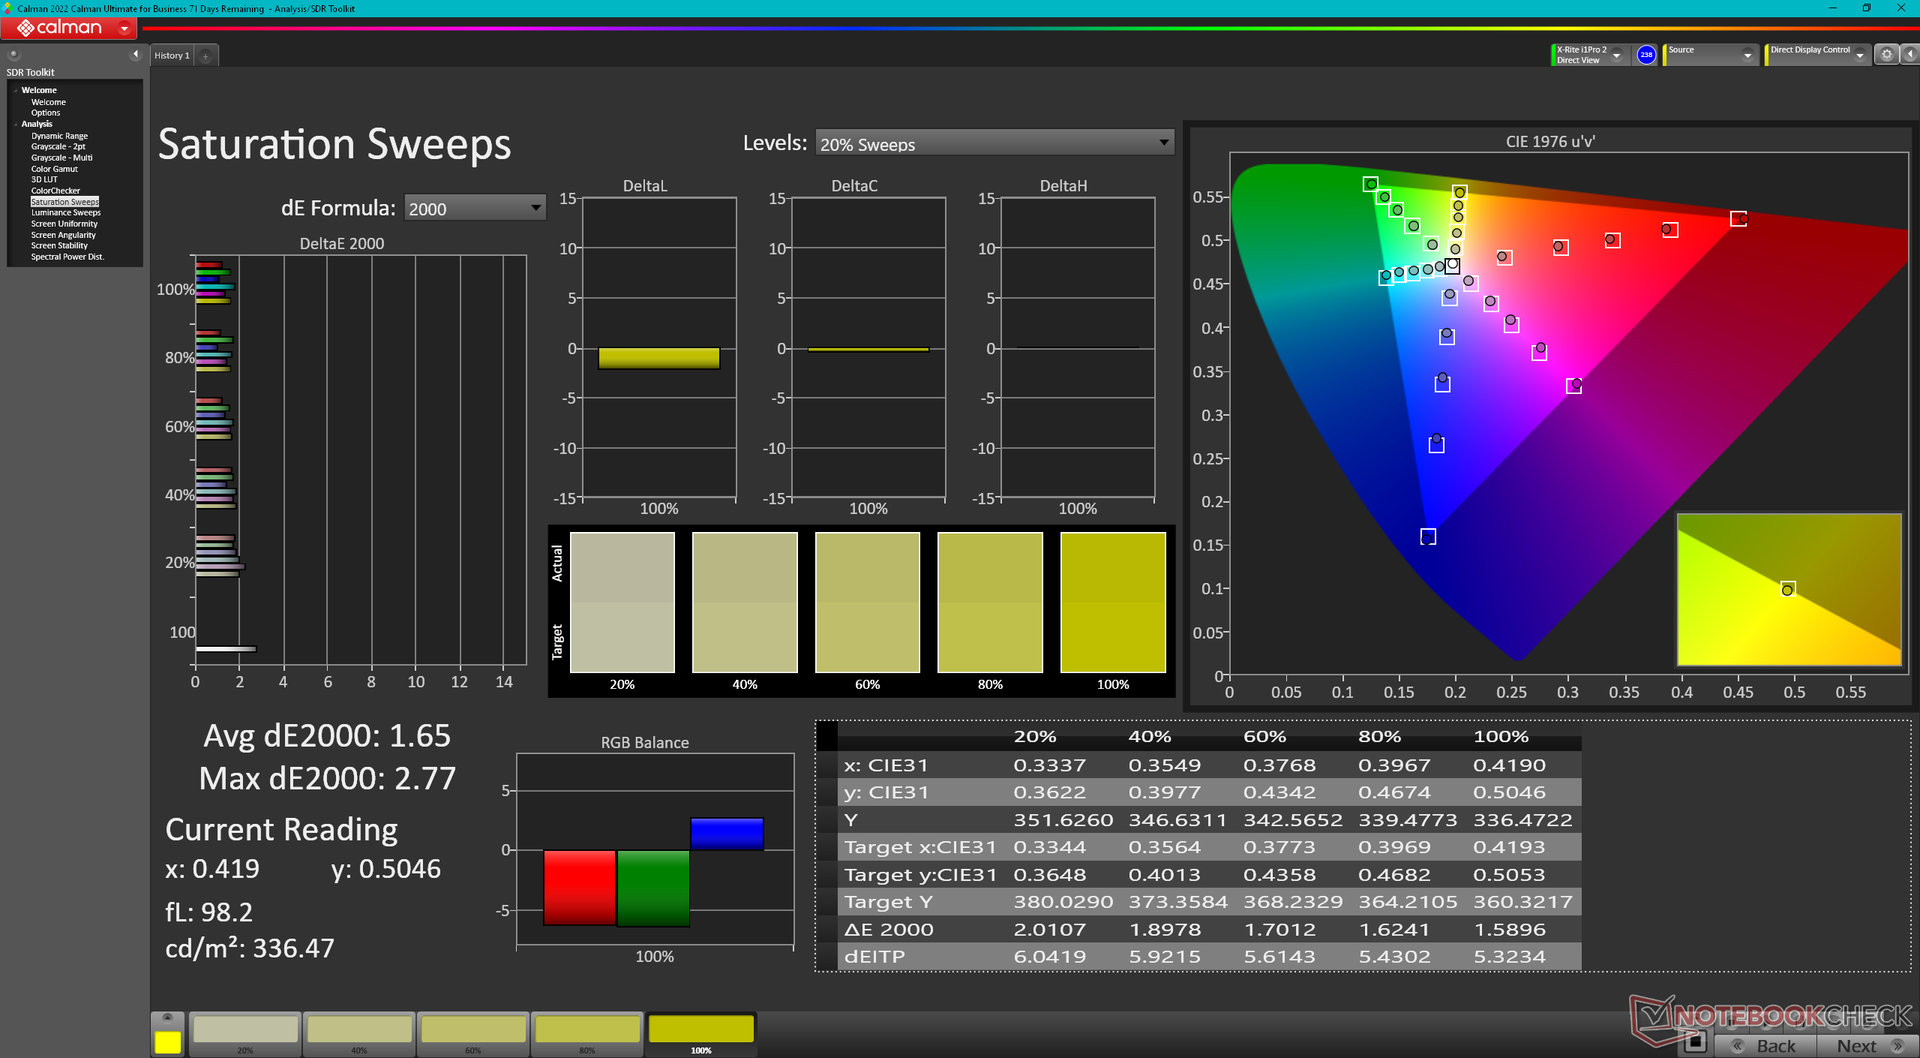
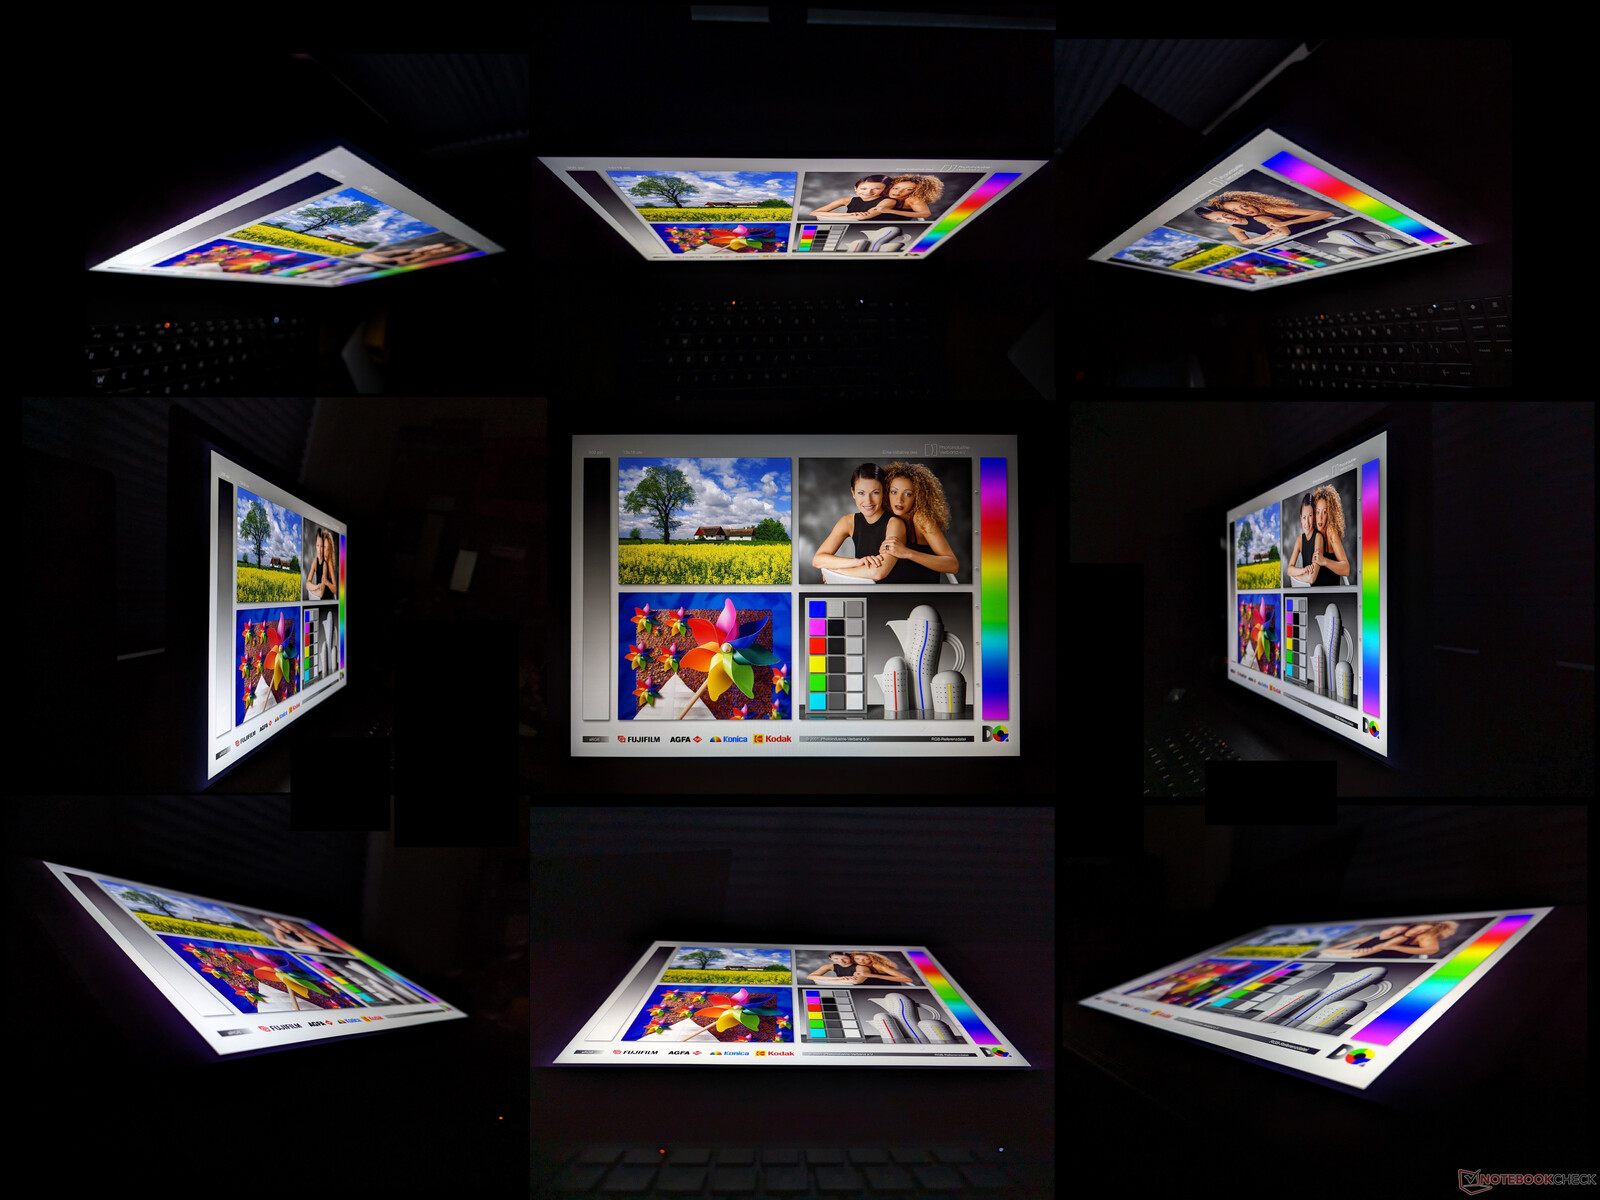
Display - Mini-LED, 240 Hz, 1600p, 16:10, 1180 nits, 100% colori P3

Un altro importante fattore di differenziazione tra Omen Transcend 16 e Omen 16 è il nuovo pannello mini-LED. Il mini-LED combina i vantaggi dell'IPS (ad esempio, velocità di aggiornamento rapida e relativa economicità) con quelli dell'OLED (ad esempio, livelli di luminosità più elevati e livelli di nero più profondi) per essere una buona opzione intermedia tra le tre tecnologie di visualizzazione. Le 1000 zone illuminate singolarmente dietro il pannello offrono un'esperienza visiva vicina ai pixel illuminati singolarmente dell'OLED.
HP dichiara una luminosità di picco di 1180 nits. Le nostre misurazioni indipendenti, eseguite con il test di luminosità HDR di , registrano un massimo di 1233 nits registrerebbero un massimo di 1233 nits, a conferma delle affermazioni di HP. Si noti che questo valore massimo è disponibile solo in determinate condizioni HDR, come nel caso dell'Asus VivoBook Asus VivoBook poiché la luminosità massima è altrimenti limitata a ~800 nits quando si visualizza tutto bianco e niente nero. Anche così, 800 nits sono quasi due volte più luminosi della maggior parte degli altri portatili IPS.
Rispetto al display mini-LED del concorrenteLenovo Slim Pro 9 16il display HP ha una risoluzione nativa inferiore (2560 x 1600 contro 3200 x 2000) ma una frequenza di aggiornamento superiore (240 Hz contro 165 Hz).


| |||||||||||||||||||||||||
Distribuzione della luminosità: 95 %
Al centro con la batteria: 791.1 cd/m²
Contrasto: 19778:1 (Nero: 0.04 cd/m²)
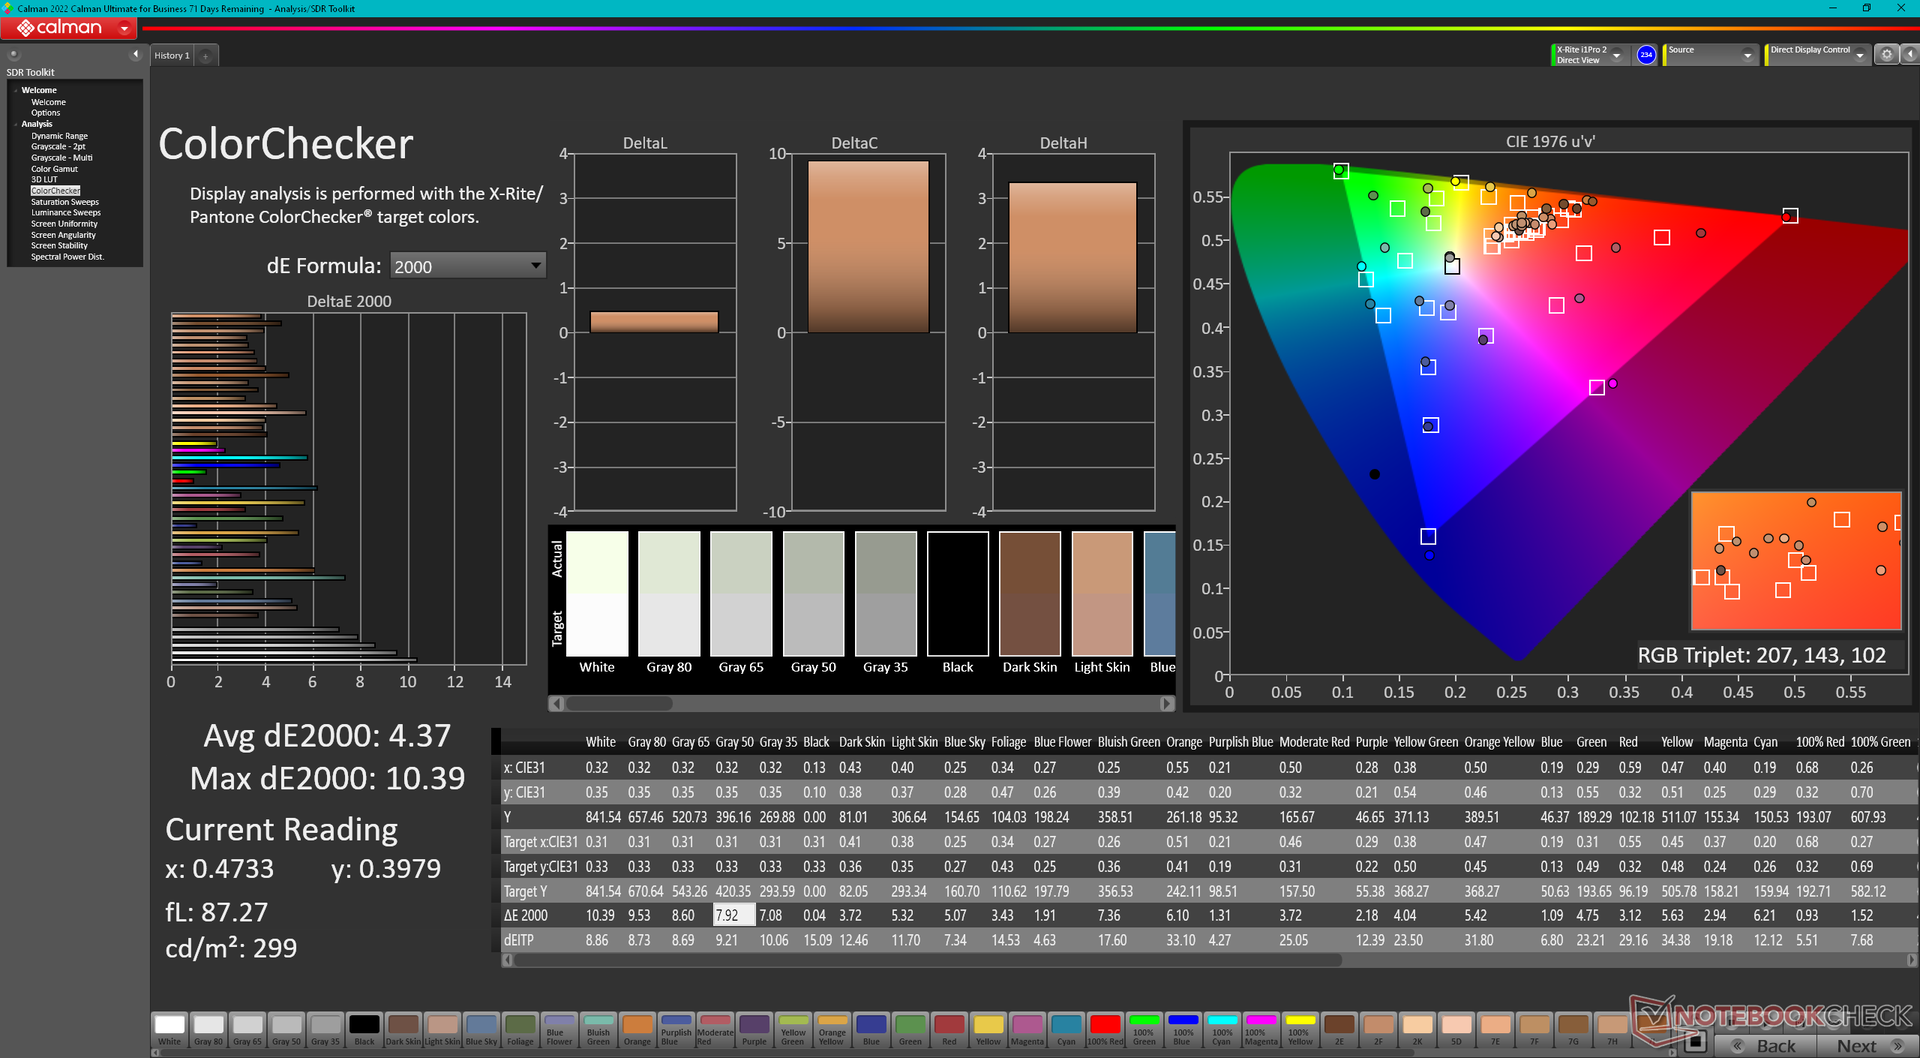
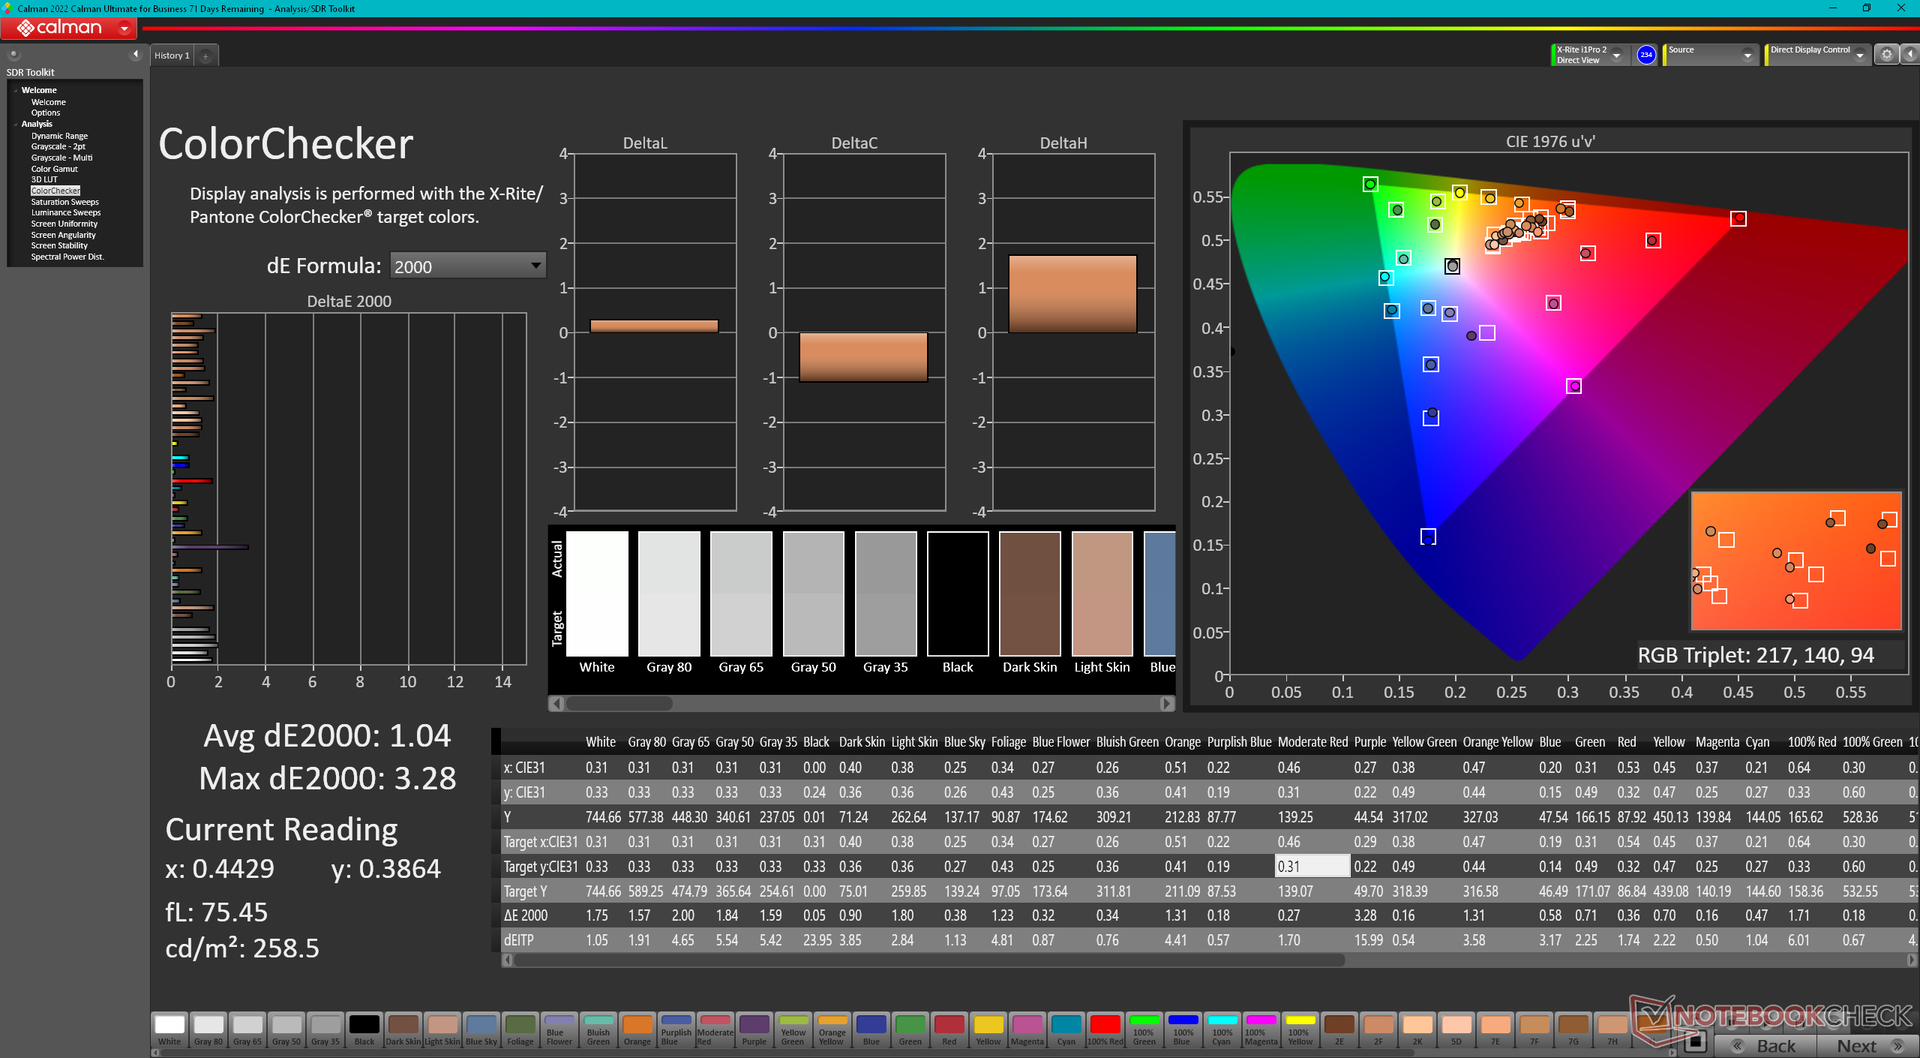
ΔE ColorChecker Calman: 4.37 | ∀{0.5-29.43 Ø4.71}
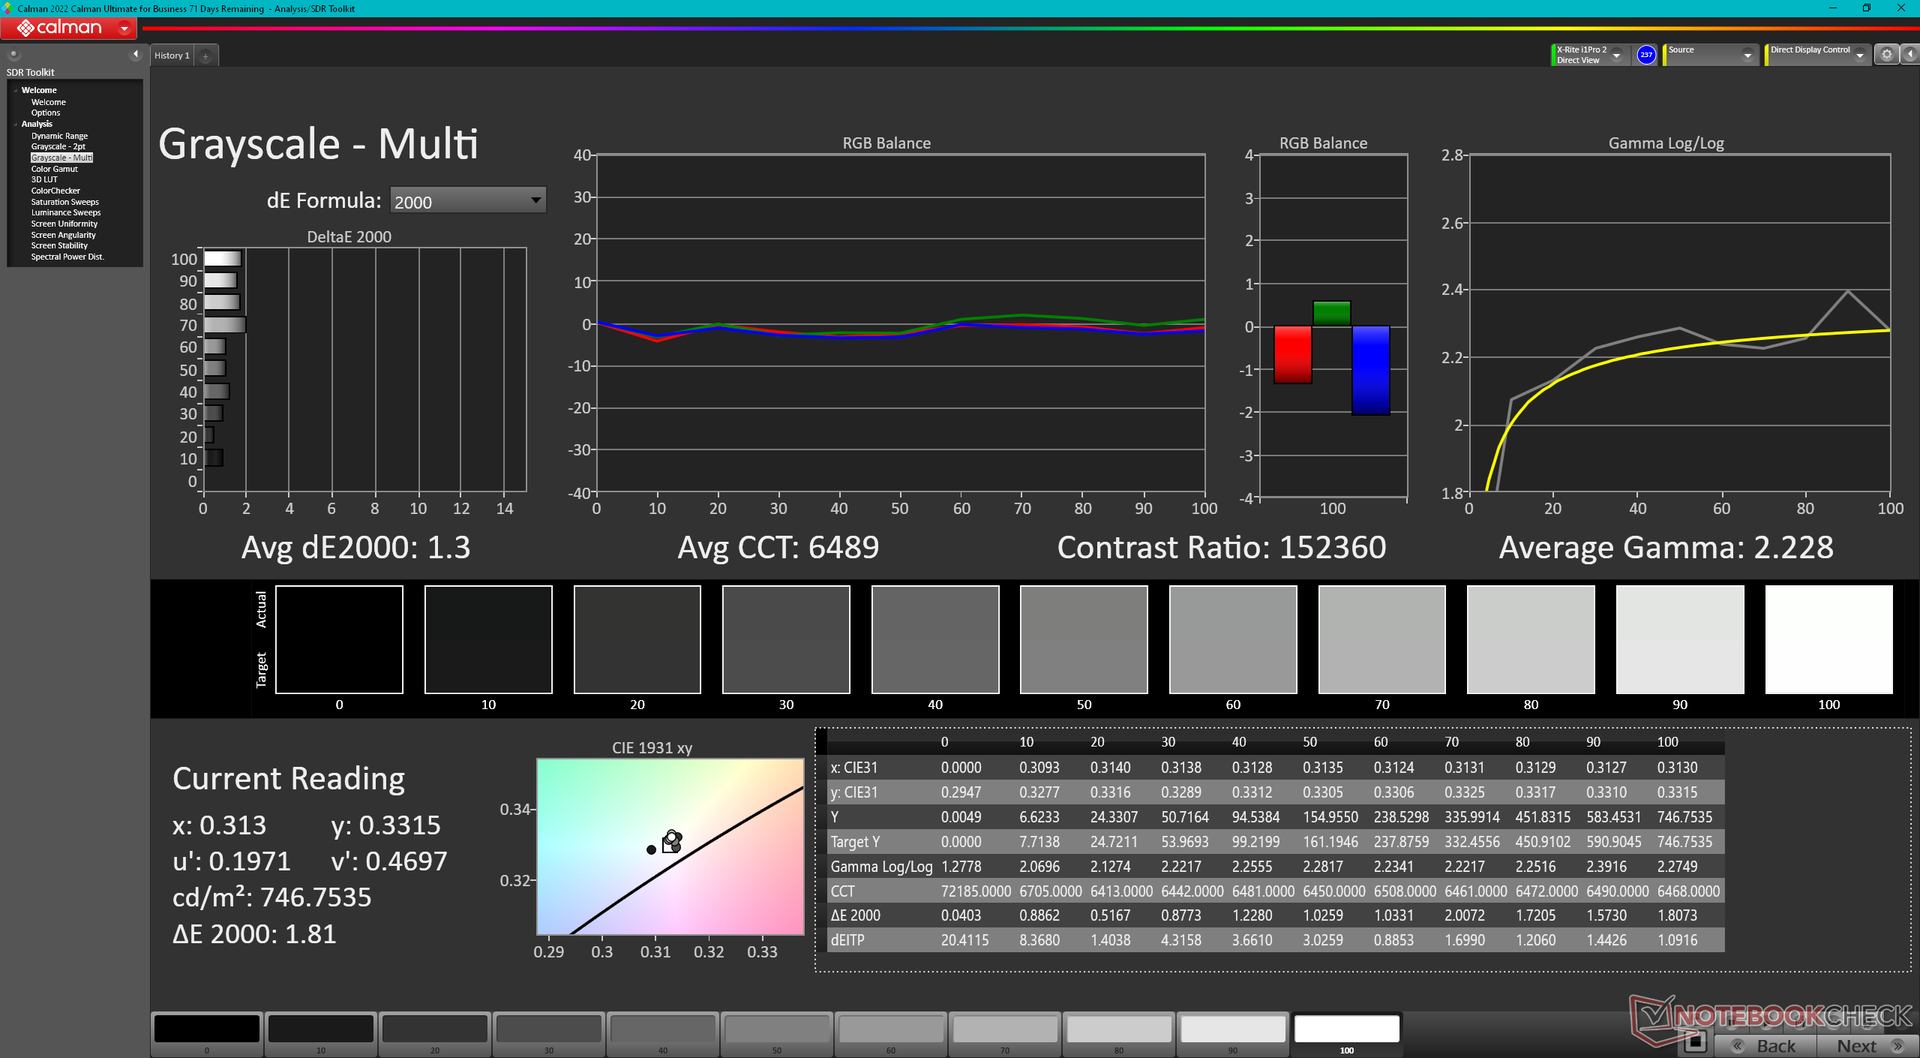
calibrated: 1.04
ΔE Greyscale Calman: 6.5 | ∀{0.09-98 Ø4.96}
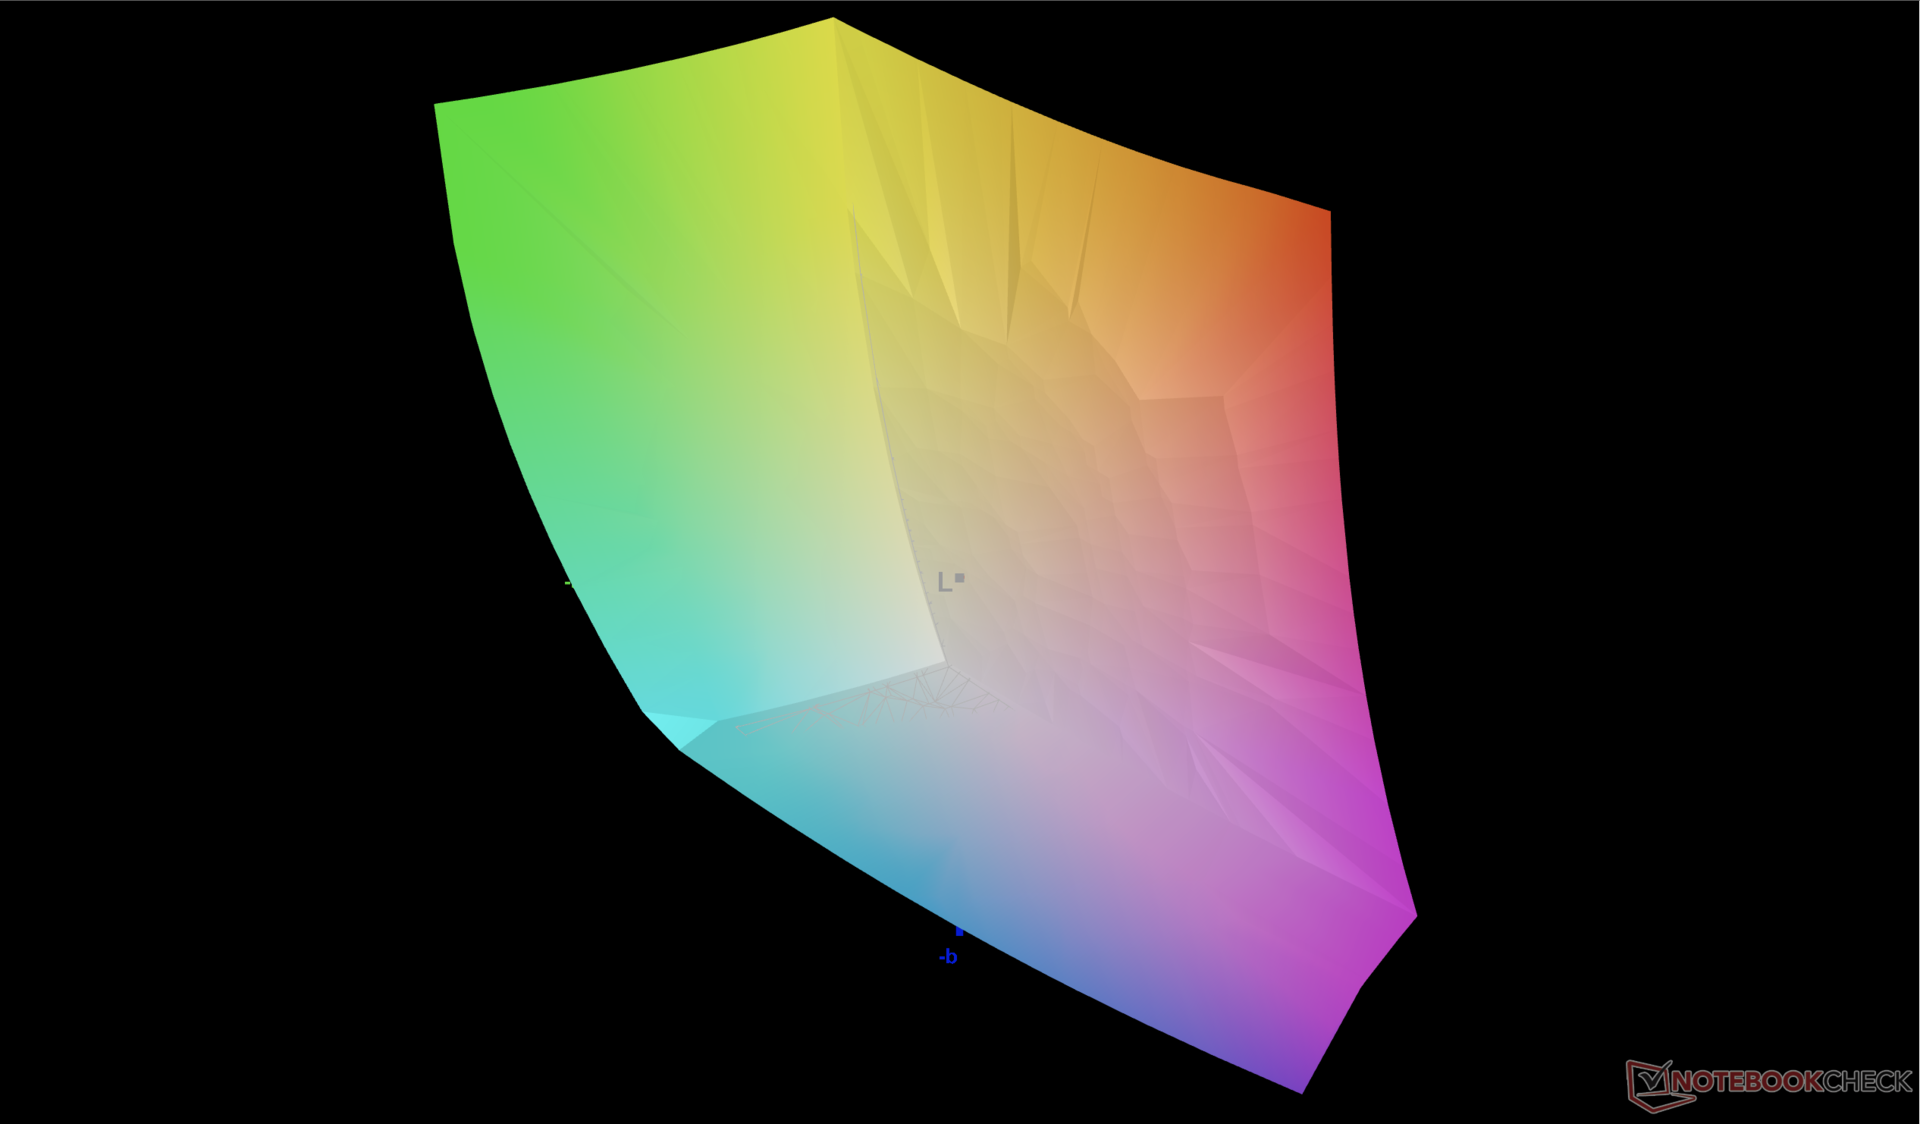
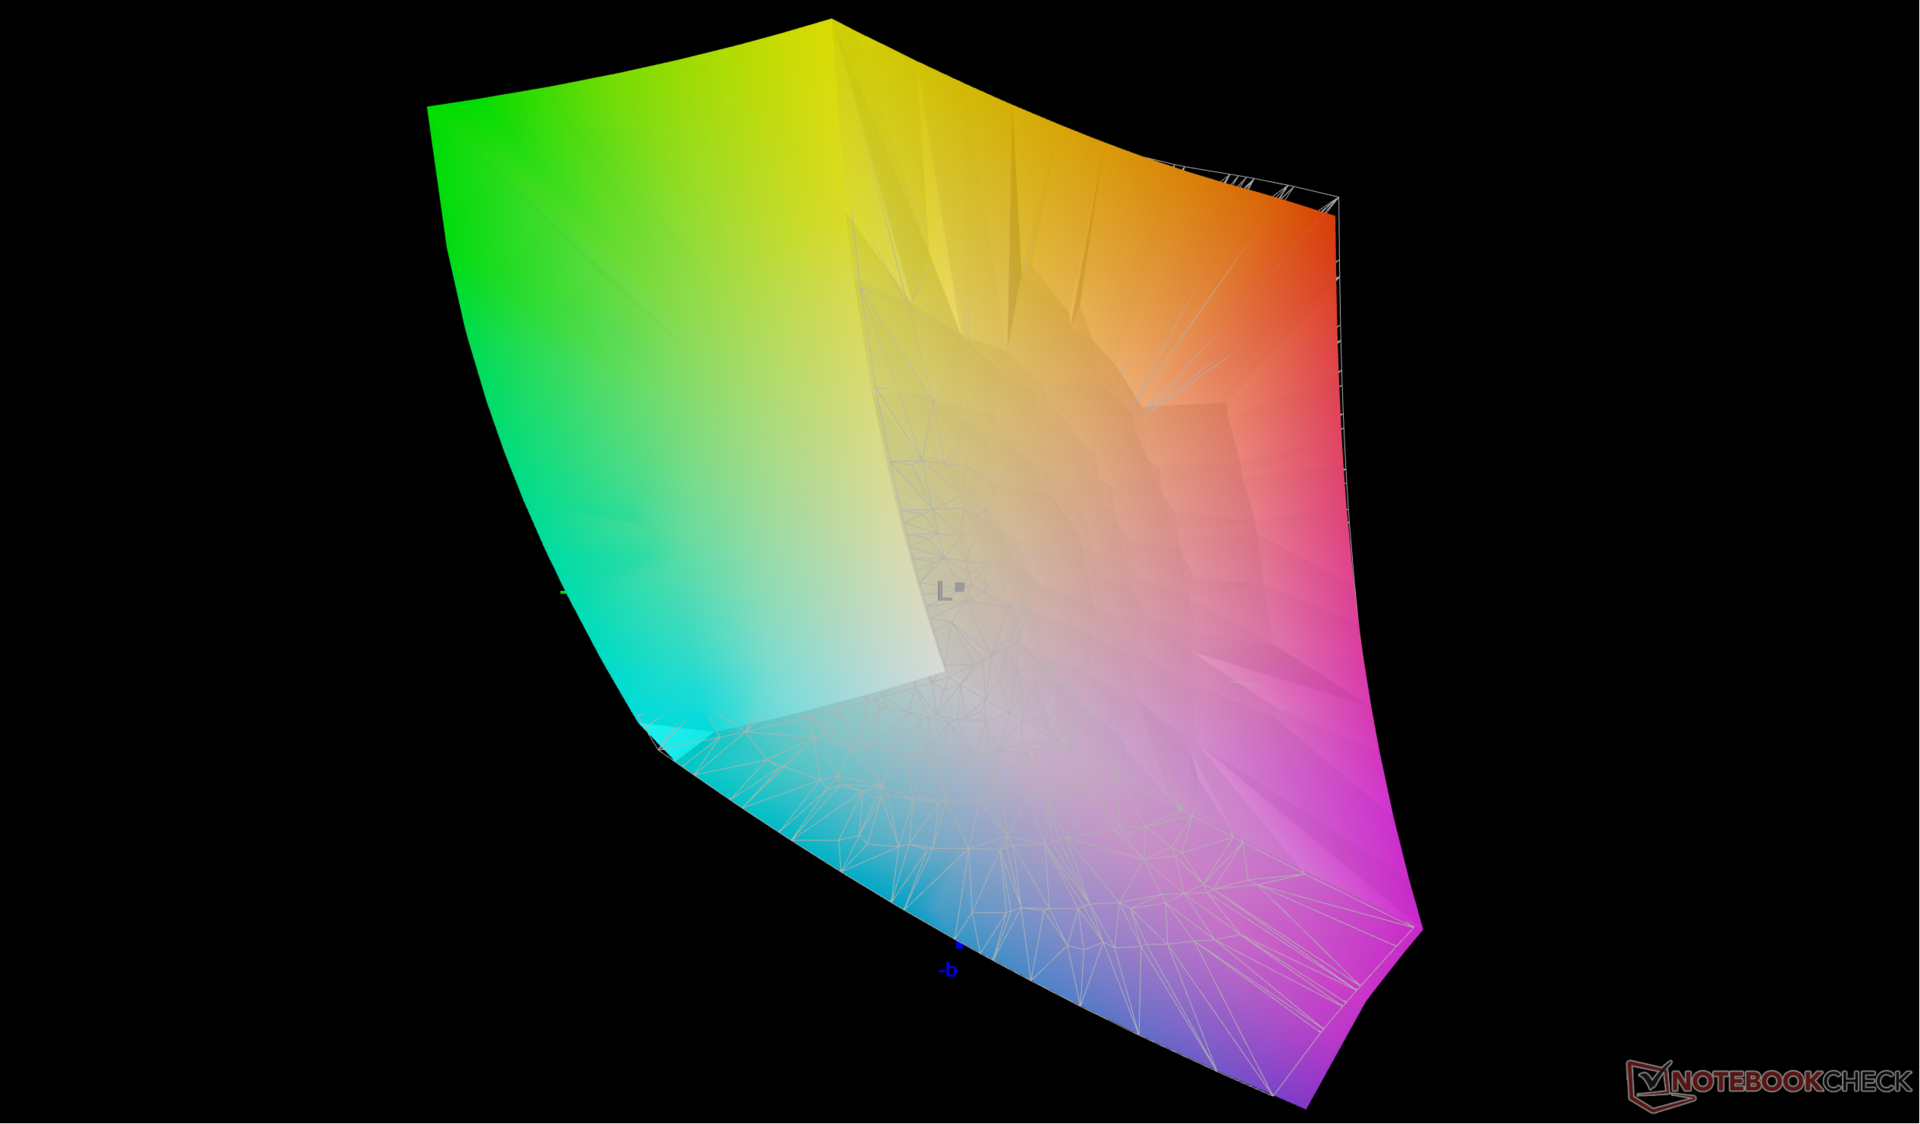
87.6% AdobeRGB 1998 (Argyll 3D)
100% sRGB (Argyll 3D)
99.2% Display P3 (Argyll 3D)
Gamma: 2.28
CCT: 6000 K
| HP Omen Transcend 16 AUOA3A6, Mini-LED, 2560x1600, 16" | Lenovo Legion Slim 7i 16 Gen 8 CSOT T3 MNG007DA2-3, IPS, 2560x1600, 16" | HP Omen 16-wf000 BOE0B7D, IPS, 2560x1440, 16.1" | Alienware x16 R1 BOE NE16NZ4, IPS, 2560x1600, 16" | Acer Nitro 16 AN16-41 BOE CQ NE16QDM-NY1, IPS, 2560x1600, 16" | Asus ROG Zephyrus M16 GU603Z BOE0A0B (BOE CQ NE160QDM-NY3), IPS, 2560x1600, 16" | |
|---|---|---|---|---|---|---|
| Display | -16% | -17% | 0% | -18% | -4% | |
| Display P3 Coverage (%) | 99.2 | 70.4 -29% | 69 -30% | 99.2 0% | 67.9 -32% | 92.8 -6% |
| sRGB Coverage (%) | 100 | 99.4 -1% | 99.2 -1% | 100 0% | 99.1 -1% | 98.5 -1% |
| AdobeRGB 1998 Coverage (%) | 87.6 | 72.5 -17% | 71.2 -19% | 88.6 1% | 69.9 -20% | 83.1 -5% |
| Response Times | 62% | 75% | 72% | 70% | 68% | |
| Response Time Grey 50% / Grey 80% * (ms) | 26.4 ? | 12 ? 55% | 4.6 ? 83% | 5.1 ? 81% | 11 ? 58% | 7.6 ? 71% |
| Response Time Black / White * (ms) | 28.2 ? | 8.9 ? 68% | 9.7 ? 66% | 10.3 ? 63% | 5 ? 82% | 10 ? 65% |
| PWM Frequency (Hz) | 3506 ? | |||||
| Screen | -95% | -86% | -67% | -95% | -79% | |
| Brightness middle (cd/m²) | 791.1 | 474.6 -40% | 310.9 -61% | 302.2 -62% | 520 -34% | 497 -37% |
| Brightness (cd/m²) | 800 | 445 -44% | 296 -63% | 285 -64% | 494 -38% | 481 -40% |
| Brightness Distribution (%) | 95 | 86 -9% | 91 -4% | 89 -6% | 91 -4% | 82 -14% |
| Black Level * (cd/m²) | 0.04 | 0.39 -875% | 0.35 -775% | 0.26 -550% | 0.39 -875% | 0.21 -425% |
| Contrast (:1) | 19778 | 1217 -94% | 888 -96% | 1162 -94% | 1333 -93% | 2367 -88% |
| Colorchecker dE 2000 * | 4.37 | 2.12 51% | 2.18 50% | 1.63 63% | 1.94 56% | 3.53 19% |
| Colorchecker dE 2000 max. * | 10.39 | 4.73 54% | 3.58 66% | 4.13 60% | 5.62 46% | 6.15 41% |
| Colorchecker dE 2000 calibrated * | 1.04 | 0.57 45% | 0.52 50% | 1.17 -13% | 0.74 29% | 3.53 -239% |
| Greyscale dE 2000 * | 6.5 | 2.8 57% | 2.8 57% | 2.5 62% | 2.94 55% | 1.74 73% |
| Gamma | 2.28 96% | 2.22 99% | 2.18 101% | 2.23 99% | 2.37 93% | 2.2 100% |
| CCT | 6000 108% | 6542 99% | 6002 108% | 6590 99% | 6443 101% | 6418 101% |
| Media totale (Programma / Settaggio) | -16% /
-56% | -9% /
-48% | 2% /
-33% | -14% /
-55% | -5% /
-42% |
* ... Meglio usare valori piccoli
Il pannello non è stato calibrato in fabbrica. La temperatura del colore è più calda del previsto a 6000K e quindi i colori ai livelli di saturazione più bassi non sono così accurati come potrebbero essere. La calibrazione del pannello con il nostro colorimetro X-Rite aumenterebbe la temperatura del colore allo standard di 6500K per ottenere colori più stabili a tutti i livelli di saturazione.
Tempi di risposta del Display
| ↔ Tempi di risposta dal Nero al Bianco | ||
|---|---|---|
| 28.2 ms ... aumenta ↗ e diminuisce ↘ combinato | ↗ 21.6 ms Incremento | 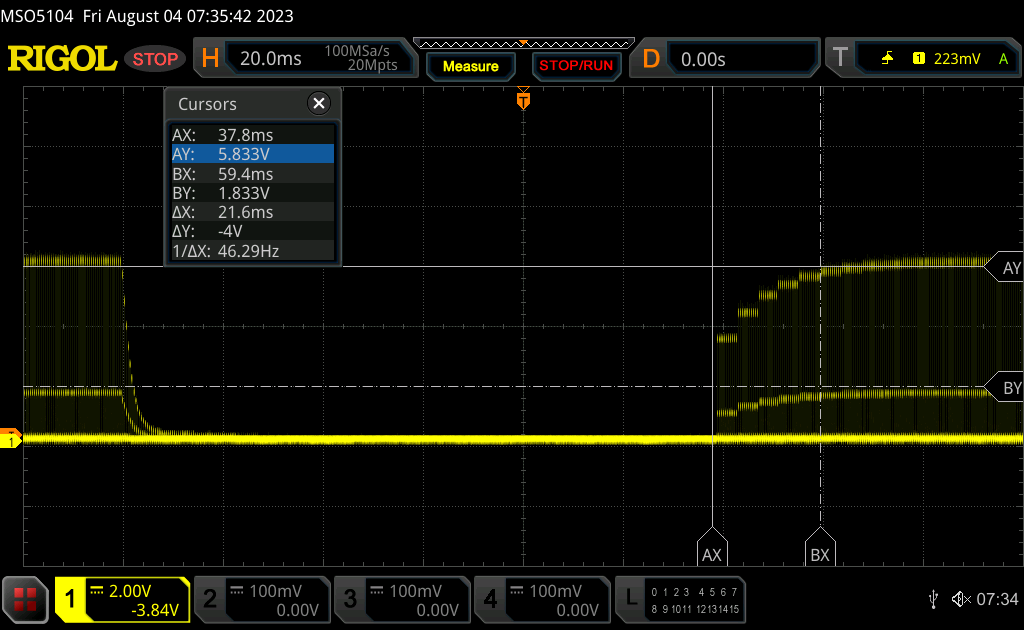 |
| ↘ 6.6 ms Calo | ||
| Lo schermo mostra tempi di risposta relativamente lenti nei nostri tests e potrebbe essere troppo lento per i gamers. In confronto, tutti i dispositivi di test variano da 0.1 (minimo) a 240 (massimo) ms. » 75 % di tutti i dispositivi è migliore. Questo significa che i tempi di risposta rilevati sono peggiori rispetto alla media di tutti i dispositivi testati (19.8 ms). | ||
| ↔ Tempo di risposta dal 50% Grigio all'80% Grigio | ||
| 26.4 ms ... aumenta ↗ e diminuisce ↘ combinato | ↗ 15 ms Incremento | 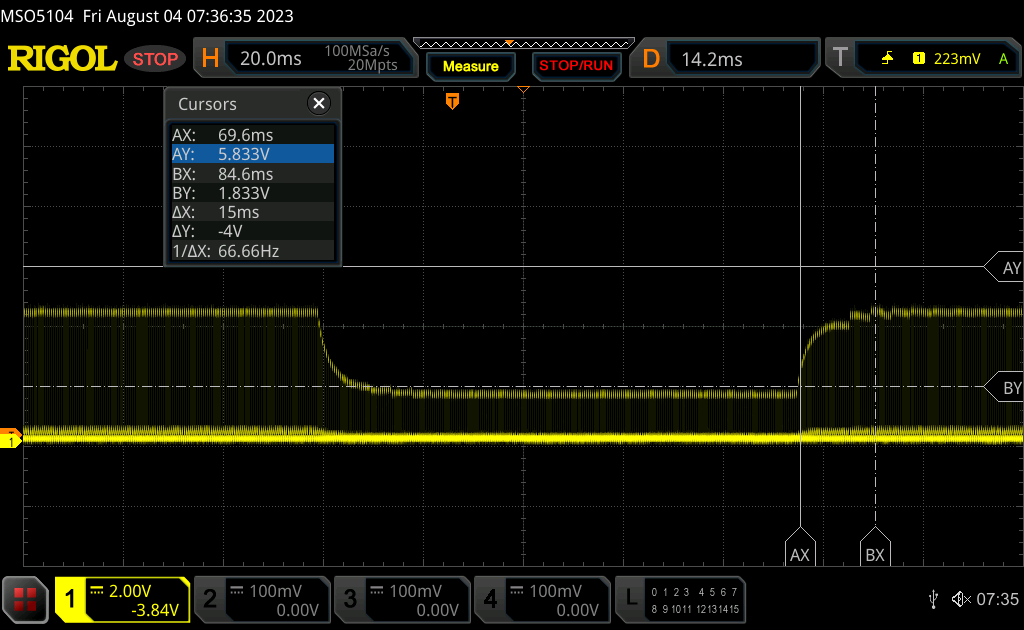 |
| ↘ 11.4 ms Calo | ||
| Lo schermo mostra tempi di risposta relativamente lenti nei nostri tests e potrebbe essere troppo lento per i gamers. In confronto, tutti i dispositivi di test variano da 0.165 (minimo) a 636 (massimo) ms. » 36 % di tutti i dispositivi è migliore. Questo significa che i tempi di risposta rilevati sono migliori rispettto alla media di tutti i dispositivi testati (31 ms). | ||
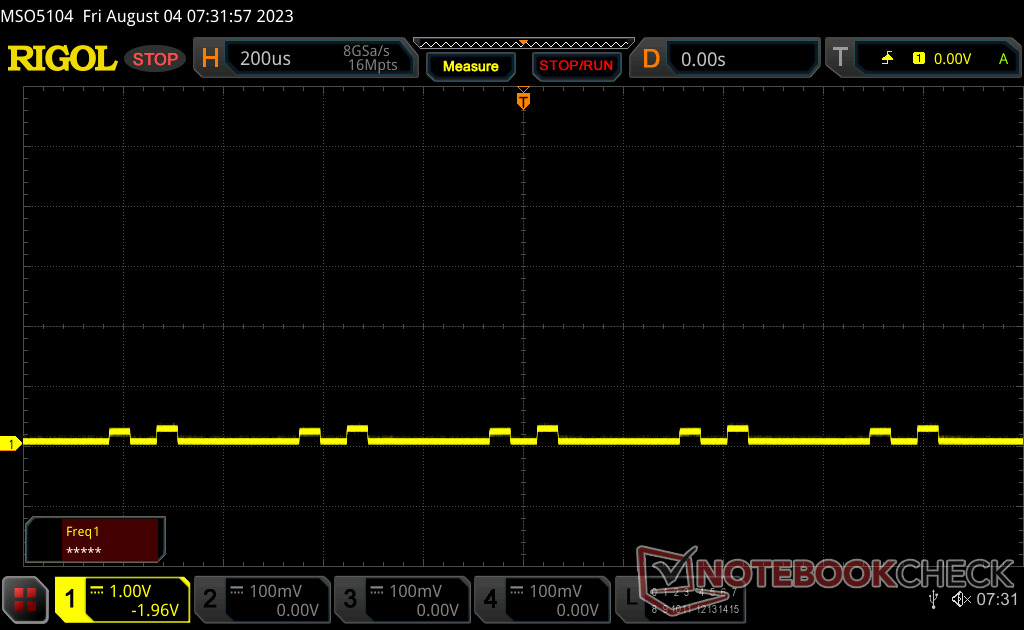
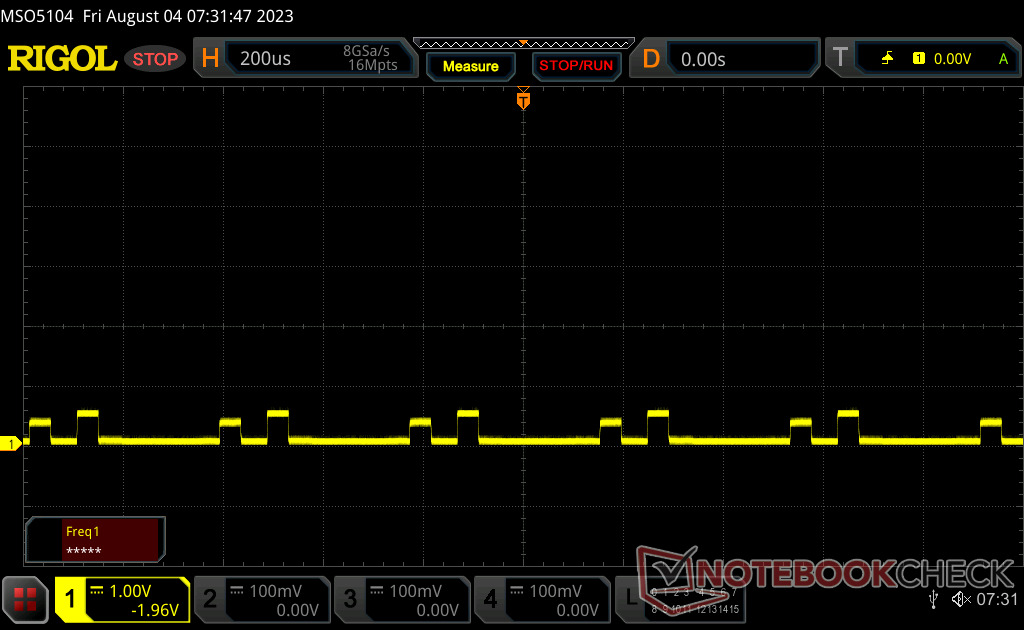
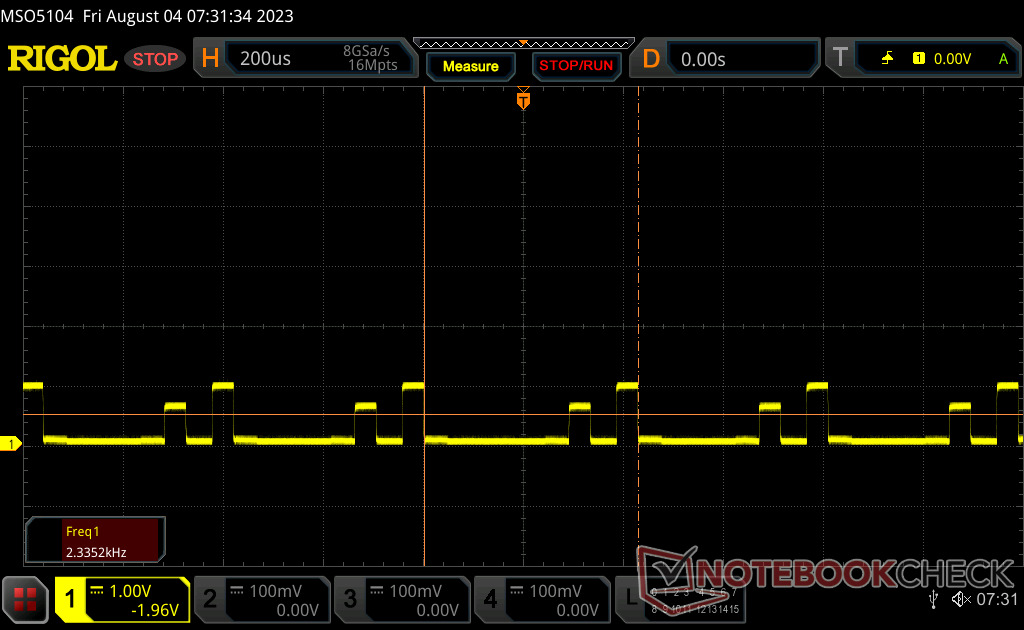
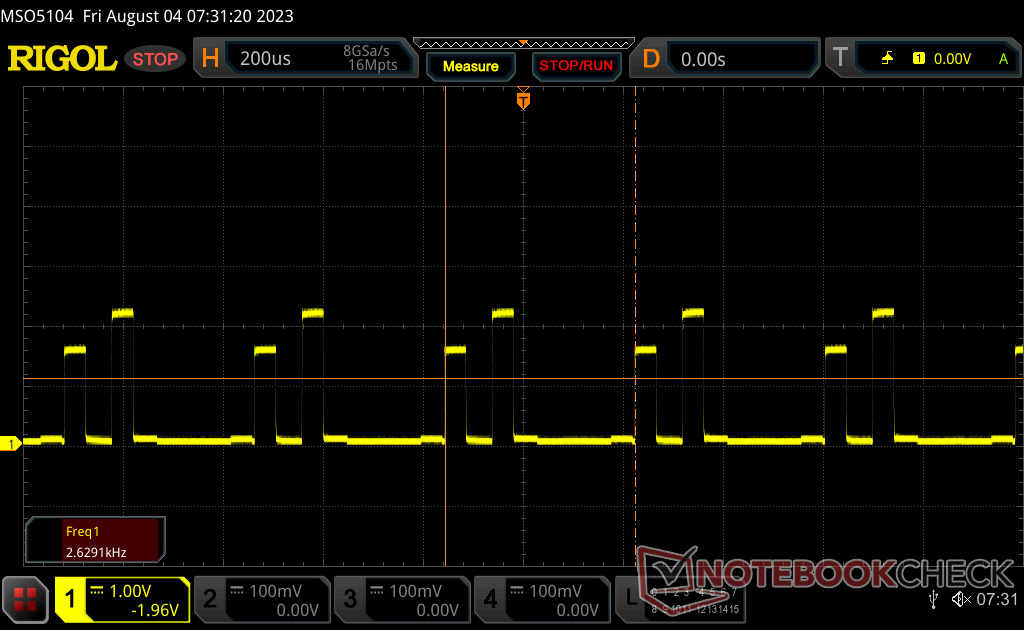
Sfarfallio dello schermo / PWM (Pulse-Width Modulation)
| flickering dello schermo / PWM rilevato | 3506 Hz | ≤ 100 % settaggio luminosita' | 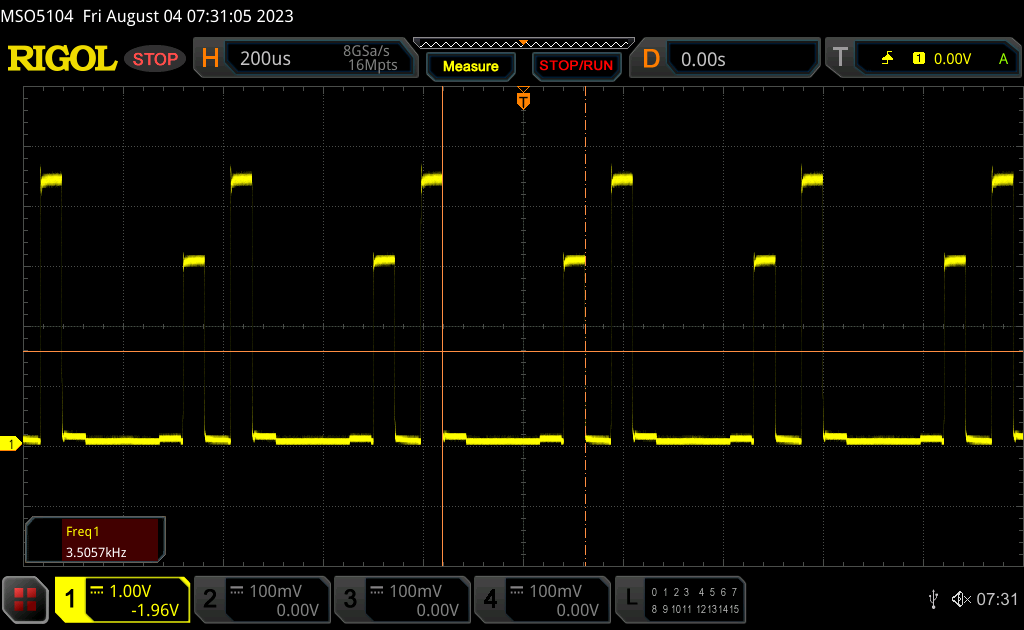 |
Il display sfarfalla a 3506 Hz (Probabilmente a causa dell'uso di PWM) Flickering rilevato ad una luminosita' di 100 % o inferiore. Non dovrebbe verificarsi flickering o PWM sopra questo valore di luminosita'. La frequenza di 3506 Hz è abbastanza alta, quindi la maggioranza degli utenti sensibili al PWM non dovrebbero notare alcun flickering. In confronto: 52 % di tutti i dispositivi testati non utilizza PWM per ridurre la luminosita' del display. Se è rilevato PWM, una media di 7754 (minimo: 5 - massimo: 343500) Hz è stata rilevata. | |||
Lo sfarfallio è presente a tutti i livelli di luminosità. Tuttavia, la frequenza relativamente alta di 3506 Hz dovrebbe rendere il problema irrilevante per la maggior parte degli utenti. Lo sfarfallio ha anche la sfortunata conseguenza di rendere i tempi di risposta più difficili da misurare con precisione.
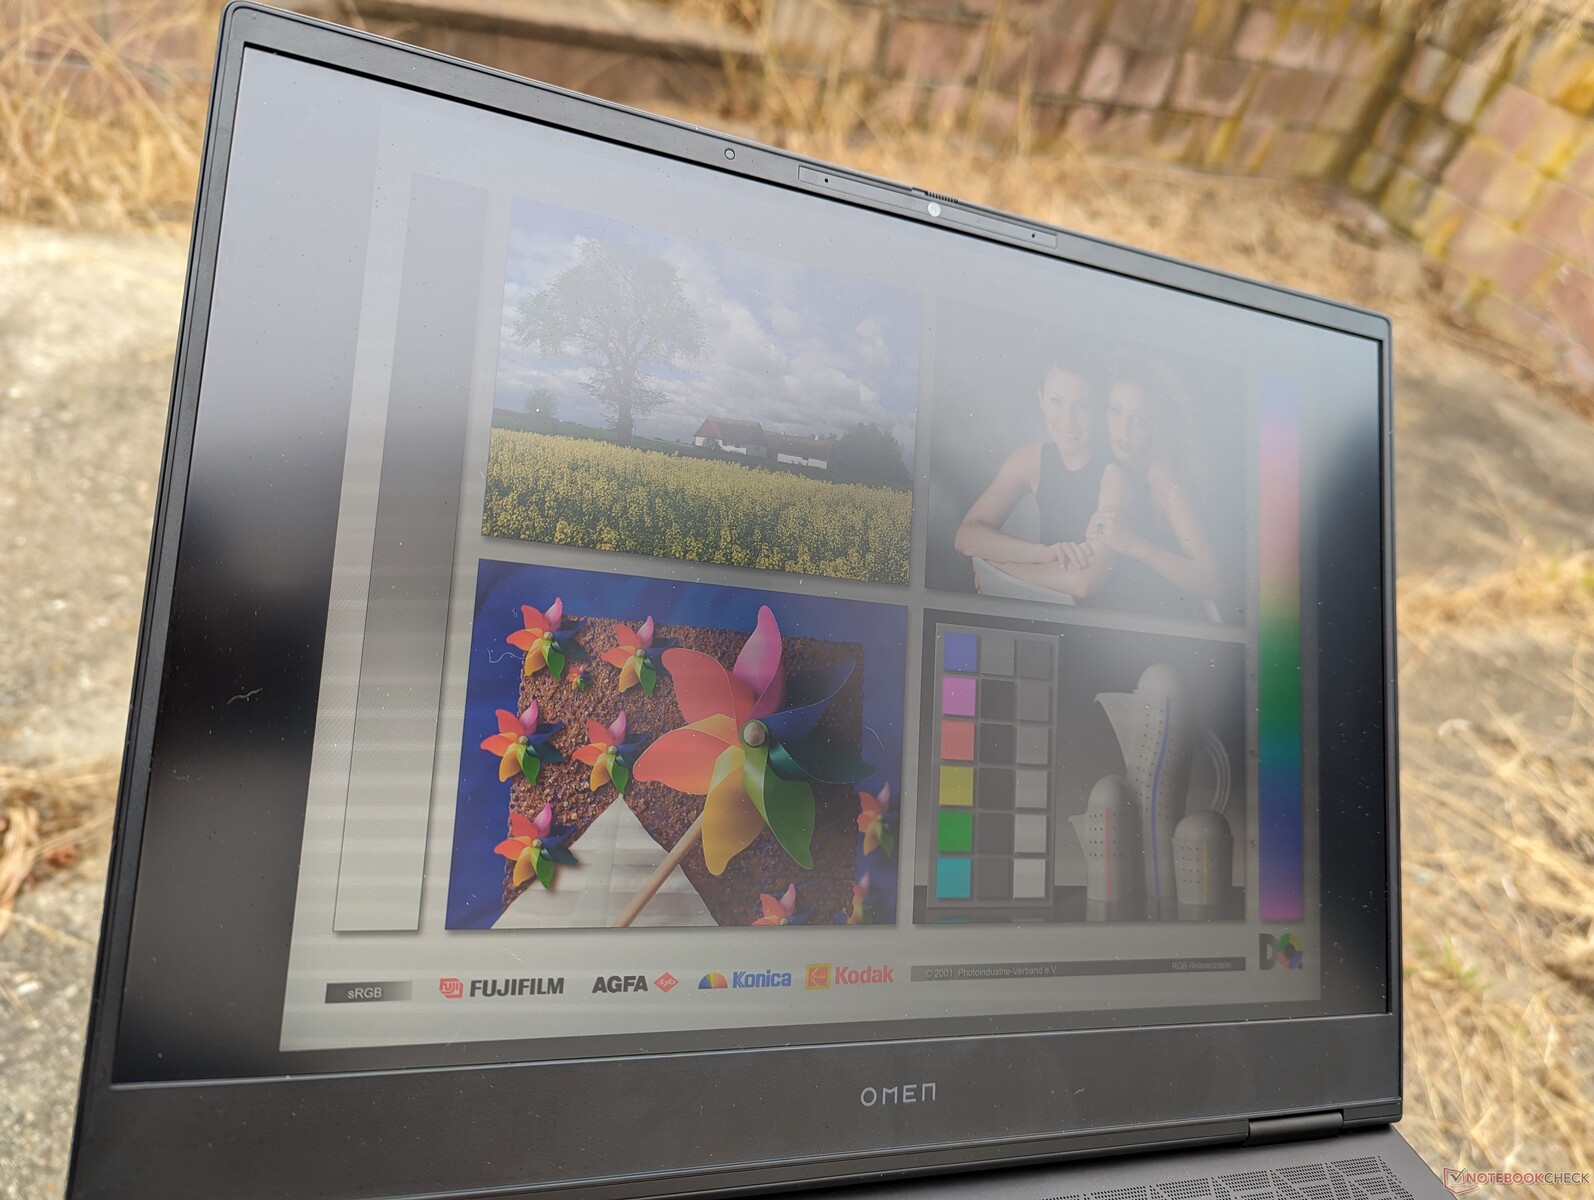
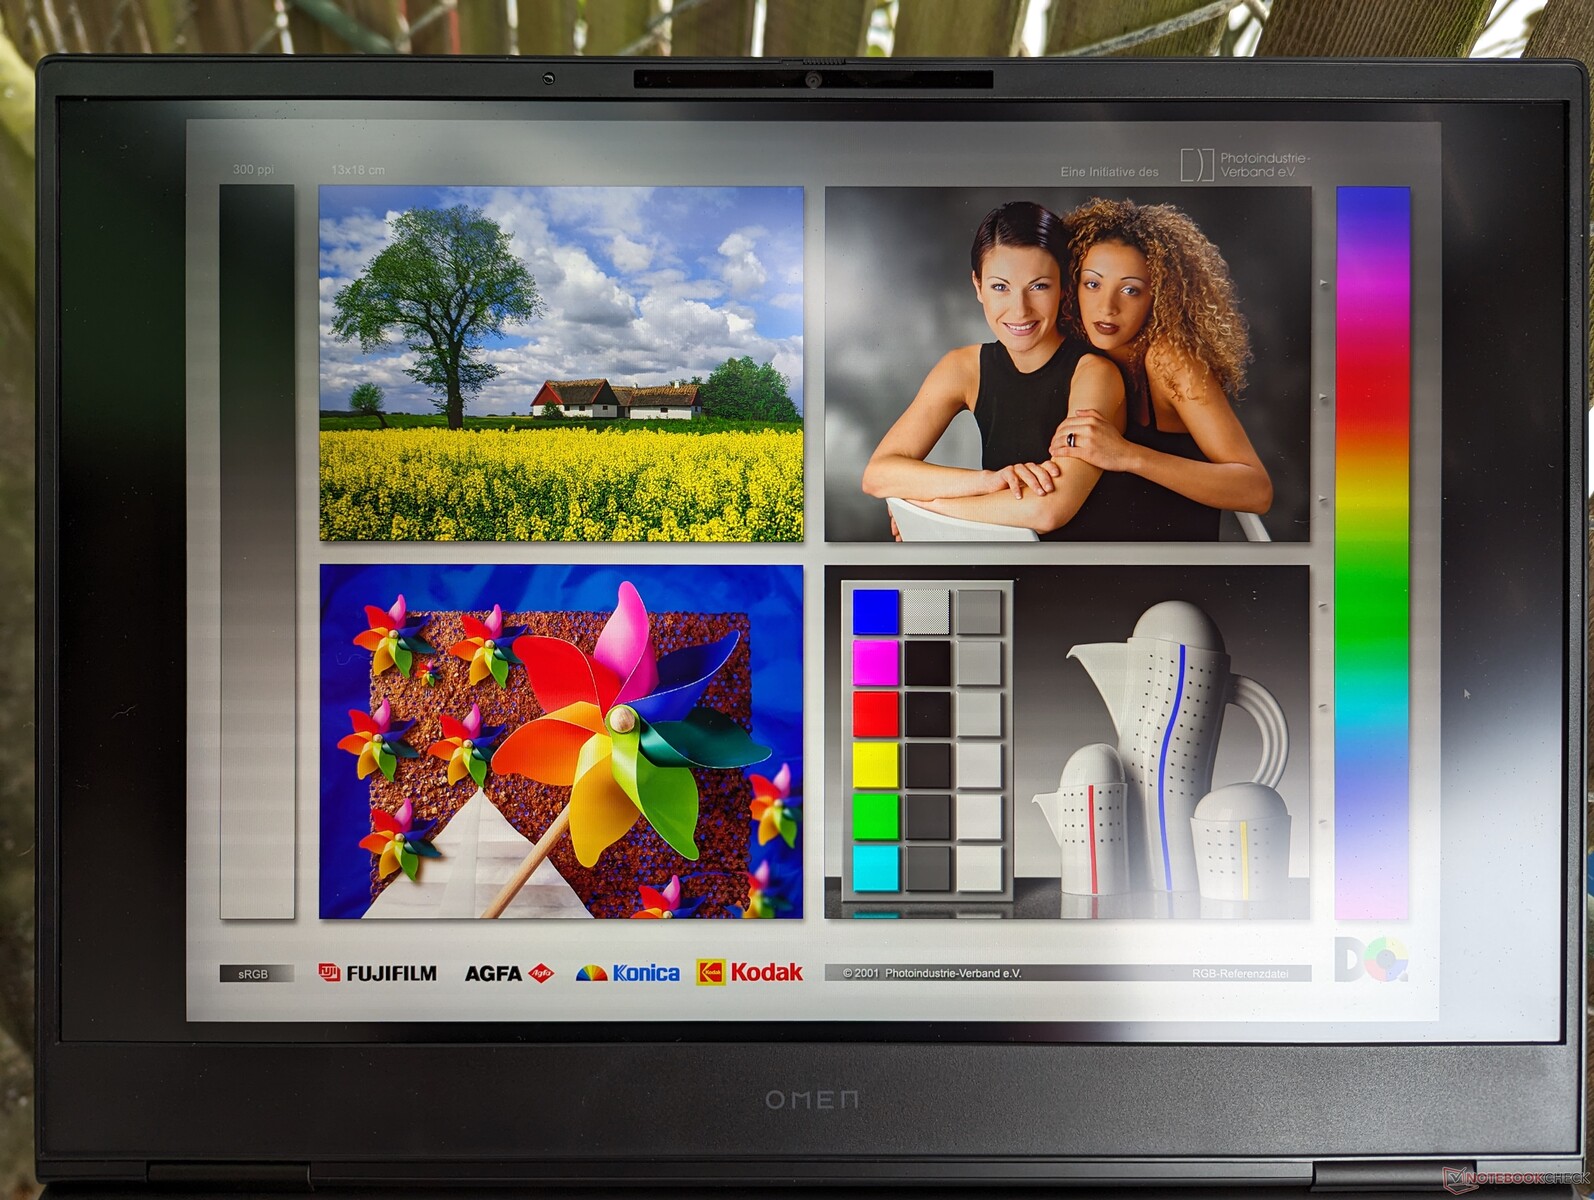
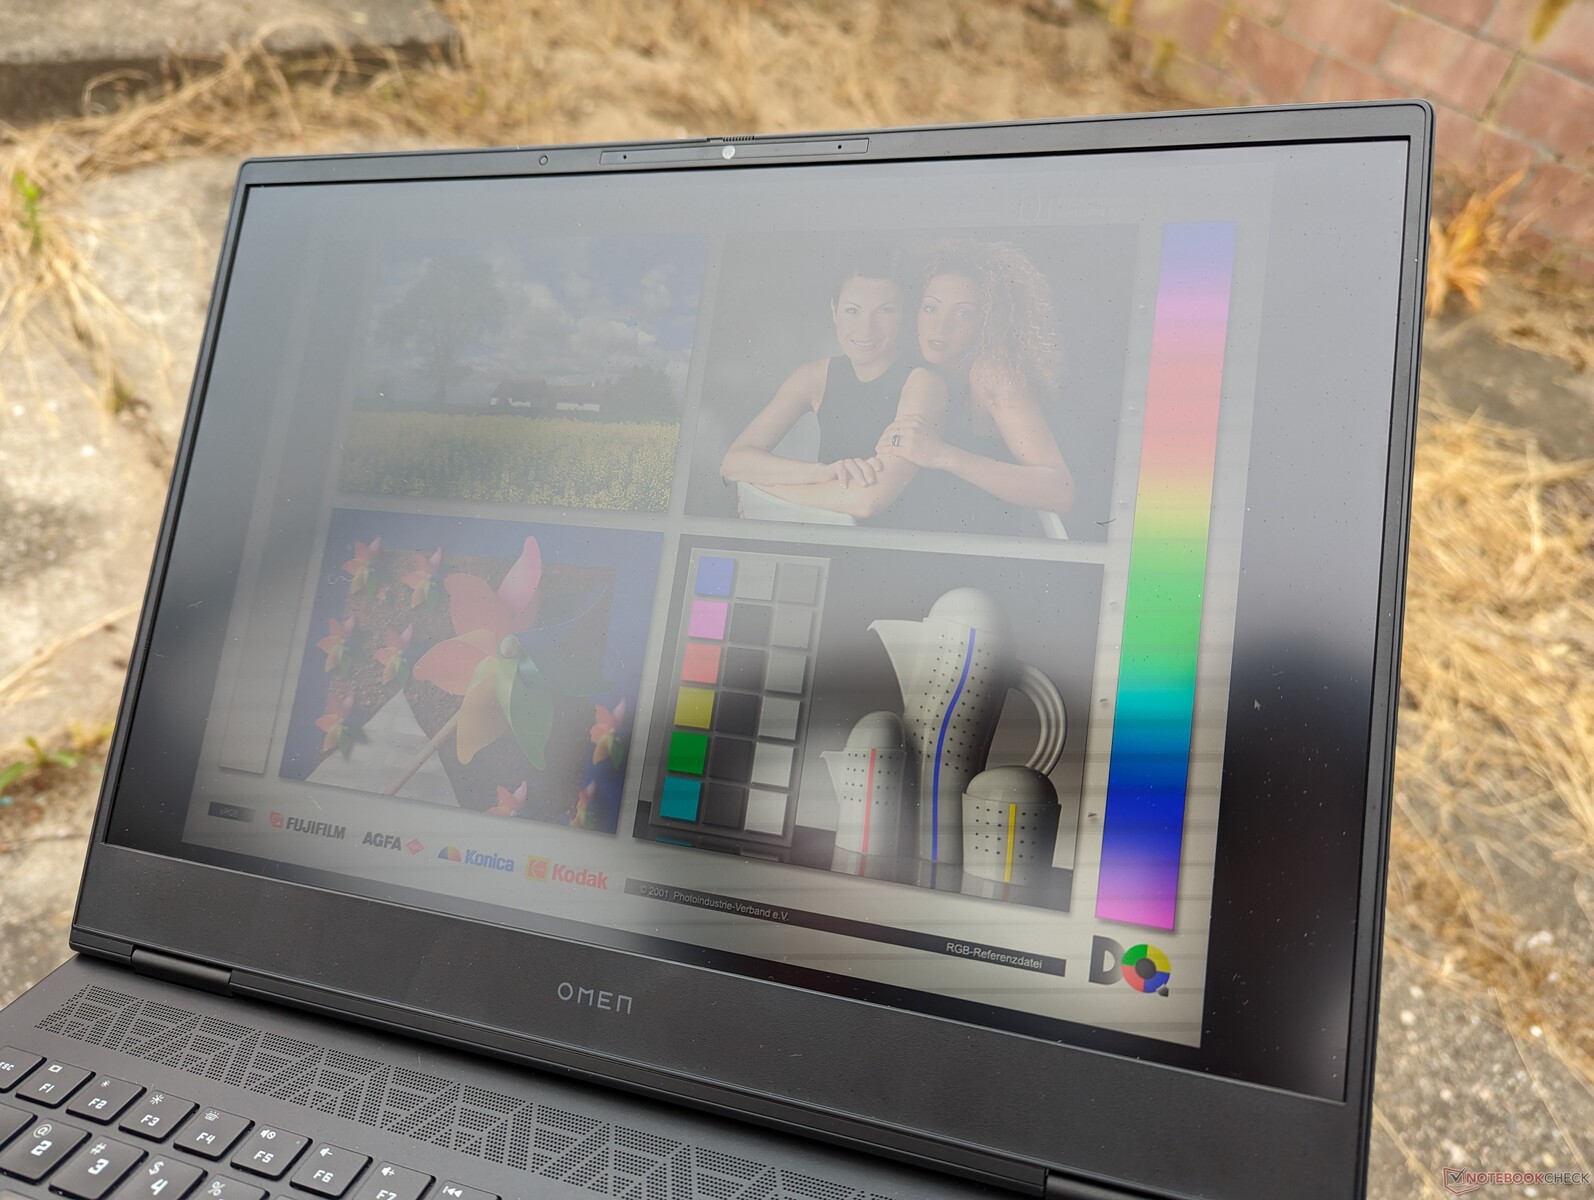
La visibilità all'aperto è buona all'ombra, ma i colori risultano comunque sbiaditi in condizioni di maggiore luminosità o alla luce del sole. La luminosità massima di ~800 nits è sostenibile a batteria.
Prestazioni - Intel Raptor Lake-HX di 13a generazione
Condizioni di test
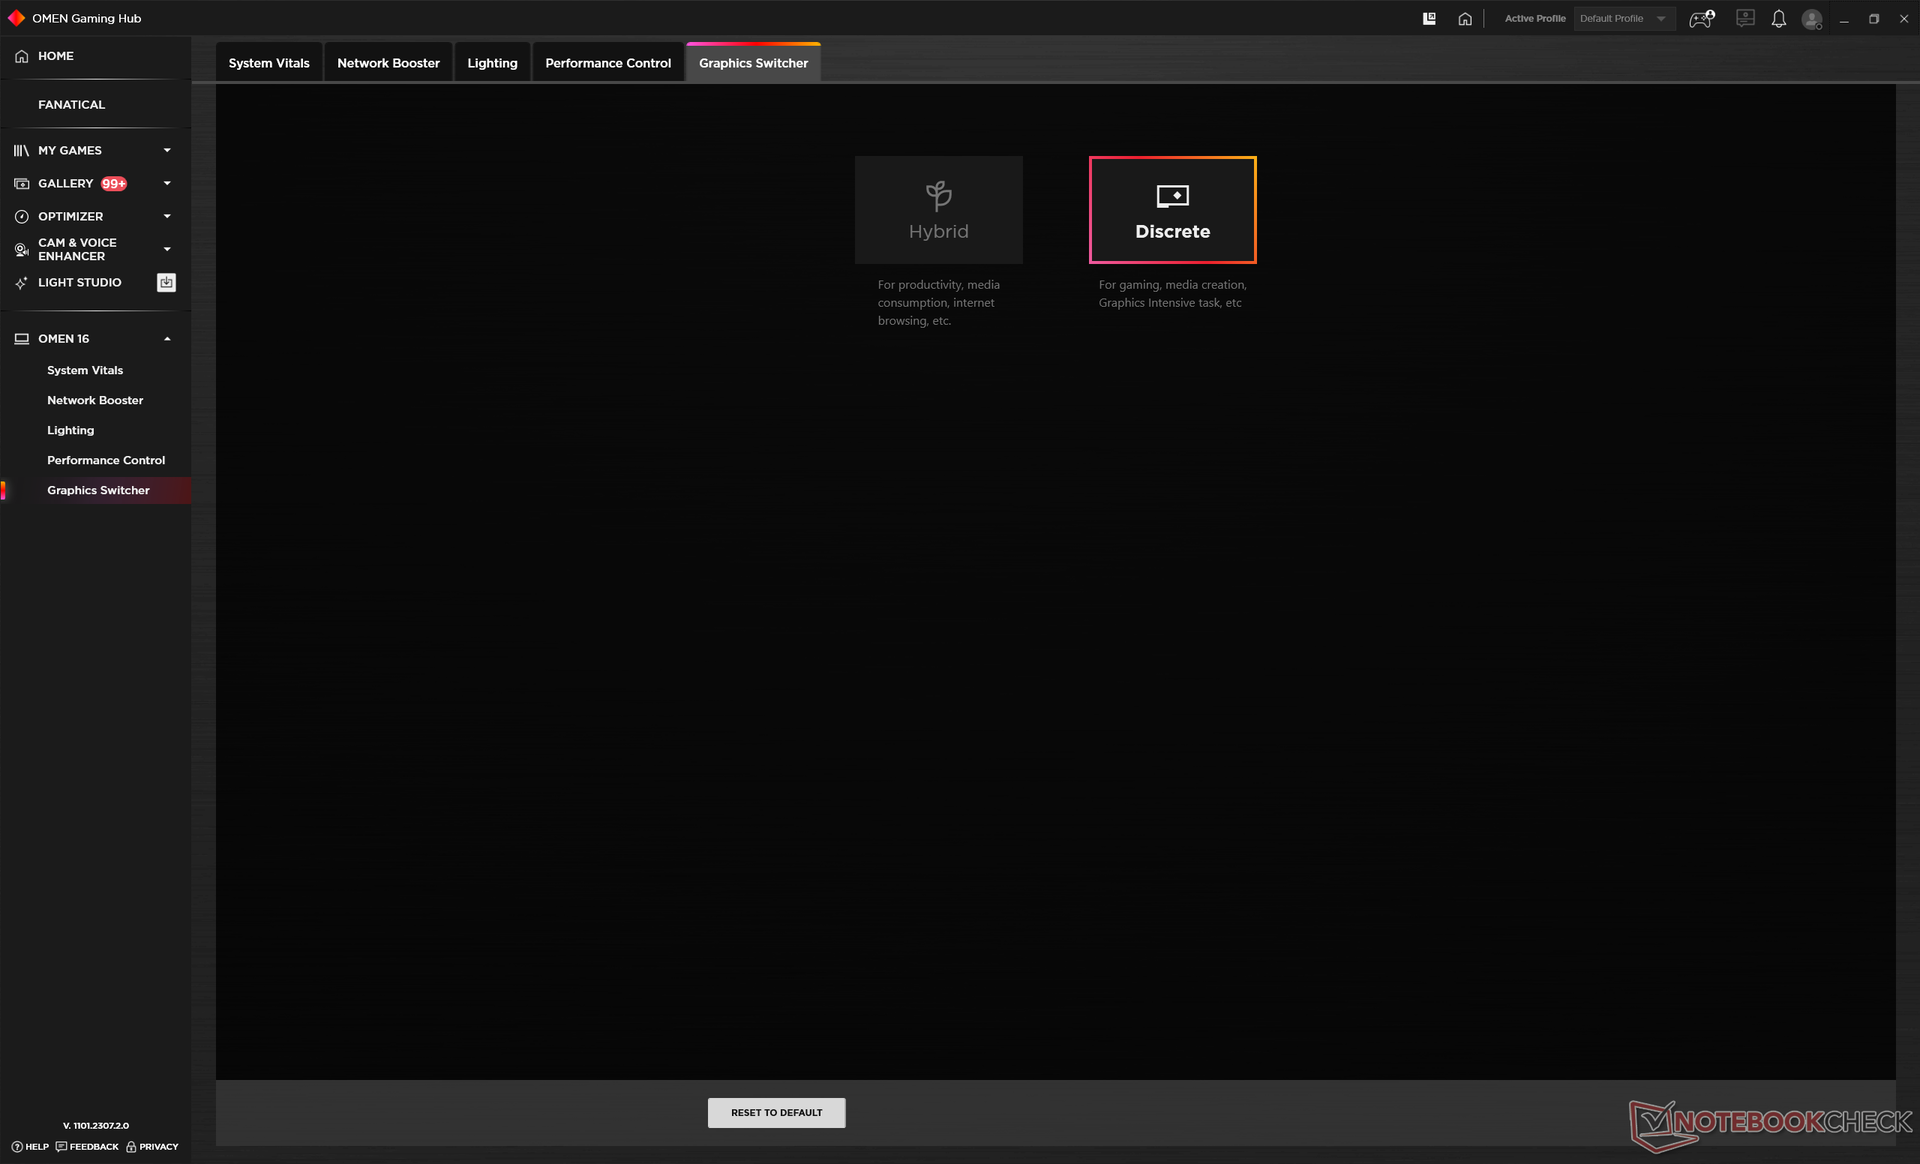
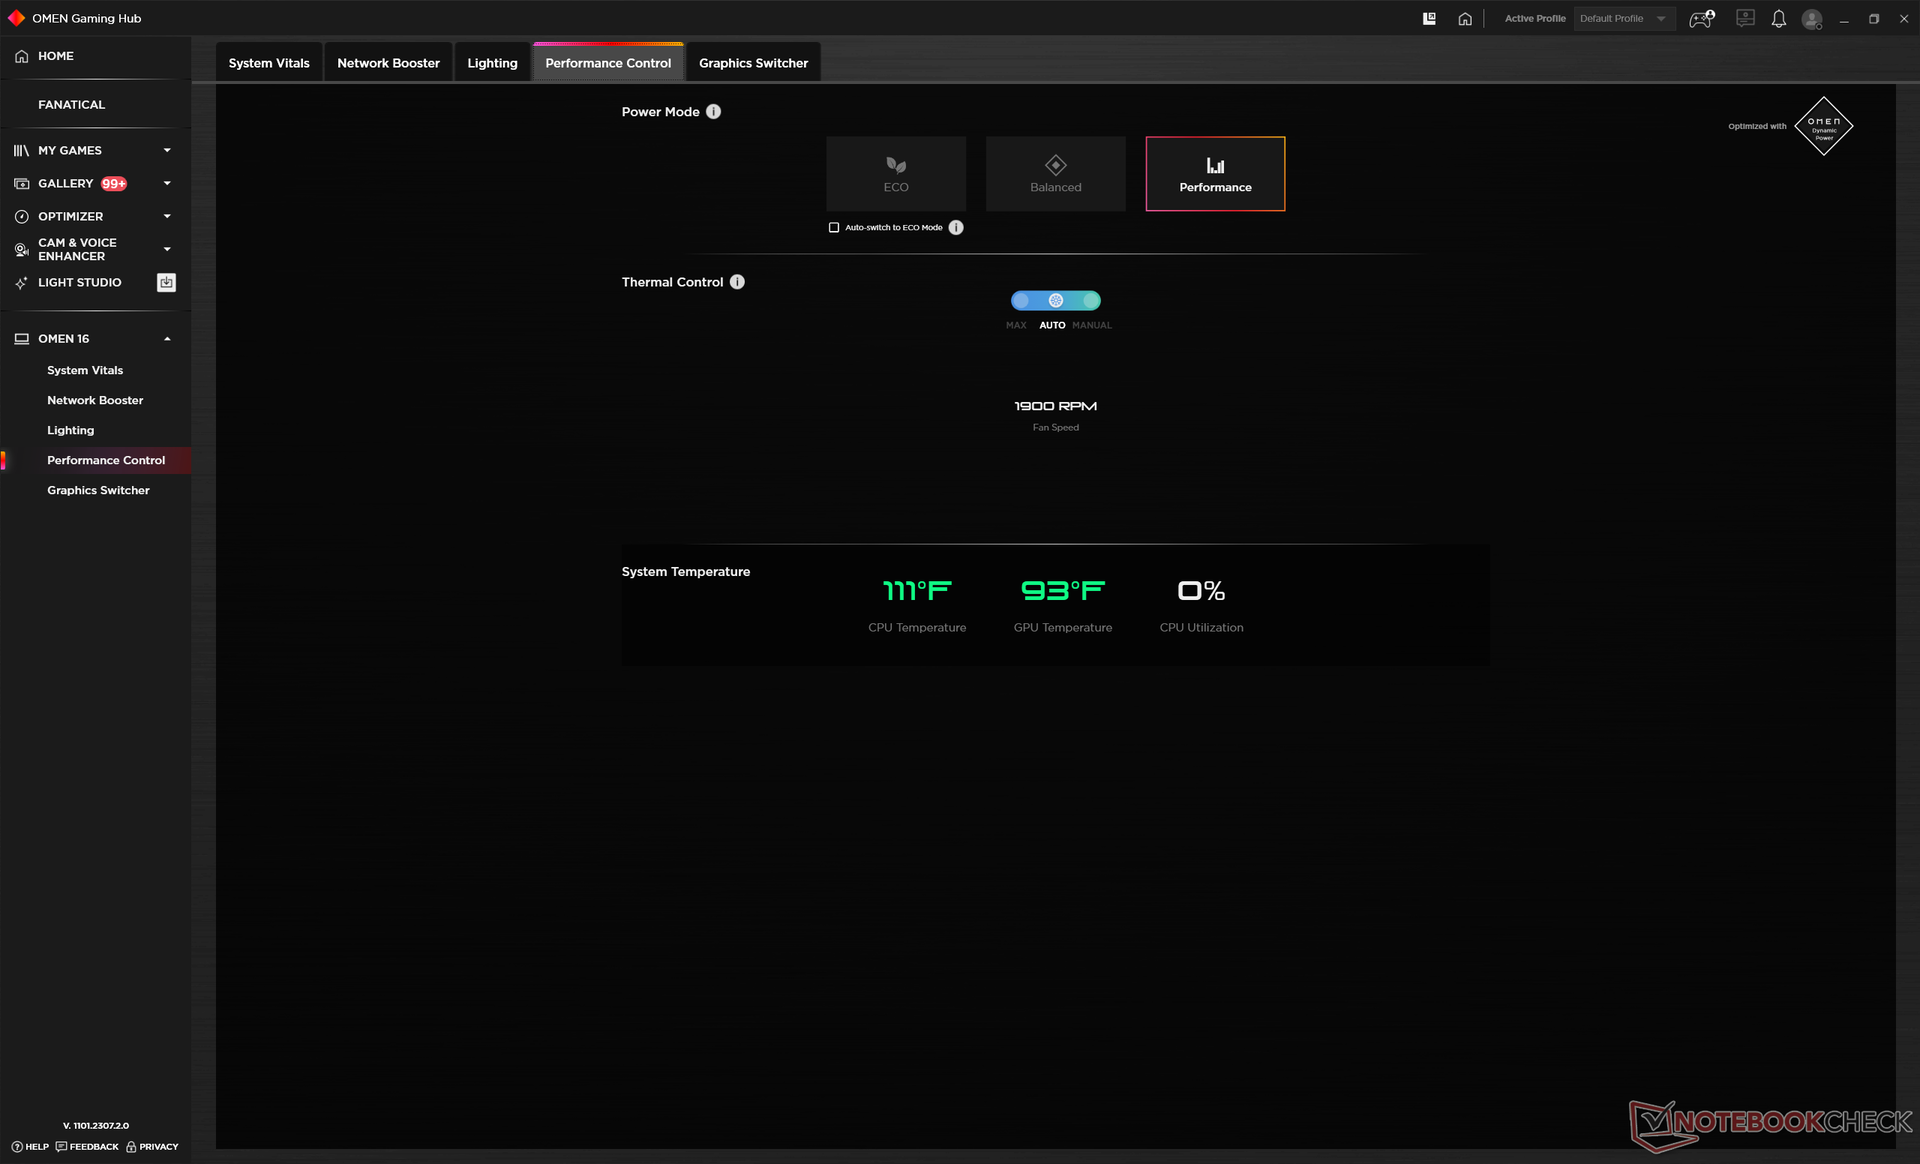
Abbiamo impostato la nostra unità in modalità Performance tramite Windows e di nuovo in modalità Performance tramite il software Omen Gaming Hub prima di eseguire i benchmark qui sotto. Purtroppo, la regolazione di un'impostazione del profilo energetico non regola automaticamente l'altra.
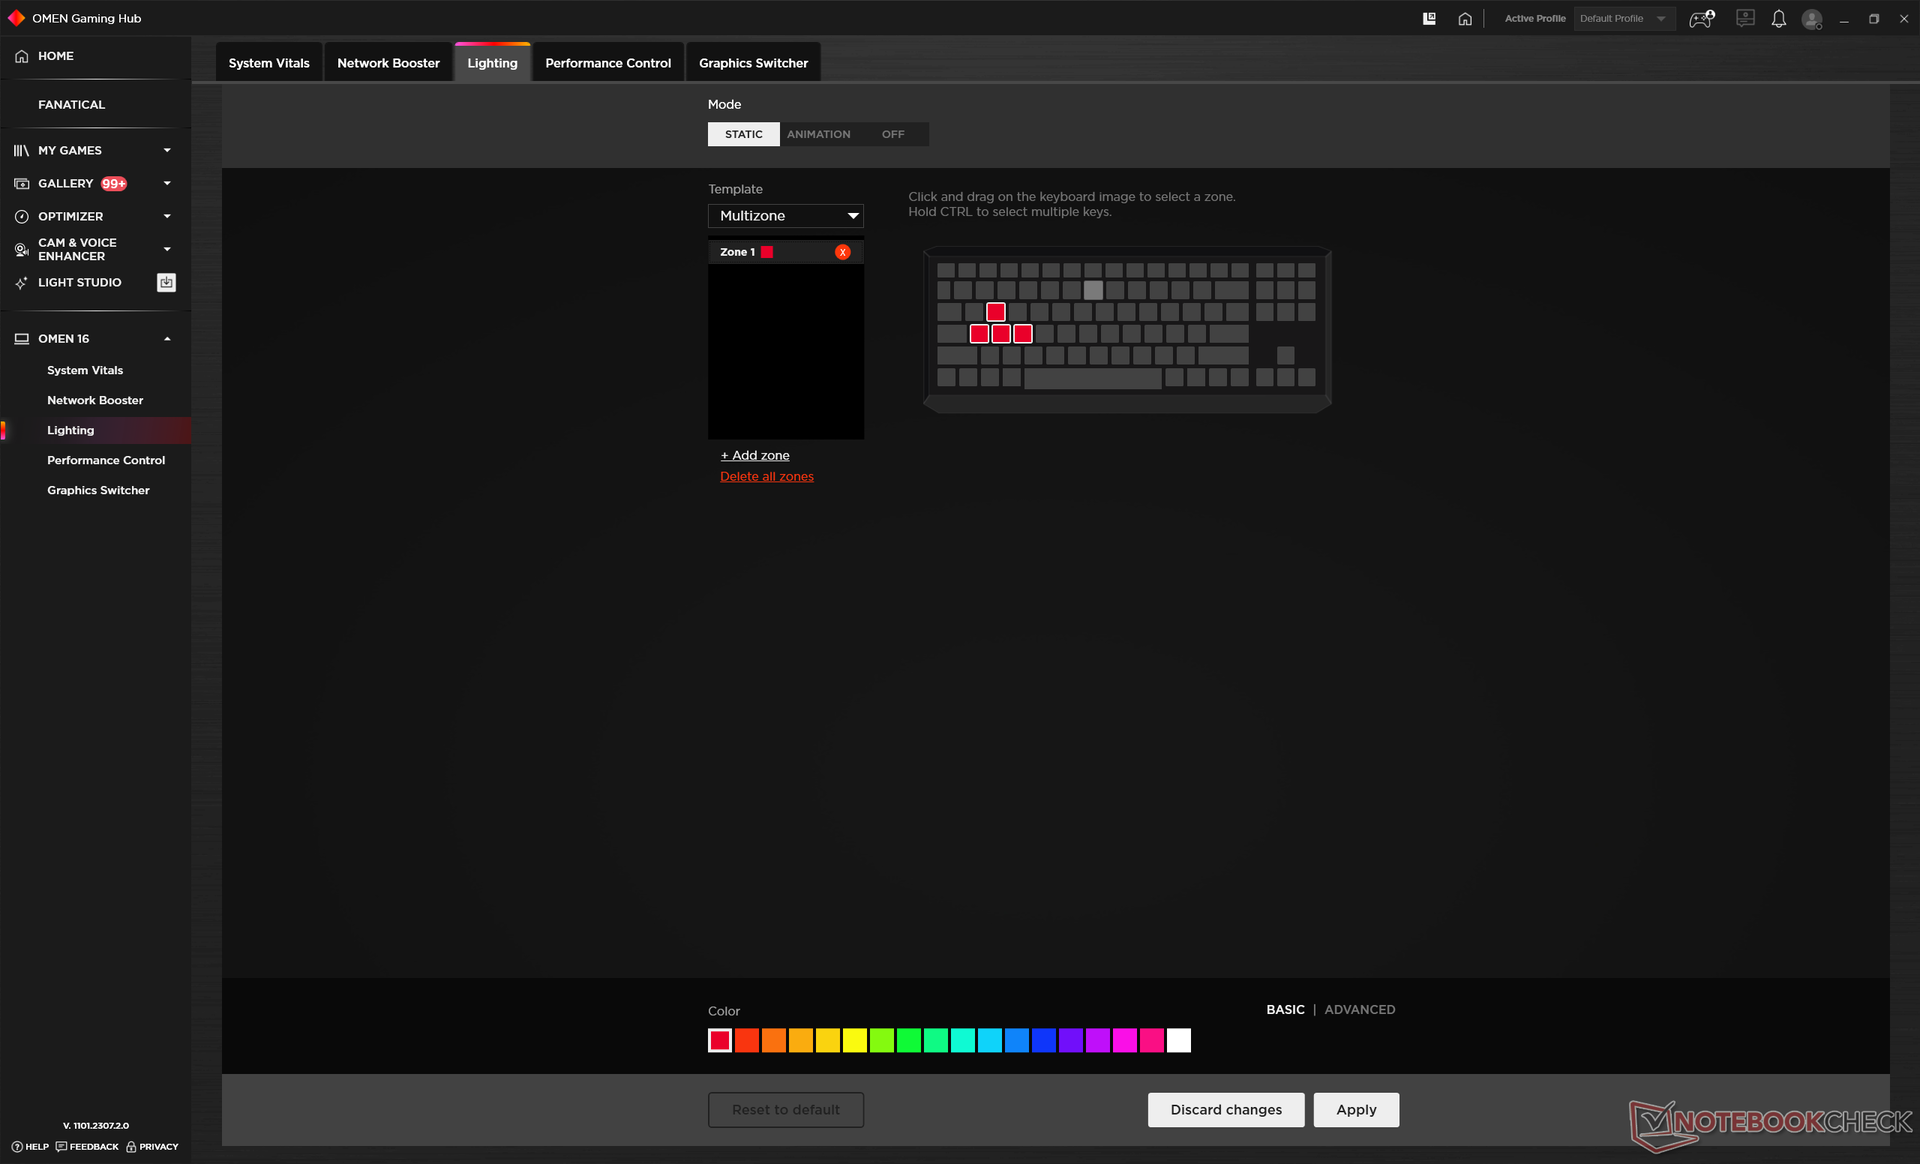
L'interruttore MUX è accessibile tramite Omen Gaming Hub, come mostrano gli screenshot qui sotto. Pertanto, si consiglia vivamente ai possessori di familiarizzare con il software, poiché qui si attivano le funzioni chiave. I profili delle prestazioni sono sepolti in diversi sottomenu, un altro aspetto fastidioso del software.
Optimus avanzato o Optimus 2.0 non sono supportati. È quindi necessario un riavvio soft quando si passa dalla iGPU alla dGPU. G-Sync è supportato sul display interno.

Processore
IlCore i9-13900HX dell'Omen Transcend 16 è più lento del 5-10% rispetto alla media dei portatili del nostro database dotati dello stesso processore. Un esempio estremo è il Lenovo Legion Pro 7 che può essere fino al 20% più veloce del nostro HP, anche se entrambi sono dotati di Core i9-13900HX. Il nostro Omen Transcend 16 è ancora uno dei portatili da gioco più veloci sul mercato, ma le prestazioni del processore avrebbero potuto essere un po' più veloci, in base a quanto abbiamo fatto con altri modelli da gioco di fascia alta.
Per il resto, la stabilità delle prestazioni è eccellente, senza problemi di throttling durante l'esecuzione di CineBench R15 xT in loop.
Cinebench R15 Multi Loop
Cinebench R23: Multi Core | Single Core
Cinebench R20: CPU (Multi Core) | CPU (Single Core)
Cinebench R15: CPU Multi 64Bit | CPU Single 64Bit
Blender: v2.79 BMW27 CPU
7-Zip 18.03: 7z b 4 | 7z b 4 -mmt1
Geekbench 5.5: Multi-Core | Single-Core
HWBOT x265 Benchmark v2.2: 4k Preset
LibreOffice : 20 Documents To PDF
R Benchmark 2.5: Overall mean
| Blender / v2.79 BMW27 CPU | |
| Dell Inspiron 16 Plus 7610-MHJ8F | |
| HP Omen 16-n0033dx | |
| Acer Nitro 16 AN16-41 | |
| Lenovo Legion S7 16ARHA7 | |
| Asus ROG Zephyrus M16 GU603Z | |
| Lenovo Legion Pro 5 16ARX8 | |
| HP Omen Transcend 16 | |
| Media Intel Core i9-13900HX (101 - 153, n=22) | |
| Asus Zephyrus Duo 16 GX650PY-NM006W | |
* ... Meglio usare valori piccoli
AIDA64: FP32 Ray-Trace | FPU Julia | CPU SHA3 | CPU Queen | FPU SinJulia | FPU Mandel | CPU AES | CPU ZLib | FP64 Ray-Trace | CPU PhotoWorxx
| Performance rating | |
| Media Intel Core i9-13900HX | |
| HP Omen Transcend 16 | |
| Alienware x16 R1 | |
| HP Omen 16-wf000 | |
| Lenovo Legion Slim 7i 16 Gen 8 | |
| Acer Nitro 16 AN16-41 | |
| Asus ROG Zephyrus M16 GU603Z | |
| AIDA64 / FP32 Ray-Trace | |
| Media Intel Core i9-13900HX (17589 - 27615, n=22) | |
| HP Omen Transcend 16 | |
| HP Omen 16-wf000 | |
| Alienware x16 R1 | |
| Lenovo Legion Slim 7i 16 Gen 8 | |
| Acer Nitro 16 AN16-41 | |
| Asus ROG Zephyrus M16 GU603Z | |
| AIDA64 / FPU Julia | |
| Media Intel Core i9-13900HX (88686 - 137015, n=22) | |
| HP Omen Transcend 16 | |
| Acer Nitro 16 AN16-41 | |
| HP Omen 16-wf000 | |
| Alienware x16 R1 | |
| Lenovo Legion Slim 7i 16 Gen 8 | |
| Asus ROG Zephyrus M16 GU603Z | |
| AIDA64 / CPU SHA3 | |
| Media Intel Core i9-13900HX (4362 - 7029, n=22) | |
| HP Omen Transcend 16 | |
| HP Omen 16-wf000 | |
| Alienware x16 R1 | |
| Lenovo Legion Slim 7i 16 Gen 8 | |
| Asus ROG Zephyrus M16 GU603Z | |
| Acer Nitro 16 AN16-41 | |
| AIDA64 / CPU Queen | |
| Media Intel Core i9-13900HX (125644 - 141385, n=22) | |
| HP Omen Transcend 16 | |
| Lenovo Legion Slim 7i 16 Gen 8 | |
| Alienware x16 R1 | |
| Acer Nitro 16 AN16-41 | |
| Asus ROG Zephyrus M16 GU603Z | |
| HP Omen 16-wf000 | |
| AIDA64 / FPU SinJulia | |
| Media Intel Core i9-13900HX (12334 - 17179, n=22) | |
| HP Omen Transcend 16 | |
| Acer Nitro 16 AN16-41 | |
| HP Omen 16-wf000 | |
| Alienware x16 R1 | |
| Lenovo Legion Slim 7i 16 Gen 8 | |
| Asus ROG Zephyrus M16 GU603Z | |
| AIDA64 / FPU Mandel | |
| Media Intel Core i9-13900HX (43850 - 69202, n=22) | |
| HP Omen Transcend 16 | |
| Acer Nitro 16 AN16-41 | |
| HP Omen 16-wf000 | |
| Alienware x16 R1 | |
| Lenovo Legion Slim 7i 16 Gen 8 | |
| Asus ROG Zephyrus M16 GU603Z | |
| AIDA64 / CPU AES | |
| Media Intel Core i9-13900HX (89413 - 237881, n=22) | |
| Asus ROG Zephyrus M16 GU603Z | |
| HP Omen Transcend 16 | |
| HP Omen 16-wf000 | |
| Alienware x16 R1 | |
| Lenovo Legion Slim 7i 16 Gen 8 | |
| Acer Nitro 16 AN16-41 | |
| AIDA64 / CPU ZLib | |
| Media Intel Core i9-13900HX (1284 - 1958, n=22) | |
| HP Omen Transcend 16 | |
| HP Omen 16-wf000 | |
| Lenovo Legion Slim 7i 16 Gen 8 | |
| Alienware x16 R1 | |
| Asus ROG Zephyrus M16 GU603Z | |
| Acer Nitro 16 AN16-41 | |
| AIDA64 / FP64 Ray-Trace | |
| Media Intel Core i9-13900HX (9481 - 15279, n=22) | |
| HP Omen Transcend 16 | |
| HP Omen 16-wf000 | |
| Alienware x16 R1 | |
| Lenovo Legion Slim 7i 16 Gen 8 | |
| Acer Nitro 16 AN16-41 | |
| Asus ROG Zephyrus M16 GU603Z | |
| AIDA64 / CPU PhotoWorxx | |
| HP Omen Transcend 16 | |
| Alienware x16 R1 | |
| Media Intel Core i9-13900HX (42994 - 51994, n=22) | |
| Asus ROG Zephyrus M16 GU603Z | |
| HP Omen 16-wf000 | |
| Acer Nitro 16 AN16-41 | |
| Lenovo Legion Slim 7i 16 Gen 8 | |
Prestazioni del sistema
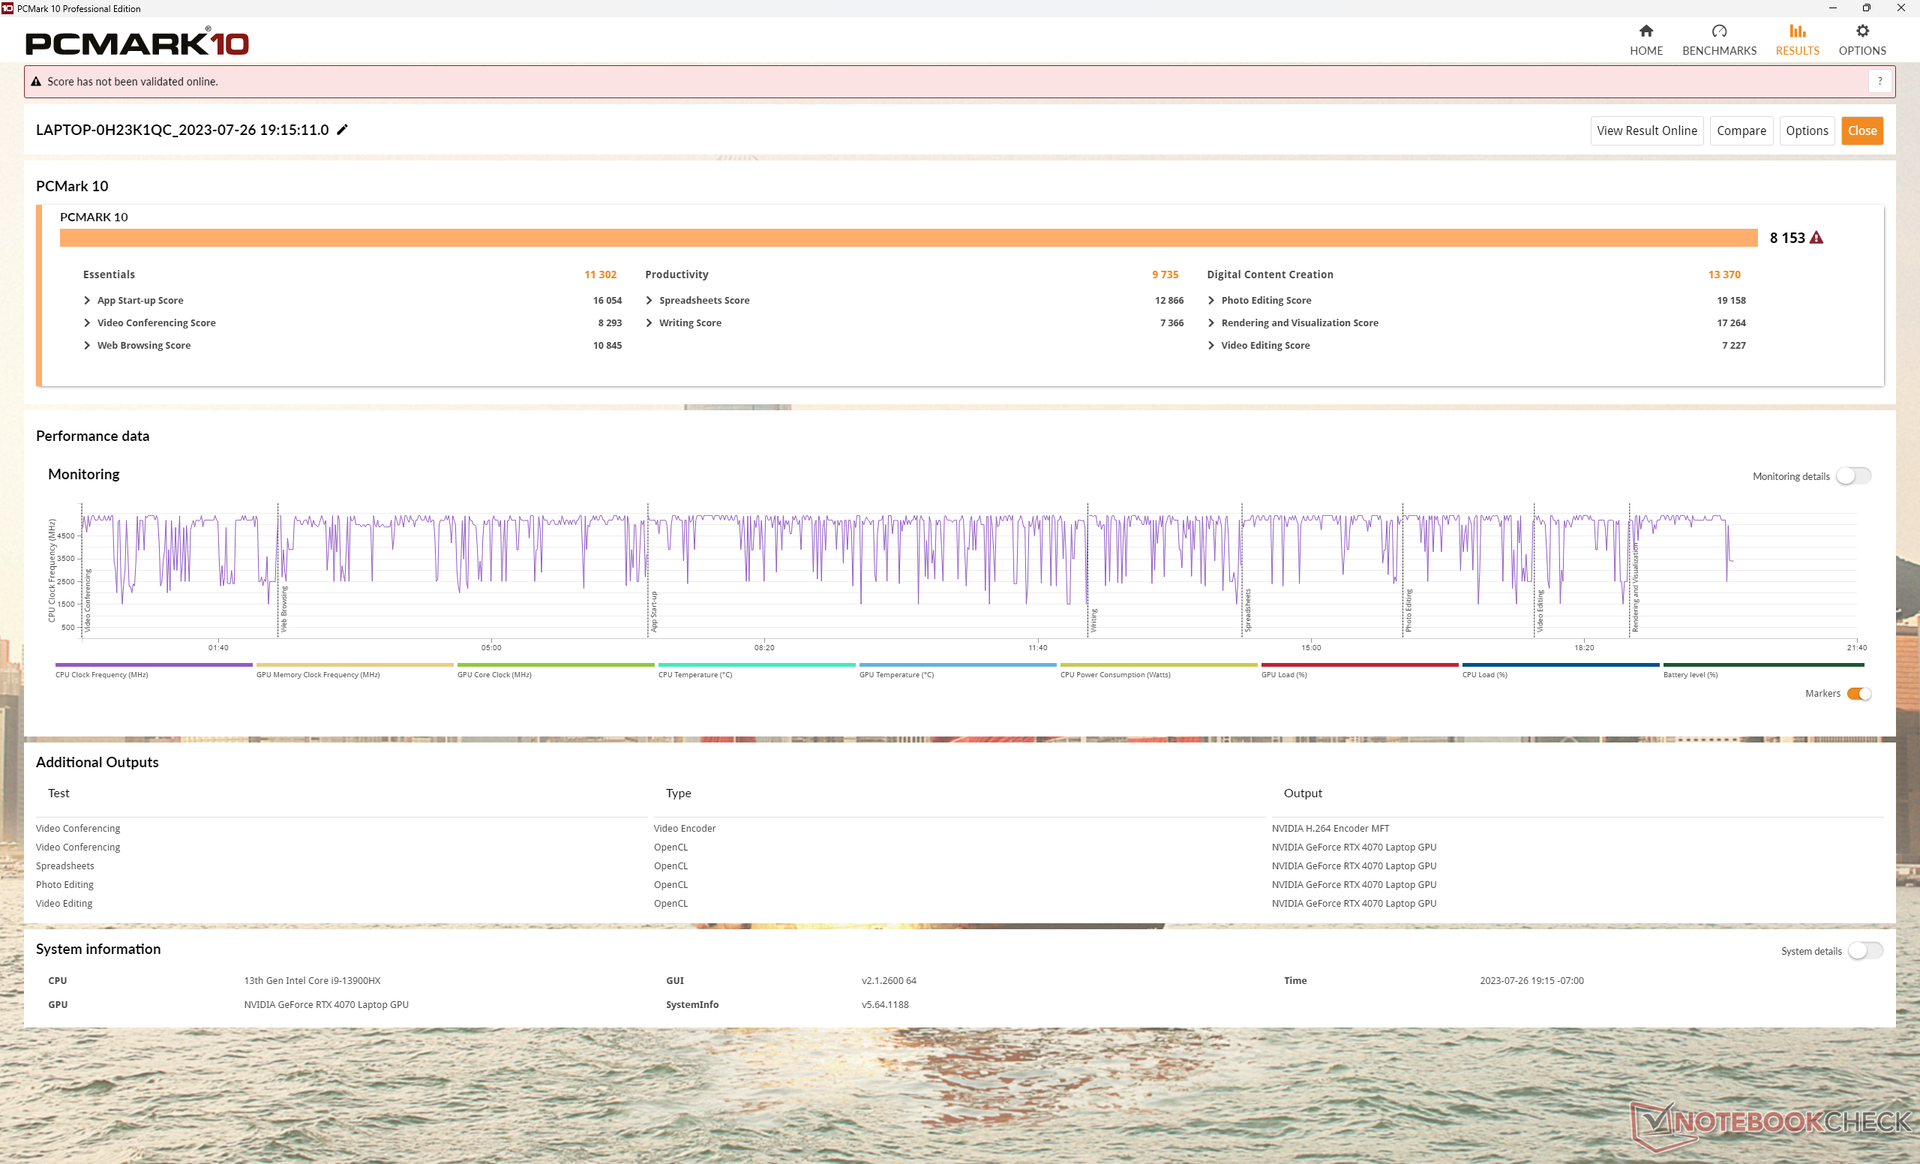
I risultati di PCMark sono leggermente superiori a quelli dell'Omen 16 con RTX 4080, tranne che nella Creazione di contenuti digitali, a causa della RTX 4070 più lenta. Non abbiamo riscontrato problemi di wake-from-sleep o BSOD, a differenza di quanto accaduto con il nostro recente Lenovo Slim Pro 9i 16.
CrossMark: Overall | Productivity | Creativity | Responsiveness
| PCMark 10 / Score | |
| Lenovo Legion Slim 7i 16 Gen 8 | |
| Alienware x16 R1 | |
| HP Omen Transcend 16 | |
| Asus ROG Zephyrus M16 GU603Z | |
| HP Omen 16-wf000 | |
| Media Intel Core i9-13900HX, NVIDIA GeForce RTX 4070 Laptop GPU (6956 - 8153, n=3) | |
| Acer Nitro 16 AN16-41 | |
| PCMark 10 / Essentials | |
| Lenovo Legion Slim 7i 16 Gen 8 | |
| HP Omen Transcend 16 | |
| Alienware x16 R1 | |
| Media Intel Core i9-13900HX, NVIDIA GeForce RTX 4070 Laptop GPU (9865 - 11653, n=3) | |
| Asus ROG Zephyrus M16 GU603Z | |
| Acer Nitro 16 AN16-41 | |
| HP Omen 16-wf000 | |
| PCMark 10 / Productivity | |
| Lenovo Legion Slim 7i 16 Gen 8 | |
| Asus ROG Zephyrus M16 GU603Z | |
| Alienware x16 R1 | |
| HP Omen Transcend 16 | |
| Media Intel Core i9-13900HX, NVIDIA GeForce RTX 4070 Laptop GPU (9470 - 9850, n=3) | |
| Acer Nitro 16 AN16-41 | |
| HP Omen 16-wf000 | |
| PCMark 10 / Digital Content Creation | |
| Alienware x16 R1 | |
| Lenovo Legion Slim 7i 16 Gen 8 | |
| HP Omen 16-wf000 | |
| HP Omen Transcend 16 | |
| Asus ROG Zephyrus M16 GU603Z | |
| Media Intel Core i9-13900HX, NVIDIA GeForce RTX 4070 Laptop GPU (9776 - 13370, n=3) | |
| Acer Nitro 16 AN16-41 | |
| CrossMark / Overall | |
| Lenovo Legion Slim 7i 16 Gen 8 | |
| HP Omen Transcend 16 | |
| Media Intel Core i9-13900HX, NVIDIA GeForce RTX 4070 Laptop GPU (1842 - 2029, n=3) | |
| Alienware x16 R1 | |
| Asus ROG Zephyrus M16 GU603Z | |
| HP Omen 16-wf000 | |
| Acer Nitro 16 AN16-41 | |
| CrossMark / Productivity | |
| Lenovo Legion Slim 7i 16 Gen 8 | |
| Alienware x16 R1 | |
| HP Omen Transcend 16 | |
| Asus ROG Zephyrus M16 GU603Z | |
| Media Intel Core i9-13900HX, NVIDIA GeForce RTX 4070 Laptop GPU (1700 - 1872, n=3) | |
| HP Omen 16-wf000 | |
| Acer Nitro 16 AN16-41 | |
| CrossMark / Creativity | |
| HP Omen Transcend 16 | |
| Media Intel Core i9-13900HX, NVIDIA GeForce RTX 4070 Laptop GPU (2088 - 2316, n=3) | |
| Lenovo Legion Slim 7i 16 Gen 8 | |
| Alienware x16 R1 | |
| Asus ROG Zephyrus M16 GU603Z | |
| HP Omen 16-wf000 | |
| Acer Nitro 16 AN16-41 | |
| CrossMark / Responsiveness | |
| Alienware x16 R1 | |
| Lenovo Legion Slim 7i 16 Gen 8 | |
| Asus ROG Zephyrus M16 GU603Z | |
| Media Intel Core i9-13900HX, NVIDIA GeForce RTX 4070 Laptop GPU (1557 - 1752, n=3) | |
| HP Omen Transcend 16 | |
| HP Omen 16-wf000 | |
| Acer Nitro 16 AN16-41 | |
| PCMark 10 Score | 8153 punti | |
Aiuto | ||
| AIDA64 / Memory Copy | |
| HP Omen Transcend 16 | |
| Media Intel Core i9-13900HX (67716 - 79193, n=22) | |
| Alienware x16 R1 | |
| HP Omen 16-wf000 | |
| Asus ROG Zephyrus M16 GU603Z | |
| Acer Nitro 16 AN16-41 | |
| Lenovo Legion Slim 7i 16 Gen 8 | |
| AIDA64 / Memory Read | |
| HP Omen Transcend 16 | |
| Media Intel Core i9-13900HX (73998 - 88462, n=22) | |
| Alienware x16 R1 | |
| HP Omen 16-wf000 | |
| Asus ROG Zephyrus M16 GU603Z | |
| Acer Nitro 16 AN16-41 | |
| Lenovo Legion Slim 7i 16 Gen 8 | |
| AIDA64 / Memory Write | |
| Alienware x16 R1 | |
| HP Omen Transcend 16 | |
| Media Intel Core i9-13900HX (65472 - 77045, n=22) | |
| HP Omen 16-wf000 | |
| Asus ROG Zephyrus M16 GU603Z | |
| Acer Nitro 16 AN16-41 | |
| Lenovo Legion Slim 7i 16 Gen 8 | |
| AIDA64 / Memory Latency | |
| Alienware x16 R1 | |
| Acer Nitro 16 AN16-41 | |
| Asus ROG Zephyrus M16 GU603Z | |
| HP Omen Transcend 16 | |
| HP Omen 16-wf000 | |
| Media Intel Core i9-13900HX (75.3 - 91.1, n=22) | |
| Lenovo Legion Slim 7i 16 Gen 8 | |
* ... Meglio usare valori piccoli
Latenza DPC
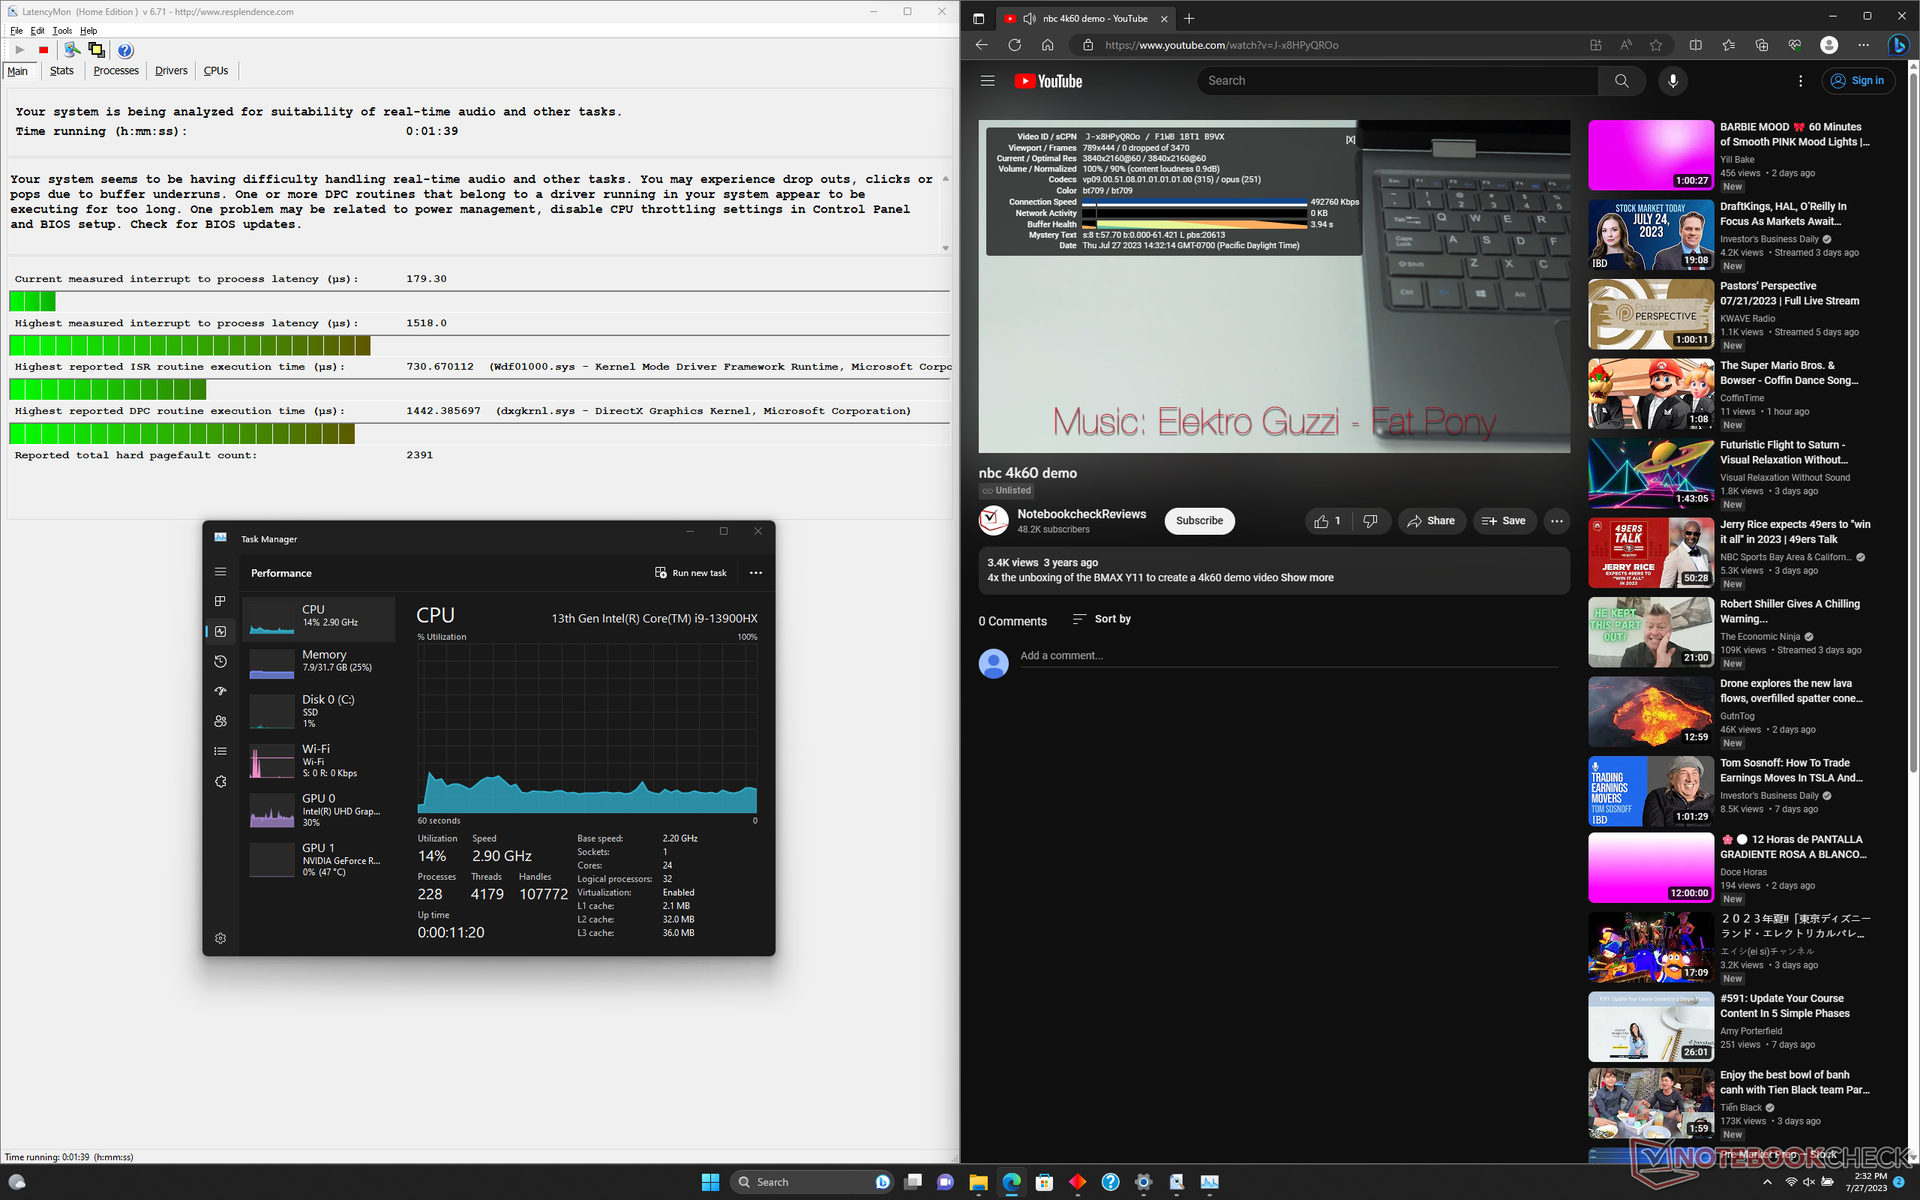
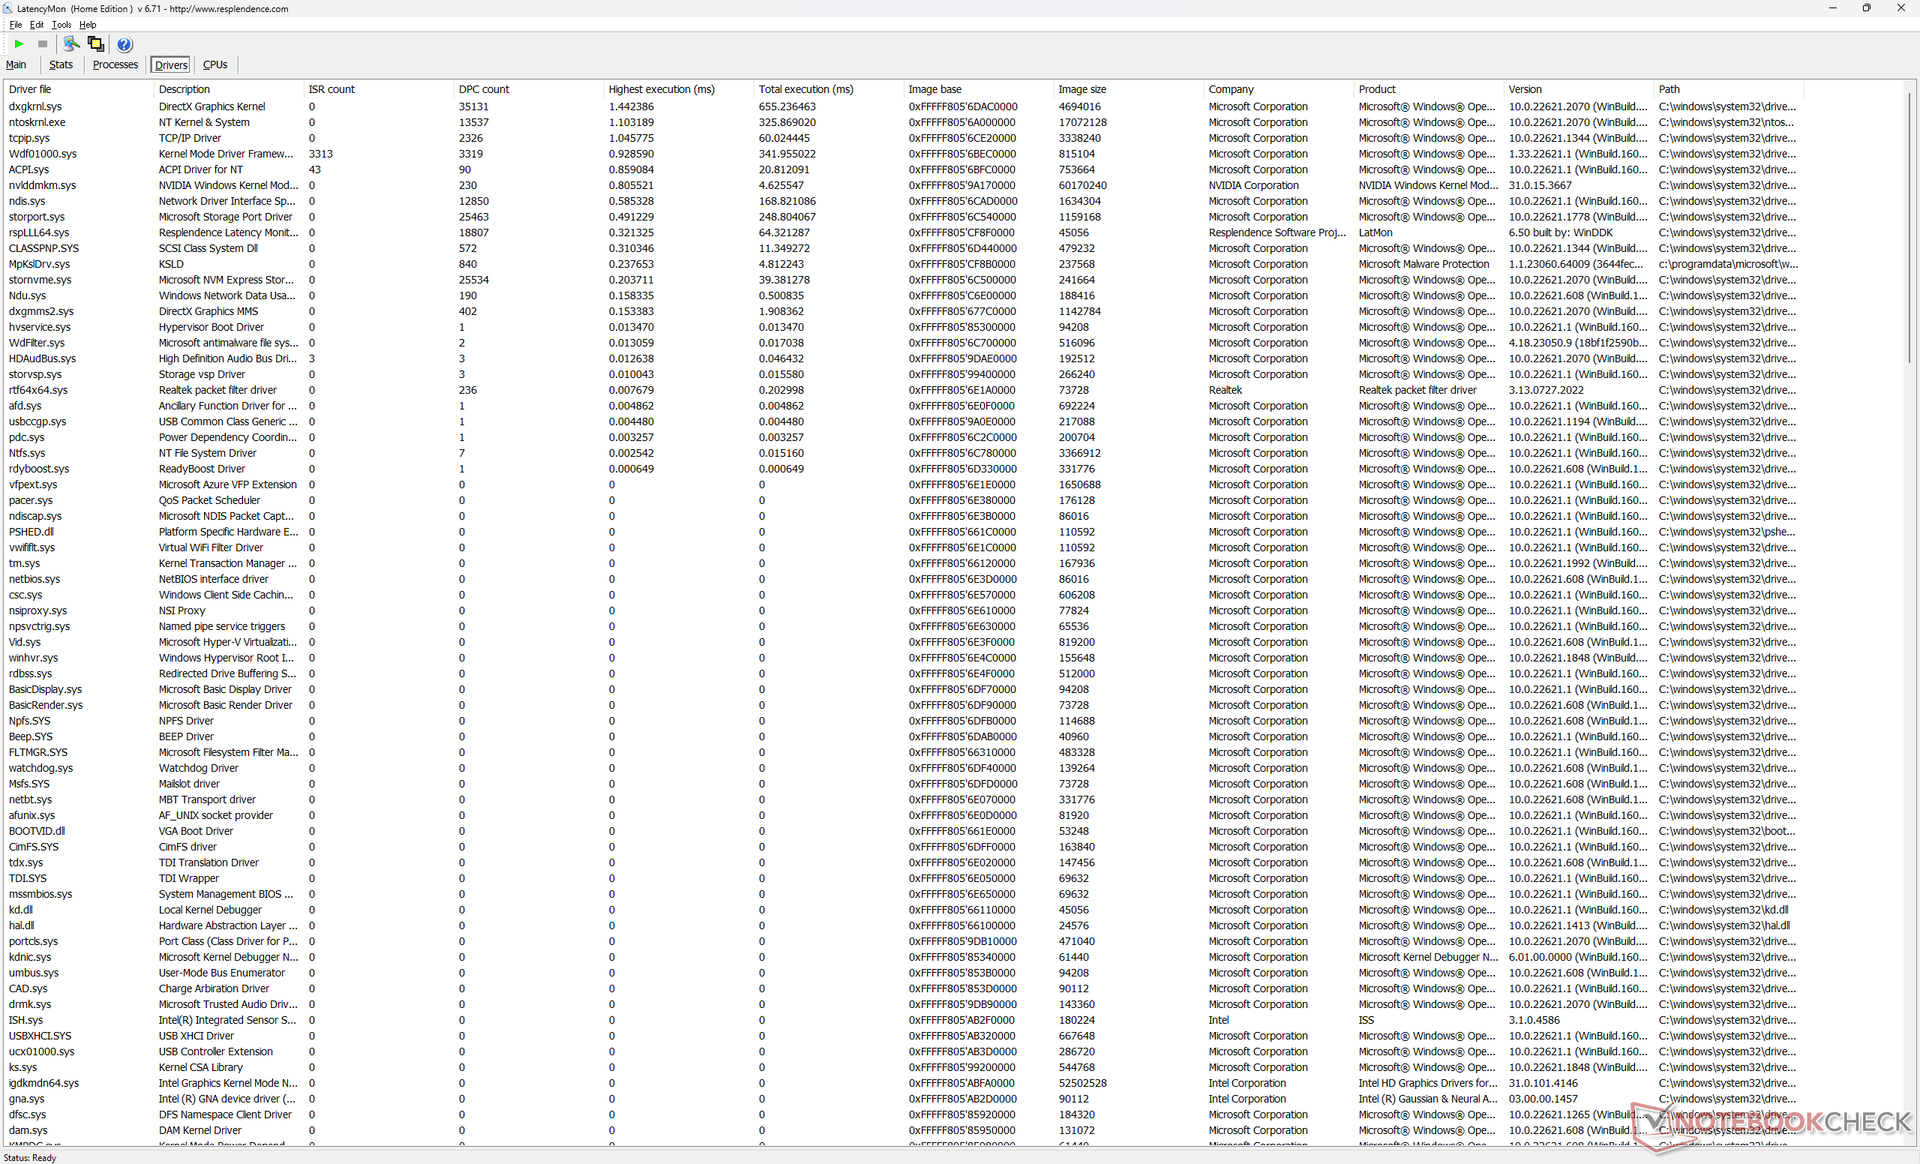
LatencyMon rivela lievi problemi di DPC quando si aprono più schede del browser della nostra homepage. la riproduzione di video 4K a 60 FPS è invece perfetta, senza alcuna caduta di fotogrammi.
| DPC Latencies / LatencyMon - interrupt to process latency (max), Web, Youtube, Prime95 | |
| Lenovo Legion Slim 7i 16 Gen 8 | |
| HP Omen 16-wf000 | |
| HP Omen Transcend 16 | |
| Alienware x16 R1 | |
| Acer Nitro 16 AN16-41 | |
| Asus ROG Zephyrus M16 GU603Z | |
* ... Meglio usare valori piccoli
Dispositivi di archiviazione
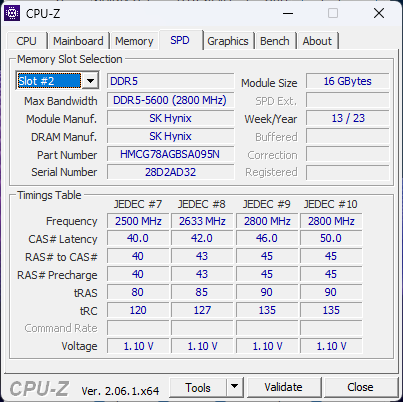
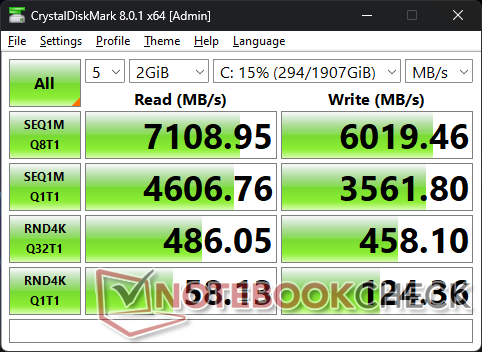
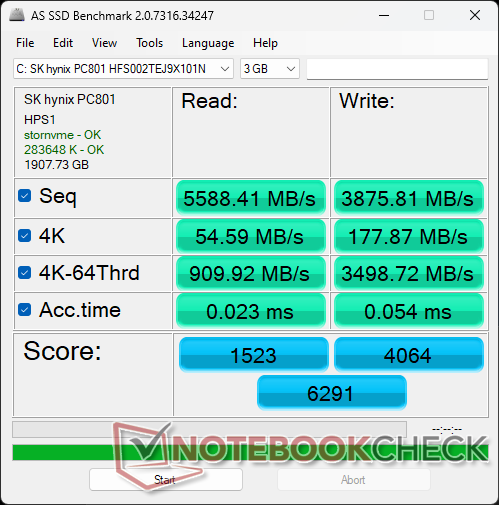
L'Omen Transcend 16 viene fornito con la stessa SK hynix PC801 Dell'Omen 16. L'unità non presenta problemi di strozzatura delle prestazioni ed è quindi in grado di sostenere un'elevata velocità di trasferimento massima di quasi 7000 MB/s senza alcun problema durante il nostro stress test.

| Drive Performance rating - Percent | |
| Alienware x16 R1 | |
| Lenovo Legion Slim 7i 16 Gen 8 | |
| Asus ROG Zephyrus M16 GU603Z | |
| HP Omen 16-wf000 | |
| Acer Nitro 16 AN16-41 | |
| HP Omen Transcend 16 | |
* ... Meglio usare valori piccoli
Disk Throttling: DiskSpd Read Loop, Queue Depth 8
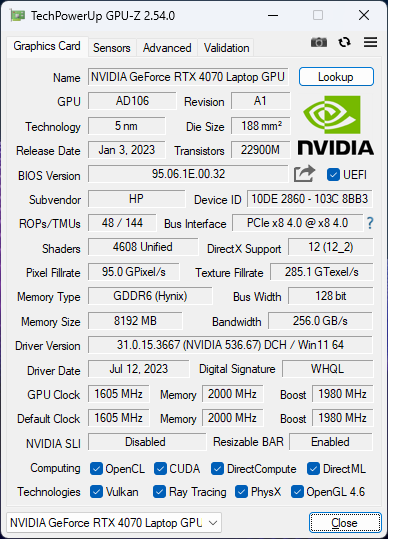
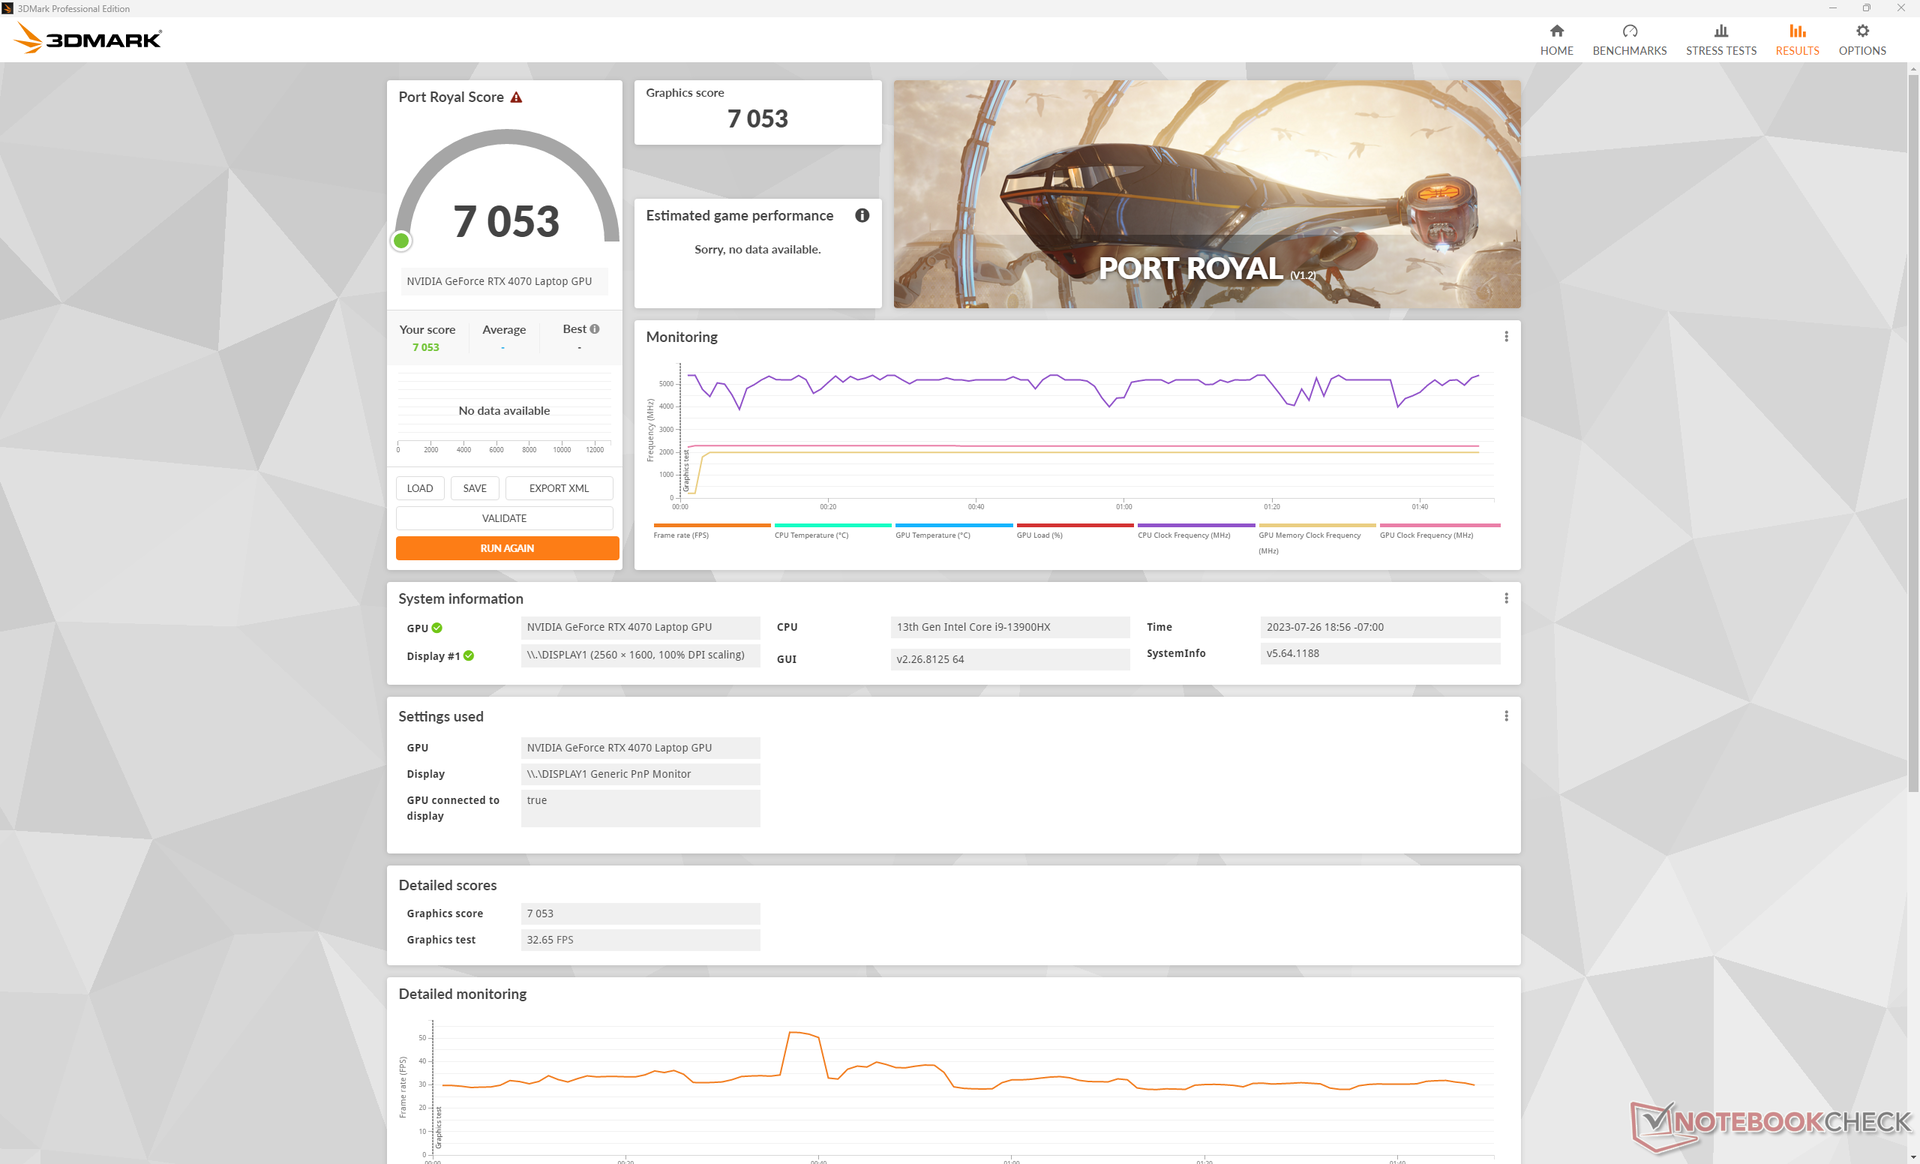
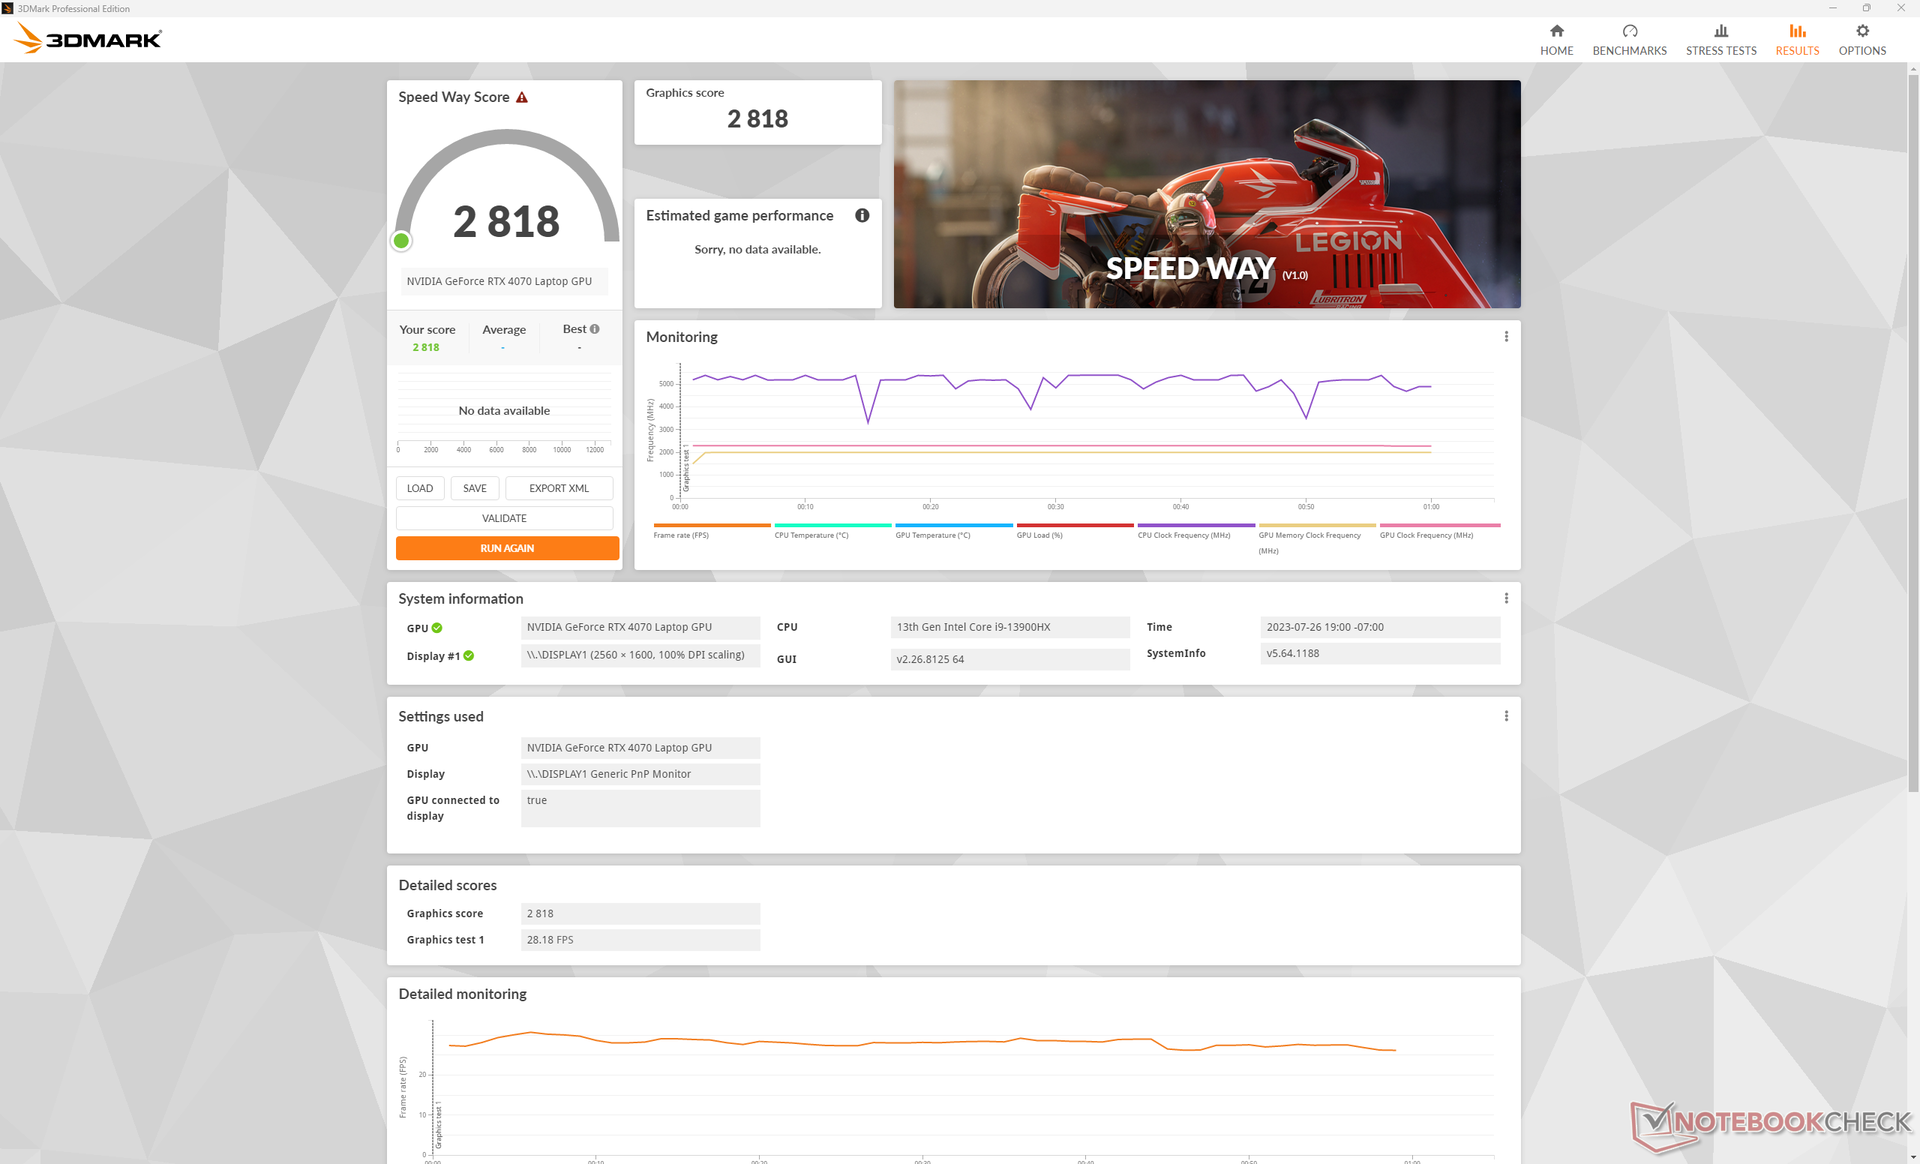
Prestazioni della GPU - GPU TGP da 130 W
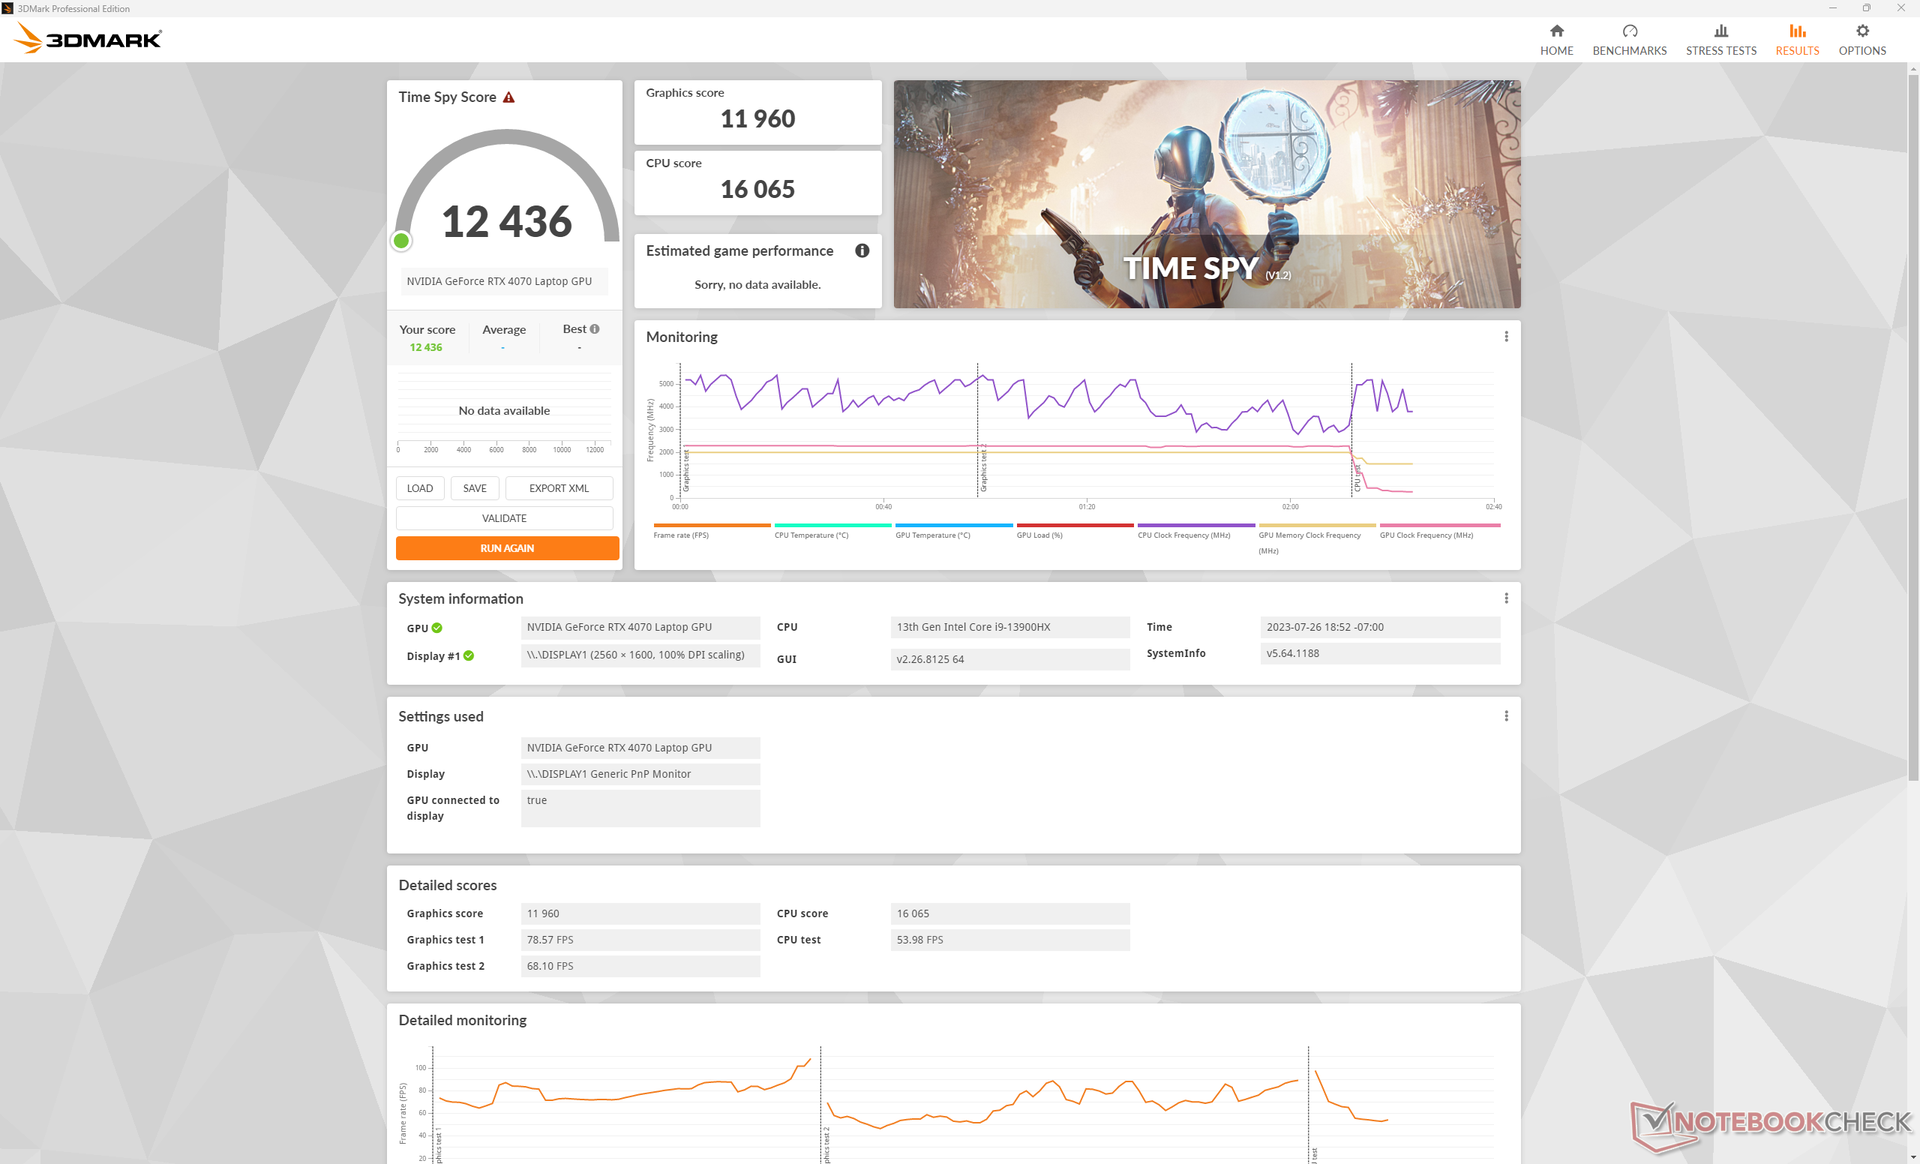
Le prestazioni grafiche sono paragonabili a quelle di un portatile medio del nostro database dotato della stessa mobile RTX 4070 GPU. Tuttavia, ilLenovo Legion Slim 7i 16 G8 con la stessa GPU è ancora circa il 10% più veloce, in parte grazie al target TGP leggermente più alto (145 W contro 130 W).
Il downgrade alla RTX 4060 Ridurrebbe le prestazioni grafiche di circa il 10-20%. Nel frattempo, la RTX 4080 può aumentare le prestazioni in modo significativo del 40-50%, ma per ora l'Omen Transcend 16 è limitato alla RTX 4070. Al contrario, il normale Omen 16 può essere configurato con opzioni GPU superiori alla RTX 4070.
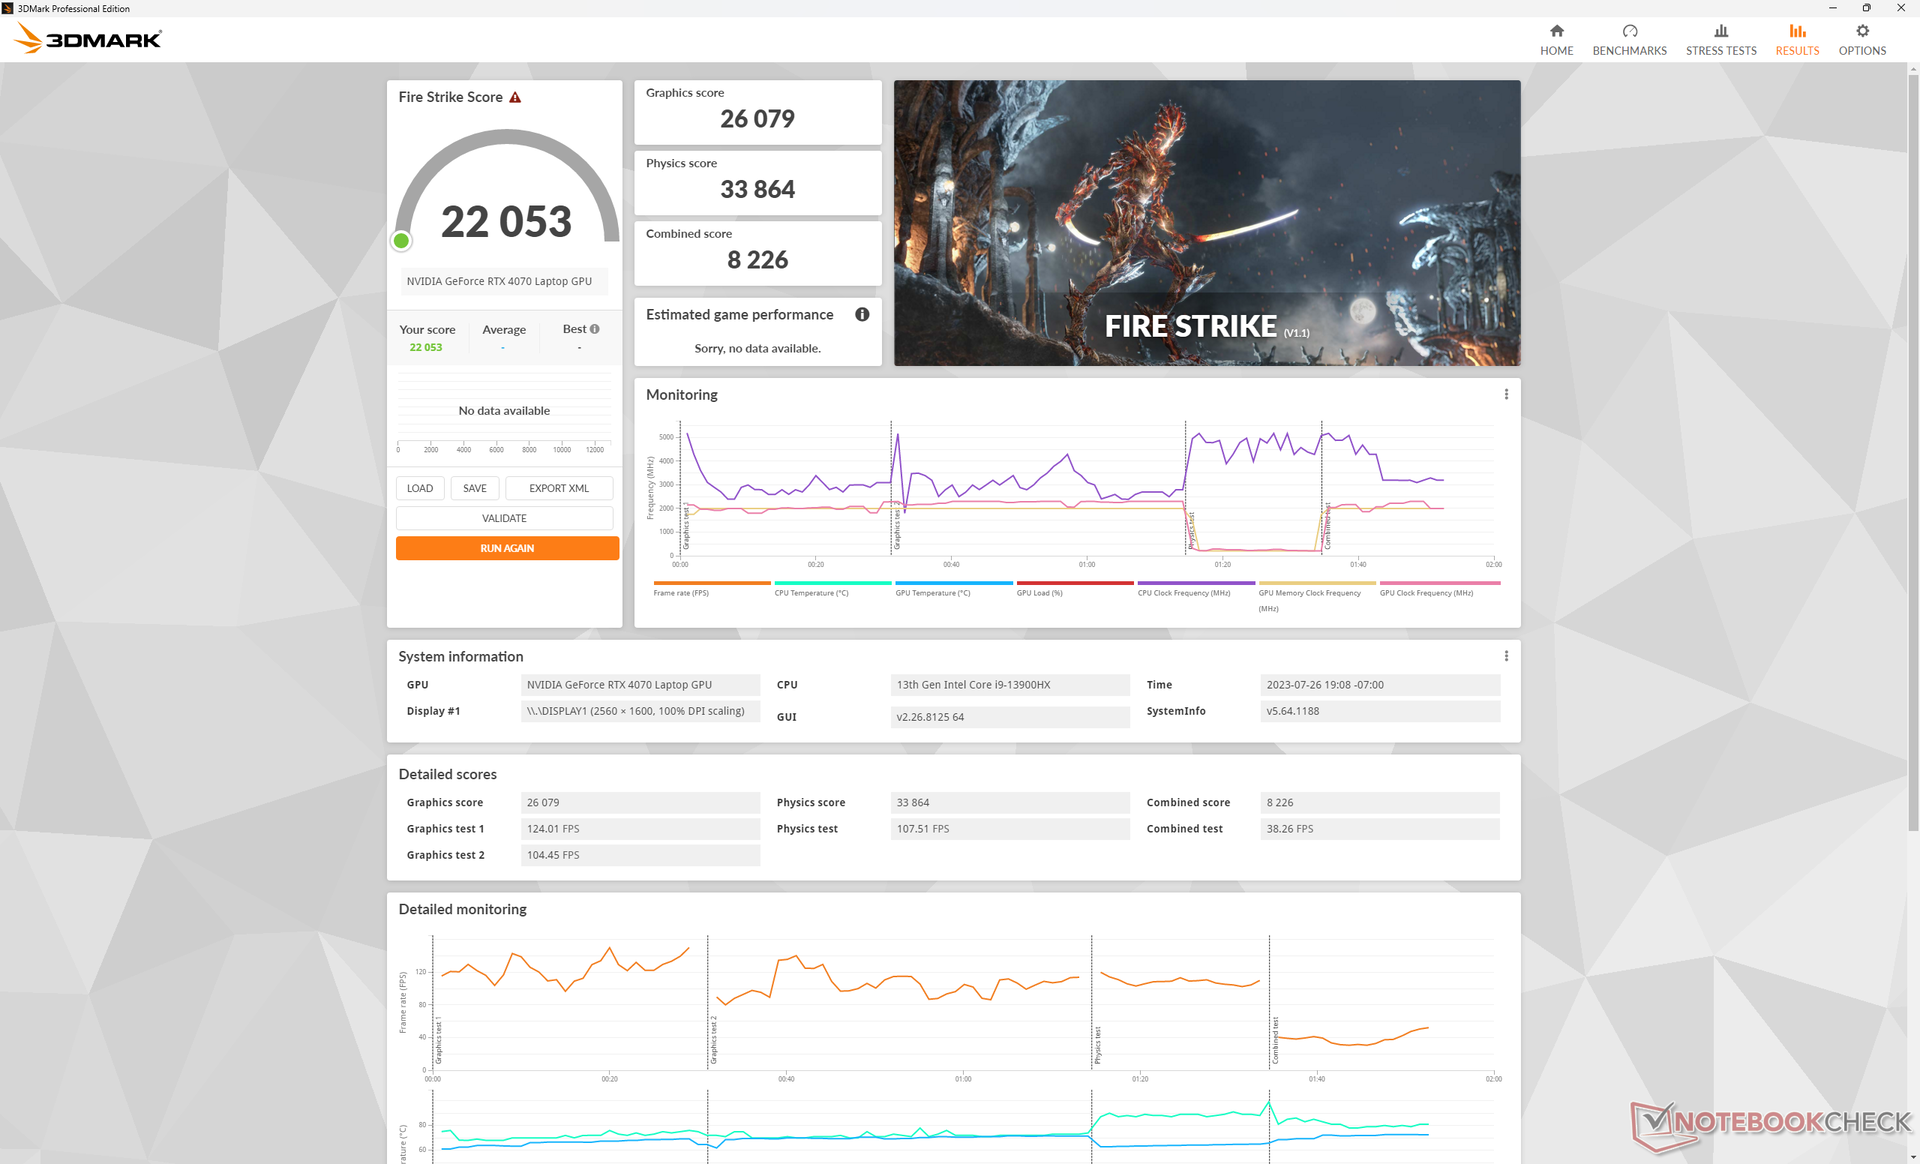
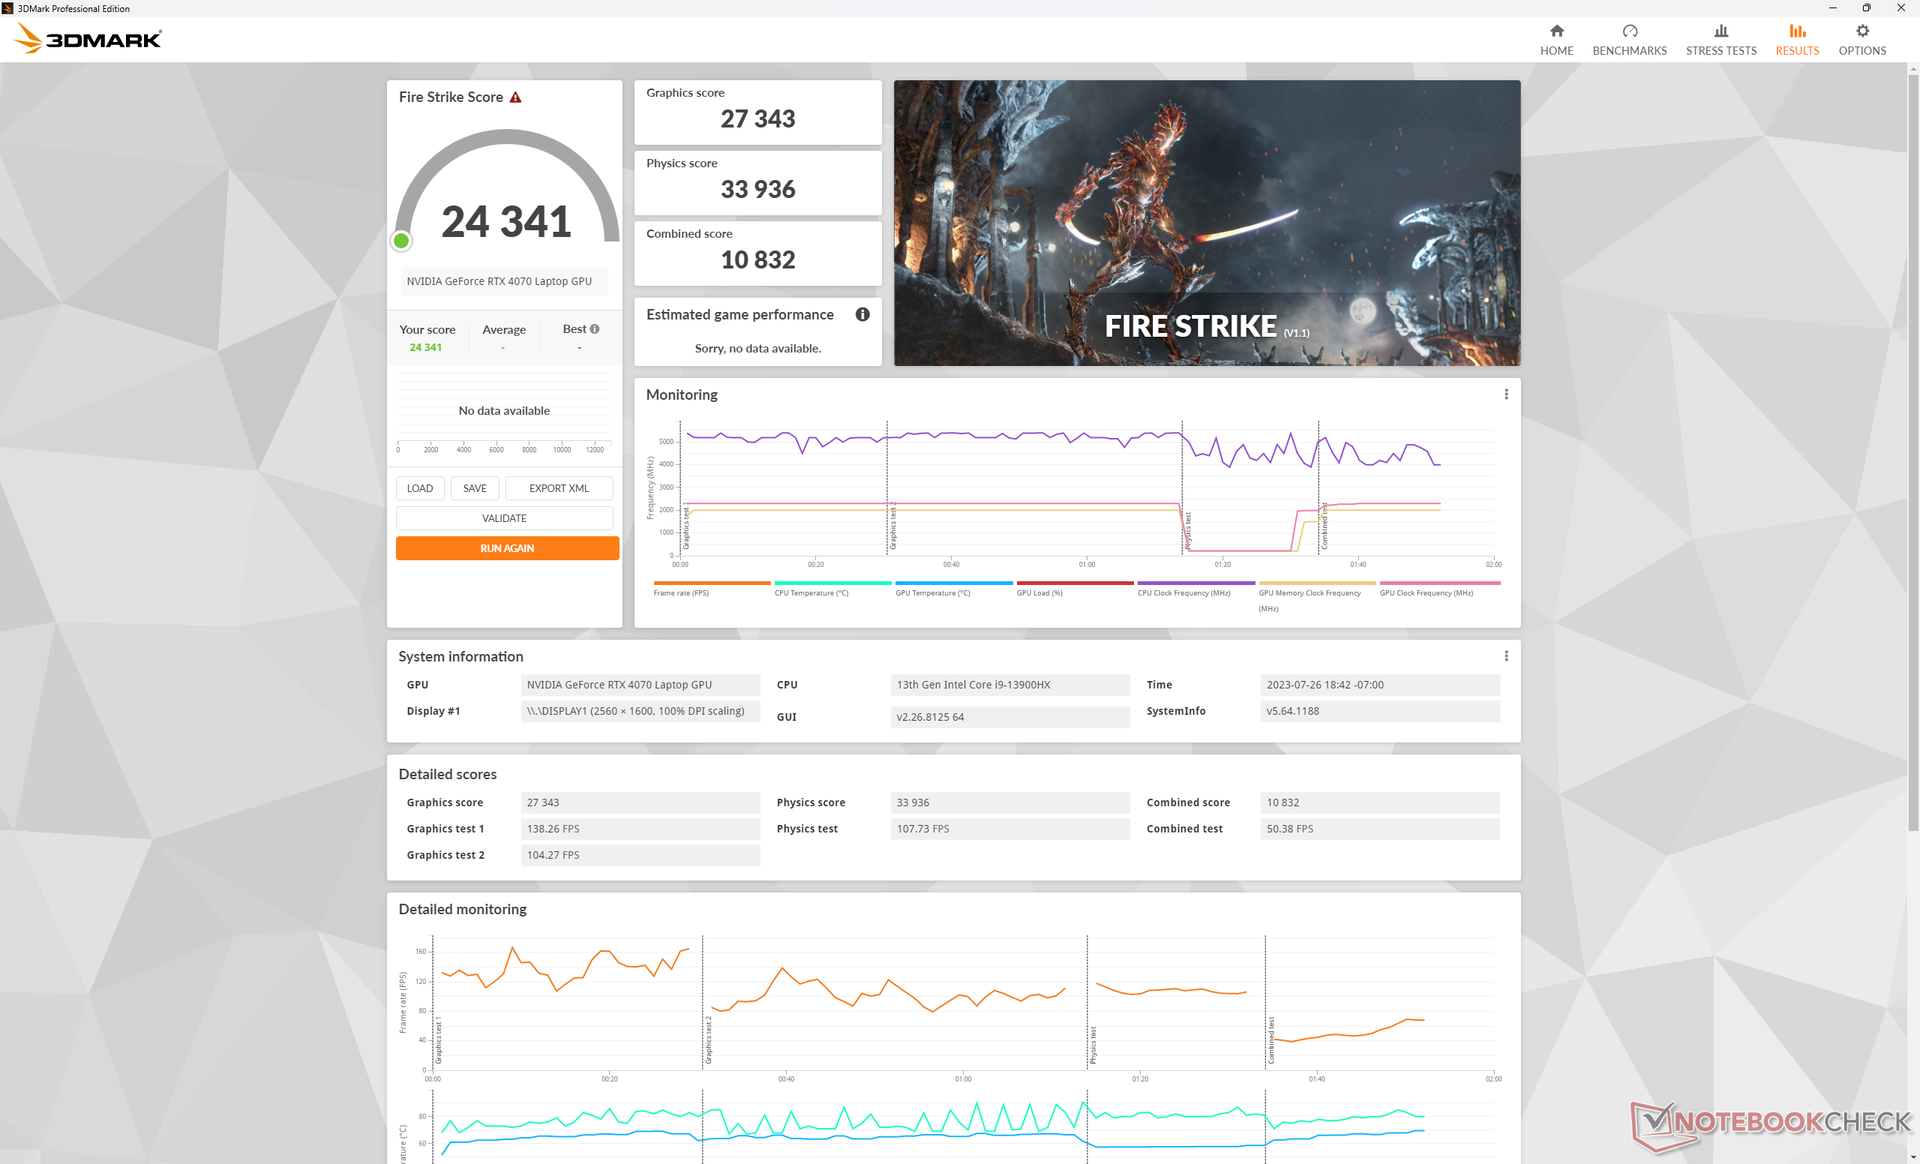
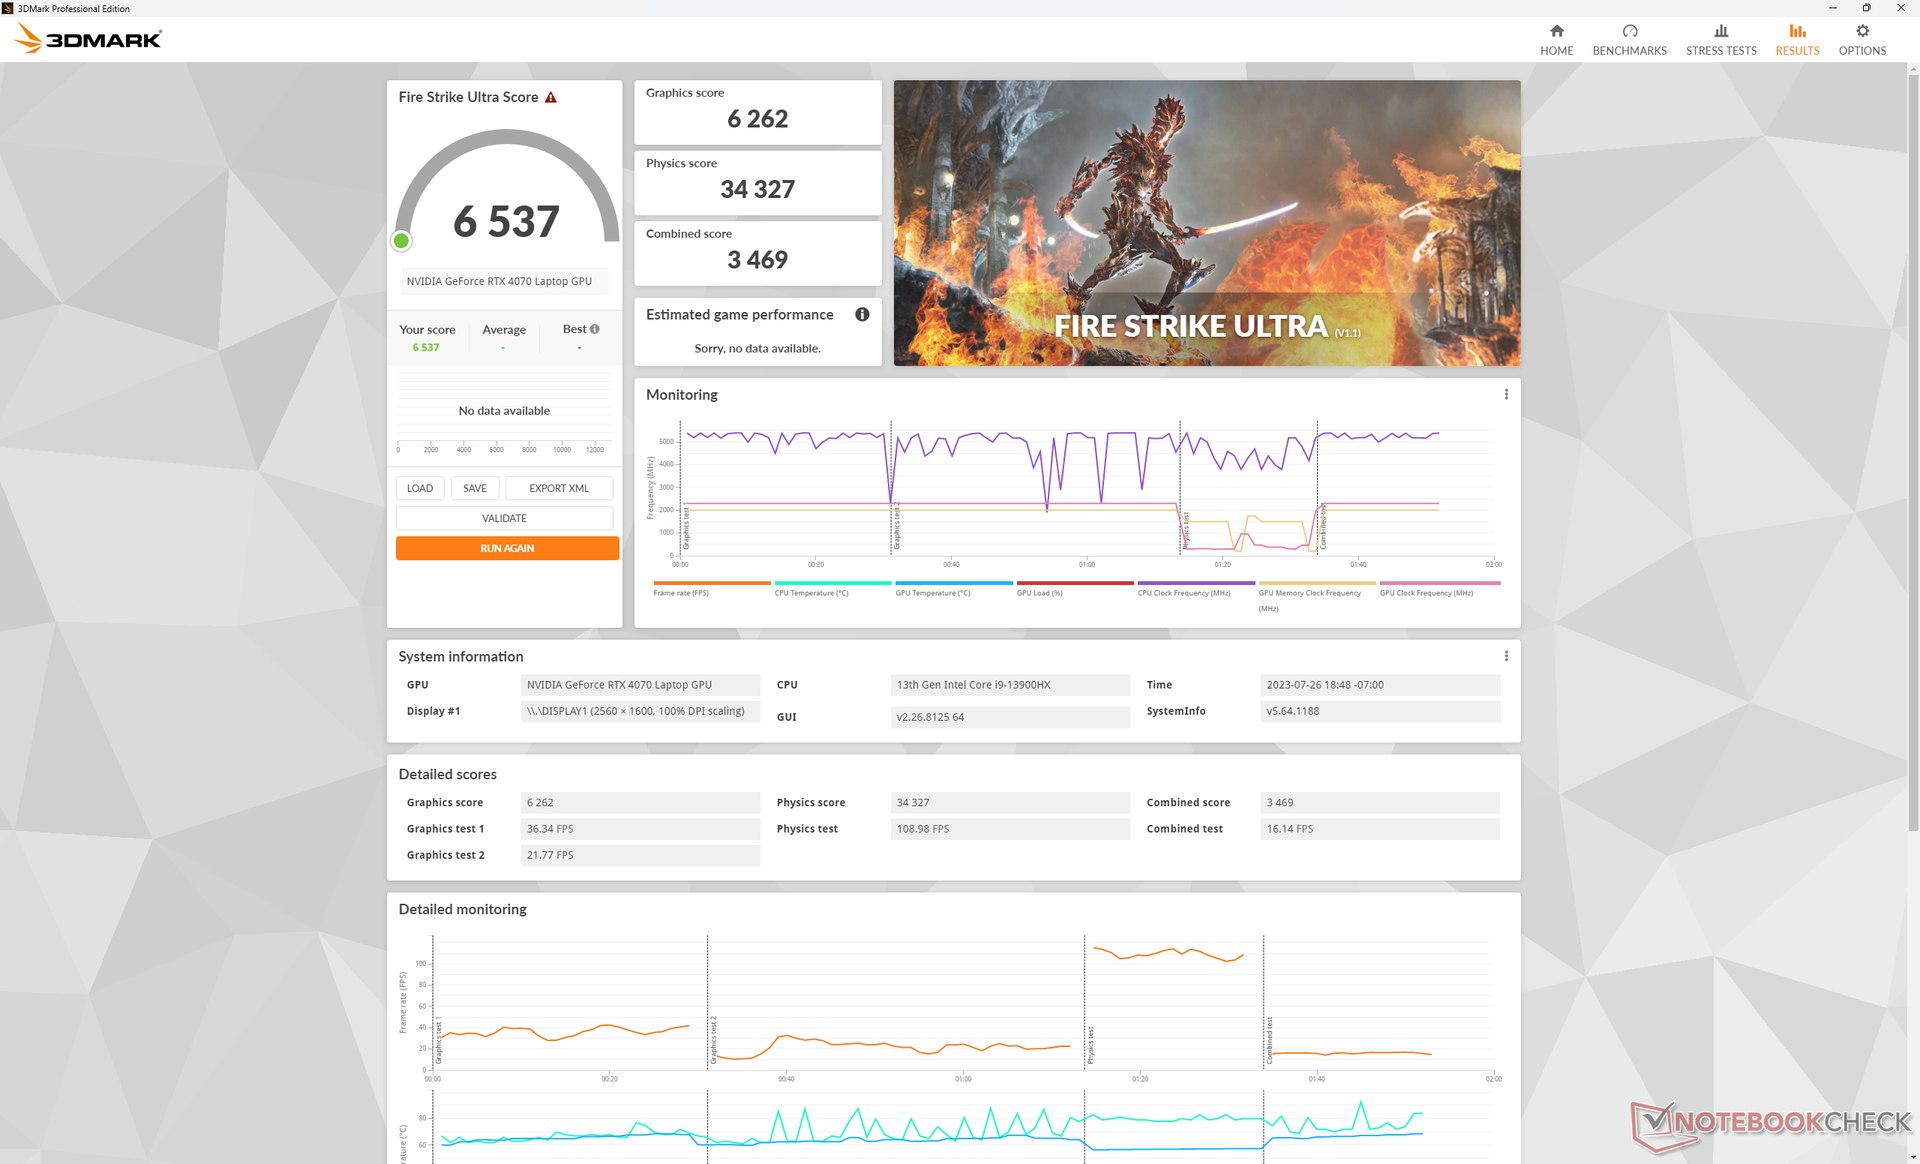
L'utilizzo della modalità Balanced invece della modalità Performance ridurrebbe di poco le prestazioni, come mostra la tabella Fire Strike qui sotto. È importante notare che le differenze di rumorosità della ventola tra le modalità Balanced e Performance possono essere significative, come illustreremo nella sezione Rumorosità del sistema.
| Profilo energetico | Punteggio grafico | Punteggio fisico | Punteggio combinato |
| Equilibrato | 26079 (-5%) | 33864 (-0%) | 8226 (-24%) |
| Prestazioni | 27343 | 33936 | 10832 |
| 3DMark 11 Performance | 32031 punti | |
| 3DMark Fire Strike Score | 24341 punti | |
| 3DMark Time Spy Score | 12436 punti | |
Aiuto | ||
* ... Meglio usare valori piccoli
Prestazioni di gioco
Tutti i titoli sono giocabili con impostazioni alte o massime alla risoluzione nativa QHD+, compresi titoli impegnativi come Returnal o Cyberpunk 2077. Il DLSS è comunque consigliato se si attivano le funzioni RT o se si gioca su un monitor 4K esterno.
Witcher 3 FPS Chart
| basso | medio | alto | ultra | QHD | 4K | |
|---|---|---|---|---|---|---|
| The Witcher 3 (2015) | 500.9 | 375.9 | 222.7 | 111.8 | 65.7 | |
| Dota 2 Reborn (2015) | 212 | 192 | 188.4 | 168.4 | 142.5 | |
| Final Fantasy XV Benchmark (2018) | 220 | 164.8 | 82.6 | 47.1 | ||
| X-Plane 11.11 (2018) | 191.5 | 169.8 | 132.9 | 114 | ||
| Strange Brigade (2018) | 414 | 310 | 245 | 208 | 133.3 | 71.4 |
| Cyberpunk 2077 1.6 (2022) | 128.5 | 118.1 | 103 | 87.5 | 54.5 | 23.5 |
| Tiny Tina's Wonderlands (2022) | 241.7 | 195.6 | 132.5 | 102 | 70.4 | 33.6 |
| F1 22 (2022) | 301 | 289 | 221 | 79.3 | 50.4 | 24.7 |
| Returnal (2023) | 109 | 115 | 101 | 79 | 64 | 37 |
Emissioni
Rumore di sistema - Grande differenza tra la modalità bilanciata e quella ad alte prestazioni
La rumorosità complessiva della ventola è leggermente più silenziosa rispetto a quella riscontrata con il modello Omen 16ma vale la pena notare che l'Omen 16 è dotato della GPU RTX 4080, più veloce e con un TGP più elevato di 145 W rispetto alla nostra RTX 4070, più lenta e da 130 W.
Il rumore della ventola quando si gioca in modalità Performance può raggiungere i 54,3 dB(A) rispetto ai soli 42 dB(A) della modalità Balanced. Come già detto, si perde un po' di prestazioni, ma la significativa riduzione del rumore può rendere il compromesso degno di nota. Per il resto, la fascia media di 50 dB(A) quando si gioca è paragonabile a quella di alternative come l'Alienware x16 R1.
Rumorosità
| Idle |
| 29.1 / 29.1 / 29.1 dB(A) |
| Sotto carico |
| 45.7 / 54.3 dB(A) |
 | ||
30 dB silenzioso 40 dB(A) udibile 50 dB(A) rumoroso |
||
min: | ||
| HP Omen Transcend 16 GeForce RTX 4070 Laptop GPU, i9-13900HX, SK hynix PC801 HFS002TEJ9X101N | Lenovo Legion Slim 7i 16 Gen 8 GeForce RTX 4070 Laptop GPU, i9-13900H, Samsung PM9A1 MZVL21T0HCLR | HP Omen 16-wf000 GeForce RTX 4080 Laptop GPU, i7-13700HX, SK hynix PC801 HFS002TEJ9X101N | Alienware x16 R1 GeForce RTX 4080 Laptop GPU, i9-13900HK, SK hynix PC801 HFS001TEJ9X101N | Acer Nitro 16 AN16-41 GeForce RTX 4070 Laptop GPU, R7 7735HS, Samsung PM9A1 MZVL21T0HCLR | Asus ROG Zephyrus M16 GU603Z GeForce RTX 3070 Ti Laptop GPU, i9-12900H, Micron 3400 1TB MTFDKBA1T0TFH | |
|---|---|---|---|---|---|---|
| Noise | 13% | 1% | 9% | 6% | -2% | |
| off /ambiente * (dB) | 22.9 | 22.8 -0% | 23 -0% | 22.7 1% | 25.7 -12% | 23 -0% |
| Idle Minimum * (dB) | 29.1 | 23.6 19% | 29.6 -2% | 23.1 21% | 25.7 12% | 23 21% |
| Idle Average * (dB) | 29.1 | 23.6 19% | 29.8 -2% | 25.8 11% | 25.7 12% | 24 18% |
| Idle Maximum * (dB) | 29.1 | 25.7 12% | 30.4 -4% | 25.8 11% | 26.3 10% | 47 -62% |
| Load Average * (dB) | 45.7 | 27.6 40% | 33.8 26% | 39.3 14% | 33.9 26% | 47.91 -5% |
| Witcher 3 ultra * (dB) | 54.3 | 54.4 -0% | 57 -5% | 49.9 8% | 48.91 10% | |
| Load Maximum * (dB) | 54.3 | 54.4 -0% | 58.3 -7% | 54.8 -1% | 62 -14% | 50.25 7% |
* ... Meglio usare valori piccoli
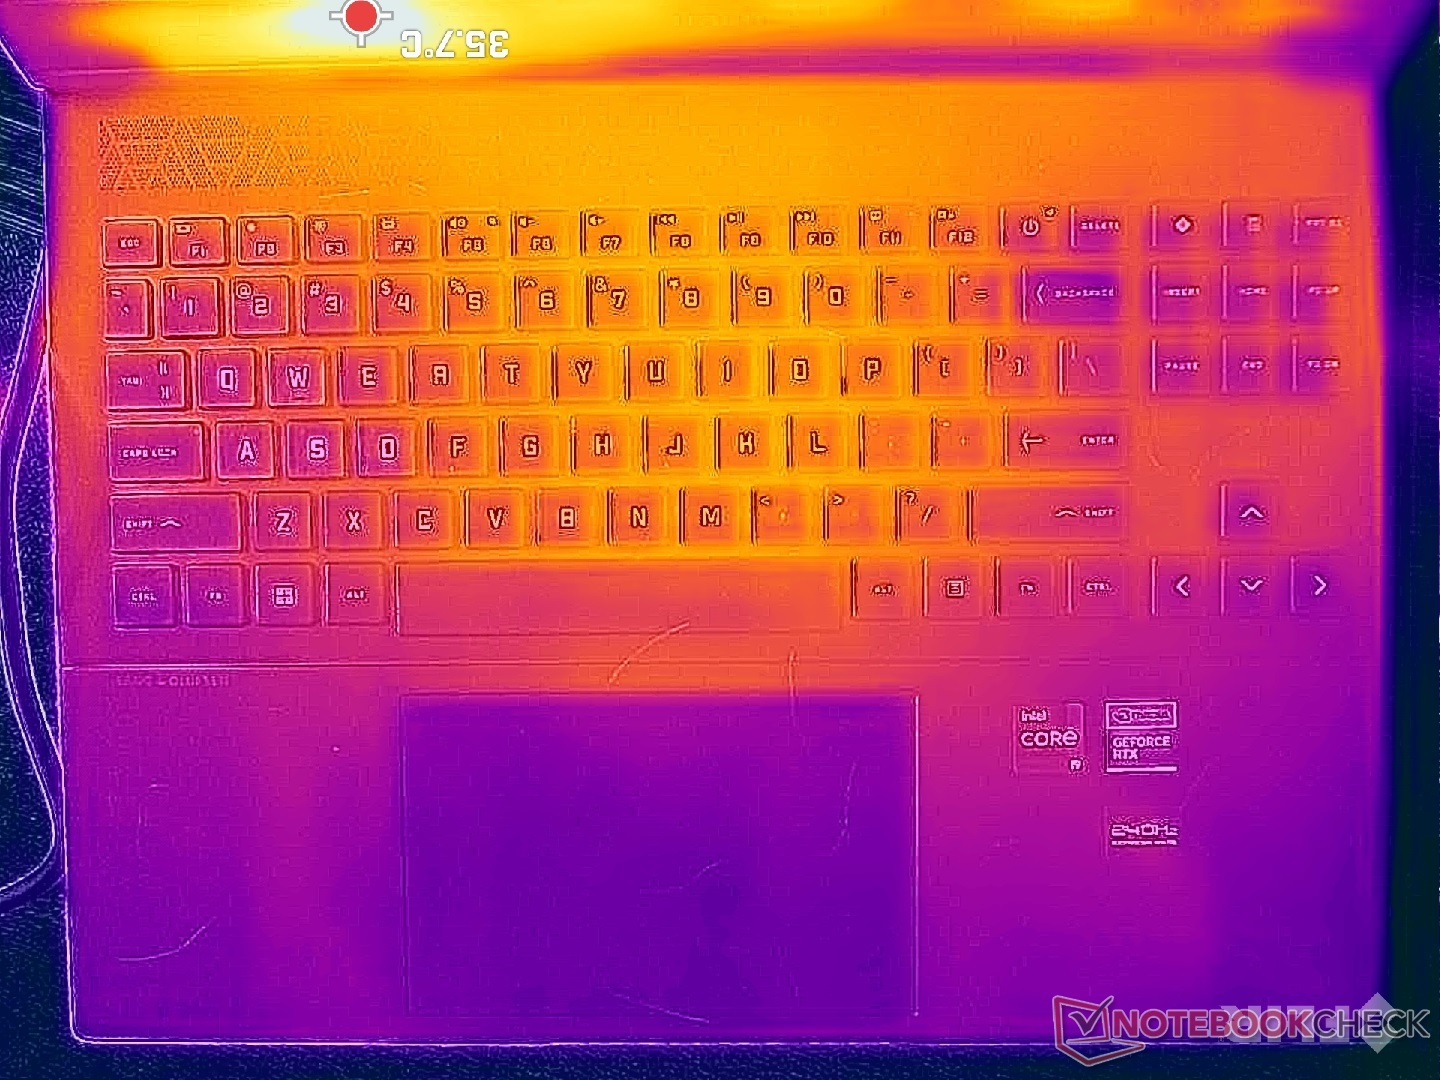
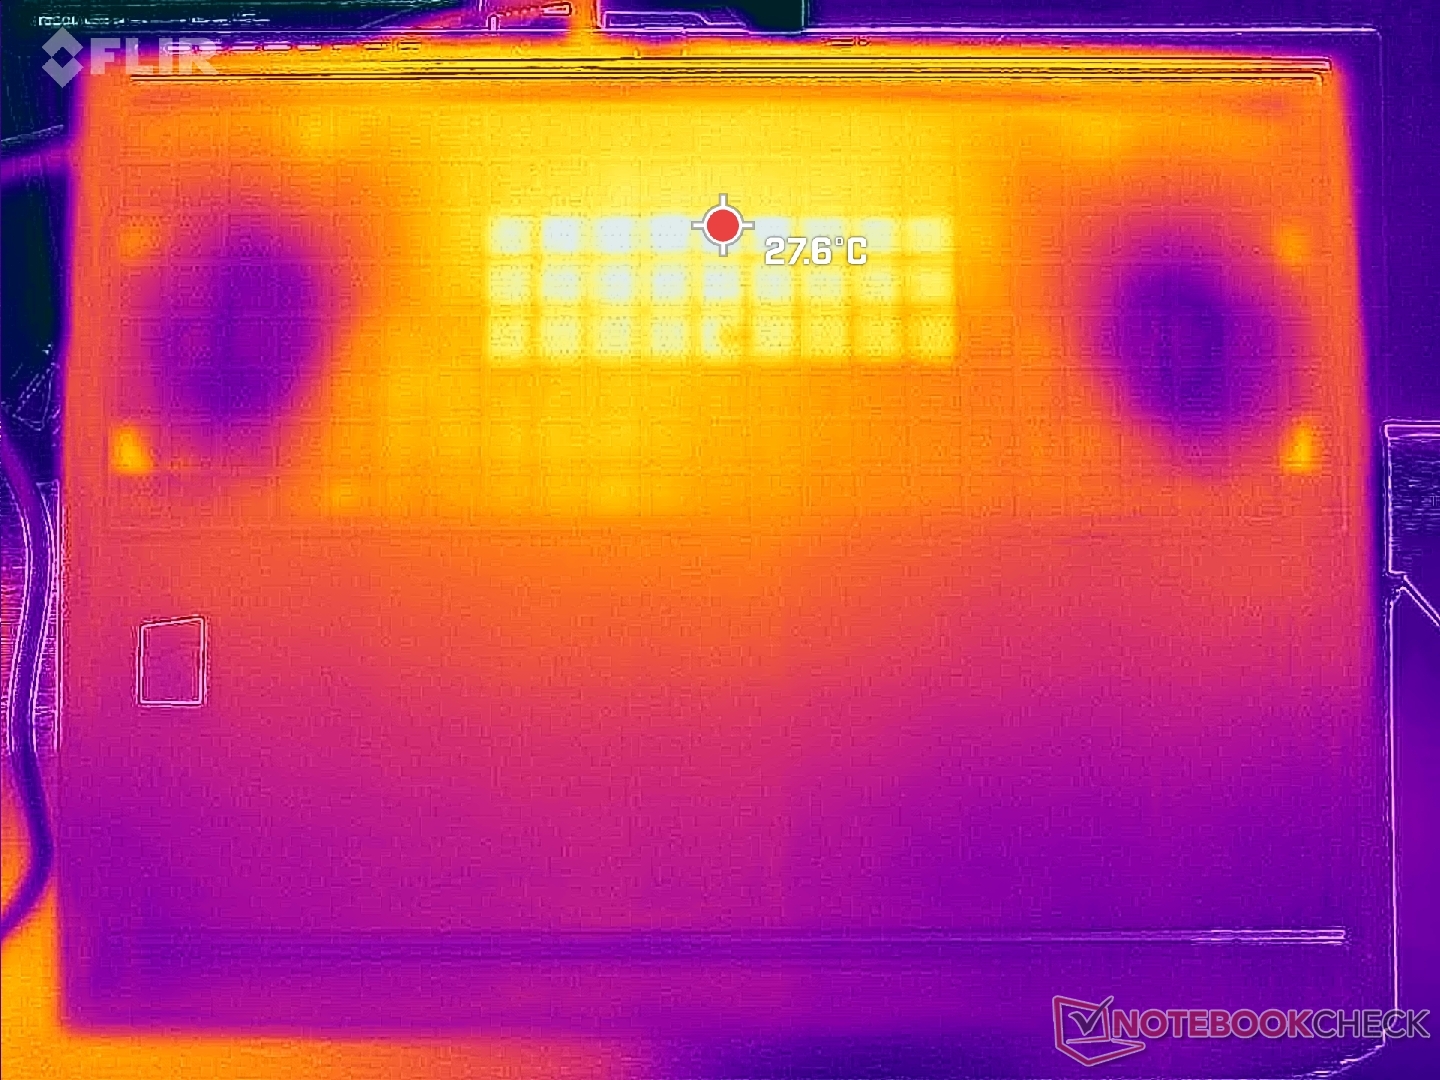
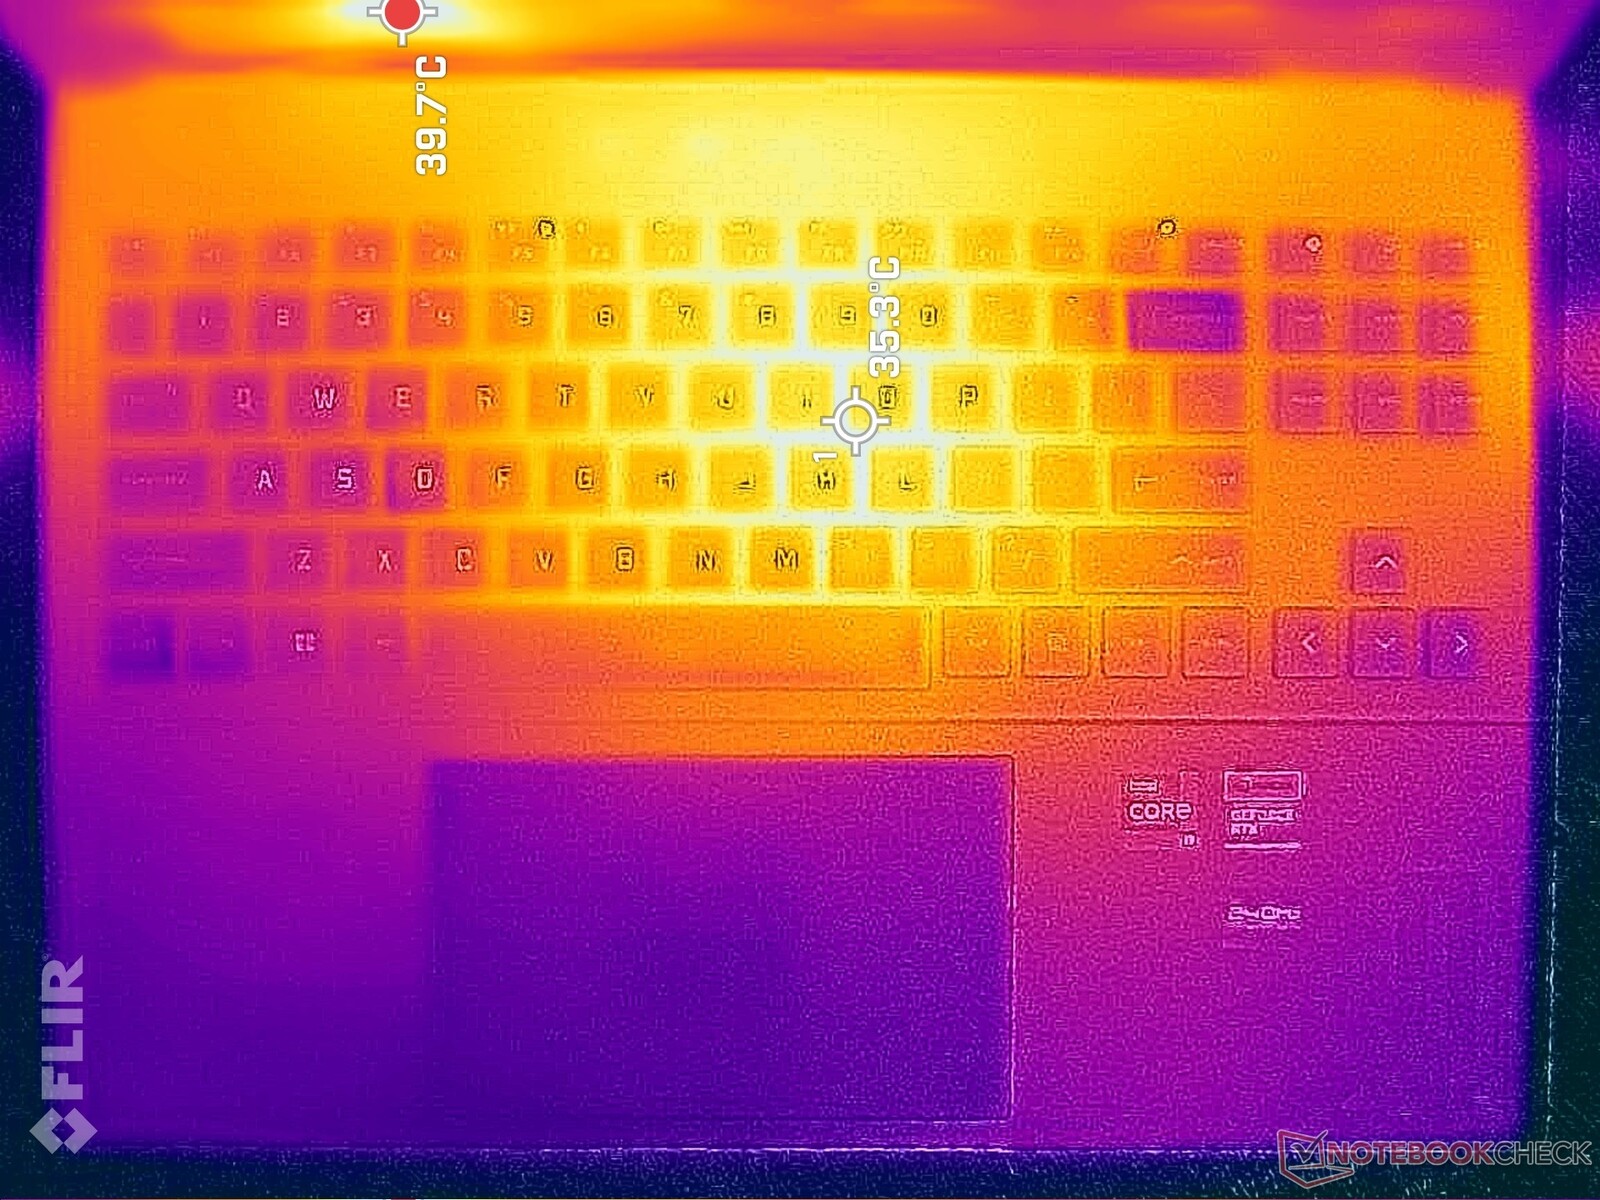
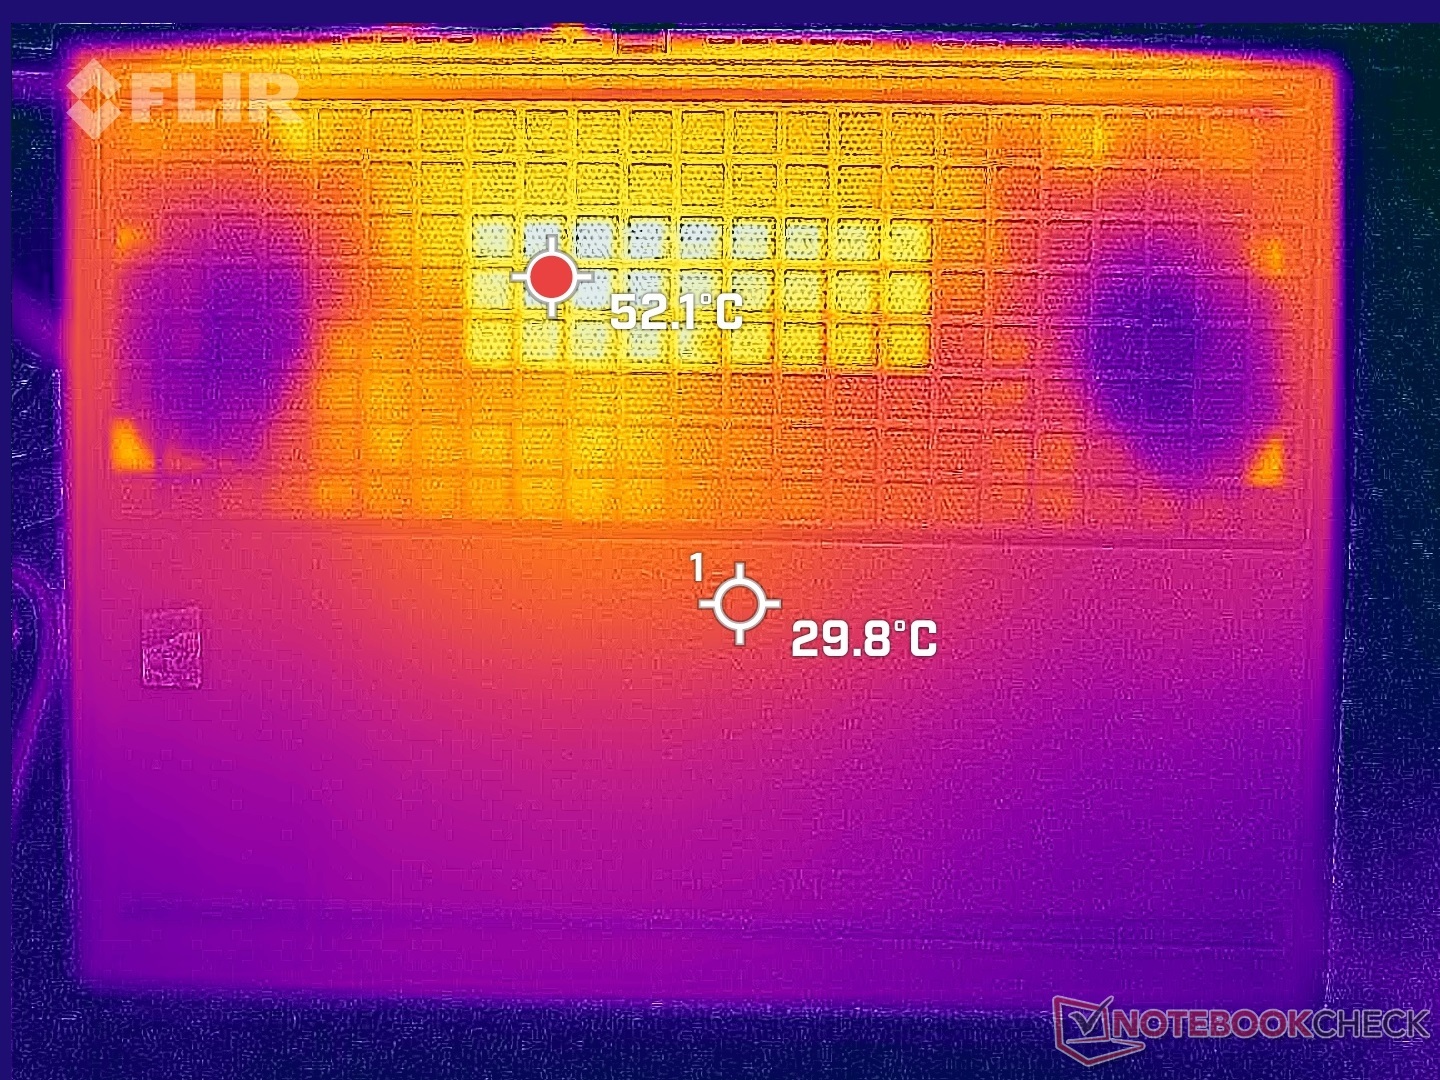
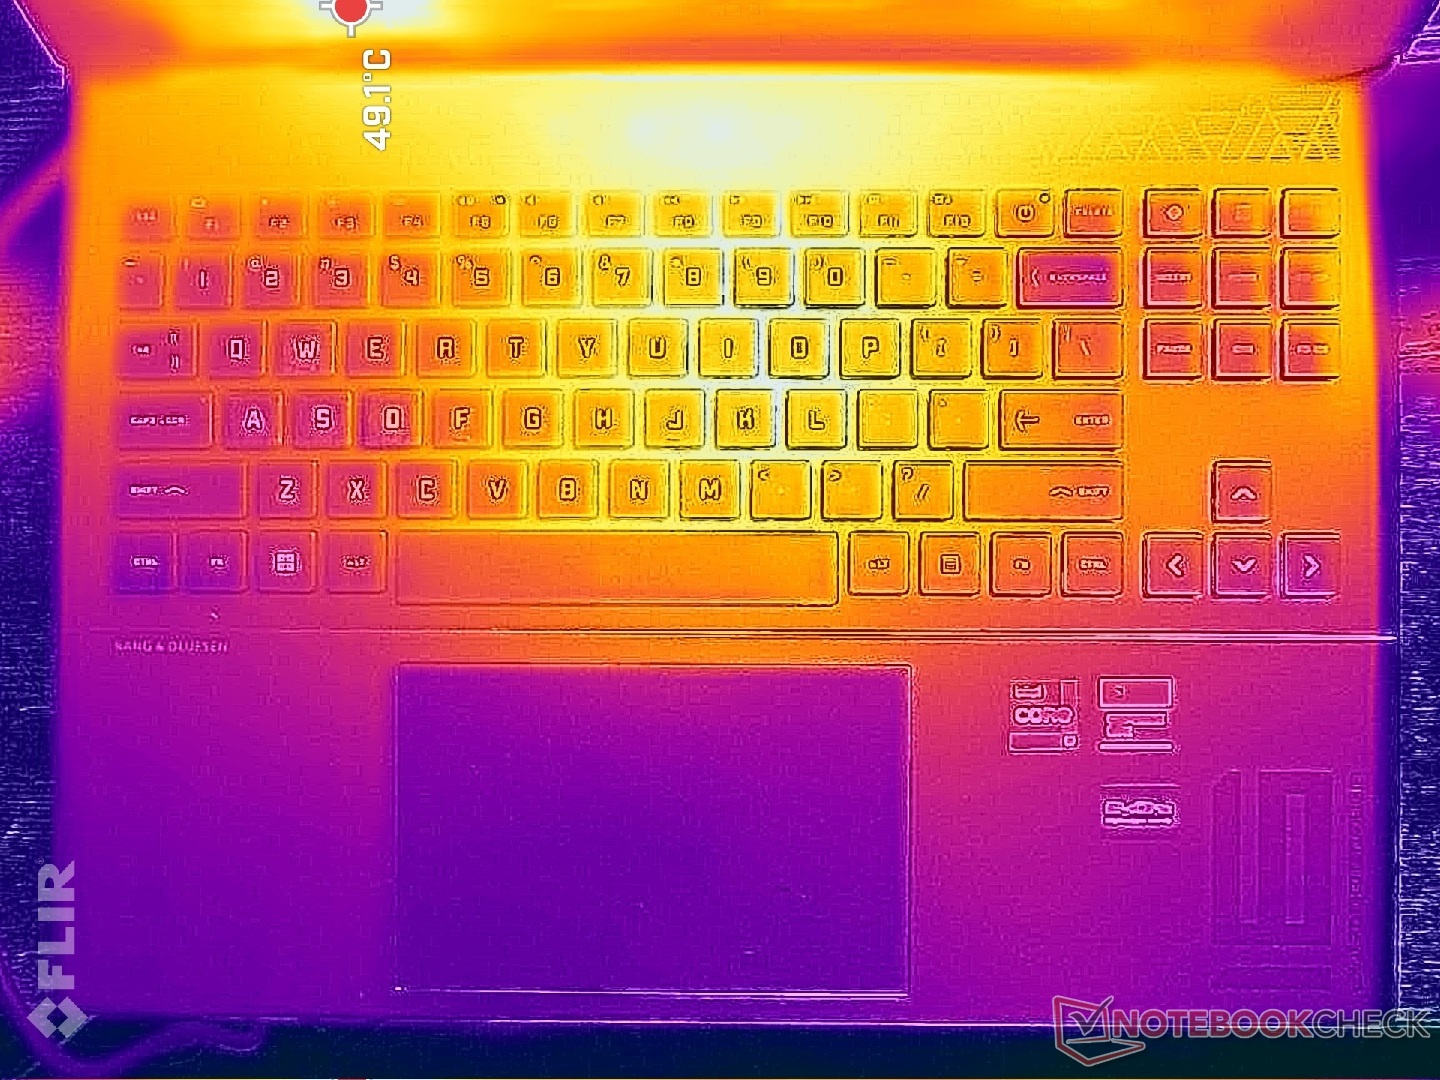
Temperatura
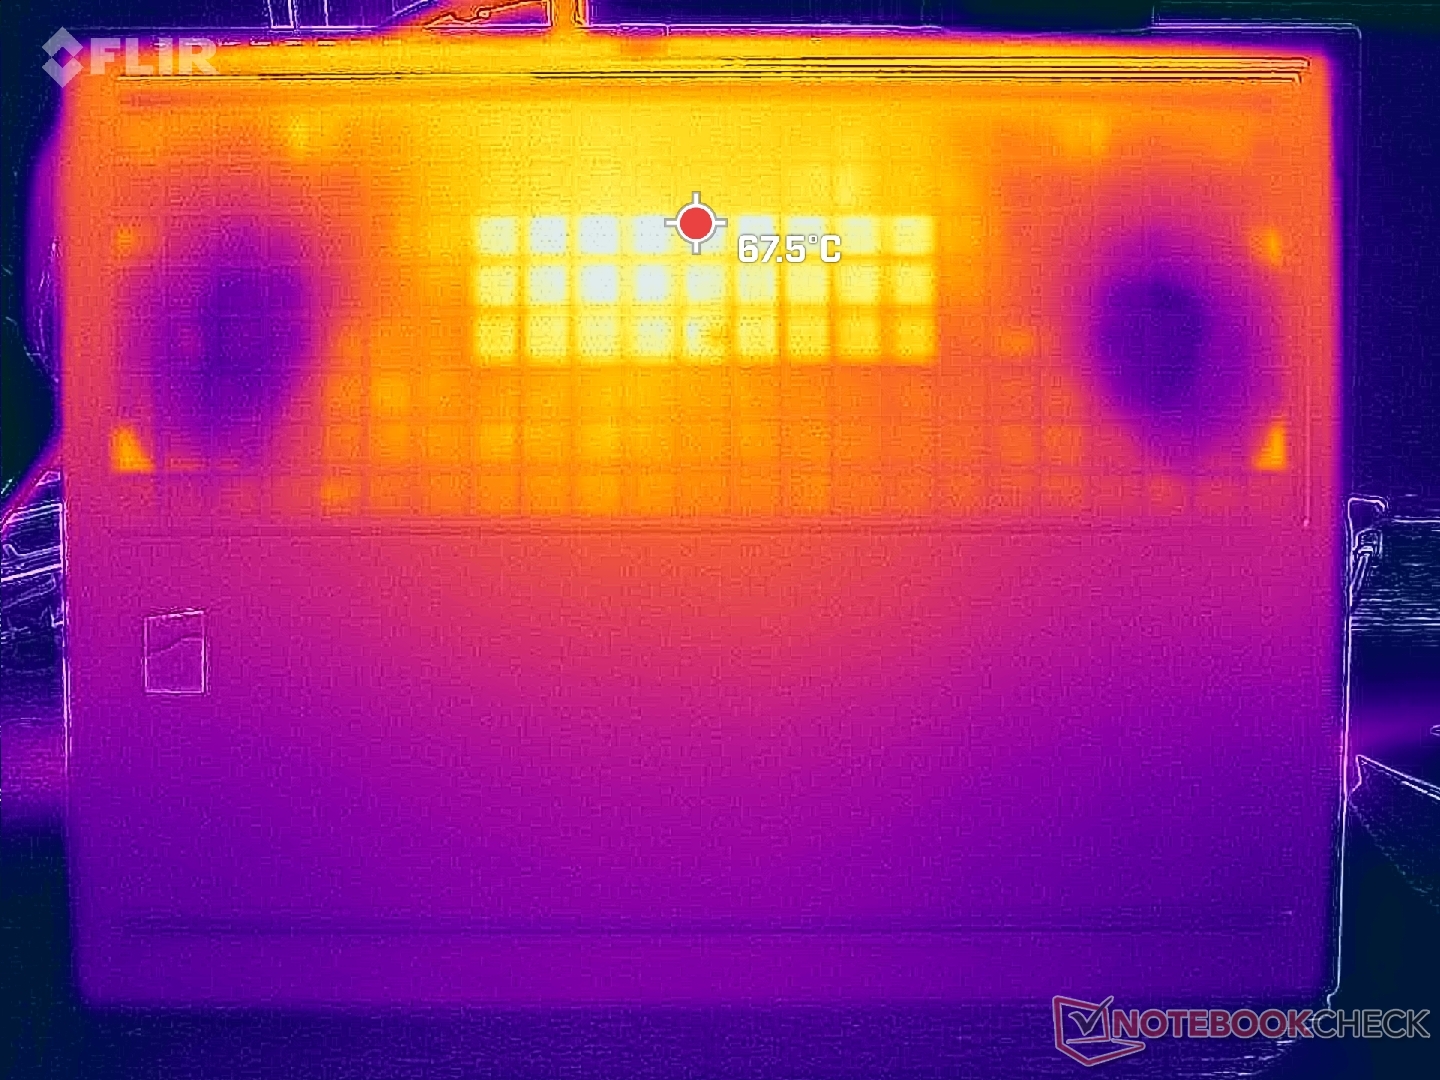
Le temperature della superficie sono più calde verso il centro, grazie alla soluzione di raffreddamento simmetrica all'interno. Il centro della tastiera può raggiungere i 40-45 C durante il gioco e la parte inferiore può essere ancora più calda. Tuttavia, questo intervallo è ancora paragonabile a quello dellaLegion Slim 7i 16 G8. Il resto del portatile è più fresco, compresi i poggiapolsi, i tasti WASD e i tasti freccia, dove la pelle è più spesso a contatto quando si gioca.
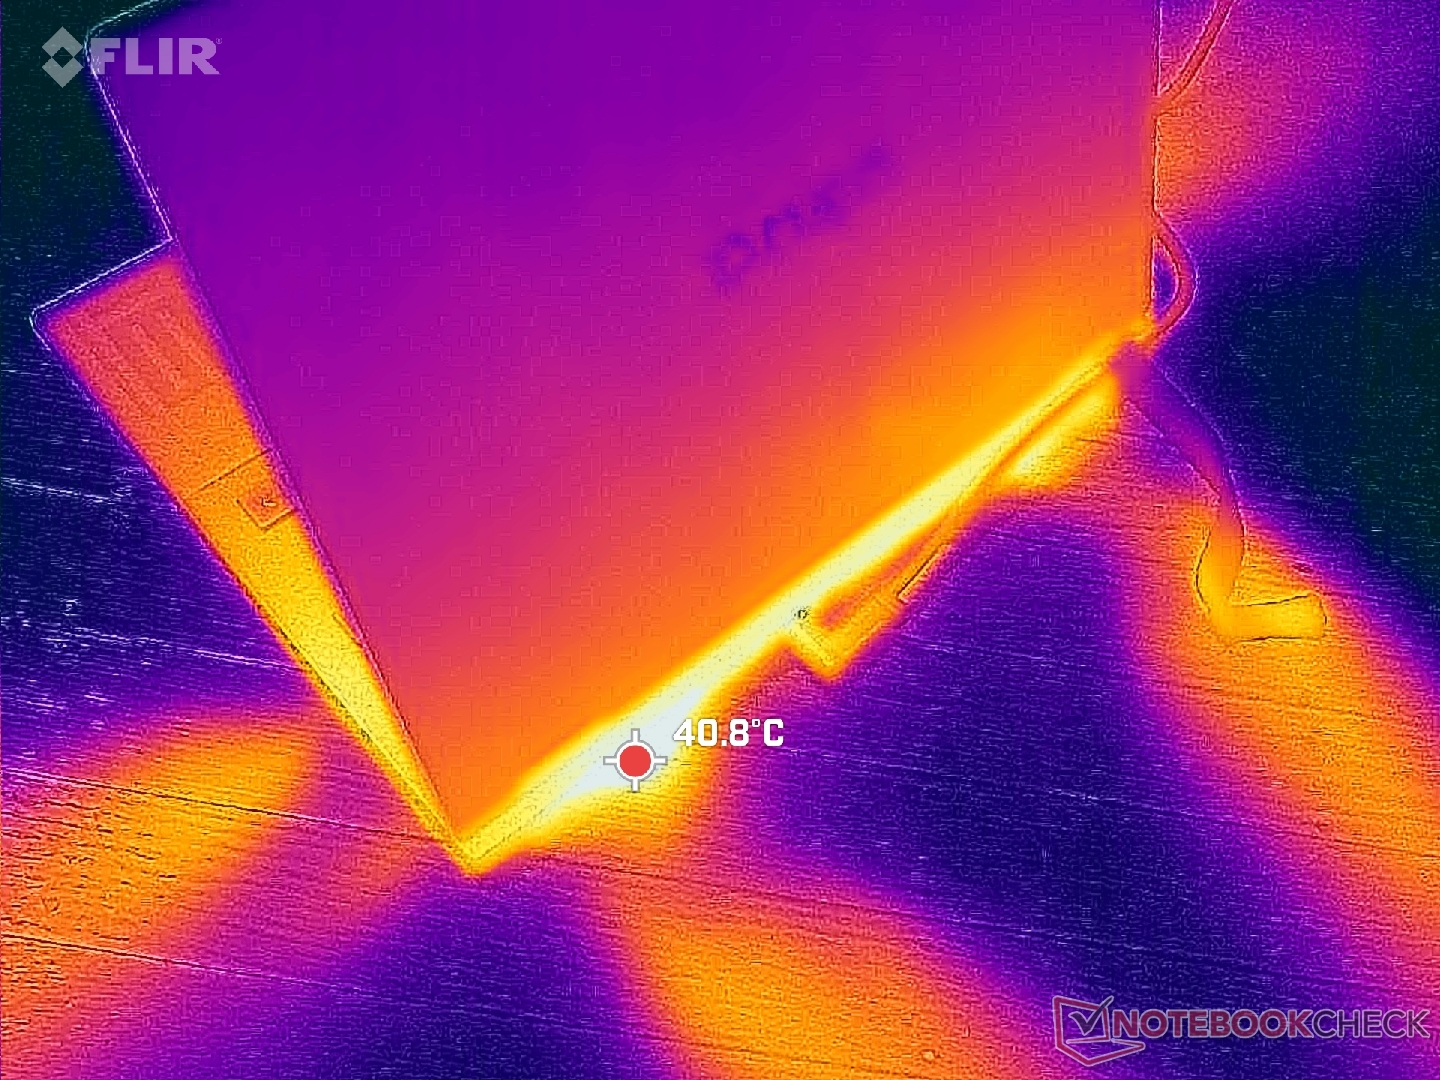
(-) La temperatura massima sul lato superiore è di 47.4 °C / 117 F, rispetto alla media di 40.4 °C / 105 F, che varia da 21.2 a 68.8 °C per questa classe Gaming.
(-) Il lato inferiore si riscalda fino ad un massimo di 54.4 °C / 130 F, rispetto alla media di 43.2 °C / 110 F
(+) In idle, la temperatura media del lato superiore è di 25.4 °C / 78 F, rispetto alla media deld ispositivo di 33.9 °C / 93 F.
(±) Riproducendo The Witcher 3, la temperatura media per il lato superiore e' di 32.5 °C / 91 F, rispetto alla media del dispositivo di 33.9 °C / 93 F.
(+) I poggiapolsi e il touchpad sono piu' freddi della temperatura della pelle con un massimo di 29.6 °C / 85.3 F e sono quindi freddi al tatto.
(±) La temperatura media della zona del palmo della mano di dispositivi simili e'stata di 28.8 °C / 83.8 F (-0.8 °C / -1.5 F).
| HP Omen Transcend 16 Intel Core i9-13900HX, NVIDIA GeForce RTX 4070 Laptop GPU | Lenovo Legion Slim 7i 16 Gen 8 Intel Core i9-13900H, NVIDIA GeForce RTX 4070 Laptop GPU | HP Omen 16-wf000 Intel Core i7-13700HX, NVIDIA GeForce RTX 4080 Laptop GPU | Alienware x16 R1 Intel Core i9-13900HK, NVIDIA GeForce RTX 4080 Laptop GPU | Acer Nitro 16 AN16-41 AMD Ryzen 7 7735HS, NVIDIA GeForce RTX 4070 Laptop GPU | Asus ROG Zephyrus M16 GU603Z Intel Core i9-12900H, NVIDIA GeForce RTX 3070 Ti Laptop GPU | |
|---|---|---|---|---|---|---|
| Heat | -1% | 3% | -10% | -3% | -5% | |
| Maximum Upper Side * (°C) | 47.4 | 49.8 -5% | 45 5% | 47.2 -0% | 41.5 12% | 52 -10% |
| Maximum Bottom * (°C) | 54.4 | 48.8 10% | 48.8 10% | 47.8 12% | 51.8 5% | 51 6% |
| Idle Upper Side * (°C) | 28.4 | 29.4 -4% | 29.2 -3% | 36.8 -30% | 31.6 -11% | 29 -2% |
| Idle Bottom * (°C) | 29.2 | 30 -3% | 28.8 1% | 35.8 -23% | 34.5 -18% | 33 -13% |
* ... Meglio usare valori piccoli
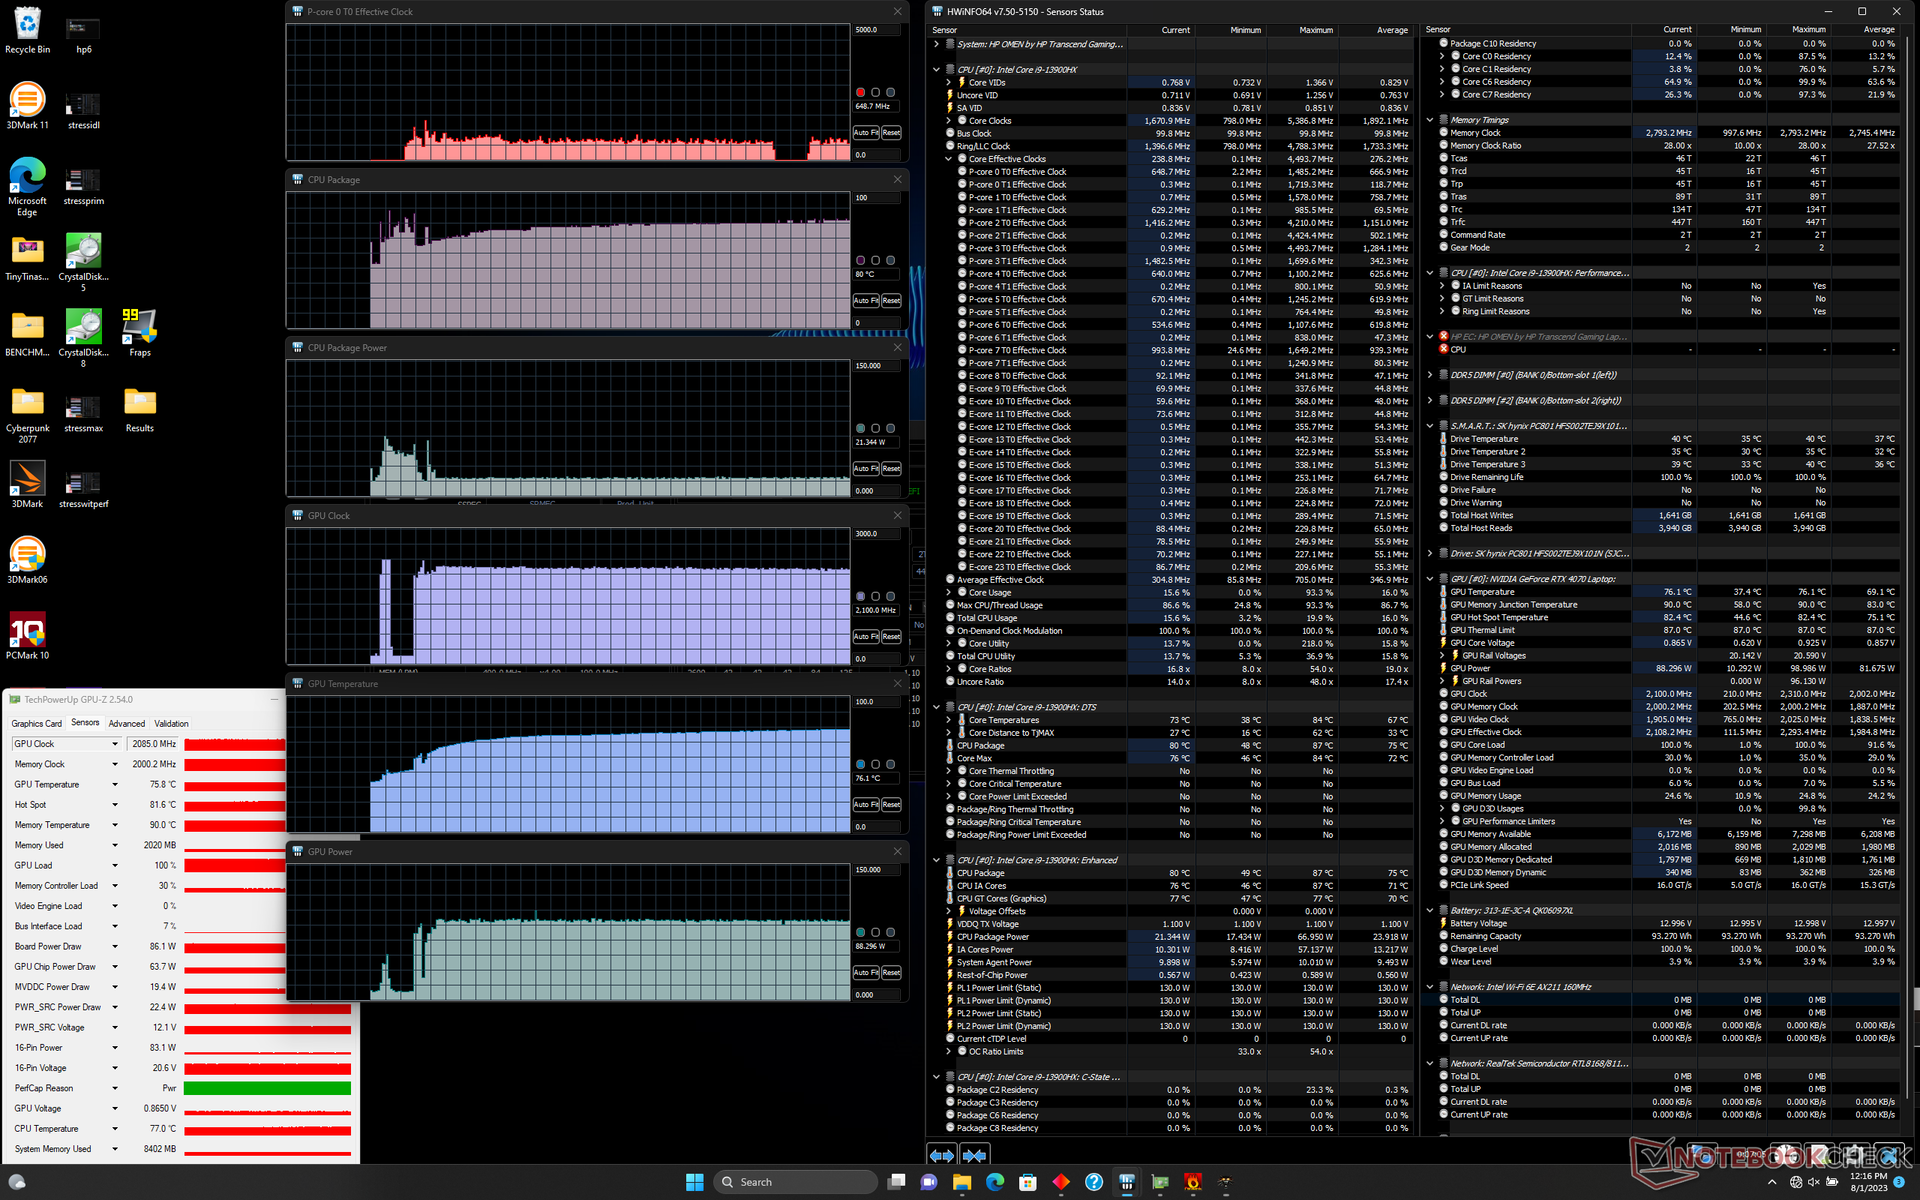
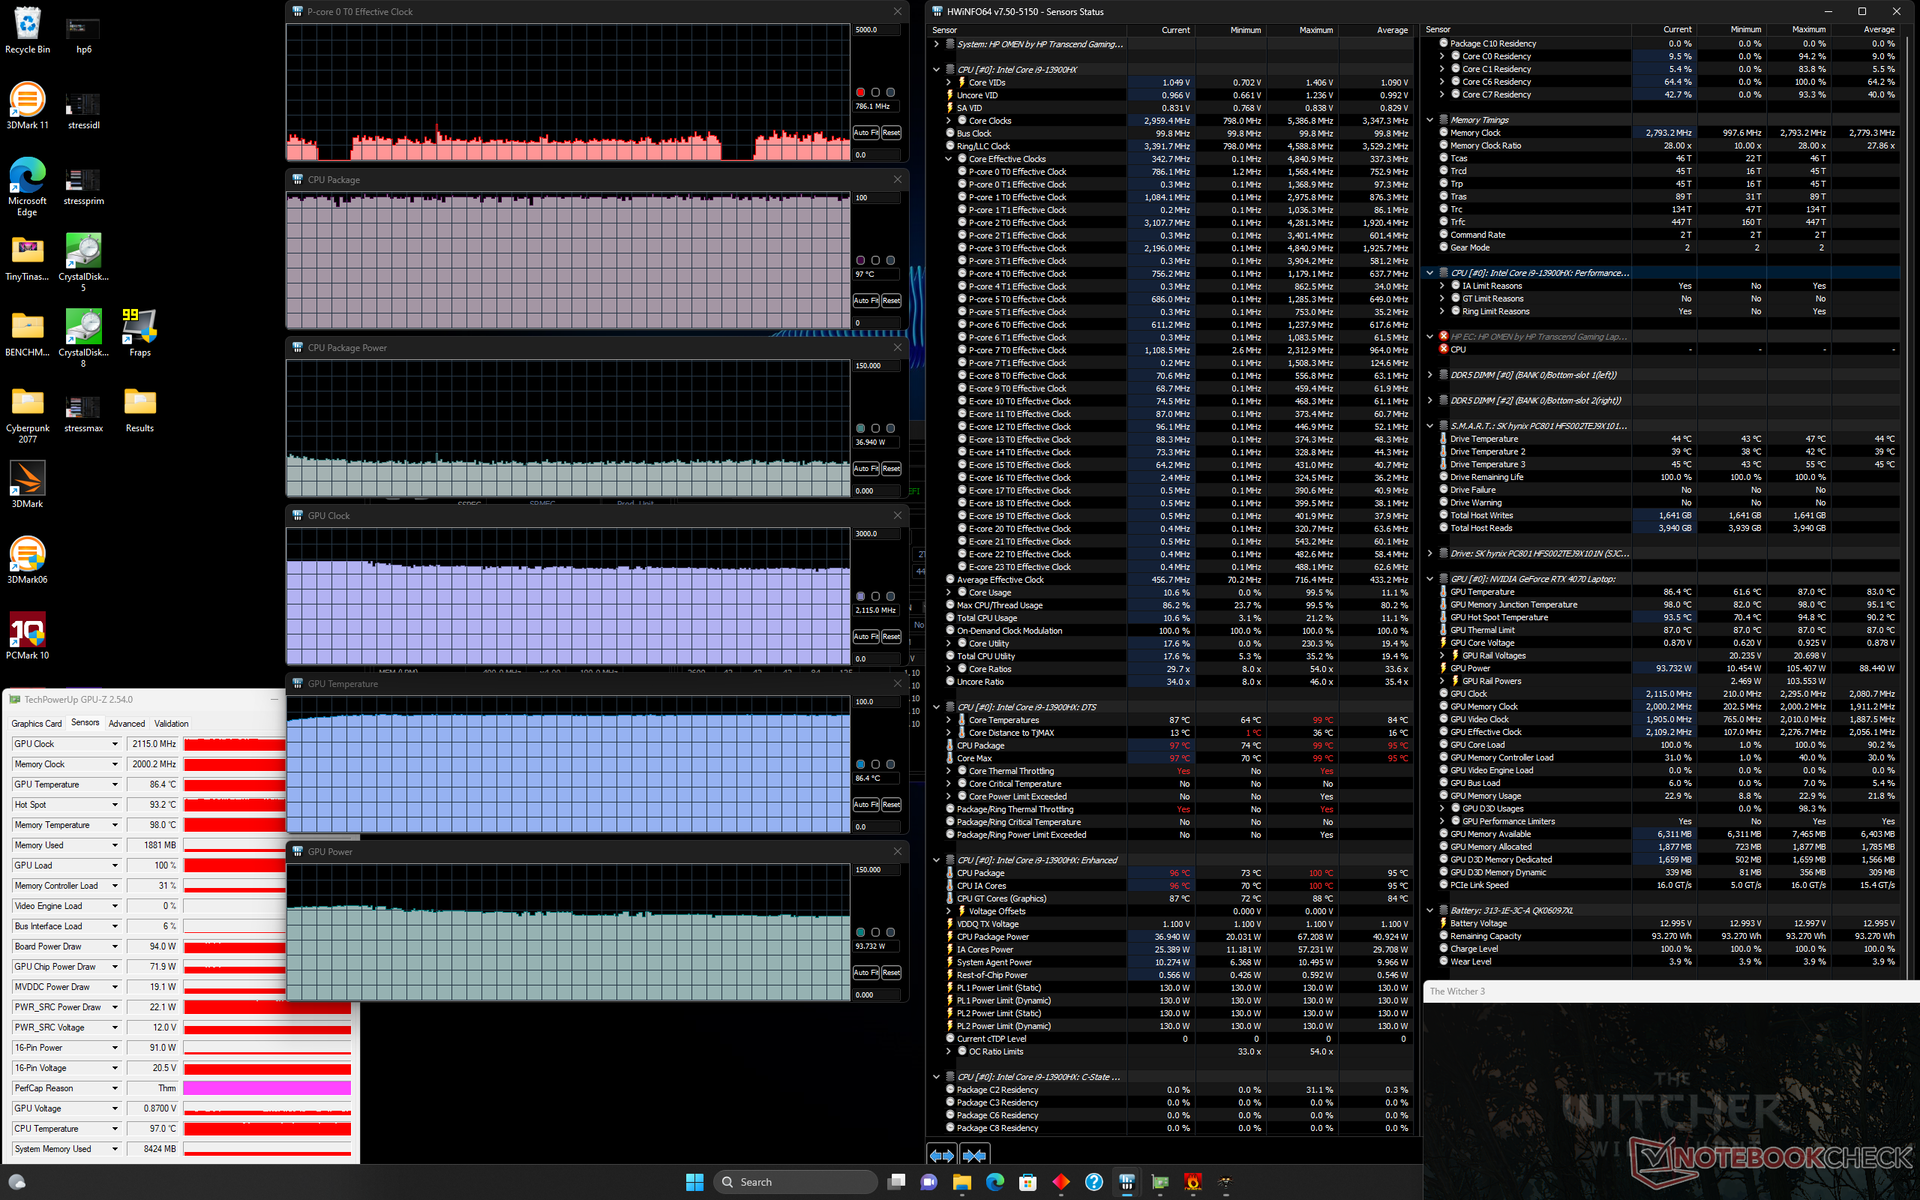
Stress test
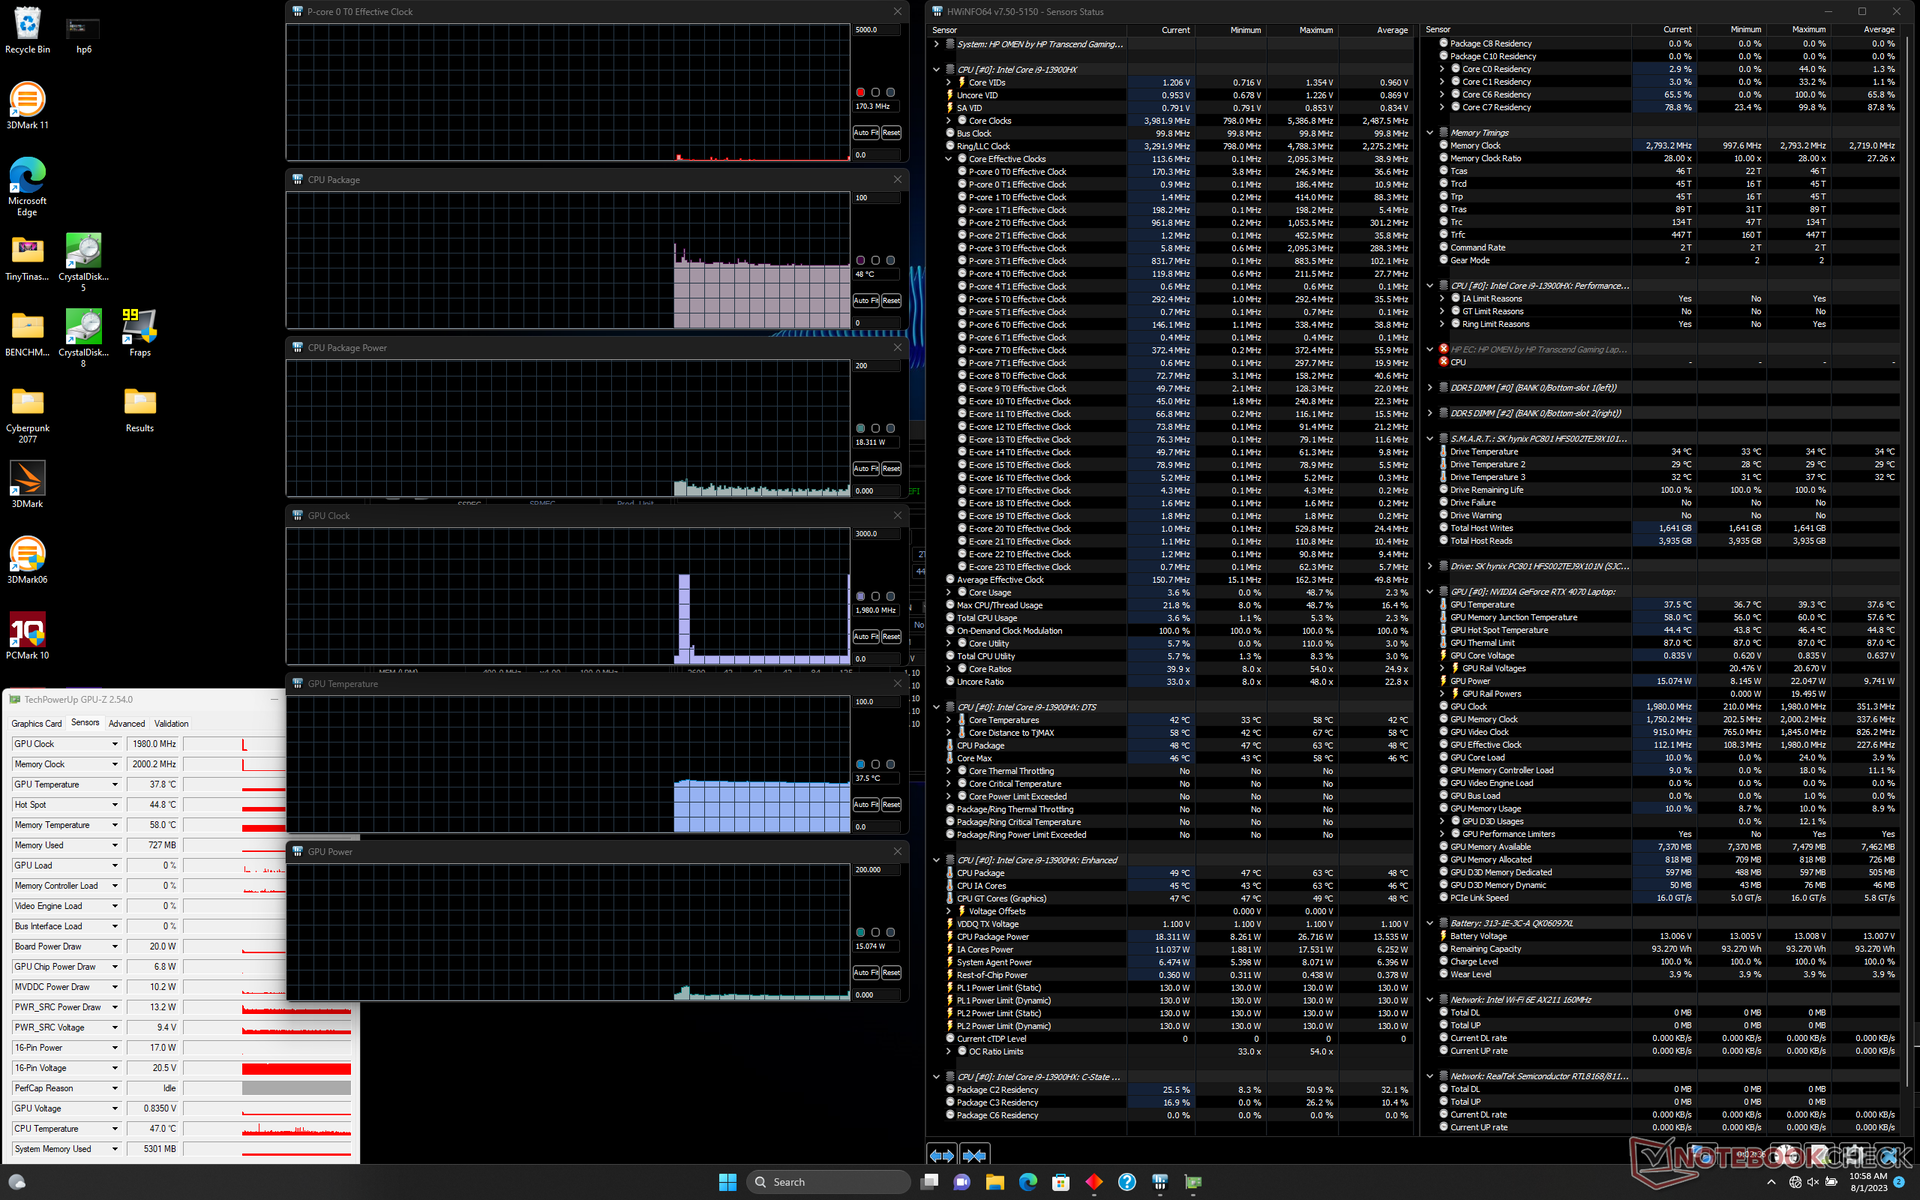
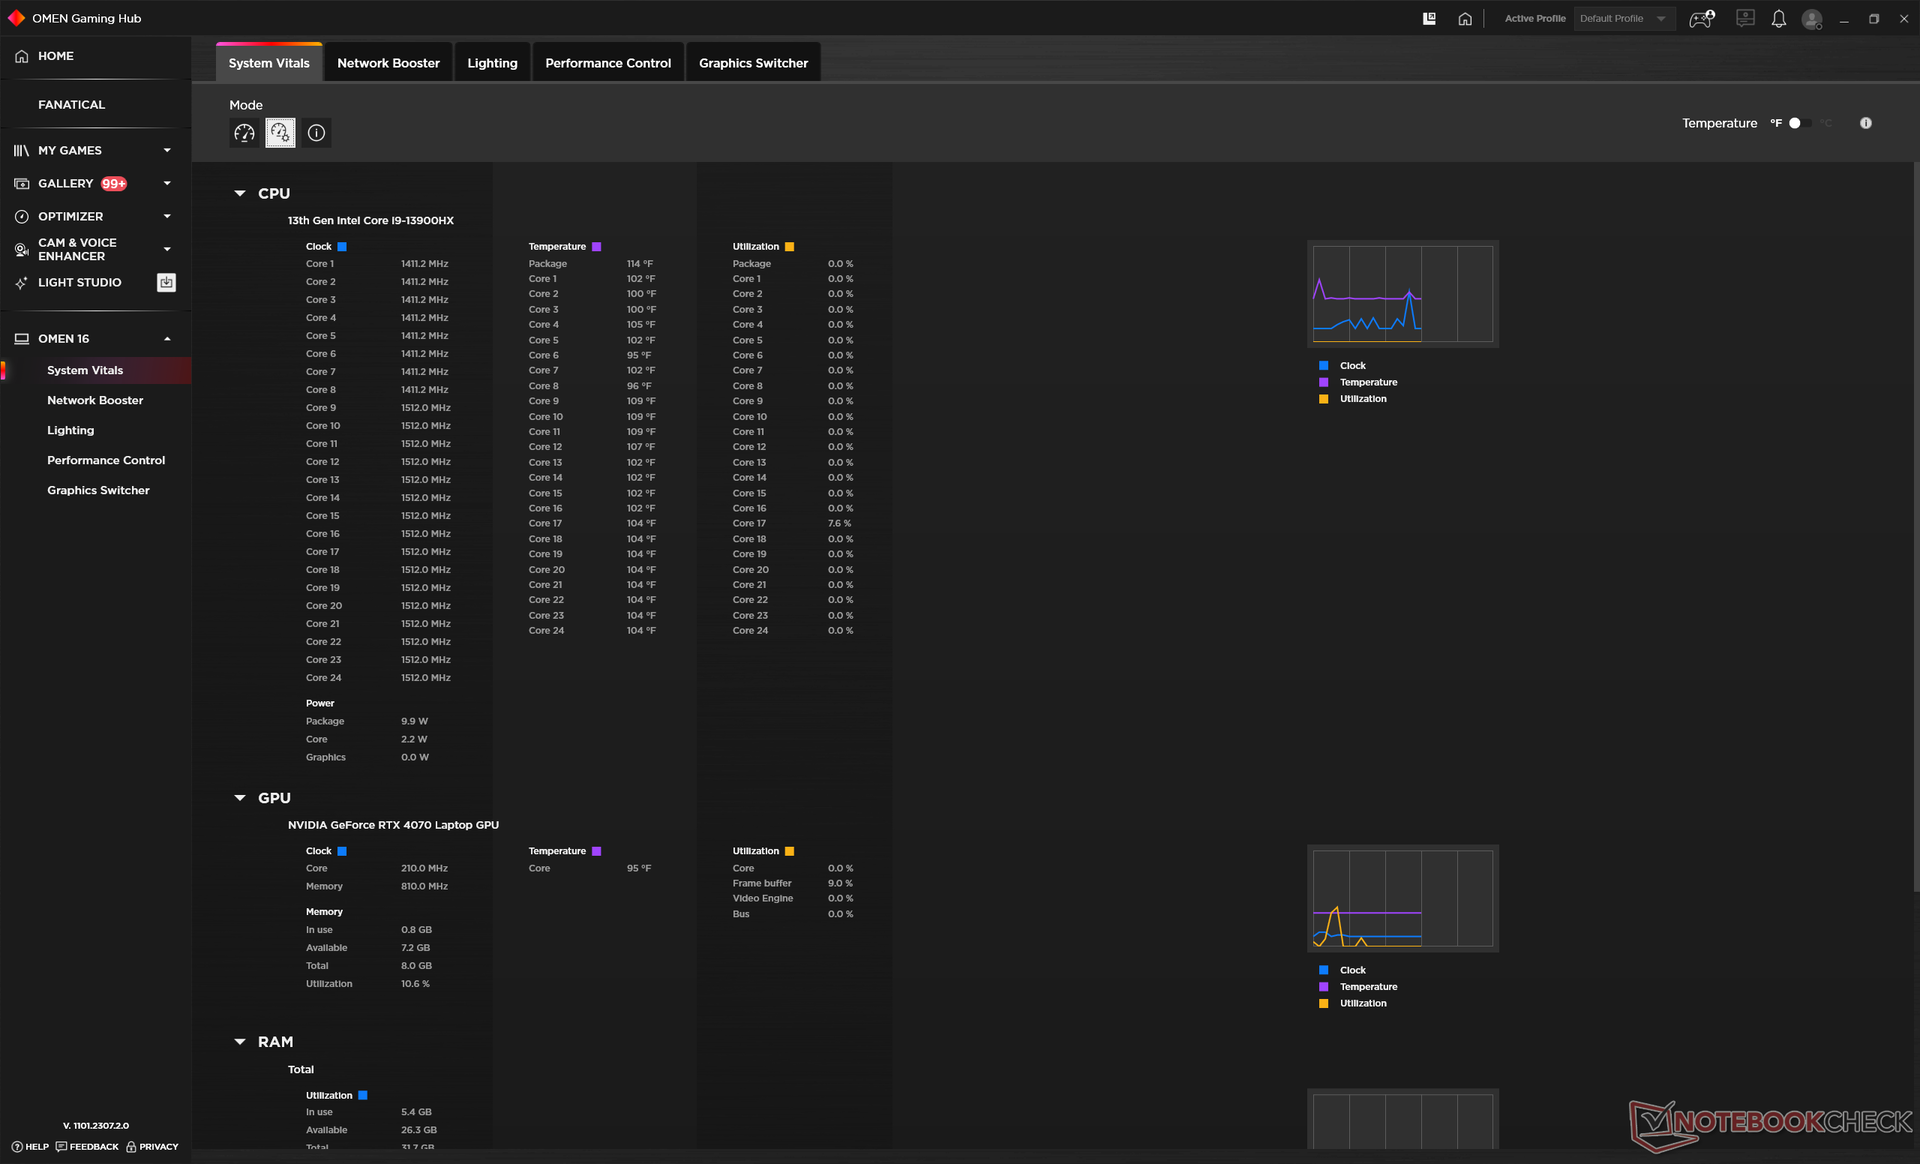
Quando si esegue lo stress Prime95, la CPU sale fino a 3,1 GHz e 101 W prima di scendere rapidamente e stabilizzarsi a circa 2,4 GHz e 84 W per mantenere una temperatura ragionevole del core di 81 C. La temperatura del core può raggiungere i 97 C se anche la GPU viene stressata allo stesso tempo, come mostrato dagli screenshot qui sotto.
La GPU Nvidia si stabilizza a 2115 MHz, 86 C e 94 W, rispettivamente, quando viene eseguita in modalità Performance Witcher 3 in modalità Performance. In modalità Bilanciata, la GPU scende a 2085 MHz, 76 C e 86 W. Siamo riusciti a raggiungere un picco di potenza della GPU nel mondo reale di 105 W rispetto all'obiettivo di 130 W del TGP.
Il funzionamento a batteria limita le prestazioni. Un test di Fire Strike a batteria restituirebbe punteggi di Fisica e Grafica pari a 21003 e 17627 punti, rispettivamente, rispetto a 33936 e 27343 punti con alimentazione a rete.
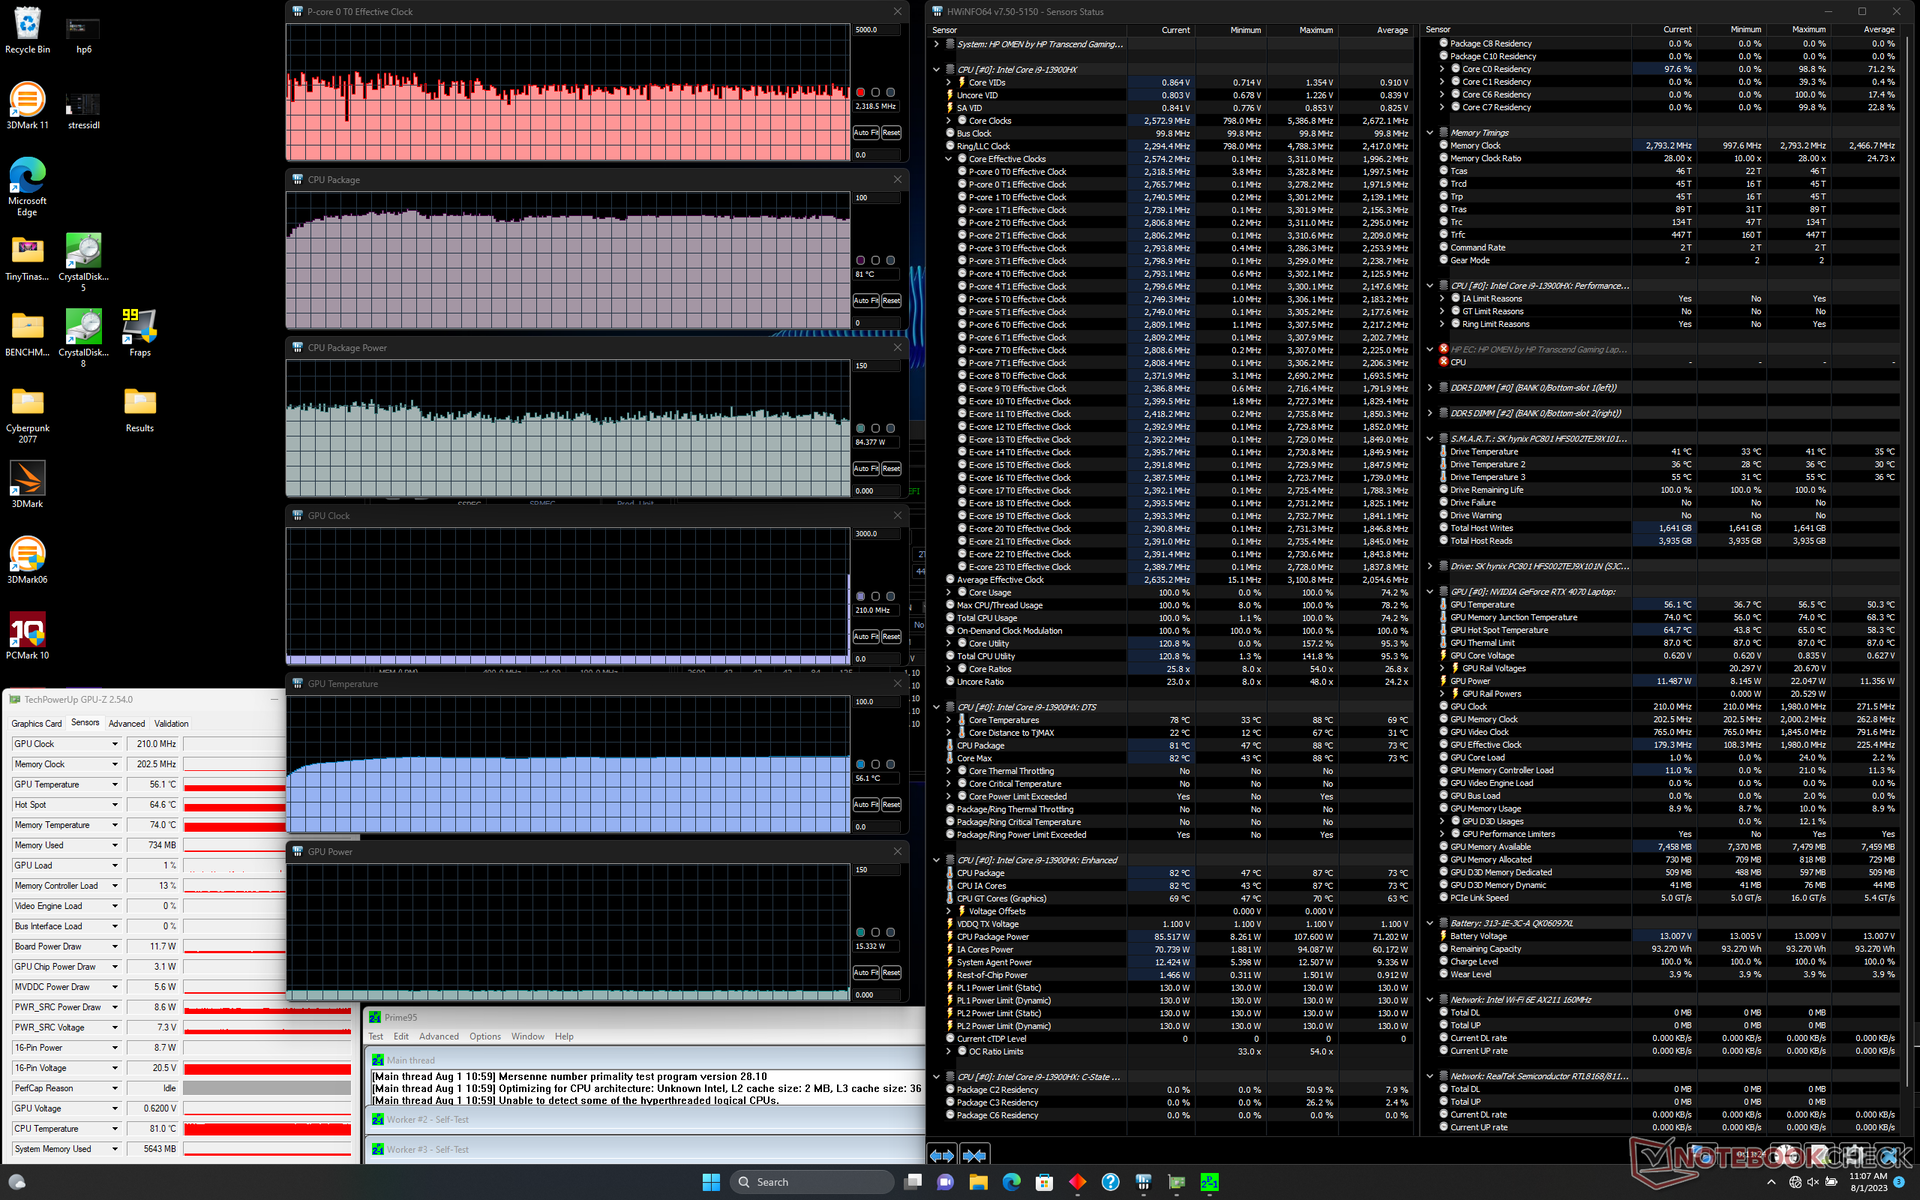
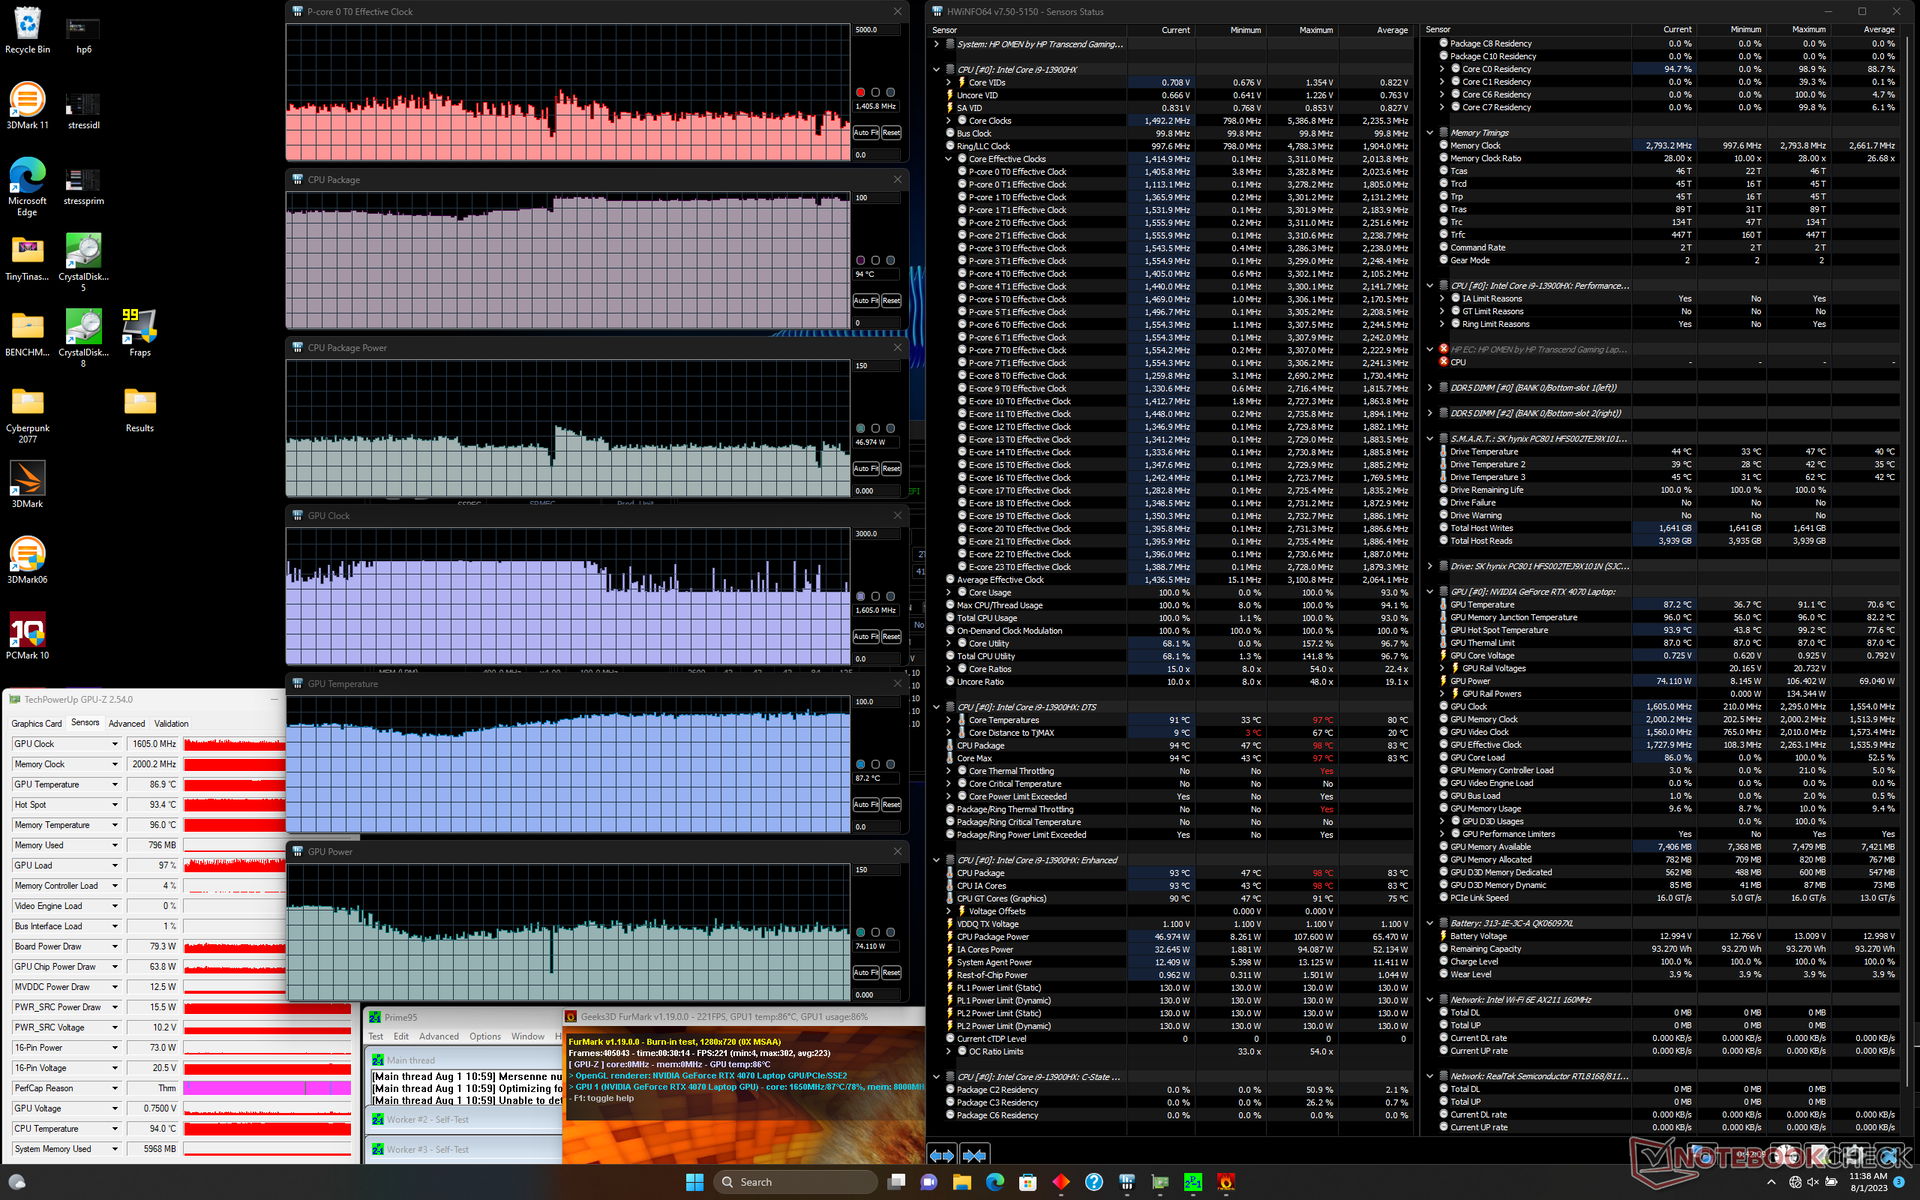
| Clock della CPU (GHz) | Clock della GPU (MHz) | Temperatura media della CPU (°C) | Temperatura media della GPU (°C) | |
| Sistema inattivo | -- | -- | 48 | 38 |
| Stress Prime95 | ~2,0 - 2,4 | -- | 81 | 56 |
| Prime95 + FurMark Stress | ~1,5 | 1605 | 94 | 87 |
| Witcher 3 Stress (modalità bilanciata) | ~0,7 | 2085 | 80 | 77 |
| Witcher 3 Stress (modalità Performance) | ~0,7 | 2115 | 97 | 87 |
Altoparlanti
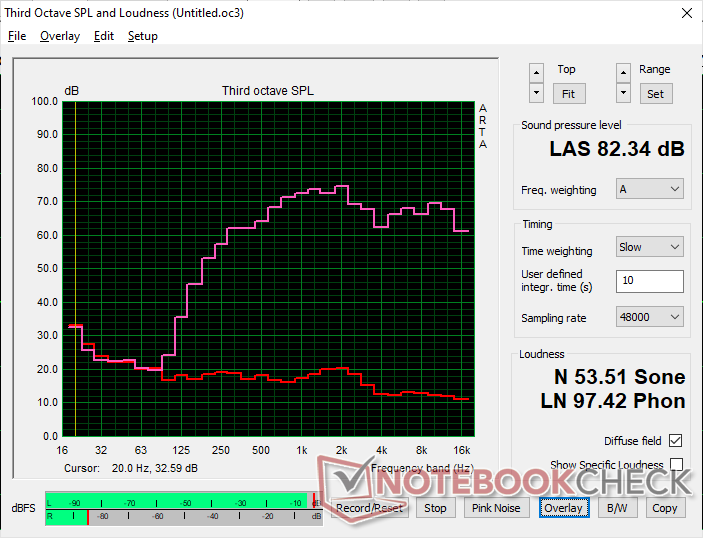
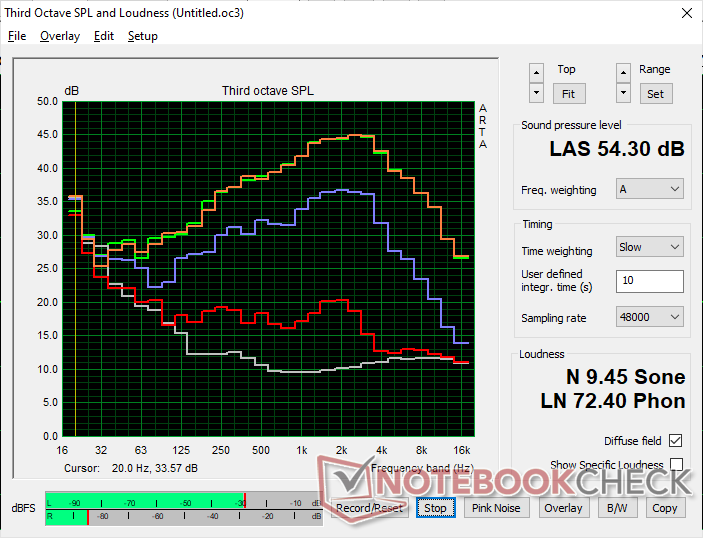
HP Omen Transcend 16 analisi audio
(+) | gli altoparlanti sono relativamente potenti (82.3 dB)
Bassi 100 - 315 Hz
(-) | quasi nessun basso - in media 20% inferiori alla media
(±) | la linearità dei bassi è media (14.3% delta rispetto alla precedente frequenza)
Medi 400 - 2000 Hz
(±) | medi elevati - circa 5.2% superiore alla media
(+) | medi lineari (3.7% delta rispetto alla precedente frequenza)
Alti 2 - 16 kHz
(+) | Alti bilanciati - appena 2% dalla media
(+) | alti lineari (6.7% delta rispetto alla precedente frequenza)
Nel complesso 100 - 16.000 Hz
(±) | la linearità complessiva del suono è media (17% di differenza rispetto alla media
Rispetto alla stessa classe
» 45% di tutti i dispositivi testati in questa classe è stato migliore, 12% simile, 43% peggiore
» Il migliore ha avuto un delta di 6%, medio di 18%, peggiore di 132%
Rispetto a tutti i dispositivi testati
» 31% di tutti i dispositivi testati in questa classe è stato migliore, 8% similare, 61% peggiore
» Il migliore ha avuto un delta di 4%, medio di 23%, peggiore di 134%
Apple MacBook Pro 16 2021 M1 Pro analisi audio
(+) | gli altoparlanti sono relativamente potenti (84.7 dB)
Bassi 100 - 315 Hz
(+) | bassi buoni - solo 3.8% dalla media
(+) | bassi in lineaa (5.2% delta rispetto alla precedente frequenza)
Medi 400 - 2000 Hz
(+) | medi bilanciati - solo only 1.3% rispetto alla media
(+) | medi lineari (2.1% delta rispetto alla precedente frequenza)
Alti 2 - 16 kHz
(+) | Alti bilanciati - appena 1.9% dalla media
(+) | alti lineari (2.7% delta rispetto alla precedente frequenza)
Nel complesso 100 - 16.000 Hz
(+) | suono nel complesso lineare (4.6% differenza dalla media)
Rispetto alla stessa classe
» 0% di tutti i dispositivi testati in questa classe è stato migliore, 0% simile, 100% peggiore
» Il migliore ha avuto un delta di 5%, medio di 17%, peggiore di 45%
Rispetto a tutti i dispositivi testati
» 0% di tutti i dispositivi testati in questa classe è stato migliore, 0% similare, 100% peggiore
» Il migliore ha avuto un delta di 4%, medio di 23%, peggiore di 134%
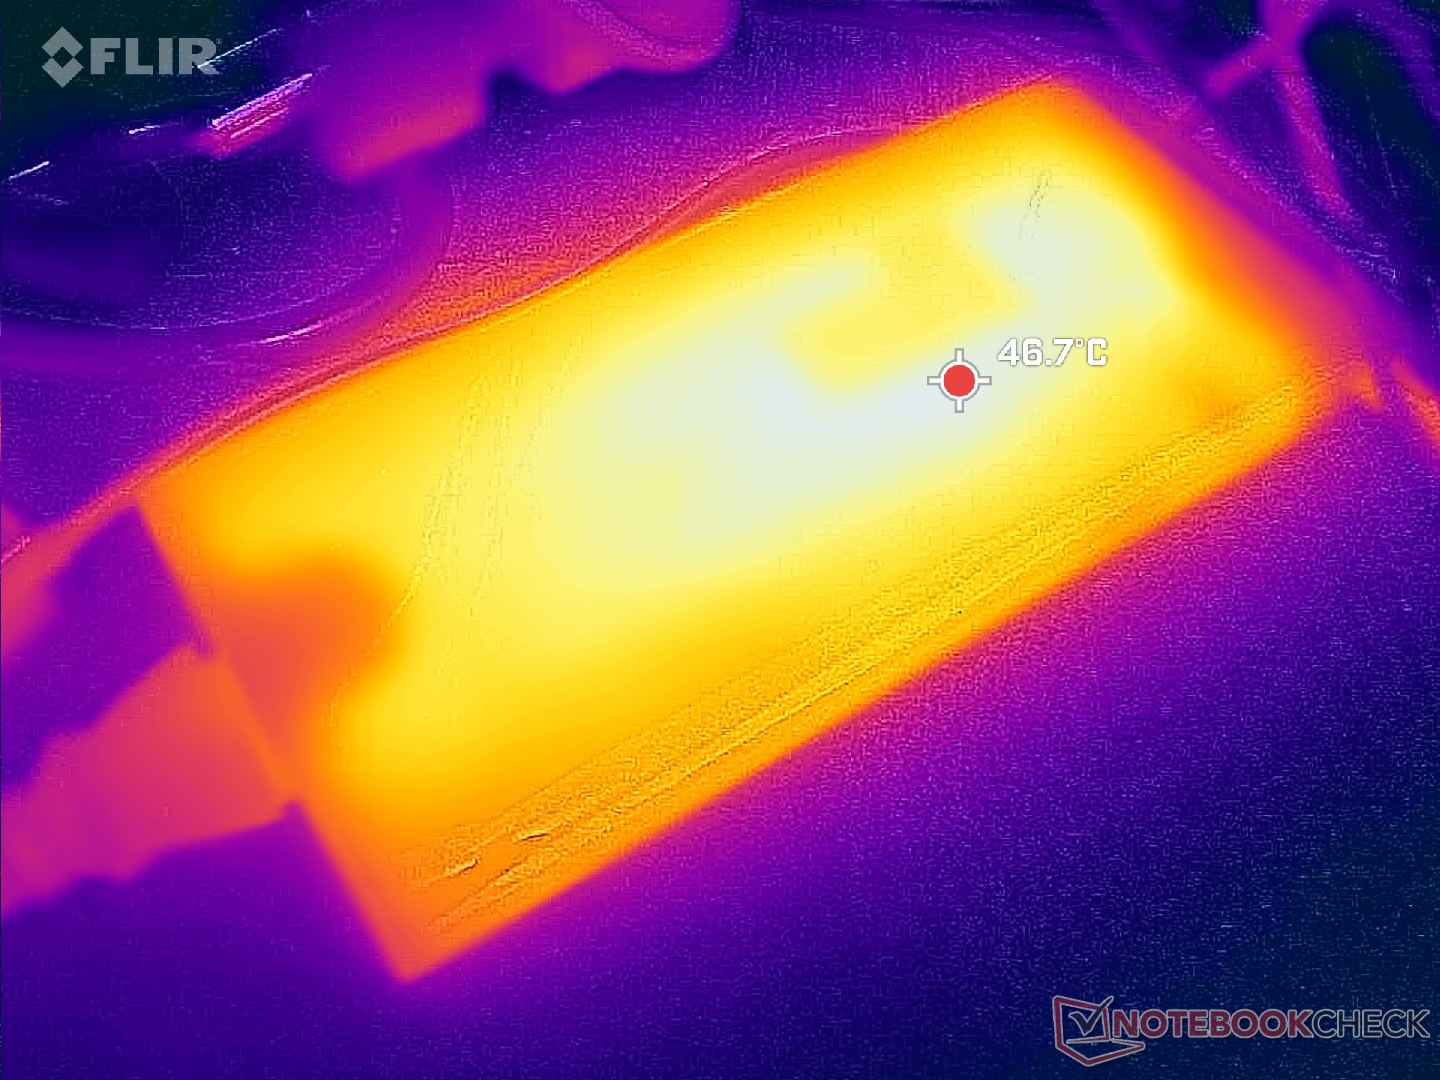
Gestione dell'energia
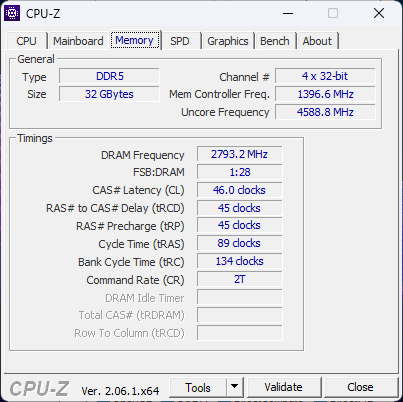
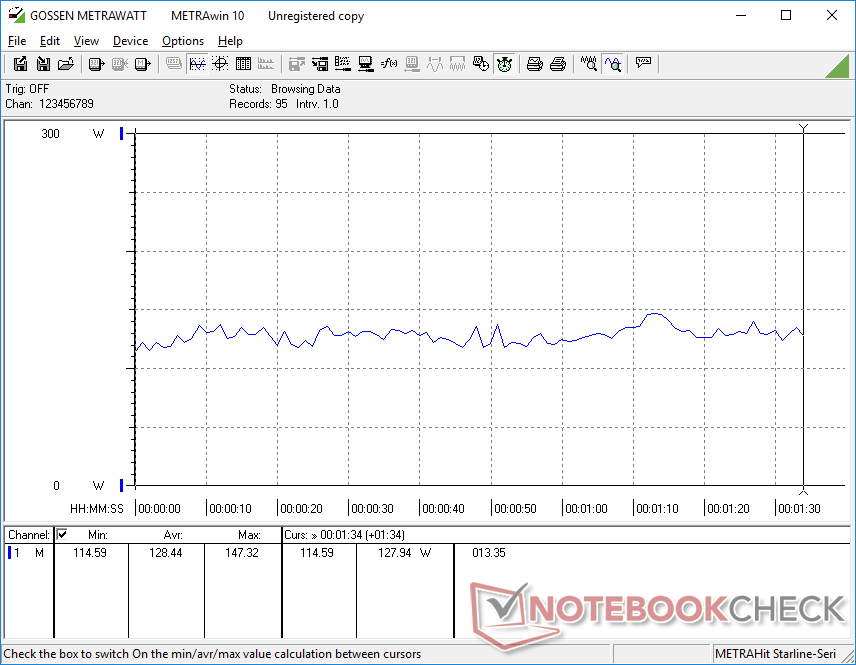
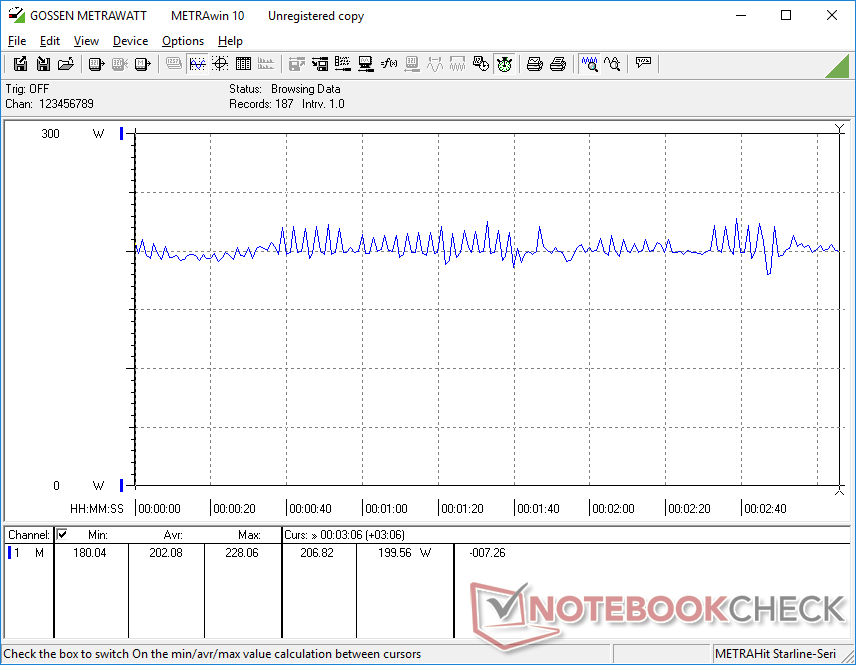
Consumo di energia - Numeri elevati quando il motore è al minimo
Il nostro Omen Transcend 16 è dotato di una CPU più veloce ma di una GPU più lenta rispetto all'Omen 16 e quindi il consumo medio di energia è circa lo stesso tra i due. Le differenze diventano più evidenti quando si stressa solo la CPU o la GPU. Ad esempio, l'Omen Transcend 16 consuma circa 15-20 W in più quando si esegue Prime95, mentre consuma circa 15 W in meno quando si esegue FurMark.
Il funzionamento al minimo sul desktop può arrivare a consumare fino a 55 W con il profilo Performance. Il Mini-LED è noto per essere generalmente più esigente di un'alternativa IPS standard.
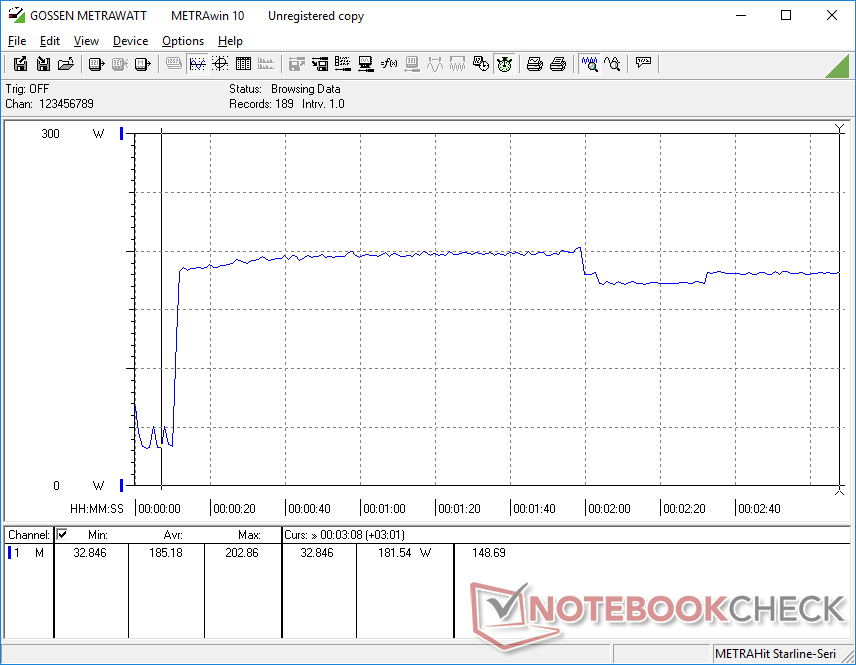
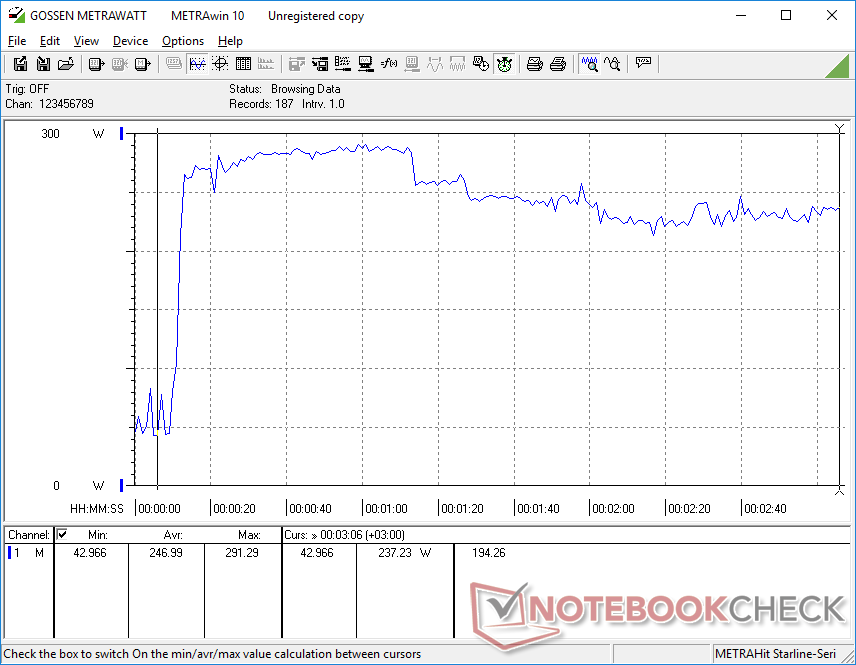
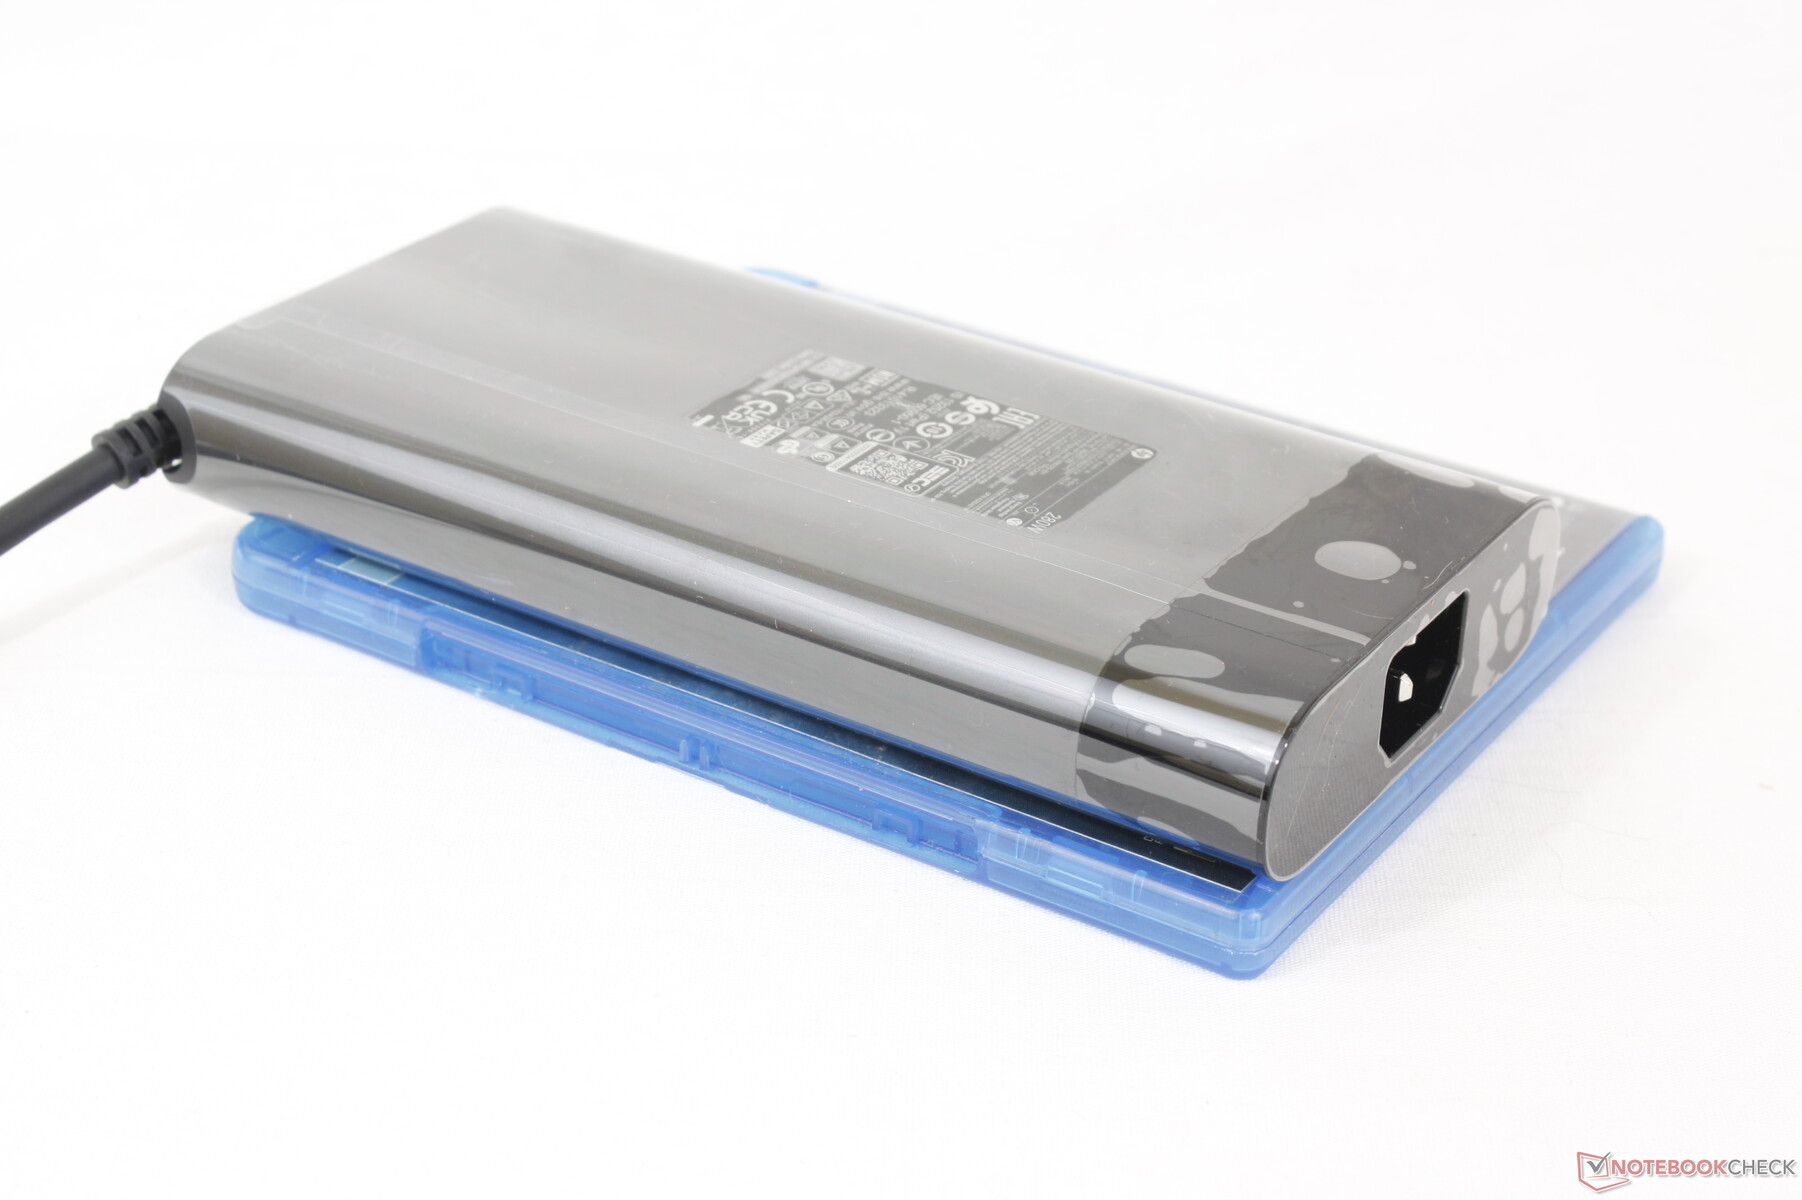
Siamo riusciti a registrare un consumo massimo di 292 W dall'adattatore CA medio-grande (~18 x 8,7 x 2,6 cm) da 280 W quando la CPU e la GPU sono utilizzate al 100%. Il consumo si stabilizza nell'intervallo di 240 W dopo circa un minuto di pieno stress.
| Off / Standby | |
| Idle | |
| Sotto carico |
|
Leggenda:
min: | |
| HP Omen Transcend 16 i9-13900HX, GeForce RTX 4070 Laptop GPU, SK hynix PC801 HFS002TEJ9X101N, Mini-LED, 2560x1600, 16" | Lenovo Legion Slim 7i 16 Gen 8 i9-13900H, GeForce RTX 4070 Laptop GPU, Samsung PM9A1 MZVL21T0HCLR, IPS, 2560x1600, 16" | HP Omen 16-wf000 i7-13700HX, GeForce RTX 4080 Laptop GPU, SK hynix PC801 HFS002TEJ9X101N, IPS, 2560x1440, 16.1" | Alienware x16 R1 i9-13900HK, GeForce RTX 4080 Laptop GPU, SK hynix PC801 HFS001TEJ9X101N, IPS, 2560x1600, 16" | Acer Nitro 16 AN16-41 R7 7735HS, GeForce RTX 4070 Laptop GPU, Samsung PM9A1 MZVL21T0HCLR, IPS, 2560x1600, 16" | Asus ROG Zephyrus M16 GU603Z i9-12900H, GeForce RTX 3070 Ti Laptop GPU, Micron 3400 1TB MTFDKBA1T0TFH, IPS, 2560x1600, 16" | |
|---|---|---|---|---|---|---|
| Power Consumption | 9% | 3% | -12% | 29% | 34% | |
| Idle Minimum * (Watt) | 19.2 | 22 -15% | 21.8 -14% | 25.2 -31% | 11.6 40% | 10.8 44% |
| Idle Average * (Watt) | 22.7 | 29 -28% | 26 -15% | 29.9 -32% | 15.6 31% | 17 25% |
| Idle Maximum * (Watt) | 55.4 | 39.5 29% | 36 35% | 49.8 10% | 16.5 70% | 17.8 68% |
| Load Average * (Watt) | 128.4 | 98.7 23% | 115.5 10% | 105.4 18% | 155 -21% | 116 10% |
| Witcher 3 ultra * (Watt) | 206 | 171.8 17% | 214 -4% | 263 -28% | 154.8 25% | 144 30% |
| Load Maximum * (Watt) | 292 | 213.2 27% | 269.7 8% | 313.8 -7% | 205 30% | 220 25% |
* ... Meglio usare valori piccoli
Power Consumption Witcher 3 / Stresstest
Power Consumption external Monitor
Durata della batteria
La capacità della batteria è aumentata, passando da 83 Wh dell'Omen 16 a 97 Wh dell'Omen Transcend 16. Tuttavia, la durata della batteria è ancora inferiore a causa del pannello mini-LED più esigente. Siamo riusciti a registrare poco più di 4 ore di navigazione WLAN nel mondo reale con il profilo energetico Bilanciato e l'iGPU attiva, mentre l'Omen 16 si avvicina alle 5 ore con impostazioni simili.
La ricarica da vuoto a pieno regime con l'adattatore CA in dotazione richiede circa 90 minuti. Il sistema può essere ricaricato anche tramite USB-C, ma gli adattatori di capacità inferiore potrebbero non funzionare. Il nostro adattatore CA USB-C da 65 W, ad esempio, genera un messaggio di errore di compatibilità, mentre il nostro adattatore USB-C da 135 W si ricarica senza problemi.
| HP Omen Transcend 16 i9-13900HX, GeForce RTX 4070 Laptop GPU, 97 Wh | Lenovo Legion Slim 7i 16 Gen 8 i9-13900H, GeForce RTX 4070 Laptop GPU, 99.9 Wh | HP Omen 16-wf000 i7-13700HX, GeForce RTX 4080 Laptop GPU, 83 Wh | Alienware x16 R1 i9-13900HK, GeForce RTX 4080 Laptop GPU, 90 Wh | Acer Nitro 16 AN16-41 R7 7735HS, GeForce RTX 4070 Laptop GPU, 90 Wh | Asus ROG Zephyrus M16 GU603Z i9-12900H, GeForce RTX 3070 Ti Laptop GPU, 90 Wh | |
|---|---|---|---|---|---|---|
| Autonomia della batteria | -13% | 0% | -22% | 86% | 47% | |
| Reader / Idle (h) | 6.3 | 5.1 -19% | 5.5 -13% | 7.3 16% | 12.2 94% | |
| WiFi v1.3 (h) | 4.2 | 4.4 5% | 5.1 21% | 2.5 -40% | 9 114% | 7.4 76% |
| Load (h) | 1.2 | 0.9 -25% | 1.1 -8% | 0.7 -42% | 1.8 50% | 1.4 17% |
| H.264 (h) | 10.2 | 7.3 |
Pro
Contro
Verdetto - Ottimo design e display mini-LED unico, ma dov'è la GeForce RTX 4080?
L'Omen Transcend 16 offre diversi aggiornamenti rispetto all'Omen 16 standard, tra cui un sensore IR, un rapporto di aspetto 16:10, una batteria di maggiore capacità e un'opzione mini-LED. Quest'ultima è forse la più singolare, in quanto il modello è uno dei primi ad avere un display mini-LED QHD+ a 240 Hz, per un'esperienza visiva diversa dalla maggior parte degli altri portatili da gioco in cui IPS e OLED sono ancora comuni. Gli utenti che apprezzano la luminosità e le funzioni HDR1000 apprezzeranno particolarmente i vantaggi del mini-LED.
L'Omen Transcend 16 rinuncia alle opzioni di GPU superiori per una CPU più veloce e un profilo più sottile e leggero. Nel frattempo, il suo display Mini-LED è straordinariamente luminoso per offrire i contenuti HDR più vibranti di qualsiasi altro portatile da gioco.
L'ultimo modello non è necessariamente migliore dell'Omen 16 normale, in quanto omette alcune caratteristiche importanti. In primo luogo, l'Omen Transcend 16 supporta un solo SSD interno, mentre l'Omen 16 ne supporta due. GeForce In secondo luogo, e forse è la cosa più importante, l'Omen Transcend 16 ha un limite massimo di 130 W per la GPU GeForce RTX 4070, mentre l'Omen 16 può essere configurato con una GPU RTX 4080 da 145 W. Questa limitazione della GPU potrebbe essere dovuta al profilo più sottile e all'opzione di CPU Core i9-13900HX più alta dell'Omen Transcend 16. Pertanto, gli utenti che preferiscono prestazioni più elevate della GPU potrebbero prendere in considerazione l'Omen 16 normale omen 16 normale mentre chi preferisce prestazioni più elevate della CPU potrebbe prendere in considerazione l'Omen Transcend 16.
Prezzo e disponibilità
HP distribuisce ora il suo Omen Transcend 16 a partire da 1250 dollari per la configurazione base con Core i7-13700HX e RTX 4050, fino a 2500 dollari per la configurazione della nostra recensione.
HP Omen Transcend 16
- 08/04/2023 v7 (old)
Allen Ngo
Transparency
La selezione dei dispositivi da recensire viene effettuata dalla nostra redazione. Il campione di prova è stato fornito all'autore come prestito dal produttore o dal rivenditore ai fini di questa recensione. L'istituto di credito non ha avuto alcuna influenza su questa recensione, né il produttore ne ha ricevuto una copia prima della pubblicazione. Non vi era alcun obbligo di pubblicare questa recensione. In quanto società mediatica indipendente, Notebookcheck non è soggetta all'autorità di produttori, rivenditori o editori.
Ecco come Notebookcheck esegue i test
Ogni anno, Notebookcheck esamina in modo indipendente centinaia di laptop e smartphone utilizzando procedure standardizzate per garantire che tutti i risultati siano comparabili. Da circa 20 anni sviluppiamo continuamente i nostri metodi di prova e nel frattempo stabiliamo gli standard di settore. Nei nostri laboratori di prova, tecnici ed editori esperti utilizzano apparecchiature di misurazione di alta qualità. Questi test comportano un processo di validazione in più fasi. Il nostro complesso sistema di valutazione si basa su centinaia di misurazioni e parametri di riferimento ben fondati, che mantengono l'obiettività.Price comparison

