Recensione del portatile HP Omen 16 2023: Prestazioni della GeForce RTX 4080 da 145 W

L'Omen 16 del 2023 succede modello dello scorso anno con i più veloci processori Raptor Lake-H di 13a generazione, le GPU Nvidia Ada Lovelace RTX e un design rinnovato del telaio. Può essere considerato un passo avanti rispetto al più economico HP Pavilion Gaming 16.
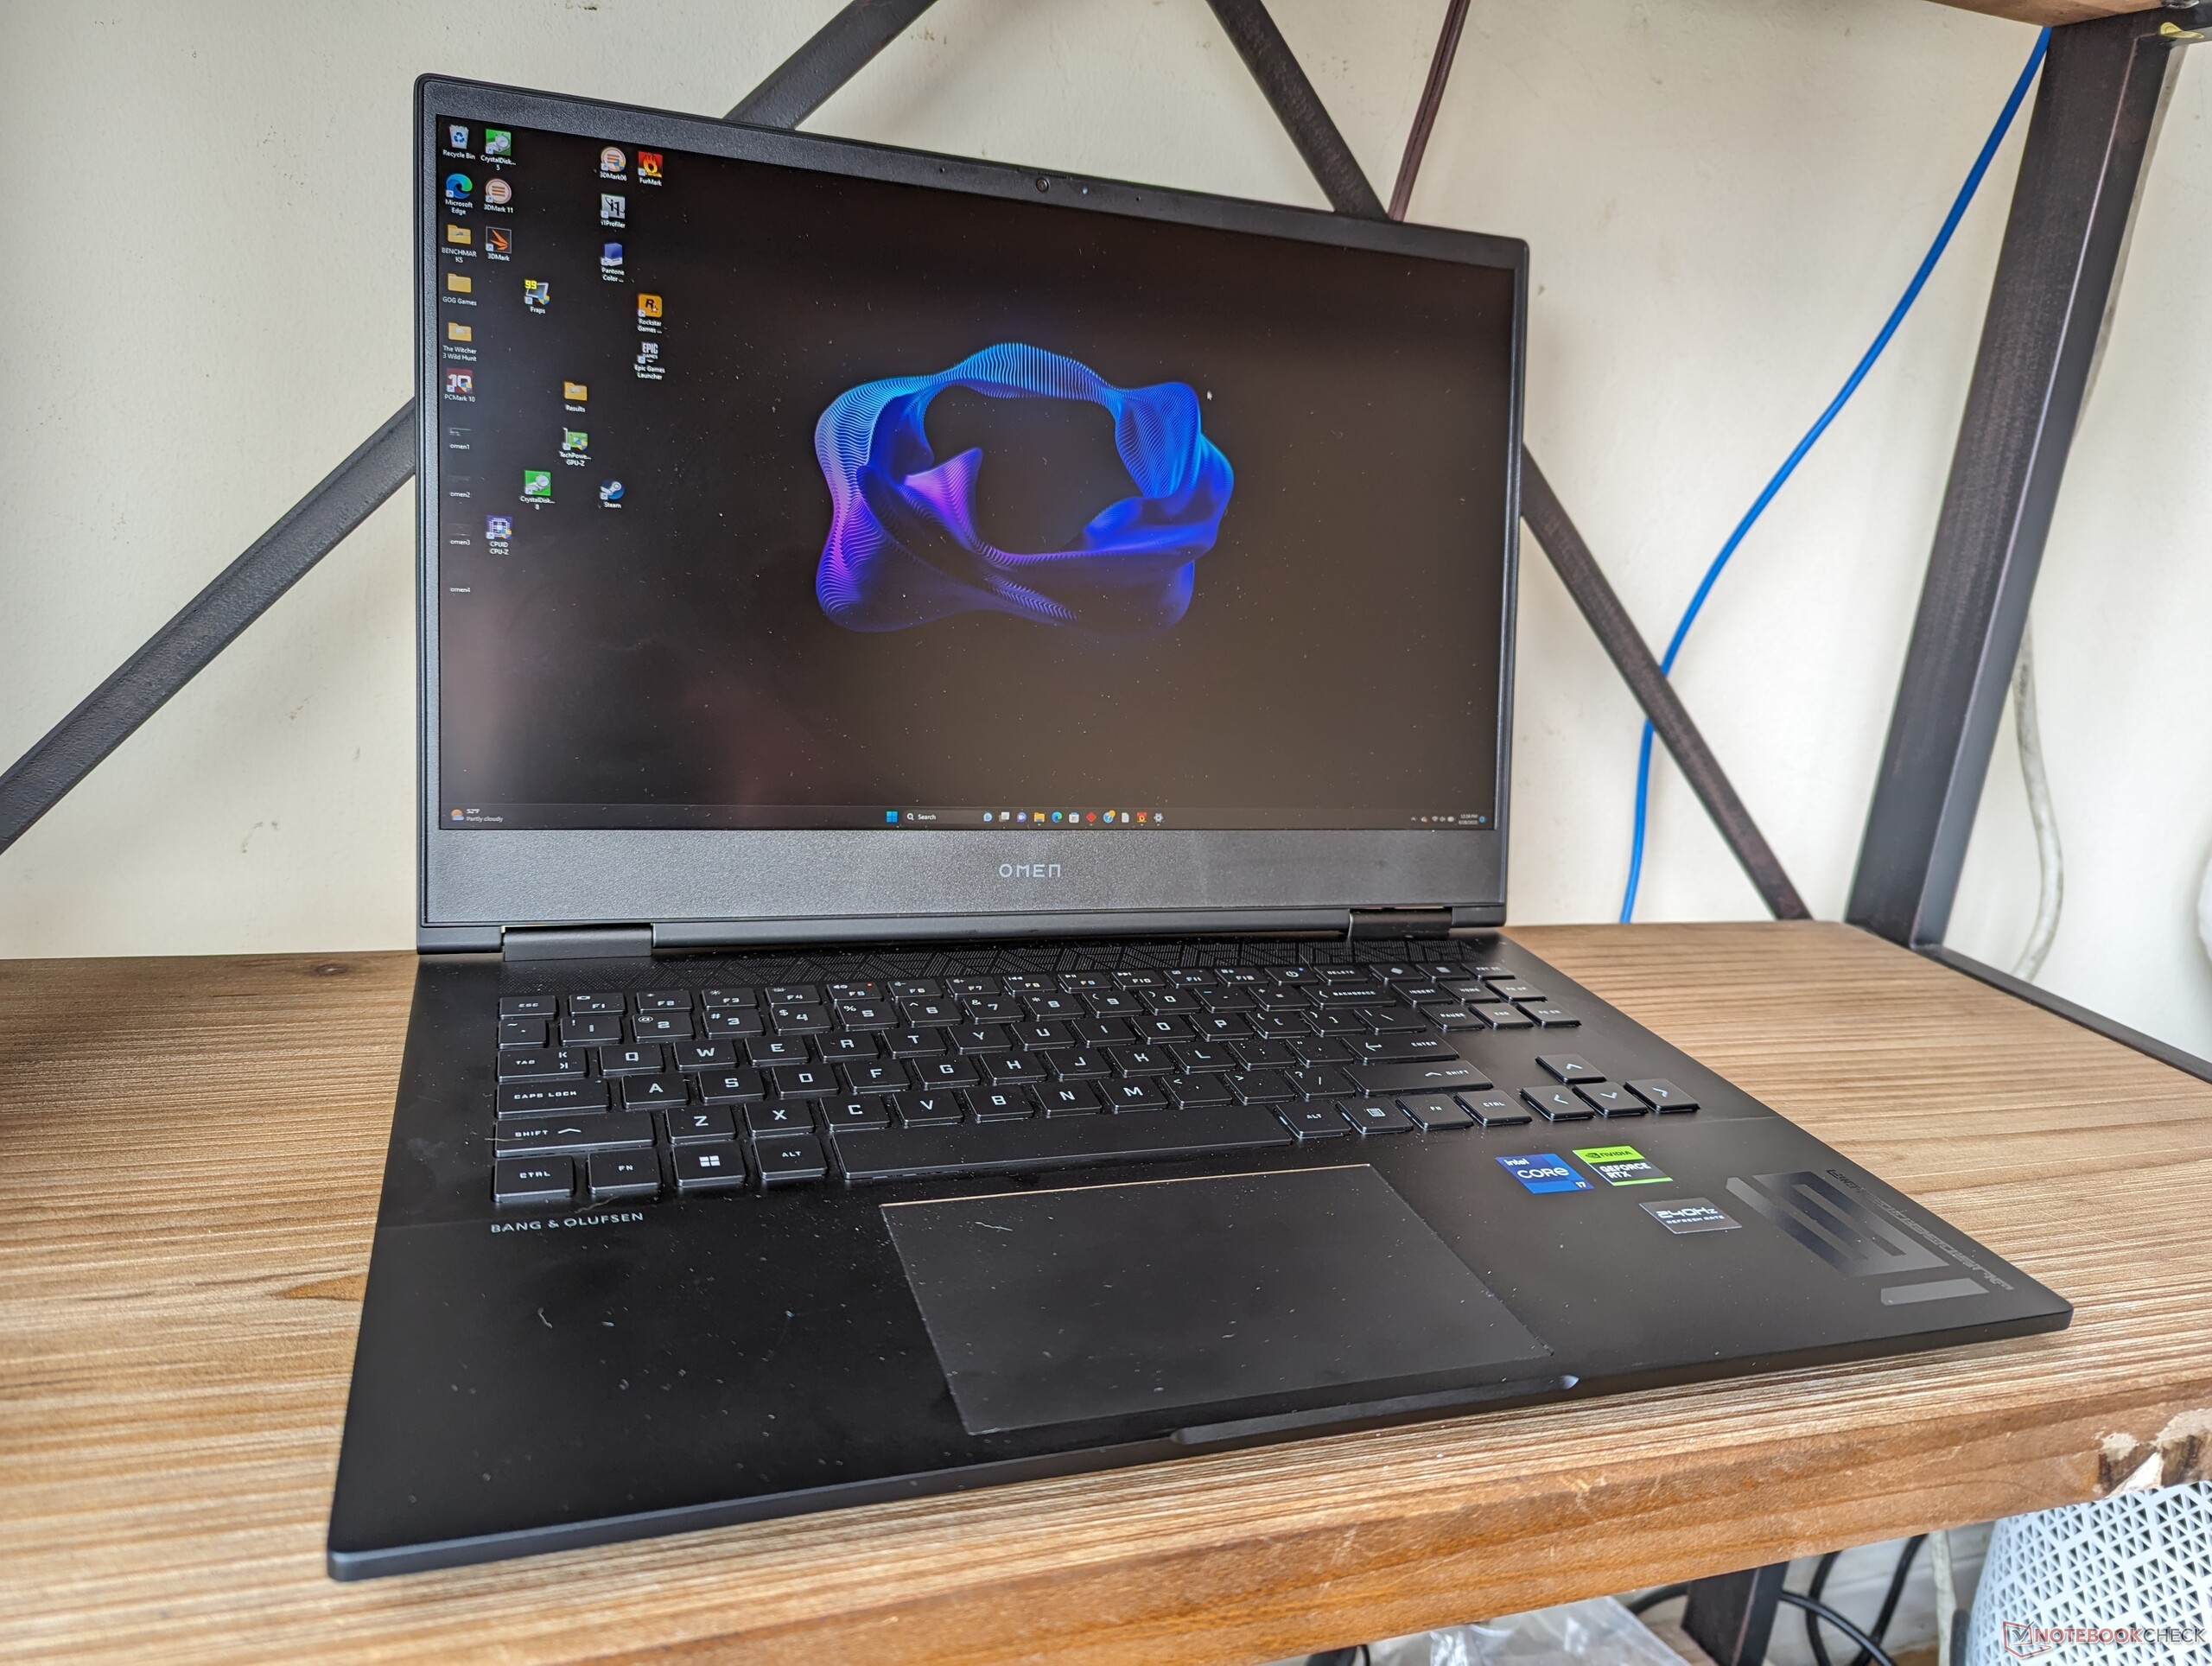
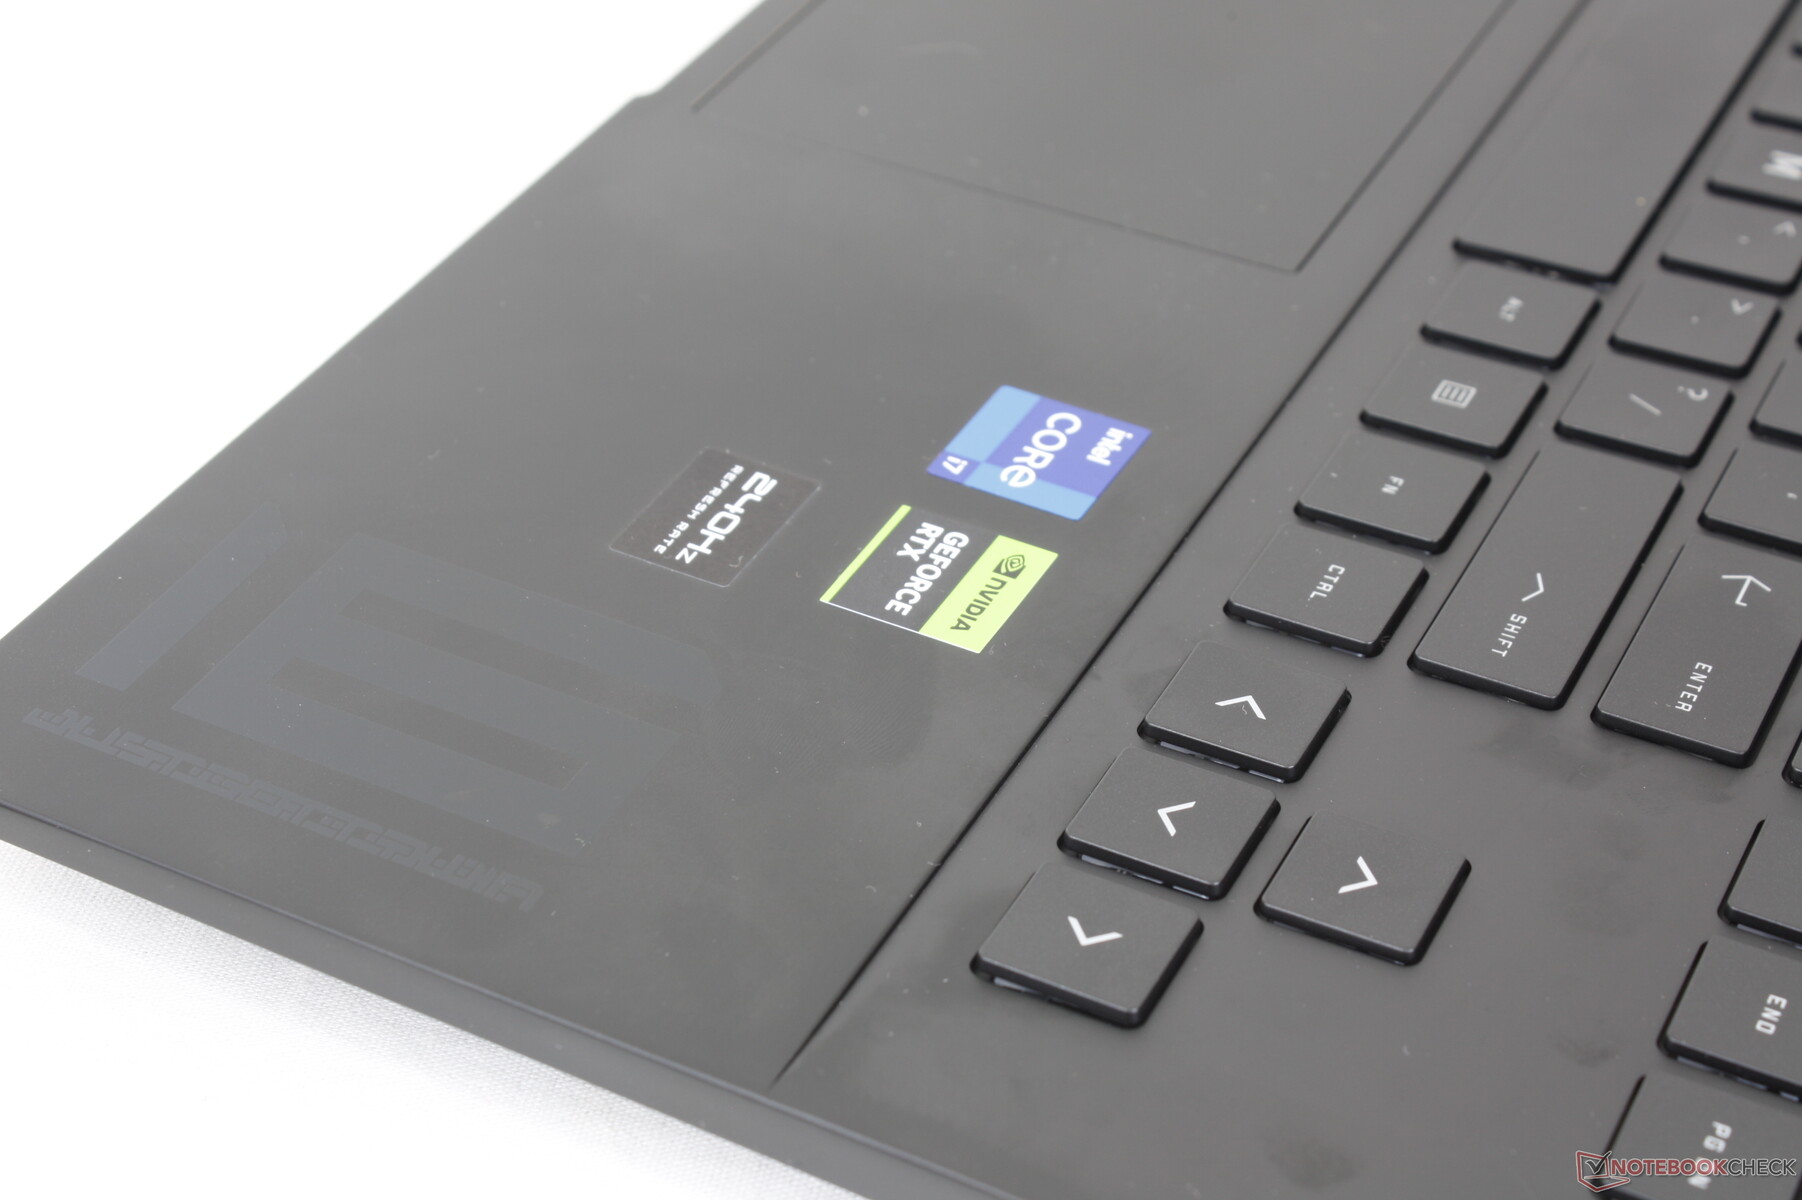
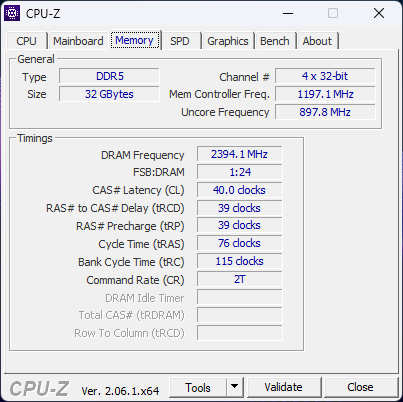
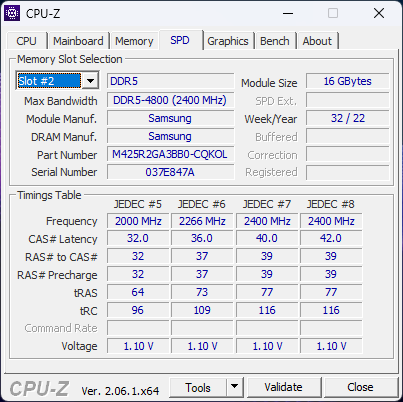
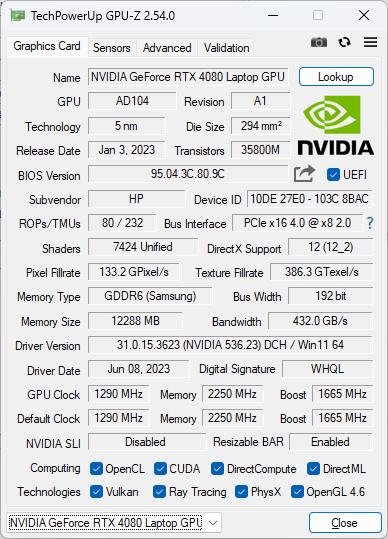
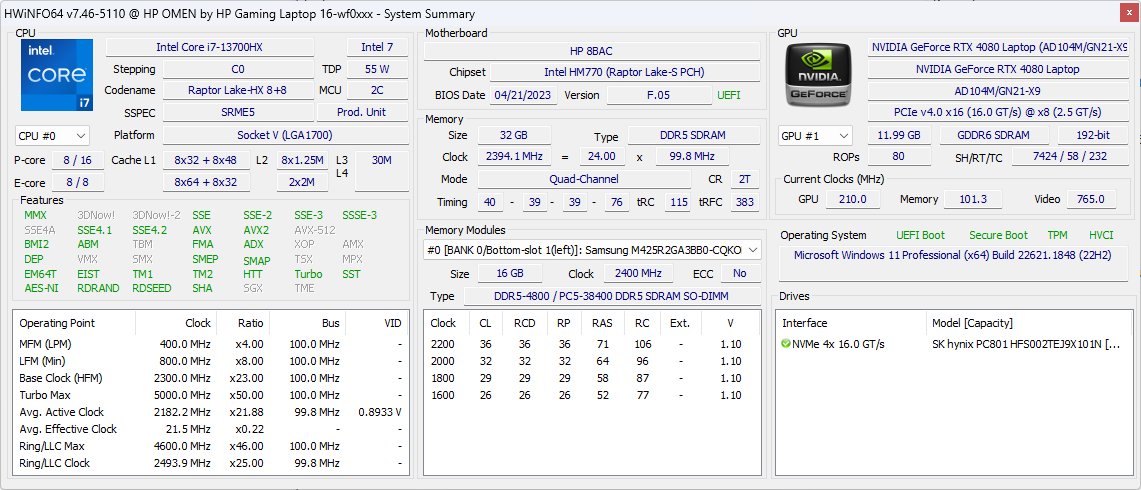
La nostra unità di recensione è la configurazione di fascia più alta con CPU Raptor Lake Core i7-13700HX di 13a generazione, GPU RTX 4080 da 145 W GeForce, display IPS 1440p240, illuminazione RGB per tasto e 32 GB di RAM per poco meno di 2600 dollari. Sono disponibili anche SKU inferiori con RTX 4060, display IPS 1080p165 e illuminazione della tastiera a zona singola, a partire da 1100 dollari. Tutte le opzioni al momento devono essere dotate della stessa CPU Core i7-13700HX. Si noti che quest'anno HP ha abbandonato le opzioni AMD e Radeon.
Tra le alternative all'Omen 16 ci sono altri portatili da gioco da 16 pollici di fascia alta come l' Alienware x16 R1,Lenovo Legion Pro 7 16,Asus ROG Strix G16, o Razer Blade 16.
Altre recensioni di HP:
Potenziali concorrenti a confronto
Punteggio | Data | Modello | Peso | Altezza | Dimensione | Risoluzione | Prezzo |
|---|---|---|---|---|---|---|---|
| 87.4 % v7 (old) | 07/2023 | HP Omen 16-wf000 i7-13700HX, GeForce RTX 4080 Laptop GPU | 2.4 kg | 23.6 mm | 16.10" | 2560x1440 | |
| 86.4 % v7 (old) | 12/2022 | HP Omen 16-n0033dx R7 6800H, Radeon RX 6650M | 2.4 kg | 22.6 mm | 16.10" | 1920x1080 | |
| 88.4 % v7 (old) | 06/2023 | Alienware x16 R1 i9-13900HK, GeForce RTX 4080 Laptop GPU | 2.6 kg | 18.57 mm | 16.00" | 2560x1600 | |
| 88.8 % v7 (old) | 06/2023 | Lenovo Legion Pro 7 RTX4090 i9-13900HX, GeForce RTX 4090 Laptop GPU | 2.7 kg | 26 mm | 16.00" | 2560x1600 | |
| 88.4 % v7 (old) | 03/2023 | Asus ROG Strix G16 G614JZ i9-13980HX, GeForce RTX 4080 Laptop GPU | 2.4 kg | 30.4 mm | 16.00" | 2560x1600 | |
| 91.2 % v7 (old) | 02/2023 | Razer Blade 16 Early 2023 i9-13950HX, GeForce RTX 4080 Laptop GPU | 2.4 kg | 21.99 mm | 16.00" | 2560x1600 |
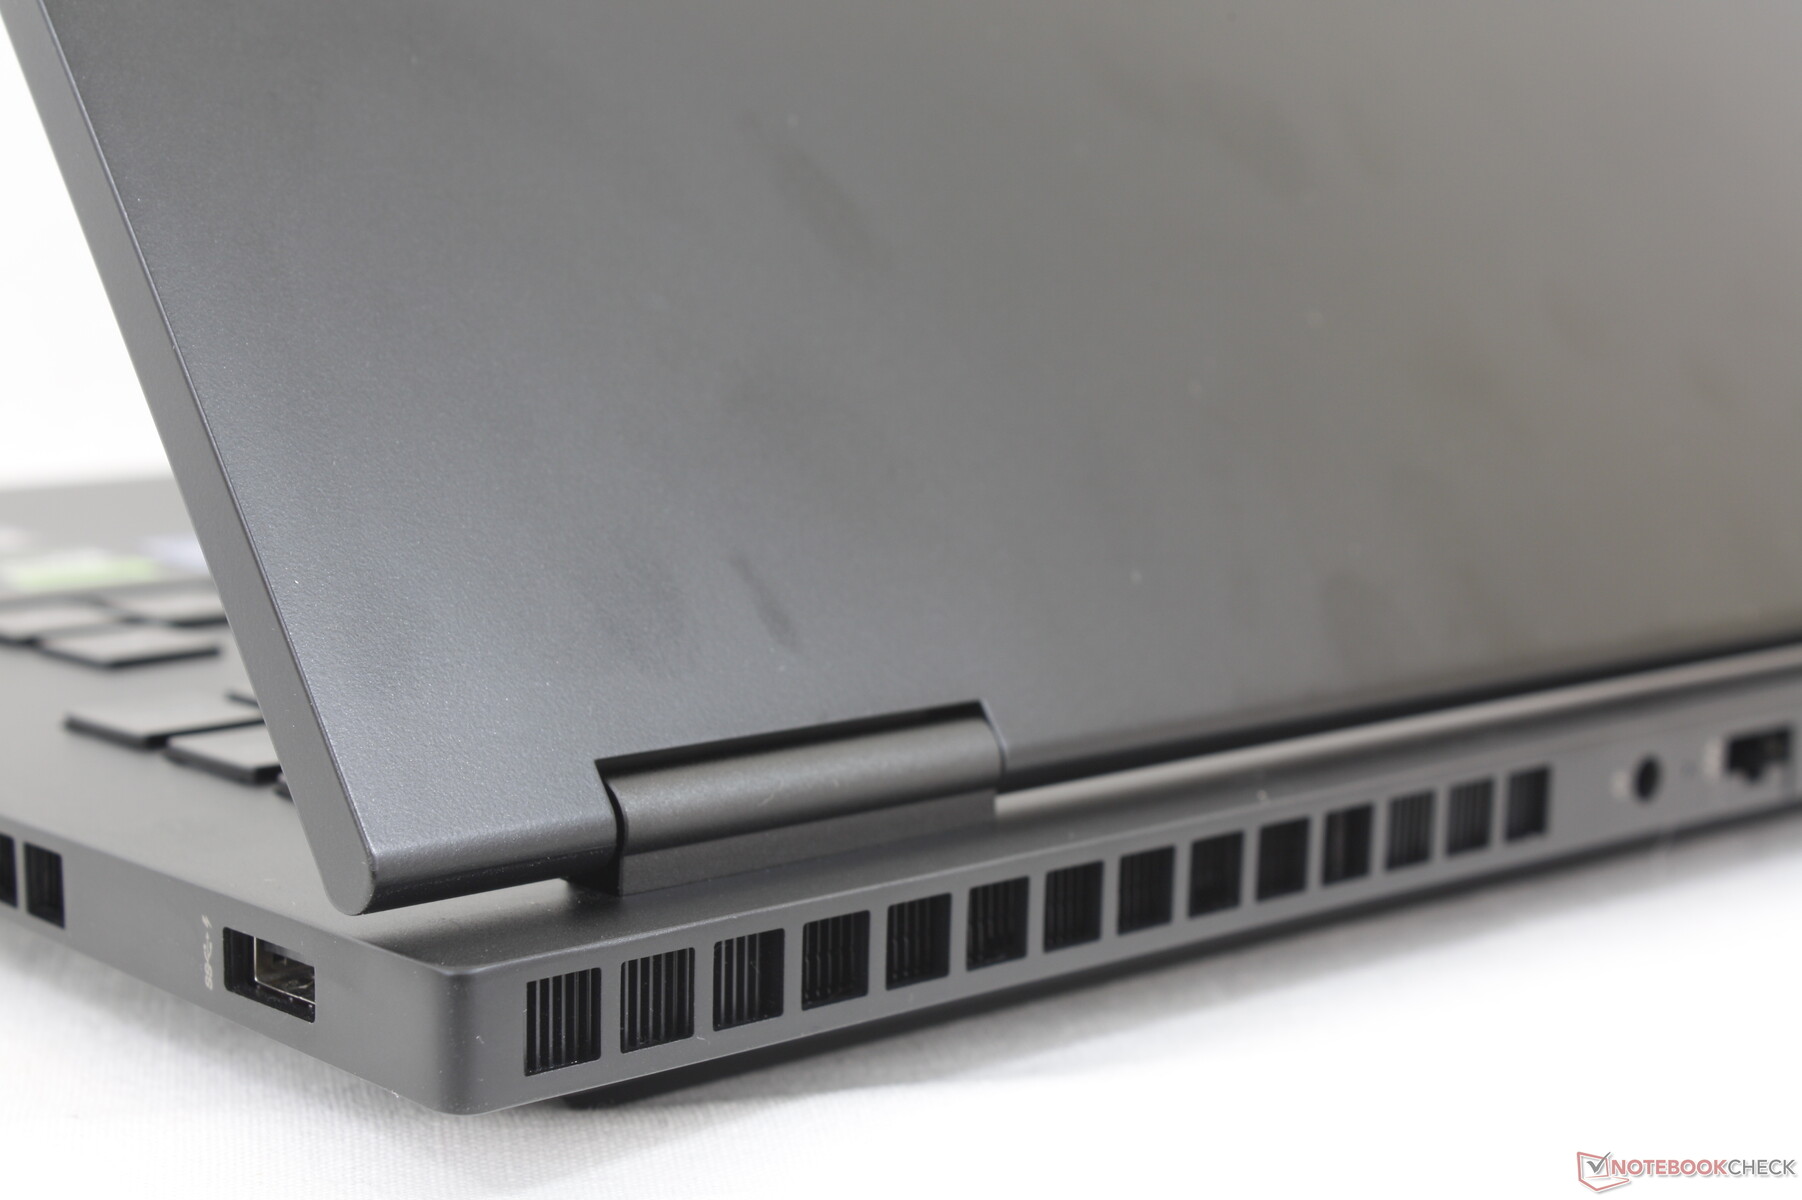
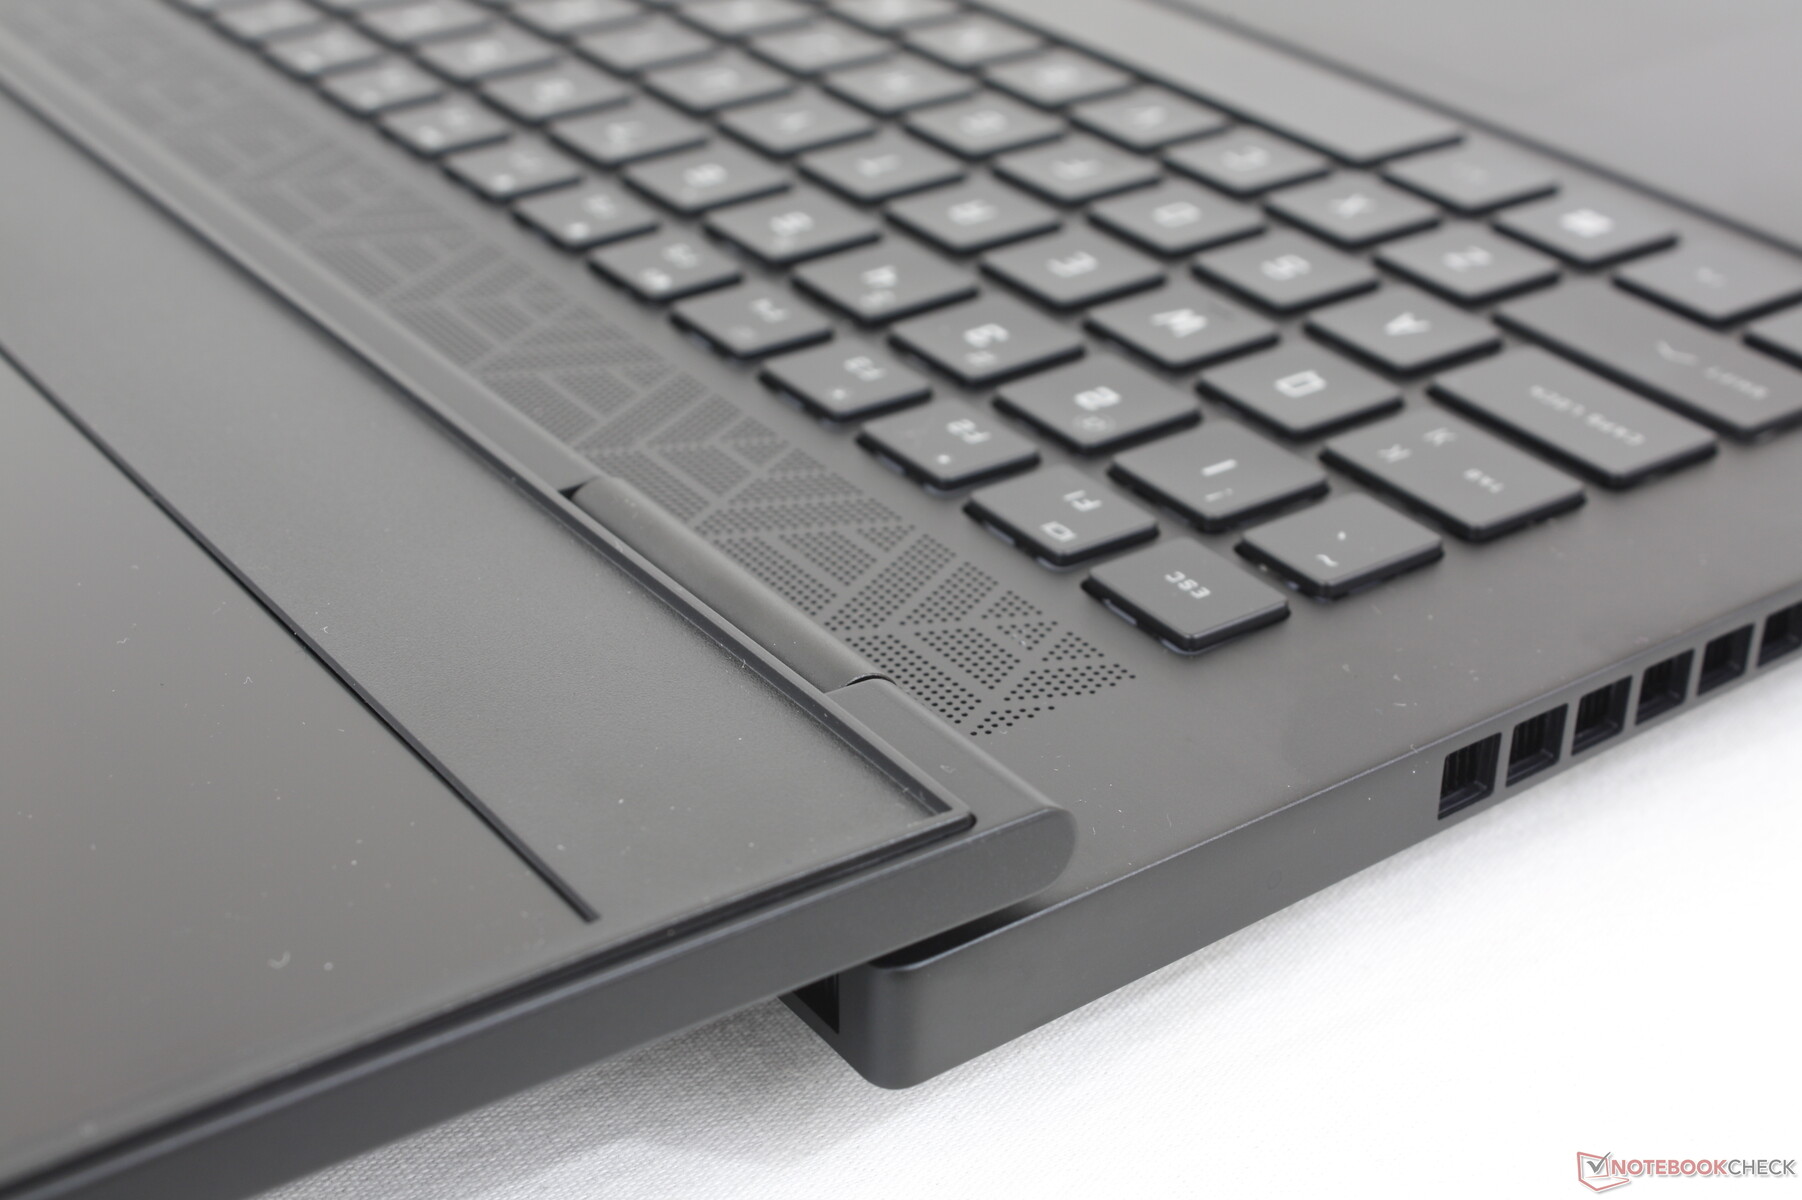
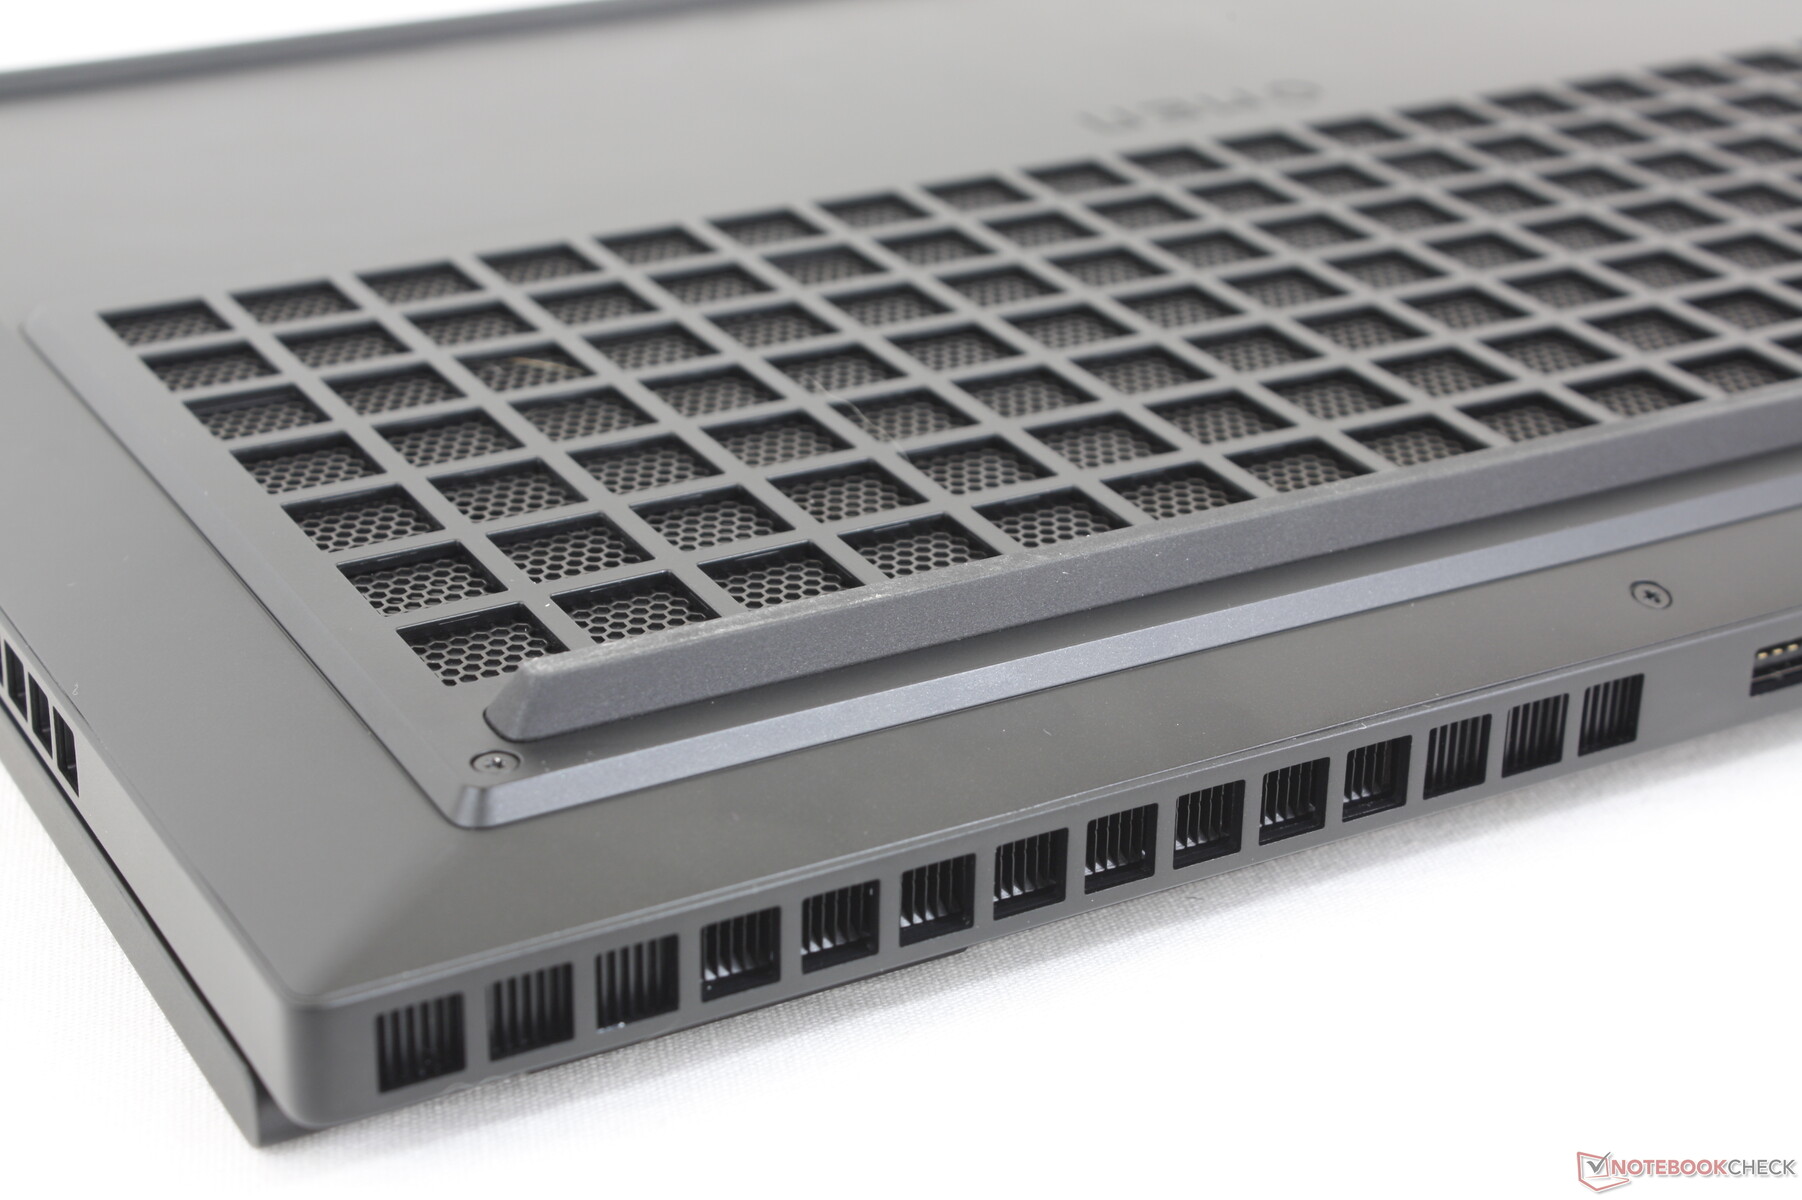
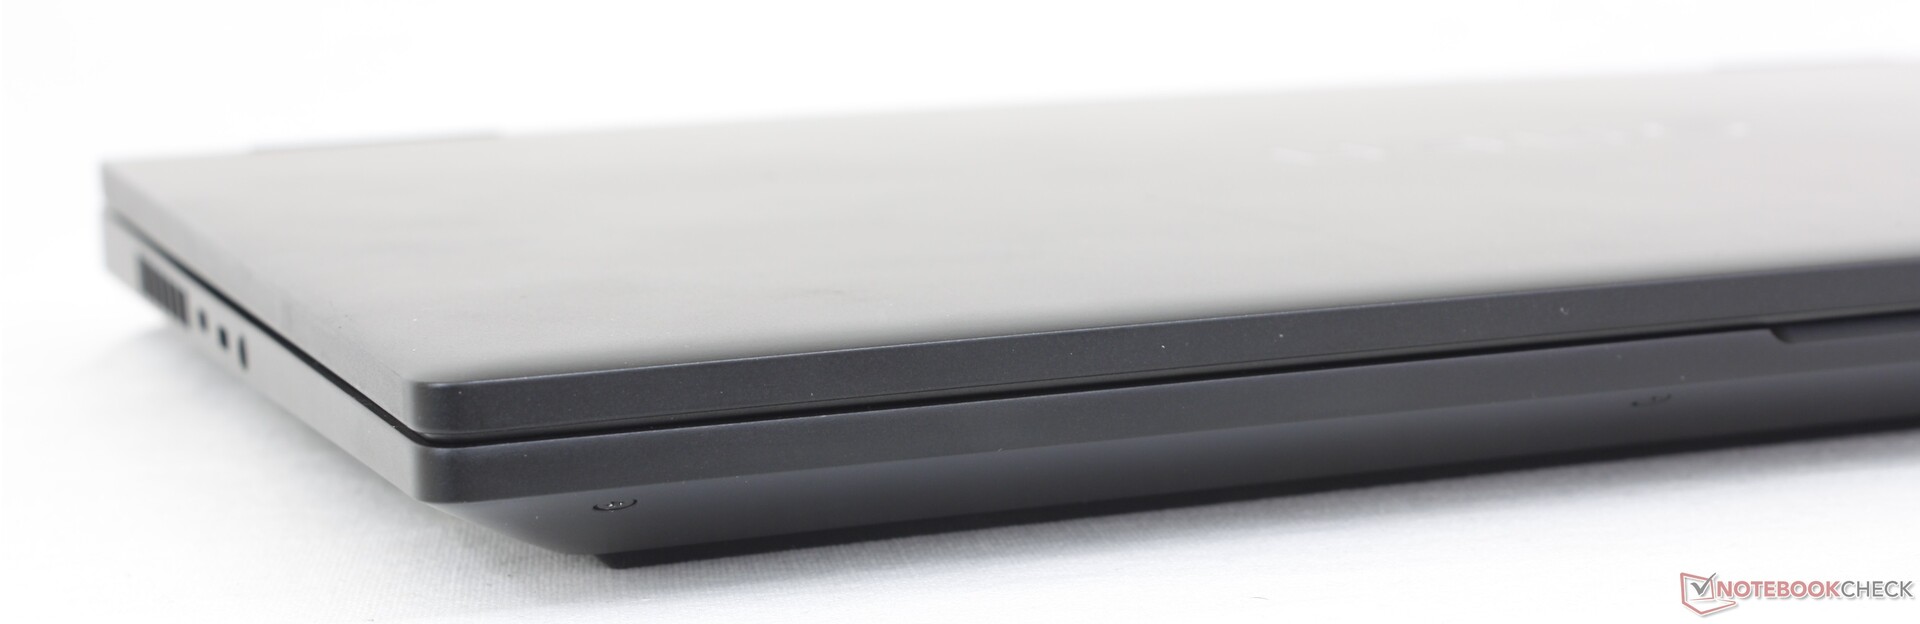
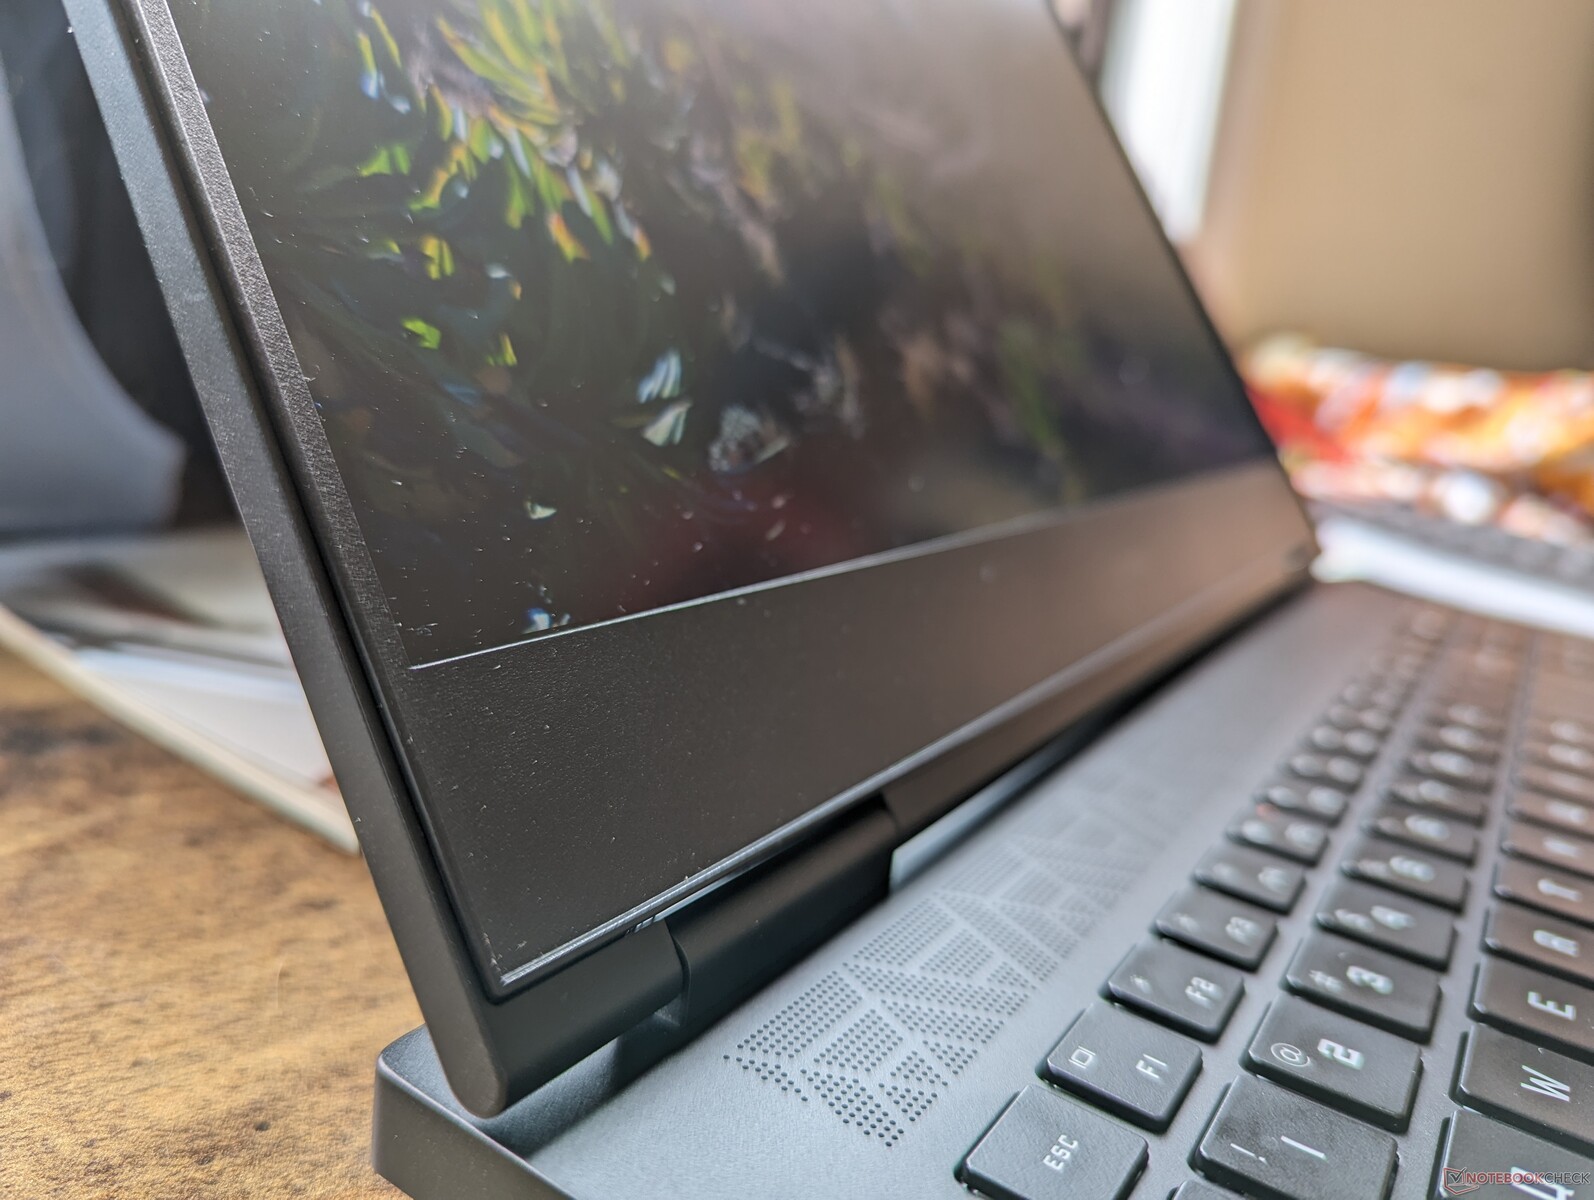
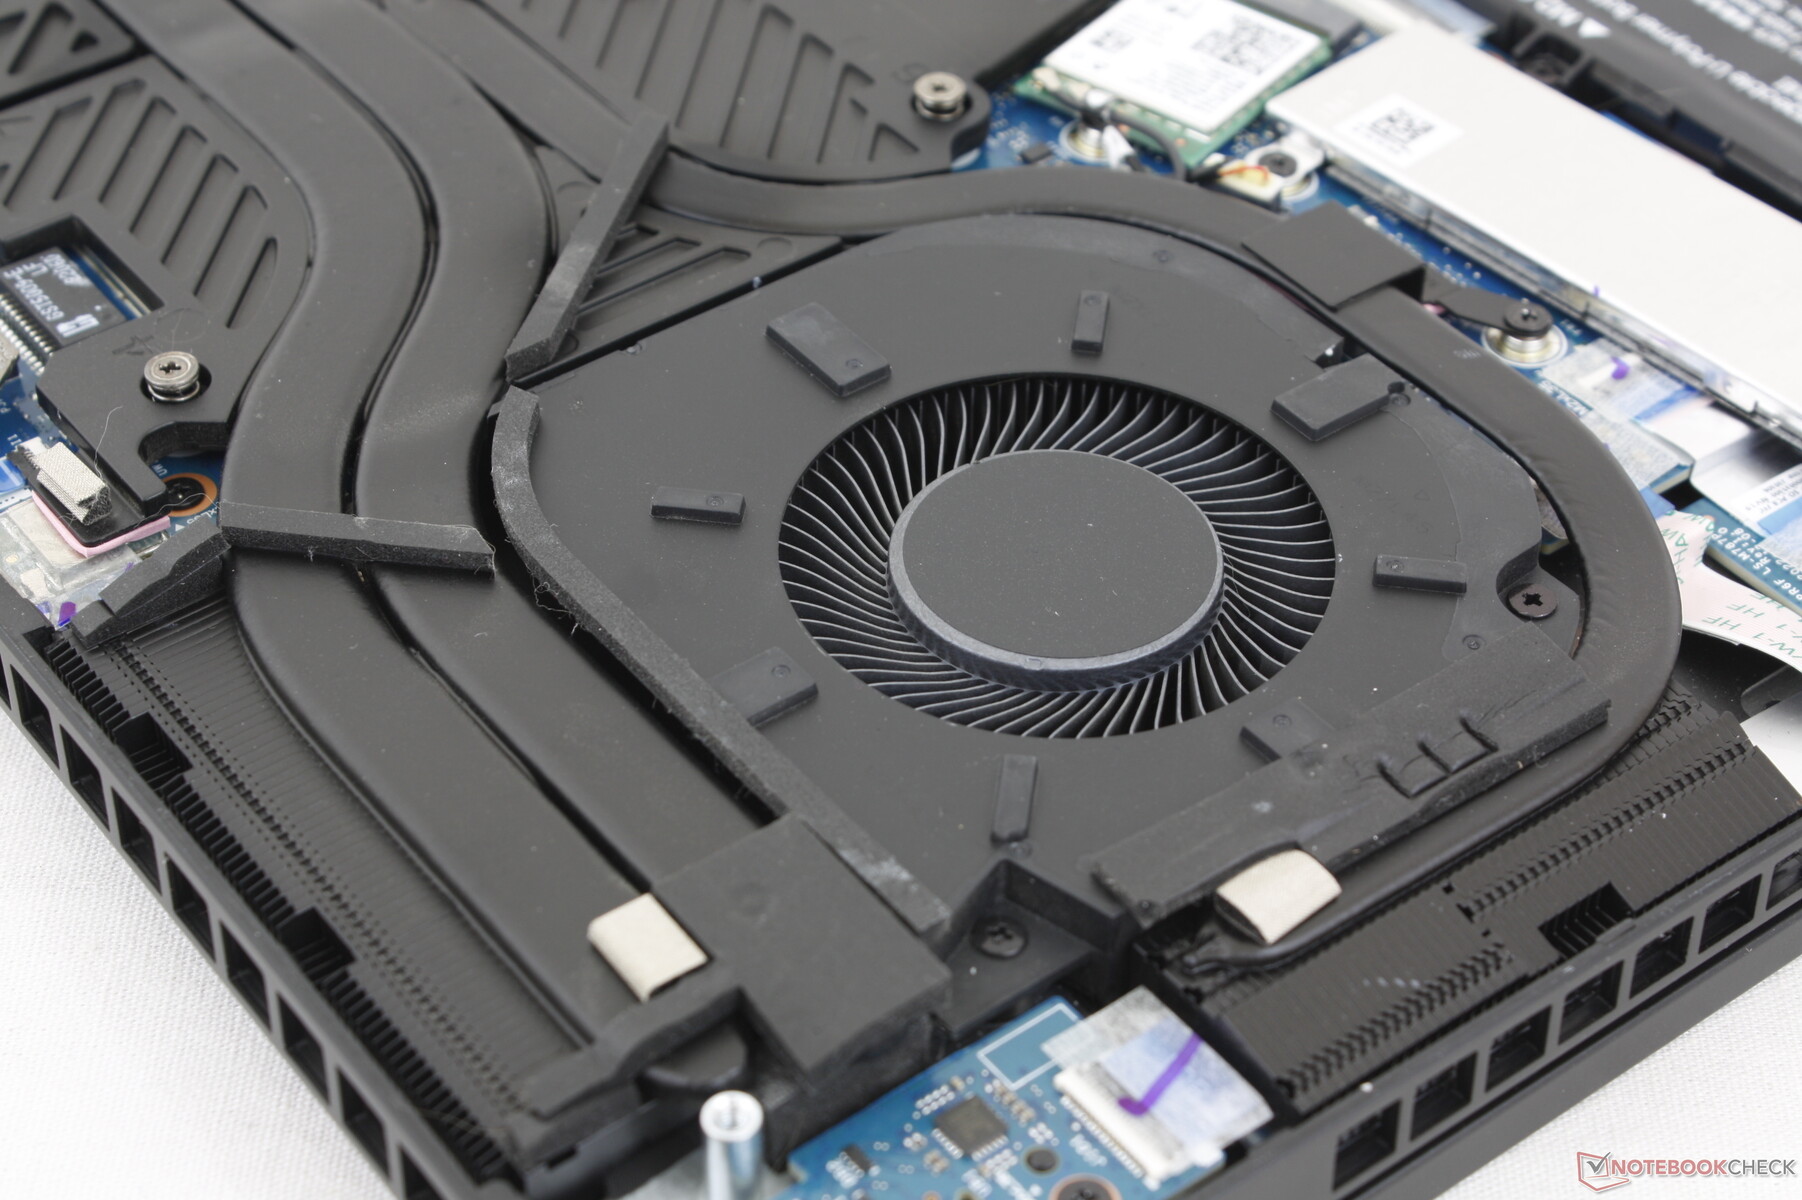
Case - Parte posteriore estesa per un migliore raffreddamento
I principali aggiornamenti visivi di quest'anno riguardano la parte posteriore allungata e le griglie di ventilazione più grandi per adattarsi meglio agli obiettivi TGP più elevati e alle prestazioni più veloci. Il modello appare quindi simile al suo predecessore dalla parte anteriore, mentre i cambiamenti sono molto più evidenti dalla parte posteriore. Per il resto, i materiali metallici e le superfici lisce sembrano identici tra i due modelli.
La rigidità del telaio è molto buona, anche se non è così solida o inflessibile come quella del Razer Blade 16. Se si tenta di ruotare la base e il coperchio, ad esempio, l'HP si deforma leggermente di più. Almeno sulla nostra unità non abbiamo notato scricchiolii o difetti visivi.
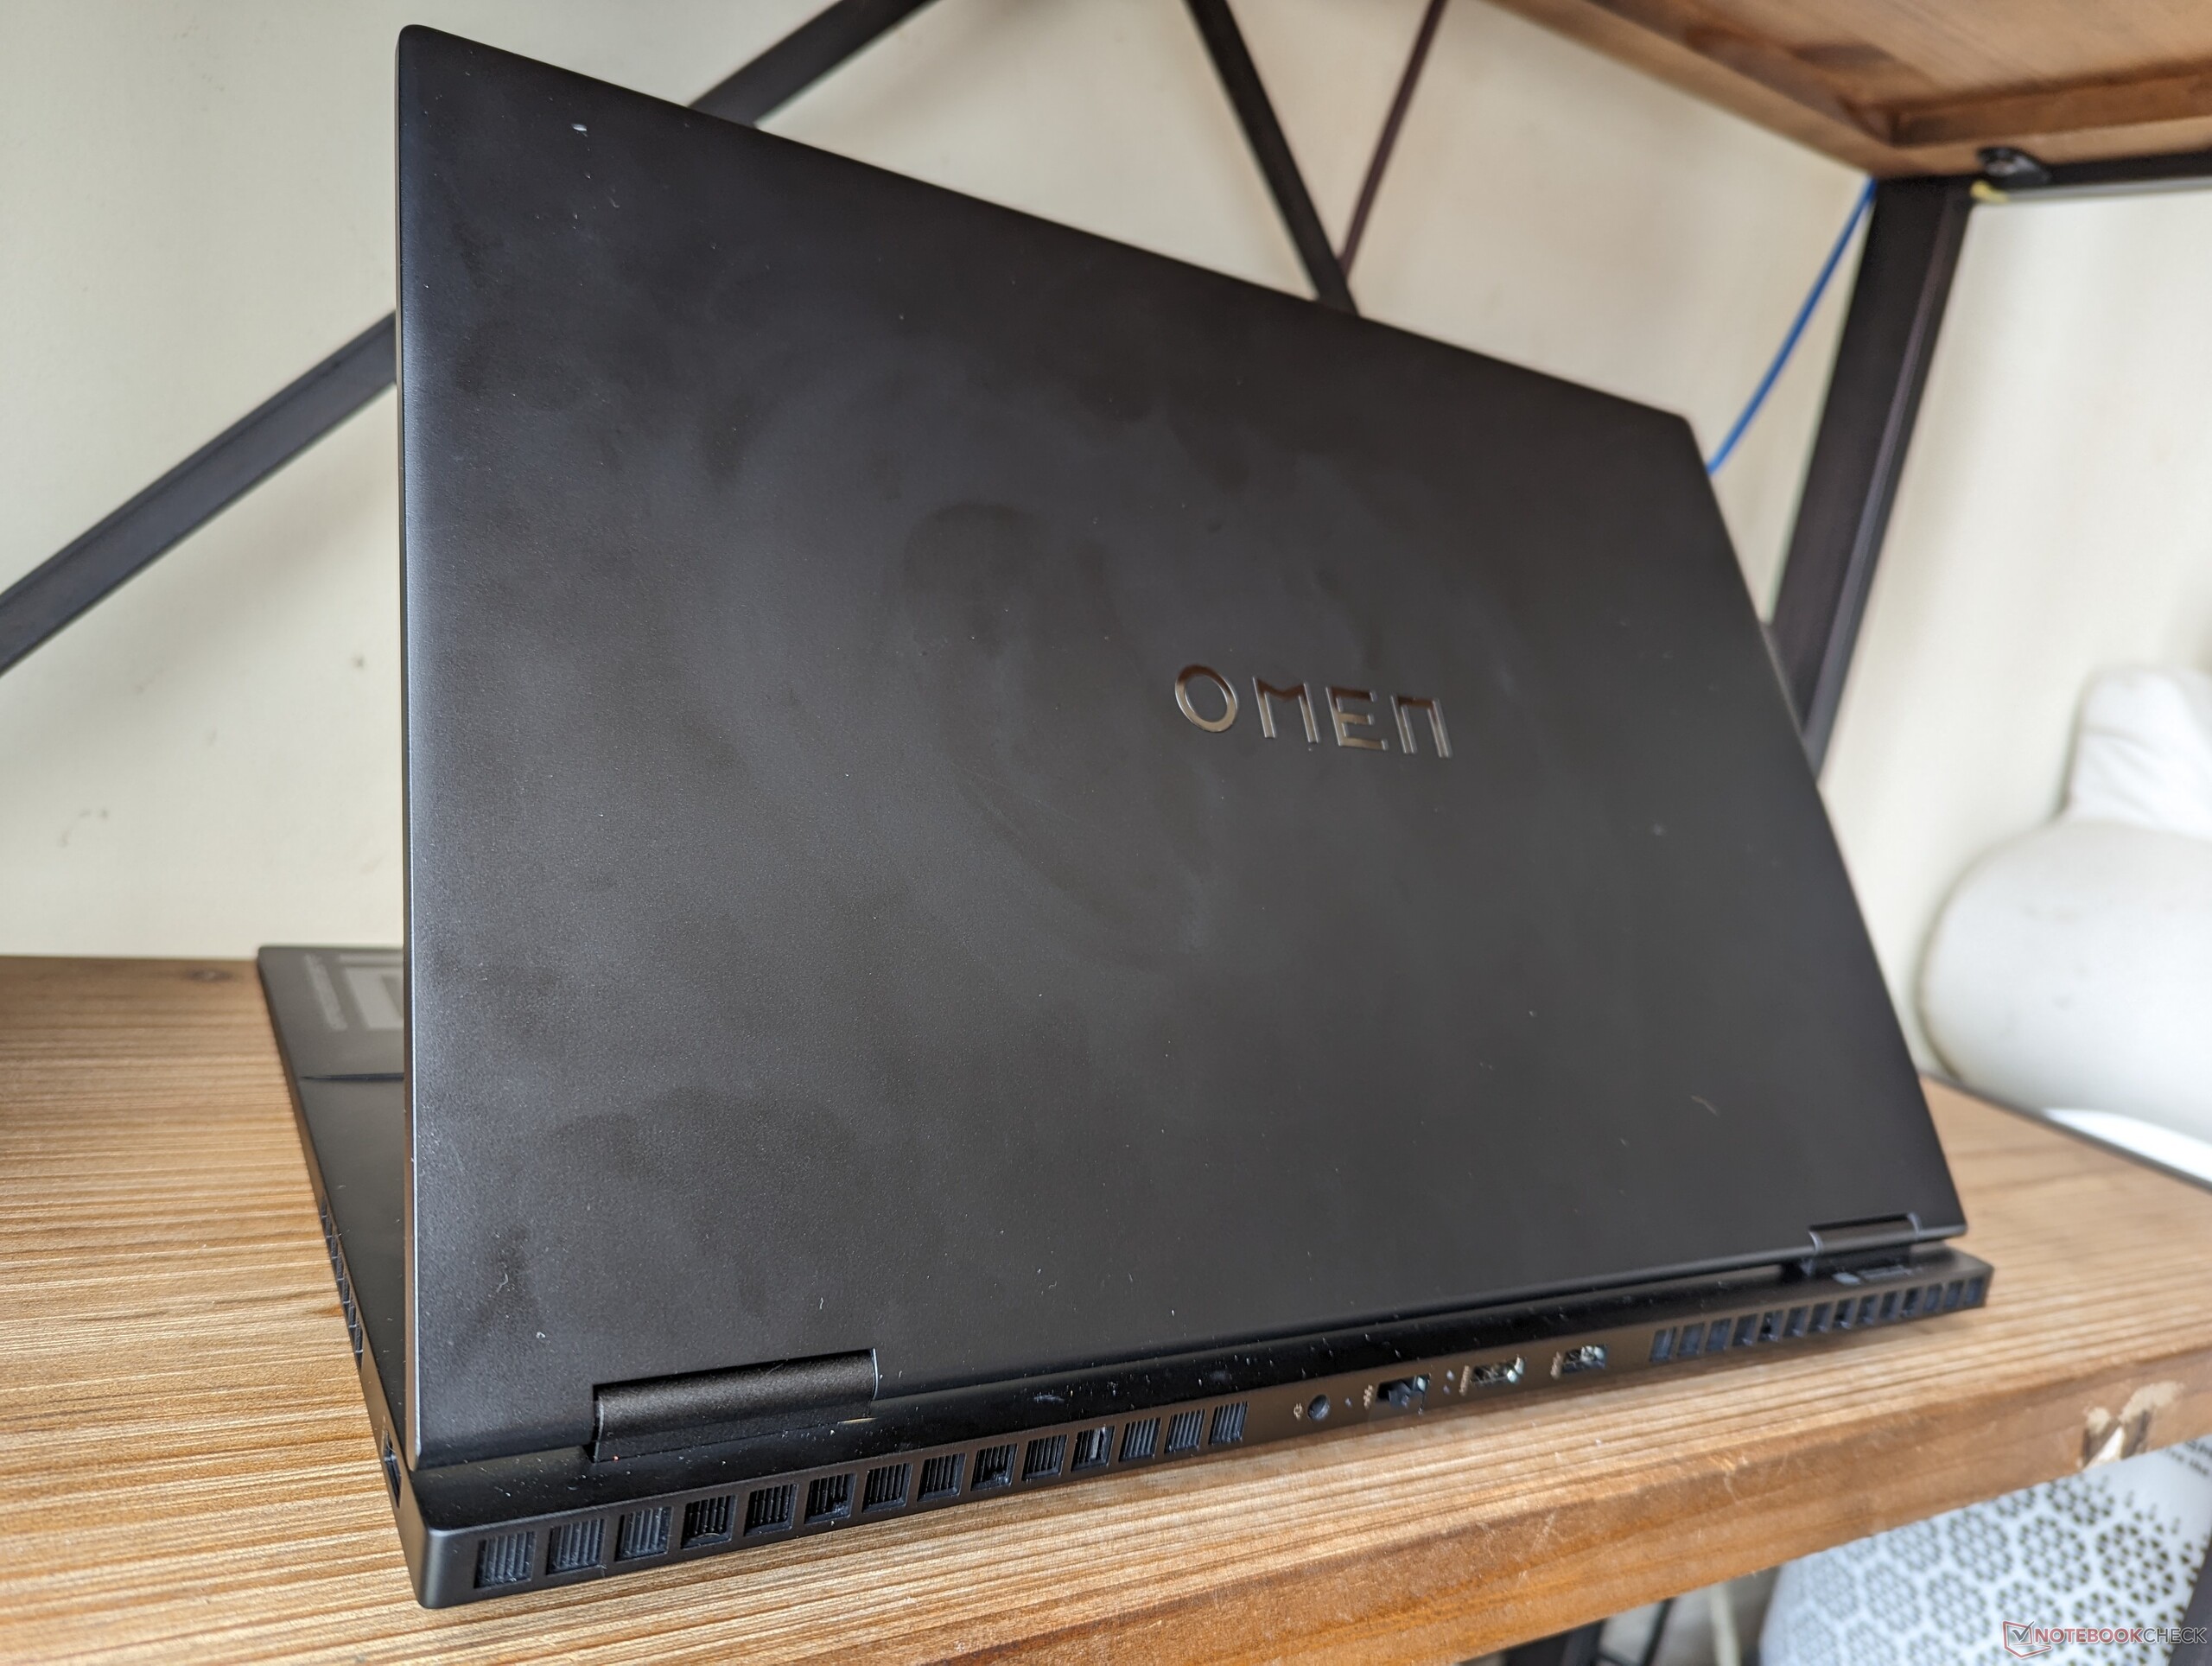
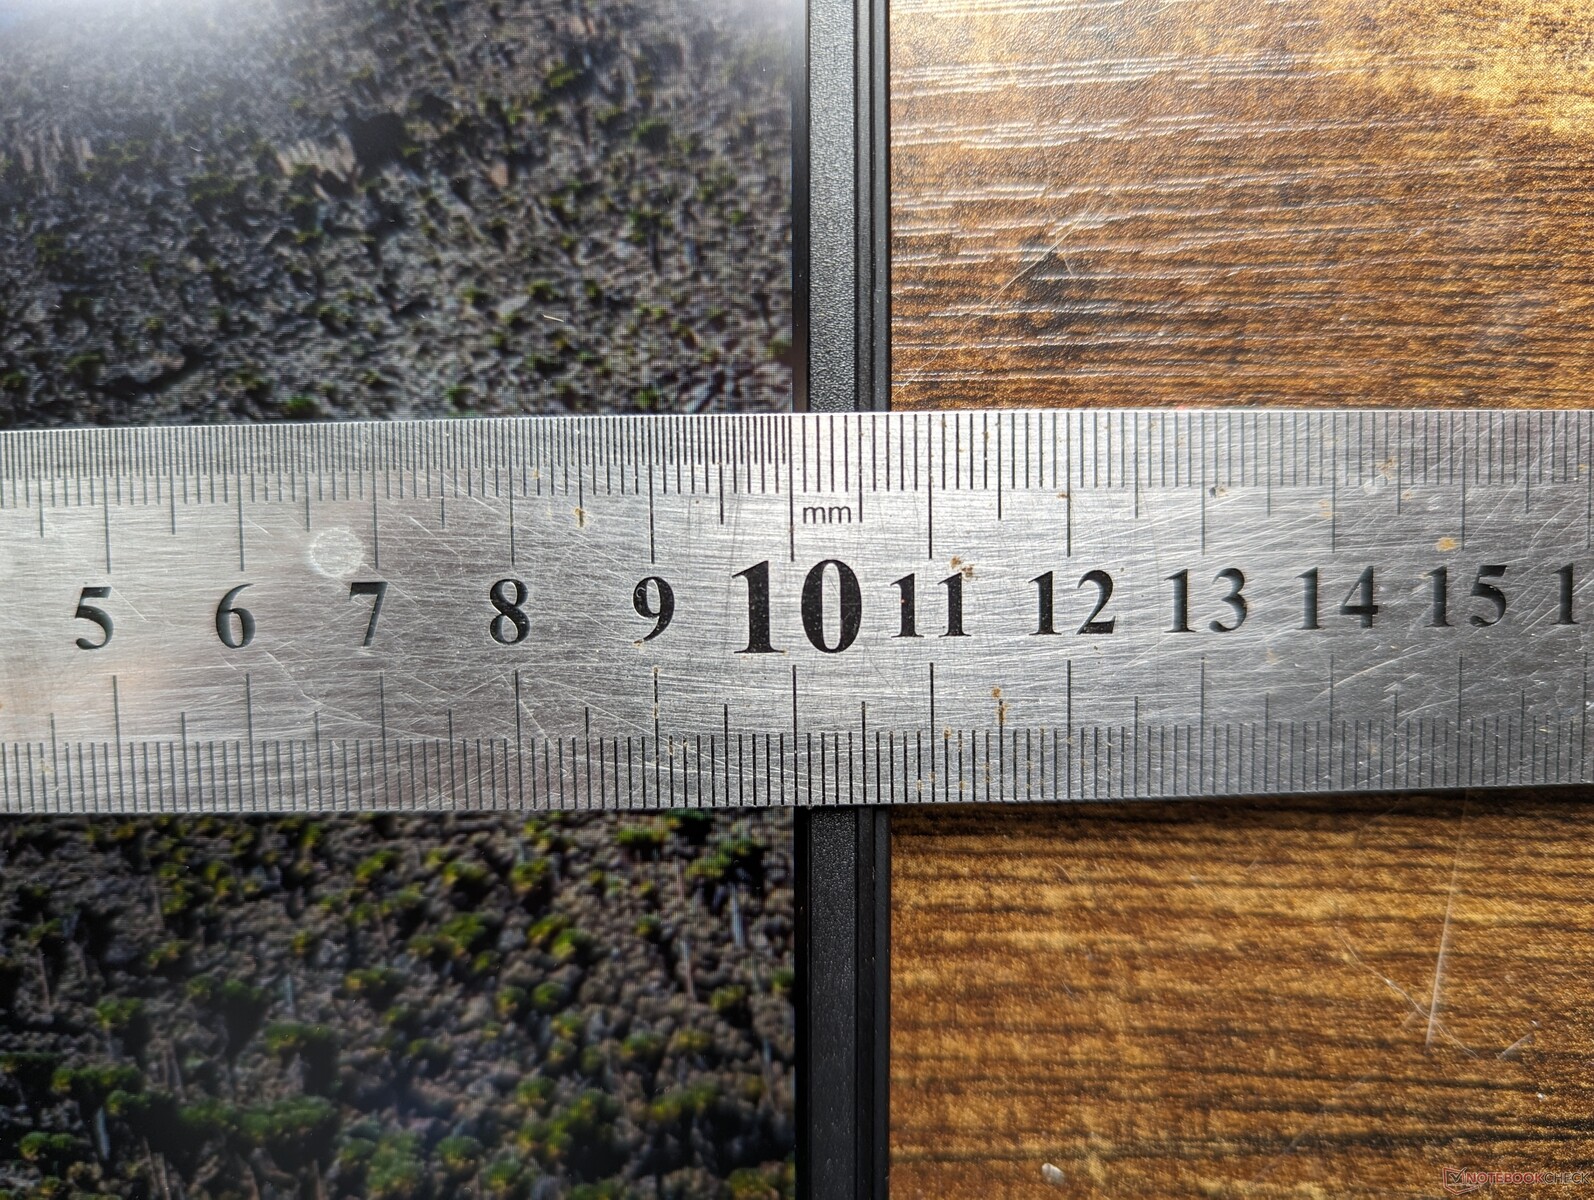
Il nuovo Omen 16 è effettivamente più lungo di circa 11 mm rispetto al modello 2022, grazie alla parte posteriore allungata di cui sopra. Nonostante ciò, il peso complessivo rimane più o meno lo stesso e le dimensioni del sistema sono ancora inferiori a quelle dellaROG Strix G16, Legion Pro 7 16o dell'Alienware x16 R1.
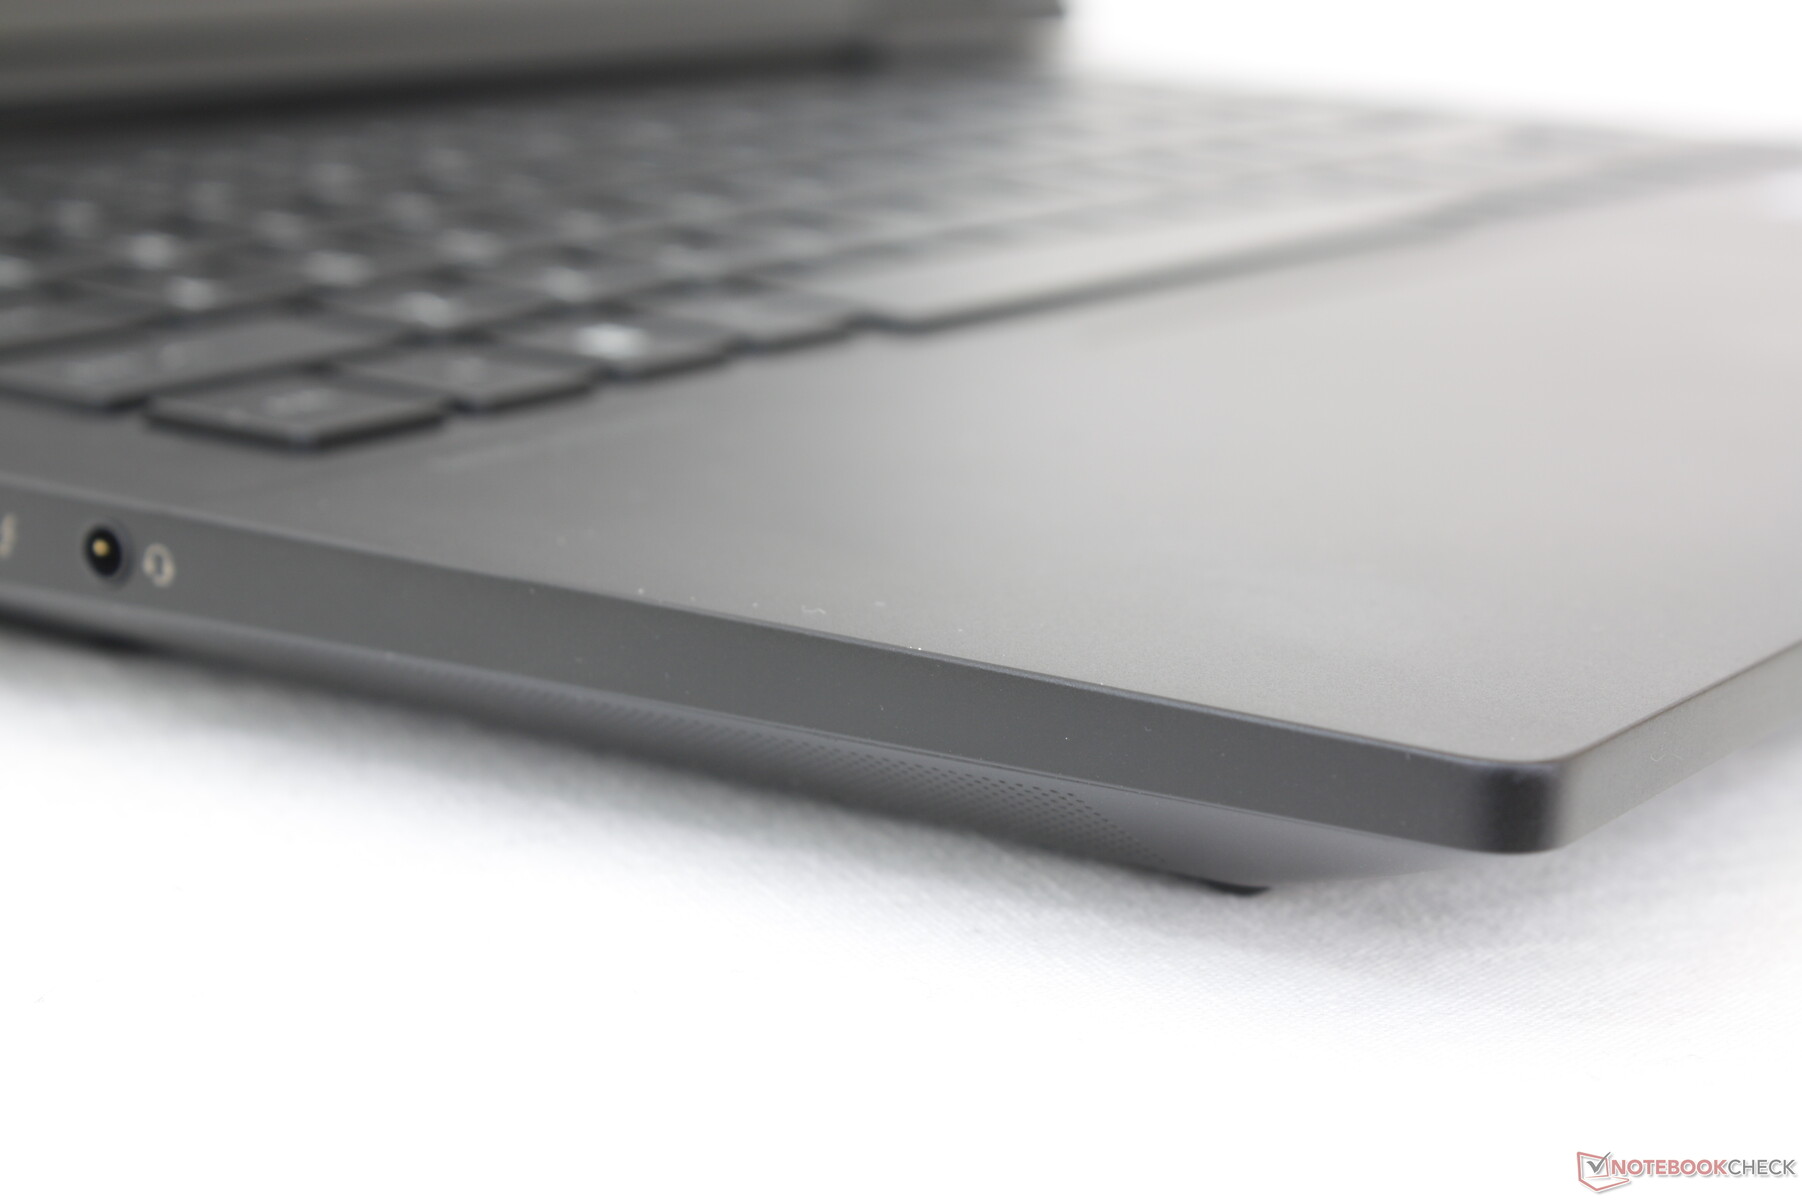
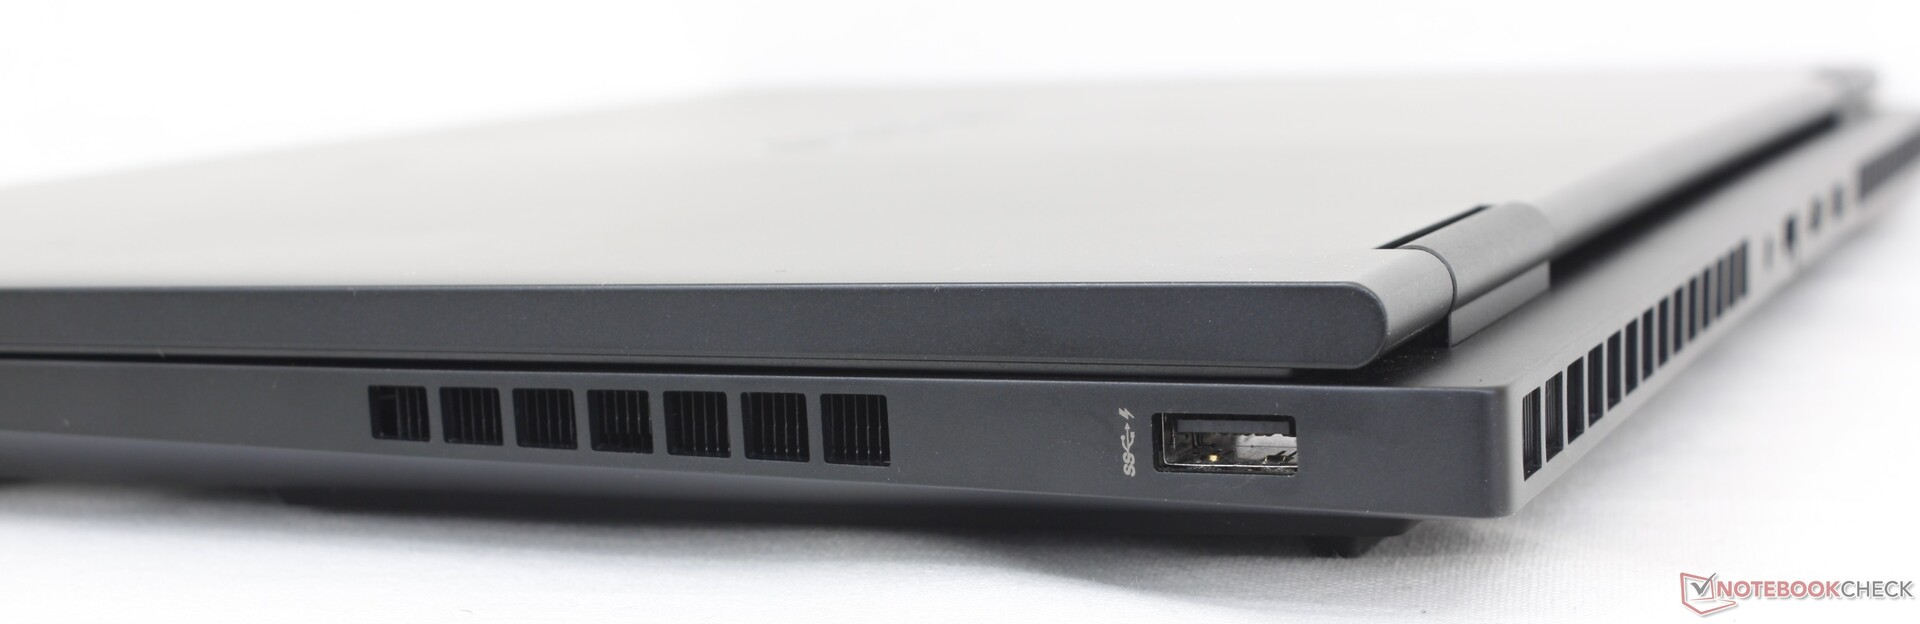
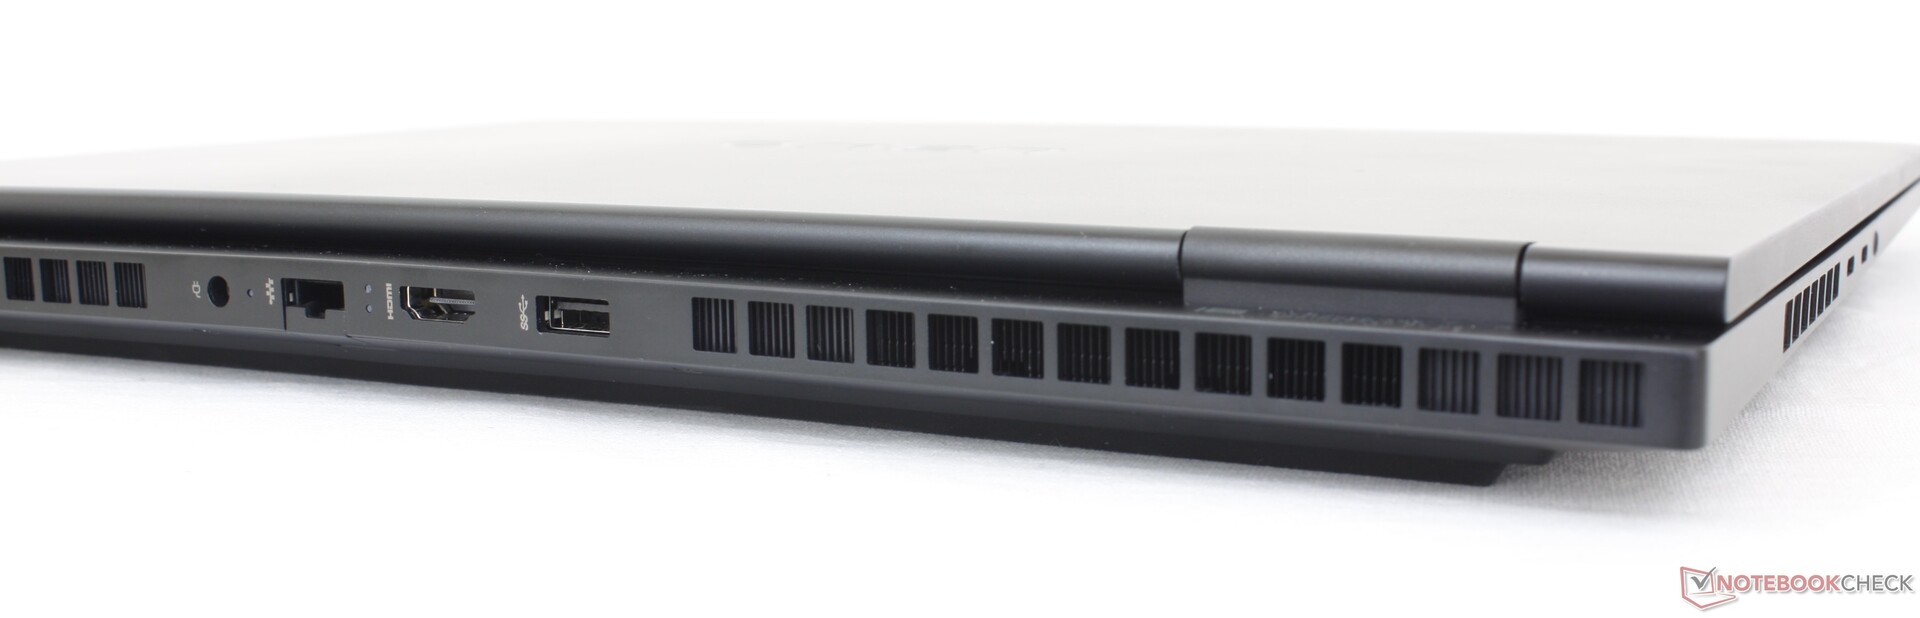
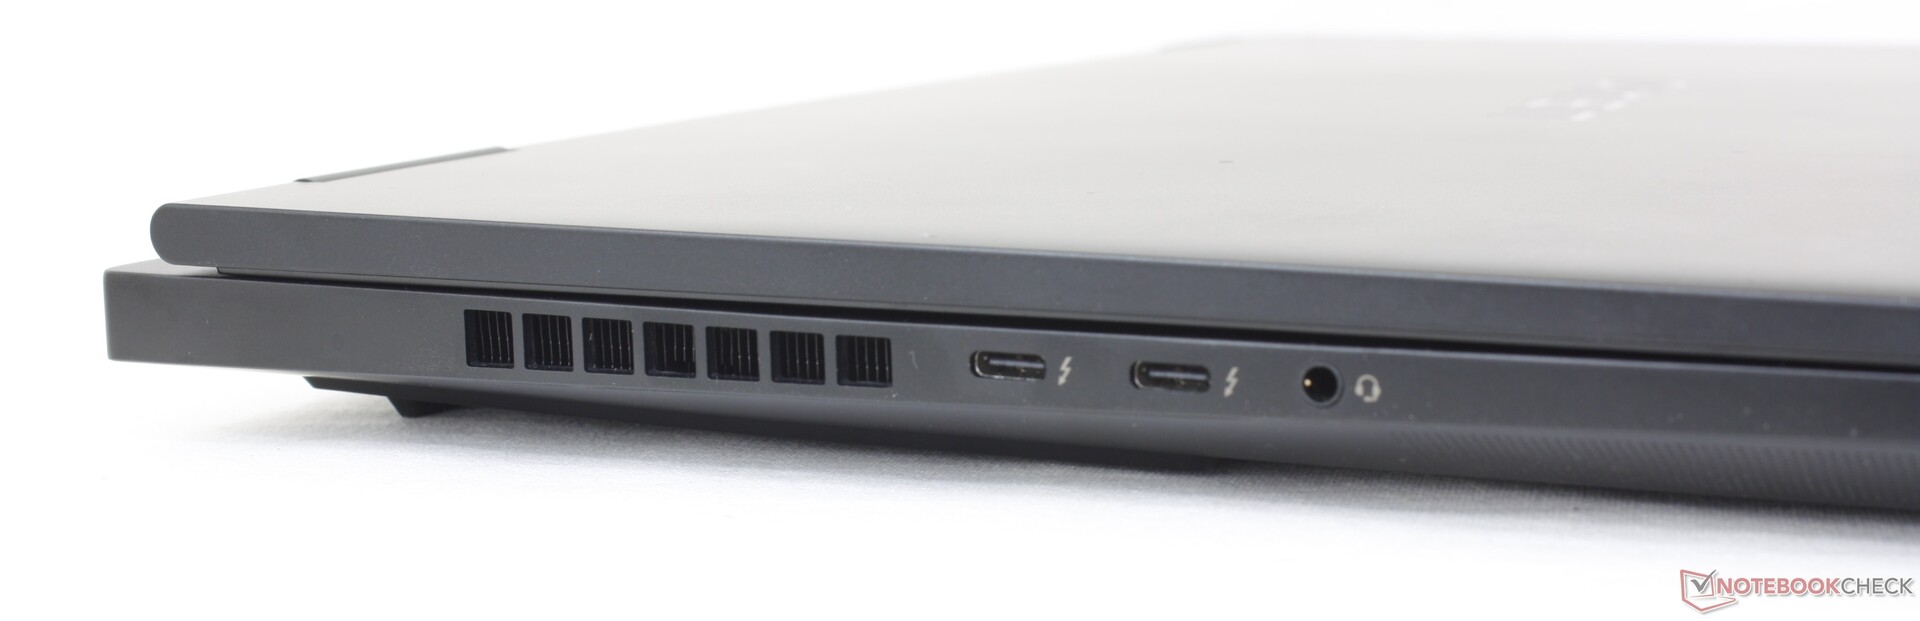
Connettività
Le opzioni delle porte sono state ridotte rispetto al modello dell'anno scorso: ora c'è una porta USB-A in meno e non c'è più il lettore di schede SD. Entrambe le porte USB-C sono state spostate dal bordo posteriore a quello sinistro per facilitarne l'accesso.
Comunicazione
Un Intel AX211 è opzionale per la connettività Wi-Fi6E e Bluetooth 5.3. Non abbiamo riscontrato alcun problema quando è stato accoppiato alla nostra rete Asus AXE11000 a 6 GHz.
| Networking | |
| iperf3 transmit AXE11000 | |
| Lenovo Legion Pro 7 RTX4090 | |
| Asus ROG Strix G16 G614JZ | |
| HP Omen 16-n0033dx | |
| Razer Blade 16 Early 2023 | |
| HP Omen 16-wf000 | |
| Alienware x16 R1 | |
| iperf3 receive AXE11000 | |
| Lenovo Legion Pro 7 RTX4090 | |
| Asus ROG Strix G16 G614JZ | |
| HP Omen 16-n0033dx | |
| Razer Blade 16 Early 2023 | |
| Alienware x16 R1 | |
| HP Omen 16-wf000 | |
| iperf3 transmit AXE11000 6GHz | |
| HP Omen 16-n0033dx | |
| Razer Blade 16 Early 2023 | |
| HP Omen 16-wf000 | |
| Alienware x16 R1 | |
| iperf3 receive AXE11000 6GHz | |
| Razer Blade 16 Early 2023 | |
| HP Omen 16-wf000 | |
| HP Omen 16-n0033dx | |
| Alienware x16 R1 | |
Webcam - Aggiornamento a 2 MP
Una webcam da 2 MP viene fornita di serie insieme a un otturatore per la privacy per sostituire la webcam da 1 MP dell'Omen 16 2022. L'IR, tuttavia, non è supportato su questa serie.


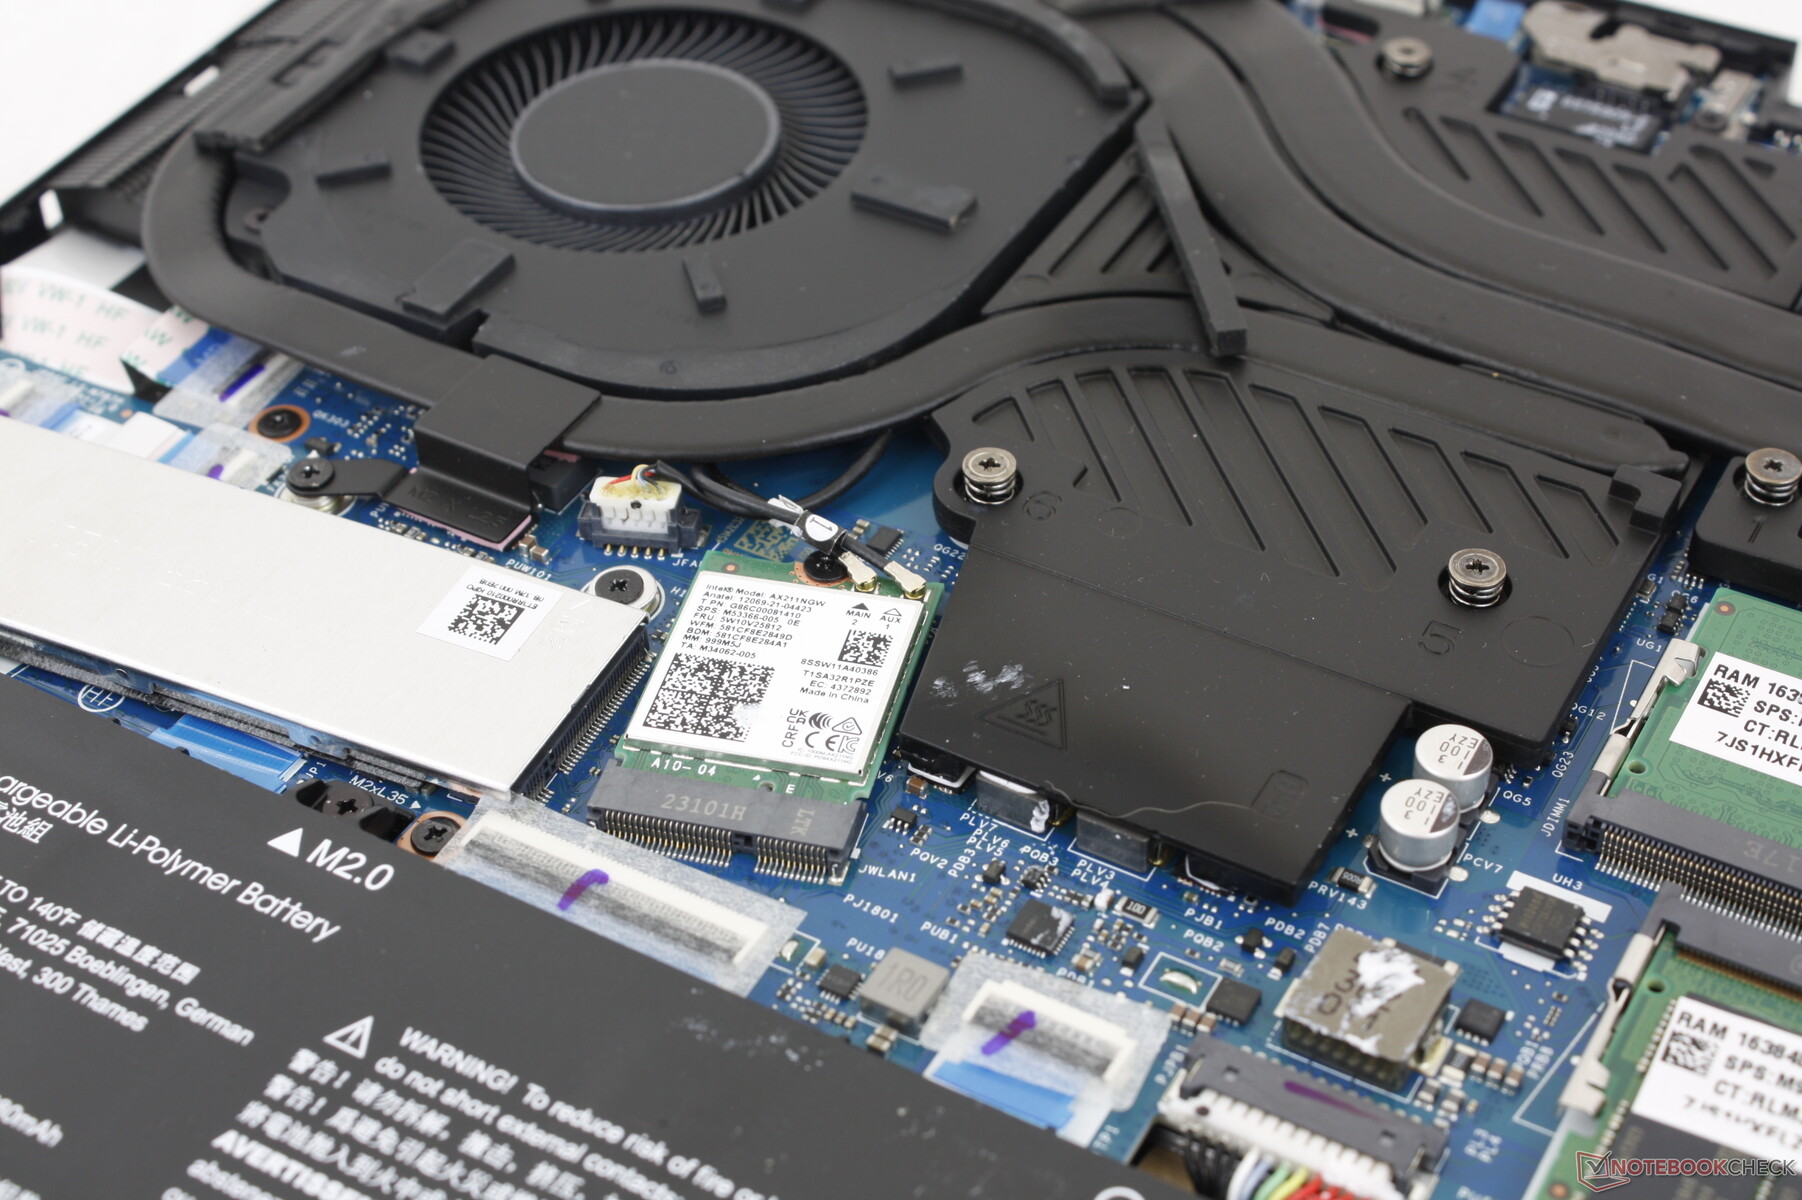
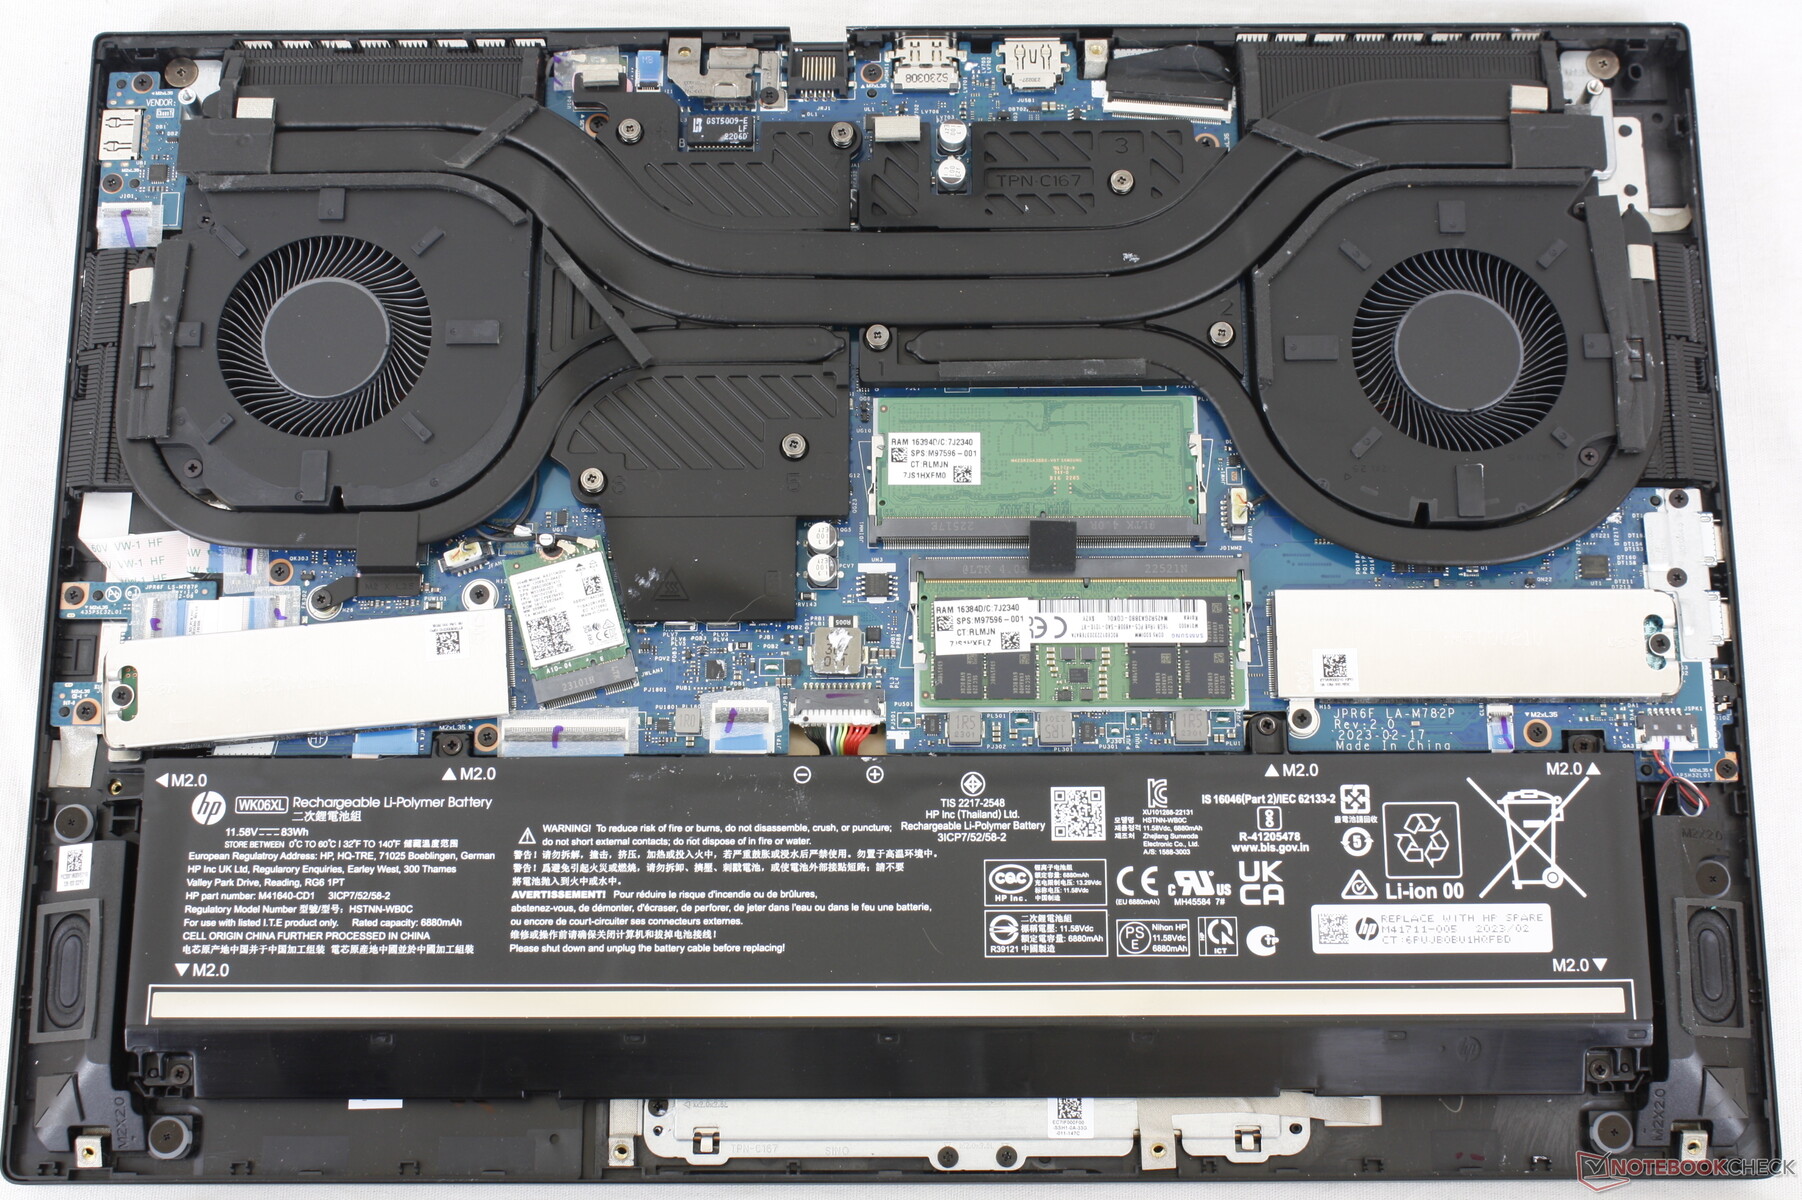
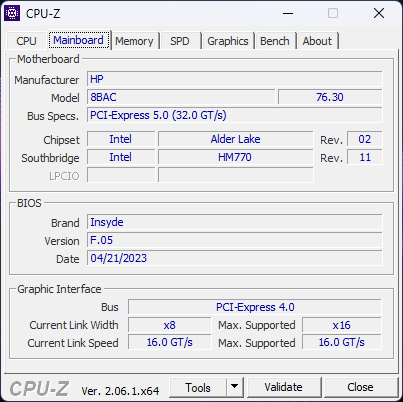
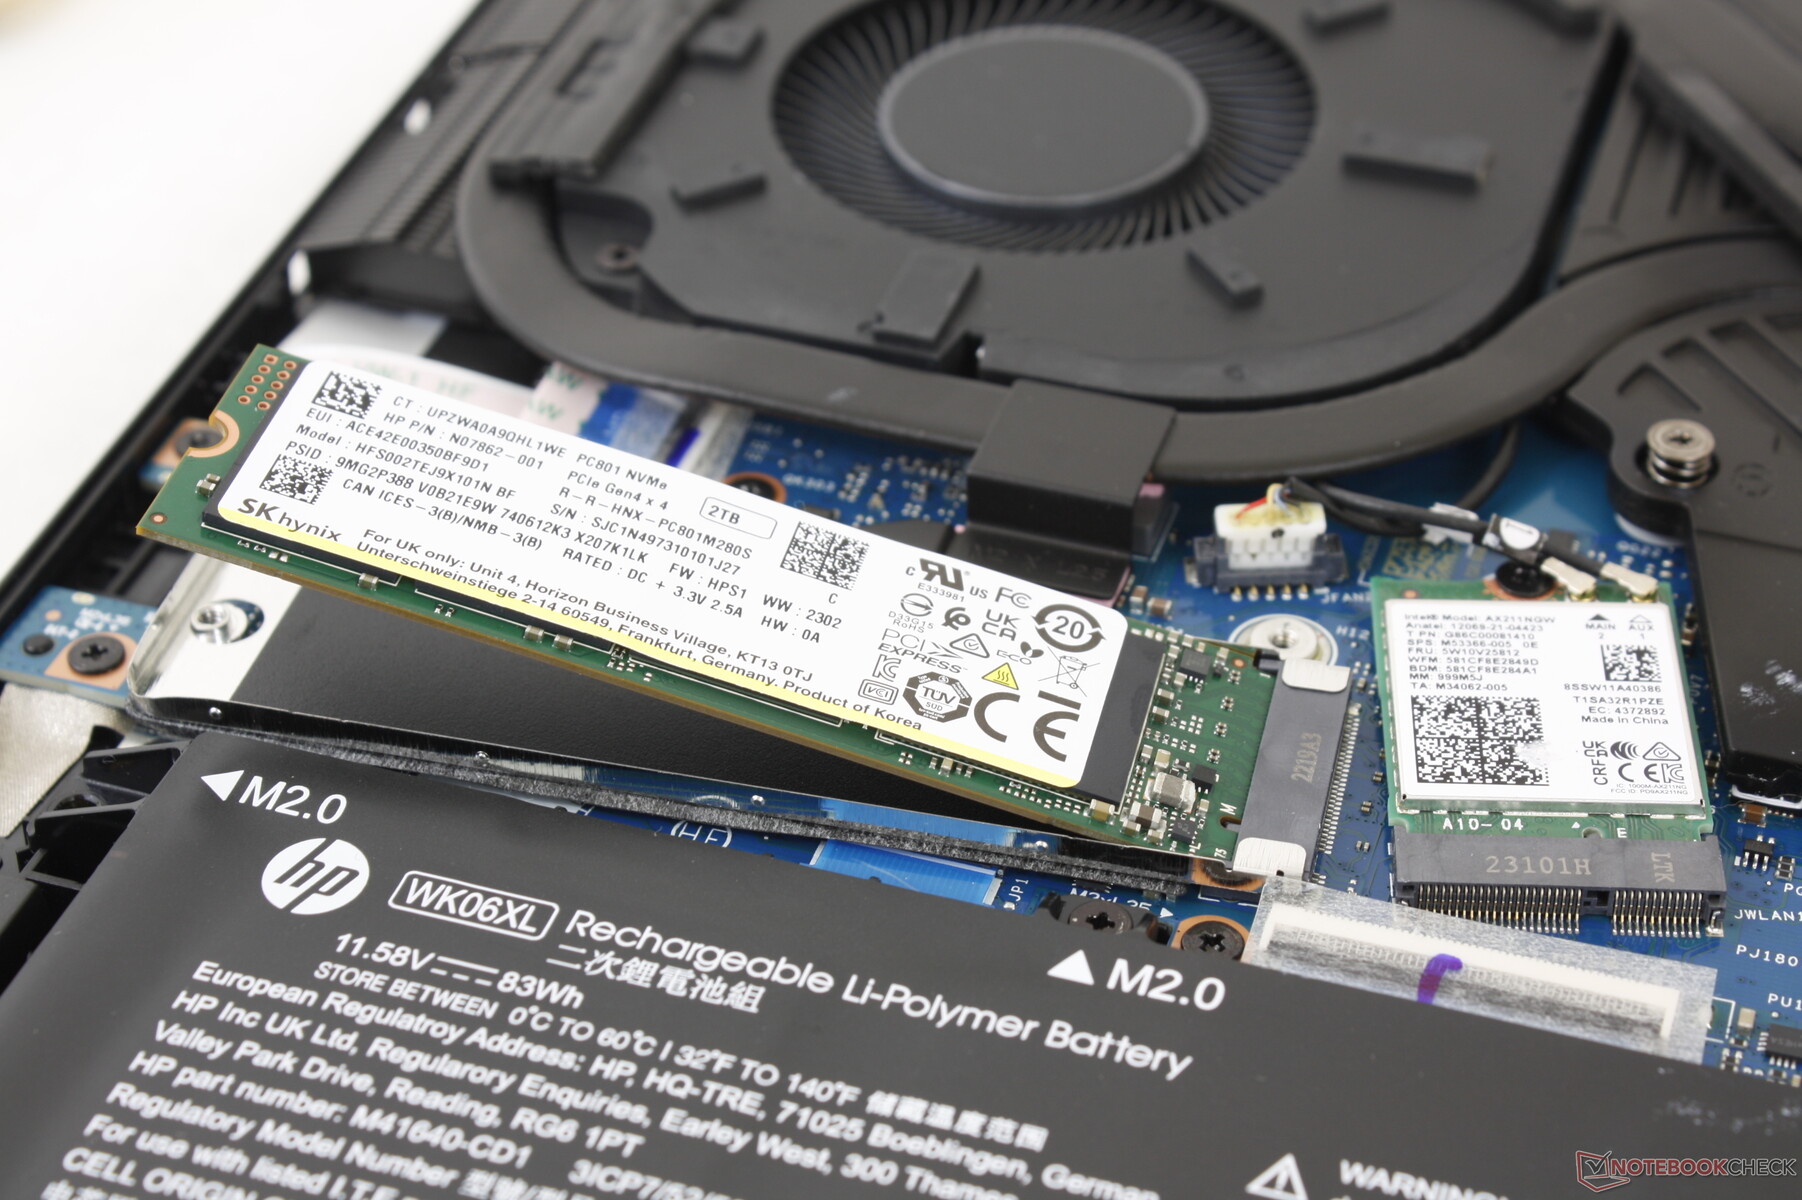
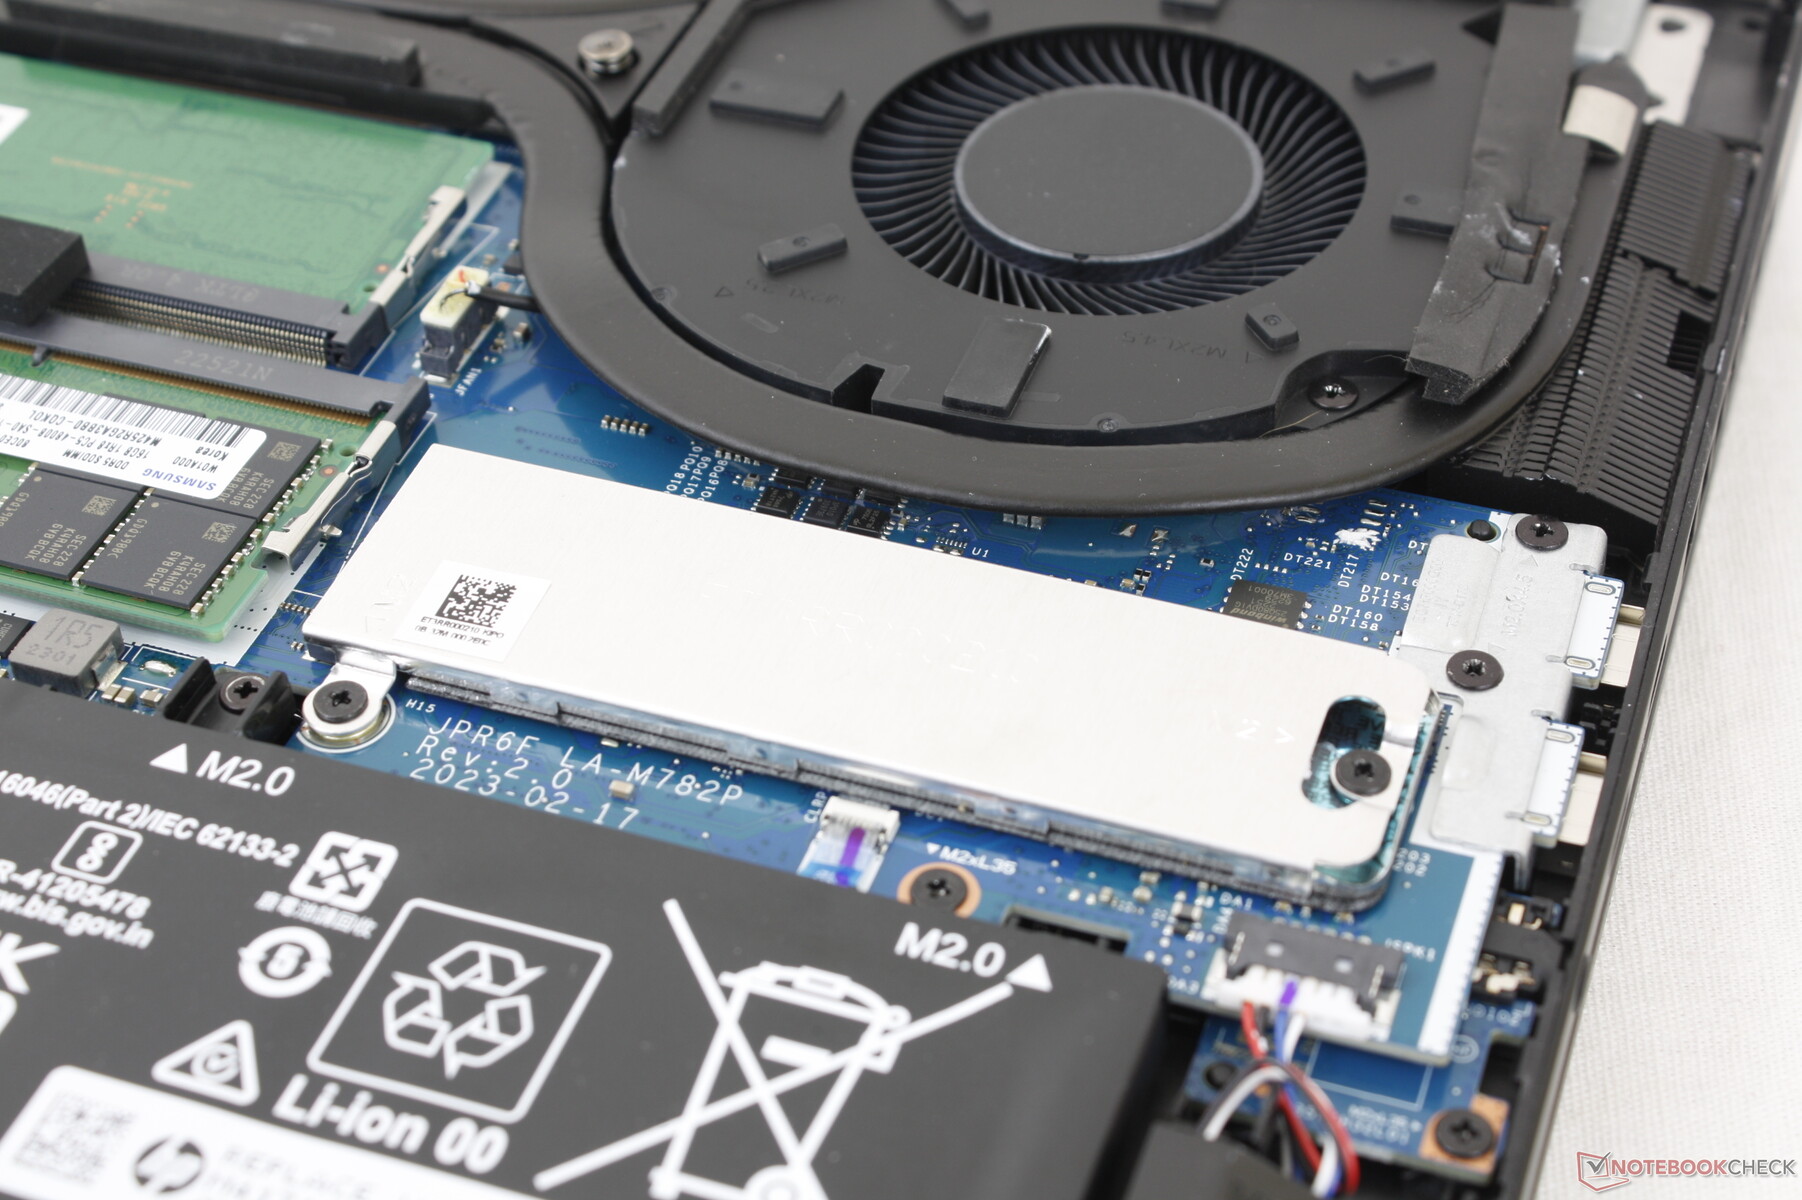
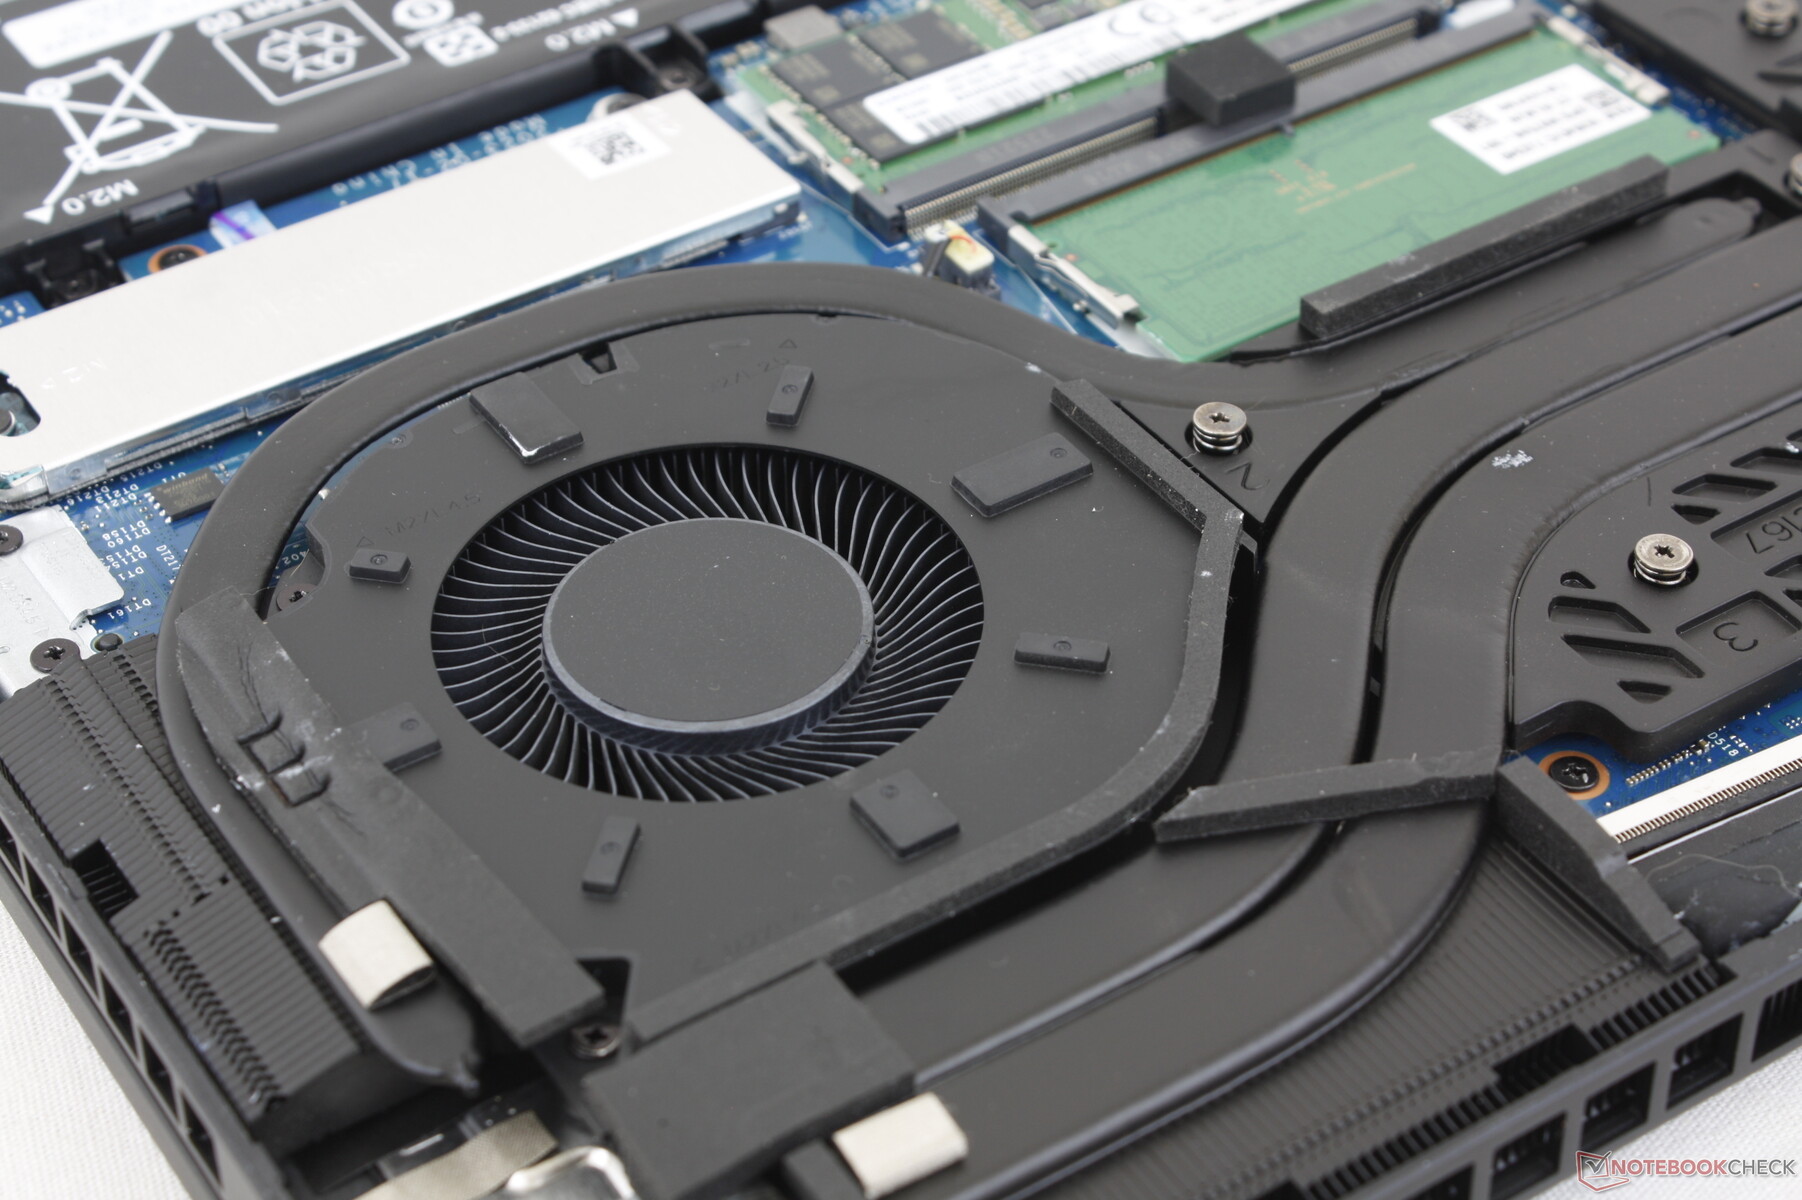
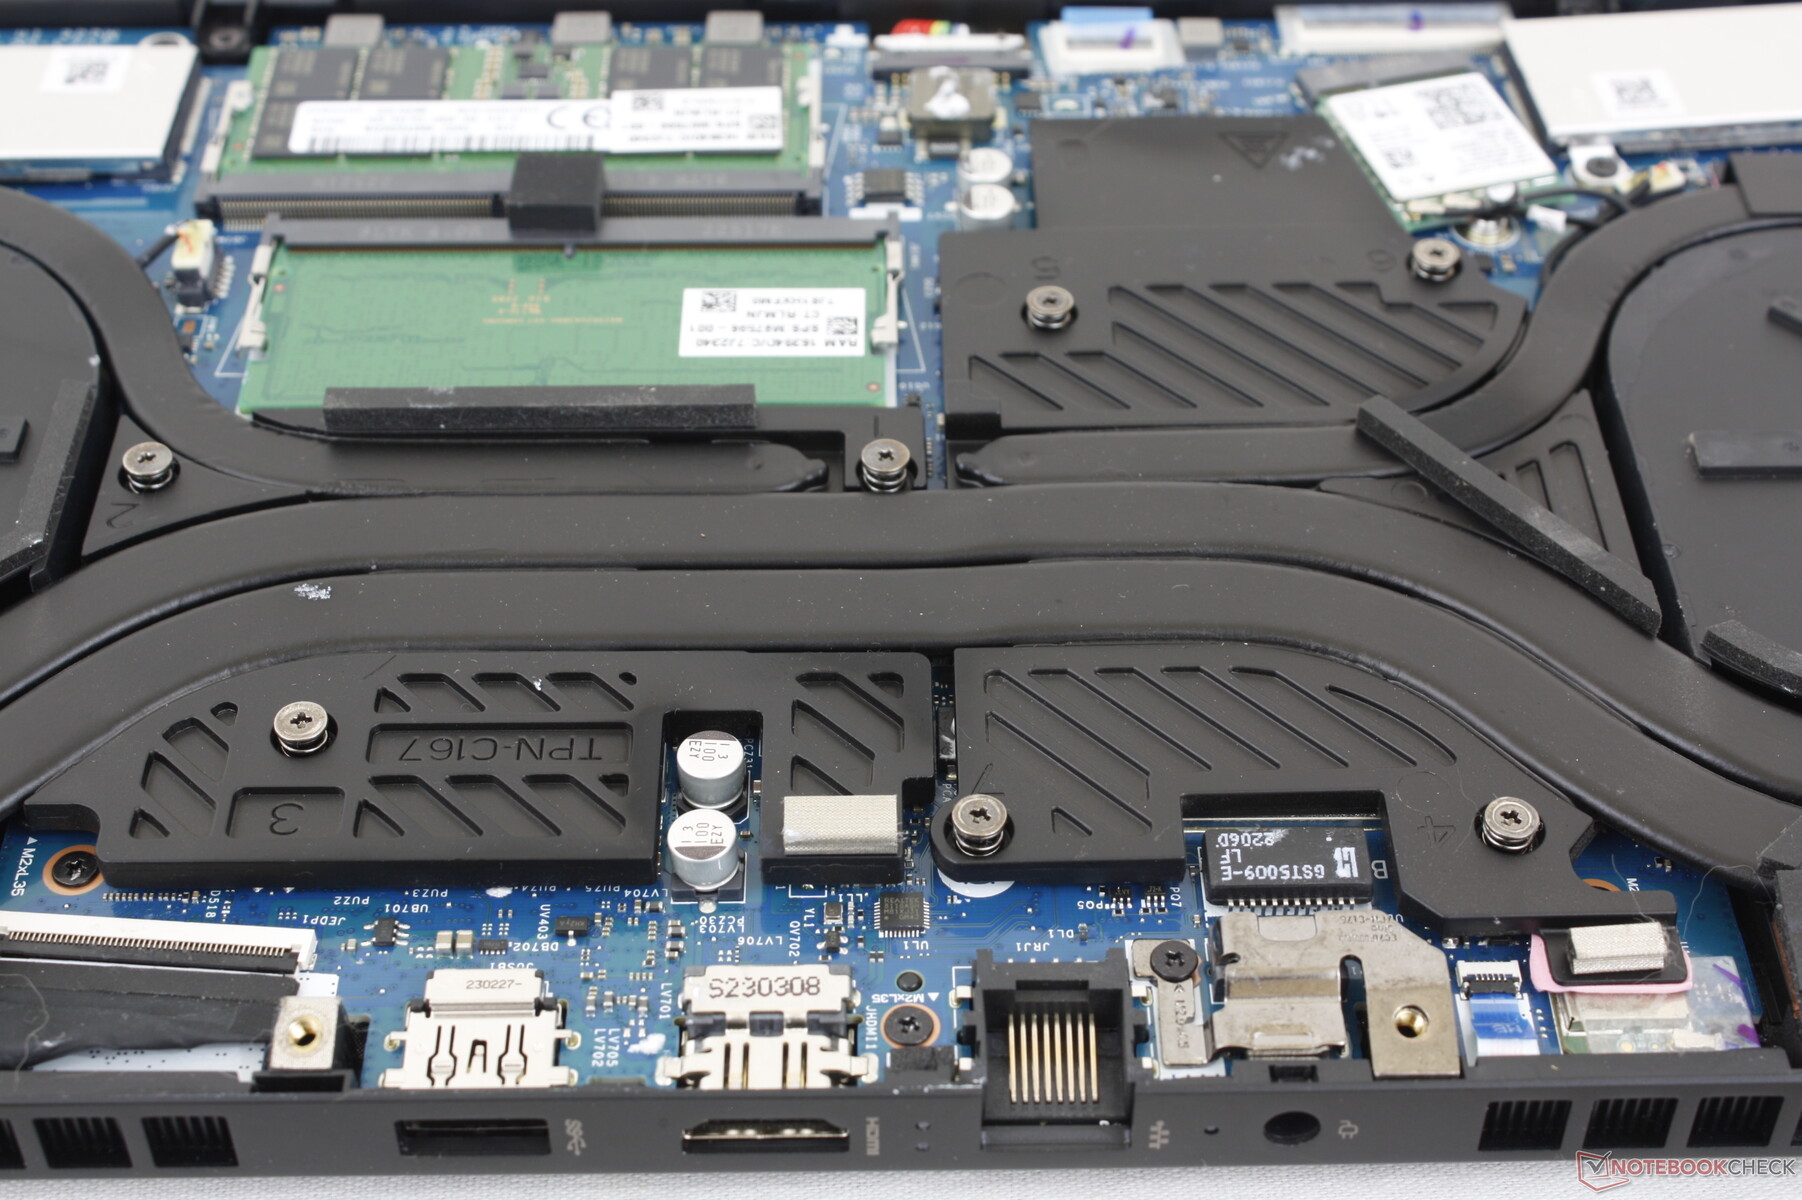
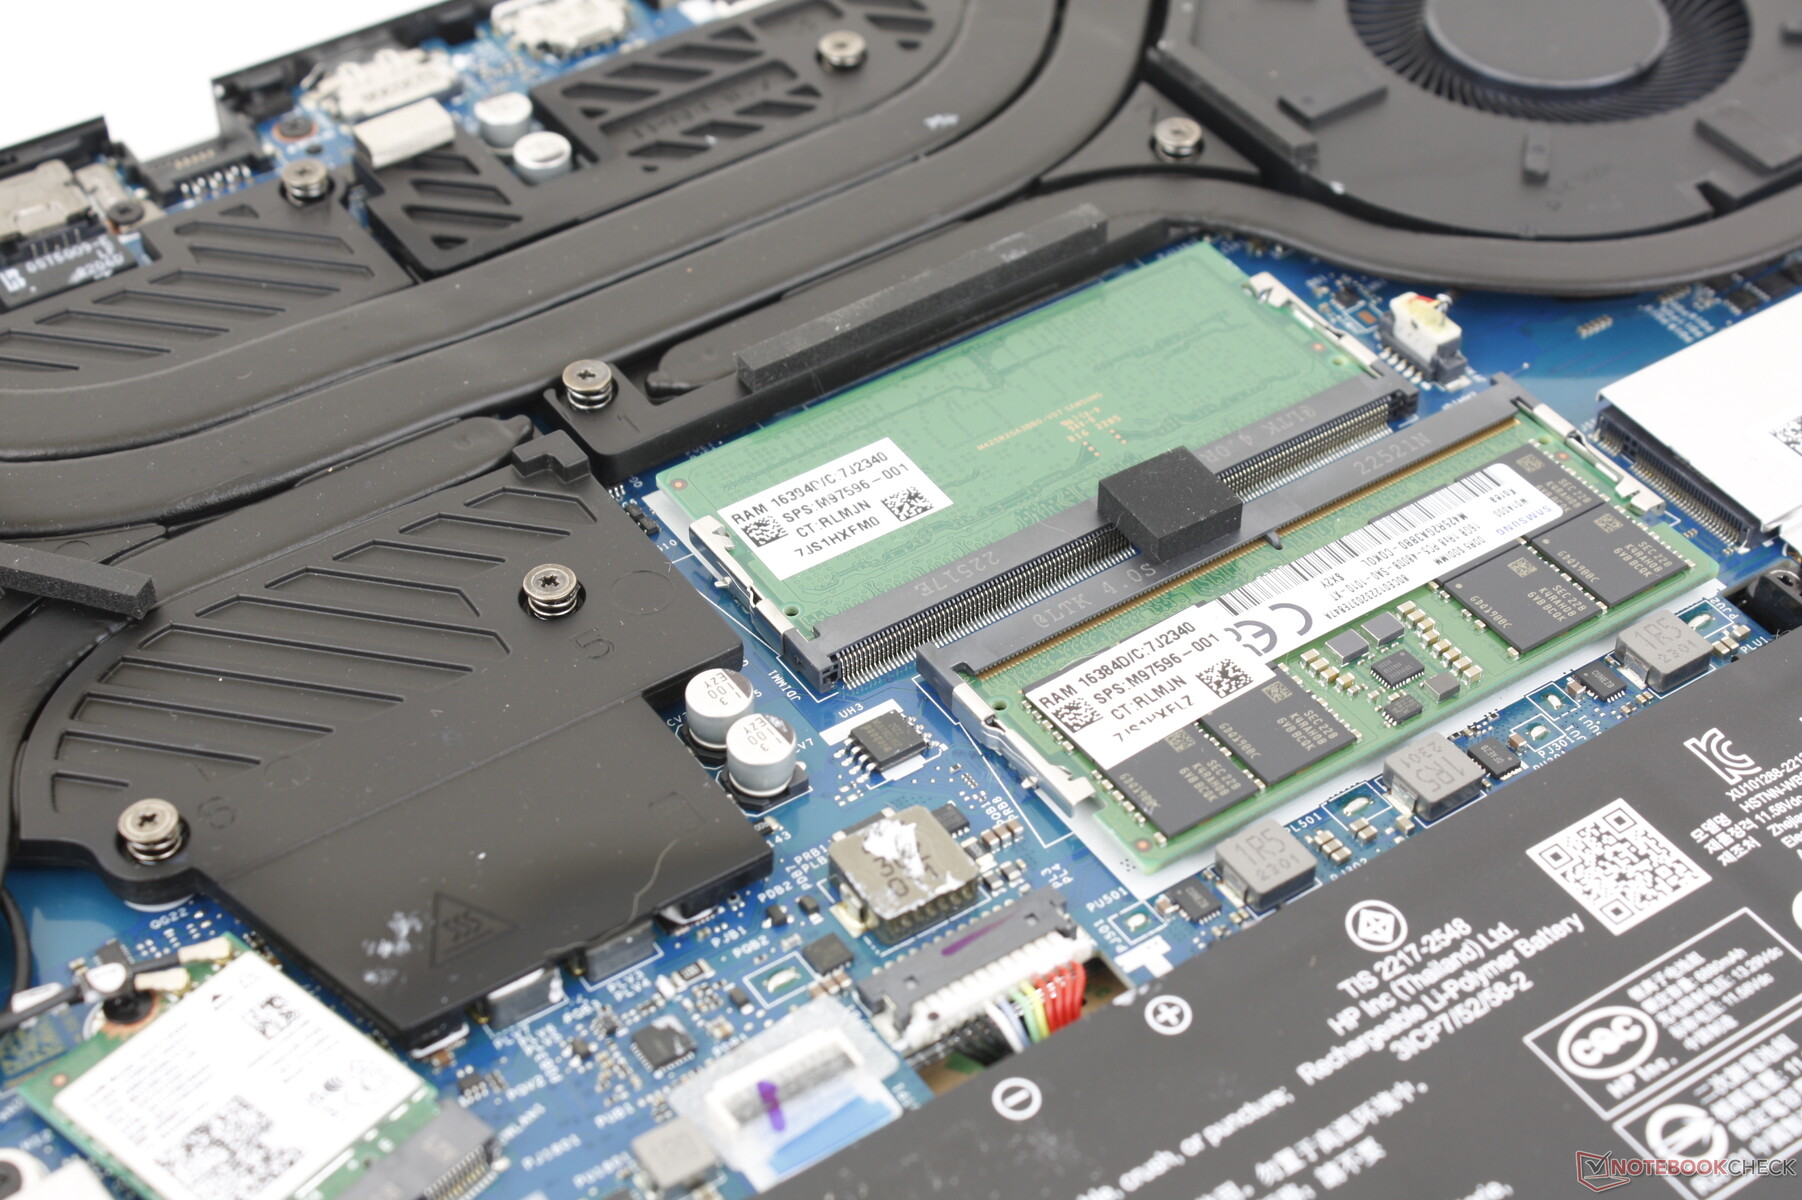
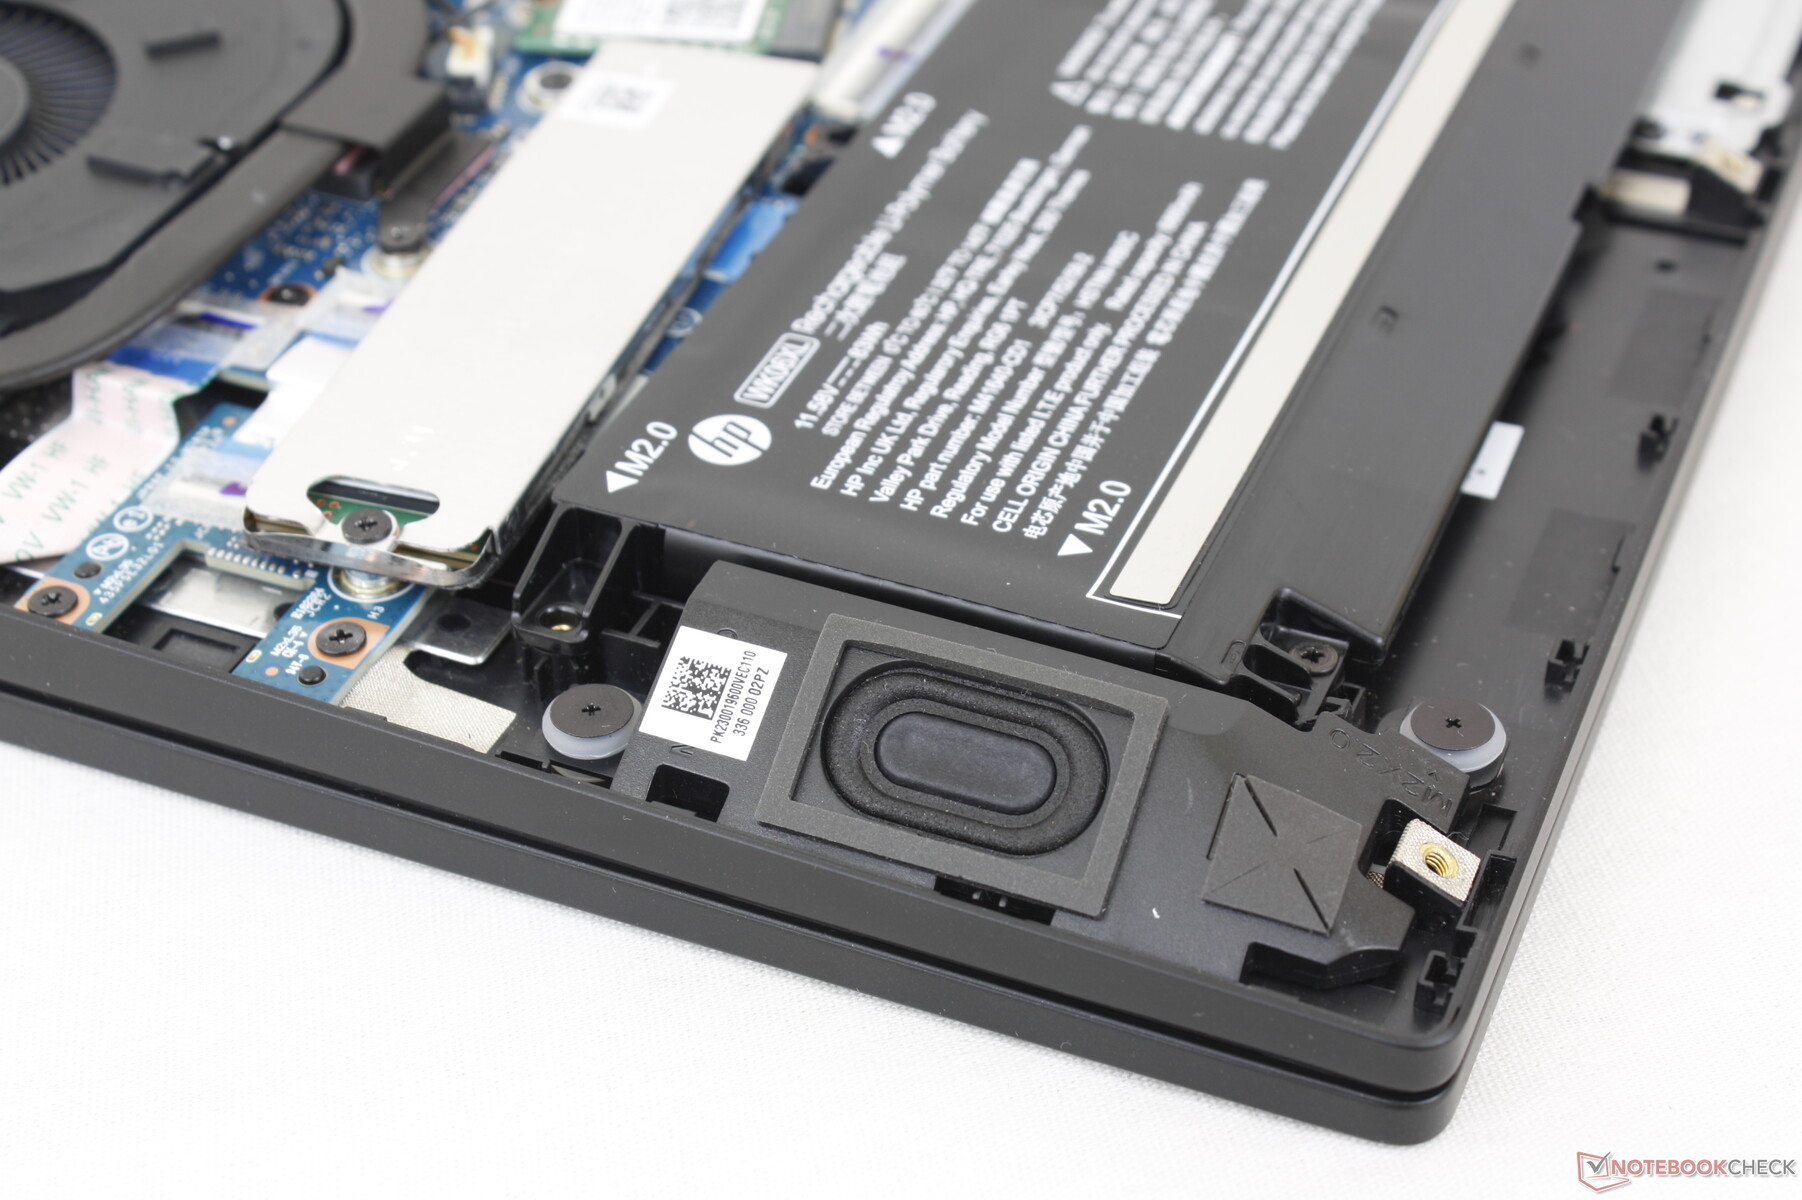
Manutenzione
Il pannello inferiore è fissato da sei viti Phillips per una facile rimozione. I proprietari hanno accesso diretto a 2 slot per SSD M.2 PCIe4 x4 2280, 2 slot SODIMM, batteria e modulo WLAN rimovibile, come nel modello 2022.
Accessori e garanzia
La confezione di vendita include una cuffia wireless HyperX Cloud II Core se configurata con la RTX 4080. Altrimenti, la confezione include solo il solito adattatore CA e la documentazione cartacea.
La garanzia limitata di un anno del produttore è standard se acquistata negli Stati Uniti.
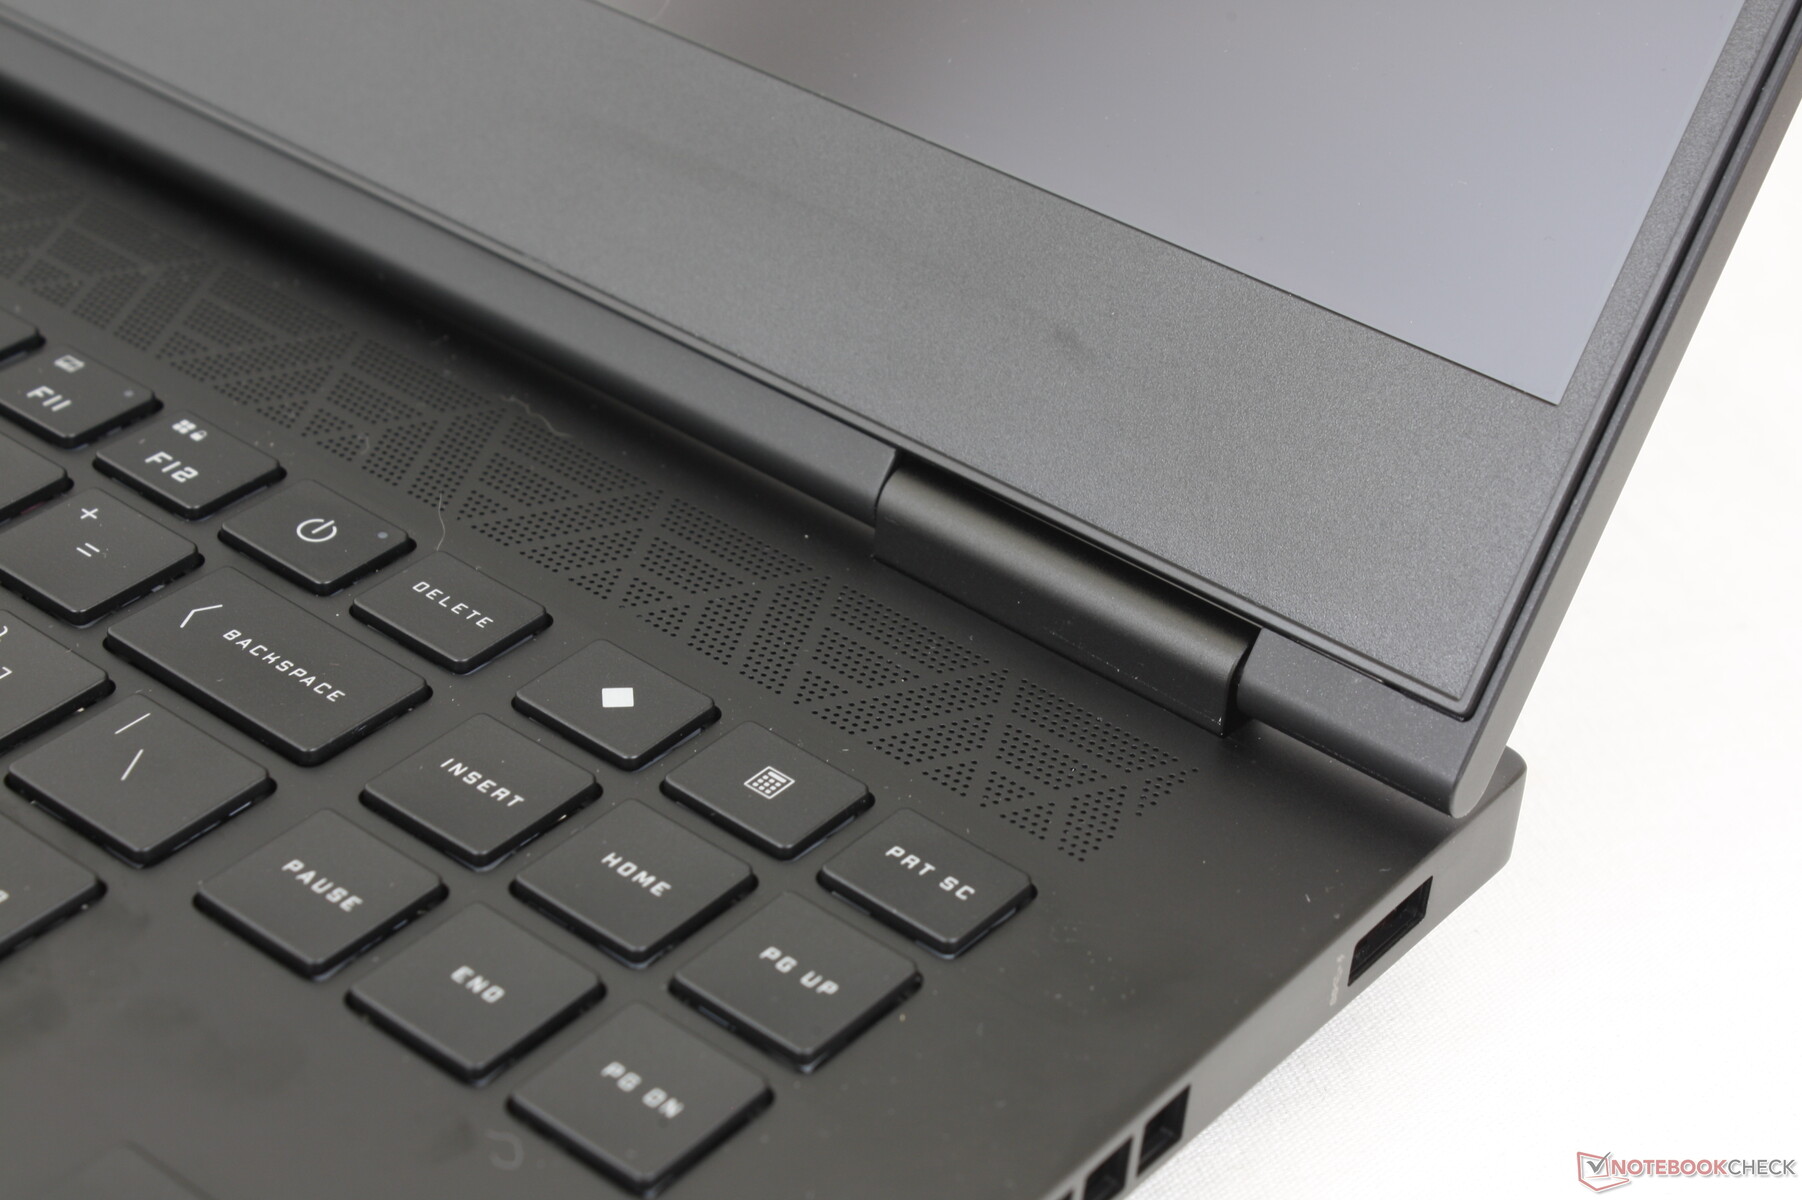
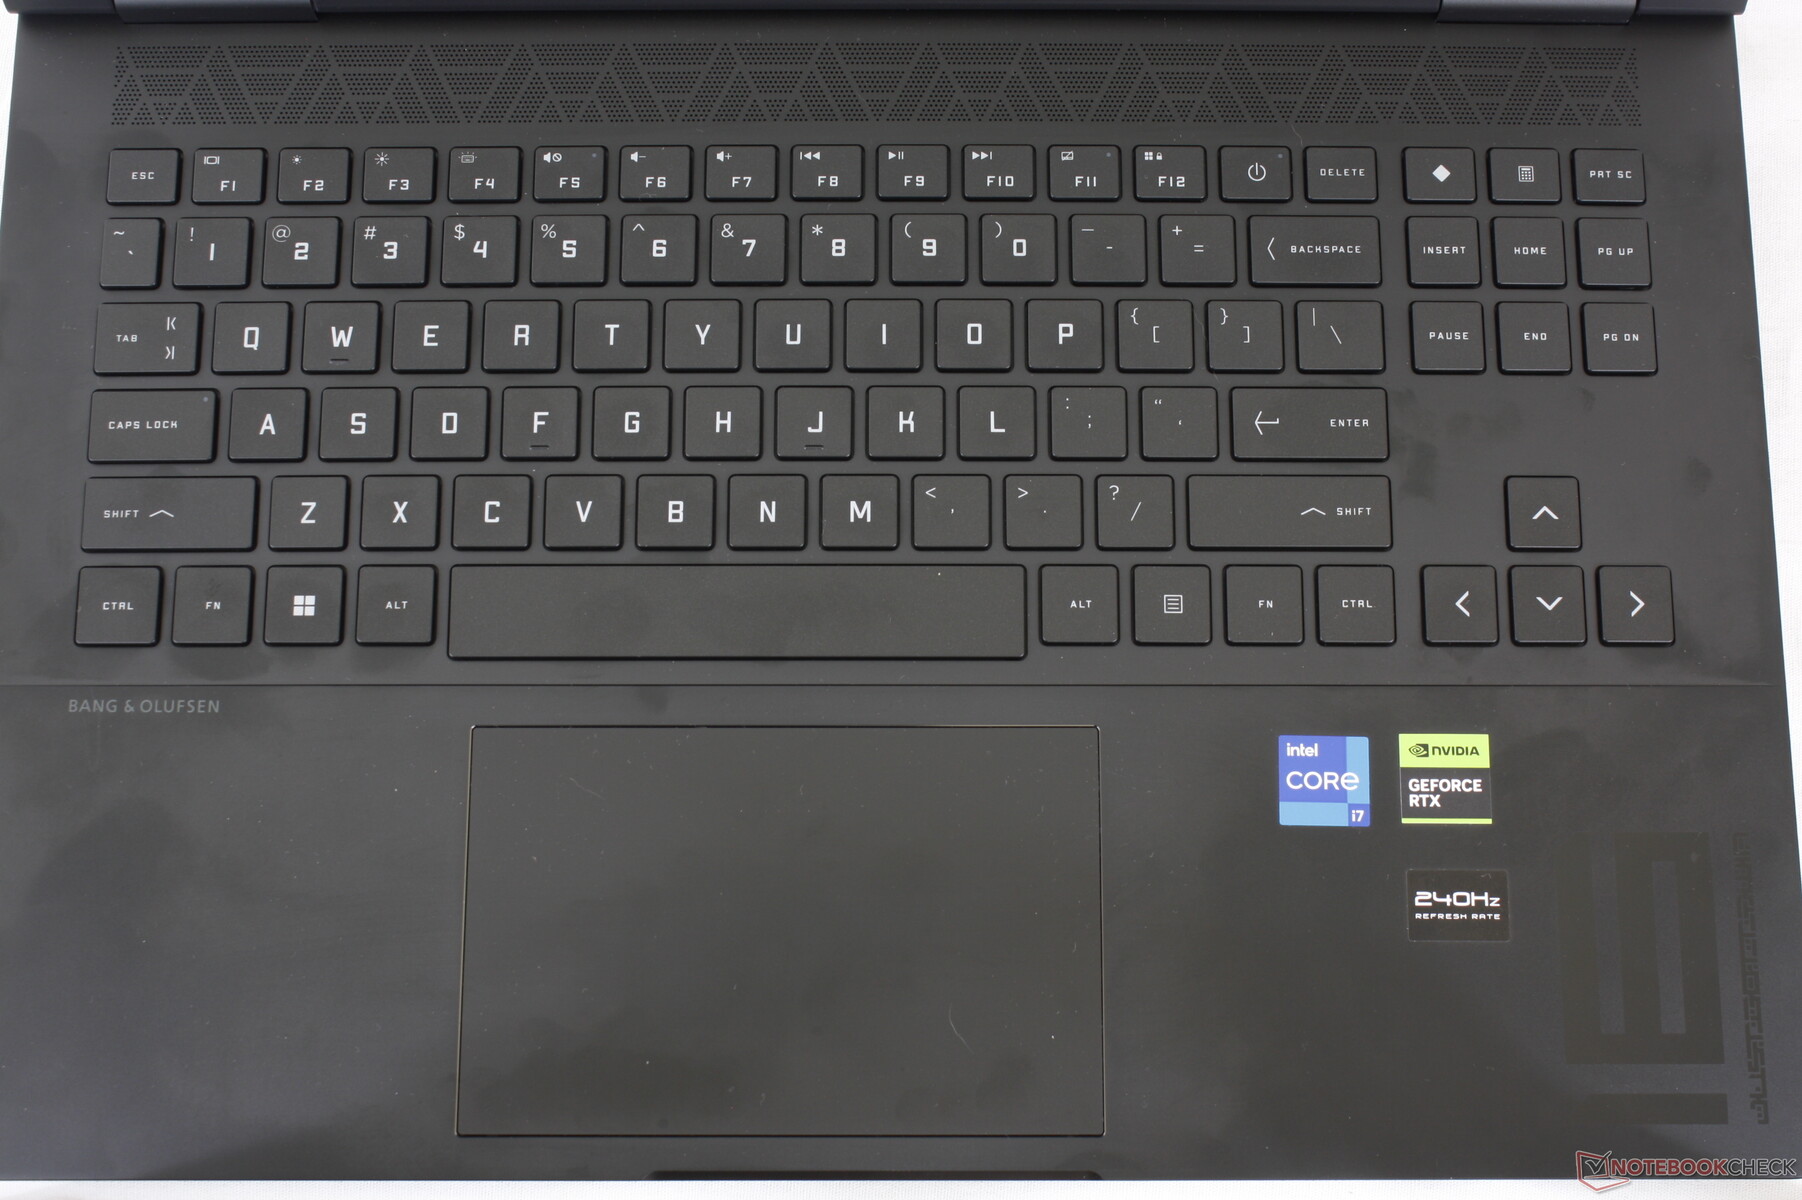
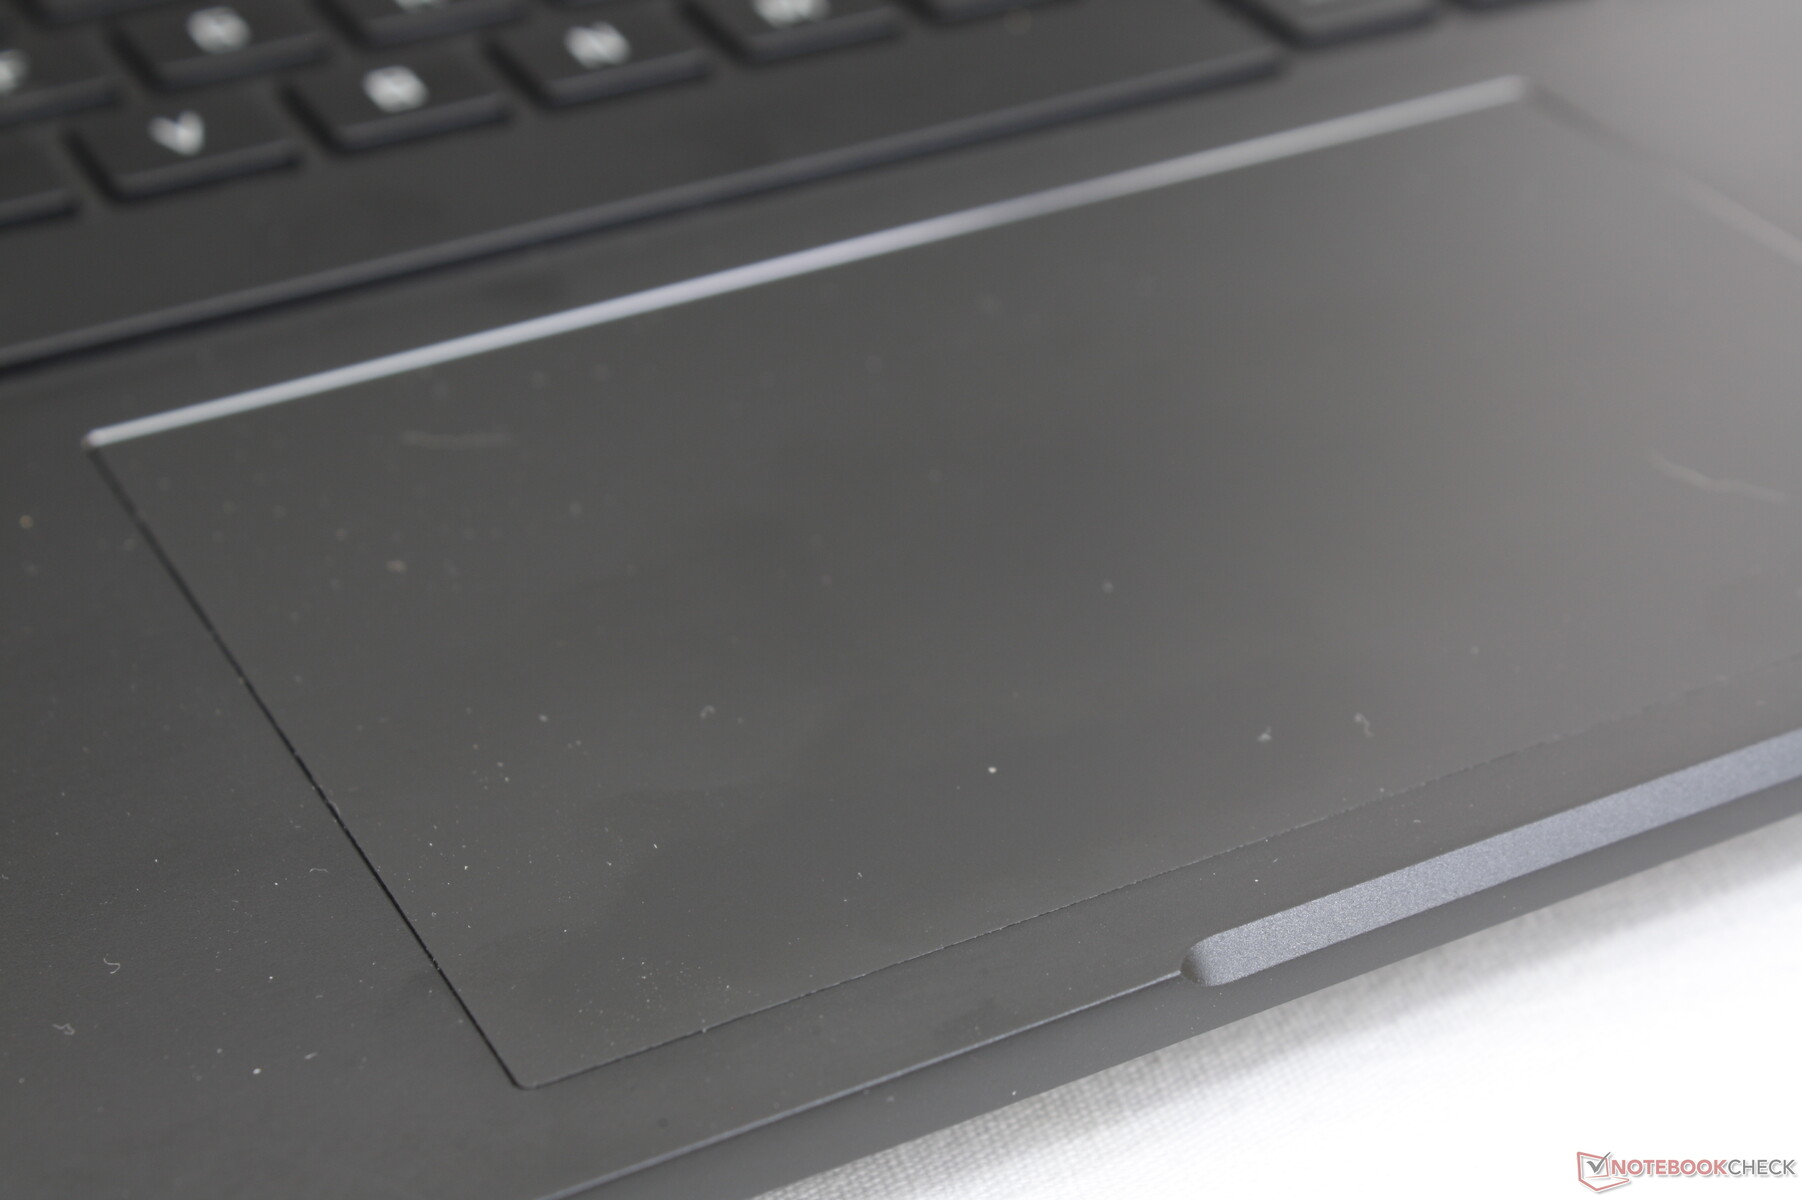
Dispositivi di input - Touchpad più piccolo ma migliore
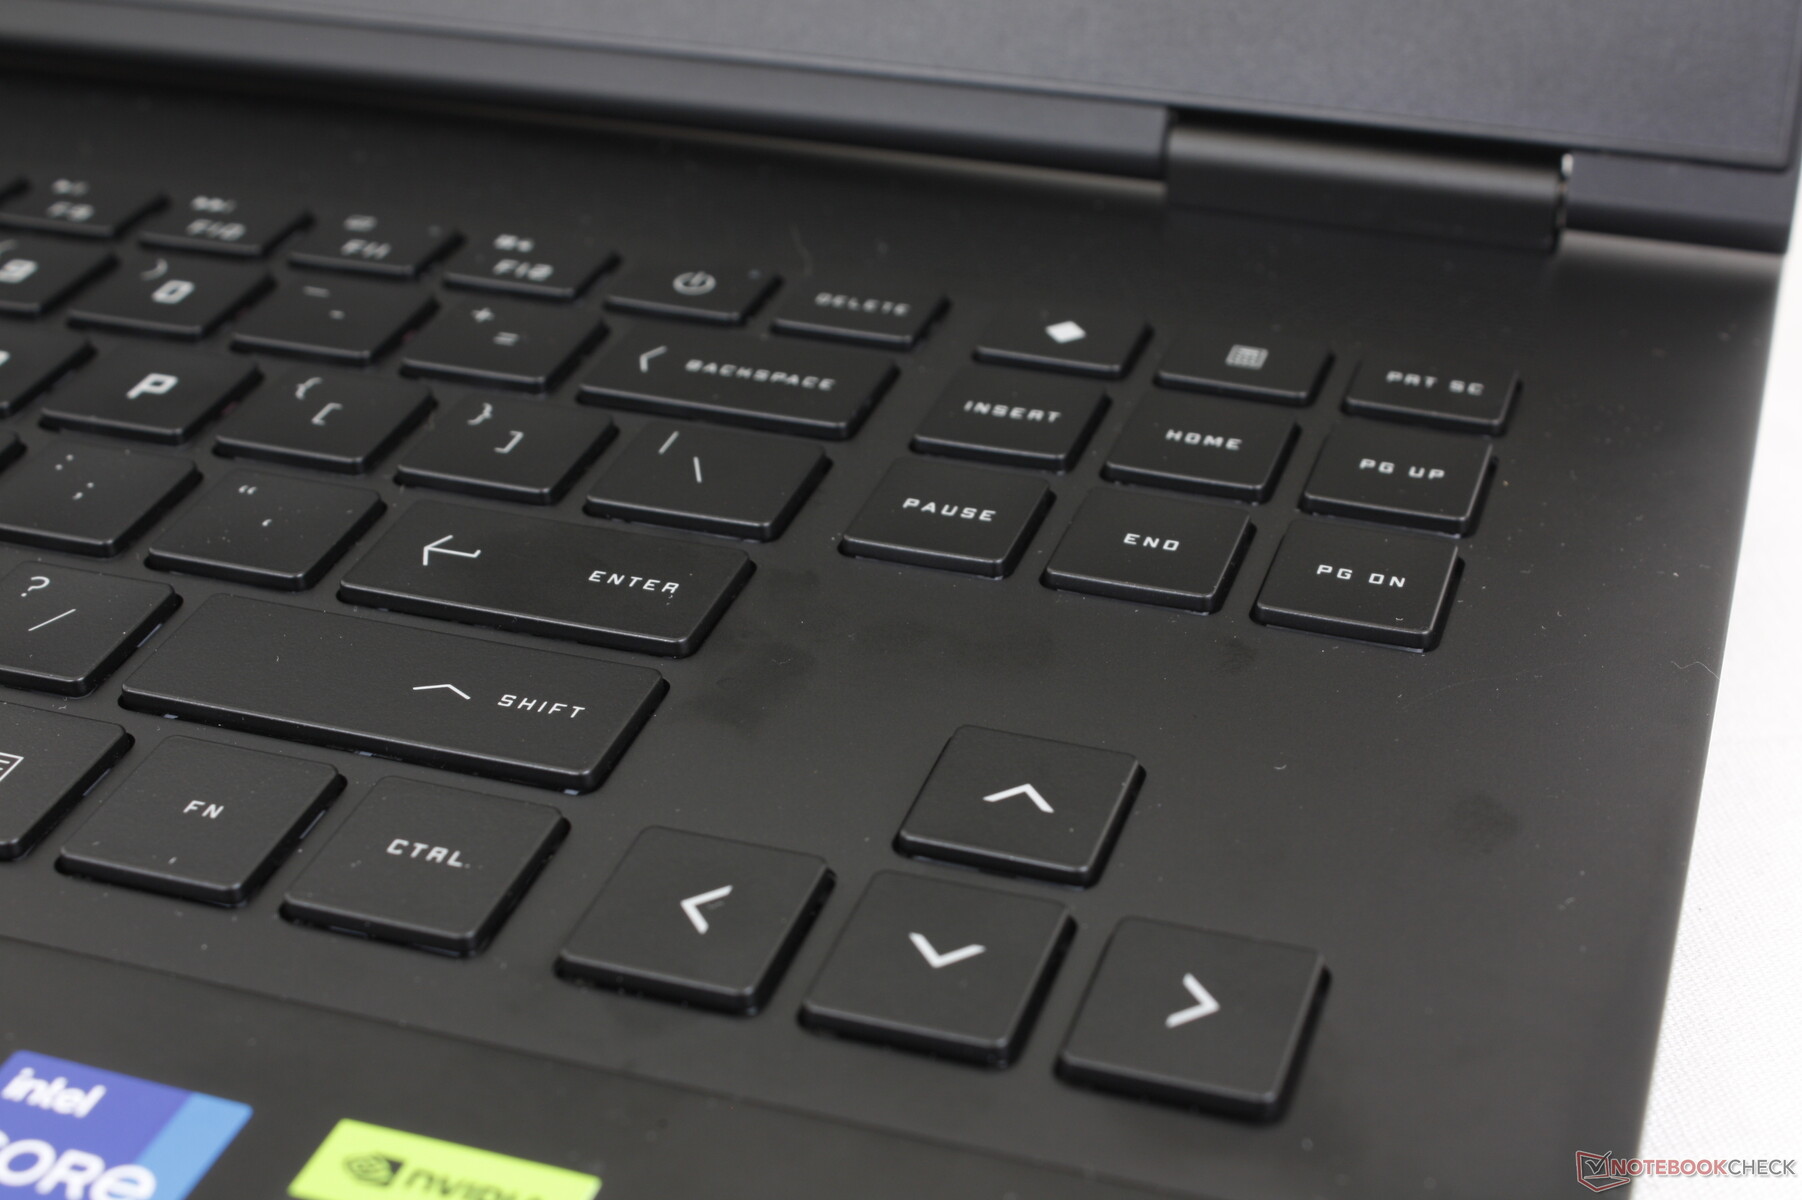
Tastiera
Mentre lo chassis e il clickpad sono stati rinnovati, la tastiera non è cambiata e quindi l'esperienza di digitazione rimane identica a quella dell'Omen 16 del 2022. Il feedback dei tasti è soddisfacente, soprattutto per quanto riguarda il tasto Spazio, ma il tasto Invio avrebbe potuto essere più deciso. La digitazione risulta più spaziosa rispetto a quella del Blade 16.
Touchpad
E' interessante notare che HP ha ridotto le dimensioni del clickpad da 13 x 8,6 cm sul modello Omen 16 2022 Omen 16 a soli 12,5 x 8 cm sul nuovo modello 2023. Tuttavia, il feedback quando si preme sulla sua superficie è migliorato per un clic più soddisfacente e udibile. Pertanto, non siamo troppo infastiditi dalle dimensioni ridotte.

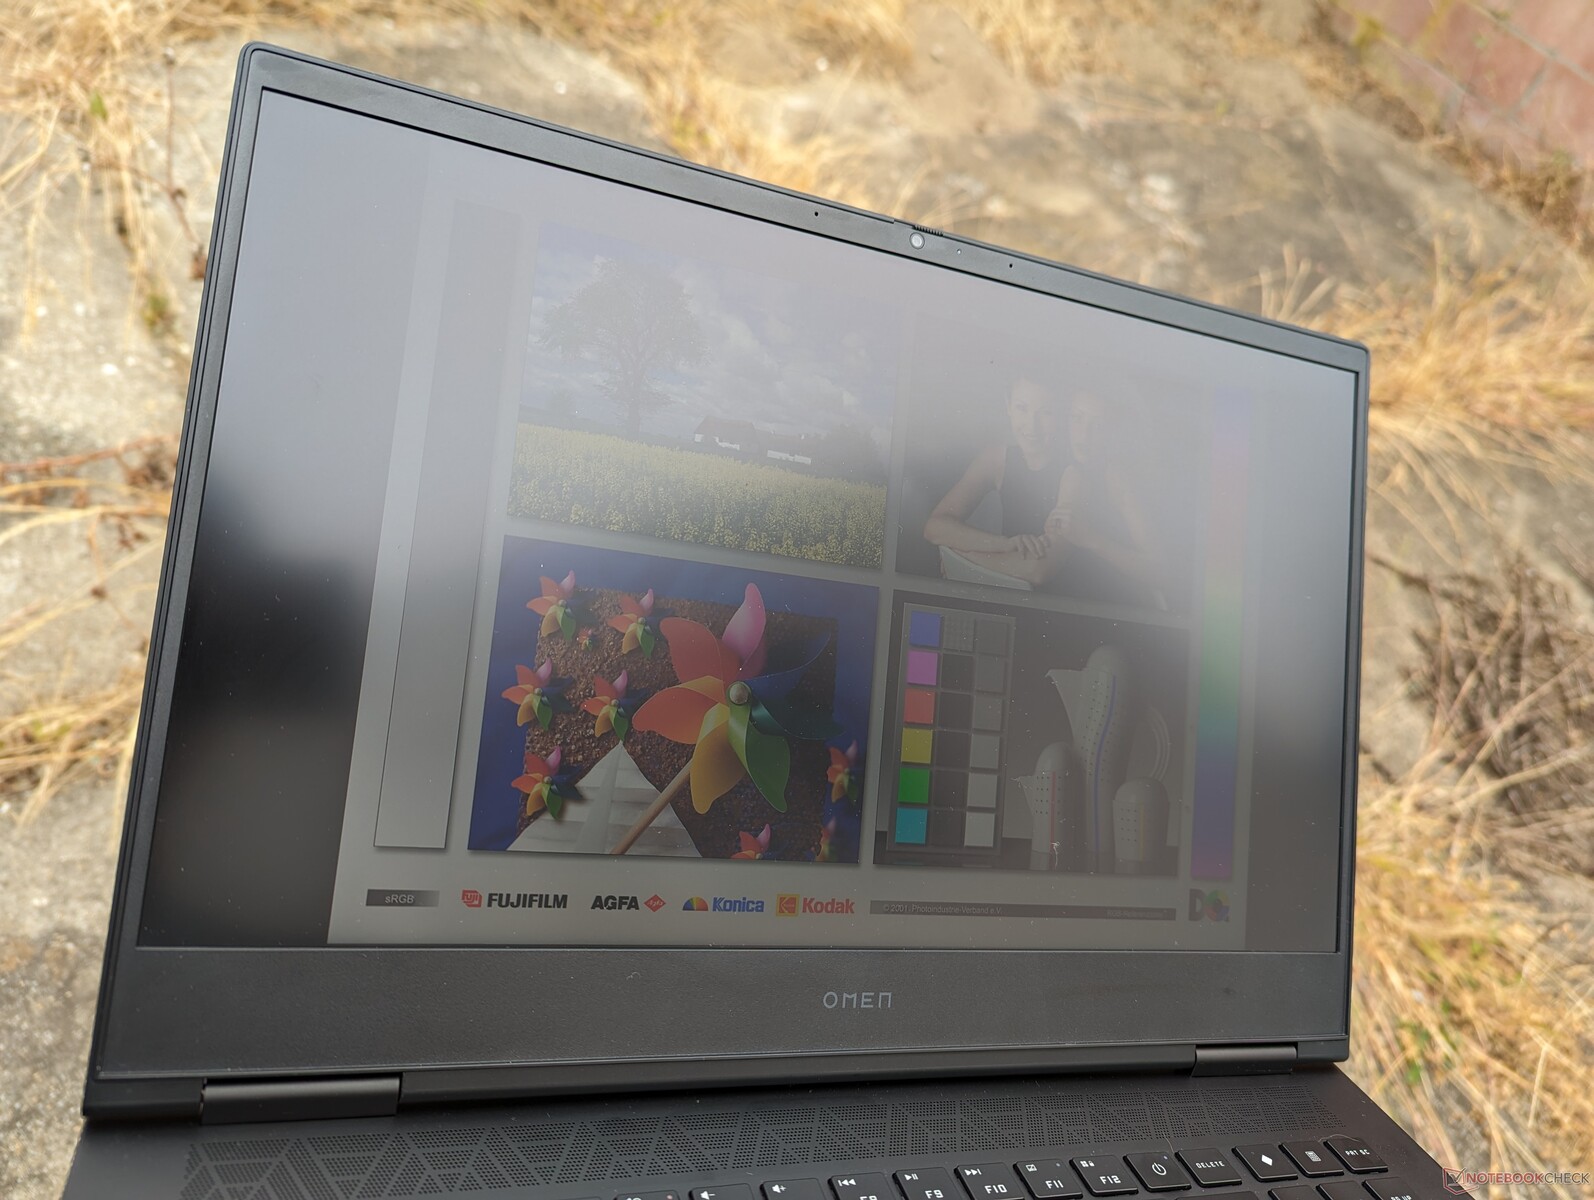
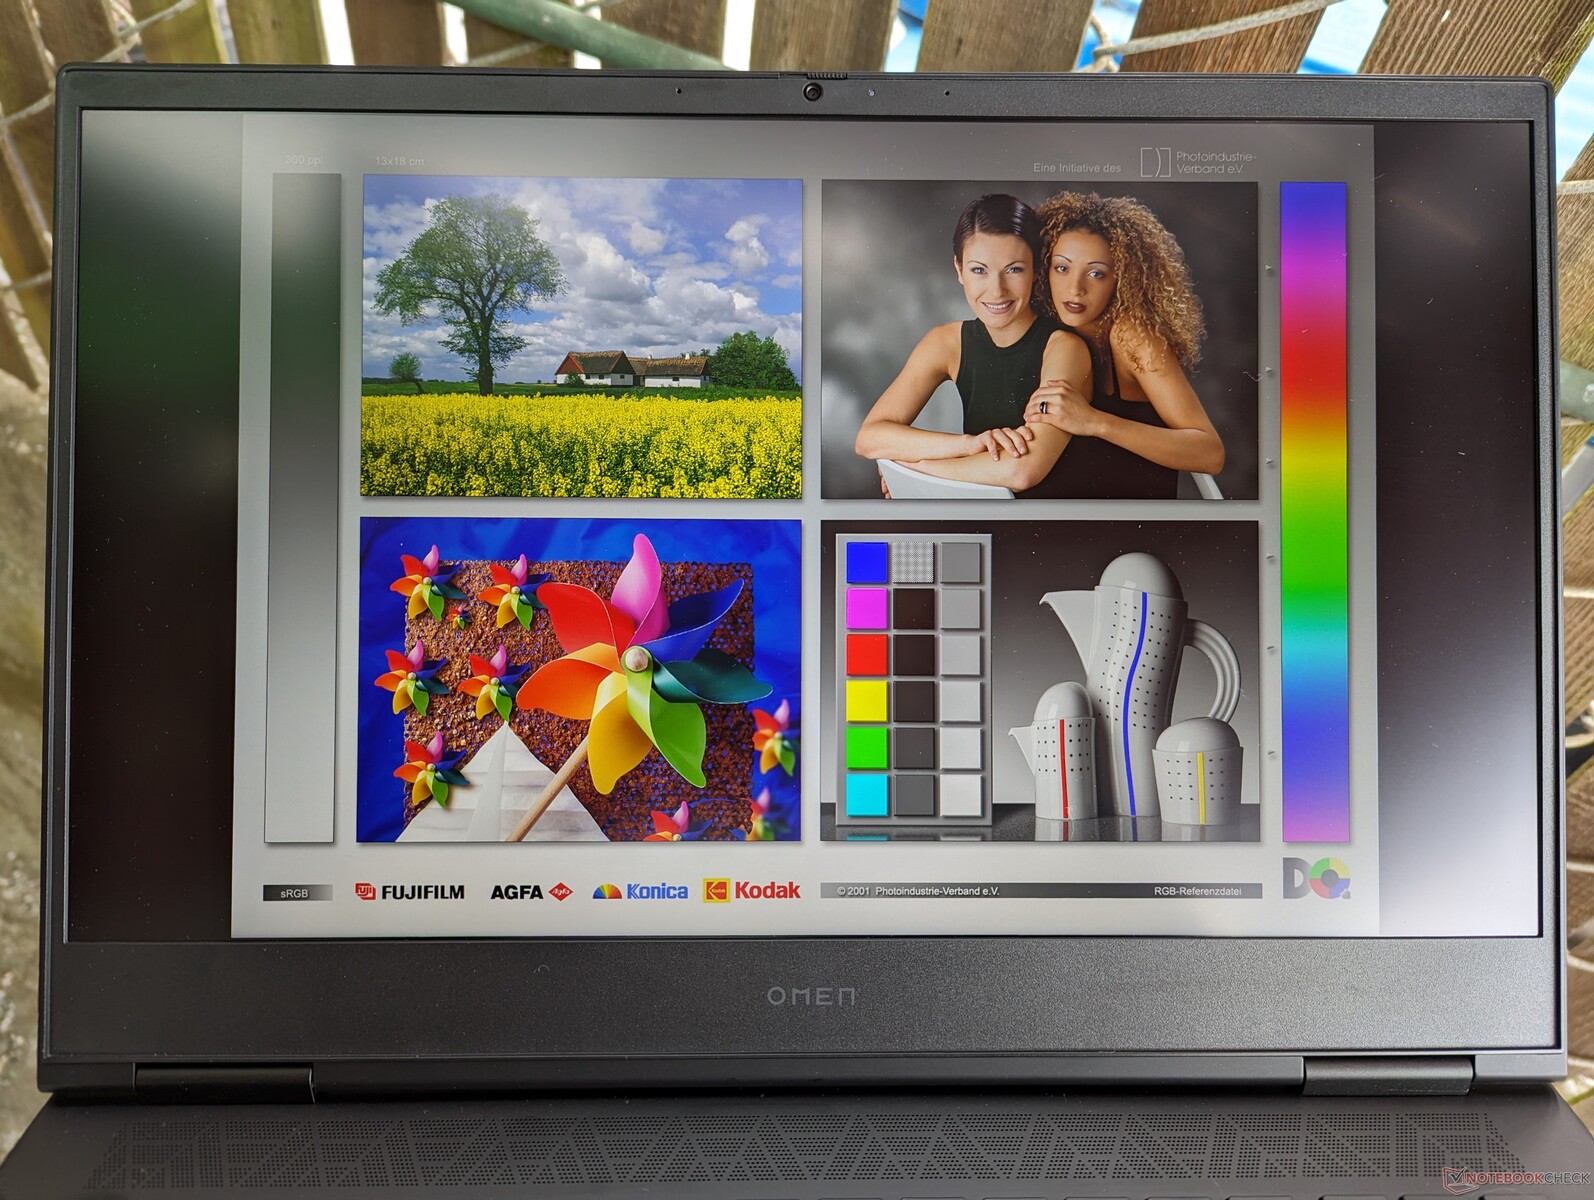
Display - Nessuna cattiva opzione
HP offre due opzioni di display, elencate di seguito. Le nostre misurazioni riflettono solo il pannello in grassetto.
- 1920 x 1080, 165 Hz, IPS, tempo di risposta 7 ms, opaco, 300 nits
- 2560 x 1440, 240 Hz, IPS, tempo di risposta 3 ms, opaco, 300 nits
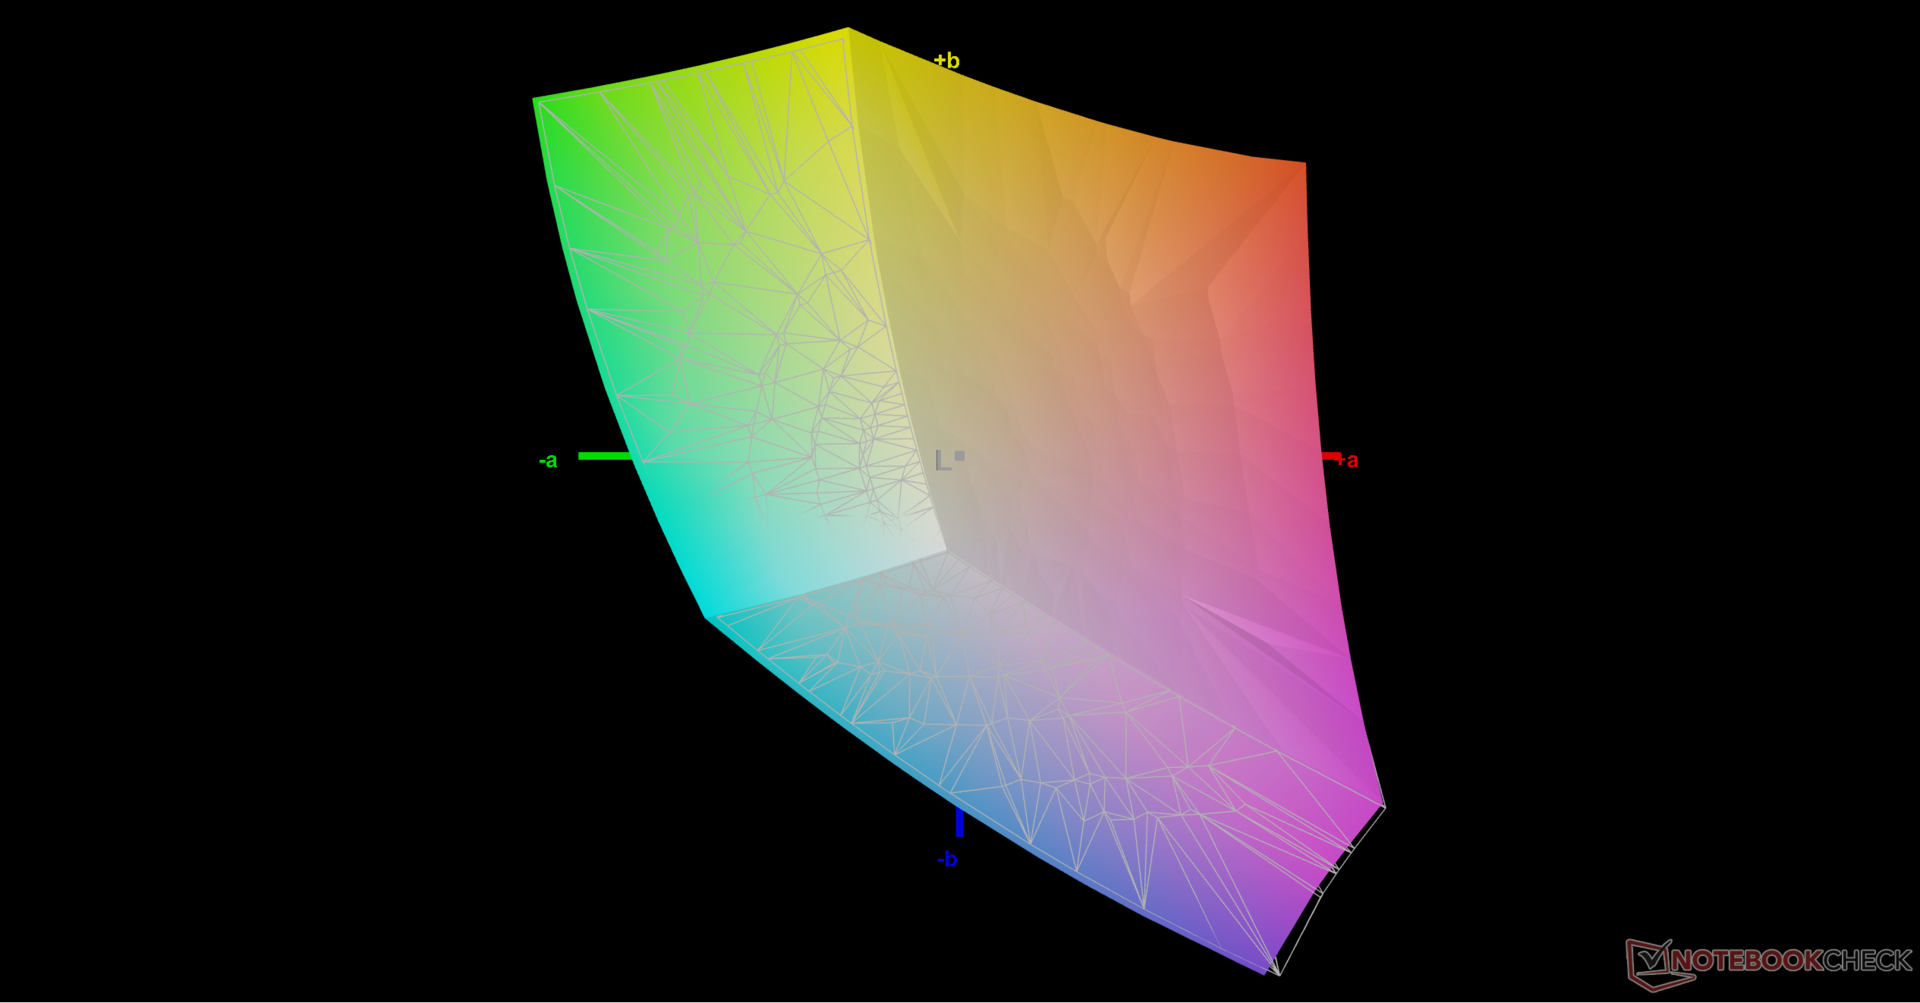
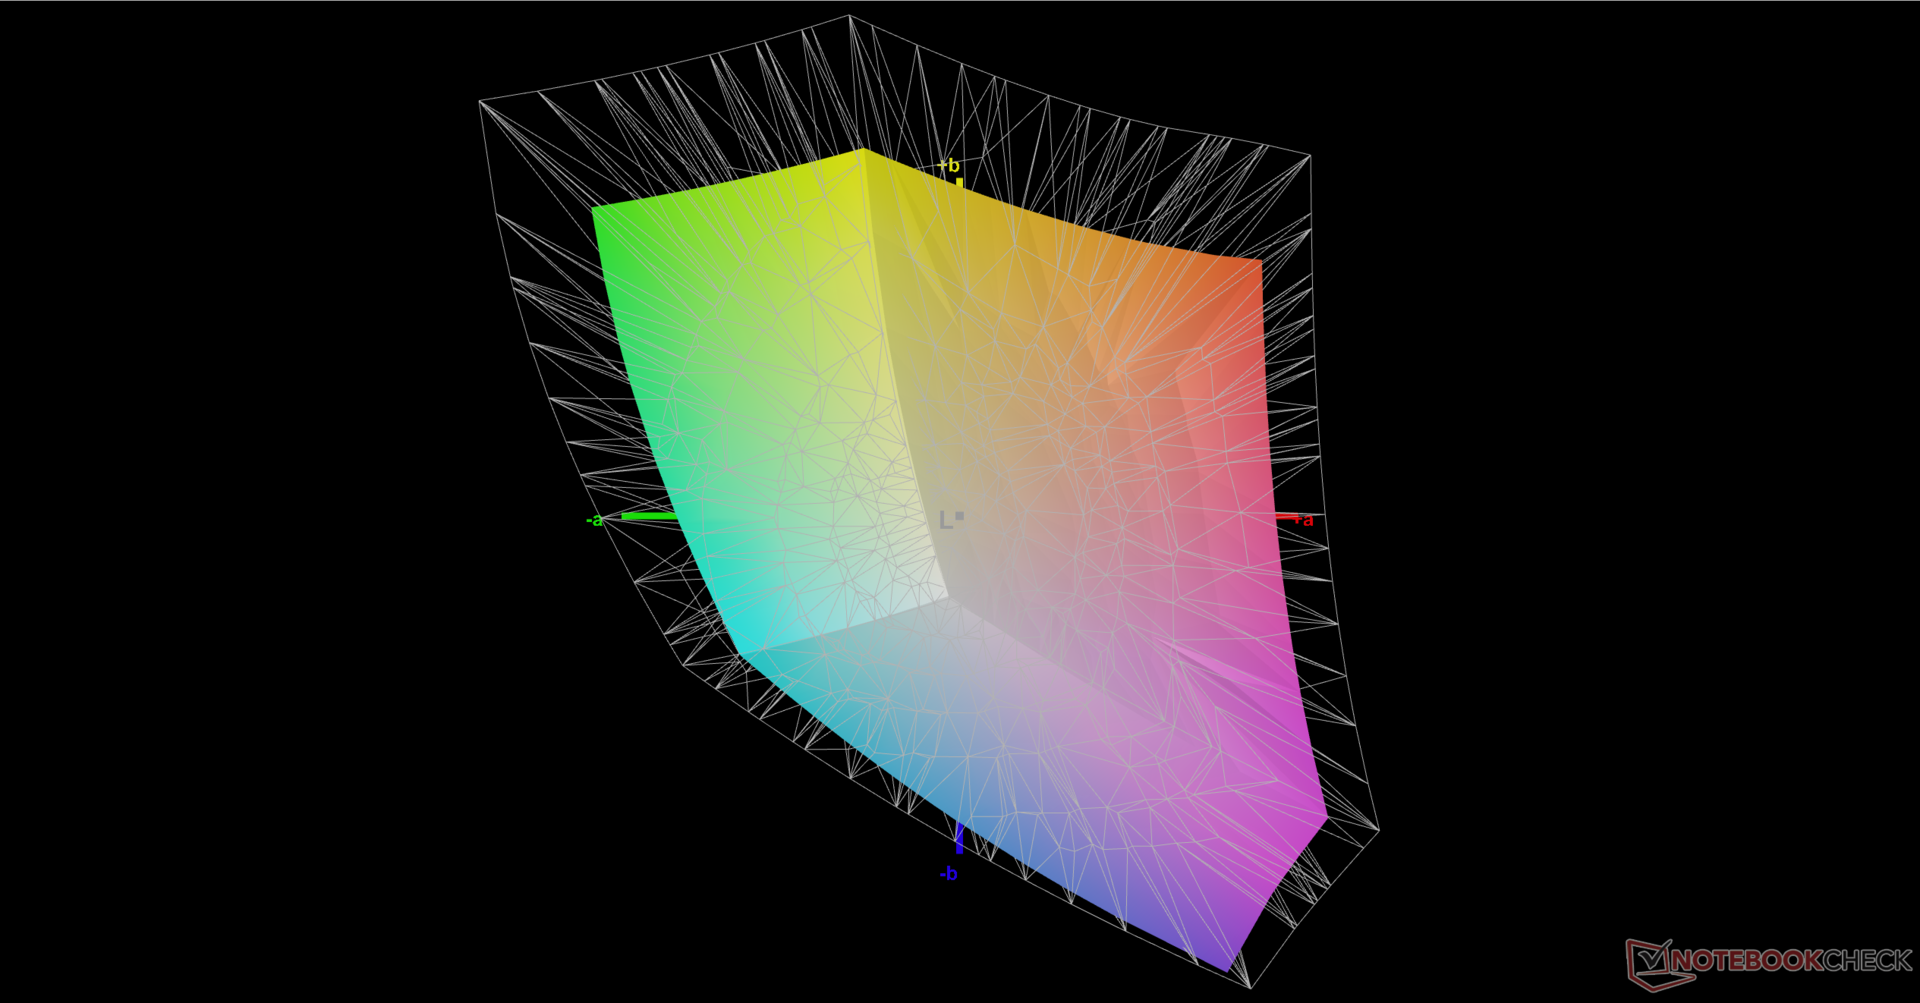
Nessuno dei due pannelli può essere considerato una cattiva opzione per i giochi, ma i giocatori di titoli veloci come Overwatch 2 o Valorant potrebbero voler prendere in considerazione l'opzione 1440p per i suoi tempi di risposta e frequenze di aggiornamento più veloci. La copertura dei colori è limitata al 100% sRGB, mentre concorrenti come Legion Pro 7 o ROG Strix G16 possono disporre di pannelli DCI-P3 più completi.
Si noti che l'Omen 16 è uno dei pochi portatili da gioco in 16:9 rimasti nella sua categoria di dimensioni, dato che la maggior parte degli altri è già passata ai 16:10.


| |||||||||||||||||||||||||
Distribuzione della luminosità: 91 %
Al centro con la batteria: 310.9 cd/m²
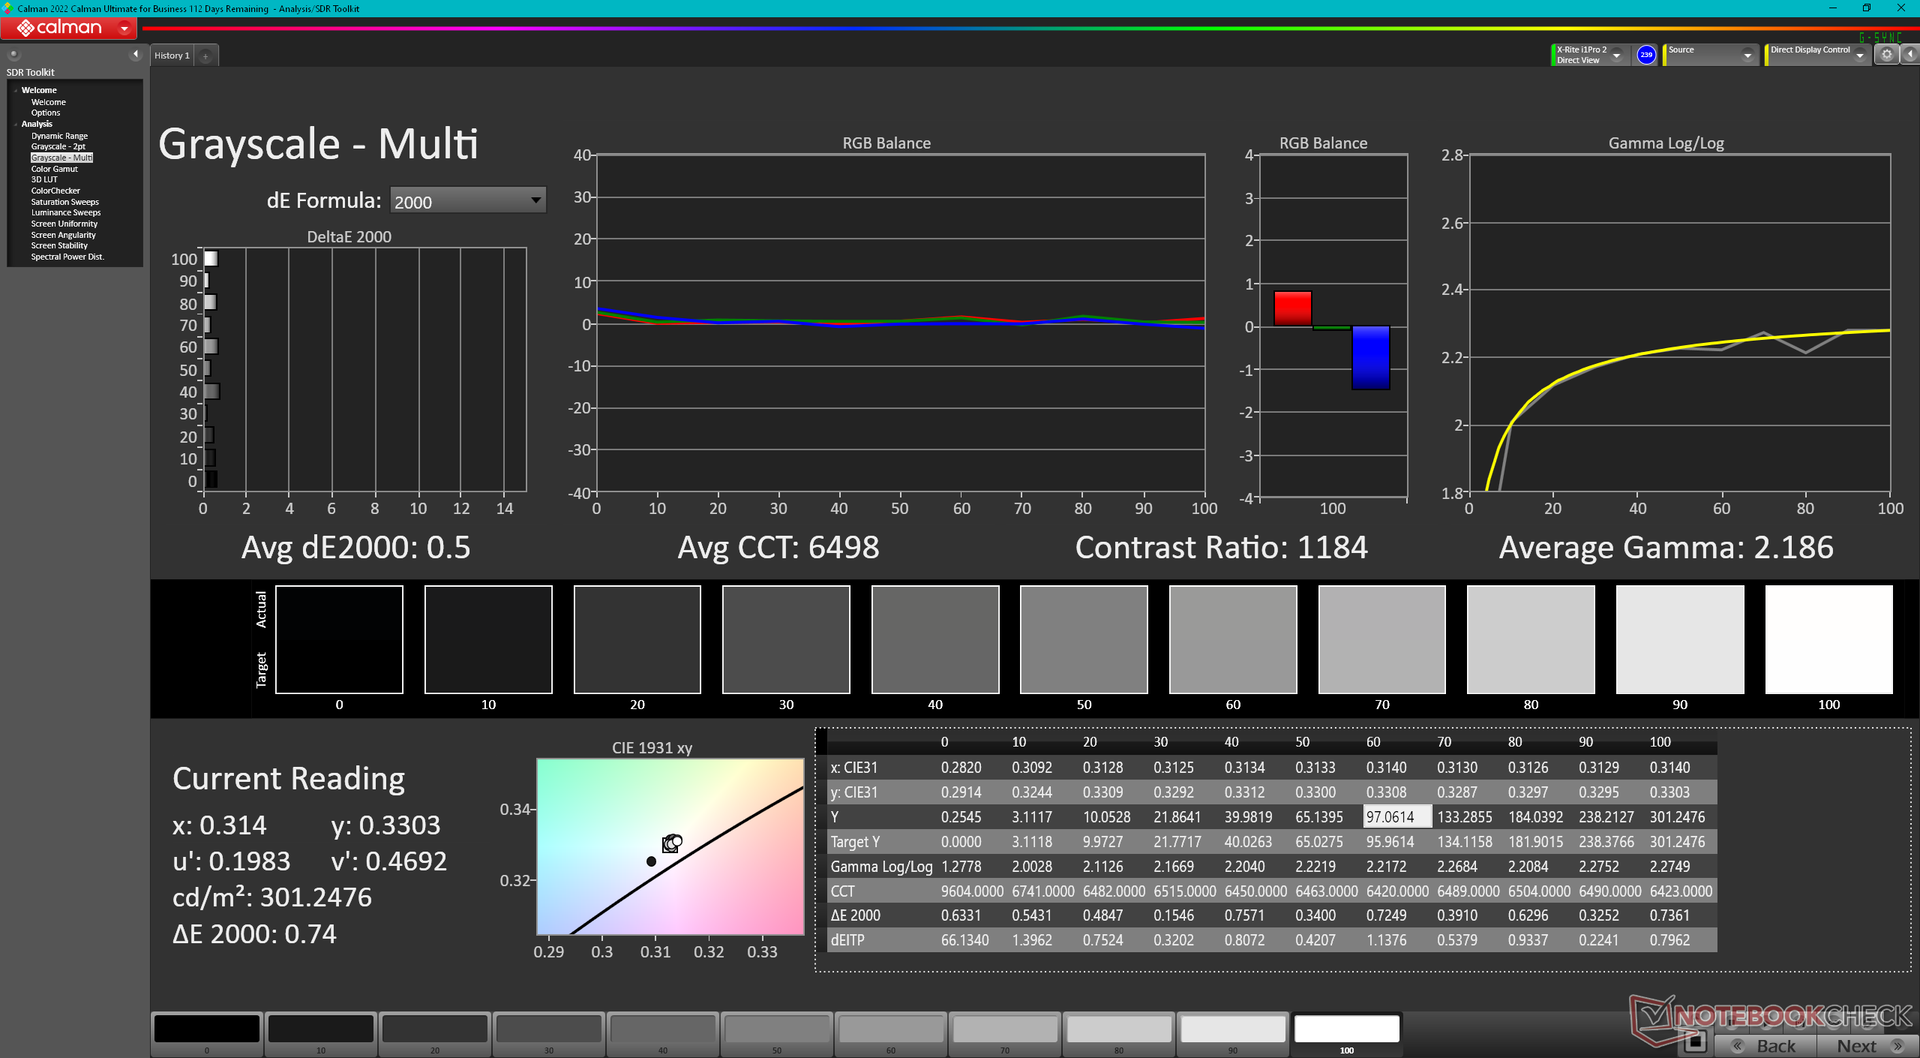
Contrasto: 888:1 (Nero: 0.35 cd/m²)
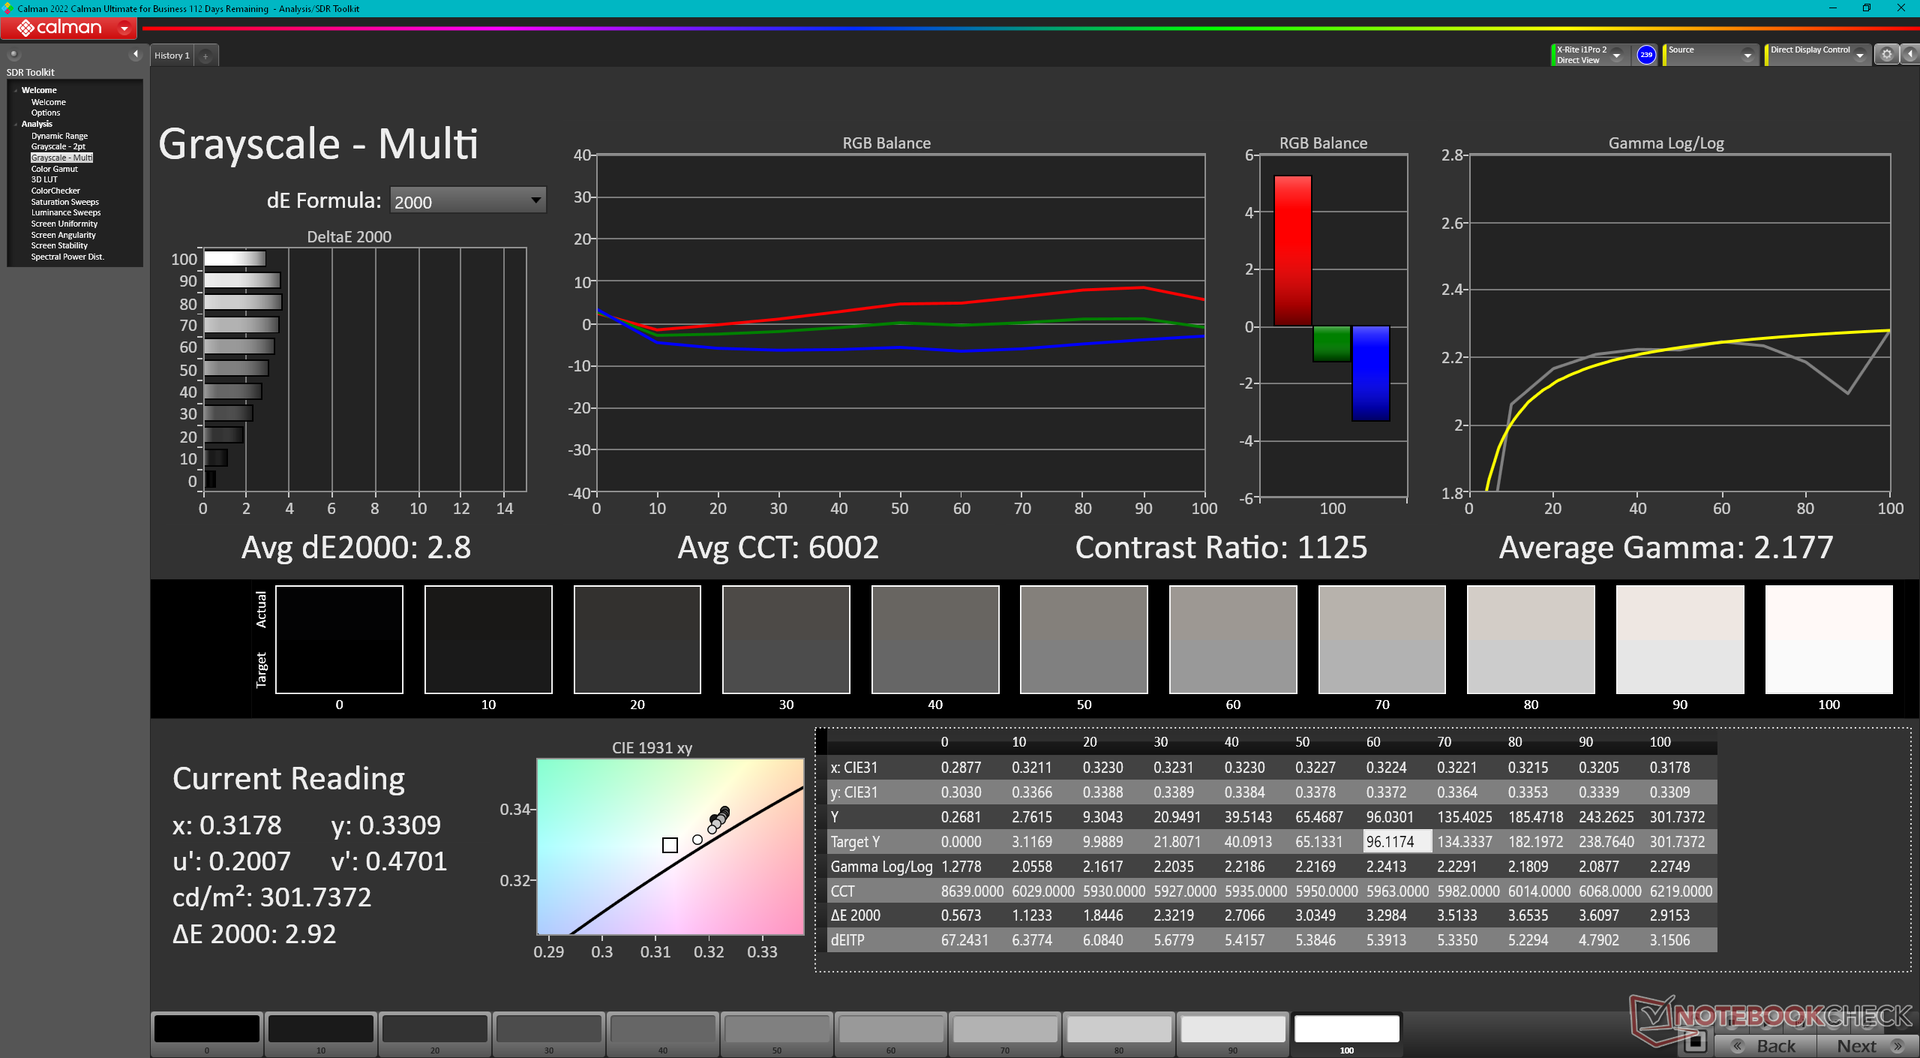
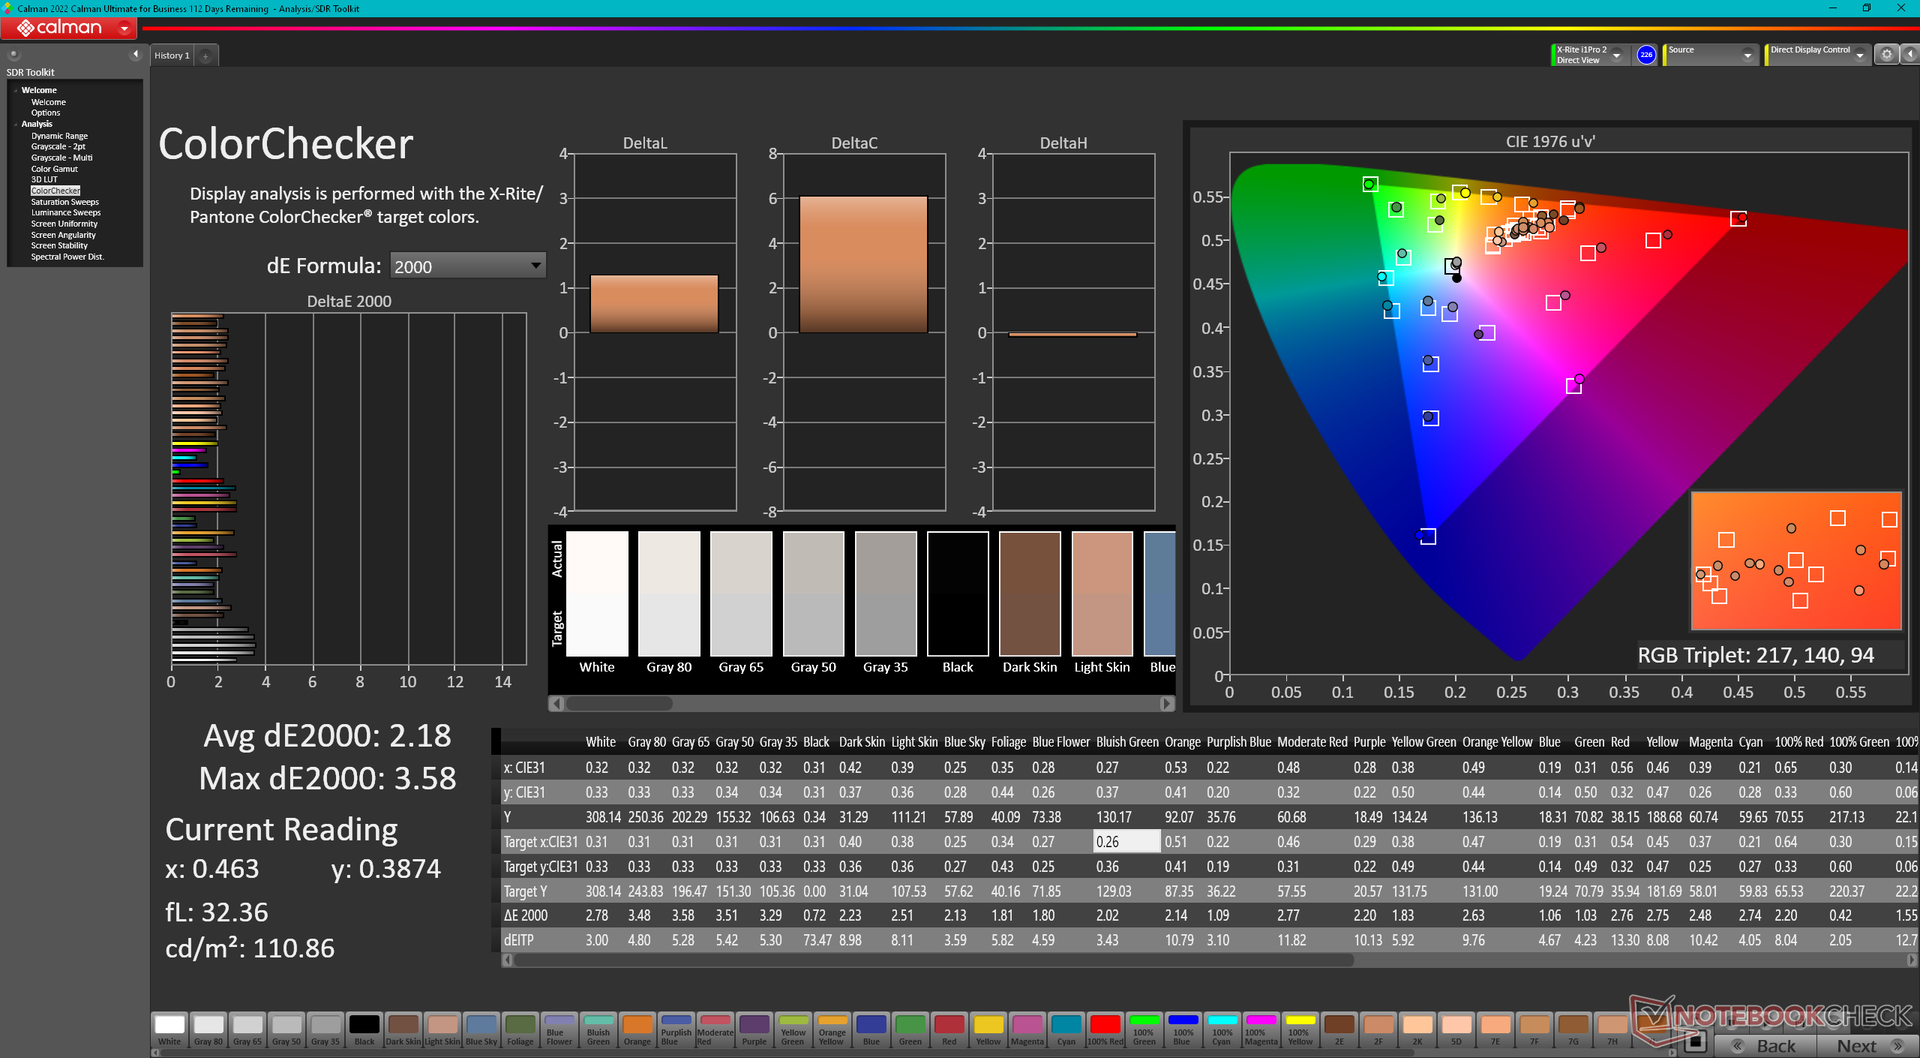
ΔE ColorChecker Calman: 2.18 | ∀{0.5-29.43 Ø4.73}
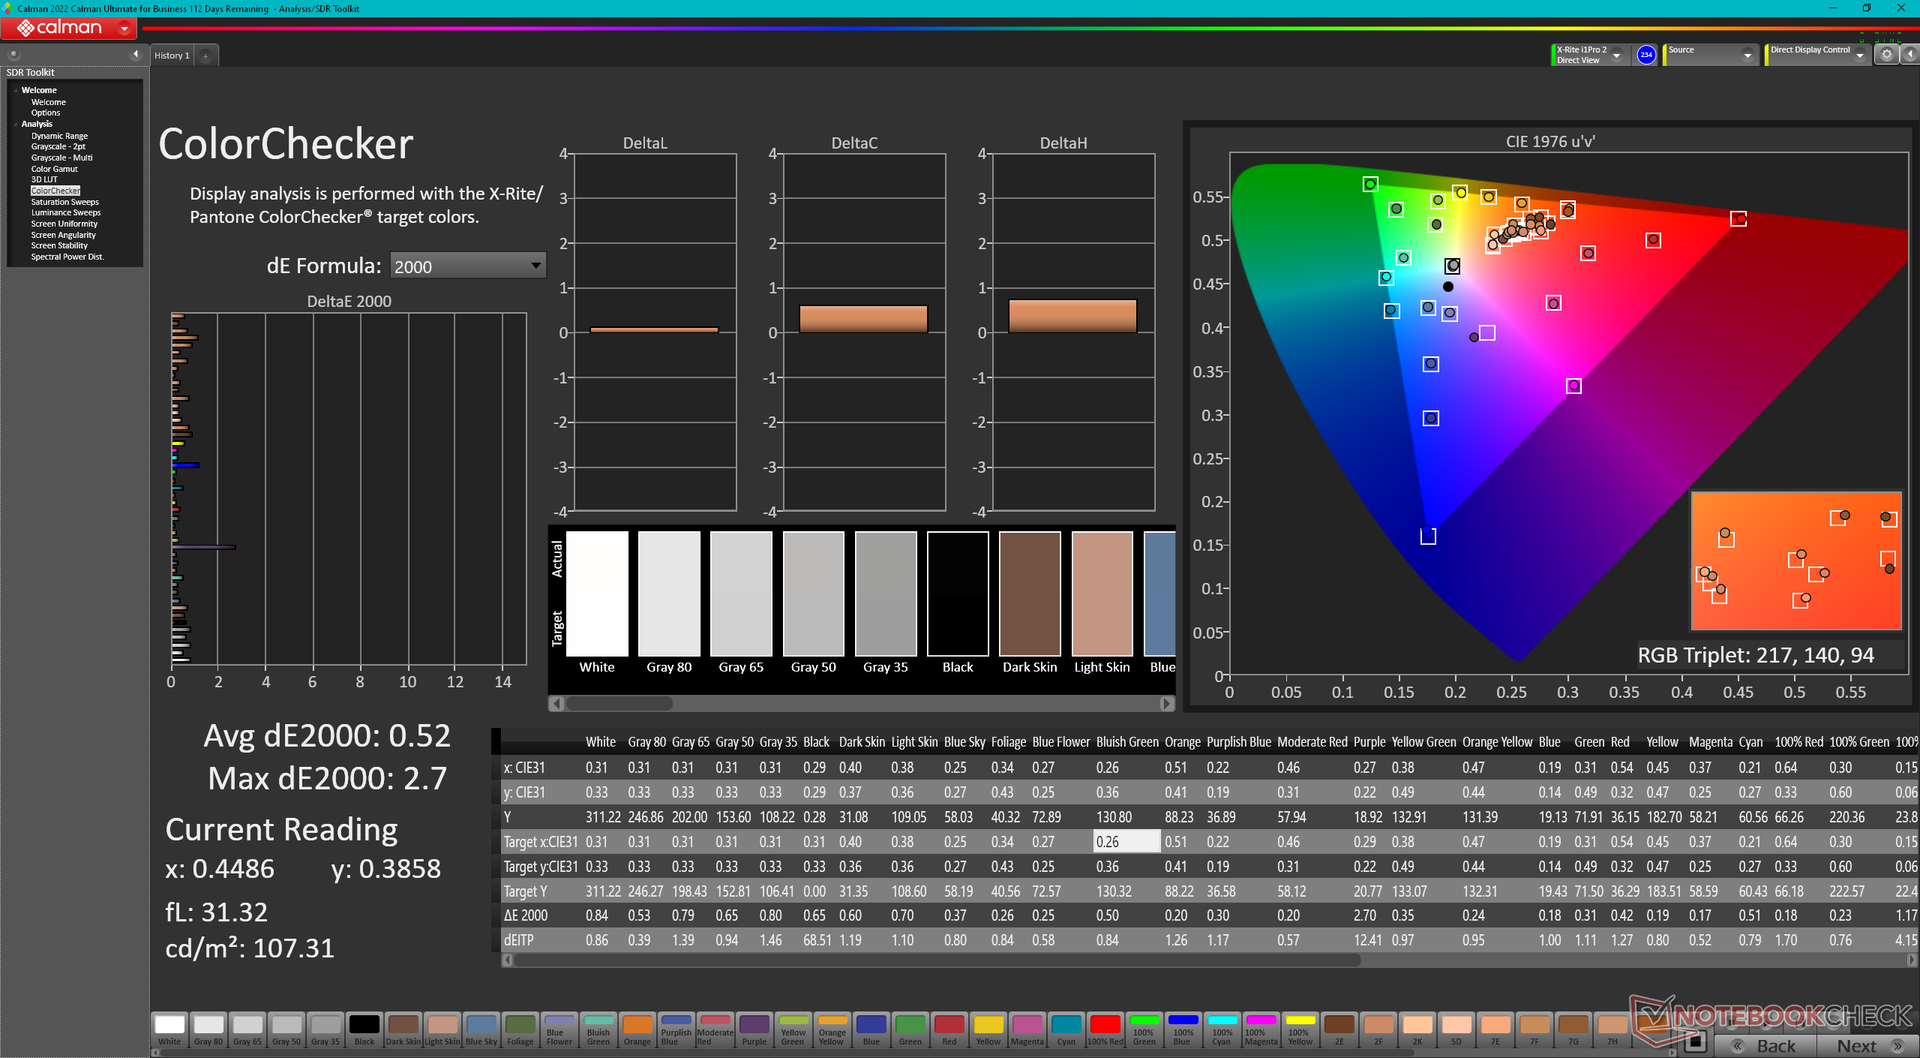
calibrated: 0.52
ΔE Greyscale Calman: 2.8 | ∀{0.09-98 Ø4.97}
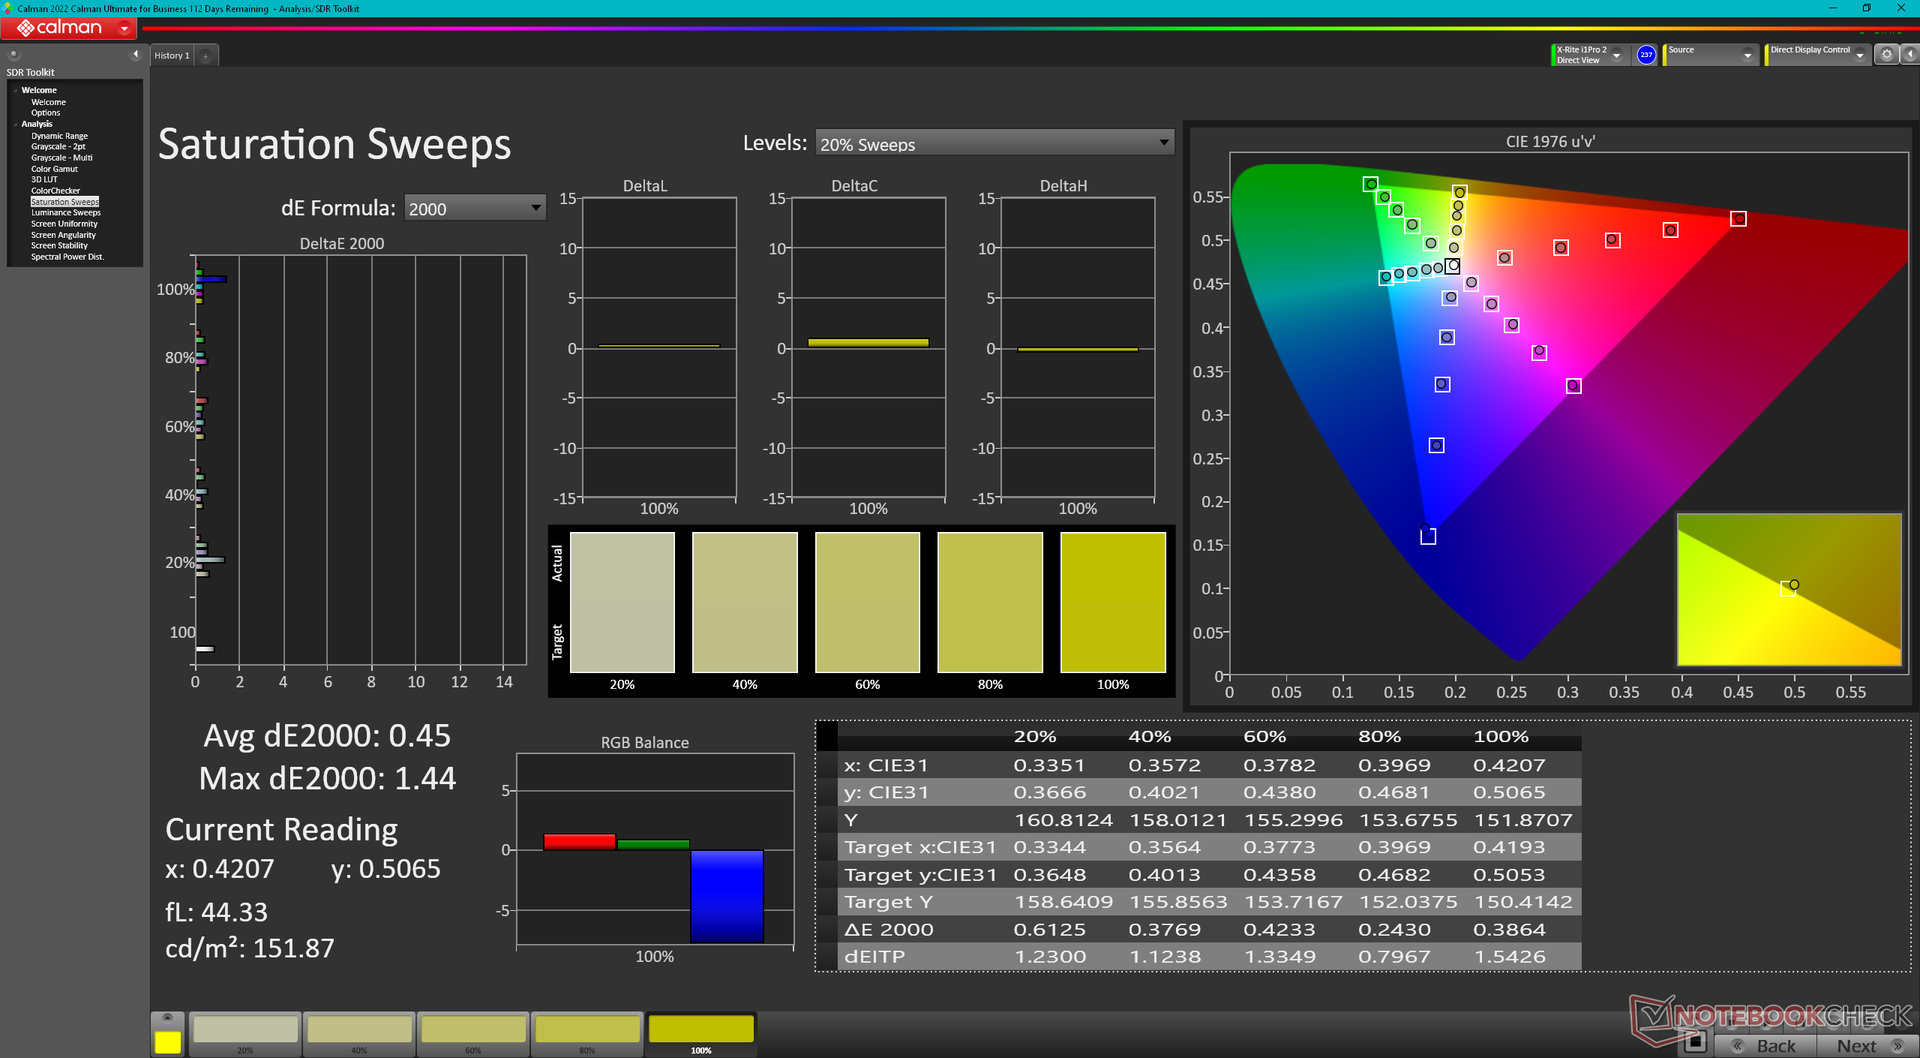
71.2% AdobeRGB 1998 (Argyll 3D)
99.2% sRGB (Argyll 3D)
69% Display P3 (Argyll 3D)
Gamma: 2.18
CCT: 6002 K
| HP Omen 16-wf000 BOE0B7D, IPS, 2560x1440, 16.1" | HP Omen 16-n0033dx BOE0AAE, IPS, 1920x1080, 16.1" | Alienware x16 R1 BOE NE16NZ4, IPS, 2560x1600, 16" | Lenovo Legion Pro 7 RTX4090 MNG007DA2-3 (CSO1628), IPS, 2560x1600, 16" | Asus ROG Strix G16 G614JZ TL160ADMP03-0, IPS, 2560x1600, 16" | Razer Blade 16 Early 2023 CSOT T3 MNG007DA4-1, IPS, 2560x1600, 16" | |
|---|---|---|---|---|---|---|
| Display | 4% | 23% | 1% | 20% | 23% | |
| Display P3 Coverage (%) | 69 | 74.4 8% | 99.2 44% | 69.5 1% | 97 41% | 98.5 43% |
| sRGB Coverage (%) | 99.2 | 99.2 0% | 100 1% | 99.8 1% | 99.9 1% | 100 1% |
| AdobeRGB 1998 Coverage (%) | 71.2 | 73.4 3% | 88.6 24% | 71.6 1% | 84.9 19% | 89.7 26% |
| Response Times | -149% | -9% | -42% | 11% | -34% | |
| Response Time Grey 50% / Grey 80% * (ms) | 4.6 ? | 17.6 ? -283% | 5.1 ? -11% | 10.9 ? -137% | 5.1 ? -11% | 6.6 ? -43% |
| Response Time Black / White * (ms) | 9.7 ? | 11.2 ? -15% | 10.3 ? -6% | 4.6 ? 53% | 6.6 ? 32% | 12 ? -24% |
| PWM Frequency (Hz) | ||||||
| Screen | -38% | -6% | 3% | 5% | -4% | |
| Brightness middle (cd/m²) | 310.9 | 373.3 20% | 302.2 -3% | 491 58% | 470 51% | 456.8 47% |
| Brightness (cd/m²) | 296 | 361 22% | 285 -4% | 472 59% | 459 55% | 437 48% |
| Brightness Distribution (%) | 91 | 79 -13% | 89 -2% | 91 0% | 93 2% | 83 -9% |
| Black Level * (cd/m²) | 0.35 | 0.44 -26% | 0.26 26% | 0.4 -14% | 0.42 -20% | 0.35 -0% |
| Contrast (:1) | 888 | 848 -5% | 1162 31% | 1228 38% | 1119 26% | 1305 47% |
| Colorchecker dE 2000 * | 2.18 | 2.12 3% | 1.63 25% | 1.6 27% | 1.86 15% | 3.7 -70% |
| Colorchecker dE 2000 max. * | 3.58 | 5.62 -57% | 4.13 -15% | 5.15 -44% | 3.87 -8% | 6.42 -79% |
| Colorchecker dE 2000 calibrated * | 0.52 | 2.06 -296% | 1.17 -125% | 0.97 -87% | 0.93 -79% | 0.66 -27% |
| Greyscale dE 2000 * | 2.8 | 2.5 11% | 2.5 11% | 3 -7% | 2.7 4% | 2.6 7% |
| Gamma | 2.18 101% | 2.3 96% | 2.23 99% | 2.211 100% | 2.246 98% | 2.3 96% |
| CCT | 6002 108% | 6408 101% | 6590 99% | 6979 93% | 6711 97% | 6108 106% |
| Media totale (Programma / Settaggio) | -61% /
-45% | 3% /
-0% | -13% /
-4% | 12% /
9% | -5% /
-2% |
* ... Meglio usare valori piccoli
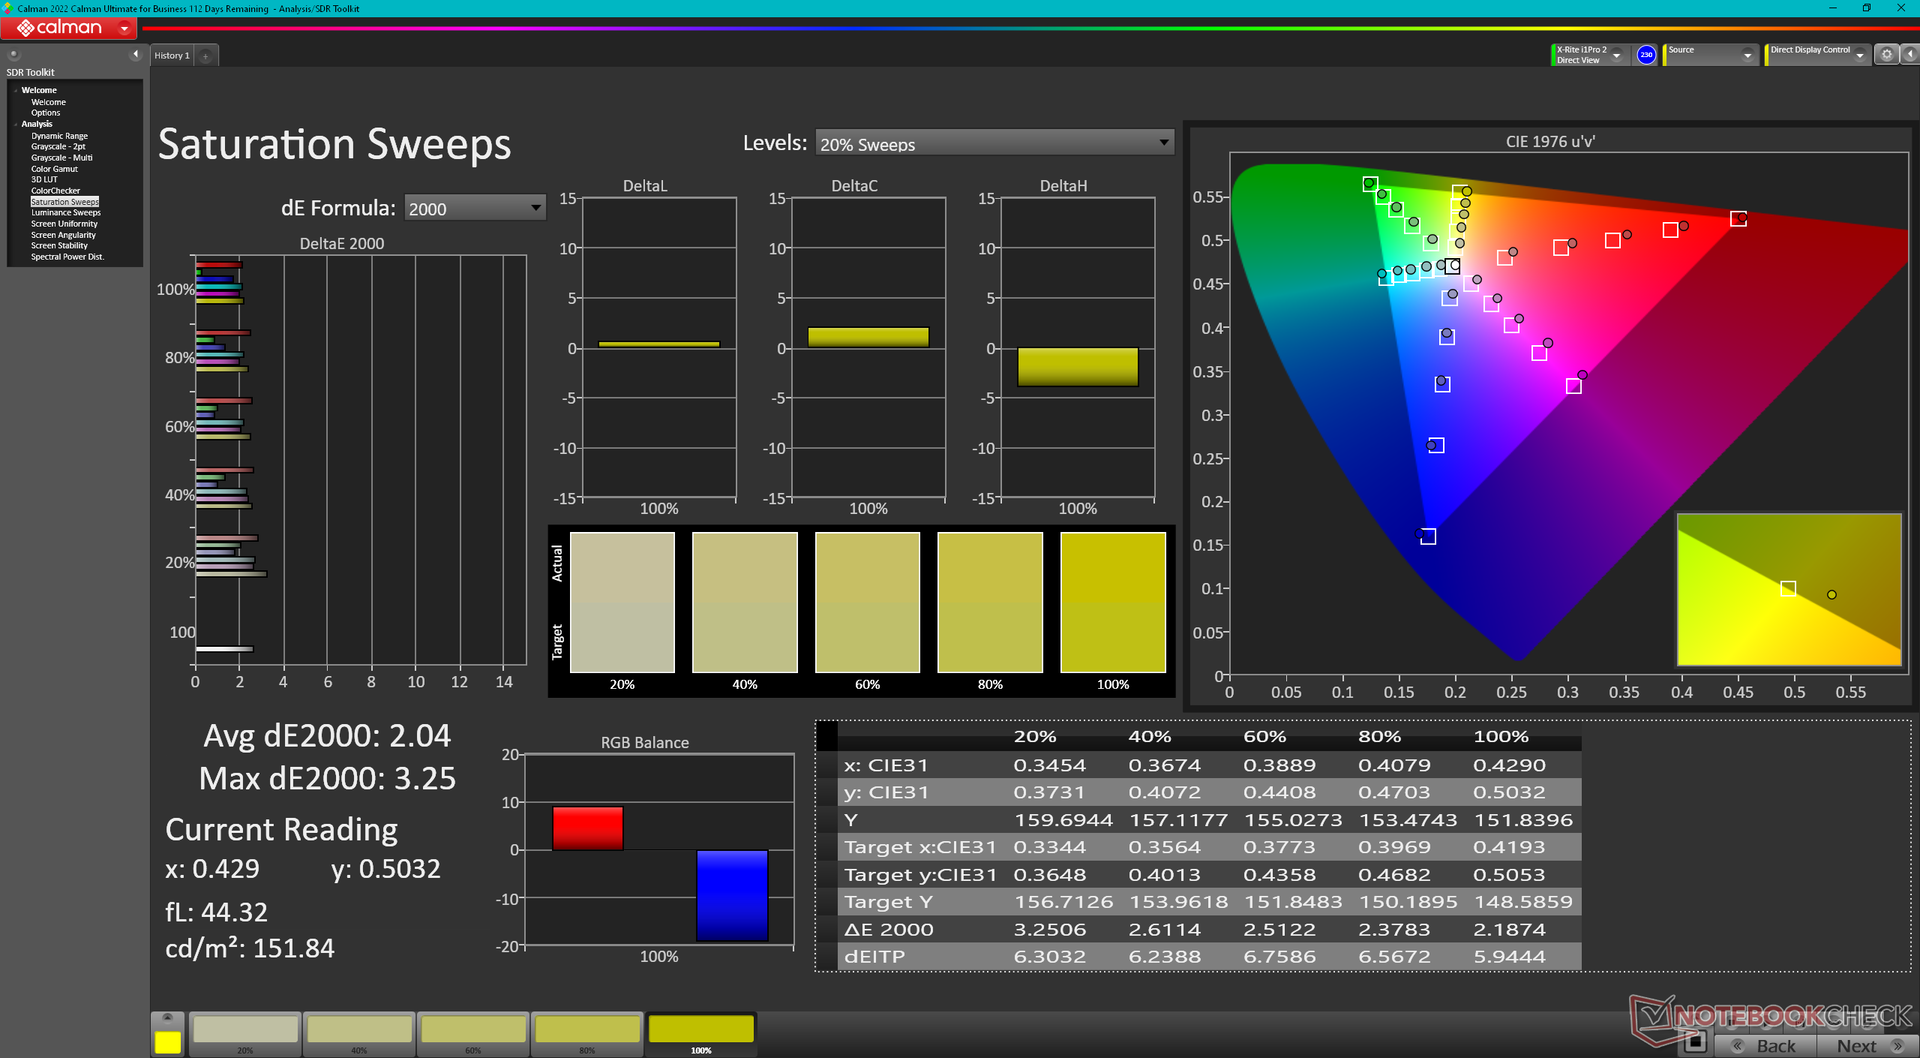
Il display è calibrato in modo decente, con valori medi di deltaE della scala di grigi e del colore pari rispettivamente a 2,8 e 2,18. La calibrazione del pannello con un colorimetro X-Rite migliorerebbe ulteriormente i valori medi, portandoli a 0,5 e 0,52 rispettivamente. Se lo si desidera, i proprietari possono applicare il nostro profilo ICM calibrato di cui sopra.
Tempi di risposta del Display
| ↔ Tempi di risposta dal Nero al Bianco | ||
|---|---|---|
| 9.7 ms ... aumenta ↗ e diminuisce ↘ combinato | ↗ 4.6 ms Incremento | 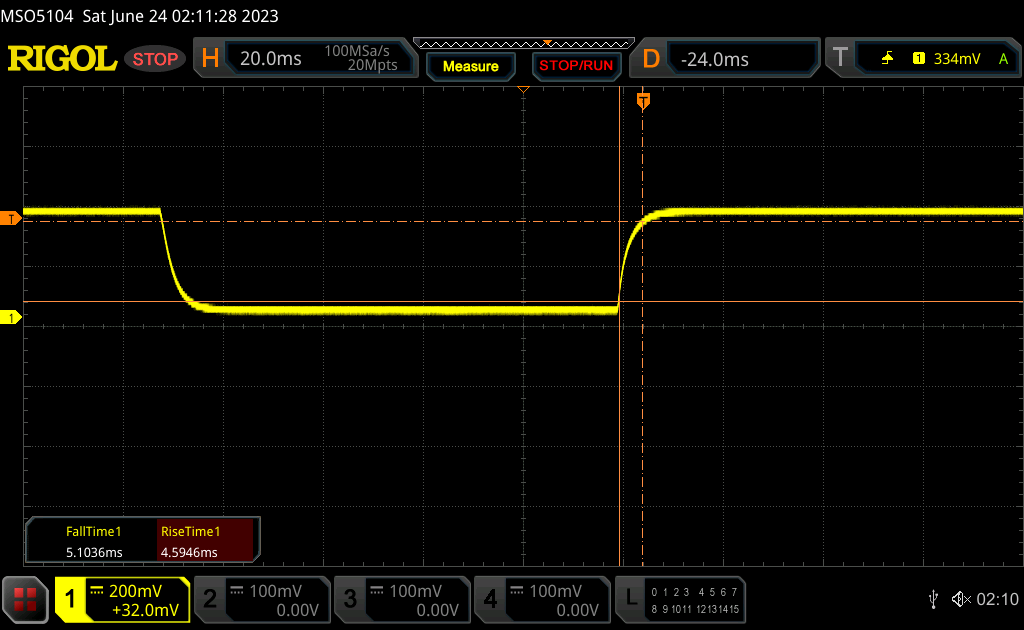 |
| ↘ 5.1 ms Calo | ||
| Lo schermo mostra veloci tempi di risposta durante i nostri tests e dovrebbe esere adatto al gaming In confronto, tutti i dispositivi di test variano da 0.1 (minimo) a 240 (massimo) ms. » 27 % di tutti i dispositivi è migliore. Questo significa che i tempi di risposta rilevati sono migliori rispettto alla media di tutti i dispositivi testati (19.9 ms). | ||
| ↔ Tempo di risposta dal 50% Grigio all'80% Grigio | ||
| 4.6 ms ... aumenta ↗ e diminuisce ↘ combinato | ↗ 2.1 ms Incremento | 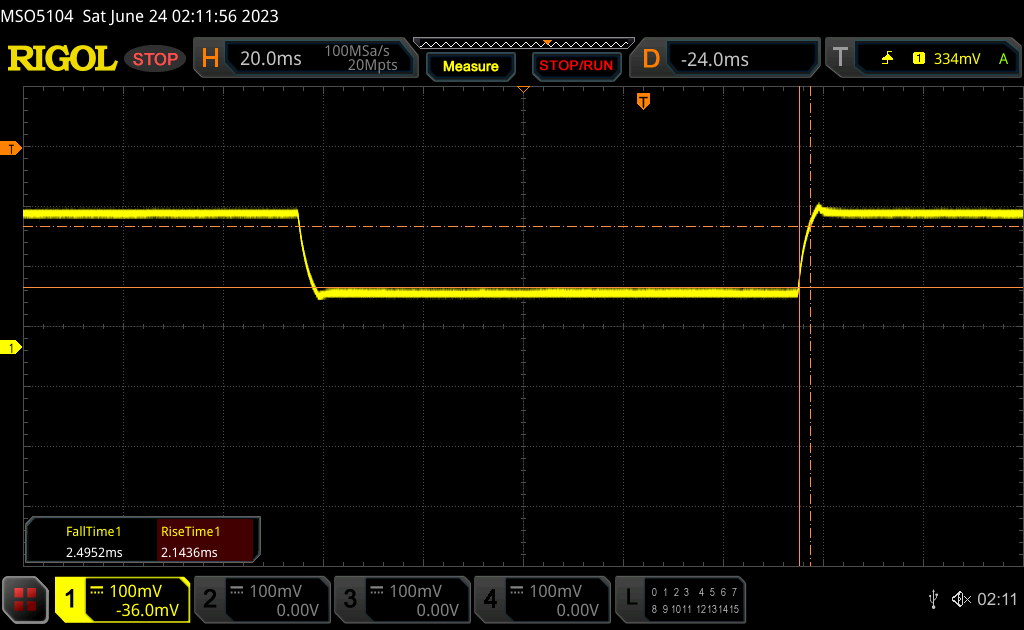 |
| ↘ 2.5 ms Calo | ||
| Lo schermo ha mostrato valori di risposta molto veloci nei nostri tests ed è molto adatto per i gaming veloce. In confronto, tutti i dispositivi di test variano da 0.165 (minimo) a 636 (massimo) ms. » 16 % di tutti i dispositivi è migliore. Questo significa che i tempi di risposta rilevati sono migliori rispettto alla media di tutti i dispositivi testati (31.1 ms). | ||
Sfarfallio dello schermo / PWM (Pulse-Width Modulation)
| flickering dello schermo / PWM non rilevato | 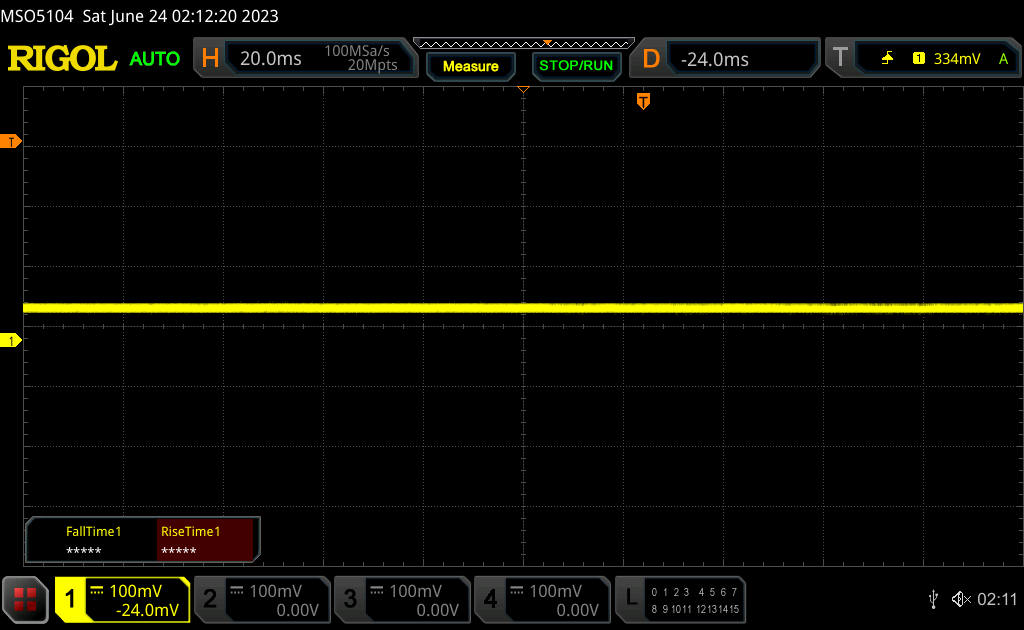 | ||
In confronto: 52 % di tutti i dispositivi testati non utilizza PWM per ridurre la luminosita' del display. Se è rilevato PWM, una media di 7798 (minimo: 5 - massimo: 343500) Hz è stata rilevata. | |||
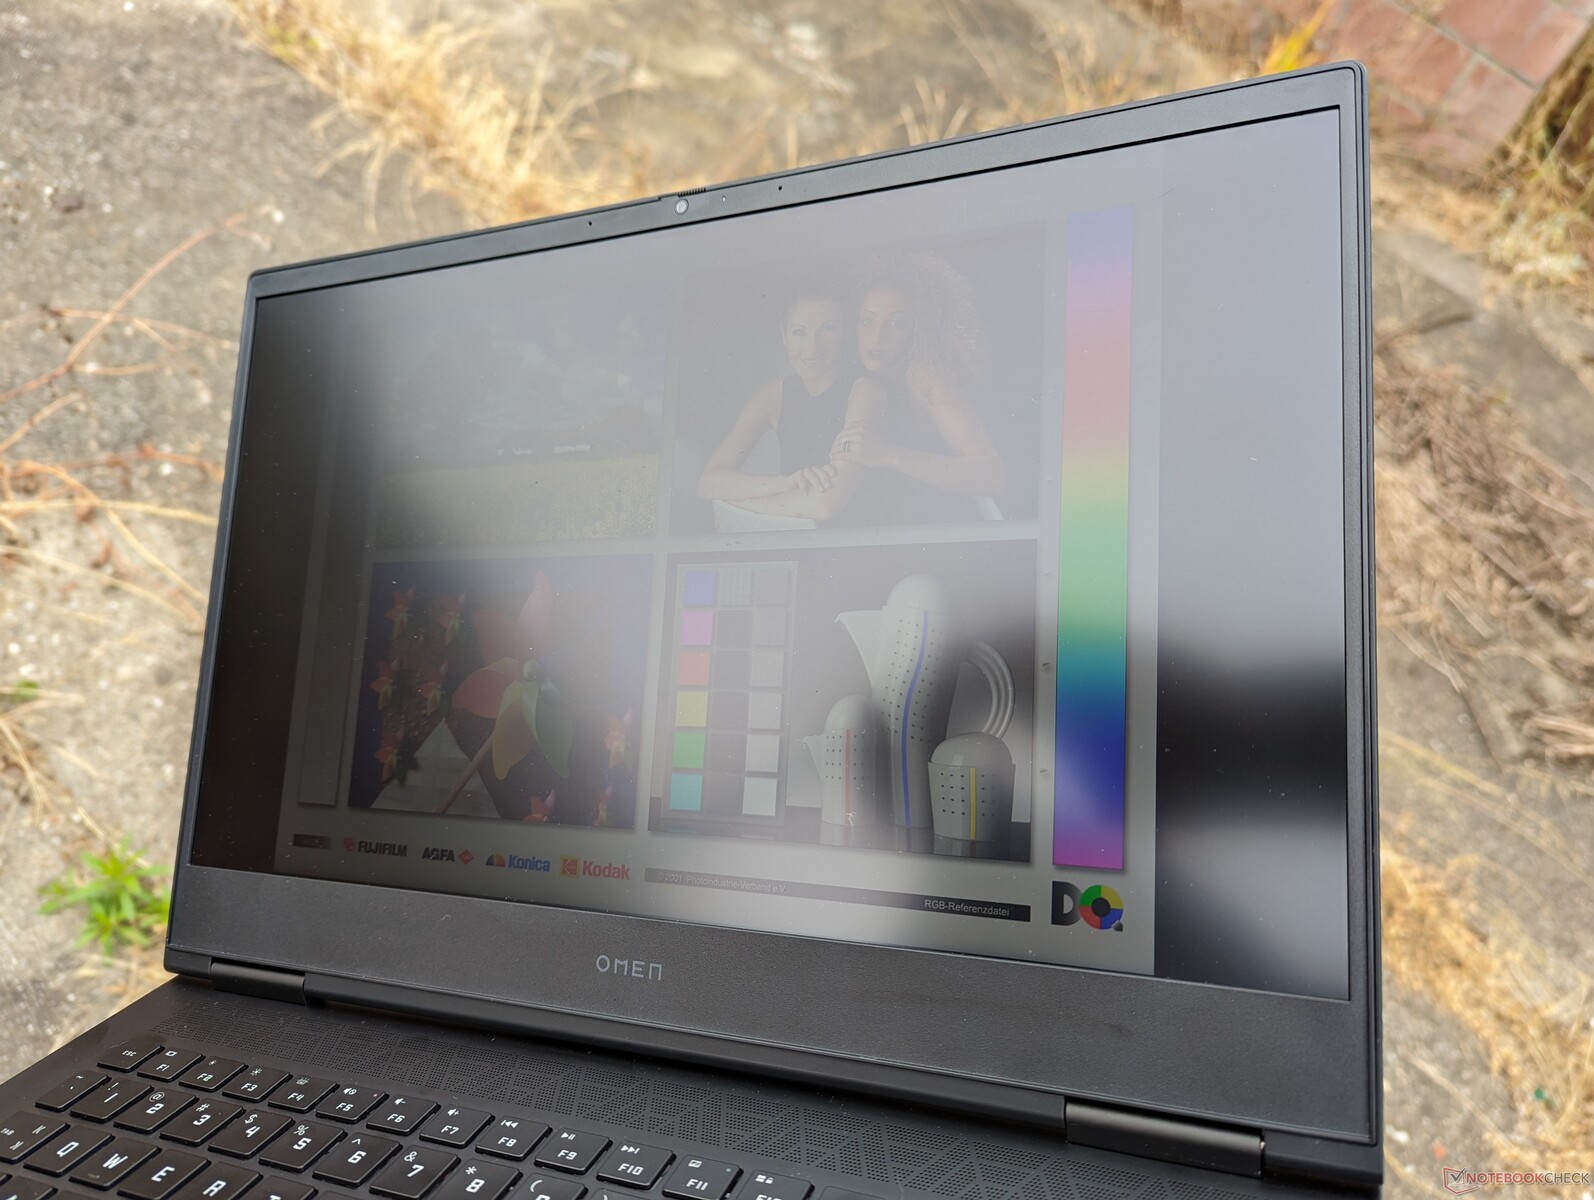
La visibilità all'aperto è accettabile solo se all'ombra. Il display non è così luminoso come quello di Legion Pro 7,ROG Strix G16oBlade 16 che sono più facili da vedere all'aperto.

Prestazioni - Intel Raptor Lake-H di 13a generazione
Condizioni di test
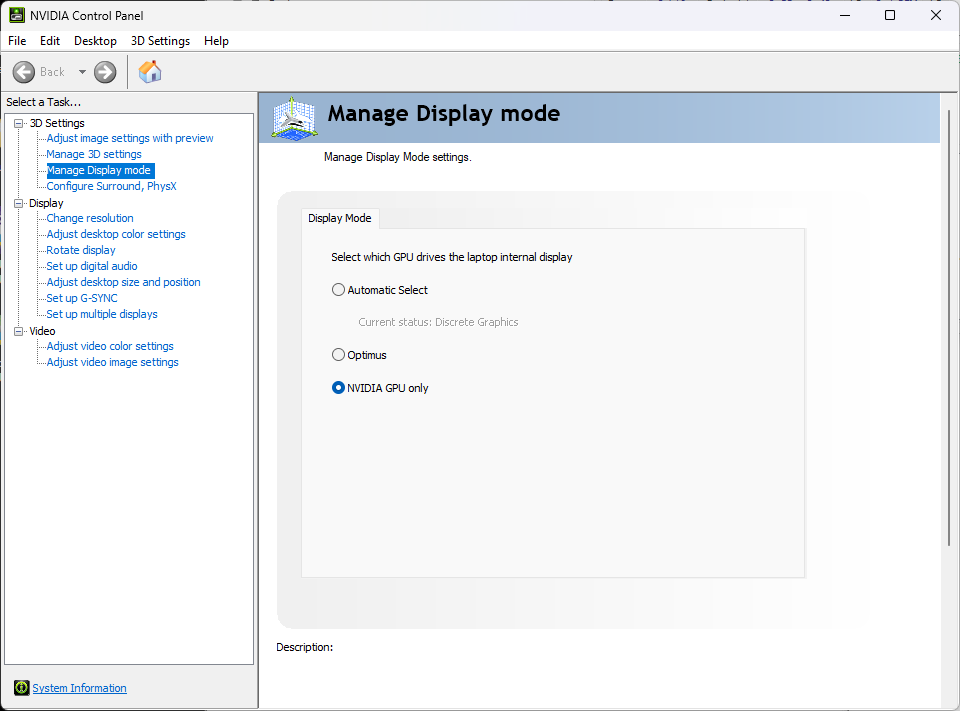
Abbiamo impostato la nostra unità in modalità dGPU tramite il pannello di controllo Nvidia e in modalità Performance tramite Omen Gaming Hub e Windows prima di eseguire i benchmark qui sotto. Oltre alla normale modalità Performance, è disponibile anche l'impostazione Max Fan. Raccomandiamo ai possessori di familiarizzare con Omen Gaming Hub in quanto è il centro di controllo per la regolazione dei profili di alimentazione, dell'illuminazione RGB, delle impostazioni di gioco e altro ancora. Purtroppo, le impostazioni dei profili energetici HP non sono sincronizzate con i normali profili energetici di Windows.
Sono supportati Optimus avanzato o MUX e G-Sync.
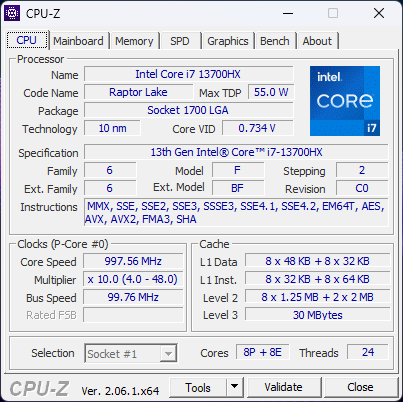
Processore
Le prestazioni della CPU sono quelle che ci aspettiamo rispetto ad altri computer portatili con lo stesso processore Core i7-13700HX Il che significa che l'Omen 16 non presenta grossi problemi di prestazioni. In particolare, il processore è a pari merito con il più costosoCore i9-13900HK dell'Alienware x16 R1, mentre è più veloce di circa il 15-20% rispetto all'uscente Core i7-12700HK di 12a generazione Core i7-12700H. IlCore i9-13900HX offre un aumento delle prestazioni molto più significativo, ma questa opzione non è disponibile su questo modello.
Cinebench R15 Multi Loop
Cinebench R20: CPU (Multi Core) | CPU (Single Core)
Cinebench R23: Multi Core | Single Core
Cinebench R15: CPU Multi 64Bit | CPU Single 64Bit
Blender: v2.79 BMW27 CPU
7-Zip 18.03: 7z b 4 | 7z b 4 -mmt1
Geekbench 5.5: Multi-Core | Single-Core
HWBOT x265 Benchmark v2.2: 4k Preset
LibreOffice : 20 Documents To PDF
R Benchmark 2.5: Overall mean
* ... Meglio usare valori piccoli
AIDA64: FP32 Ray-Trace | FPU Julia | CPU SHA3 | CPU Queen | FPU SinJulia | FPU Mandel | CPU AES | CPU ZLib | FP64 Ray-Trace | CPU PhotoWorxx
| Performance rating | |
| Lenovo Legion Pro 7 RTX4090 | |
| Asus ROG Strix G16 G614JZ | |
| Razer Blade 16 Early 2023 | |
| Alienware x16 R1 | |
| Media Intel Core i7-13700HX | |
| HP Omen 16-wf000 | |
| HP Omen 16-n0033dx | |
| AIDA64 / FP32 Ray-Trace | |
| Asus ROG Strix G16 G614JZ | |
| Lenovo Legion Pro 7 RTX4090 | |
| Razer Blade 16 Early 2023 | |
| Razer Blade 16 Early 2023 | |
| Razer Blade 16 Early 2023 | |
| Media Intel Core i7-13700HX (14261 - 21999, n=11) | |
| HP Omen 16-wf000 | |
| Alienware x16 R1 | |
| HP Omen 16-n0033dx | |
| AIDA64 / CPU Queen | |
| Asus ROG Strix G16 G614JZ | |
| Lenovo Legion Pro 7 RTX4090 | |
| Razer Blade 16 Early 2023 | |
| Razer Blade 16 Early 2023 | |
| Alienware x16 R1 | |
| Media Intel Core i7-13700HX (86532 - 114717, n=11) | |
| HP Omen 16-n0033dx | |
| HP Omen 16-wf000 | |
| AIDA64 / FPU SinJulia | |
| Asus ROG Strix G16 G614JZ | |
| Razer Blade 16 Early 2023 | |
| Razer Blade 16 Early 2023 | |
| Razer Blade 16 Early 2023 | |
| Lenovo Legion Pro 7 RTX4090 | |
| HP Omen 16-n0033dx | |
| Media Intel Core i7-13700HX (9290 - 13519, n=11) | |
| HP Omen 16-wf000 | |
| Alienware x16 R1 | |
| AIDA64 / FPU Mandel | |
| Lenovo Legion Pro 7 RTX4090 | |
| Asus ROG Strix G16 G614JZ | |
| Razer Blade 16 Early 2023 | |
| Razer Blade 16 Early 2023 | |
| Razer Blade 16 Early 2023 | |
| HP Omen 16-n0033dx | |
| HP Omen 16-wf000 | |
| Media Intel Core i7-13700HX (35751 - 53484, n=11) | |
| Alienware x16 R1 | |
| AIDA64 / FP64 Ray-Trace | |
| Asus ROG Strix G16 G614JZ | |
| Lenovo Legion Pro 7 RTX4090 | |
| Razer Blade 16 Early 2023 | |
| Razer Blade 16 Early 2023 | |
| Razer Blade 16 Early 2023 | |
| Media Intel Core i7-13700HX (7728 - 11837, n=11) | |
| HP Omen 16-wf000 | |
| Alienware x16 R1 | |
| HP Omen 16-n0033dx | |
| AIDA64 / CPU PhotoWorxx | |
| Razer Blade 16 Early 2023 | |
| Razer Blade 16 Early 2023 | |
| Razer Blade 16 Early 2023 | |
| Lenovo Legion Pro 7 RTX4090 | |
| Alienware x16 R1 | |
| HP Omen 16-wf000 | |
| Asus ROG Strix G16 G614JZ | |
| Media Intel Core i7-13700HX (19678 - 42415, n=11) | |
| HP Omen 16-n0033dx | |
Prestazioni del sistema
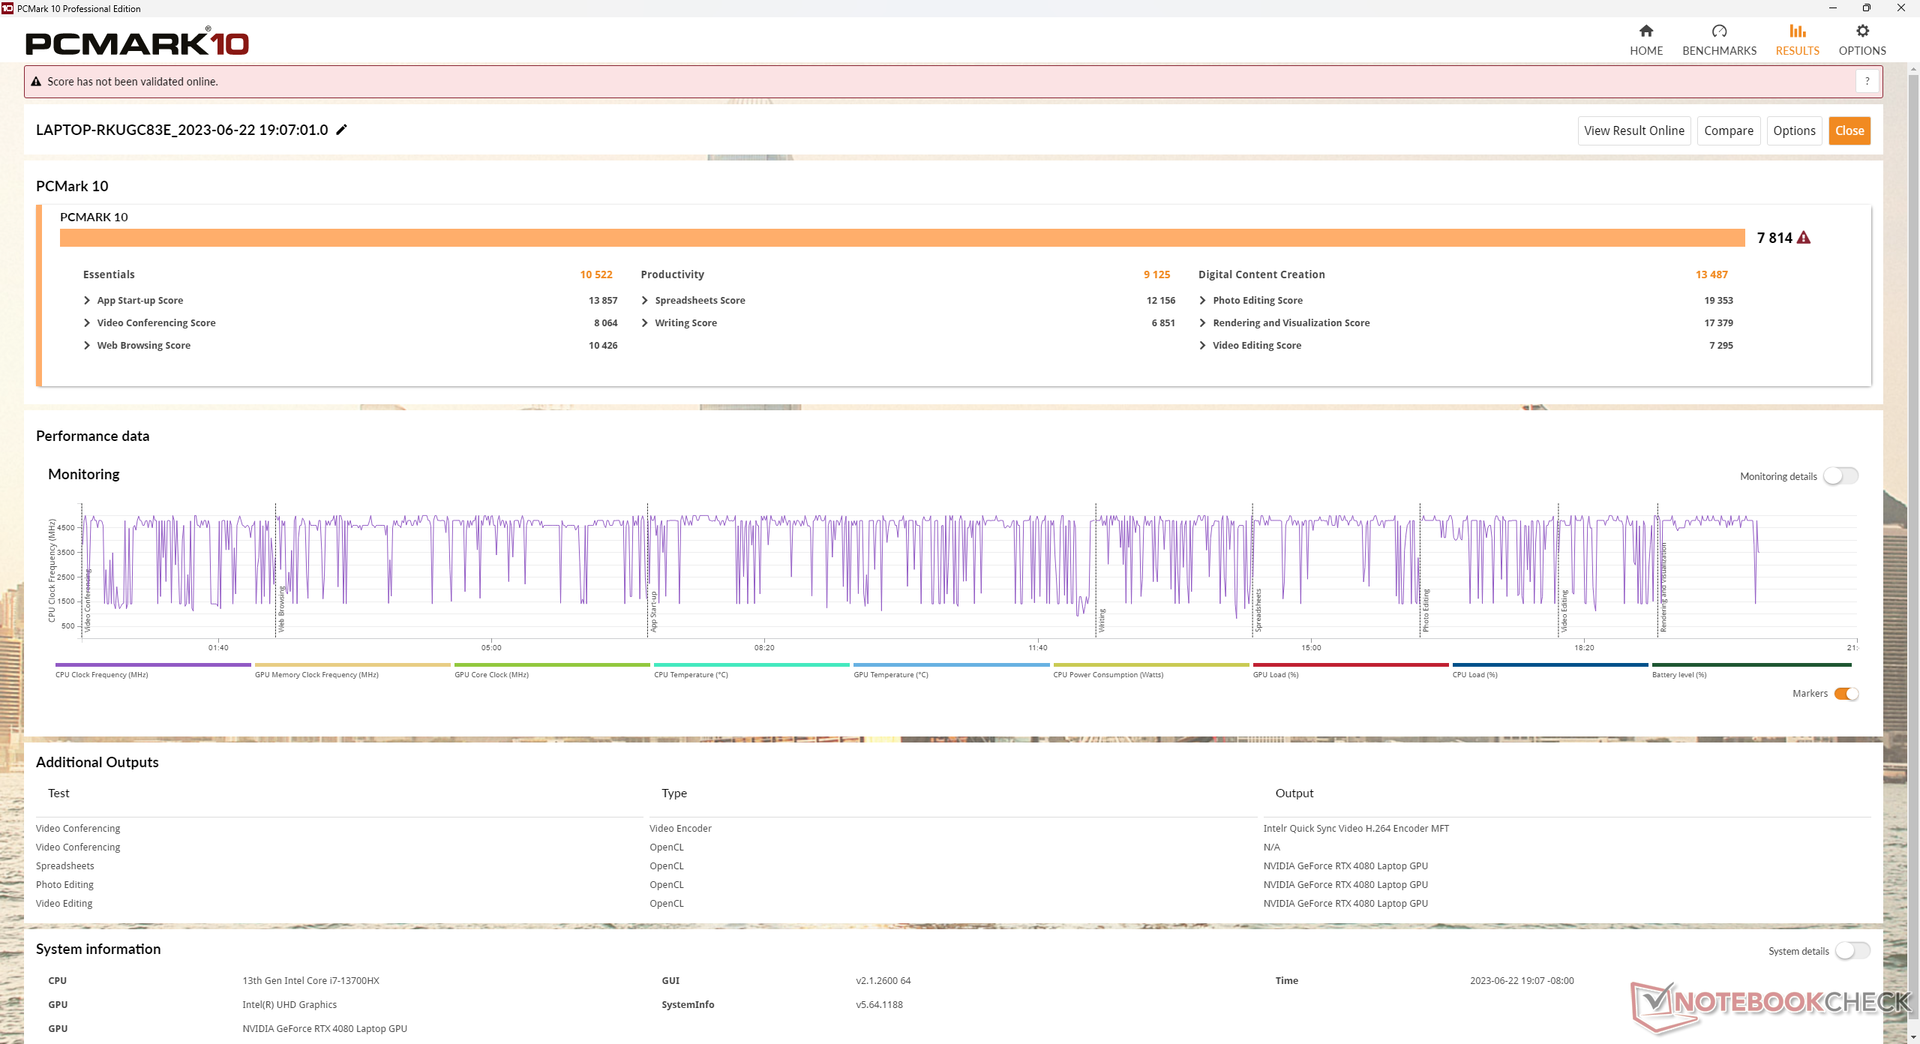
I risultati di PCMark sono superiori a quelli dell'Omen 16 dell'anno scorso, in particolare nel sottotest Digital Content Creation, molto impegnativo per la GPU, grazie alla più veloce RTX 4080.
CrossMark: Overall | Productivity | Creativity | Responsiveness
| PCMark 10 / Score | |
| Alienware x16 R1 | |
| Lenovo Legion Pro 7 RTX4090 | |
| Razer Blade 16 Early 2023 | |
| HP Omen 16-wf000 | |
| Media Intel Core i7-13700HX, NVIDIA GeForce RTX 4080 Laptop GPU (n=1) | |
| Asus ROG Strix G16 G614JZ | |
| HP Omen 16-n0033dx | |
| PCMark 10 / Essentials | |
| Asus ROG Strix G16 G614JZ | |
| Alienware x16 R1 | |
| Lenovo Legion Pro 7 RTX4090 | |
| Razer Blade 16 Early 2023 | |
| HP Omen 16-wf000 | |
| Media Intel Core i7-13700HX, NVIDIA GeForce RTX 4080 Laptop GPU (n=1) | |
| HP Omen 16-n0033dx | |
| PCMark 10 / Productivity | |
| Alienware x16 R1 | |
| HP Omen 16-n0033dx | |
| HP Omen 16-wf000 | |
| Media Intel Core i7-13700HX, NVIDIA GeForce RTX 4080 Laptop GPU (n=1) | |
| Lenovo Legion Pro 7 RTX4090 | |
| Razer Blade 16 Early 2023 | |
| Asus ROG Strix G16 G614JZ | |
| PCMark 10 / Digital Content Creation | |
| Lenovo Legion Pro 7 RTX4090 | |
| Razer Blade 16 Early 2023 | |
| Alienware x16 R1 | |
| HP Omen 16-wf000 | |
| Media Intel Core i7-13700HX, NVIDIA GeForce RTX 4080 Laptop GPU (n=1) | |
| Asus ROG Strix G16 G614JZ | |
| HP Omen 16-n0033dx | |
| CrossMark / Overall | |
| Asus ROG Strix G16 G614JZ | |
| Alienware x16 R1 | |
| HP Omen 16-wf000 | |
| Media Intel Core i7-13700HX, NVIDIA GeForce RTX 4080 Laptop GPU (n=1) | |
| Razer Blade 16 Early 2023 | |
| HP Omen 16-n0033dx | |
| CrossMark / Productivity | |
| Asus ROG Strix G16 G614JZ | |
| Alienware x16 R1 | |
| HP Omen 16-wf000 | |
| Media Intel Core i7-13700HX, NVIDIA GeForce RTX 4080 Laptop GPU (n=1) | |
| HP Omen 16-n0033dx | |
| Razer Blade 16 Early 2023 | |
| CrossMark / Creativity | |
| Asus ROG Strix G16 G614JZ | |
| Alienware x16 R1 | |
| HP Omen 16-wf000 | |
| Media Intel Core i7-13700HX, NVIDIA GeForce RTX 4080 Laptop GPU (n=1) | |
| Razer Blade 16 Early 2023 | |
| HP Omen 16-n0033dx | |
| CrossMark / Responsiveness | |
| Asus ROG Strix G16 G614JZ | |
| Alienware x16 R1 | |
| HP Omen 16-wf000 | |
| Media Intel Core i7-13700HX, NVIDIA GeForce RTX 4080 Laptop GPU (n=1) | |
| Razer Blade 16 Early 2023 | |
| HP Omen 16-n0033dx | |
| PCMark 10 Score | 7814 punti | |
Aiuto | ||
| AIDA64 / Memory Copy | |
| Razer Blade 16 Early 2023 | |
| Razer Blade 16 Early 2023 | |
| Razer Blade 16 Early 2023 | |
| Lenovo Legion Pro 7 RTX4090 | |
| Alienware x16 R1 | |
| HP Omen 16-wf000 | |
| Asus ROG Strix G16 G614JZ | |
| Media Intel Core i7-13700HX (36125 - 63990, n=11) | |
| HP Omen 16-n0033dx | |
| AIDA64 / Memory Read | |
| Lenovo Legion Pro 7 RTX4090 | |
| Razer Blade 16 Early 2023 | |
| Razer Blade 16 Early 2023 | |
| Razer Blade 16 Early 2023 | |
| Asus ROG Strix G16 G614JZ | |
| Alienware x16 R1 | |
| HP Omen 16-wf000 | |
| Media Intel Core i7-13700HX (36510 - 69729, n=11) | |
| HP Omen 16-n0033dx | |
| AIDA64 / Memory Write | |
| Alienware x16 R1 | |
| Razer Blade 16 Early 2023 | |
| Razer Blade 16 Early 2023 | |
| Razer Blade 16 Early 2023 | |
| Lenovo Legion Pro 7 RTX4090 | |
| HP Omen 16-wf000 | |
| Asus ROG Strix G16 G614JZ | |
| Media Intel Core i7-13700HX (33598 - 85675, n=11) | |
| HP Omen 16-n0033dx | |
| AIDA64 / Memory Latency | |
| Alienware x16 R1 | |
| Razer Blade 16 Early 2023 | |
| Razer Blade 16 Early 2023 | |
| Razer Blade 16 Early 2023 | |
| Asus ROG Strix G16 G614JZ | |
| HP Omen 16-n0033dx | |
| HP Omen 16-wf000 | |
| Media Intel Core i7-13700HX (81.5 - 97.9, n=11) | |
| Lenovo Legion Pro 7 RTX4090 | |
* ... Meglio usare valori piccoli
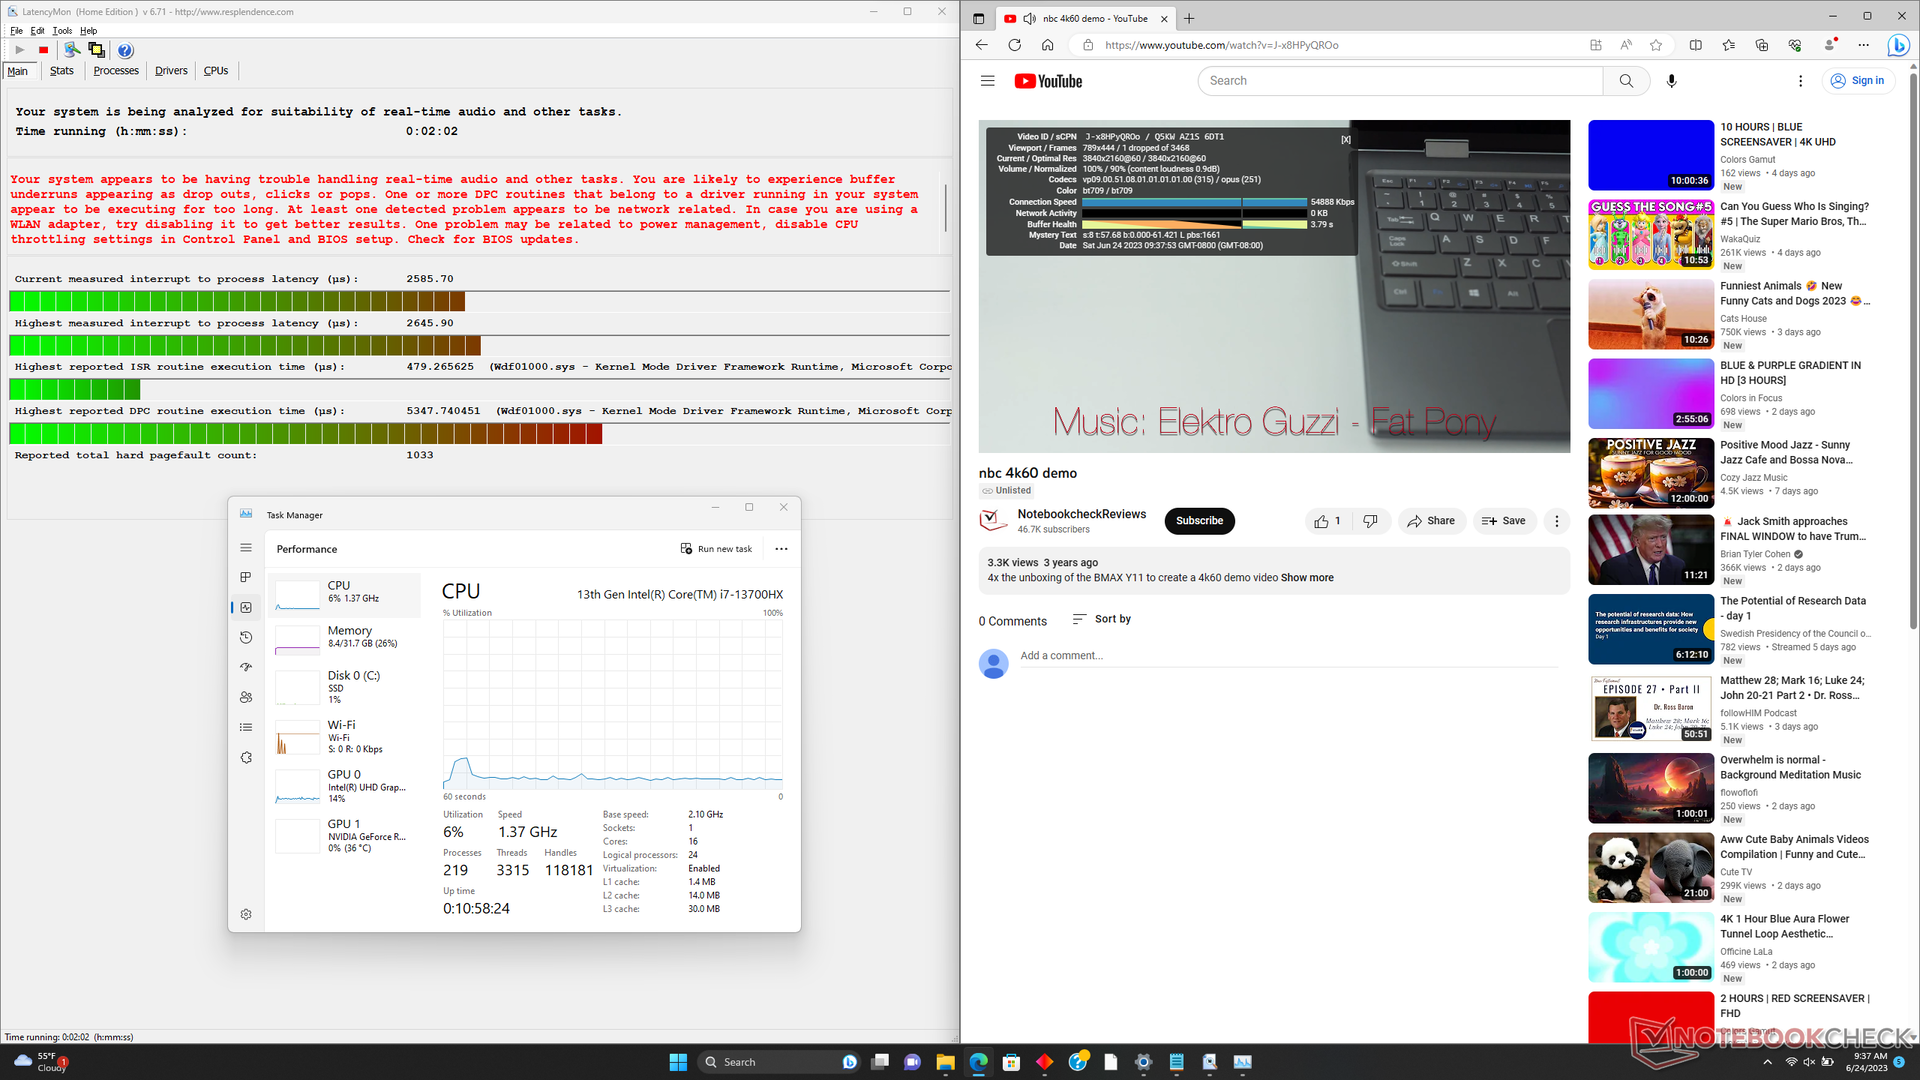
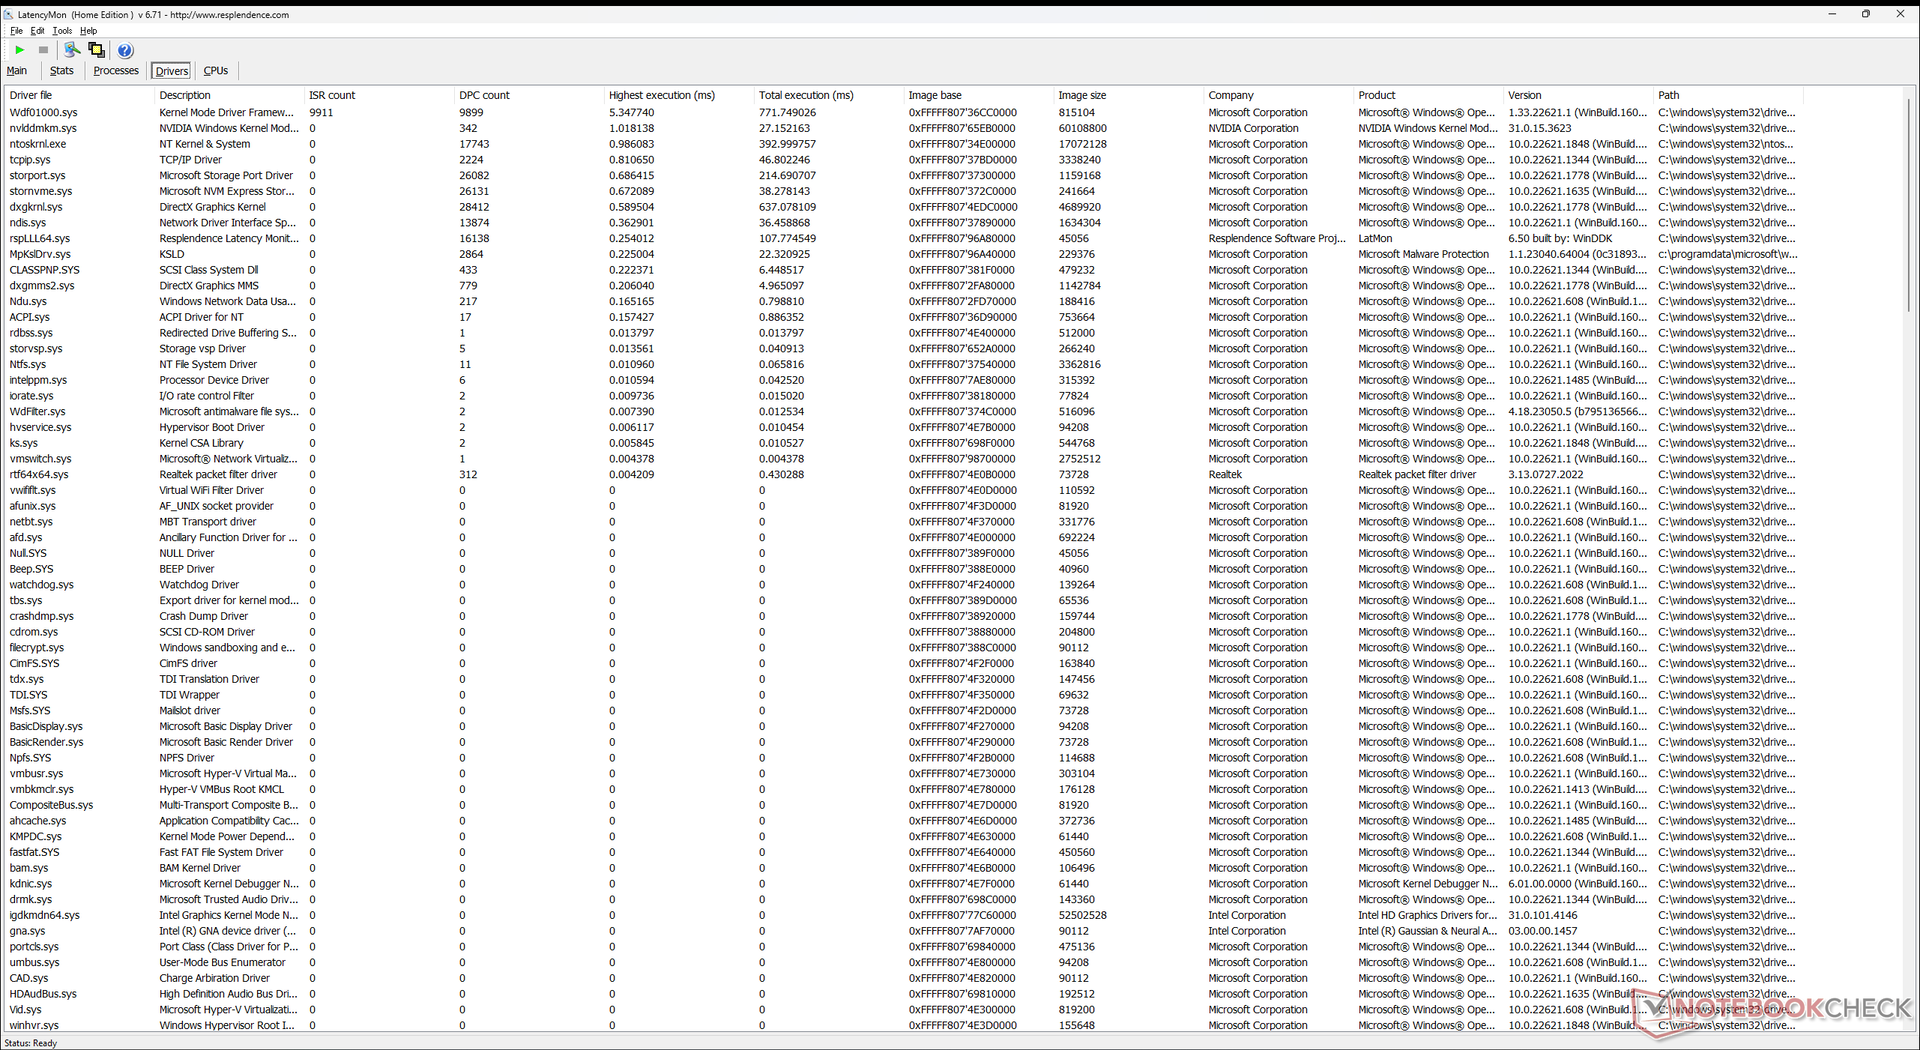
Latenza DPC
LatencyMon rivela problemi di DPC quando si aprono più schede del browser della nostra homepage, simile a quella di ROG Strix G16 ROG Strix G16 o Blade 16. la riproduzione di video 4K60 è quasi perfetta, con un solo fotogramma perso durante il nostro test video di un minuto.
| DPC Latencies / LatencyMon - interrupt to process latency (max), Web, Youtube, Prime95 | |
| Lenovo Legion Pro 7 RTX4090 | |
| HP Omen 16-wf000 | |
| Asus ROG Strix G16 G614JZ | |
| Razer Blade 16 Early 2023 | |
| Alienware x16 R1 | |
| HP Omen 16-n0033dx | |
* ... Meglio usare valori piccoli
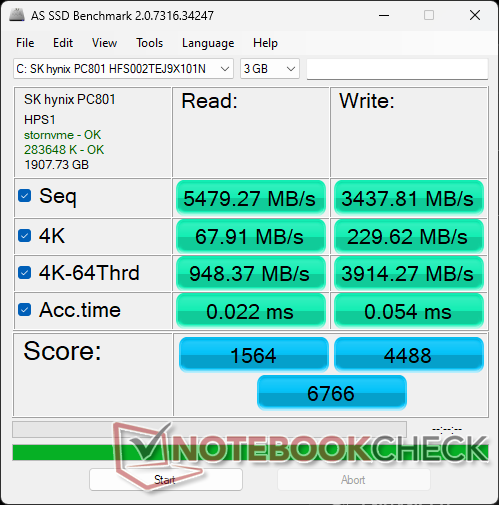
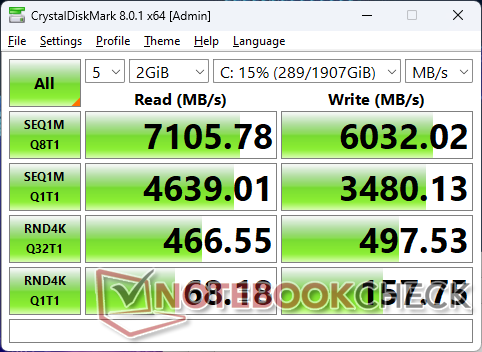
Dispositivi di archiviazione
La nostra unità di prova viene fornita con un disco da 2 TBSK hynix PC801 SSD NVMe da 2 TB per velocità di lettura e scrittura sequenziali rispettivamente di 7100 MB/s e 6000 MB/s, paragonabili a quelle del popolare Samsung PM9A1. Tuttavia, le velocità di lettura e scrittura sui blocchi più piccoli da 4k q32 sono insolitamente lente anche dopo diversi test. Le prestazioni complessive sono comunque stabili quando vengono sollecitate, il che suggerisce un'eccellente dissipazione del calore.

| Drive Performance rating - Percent | |
| Alienware x16 R1 | |
| Lenovo Legion Pro 7 RTX4090 | |
| HP Omen 16-wf000 | |
| Razer Blade 16 Early 2023 | |
| Asus ROG Strix G16 G614JZ | |
| HP Omen 16-n0033dx | |
* ... Meglio usare valori piccoli
Disk Throttling: DiskSpd Read Loop, Queue Depth 8
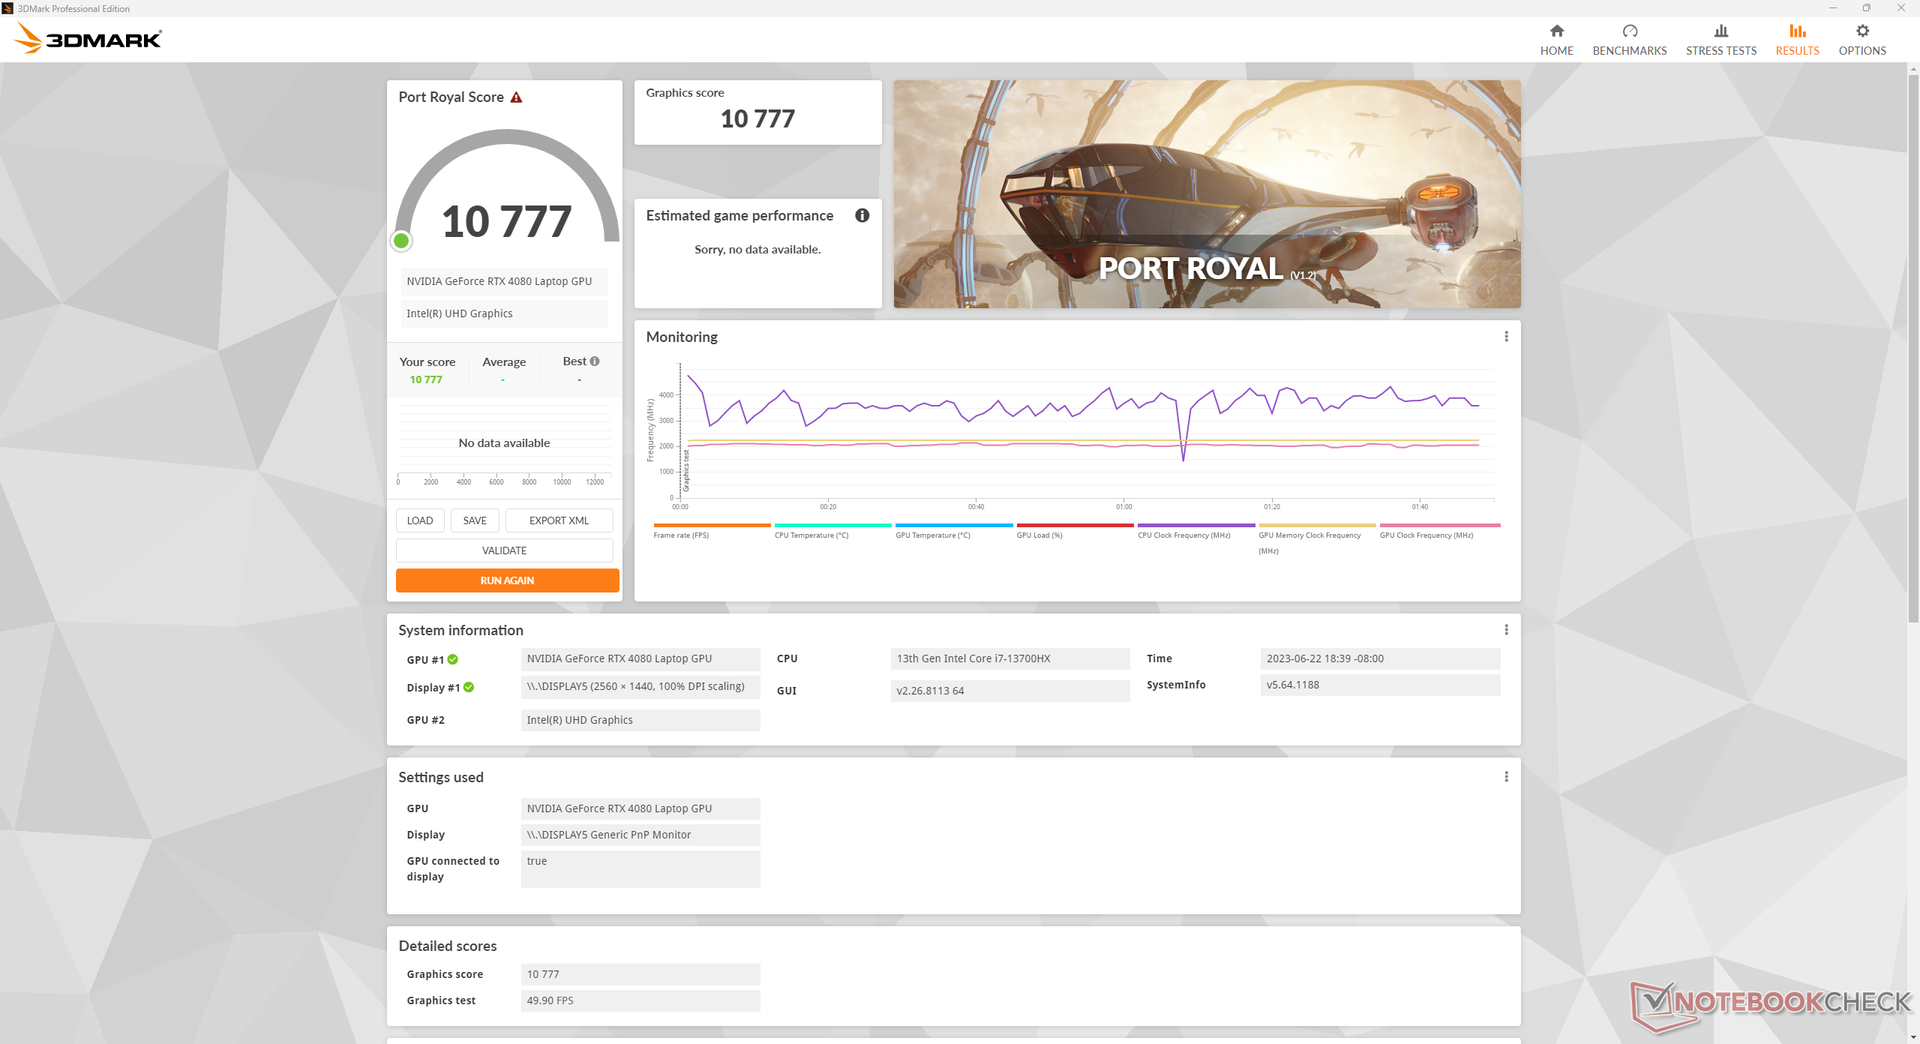
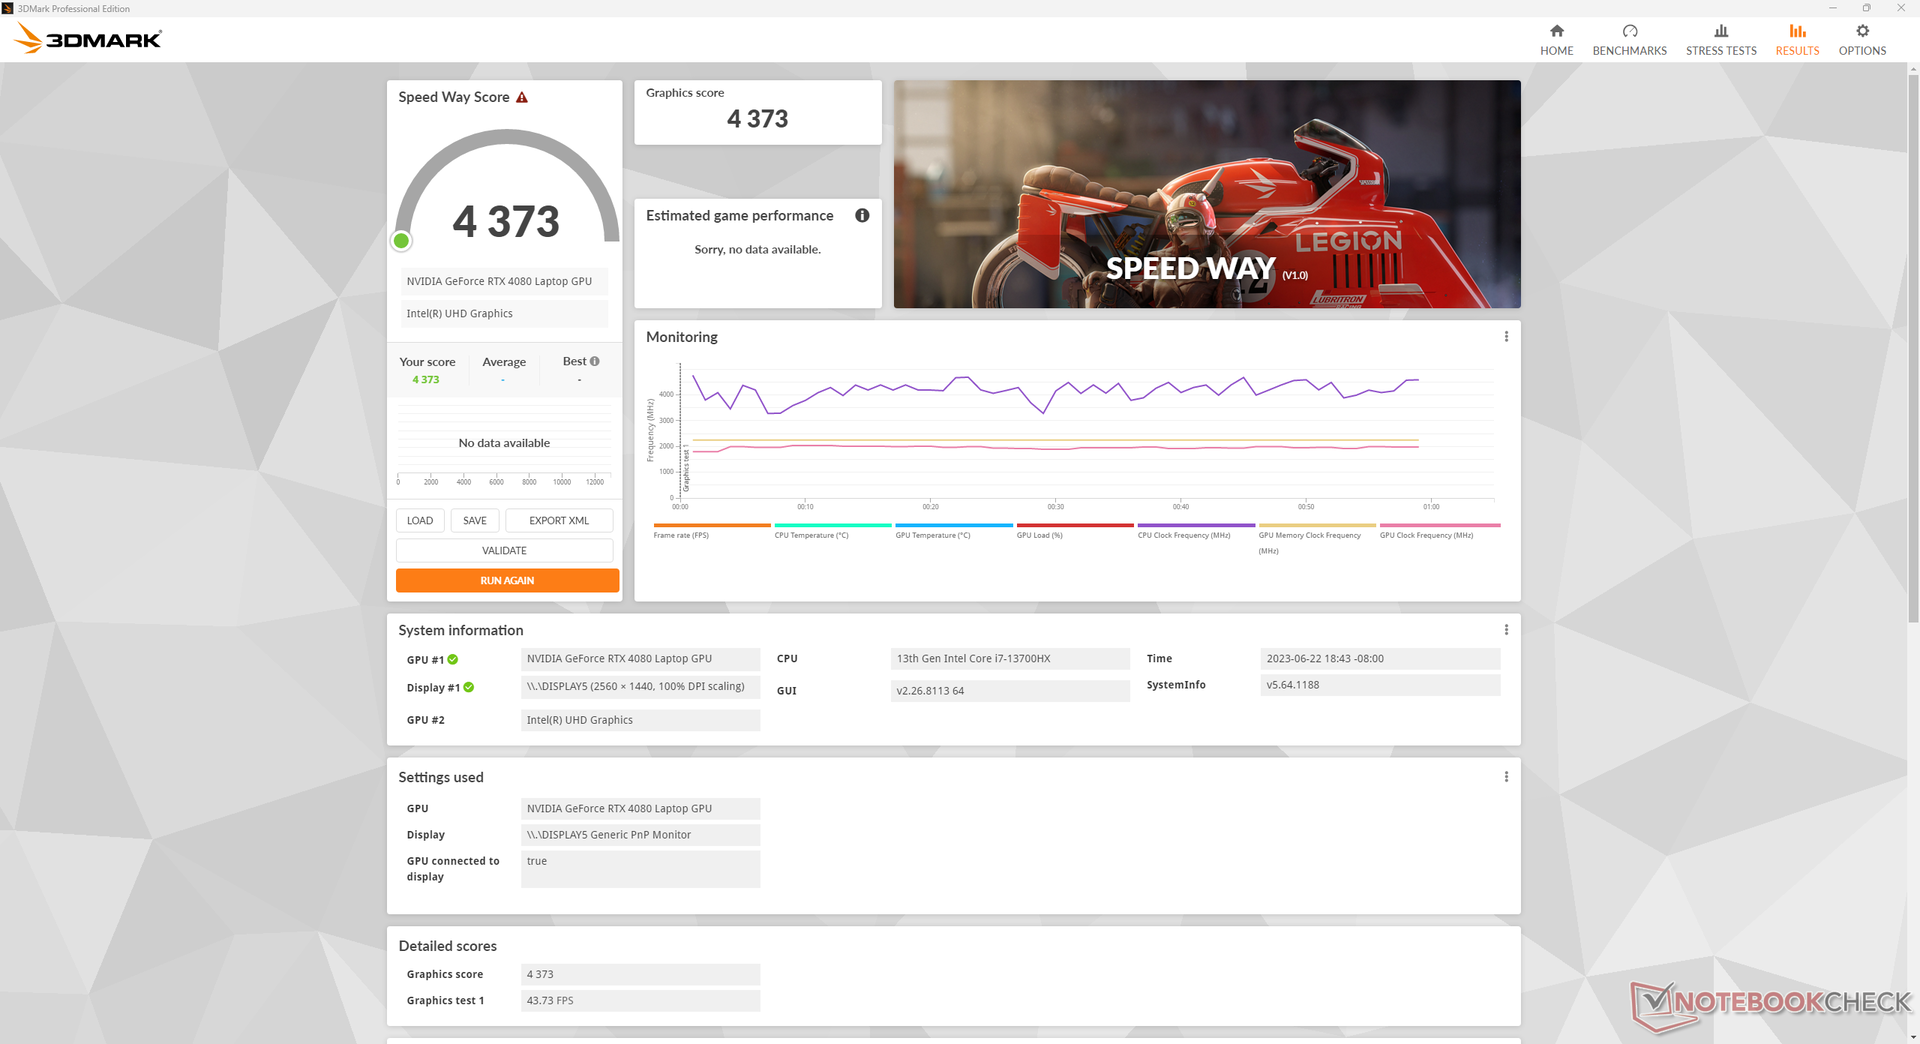
Prestazioni della GPU - 145 W GeForce RTX 4080
Le prestazioni grafiche sono eccellenti e paragonabili a quelle di altri portatili da gioco con lo stesso modello stesso GeForce RTX 4080 GPU con un margine del 5%. Passando alla GPU RTX 4070 o RTX 4060 dalla RTX 4080 dovrebbe ridurre le prestazioni grafiche rispettivamente di circa il 20% e il 30%.
Se la modalità Max Fan è disabilitata, le prestazioni complessive ne risentono di poco, come mostra la tabella seguente. Le prestazioni della GPU diminuiscono di quasi il 15% se si imposta la modalità Balanced, mentre l'impatto sulle prestazioni della CPU è molto meno grave.
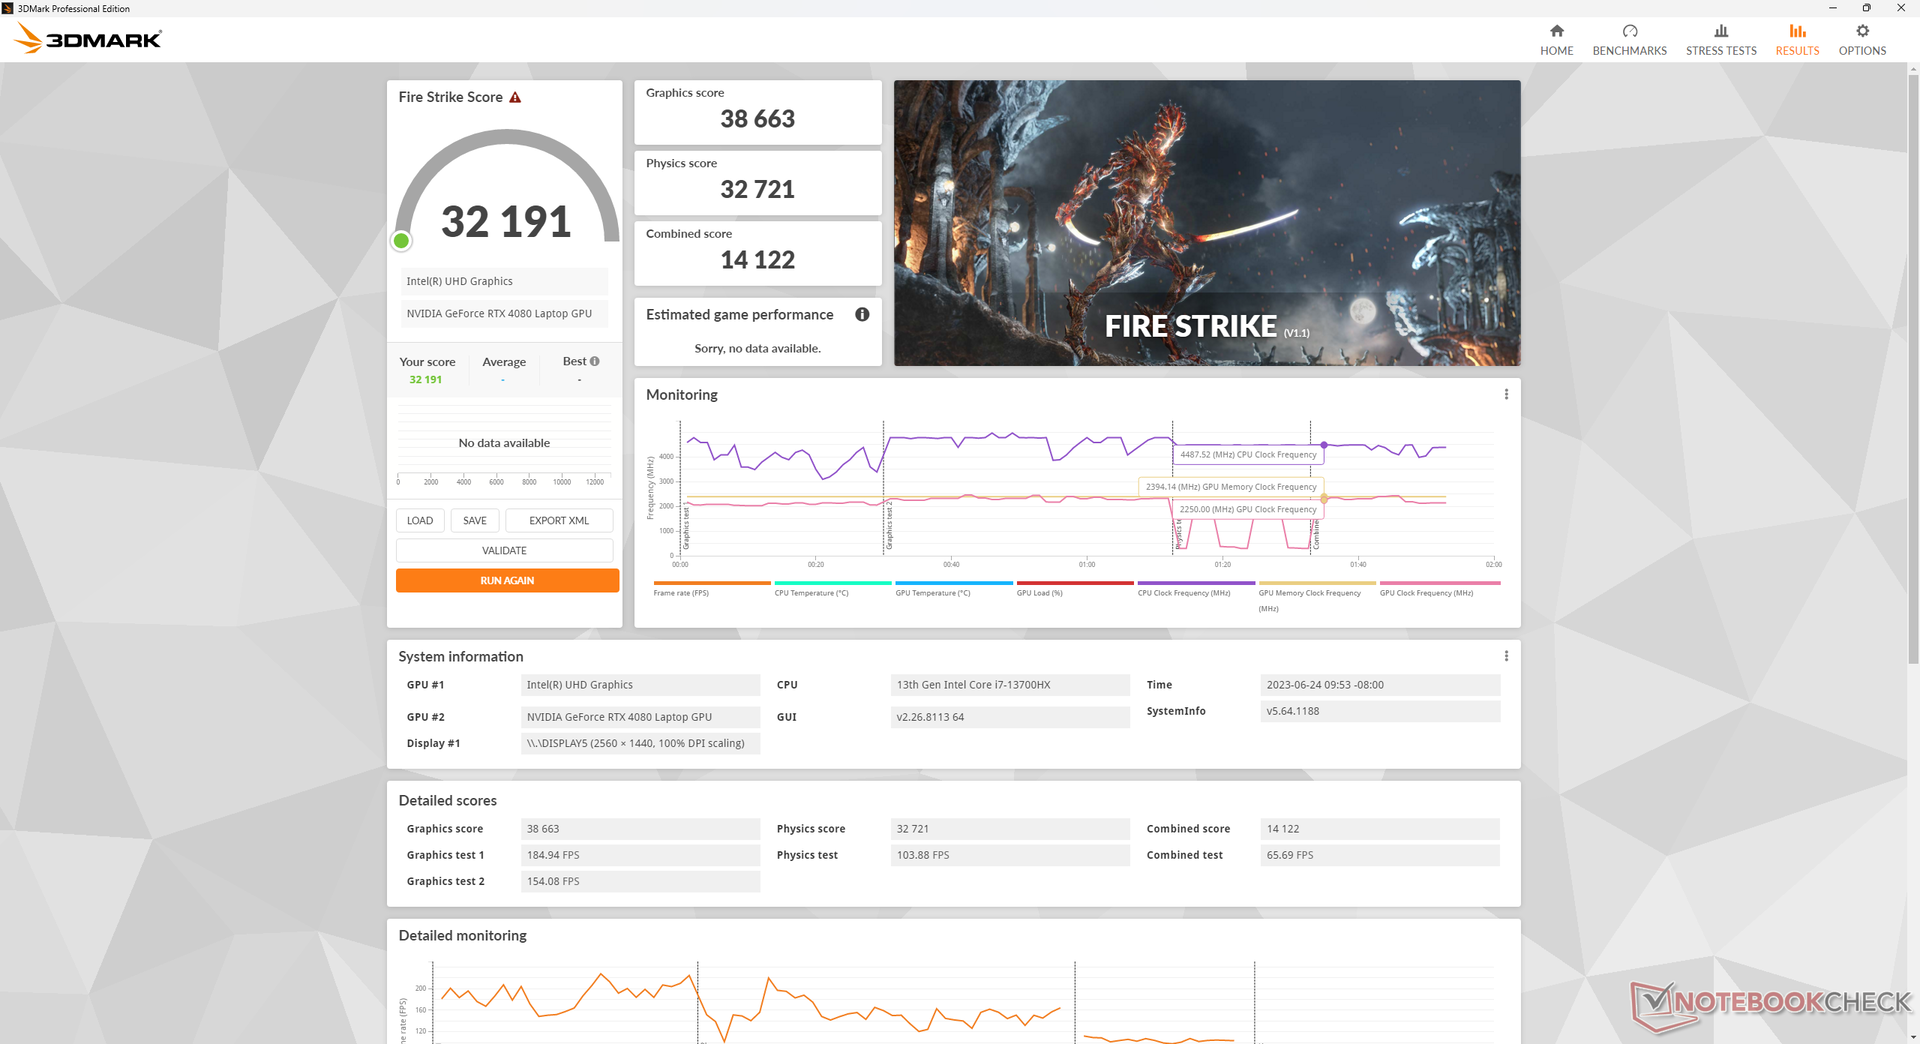
| Impostazione del profilo energetico | Fire Strike Punteggio fisico | Fire Strike Punteggio GPU | Fire Strike Punteggio combinato |
| Prestazioni + ventola massima accesa | 32721 | 38663 | 14122 |
| Prestazioni + ventola massima spenta | 31314 (-4%) | 38142 (-1%) | 13655 (-3%) |
| Equilibrato | 31837 (-3%) | 33328 (-14%) | 12426 (-12%) |
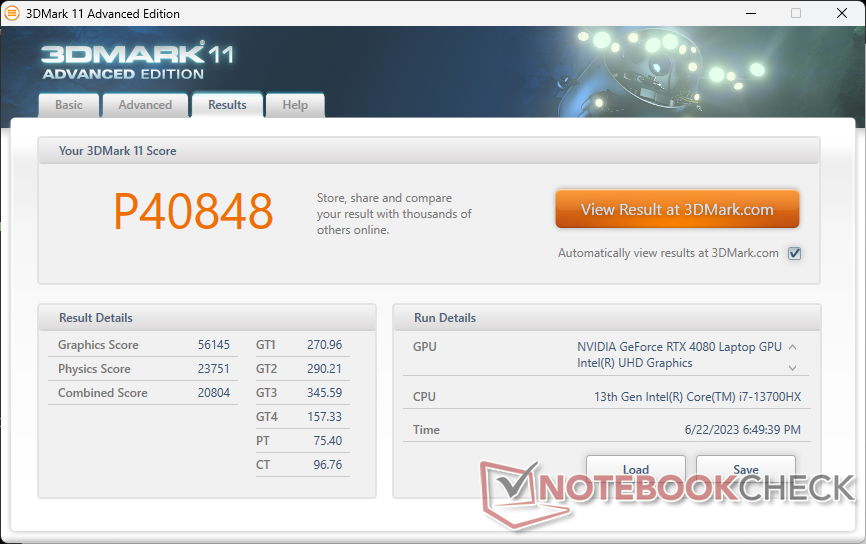
| 3DMark 11 Performance | 40848 punti | |
| 3DMark Fire Strike Score | 32191 punti | |
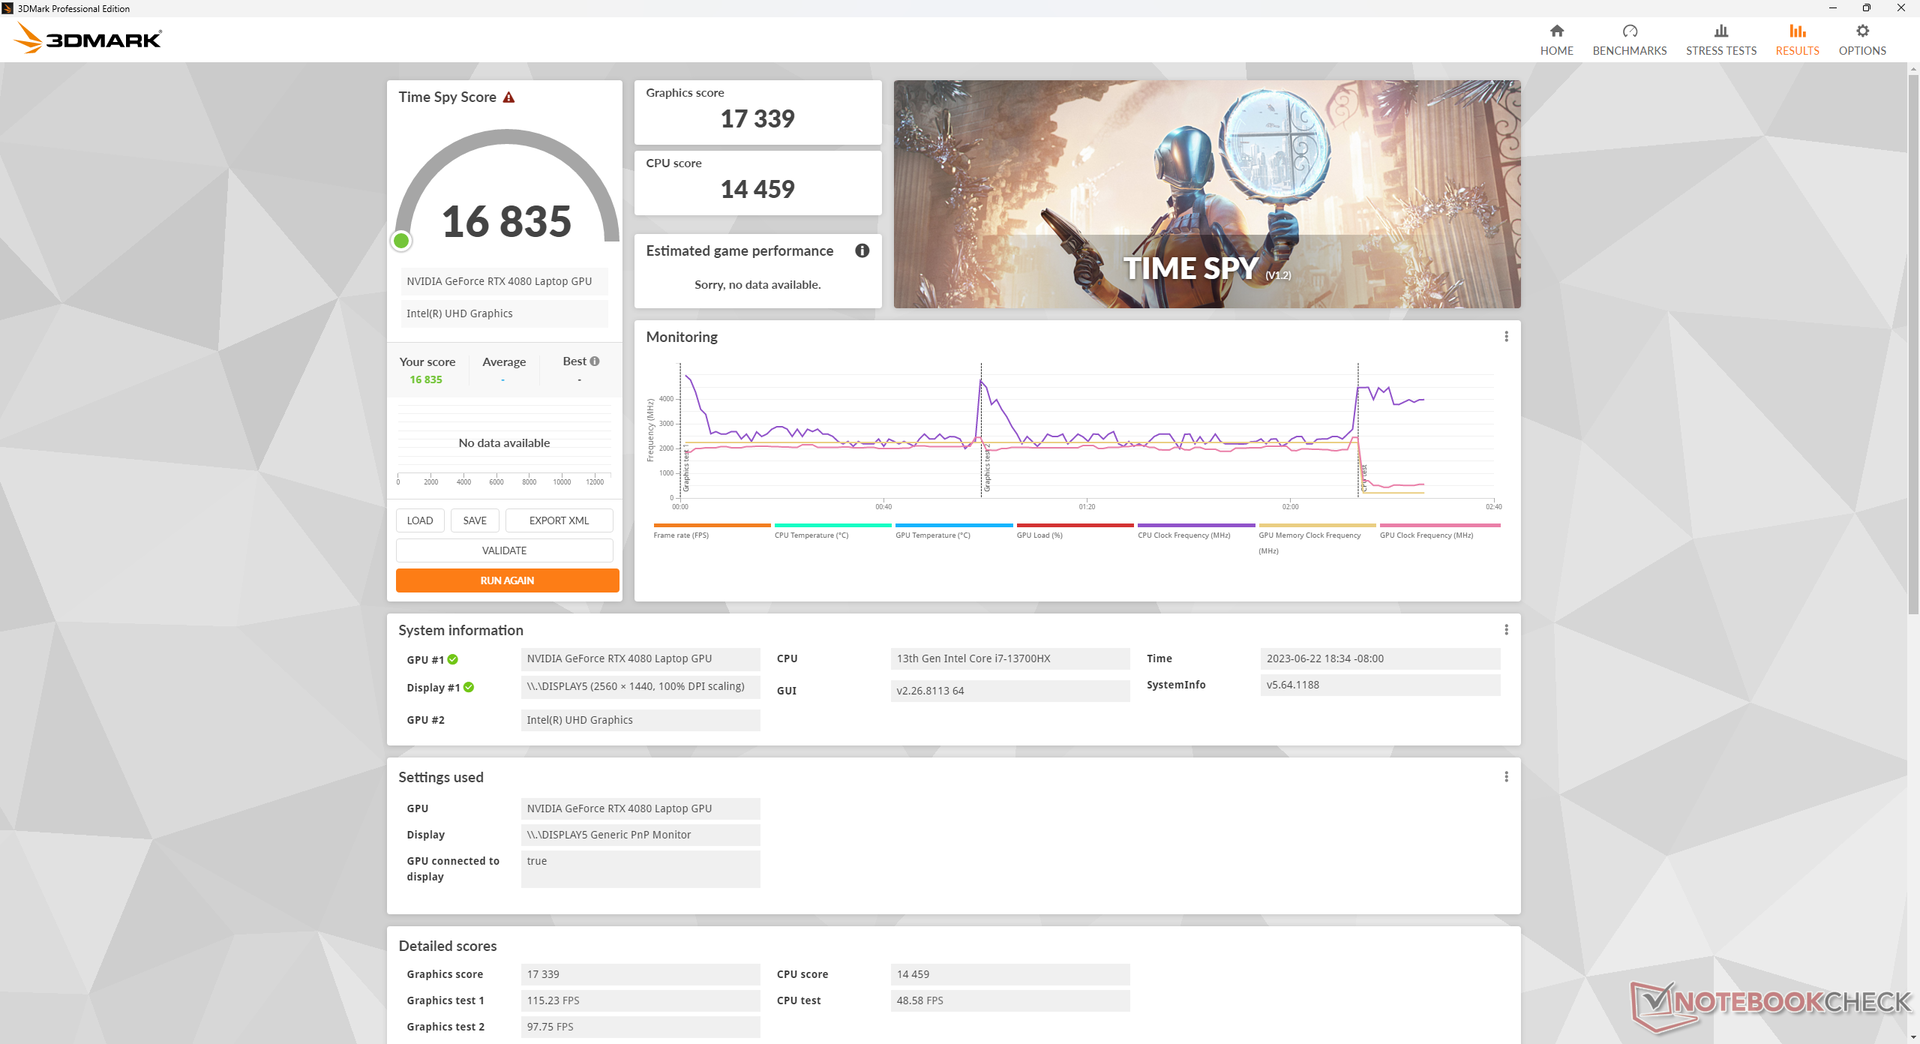
| 3DMark Time Spy Score | 16835 punti | |
Aiuto | ||
* ... Meglio usare valori piccoli
Prestazioni di gioco
Tutti i giochi sono giocabili alla risoluzione nativa di 1440p con frame rate medi superiori a 60 FPS, anche in giochi impegnativi come Returnal. La RTX 4080 mobile si accoppia molto bene con il pannello a 1440p.
Il DLSS è consigliato se si attiva l'RT o se si gioca su un monitor 4K esterno, poiché la RTX 4080 mobile è molto più debole di una RTX 4080 desktop rTX 4080 per desktop. Il frame rate medio di Cyberpunk 2077 in 4K, ad esempio, passa da 35 FPS con DLSS 2 disattivato a 55 FPS con DLSS 2 attivato.
| Tiny Tina's Wonderlands | |
| 1920x1080 Low Preset (DX12) | |
| Media NVIDIA GeForce RTX 4080 Laptop GPU (221 - 353, n=6) | |
| HP Omen 16-wf000 | |
| 1920x1080 Medium Preset (DX12) | |
| Media NVIDIA GeForce RTX 4080 Laptop GPU (199.6 - 297, n=6) | |
| HP Omen 16-wf000 | |
| 1920x1080 High Preset (DX12) | |
| Media NVIDIA GeForce RTX 4080 Laptop GPU (166.7 - 213, n=6) | |
| HP Omen 16-wf000 | |
| 1920x1080 Badass Preset (DX12) | |
| Asus Zephyrus Duo 16 GX650PY-NM006W | |
| Media NVIDIA GeForce RTX 4080 Laptop GPU (112.9 - 167.1, n=9) | |
| HP Omen 16-wf000 | |
| 2560x1440 Badass Preset (DX12) | |
| Asus Zephyrus Duo 16 GX650PY-NM006W | |
| Media NVIDIA GeForce RTX 4080 Laptop GPU (85 - 114.8, n=9) | |
| HP Omen 16-wf000 | |
| 3840x2160 Badass Preset (DX12) | |
| Media NVIDIA GeForce RTX 4080 Laptop GPU (46.4 - 60.9, n=9) | |
| HP Omen 16-wf000 | |
| Returnal | |
| 1920x1080 Low Preset | |
| HP Omen 16-wf000 | |
| Media NVIDIA GeForce RTX 4080 Laptop GPU (116 - 150, n=4) | |
| 1920x1080 Medium Preset | |
| HP Omen 16-wf000 | |
| Media NVIDIA GeForce RTX 4080 Laptop GPU (117 - 148, n=4) | |
| 1920x1080 High Preset | |
| HP Omen 16-wf000 | |
| Media NVIDIA GeForce RTX 4080 Laptop GPU (114 - 137, n=4) | |
| 1920x1080 Epic Preset | |
| Media NVIDIA GeForce RTX 4080 Laptop GPU (107 - 121, n=4) | |
| HP Omen 16-wf000 | |
| 2560x1440 Epic Preset | |
| HP Omen 16-wf000 | |
| Media NVIDIA GeForce RTX 4080 Laptop GPU (79 - 92, n=4) | |
| 3840x2160 Epic Preset | |
| HP Omen 16-wf000 | |
| Media NVIDIA GeForce RTX 4080 Laptop GPU (43 - 53, n=3) | |
Witcher 3 FPS Chart
| basso | medio | alto | ultra | QHD | 4K | |
|---|---|---|---|---|---|---|
| GTA V (2015) | 184.7 | 176.8 | 171.6 | 114 | 108.6 | 142.8 |
| The Witcher 3 (2015) | 453.2 | 407 | 296.5 | 163.4 | 113.1 | |
| Dota 2 Reborn (2015) | 187.4 | 173 | 164.2 | 153.7 | 145.7 | |
| Final Fantasy XV Benchmark (2018) | 208 | 194.9 | 153.9 | 120.6 | 71.6 | |
| X-Plane 11.11 (2018) | 172.4 | 151.2 | 118.5 | 102.3 | ||
| Strange Brigade (2018) | 413 | 334 | 320 | 299 | 225 | 116.7 |
| Cyberpunk 2077 1.6 (2022) | 132.3 | 127.1 | 124.4 | 116.7 | 77.6 | 35.3 |
| Tiny Tina's Wonderlands (2022) | 260.2 | 232.5 | 177.1 | 145.2 | 102.6 | 54.4 |
| F1 22 (2022) | 261 | 260 | 245 | 100.7 | 70.7 | 35.5 |
| Returnal (2023) | 148 | 148 | 136 | 107 | 91 | 53 |
Emissioni
Rumore di sistema: ancora molto forte in modalità prestazioni
Le ventole sono sempre attive a quasi 30 dB(A) contro uno sfondo silenzioso di 23 dB(A), indipendentemente dall'impostazione o dal carico sullo schermo. D'altra parte, le ventole non hanno bisogno di pulsare così spesso e quindi il rumore delle ventole è di solito nella gamma bassa e relativamente discreta di 30-33 dB(A) quando si eseguono carichi non impegnativi come lo streaming video.
Giocando in modalità Bilanciata invece che in modalità Prestazioni, le ventole sono sensibilmente più silenziose, con soli 44,2 dB(A), il che può valere la riduzione del 15% delle prestazioni grafiche. Per il resto, l'Omen 16 è uno dei portatili da gioco più rumorosi sul mercato, con oltre 57 dB(A) quando è impostato sulla modalità Performance.
| Impostazione del profilo di alimentazione | Witcher 3 Rumore della ventola dB(A) |
| Bilanciato | 44.2 |
| Prestazioni + Ventola massima disattivata | 57 |
| Prestazioni + ventola uomo accesa | 58.3 |
Rumorosità
| Idle |
| 29.6 / 29.8 / 30.4 dB(A) |
| Sotto carico |
| 33.8 / 58.3 dB(A) |
 | ||
30 dB silenzioso 40 dB(A) udibile 50 dB(A) rumoroso |
||
min: | ||
| HP Omen 16-wf000 GeForce RTX 4080 Laptop GPU, i7-13700HX, SK hynix PC801 HFS002TEJ9X101N | HP Omen 16-n0033dx Radeon RX 6650M, R7 6800H, Samsung PM9A1 MZVL21T0HCLR | Alienware x16 R1 GeForce RTX 4080 Laptop GPU, i9-13900HK, SK hynix PC801 HFS001TEJ9X101N | Lenovo Legion Pro 7 RTX4090 GeForce RTX 4090 Laptop GPU, i9-13900HX, Samsung PM9A1 MZVL21T0HCLR | Asus ROG Strix G16 G614JZ GeForce RTX 4080 Laptop GPU, i9-13980HX, WD PC SN560 SDDPNQE-1T00 | Razer Blade 16 Early 2023 GeForce RTX 4080 Laptop GPU, i9-13950HX, SSSTC CA6-8D1024 | |
|---|---|---|---|---|---|---|
| Noise | 4% | 8% | -8% | -1% | 10% | |
| off /ambiente * (dB) | 23 | 24.2 -5% | 22.7 1% | 25 -9% | 25 -9% | 23 -0% |
| Idle Minimum * (dB) | 29.6 | 27.4 7% | 23.1 22% | 28 5% | 26 12% | 23 22% |
| Idle Average * (dB) | 29.8 | 27.4 8% | 25.8 13% | 30 -1% | 28 6% | 23 23% |
| Idle Maximum * (dB) | 30.4 | 28.9 5% | 25.8 15% | 38 -25% | 30 1% | 23.6 22% |
| Load Average * (dB) | 33.8 | 32.3 4% | 39.3 -16% | 48 -42% | 48 -42% | 39 -15% |
| Witcher 3 ultra * (dB) | 57 | 54.1 5% | 49.9 12% | 53 7% | 49 14% | 51.6 9% |
| Load Maximum * (dB) | 58.3 | 57.6 1% | 54.8 6% | 55 6% | 52 11% | 51.3 12% |
* ... Meglio usare valori piccoli
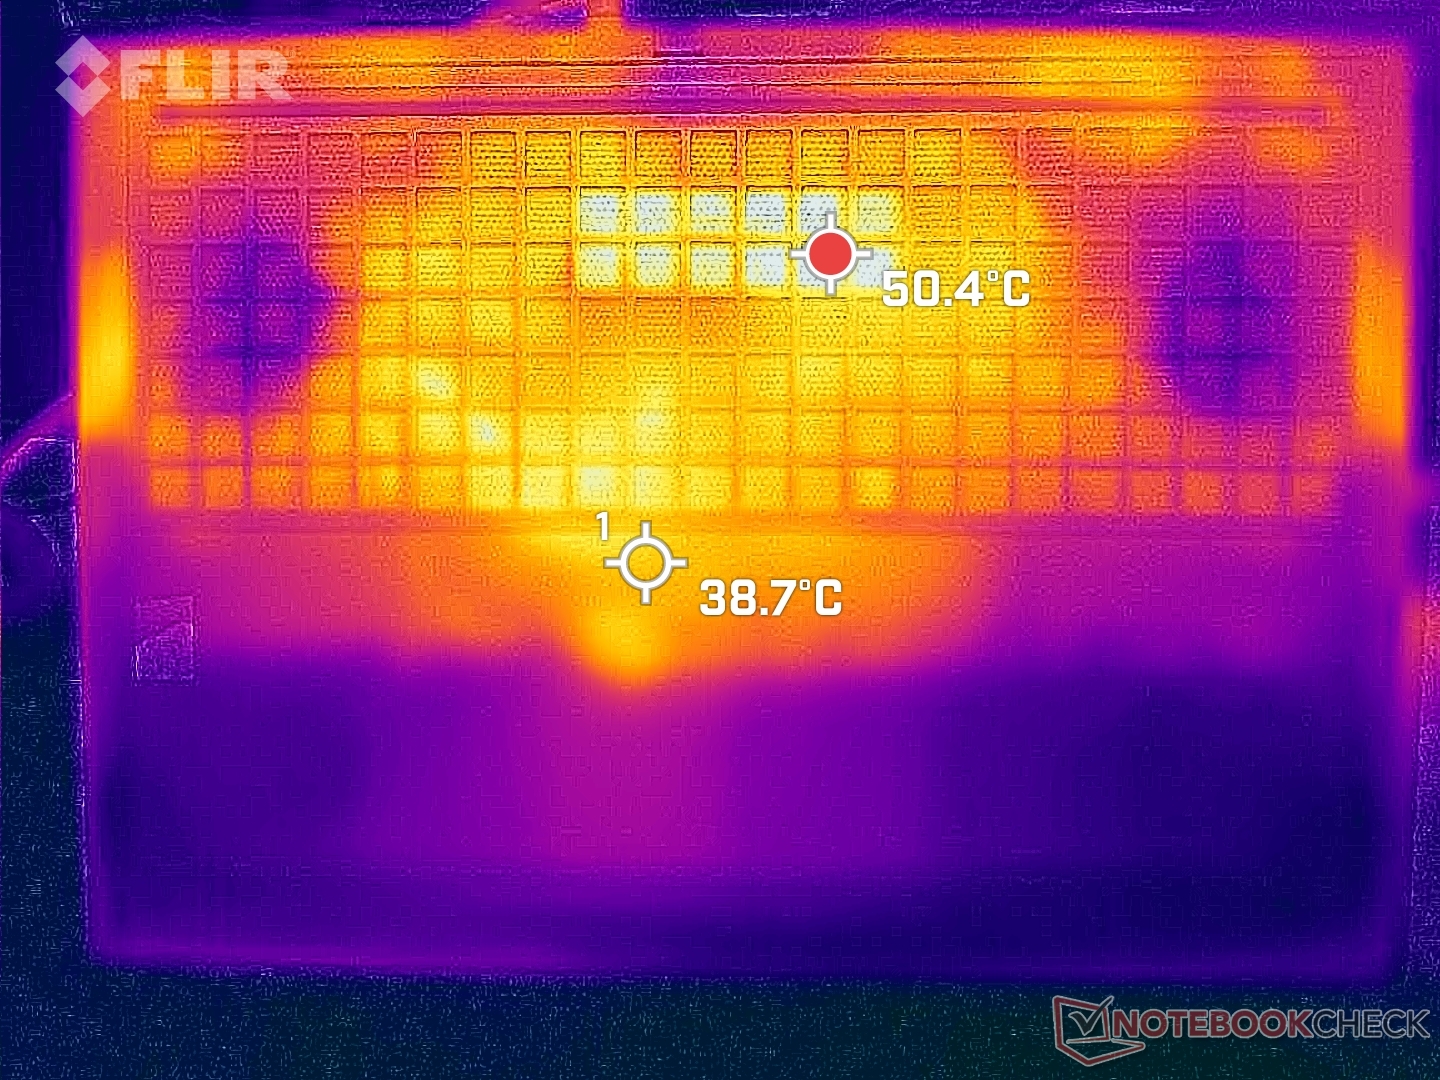
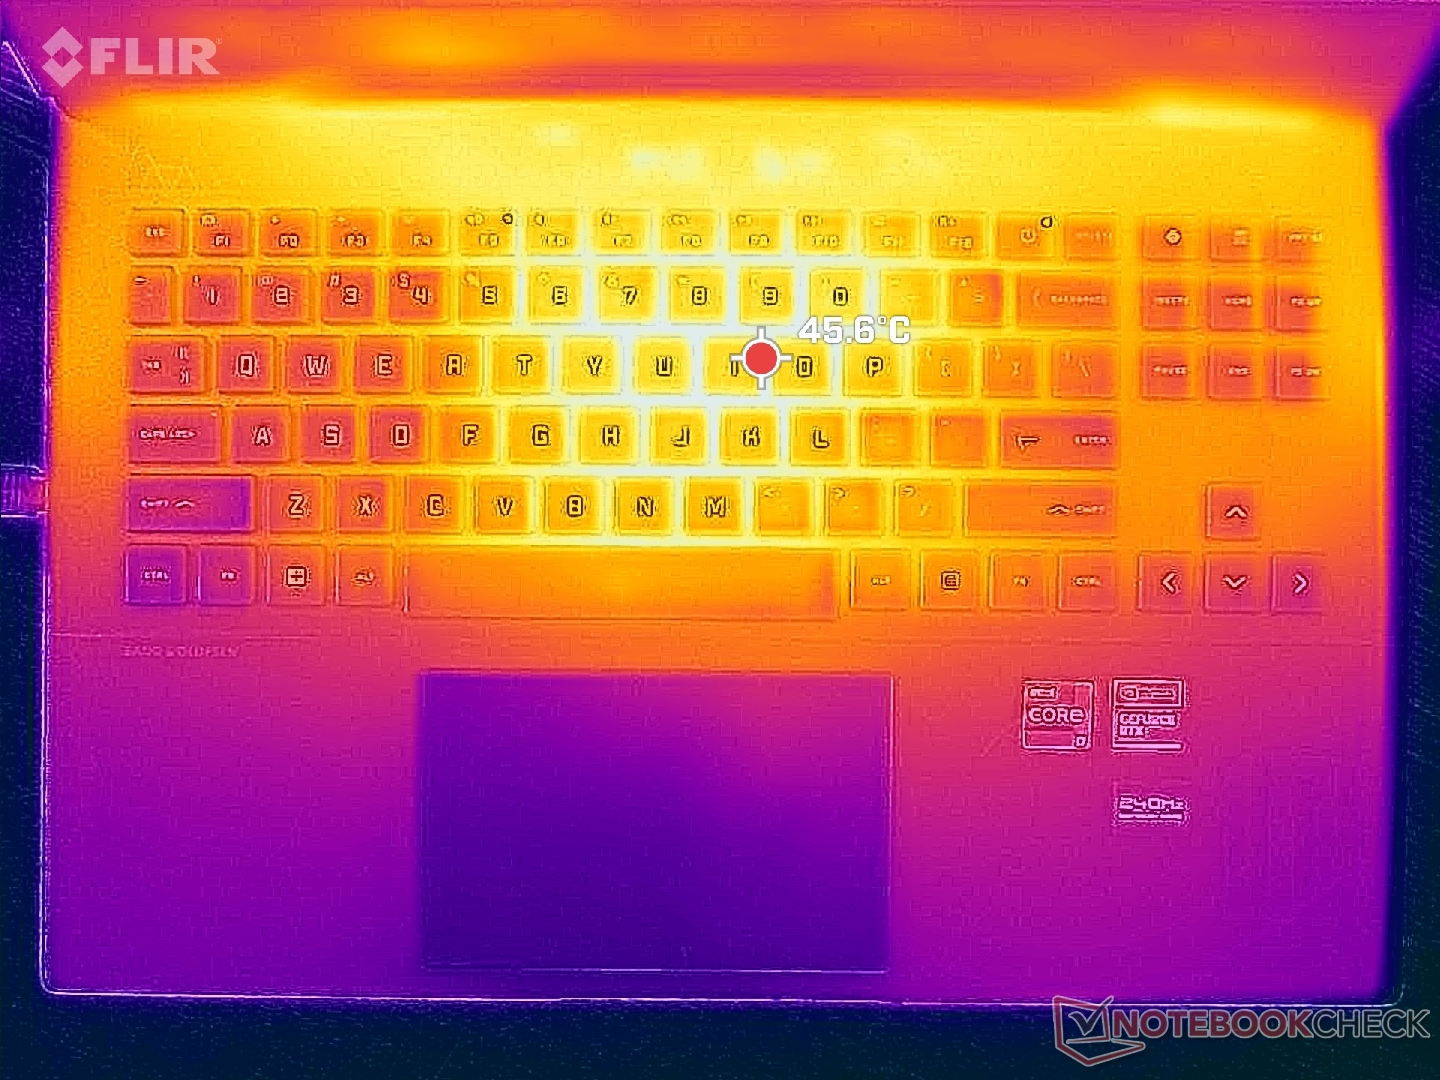
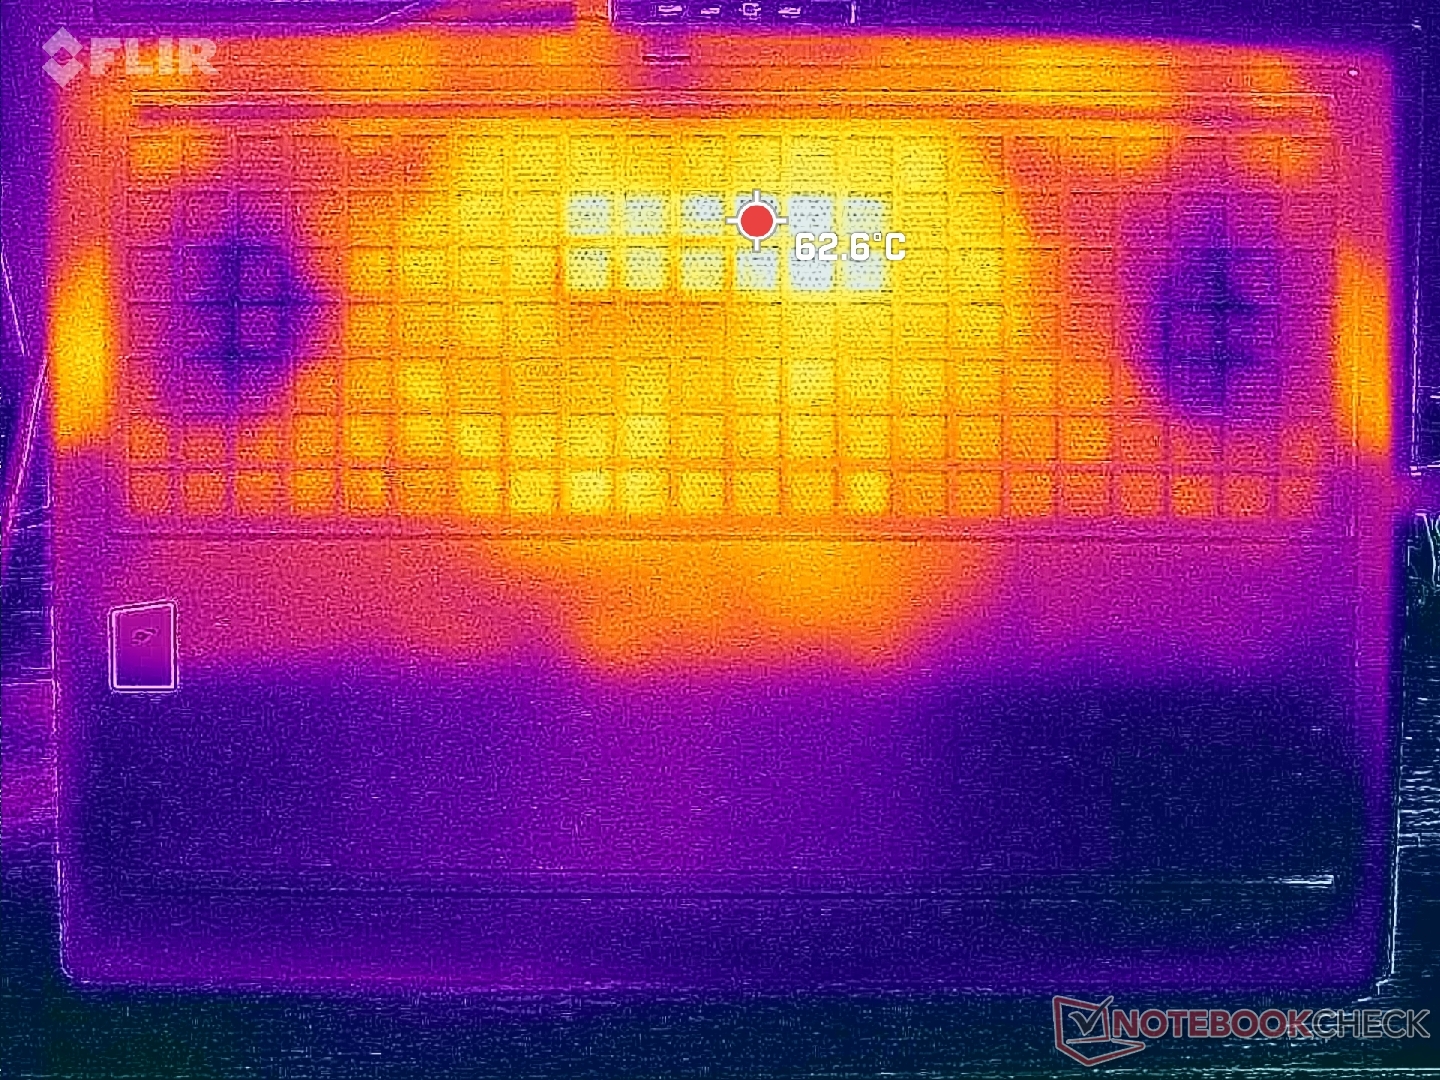
Temperatura
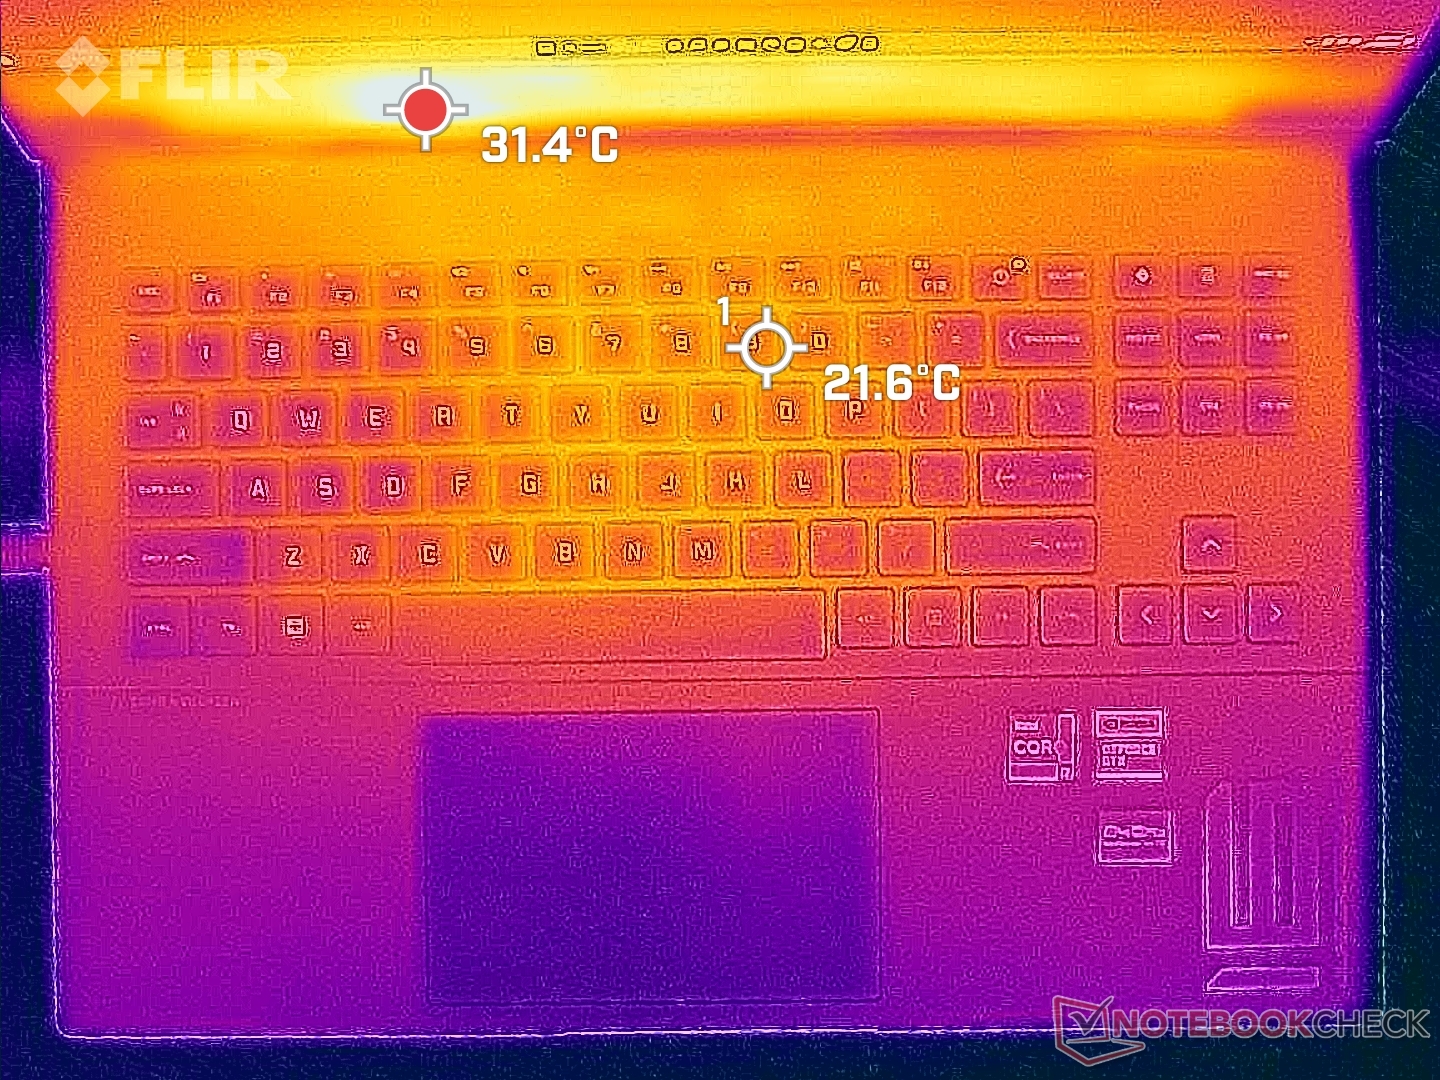
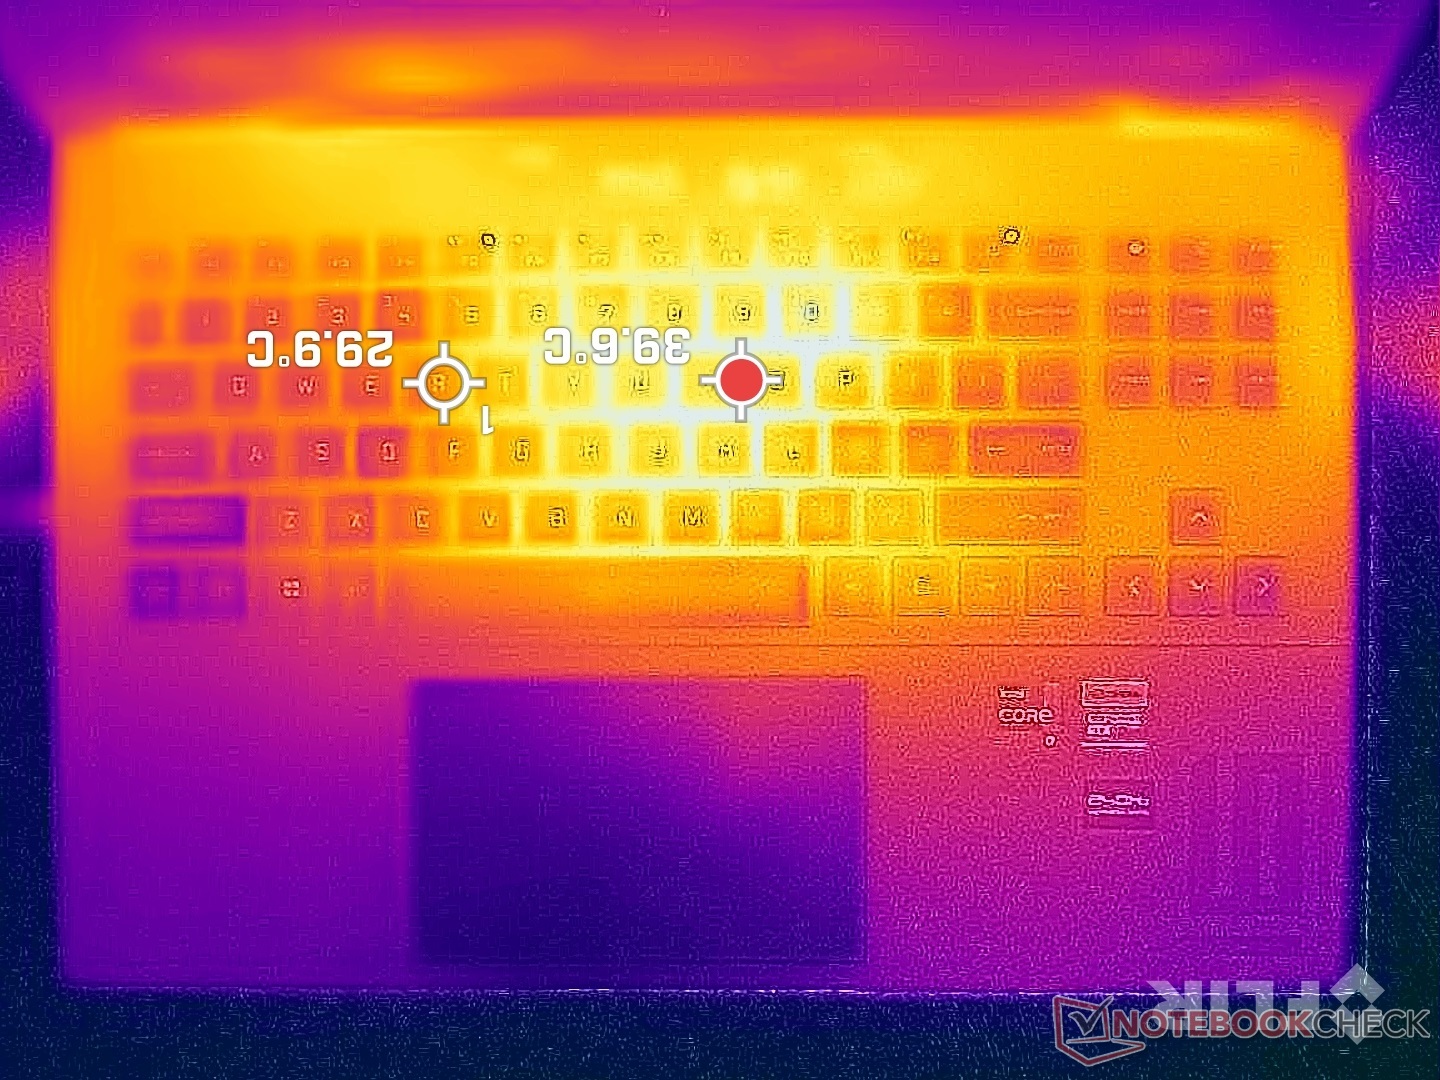
Le temperature della superficie sono simmetriche con punti caldi più vicini al centro della tastiera. Questa regione può raggiungere i 40-45 C quando si gioca, rispetto ai 55-60 C del modello più spesso, più pesante e più veloce Lenovo Legion Pro 7 16. Le temperature superficiali generalmente più basse possono essere attribuite alle griglie di ventilazione più ampie e all'obiettivo TGP più basso del design HP.
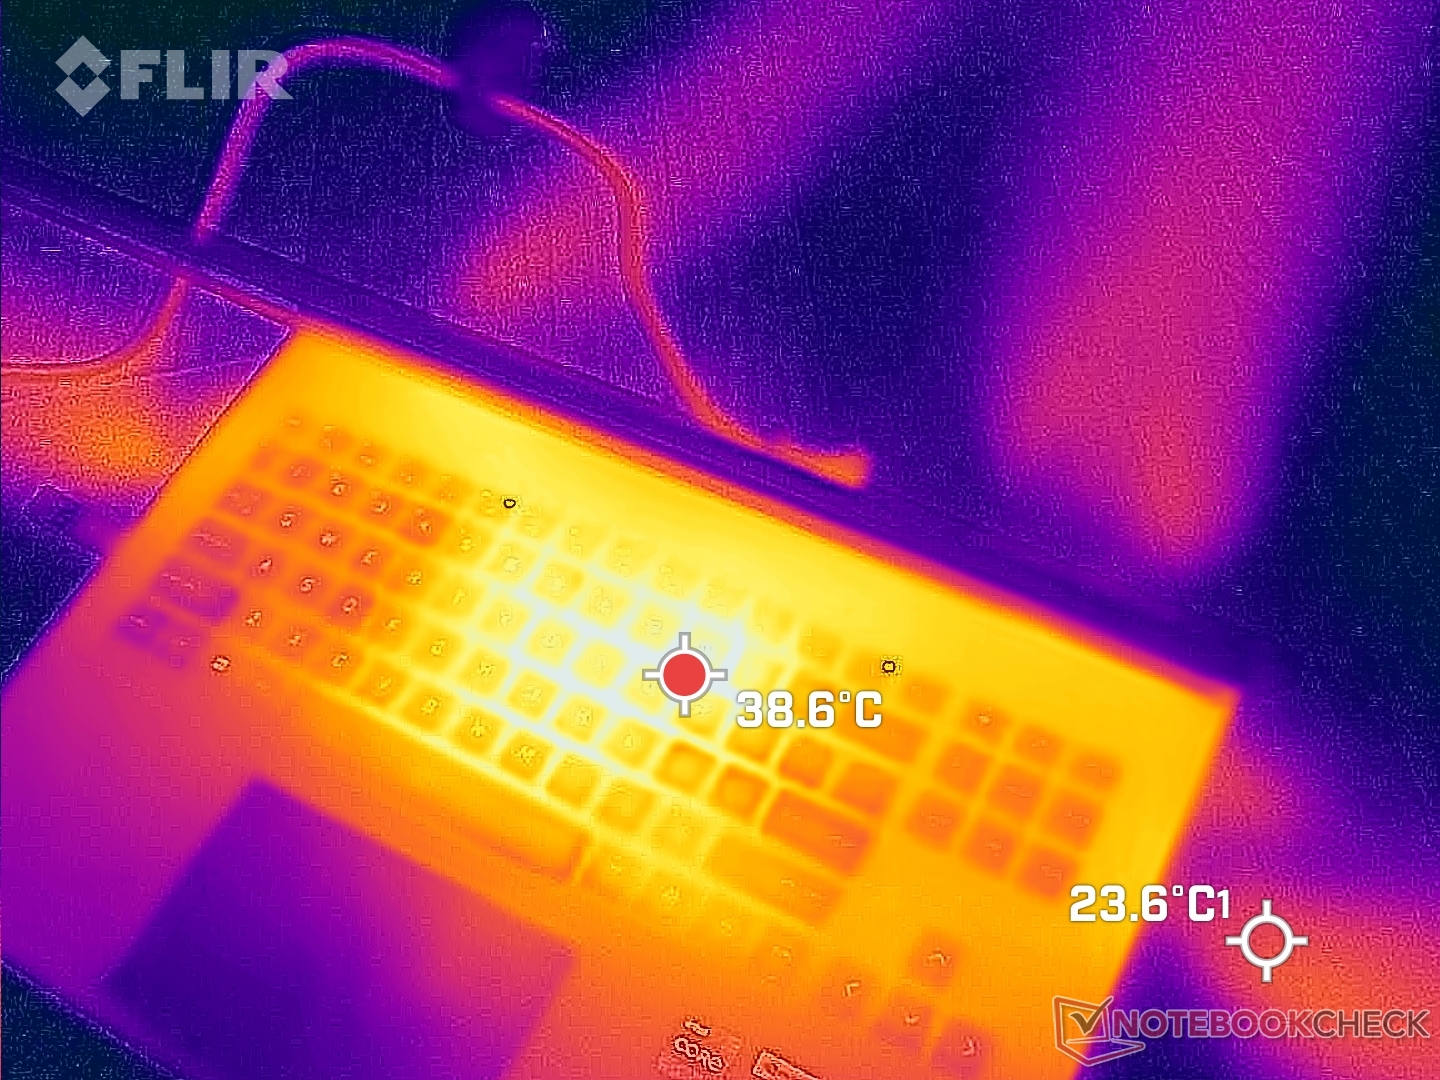
(±) La temperatura massima sul lato superiore è di 45 °C / 113 F, rispetto alla media di 40.4 °C / 105 F, che varia da 21.2 a 68.8 °C per questa classe Gaming.
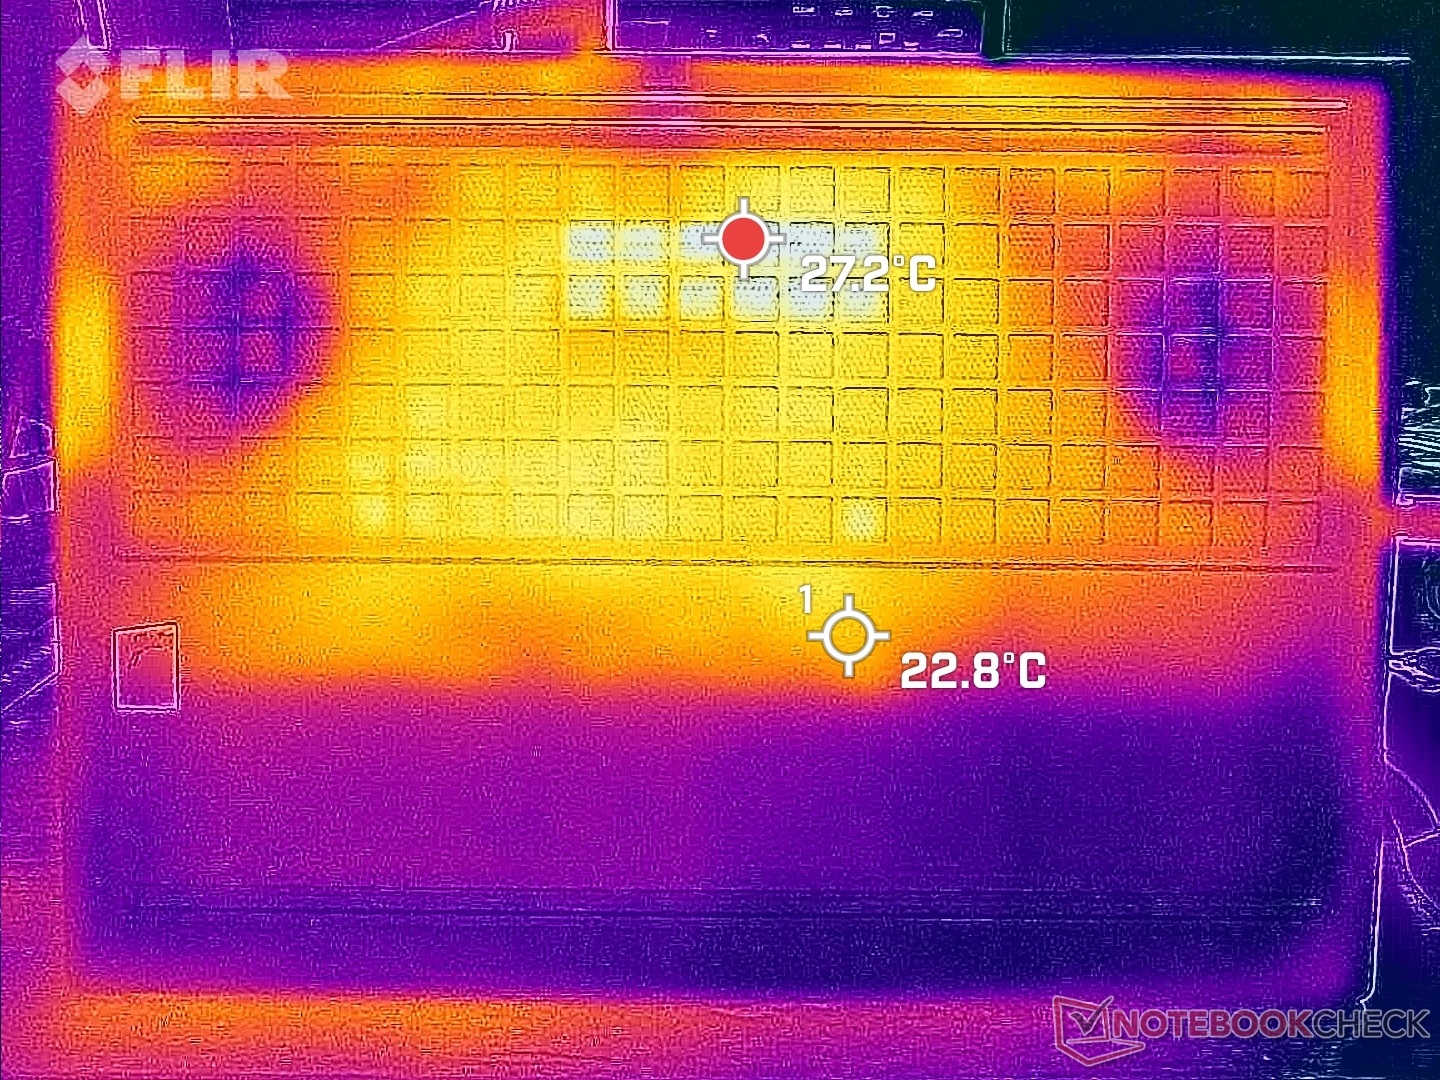
(-) Il lato inferiore si riscalda fino ad un massimo di 48.8 °C / 120 F, rispetto alla media di 43.2 °C / 110 F
(+) In idle, la temperatura media del lato superiore è di 26.6 °C / 80 F, rispetto alla media deld ispositivo di 33.9 °C / 93 F.
(±) Riproducendo The Witcher 3, la temperatura media per il lato superiore e' di 33.9 °C / 93 F, rispetto alla media del dispositivo di 33.9 °C / 93 F.
(+) I poggiapolsi e il touchpad sono piu' freddi della temperatura della pelle con un massimo di 31.4 °C / 88.5 F e sono quindi freddi al tatto.
(-) La temperatura media della zona del palmo della mano di dispositivi simili e'stata di 28.8 °C / 83.8 F (-2.6 °C / -4.7 F).
| HP Omen 16-wf000 Intel Core i7-13700HX, NVIDIA GeForce RTX 4080 Laptop GPU | HP Omen 16-n0033dx AMD Ryzen 7 6800H, AMD Radeon RX 6650M | Alienware x16 R1 Intel Core i9-13900HK, NVIDIA GeForce RTX 4080 Laptop GPU | Lenovo Legion Pro 7 RTX4090 Intel Core i9-13900HX, NVIDIA GeForce RTX 4090 Laptop GPU | Asus ROG Strix G16 G614JZ Intel Core i9-13980HX, NVIDIA GeForce RTX 4080 Laptop GPU | Razer Blade 16 Early 2023 Intel Core i9-13950HX, NVIDIA GeForce RTX 4080 Laptop GPU | |
|---|---|---|---|---|---|---|
| Heat | 3% | -13% | -17% | -12% | 4% | |
| Maximum Upper Side * (°C) | 45 | 41.2 8% | 47.2 -5% | 53 -18% | 54 -20% | 40 11% |
| Maximum Bottom * (°C) | 48.8 | 53.2 -9% | 47.8 2% | 59 -21% | 55 -13% | 37.6 23% |
| Idle Upper Side * (°C) | 29.2 | 26.4 10% | 36.8 -26% | 34 -16% | 29 1% | 32.4 -11% |
| Idle Bottom * (°C) | 28.8 | 27.8 3% | 35.8 -24% | 32 -11% | 33 -15% | 31.4 -9% |
* ... Meglio usare valori piccoli
Stress test
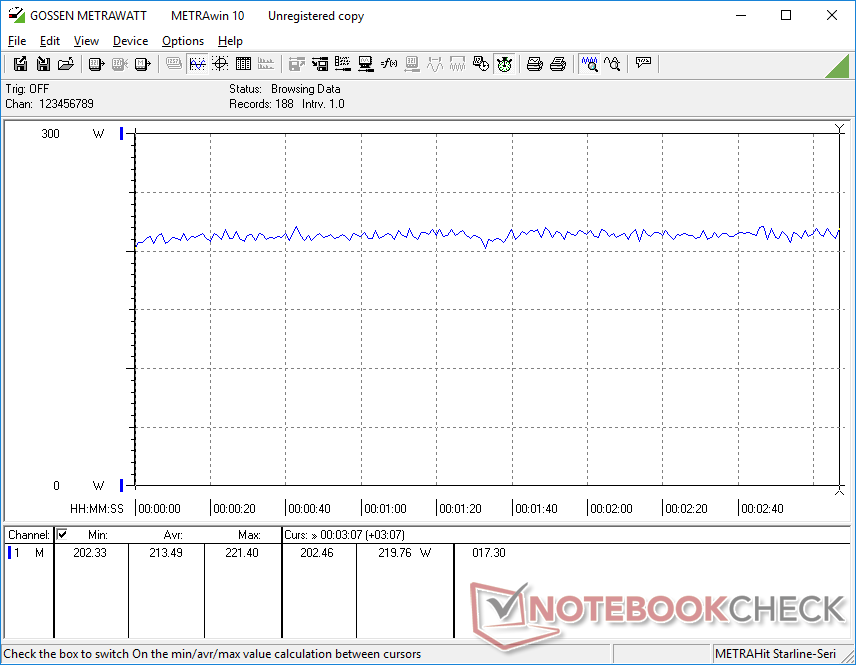
Le frequenze di clock della CPU e l'assorbimento di potenza della scheda all'avvio dello stress Prime95 hanno raggiunto un picco rispettivamente di 3,4 GHz e 110 W, durando per circa due minuti o fino a quando la temperatura del core ha raggiunto i 91 C. Successivamente, la CPU si è mantenuta in media intorno ai 3,0 GHz e ai 90 W per mantenere una temperatura di raffreddamento compresa tra gli 80 e i 90 C. Questo intervallo di temperatura è simile a quello che abbiamo registrato sul 2022 Omen 16 alimentato da AMD e sul più veloce Blade 16.
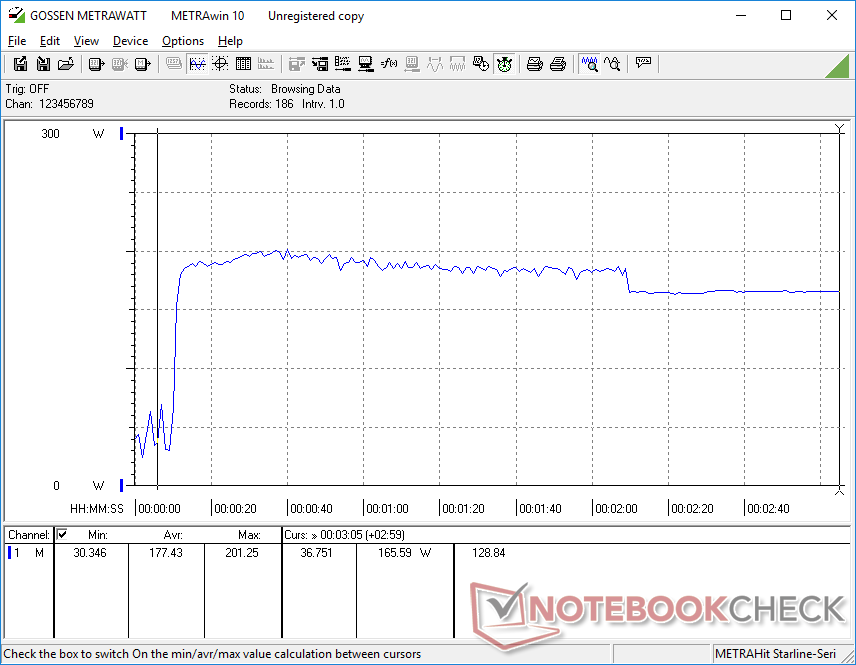
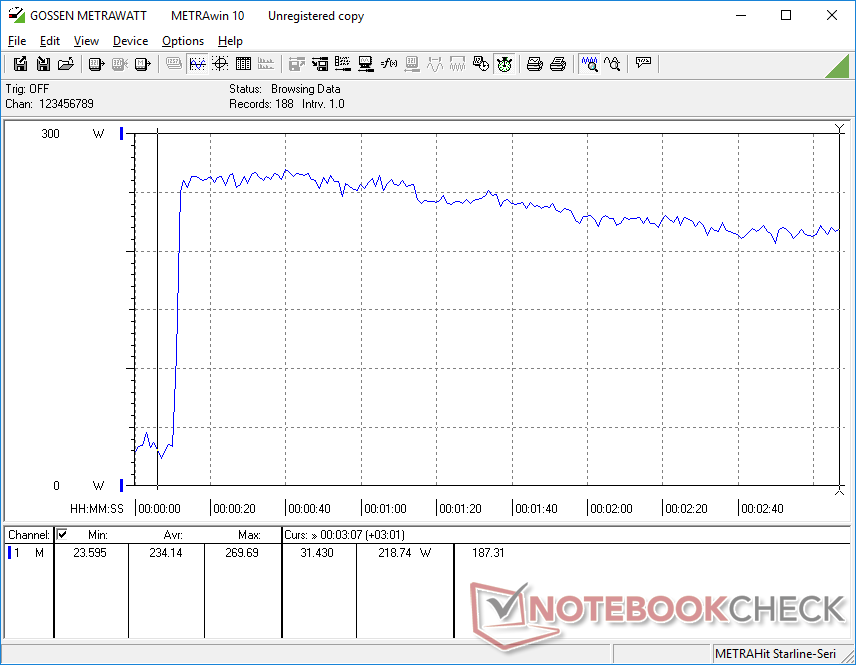
Quando si lavora Witcher 3 in modalità Performance con la ventola Max attivata, la velocità di clock della GPU e l'assorbimento di potenza della scheda sono leggermente superiori rispetto alla modalità Performance con la ventola Max disattivata, come mostrano gli screenshot qui sotto. I risultati corrispondono a quelli di Fire Strike e anche le temperature del core sarebbero sensibilmente più basse con la ventola Max attivata. Pertanto, è necessario attivare la modalità Man Fan se si desidera ottenere il massimo delle prestazioni dal portatile.
Eseguire Witcher 3 in modalità Bilanciata limiterebbe l'assorbimento di potenza della scheda a soli 95 W da un massimo di circa 130-145 W. Il rumore della ventola è più silenzioso, ovviamente, ma al costo delle prestazioni grafiche.
Il funzionamento a batteria limita notevolmente le prestazioni. Un test 3DMark 11 a batteria restituirebbe punteggi di Fisica e Grafica rispettivamente di 8347 e 10654 punti, rispetto a 23751 e 56145 punti con la rete elettrica.
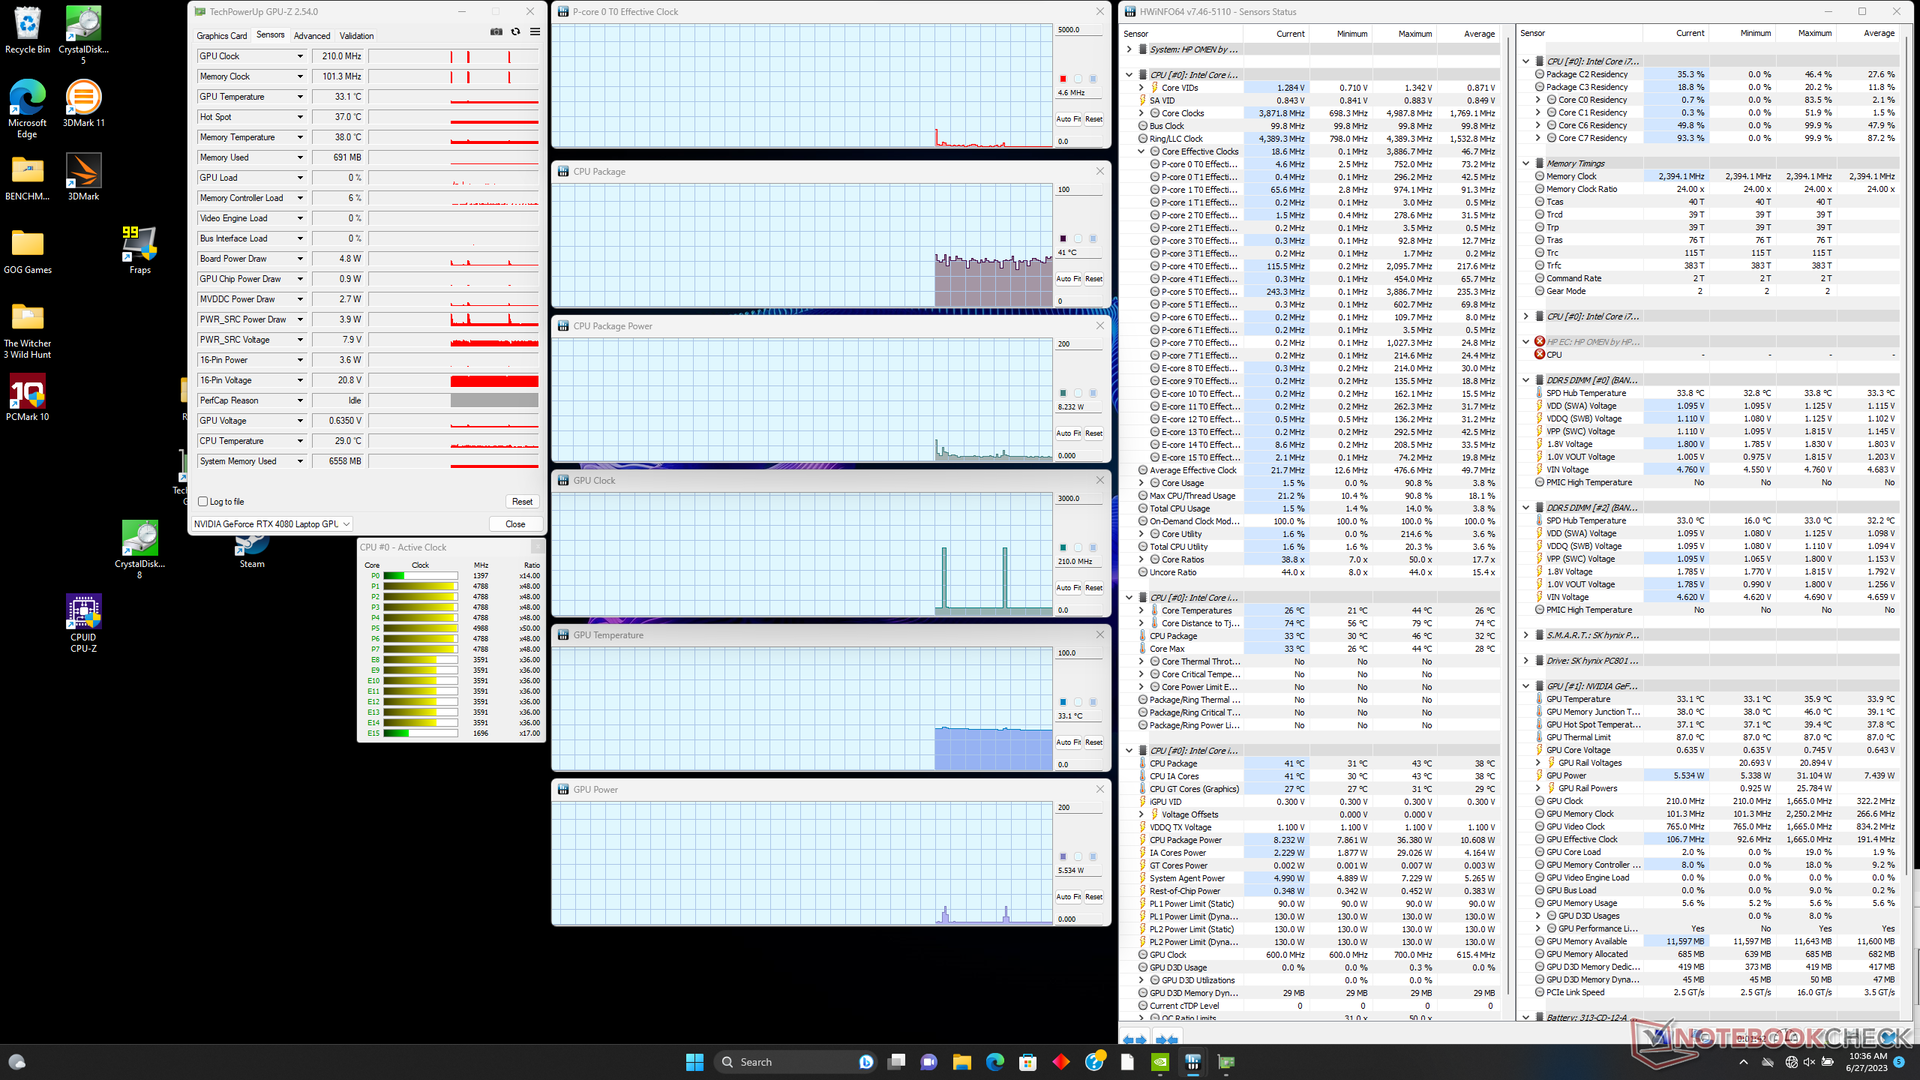
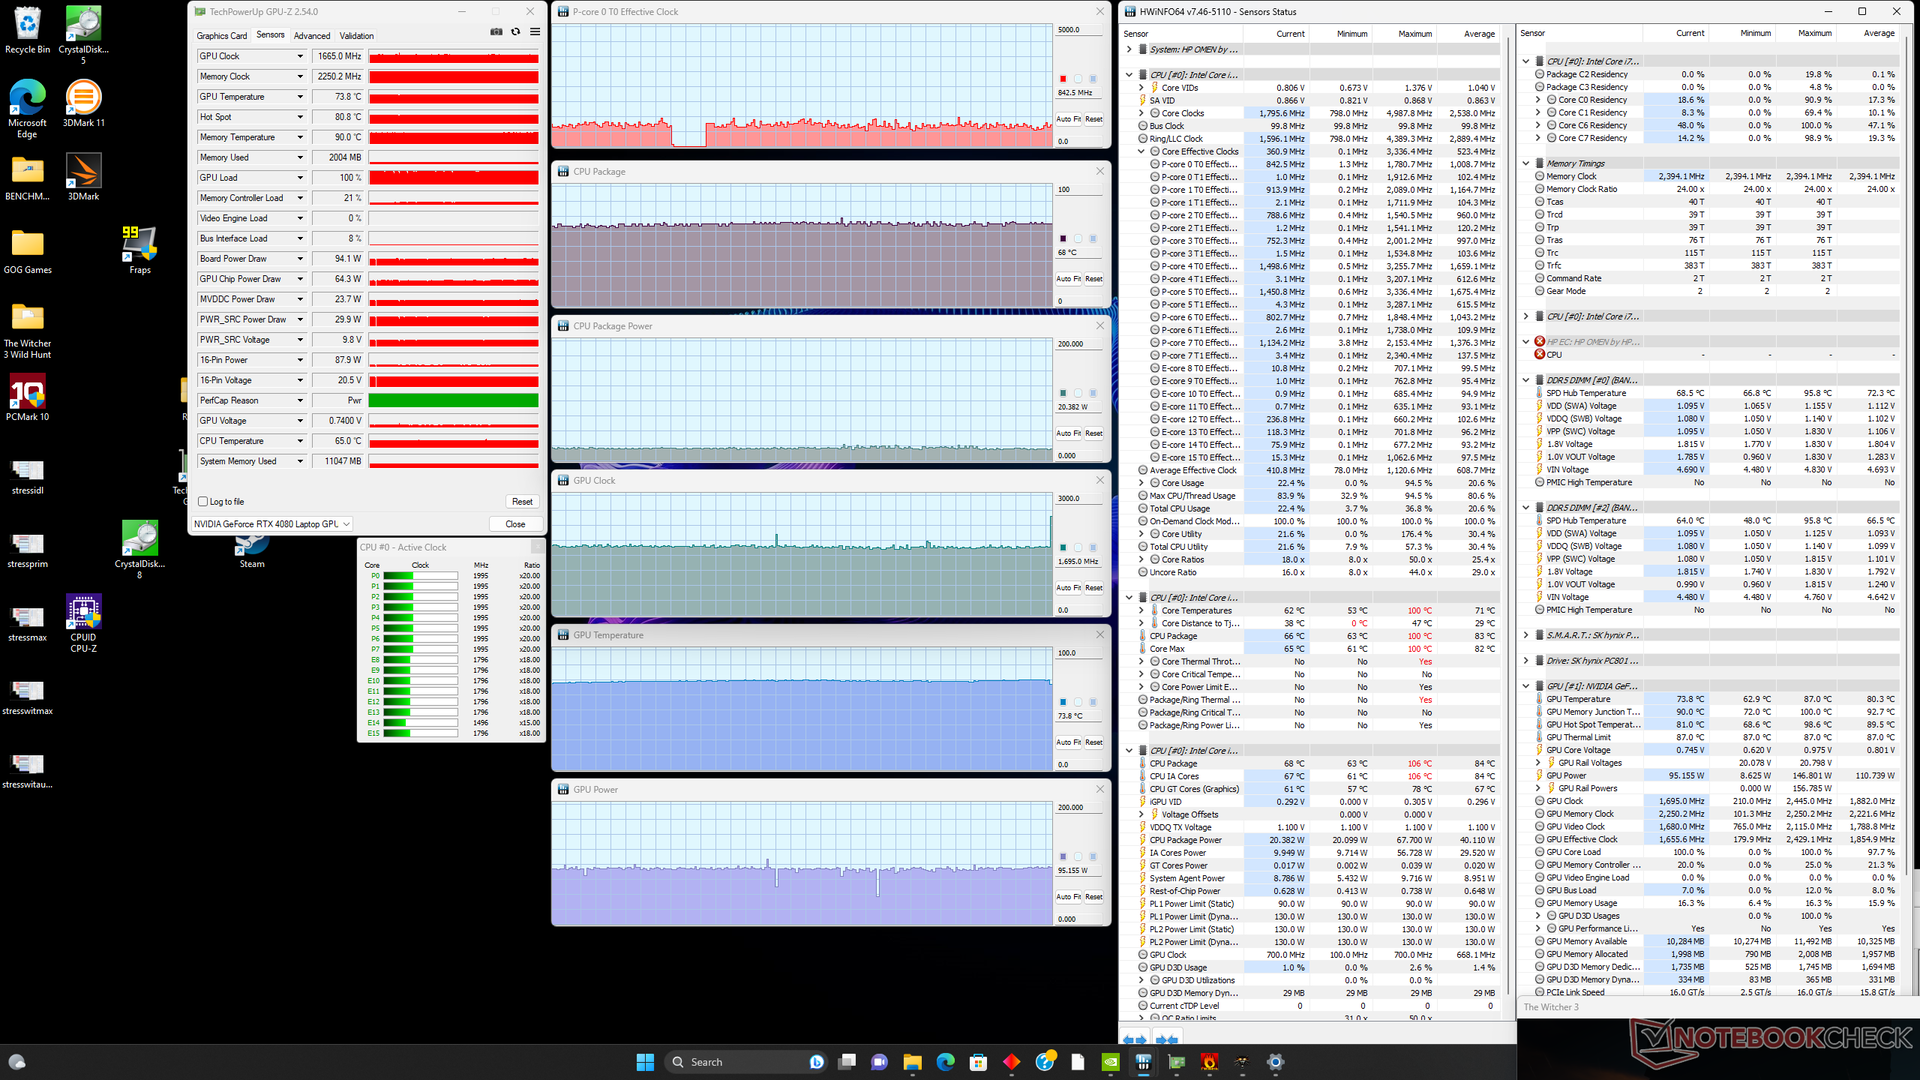
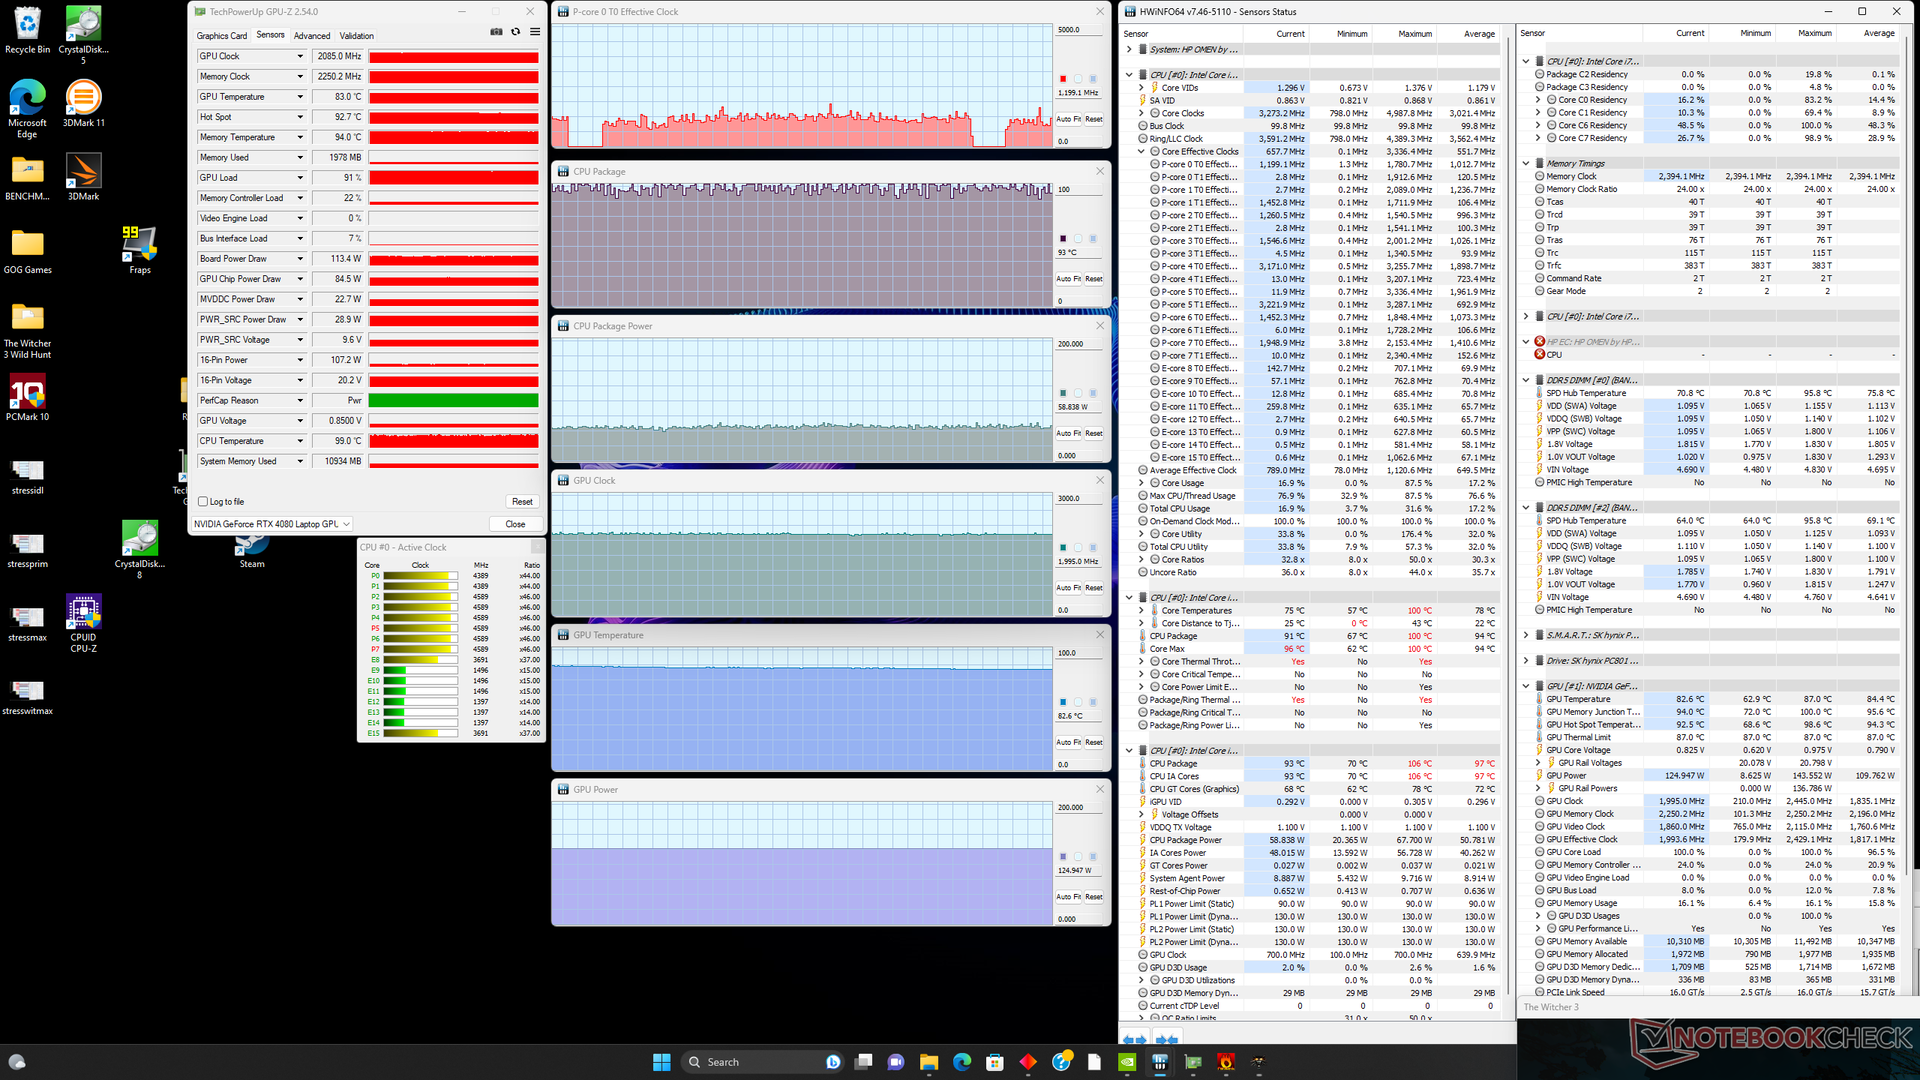
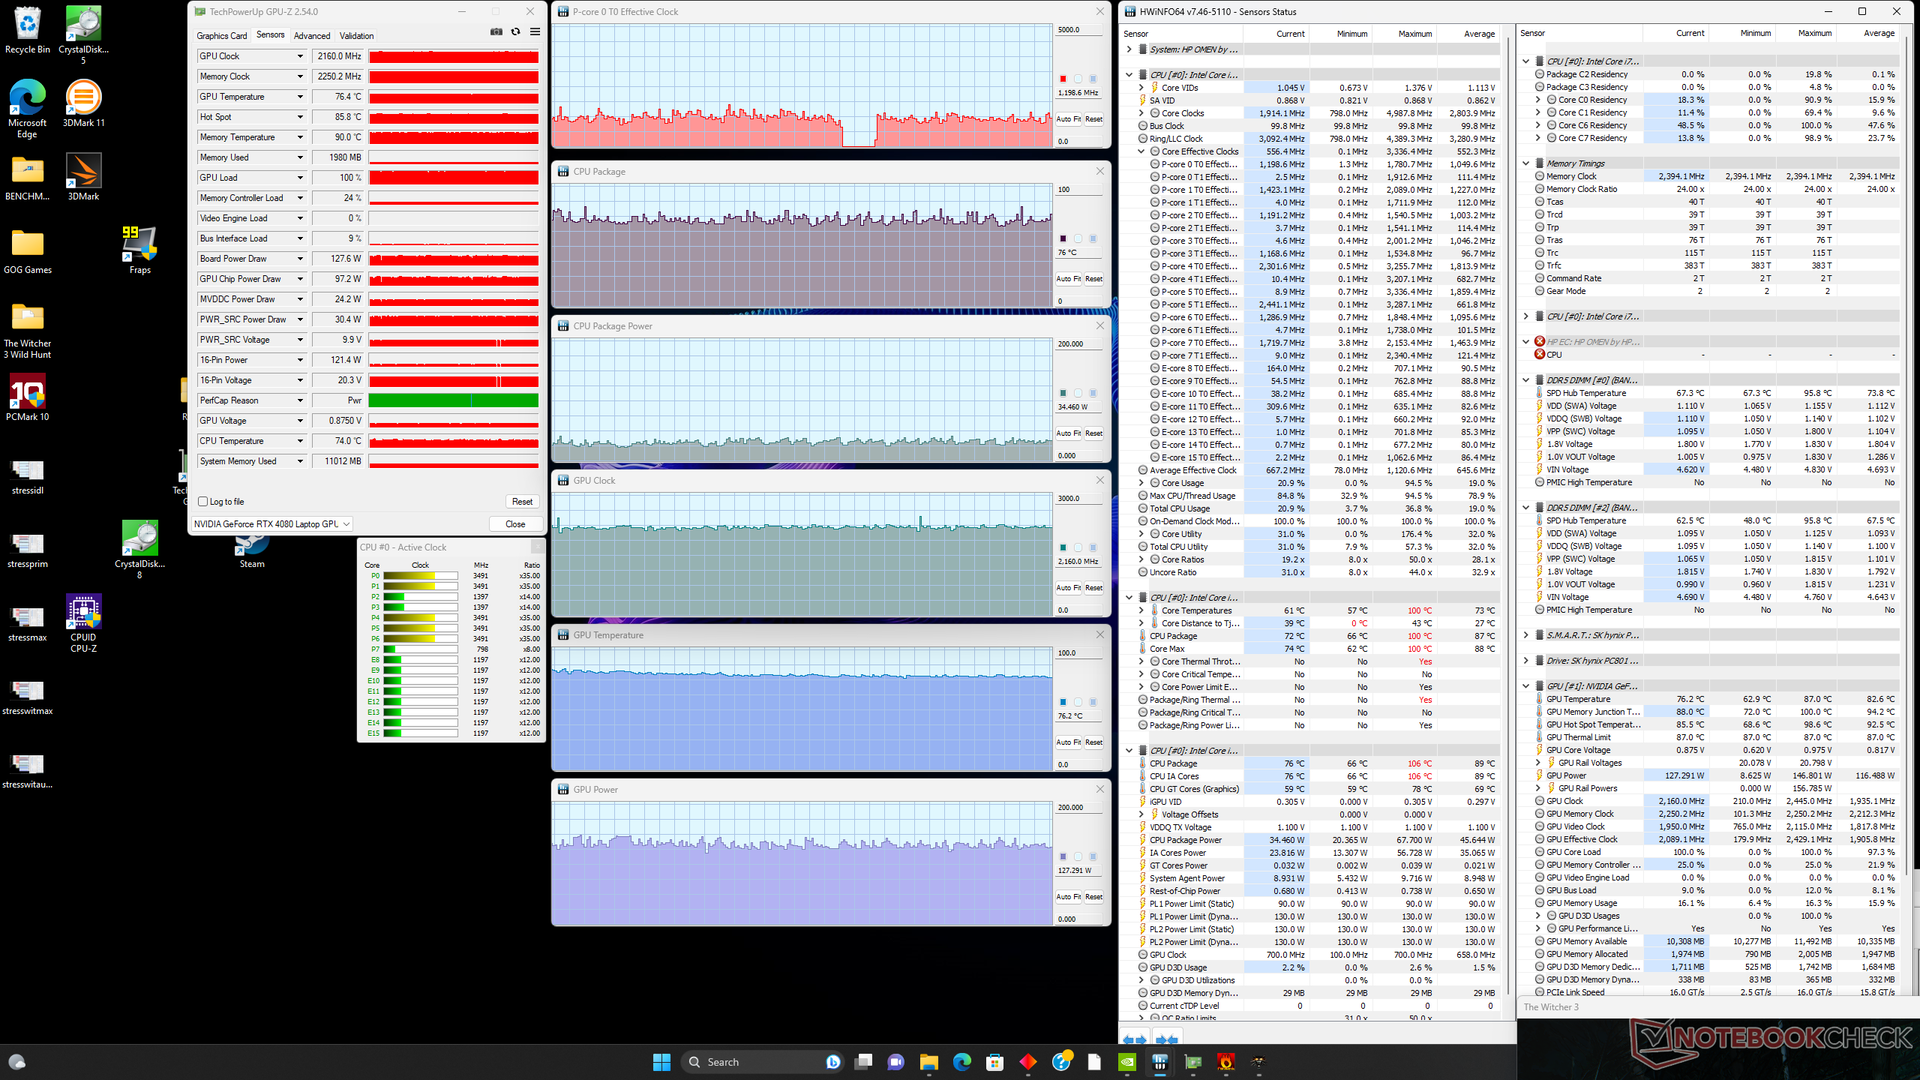
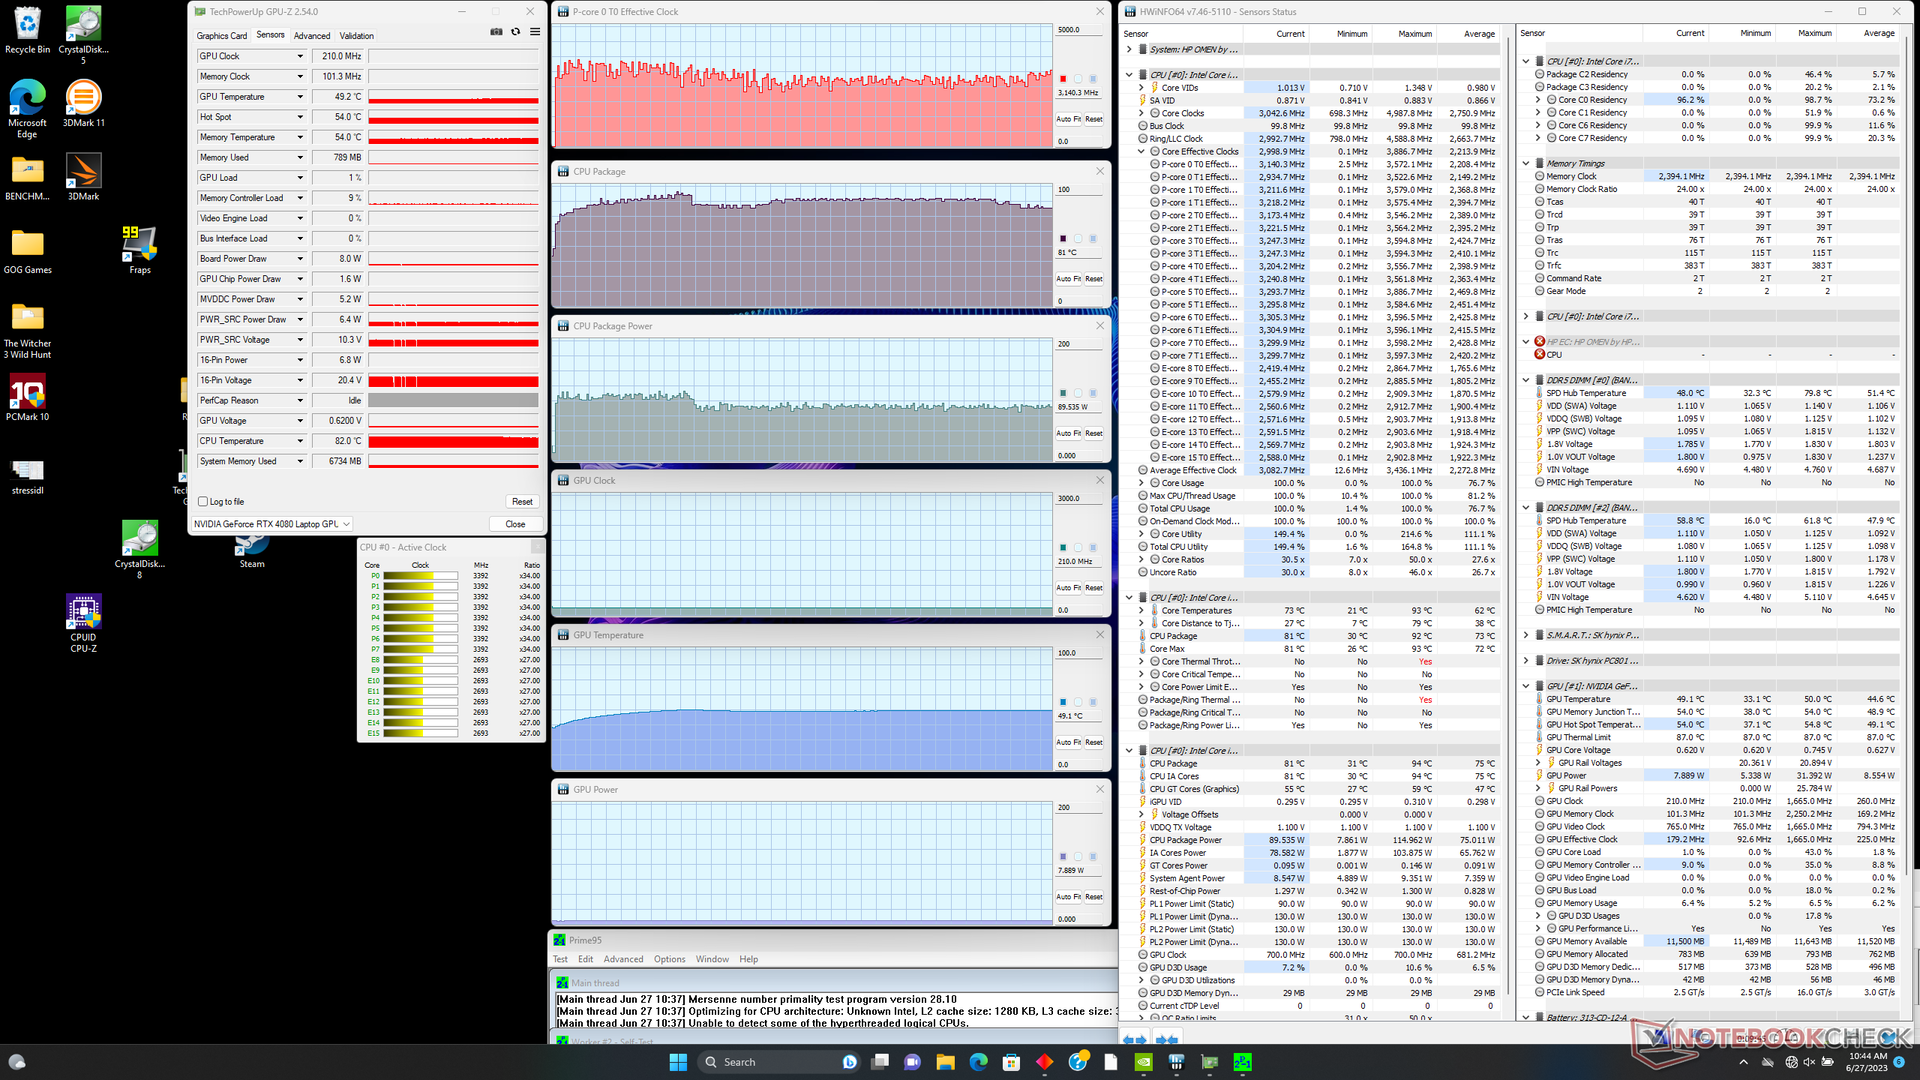
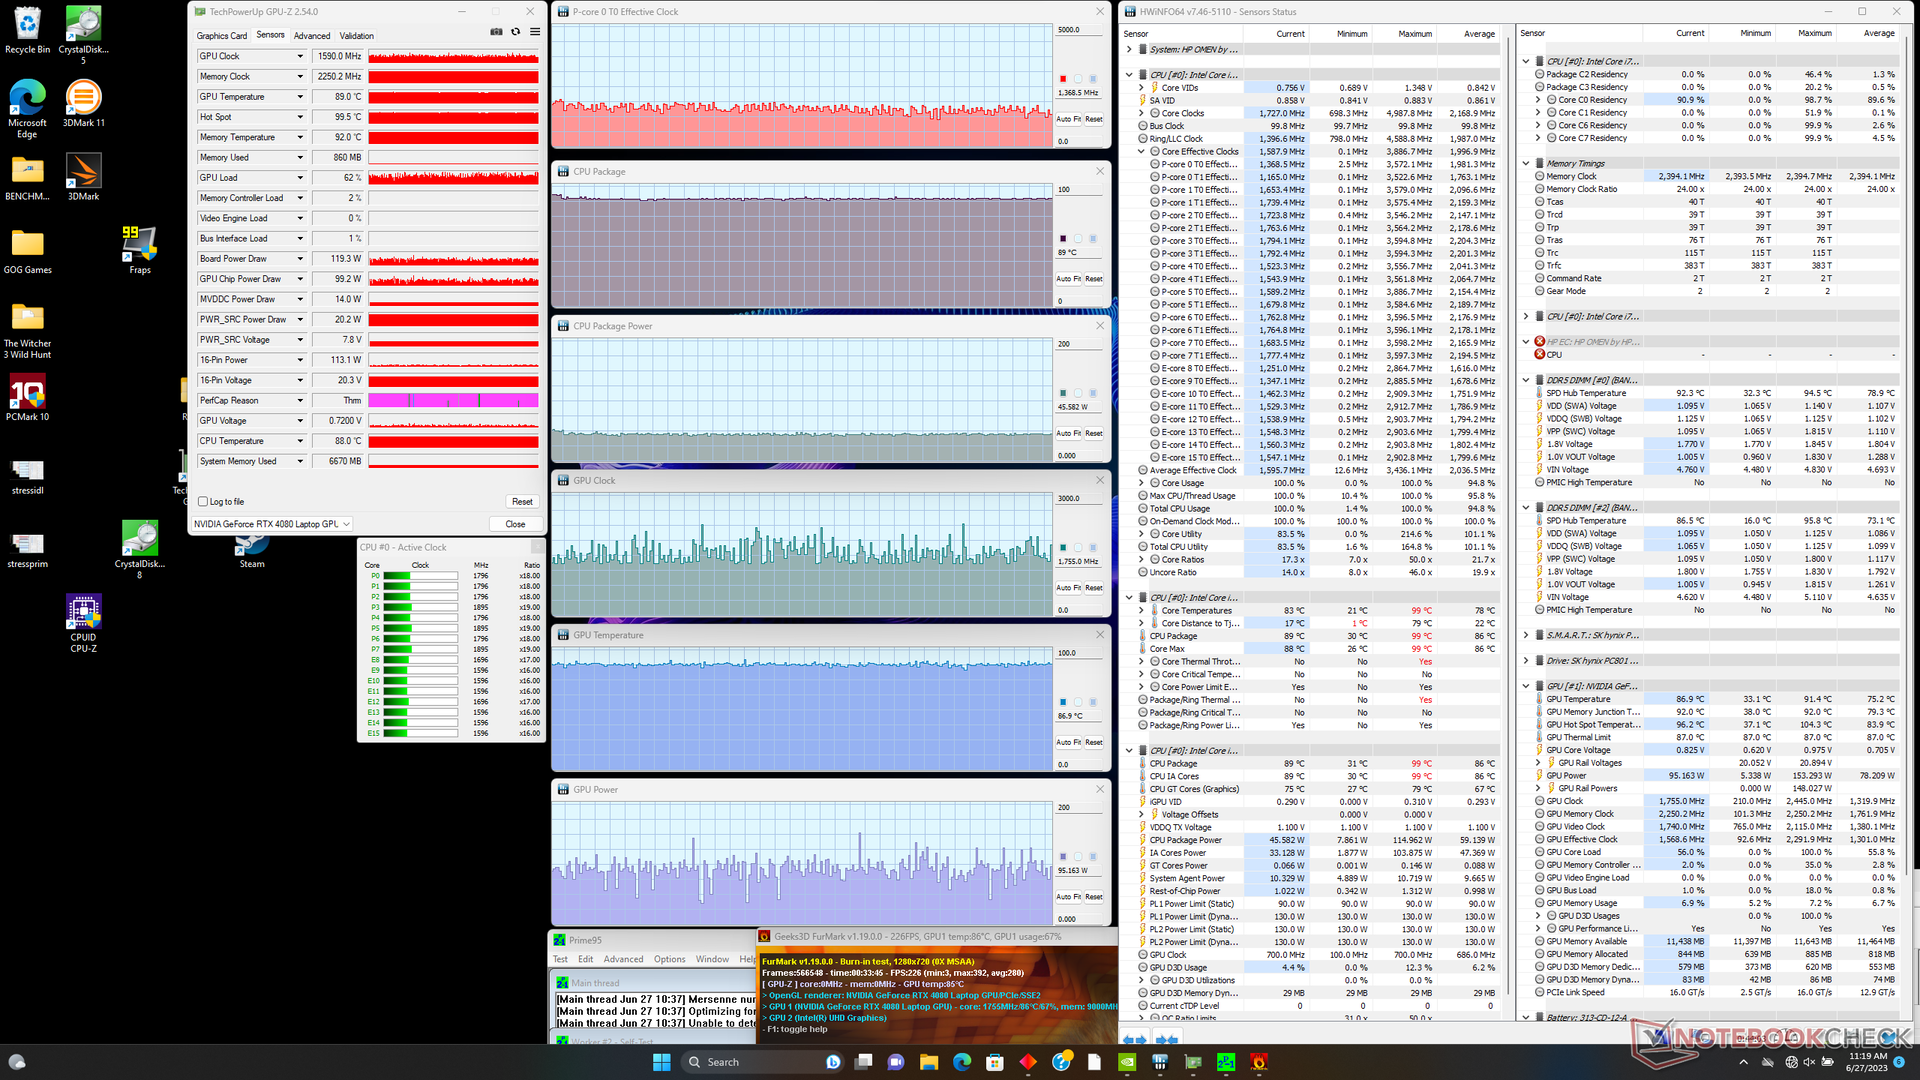
| Clock della CPU (GHz) | Clock della GPU (MHz) | Temperatura media della CPU (°C) | Temperatura media della GPU (°C) | |
| Sistema inattivo | -- | -- | 41 | 33 |
| Stress Prime95 | 2,4 - 3,2 | -- | 81 - 88 | 49 |
| Prime95 + FurMark Stress | 1,3 - 1,8 | 1300 - 2250 | 89 | 87 |
| Witcher 3 Stress (modalità bilanciata) | ~0,8 | 1665 | 68 | 74 |
| Witcher 3 Stress (modalità Performance + Max Fan Off) | ~1,2 | 2085 | ~95 | 83 |
| Witcher 3 Stress (modalità Performance + Max Fan On) | ~1,2 | 2160 | 76 | 76 |
Altoparlanti
Gli altoparlanti stereo non sono così forti come gli altoparlanti quadrupli dell'Alienware x16 R1 Alienware x16 R1ma l'equilibrio è comunque rispettabile. La qualità del suono cala sensibilmente durante i giochi a causa delle ventole rumorose.
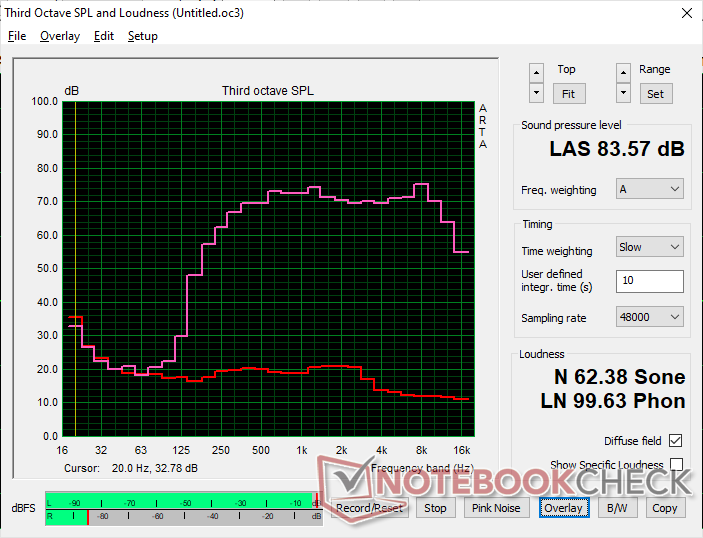
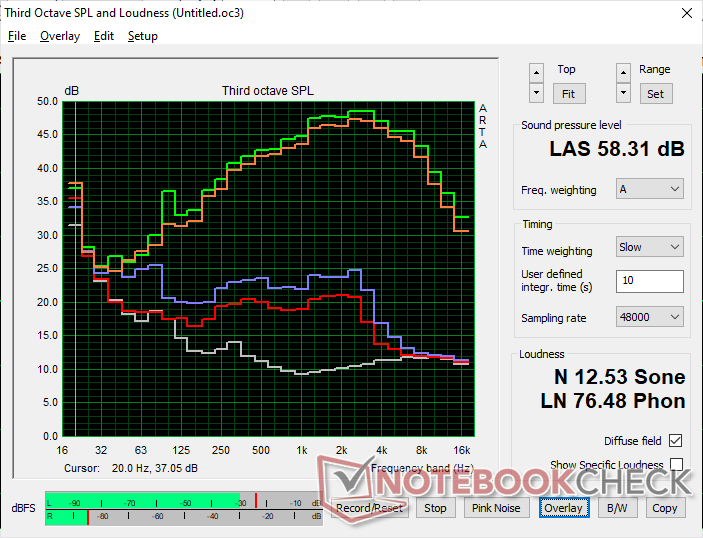
HP Omen 16-wf000 analisi audio
(+) | gli altoparlanti sono relativamente potenti (83.6 dB)
Bassi 100 - 315 Hz
(-) | quasi nessun basso - in media 21.9% inferiori alla media
(±) | la linearità dei bassi è media (14.7% delta rispetto alla precedente frequenza)
Medi 400 - 2000 Hz
(+) | medi bilanciati - solo only 2.1% rispetto alla media
(+) | medi lineari (3% delta rispetto alla precedente frequenza)
Alti 2 - 16 kHz
(+) | Alti bilanciati - appena 1.4% dalla media
(+) | alti lineari (3.5% delta rispetto alla precedente frequenza)
Nel complesso 100 - 16.000 Hz
(±) | la linearità complessiva del suono è media (15.3% di differenza rispetto alla media
Rispetto alla stessa classe
» 34% di tutti i dispositivi testati in questa classe è stato migliore, 6% simile, 60% peggiore
» Il migliore ha avuto un delta di 6%, medio di 18%, peggiore di 132%
Rispetto a tutti i dispositivi testati
» 22% di tutti i dispositivi testati in questa classe è stato migliore, 4% similare, 74% peggiore
» Il migliore ha avuto un delta di 4%, medio di 24%, peggiore di 134%
Apple MacBook Pro 16 2021 M1 Pro analisi audio
(+) | gli altoparlanti sono relativamente potenti (84.7 dB)
Bassi 100 - 315 Hz
(+) | bassi buoni - solo 3.8% dalla media
(+) | bassi in lineaa (5.2% delta rispetto alla precedente frequenza)
Medi 400 - 2000 Hz
(+) | medi bilanciati - solo only 1.3% rispetto alla media
(+) | medi lineari (2.1% delta rispetto alla precedente frequenza)
Alti 2 - 16 kHz
(+) | Alti bilanciati - appena 1.9% dalla media
(+) | alti lineari (2.7% delta rispetto alla precedente frequenza)
Nel complesso 100 - 16.000 Hz
(+) | suono nel complesso lineare (4.6% differenza dalla media)
Rispetto alla stessa classe
» 0% di tutti i dispositivi testati in questa classe è stato migliore, 0% simile, 100% peggiore
» Il migliore ha avuto un delta di 5%, medio di 17%, peggiore di 45%
Rispetto a tutti i dispositivi testati
» 0% di tutti i dispositivi testati in questa classe è stato migliore, 0% similare, 100% peggiore
» Il migliore ha avuto un delta di 4%, medio di 24%, peggiore di 134%
Gestione dell'energia - Batteria più grande, durata più breve
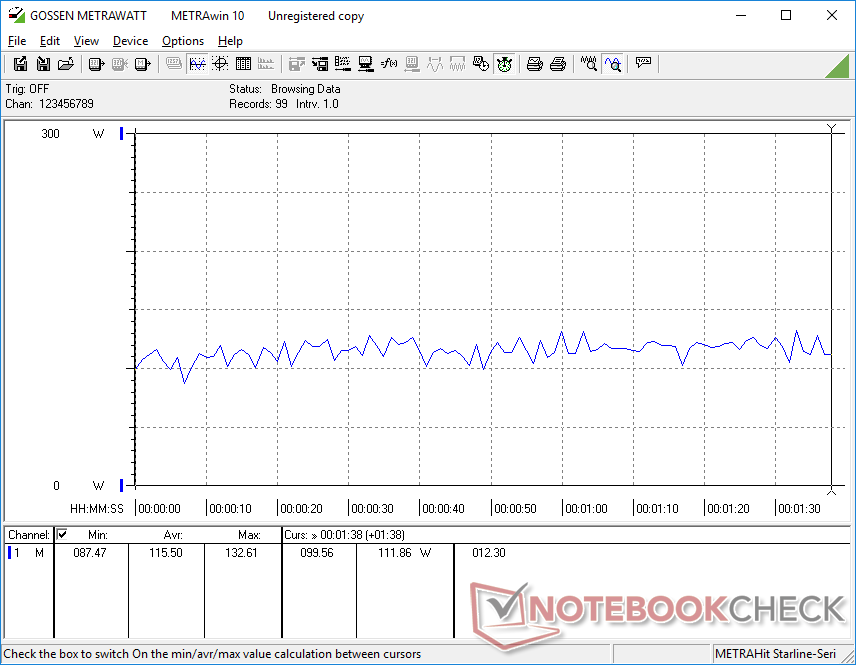
Consumo di energia
Il consumo di energia quando è al minimo è più alto del previsto anche quando si utilizza il profilo Risparmio energetico con l'iGPU attiva e la luminosità impostata al minimo. L'elevato consumo potrebbe essere responsabile dei risultati relativi alla minore durata della batteria riportati nella sezione successiva.
Fortunatamente, il consumo durante i giochi mostra miglioramenti significativi rispetto all'Omen 2022 di AMD 2022 Omen 16 alimentato da AMD. In esecuzione Witcher 3 assorbe in media solo il 4% di energia in più, pur fornendo prestazioni della GPU da 1,5 a 2 volte superiori a quelle della Radeon RX 6650M. Questo fatto da solo può spiegare perché HP ha deciso di abbandonare qualsiasi opzione Radeon per l'Omen 16 di quest'anno, poiché i vantaggi in termini di prestazioni per watt di Ada Lovelace sono sorprendenti.
I portatili della concorrenza con la stessa GPU RTX 4080 come ilROG Strix G16 o Blade 16 richiedono ciascuno circa 30 W in più rispetto al nostro sistema HP quando si esegue lo stesso titolo. Tuttavia, sono anche dotati di CPU Core i9 HX molto più veloci per compensare.
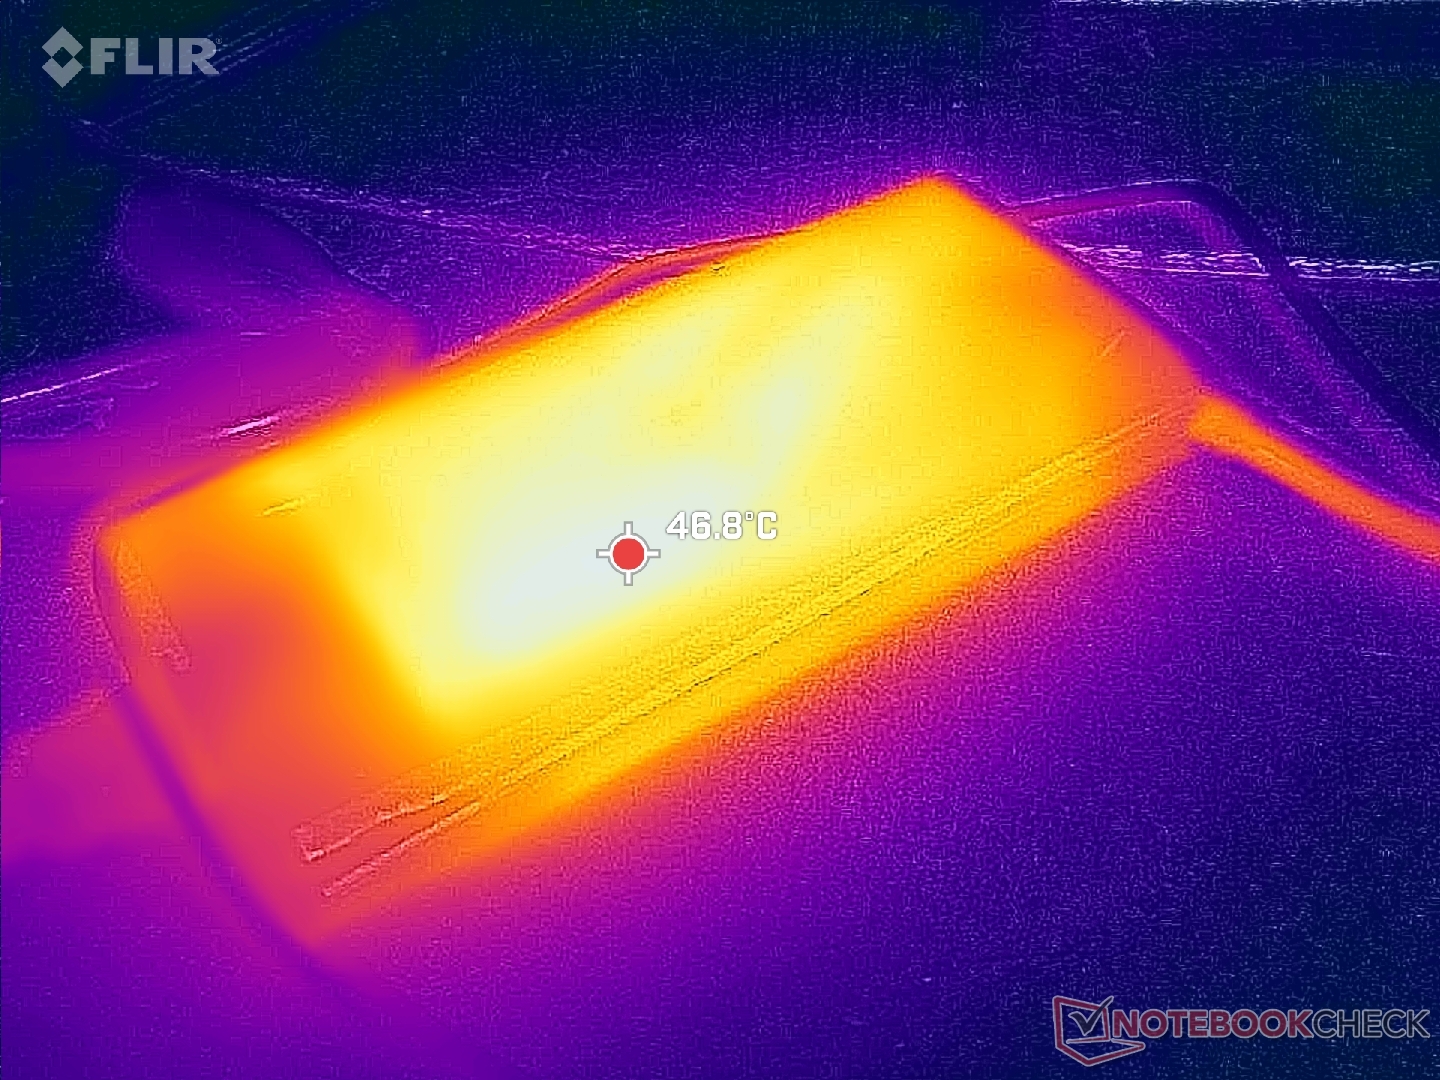
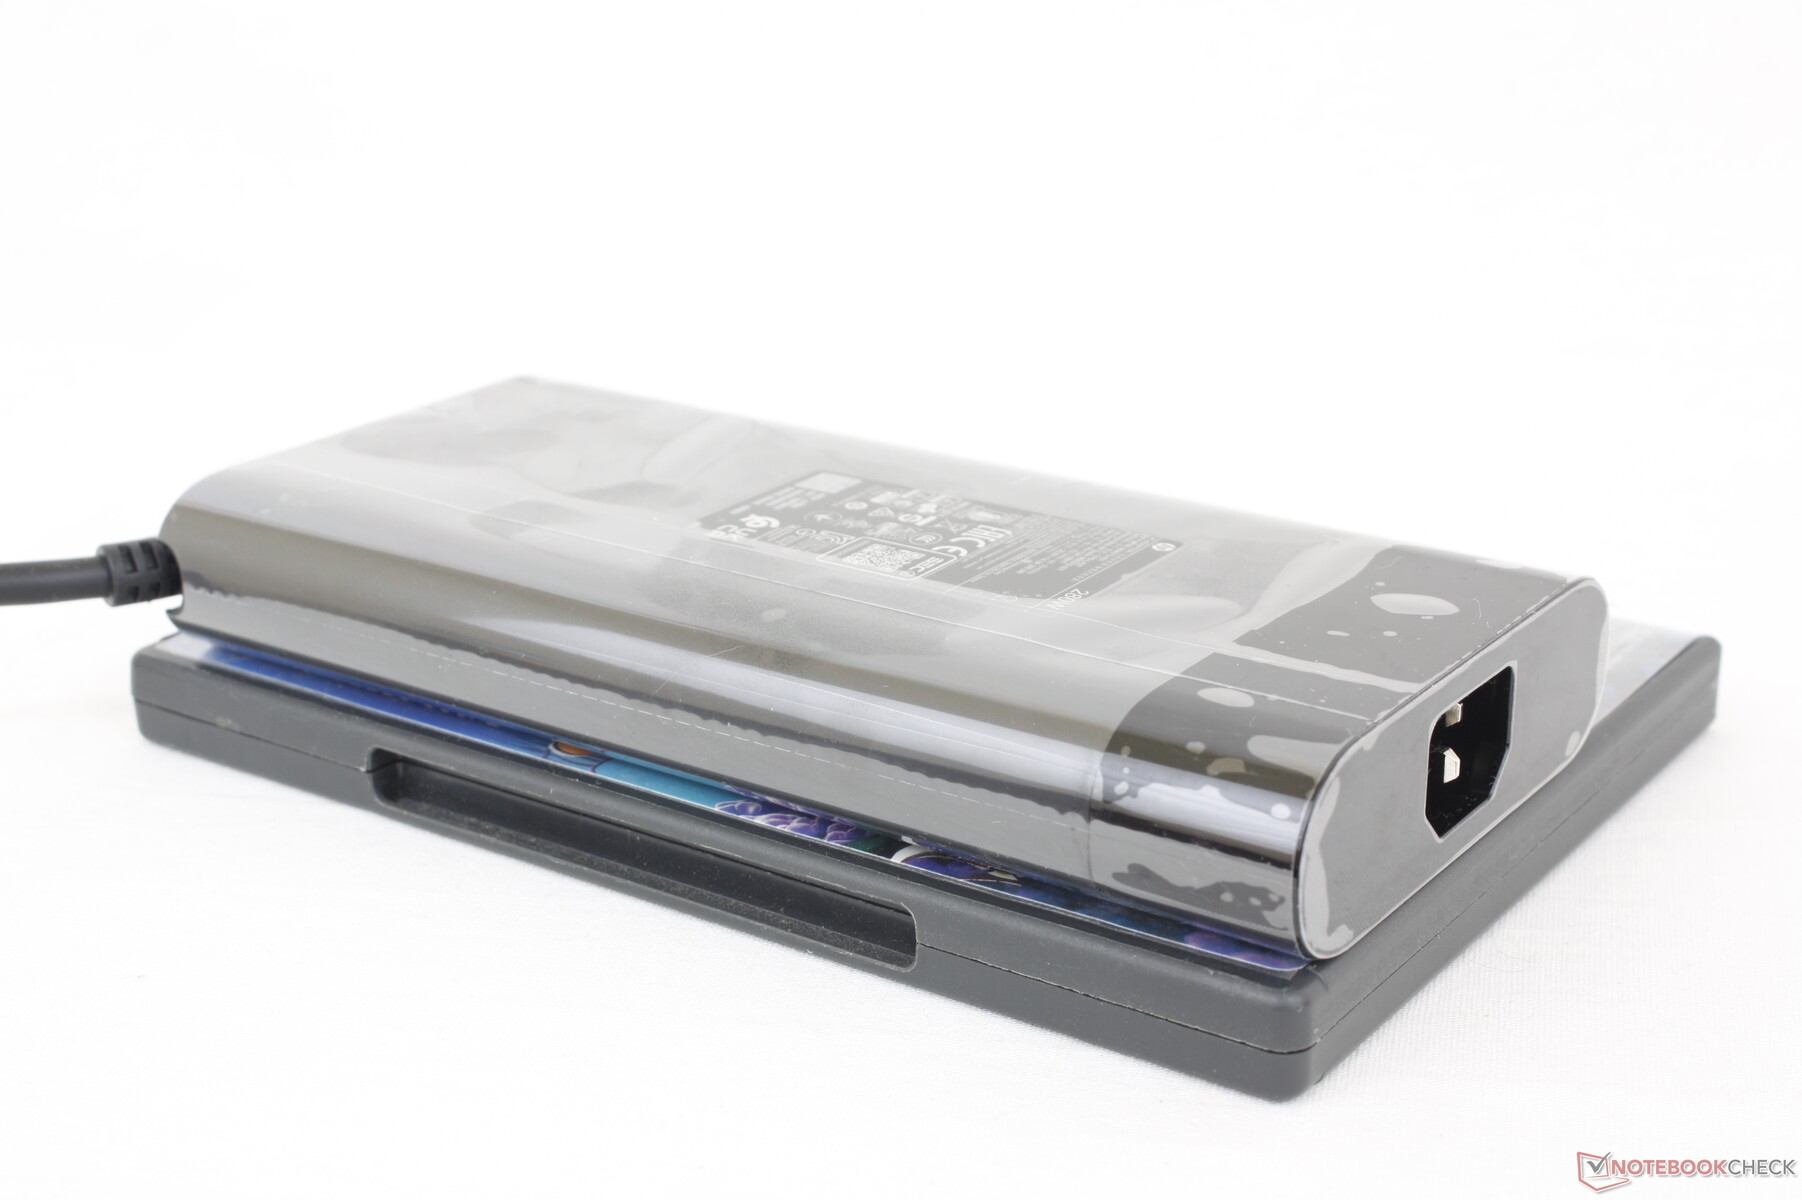
Siamo riusciti a registrare un consumo massimo temporaneo di 270 W dall'adattatore CA di medie dimensioni (~18 x 8,8 x 2,4 cm) da 280 W quando la CPU e la GPU sono utilizzate al 100%. Un adattatore CA più grande da 330 W sarebbe stato probabilmente eccessivo.
| Off / Standby | |
| Idle | |
| Sotto carico |
|
Leggenda:
min: | |
| HP Omen 16-wf000 i7-13700HX, GeForce RTX 4080 Laptop GPU, SK hynix PC801 HFS002TEJ9X101N, IPS, 2560x1440, 16.1" | HP Omen 16-n0033dx R7 6800H, Radeon RX 6650M, Samsung PM9A1 MZVL21T0HCLR, IPS, 1920x1080, 16.1" | Alienware x16 R1 i9-13900HK, GeForce RTX 4080 Laptop GPU, SK hynix PC801 HFS001TEJ9X101N, IPS, 2560x1600, 16" | Lenovo Legion Pro 7 RTX4090 i9-13900HX, GeForce RTX 4090 Laptop GPU, Samsung PM9A1 MZVL21T0HCLR, IPS, 2560x1600, 16" | Asus ROG Strix G16 G614JZ i9-13980HX, GeForce RTX 4080 Laptop GPU, WD PC SN560 SDDPNQE-1T00, IPS, 2560x1600, 16" | Razer Blade 16 Early 2023 i9-13950HX, GeForce RTX 4080 Laptop GPU, SSSTC CA6-8D1024, IPS, 2560x1600, 16" | |
|---|---|---|---|---|---|---|
| Power Consumption | 34% | -17% | -9% | 11% | -3% | |
| Idle Minimum * (Watt) | 21.8 | 7.9 64% | 25.2 -16% | 20 8% | 10 54% | 15.2 30% |
| Idle Average * (Watt) | 26 | 11.5 56% | 29.9 -15% | 25 4% | 16 38% | 22.8 12% |
| Idle Maximum * (Watt) | 36 | 18.3 49% | 49.8 -38% | 35 3% | 27 25% | 49.8 -38% |
| Load Average * (Watt) | 115.5 | 88.1 24% | 105.4 9% | 136 -18% | 129 -12% | 121.2 -5% |
| Witcher 3 ultra * (Watt) | 214 | 206 4% | 263 -23% | 282 -32% | 247 -15% | 242 -13% |
| Load Maximum * (Watt) | 269.7 | 246.4 9% | 313.8 -16% | 320 -19% | 342 -27% | 273.7 -1% |
* ... Meglio usare valori piccoli
Power Consumption Witcher 3 / Stresstest
Power Consumption external Monitor
Durata della batteria
La capacità della batteria è aumentata a 83 Wh rispetto ai 68 Wh del modello dello scorso anno. Sfortunatamente, la durata della batteria è inferiore rispetto al passato di quasi 2 ore piene. Siamo riusciti a registrare un'autonomia WLAN di poco superiore alle 5 ore, simile a quella del Legion Pro 7 anche con il profilo di alimentazione bilanciato e l'iGPU attiva.
La ricarica da vuoto a pieno regime richiede circa 90 minuti con l'adattatore CA in dotazione. Il sistema può essere caricato anche tramite USB-C, ma la compatibilità non è garantita. Ad esempio, collegando il nostro adattatore Dell USB-C da 130 W si è verificato un messaggio di incompatibilità, mentre il nostro adattatore Lenovo USB-C da 135 W si è caricato senza problemi.
| HP Omen 16-wf000 i7-13700HX, GeForce RTX 4080 Laptop GPU, 83 Wh | HP Omen 16-n0033dx R7 6800H, Radeon RX 6650M, 68 Wh | Alienware x16 R1 i9-13900HK, GeForce RTX 4080 Laptop GPU, 90 Wh | Lenovo Legion Pro 7 RTX4090 i9-13900HX, GeForce RTX 4090 Laptop GPU, 99.9 Wh | Asus ROG Strix G16 G614JZ i9-13980HX, GeForce RTX 4080 Laptop GPU, 90 Wh | Razer Blade 16 Early 2023 i9-13950HX, GeForce RTX 4080 Laptop GPU, 95.2 Wh | |
|---|---|---|---|---|---|---|
| Autonomia della batteria | 40% | -18% | 0% | 45% | 36% | |
| Reader / Idle (h) | 5.5 | 10 82% | 7.3 33% | 8.9 62% | ||
| WiFi v1.3 (h) | 5.1 | 7 37% | 2.5 -51% | 5.1 0% | 9.7 90% | 6.1 20% |
| Load (h) | 1.1 | 1.1 0% | 0.7 -36% | 1.1 0% | 1.4 27% |
Pro
Contro
Verdetto - Bassa barriera all'ingresso per un design sottile e accattivante
Forse l'aspetto più redditizio del 2023 Omen 16 è il suo prezzo di partenza accessibile di 1100 dollari per la configurazione con Core i7-13700HX, RTX 4060 e 16 GB di RAM. Si tratta di uno chassis di fascia media superiore con una qualità costruttiva migliore e un design più elegante rispetto a portatili da gioco economici di prezzo simile come l' MSI Katana, Dell G16o la Asus TUF F. Se siete alla ricerca di un portatile RTX 4060 senza dovervi accontentare di materiali plastici economici, allora vale la pena prendere in considerazione l'Omen 16. Il nuovo modello è leggermente più spesso del precedente e con una durata della batteria inferiore.
Il nuovo modello è leggermente più spesso e più largo del suo predecessore e ha anche una durata della batteria più breve, ma i cambiamenti valgono probabilmente le prestazioni della CPU e della GPU molto più veloci. Il peso rimane più o meno lo stesso nonostante le differenze di dimensioni e la maggior parte dei giocatori potrebbe non essere preoccupata per i tempi di esecuzione più brevi.
L'Omen 16 2023 ha un aspetto e delle prestazioni migliori di quanto il suo basso prezzo di partenza possa far pensare.
Due caratteristiche degne di nota che mancano all'Omen 16 sono il supporto DCI-P3 e un lettore di schede SD integrato. Queste non influiscono sull'esperienza di gioco principale del sistema, ma i giocatori che sono anche creatori di contenuti potrebbero voler prendere in considerazione l'Alienware x16 R1.Alienware x16 R1 o Razer Blade 16 che offrono lettori di schede, colori più ampi e risoluzioni native più elevate. Naturalmente, queste alternative a doppio uso sono anche notevolmente più costose.
Prezzo e disponibilità
L'Omen 16 2023 è ora in vendita direttamente da HP a partire da 1100 dollari per la configurazione RTX 4060 di base fino a 2600 dollari per la nostra configurazione RTX 4080 come da recensione.
HP Omen 16-wf000
- 09/13/2023 v7 (old)
Allen Ngo
Transparency
La selezione dei dispositivi da recensire viene effettuata dalla nostra redazione. Il campione di prova è stato fornito all'autore come prestito dal produttore o dal rivenditore ai fini di questa recensione. L'istituto di credito non ha avuto alcuna influenza su questa recensione, né il produttore ne ha ricevuto una copia prima della pubblicazione. Non vi era alcun obbligo di pubblicare questa recensione. In quanto società mediatica indipendente, Notebookcheck non è soggetta all'autorità di produttori, rivenditori o editori.
Ecco come Notebookcheck esegue i test
Ogni anno, Notebookcheck esamina in modo indipendente centinaia di laptop e smartphone utilizzando procedure standardizzate per garantire che tutti i risultati siano comparabili. Da circa 20 anni sviluppiamo continuamente i nostri metodi di prova e nel frattempo stabiliamo gli standard di settore. Nei nostri laboratori di prova, tecnici ed editori esperti utilizzano apparecchiature di misurazione di alta qualità. Questi test comportano un processo di validazione in più fasi. Il nostro complesso sistema di valutazione si basa su centinaia di misurazioni e parametri di riferimento ben fondati, che mantengono l'obiettività.Price comparison

