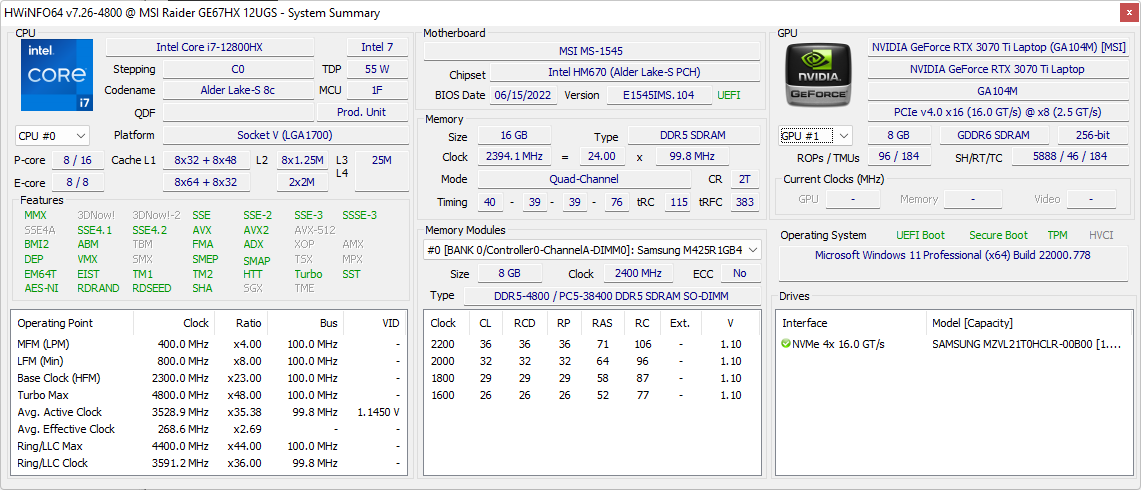
Recensione del portatile MSI Raider GE67 HX 12UGS: il processore Intel Core i7-12800HX è pazzesco
MSI GE67 è una serie da gioco di fascia alta che si colloca al di sopra delle meno costose serie Katana GF o Vector GP, ma al di sotto della serie enthusiast Titan GT. La nostra unità di test GE67 è il diretto successore della GE66 del 2020. Invece di essere fornito con CPU Intel Comet Lake-H di 10a generazione e GPU Nvidia GeForce Super, il GE67 è dotato di CPU Alder Lake-H di 12a generazione e GPU mobile GeForce Ti
Consigliamo di controllare i nostri esistenti due recensioni sul GE66, poiché il GE67 utilizza per lo più lo stesso design e le stesse caratteristiche dello chassis. Ci sono tuttavia alcune differenze visive relativamente minori che illustreremo in dettaglio nella nostra recensione
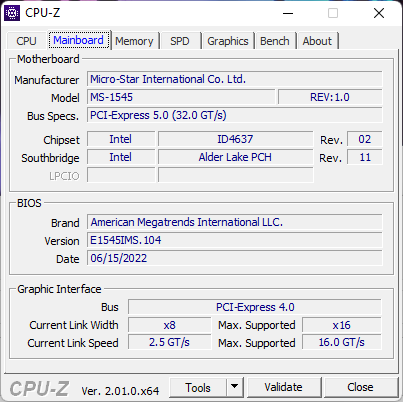
La nostra unità di prova è dotata di CPU Core i7-12800HX a 16 core, GPU RTX 3070 Ti di GeForce e pannello OLED QHD a 240 Hz con copertura DCI-P3 completa per un prezzo al dettaglio di circa 2500 dollari. Tra i concorrenti diretti in questo spazio ci sono altri portatili da gioco da 15,6 pollici di fascia alta come l' Asus ROG Strix Scar 15, Razer Blade 15oAlienware m15 R6.
Altre recensioni di MSI:
Potenziali concorrenti a confronto
Punteggio | Data | Modello | Peso | Altezza | Dimensione | Risoluzione | Prezzo |
|---|---|---|---|---|---|---|---|
| 87.7 % v7 (old) | 07/2022 | MSI GE67 HX 12UGS i7-12800HX, GeForce RTX 3070 Ti Laptop GPU | 2.5 kg | 23.4 mm | 15.60" | 1920x1080 | |
| 87.4 % v7 (old) | 06/2022 | MSI Raider GE66 12UHS i9-12900HK, GeForce RTX 3080 Ti Laptop GPU | 2.4 kg | 23.4 mm | 15.60" | 3840x2160 | |
| 86.9 % v7 (old) | 03/2022 | MSI Vector GP66 12UGS i9-12900H, GeForce RTX 3070 Ti Laptop GPU | 2.3 kg | 23.4 mm | 15.60" | 1920x1080 | |
| 86.3 % v7 (old) | 06/2022 | Asus ROG Strix Scar 15 G533ZW-LN106WS i9-12900H, GeForce RTX 3070 Ti Laptop GPU | 2.3 kg | 27.2 mm | 15.60" | 2560x1440 | |
| 86.1 % v7 (old) | 11/2021 | Alienware m15 R6, i7-11800H RTX 3080 i7-11800H, GeForce RTX 3080 Laptop GPU | 2.5 kg | 22.85 mm | 15.60" | 1920x1080 | |
| 89.1 % v7 (old) | 03/2022 | Razer Blade 15 2022 i7-12800H, GeForce RTX 3080 Ti Laptop GPU | 2.1 kg | 16.99 mm | 15.60" | 2560x1440 |
Caso: uguale sopra, diverso sotto
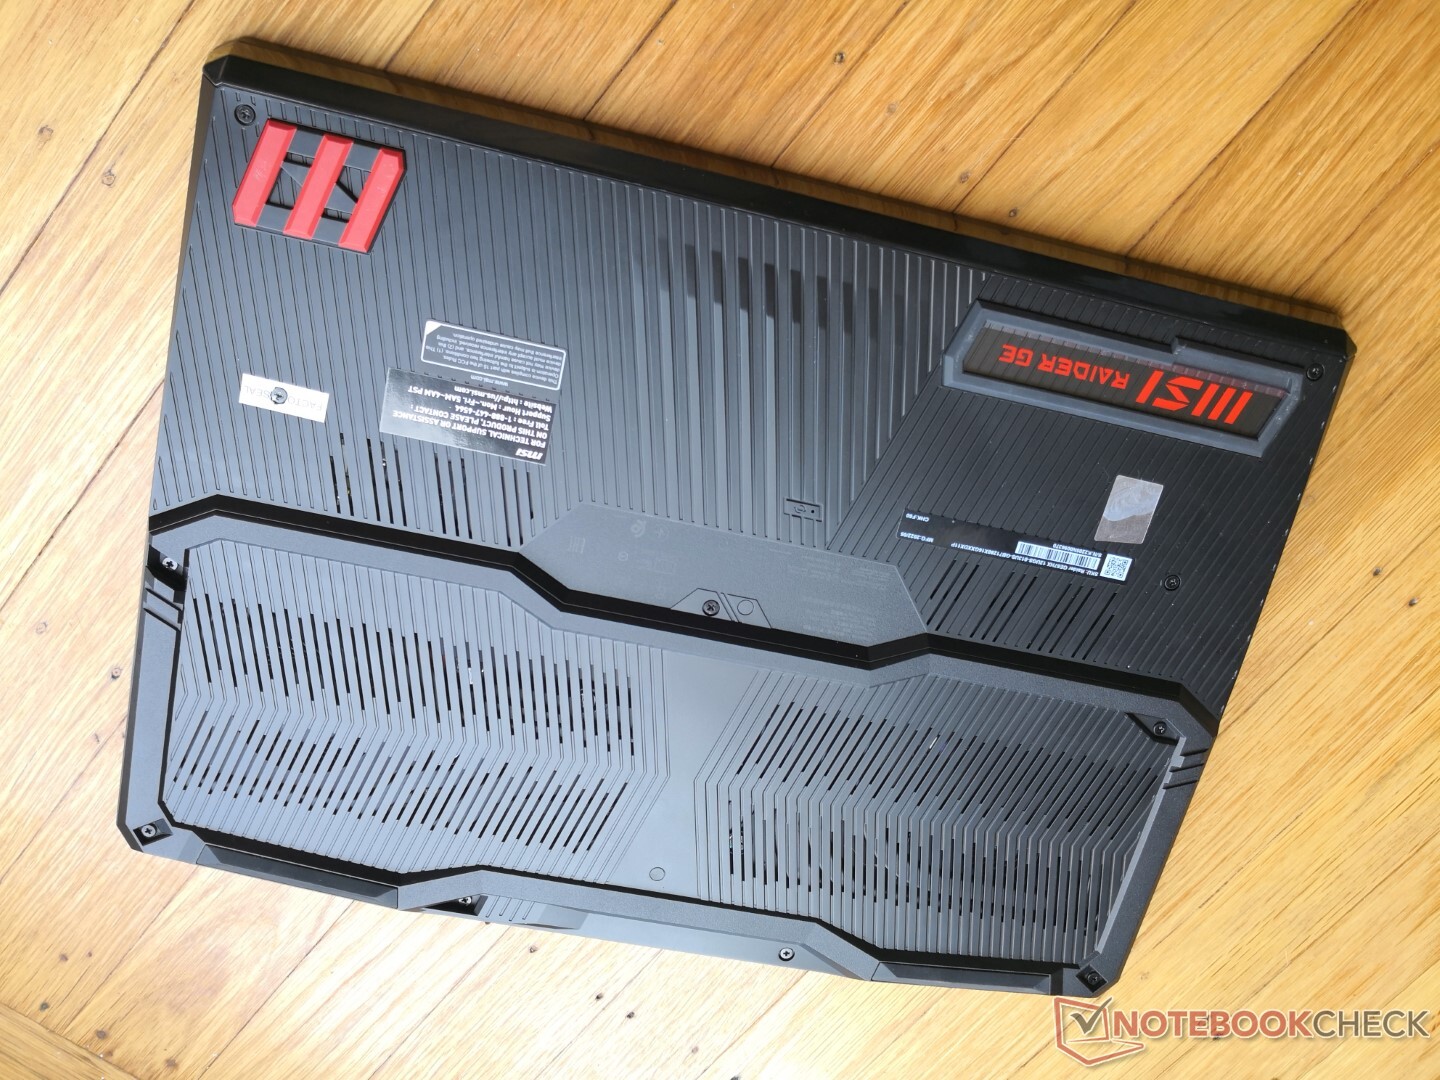
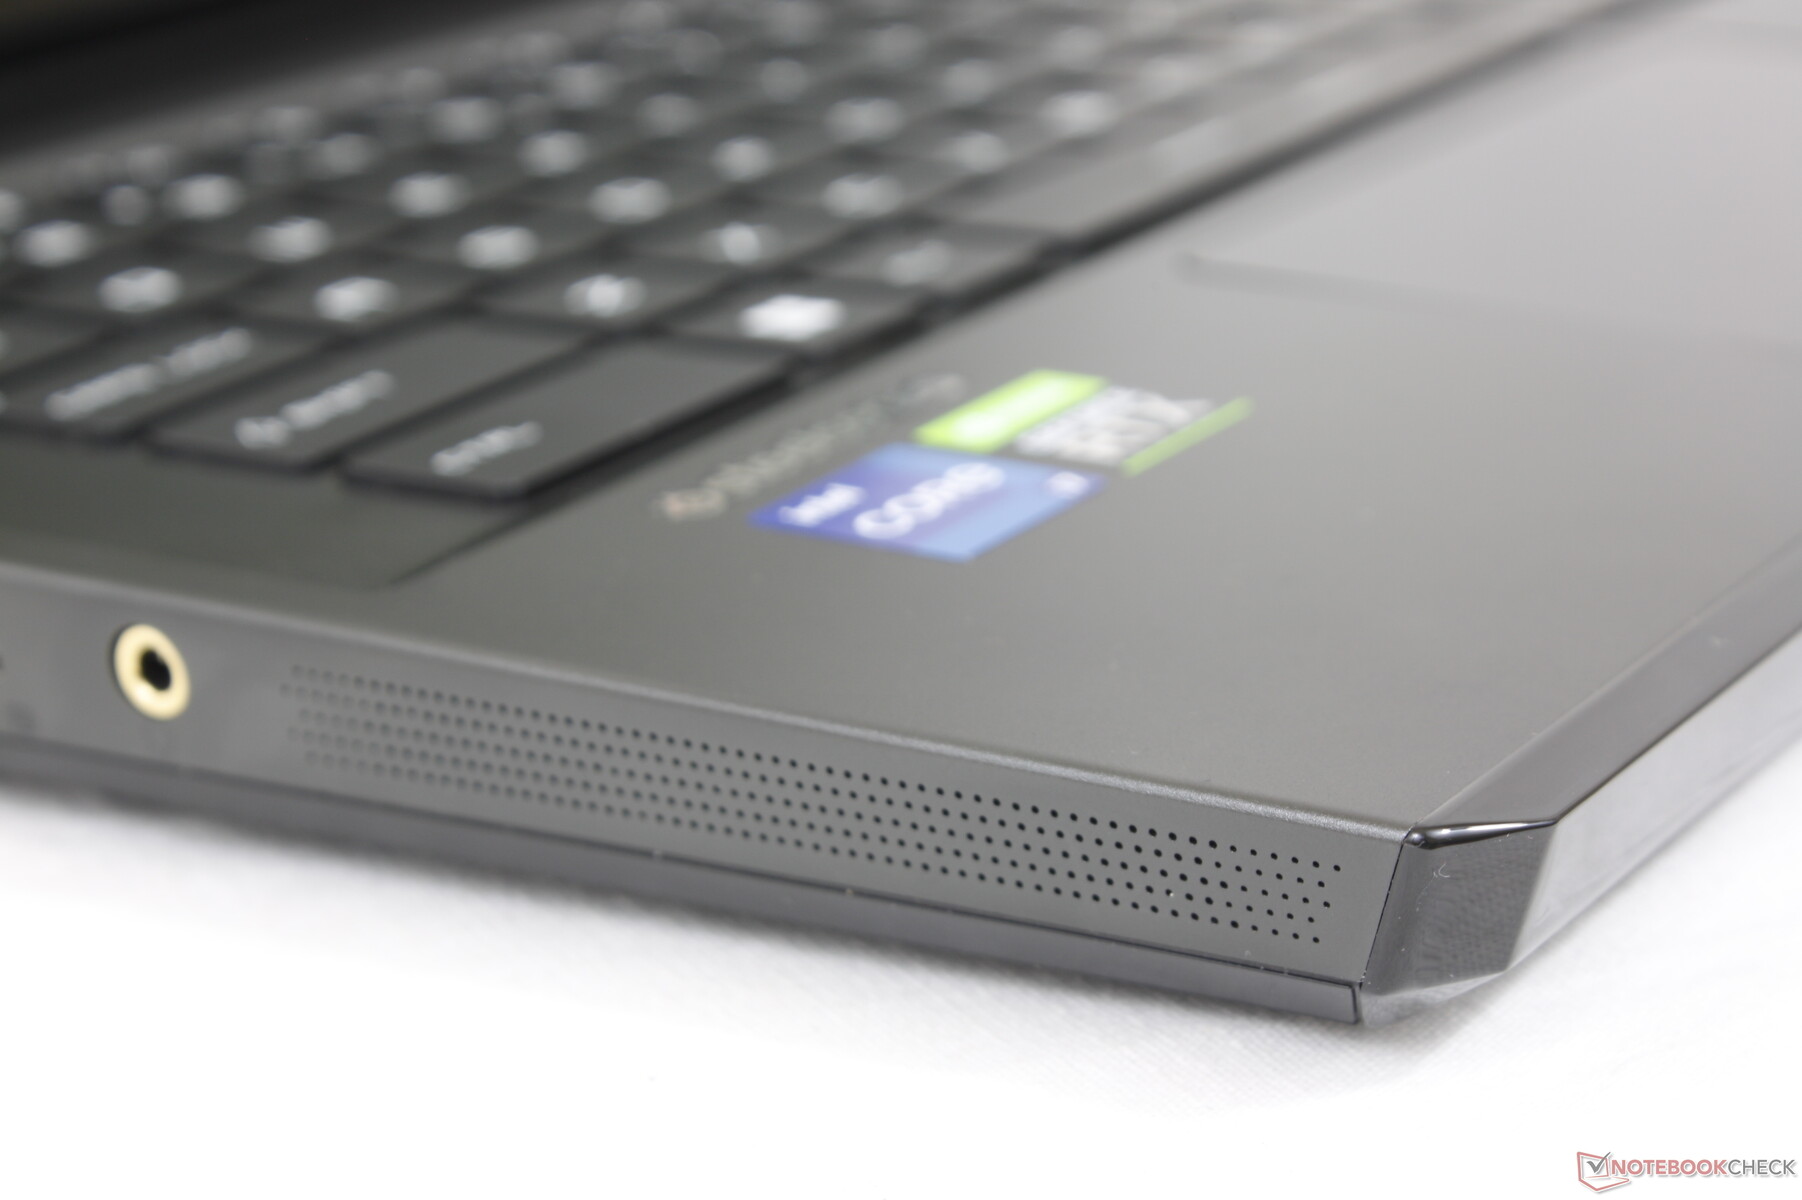
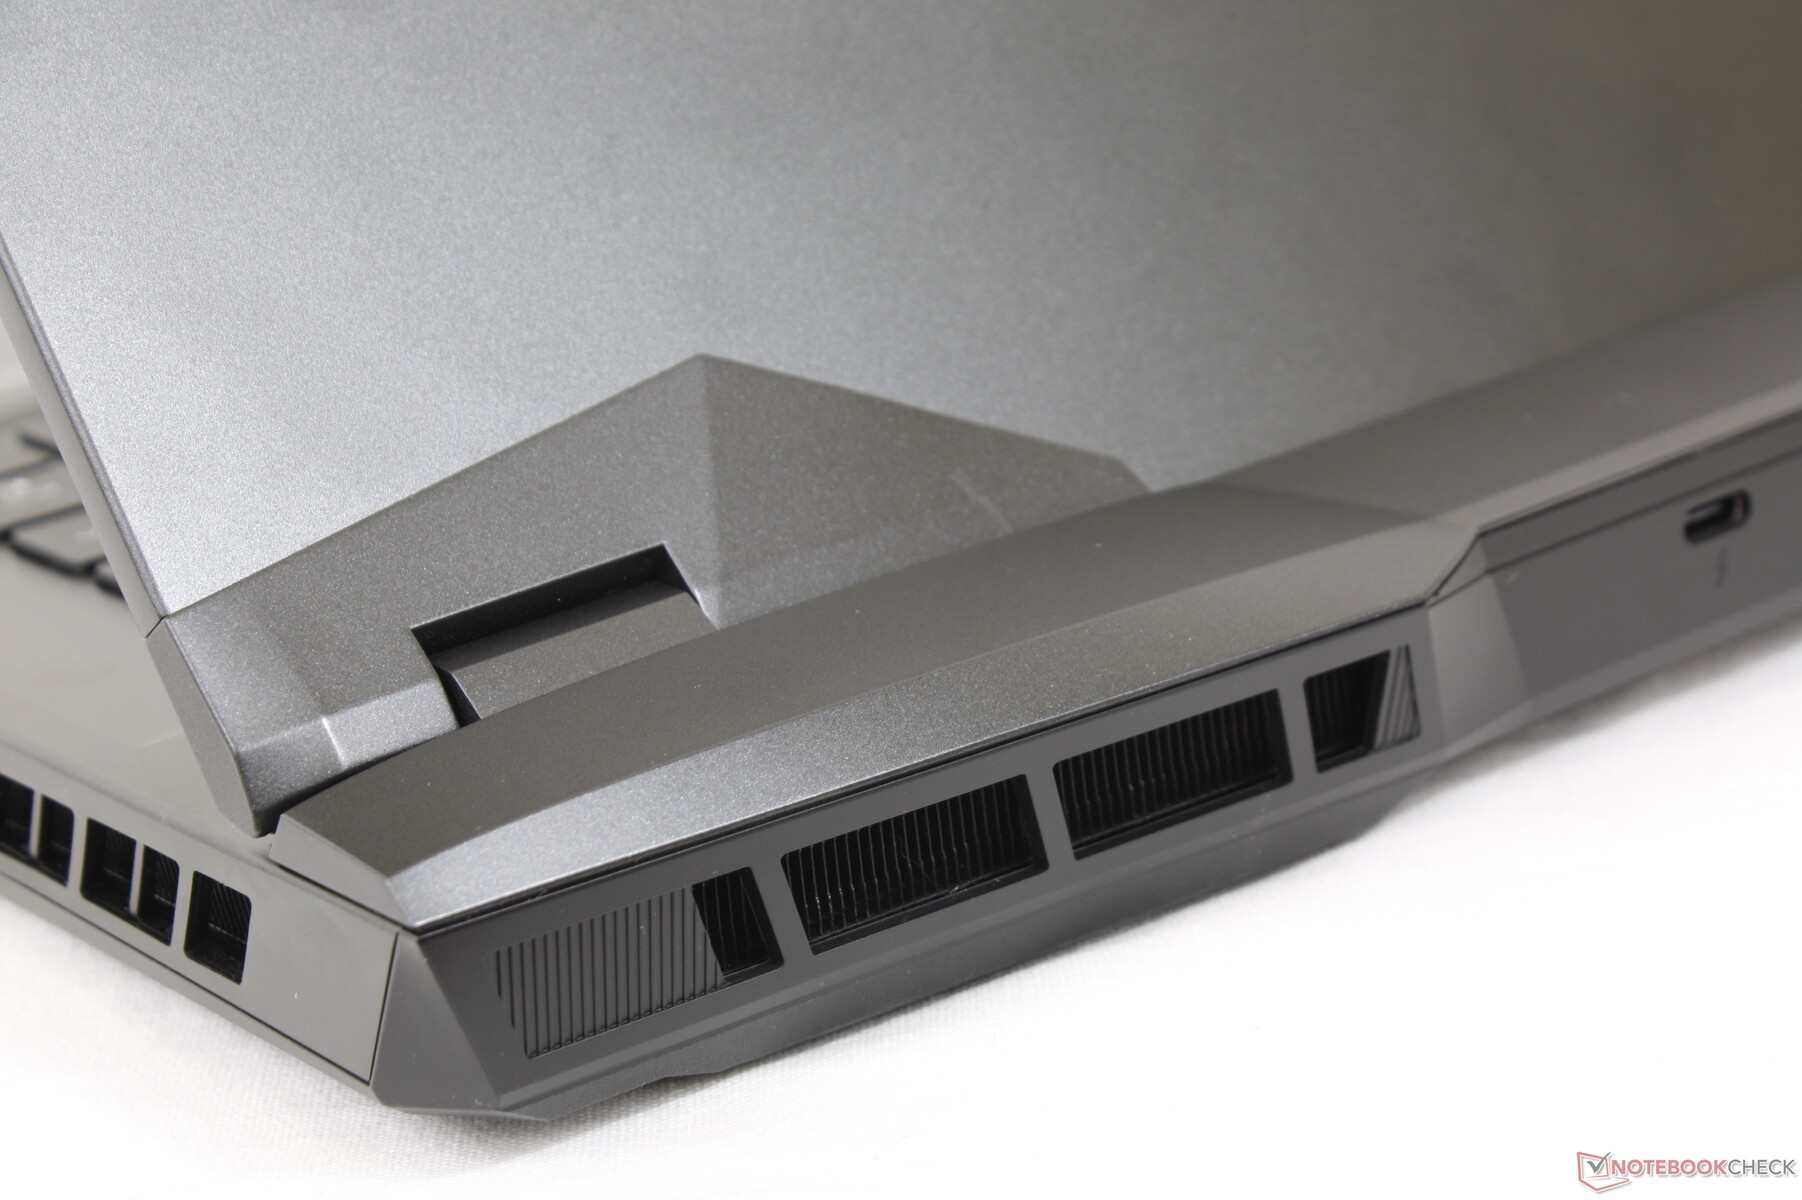
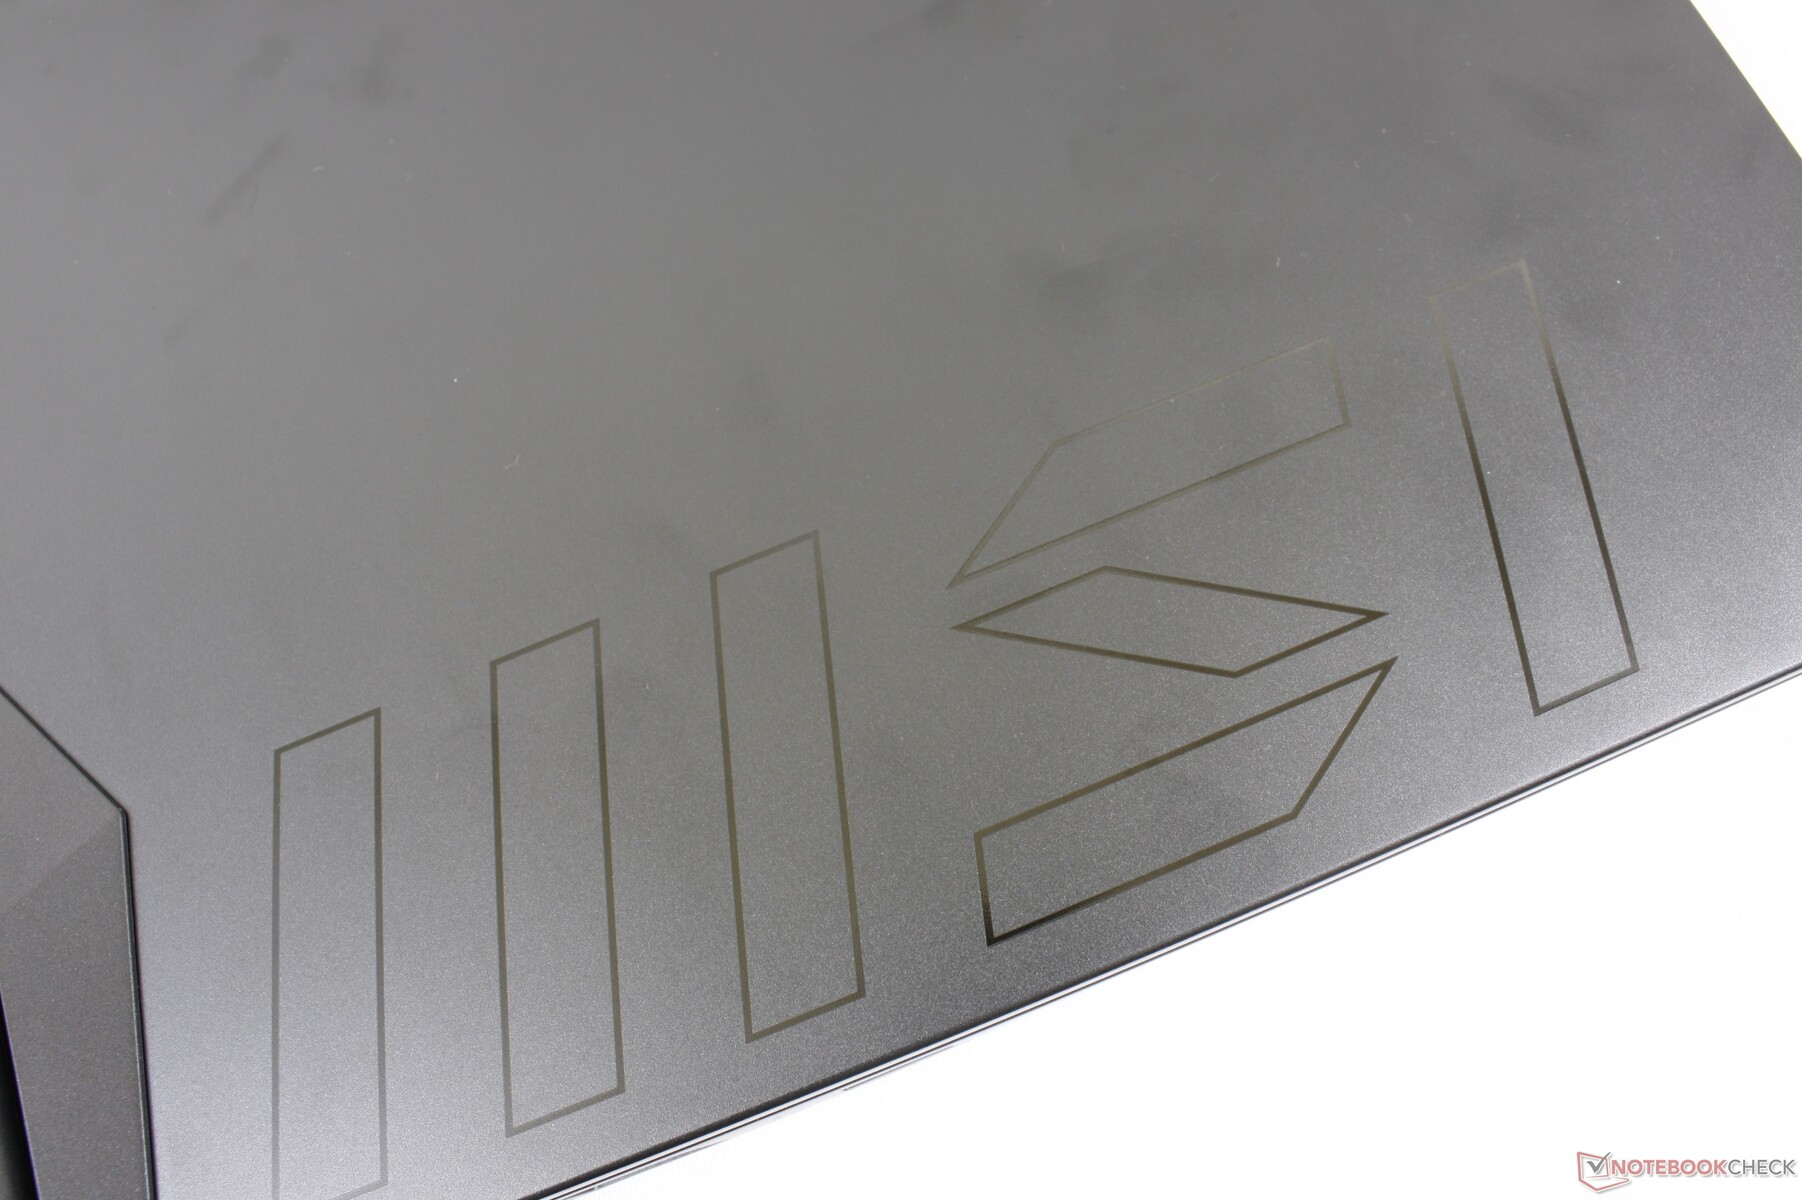
Mentre le dimensioni dello chassis sono esattamente le stesse del GE66, ci sono alcune differenze visive. In primo luogo, il GE67 presenta un grande logo MSI lungo il bordo sinistro del coperchio esterno che aiuta a distinguere più facilmente il GE66 dal GE67. In secondo luogo, MSI ha completamente ridisegnato il lato inferiore del GE67, probabilmente per migliorare il potenziale di raffreddamento complessivo del modello. Per il resto, sia il GE66 che il GE67 utilizzano materiali metallici simili per il coperchio e il piano tastiera e plastica per la piastra inferiore. La caratteristica barra LED lungo il bordo anteriore è rimasta intatta.
Il nuovo modello è leggermente più pesante del precedente di circa 100 g, probabilmente a causa delle modifiche minori.
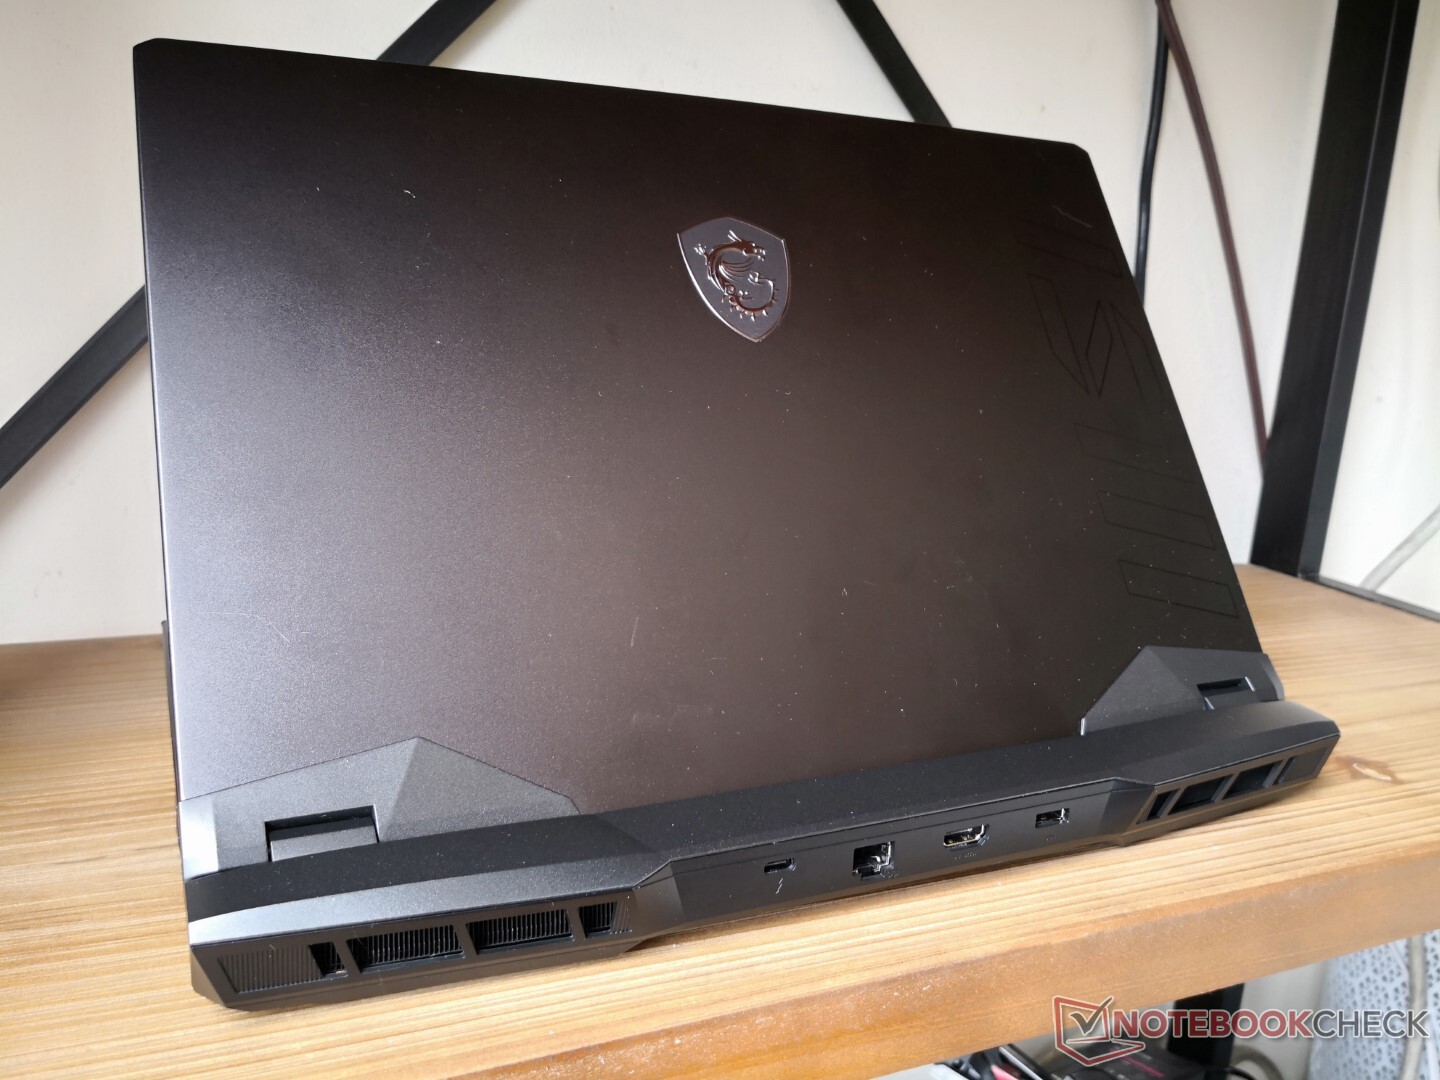
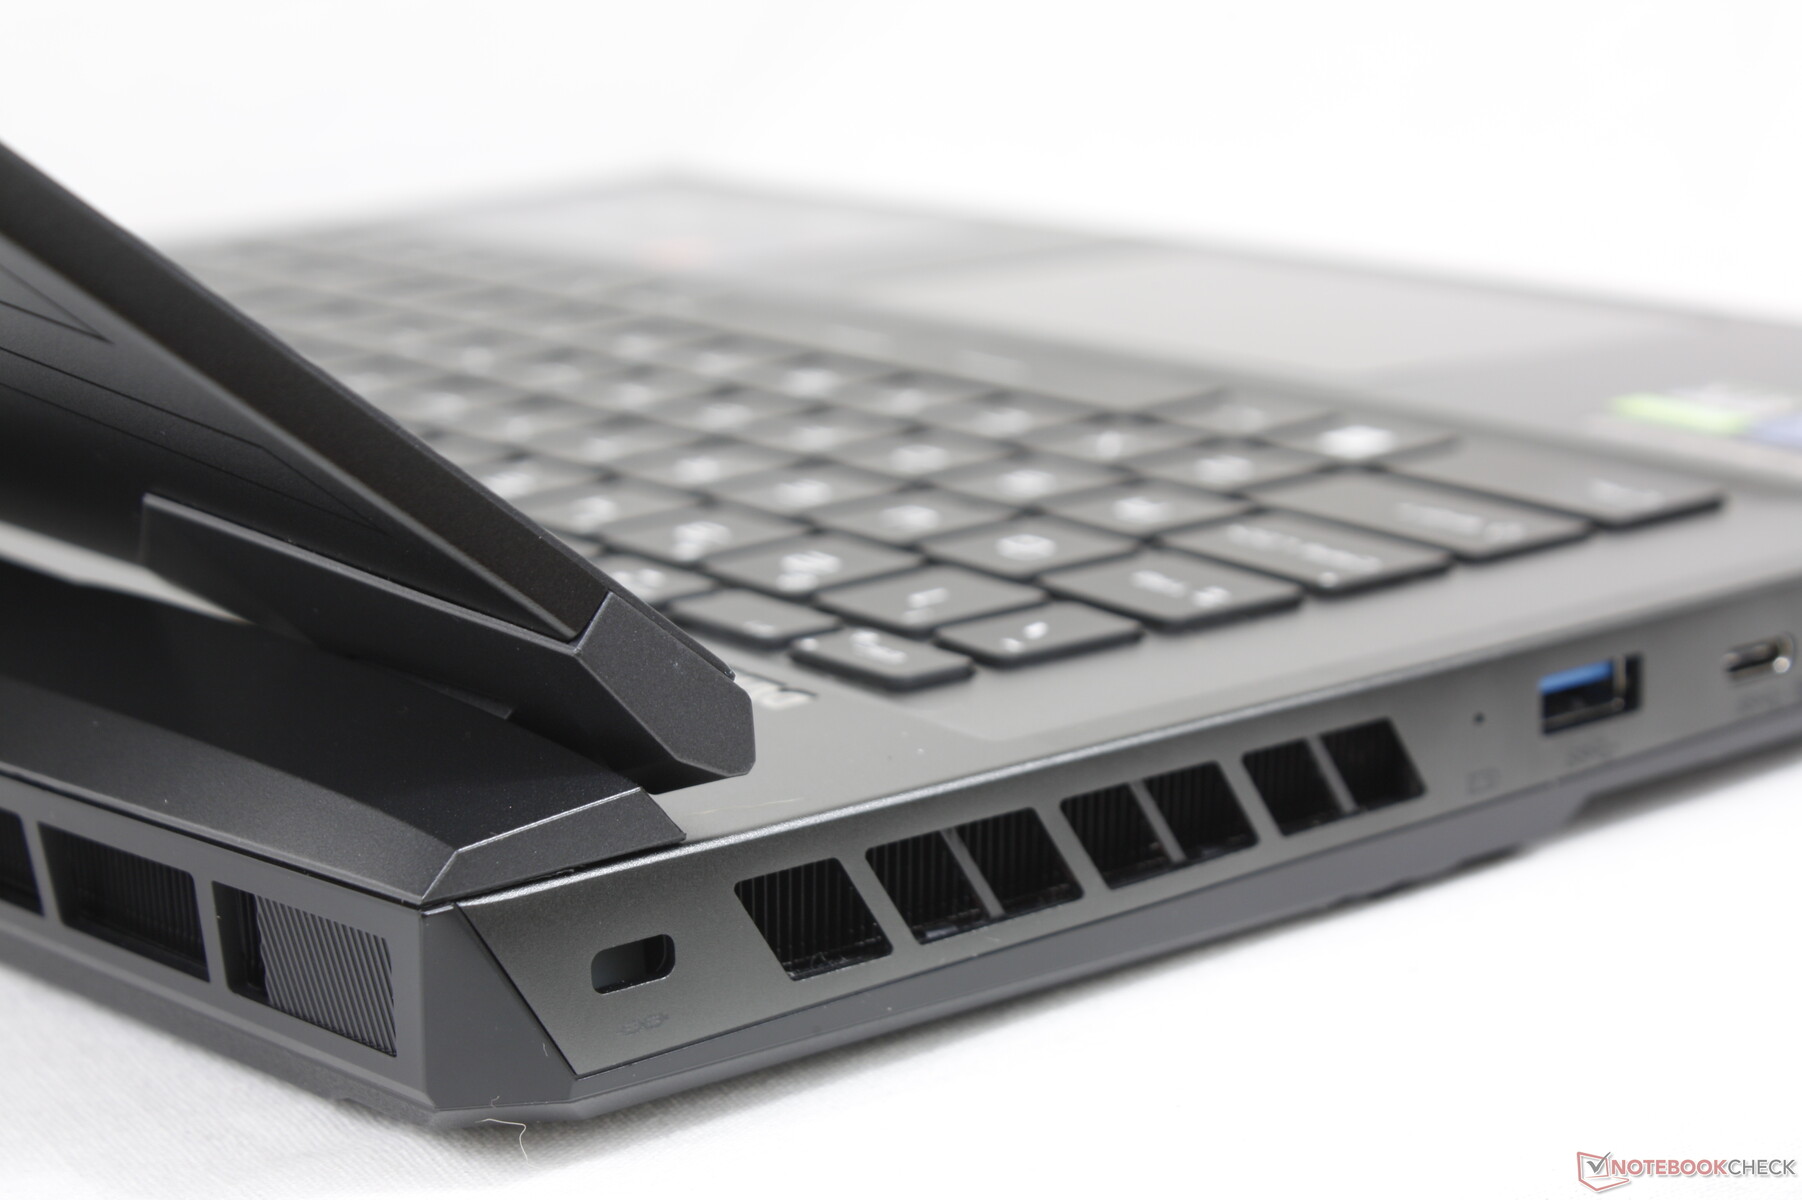
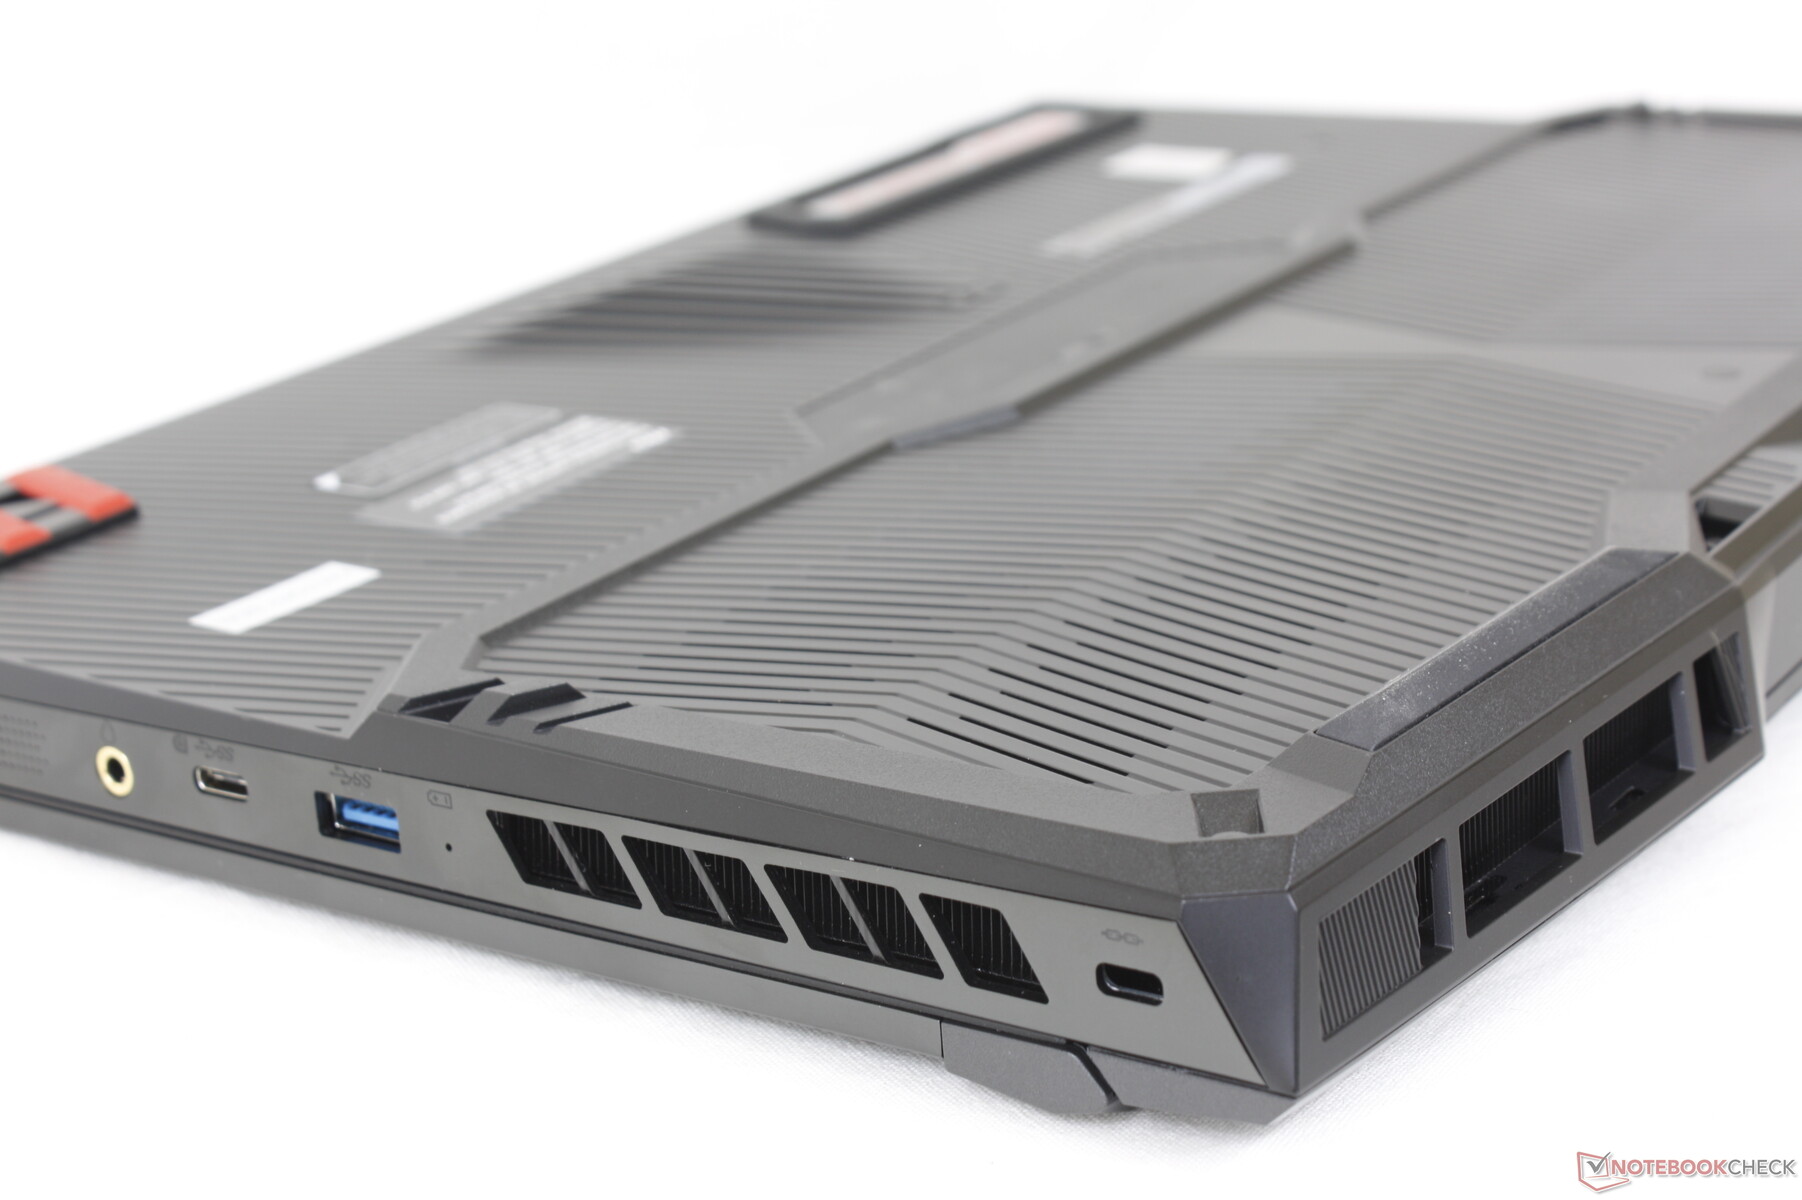
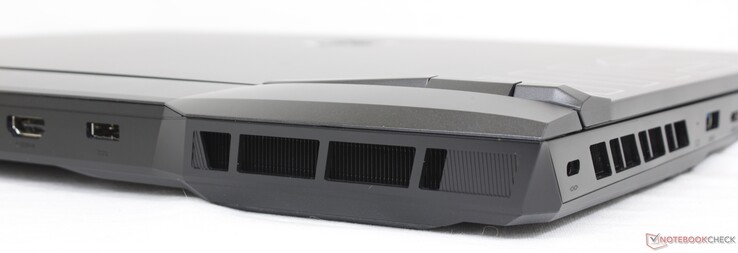
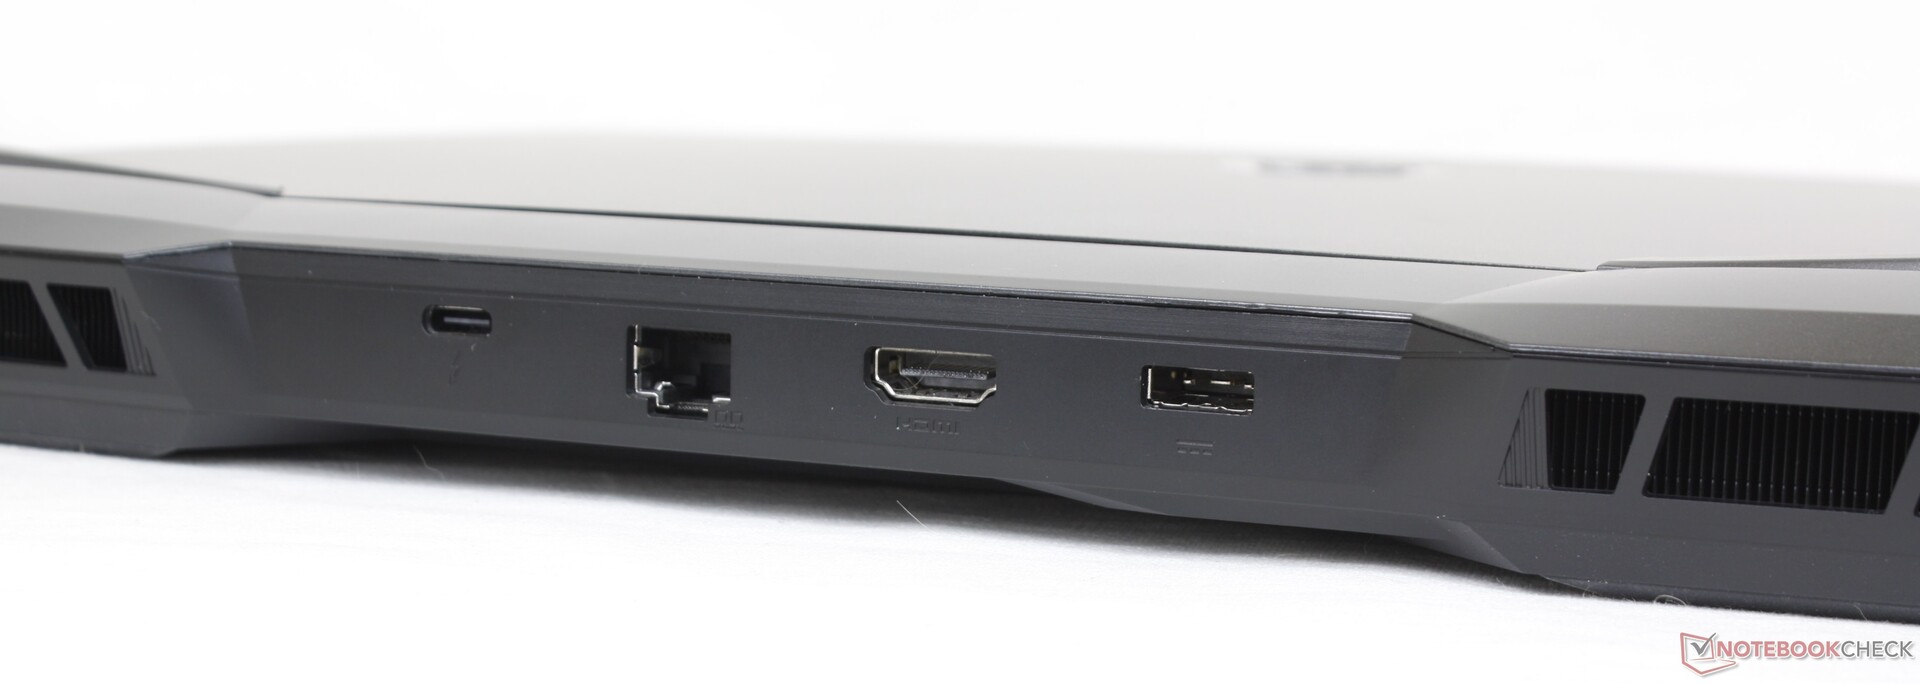
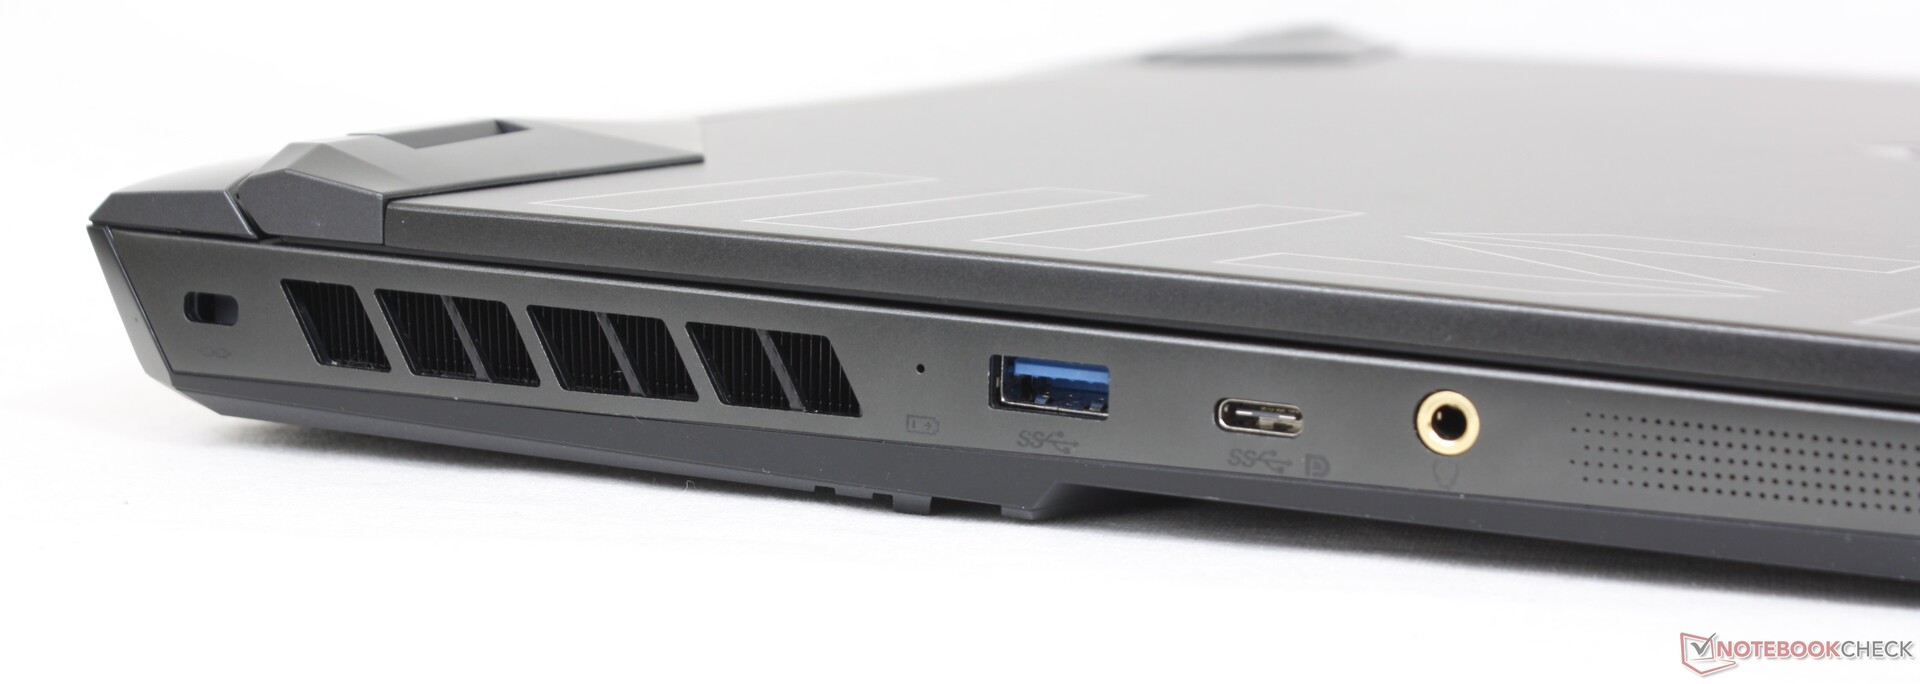
Connettività: niente più porta Mini-Display
Il GE67 ha abbandonato la porta mini-Display dedicata che era presente sul GE66. La porta DisplayPort è ancora supportata dalle due porte USB-C.
Come per altri portatili da gioco basati sulla piattaforma Alder-Lake-H, come l'Asus TUF Gaming F15 FX507ZM Asus TUF Gaming F15 FX507ZMla connettività Thunderbolt 4 sarà disabilitata se si utilizza la modalità grafica discreta.
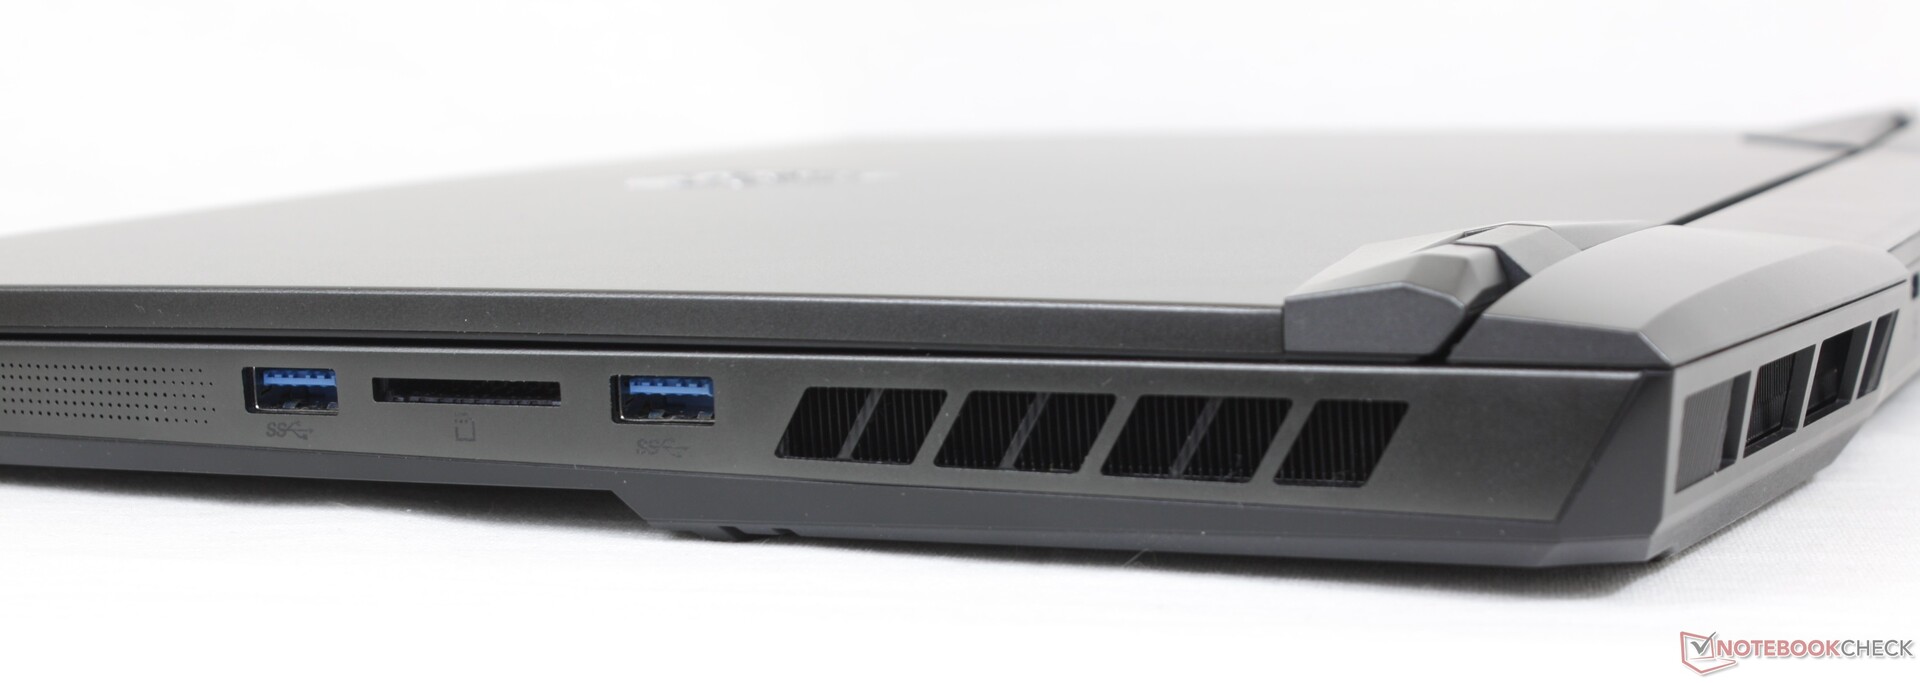
Lettore di schede SD
La velocità di trasferimento dal lettore di schede SD integrato è lenta rispetto al prezzo della configurazione. Gli utenti vedranno prestazioni del lettore SD due volte più veloci da modelli concorrenti come Razer Blade 15 o Asus ROG Zephyrus Duo 16.

| SD Card Reader | |
| average JPG Copy Test (av. of 3 runs) | |
| Razer Blade 15 2022 (Toshiba Exceria Pro SDXC 64 GB UHS-II) | |
| MSI GE67 HX 12UGS (Toshiba Exceria Pro SDXC 64 GB UHS-II) | |
| MSI Raider GE66 12UHS (AV PRO microSD 128 GB V60) | |
| maximum AS SSD Seq Read Test (1GB) | |
| Razer Blade 15 2022 (Toshiba Exceria Pro SDXC 64 GB UHS-II) | |
| MSI GE67 HX 12UGS (Toshiba Exceria Pro SDXC 64 GB UHS-II) | |
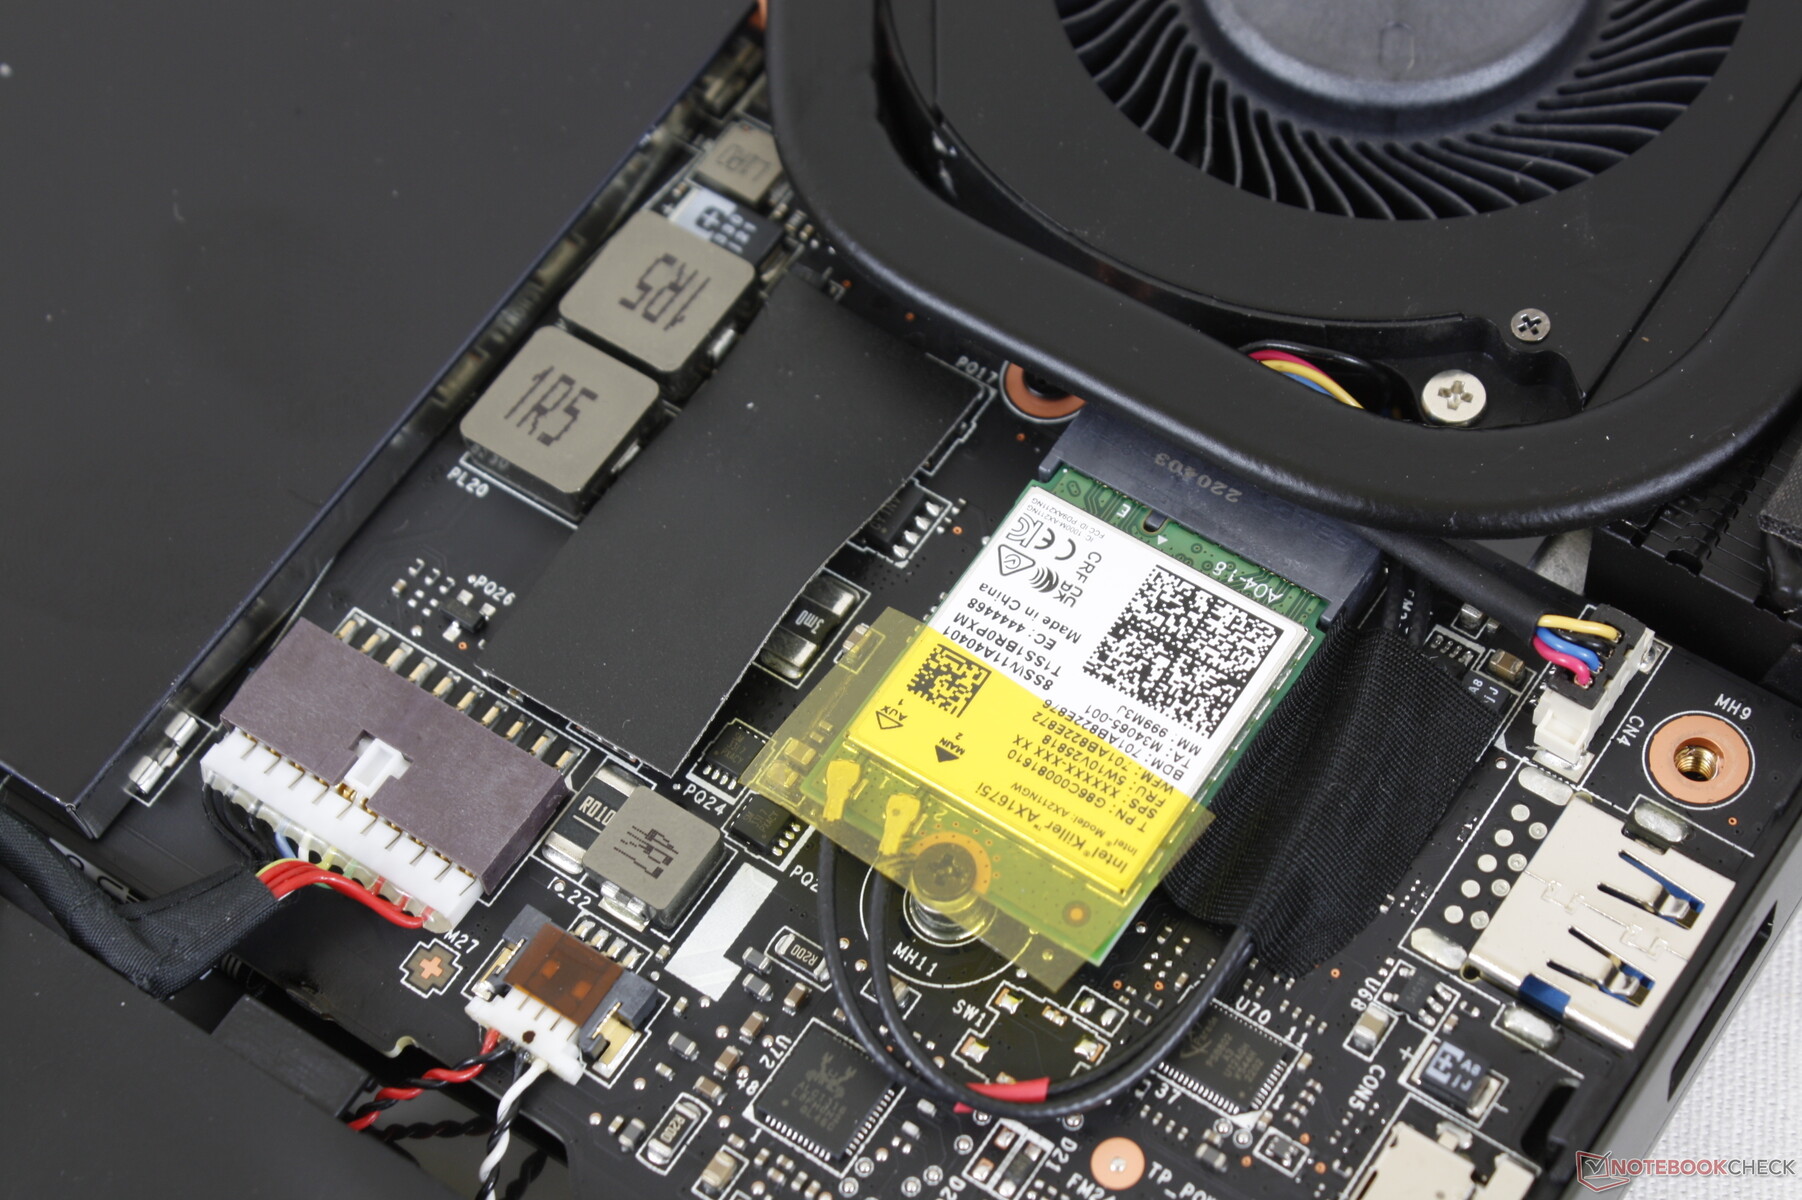
Comunicazione
| Networking | |
| iperf3 transmit AX12 | |
| Razer Blade 15 2022 | |
| MSI Vector GP66 12UGS | |
| Alienware m15 R6, i7-11800H RTX 3080 | |
| iperf3 receive AX12 | |
| Razer Blade 15 2022 | |
| MSI Vector GP66 12UGS | |
| Alienware m15 R6, i7-11800H RTX 3080 | |
| iperf3 receive AXE11000 6GHz | |
| Asus ROG Strix Scar 15 G533ZW-LN106WS | |
| MSI GE67 HX 12UGS | |
| iperf3 transmit AXE11000 6GHz | |
| Asus ROG Strix Scar 15 G533ZW-LN106WS | |
| MSI GE67 HX 12UGS | |
Webcam
Non ci sono modifiche alla webcam da 2 MP, il che significa che non c'è ancora un otturatore fisico per la privacy e nemmeno il supporto a Windows Hello. Gli utenti possono invece disattivare la webcam elettronicamente tramite il tasto F4.
Si noti che la spia di attività della webcam lampeggia sempre quando la webcam è attiva. Questo è particolarmente fastidioso durante le videochiamate e non troviamo alcuna opzione per spegnere la luce lampeggiante.


Manutenzione
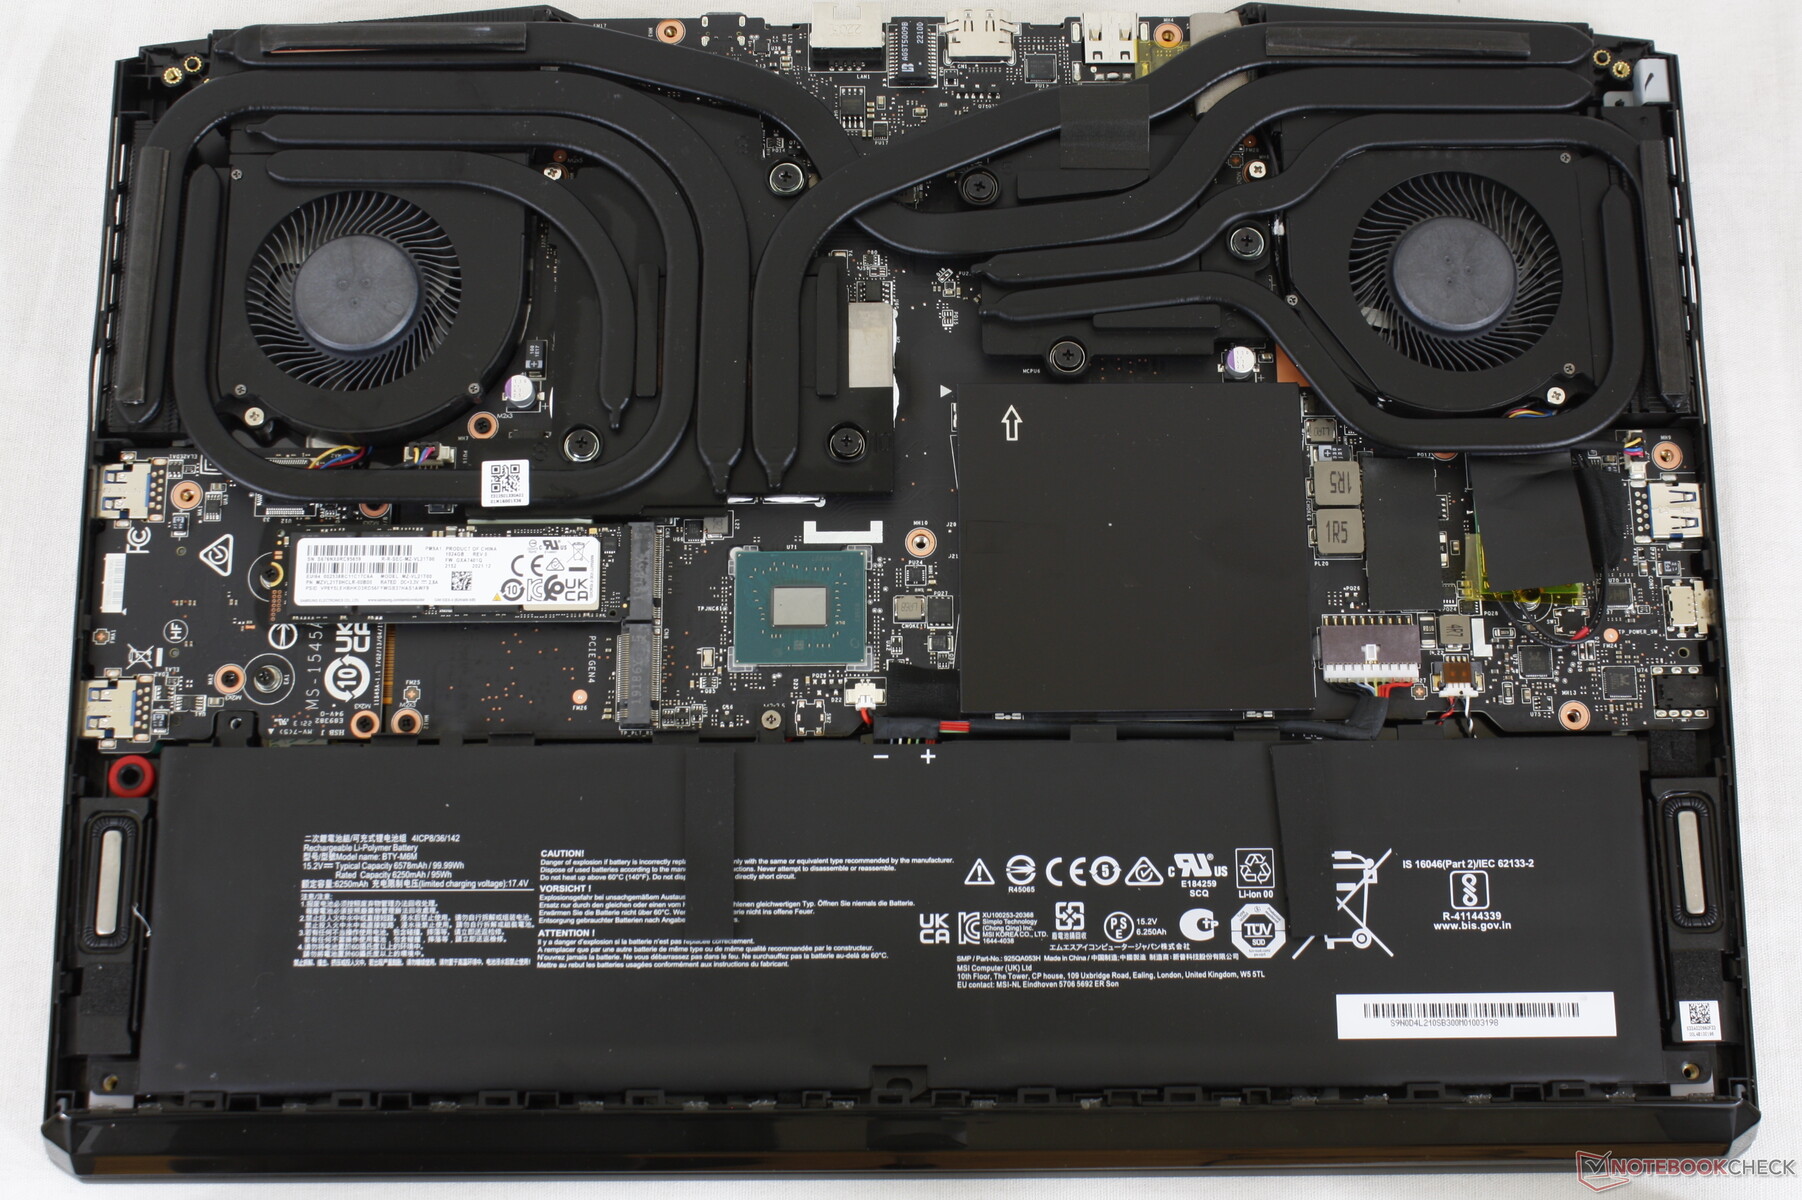
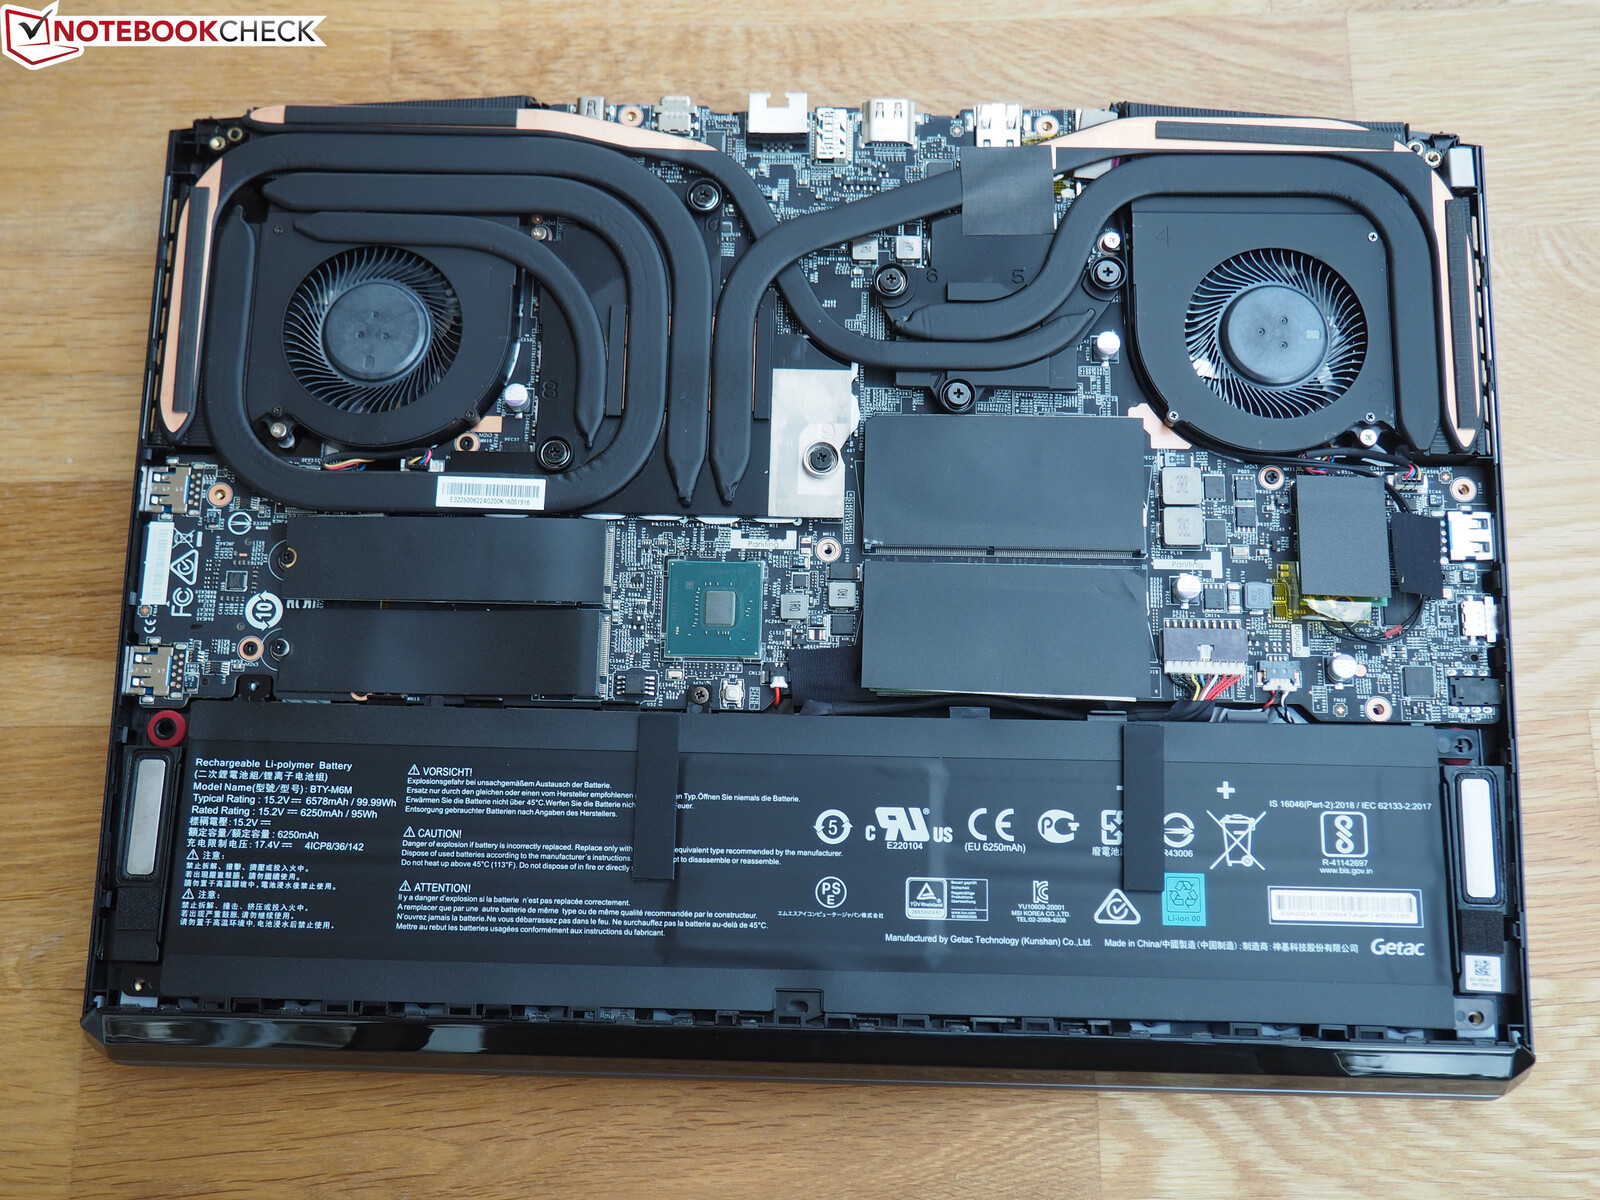
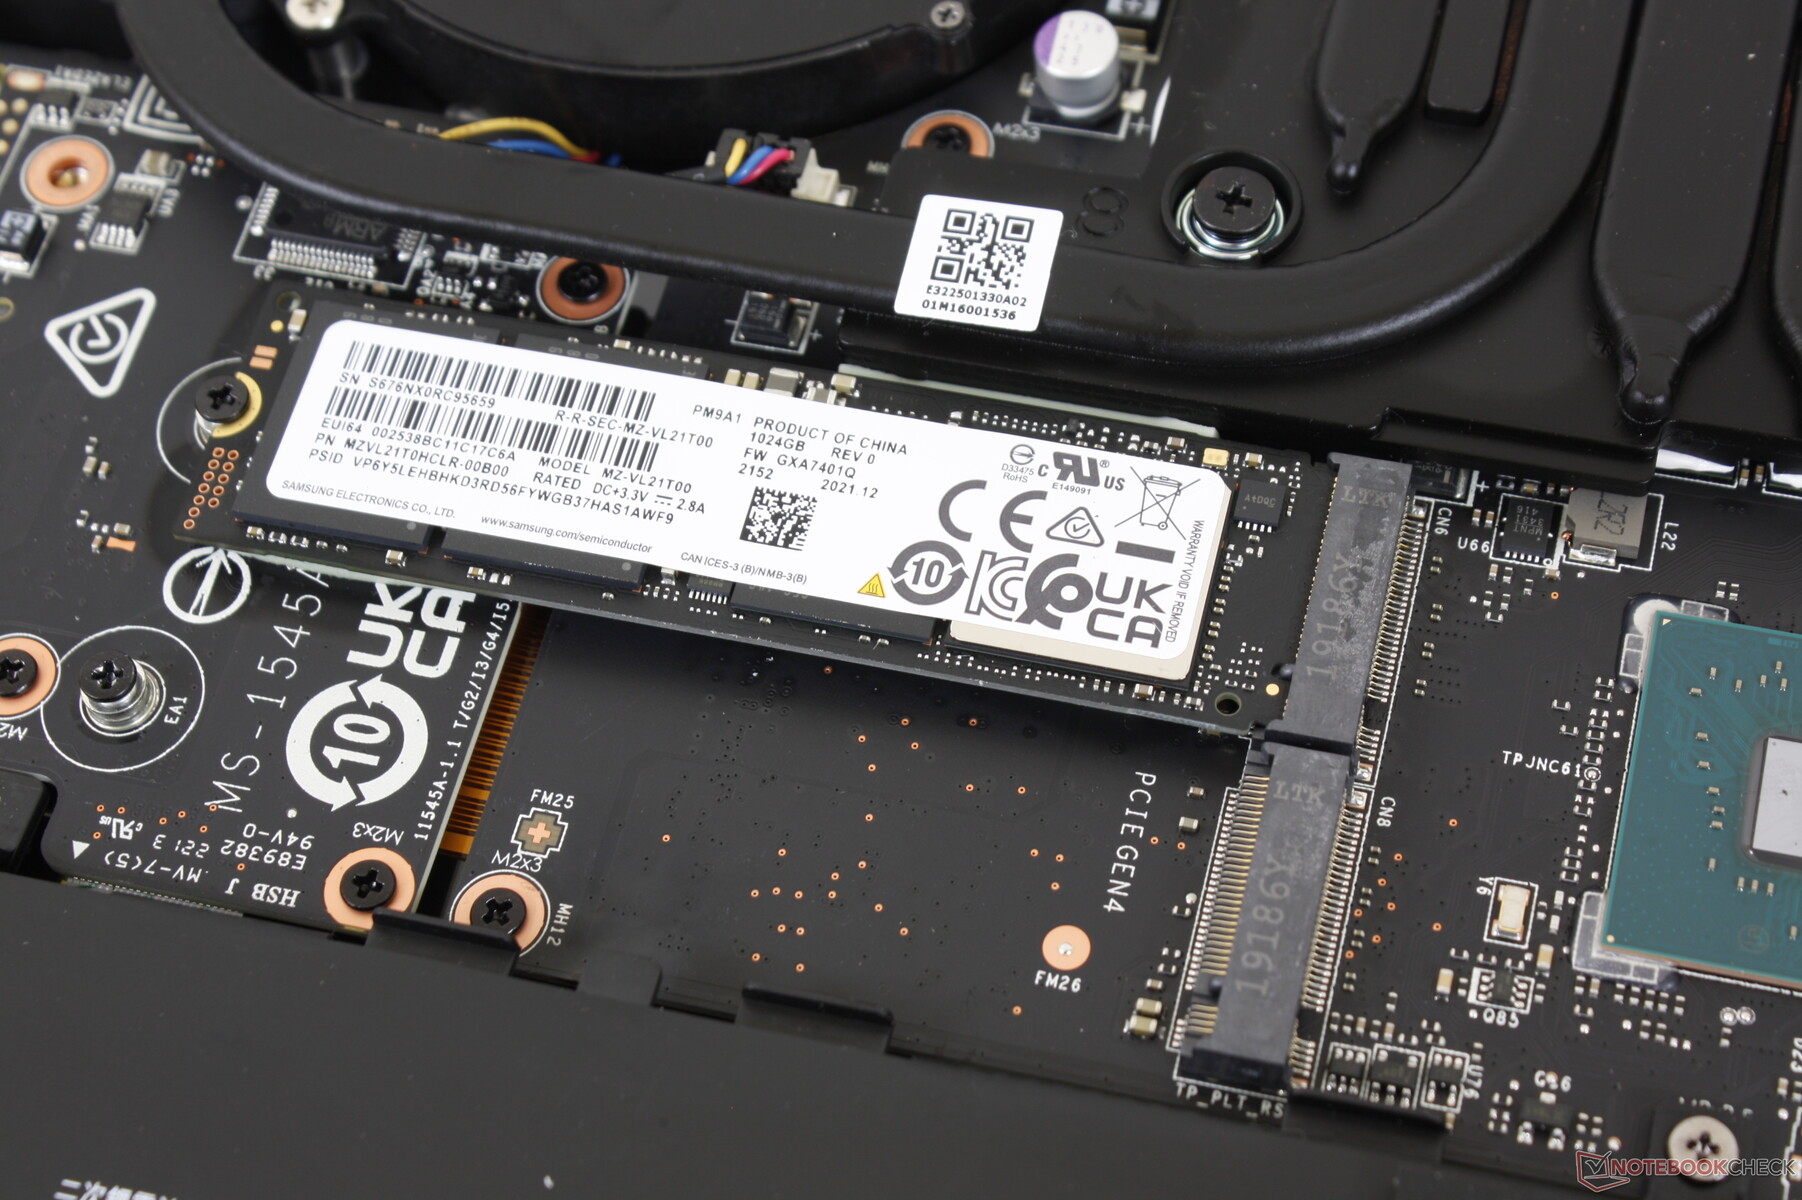
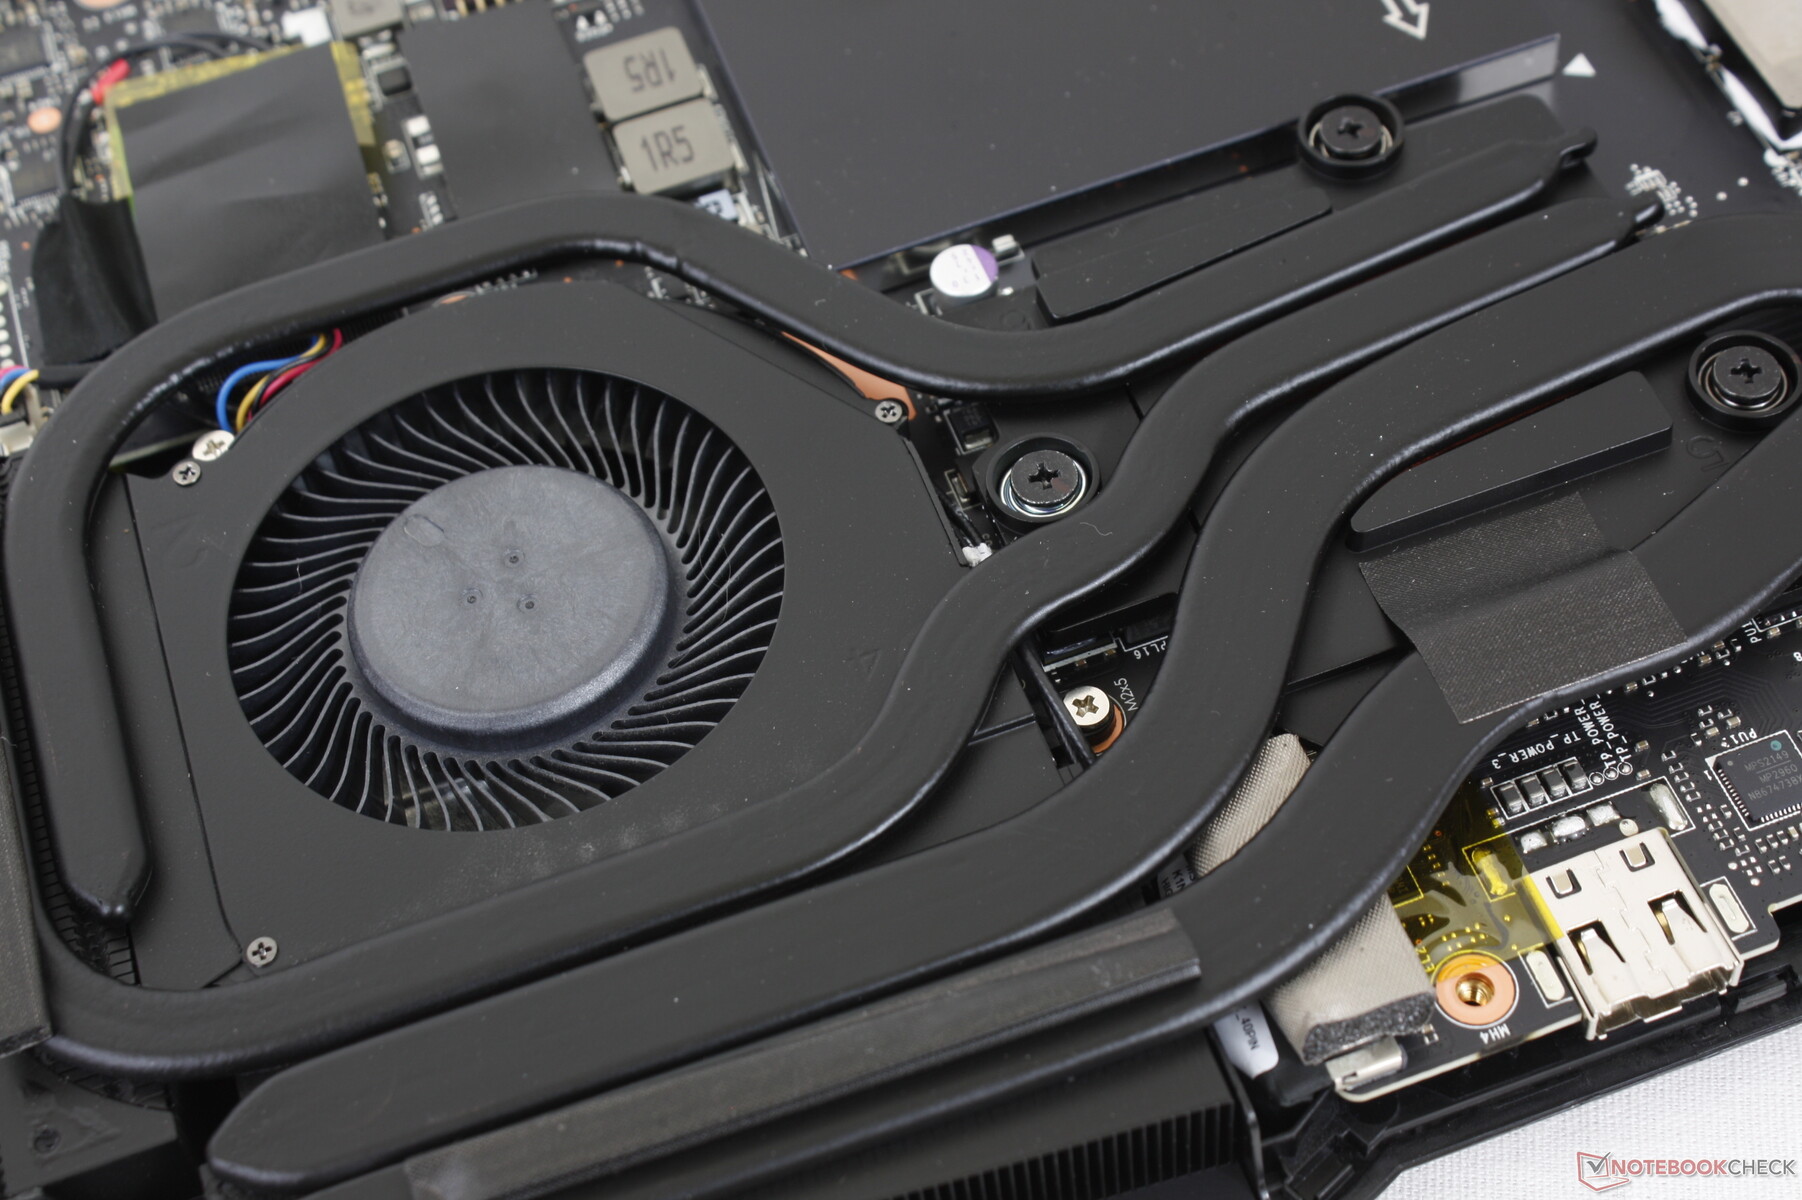
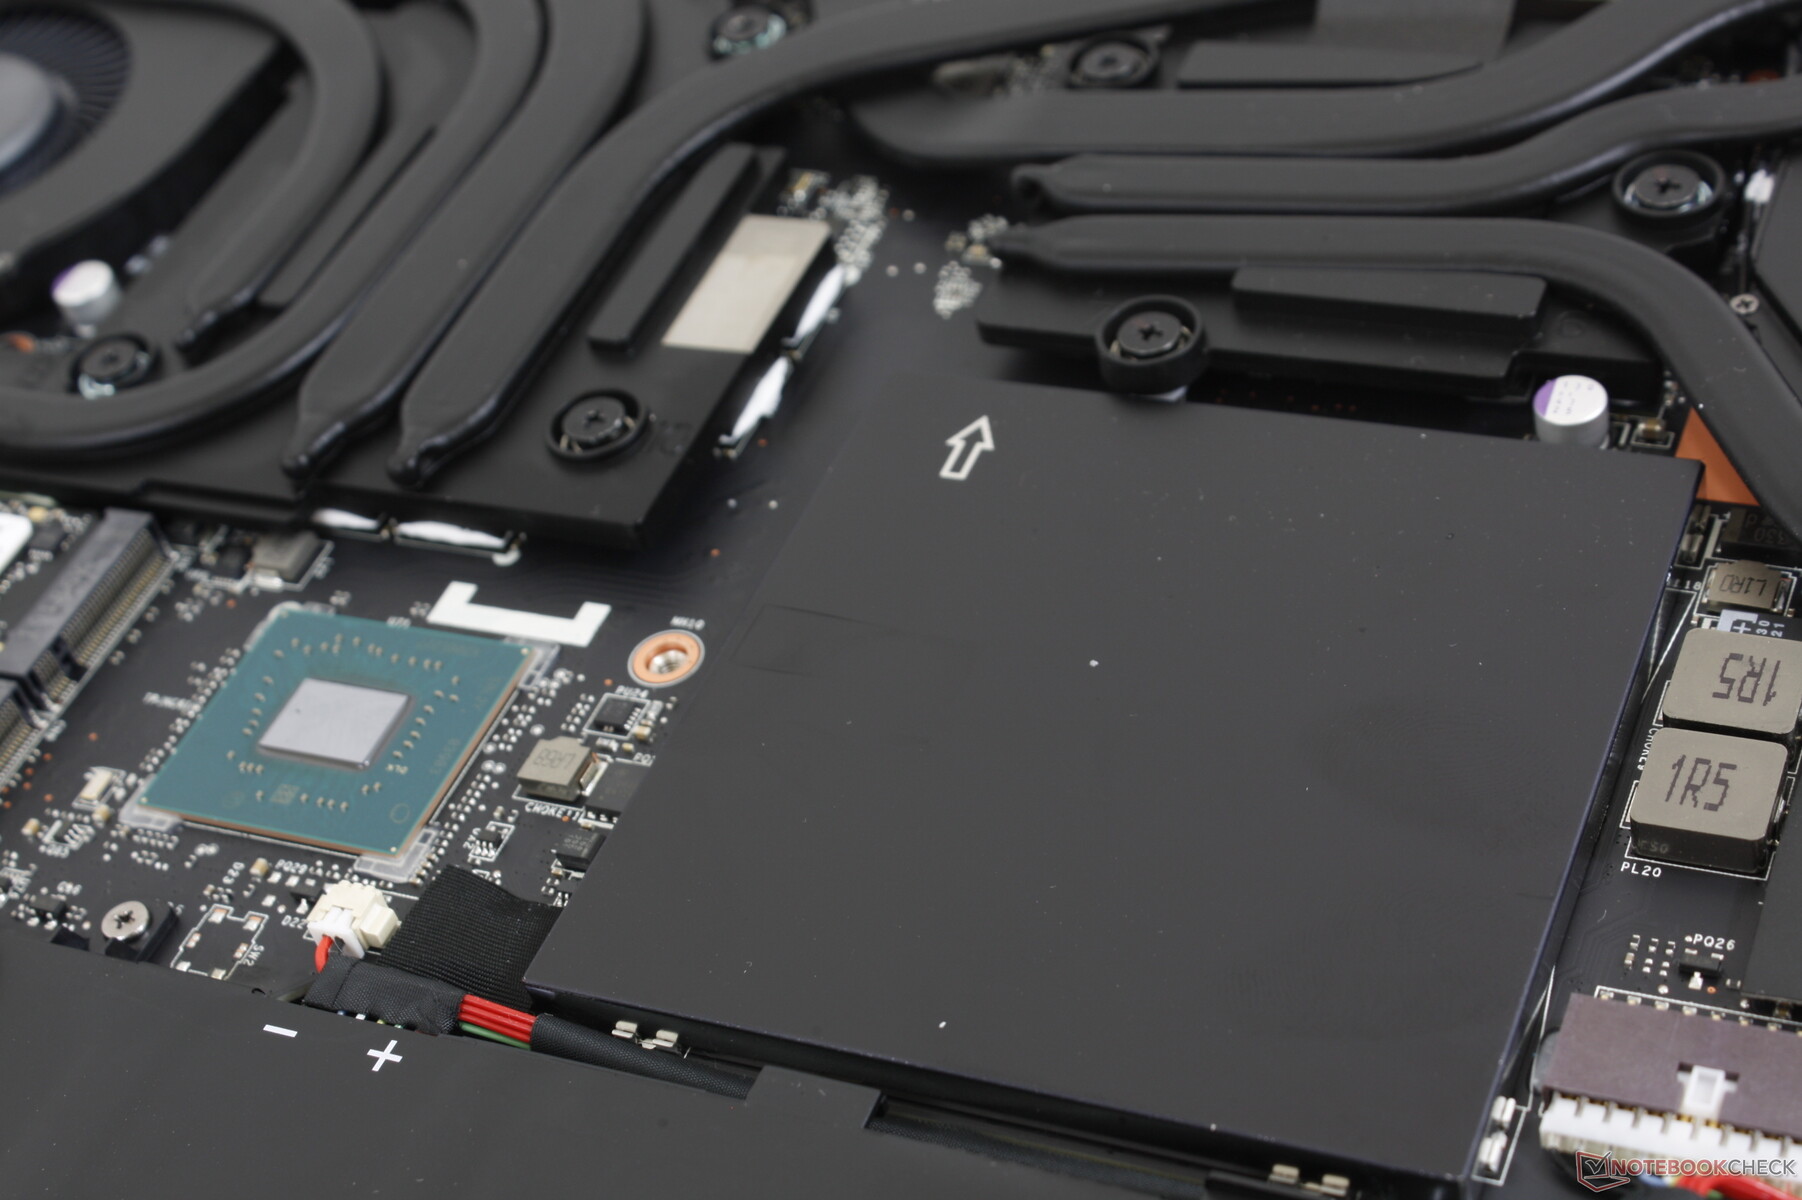
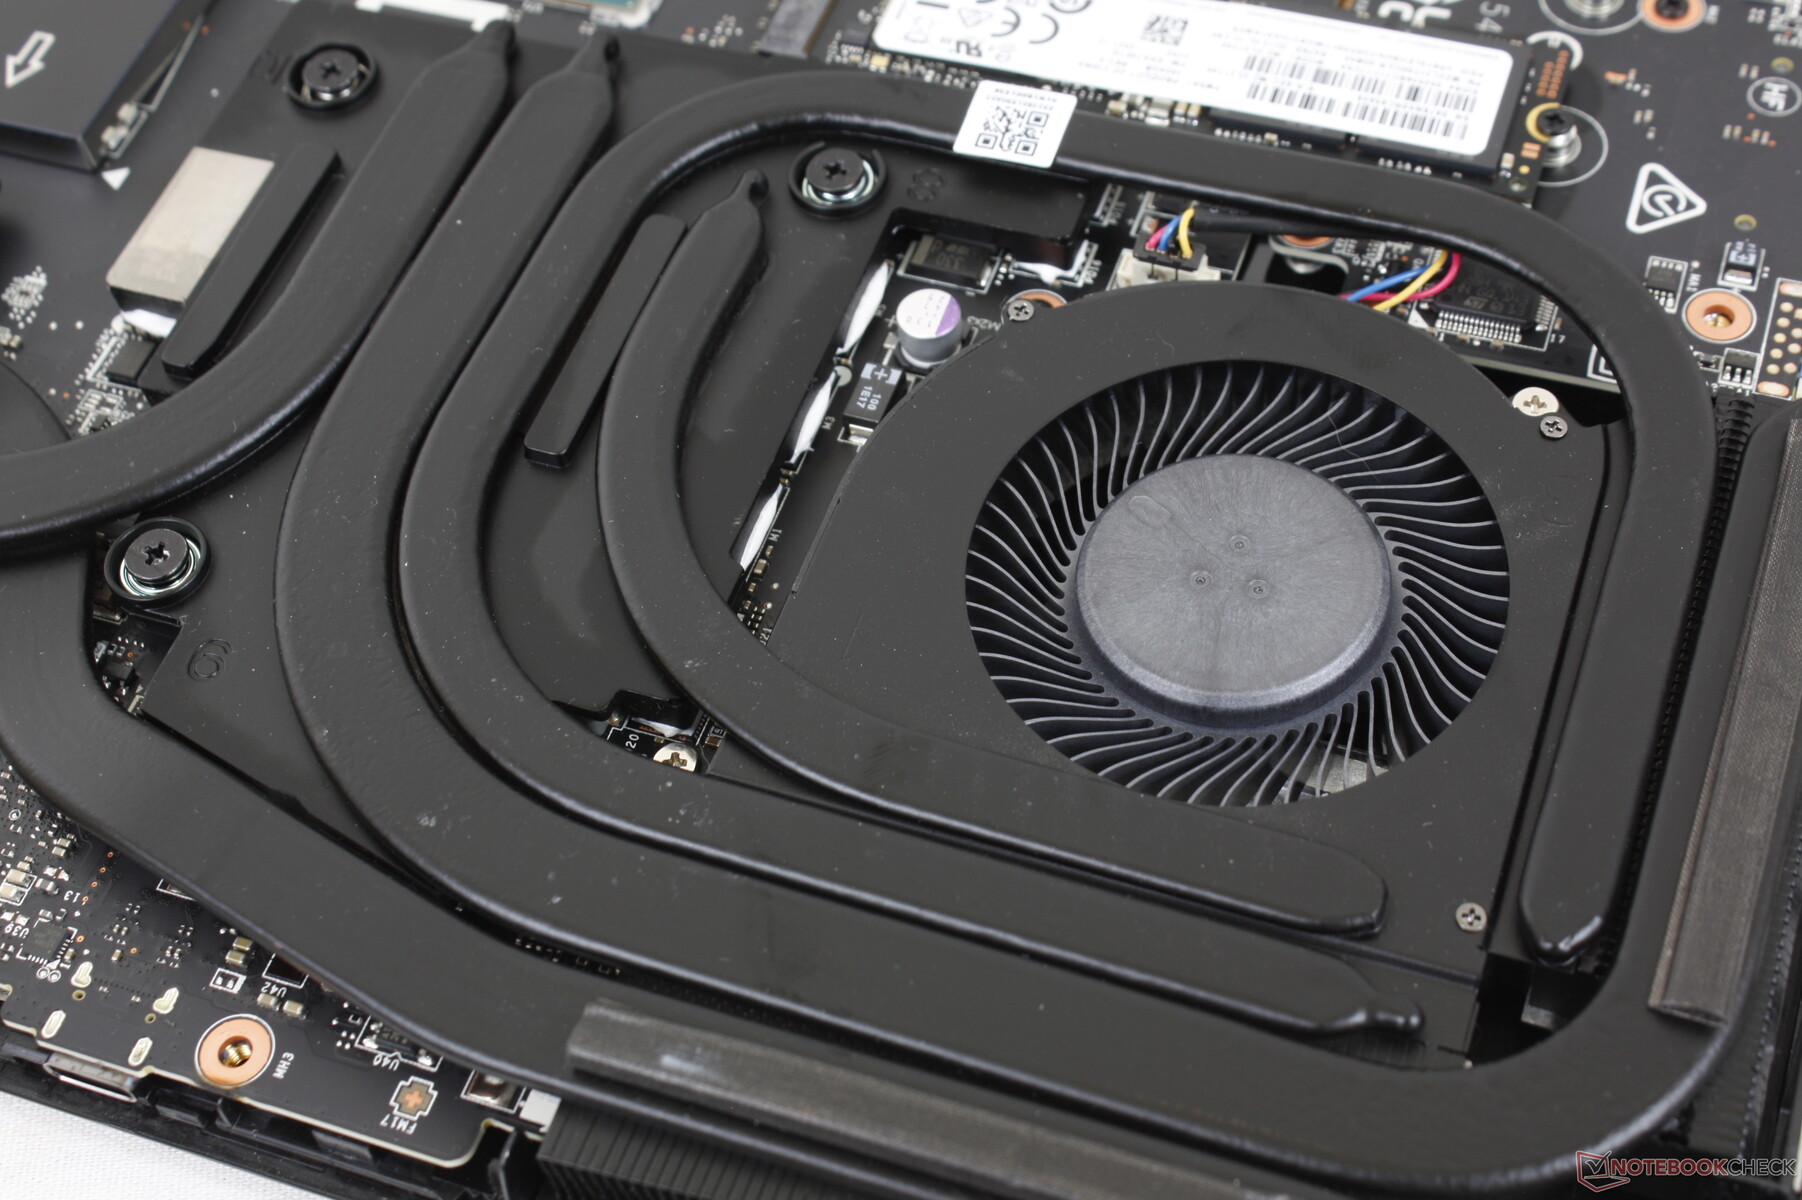
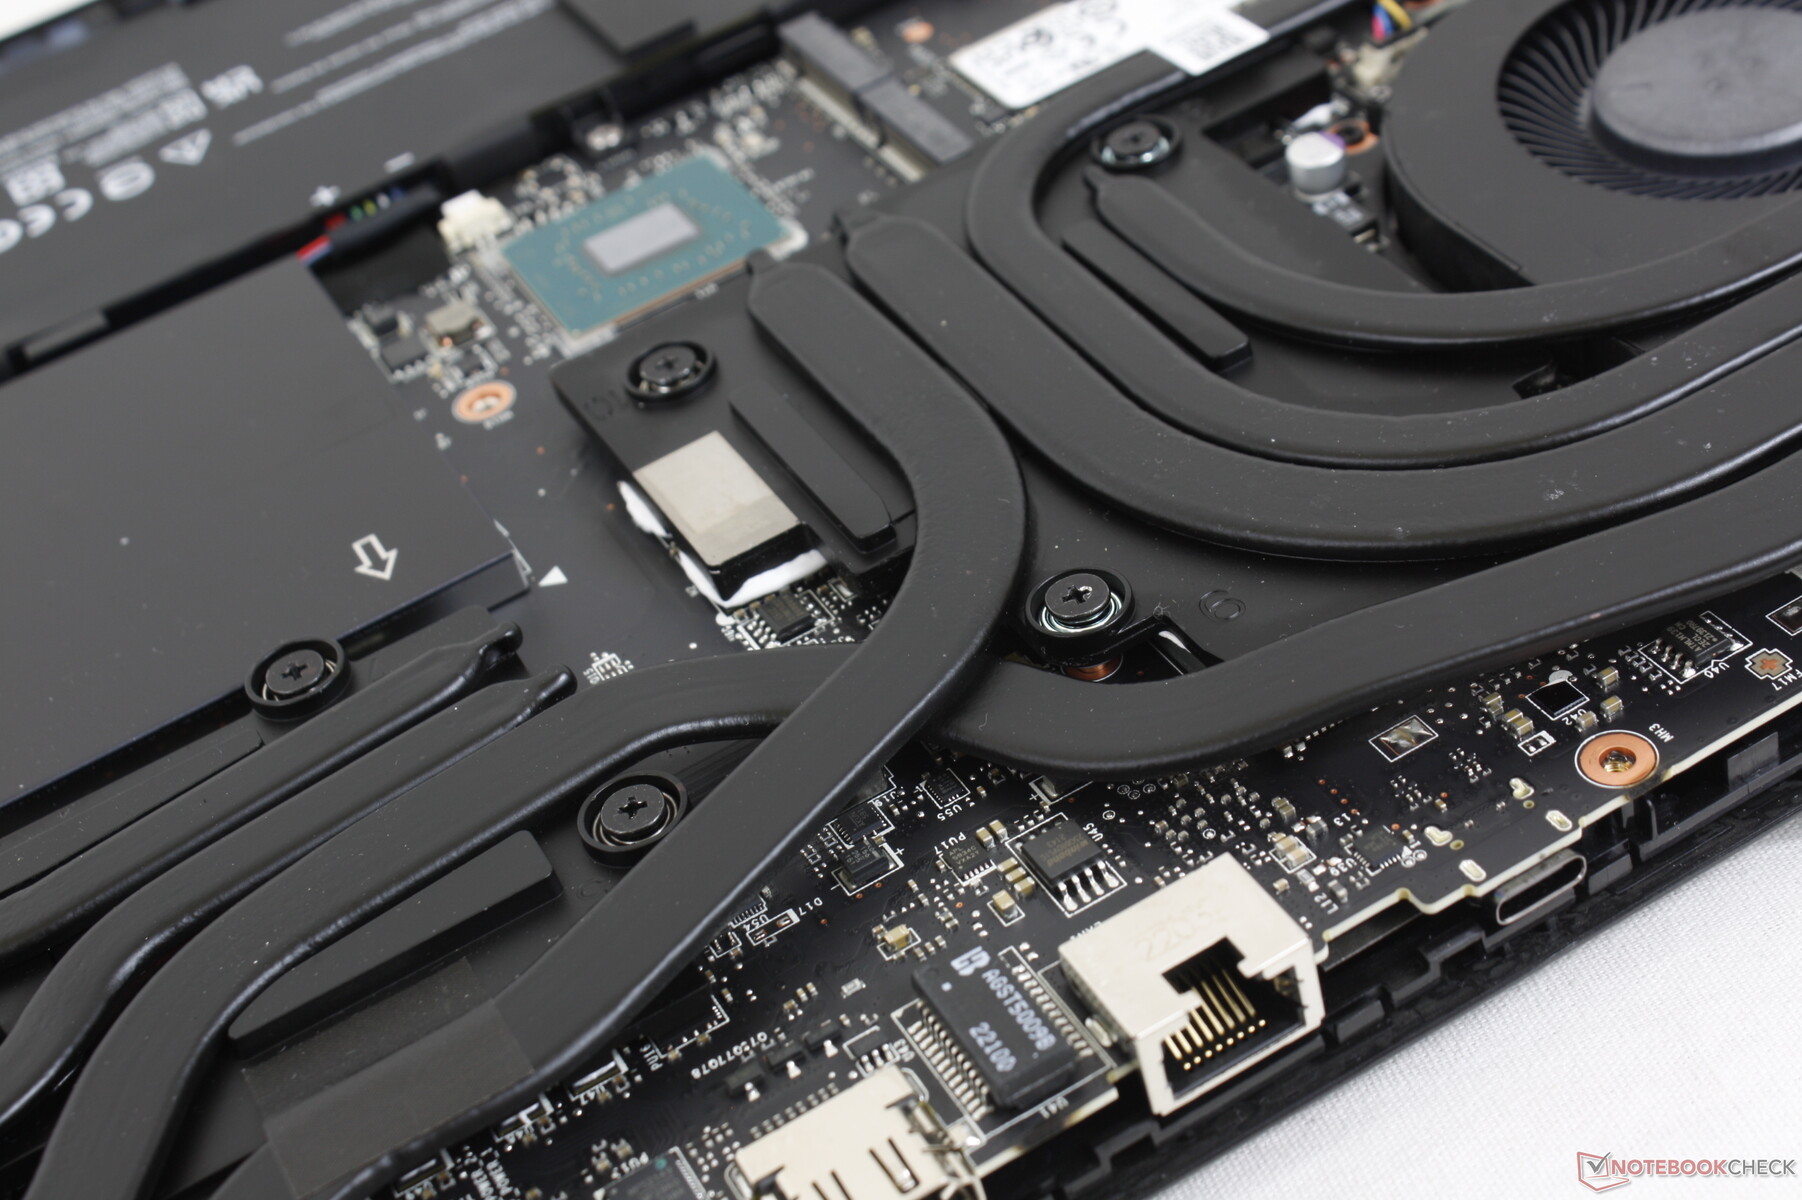
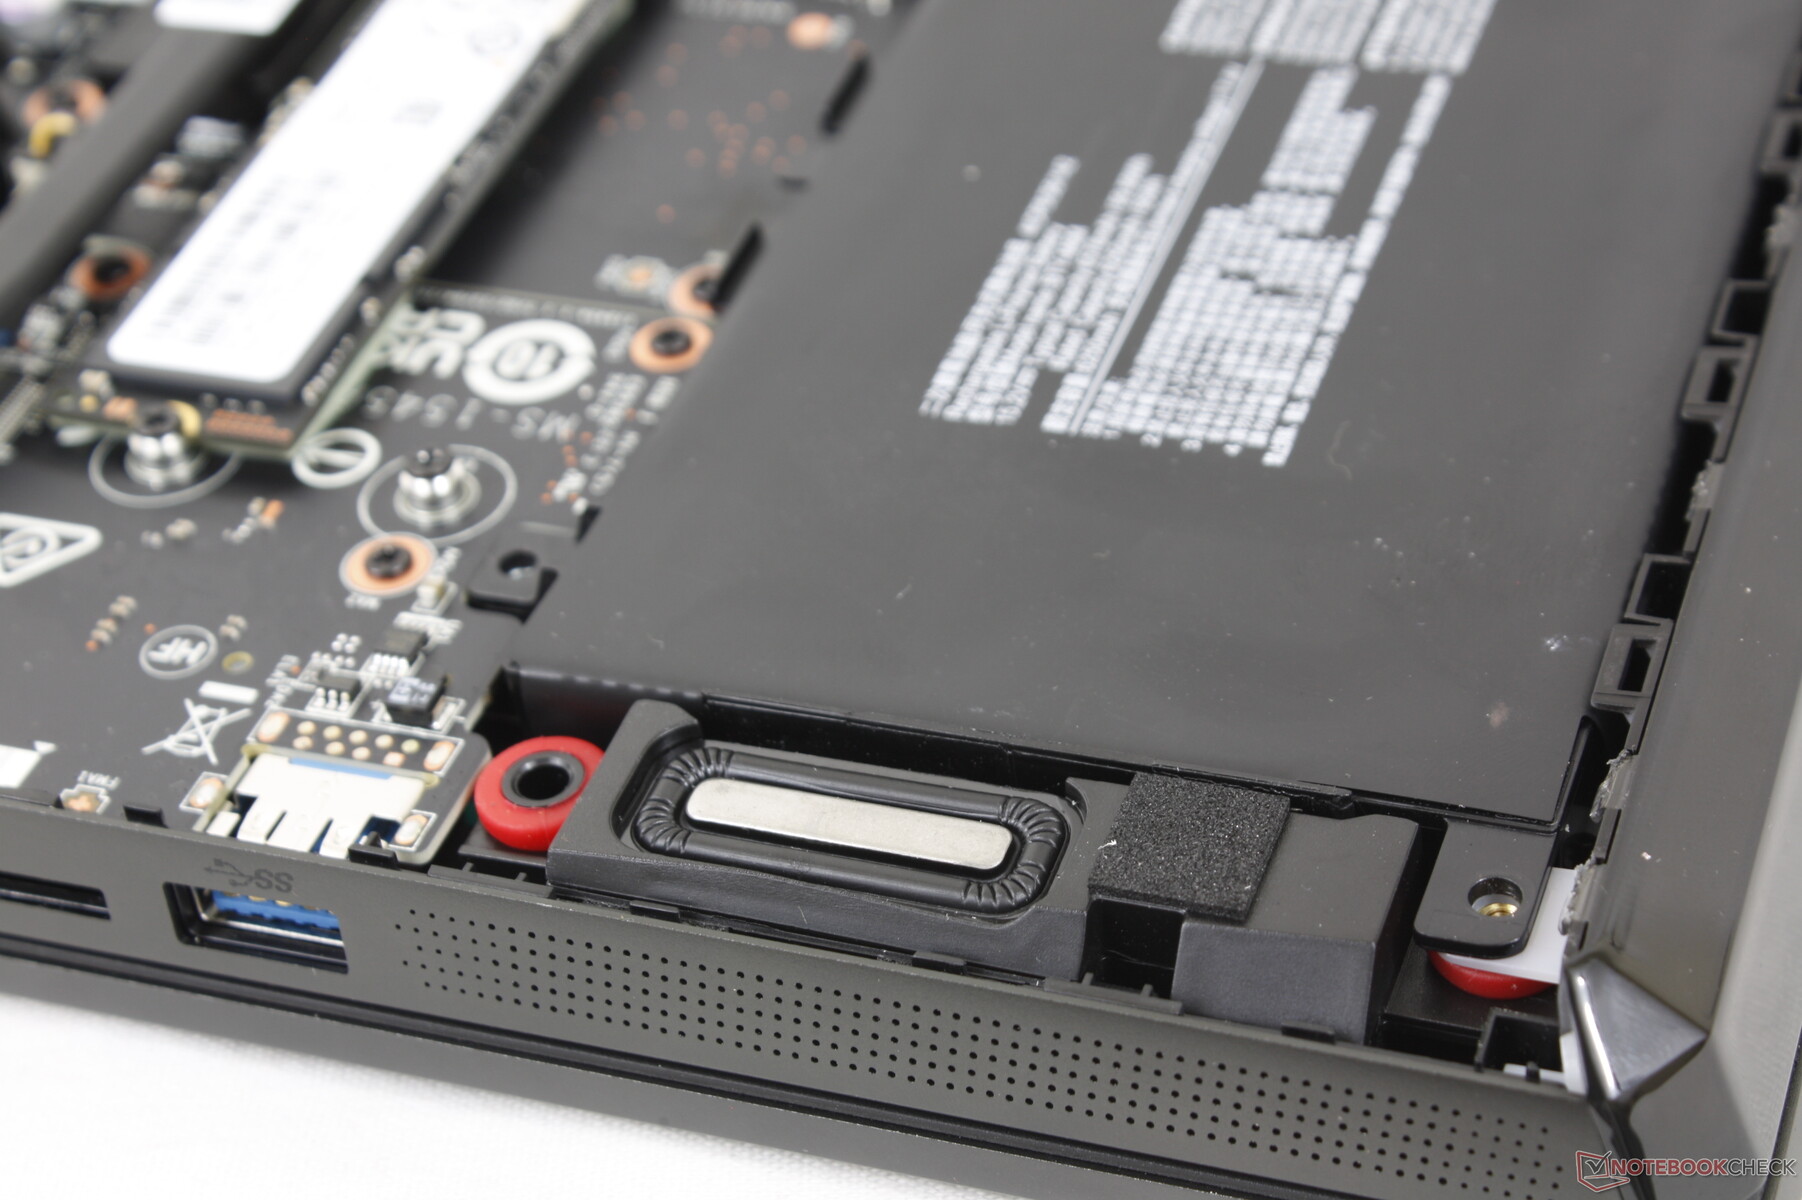
Per rimuovere il pannello inferiore è necessario un cacciavite Philips e un bordo piatto. Rispetto al GE66, il GE67 ha una heat pipe aggiuntiva sopra la CPU, come mostrato di seguito, per migliorare il raffreddamento.
Accessori e garanzia
La confezione di vendita comprende un grande panno di velluto, oltre all'adattatore CA e alla documentazione. La garanzia standard del produttore di un anno è valida se acquistata negli Stati Uniti.
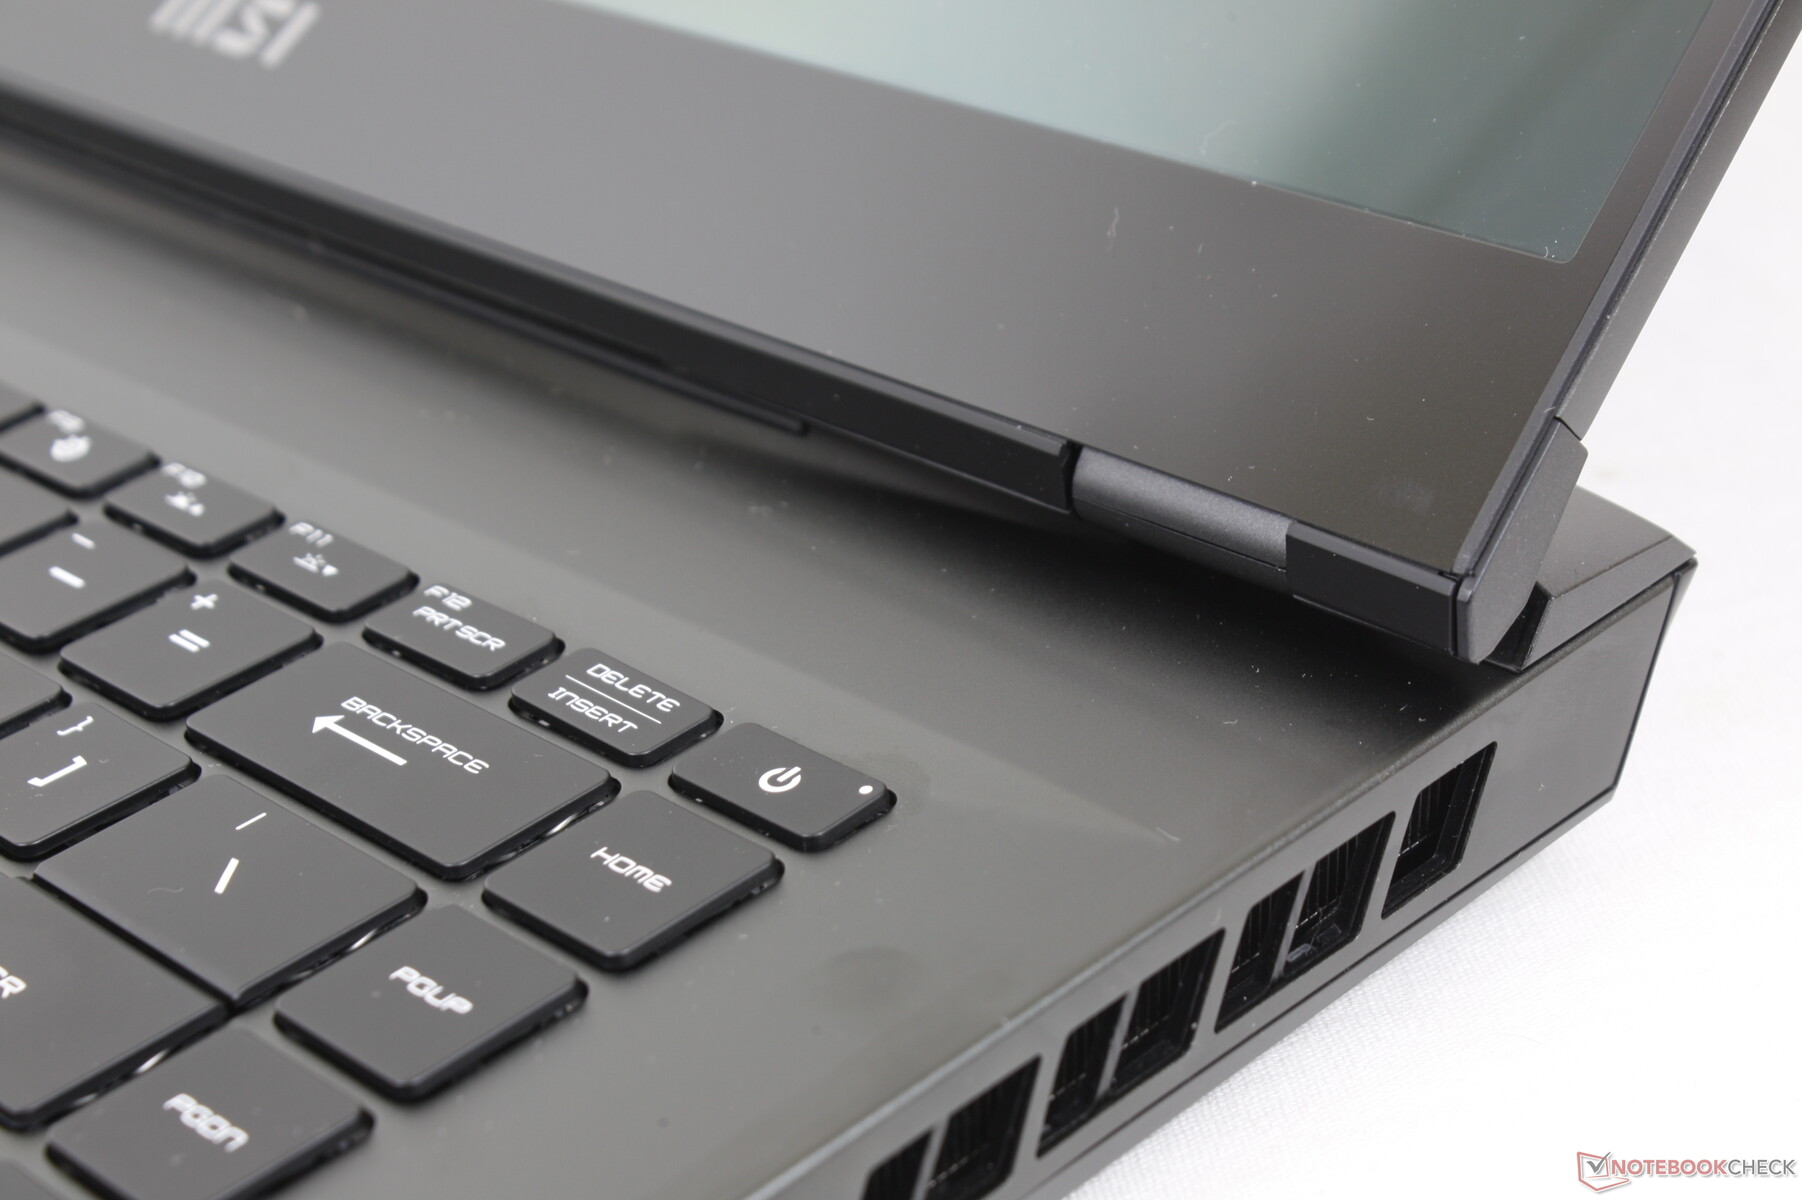
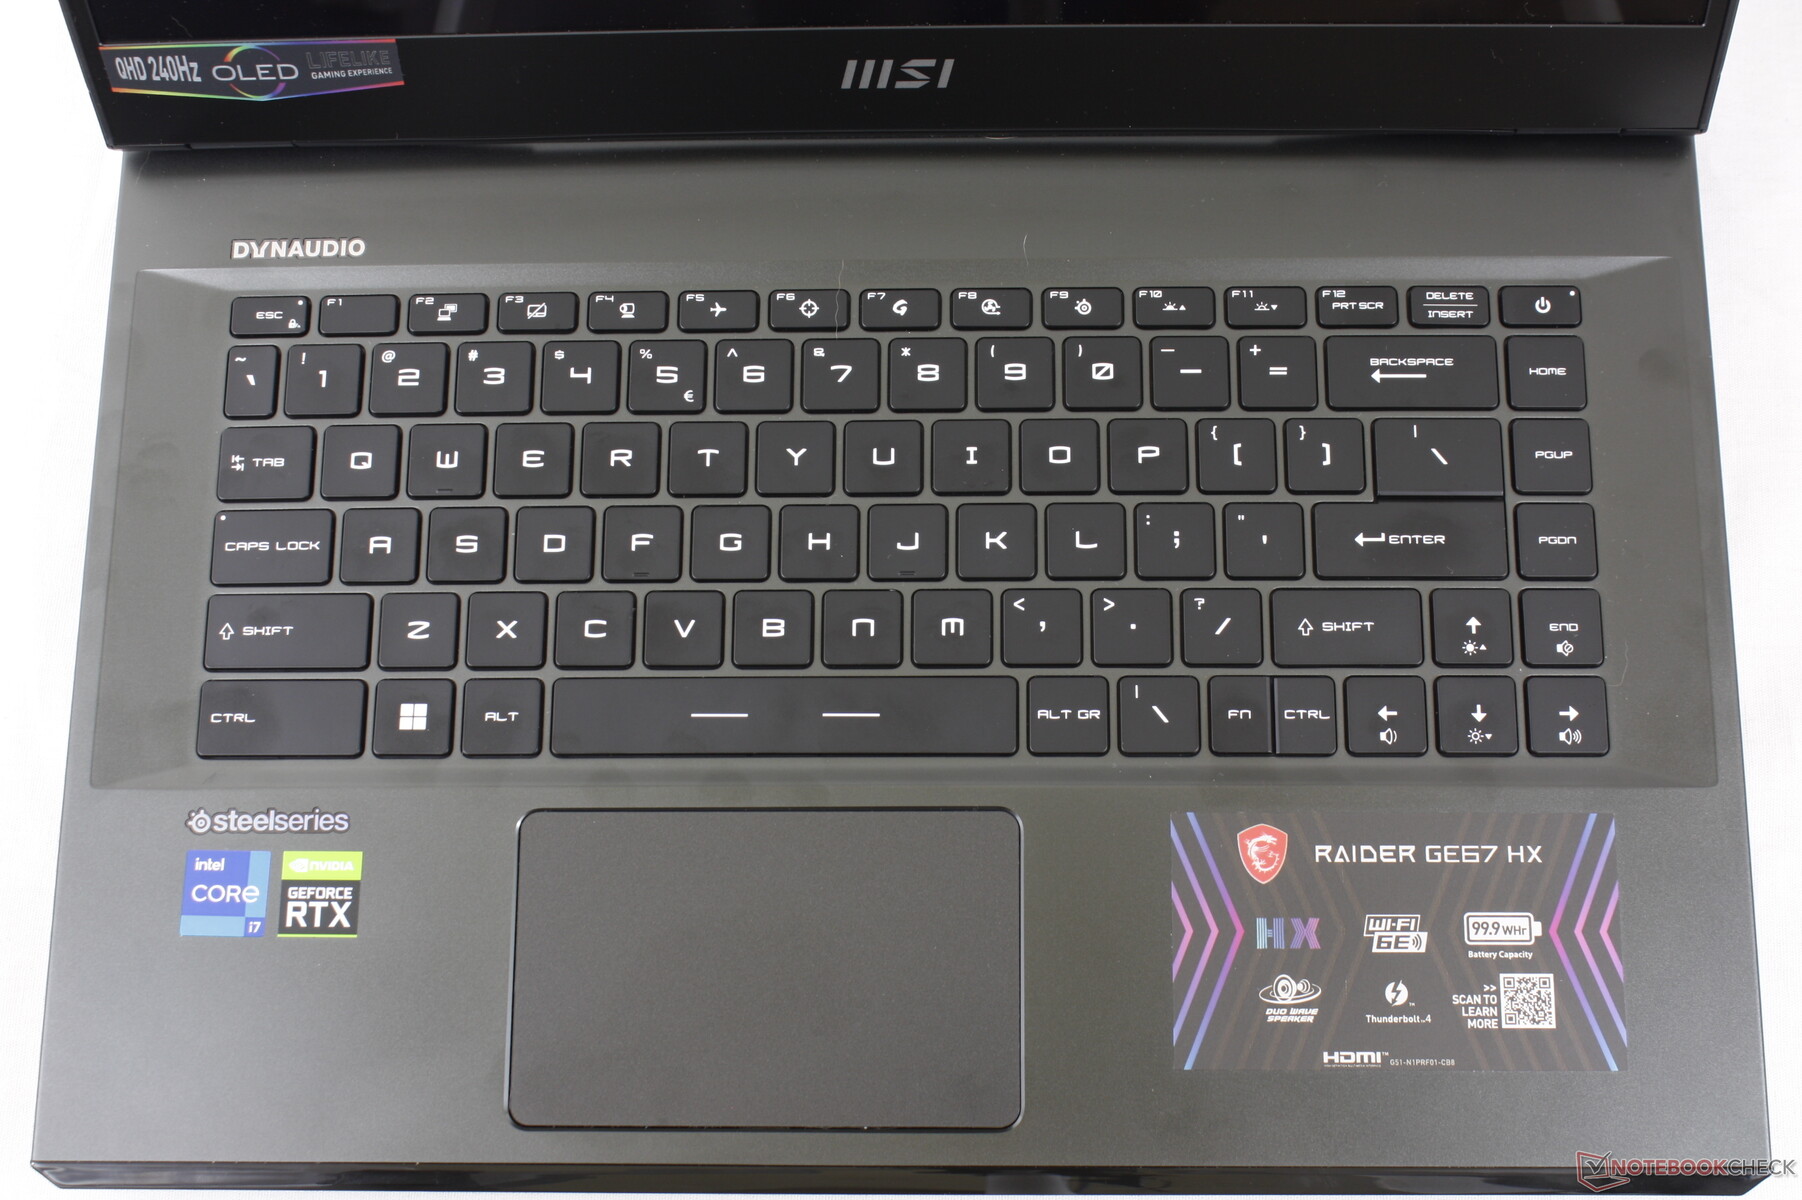
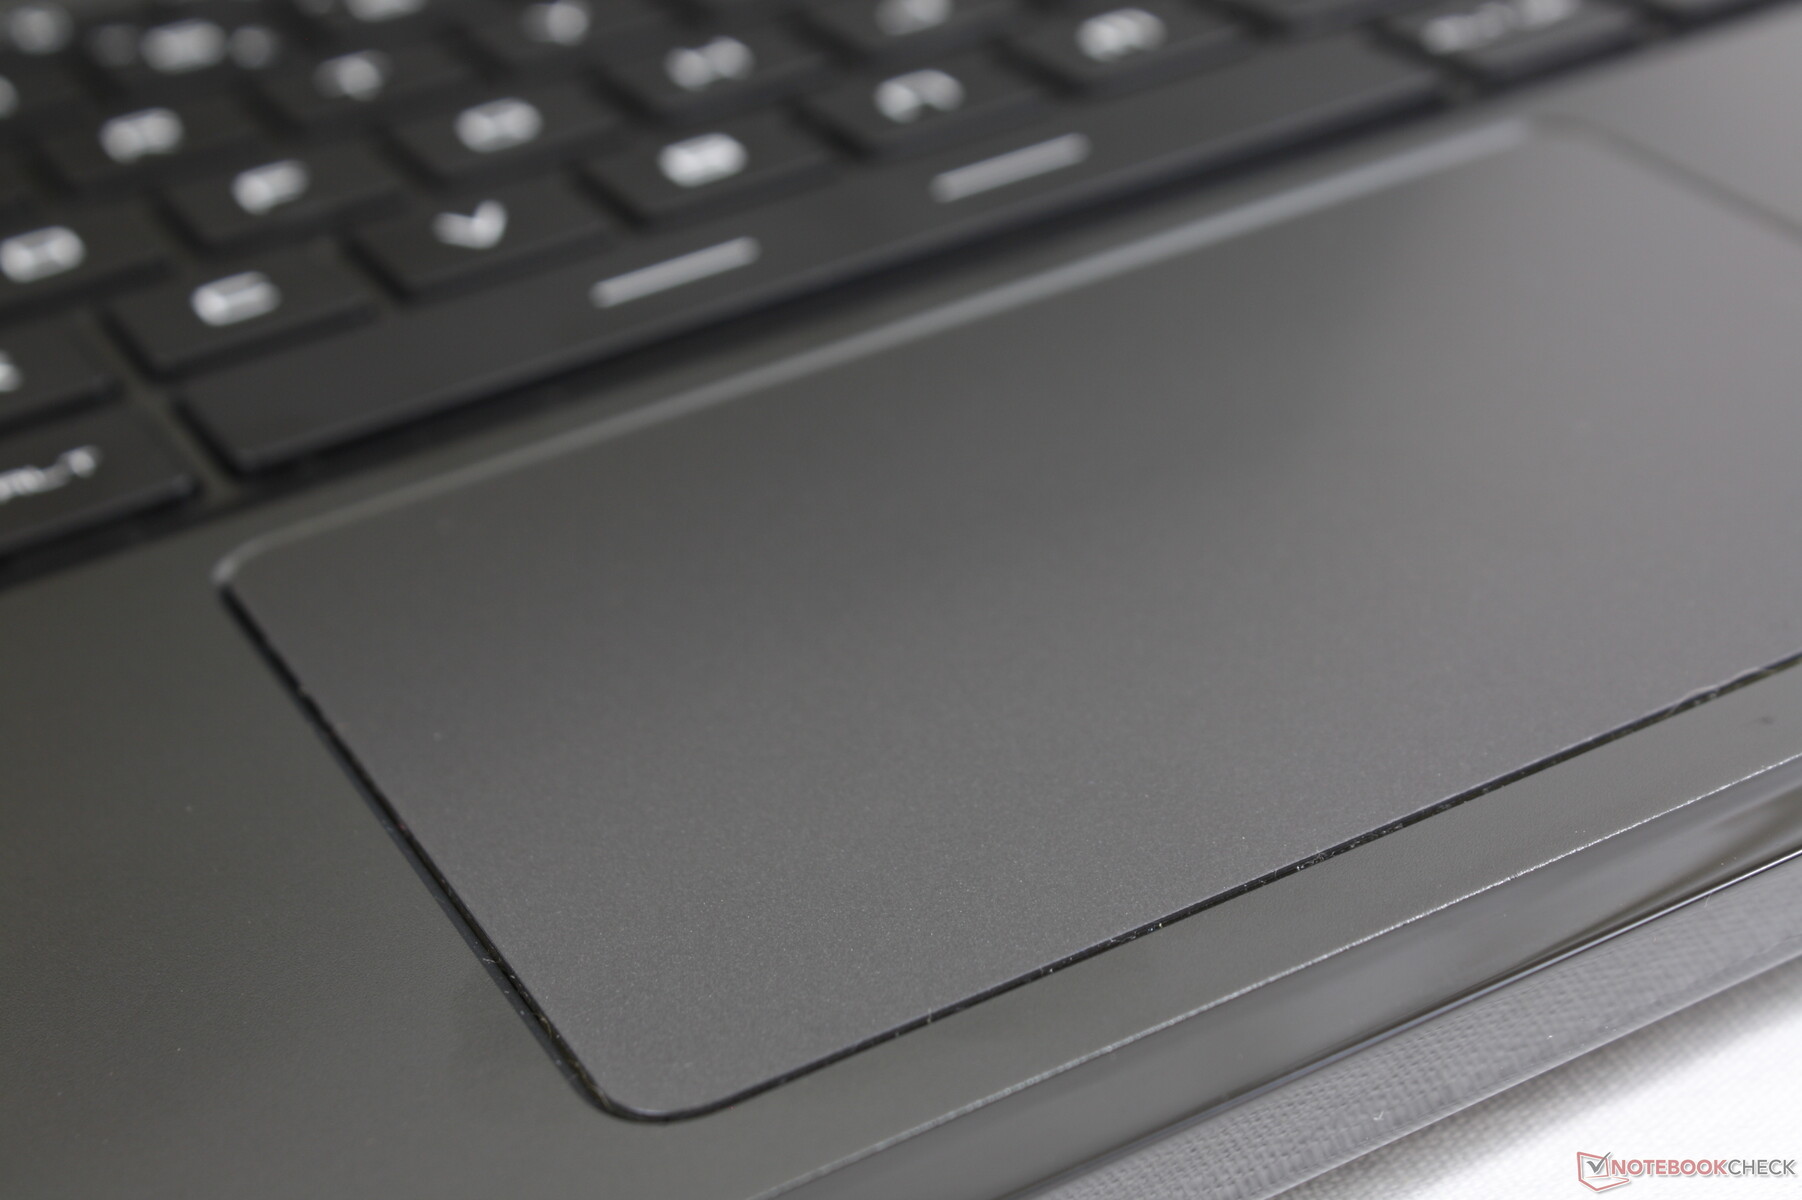
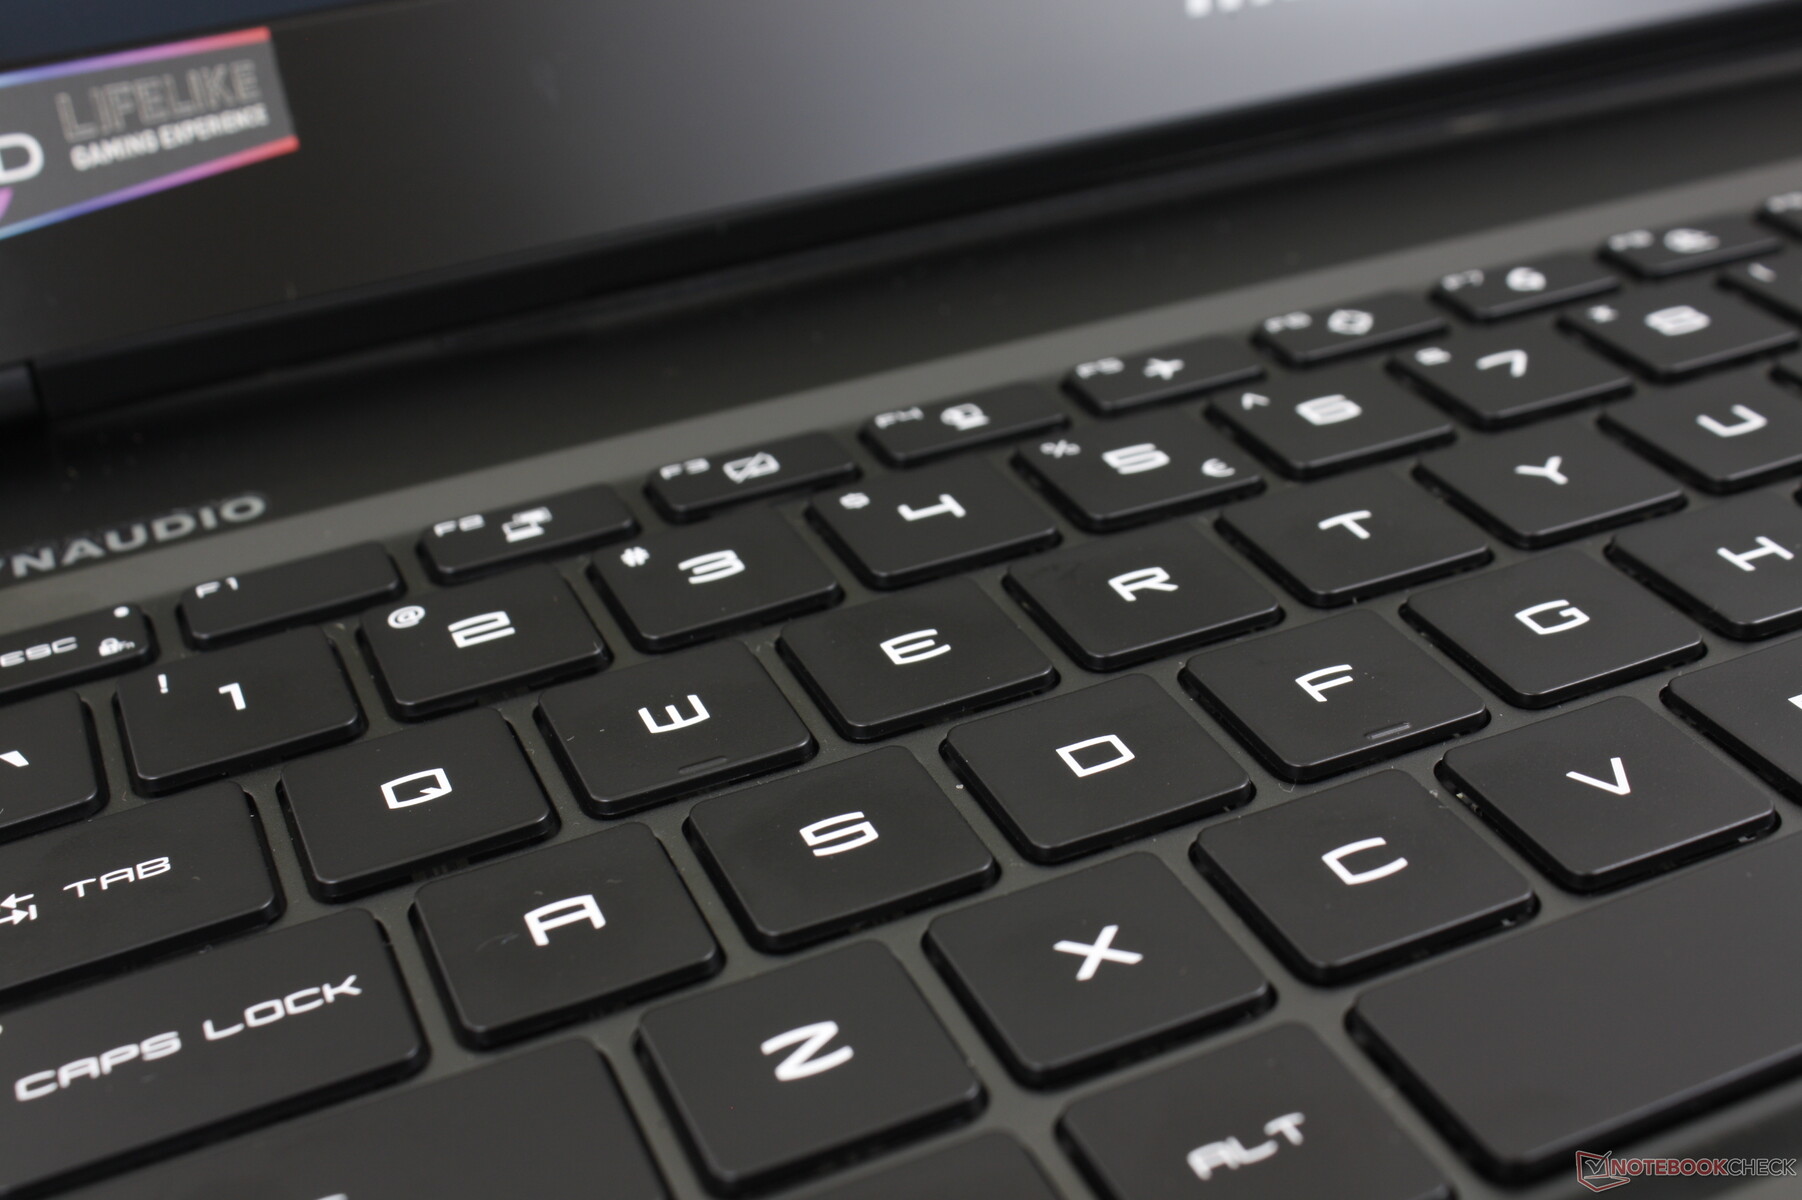
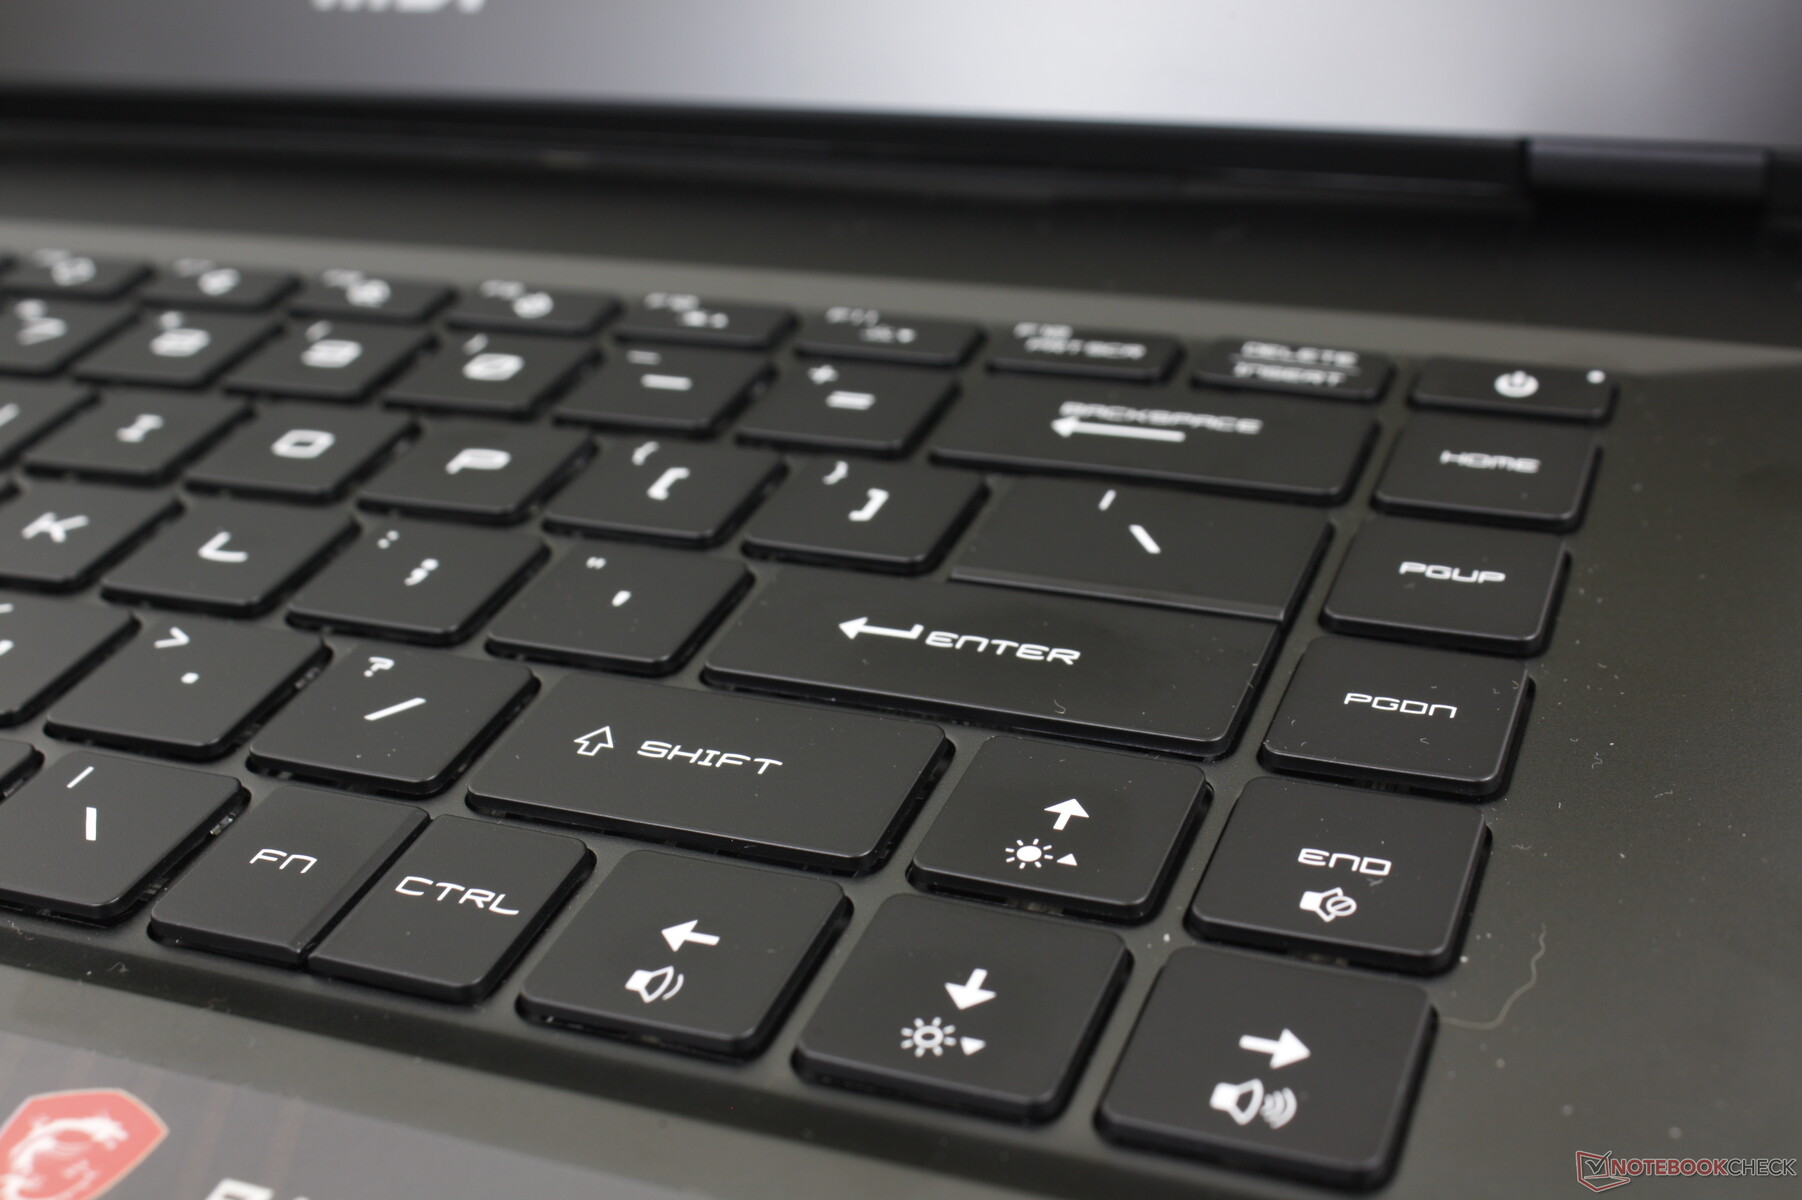
Dispositivi di input - Nessuna modifica sostanziale rispetto a GE66
Tastiera e touchpad
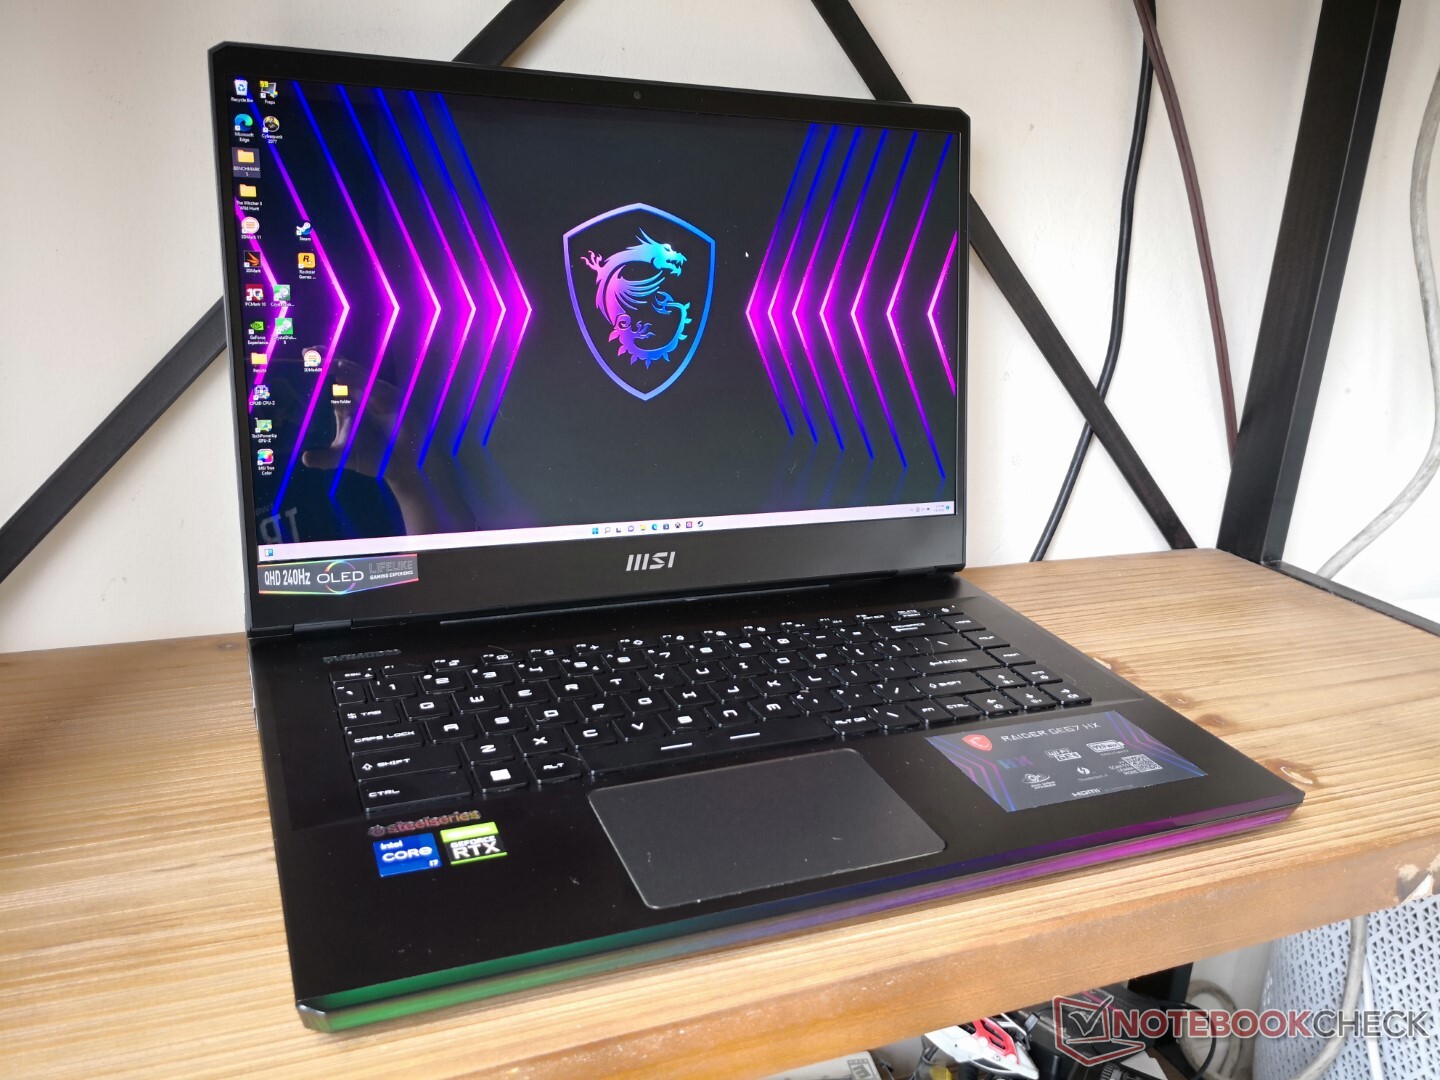
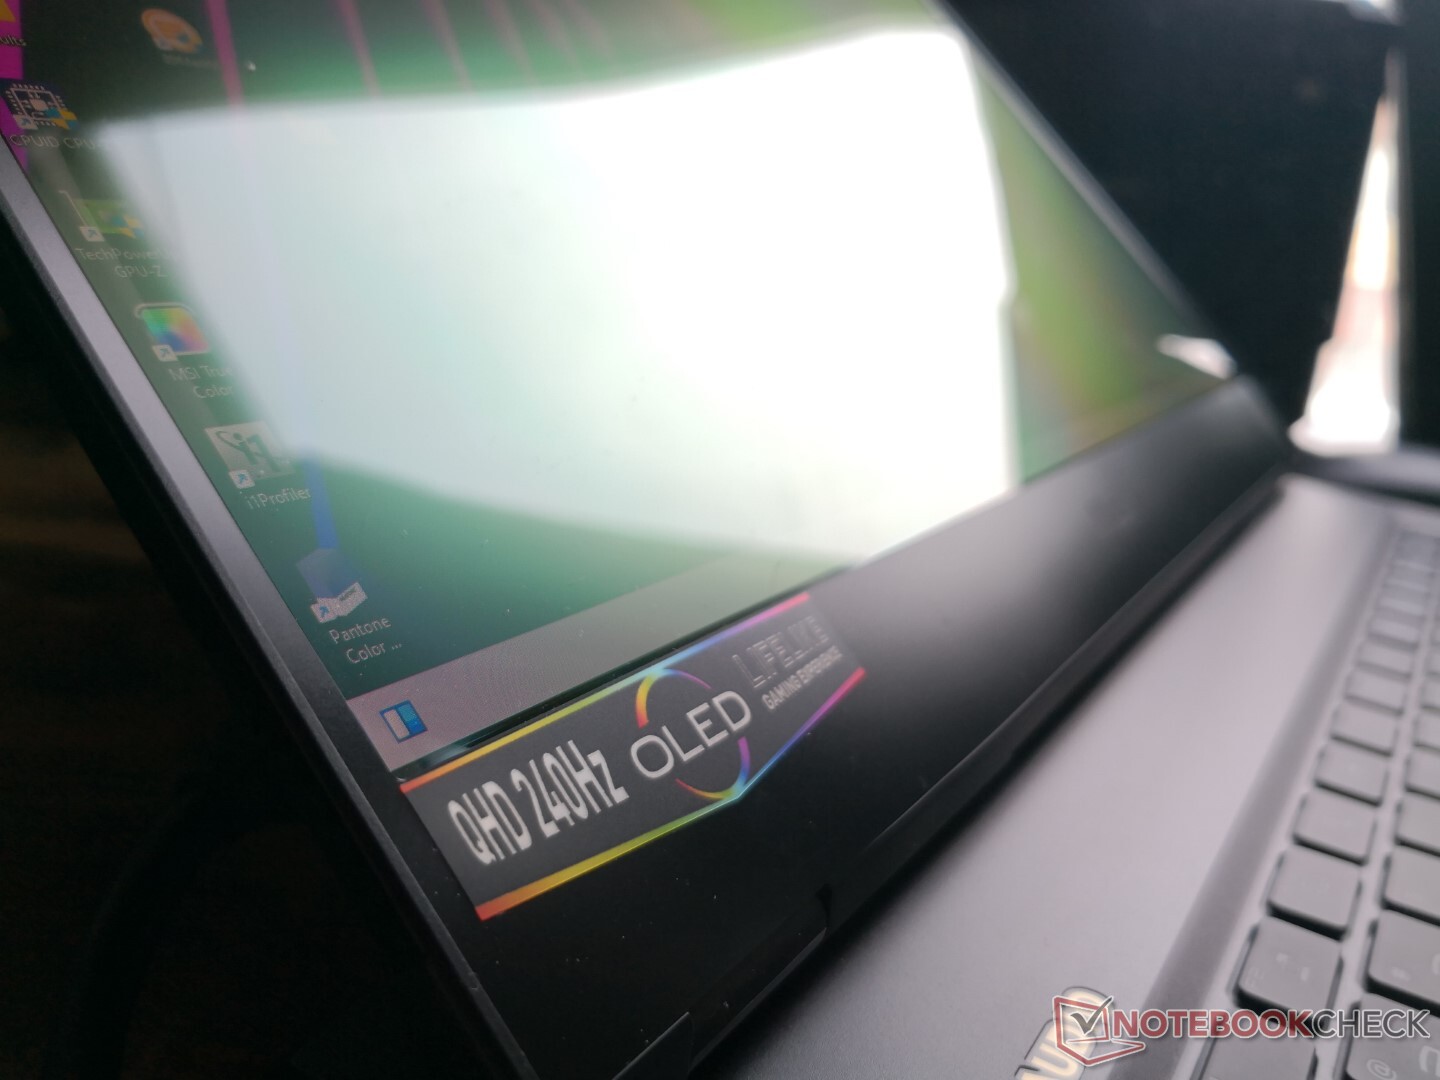
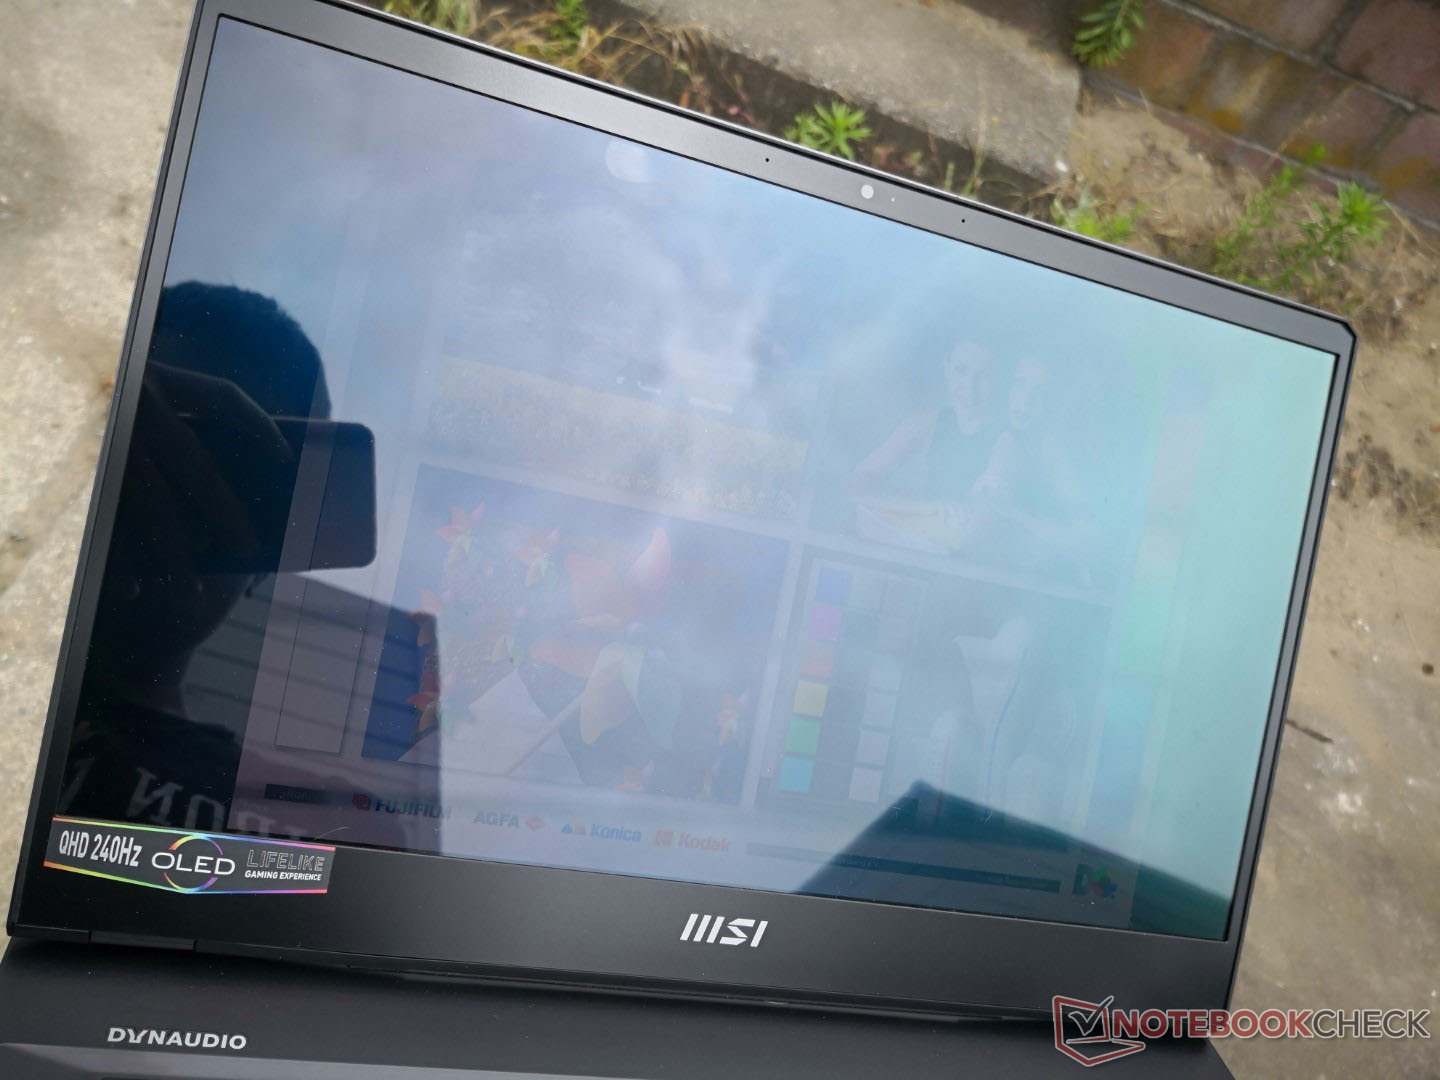
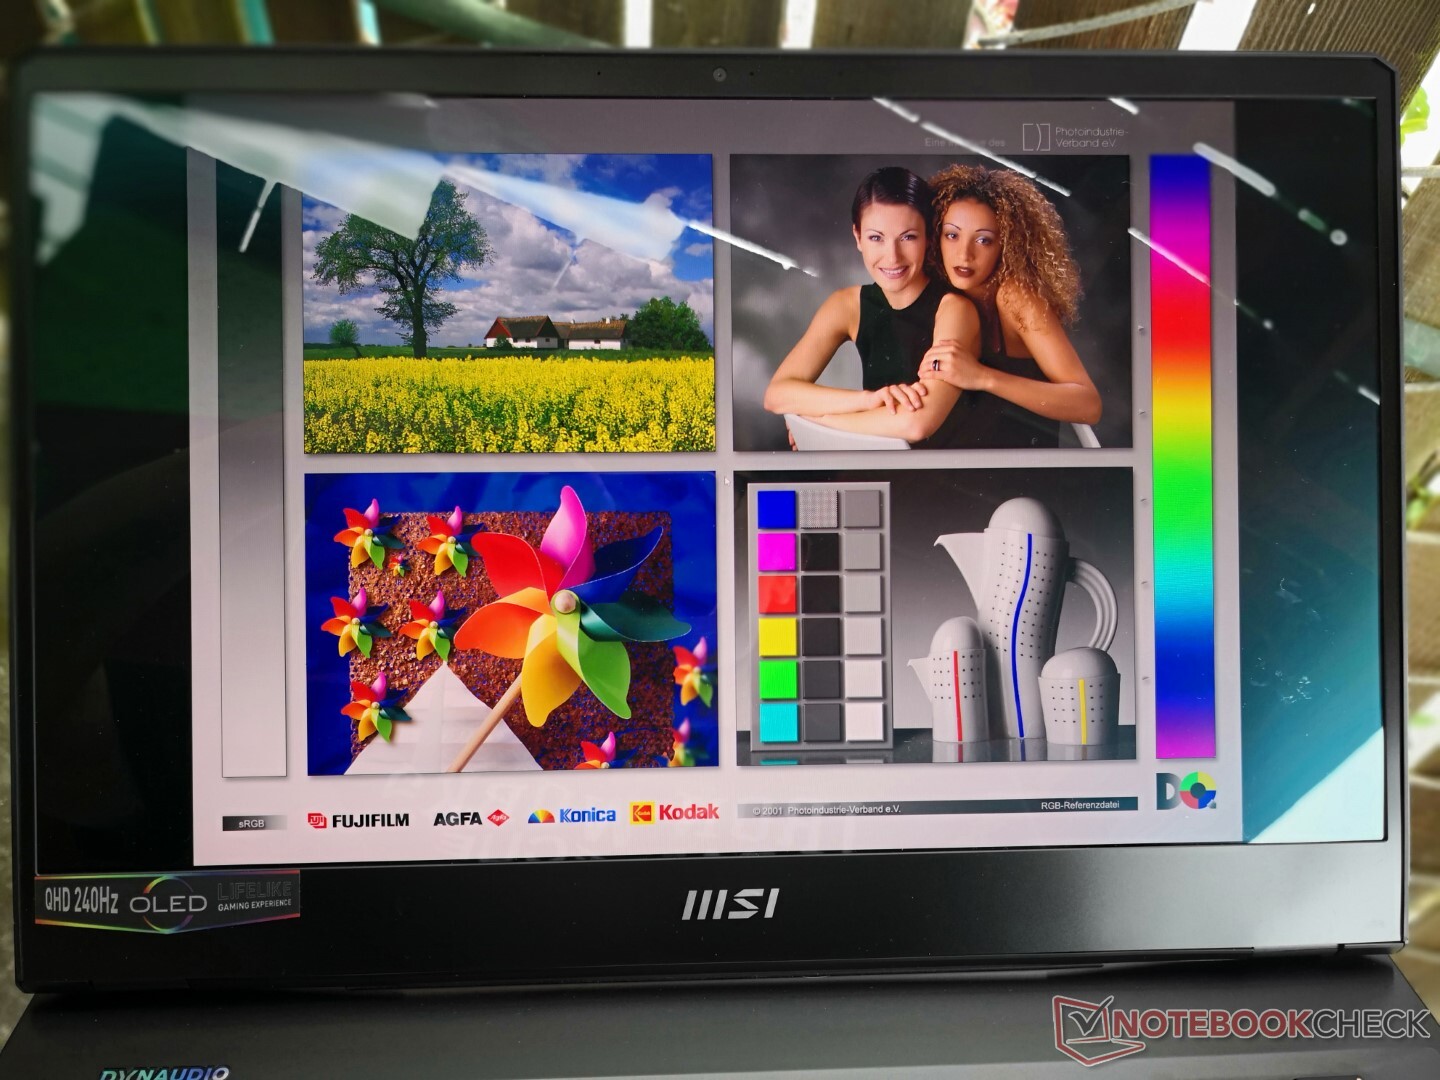
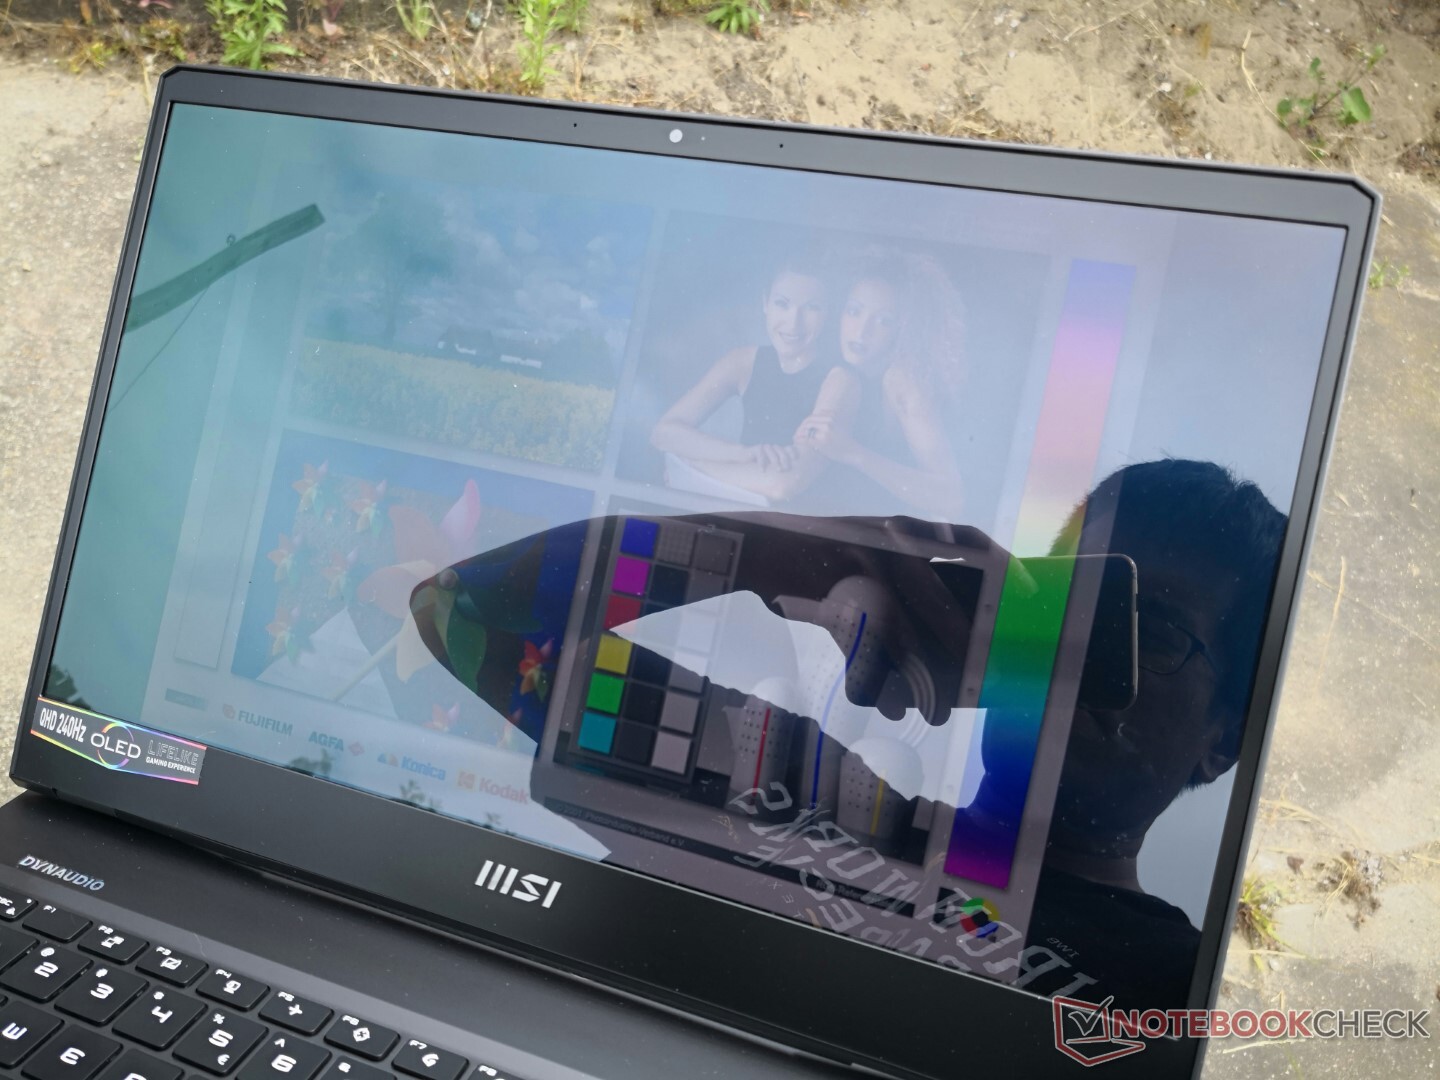
Display: quasi ideale per il gioco
MSI GE67 e Razer Blade 15 sono due dei primi computer portatili a offrire opzioni di visualizzazione QHD OLED a 240 Hz. Sebbene questo possa sembrare eccellente sulla carta, ci sono alcuni asterischi da tenere a mente
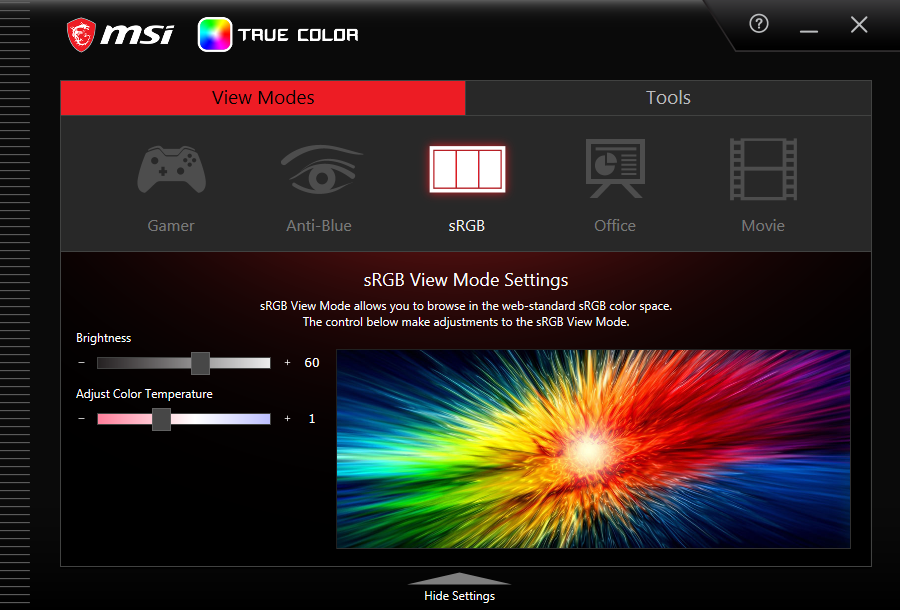
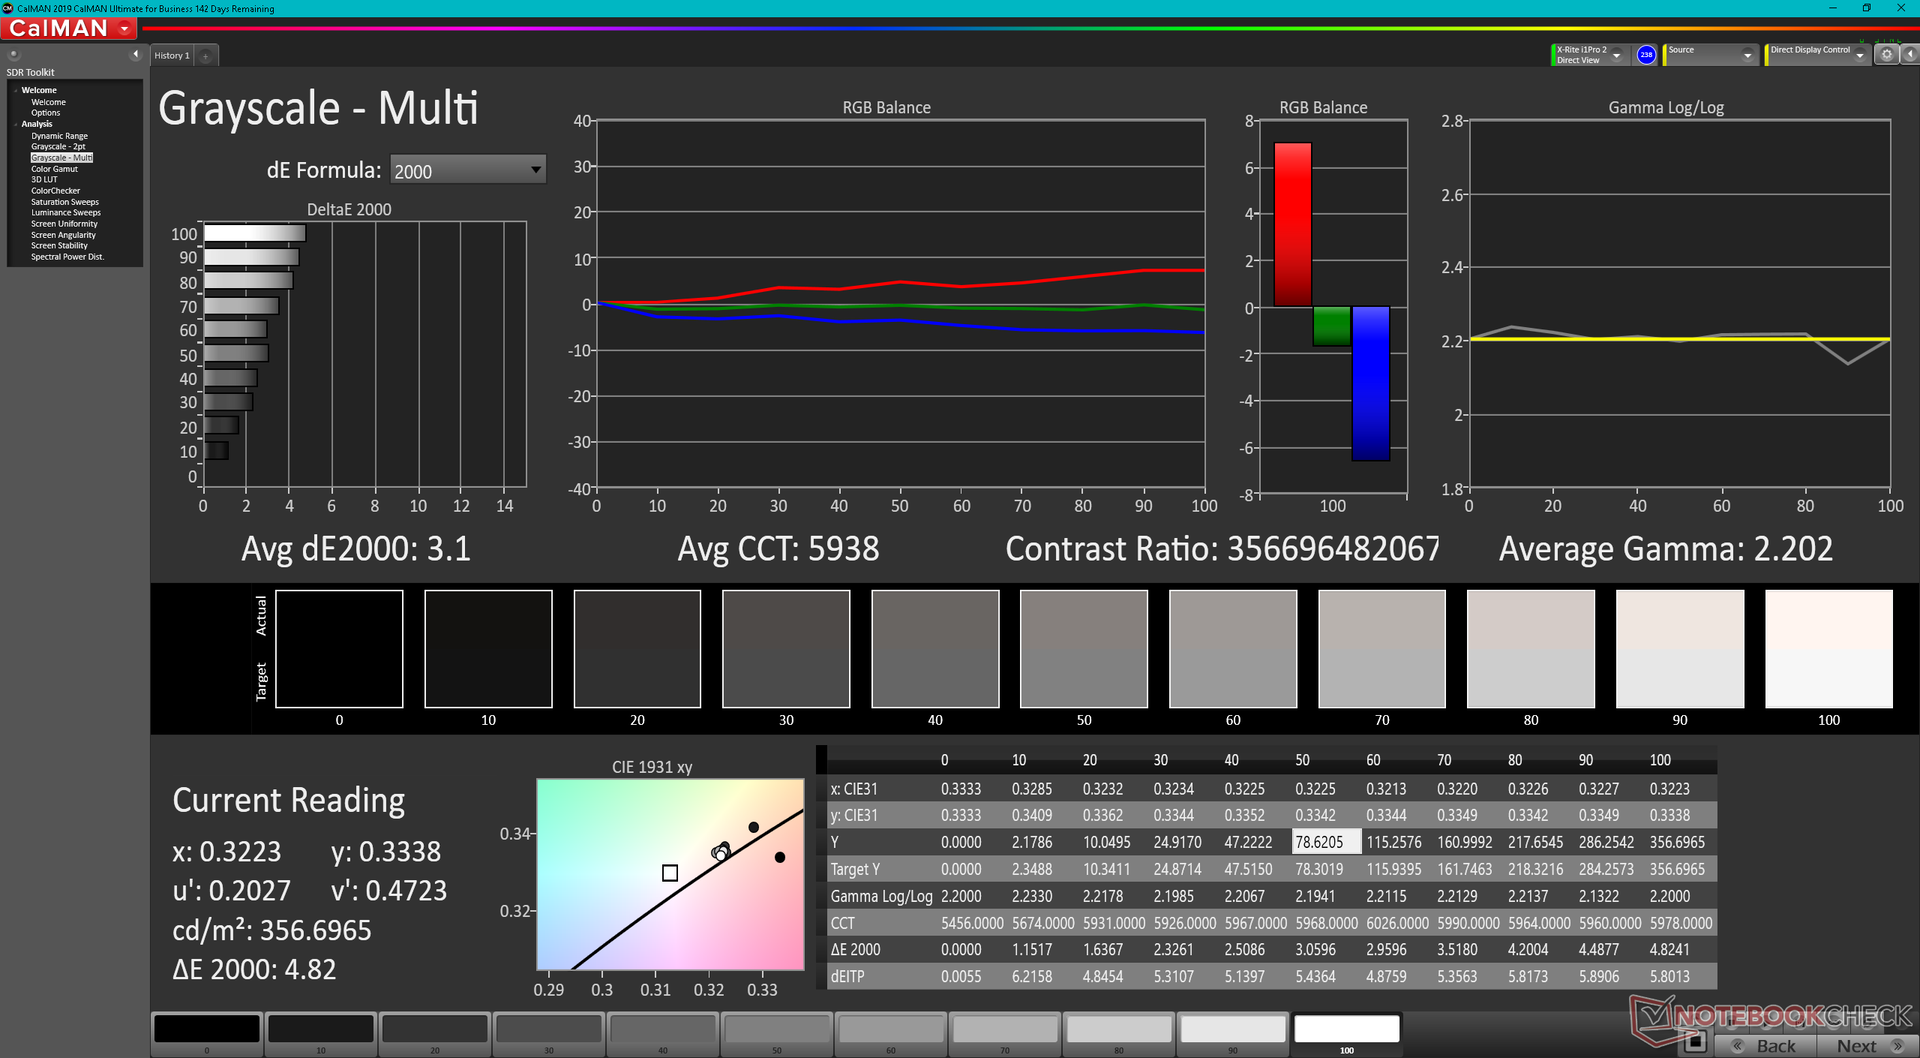
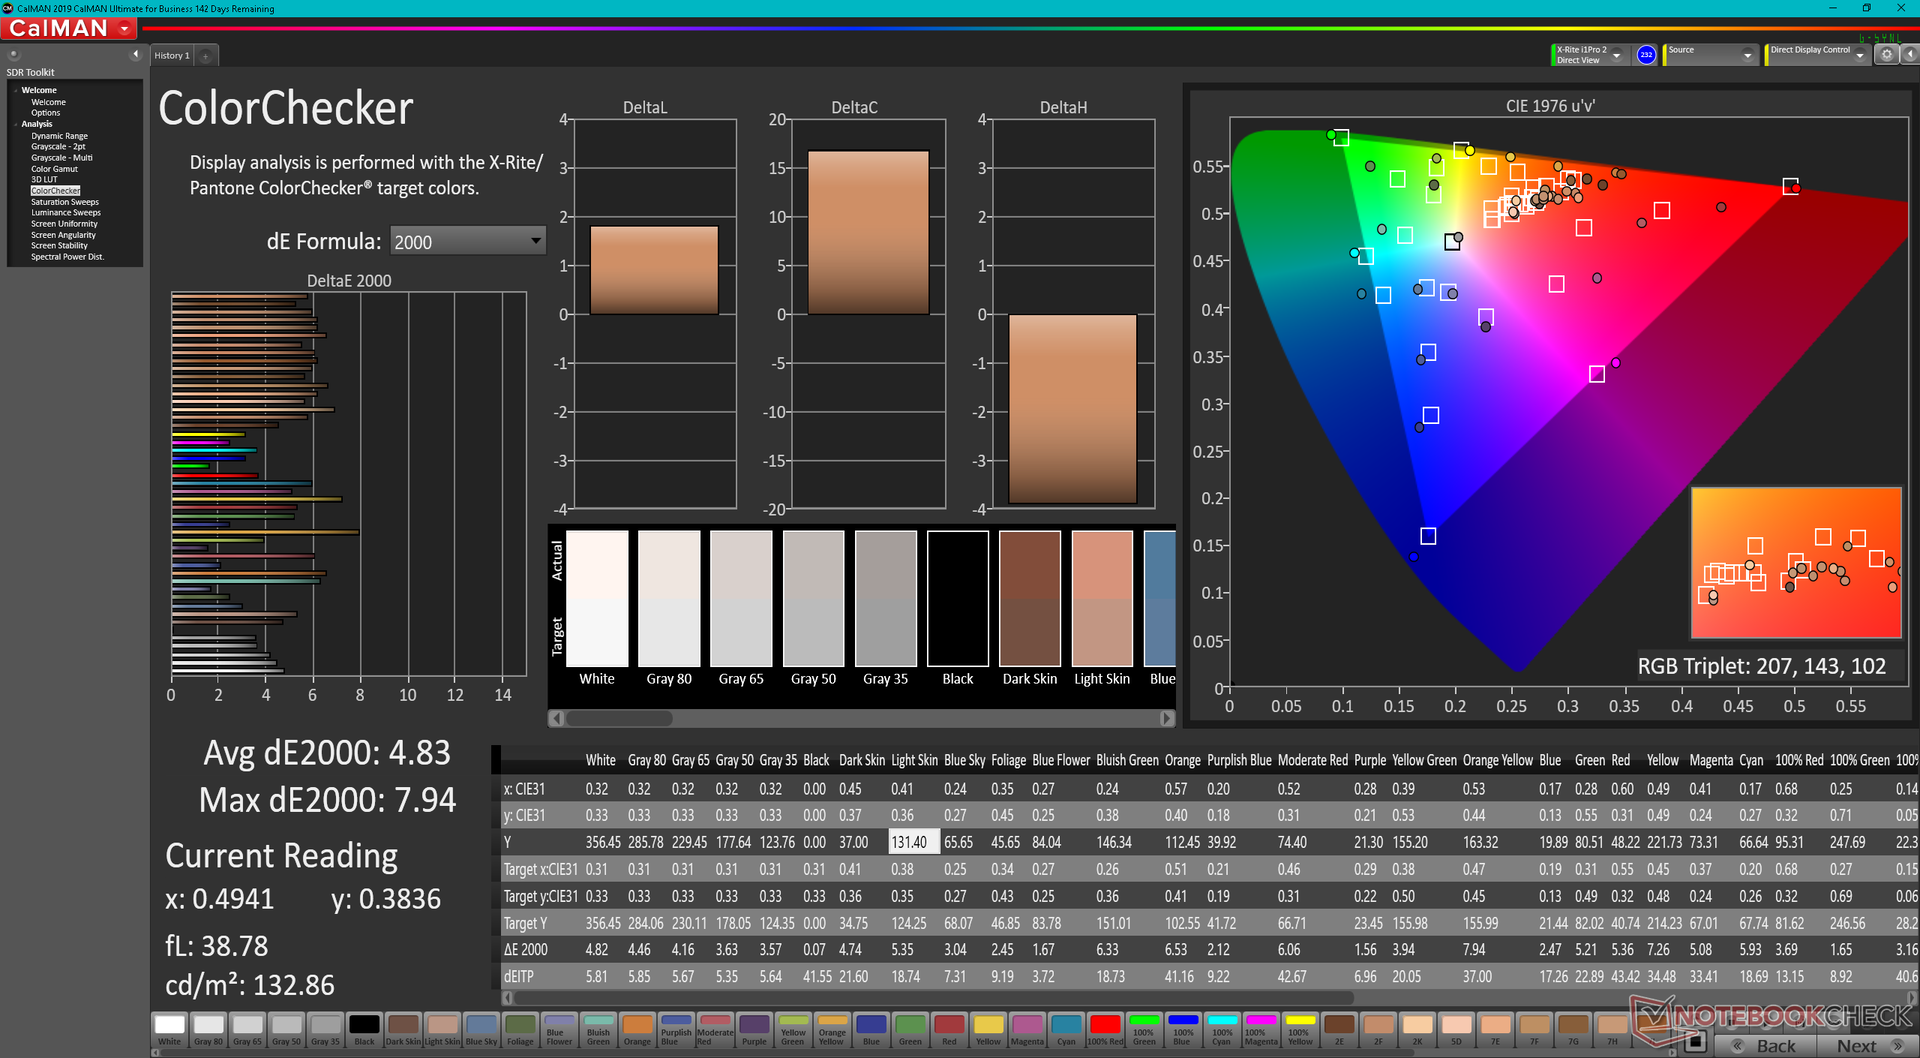
In primo luogo, il display del GE67 non è calibrato in fabbrica, anche se il pannello OLED pubblicizza una copertura completa DCI-P3. In effetti, siamo riusciti a registrare una copertura di appena il 72% e lo stesso software MSI True Color non prevede alcuna opzione DCI-P3 tra cui scegliere. Alla richiesta di un commento, MSI ha risposto che la modalità DCI-P3 è "più per gli editor video e per la nostra serie di laptop Creator" e che il GE67 implementa invece la modalità Display P3
In secondo luogo, il pannello presenta uno sfarfallio a 480 Hz a tutti i livelli di luminosità, compresa l'impostazione del 100%. Abbiamo registrato risultati simili su molti recenti Asus Vivobook e Zenbook OLED. Se gli occhi sono sensibili allo sfarfallio dello schermo, è meglio abbassare la luminosità o evitare di utilizzare il GE67 per lunghi periodi
Infine, il display interno non supporta G-Sync o la sincronizzazione adattiva
A parte gli inconvenienti di cui sopra, il pannello QHD OLED da 240 Hz offre sicuramente una delle esperienze OLED più fluide che abbiamo visto durante i giochi. I pannelli OLED precedenti erano limitati a 60 Hz che, pur essendo perfettamente adatti per l'editing, non sarebbero stati interessanti per i giocatori appassionati. MSI ha modellato il display per i giochi e meno per l'editing o i professionisti.

| |||||||||||||||||||||||||
Distribuzione della luminosità: 99 %
Al centro con la batteria: 356.1 cd/m²
Contrasto: ∞:1 (Nero: 0 cd/m²)
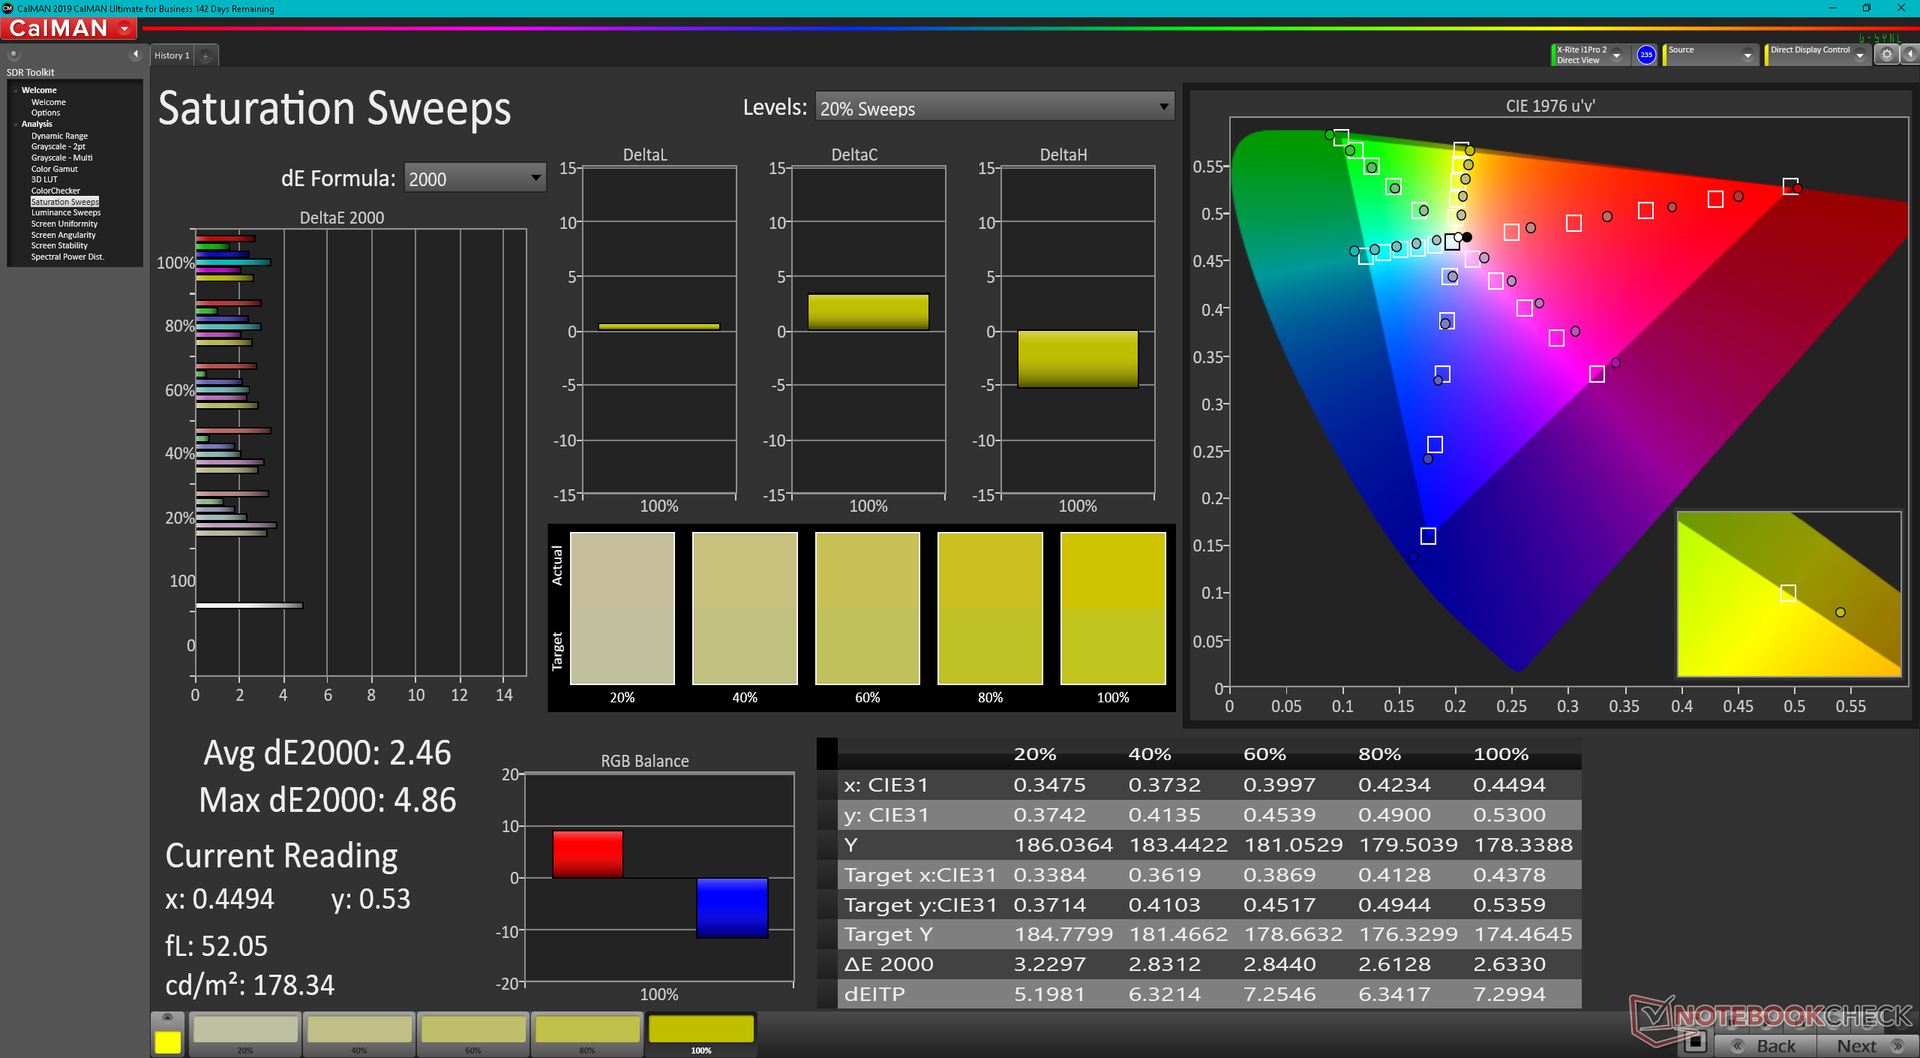
ΔE ColorChecker Calman: 4.83 | ∀{0.5-29.43 Ø4.71}
ΔE Greyscale Calman: 3.1 | ∀{0.09-98 Ø4.96}
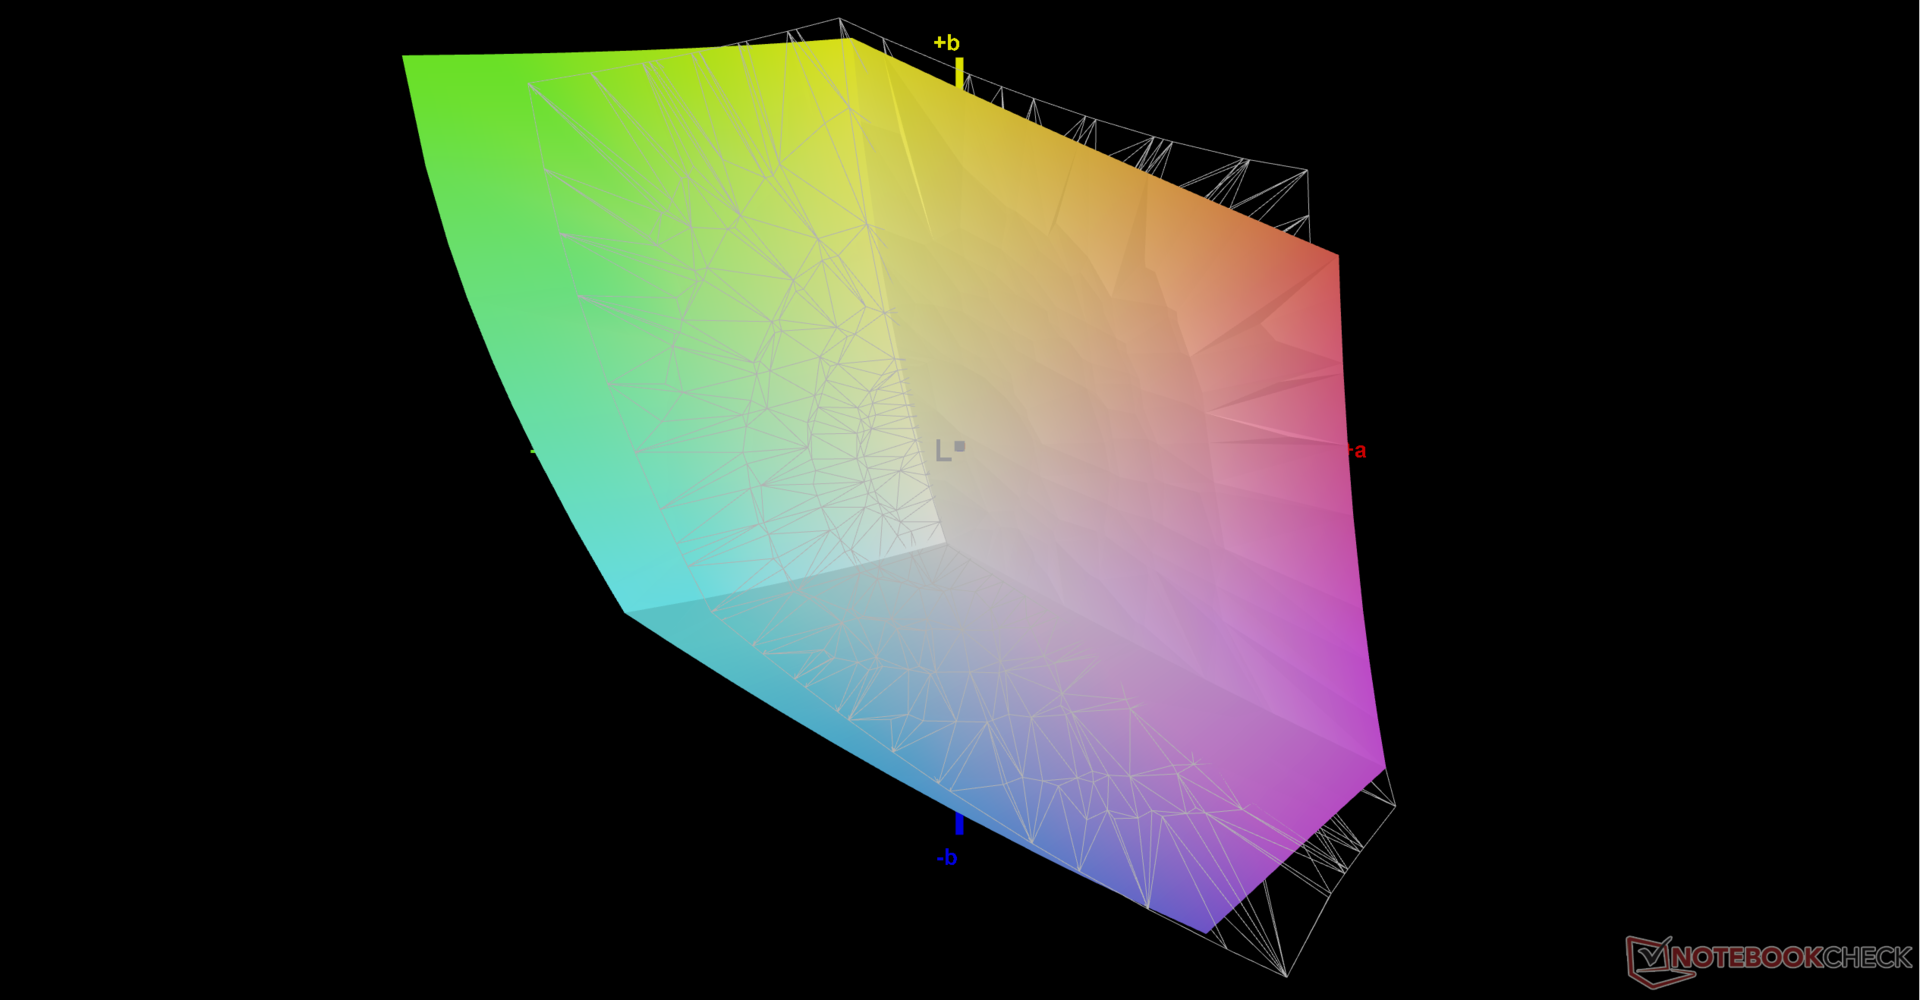
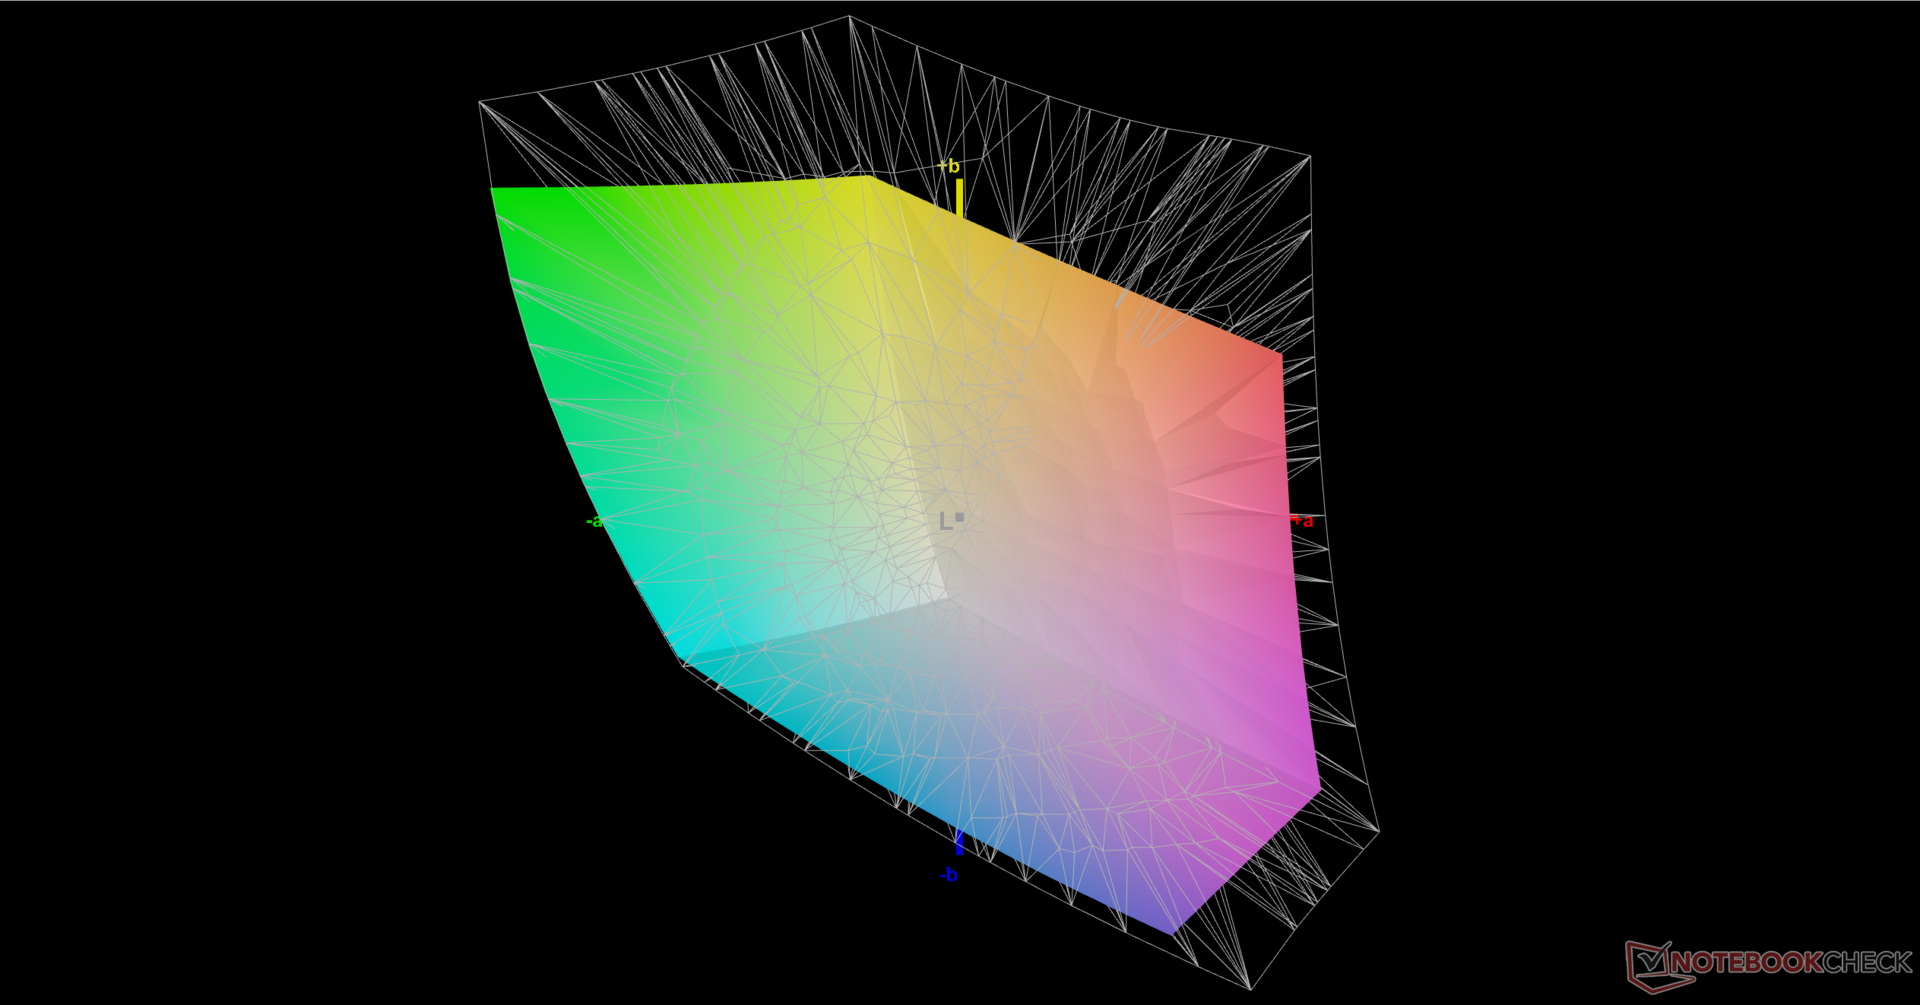
75.2% AdobeRGB 1998 (Argyll 3D)
89.7% sRGB (Argyll 3D)
71.7% Display P3 (Argyll 3D)
Gamma: 2.2
CCT: 5938 K
| MSI GE67 HX 12UGS Samsung ATNA562P02-0, OLED, 1920x1080, 15.6" | MSI Raider GE66 12UHS AUO51EB, IPS, 3840x2160, 15.6" | MSI Vector GP66 12UGS BOE NE156FHM-NZ3, IPS, 1920x1080, 15.6" | Asus ROG Strix Scar 15 G533ZW-LN106WS BOE CQ NE156QHM-NZ2, IPS-level, 2560x1440, 15.6" | Alienware m15 R6, i7-11800H RTX 3080 AU Optronics AUO9092 (B156HAN), IPS, 1920x1080, 15.6" | Razer Blade 15 2022 Sharp LQ156T1JW03, IPS, 2560x1440, 15.6" | |
|---|---|---|---|---|---|---|
| Display | 16% | 2% | 19% | 5% | 21% | |
| Display P3 Coverage (%) | 71.7 | 80.4 12% | 70.1 -2% | 96.2 34% | 74.1 3% | 99.1 38% |
| sRGB Coverage (%) | 89.7 | 98.4 10% | 99.5 11% | 99.9 11% | 99.5 11% | 99.9 11% |
| AdobeRGB 1998 Coverage (%) | 75.2 | 94.7 26% | 72.1 -4% | 84.5 12% | 75.7 1% | 86.8 15% |
| Response Times | -5260% | -2260% | -2134% | -1160% | -4230% | |
| Response Time Grey 50% / Grey 80% * (ms) | 0.25 ? | 18.8 ? -7420% | 5.8 ? -2220% | 7.86 ? -3044% 4.21 ? -1584% | 2.8 -1020% | 14.4 ? -5660% |
| Response Time Black / White * (ms) | 0.4 ? | 12.8 ? -3100% | 9.6 ? -2300% | 7.5 ? -1775% | 5.6 -1300% | 11.6 ? -2800% |
| PWM Frequency (Hz) | 480.4 ? | |||||
| Screen | -1% | 6% | 9% | 6% | 15% | |
| Brightness middle (cd/m²) | 356.1 | 351 -1% | 353.1 -1% | 346 -3% | 359 1% | 286 -20% |
| Brightness (cd/m²) | 358 | 347 -3% | 325 -9% | 329 -8% | 344 -4% | 271 -24% |
| Brightness Distribution (%) | 99 | 90 -9% | 85 -14% | 91 -8% | 85 -14% | 89 -10% |
| Black Level * (cd/m²) | 0.35 | 0.38 | 0.59 | 0.35 | 0.25 | |
| Colorchecker dE 2000 * | 4.83 | 2.54 47% | 2.24 54% | 3.06 37% | 3.3 32% | 2.74 43% |
| Colorchecker dE 2000 max. * | 7.94 | 8.36 -5% | 5 37% | 5.81 27% | 4.84 39% | 5.21 34% |
| Greyscale dE 2000 * | 3.1 | 4.1 -32% | 4 -29% | 3.66 -18% | 1.1 65% | |
| Gamma | 2.2 100% | 2.089 105% | 2.24 98% | 2.12 104% | 2.43 91% | 2.2 100% |
| CCT | 5938 109% | 7036 92% | 6864 95% | 7021 93% | 5896 110% | 6408 101% |
| Contrast (:1) | 1003 | 929 | 586 | 1026 | 1144 | |
| Colorchecker dE 2000 calibrated * | 0.67 | 1.02 | 2.57 | 3.28 | 2.52 | |
| Media totale (Programma / Settaggio) | -1748% /
-952% | -751% /
-407% | -702% /
-573% | -383% /
-206% | -1398% /
-755% |
* ... Meglio usare valori piccoli
Tempi di risposta del Display
| ↔ Tempi di risposta dal Nero al Bianco | ||
|---|---|---|
| 0.4 ms ... aumenta ↗ e diminuisce ↘ combinato | ↗ 0.2 ms Incremento | 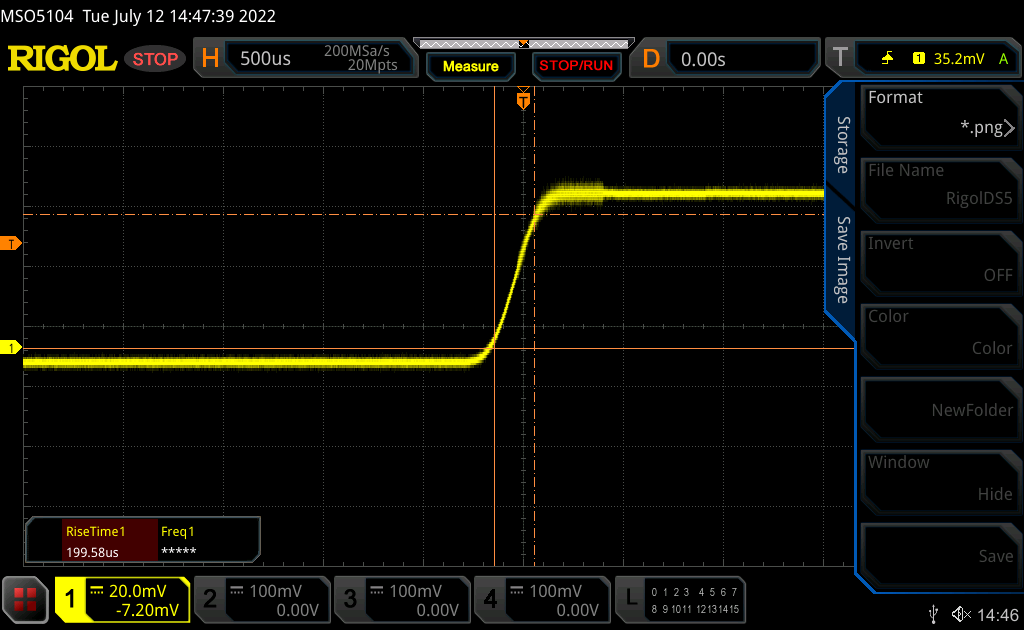 |
| ↘ 0.2 ms Calo | ||
| Lo schermo ha mostrato valori di risposta molto veloci nei nostri tests ed è molto adatto per i gaming veloce. In confronto, tutti i dispositivi di test variano da 0.1 (minimo) a 240 (massimo) ms. » 0 % di tutti i dispositivi è migliore. Questo significa che i tempi di risposta rilevati sono migliori rispettto alla media di tutti i dispositivi testati (19.8 ms). | ||
| ↔ Tempo di risposta dal 50% Grigio all'80% Grigio | ||
| 0.25 ms ... aumenta ↗ e diminuisce ↘ combinato | ↗ 0.13 ms Incremento | 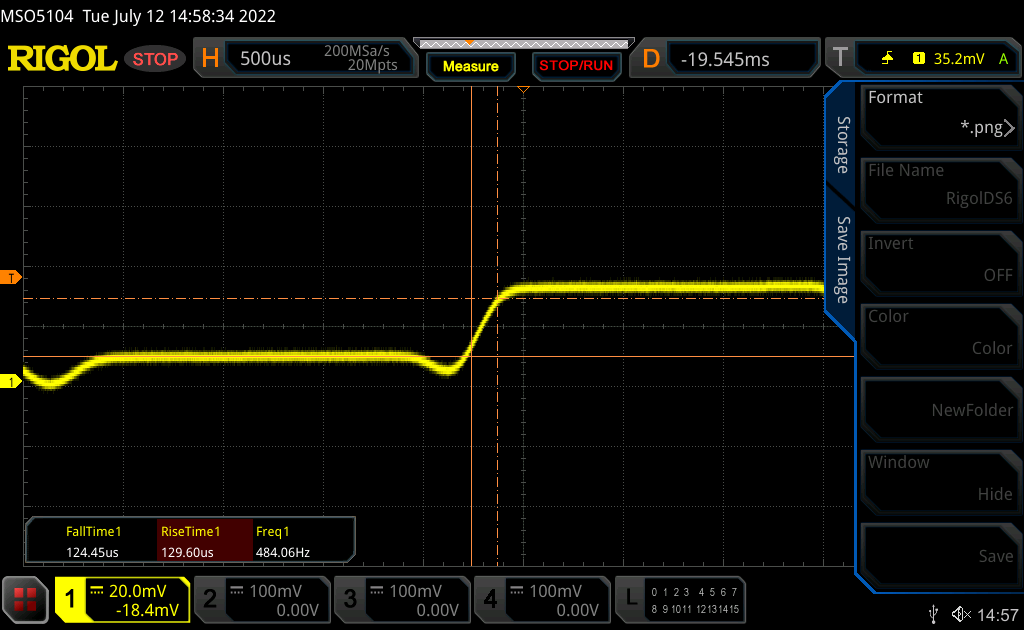 |
| ↘ 0.12 ms Calo | ||
| Lo schermo ha mostrato valori di risposta molto veloci nei nostri tests ed è molto adatto per i gaming veloce. In confronto, tutti i dispositivi di test variano da 0.165 (minimo) a 636 (massimo) ms. » 0 % di tutti i dispositivi è migliore. Questo significa che i tempi di risposta rilevati sono migliori rispettto alla media di tutti i dispositivi testati (30.9 ms). | ||
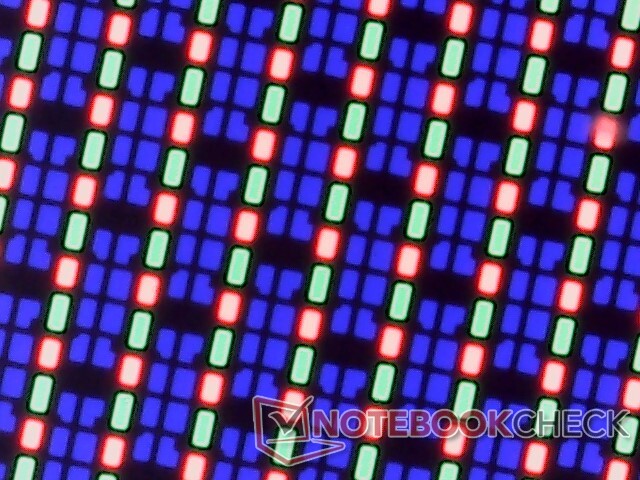
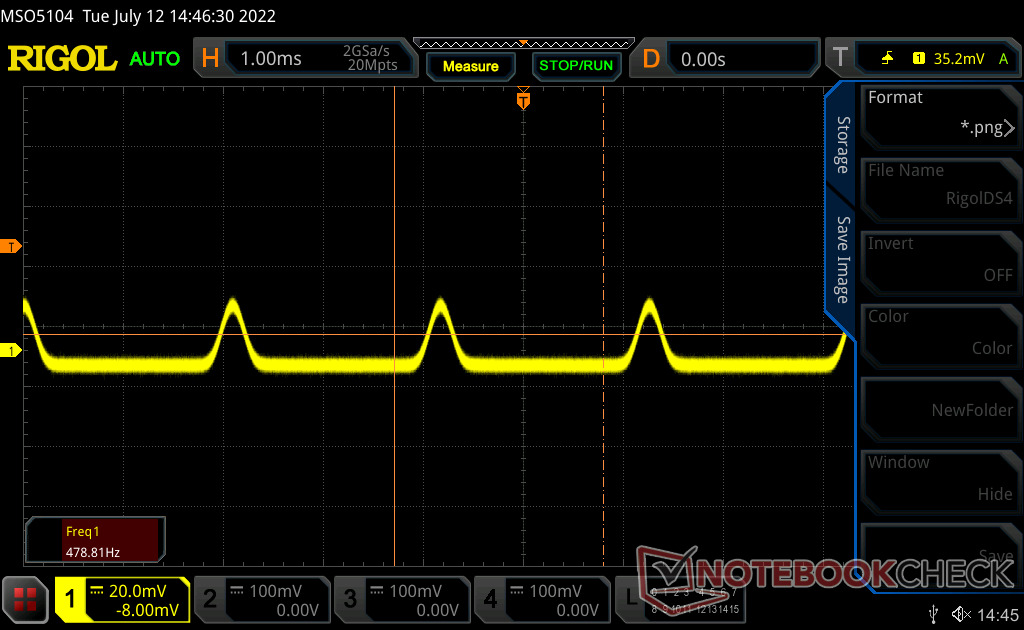
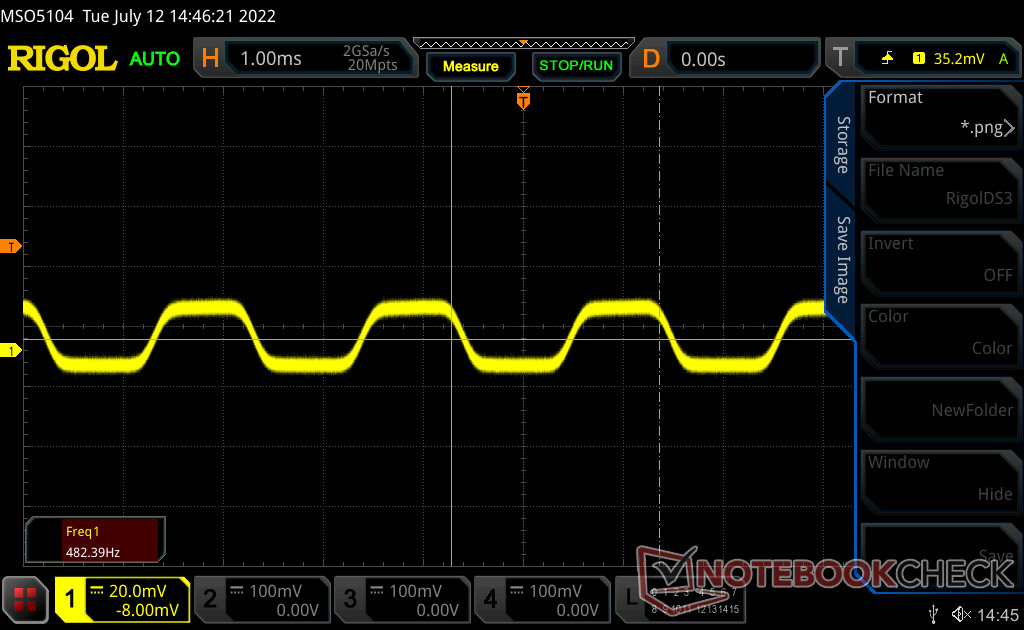
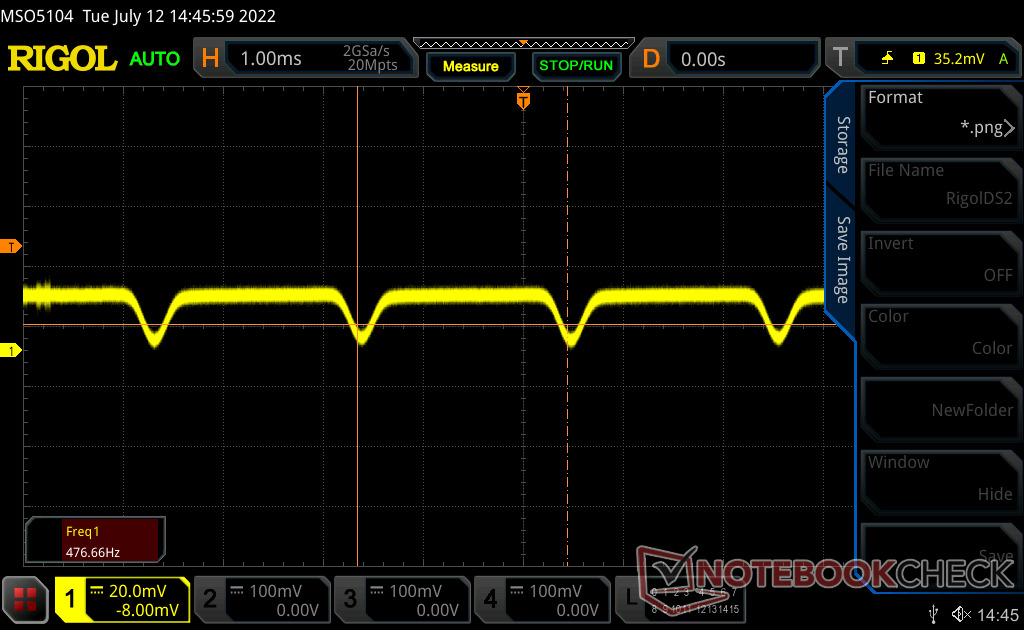
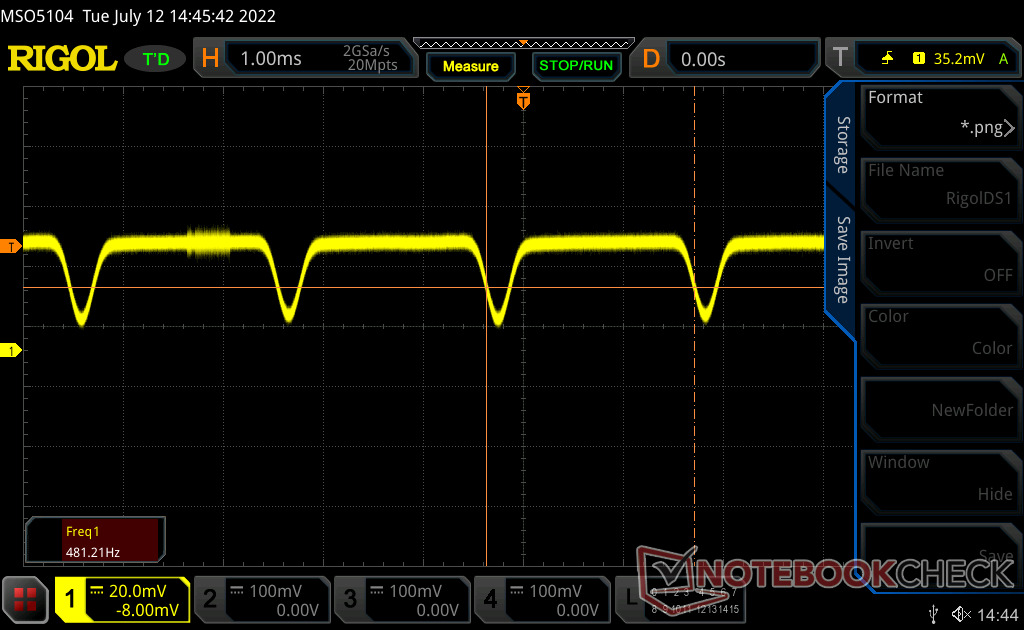
Sfarfallio dello schermo / PWM (Pulse-Width Modulation)
| flickering dello schermo / PWM rilevato | 480.4 Hz | ≤ 100 % settaggio luminosita' | 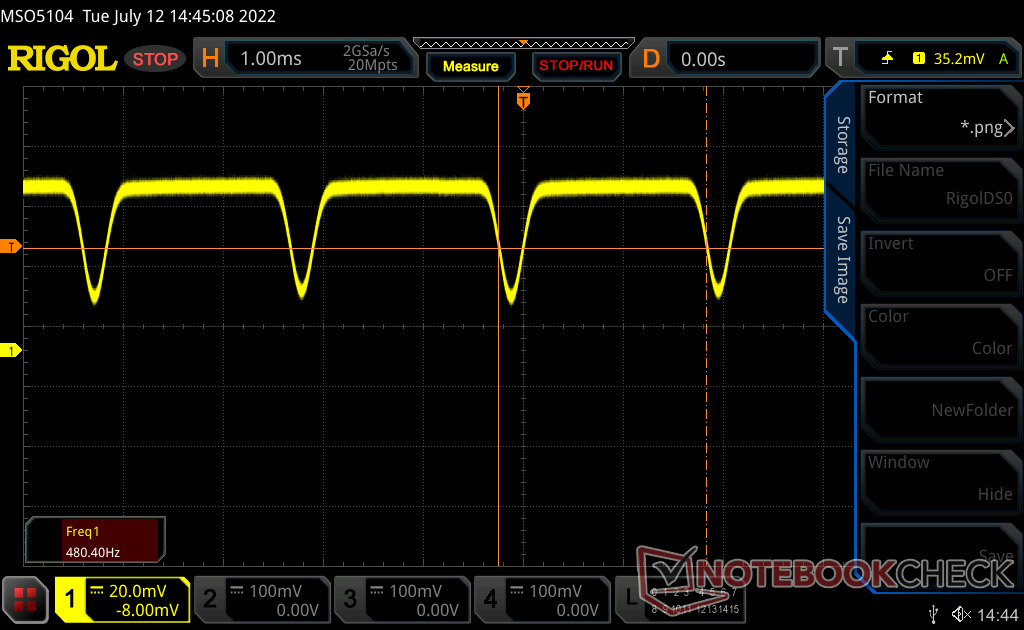 |
Il display sfarfalla a 480.4 Hz (Probabilmente a causa dell'uso di PWM) Flickering rilevato ad una luminosita' di 100 % o inferiore. Non dovrebbe verificarsi flickering o PWM sopra questo valore di luminosita'. La frequenza di 480.4 Hz è relativamente elevata, quindi la maggioranza degli utenti sensibili al PWM non dovrebbe notare alcun flickering. Tuttavia, è stato segnalato che alcuni utenti sono sensibili al PWM a 500 Hz ed oltre, quindi prestate attenzione. In confronto: 52 % di tutti i dispositivi testati non utilizza PWM per ridurre la luminosita' del display. Se è rilevato PWM, una media di 7741 (minimo: 5 - massimo: 343500) Hz è stata rilevata. | |||


Prestazioni - 16 core e 24 thread
Condizioni di test
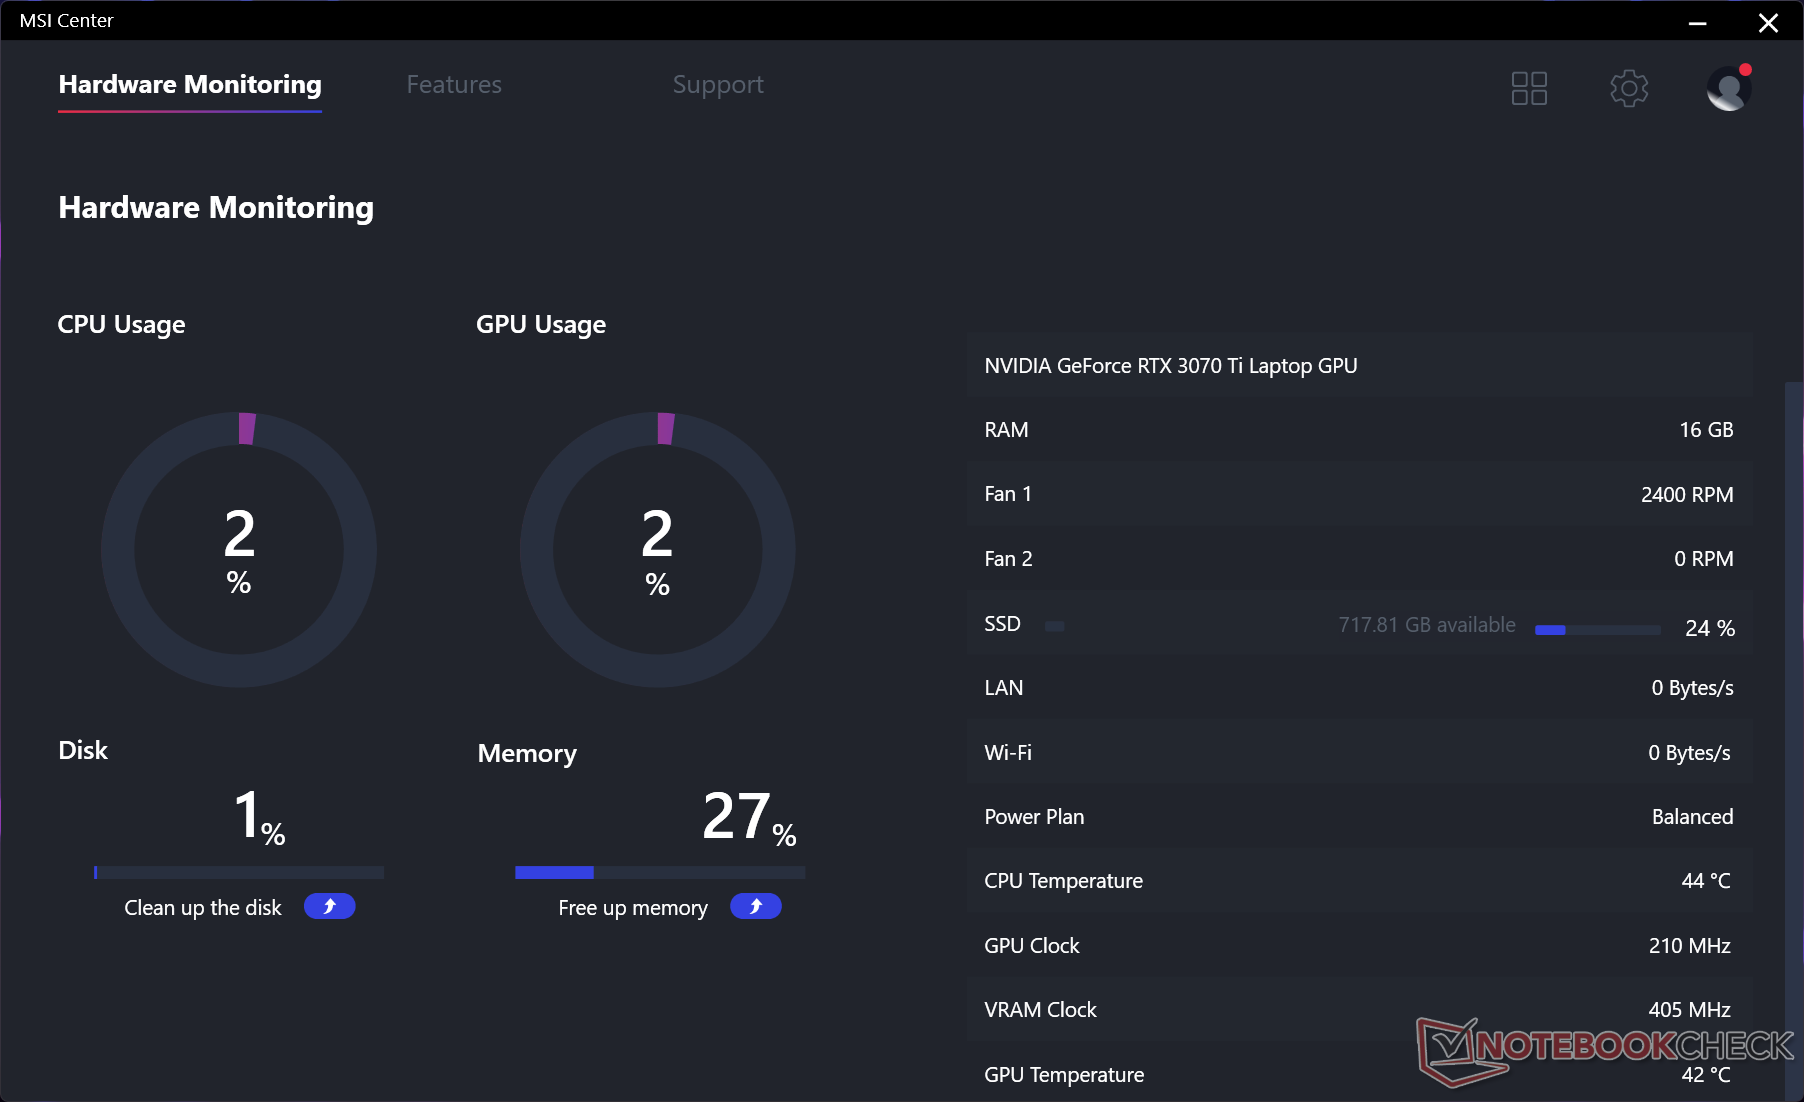
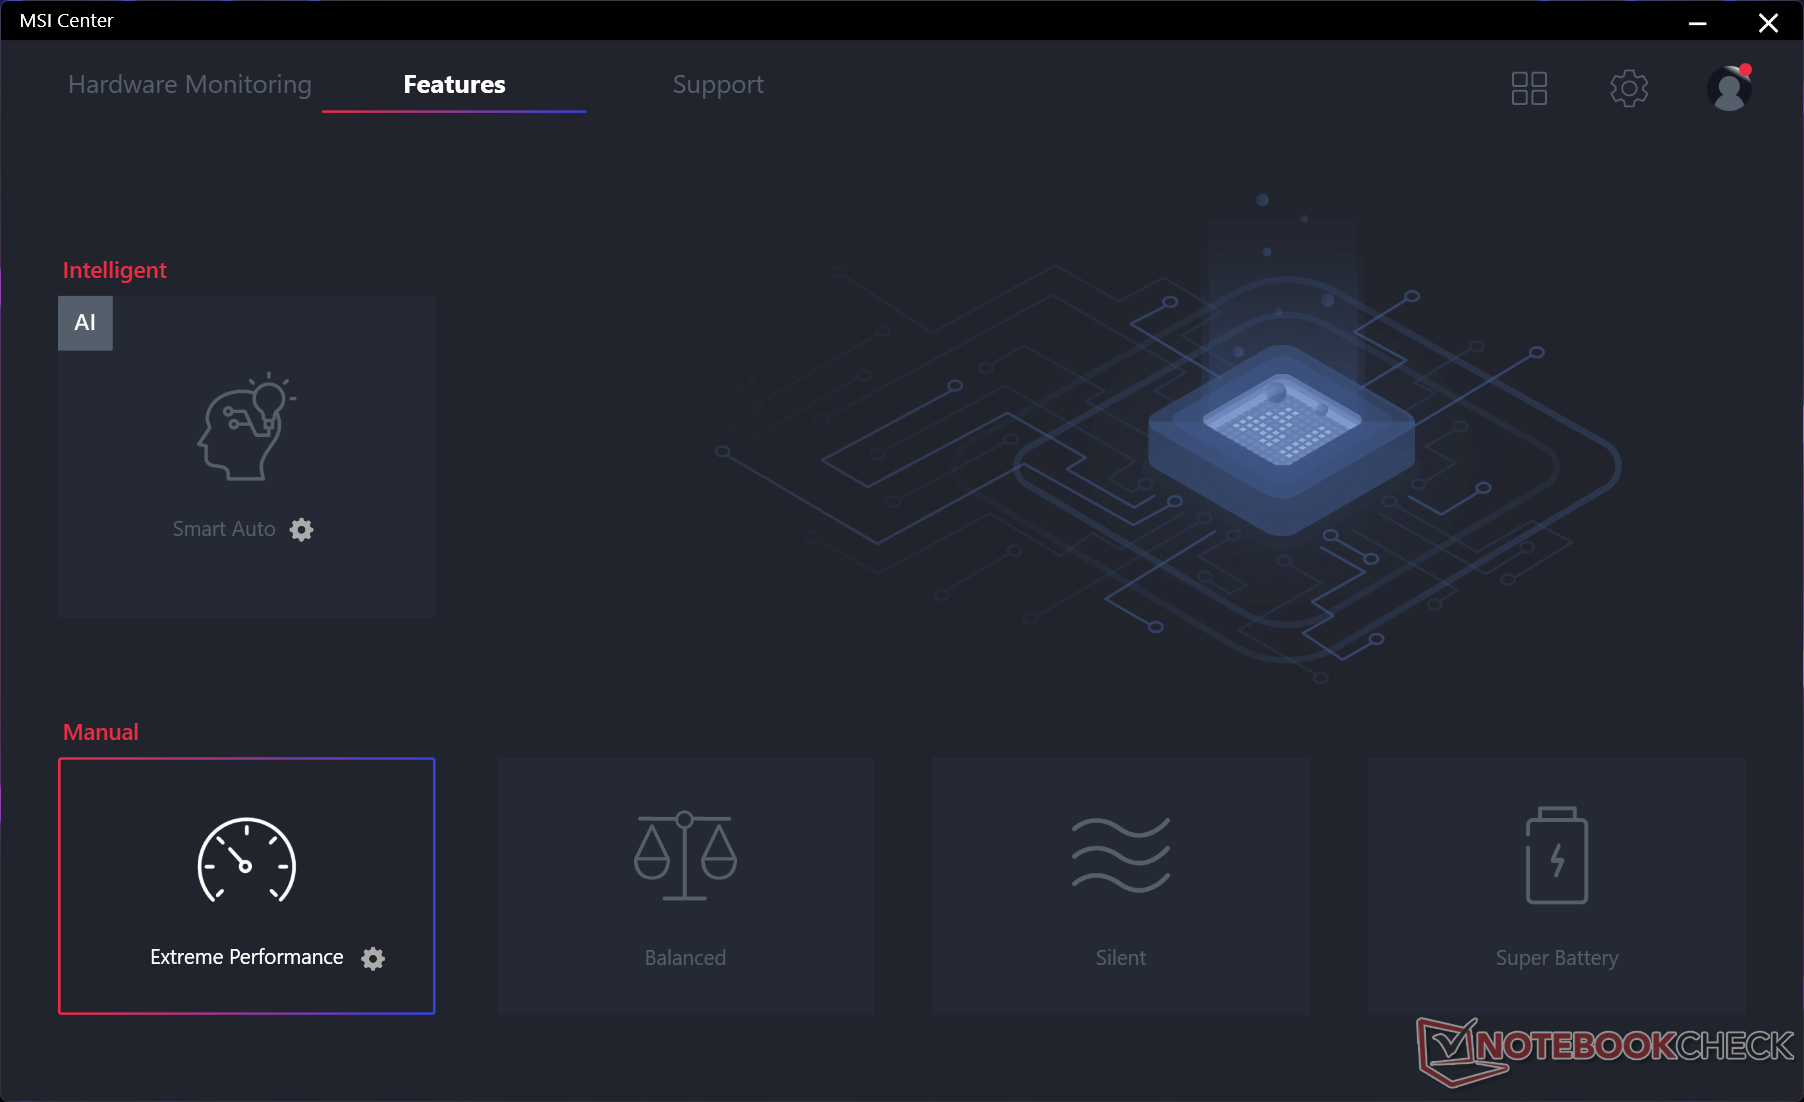
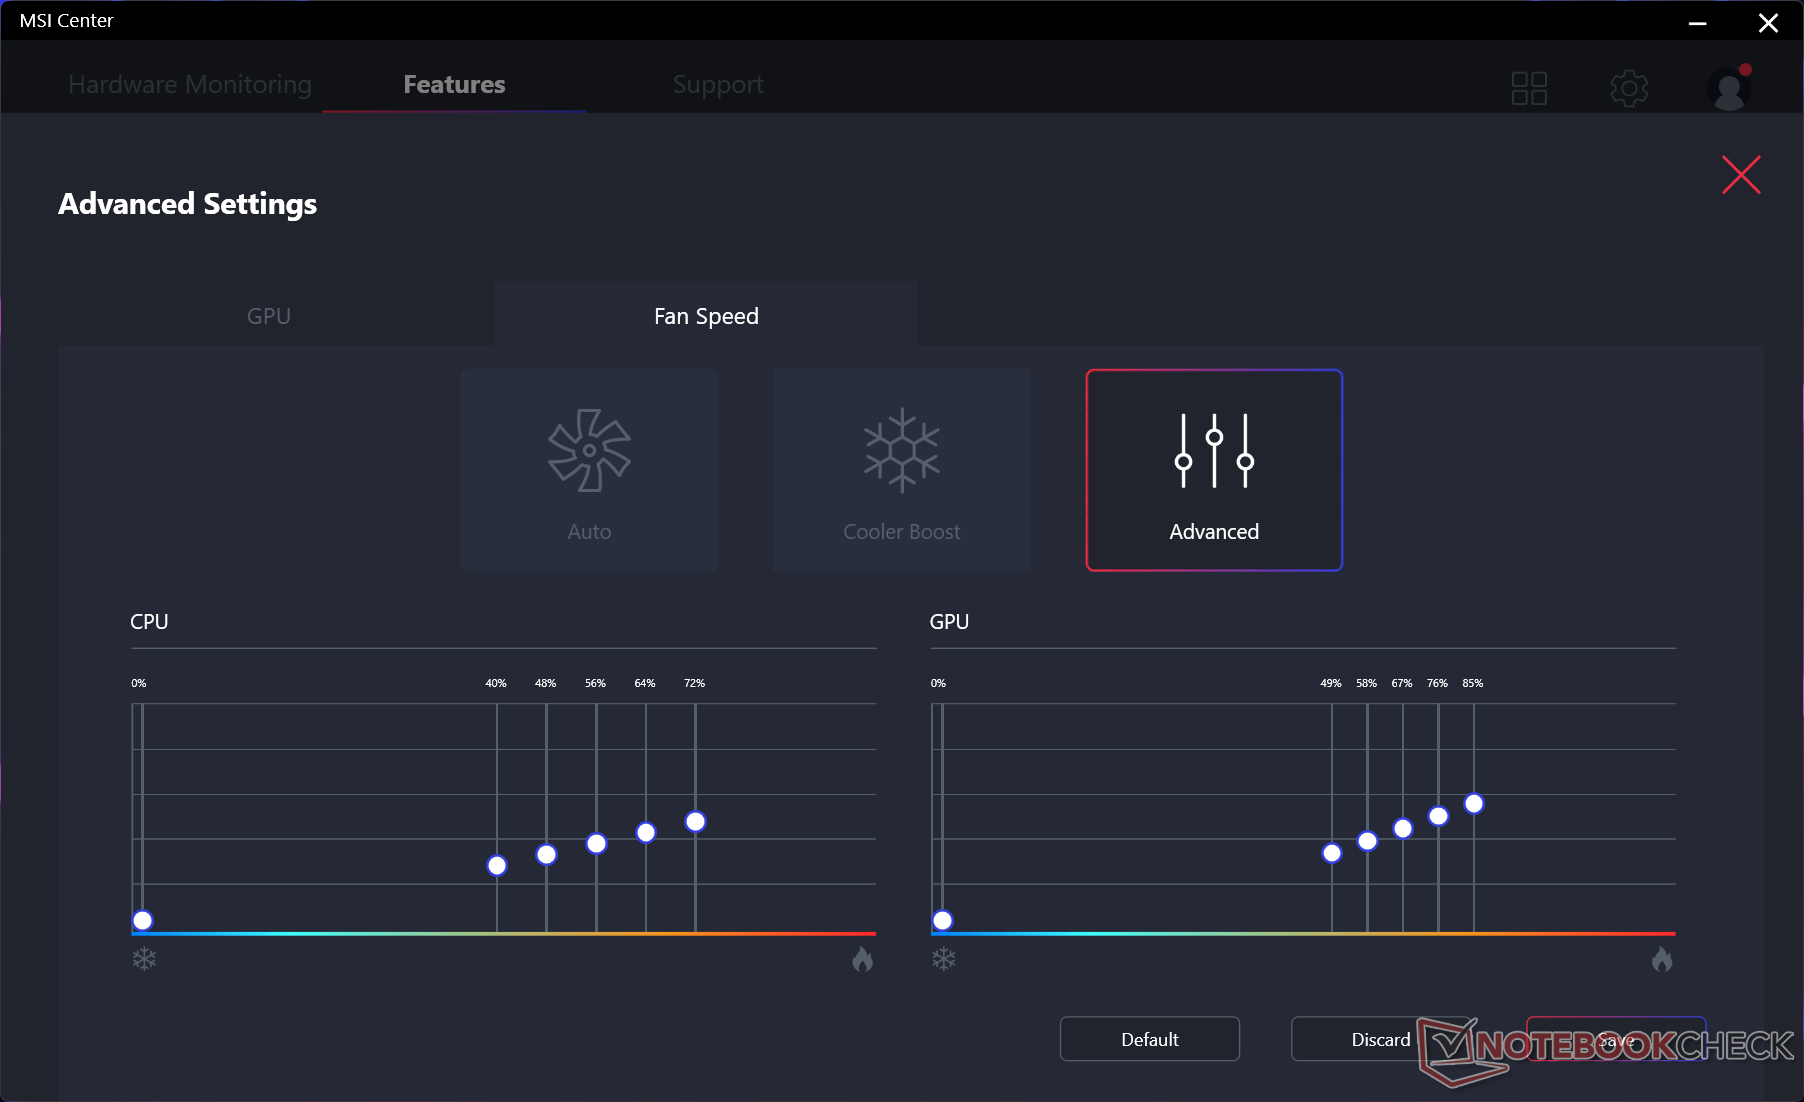
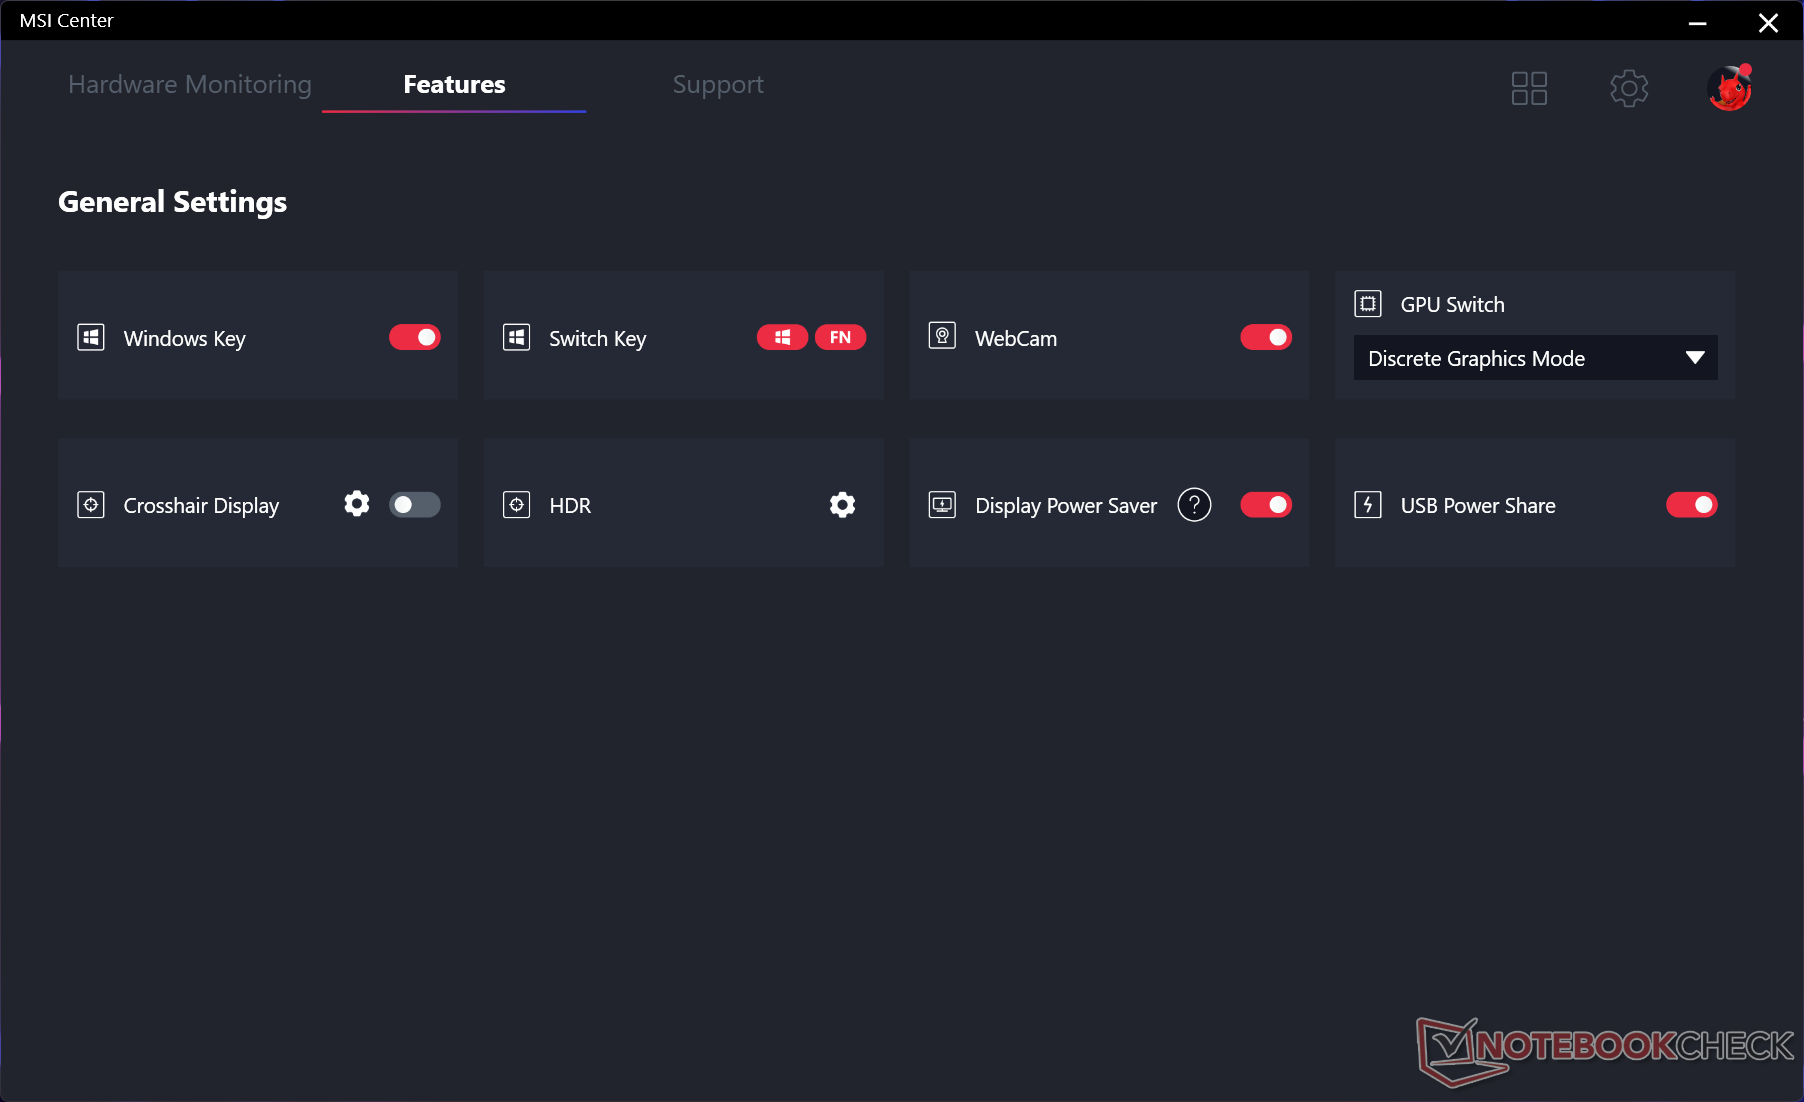
Abbiamo impostato la nostra unità in modalità Performance tramite Windows, in modalità Extreme Performance tramite MSI Center e con la GPU discreta attiva invece della modalità MSHybrid prima di eseguire i benchmark qui sotto. Raccomandiamo agli utenti di familiarizzare con il software MSI Center preinstallato, in quanto qui vengono attivate le principali funzioni prestazionali e ausiliarie.
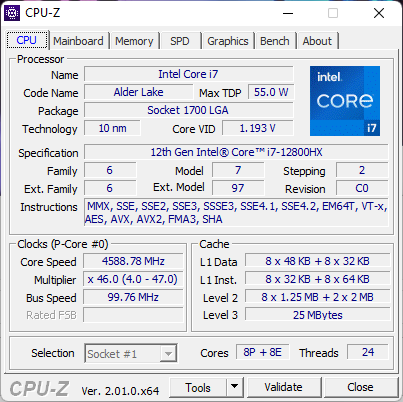
Processore
IlCore i7-12800HX è un punto di forza del GE67 HX. Le prestazioni multi-thread grezze sono circa il 25% più veloci rispetto alCore i9-12900HK nel GE66 Q1 2022 e questo delta è ancora maggiore se confrontato con il Core i9-12900HK di 10a generazione Core i9-10980HK nel GE66 originale del 2020. Questo processore supera facilmente qualsiasi processore mobile della linea Zen 3 di AMD. Il Ryzen 9 5900HXad esempio, è più lento del 40-45% nei carichi multi-thread
Anche la sostenibilità delle prestazioni è molto buona: non si registrano cali di clock significativi nel corso del tempo, anche quando il processore viene sollecitato per lunghi periodi
Le prestazioni a thread singolo rimangono simili a quelle del Core i9-12900HK, nonostante le differenze nel numero di core (16 contro 14) e di thread (24 contro 20).
Cinebench R15 Multi Loop
Cinebench R23: Multi Core | Single Core
Cinebench R15: CPU Multi 64Bit | CPU Single 64Bit
Blender: v2.79 BMW27 CPU
7-Zip 18.03: 7z b 4 | 7z b 4 -mmt1
Geekbench 5.5: Multi-Core | Single-Core
HWBOT x265 Benchmark v2.2: 4k Preset
LibreOffice : 20 Documents To PDF
R Benchmark 2.5: Overall mean
| Cinebench R23 / Multi Core | |
| Intel Core i9-12900K | |
| MSI GE67 HX 12UGS | |
| Media Intel Core i7-12800HX (n=1) | |
| MSI GE76 Raider | |
| Schenker XMG Neo 15 (i7-12700H, RTX 3080 Ti) | |
| Eurocom Raptor X15 | |
| Asus ROG Strix Scar 15 G533zm | |
| MSI Raider GE66 12UHS | |
| Schenker XMG Apex 15 NH57E PS | |
| MSI Delta 15 A5EFK | |
| Cinebench R23 / Single Core | |
| Intel Core i9-12900K | |
| MSI GE76 Raider | |
| MSI Raider GE66 12UHS | |
| MSI GE67 HX 12UGS | |
| Media Intel Core i7-12800HX (n=1) | |
| Schenker XMG Neo 15 (i7-12700H, RTX 3080 Ti) | |
| Eurocom Raptor X15 | |
| Asus ROG Strix Scar 15 G533zm | |
| MSI Delta 15 A5EFK | |
| Schenker XMG Apex 15 NH57E PS | |
Cinebench R23: Multi Core | Single Core
Cinebench R15: CPU Multi 64Bit | CPU Single 64Bit
Blender: v2.79 BMW27 CPU
7-Zip 18.03: 7z b 4 | 7z b 4 -mmt1
Geekbench 5.5: Multi-Core | Single-Core
HWBOT x265 Benchmark v2.2: 4k Preset
LibreOffice : 20 Documents To PDF
R Benchmark 2.5: Overall mean
* ... Meglio usare valori piccoli
AIDA64: FP32 Ray-Trace | FPU Julia | CPU SHA3 | CPU Queen | FPU SinJulia | FPU Mandel | CPU AES | CPU ZLib | FP64 Ray-Trace | CPU PhotoWorxx
| Performance rating | |
| Alienware m15 R6, i7-11800H RTX 3080 | |
| MSI GE67 HX 12UGS | |
| Media Intel Core i7-12800HX | |
| Asus ROG Strix Scar 15 G533ZW-LN106WS | |
| MSI Raider GE66 12UHS | |
| MSI Vector GP66 12UGS | |
| Razer Blade 15 2022 | |
| AIDA64 / FP32 Ray-Trace | |
| Alienware m15 R6, i7-11800H RTX 3080 | |
| MSI GE67 HX 12UGS | |
| Media Intel Core i7-12800HX (n=1) | |
| Asus ROG Strix Scar 15 G533ZW-LN106WS | |
| MSI Raider GE66 12UHS | |
| MSI Vector GP66 12UGS | |
| Razer Blade 15 2022 | |
| AIDA64 / FPU Julia | |
| Alienware m15 R6, i7-11800H RTX 3080 | |
| MSI GE67 HX 12UGS | |
| Media Intel Core i7-12800HX (n=1) | |
| Asus ROG Strix Scar 15 G533ZW-LN106WS | |
| MSI Raider GE66 12UHS | |
| MSI Vector GP66 12UGS | |
| Razer Blade 15 2022 | |
| AIDA64 / CPU SHA3 | |
| Alienware m15 R6, i7-11800H RTX 3080 | |
| MSI GE67 HX 12UGS | |
| Media Intel Core i7-12800HX (n=1) | |
| Asus ROG Strix Scar 15 G533ZW-LN106WS | |
| MSI Vector GP66 12UGS | |
| MSI Raider GE66 12UHS | |
| Razer Blade 15 2022 | |
| AIDA64 / CPU Queen | |
| MSI Vector GP66 12UGS | |
| MSI Raider GE66 12UHS | |
| Asus ROG Strix Scar 15 G533ZW-LN106WS | |
| Razer Blade 15 2022 | |
| Alienware m15 R6, i7-11800H RTX 3080 | |
| MSI GE67 HX 12UGS | |
| Media Intel Core i7-12800HX (n=1) | |
| AIDA64 / FPU SinJulia | |
| MSI GE67 HX 12UGS | |
| Media Intel Core i7-12800HX (n=1) | |
| Asus ROG Strix Scar 15 G533ZW-LN106WS | |
| Alienware m15 R6, i7-11800H RTX 3080 | |
| MSI Vector GP66 12UGS | |
| MSI Raider GE66 12UHS | |
| Razer Blade 15 2022 | |
| AIDA64 / FPU Mandel | |
| Alienware m15 R6, i7-11800H RTX 3080 | |
| MSI GE67 HX 12UGS | |
| Media Intel Core i7-12800HX (n=1) | |
| Asus ROG Strix Scar 15 G533ZW-LN106WS | |
| MSI Raider GE66 12UHS | |
| MSI Vector GP66 12UGS | |
| Razer Blade 15 2022 | |
| AIDA64 / CPU AES | |
| Alienware m15 R6, i7-11800H RTX 3080 | |
| MSI GE67 HX 12UGS | |
| Media Intel Core i7-12800HX (n=1) | |
| Asus ROG Strix Scar 15 G533ZW-LN106WS | |
| MSI Vector GP66 12UGS | |
| MSI Raider GE66 12UHS | |
| Razer Blade 15 2022 | |
| AIDA64 / CPU ZLib | |
| MSI GE67 HX 12UGS | |
| Media Intel Core i7-12800HX (n=1) | |
| Asus ROG Strix Scar 15 G533ZW-LN106WS | |
| MSI Vector GP66 12UGS | |
| MSI Raider GE66 12UHS | |
| Razer Blade 15 2022 | |
| Alienware m15 R6, i7-11800H RTX 3080 | |
| AIDA64 / FP64 Ray-Trace | |
| Alienware m15 R6, i7-11800H RTX 3080 | |
| MSI GE67 HX 12UGS | |
| Media Intel Core i7-12800HX (n=1) | |
| Asus ROG Strix Scar 15 G533ZW-LN106WS | |
| MSI Raider GE66 12UHS | |
| MSI Vector GP66 12UGS | |
| Razer Blade 15 2022 | |
| AIDA64 / CPU PhotoWorxx | |
| Razer Blade 15 2022 | |
| MSI Raider GE66 12UHS | |
| Asus ROG Strix Scar 15 G533ZW-LN106WS | |
| MSI GE67 HX 12UGS | |
| Media Intel Core i7-12800HX (n=1) | |
| MSI Vector GP66 12UGS | |
| Alienware m15 R6, i7-11800H RTX 3080 | |
Prestazioni del sistema
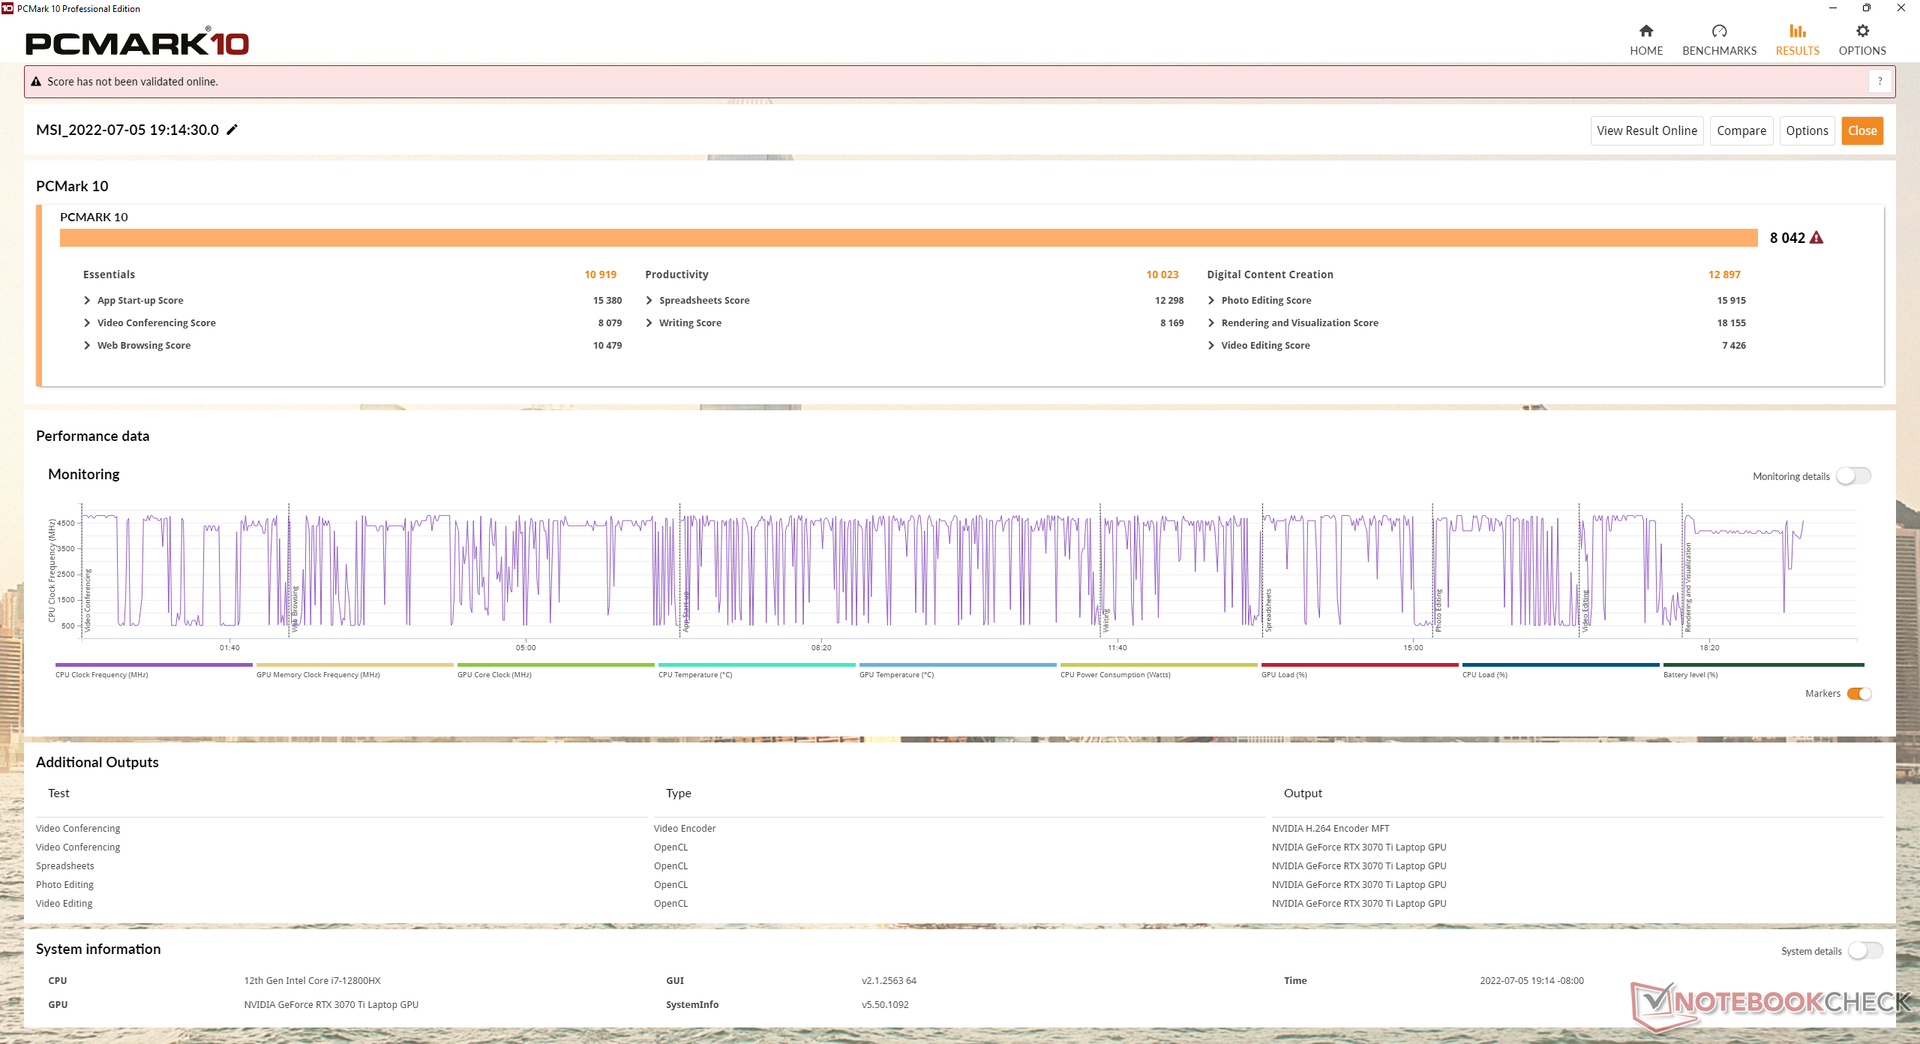
I risultati di PCMark 10 sono tra i più alti del nostro database, con punteggi simili a quelli osservati sul vecchio GE66 con il più lento Core i9-12900HK ma la più veloce GeForce RTX 3080 Ti.
È interessante notare che il subscore Digital Content Creation scende da 12897 punti a soli 9568 punti con la modalità MSHybrid.
CrossMark: Overall | Productivity | Creativity | Responsiveness
| PCMark 10 / Score | |
| MSI Raider GE66 12UHS | |
| MSI GE67 HX 12UGS | |
| Media Intel Core i7-12800HX, NVIDIA GeForce RTX 3070 Ti Laptop GPU (n=1) | |
| MSI Vector GP66 12UGS | |
| Asus ROG Strix Scar 15 G533ZW-LN106WS | |
| Razer Blade 15 2022 | |
| Alienware m15 R6, i7-11800H RTX 3080 | |
| PCMark 10 / Essentials | |
| MSI Raider GE66 12UHS | |
| MSI Vector GP66 12UGS | |
| MSI GE67 HX 12UGS | |
| Media Intel Core i7-12800HX, NVIDIA GeForce RTX 3070 Ti Laptop GPU (n=1) | |
| Razer Blade 15 2022 | |
| Asus ROG Strix Scar 15 G533ZW-LN106WS | |
| Alienware m15 R6, i7-11800H RTX 3080 | |
| PCMark 10 / Productivity | |
| Asus ROG Strix Scar 15 G533ZW-LN106WS | |
| MSI Raider GE66 12UHS | |
| MSI Vector GP66 12UGS | |
| MSI GE67 HX 12UGS | |
| Media Intel Core i7-12800HX, NVIDIA GeForce RTX 3070 Ti Laptop GPU (n=1) | |
| Razer Blade 15 2022 | |
| Alienware m15 R6, i7-11800H RTX 3080 | |
| PCMark 10 / Digital Content Creation | |
| MSI GE67 HX 12UGS | |
| Media Intel Core i7-12800HX, NVIDIA GeForce RTX 3070 Ti Laptop GPU (n=1) | |
| MSI Raider GE66 12UHS | |
| MSI Vector GP66 12UGS | |
| Razer Blade 15 2022 | |
| Asus ROG Strix Scar 15 G533ZW-LN106WS | |
| Alienware m15 R6, i7-11800H RTX 3080 | |
| CrossMark / Overall | |
| Asus ROG Strix Scar 15 G533ZW-LN106WS | |
| MSI GE67 HX 12UGS | |
| Media Intel Core i7-12800HX, NVIDIA GeForce RTX 3070 Ti Laptop GPU (n=1) | |
| CrossMark / Productivity | |
| Asus ROG Strix Scar 15 G533ZW-LN106WS | |
| MSI GE67 HX 12UGS | |
| Media Intel Core i7-12800HX, NVIDIA GeForce RTX 3070 Ti Laptop GPU (n=1) | |
| CrossMark / Creativity | |
| Asus ROG Strix Scar 15 G533ZW-LN106WS | |
| MSI GE67 HX 12UGS | |
| Media Intel Core i7-12800HX, NVIDIA GeForce RTX 3070 Ti Laptop GPU (n=1) | |
| CrossMark / Responsiveness | |
| Asus ROG Strix Scar 15 G533ZW-LN106WS | |
| MSI GE67 HX 12UGS | |
| Media Intel Core i7-12800HX, NVIDIA GeForce RTX 3070 Ti Laptop GPU (n=1) | |
| PCMark 10 Score | 8042 punti | |
Aiuto | ||
| AIDA64 / Memory Copy | |
| MSI Raider GE66 12UHS | |
| Razer Blade 15 2022 | |
| Asus ROG Strix Scar 15 G533ZW-LN106WS | |
| MSI GE67 HX 12UGS | |
| Media Intel Core i7-12800HX (n=1) | |
| MSI Vector GP66 12UGS | |
| Alienware m15 R6, i7-11800H RTX 3080 | |
| AIDA64 / Memory Read | |
| MSI Raider GE66 12UHS | |
| Razer Blade 15 2022 | |
| Asus ROG Strix Scar 15 G533ZW-LN106WS | |
| MSI GE67 HX 12UGS | |
| Media Intel Core i7-12800HX (n=1) | |
| Alienware m15 R6, i7-11800H RTX 3080 | |
| MSI Vector GP66 12UGS | |
| AIDA64 / Memory Write | |
| Razer Blade 15 2022 | |
| MSI Raider GE66 12UHS | |
| Asus ROG Strix Scar 15 G533ZW-LN106WS | |
| MSI GE67 HX 12UGS | |
| Media Intel Core i7-12800HX (n=1) | |
| MSI Vector GP66 12UGS | |
| Alienware m15 R6, i7-11800H RTX 3080 | |
| AIDA64 / Memory Latency | |
| Asus ROG Strix Scar 15 G533ZW-LN106WS | |
| Alienware m15 R6, i7-11800H RTX 3080 | |
| MSI GE67 HX 12UGS | |
| Media Intel Core i7-12800HX (n=1) | |
| MSI Raider GE66 12UHS | |
| MSI Vector GP66 12UGS | |
| Razer Blade 15 2022 | |
* ... Meglio usare valori piccoli
Latenza DPC
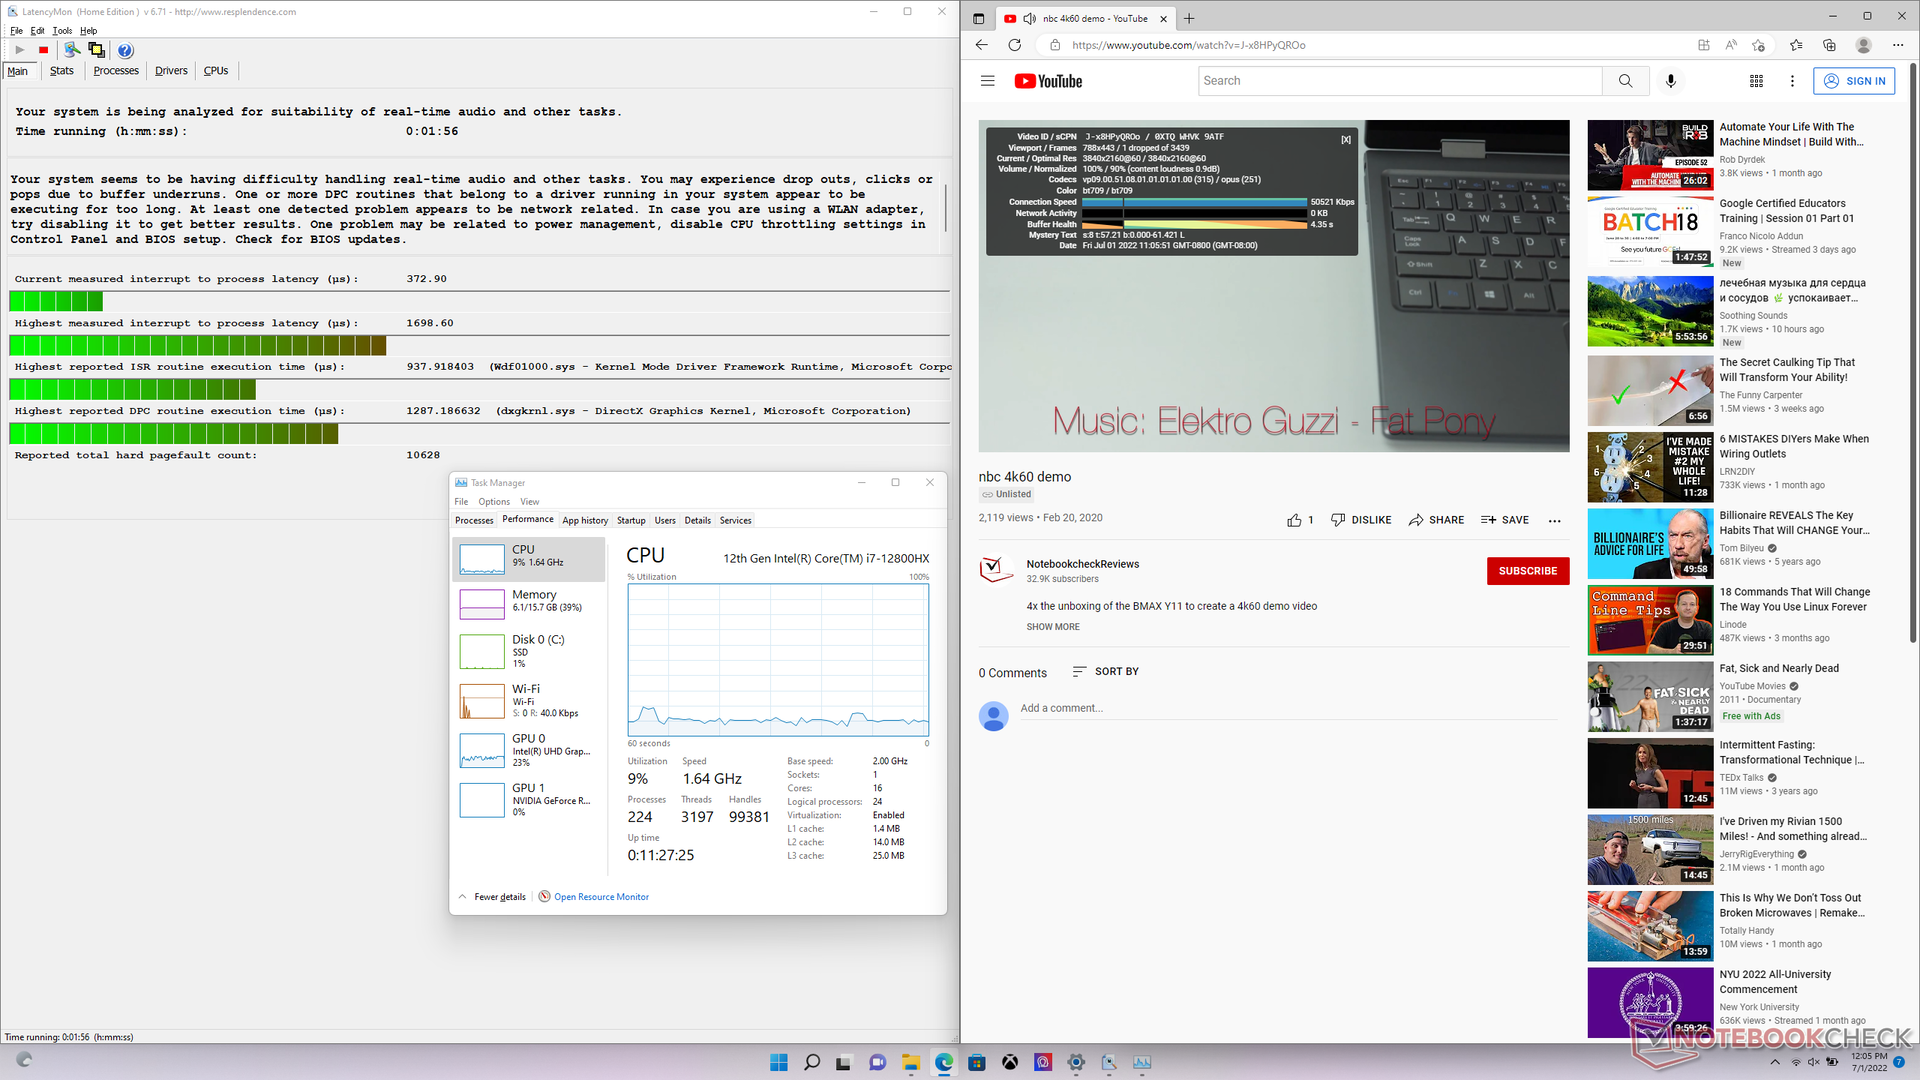
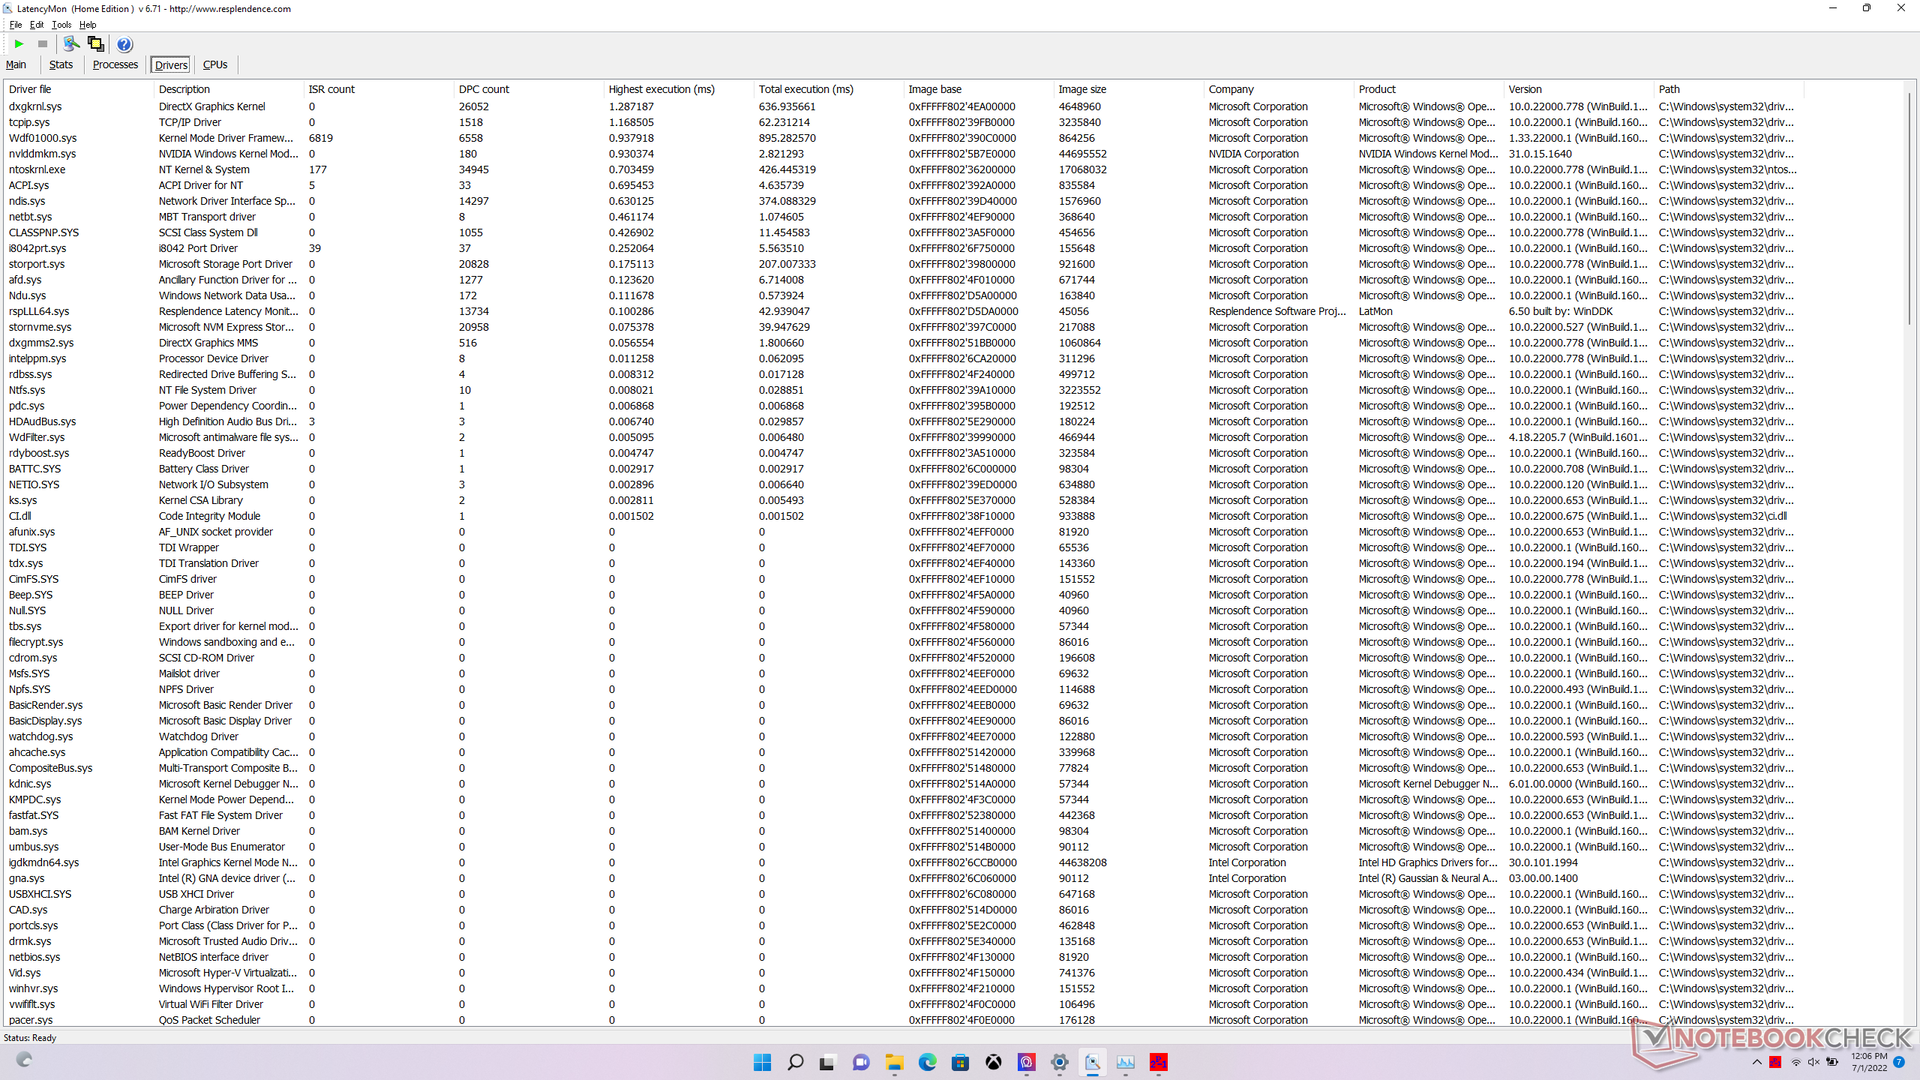
LatencyMon rivela lievi problemi di DPC quando si aprono più schede del browser sulla nostra homepage. la riproduzione di video 4K a 60 FPS è invece fluida, con una sola caduta di fotogrammi durante il nostro test video di 60 secondi.
| DPC Latencies / LatencyMon - interrupt to process latency (max), Web, Youtube, Prime95 | |
| MSI Raider GE66 12UHS | |
| MSI Vector GP66 12UGS | |
| MSI GE67 HX 12UGS | |
| Razer Blade 15 2022 | |
| Alienware m15 R6, i7-11800H RTX 3080 | |
| Asus ROG Strix Scar 15 G533ZW-LN106WS | |
* ... Meglio usare valori piccoli
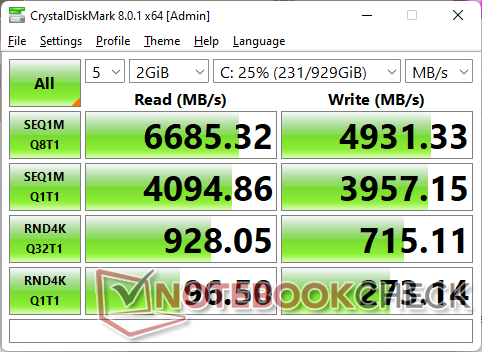
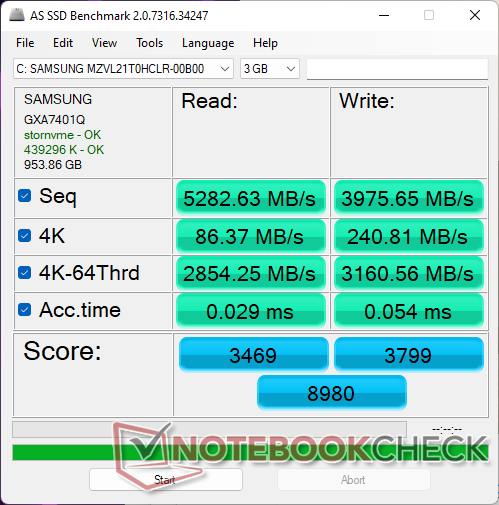
Dispositivi di archiviazione - Standard PCIe4 x4
La nostra unità viene fornita con un disco da 1 TBSamsung PM9A1 PCIe4 x4 NVMe per velocità di lettura e scrittura sequenziale fino a 7000 MB/s e 5100 MB/s, rispettivamente. Sfortunatamente, la nostra unità ha avuto problemi a mantenere la velocità massima di lettura per periodi prolungati, come mostrato dal nostro test DiskSpd loop qui sotto. La velocità di lettura è scesa fino a 1500 MB/s, probabilmente a causa dei limiti di temperatura e della mancanza di un adeguato diffusore di calore sull'unità SSD.

* ... Meglio usare valori piccoli
Disk Throttling: DiskSpd Read Loop, Queue Depth 8
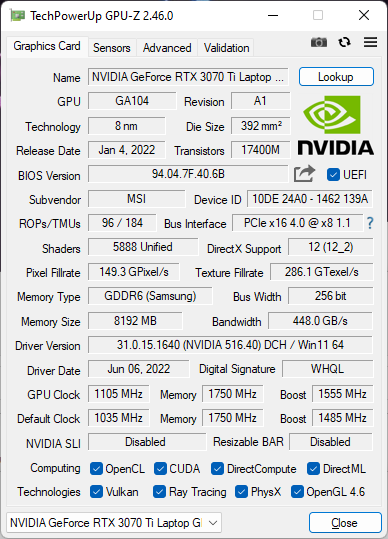
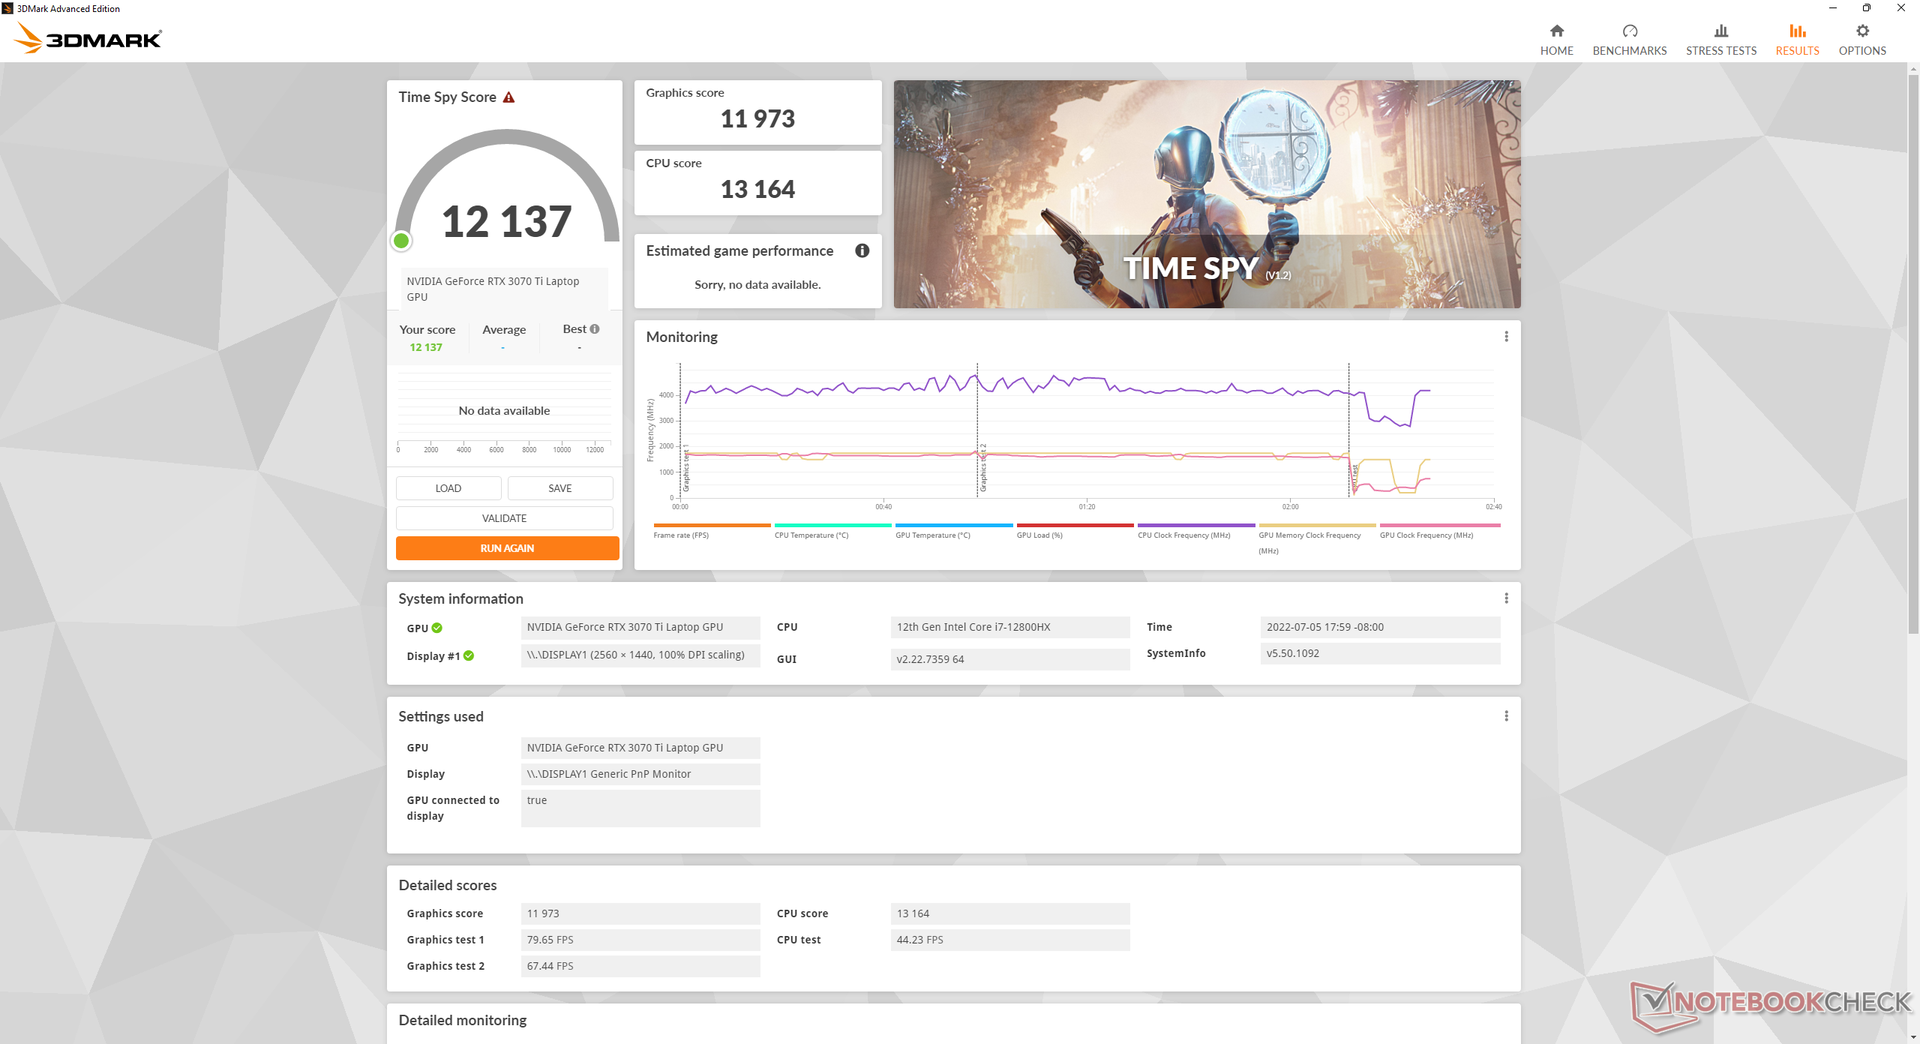
Prestazioni della GPU - 150 W con 25 W di boost dinamico
GeForce i risultati di 3DMark sono superiori di circa il 12% rispetto alla media dei laptop del nostro database equipaggiati con la stessa GPU mobile RTX 3070 Ti. I numeri più alti del previsto possono essere attribuiti all'elevato obiettivo di 150 W del TGP e alla veloce RAM DDR5, mentre la maggior parte dei portatili da gioco utilizza ancora GPU da 130 W o inferiori e/o RAM DDR4 più lente. Le differenze sono sufficienti a far sì che la nostra GTX 3070 Ti mobile abbia prestazioni simili a quelle della RTX 3080 Ti mobile che gira con la vecchia GE66 Q1 2022.
Per i giochi, la GPU Nvidia avrebbe prestazioni quasi identiche tra la modalità MSHybrid e quella discreta.
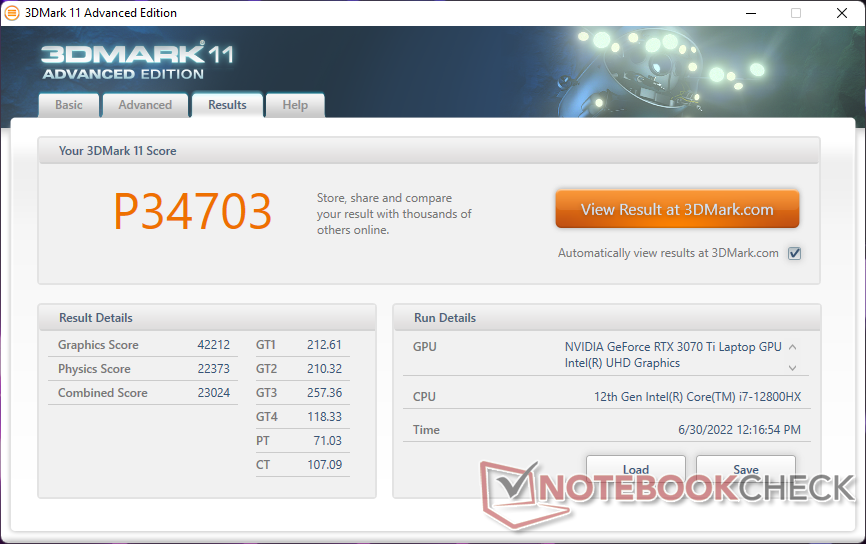
| 3DMark 11 Performance | 34703 punti | |
| 3DMark Cloud Gate Standard Score | 68738 punti | |
| 3DMark Fire Strike Score | 28492 punti | |
| 3DMark Time Spy Score | 12239 punti | |
Aiuto | ||
Witcher 3 FPS Chart
| basso | medio | alto | ultra | QHD | 4K | |
|---|---|---|---|---|---|---|
| GTA V (2015) | 186.8 | 184.7 | 178.1 | 122 | 108.7 | |
| The Witcher 3 (2015) | 426.4 | 329 | 223.3 | 112.7 | ||
| Dota 2 Reborn (2015) | 181.2 | 165.6 | 155.3 | 147.7 | 148.9 | |
| Final Fantasy XV Benchmark (2018) | 201 | 162.6 | 122.4 | 93 | ||
| X-Plane 11.11 (2018) | 145.5 | 133.4 | 105.9 | |||
| Strange Brigade (2018) | 453 | 288 | 235 | 207 | 154.1 | |
| Cyberpunk 2077 1.6 (2022) | 141.2 | 133.2 | 106 | 88.1 | 56.4 |
Emissioni
Rumore del sistema
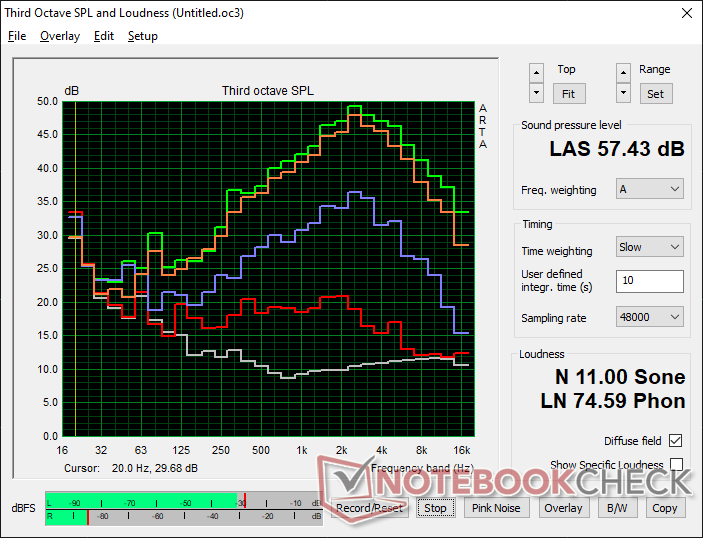
La rumorosità della ventola dipende dai cinque profili di alimentazione preimpostati, come indicato nelle condizioni di test precedenti. Quando è al minimo sul desktop senza applicazioni in esecuzione, la nostra unità è in grado di rimanere silenziosa a 22,9 dB(A) anche quando è impostata sul profilo Extreme Performance. Tuttavia, piccole esigenze come la navigazione web o lo streaming video indurranno un rumore della ventola compreso tra 30 e 34 dB(A), indipendentemente dall'impostazione del profilo. L'esecuzione della prima scena di benchmark di 3DMark 06 in modalità Balanced indurrebbe un rumore della ventola di 44 dB(A), simile a quello registrato sul GE66 o sul Razer Blade 15 Razer Blade 15.
L'esecuzione di Witcher 3 in modalità Bilanciata e in modalità Prestazioni estreme comporta un rumore della ventola di 49,8 dB(A) e 55,7 dB(A), rispettivamente. Consideriamo qualsiasi cosa nella gamma dei 50 dB(A) come molto rumorosa, al punto da consigliare l'uso di cuffie durante il gioco. Tuttavia, questo intervallo è purtroppo comune a molti portatili da gioco per appassionati, tra cui Vector GP66, Asus ROG Strix Scar 15 o Alienware m15 R6. Se Cooler Boost (ovvero la modalità di massima rumorosità della ventola) è attivo, la rumorosità della ventola sarà ancora più elevata, con 57,4 dB(A). Gli utenti dovranno attivare la modalità Extreme Performance sul GE67 per massimizzare il TGP, come dimostra la sezione Stress Test. Il GE66 non era così rumoroso in condizioni simili.
Rumorosità
| Idle |
| 22.9 / 22.9 / 22.9 dB(A) |
| Sotto carico |
| 44.4 / 57.4 dB(A) |
 | ||
30 dB silenzioso 40 dB(A) udibile 50 dB(A) rumoroso |
||
min: | ||
| MSI GE67 HX 12UGS GeForce RTX 3070 Ti Laptop GPU, i7-12800HX, Samsung PM9A1 MZVL21T0HCLR | MSI Raider GE66 12UHS GeForce RTX 3080 Ti Laptop GPU, i9-12900HK, Samsung PM9A1 MZVL22T0HBLB | MSI Vector GP66 12UGS GeForce RTX 3070 Ti Laptop GPU, i9-12900H | Asus ROG Strix Scar 15 G533ZW-LN106WS GeForce RTX 3070 Ti Laptop GPU, i9-12900H, Samsung PM9A1 MZVL22T0HBLB | Alienware m15 R6, i7-11800H RTX 3080 GeForce RTX 3080 Laptop GPU, i7-11800H, Samsung PM9A1 MZVL21T0HCLR | Razer Blade 15 2022 GeForce RTX 3080 Ti Laptop GPU, i7-12800H, SSSTC CA6-8D1024 | |
|---|---|---|---|---|---|---|
| Noise | -14% | -2% | -36% | -2% | -5% | |
| off /ambiente * (dB) | 22.7 | 26 -15% | 22.9 -1% | 26.86 -18% | 23 -1% | 25.4 -12% |
| Idle Minimum * (dB) | 22.9 | 27 -18% | 23.4 -2% | 39.07 -71% | 23 -0% | 26.2 -14% |
| Idle Average * (dB) | 22.9 | 30 -31% | 23.4 -2% | 39.07 -71% | 23 -0% | 26.2 -14% |
| Idle Maximum * (dB) | 22.9 | 39 -70% | 27.4 -20% | 39.07 -71% | 30 -31% | 28.4 -24% |
| Load Average * (dB) | 44.4 | 45 -1% | 36 19% | 53.34 -20% | 41.26 7% | 44.7 -1% |
| Witcher 3 ultra * (dB) | 55.7 | 45 19% | 58.2 -4% | 56.6 -2% | 53.4 4% | 44.7 20% |
| Load Maximum * (dB) | 57.4 | 47 18% | 58 -1% | 56.6 1% | 53.37 7% | 51.9 10% |
* ... Meglio usare valori piccoli
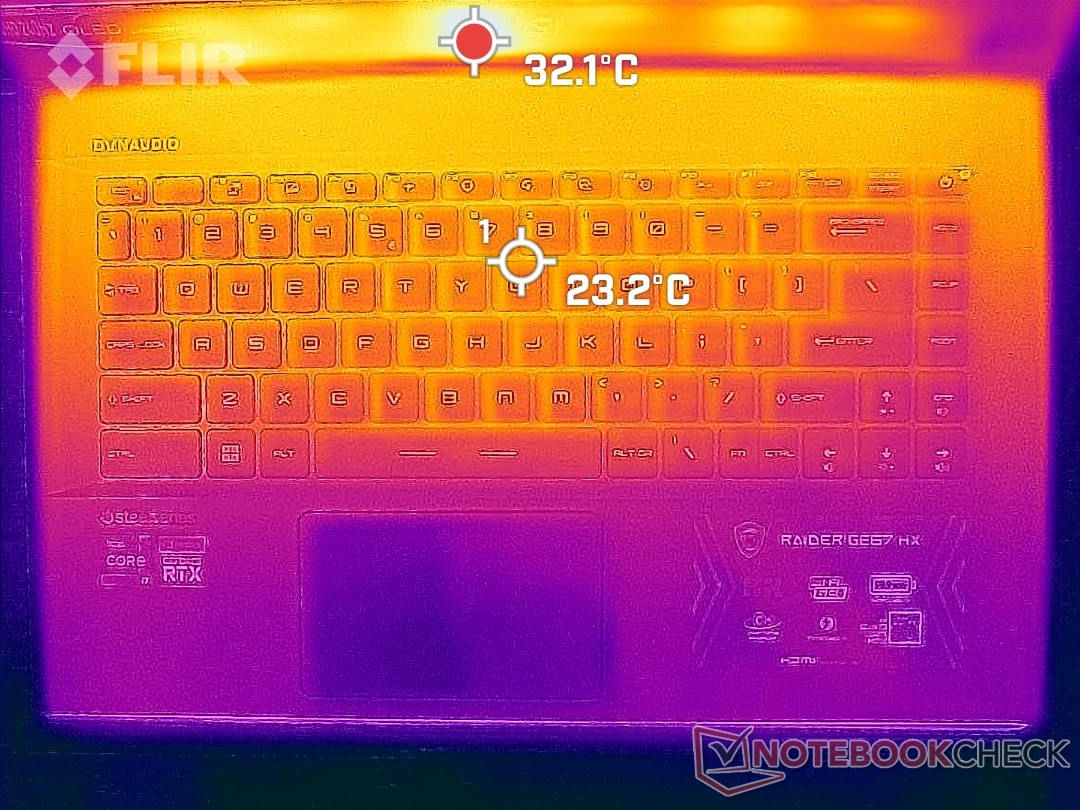
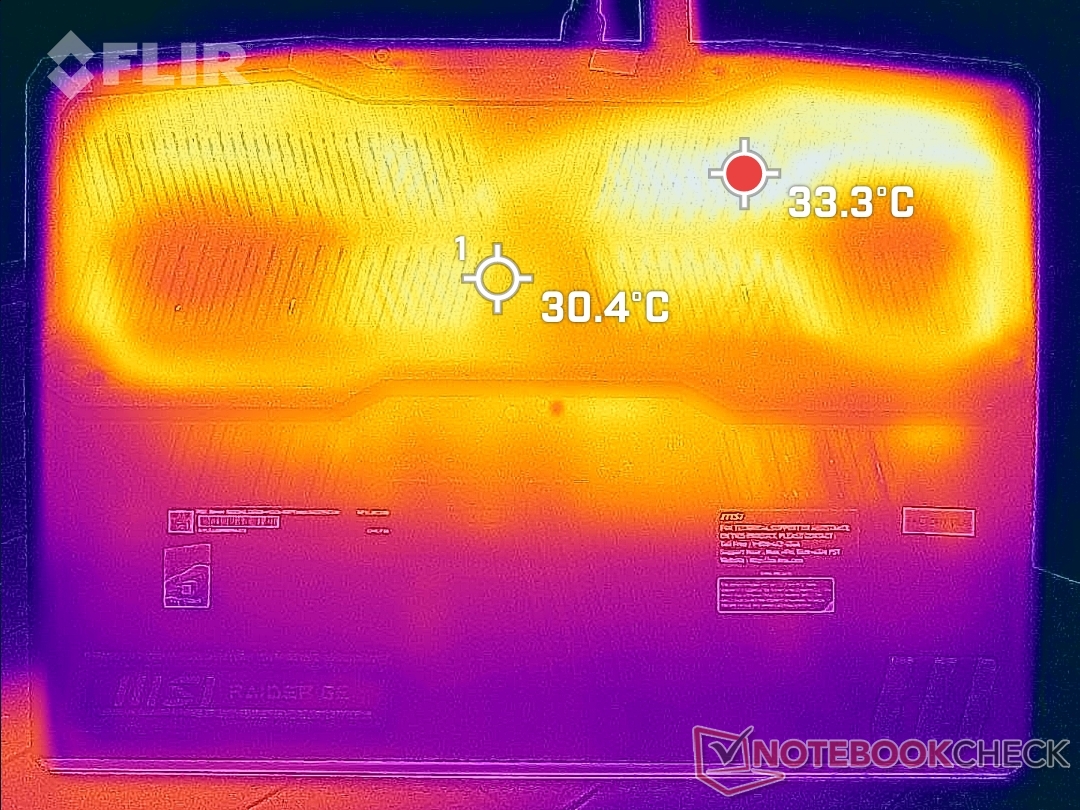
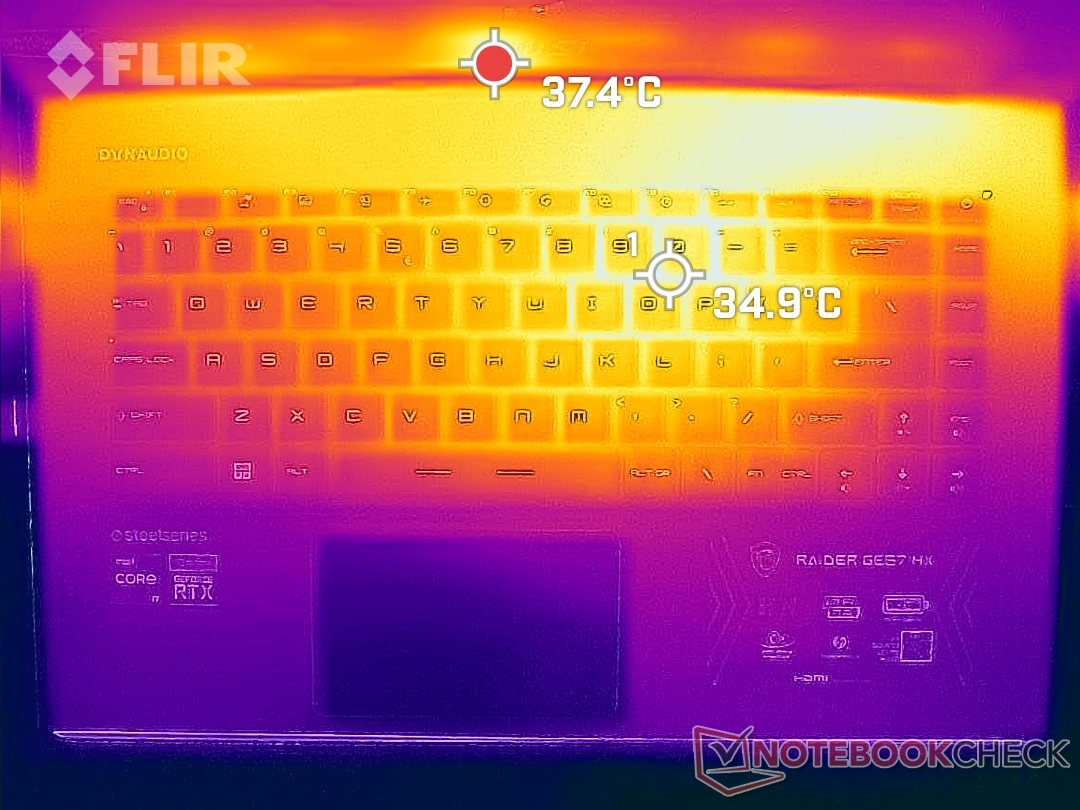
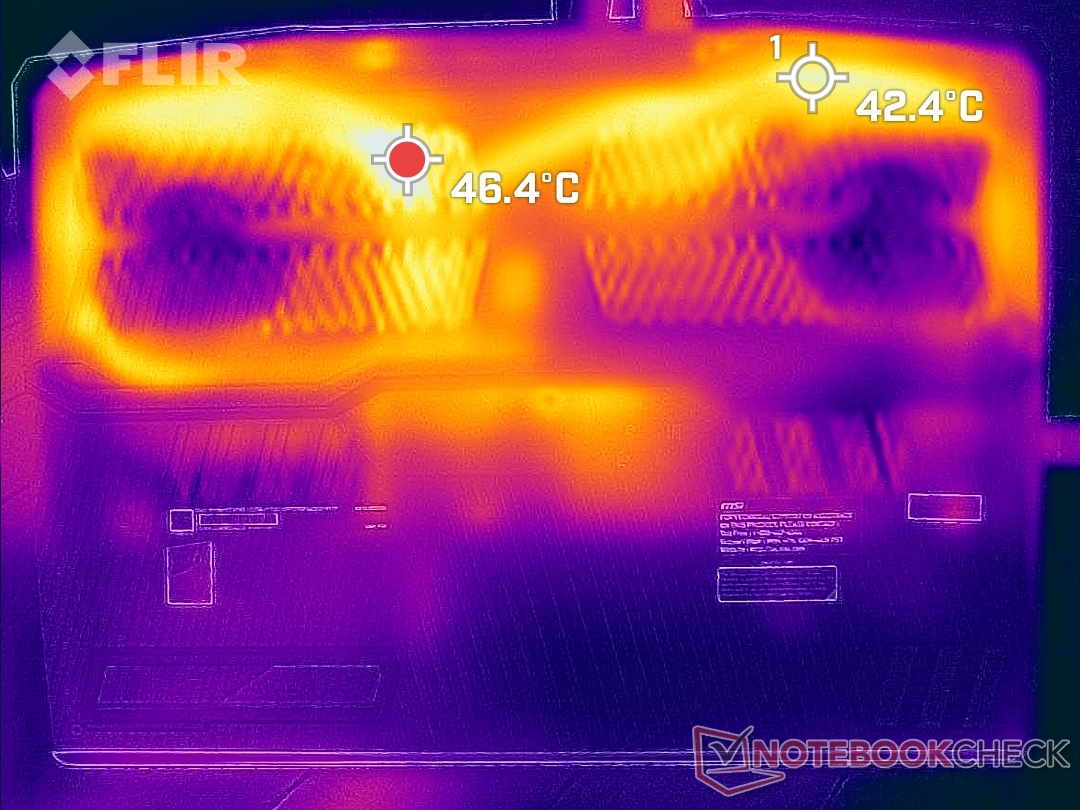
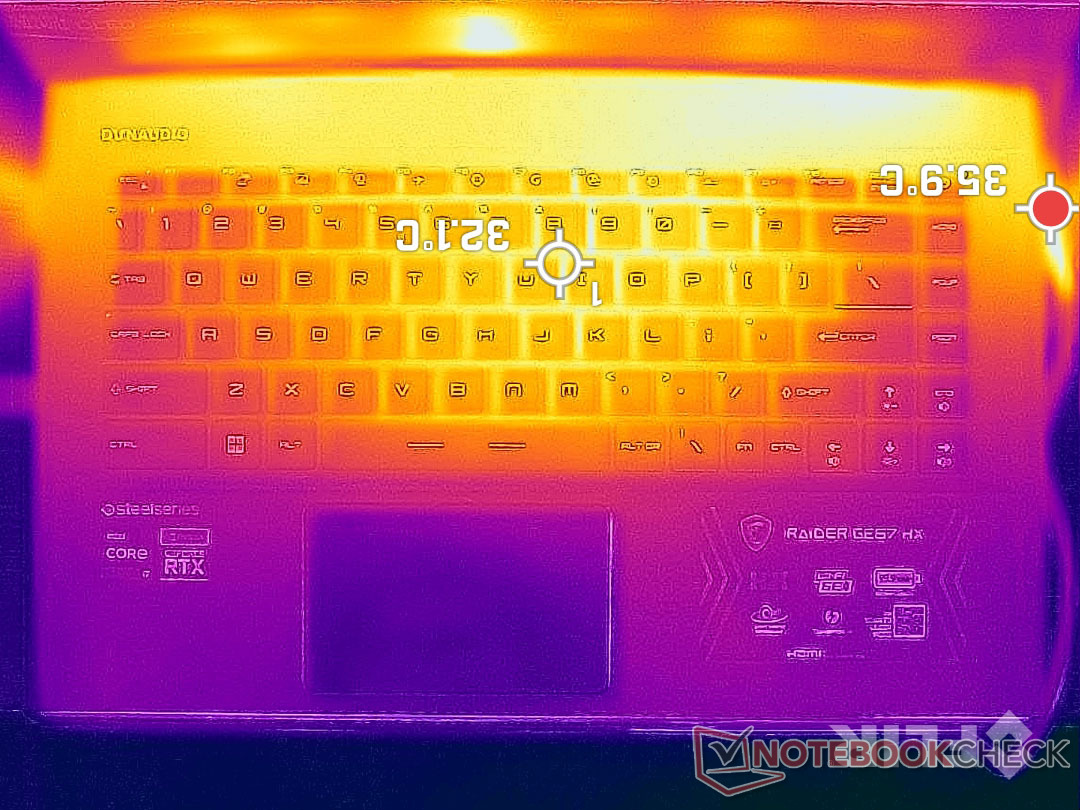
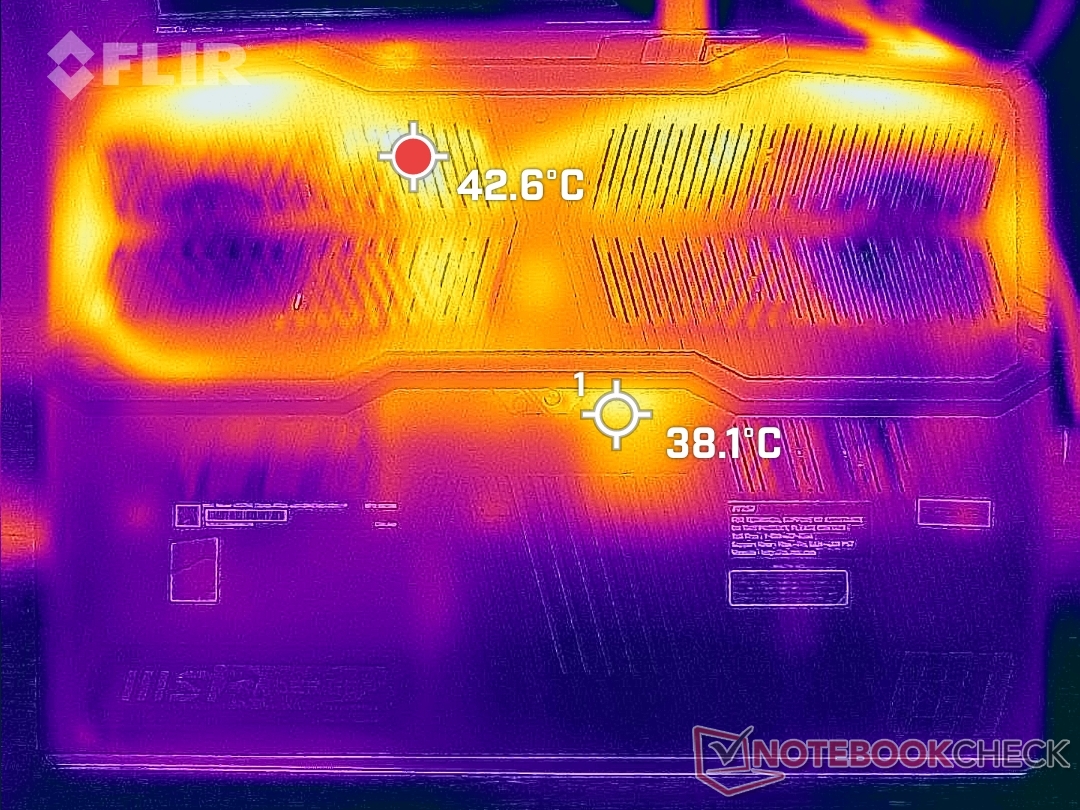
Temperatura
Le temperature di superficie sono più basse rispetto a quelle osservate sul vecchio GE66. Durante il gioco, i punti caldi sul piano della tastiera e sul pannello inferiore possono raggiungere rispettivamente i 35 C e i 46 C. Queste zone si trovano verso la parte posteriore dello chassis, come mostrano le mappe di temperatura qui sotto.
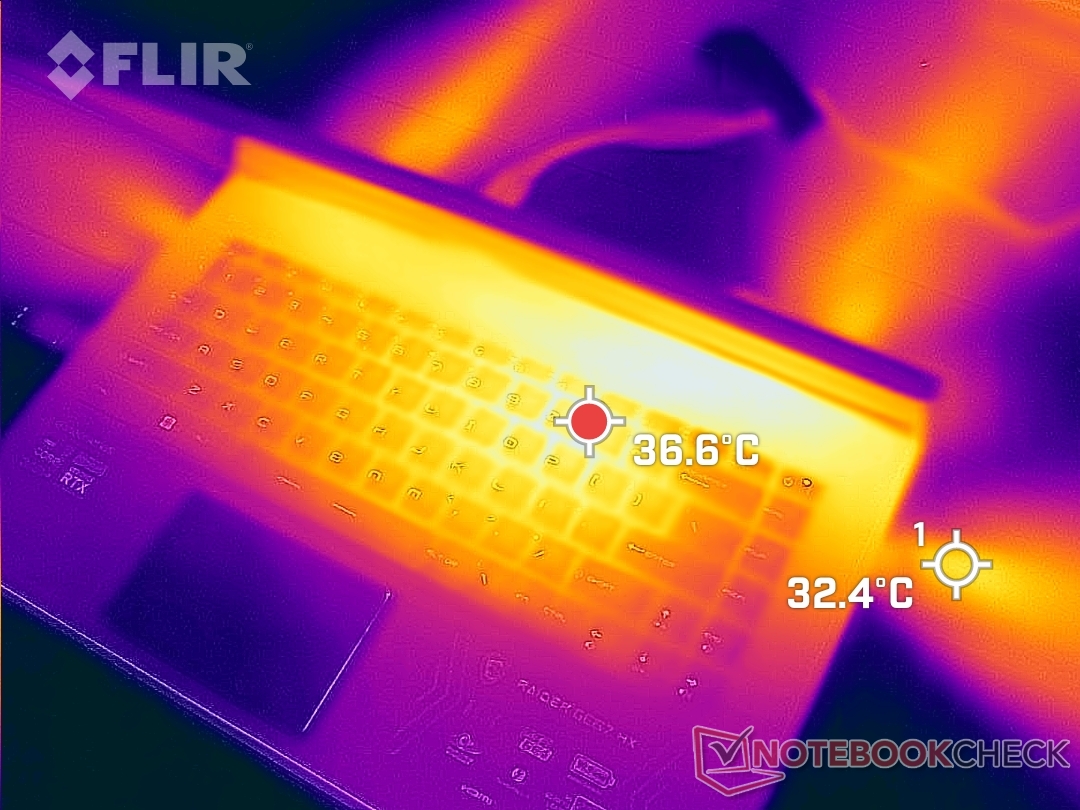
(+) La temperatura massima sul lato superiore è di 34.4 °C / 94 F, rispetto alla media di 40.4 °C / 105 F, che varia da 21.2 a 68.8 °C per questa classe Gaming.
(±) Il lato inferiore si riscalda fino ad un massimo di 42 °C / 108 F, rispetto alla media di 43.2 °C / 110 F
(+) In idle, la temperatura media del lato superiore è di 21.4 °C / 71 F, rispetto alla media deld ispositivo di 33.9 °C / 93 F.
(+) Riproducendo The Witcher 3, la temperatura media per il lato superiore e' di 27.9 °C / 82 F, rispetto alla media del dispositivo di 33.9 °C / 93 F.
(+) I poggiapolsi e il touchpad sono piu' freddi della temperatura della pelle con un massimo di 20.4 °C / 68.7 F e sono quindi freddi al tatto.
(+) La temperatura media della zona del palmo della mano di dispositivi simili e'stata di 28.8 °C / 83.8 F (+8.4 °C / 15.1 F).
| MSI GE67 HX 12UGS Intel Core i7-12800HX, NVIDIA GeForce RTX 3070 Ti Laptop GPU | MSI Raider GE66 12UHS Intel Core i9-12900HK, NVIDIA GeForce RTX 3080 Ti Laptop GPU | MSI Vector GP66 12UGS Intel Core i9-12900H, NVIDIA GeForce RTX 3070 Ti Laptop GPU | Asus ROG Strix Scar 15 G533ZW-LN106WS Intel Core i9-12900H, NVIDIA GeForce RTX 3070 Ti Laptop GPU | Alienware m15 R6, i7-11800H RTX 3080 Intel Core i7-11800H, NVIDIA GeForce RTX 3080 Laptop GPU | Razer Blade 15 2022 Intel Core i7-12800H, NVIDIA GeForce RTX 3080 Ti Laptop GPU | |
|---|---|---|---|---|---|---|
| Heat | -36% | -19% | -29% | -45% | -32% | |
| Maximum Upper Side * (°C) | 34.4 | 54 -57% | 40.2 -17% | 42.6 -24% | 61 -77% | 50 -45% |
| Maximum Bottom * (°C) | 42 | 65 -55% | 43.8 -4% | 50.2 -20% | 58 -38% | 47 -12% |
| Idle Upper Side * (°C) | 24 | 30 -25% | 34.8 -45% | 36.2 -51% | 38 -58% | 37.4 -56% |
| Idle Bottom * (°C) | 33.2 | 35 -5% | 37 -11% | 40.2 -21% | 36 -8% | 38.4 -16% |
* ... Meglio usare valori piccoli
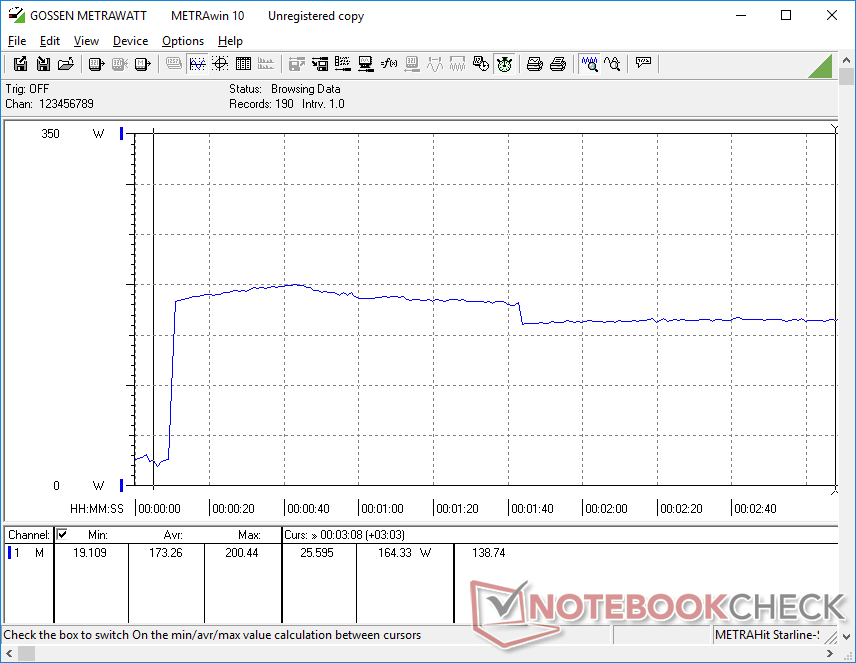
Stress test
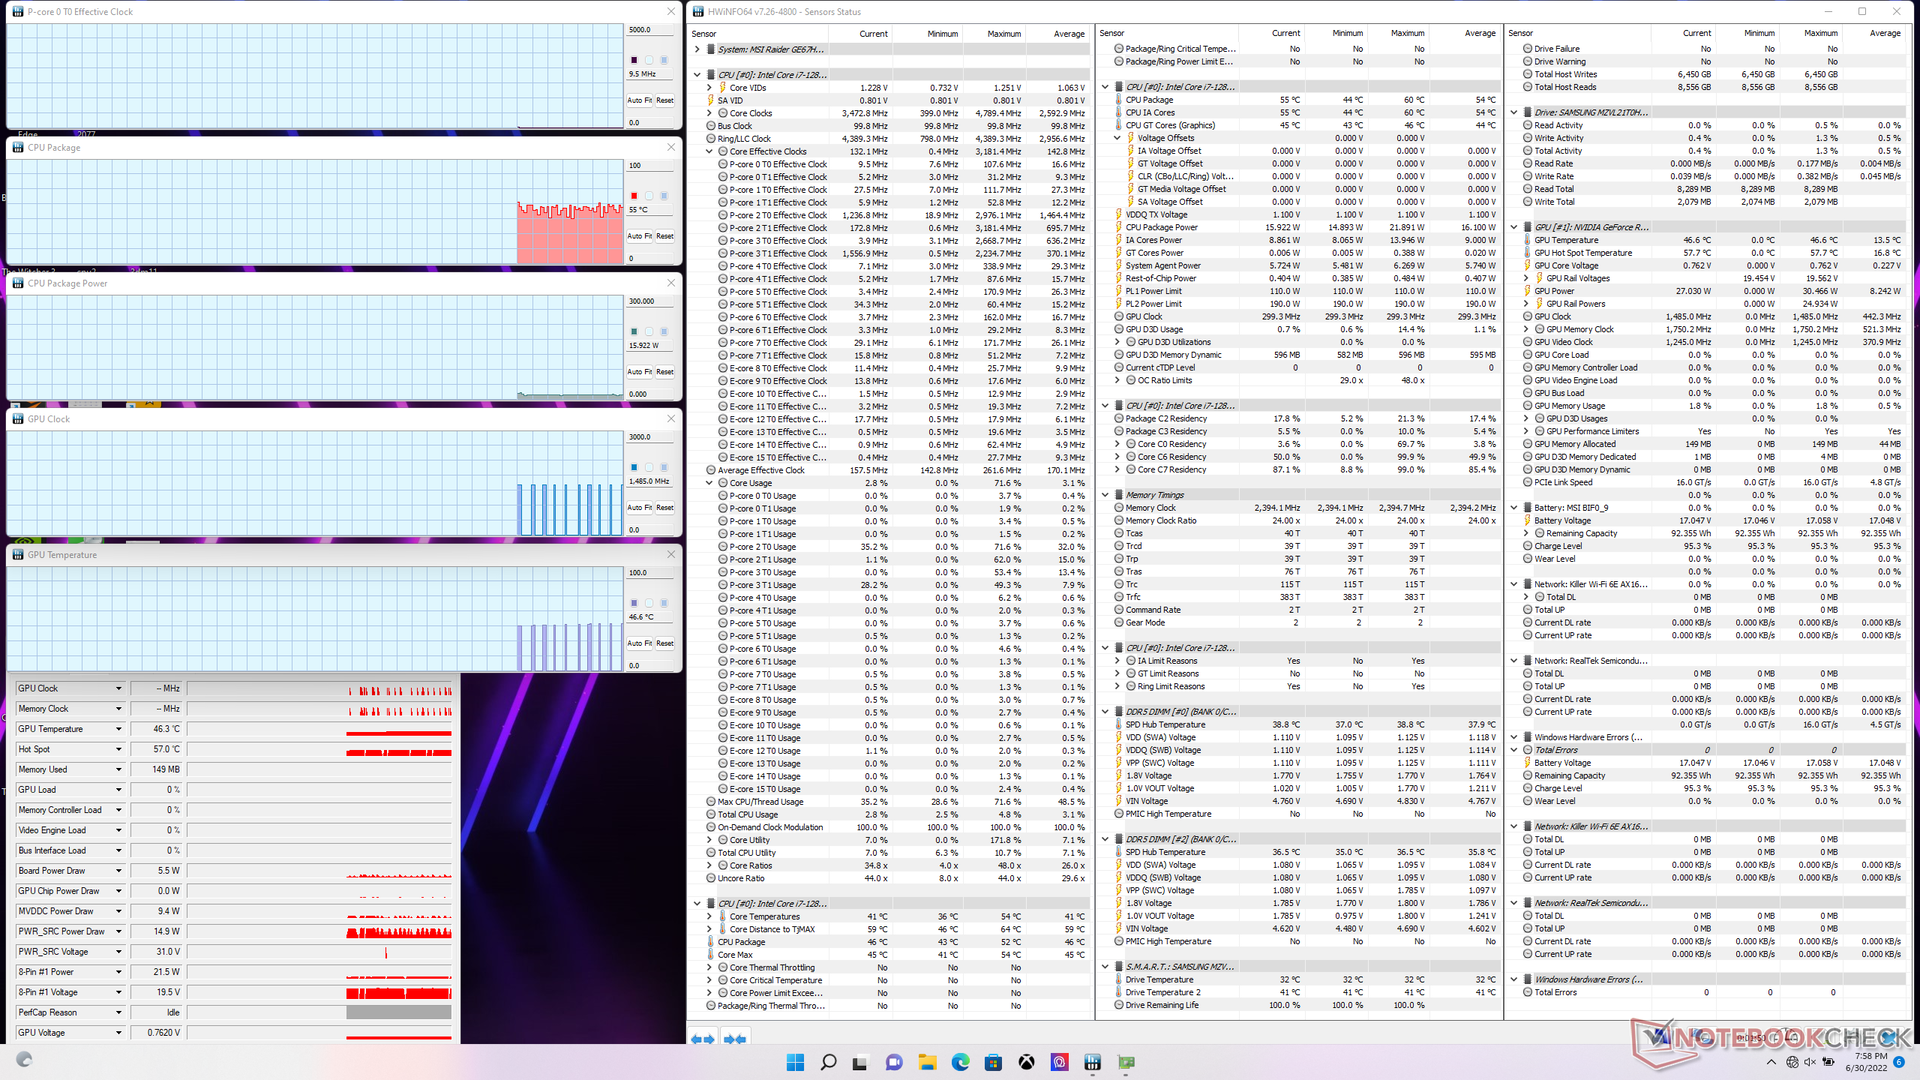
Quando è stata sottoposta a Prime95, la CPU ha raggiunto i 4,2 GHz fino a circa 90 secondi dopo, quando la temperatura del core ha raggiunto i 96 C. In seguito, le frequenze di clock sono scese tra i 3,4 e i 3,7 GHz per mantenere una temperatura del core più bassa, intorno agli 87 C. L'assorbimento di potenza del pacchetto CPU ha raggiunto i 140 W durante i primi 90 secondi del test, prima di stabilizzarsi a 110 W. In confronto, il Core i7-12900HK nel vecchio GE66 si è stabilizzato a soli 45 W in condizioni simili.
L'assorbimento di potenza della scheda GPU raggiunge i 148 W in modalità Extreme Performance, rispetto ai 135 W del profilo di alimentazione Balanced. È consigliabile attivare la modalità Extreme Performance per massimizzare il potenziale della GPU. Le temperature medie di CPU e GPU sono ragionevoli, rispettivamente 69 C e 77 C, rispetto ai 71 C e 70 C della scheda Vector GP66 Vector GP66 che è dotato della stessa GPU RTX 3070 Ti di GeForce ma di una CPU di 11a generazione più lenta.
Vale la pena notare che siamo riusciti a raggiungere un assorbimento di potenza della scheda GPU di soli 148 W, nonostante l'annuncio di MSI di 150 W + 25 W di Dynamic Boost, anche con la modalità Extreme Performance, almeno secondo GPU-Z.
Il funzionamento a batteria influisce sulle prestazioni. Un test di Fire Strike con l'alimentazione a batteria restituirebbe punteggi di Fisica e Grafica rispettivamente di 22492 e 11614 punti, rispetto ai 34445 e 31096 punti con l'alimentazione a rete.
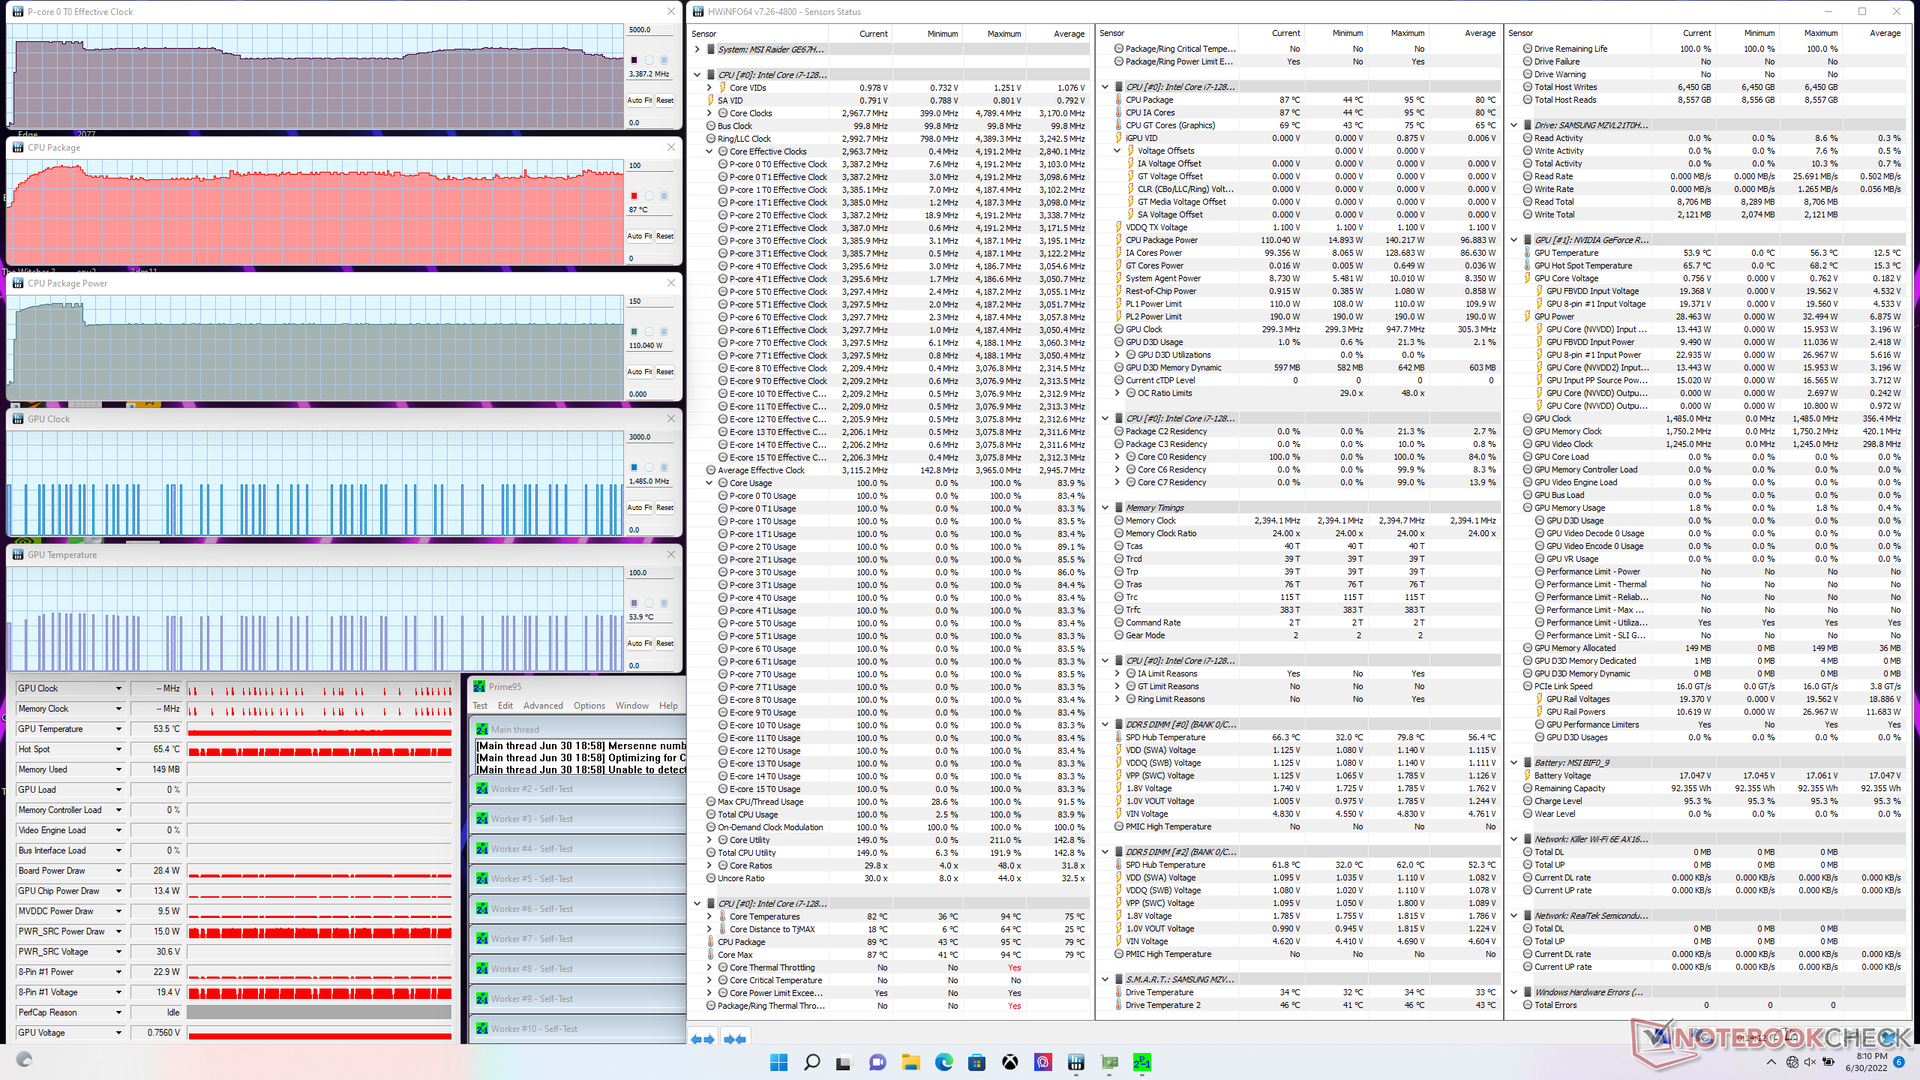
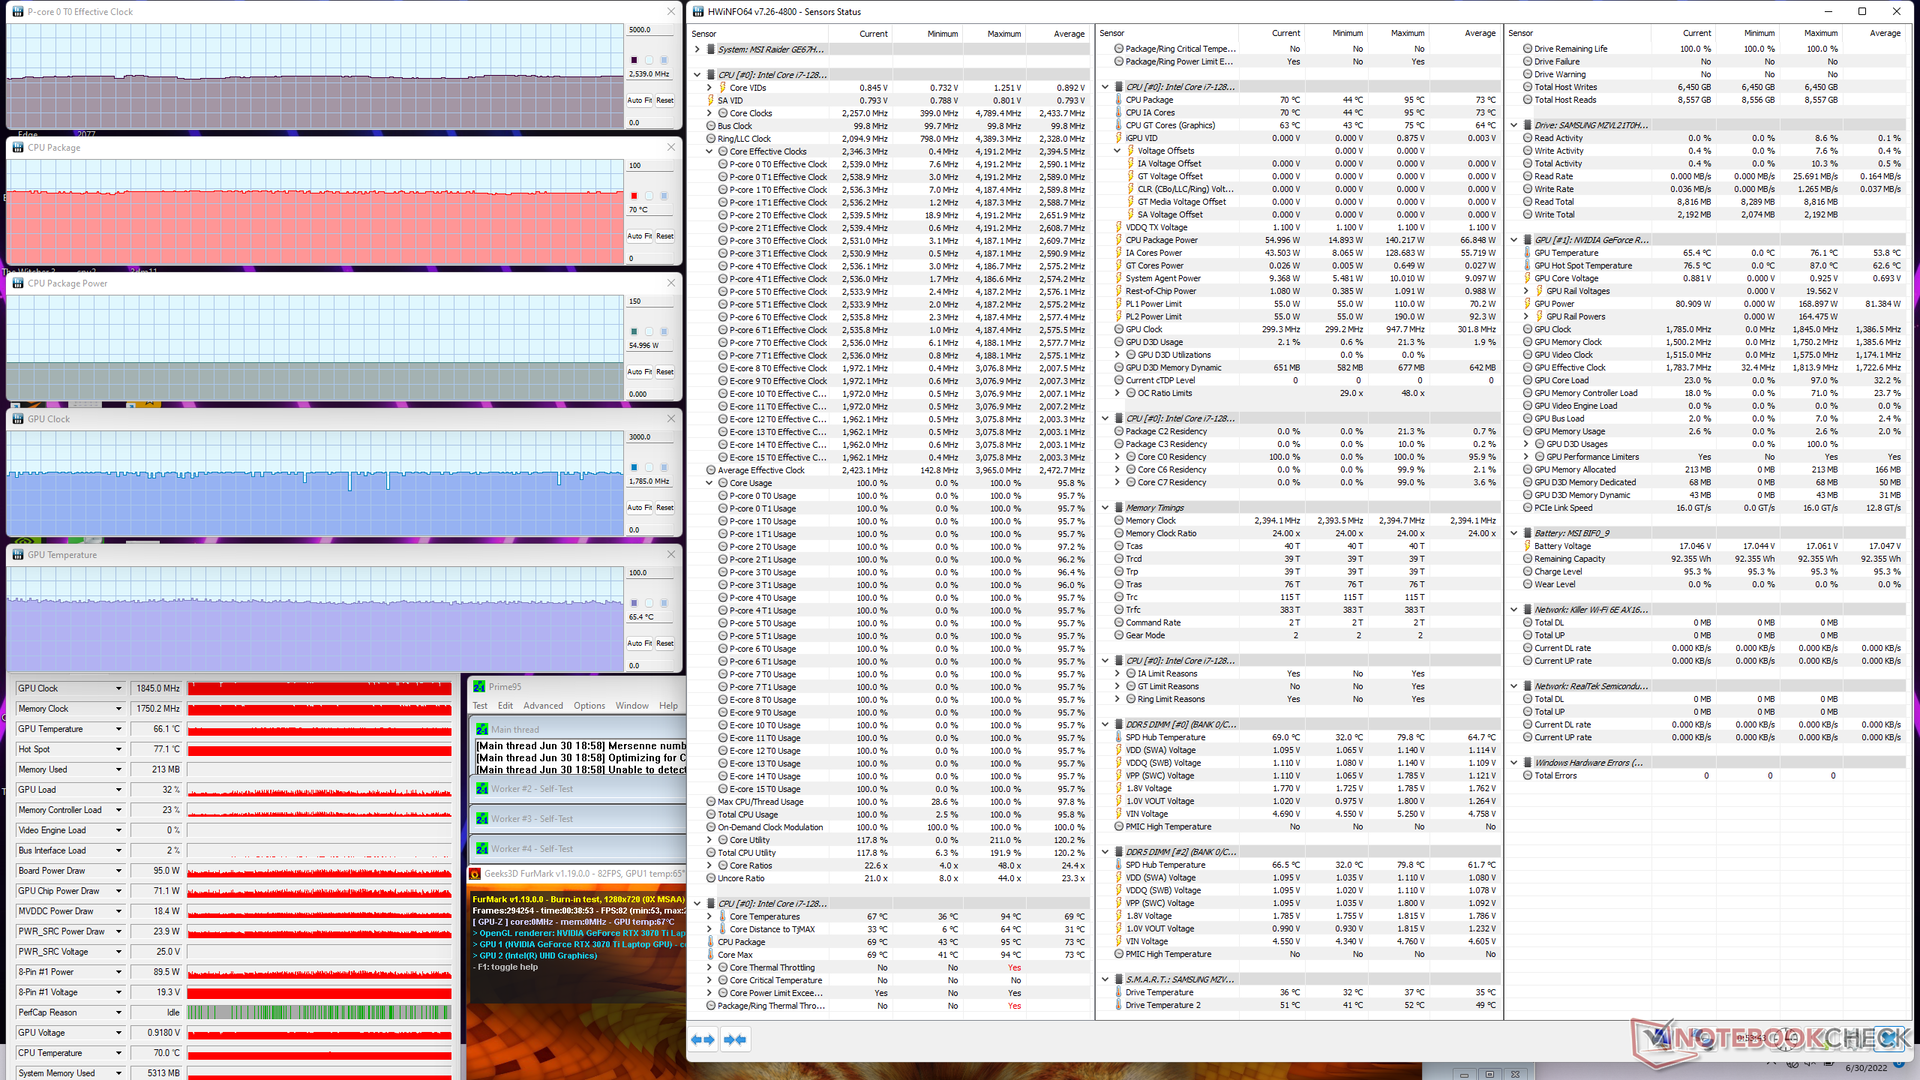
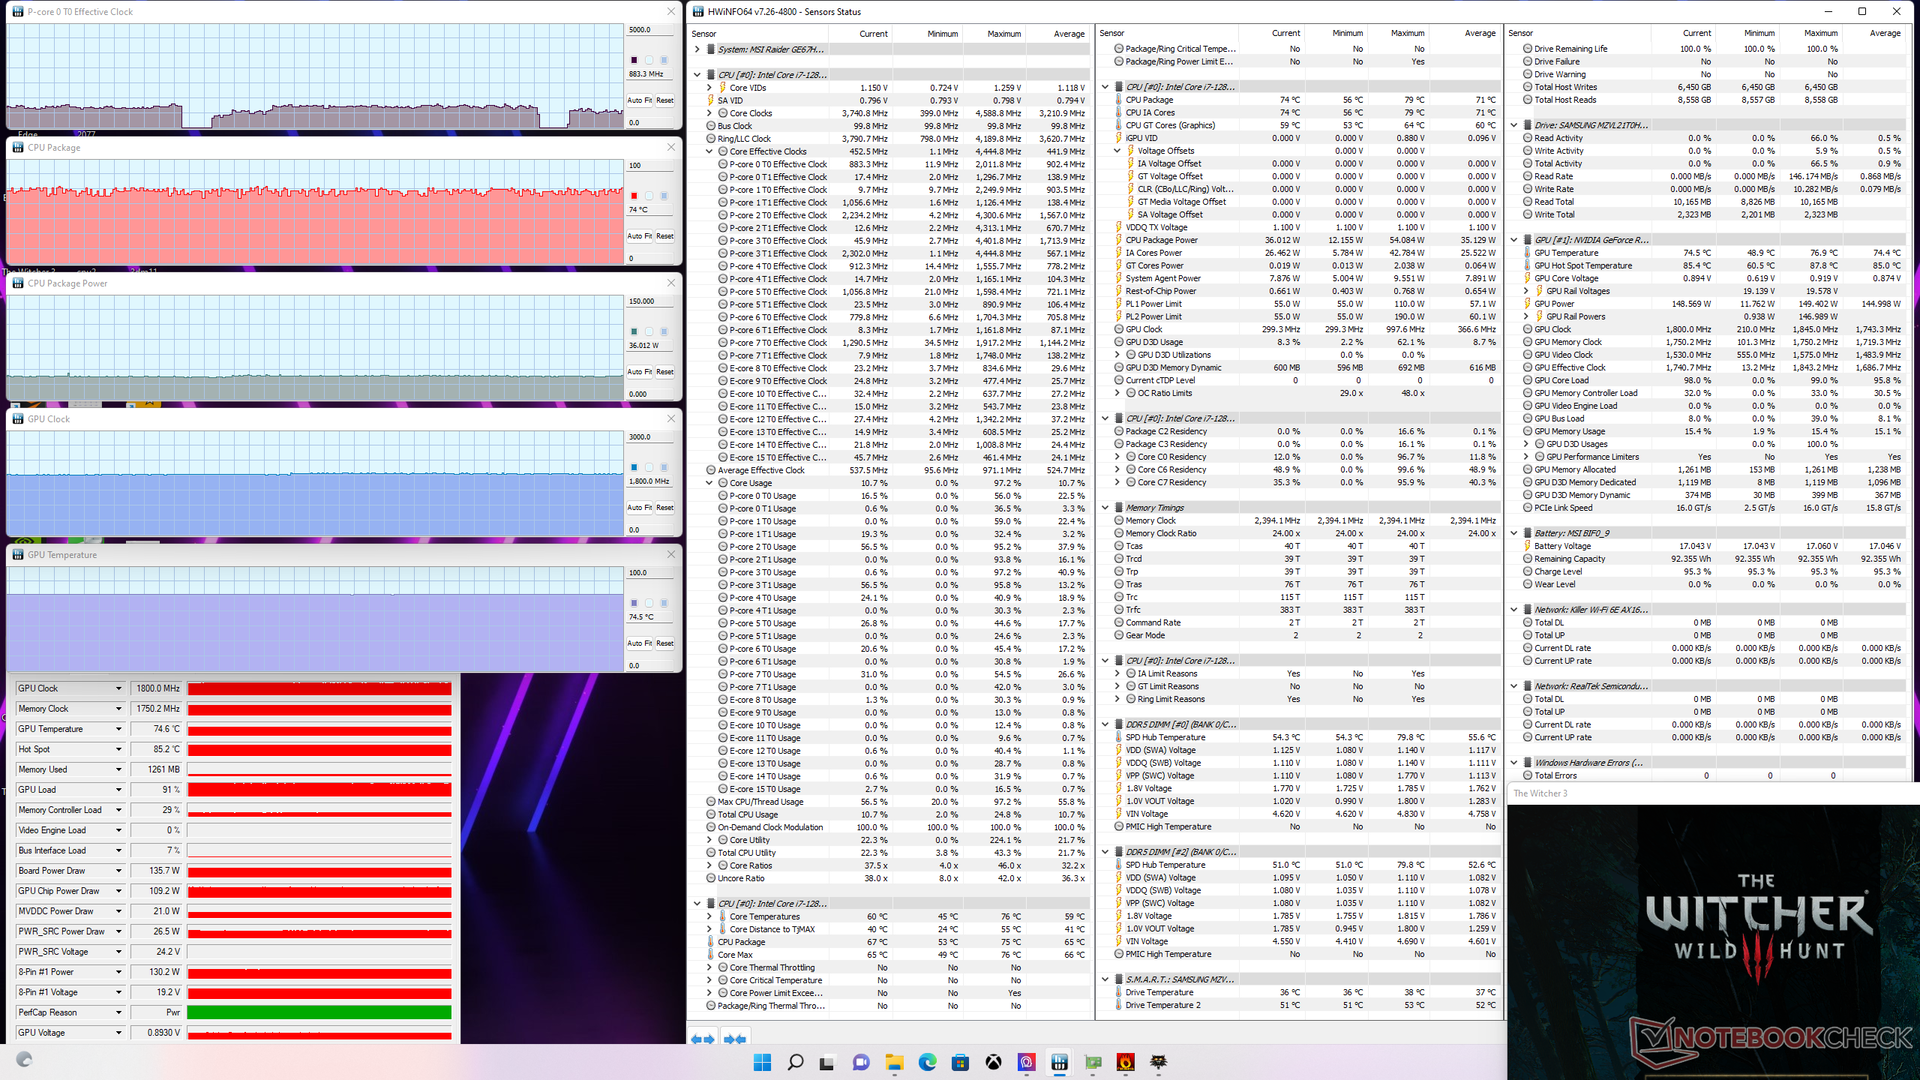
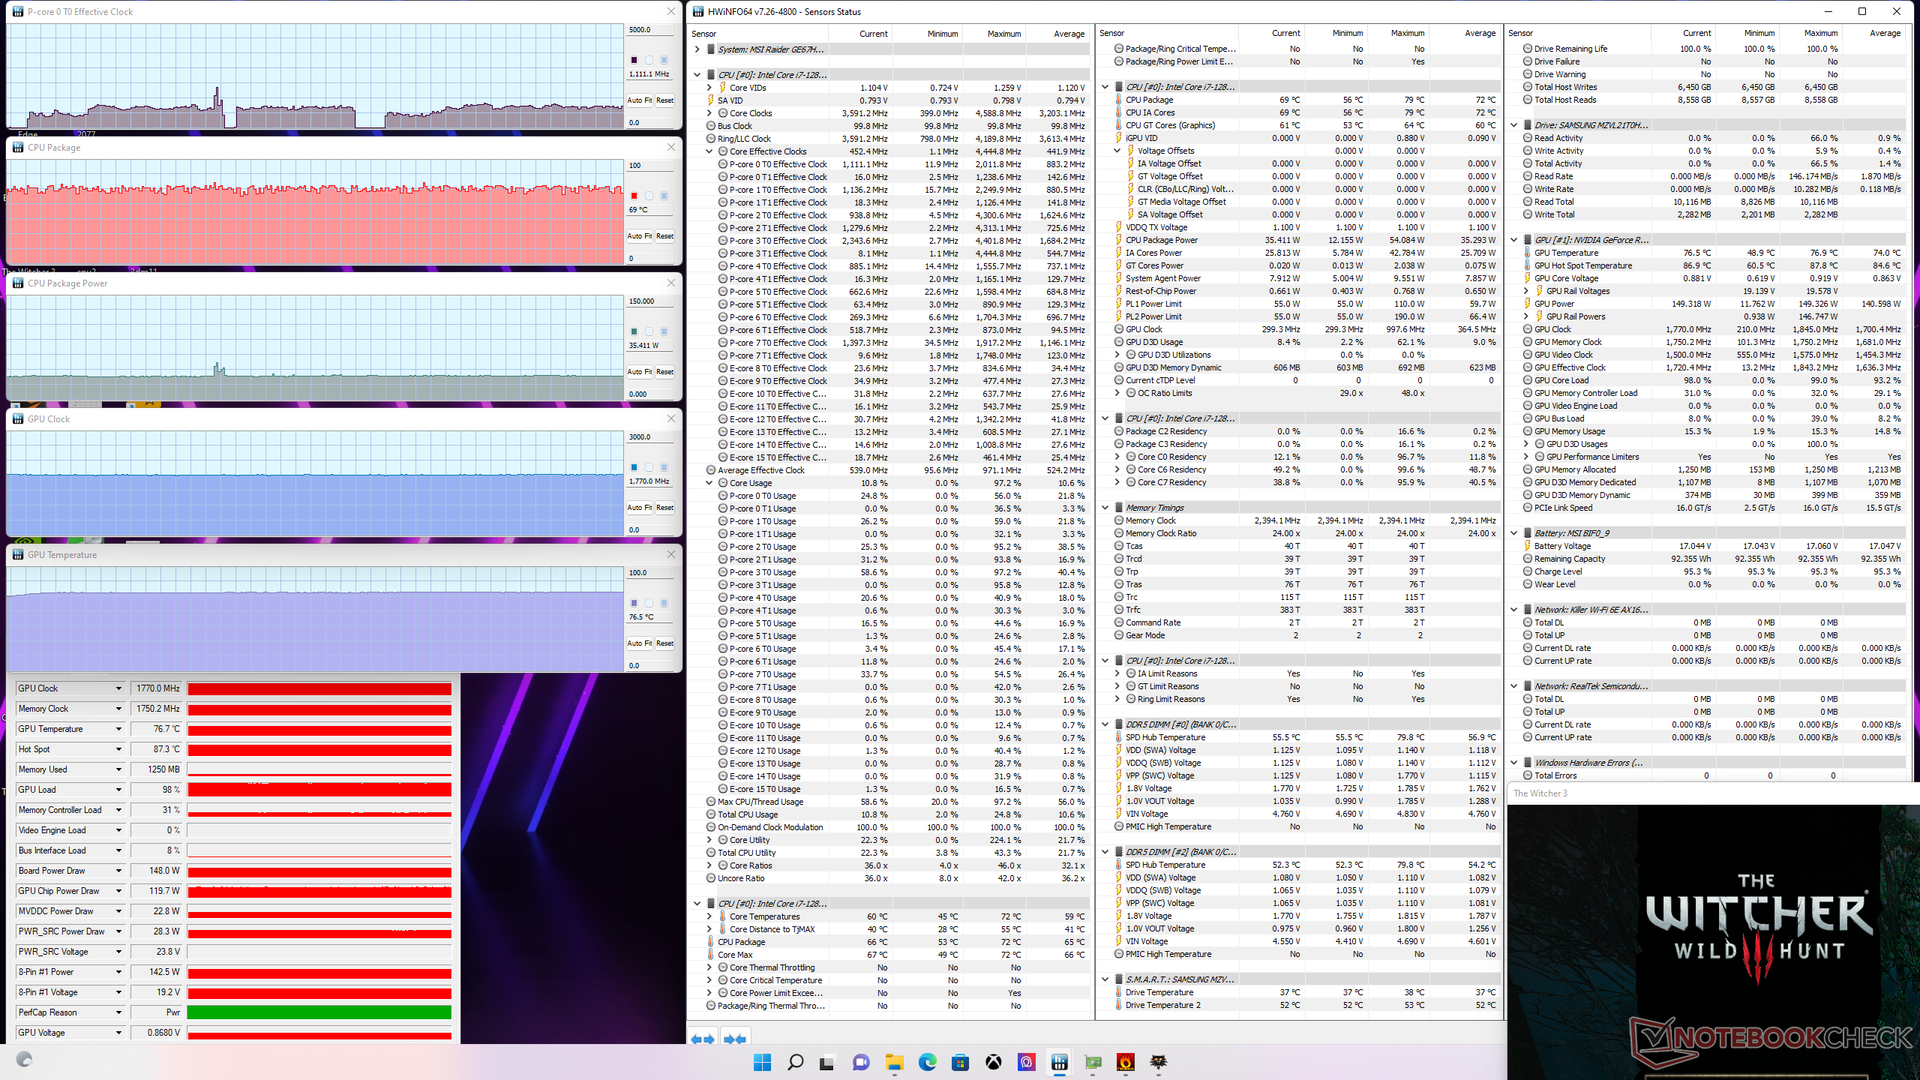
| Clock della CPU (GHz) | Clock della GPU (MHz) | Temperatura media della CPU (°C) | Temperatura media della GPU (°C) | |
| Sistema inattivo | -- | -- | 55 | 47 |
| Stress Prime95 | 3,4 - 3,7 | -- | 87 | 54 |
| StressPrime95 + FurMark | 2,6 | 1845 | 70 | 65 |
| Witcher 3 Stress (modalità bilanciata) | 0,9 | 1800 | 74 | 75 |
| Witcher 3 Stress (modalità Extreme Performance) | 1,1 | 1770 | 69 | 77 |
Altoparlanti
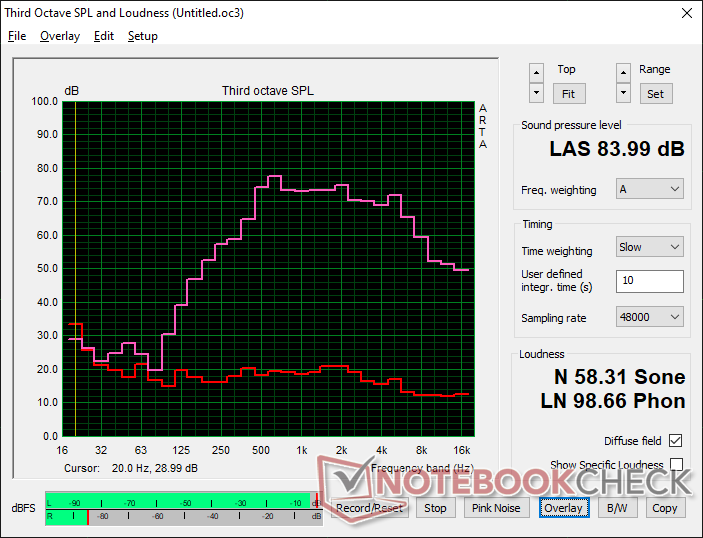
MSI GE67 HX 12UGS analisi audio
(+) | gli altoparlanti sono relativamente potenti (84 dB)
Bassi 100 - 315 Hz
(-) | quasi nessun basso - in media 17.9% inferiori alla media
(±) | la linearità dei bassi è media (13.7% delta rispetto alla precedente frequenza)
Medi 400 - 2000 Hz
(±) | medi elevati - circa 7.9% superiore alla media
(+) | medi lineari (6.6% delta rispetto alla precedente frequenza)
Alti 2 - 16 kHz
(±) | alti elevati - circa 5.5% superiori alla media
(±) | la linearità degli alti è media (8.6% delta rispetto alla precedente frequenza)
Nel complesso 100 - 16.000 Hz
(±) | la linearità complessiva del suono è media (22.1% di differenza rispetto alla media
Rispetto alla stessa classe
» 79% di tutti i dispositivi testati in questa classe è stato migliore, 6% simile, 15% peggiore
» Il migliore ha avuto un delta di 6%, medio di 18%, peggiore di 132%
Rispetto a tutti i dispositivi testati
» 64% di tutti i dispositivi testati in questa classe è stato migliore, 6% similare, 30% peggiore
» Il migliore ha avuto un delta di 4%, medio di 23%, peggiore di 134%
Apple MacBook Pro 16 2021 M1 Pro analisi audio
(+) | gli altoparlanti sono relativamente potenti (84.7 dB)
Bassi 100 - 315 Hz
(+) | bassi buoni - solo 3.8% dalla media
(+) | bassi in lineaa (5.2% delta rispetto alla precedente frequenza)
Medi 400 - 2000 Hz
(+) | medi bilanciati - solo only 1.3% rispetto alla media
(+) | medi lineari (2.1% delta rispetto alla precedente frequenza)
Alti 2 - 16 kHz
(+) | Alti bilanciati - appena 1.9% dalla media
(+) | alti lineari (2.7% delta rispetto alla precedente frequenza)
Nel complesso 100 - 16.000 Hz
(+) | suono nel complesso lineare (4.6% differenza dalla media)
Rispetto alla stessa classe
» 0% di tutti i dispositivi testati in questa classe è stato migliore, 0% simile, 100% peggiore
» Il migliore ha avuto un delta di 5%, medio di 17%, peggiore di 45%
Rispetto a tutti i dispositivi testati
» 0% di tutti i dispositivi testati in questa classe è stato migliore, 0% similare, 100% peggiore
» Il migliore ha avuto un delta di 4%, medio di 23%, peggiore di 134%
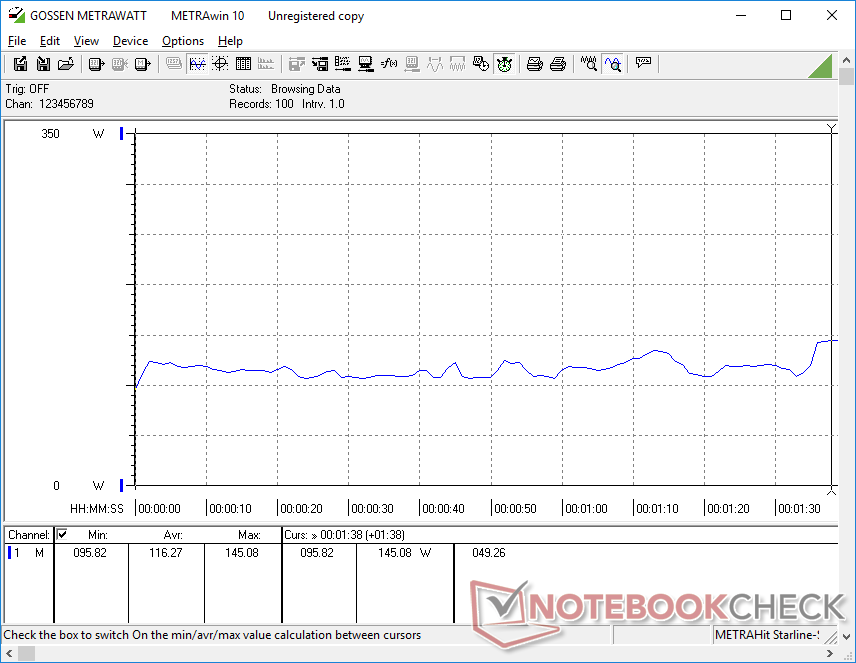
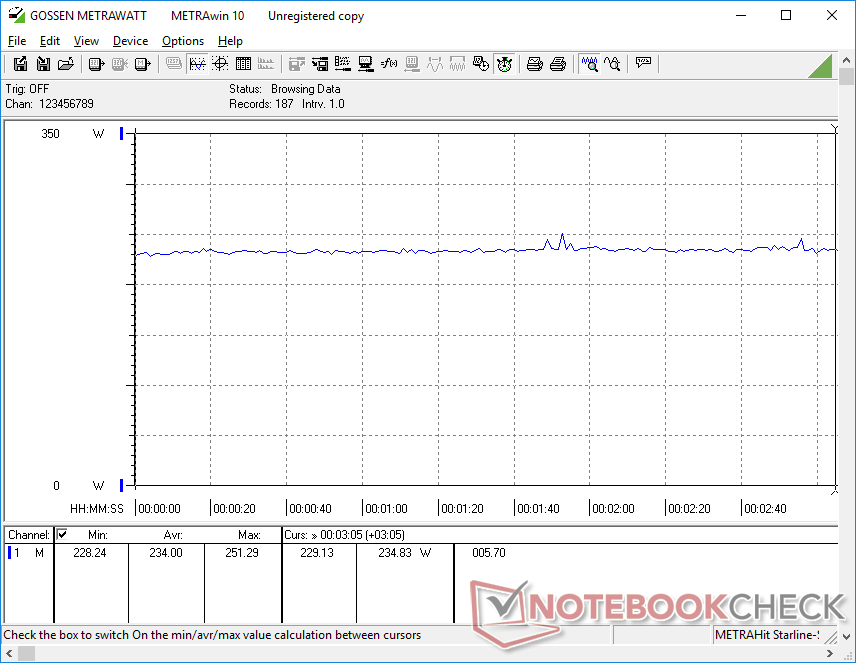
Gestione dell'energia - Consumi elevati e mattoni di potenza pesante
Consumo di energia
Il consumo è notevolmente più elevato rispetto a quello registrato sul vecchio Core i9-12900HK GE66, soprattutto quando si eseguono applicazioni pesanti per la CPU. Prime95, ad esempio, consuma circa 165 W sul nostro GE67 rispetto ai soli 90 W del GE66, con un aumento dell'83%. È un prezzo elevato da pagare per l'aumento del 35-40% delle prestazioni multi-thread grezze tra il Core i9-12900HK e il Core i7-12800HX
L'esecuzione Witcher 3 consumerebbe circa 237 W, un valore di nuovo superiore ai 202 W che abbiamo registrato sul GE66. Anche rispetto ad altri portatili da gioco ad alte prestazioni come l'Asus ROG Strix Scar 15 o l'Alienware m15 R6 Alienware m15 R6il GE67 sarebbe più affamato di energia in entrambe le occasioni
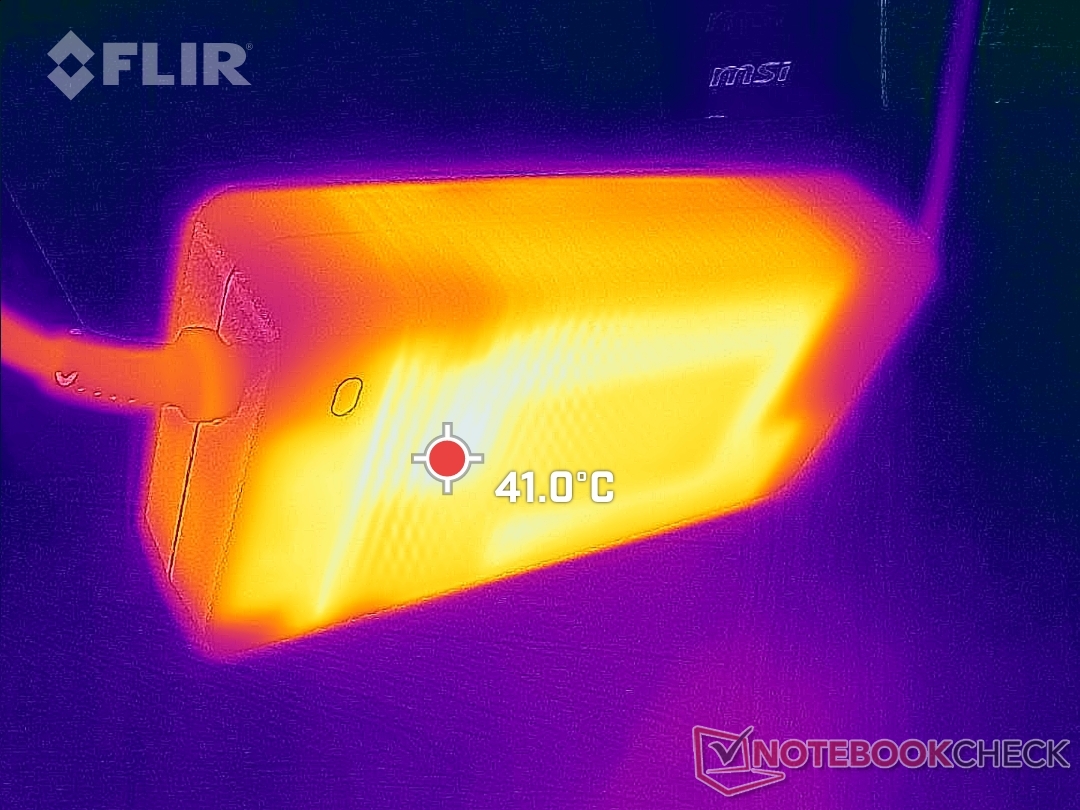
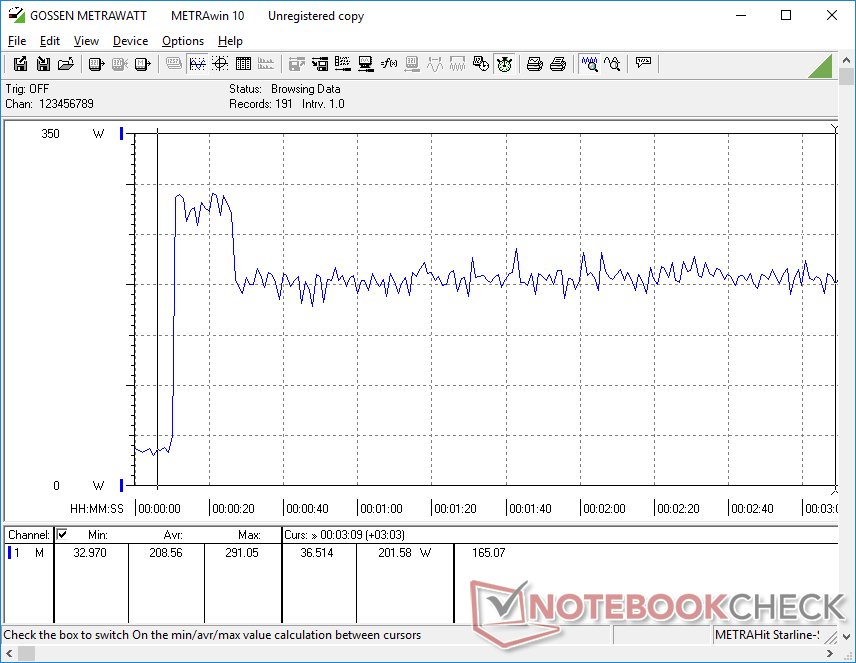
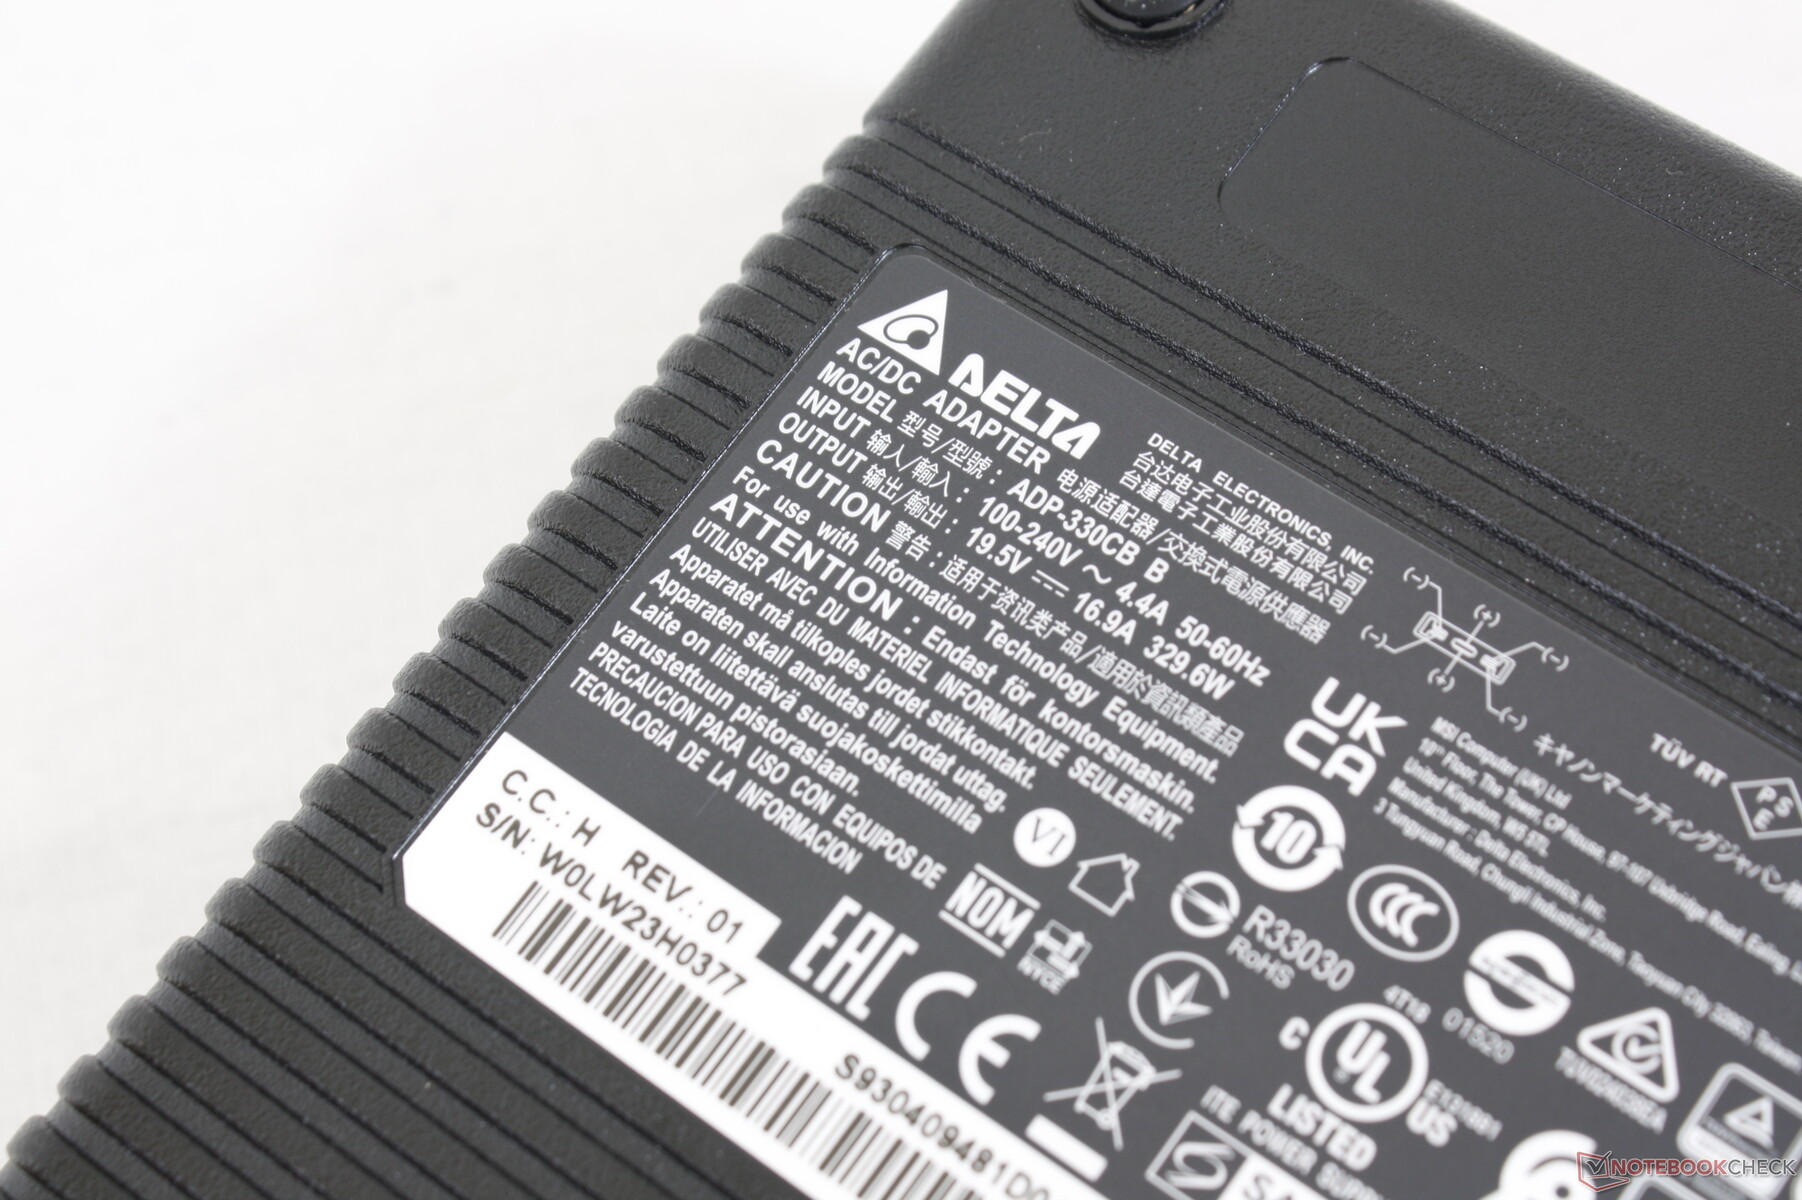
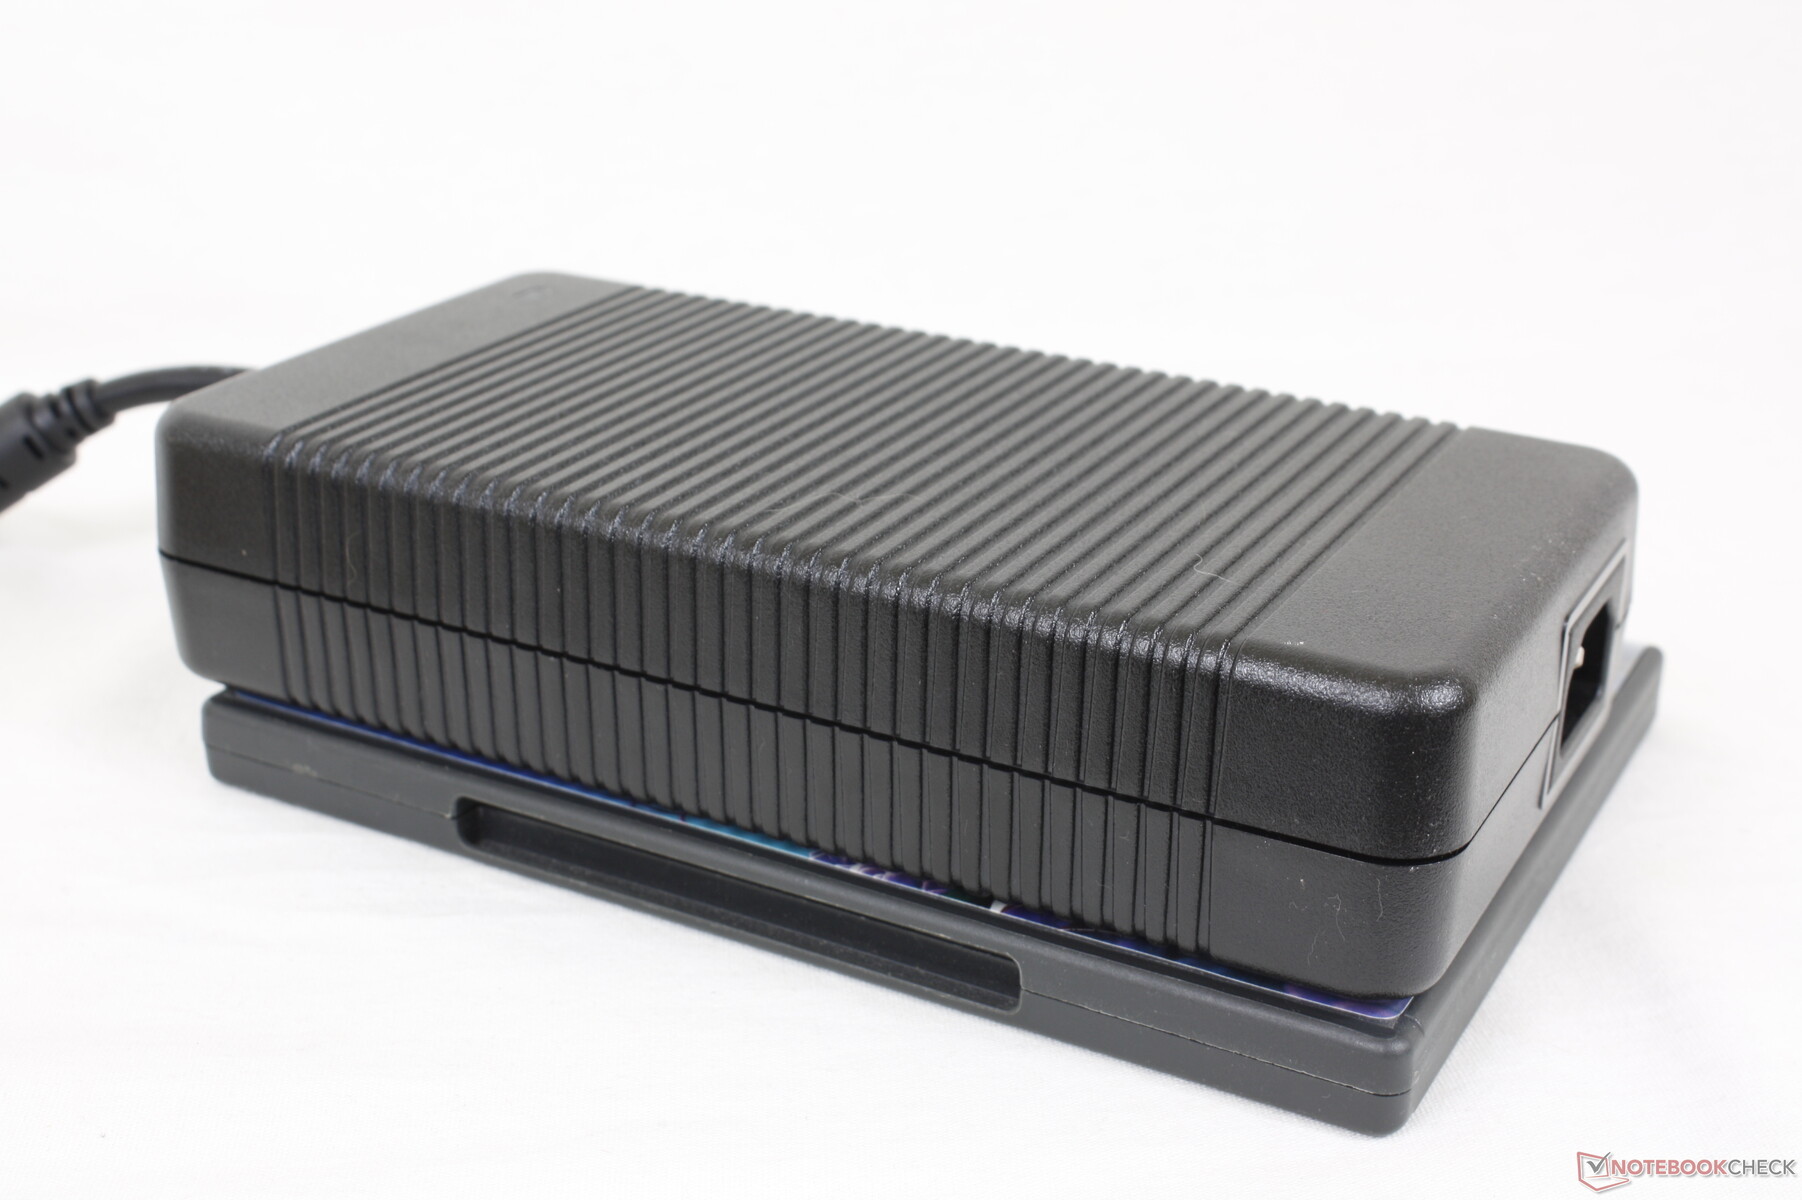
Siamo riusciti a registrare un assorbimento massimo di 291 W dal massiccio (~20 x 9,8 x 4,3 cm) e pesante (1,3 kg) mattone di alimentazione da 330 W quando si eseguono contemporaneamente Prime95 e FurMark. Si noti che la maggior parte degli altri portatili da gioco viene fornita con adattatori CA da 280 W o più piccoli.
| Off / Standby | |
| Idle | |
| Sotto carico |
|
Leggenda:
min: | |
| MSI GE67 HX 12UGS i7-12800HX, GeForce RTX 3070 Ti Laptop GPU, Samsung PM9A1 MZVL21T0HCLR, OLED, 1920x1080, 15.6" | MSI Raider GE66 12UHS i9-12900HK, GeForce RTX 3080 Ti Laptop GPU, Samsung PM9A1 MZVL22T0HBLB, IPS, 3840x2160, 15.6" | MSI Vector GP66 12UGS i9-12900H, GeForce RTX 3070 Ti Laptop GPU, , IPS, 1920x1080, 15.6" | Asus ROG Strix Scar 15 G533ZW-LN106WS i9-12900H, GeForce RTX 3070 Ti Laptop GPU, Samsung PM9A1 MZVL22T0HBLB, IPS-level, 2560x1440, 15.6" | Alienware m15 R6, i7-11800H RTX 3080 i7-11800H, GeForce RTX 3080 Laptop GPU, Samsung PM9A1 MZVL21T0HCLR, IPS, 1920x1080, 15.6" | Razer Blade 15 2022 i7-12800H, GeForce RTX 3080 Ti Laptop GPU, SSSTC CA6-8D1024, IPS, 2560x1440, 15.6" | |
|---|---|---|---|---|---|---|
| Power Consumption | 5% | -15% | 21% | 12% | -35% | |
| Idle Minimum * (Watt) | 16.1 | 16 1% | 17.5 -9% | 7.56 53% | 14 13% | 33.2 -106% |
| Idle Average * (Watt) | 17.1 | 19 -11% | 20.1 -18% | 13.5 21% | 18 -5% | 36.4 -113% |
| Idle Maximum * (Watt) | 26.6 | 26 2% | 47.3 -78% | 16.87 37% | 29 -9% | 37.6 -41% |
| Load Average * (Watt) | 116.3 | 110 5% | 107.3 8% | 128.9 -11% | 93 20% | 116.7 -0% |
| Witcher 3 ultra * (Watt) | 237 | 202 15% | 225 5% | 196.2 17% | 190 20% | 172 27% |
| Load Maximum * (Watt) | 291.1 | 242 17% | 277.7 5% | 274.86 6% | 203 30% | 228.6 21% |
* ... Meglio usare valori piccoli
Power Consumption Witcher 3 / Stresstest
Power Consumption external Monitor
Durata della batteria: non male
La capacità della batteria è la massima consentita, pari a 99,9 Wh, poiché qualsiasi valore superiore violerebbe le norme di sicurezza delle batterie al litio della FAA. Gli utenti possono aspettarsi tempi di esecuzione WLAN di circa 5,5 ore se impostati sul profilo di alimentazione Bilanciato, che è simile a quello che abbiamo registrato sul GE66 nonostante le differenze di prestazioni.
La ricarica da vuoto a pieno è lenta e dura dalle 2 alle 2,5 ore. Il sistema non può essere caricato tramite USB-C, a differenza della serie Razer Blade o della maggior parte dei modelli Asus ROG.
| MSI GE67 HX 12UGS i7-12800HX, GeForce RTX 3070 Ti Laptop GPU, 99.9 Wh | MSI Raider GE66 12UHS i9-12900HK, GeForce RTX 3080 Ti Laptop GPU, 99 Wh | MSI Vector GP66 12UGS i9-12900H, GeForce RTX 3070 Ti Laptop GPU, 65 Wh | Asus ROG Strix Scar 15 G533ZW-LN106WS i9-12900H, GeForce RTX 3070 Ti Laptop GPU, 90 Wh | Alienware m15 R6, i7-11800H RTX 3080 i7-11800H, GeForce RTX 3080 Laptop GPU, 84 Wh | Razer Blade 15 2022 i7-12800H, GeForce RTX 3080 Ti Laptop GPU, 80 Wh | |
|---|---|---|---|---|---|---|
| Autonomia della batteria | -9% | -19% | -4% | -18% | -12% | |
| Reader / Idle (h) | 8.4 | 7.9 -6% | ||||
| WiFi v1.3 (h) | 5.6 | 5.7 2% | 5.7 2% | 8.4 50% | 5 -11% | 4.9 -12% |
| Load (h) | 2.1 | 1.7 -19% | 1 -52% | 0.9 -57% | 1.6 -24% | |
| H.264 (h) | 7.1 | 8.5 | 5.6 | |||
| Witcher 3 ultra (h) | 1.2 |
Pro
Contro
Verdetto - Prestazioni più elevate, bollette più salate
I vantaggi in termini di prestazioni del Core i7-12800HX sono innegabili. Se confrontato con il Ryzen 7 5800H o anche al Core i9-12900Hla CPU Intel HX è in grado di offrire prestazioni multi-thread fino all'80% superiori rispetto al primo e dal 30 al 60% superiori rispetto al secondo. I guadagni sono abbastanza significativi da superare il Core i7-12700K di classe desktop Core i7-12700K in molti casi. Gli appassionati e i giocatori che sanno di poter trarre vantaggio da questo processore, ad esempio per ottenere un frame rate più elevato durante i giochi, troveranno molto da apprezzare in ciò che il GE67 può offrire.
Tutte queste prestazioni extra non sono gratuite. Mentre il GE66 viene fornito con un adattatore CA più sottile da 280 W, il GE67 viene fornito con un adattatore CA più ingombrante da 330 W solo per ospitare la CPU HX Intel di 12a generazione, affamata di energia. Di conseguenza, il consumo energetico è indubbiamente più elevato. Alcuni utenti potrebbero ritenere questi svantaggi validi se si considera l'immenso guadagno della CPU, ma è comunque un aspetto da tenere presente se si considera il rapporto prestazioni/watt.
Il GE67 è uno dei portatili da gioco da 15,6 pollici più veloci grazie alla CPU Core i7-12800HX e alla GPU RTX da 150 W GeForce. È anche uno dei più affamati di energia, in quanto richiede un grosso blocco di alimentazione da 330 W per funzionare.
Per quanto riguarda il display QHD OLED da 240 Hz, si tratta senza dubbio del miglior pannello OLED attualmente disponibile per i giochi e si abbina molto bene alla CPU HX e alla GPU RTX 3070 Ti da 150 W GeForce. Tuttavia, la sua implementazione sul GE67 non è adatta a scopi di editing professionale e lo sfarfallio potrebbe interessare una minoranza di utenti.
Prezzo e disponibilità
Al momento, MSI GE67 non è ancora disponibile su Amazon o Best Buy. Tuttavia, punti vendita come XoticPC e EXcaliberPC hanno in magazzino SKU a partire da 2500 dollari.
MSI GE67 HX 12UGS
- 08/30/2022 v7 (old)
Allen Ngo
Price comparison

