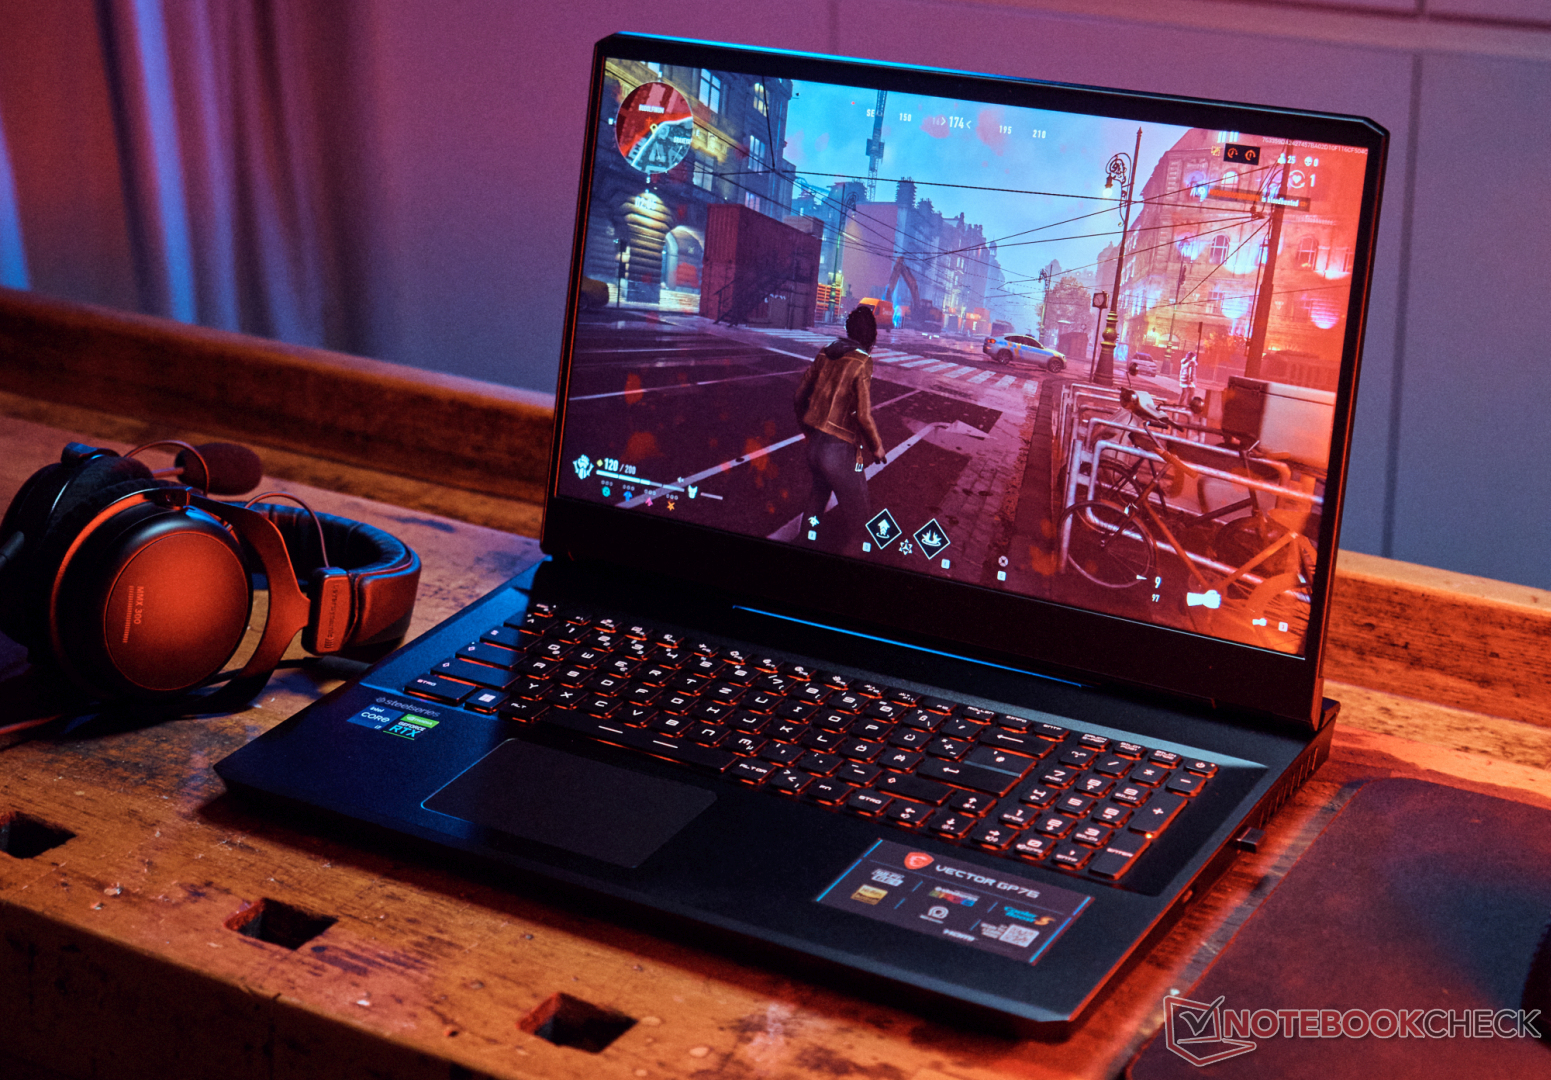
Recensione dell'MSI Vector GP76 12UGS: Un veloce portatile gaming

Con la nuova serie Vector, MSI introduce quest'anno due nuovi notebook sui campi di gioco. Il più piccolo da 15 pollici offre già prestazioni eccezionali, ma quali sono gli aggiornamenti che il Vector GP76 offre come successore diretto delGP76 Leoparda differenza del MSI Alpha, Katana o Pulsela gamma Vector non è pensata per utenti entry-level o di fascia media, ma offre macchine da gioco di fascia alta con elementi di fascia media, il che si riflette anche nel prezzo di circa 2.600 dollari.
Tuttavia, mancano alcune caratteristiche rispetto alla serieSerie GE per gli appassionati e la compatta serie Serie GS. Ad esempio, sono state omesse la Thunderbolt 4, il lettore di schede e la ricarica USB-C, oltre alla mancanza di opzioni per i display QHD o UHD, o di una Nvidia GeForce RTX 3080 Tiinoltre, è dotato di una RAM DDR4 un po' più lenta e di una batteria più piccola. Ciononostante, ci sono molte caratteristiche e aggiornamenti importanti che mettiamo in evidenza in questo report, come il pannello veloce a 360 Hz con tempo di risposta di 4 ms.
I concorrenti includono il modello Asus ROG Strix G17, il Gigabyte Aorus 17, XMG Neo 17 di Schenker e Legion 5 Pro di Lenovo. Interessante anche il confronto con il modello di prezzo simile Asus ROG Zephyrus M16.
Potenziali concorrenti a confronto
Punteggio | Data | Modello | Peso | Altezza | Dimensione | Risoluzione | Prezzo |
|---|---|---|---|---|---|---|---|
| 86.7 % v7 (old) | 05/2022 | MSI Vector GP76 12UGS-434 i7-12700H, GeForce RTX 3070 Ti Laptop GPU | 2.9 kg | 25.9 mm | 17.30" | 1920x1080 | |
| 85.1 % v7 (old) | 03/2021 | MSI GP76 Leopard 10UG i7-10750H, GeForce RTX 3070 Laptop GPU | 2.9 kg | 26 mm | 17.30" | 1920x1080 | |
| 83.4 % v7 (old) | 08/2021 | Asus ROG Strix G17 G713QE-RB74 R7 5800H, GeForce RTX 3050 Ti Laptop GPU | 2.5 kg | 24.6 mm | 17.30" | 1920x1080 | |
| 85.2 % v7 (old) | 04/2022 | Aorus 17 XE4 i7-12700H, GeForce RTX 3070 Ti Laptop GPU | 2.6 kg | 27 mm | 17.30" | 1920x1080 | |
| 87.4 % v7 (old) | 09/2021 | Schenker XMG NEO 17 GM7TG8S i7-11800H, GeForce RTX 3080 Laptop GPU | 2.6 kg | 27.45 mm | 17.30" | 2560x1440 | |
| 88 % v7 (old) | 03/2022 | Lenovo Legion 5 Pro 16 G7 i7 RTX 3070Ti i7-12700H, GeForce RTX 3070 Ti Laptop GPU | 2.6 kg | 26.6 mm | 16.00" | 2560x1600 | |
| 85.6 % v7 (old) | 07/2021 | Asus ROG Zephyrus M16 GU603H i9-11900H, GeForce RTX 3070 Laptop GPU | 2 kg | 20 mm | 16.00" | 2560x1600 | |
| 86.9 % v7 (old) | 03/2022 | MSI Vector GP66 12UGS i9-12900H, GeForce RTX 3070 Ti Laptop GPU | 2.3 kg | 23.4 mm | 15.60" | 1920x1080 |
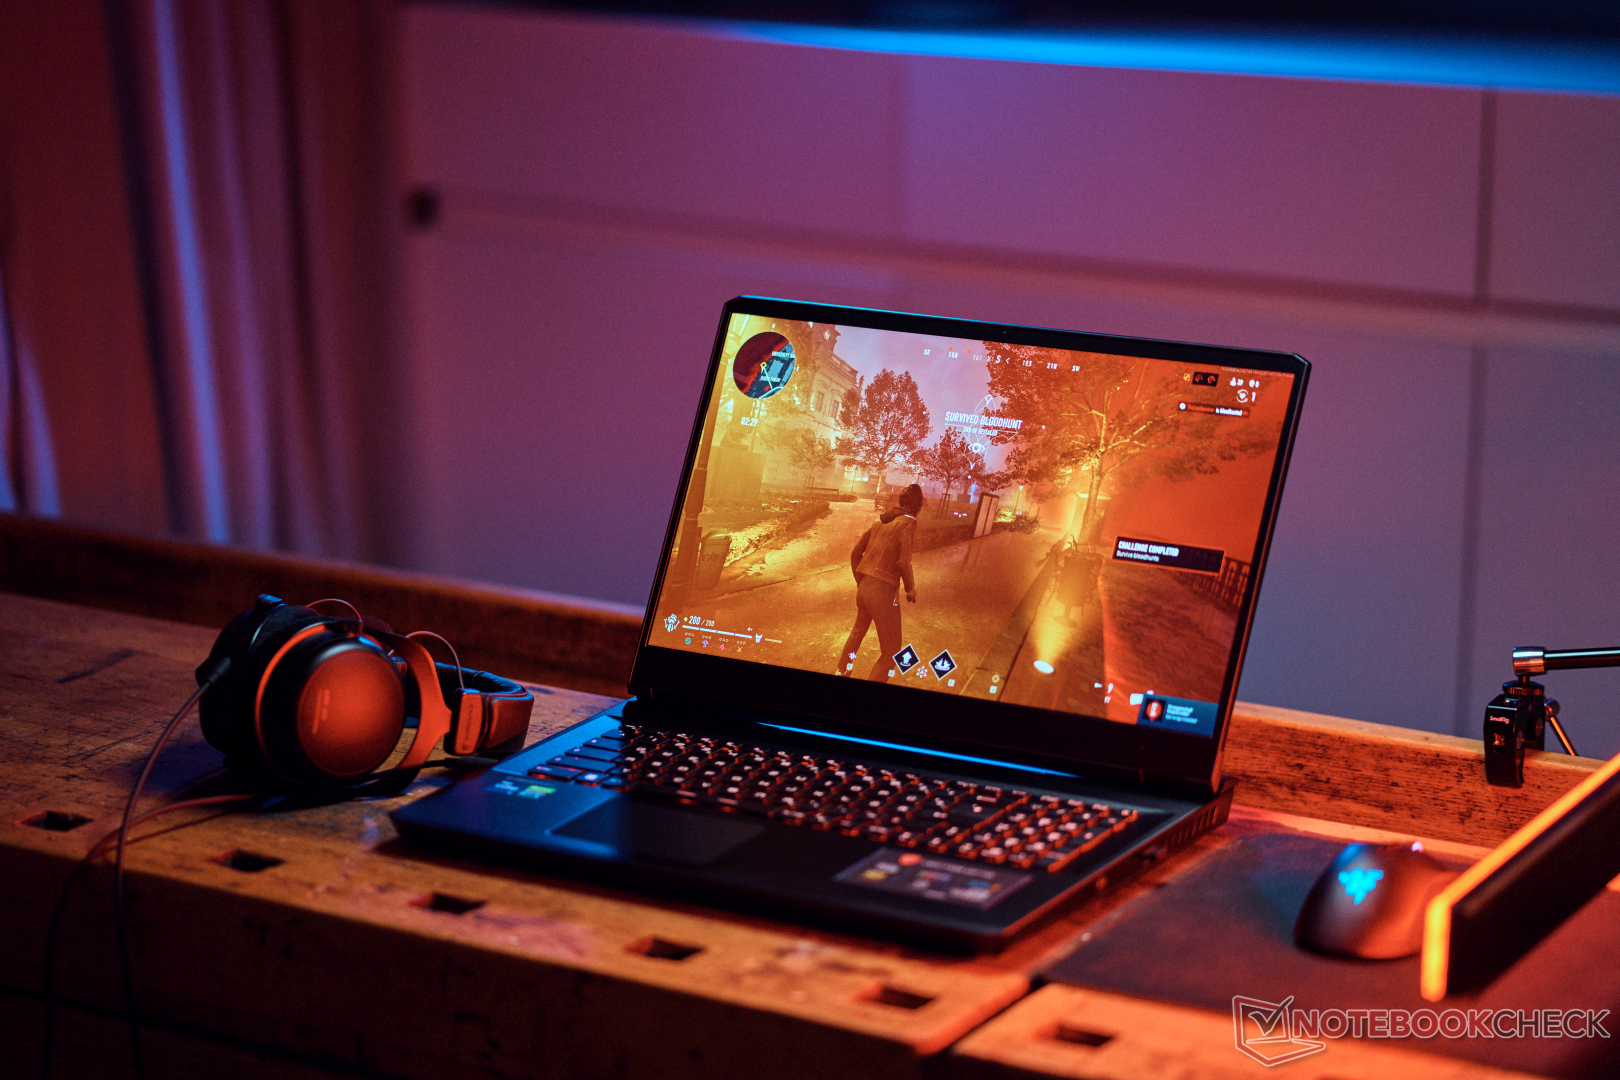
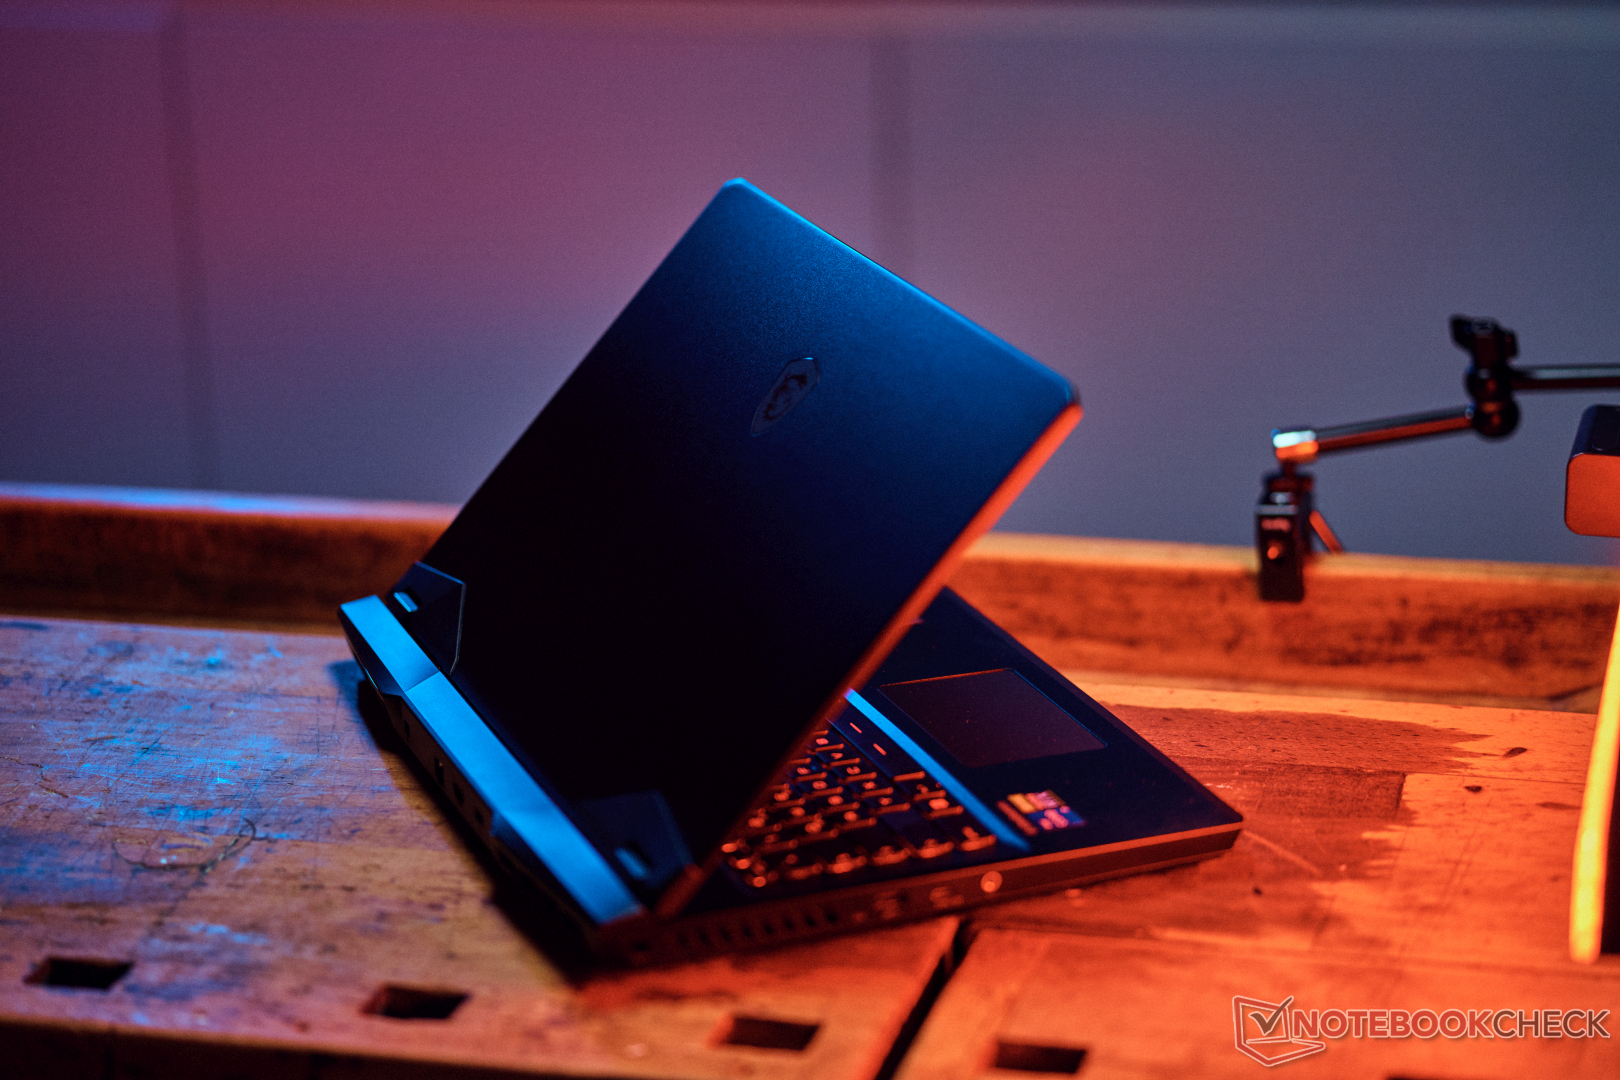
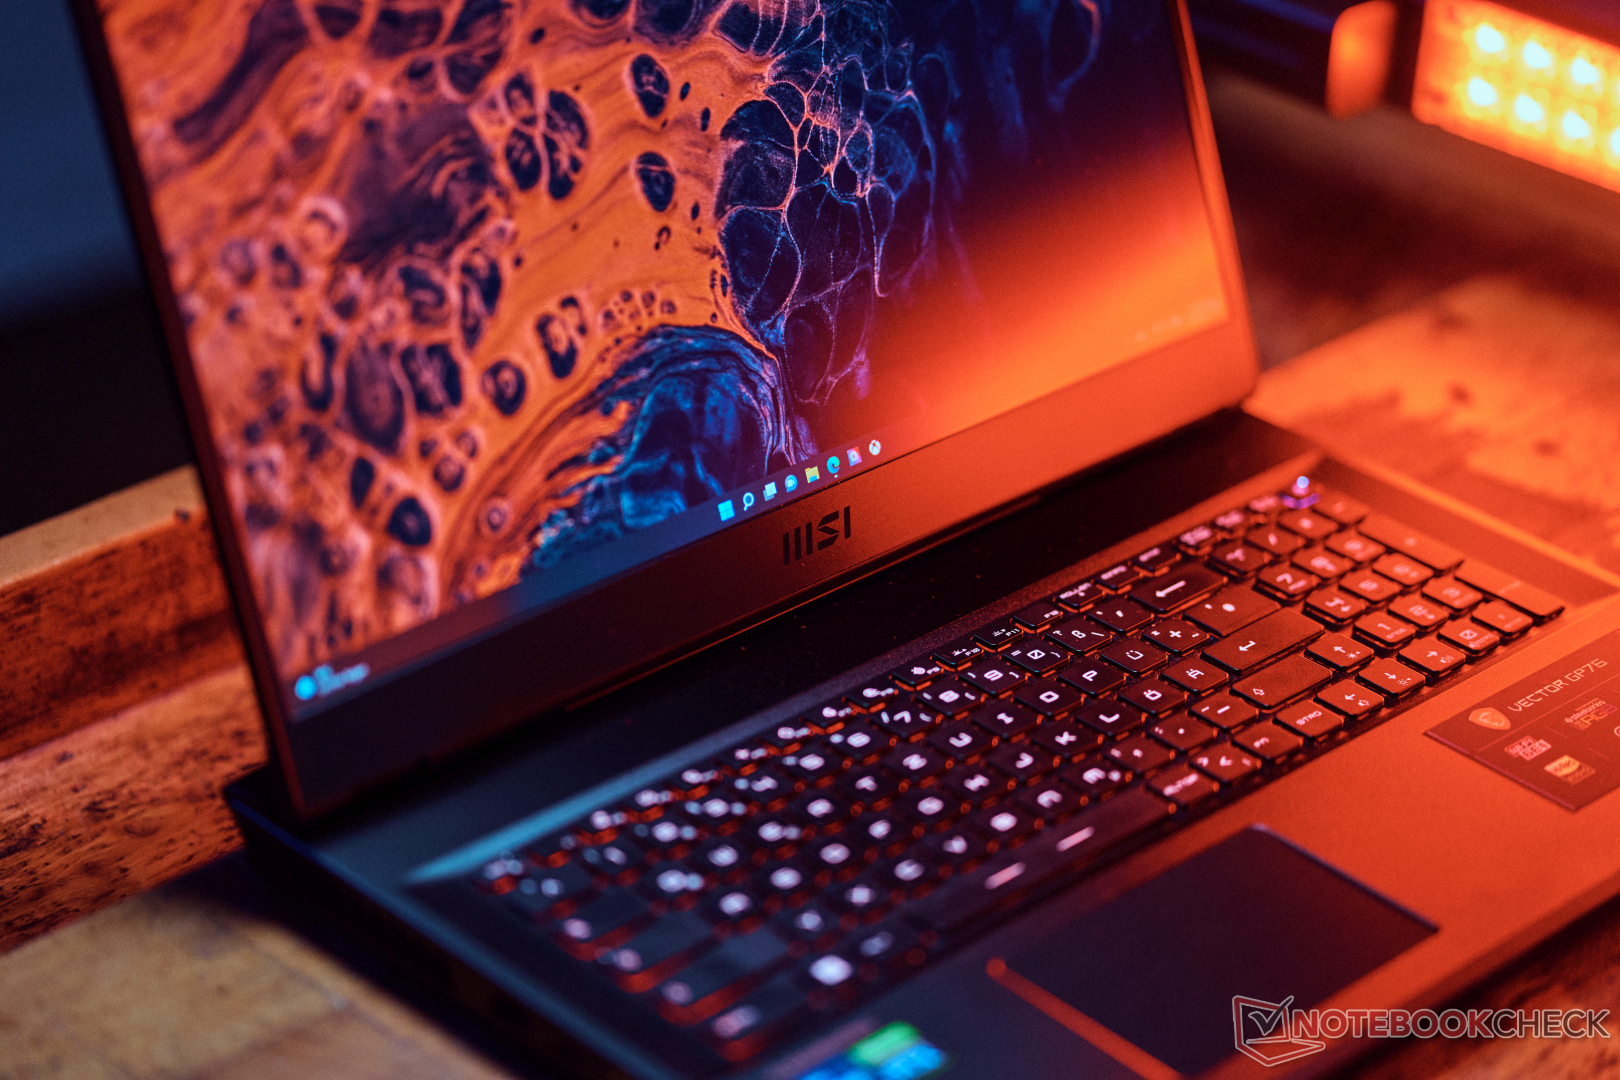
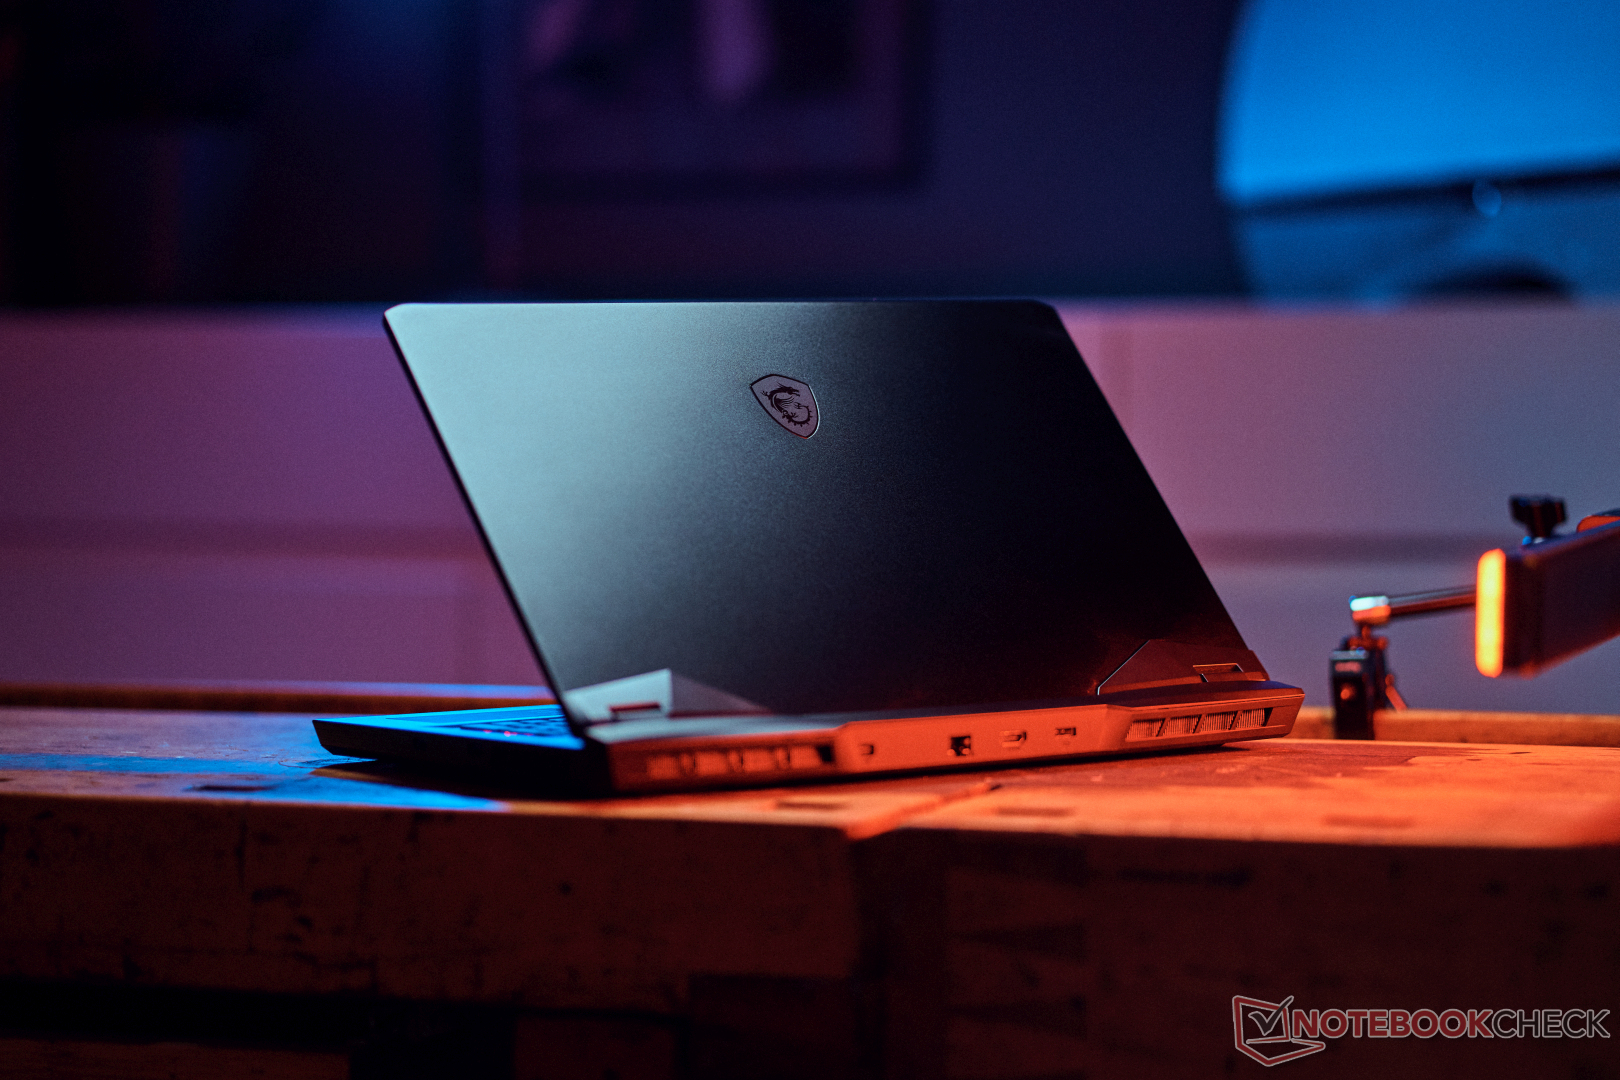
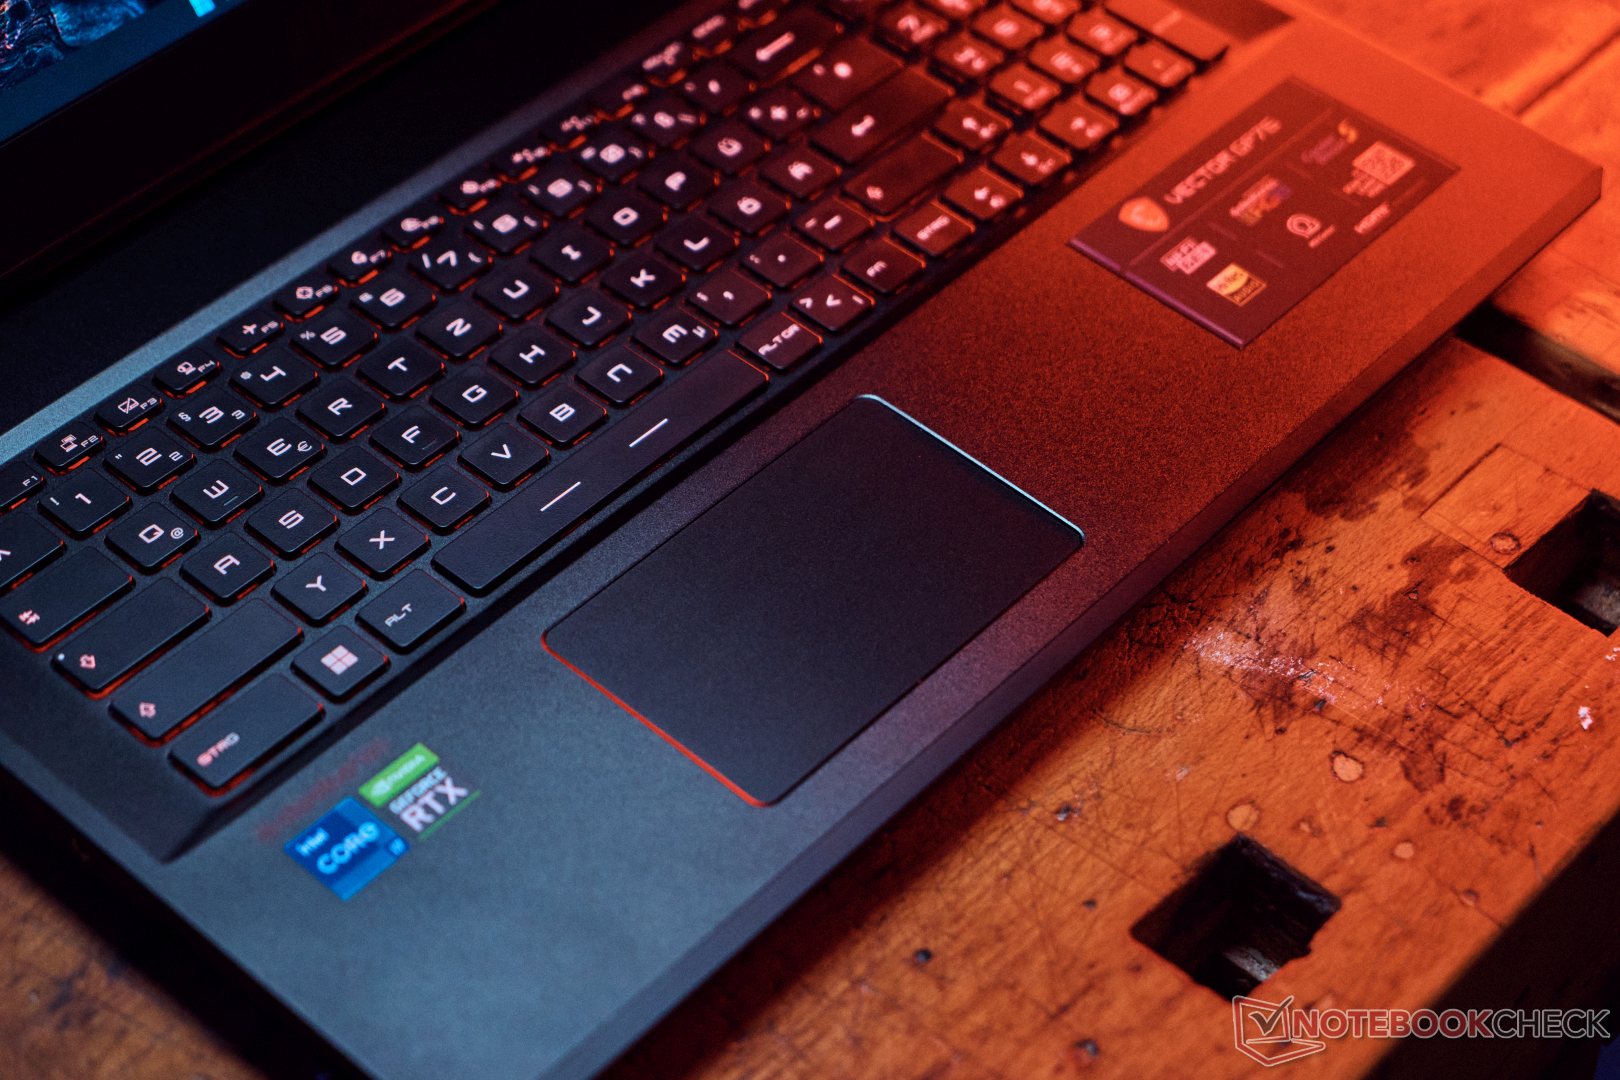
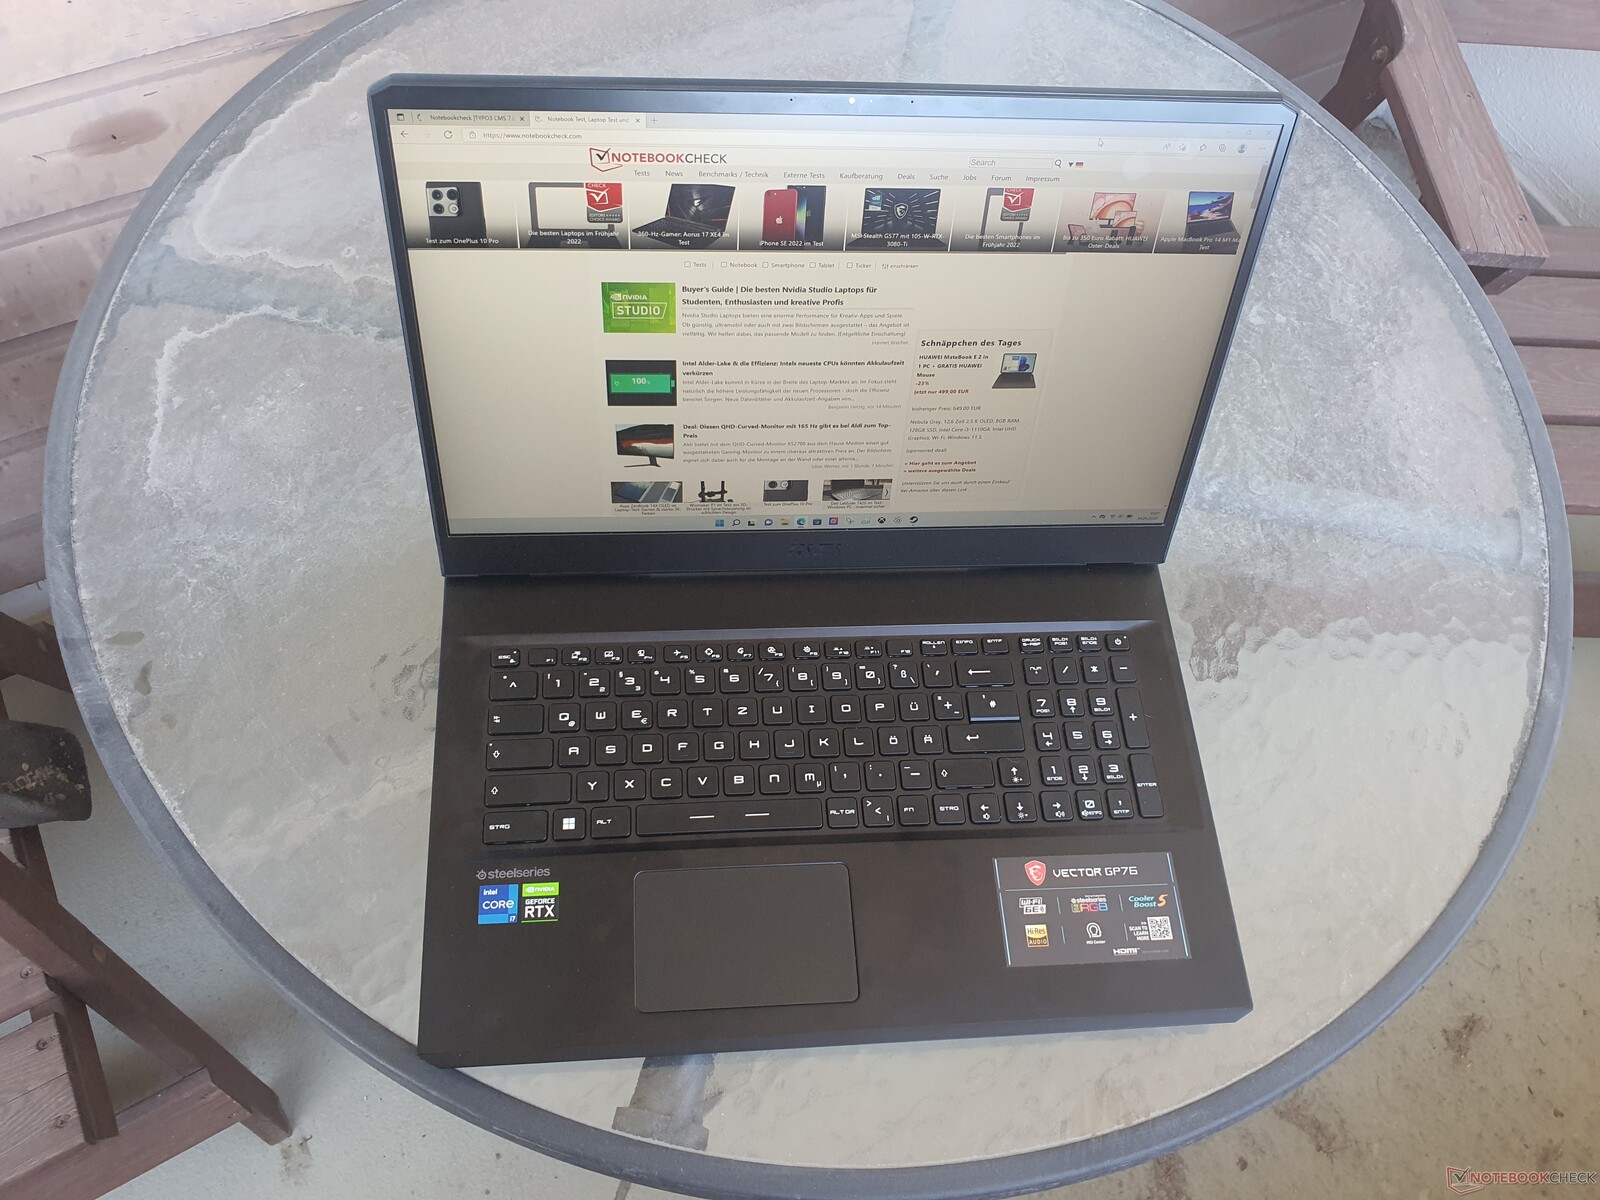
Case: MSI con Vector stabile e molto metallo
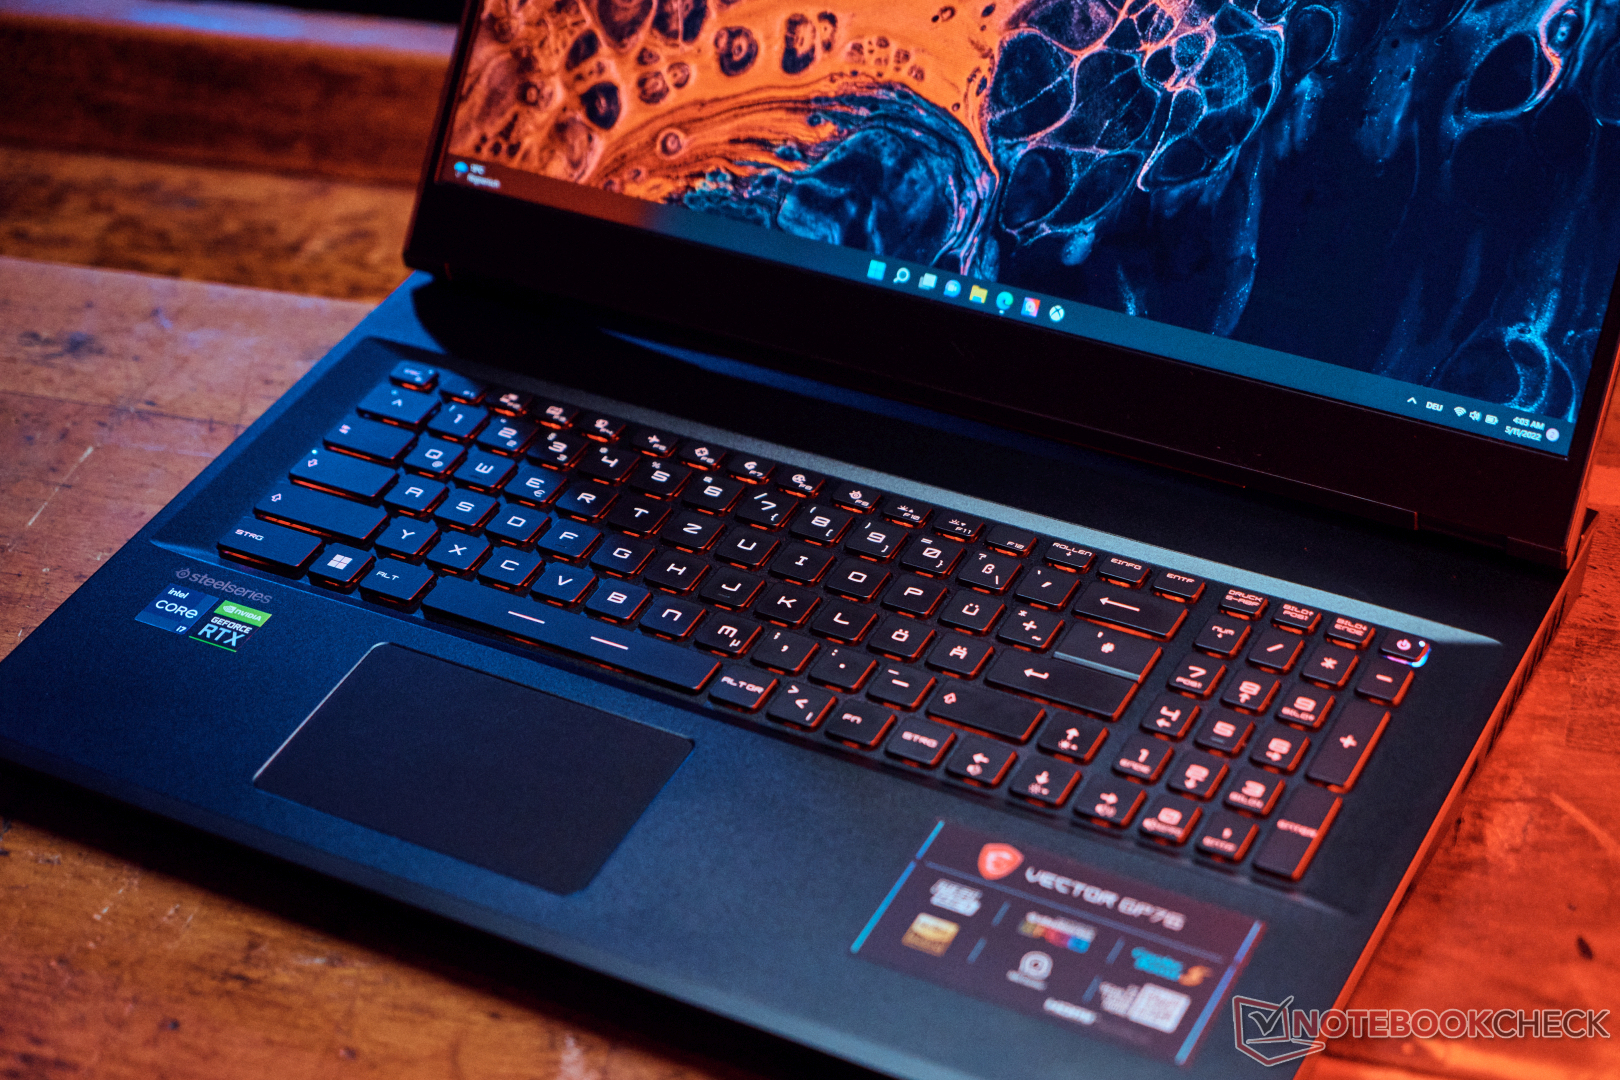
L'MSI Vector GP76, disponibile solo nella colorazione "Coral Black", ha un case estremamente robusto con coperchio del display e area della tastiera in alluminio. Rispetto al modello precedente, il case è rimasto in gran parte invariato e presenta una parte inferiore in plastica. Il Vector è resistente alla torsione, compreso il display, e la pressione mirata sul retro del display non causa alcuna distorsione dell'immagine. Solo la parte inferiore della cornice del display cede un po' alla pressione, ma non è un problema grave. Lo schermo traballa solo leggermente.
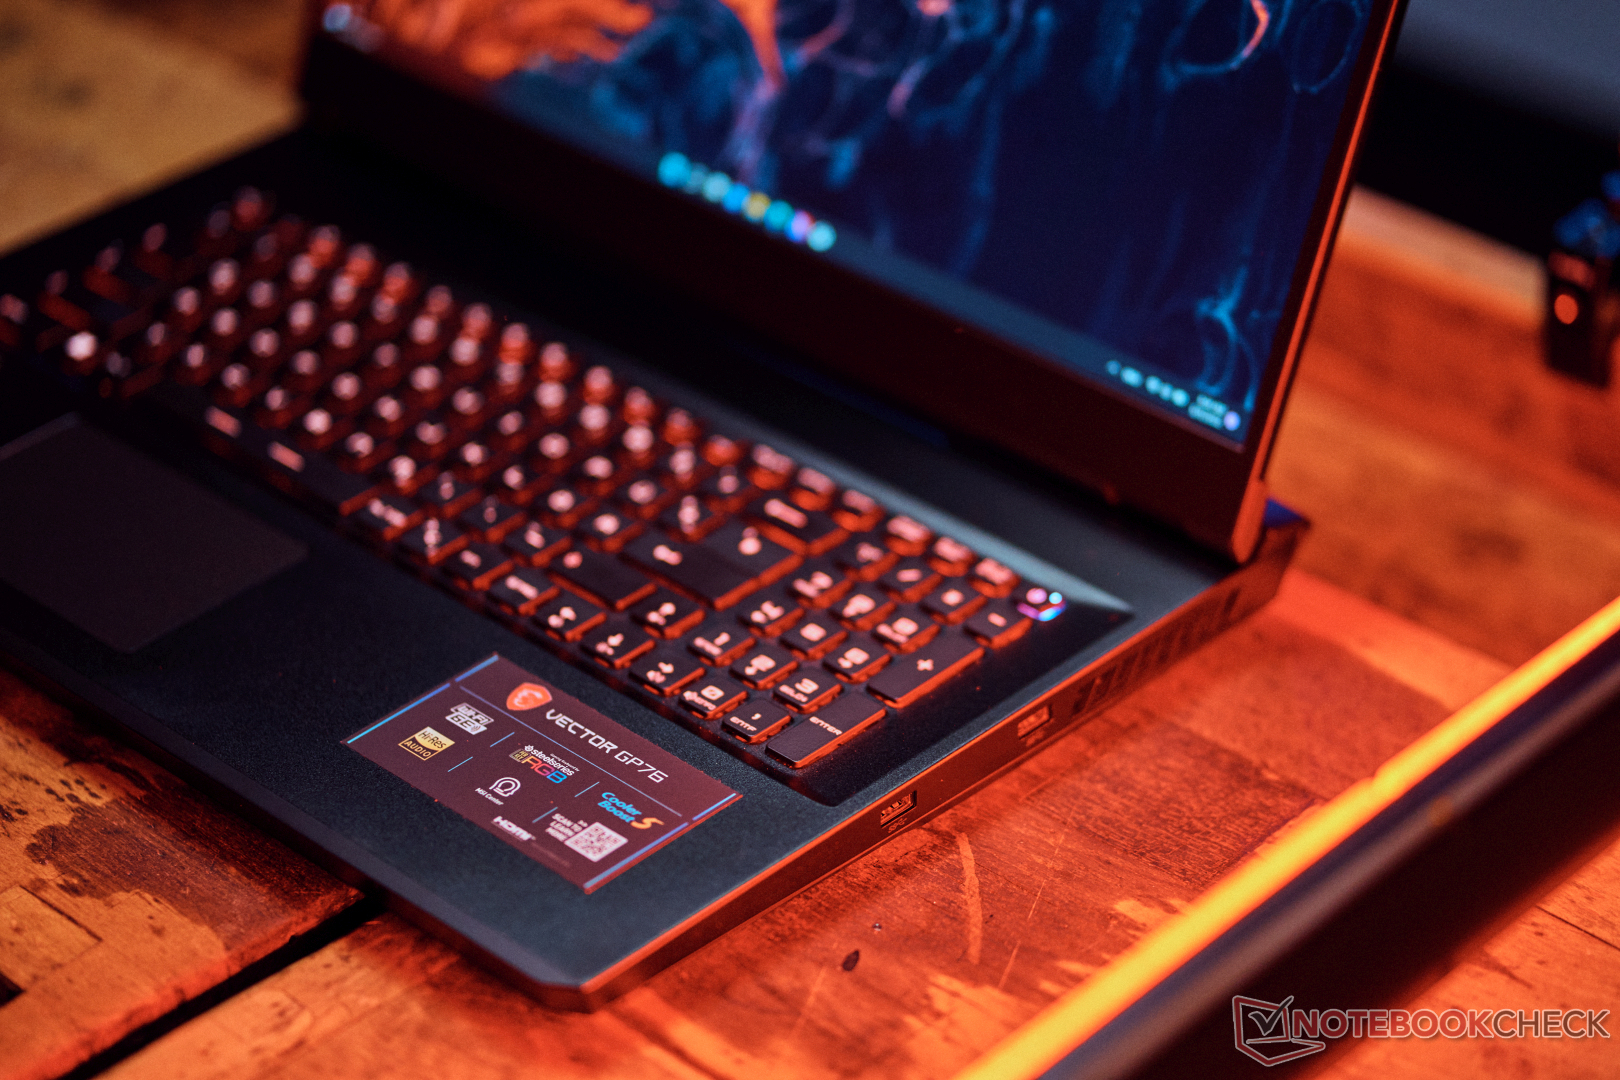
Il coperchio può essere aperto con una sola mano, mentre l'angolo di apertura massimo di 140 gradi è un po' ridotto. La tastiera è ben inserita nel case e non si piega affatto. Le superfici sono leggermente ruvide e hanno una sensazione di alta qualità. Alcuni bordi sono un po' taglienti a causa del design da gioco, ma sono comunque accettabili. Tuttavia, poiché il bordo anteriore del case è collegato al pannello inferiore, questo può allentarsi o staccarsi un po' con il tempo, rovinando l'impressione generale di qualità.

Il peso di 2,85 kg è accettabile in considerazione del fatto che si tratta di una macchina da gioco da 17 pollici con componenti potenti. La concorrenza offre dispositivi impercettibilmente più leggeri, come quelli della classe da 16 pollici, come l' Asus ROG Zephyrus M16è significativamente più leggero, con un peso di soli 2 kg, ed è anche il dispositivo più compatto di gran lunga nel campo di confronto. La differenza è piuttosto significativa e vale sicuramente la pena di tenerla in considerazione per i giochi in mobilità. Lo spessore di 26 mm non è male. Nel complesso, il GP76 è leggermente più spesso di altri dispositivi da 17 pollici comparabili.
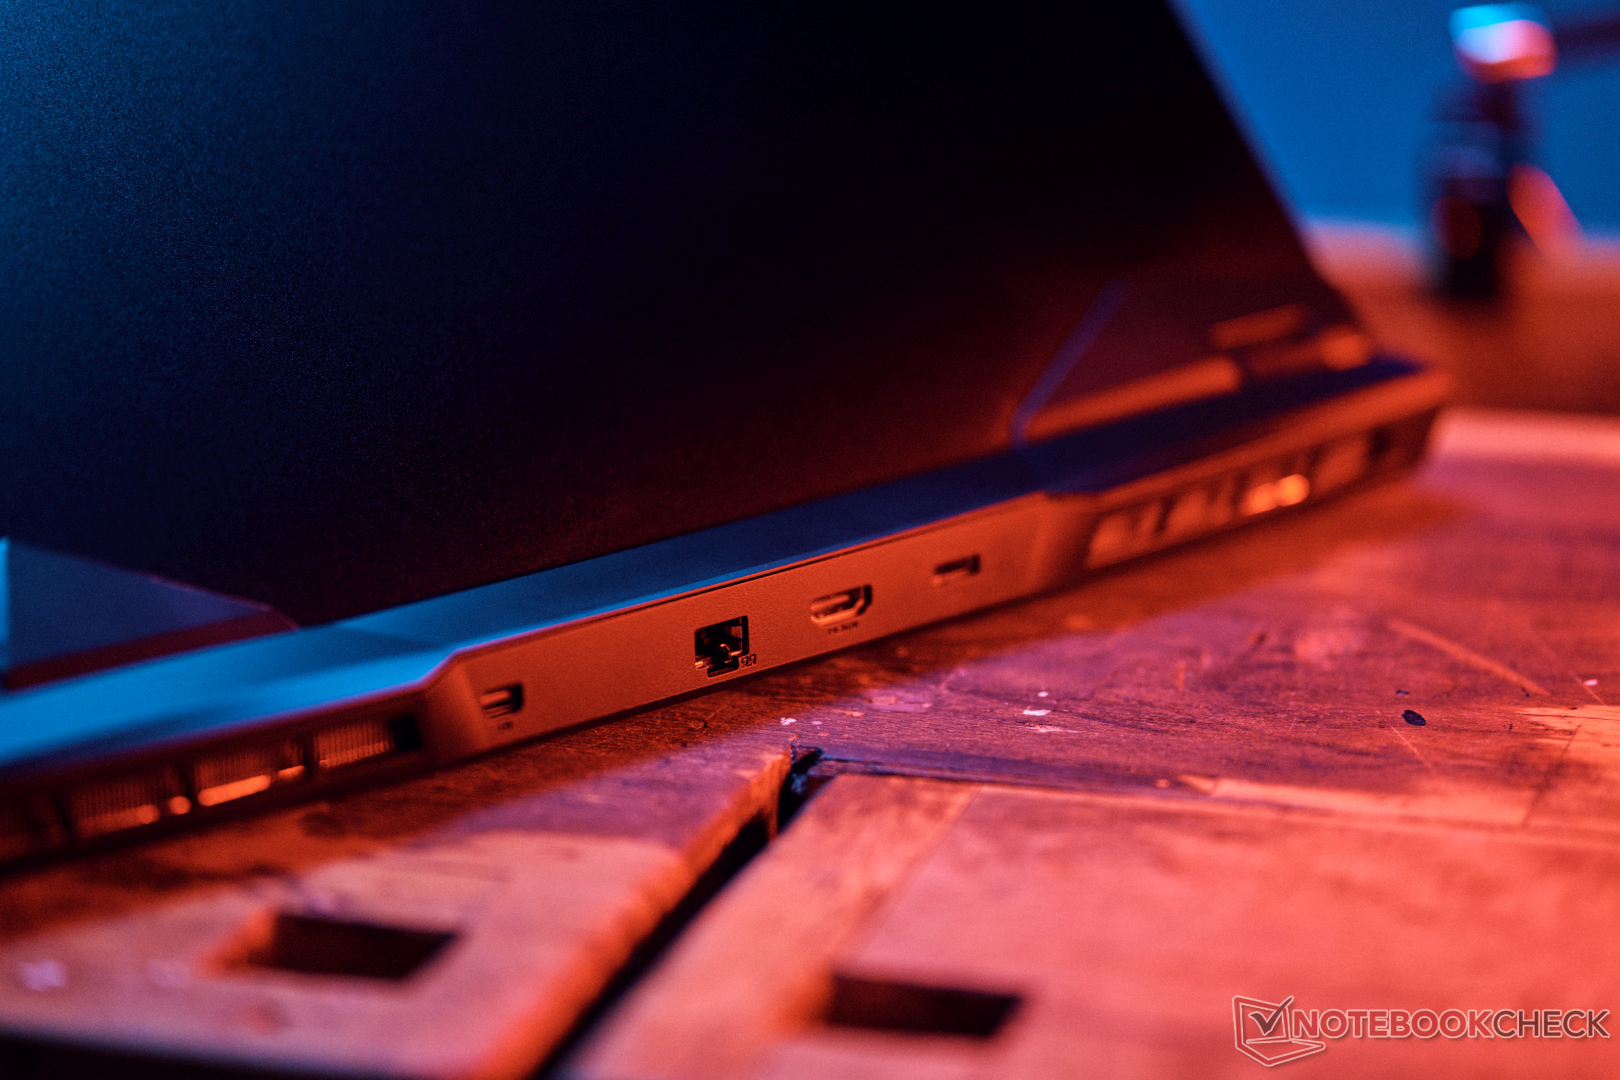
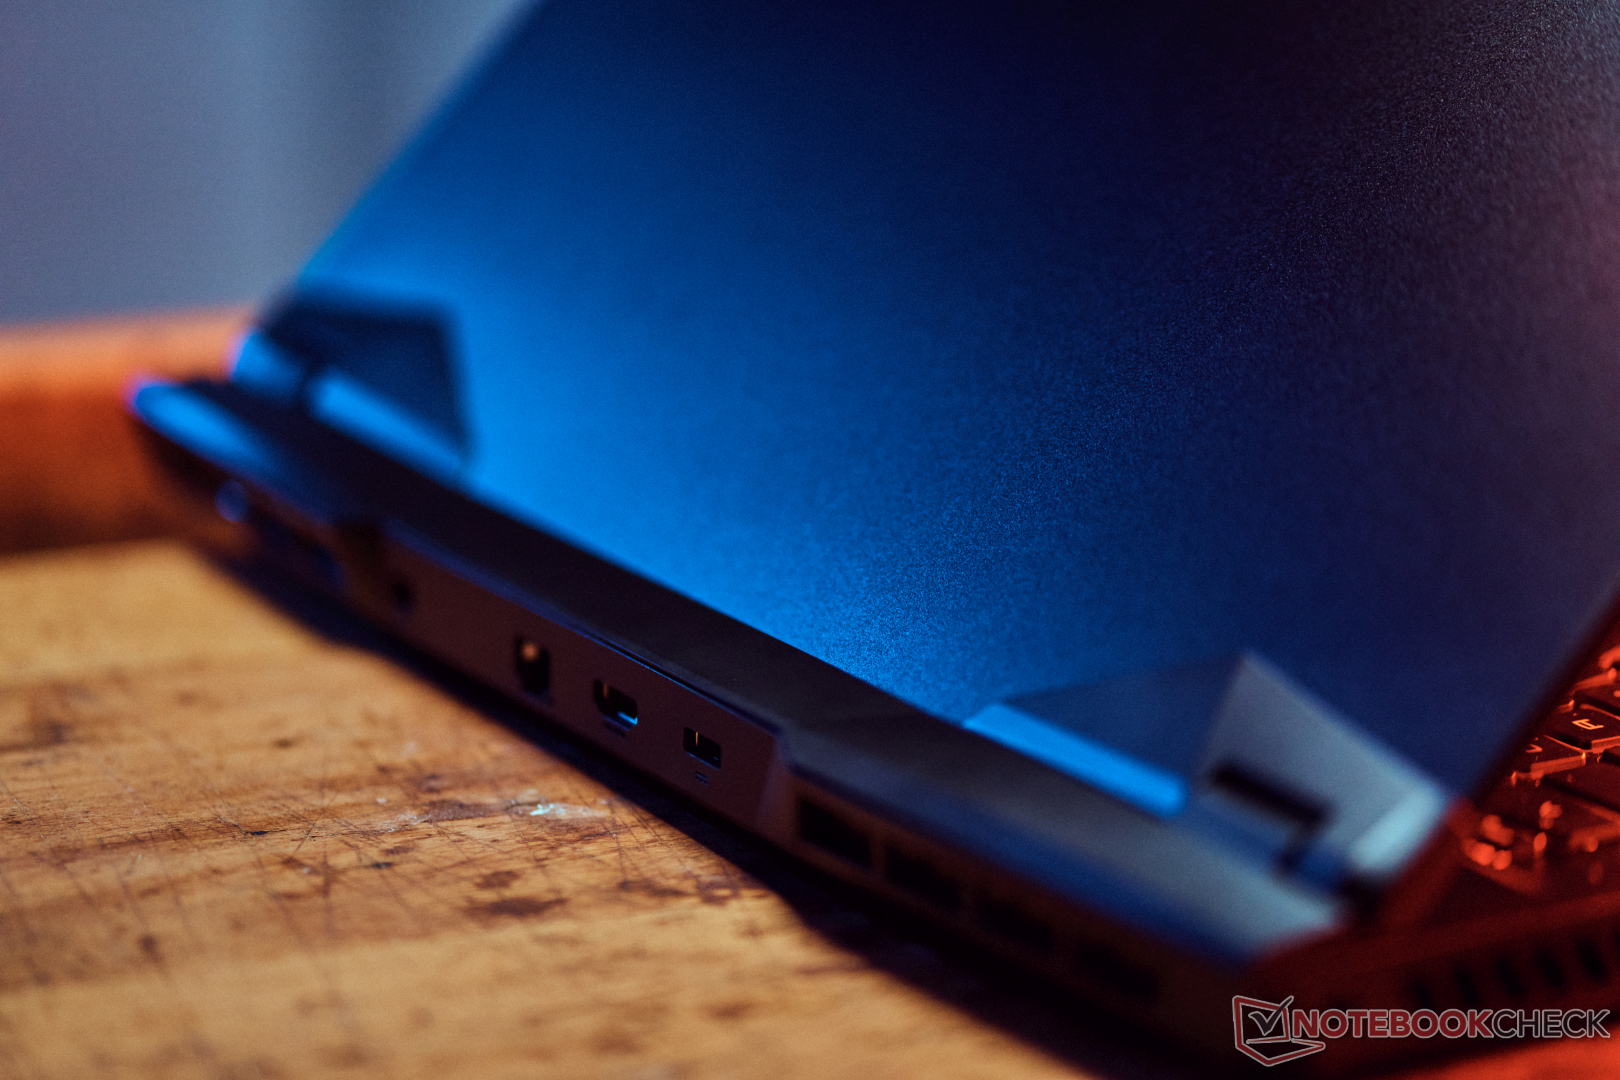
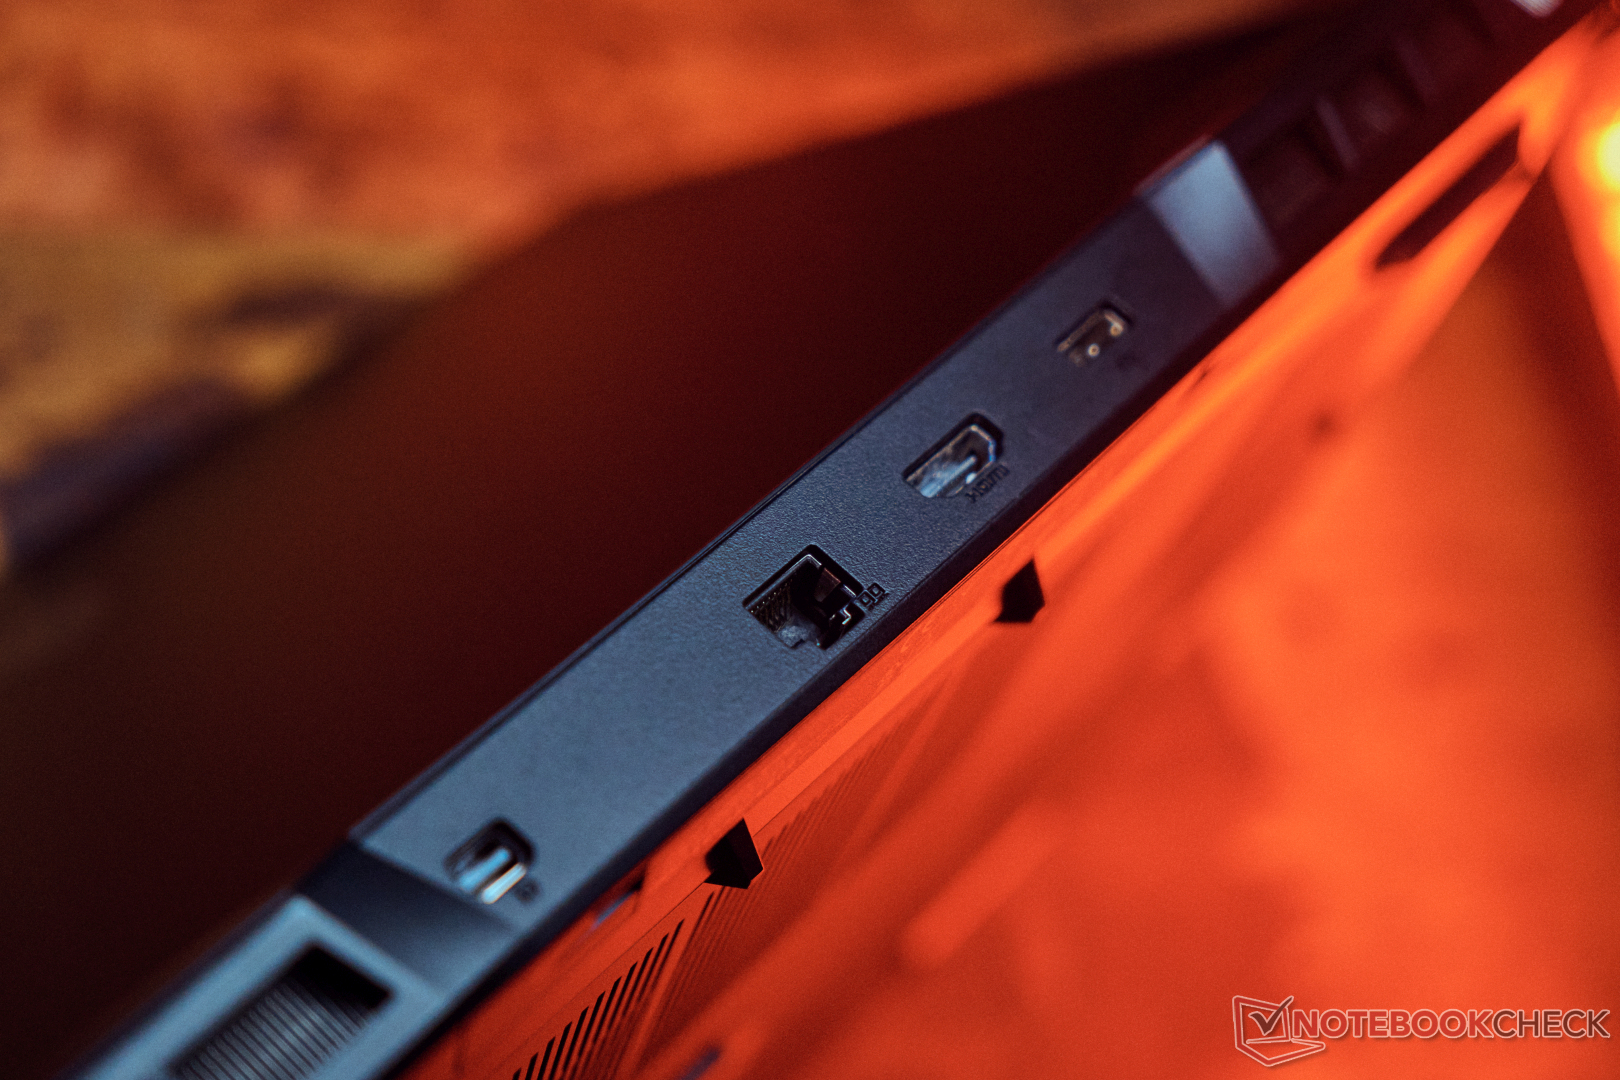
Hardware: Nessuna ricarica tramite USB-C
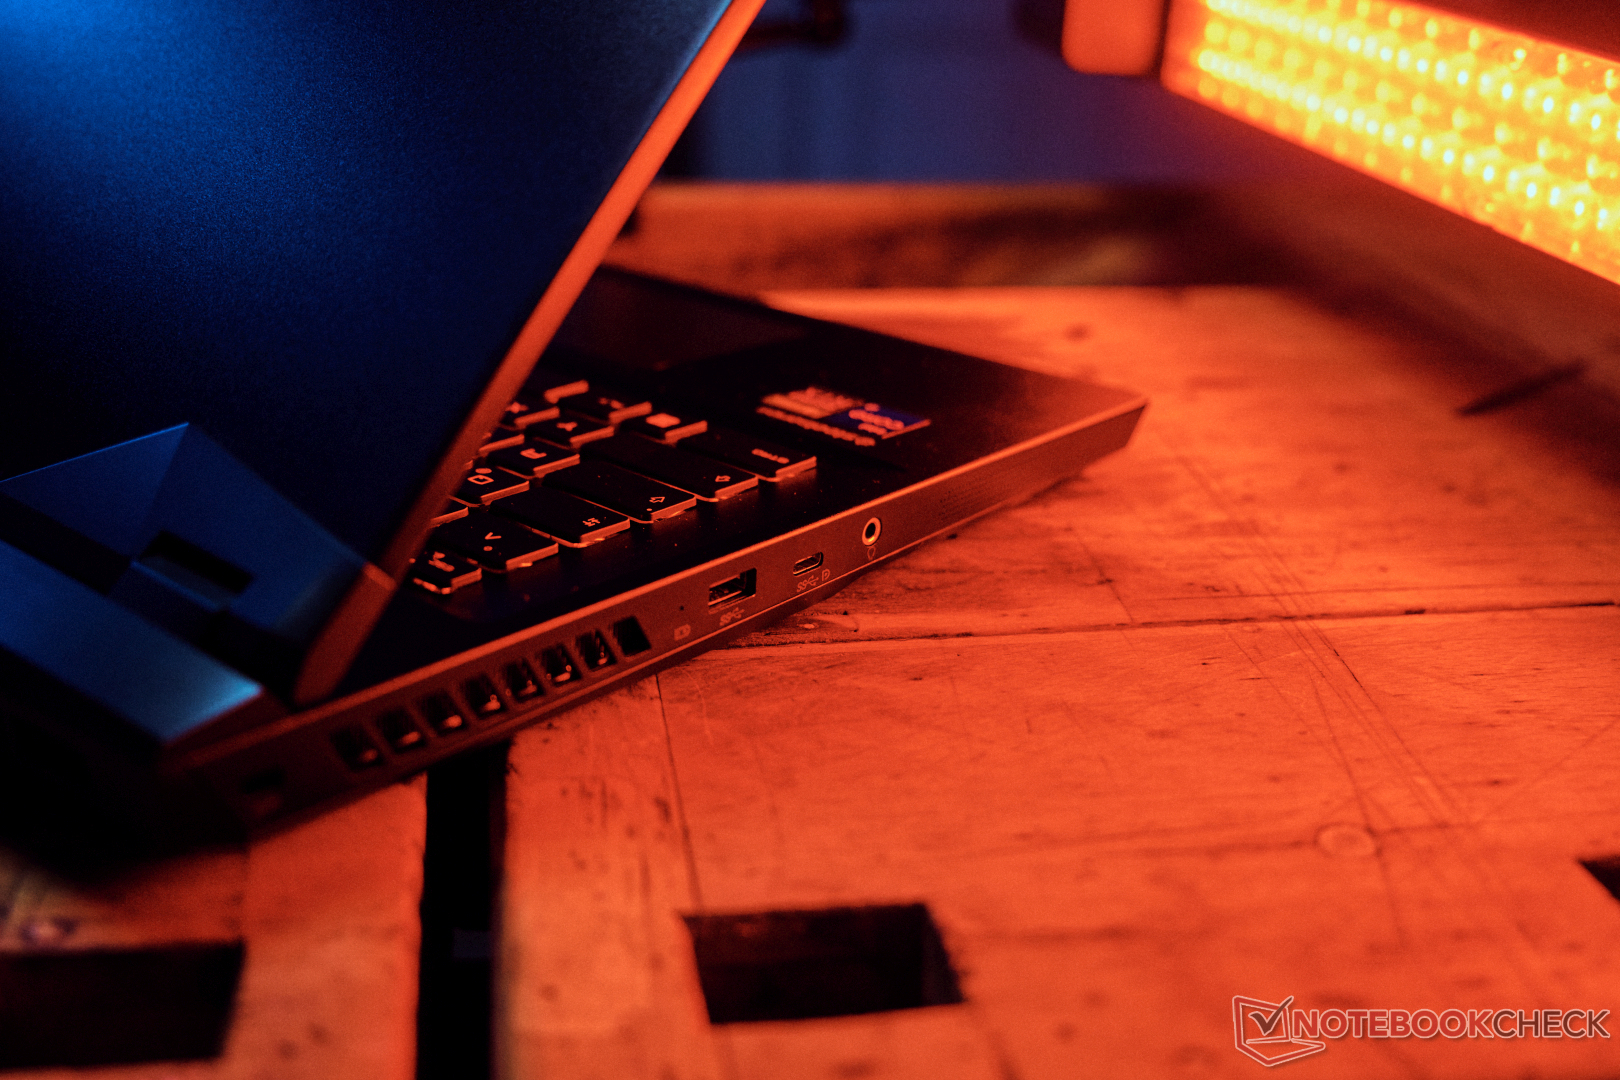
Fortunatamente, alcune delle porte sono posizionate sul retro del dispositivo, in modo che i cavi corrispondenti non siano visibili. Sono presenti una mini DisplayPort con Adaptive Sync, un'uscita HDMI (4K @120Hz), una LAN a 2,5-GBit e il connettore di alimentazione proprietario.
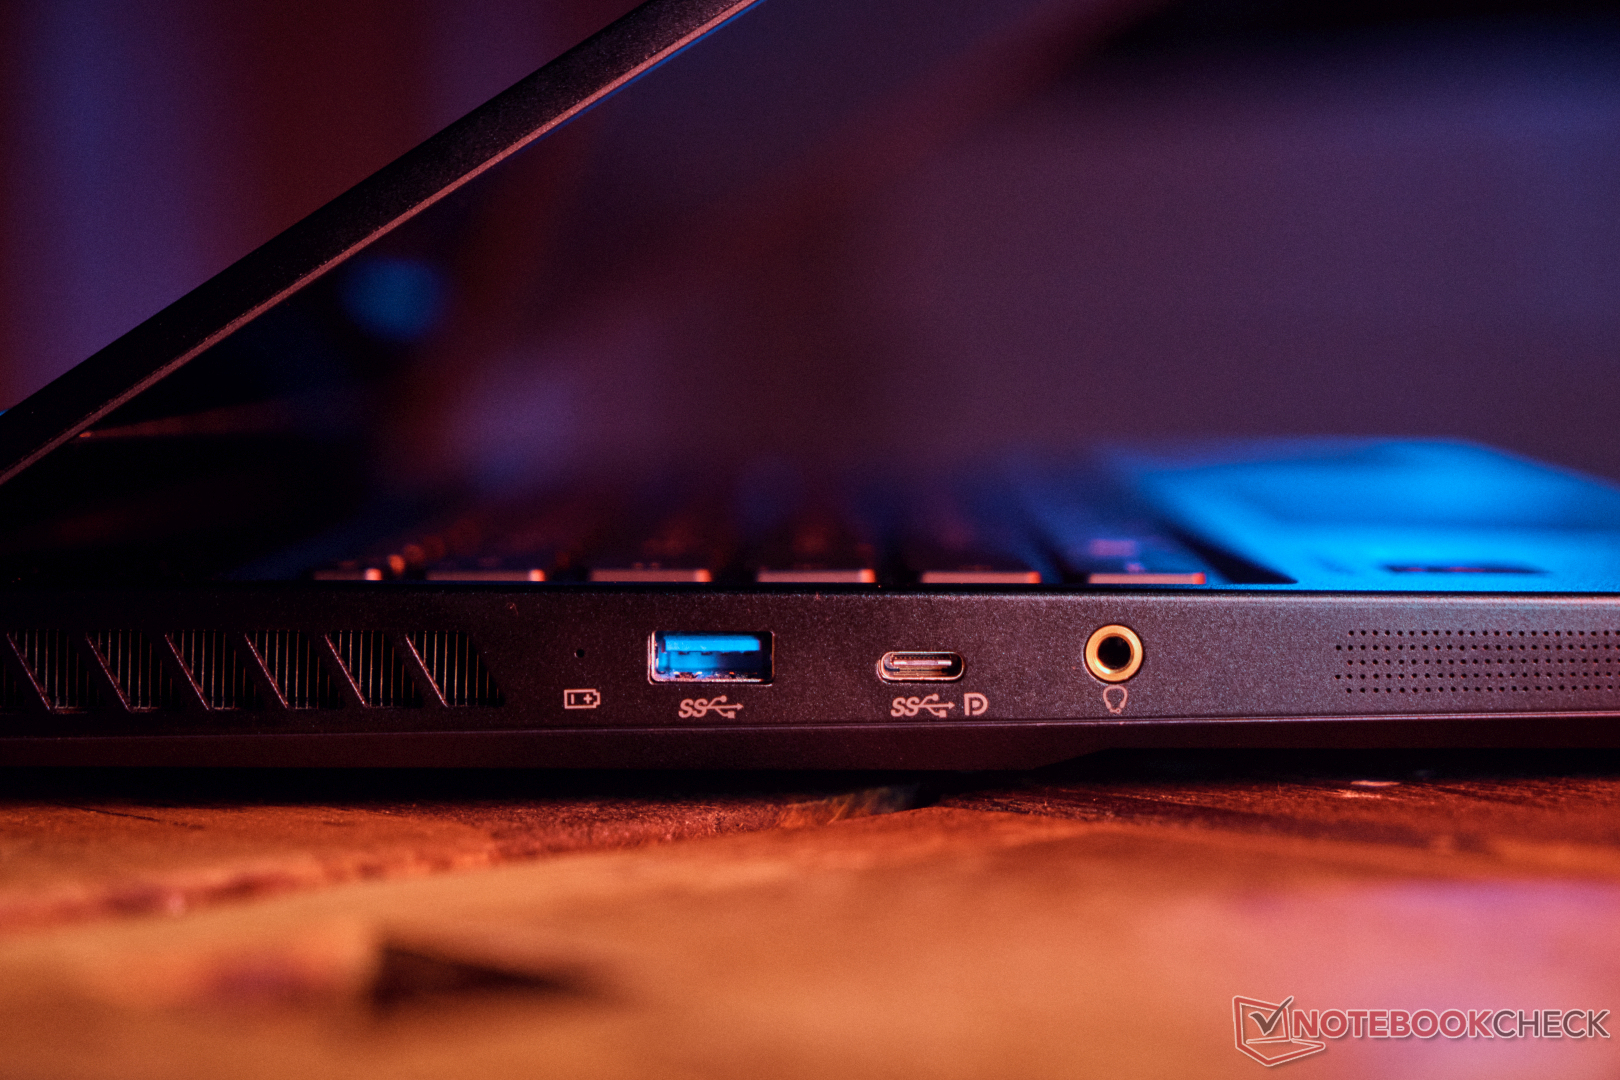
Sul lato sinistro sono presenti un lucchetto Kensington, 1x USB-A 3.2 Gen1 (5 GBit/s), 1x USB-C 3.2 Gen2 (10 GBit/s) con funzionalità DisplayPort. Mancano tuttavia Power Delivery e Thunderbolt. Non è quindi possibile garantire il gioco mobile in assenza di un alimentatore da 800 grammi. Non è nemmeno possibile utilizzare una scheda grafica esterna più potente.
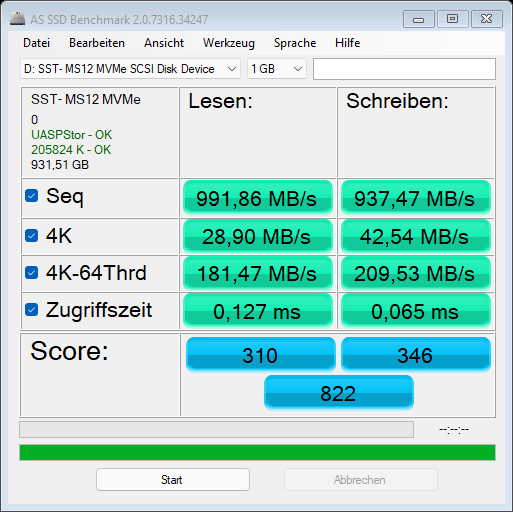
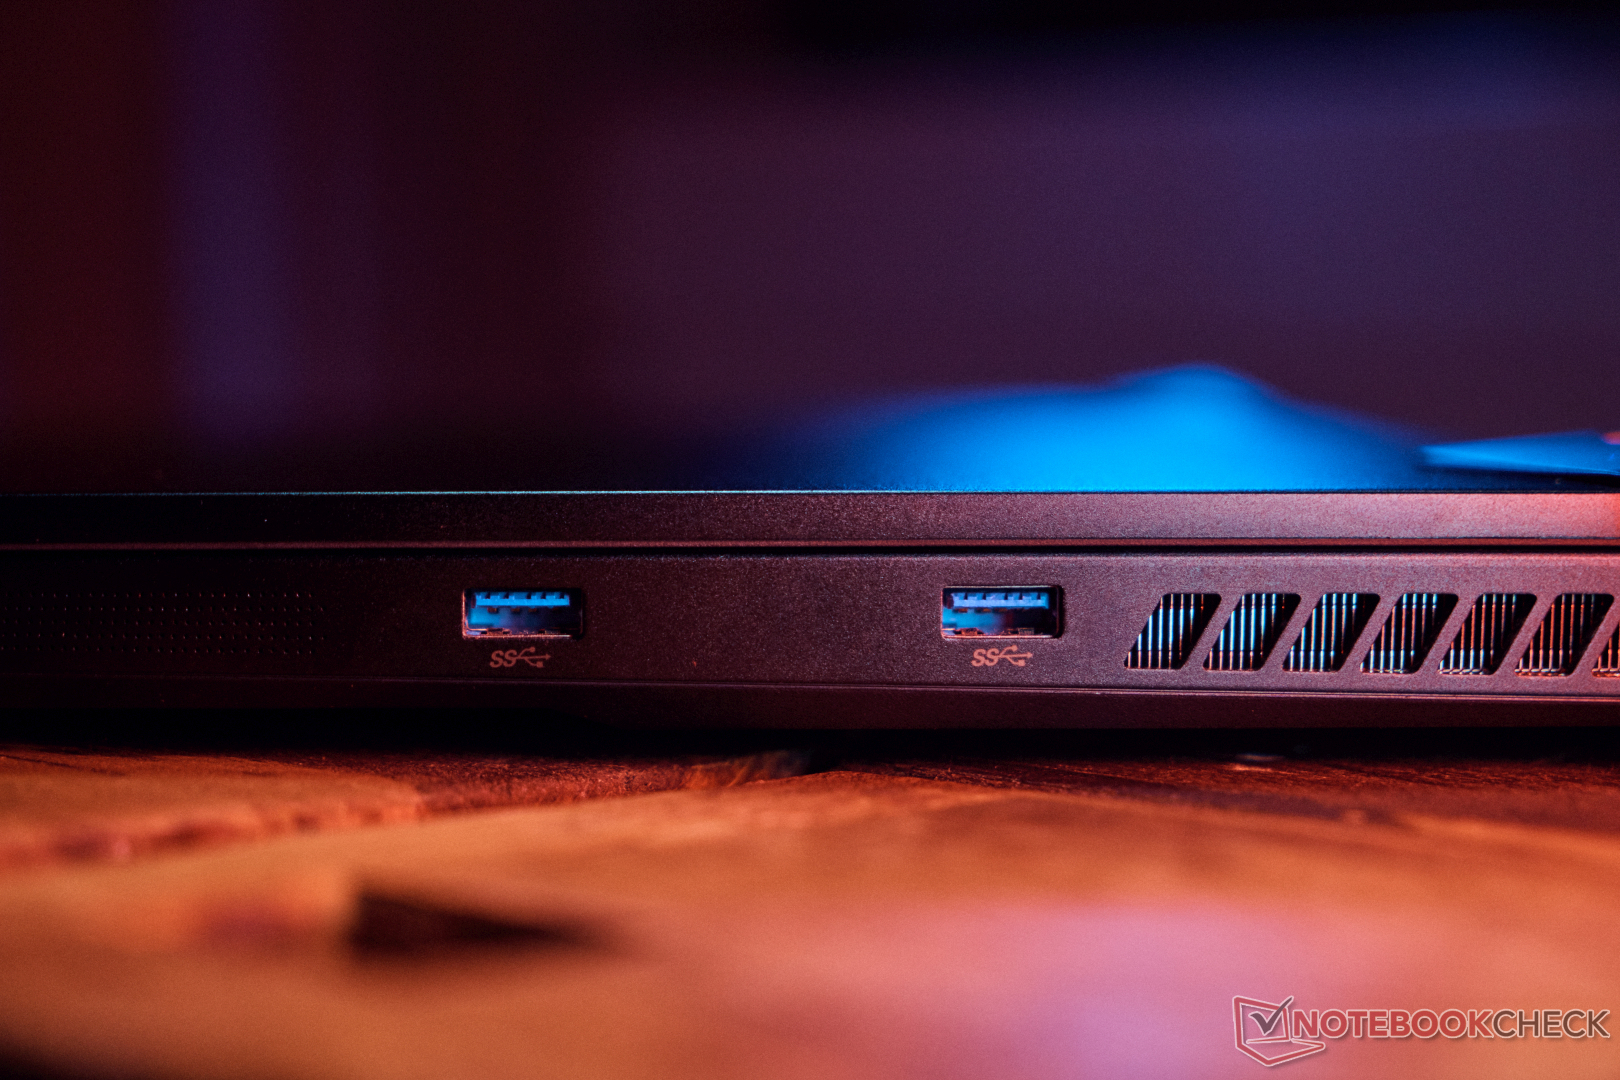
Per il resto, sono presenti una connessione jack e altre due porte USB A 3.2 Gen1 sul lato destro del notebook. Non c'è un lettore di schede SD o un lettore di impronte digitali. Con un disco rigido esterno, abbiamo raggiunto una velocità di trasferimento di circa 1 GB/s sulla porta più veloce (USB-C a 10GBIt/s), il che rappresenta un limite massimo per la porta. L'unità SSD esterna (USB 3.2 Gen 2x2) raggiunge il doppio della velocità di trasferimento su una porta Thunderbolt.
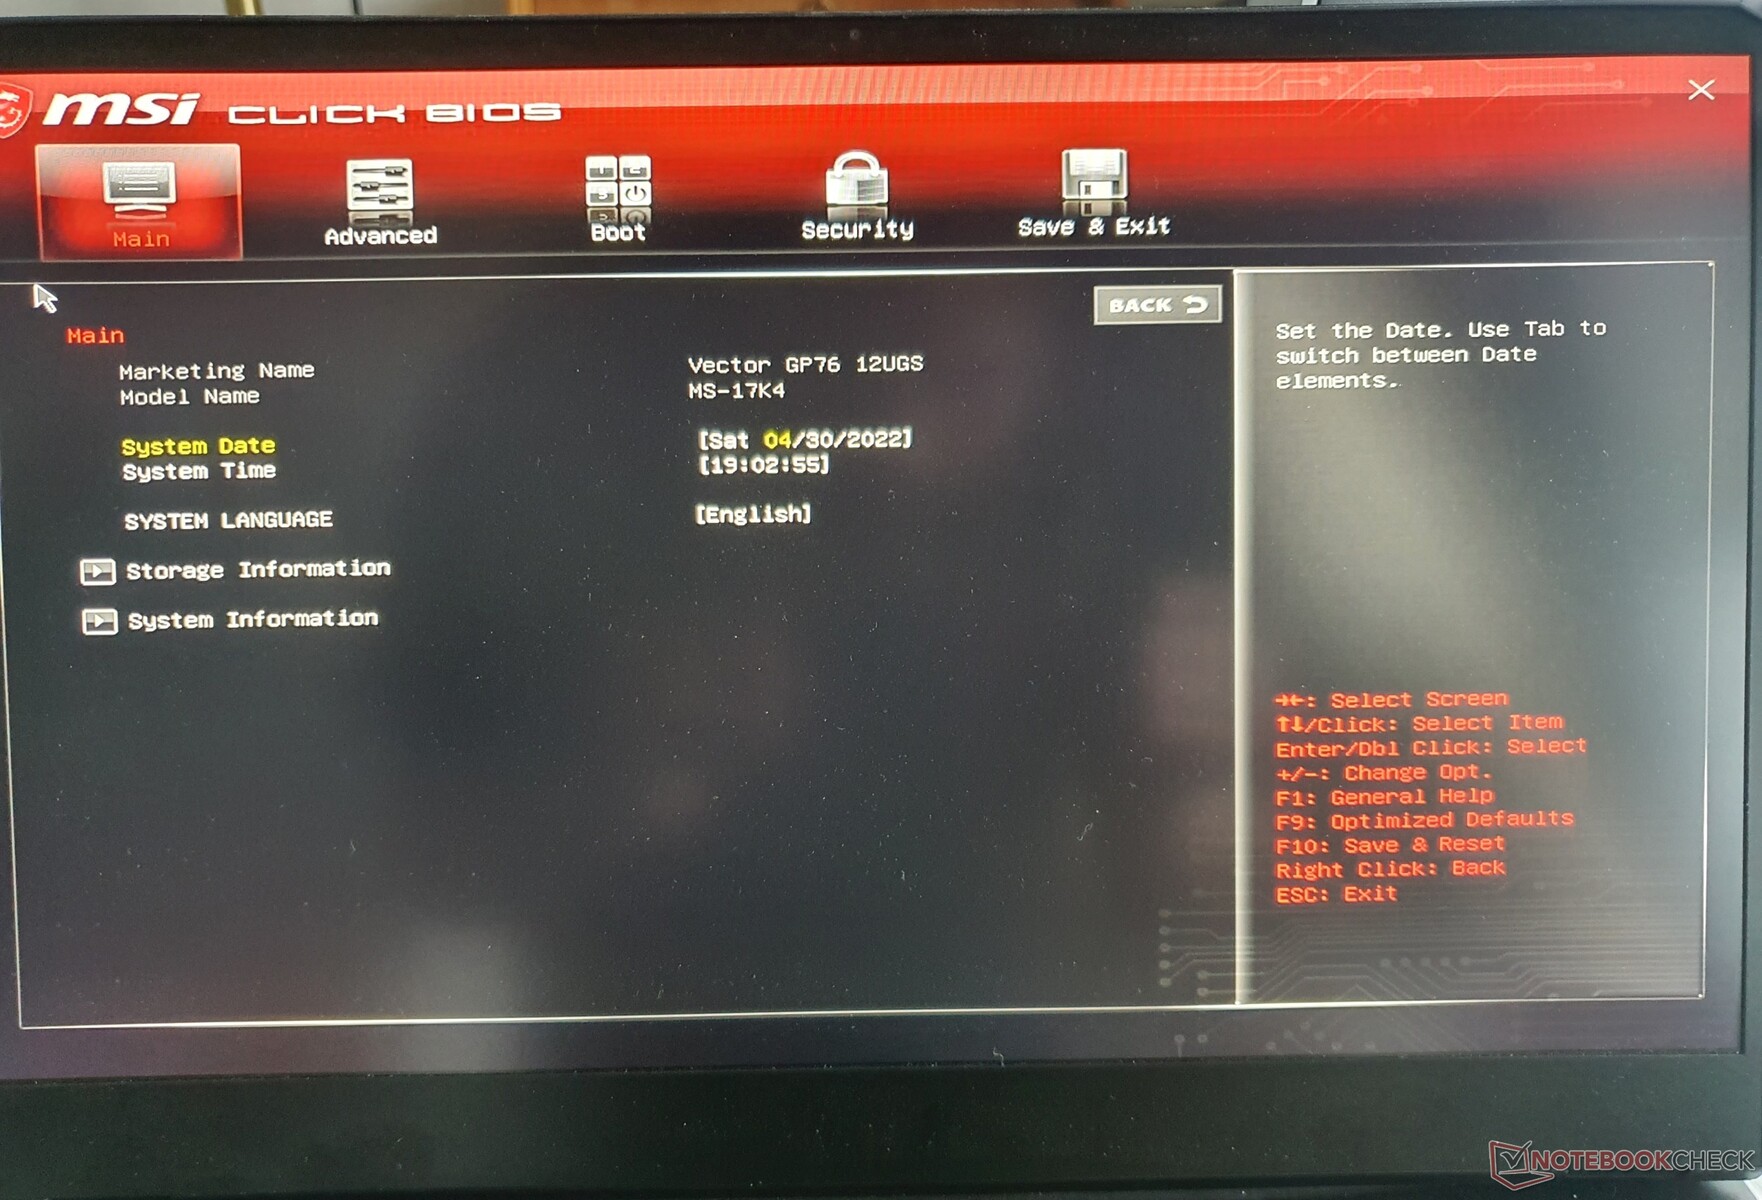
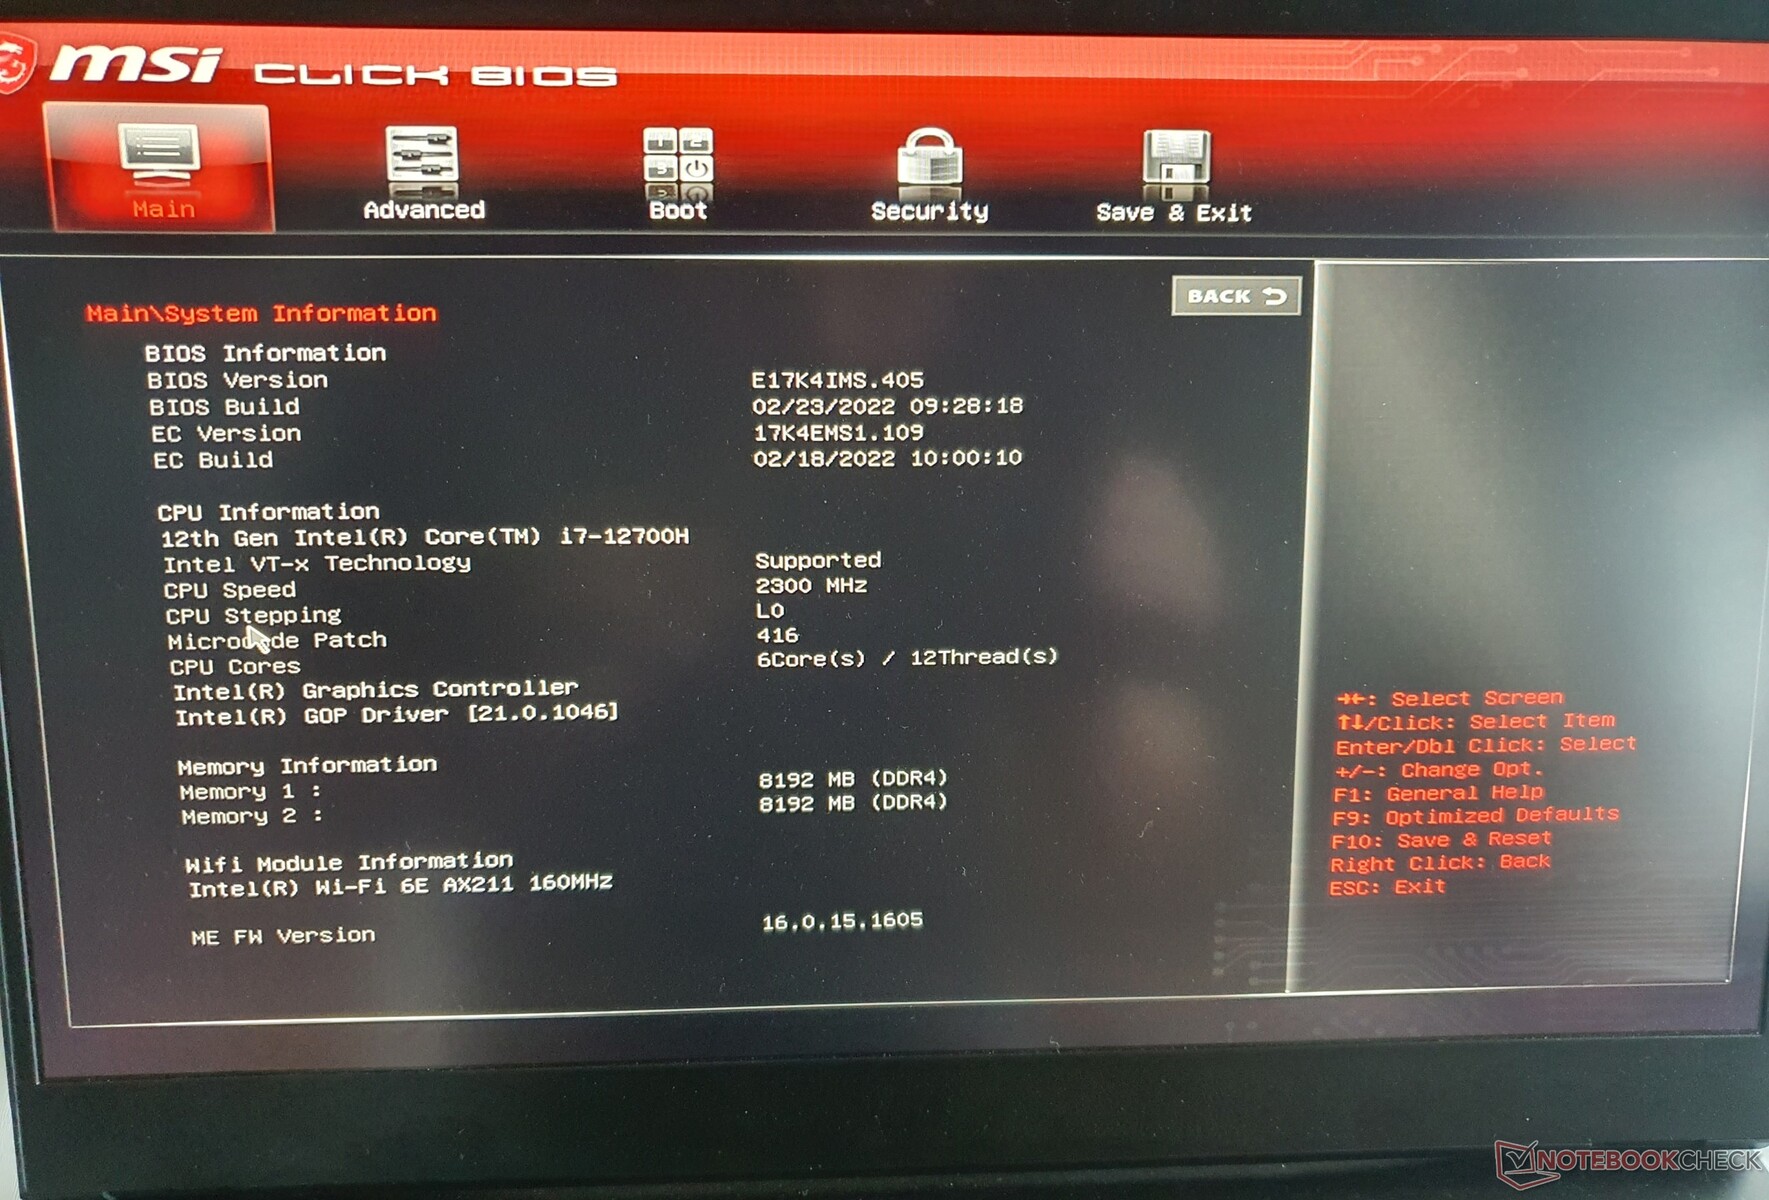
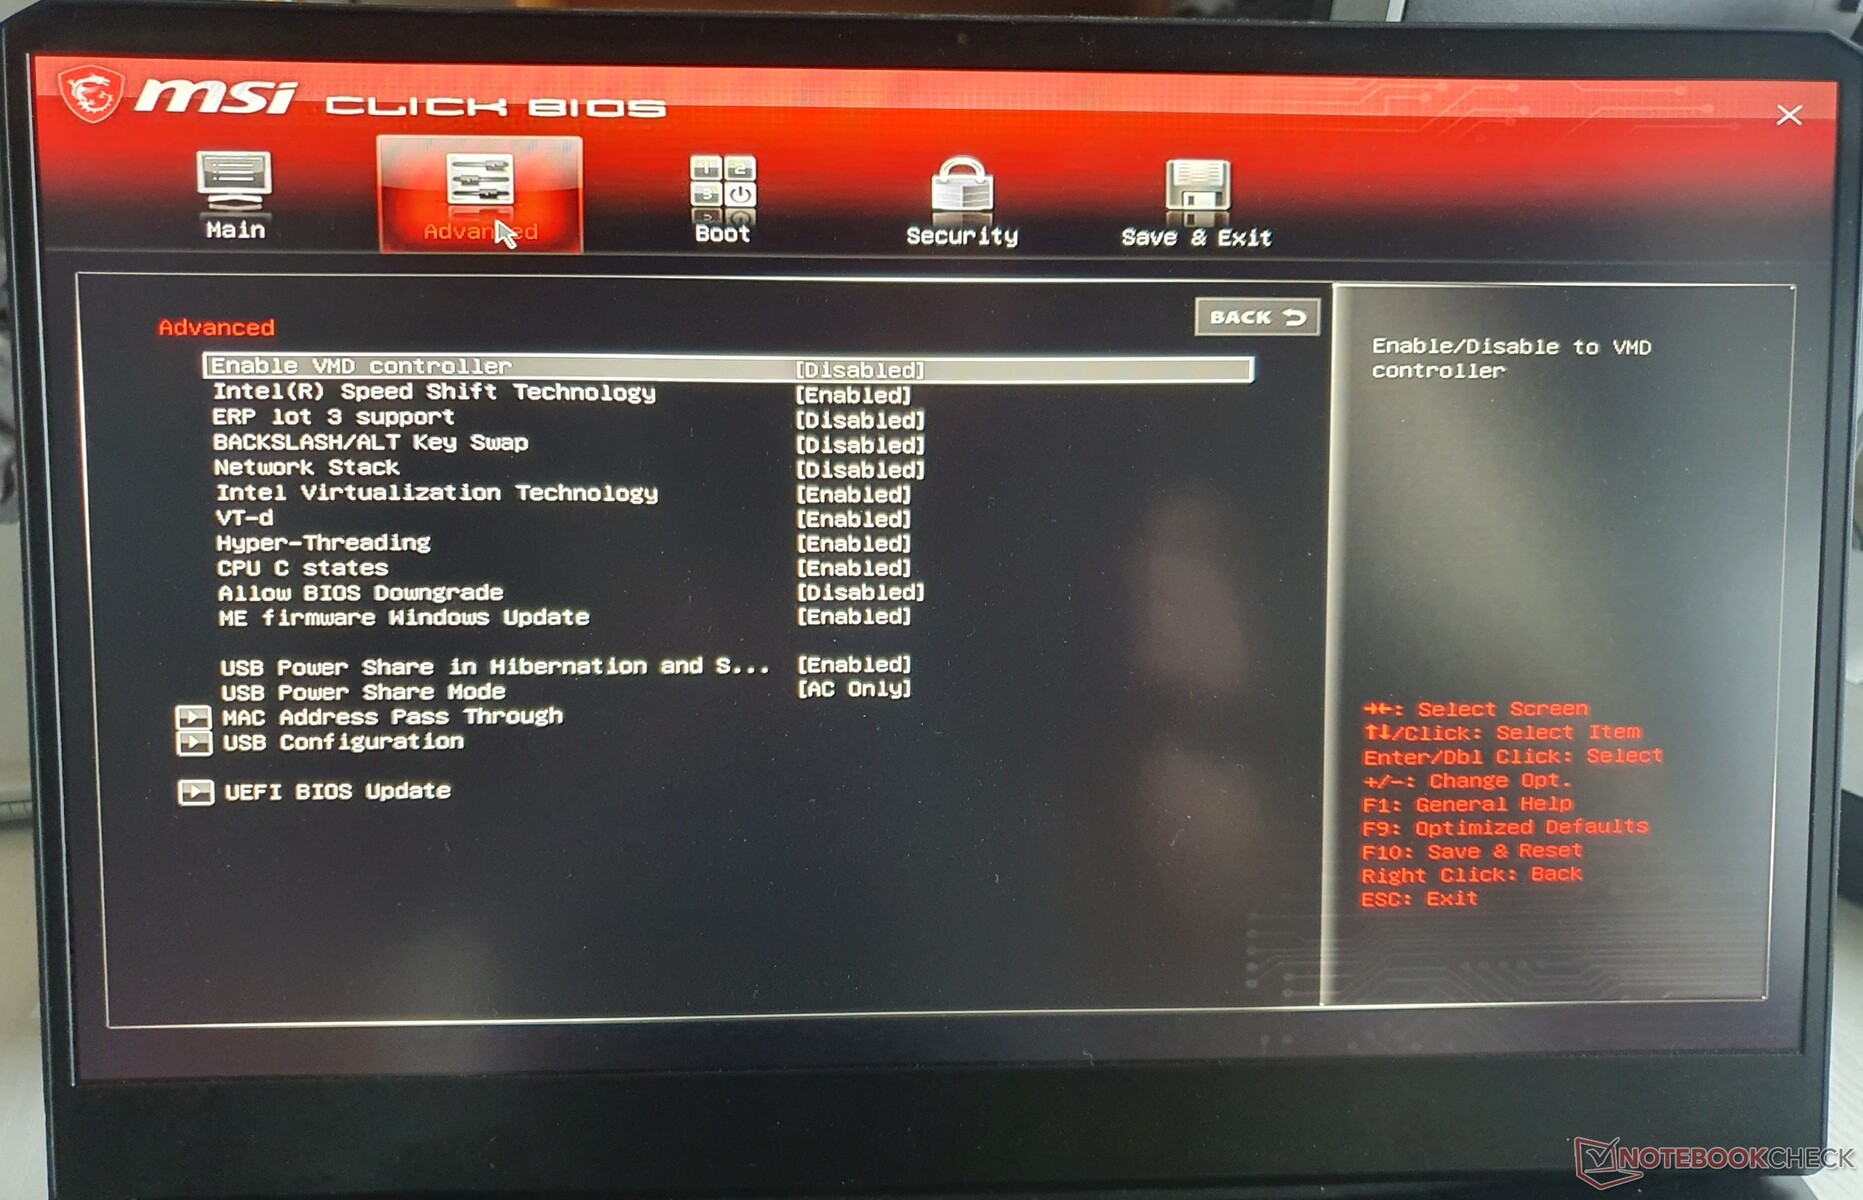
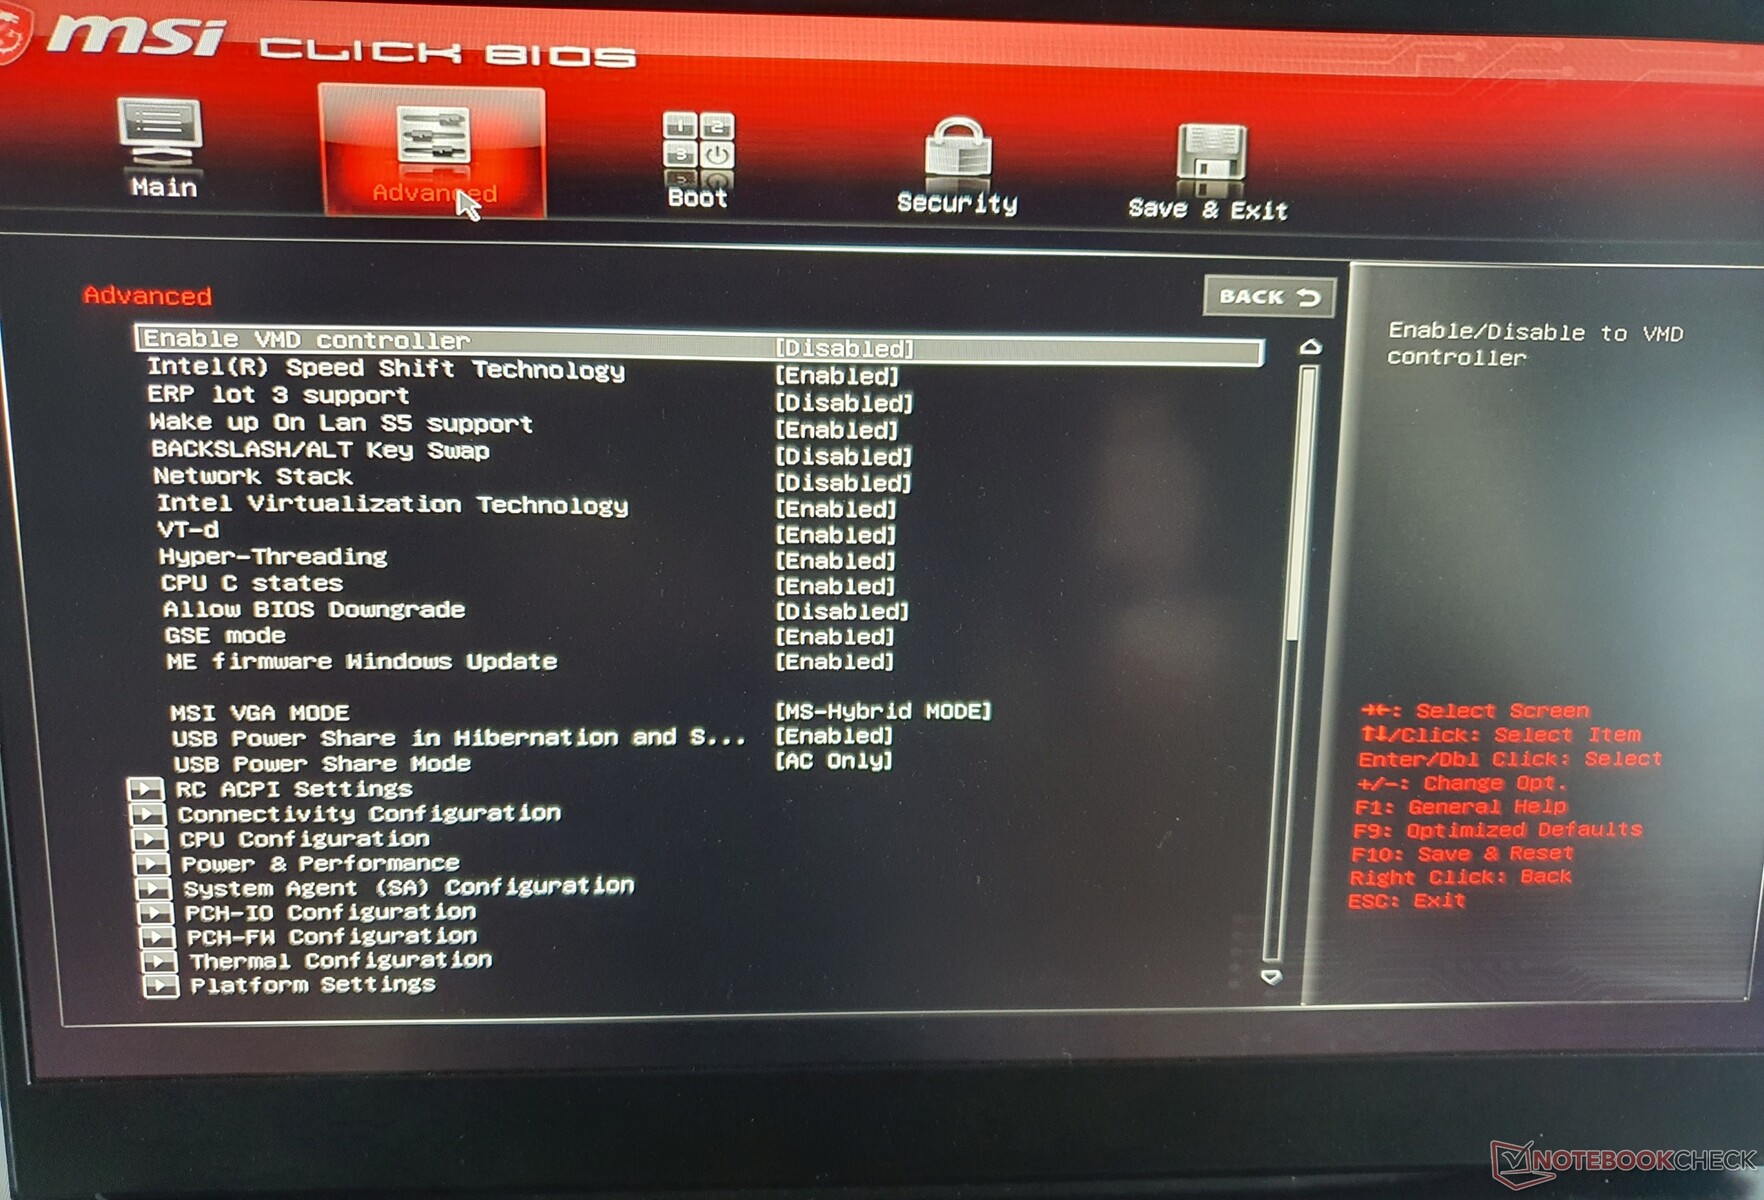
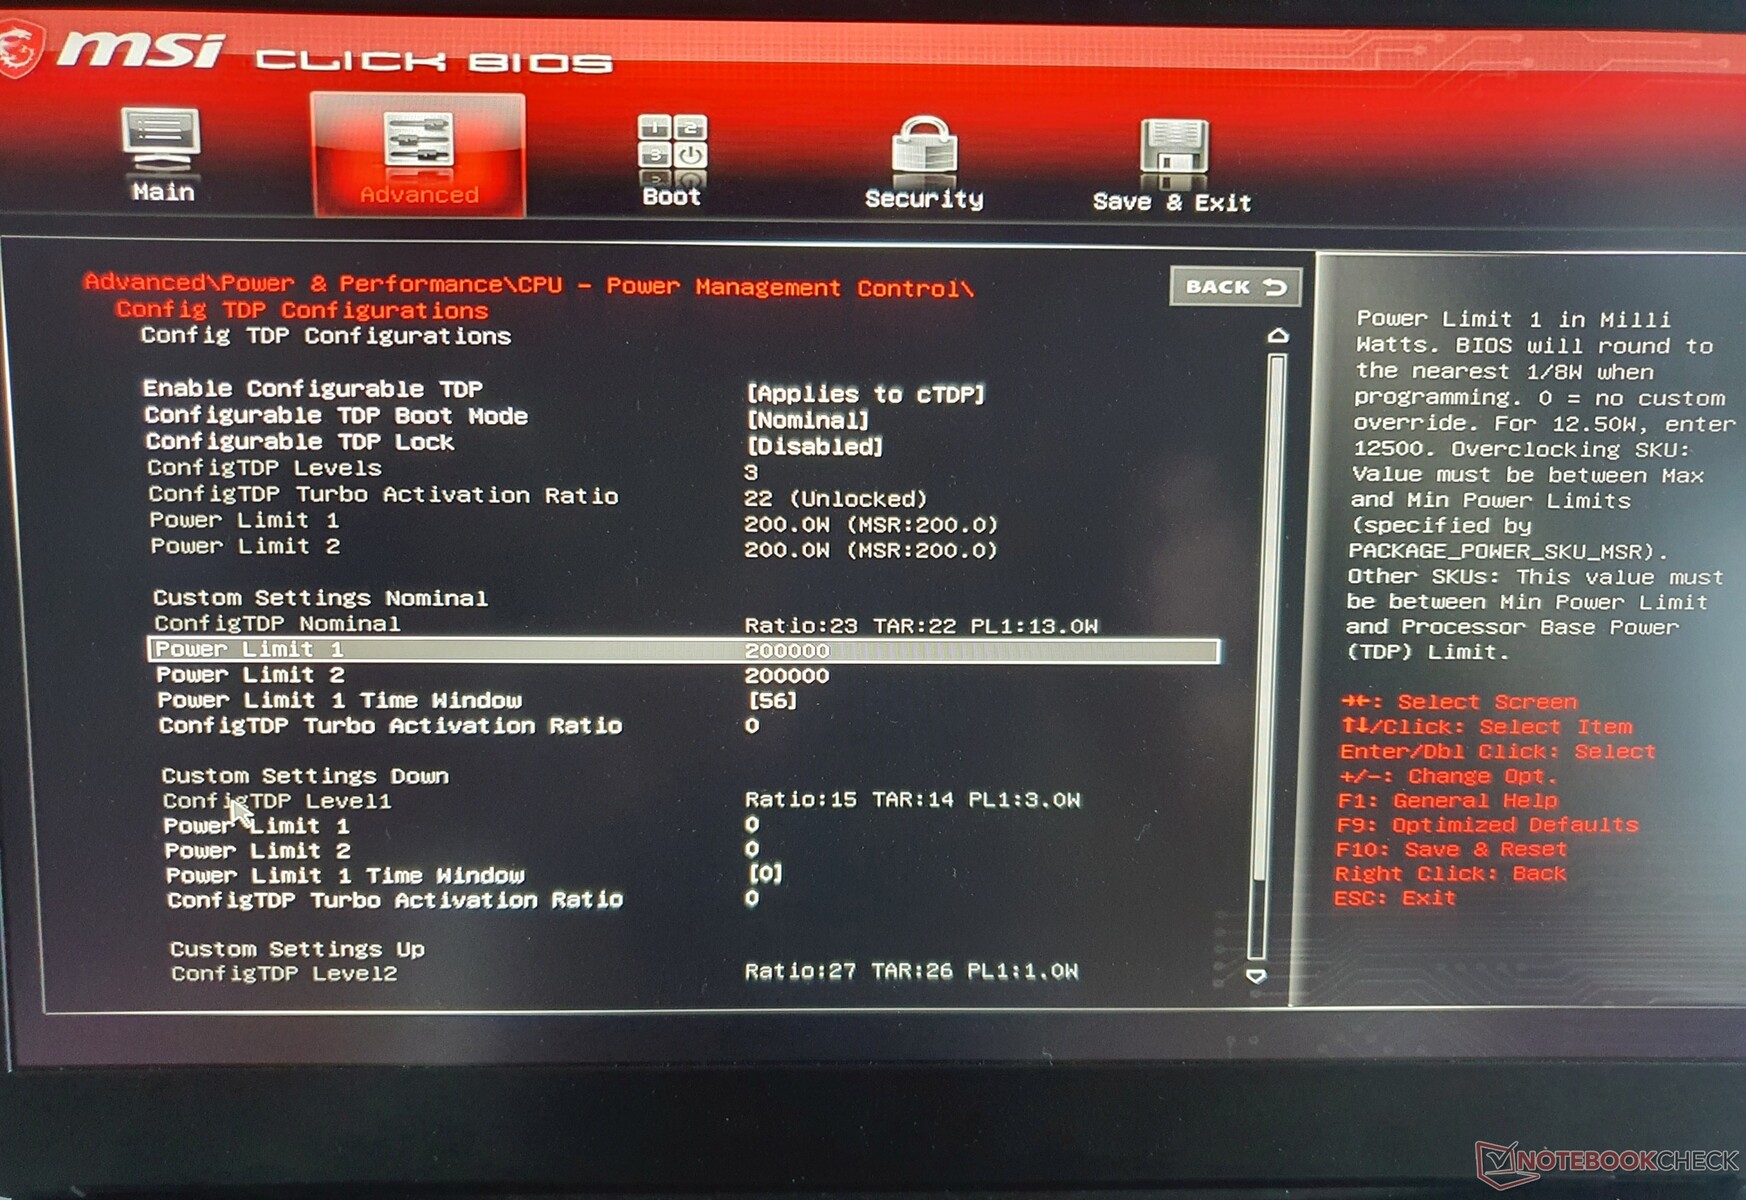
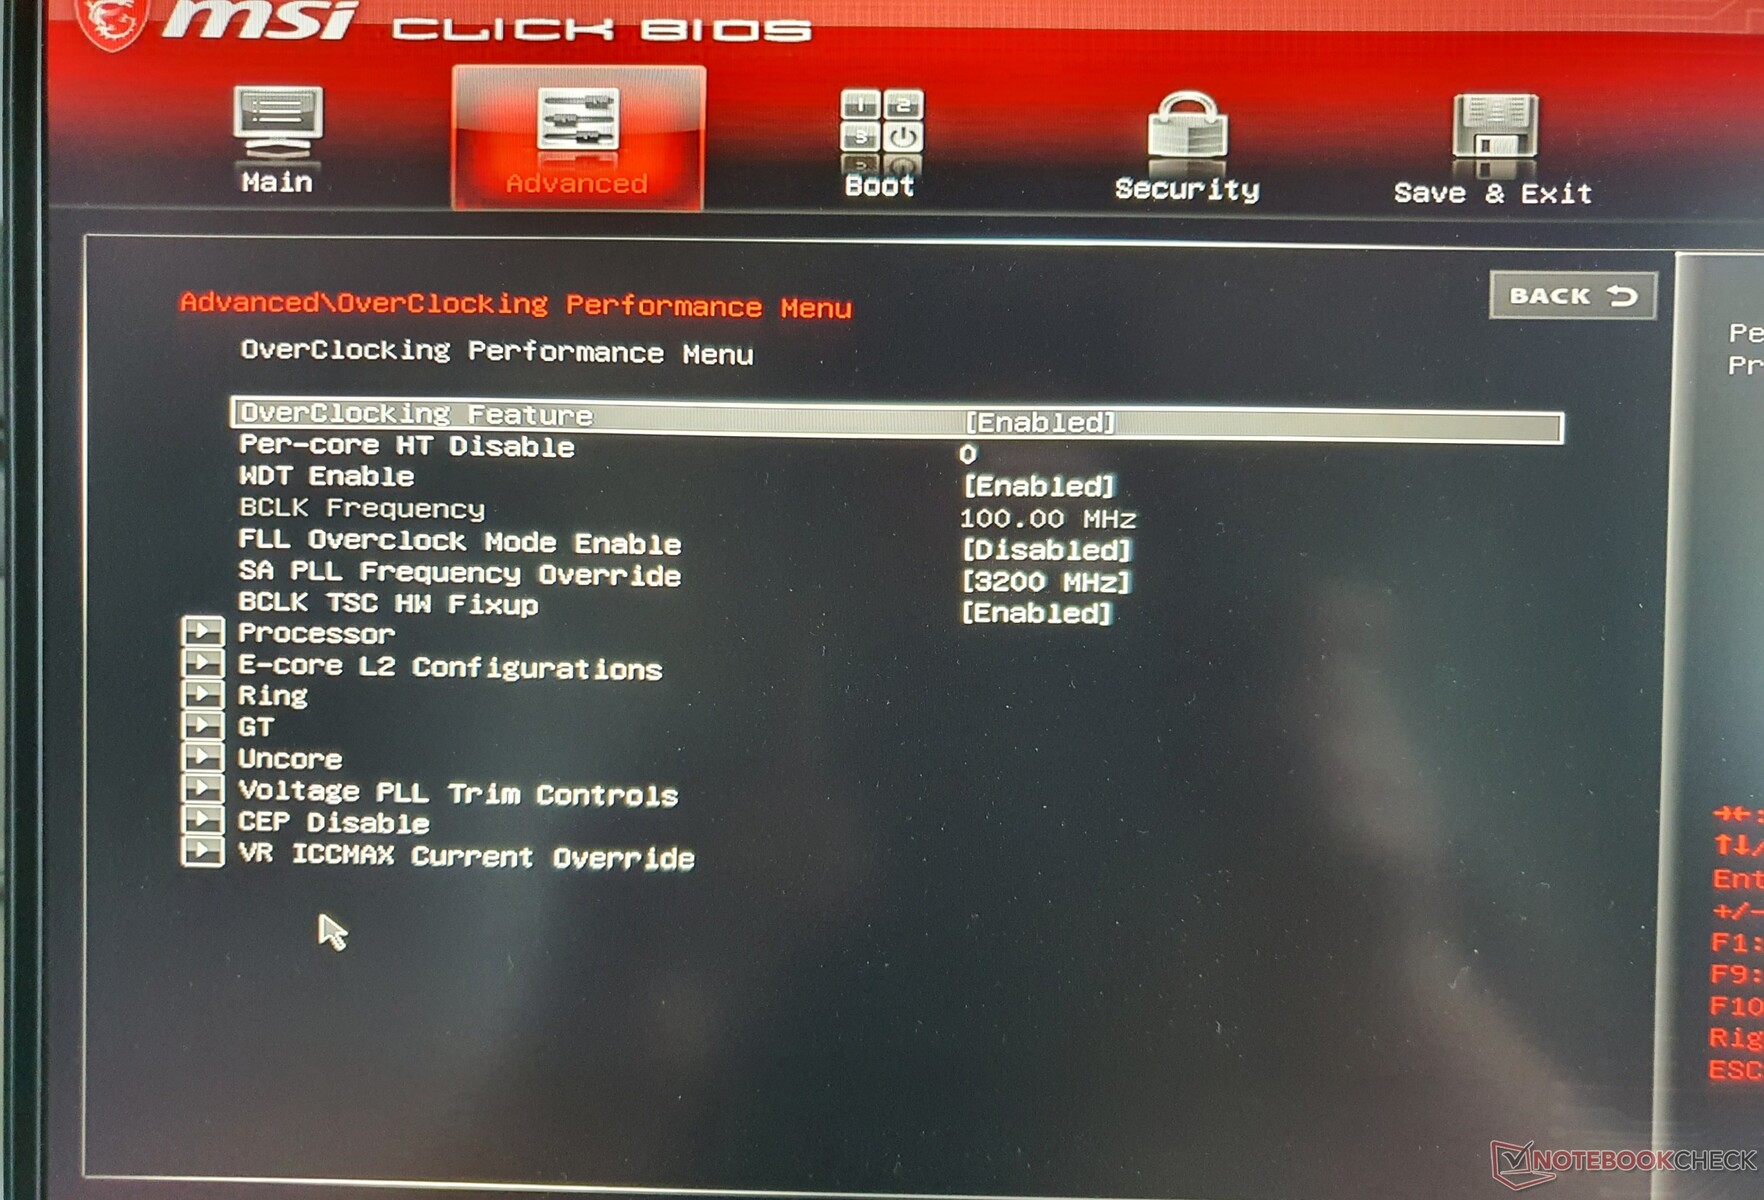
BIOS
Nei portatili da gioco MSI è possibile accedere al BIOS tramite la combinazione "F1 + DEL". A prima vista non c'è molto da vedere, ma la combinazione di tasti "Shift (destra) + CTRL (destra) + ALT + F2" sblocca tutte le possibili funzioni del BIOS, dai limiti delle prestazioni alle impostazioni termiche, fino alle possibilità di overclock (a proprio rischio e pericolo, ovviamente).
Comunicazione
Il modulo avvitato con capacità Wi-Fi 6 di Intel (AX211) sprigiona tutto il suo potenziale con una potenza di segnale di circa 1,6 GBit/s. I portatili della concorrenza con la stessa o simile scheda WLAN hanno livelli simili in media. I due portatili Asus sono molto indietro nel confronto.
Inoltre, il Vector GP76 dispone di Bluetooth 5.2, ma non di WWAN, che non può essere installato in un secondo momento.
Webcam

La webcam, che ha una risoluzione di 1280x720, offre una qualità inferiore alla media. i 1080p devono ancora arrivare sulla serie Vector, anche nel 2022. Mancano anche IR, Windows Hello e un otturatore meccanico.


Accessori
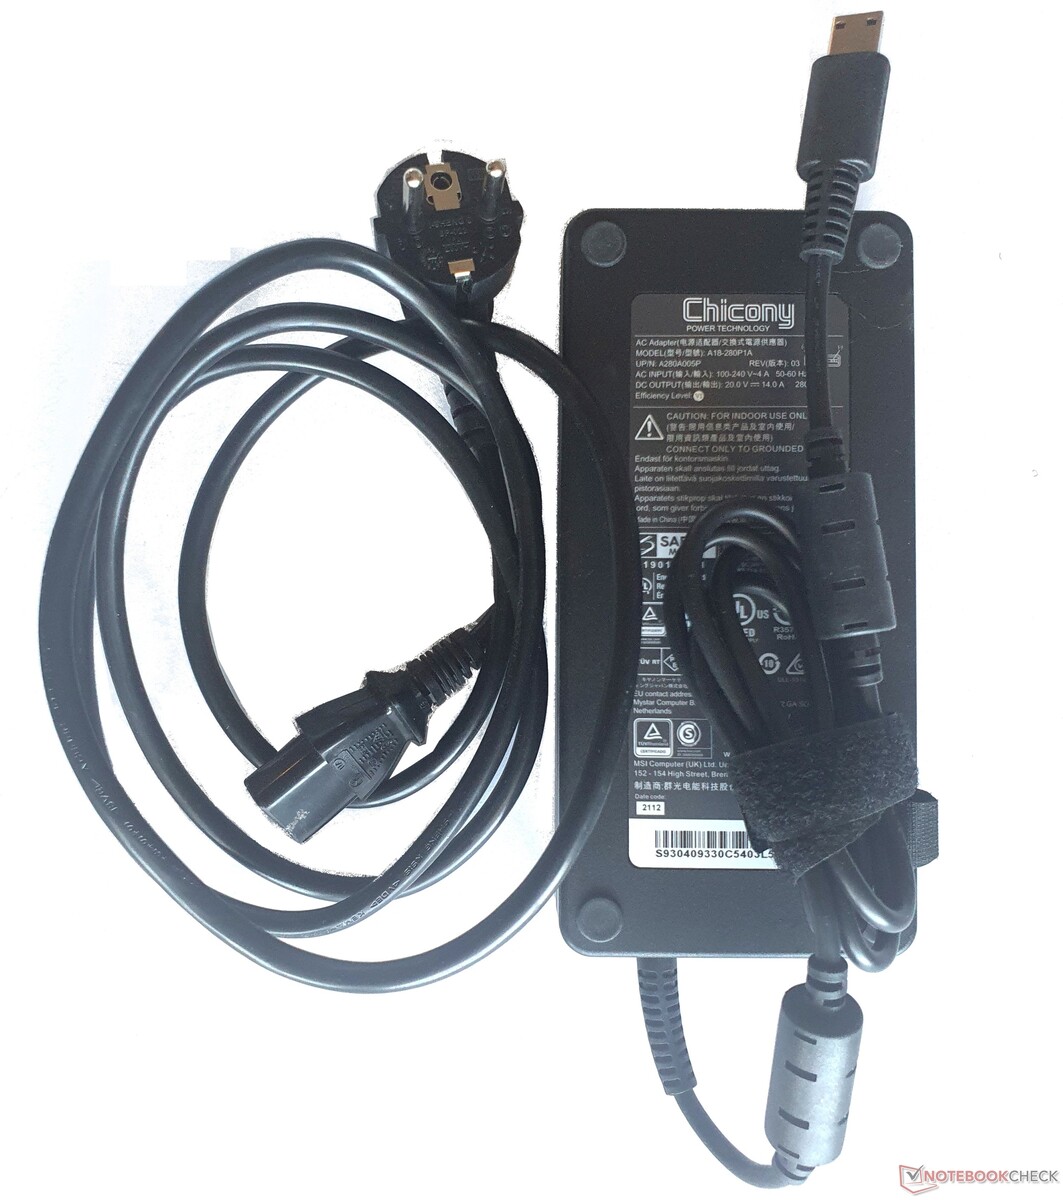
La fornitura comprende un alimentatore da 280 watt, che eroga 50 watt in più rispetto al suo predecessore. Non ci sono altri accessori e nella confezione non sono stati utilizzati (ancora) materiali riciclati.
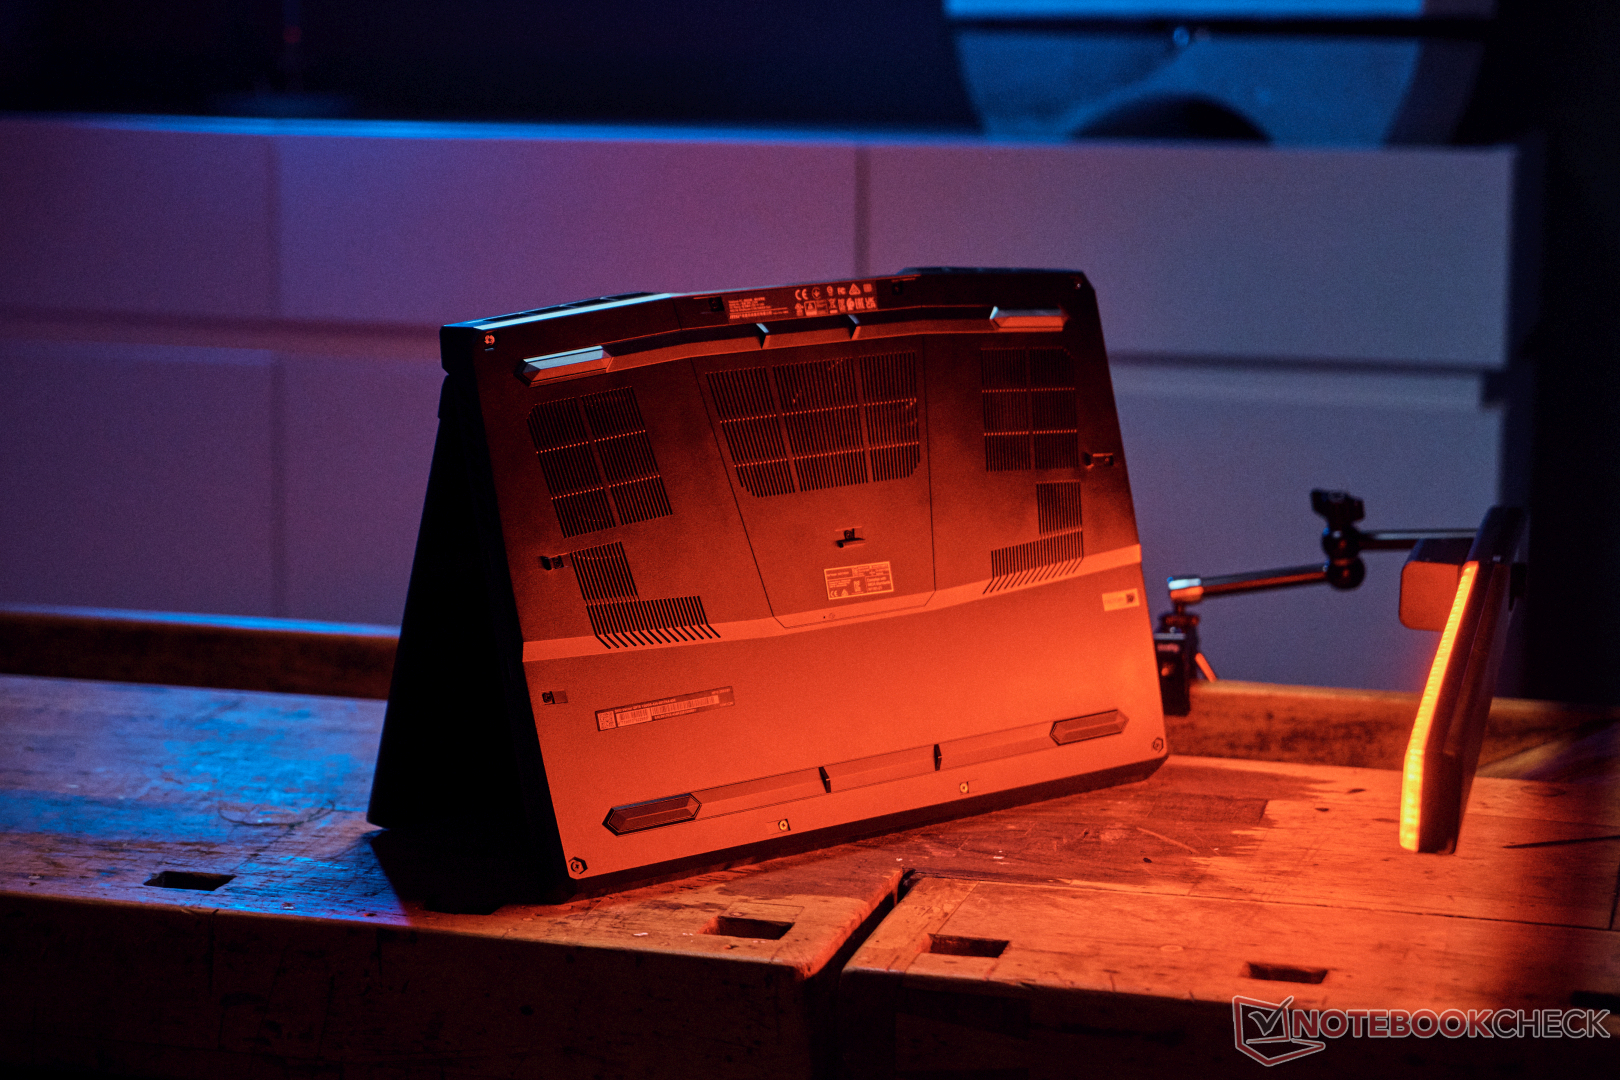
Manutenzione
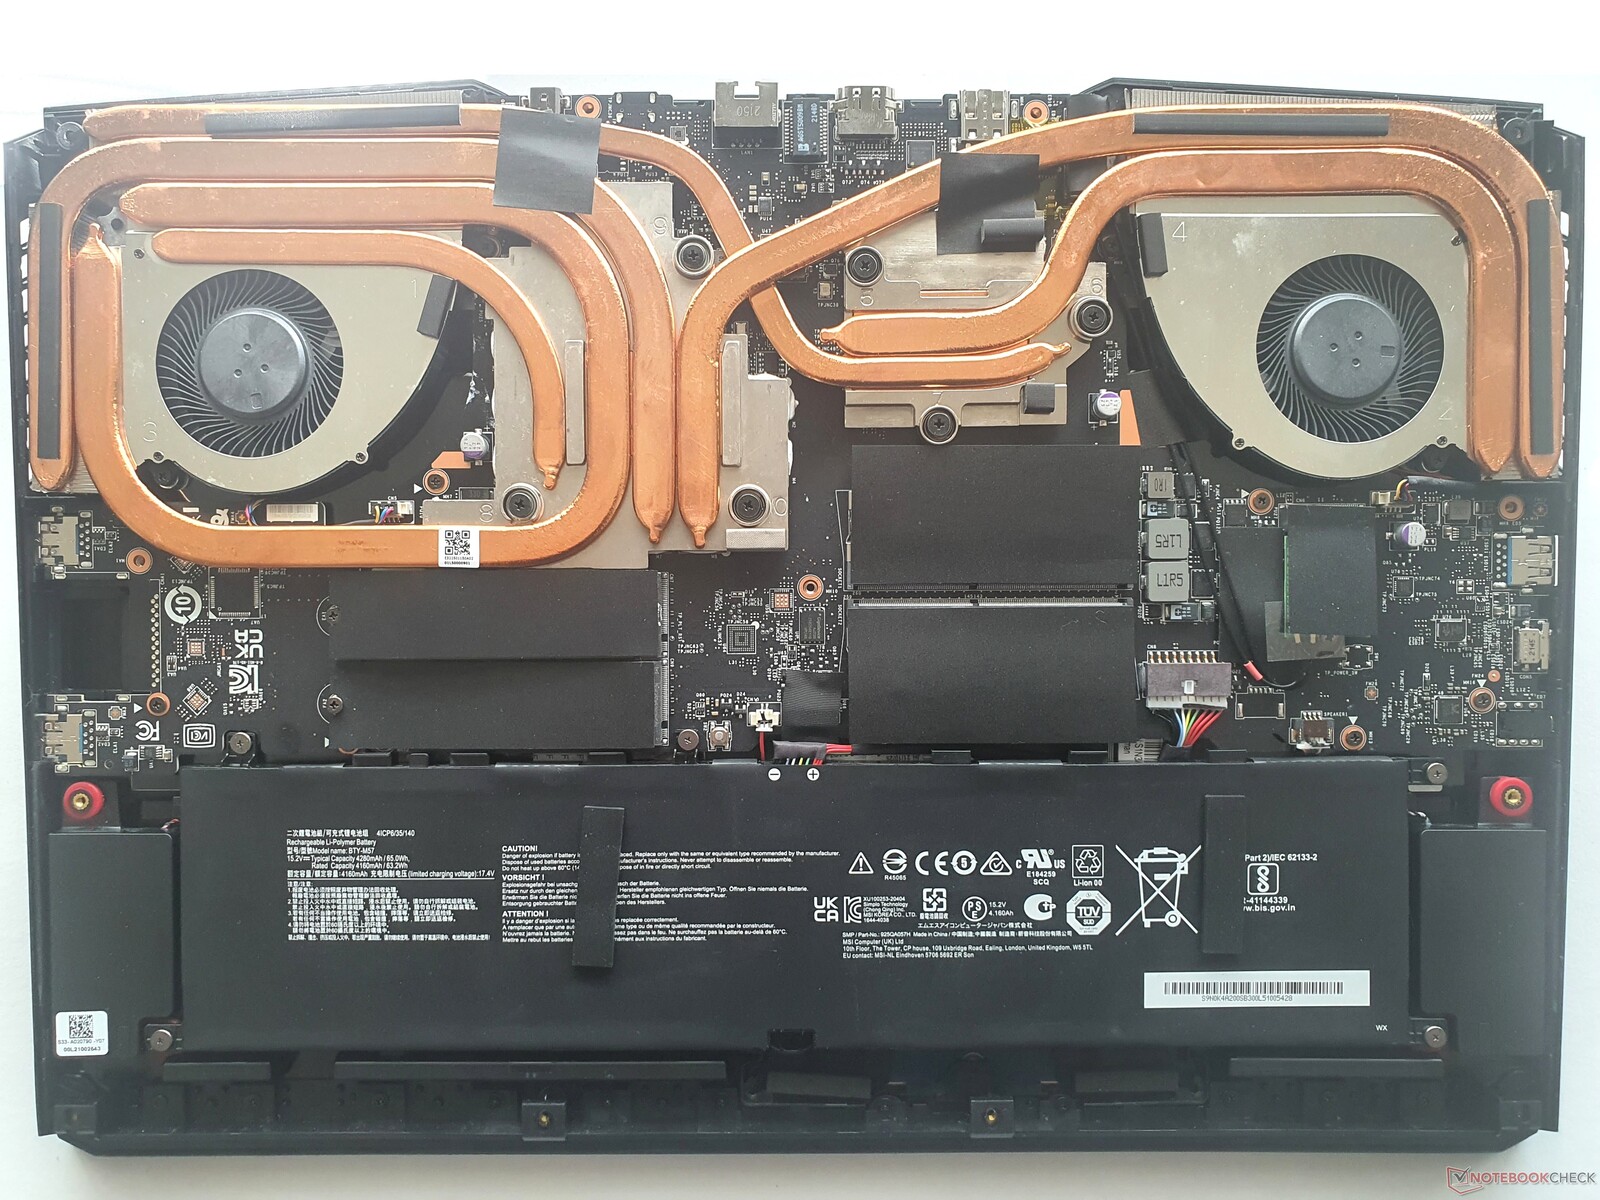
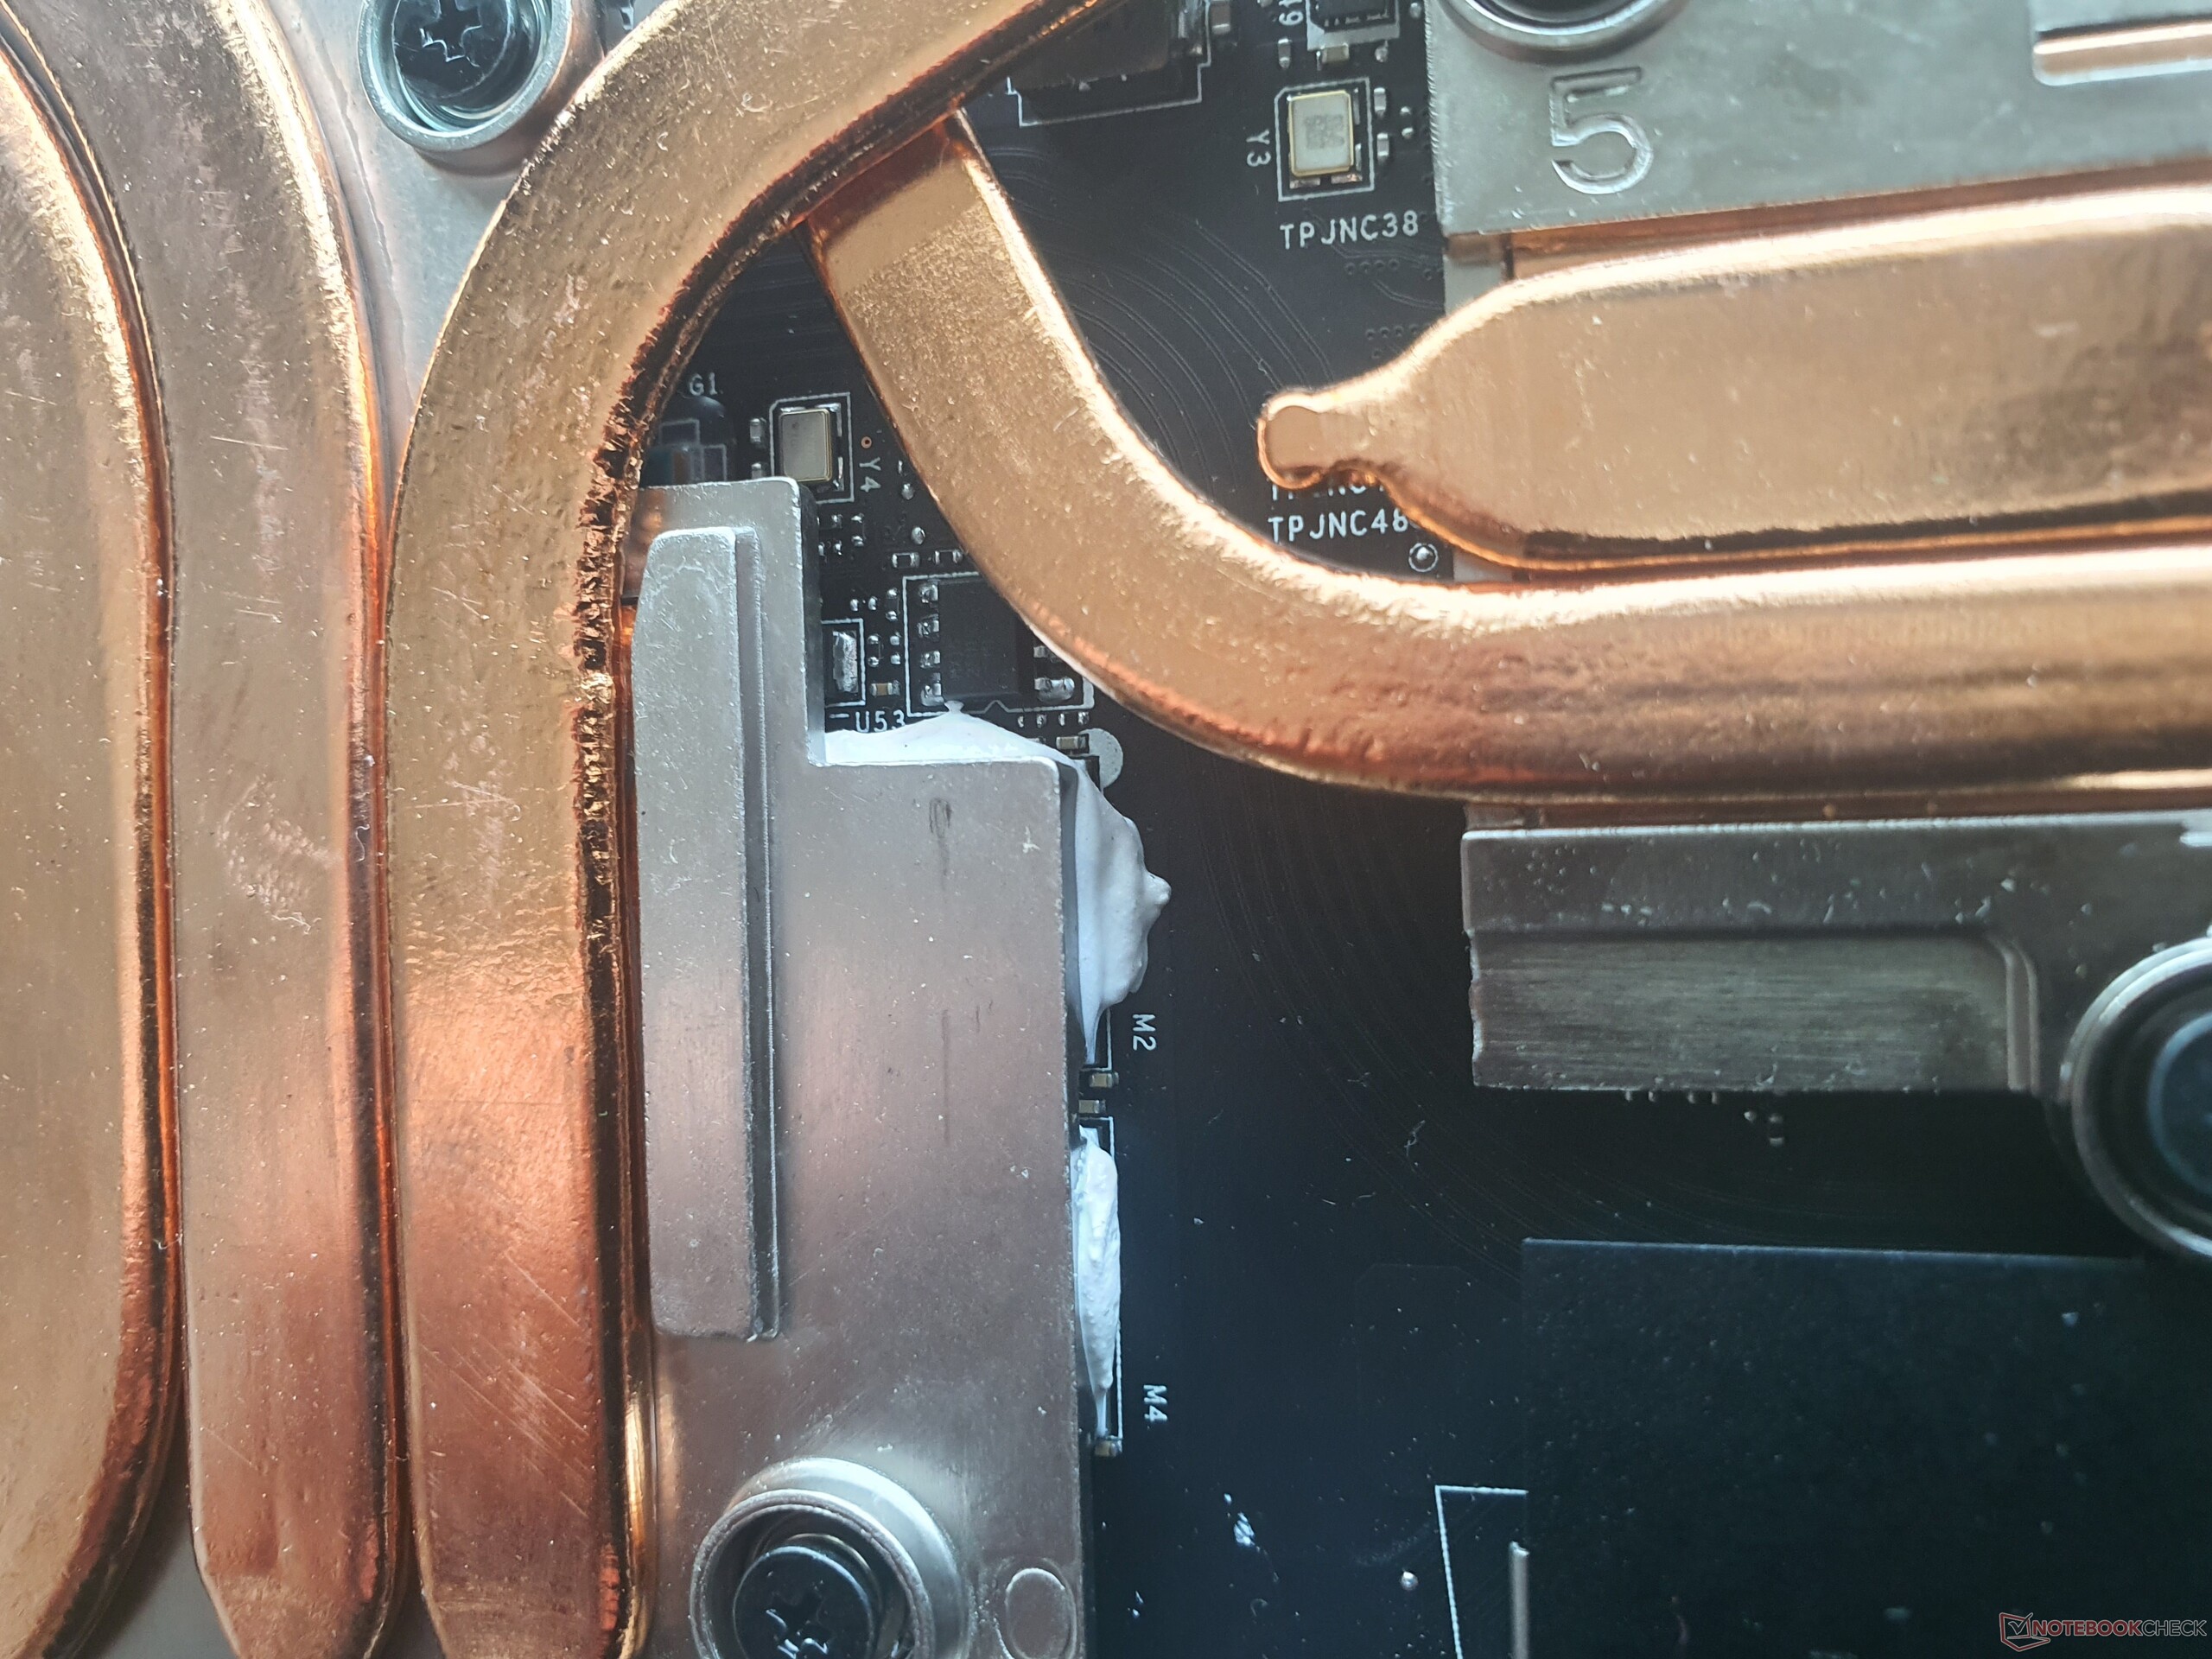
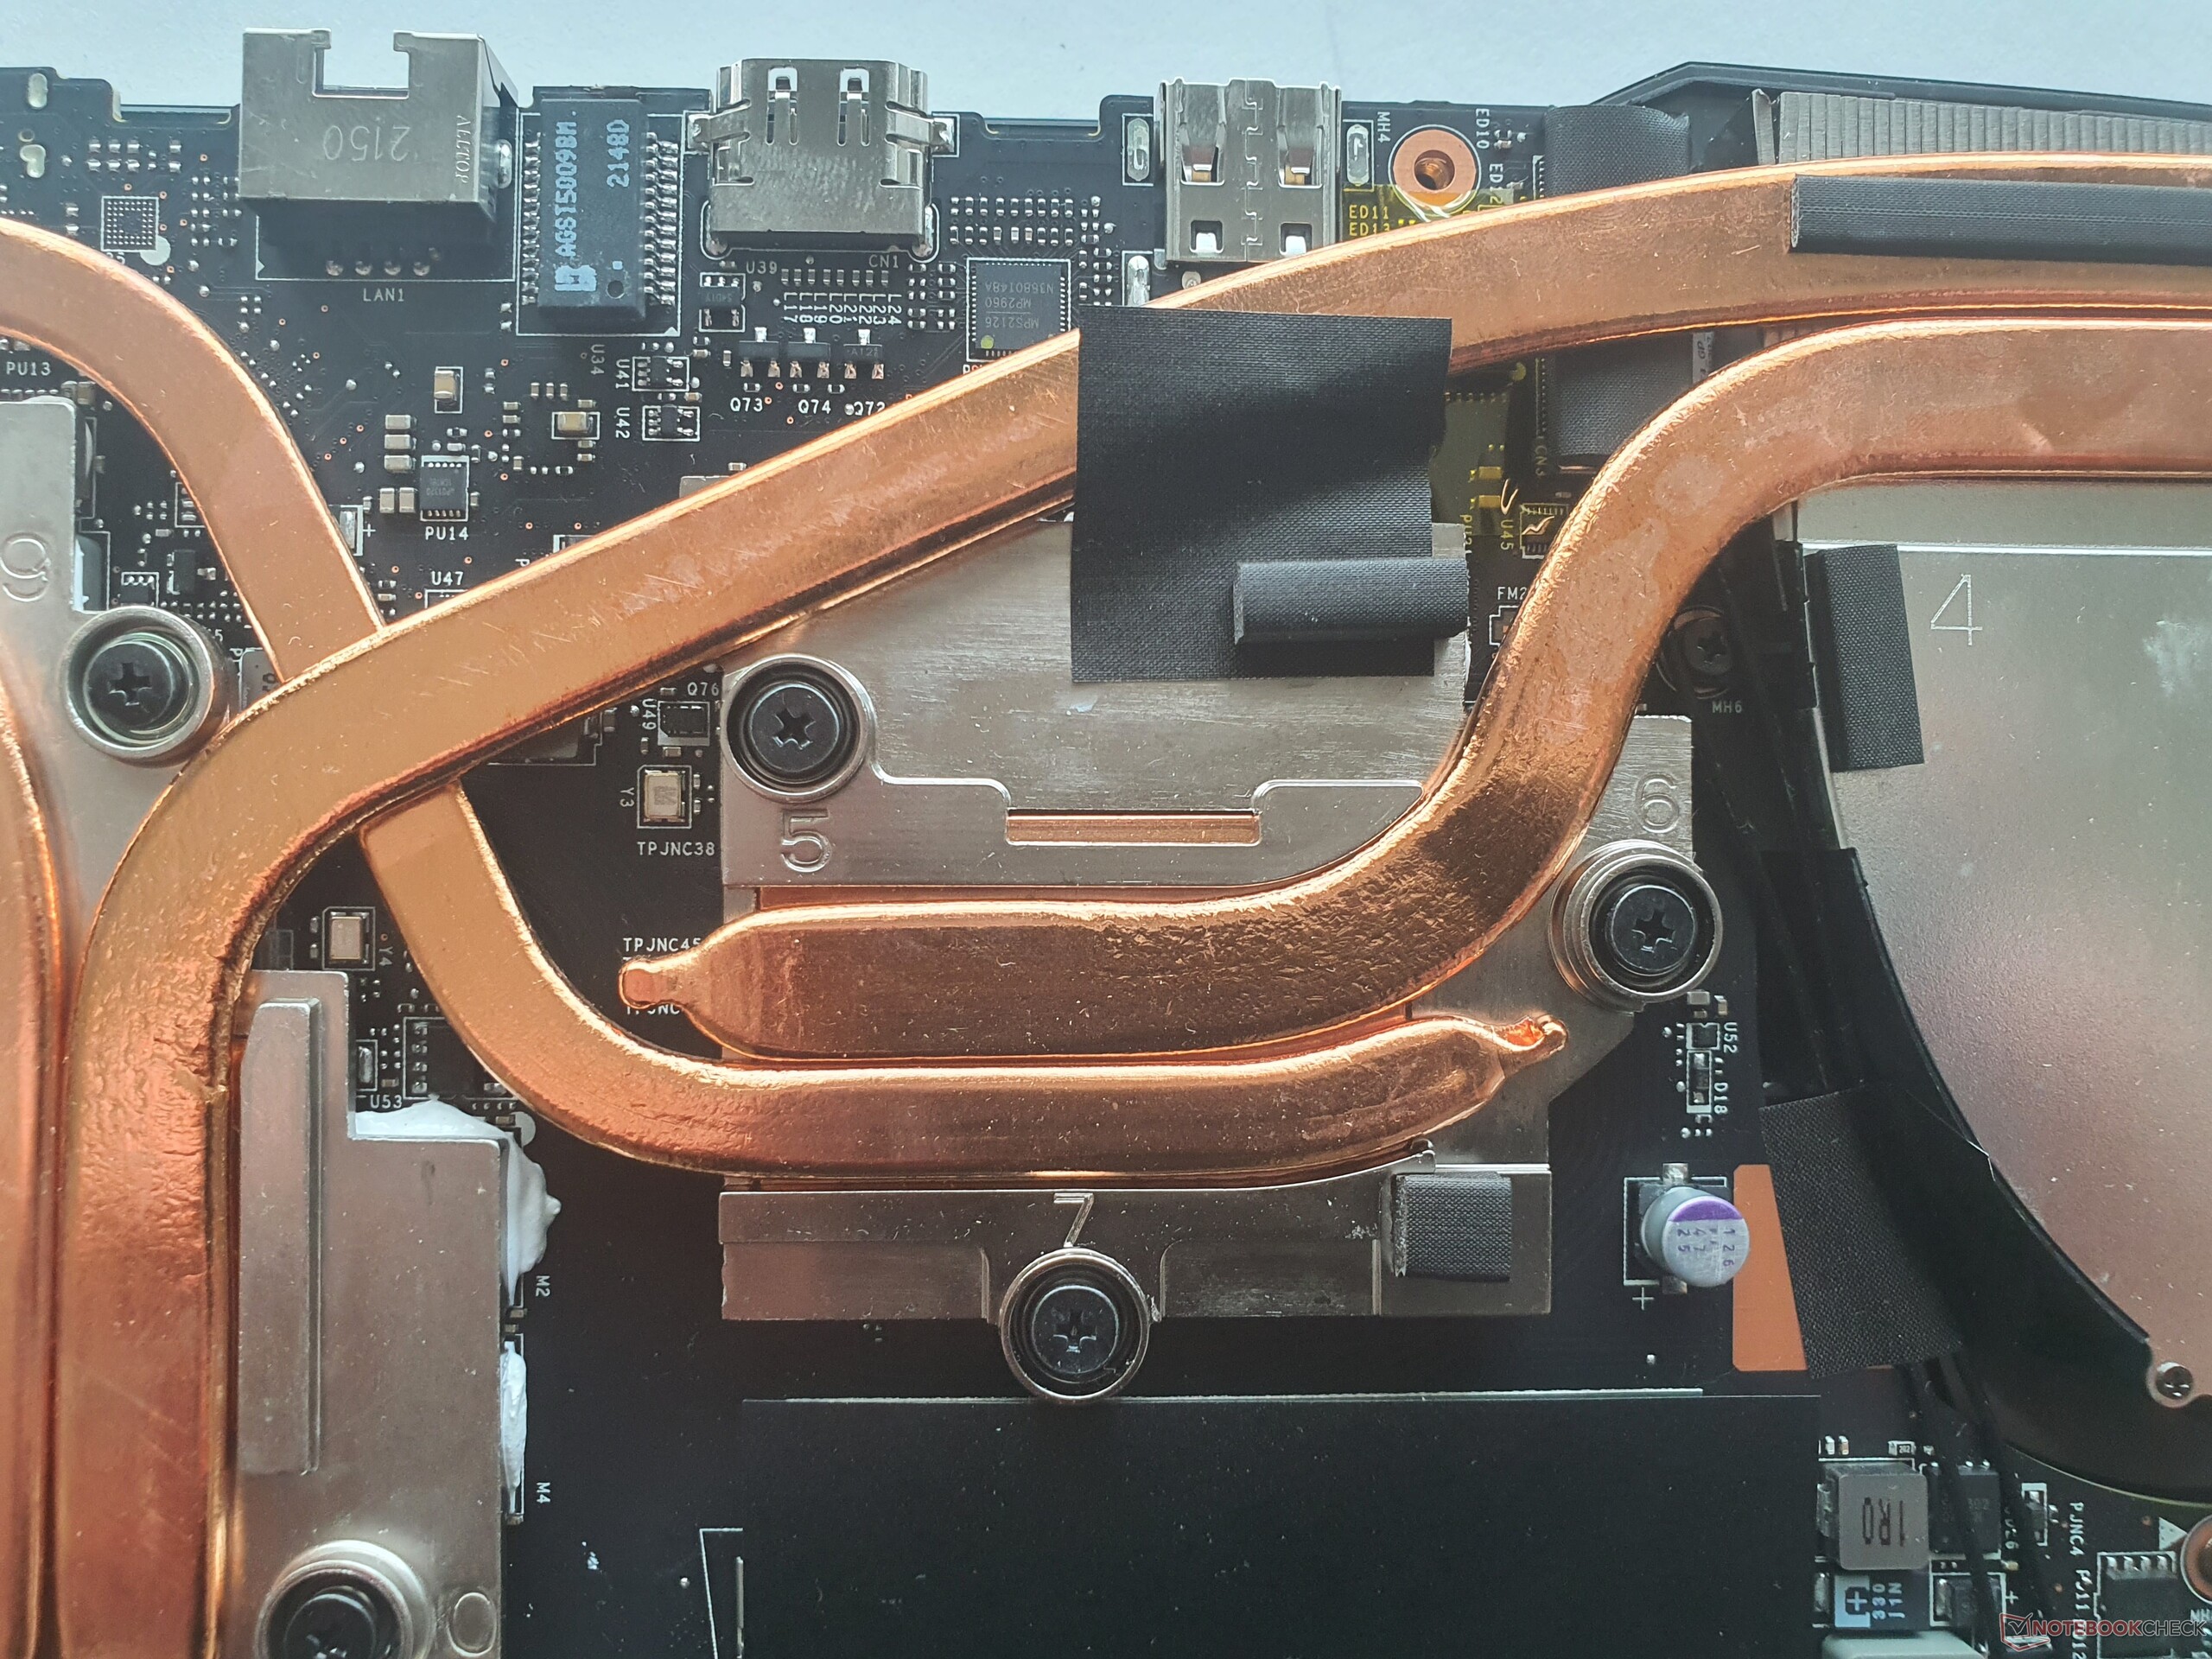
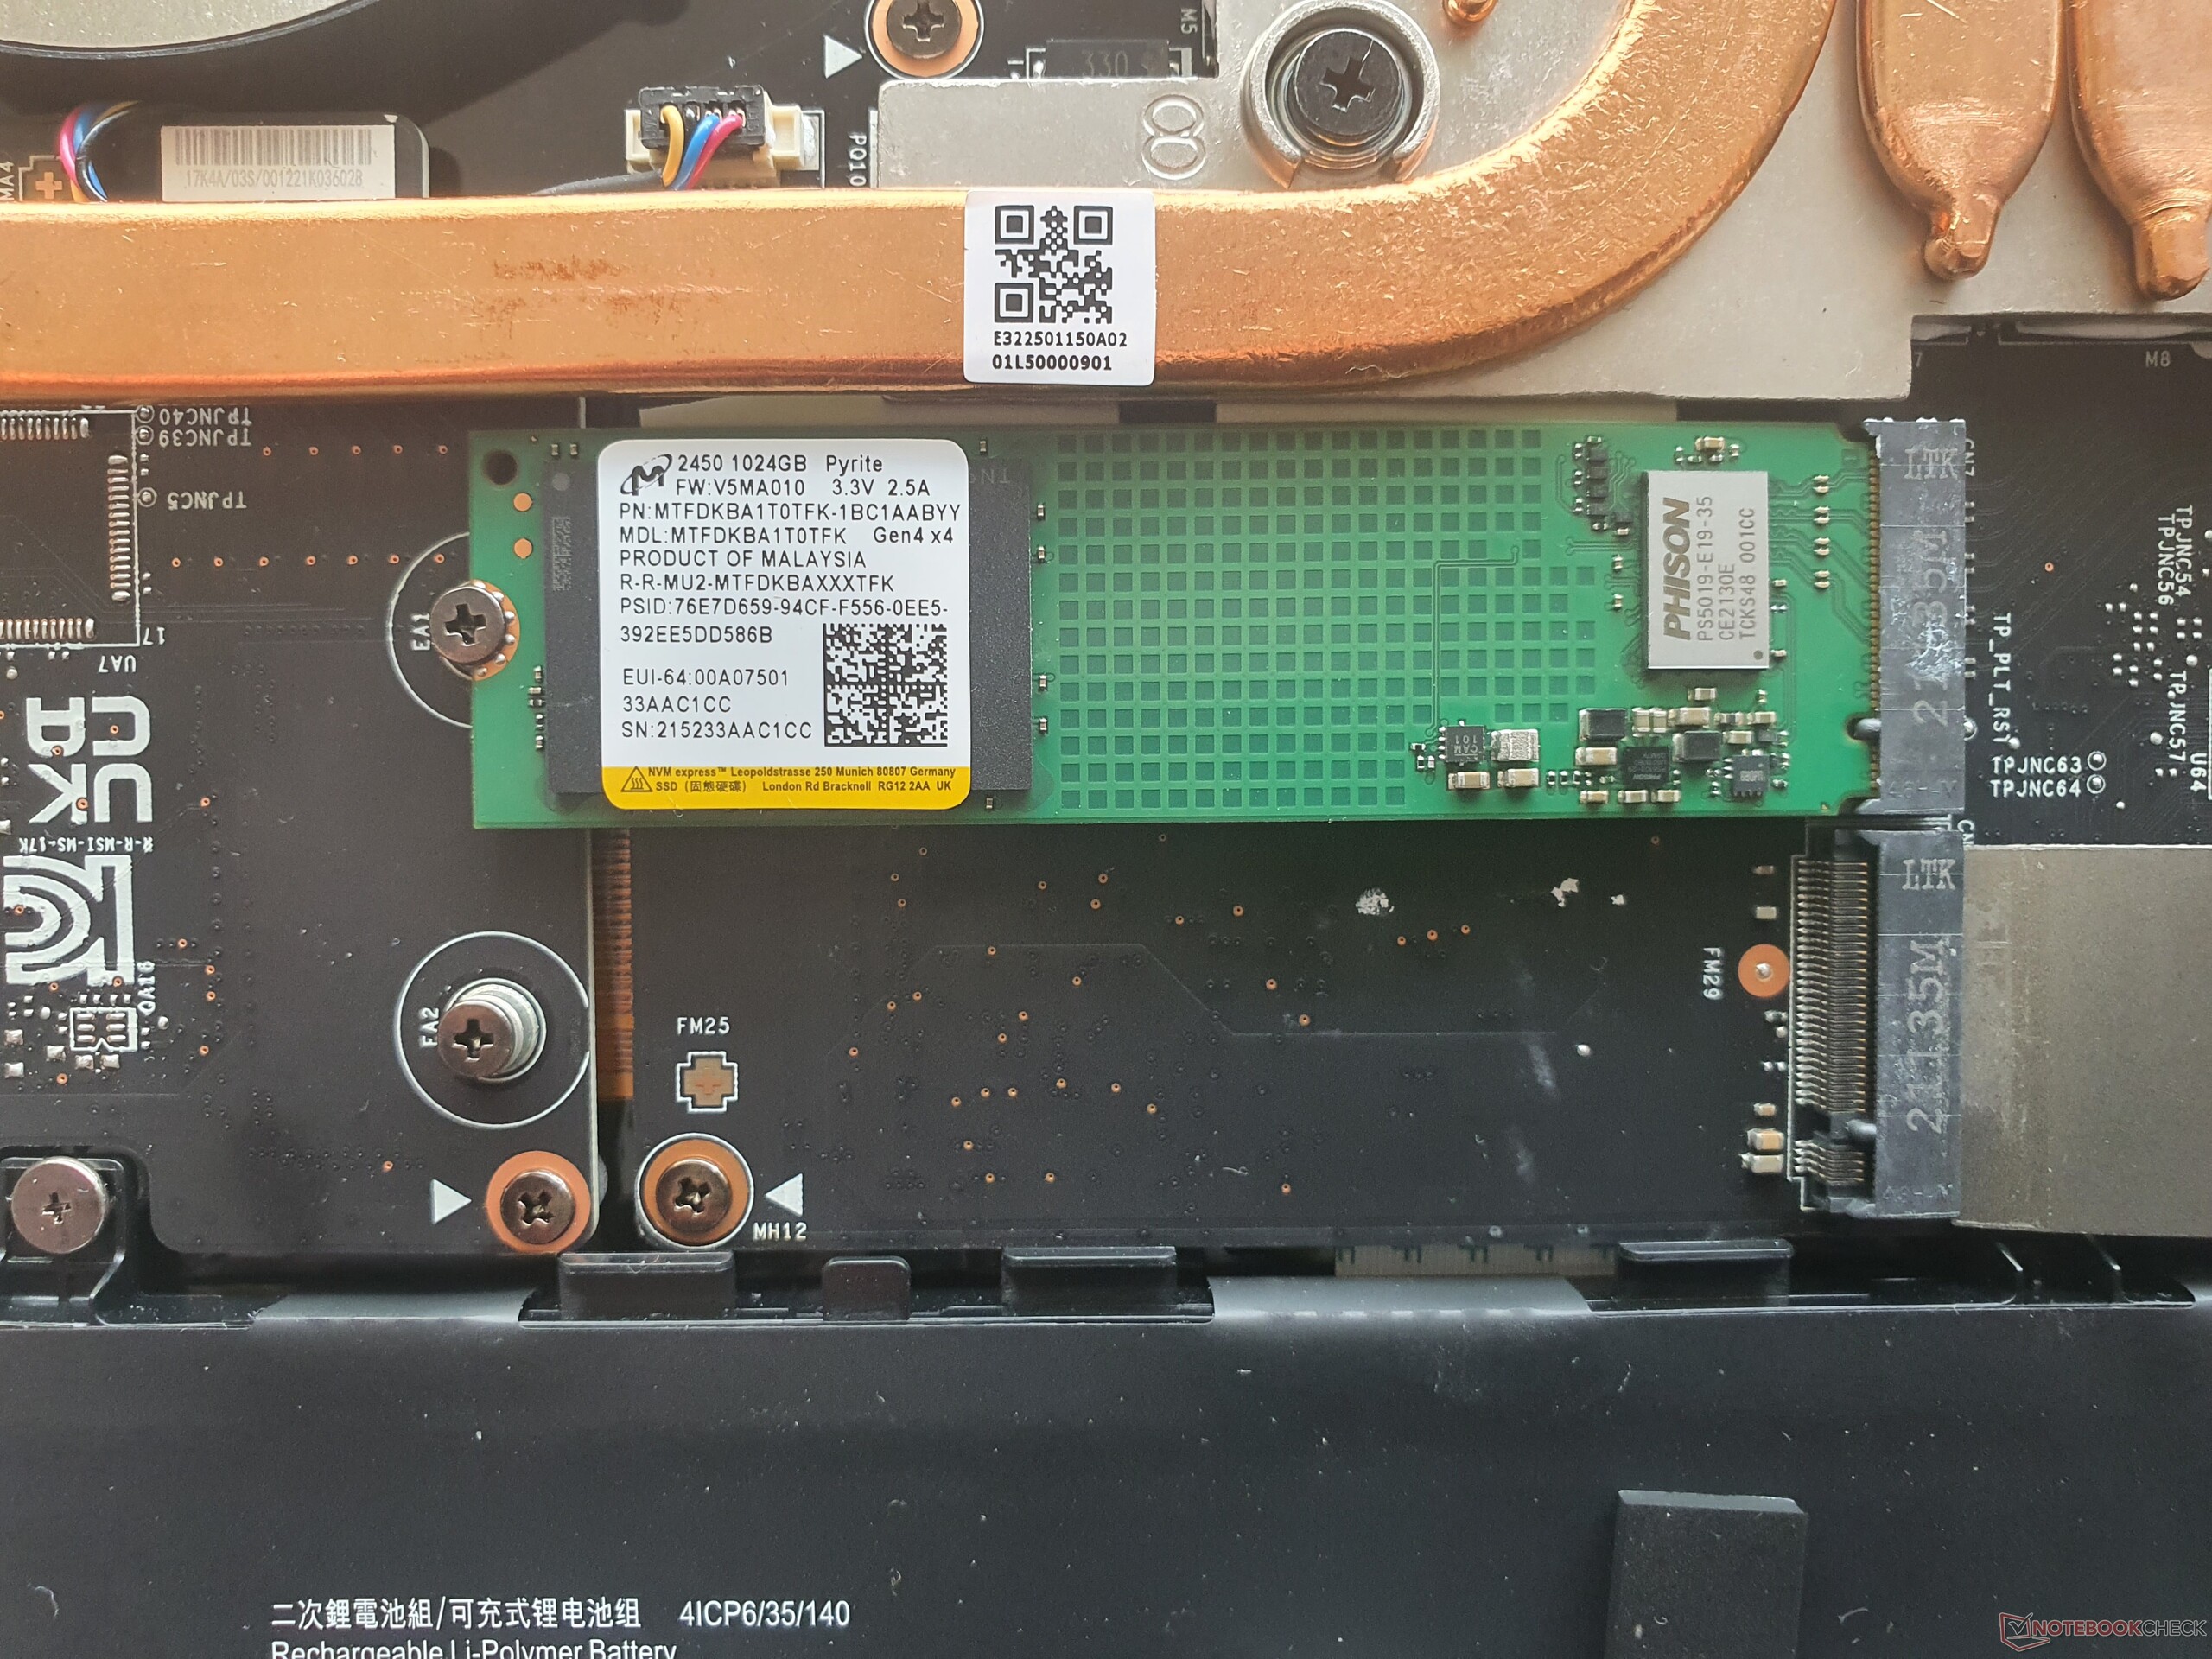
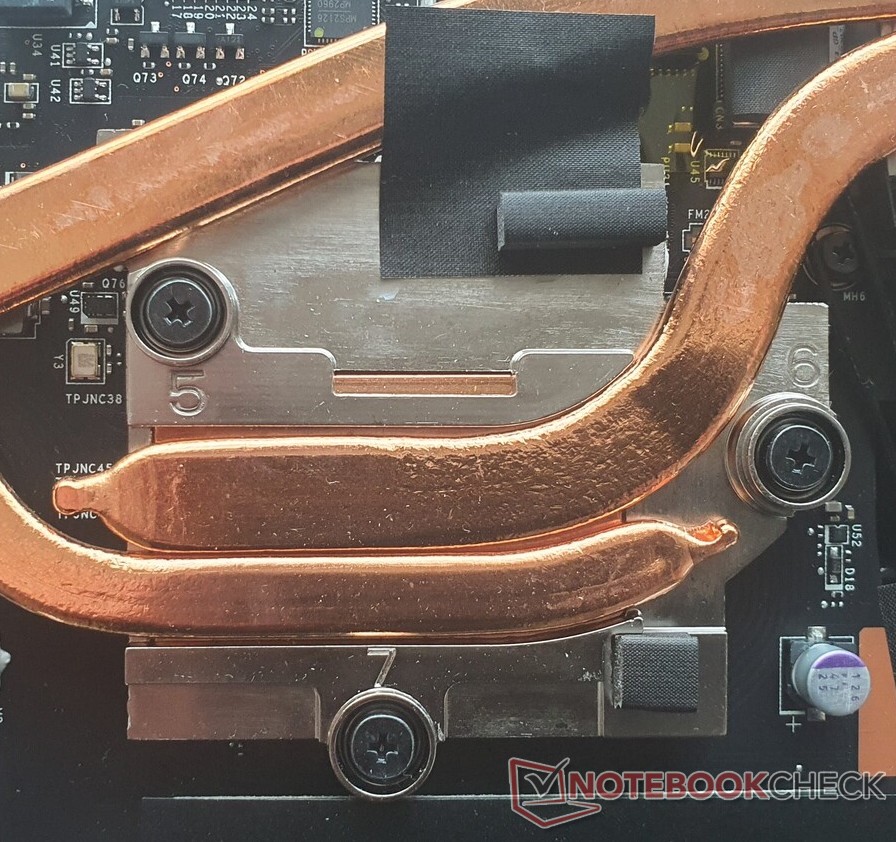
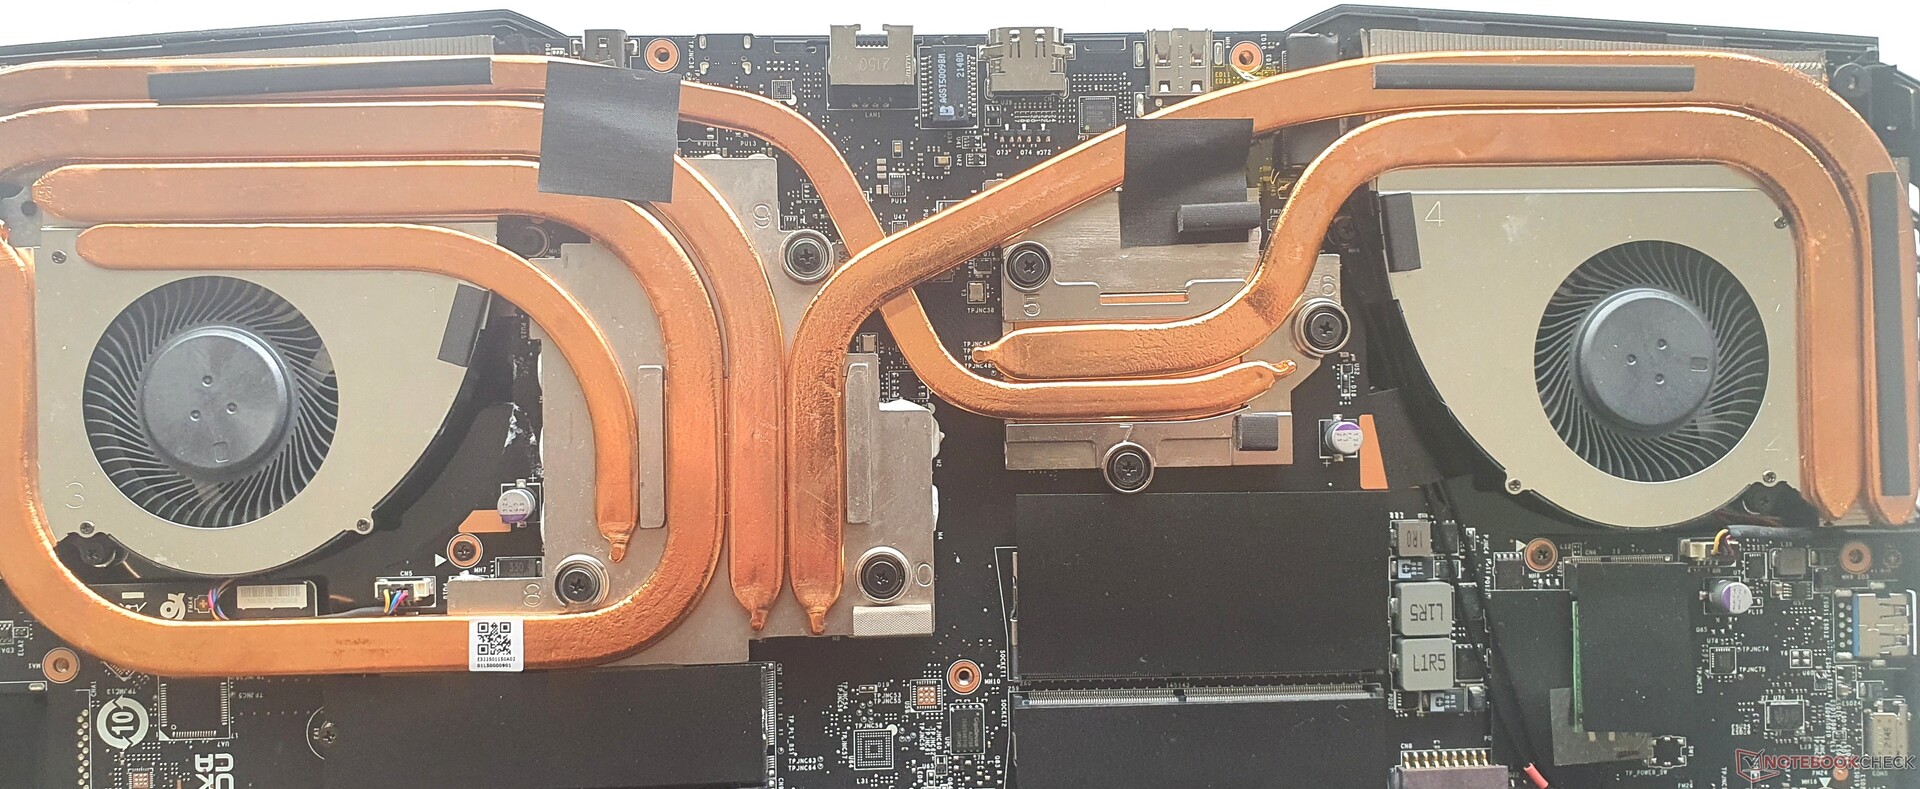
La parte posteriore del case può essere staccata dopo aver rimosso 13 viti Phillips e aver utilizzato un attrezzo per spudorare. Il bordo anteriore, che arriva fino alla parte superiore del portatile e presenta molti ganci, richiede una certa dose di forza e abilità.
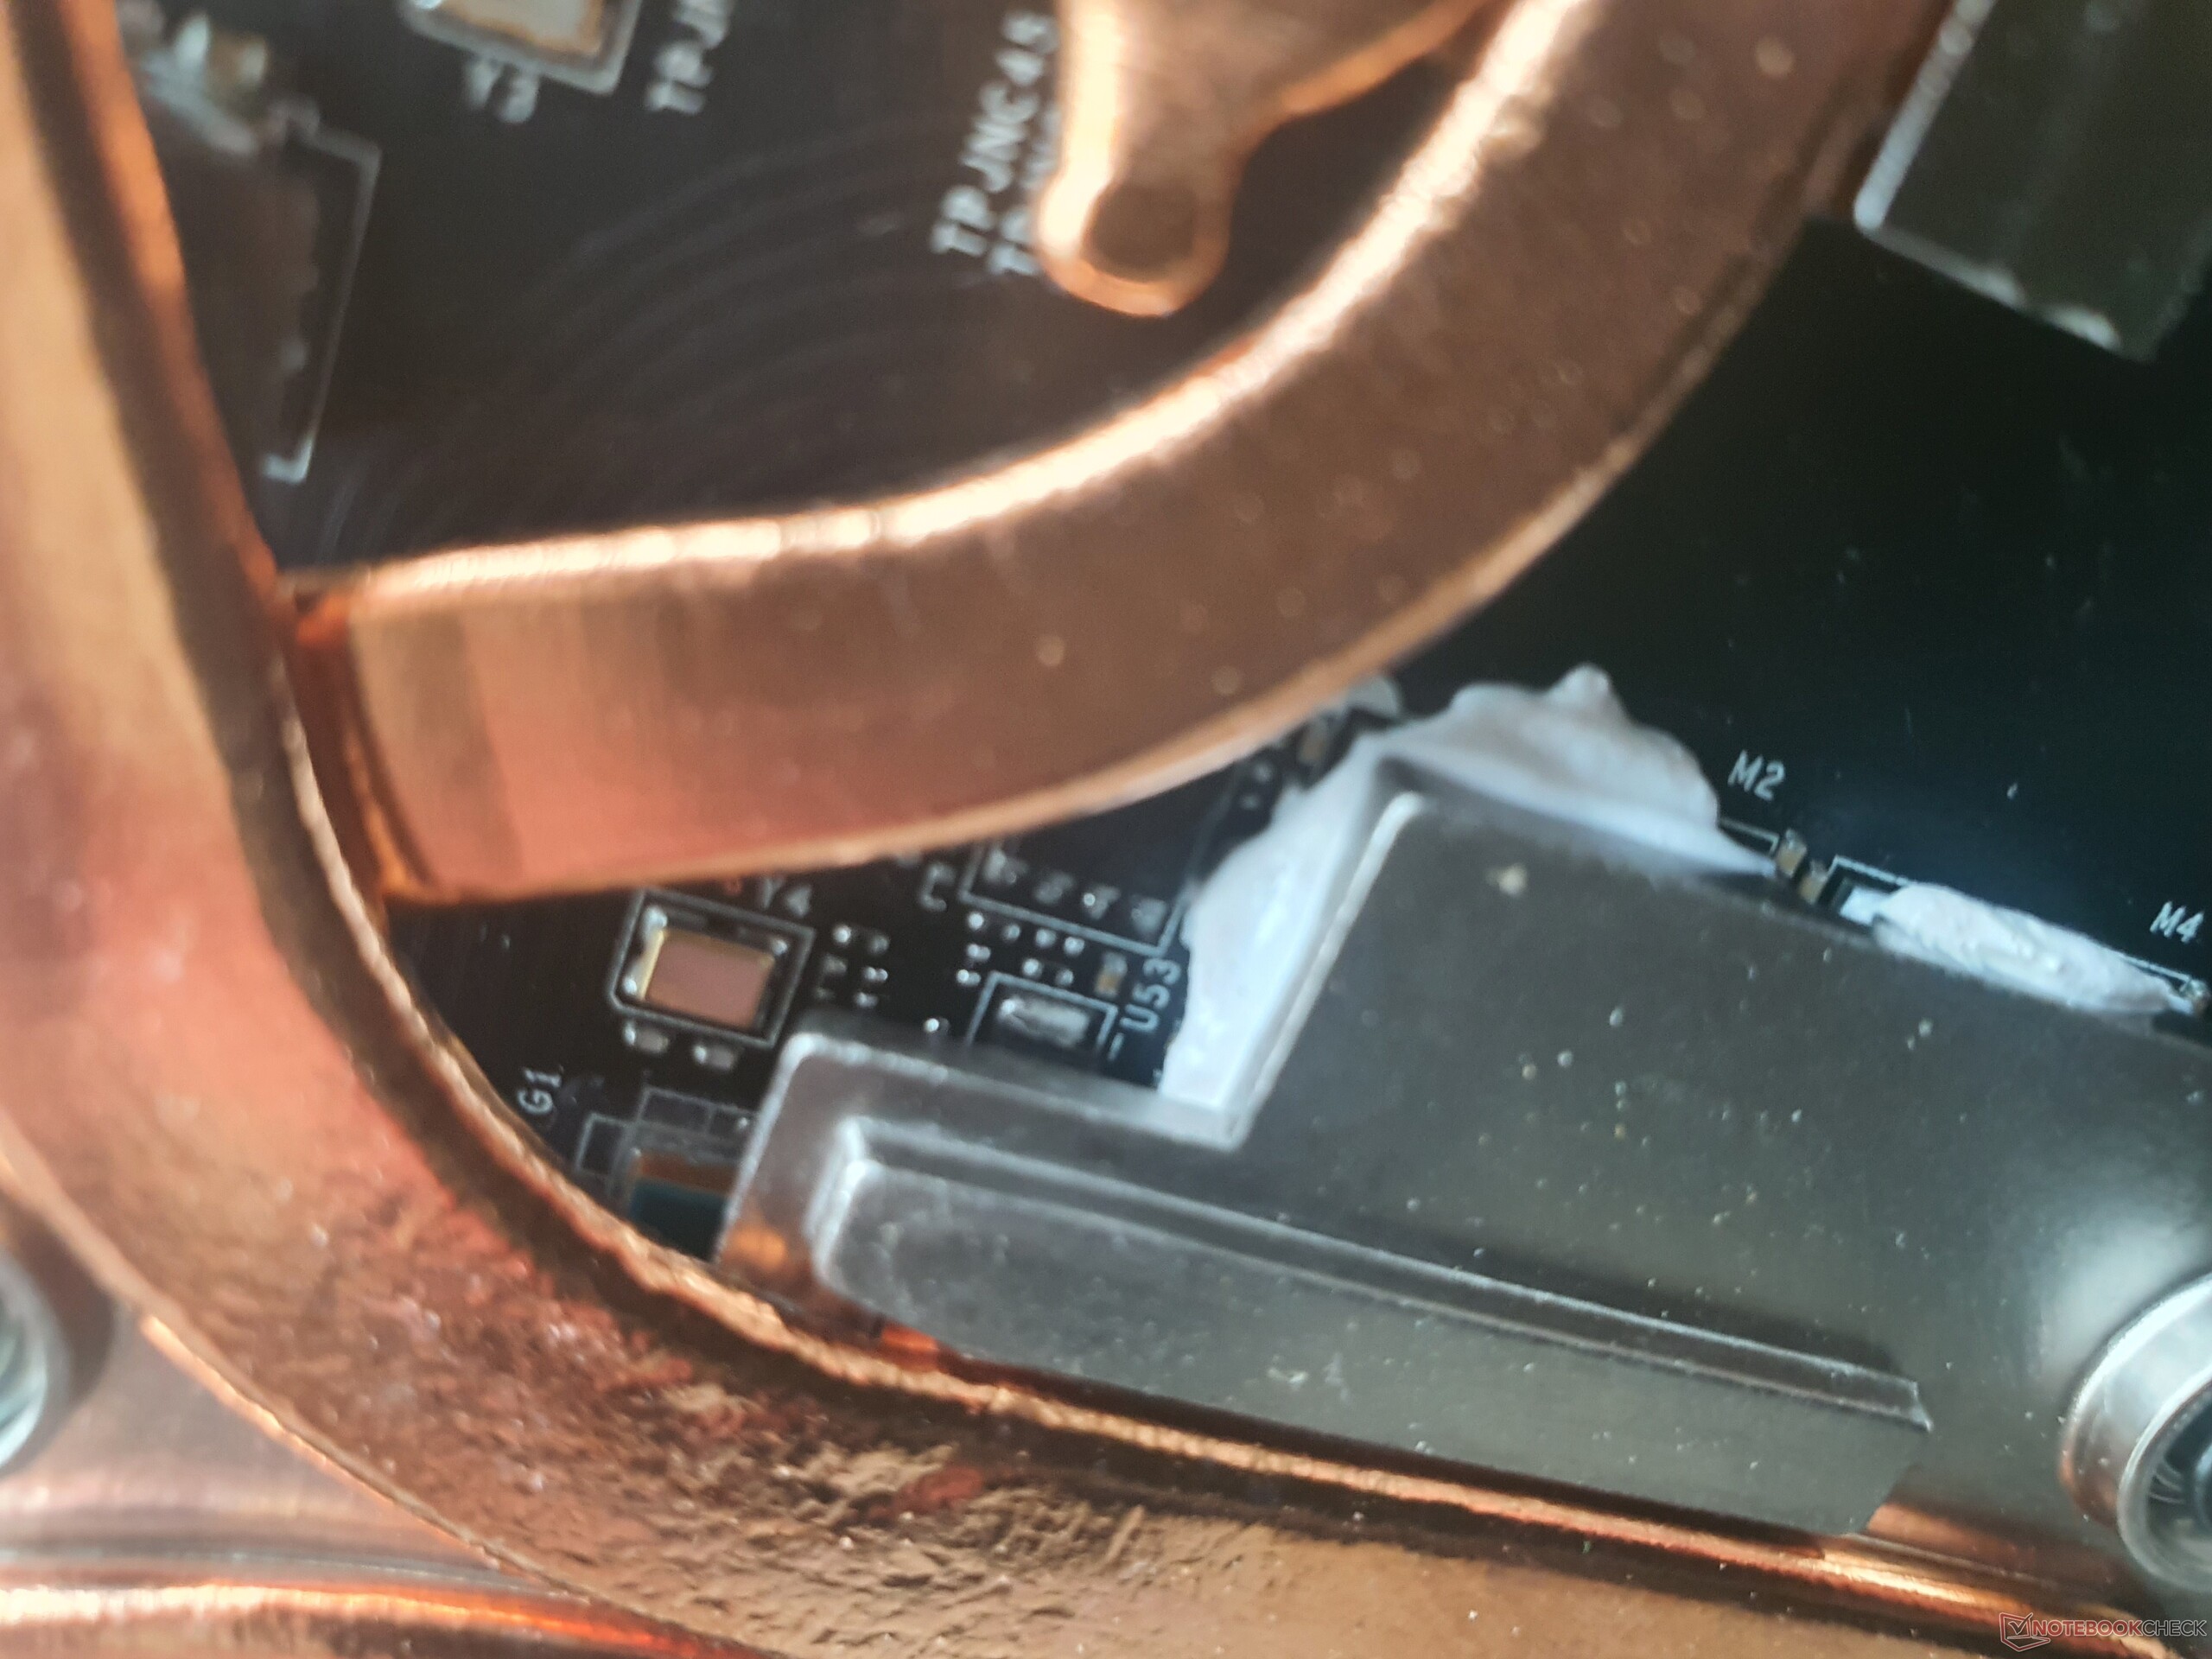
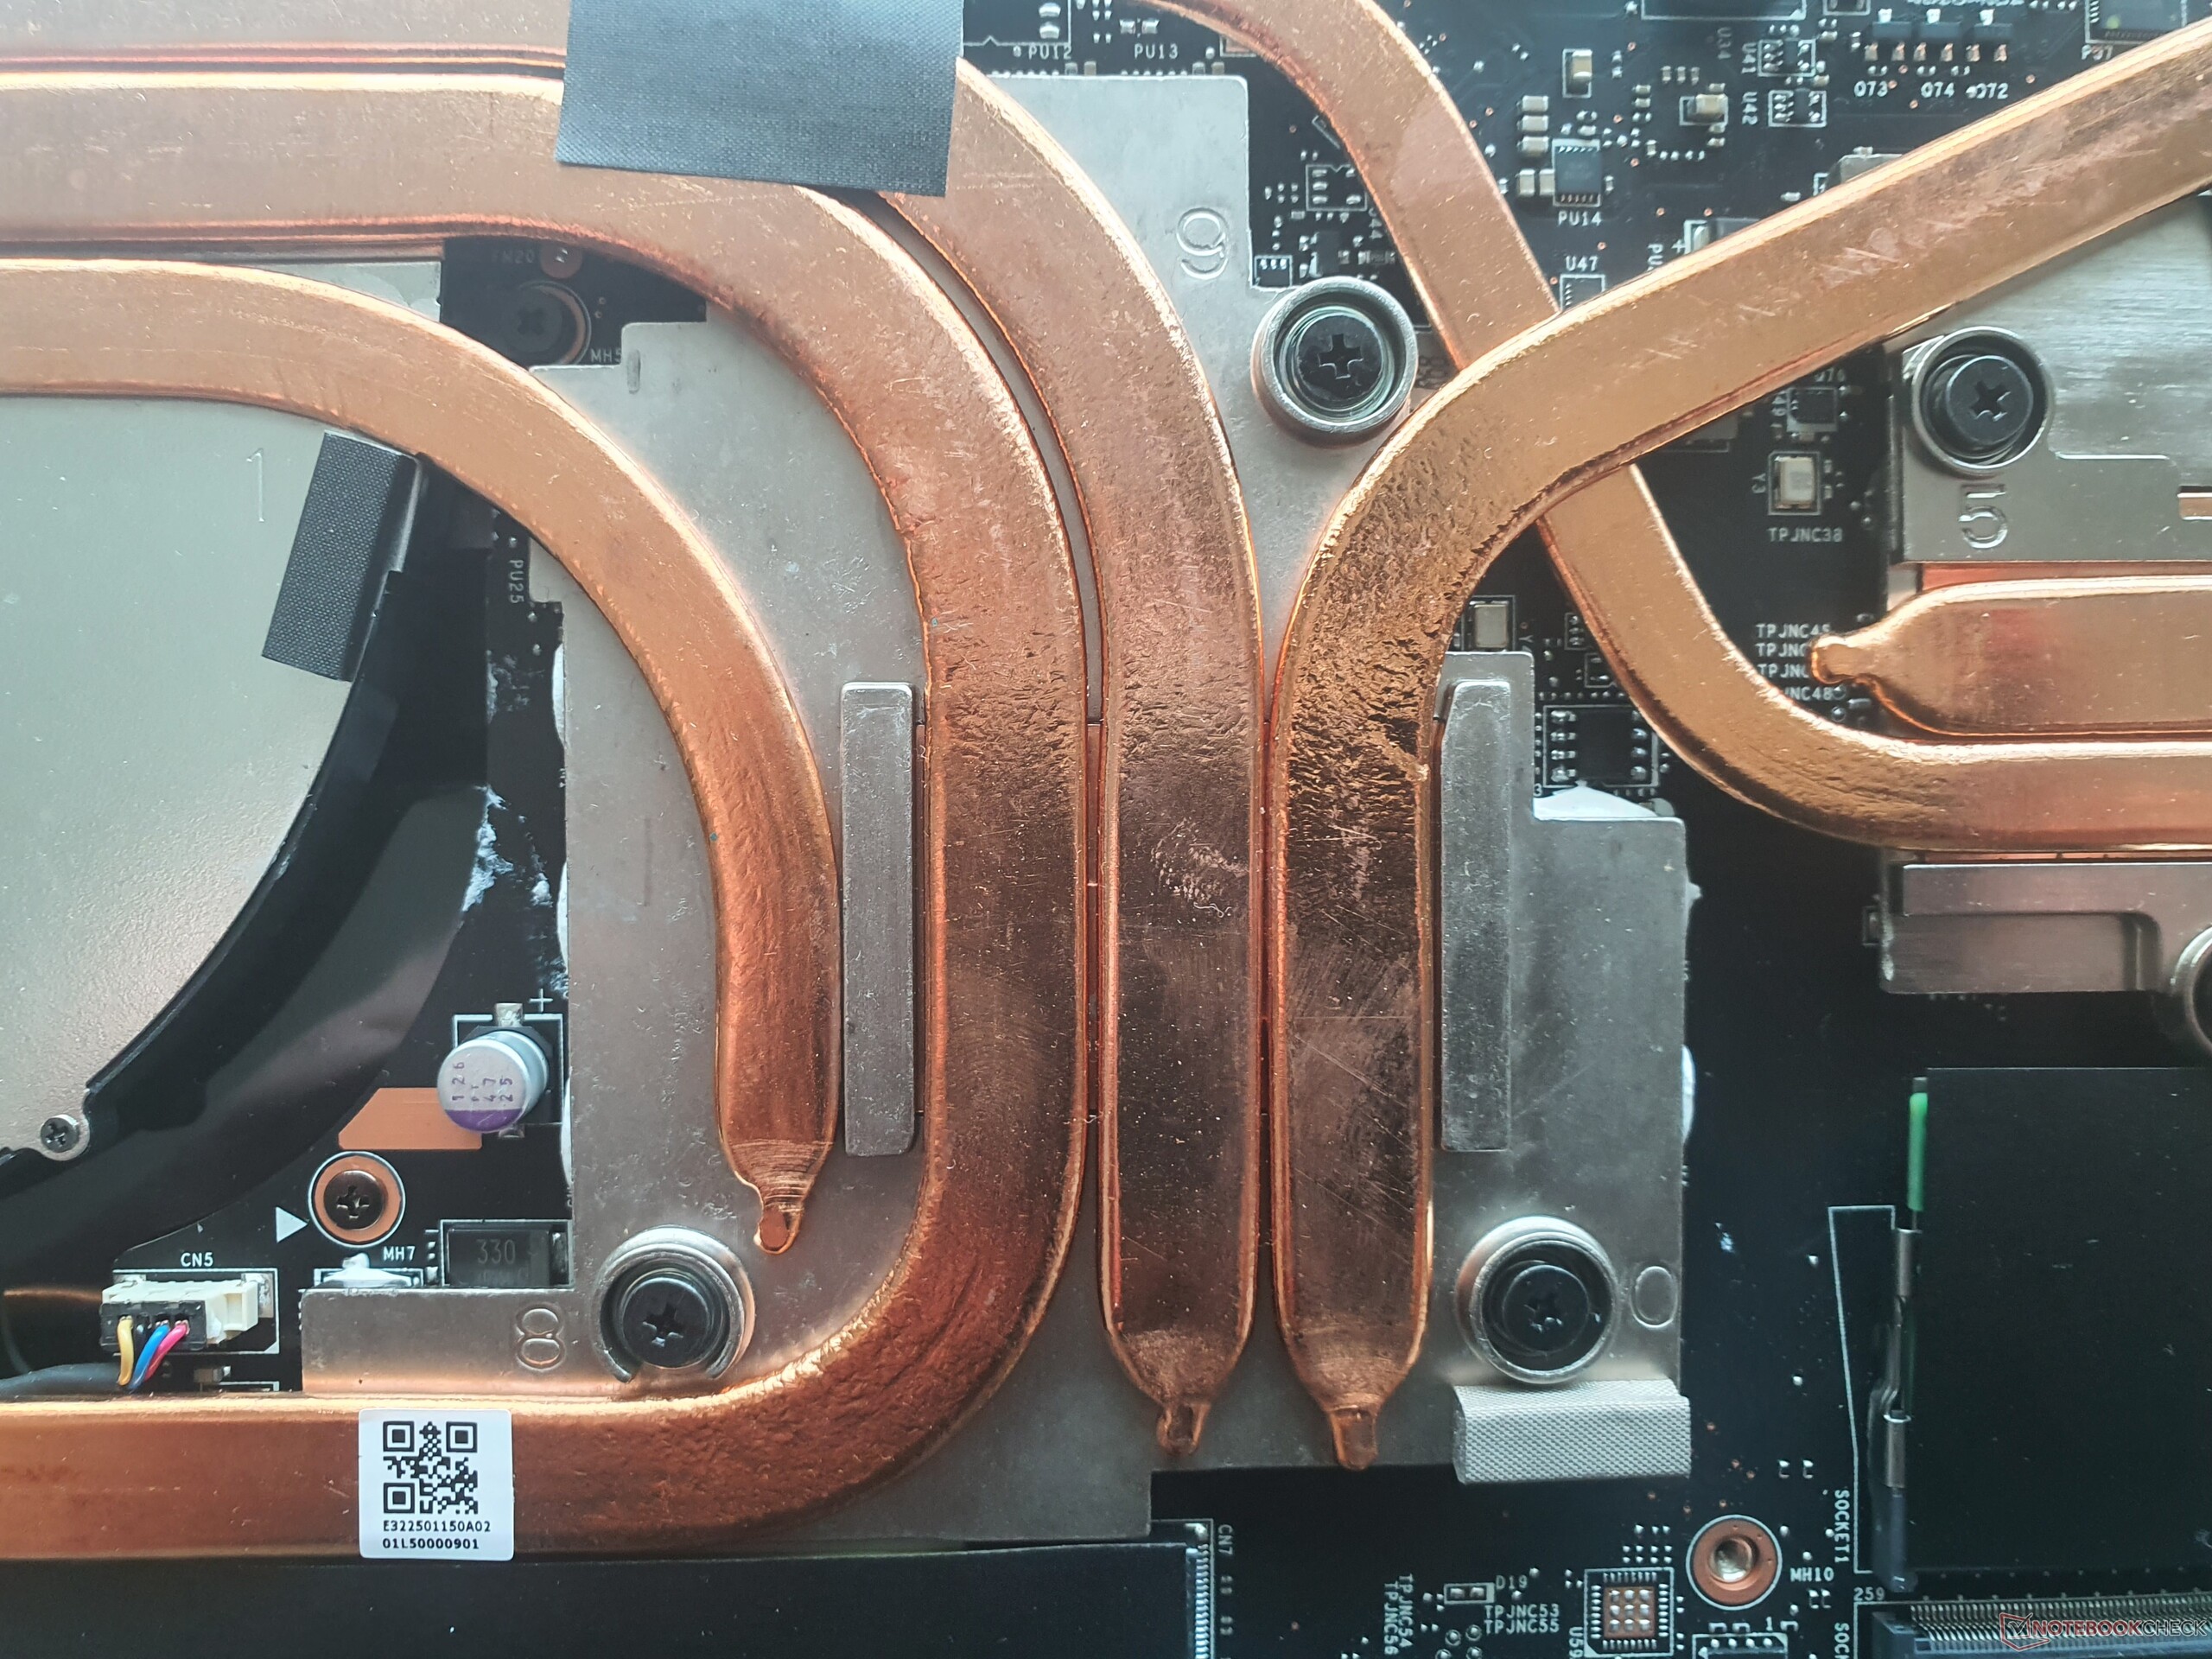
Successivamente, si incontra una grande quantità di rame sotto forma di 6 heat pipe, tra cui due grandi ventole che possono essere pulite. Gli elementi che possono essere raffreddati, come la CPU e la GPU, sono ricoperti di pasta termoconduttiva che "deborda" e si riversa in parte sul circuito stampato.
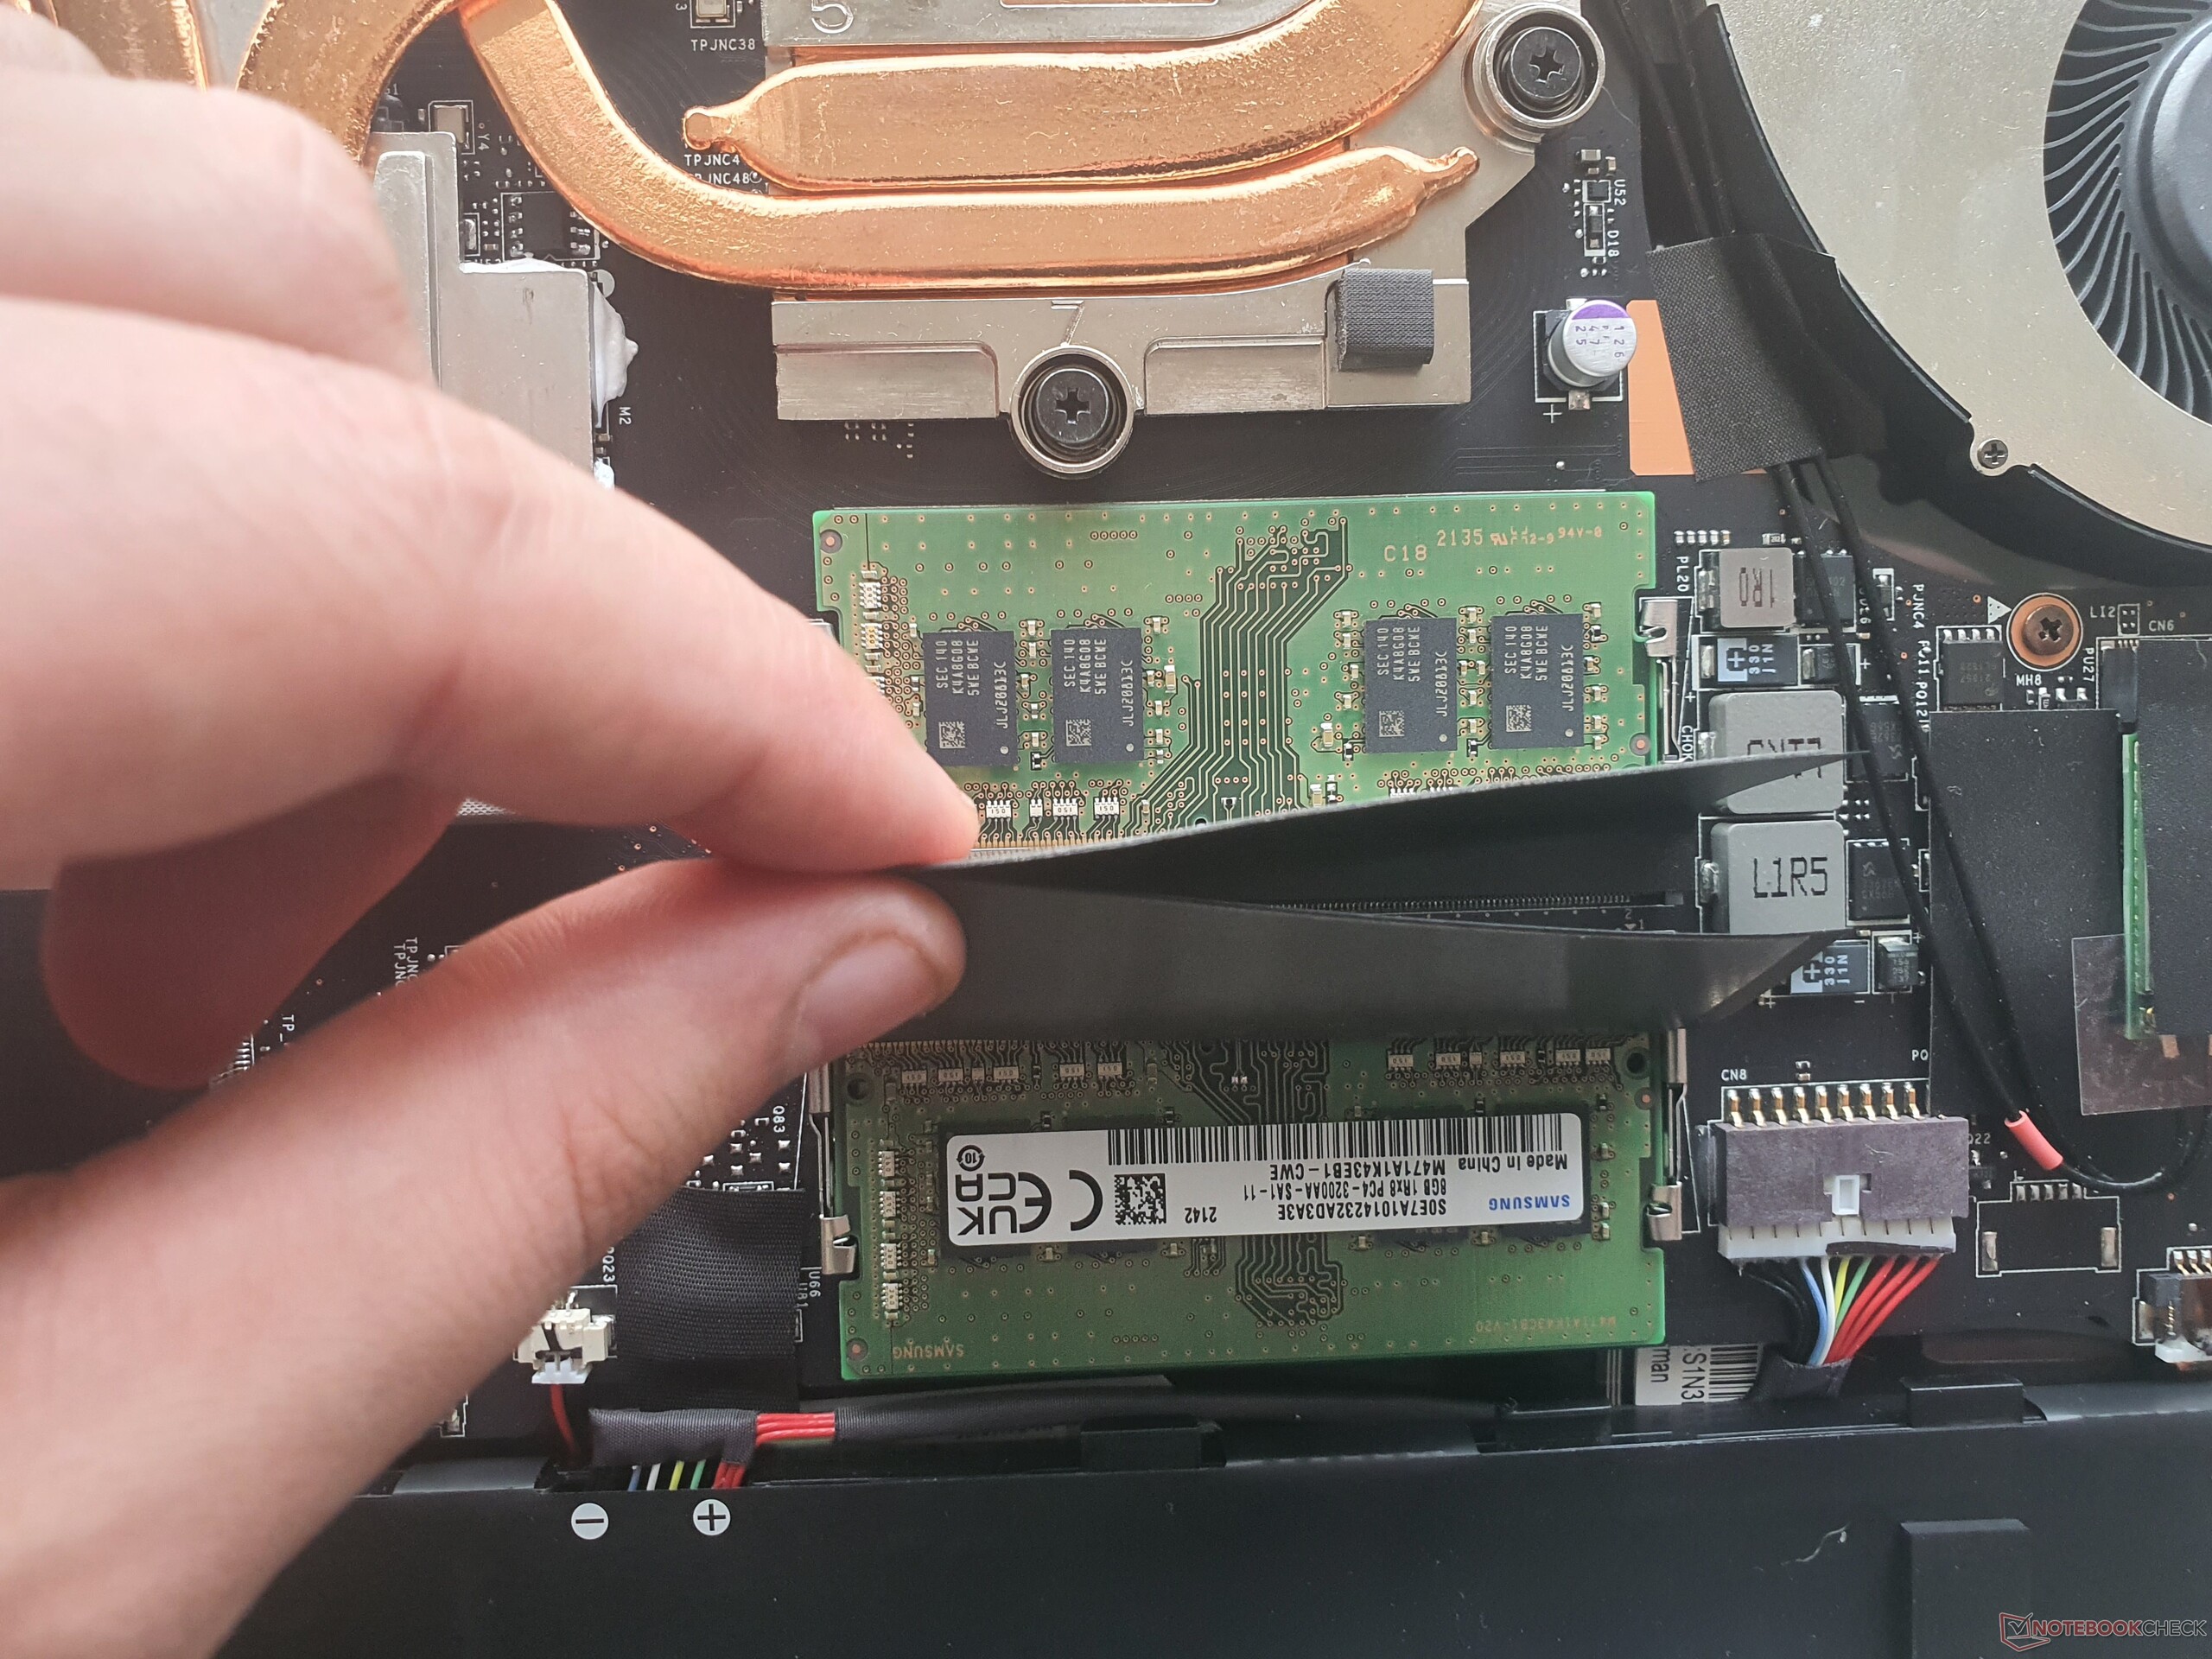
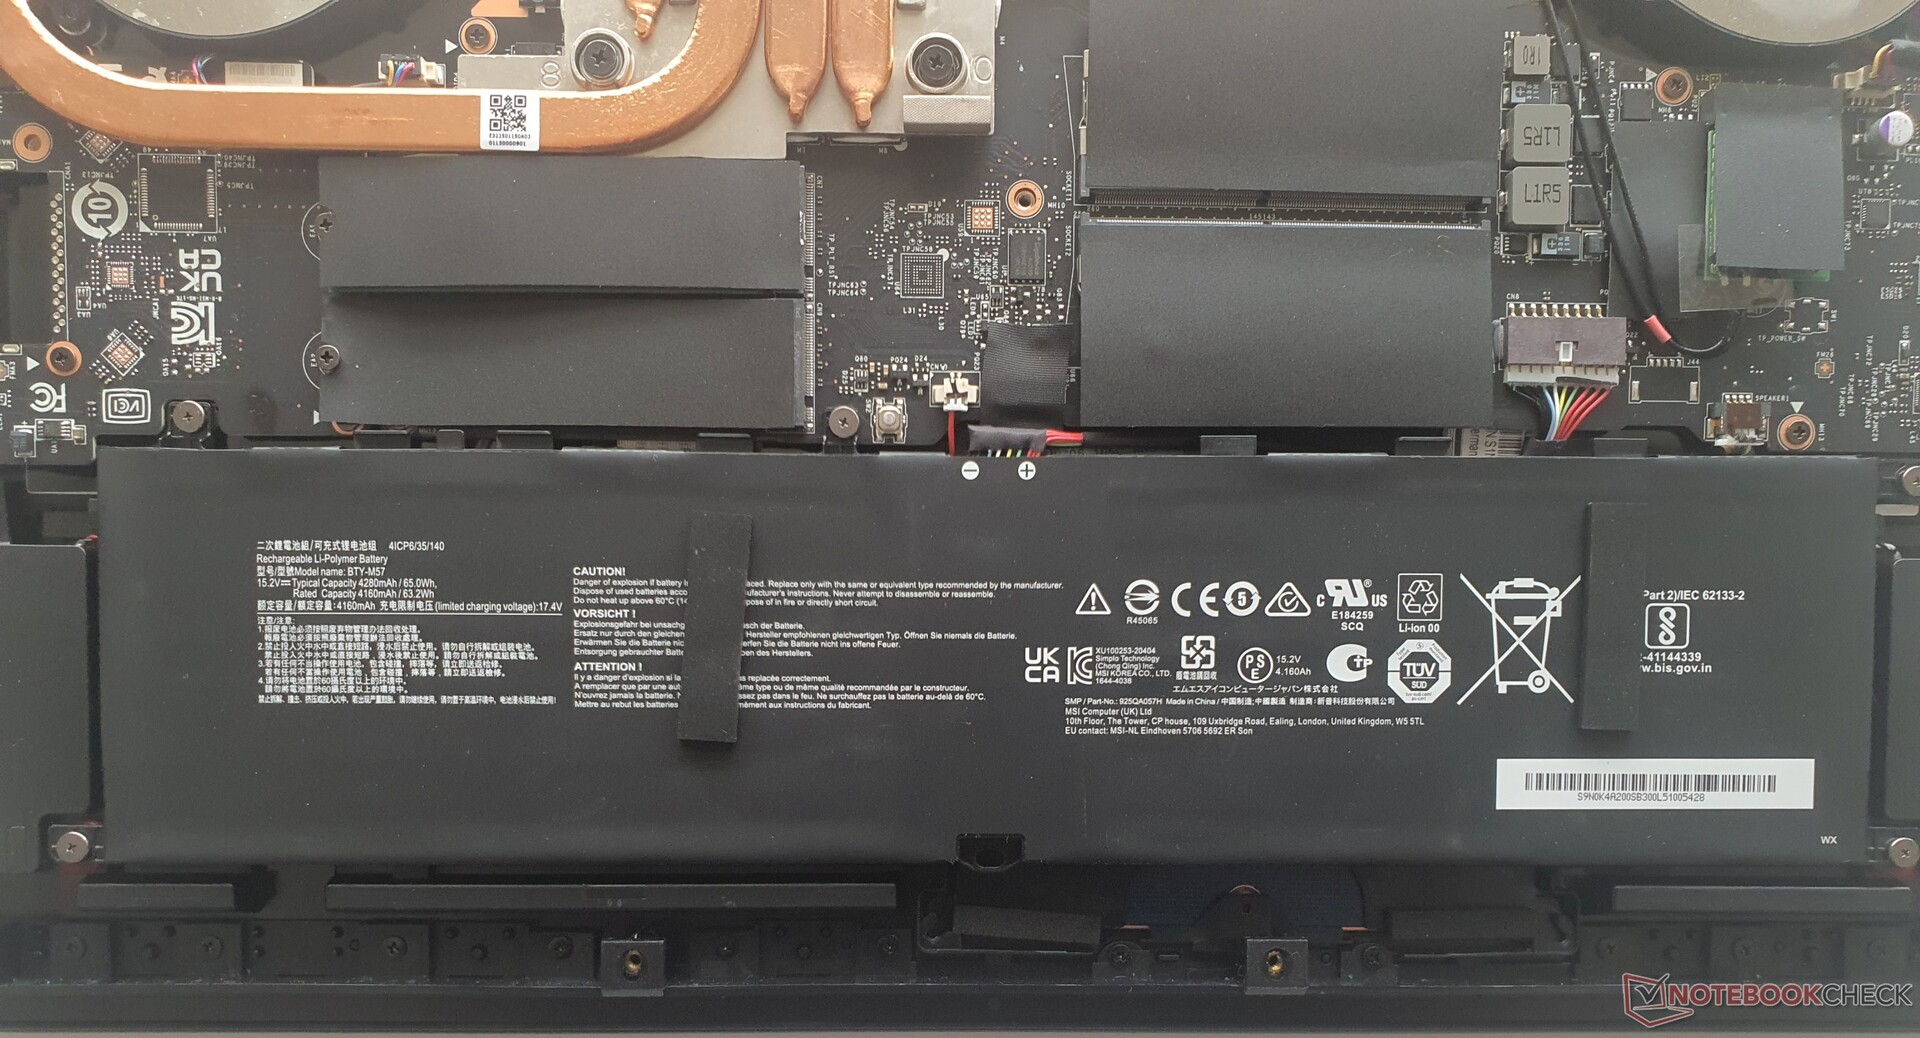
Il successivo componente più grande e manutenibile è la batteria da 65 Wh (avvitata). Inoltre, sono presenti due slot M.2 con specifiche PCIe4x4 (con capacità RAID 0.1), completati da due SODIMM per un massimo di 64 GB di RAM DDR4-3200. Come già detto, anche il modulo Wi-Fi è sostituibile. Nel complesso, quindi, il Vector GP76 è di facile manutenzione.
Garanzia
La garanzia nell'UE è di 24 mesi con servizio di ritiro. Nella maggior parte delle altre regioni è di 12 mesi. È possibile un'estensione con un sovrapprezzo.
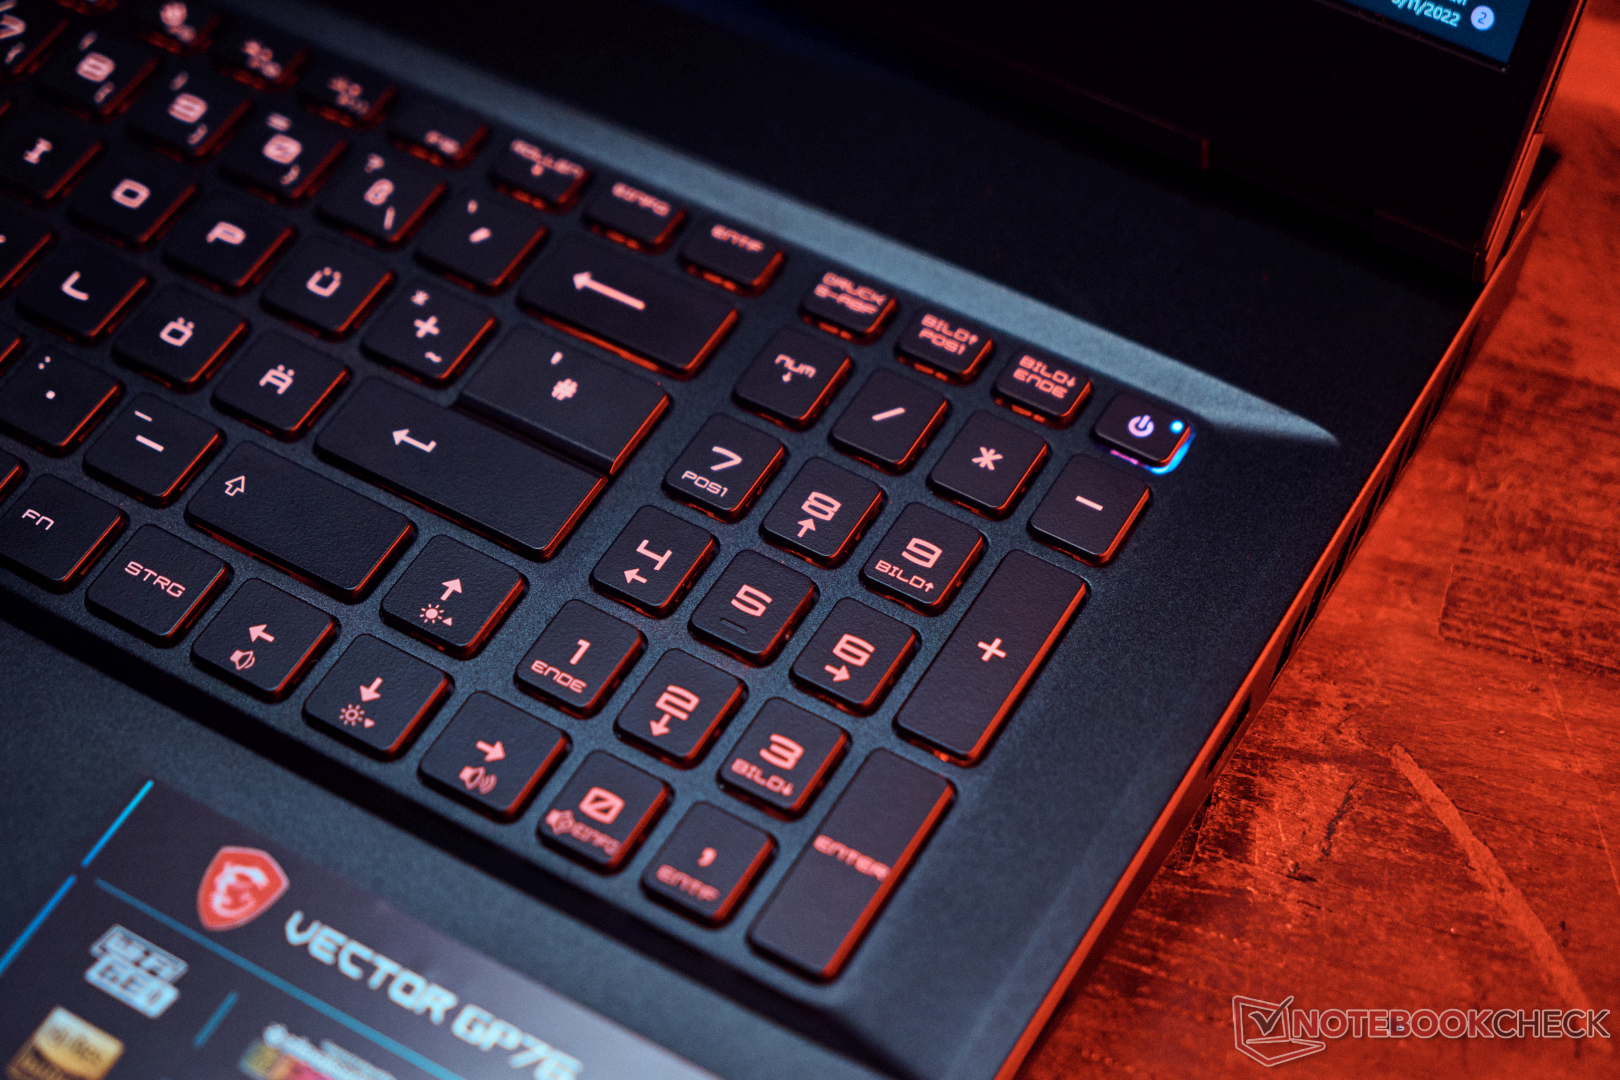
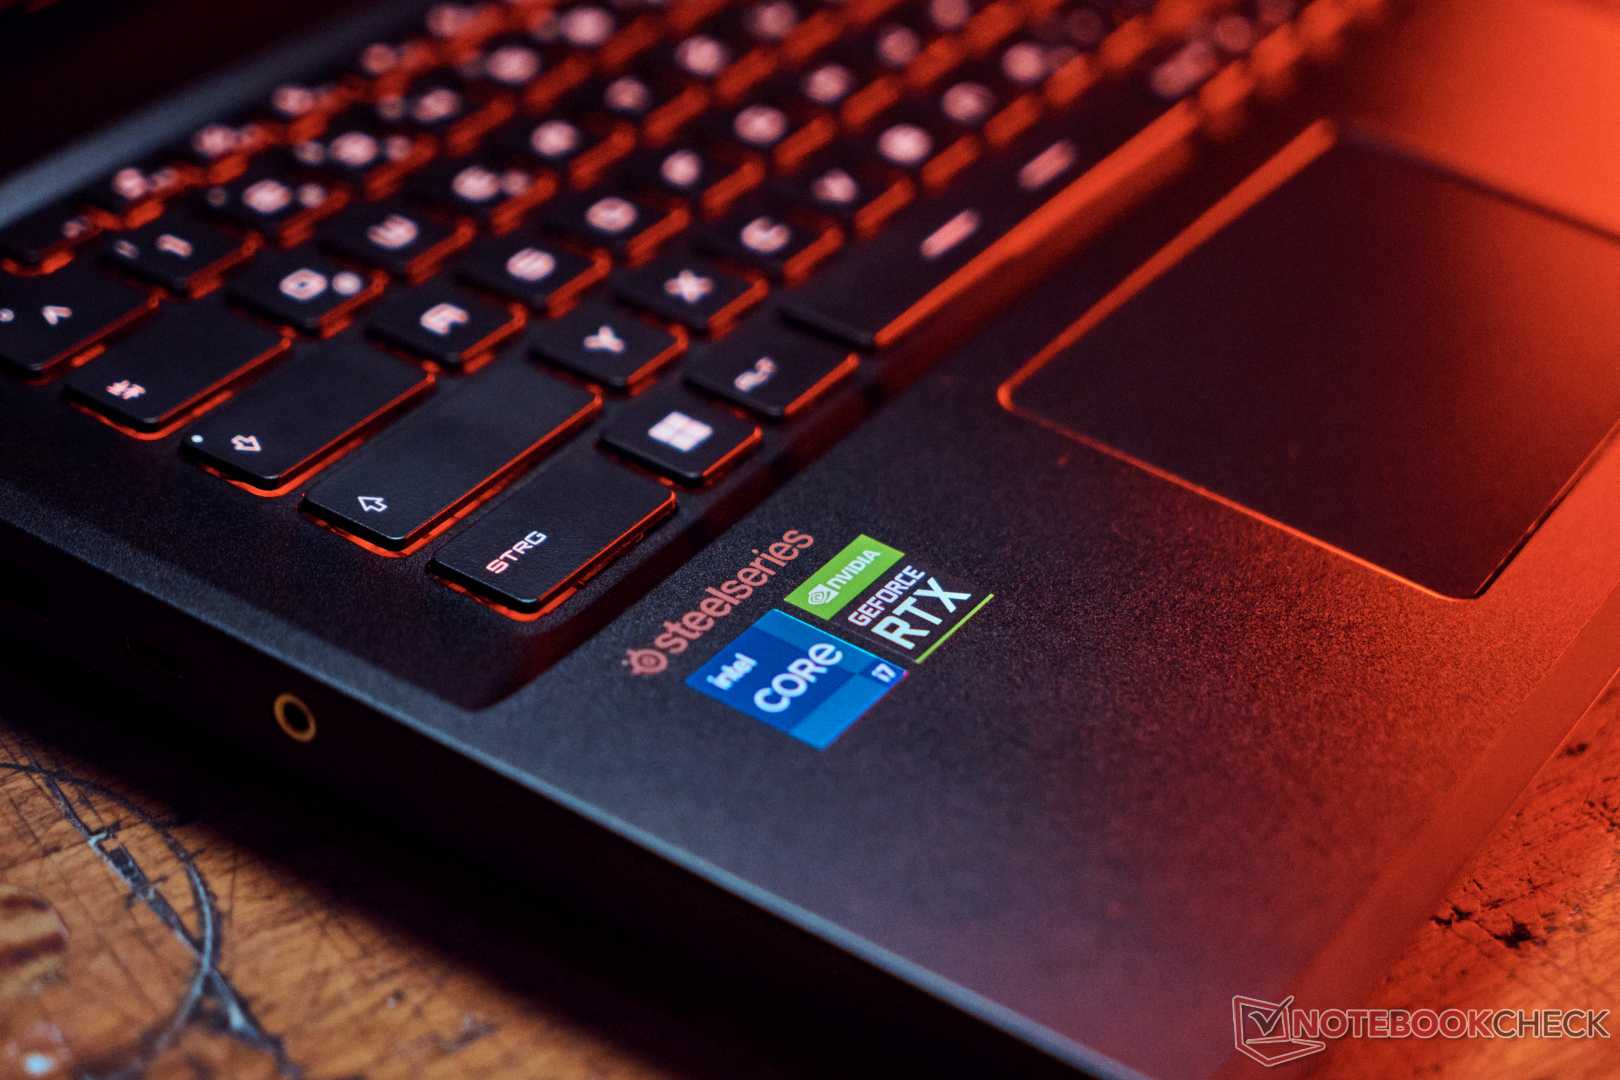
Dispositivi di input: MSI con RGB per tasto per un tocco di colore
Tastiera
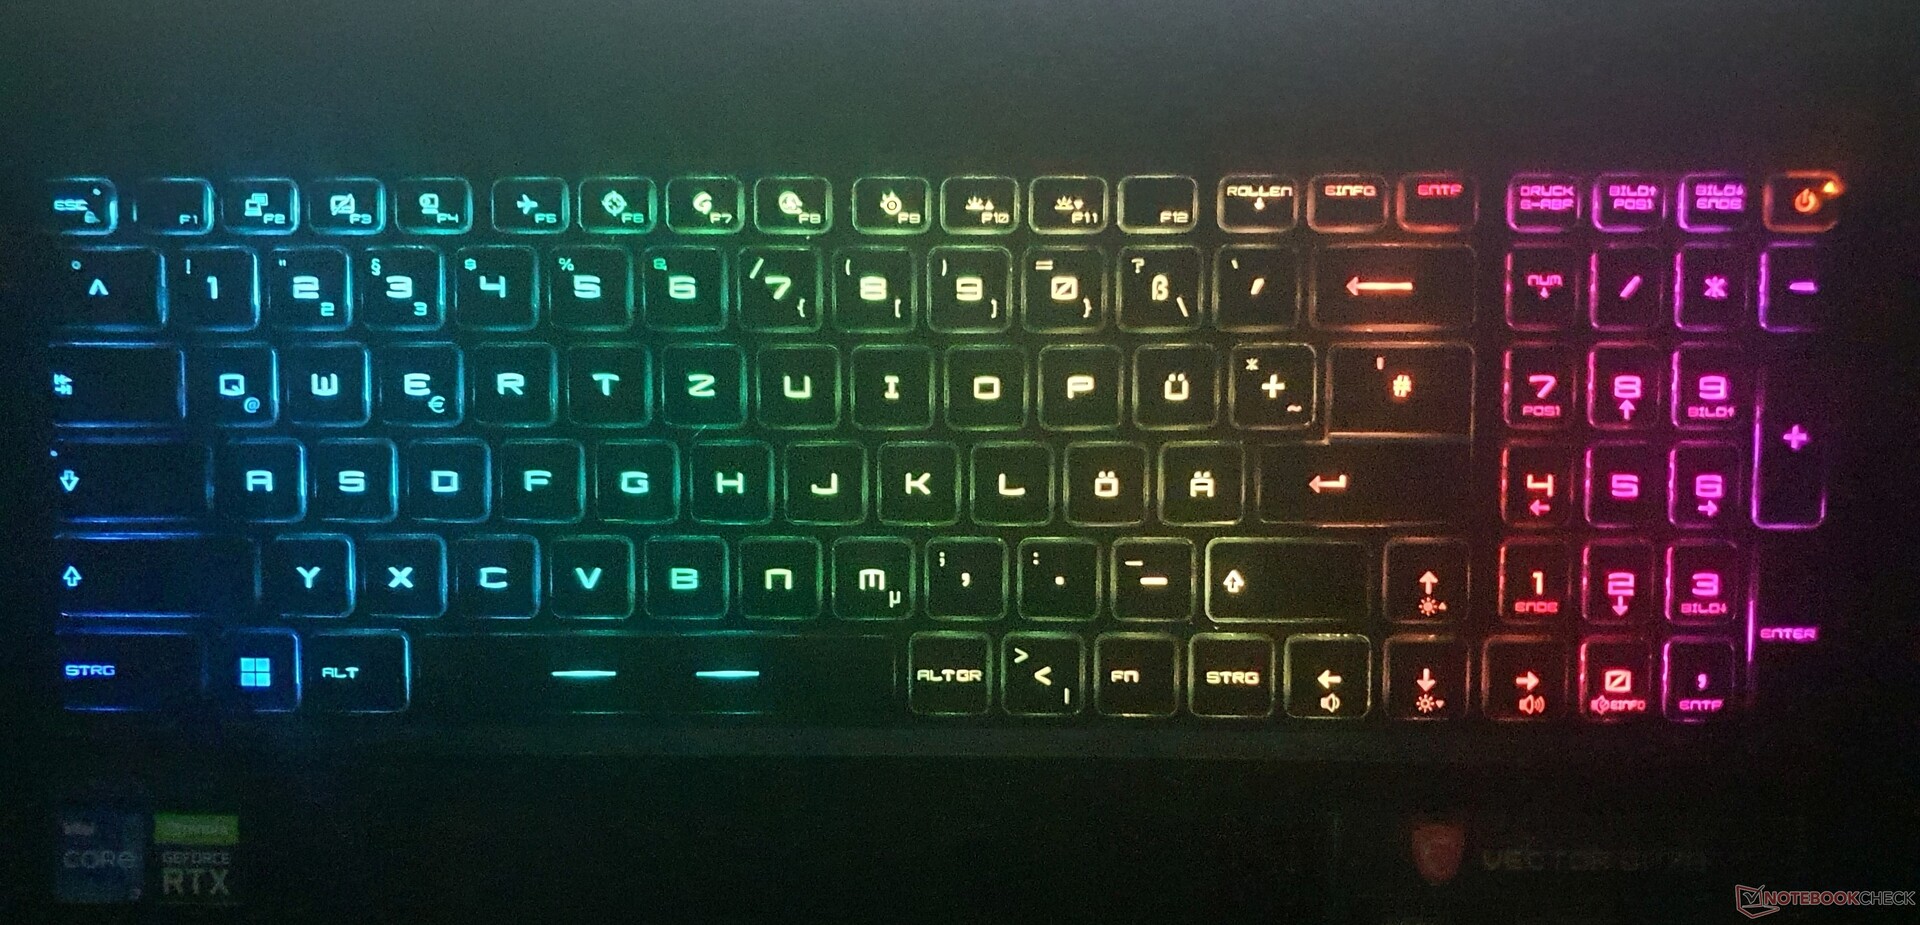
La tastiera SteelSeries, che non è cambiata da generazioni, offre tasti un po' più piccoli, ma con un punto di pressione moderato e una corsa media.
I testi più lunghi possono essere scritti senza problemi, anche se la corsa è un po' morbida. Ci sono alcune cose da notare sul layout: Come la maggior parte degli altri tasti, le frecce hanno una dimensione di 15x15 mm, ma il tasto Invio è diviso e i tasti Shift, Blocco numeri e F sono più piccoli. La tastiera corrisponde quindi a quella del mercato statunitense con l'etichettatura DE adattata. Alcuni tasti funzione hanno anche una doppia funzione.
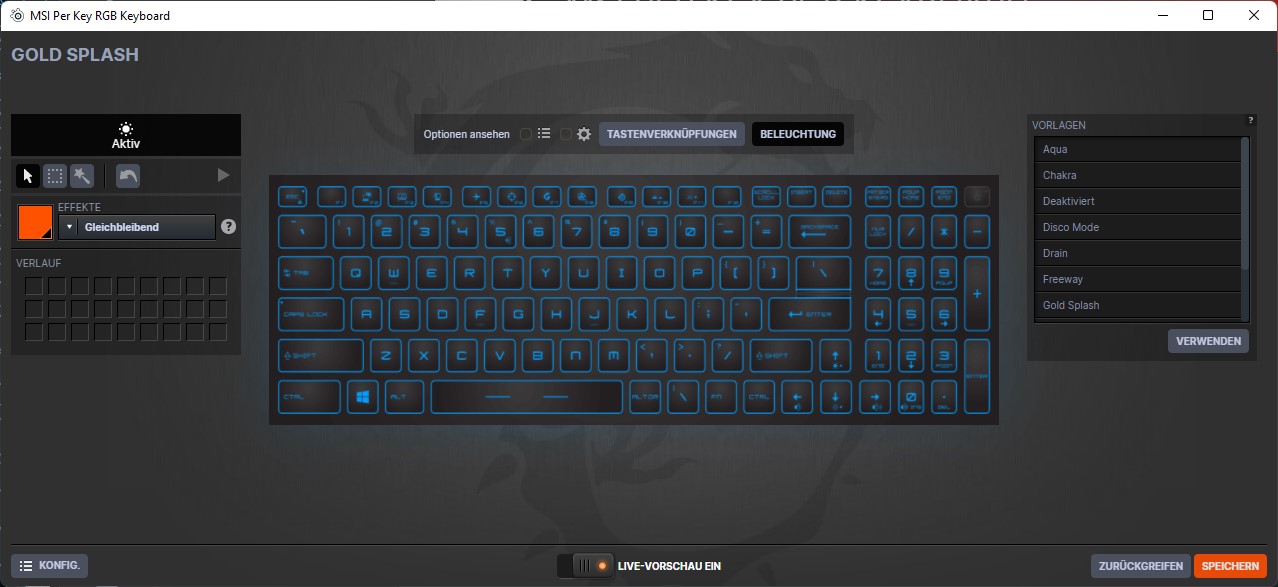
Un vantaggio è il basso livello di rumore. Grazie all'anti-ghosting, è possibile premere fino a 10 tasti contemporaneamente e la retroilluminazione dei singoli tasti può essere configurata con il software "SteelSeries Engine 3".
Touchpad

Il touchpad misura 10,5 x 6,5 cm e non è quindi il più grande, ma la qualità di scorrimento è molto buona e funziona in modo preciso. Tuttavia, i pulsanti integrati funzionano solo con una forte pressione e non offrono un feedback ottimale. Detto questo, ci sono clickpad molto peggiori sul mercato.
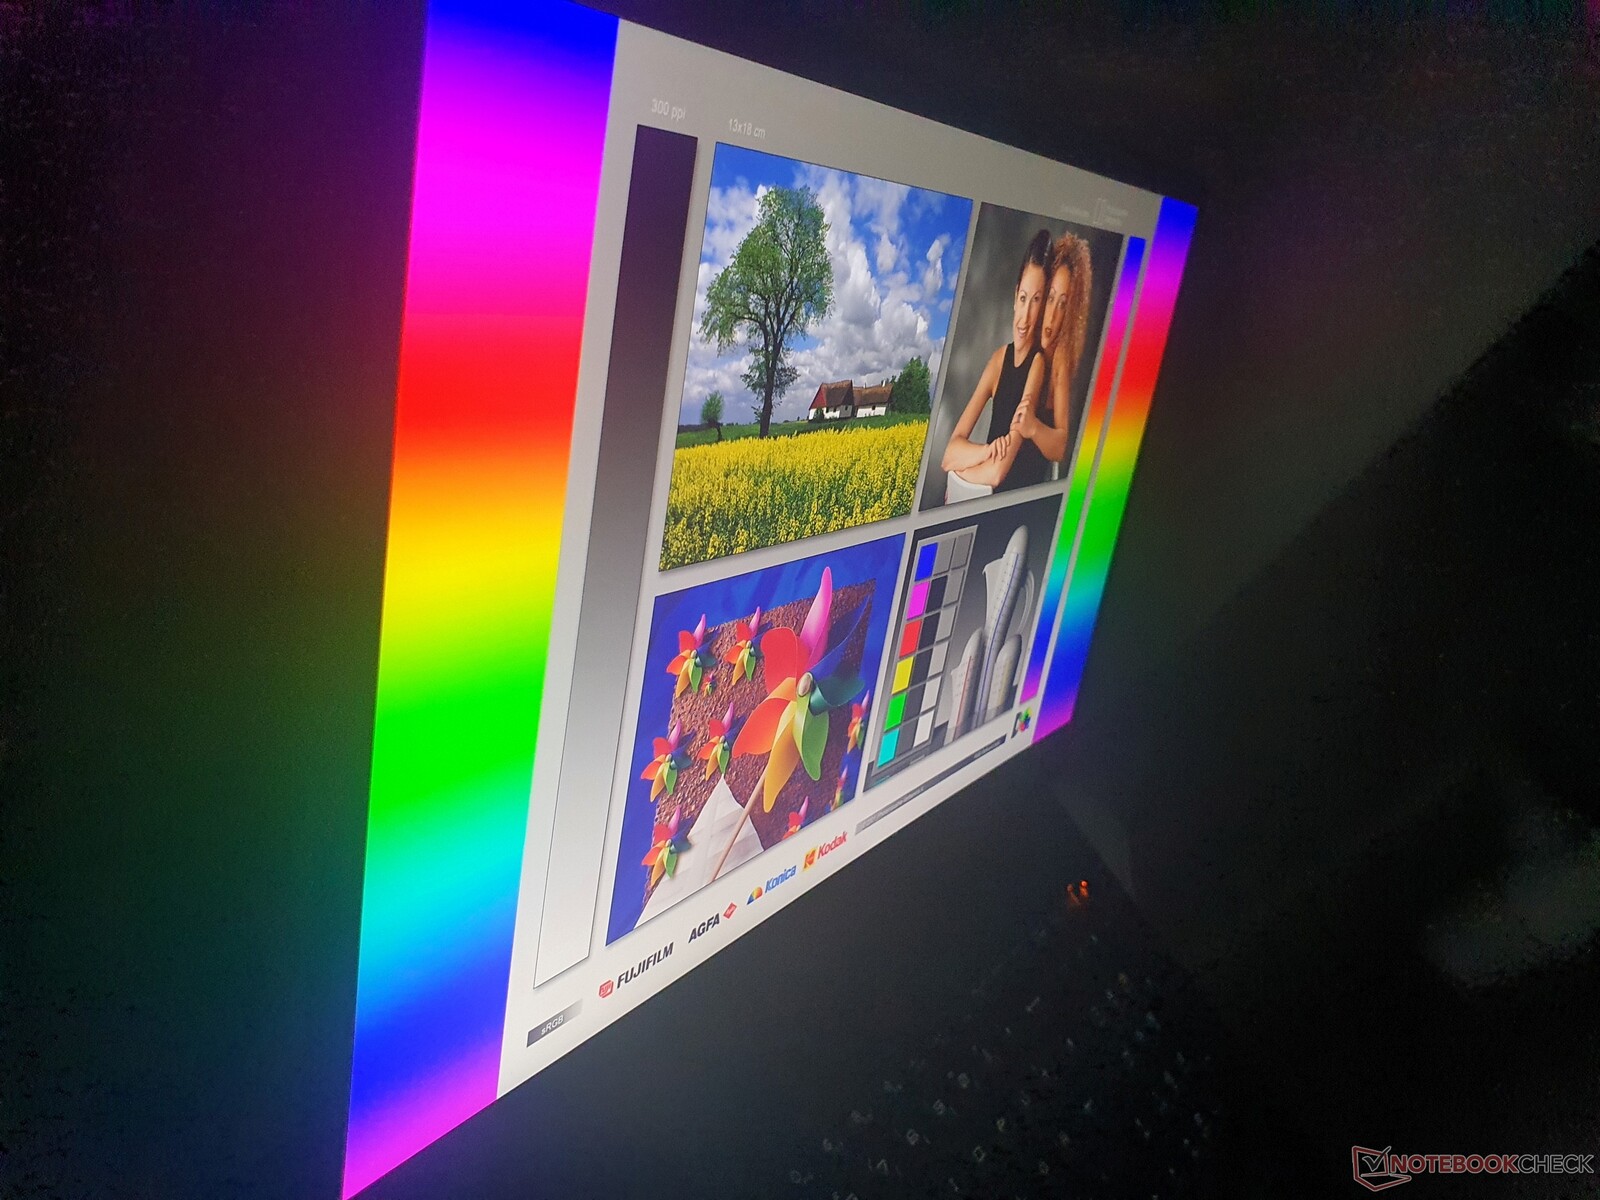
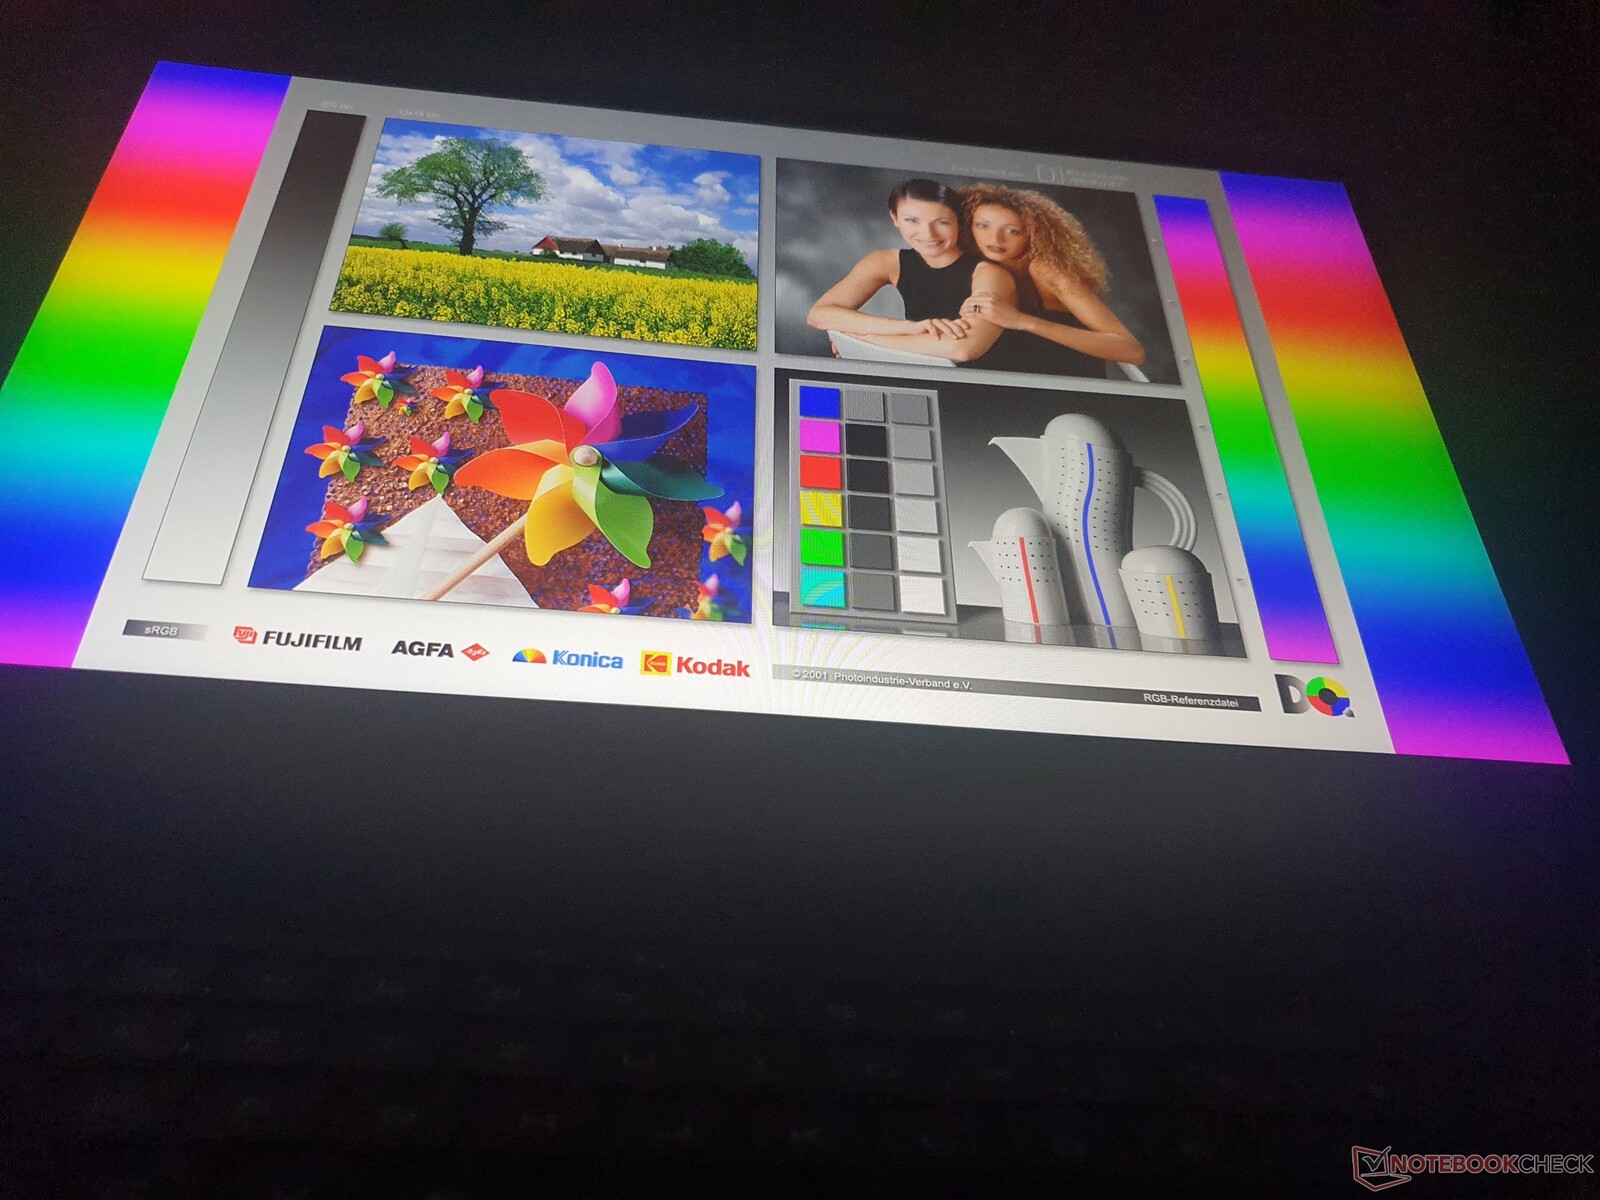
Display: Rapido a 360 Hz e da grigio a grigio di 4 ms su Vector GP76

Il display IPS opaco da 17,3 pollici in formato 16:9 offre una luminosità mediocre di 264 cd/m², che si rivela sufficiente per l'uso in interni. La risoluzione 1920x1080 (Full HD) è l'unica offerta da MSI nella serie Vector ed è sufficientemente nitida a patto di non avvicinare il naso al display. Anche le immagini sono molto nitide e chiare, grazie alla buona qualità dei subpixel.
Il contrasto di 1.096:1 è accettabile e il valore del nero buono di 0,25 risulta in un nero ricco. Mentre il campo di confronto è generalmente di livello simile, il più piccolo Vector GP66 (insieme al suo predecessore) è ancora più luminoso con 324 cd/m². Tuttavia, il Legion 5 Pro e Zephyrus M16superano la concorrenza con poco meno di 500 cd/m² e sono quindi adatti anche all'uso esterno.
In termini di tempi di risposta, nulla può competere con il GP76: Oltre alla velocissima frequenza di aggiornamento di 360 Hz, un segnale da grigio a grigio richiede solo 4 ms e da nero a bianco è ancora un ottimo 8 ms. La concorrenza si colloca tra i 15 e i 27 ms per il passaggio da grigio a grigio. Nel complesso, il pannello corrisponde alle specifiche di fascia alta appropriate per i giochi. Il predecessore utilizza un pannello da 144 Hz.
Tuttavia, non è presente il G-Sync interno. L'Adaptive Sync è supportato da un monitor esterno tramite DisplayPort. Non è stato rilevato alcuno sfarfallio PWM
| |||||||||||||||||||||||||
Distribuzione della luminosità: 87 %
Al centro con la batteria: 270 cd/m²
Contrasto: 1096:1 (Nero: 0.25 cd/m²)
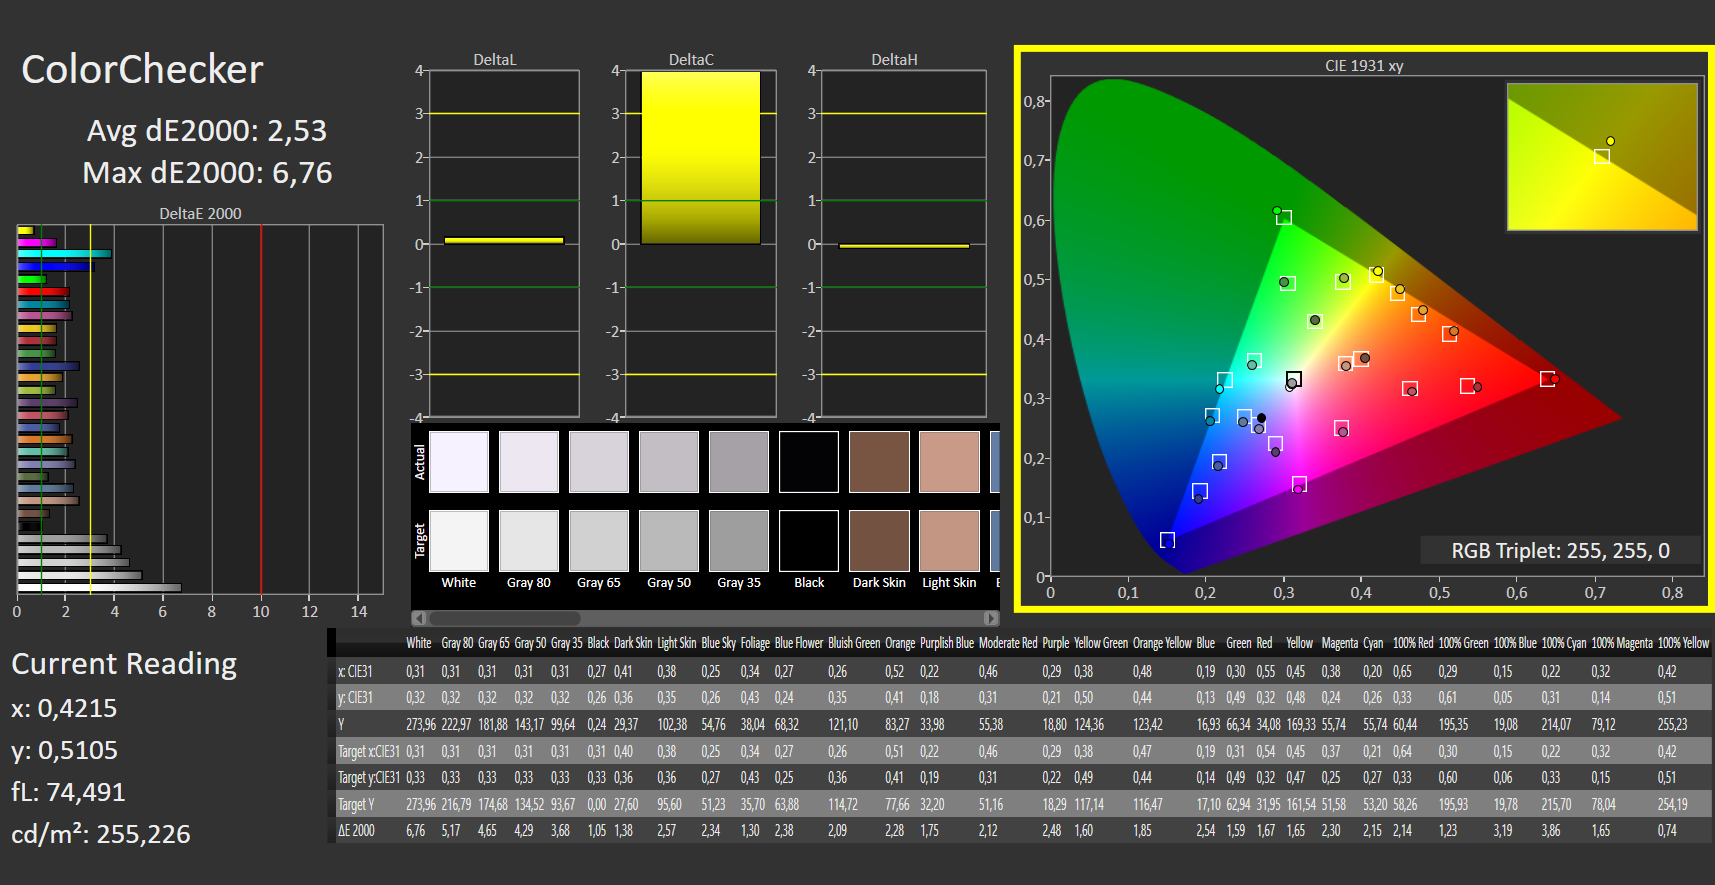
ΔE ColorChecker Calman: 2.53 | ∀{0.5-29.43 Ø4.73}
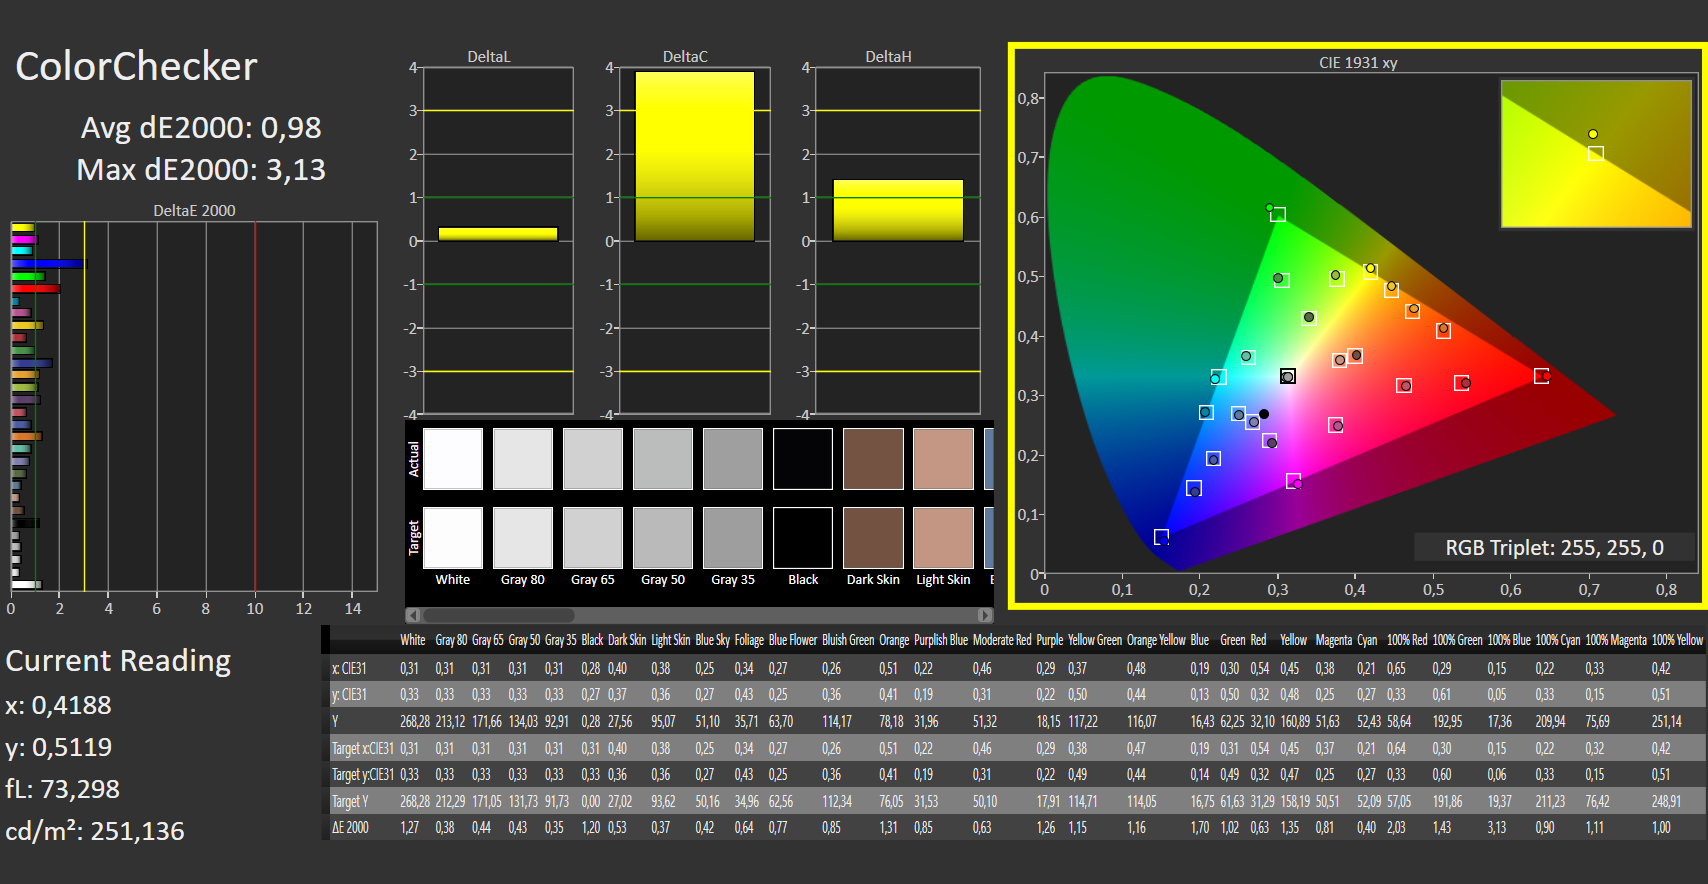
calibrated: 0.98
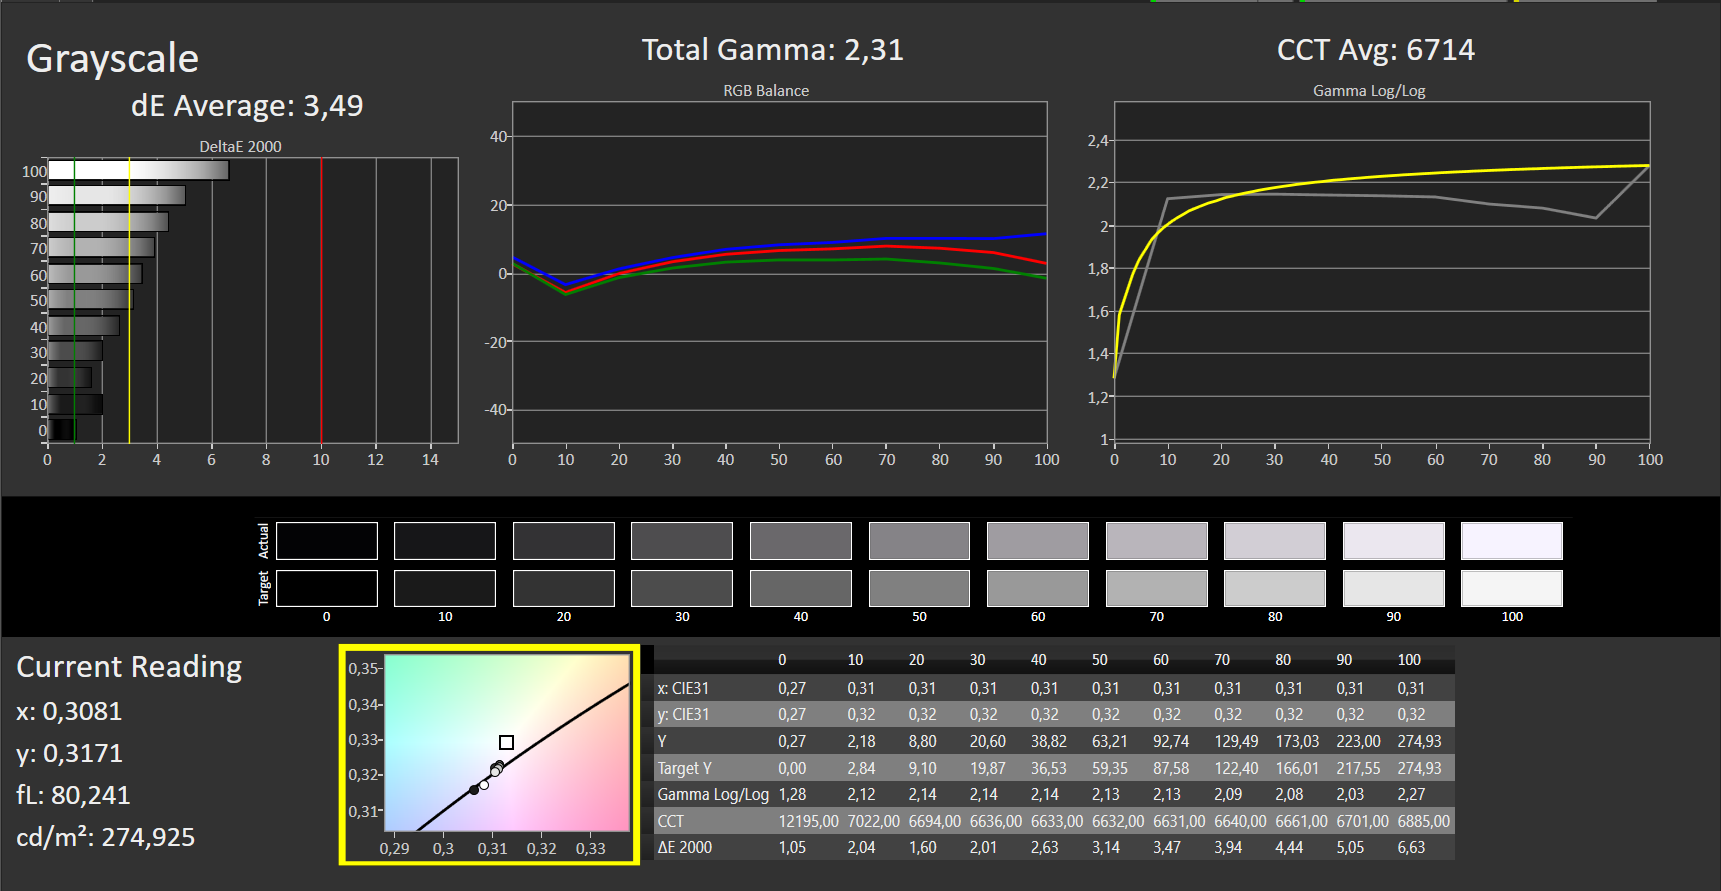
ΔE Greyscale Calman: 3.49 | ∀{0.09-98 Ø4.97}
70.91% AdobeRGB 1998 (Argyll 3D)
98.98% sRGB (Argyll 3D)
70.09% Display P3 (Argyll 3D)
Gamma: 2.31
CCT: 6714 K
| MSI Vector GP76 12UGS-434 AUO B173HAN05.4, IPS, 1920x1080, 17.3" | MSI GP76 Leopard 10UG Chi Mei CMN176E, IPS, 1920x1080, 17.3" | Asus ROG Strix G17 G713QE-RB74 AU Optronics B173HAN04.9, IPS, 1920x1080, 17.3" | Aorus 17 XE4 Sharp LQ173M1JW12, IPS, 1920x1080, 17.3" | Schenker XMG NEO 17 GM7TG8S BOE0977 (NE173QHM-NY2), IPS, 2560x1440, 17.3" | Lenovo Legion 5 Pro 16 G7 i7 RTX 3070Ti NE160QDM-NY1, IPS, 2560x1600, 16" | Asus ROG Zephyrus M16 GU603H AU Optronics AUOC199, IPS, 2560x1600, 16" | MSI Vector GP66 12UGS BOE NE156FHM-NZ3, IPS, 1920x1080, 15.6" | |
|---|---|---|---|---|---|---|---|---|
| Display | -6% | -41% | -1% | -3% | -1% | 1% | ||
| Display P3 Coverage (%) | 70.09 | 64.7 -8% | 40.2 -43% | 69 -2% | 67.1 -4% | 68.7 -2% | 70.1 0% | |
| sRGB Coverage (%) | 98.98 | 96.4 -3% | 60.3 -39% | 99.4 0% | 96.3 -3% | 97.6 -1% | 99.5 1% | |
| AdobeRGB 1998 Coverage (%) | 70.91 | 66.9 -6% | 41.6 -41% | 71.2 0% | 68.6 -3% | 70.9 0% | 72.1 2% | |
| Response Times | -60% | -355% | -160% | -145% | -168% | 3% | -33% | |
| Response Time Grey 50% / Grey 80% * (ms) | 4 ? | 7.4 ? -85% | 26.8 ? -570% | 15.2 ? -280% | 15.2 -280% | 17.6 ? -340% | 4.8 ? -20% | 5.8 ? -45% |
| Response Time Black / White * (ms) | 8 ? | 10.8 ? -35% | 19.2 ? -140% | 11.2 ? -40% | 8.8 -10% | 7.6 ? 5% | 6 ? 25% | 9.6 ? -20% |
| PWM Frequency (Hz) | 24510 ? | |||||||
| Screen | 14% | -30% | 8% | 11% | 17% | -19% | 0% | |
| Brightness middle (cd/m²) | 274 | 328 20% | 270.5 -1% | 274 0% | 396 45% | 502 83% | 448 64% | 353.1 29% |
| Brightness (cd/m²) | 264 | 314 19% | 269 2% | 267 1% | 366 39% | 491 86% | 446 69% | 325 23% |
| Brightness Distribution (%) | 87 | 87 0% | 92 6% | 82 -6% | 82 -6% | 91 5% | 86 -1% | 85 -2% |
| Black Level * (cd/m²) | 0.25 | 0.29 -16% | 0.19 24% | 0.25 -0% | 0.45 -80% | 0.37 -48% | 0.48 -92% | 0.38 -52% |
| Contrast (:1) | 1096 | 1131 3% | 1424 30% | 1096 0% | 880 -20% | 1357 24% | 933 -15% | 929 -15% |
| Colorchecker dE 2000 * | 2.53 | 1.93 24% | 4.39 -74% | 2.07 18% | 1.43 43% | 2.7 -7% | 2.76 -9% | 2.24 11% |
| Colorchecker dE 2000 max. * | 6.76 | 4.94 27% | 20.8 -208% | 4.89 28% | 2.2 67% | 4.5 33% | 7.09 -5% | 5 26% |
| Colorchecker dE 2000 calibrated * | 0.98 | 0.68 31% | 1.56 -59% | 0.83 15% | 1.34 -37% | 1.4 -43% | 2.86 -192% | 1.02 -4% |
| Greyscale dE 2000 * | 3.49 | 2.8 20% | 3.1 11% | 3 14% | 1.8 48% | 2.7 23% | 3.1 11% | 4 -15% |
| Gamma | 2.31 95% | 2.18 101% | 2.14 103% | 2.207 100% | 2.4 92% | 2.44 90% | 2.153 102% | 2.24 98% |
| CCT | 6714 97% | 7023 93% | 6927 94% | 6999 93% | 6489 100% | 6326 103% | 6826 95% | 6864 95% |
| Color Space (Percent of AdobeRGB 1998) (%) | 67 | 87 | ||||||
| Color Space (Percent of sRGB) (%) | 89 | 100 | ||||||
| Media totale (Programma / Settaggio) | -17% /
-1% | -142% /
-79% | -51% /
-18% | -46% /
-14% | -51% /
-13% | -8% /
-15% | -11% /
-4% |
* ... Meglio usare valori piccoli
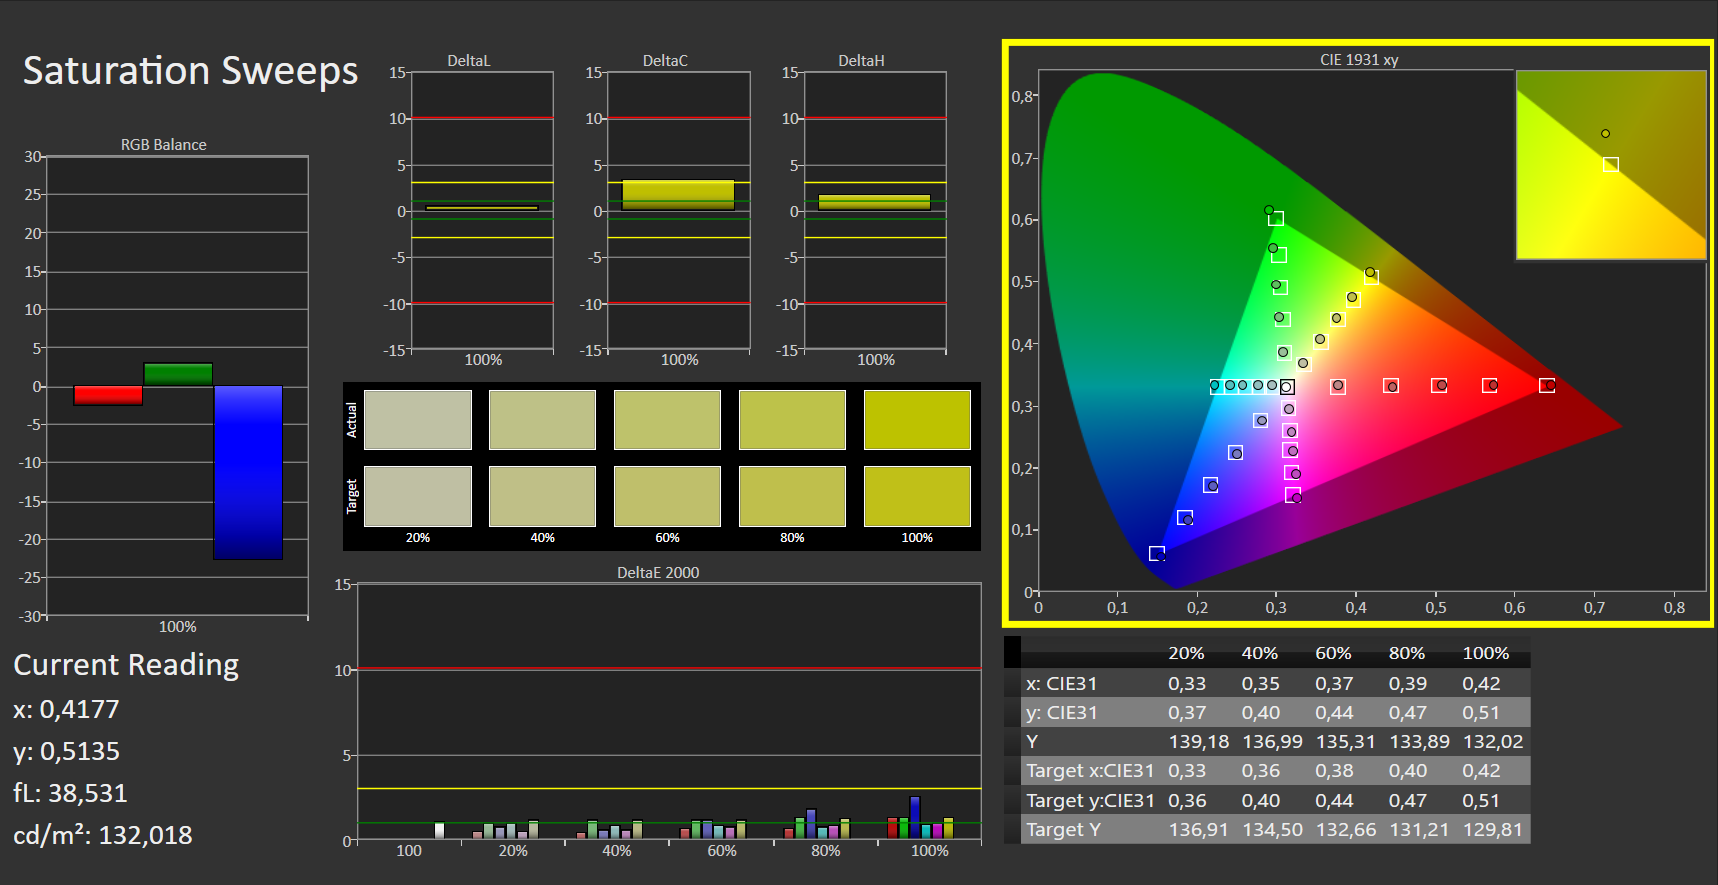
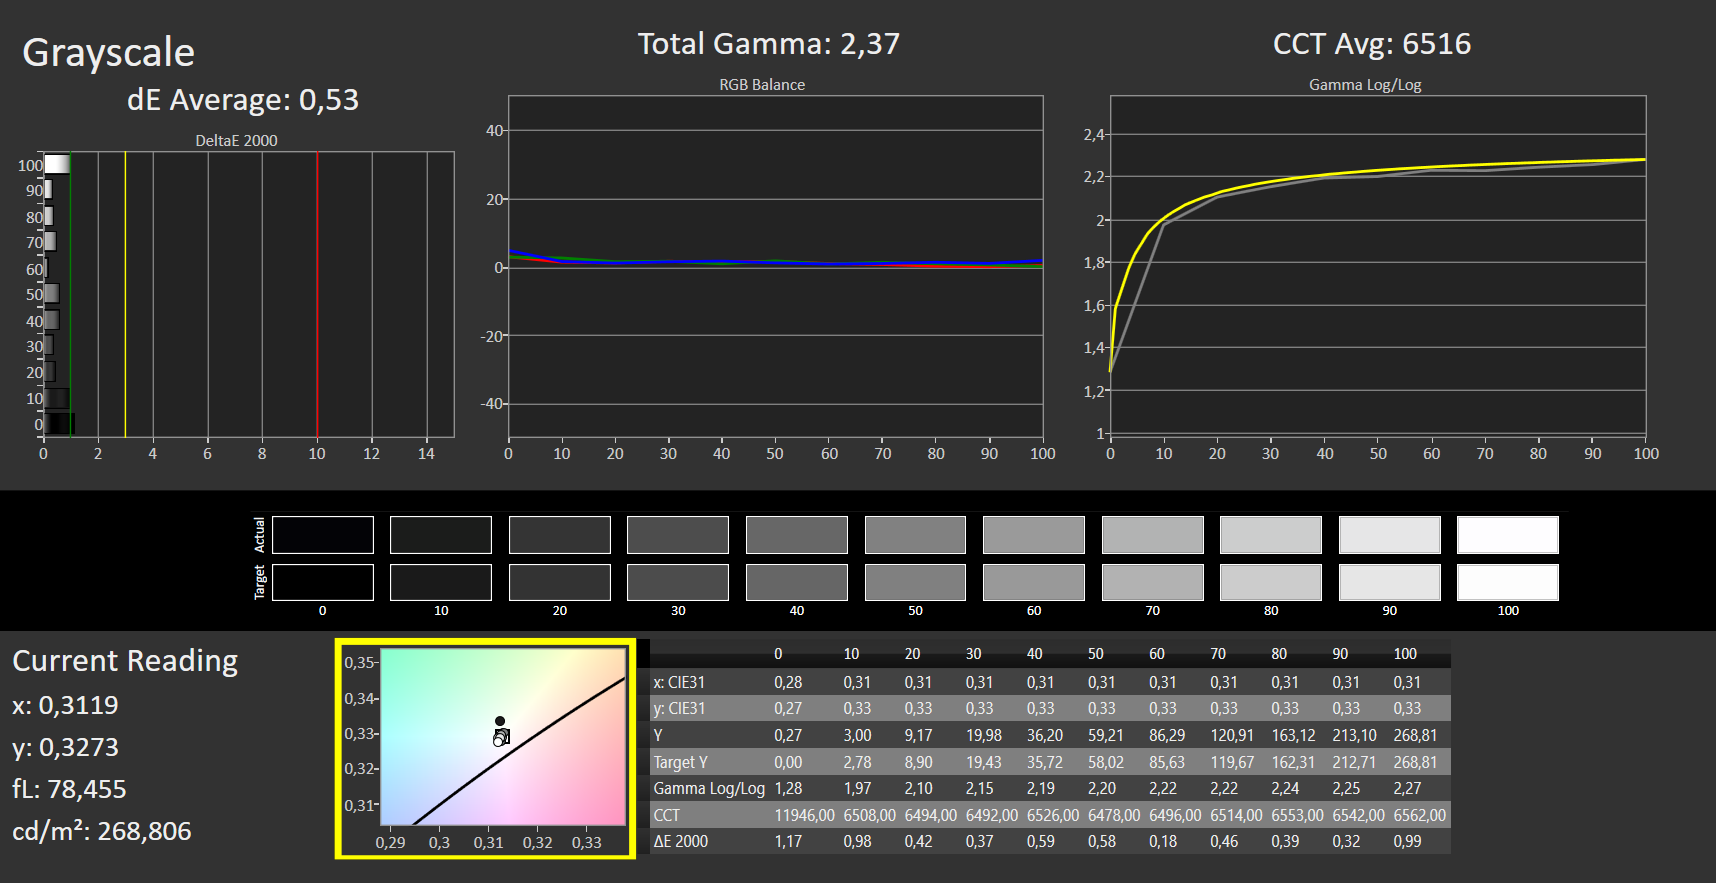
La gamma di colori sRGB è coperta molto bene, con una percentuale di poco inferiore al 99%. Per DCI-P3 e AdobeRGB, la copertura è compresa tra il 70 e il 71%, un valore sufficiente per questa classe di notebook. Il valore DeltaE di 2,54 è leggermente al di sopra della soglia di 2 e quindi in linea con la concorrenza.
La calibrazione migliora i valori, ma il blu leggermente sottorappresentato può essere solo leggermente ottimizzato. Anche la percezione soggettiva del colore testimonia toni cromatici relativamente non adulterati, che appaiono molto ricchi, ma non particolarmente sovrasaturi. Il file ICC della calibrazione è disponibile per il download nella finestra accanto al grafico di copertura.

Tempi di risposta del Display
| ↔ Tempi di risposta dal Nero al Bianco | ||
|---|---|---|
| 8 ms ... aumenta ↗ e diminuisce ↘ combinato | ↗ 4 ms Incremento |  |
| ↘ 4 ms Calo | ||
| Lo schermo mostra veloci tempi di risposta durante i nostri tests e dovrebbe esere adatto al gaming In confronto, tutti i dispositivi di test variano da 0.1 (minimo) a 240 (massimo) ms. » 22 % di tutti i dispositivi è migliore. Questo significa che i tempi di risposta rilevati sono migliori rispettto alla media di tutti i dispositivi testati (19.9 ms). | ||
| ↔ Tempo di risposta dal 50% Grigio all'80% Grigio | ||
| 4 ms ... aumenta ↗ e diminuisce ↘ combinato | ↗ 1 ms Incremento |  |
| ↘ 3 ms Calo | ||
| Lo schermo ha mostrato valori di risposta molto veloci nei nostri tests ed è molto adatto per i gaming veloce. In confronto, tutti i dispositivi di test variano da 0.165 (minimo) a 636 (massimo) ms. » 15 % di tutti i dispositivi è migliore. Questo significa che i tempi di risposta rilevati sono migliori rispettto alla media di tutti i dispositivi testati (31.1 ms). | ||
Sfarfallio dello schermo / PWM (Pulse-Width Modulation)
| flickering dello schermo / PWM non rilevato |  | ||
In confronto: 52 % di tutti i dispositivi testati non utilizza PWM per ridurre la luminosita' del display. Se è rilevato PWM, una media di 7798 (minimo: 5 - massimo: 343500) Hz è stata rilevata. | |||
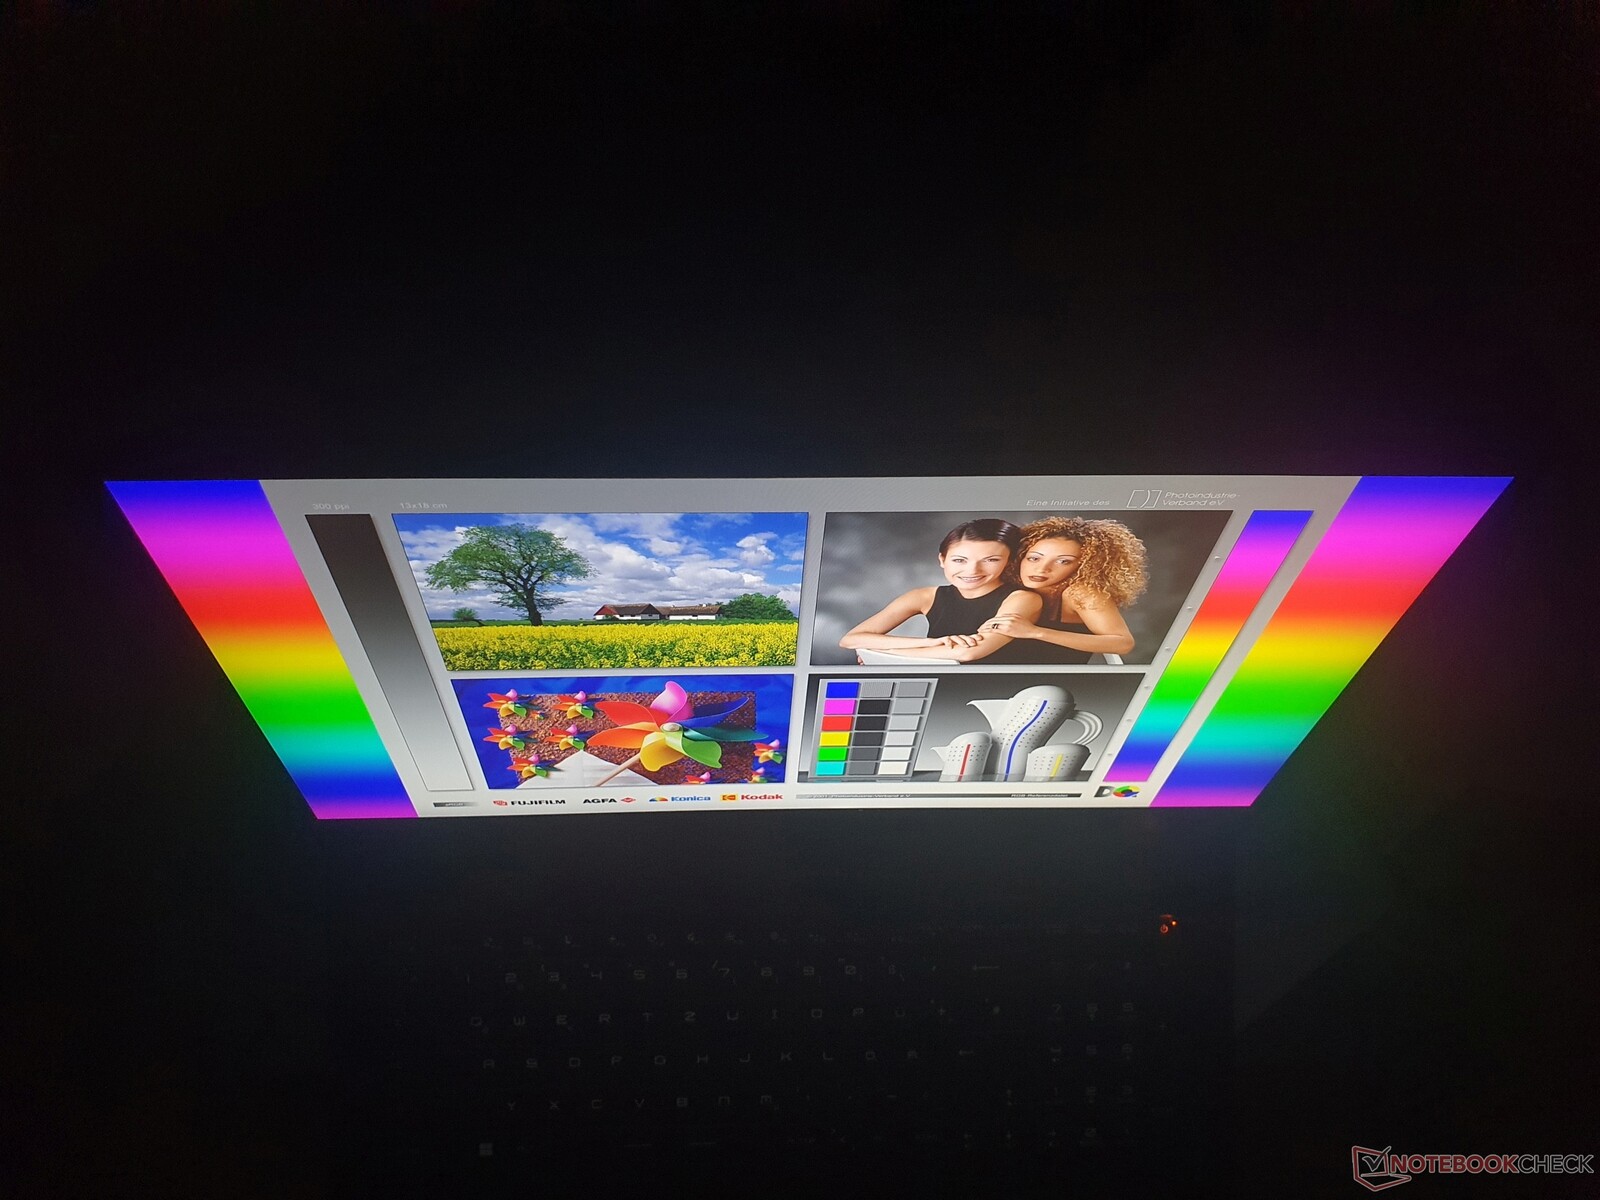
Se volete giocare all'aria aperta, dovete farlo all'ombra. Più di un LAN party sotto il padiglione non è possibile con una luminosità di 264 cd/m², anche con uno schermo opaco.
Gli angoli di visione sono buoni su tutti i display IPS, compreso il nostro modello di prova. Nessun desiderio rimane insoddisfatto. L'OLED, ad esempio, offre una stabilità dell'angolo di visione ancora migliore
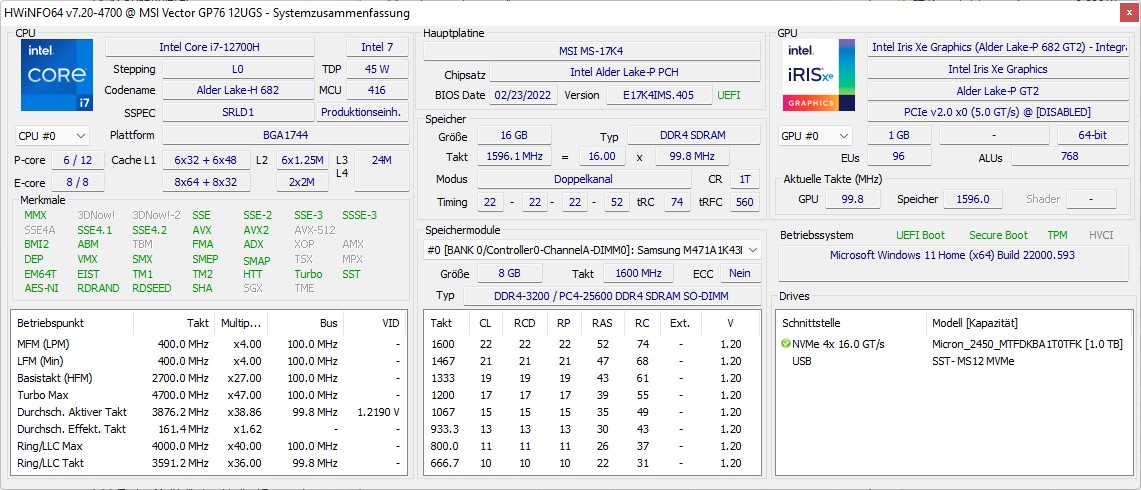
Prestazioni: MSI spinge al massimo la RTX 3070 Ti di GeForce
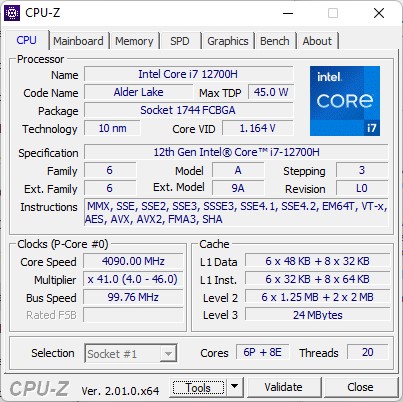
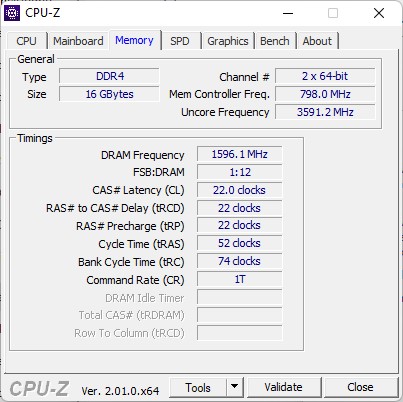
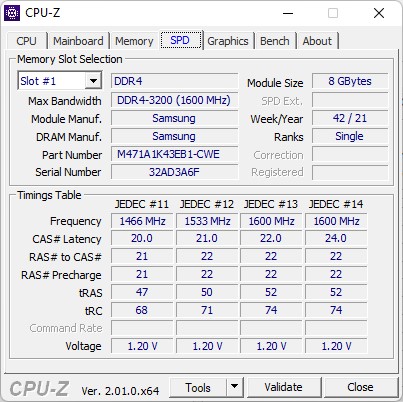
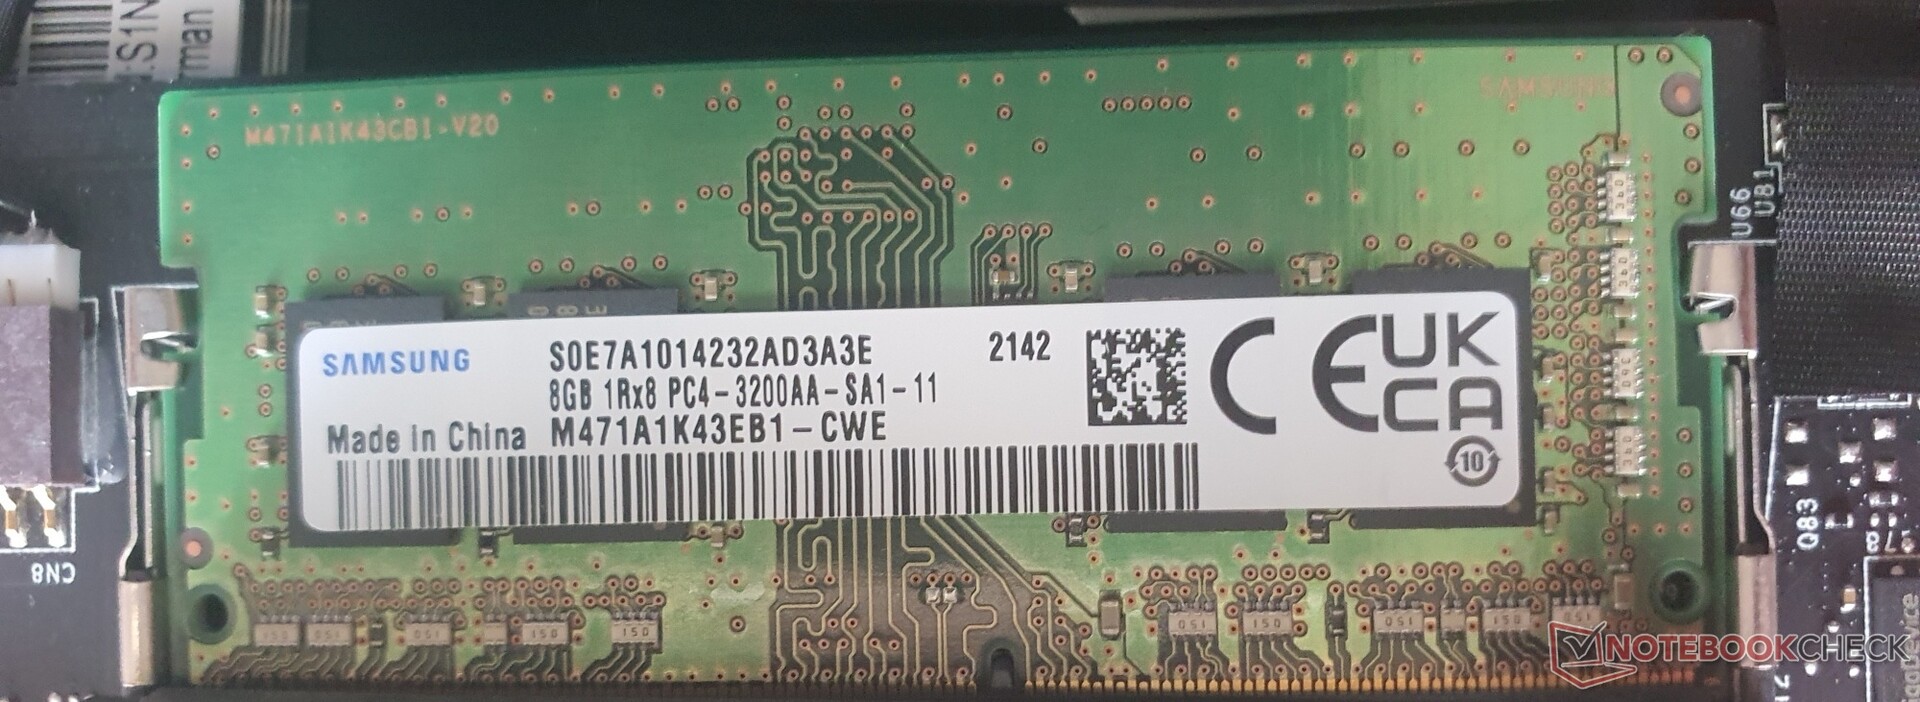
Per quanto riguarda la CPU, gli acquirenti interessati possono decidere tra ilCore i7-12700H o l'Intel i9-12900HK. Per quanto riguarda la grafica, c'è solo la Nvidia RTX 3070 Ti(150 W) e la RTX 3080 (non Ti, 165 W). La RAM viene sempre fornita come 2x 8GB DDR4-3200 dalla fabbrica (2x 16 GB in altre regioni del mondo).
La RAM DDR5, più veloce del 25% circa (vedi sotto: tabella di confronto AIDA), è riservata alle classi di fascia alta di MSI. Tuttavia, questo non ha un impatto negativo sulle applicazioni di gioco e di grafica professionale, a cui il Vector GP76 è destinato. Di serie c'è anche un'unità SSD PCIe4x4 da 1 TB, le cui prestazioni sono testate di seguito.
Condizioni di prova
Abbiamo testato l'MSI Vector GP76 in modalità Auto. Naturalmente, abbiamo anche testato le prestazioni in modalità Extreme Performance, ma nel mezzo abbiamo riscontrato il seguente problema con il controllo delle ventole:
Le ventole funzionavano solo a una velocità molto bassa anche a pieno carico, il che portava a un surriscaldamento del sistema con conseguente grave throttling, fino a rendere il sistema inutilizzabile. Conosciamo già questo errore nei portatili da gioco MSI, che è stato risolto in precedenza con gli aggiornamenti del BIOS e del CE.
Poiché a questo punto stavamo già utilizzando il BIOS più recente, siamo riusciti a risolvere temporaneamente il problema premendo due volte il pulsante "Turbo Fan", ma il problema si è ripresentato poco dopo, per cui non abbiamo potuto completare i test in modalità Extreme Performance.
Tuttavia, questa modalità non ha alcuna influenza sulle prestazioni pure della CPU, mentre è possibile ottenere circa il 7% di prestazioni in più nei giochi. Witcher 3 e PCMark 10 sono comunque riusciti a funzionare in modalità Extreme Performance. Si può anche dare un'occhiata al modello MSI Vector GP66 che abbiamo recensito di recente, che è stato testato completamente in modalità Extreme Performance e ha generato valori molto simili. Anche i benchmark della GPU sono stati eseguiti in modalità GPU discreta.
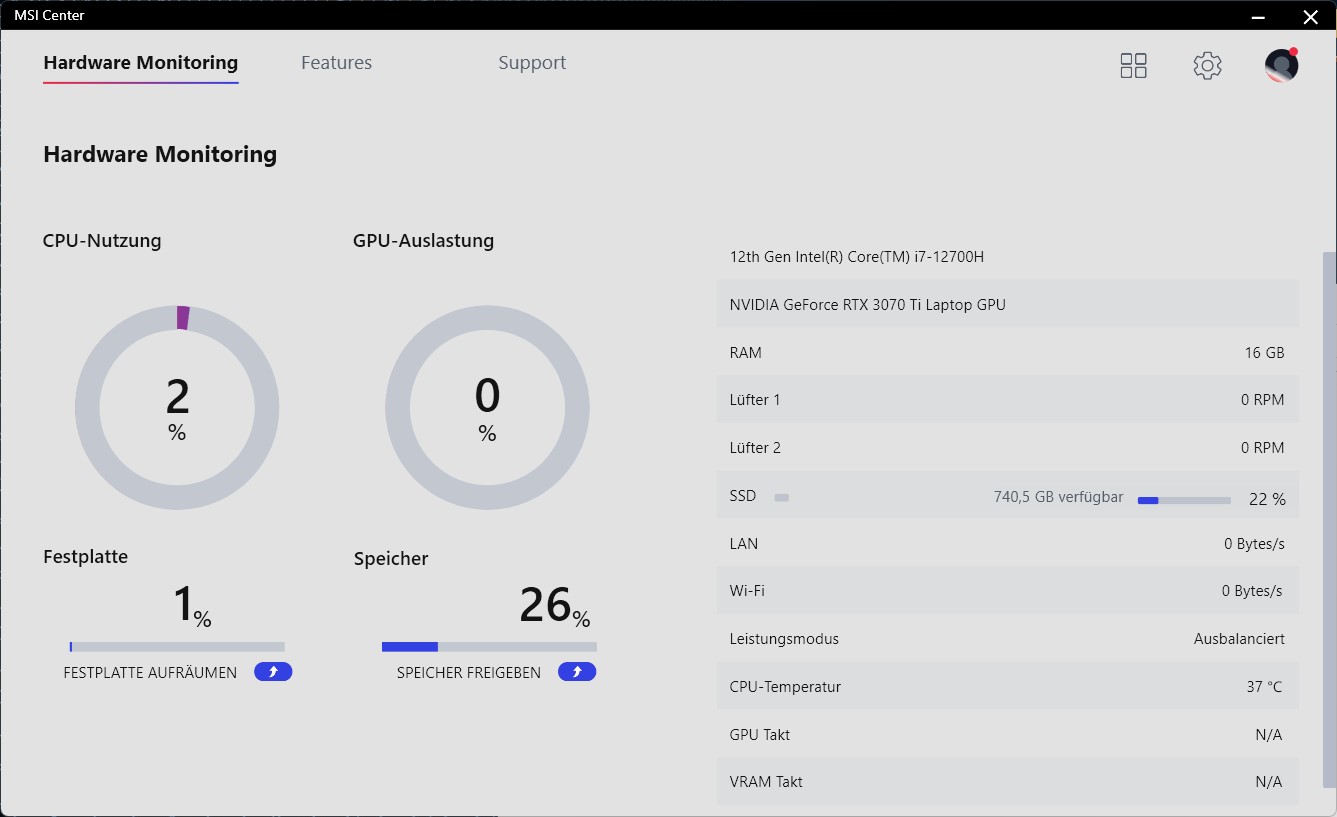
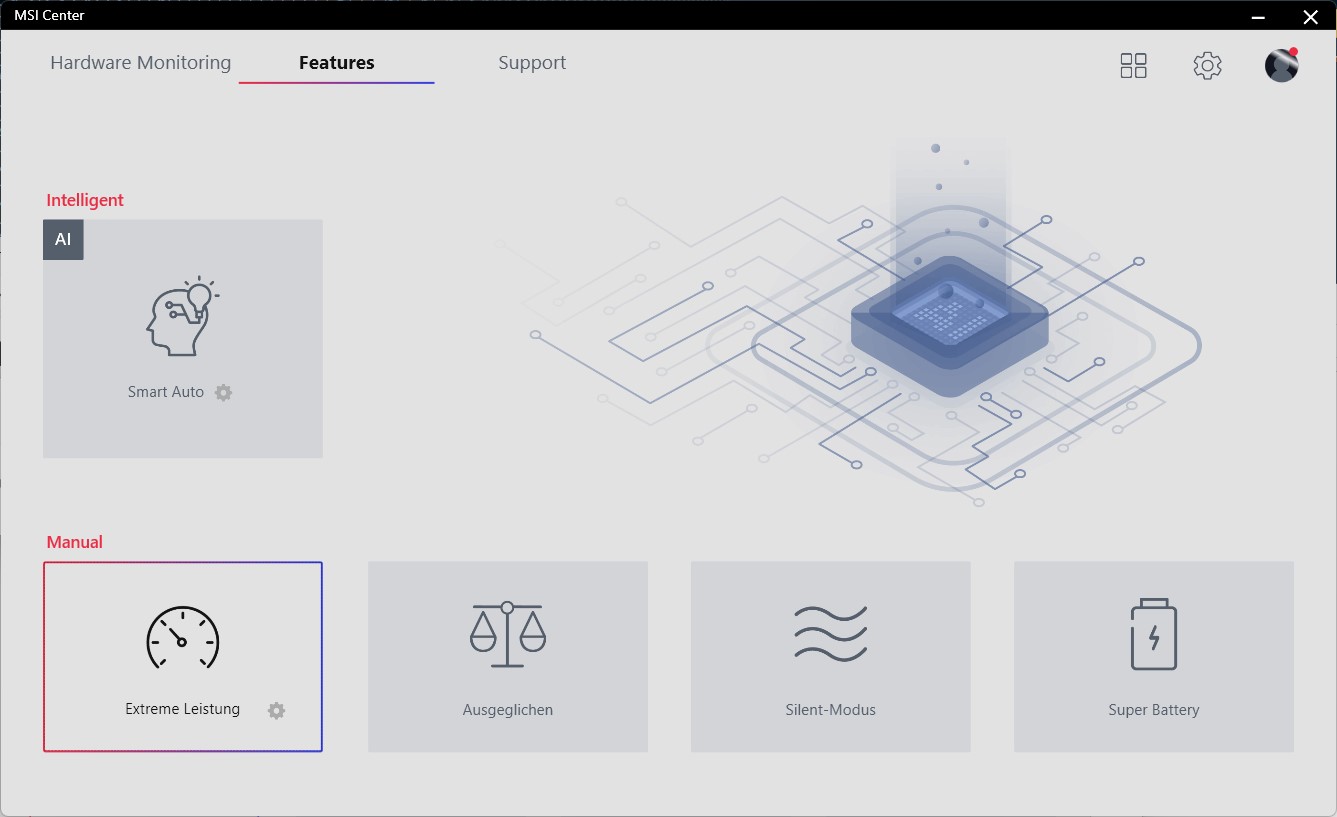
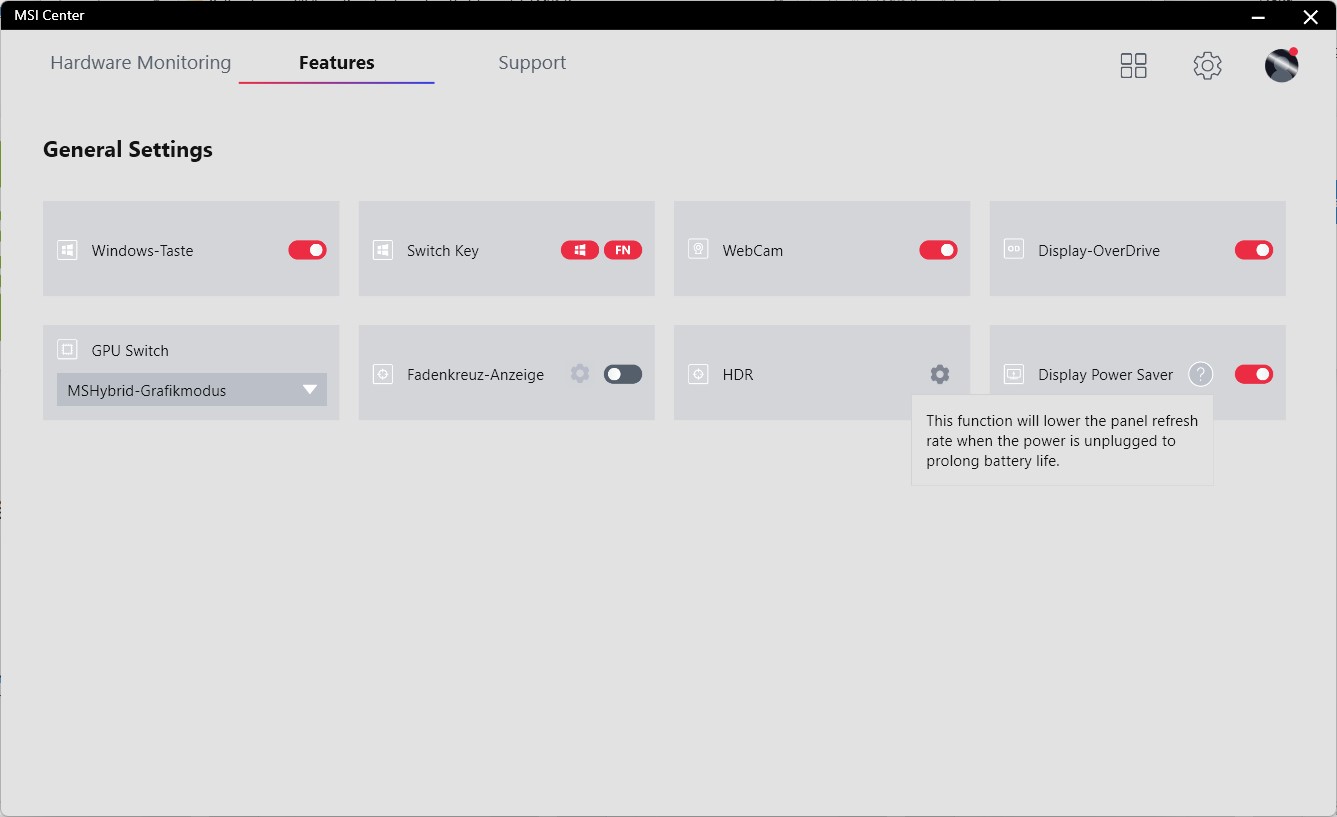
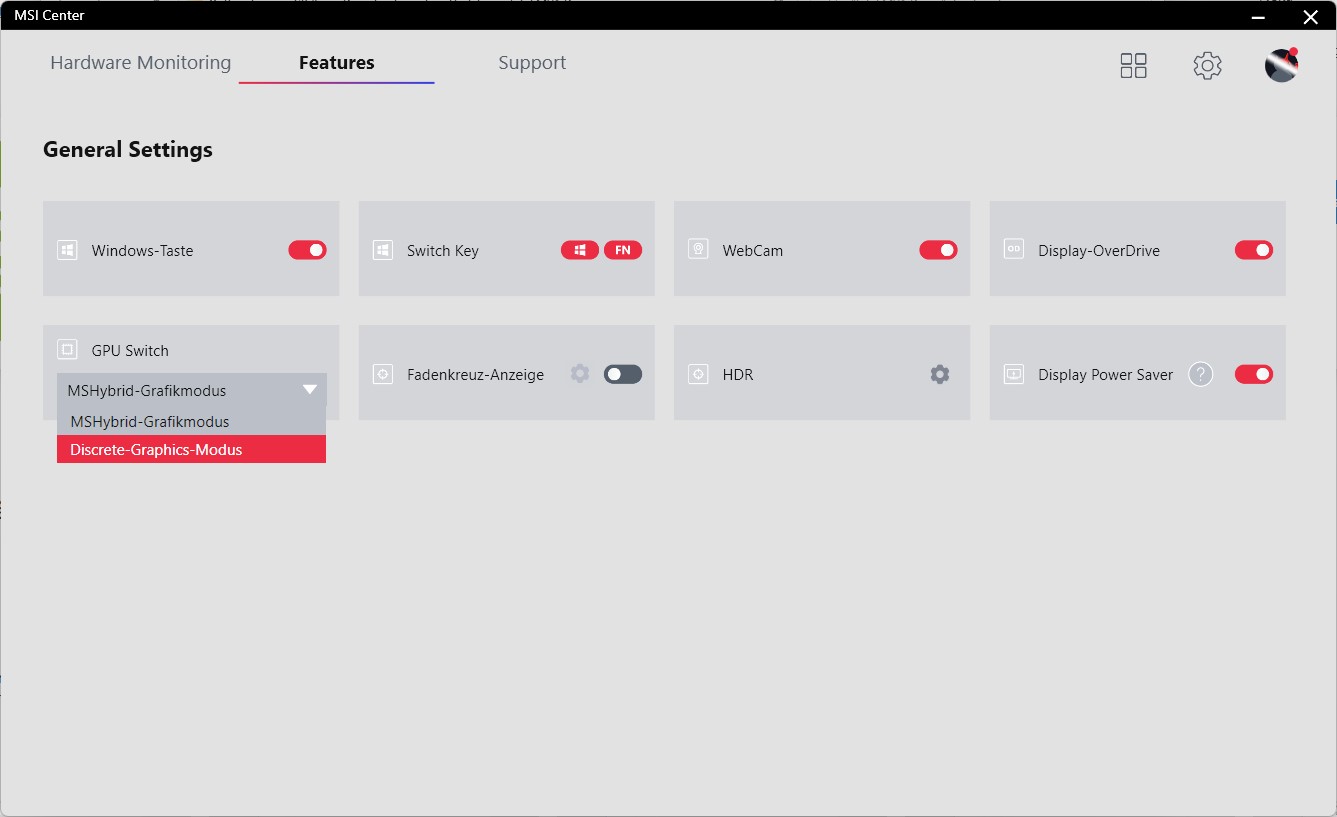
MSI Center:
L'MSI Center offre una serie di impostazioni oltre alle quattro modalità "Extreme Performance", "Balanced", "Silent" e "Super Battery", come l'interruttore MUX e una funzione che consente di passare a una frequenza di aggiornamento di 60 Hz in modalità batteria per risparmiare energia.
| Szenario | Modalità Silenziosa | Modalità Auto | Estremamente efficace. | Batteria |
|---|---|---|---|---|
| CPU-Last | 30 Watt | 45 Watt | 70 Watt | 15 Watt |
| GPU-Last | 125 Watt | 125 Watt | 150 Watt | 35 Watt |
| Stresstest | CPU: 30 Watt | CPU: 50 Watt | CPU: 70 Watt | |
| GPU: 35 Watt | GPU: 120 Watt | GPU: 150 Watt |
Processore
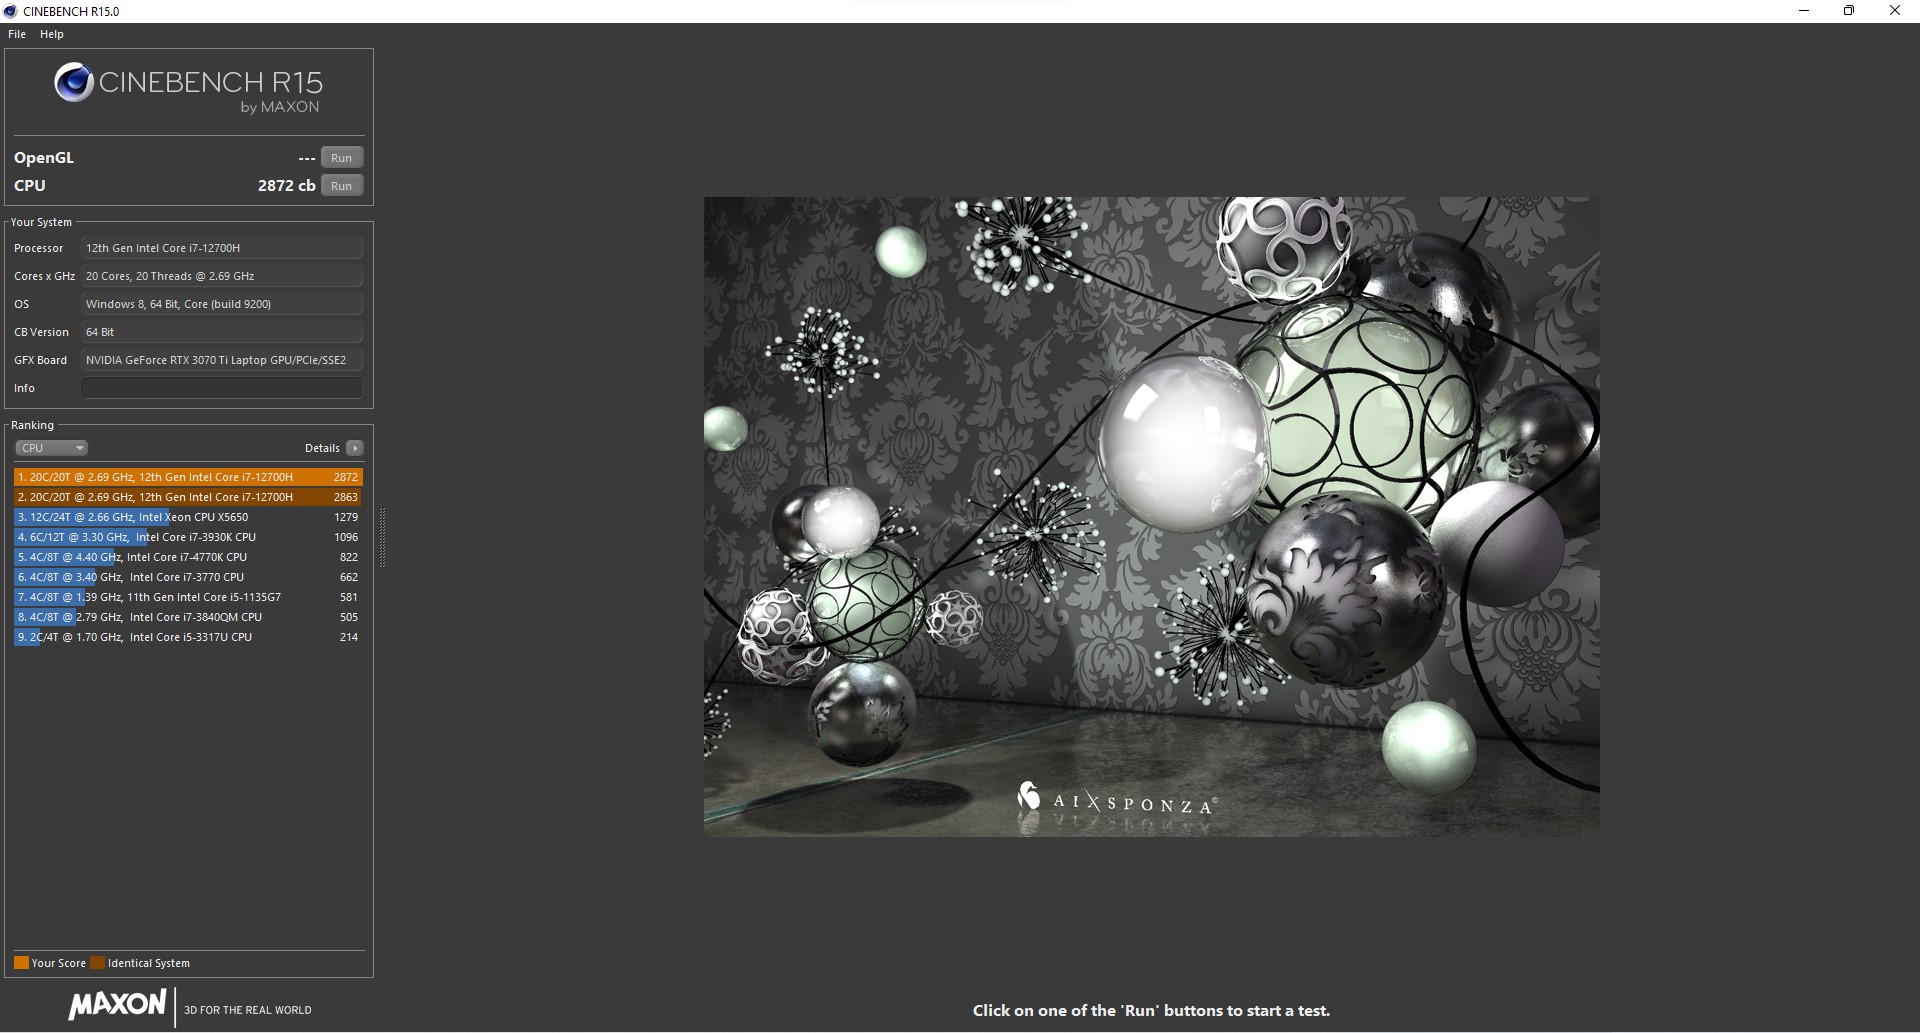
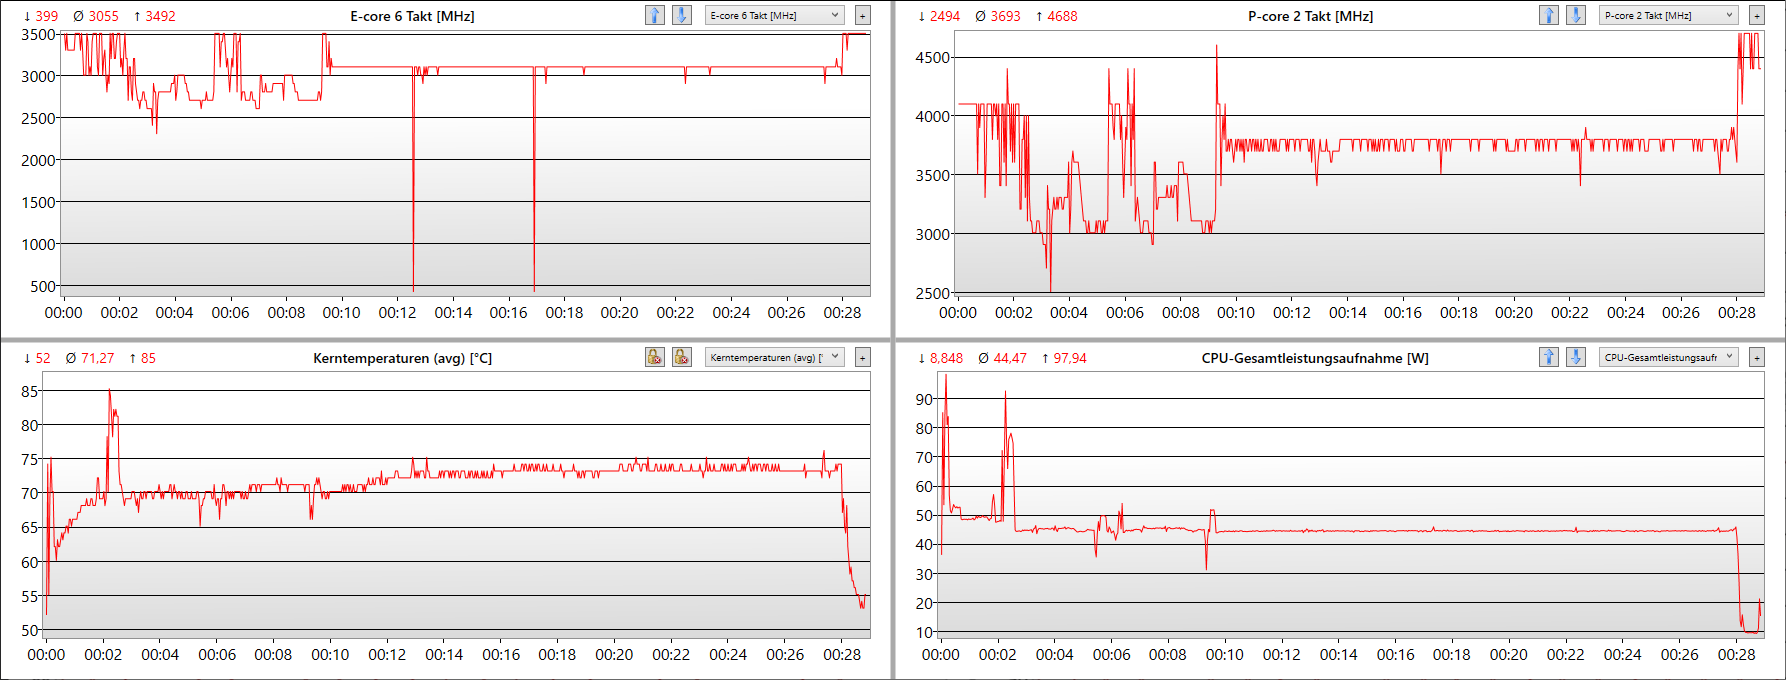
Il Core i7-12700Hè circa due volte più veloce del suo predecessore sotto carico sostenuto e non è inferiore al Core i9-12900H. Solo Legion 5 Pro di Lenovo di Lenovo è più veloce, poiché non ha un blocco del TDP e può consumare 127 watt in modo continuo. Il Core i7 del Vector GP76, invece, passa da 100 watt a 45 watt dopo poco tempo, come mostra il ciclo di Cinebench R15. Le prestazioni si riducono quindi del 20%.
La frequenza di clock dei core ad alte prestazioni è stabile a 3,7 GHz e le temperature si aggirano intorno ai 74°C. In termini di carico puro del processore, il sistema di raffreddamento ha un ampio margine di miglioramento. In modalità Extreme Performance, la CPU è sottoposta a 70 watt, il che non migliora realmente i risultati, almeno non in Cinebench R15.
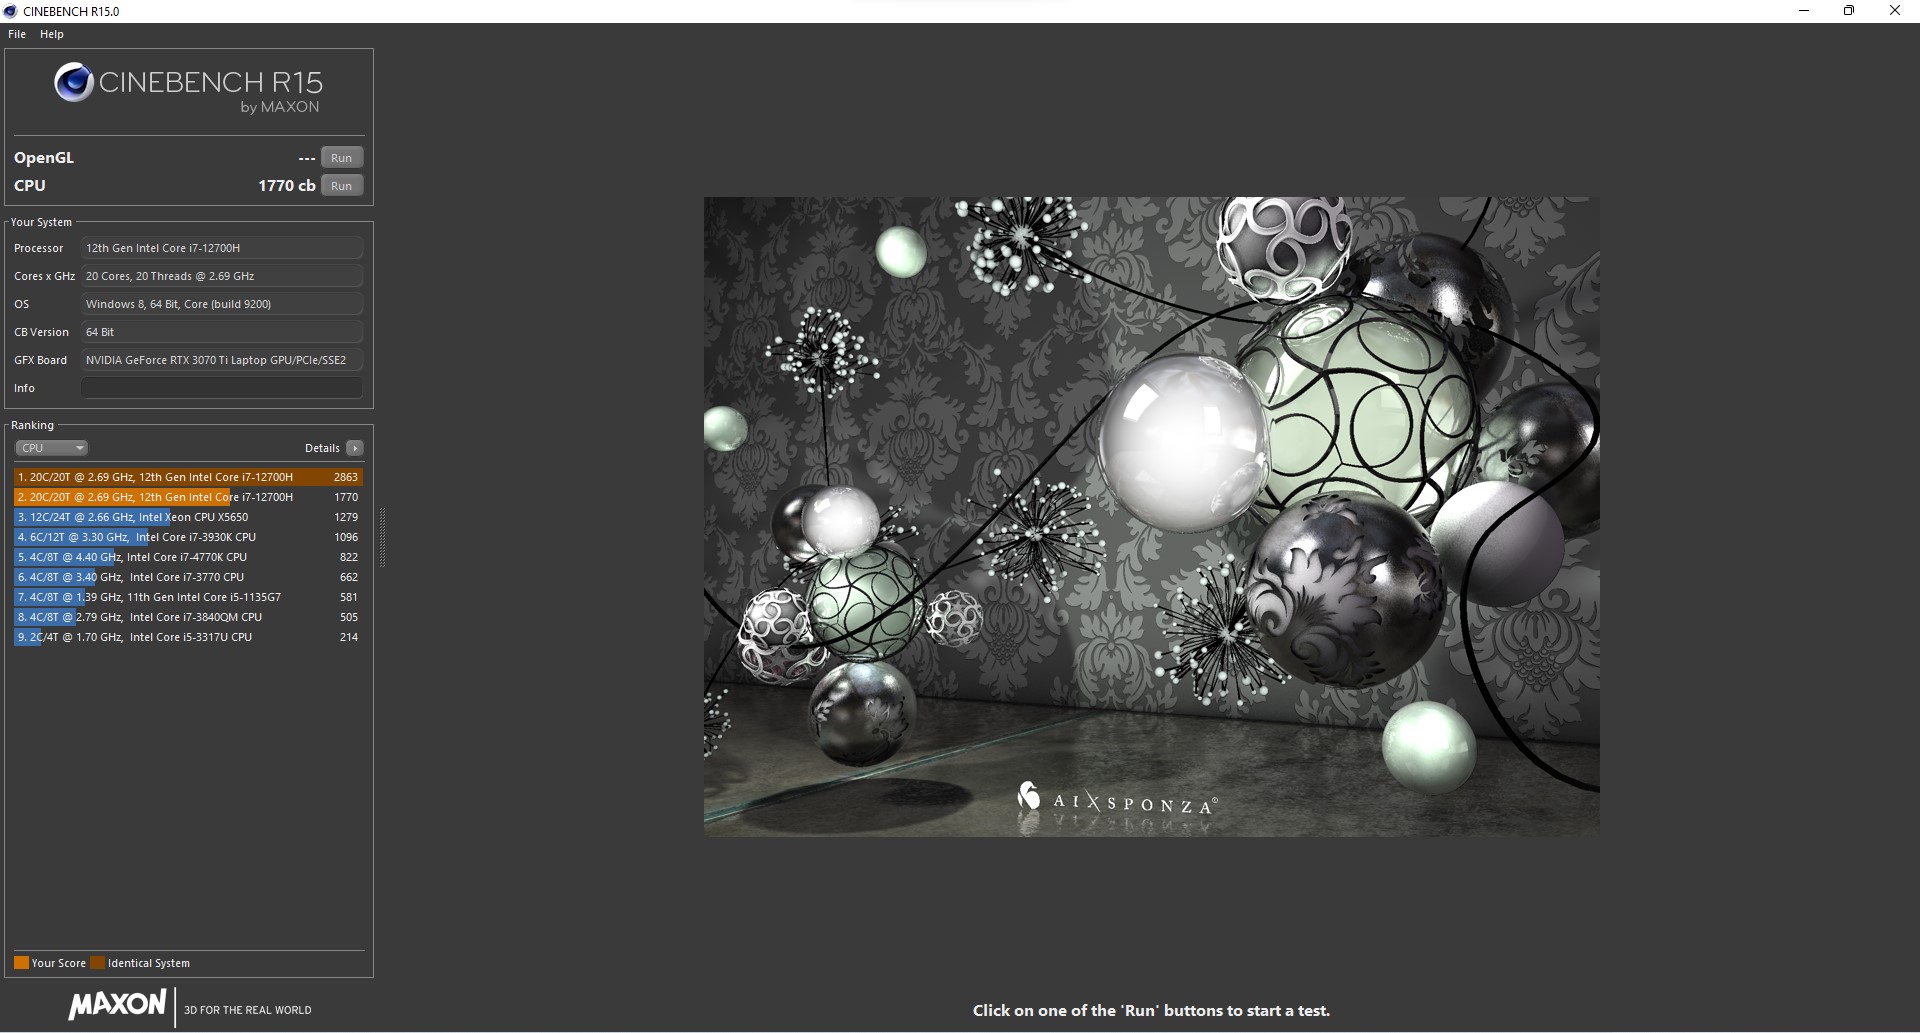
In modalità batteria, il TDP della CPU, tipico dei portatili con un TDP combinato elevato, è fortemente limitato a 15 watt. Di conseguenza, le prestazioni del processore Intel si riducono di ben il 40% (vedere gli screenshot di CB15). Tuttavia, si tratta ancora di una velocità superiore del 45% rispetto alle prestazioni del predecessore e, se si considera il valore sotto carico sostenuto, la perdita è solo del 25% circa.
Le CPU da 45 watt di AMD, come il modello Ryzen 7 5800H nel modello Asus ROG Strix G17sono generalmente un po' più lente, ma non mostrano quasi nessuna perdita di prestazioni quando funzionano a batteria.
Cinebench R15 Multi Sustained Load
Cinebench R23: Multi Core | Single Core
Cinebench R20: CPU (Multi Core) | CPU (Single Core)
Cinebench R15: CPU Multi 64Bit | CPU Single 64Bit
Blender: v2.79 BMW27 CPU
7-Zip 18.03: 7z b 4 | 7z b 4 -mmt1
Geekbench 5.5: Multi-Core | Single-Core
HWBOT x265 Benchmark v2.2: 4k Preset
LibreOffice : 20 Documents To PDF
R Benchmark 2.5: Overall mean
Geekbench 5.5: OpenCL Score
| CPU Performance rating | |
| Media della classe Gaming | |
| Lenovo Legion 5 Pro 16 G7 i7 RTX 3070Ti | |
| MSI Vector GP66 12UGS | |
| MSI Vector GP76 12UGS-434 | |
| Aorus 17 XE4 | |
| Media Intel Core i7-12700H | |
| Asus ROG Zephyrus M16 GU603H -2! | |
| Schenker XMG NEO 17 GM7TG8S | |
| Asus ROG Strix G17 G713QE-RB74 -3! | |
| MSI GP76 Leopard 10UG -2! | |
| Cinebench R23 / Multi Core | |
| Media della classe Gaming (10488 - 40970, n=112, ultimi 2 anni) | |
| Lenovo Legion 5 Pro 16 G7 i7 RTX 3070Ti | |
| MSI Vector GP76 12UGS-434 | |
| MSI Vector GP66 12UGS | |
| Aorus 17 XE4 | |
| Media Intel Core i7-12700H (4032 - 19330, n=64) | |
| Asus ROG Strix G17 G713QE-RB74 | |
| Schenker XMG NEO 17 GM7TG8S | |
| Cinebench R23 / Single Core | |
| Media della classe Gaming (1166 - 2356, n=112, ultimi 2 anni) | |
| MSI Vector GP66 12UGS | |
| Lenovo Legion 5 Pro 16 G7 i7 RTX 3070Ti | |
| Aorus 17 XE4 | |
| MSI Vector GP76 12UGS-434 | |
| Media Intel Core i7-12700H (778 - 1826, n=63) | |
| Schenker XMG NEO 17 GM7TG8S | |
| Asus ROG Strix G17 G713QE-RB74 | |
| Cinebench R20 / CPU (Multi Core) | |
| Media della classe Gaming (4029 - 16108, n=111, ultimi 2 anni) | |
| Lenovo Legion 5 Pro 16 G7 i7 RTX 3070Ti | |
| MSI Vector GP76 12UGS-434 | |
| MSI Vector GP66 12UGS | |
| Aorus 17 XE4 | |
| Media Intel Core i7-12700H (1576 - 7407, n=64) | |
| Asus ROG Zephyrus M16 GU603H | |
| Asus ROG Strix G17 G713QE-RB74 | |
| Schenker XMG NEO 17 GM7TG8S | |
| MSI GP76 Leopard 10UG | |
| Cinebench R20 / CPU (Single Core) | |
| Media della classe Gaming (442 - 895, n=111, ultimi 2 anni) | |
| MSI Vector GP66 12UGS | |
| Lenovo Legion 5 Pro 16 G7 i7 RTX 3070Ti | |
| Aorus 17 XE4 | |
| MSI Vector GP76 12UGS-434 | |
| Media Intel Core i7-12700H (300 - 704, n=64) | |
| Asus ROG Zephyrus M16 GU603H | |
| Schenker XMG NEO 17 GM7TG8S | |
| Asus ROG Strix G17 G713QE-RB74 | |
| MSI GP76 Leopard 10UG | |
| Cinebench R15 / CPU Multi 64Bit | |
| Media della classe Gaming (1578 - 6271, n=111, ultimi 2 anni) | |
| Lenovo Legion 5 Pro 16 G7 i7 RTX 3070Ti | |
| MSI Vector GP76 12UGS-434 | |
| Aorus 17 XE4 | |
| Media Intel Core i7-12700H (1379 - 2916, n=70) | |
| MSI Vector GP66 12UGS | |
| Asus ROG Zephyrus M16 GU603H | |
| Asus ROG Strix G17 G713QE-RB74 | |
| Schenker XMG NEO 17 GM7TG8S | |
| MSI GP76 Leopard 10UG | |
| Cinebench R15 / CPU Single 64Bit | |
| Media della classe Gaming (188.8 - 343, n=111, ultimi 2 anni) | |
| MSI Vector GP66 12UGS | |
| Lenovo Legion 5 Pro 16 G7 i7 RTX 3070Ti | |
| Aorus 17 XE4 | |
| MSI Vector GP76 12UGS-434 | |
| Media Intel Core i7-12700H (113 - 263, n=65) | |
| Asus ROG Zephyrus M16 GU603H | |
| Asus ROG Strix G17 G713QE-RB74 | |
| Schenker XMG NEO 17 GM7TG8S | |
| MSI GP76 Leopard 10UG | |
| Blender / v2.79 BMW27 CPU | |
| MSI GP76 Leopard 10UG | |
| Schenker XMG NEO 17 GM7TG8S | |
| Asus ROG Zephyrus M16 GU603H | |
| Asus ROG Strix G17 G713QE-RB74 | |
| Aorus 17 XE4 | |
| Media Intel Core i7-12700H (168 - 732, n=63) | |
| MSI Vector GP76 12UGS-434 | |
| MSI Vector GP66 12UGS | |
| Lenovo Legion 5 Pro 16 G7 i7 RTX 3070Ti | |
| Media della classe Gaming (80 - 330, n=109, ultimi 2 anni) | |
| 7-Zip 18.03 / 7z b 4 | |
| Media della classe Gaming (33491 - 148086, n=110, ultimi 2 anni) | |
| Lenovo Legion 5 Pro 16 G7 i7 RTX 3070Ti | |
| MSI Vector GP66 12UGS | |
| MSI Vector GP76 12UGS-434 | |
| Media Intel Core i7-12700H (22844 - 73067, n=63) | |
| Aorus 17 XE4 | |
| Asus ROG Strix G17 G713QE-RB74 | |
| Asus ROG Zephyrus M16 GU603H | |
| Schenker XMG NEO 17 GM7TG8S | |
| MSI GP76 Leopard 10UG | |
| 7-Zip 18.03 / 7z b 4 -mmt1 | |
| Media della classe Gaming (4199 - 7436, n=110, ultimi 2 anni) | |
| MSI Vector GP66 12UGS | |
| Aorus 17 XE4 | |
| Lenovo Legion 5 Pro 16 G7 i7 RTX 3070Ti | |
| Media Intel Core i7-12700H (2743 - 5972, n=63) | |
| Asus ROG Zephyrus M16 GU603H | |
| Asus ROG Strix G17 G713QE-RB74 | |
| Schenker XMG NEO 17 GM7TG8S | |
| MSI Vector GP76 12UGS-434 | |
| MSI GP76 Leopard 10UG | |
| Geekbench 5.5 / Multi-Core | |
| Media della classe Gaming (6460 - 27010, n=110, ultimi 2 anni) | |
| Lenovo Legion 5 Pro 16 G7 i7 RTX 3070Ti | |
| MSI Vector GP66 12UGS | |
| Aorus 17 XE4 | |
| MSI Vector GP76 12UGS-434 | |
| Media Intel Core i7-12700H (5144 - 13745, n=64) | |
| Asus ROG Zephyrus M16 GU603H | |
| Schenker XMG NEO 17 GM7TG8S | |
| MSI GP76 Leopard 10UG | |
| Geekbench 5.5 / Single-Core | |
| Media della classe Gaming (986 - 2474, n=110, ultimi 2 anni) | |
| MSI Vector GP66 12UGS | |
| Aorus 17 XE4 | |
| MSI Vector GP76 12UGS-434 | |
| Lenovo Legion 5 Pro 16 G7 i7 RTX 3070Ti | |
| Media Intel Core i7-12700H (803 - 1851, n=64) | |
| Asus ROG Zephyrus M16 GU603H | |
| Schenker XMG NEO 17 GM7TG8S | |
| MSI GP76 Leopard 10UG | |
| HWBOT x265 Benchmark v2.2 / 4k Preset | |
| Media della classe Gaming (11.5 - 44.3, n=110, ultimi 2 anni) | |
| Lenovo Legion 5 Pro 16 G7 i7 RTX 3070Ti | |
| MSI Vector GP66 12UGS | |
| MSI Vector GP76 12UGS-434 | |
| Media Intel Core i7-12700H (4.67 - 21.8, n=64) | |
| Aorus 17 XE4 | |
| Asus ROG Zephyrus M16 GU603H | |
| Asus ROG Strix G17 G713QE-RB74 | |
| Schenker XMG NEO 17 GM7TG8S | |
| MSI GP76 Leopard 10UG | |
| LibreOffice / 20 Documents To PDF | |
| Asus ROG Strix G17 G713QE-RB74 | |
| MSI GP76 Leopard 10UG | |
| Media della classe Gaming (19 - 88.8, n=110, ultimi 2 anni) | |
| Media Intel Core i7-12700H (34.2 - 95.3, n=63) | |
| MSI Vector GP76 12UGS-434 | |
| Lenovo Legion 5 Pro 16 G7 i7 RTX 3070Ti | |
| Asus ROG Zephyrus M16 GU603H | |
| MSI Vector GP66 12UGS | |
| Schenker XMG NEO 17 GM7TG8S | |
| Aorus 17 XE4 | |
| R Benchmark 2.5 / Overall mean | |
| MSI GP76 Leopard 10UG | |
| Schenker XMG NEO 17 GM7TG8S | |
| Asus ROG Zephyrus M16 GU603H | |
| Asus ROG Strix G17 G713QE-RB74 | |
| Media Intel Core i7-12700H (0.4441 - 1.052, n=63) | |
| MSI Vector GP76 12UGS-434 | |
| Aorus 17 XE4 | |
| Lenovo Legion 5 Pro 16 G7 i7 RTX 3070Ti | |
| Media della classe Gaming (0.3439 - 0.759, n=111, ultimi 2 anni) | |
| MSI Vector GP66 12UGS | |
| Geekbench 5.5 / OpenCL Score | |
| Media della classe Gaming (80702 - 277970, n=107, ultimi 2 anni) | |
| Aorus 17 XE4 | |
| Schenker XMG NEO 17 GM7TG8S | |
| Lenovo Legion 5 Pro 16 G7 i7 RTX 3070Ti | |
| MSI Vector GP76 12UGS-434 | |
| MSI Vector GP66 12UGS | |
| Asus ROG Zephyrus M16 GU603H | |
| MSI GP76 Leopard 10UG | |
| Media Intel Core i7-12700H (13944 - 148757, n=62) | |
* ... Meglio usare valori piccoli
AIDA64: FP32 Ray-Trace | FPU Julia | CPU SHA3 | CPU Queen | FPU SinJulia | FPU Mandel | CPU AES | CPU ZLib | FP64 Ray-Trace | CPU PhotoWorxx
| Performance rating | |
| Media della classe Gaming | |
| Asus ROG Strix G17 G713QE-RB74 | |
| Lenovo Legion 5 Pro 16 G7 i7 RTX 3070Ti | |
| Media Intel Core i7-12700H | |
| MSI Vector GP76 12UGS-434 | |
| MSI Vector GP66 12UGS | |
| Aorus 17 XE4 | |
| MSI GP76 Leopard 10UG | |
| AIDA64 / FP32 Ray-Trace | |
| Media della classe Gaming (10227 - 85542, n=109, ultimi 2 anni) | |
| Asus ROG Strix G17 G713QE-RB74 | |
| Media Intel Core i7-12700H (2585 - 17957, n=64) | |
| Lenovo Legion 5 Pro 16 G7 i7 RTX 3070Ti | |
| MSI GP76 Leopard 10UG | |
| MSI Vector GP66 12UGS | |
| MSI Vector GP76 12UGS-434 | |
| Aorus 17 XE4 | |
| AIDA64 / FPU Julia | |
| Media della classe Gaming (51376 - 238426, n=109, ultimi 2 anni) | |
| Asus ROG Strix G17 G713QE-RB74 | |
| Media Intel Core i7-12700H (12439 - 90760, n=64) | |
| MSI GP76 Leopard 10UG | |
| Lenovo Legion 5 Pro 16 G7 i7 RTX 3070Ti | |
| MSI Vector GP76 12UGS-434 | |
| MSI Vector GP66 12UGS | |
| Aorus 17 XE4 | |
| AIDA64 / CPU SHA3 | |
| Media della classe Gaming (2180 - 9817, n=109, ultimi 2 anni) | |
| Lenovo Legion 5 Pro 16 G7 i7 RTX 3070Ti | |
| MSI Vector GP76 12UGS-434 | |
| Asus ROG Strix G17 G713QE-RB74 | |
| Media Intel Core i7-12700H (833 - 4242, n=64) | |
| MSI Vector GP66 12UGS | |
| Aorus 17 XE4 | |
| MSI GP76 Leopard 10UG | |
| AIDA64 / CPU Queen | |
| Media della classe Gaming (49785 - 173351, n=100, ultimi 2 anni) | |
| MSI Vector GP66 12UGS | |
| Aorus 17 XE4 | |
| Lenovo Legion 5 Pro 16 G7 i7 RTX 3070Ti | |
| Media Intel Core i7-12700H (57923 - 103202, n=63) | |
| MSI Vector GP76 12UGS-434 | |
| Asus ROG Strix G17 G713QE-RB74 | |
| MSI GP76 Leopard 10UG | |
| AIDA64 / FPU SinJulia | |
| Media della classe Gaming (4424 - 33636, n=109, ultimi 2 anni) | |
| Asus ROG Strix G17 G713QE-RB74 | |
| Lenovo Legion 5 Pro 16 G7 i7 RTX 3070Ti | |
| MSI Vector GP76 12UGS-434 | |
| MSI Vector GP66 12UGS | |
| Media Intel Core i7-12700H (3249 - 9939, n=64) | |
| Aorus 17 XE4 | |
| MSI GP76 Leopard 10UG | |
| AIDA64 / FPU Mandel | |
| Media della classe Gaming (25115 - 128721, n=109, ultimi 2 anni) | |
| Asus ROG Strix G17 G713QE-RB74 | |
| Media Intel Core i7-12700H (7135 - 44760, n=64) | |
| Lenovo Legion 5 Pro 16 G7 i7 RTX 3070Ti | |
| MSI Vector GP66 12UGS | |
| MSI GP76 Leopard 10UG | |
| MSI Vector GP76 12UGS-434 | |
| Aorus 17 XE4 | |
| AIDA64 / CPU AES | |
| Asus ROG Strix G17 G713QE-RB74 | |
| Media della classe Gaming (39258 - 247074, n=109, ultimi 2 anni) | |
| Lenovo Legion 5 Pro 16 G7 i7 RTX 3070Ti | |
| MSI Vector GP76 12UGS-434 | |
| MSI Vector GP66 12UGS | |
| Media Intel Core i7-12700H (31839 - 144360, n=64) | |
| Aorus 17 XE4 | |
| MSI GP76 Leopard 10UG | |
| AIDA64 / CPU ZLib | |
| Media della classe Gaming (574 - 2531, n=109, ultimi 2 anni) | |
| Lenovo Legion 5 Pro 16 G7 i7 RTX 3070Ti | |
| MSI Vector GP76 12UGS-434 | |
| MSI Vector GP66 12UGS | |
| Media Intel Core i7-12700H (305 - 1171, n=64) | |
| Aorus 17 XE4 | |
| Asus ROG Strix G17 G713QE-RB74 | |
| MSI GP76 Leopard 10UG | |
| AIDA64 / FP64 Ray-Trace | |
| Media della classe Gaming (5509 - 45446, n=109, ultimi 2 anni) | |
| Asus ROG Strix G17 G713QE-RB74 | |
| Media Intel Core i7-12700H (1437 - 9692, n=64) | |
| Lenovo Legion 5 Pro 16 G7 i7 RTX 3070Ti | |
| MSI GP76 Leopard 10UG | |
| MSI Vector GP66 12UGS | |
| MSI Vector GP76 12UGS-434 | |
| Aorus 17 XE4 | |
| AIDA64 / CPU PhotoWorxx | |
| Media della classe Gaming (12271 - 89891, n=109, ultimi 2 anni) | |
| Lenovo Legion 5 Pro 16 G7 i7 RTX 3070Ti | |
| Media Intel Core i7-12700H (12863 - 52207, n=64) | |
| MSI Vector GP66 12UGS | |
| MSI Vector GP76 12UGS-434 | |
| Aorus 17 XE4 | |
| MSI GP76 Leopard 10UG | |
| Asus ROG Strix G17 G713QE-RB74 | |
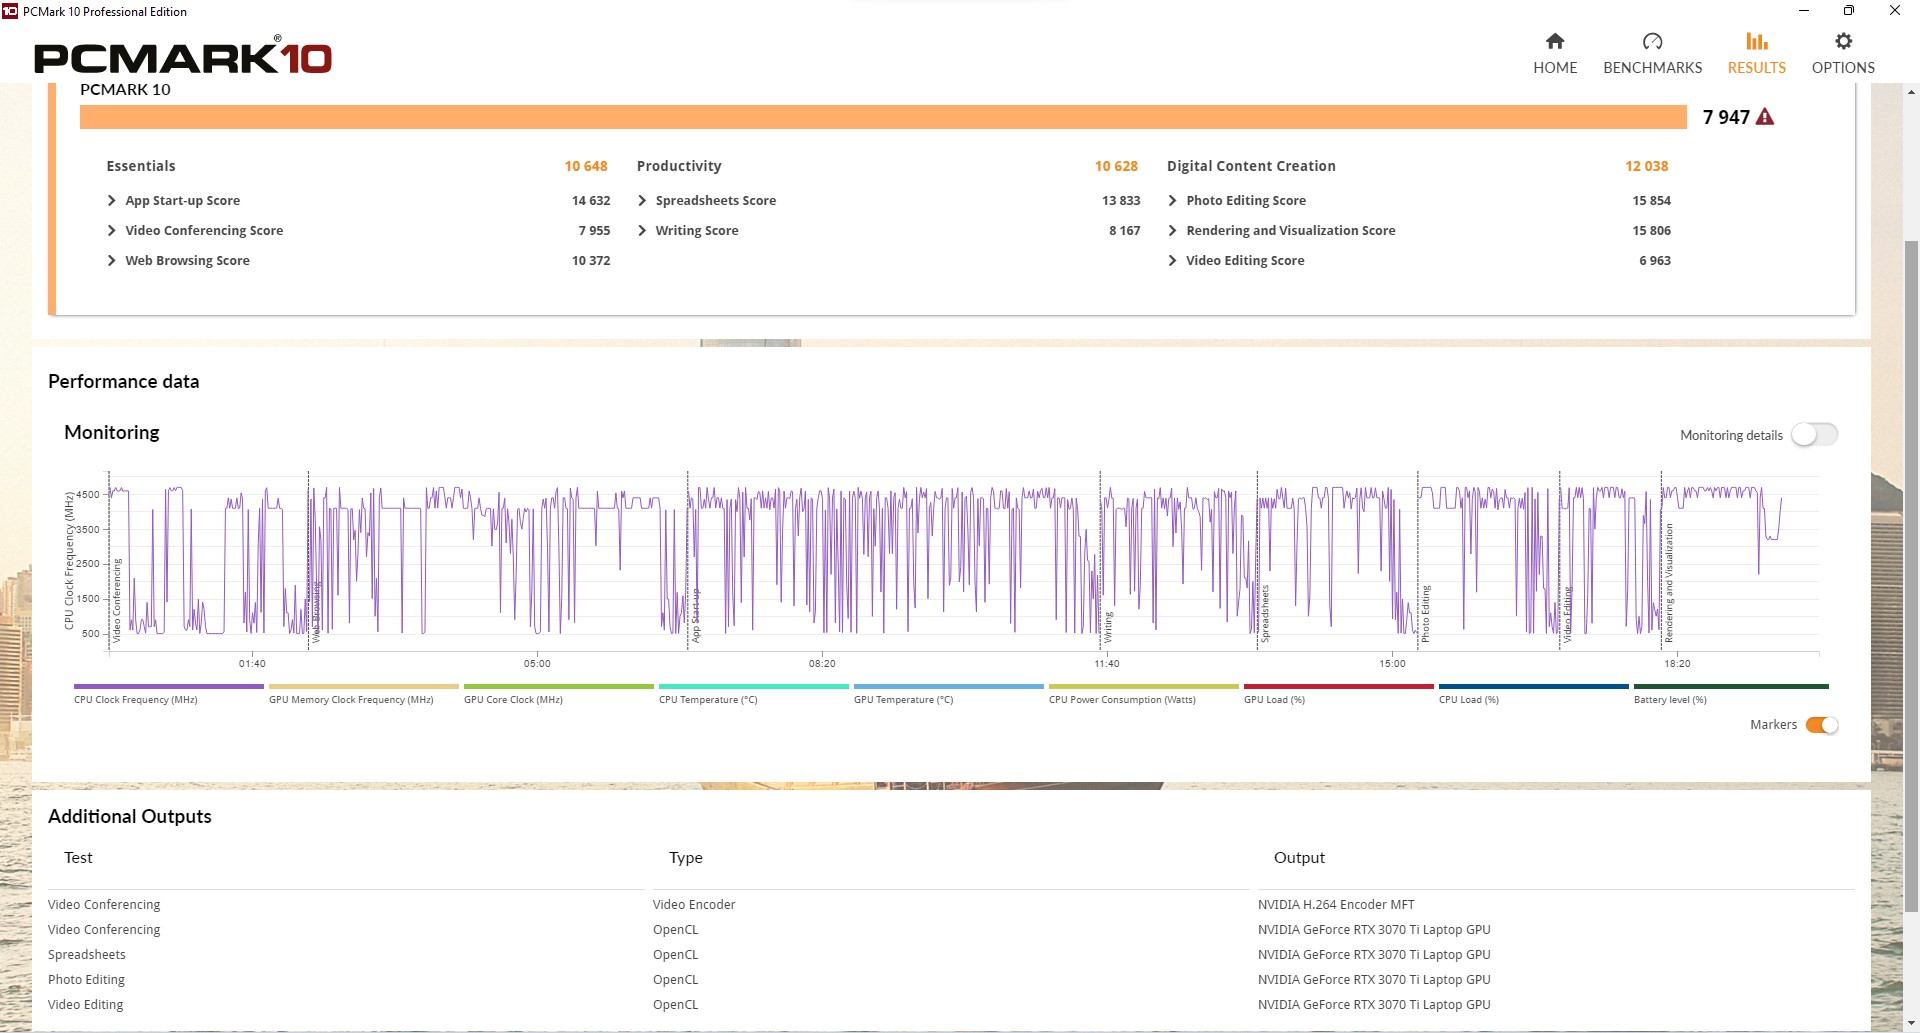
Prestazioni del sistema
In questo caso, il nostro dispositivo recensito è proprio al top; infatti, non c'è quasi nessun risultato migliore in tutto il nostro database. Il predecessore viene superato del 33%. I programmi si aprono immediatamente, così come le schede multiple del browser.
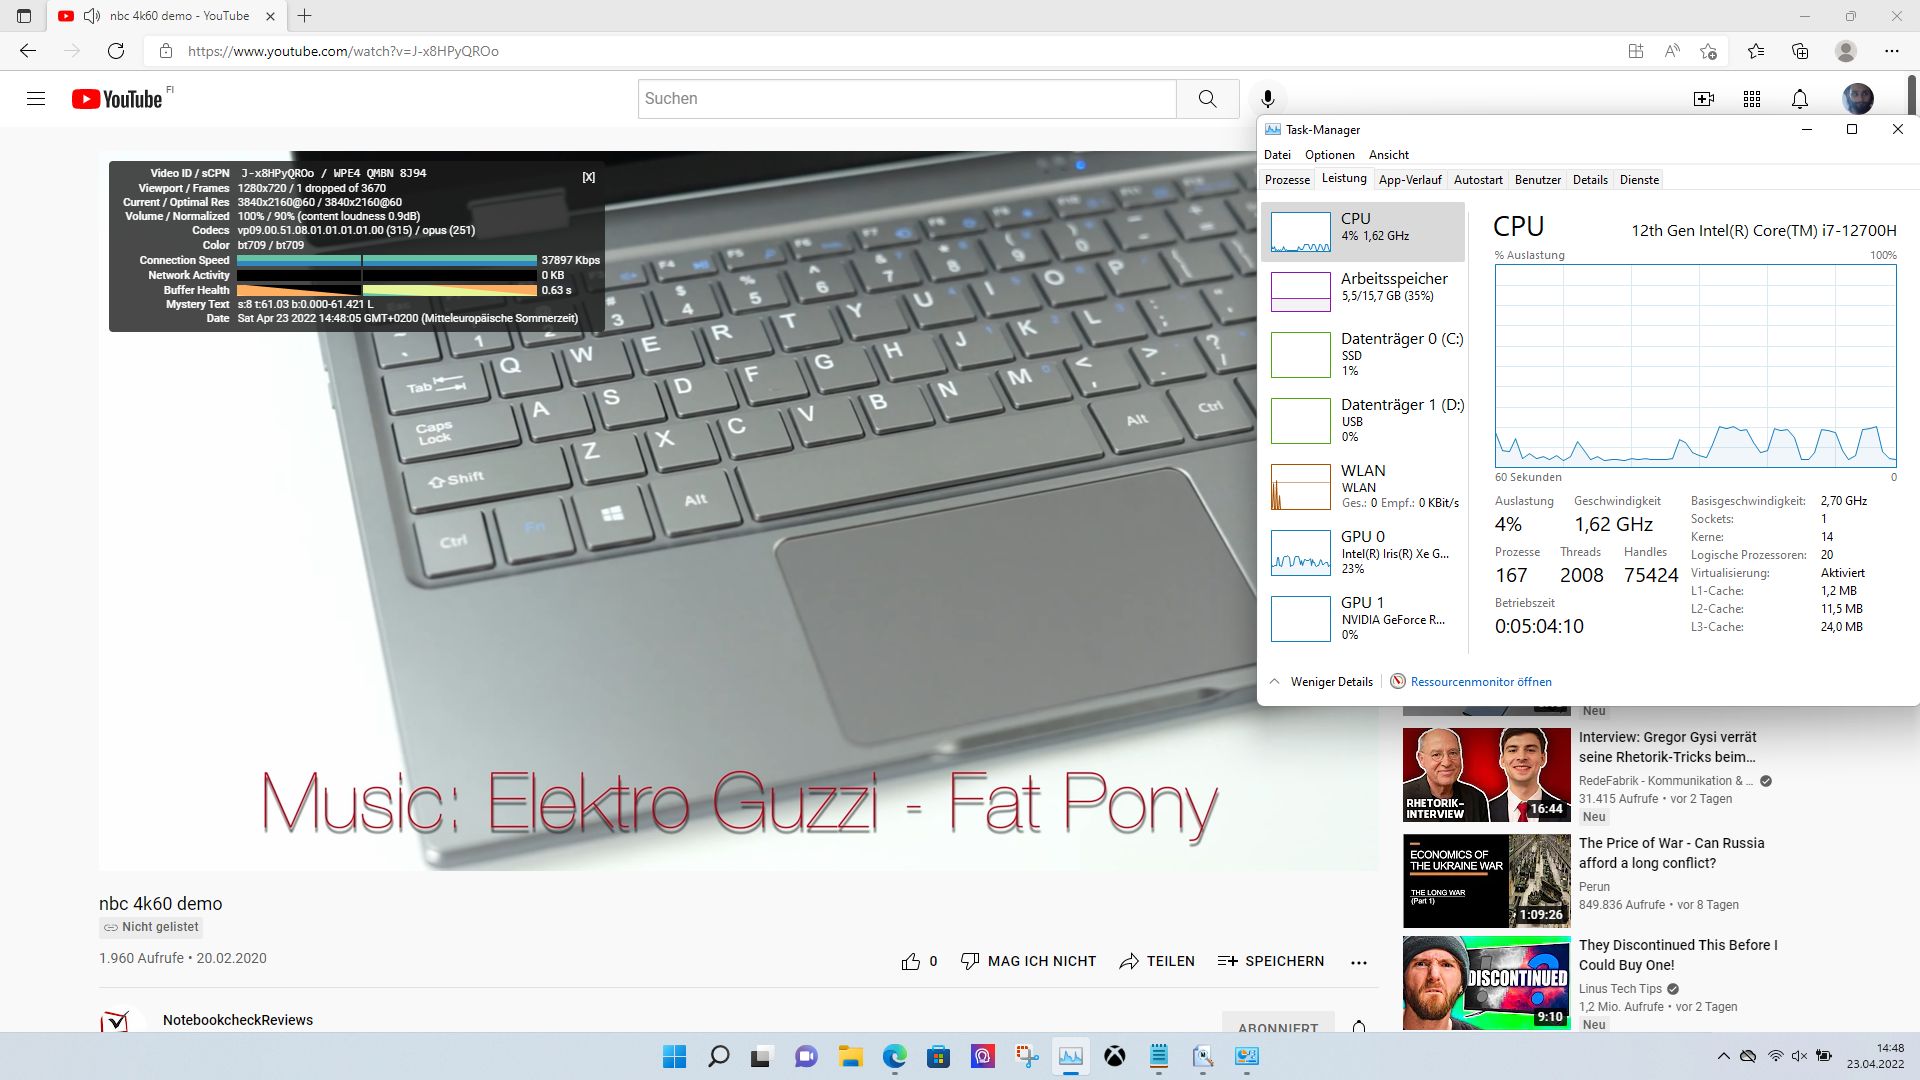
Il pannello a 360 Hz contribuisce sicuramente a un'elevata reattività del sistema. anche la riproduzione di YouTube in 4K richiede pochissime risorse della CPU
CrossMark: Overall | Productivity | Creativity | Responsiveness
| PCMark 10 / Score | |
| Media della classe Gaming (5828 - 11574, n=95, ultimi 2 anni) | |
| MSI Vector GP66 12UGS | |
| MSI Vector GP76 12UGS-434 | |
| Aorus 17 XE4 | |
| Lenovo Legion 5 Pro 16 G7 i7 RTX 3070Ti | |
| Media Intel Core i7-12700H, NVIDIA GeForce RTX 3070 Ti Laptop GPU (6941 - 7947, n=11) | |
| Schenker XMG NEO 17 GM7TG8S | |
| Asus ROG Zephyrus M16 GU603H | |
| Asus ROG Strix G17 G713QE-RB74 | |
| MSI GP76 Leopard 10UG | |
| PCMark 10 / Essentials | |
| MSI Vector GP66 12UGS | |
| Aorus 17 XE4 | |
| Media della classe Gaming (8810 - 12600, n=99, ultimi 2 anni) | |
| MSI Vector GP76 12UGS-434 | |
| Asus ROG Zephyrus M16 GU603H | |
| Media Intel Core i7-12700H, NVIDIA GeForce RTX 3070 Ti Laptop GPU (9892 - 10935, n=11) | |
| Schenker XMG NEO 17 GM7TG8S | |
| Asus ROG Strix G17 G713QE-RB74 | |
| Lenovo Legion 5 Pro 16 G7 i7 RTX 3070Ti | |
| MSI GP76 Leopard 10UG | |
| PCMark 10 / Productivity | |
| Media della classe Gaming (6845 - 18766, n=97, ultimi 2 anni) | |
| MSI Vector GP76 12UGS-434 | |
| MSI Vector GP66 12UGS | |
| Lenovo Legion 5 Pro 16 G7 i7 RTX 3070Ti | |
| Aorus 17 XE4 | |
| Media Intel Core i7-12700H, NVIDIA GeForce RTX 3070 Ti Laptop GPU (9024 - 10638, n=11) | |
| Schenker XMG NEO 17 GM7TG8S | |
| Asus ROG Strix G17 G713QE-RB74 | |
| Asus ROG Zephyrus M16 GU603H | |
| MSI GP76 Leopard 10UG | |
| PCMark 10 / Digital Content Creation | |
| Media della classe Gaming (7602 - 19657, n=97, ultimi 2 anni) | |
| MSI Vector GP66 12UGS | |
| MSI Vector GP76 12UGS-434 | |
| Lenovo Legion 5 Pro 16 G7 i7 RTX 3070Ti | |
| Aorus 17 XE4 | |
| Media Intel Core i7-12700H, NVIDIA GeForce RTX 3070 Ti Laptop GPU (10165 - 12546, n=11) | |
| Schenker XMG NEO 17 GM7TG8S | |
| Asus ROG Zephyrus M16 GU603H | |
| Asus ROG Strix G17 G713QE-RB74 | |
| MSI GP76 Leopard 10UG | |
| CrossMark / Overall | |
| Aorus 17 XE4 | |
| Media della classe Gaming (1366 - 2409, n=97, ultimi 2 anni) | |
| MSI Vector GP76 12UGS-434 | |
| Lenovo Legion 5 Pro 16 G7 i7 RTX 3070Ti | |
| Media Intel Core i7-12700H, NVIDIA GeForce RTX 3070 Ti Laptop GPU (974 - 2000, n=12) | |
| CrossMark / Productivity | |
| Aorus 17 XE4 | |
| MSI Vector GP76 12UGS-434 | |
| Lenovo Legion 5 Pro 16 G7 i7 RTX 3070Ti | |
| Media della classe Gaming (1386 - 2254, n=97, ultimi 2 anni) | |
| Media Intel Core i7-12700H, NVIDIA GeForce RTX 3070 Ti Laptop GPU (907 - 1962, n=12) | |
| CrossMark / Creativity | |
| Media della classe Gaming (1343 - 2729, n=97, ultimi 2 anni) | |
| Lenovo Legion 5 Pro 16 G7 i7 RTX 3070Ti | |
| Aorus 17 XE4 | |
| MSI Vector GP76 12UGS-434 | |
| Media Intel Core i7-12700H, NVIDIA GeForce RTX 3070 Ti Laptop GPU (1027 - 2057, n=12) | |
| CrossMark / Responsiveness | |
| Aorus 17 XE4 | |
| MSI Vector GP76 12UGS-434 | |
| Lenovo Legion 5 Pro 16 G7 i7 RTX 3070Ti | |
| Media Intel Core i7-12700H, NVIDIA GeForce RTX 3070 Ti Laptop GPU (1029 - 2142, n=12) | |
| Media della classe Gaming (1226 - 2334, n=97, ultimi 2 anni) | |
| PCMark 10 Score | 7947 punti | |
Aiuto | ||
| AIDA64 / Memory Copy | |
| Media della classe Gaming (21750 - 129946, n=109, ultimi 2 anni) | |
| Media Intel Core i7-12700H (25615 - 80511, n=64) | |
| Lenovo Legion 5 Pro 16 G7 i7 RTX 3070Ti | |
| MSI Vector GP66 12UGS | |
| Aorus 17 XE4 | |
| MSI Vector GP76 12UGS-434 | |
| Asus ROG Strix G17 G713QE-RB74 | |
| MSI GP76 Leopard 10UG | |
| AIDA64 / Memory Read | |
| Media della classe Gaming (22956 - 118858, n=109, ultimi 2 anni) | |
| Lenovo Legion 5 Pro 16 G7 i7 RTX 3070Ti | |
| Media Intel Core i7-12700H (25586 - 79442, n=64) | |
| MSI Vector GP66 12UGS | |
| Aorus 17 XE4 | |
| MSI Vector GP76 12UGS-434 | |
| Asus ROG Strix G17 G713QE-RB74 | |
| MSI GP76 Leopard 10UG | |
| AIDA64 / Memory Write | |
| Media della classe Gaming (22297 - 135096, n=109, ultimi 2 anni) | |
| Lenovo Legion 5 Pro 16 G7 i7 RTX 3070Ti | |
| Media Intel Core i7-12700H (23679 - 88660, n=64) | |
| MSI Vector GP76 12UGS-434 | |
| MSI Vector GP66 12UGS | |
| Aorus 17 XE4 | |
| MSI GP76 Leopard 10UG | |
| Asus ROG Strix G17 G713QE-RB74 | |
| AIDA64 / Memory Latency | |
| Media della classe Gaming (75.3 - 259, n=109, ultimi 2 anni) | |
| Lenovo Legion 5 Pro 16 G7 i7 RTX 3070Ti | |
| MSI Vector GP76 12UGS-434 | |
| Aorus 17 XE4 | |
| MSI Vector GP66 12UGS | |
| Asus ROG Strix G17 G713QE-RB74 | |
| Media Intel Core i7-12700H (76.2 - 133.9, n=62) | |
| MSI GP76 Leopard 10UG | |
| Asus ROG Zephyrus M16 GU603H | |
| Schenker XMG NEO 17 GM7TG8S | |
* ... Meglio usare valori piccoli
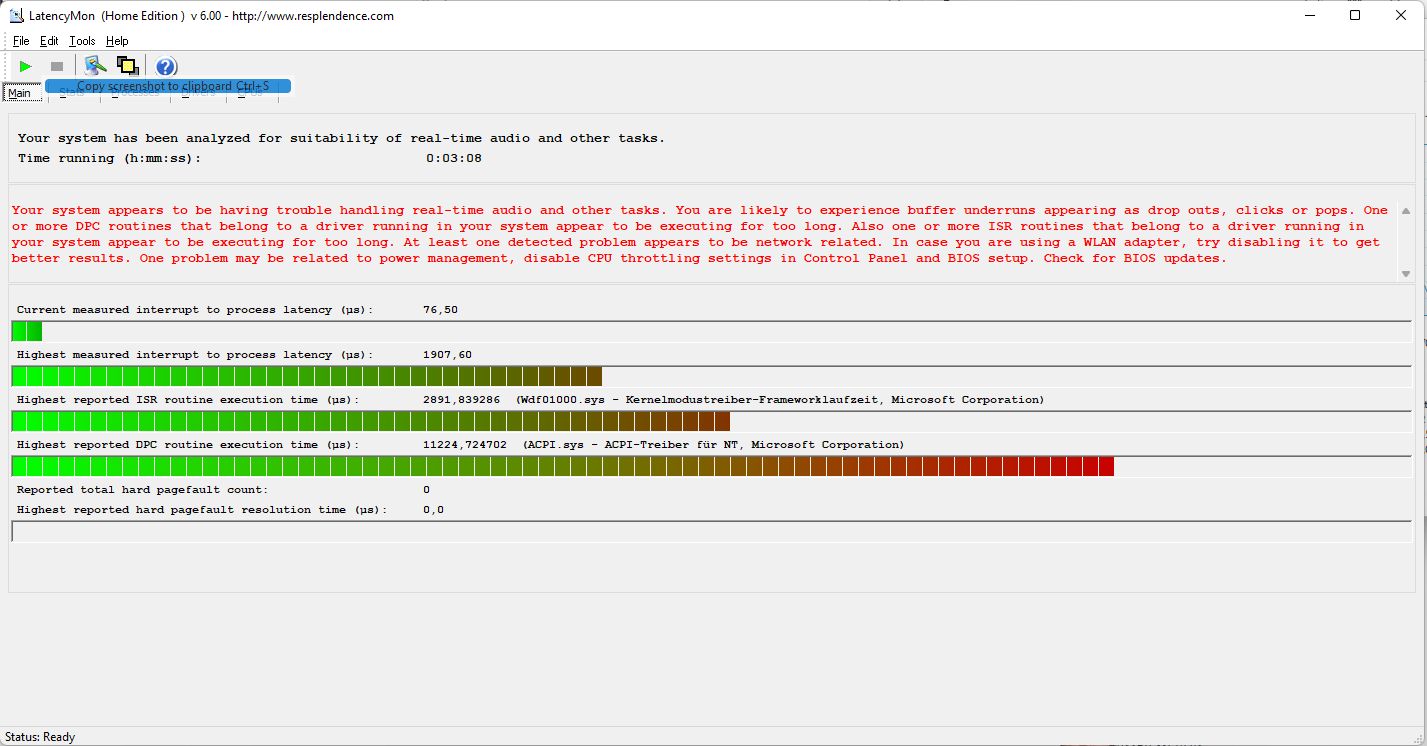
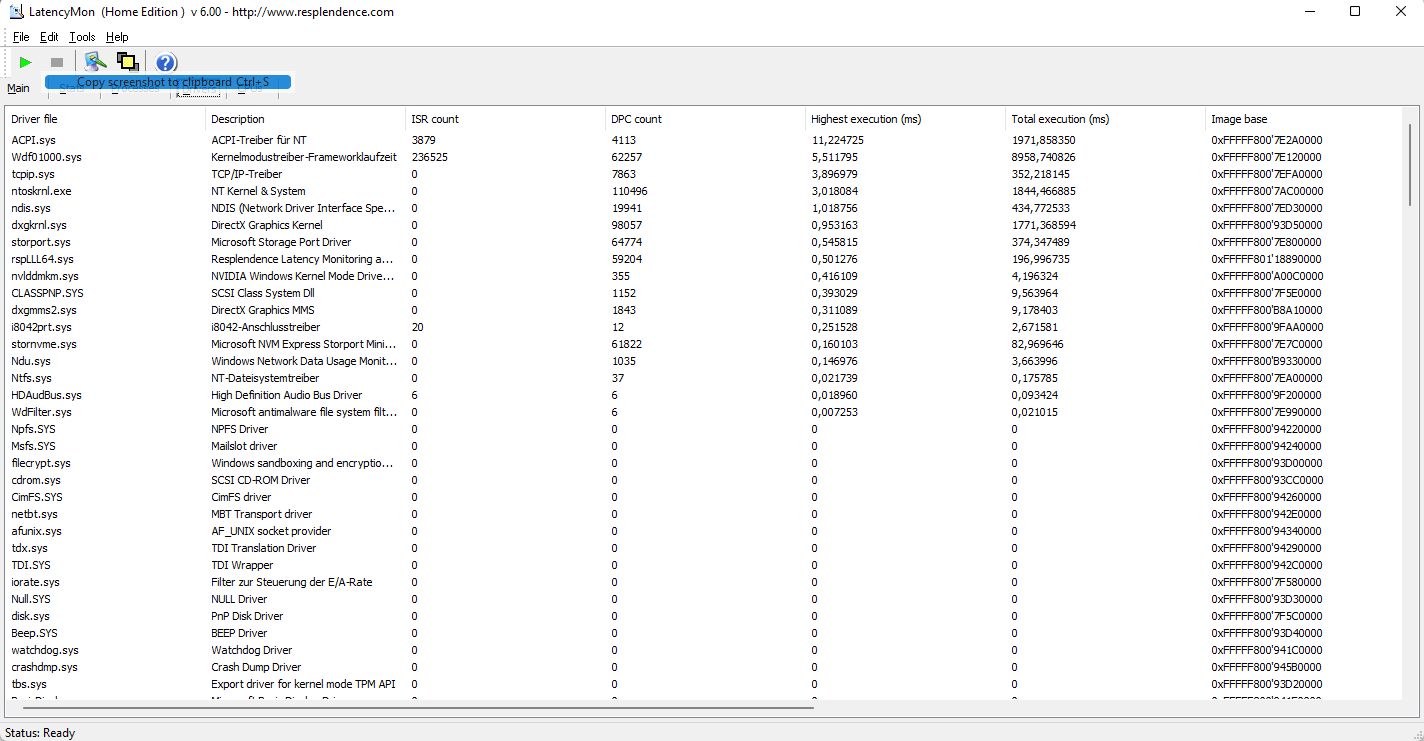
Latenze DPC
Le latenze DPC mostrano il ritardo dall'ingresso alla visualizzazione: il sistema in questo caso si rivela inadatto per l'editing video e audio in tempo reale perché le latenze sono molto elevate, con un ritardo di 1.907 ms. Il driver ACPI è il colpevole. Tuttavia, il problema può essere migliorato con un aggiornamento del BIOS.
Fortunatamente, non si sono verificate cadute di fotogrammi durante la riproduzione di YouTube 4K e il carico della CPU è rimasto basso. Tuttavia, la GPU Intel integrata rimane un po' occupata con un carico del 23%.
| DPC Latencies / LatencyMon - interrupt to process latency (max), Web, Youtube, Prime95 | |
| Schenker XMG NEO 17 GM7TG8S | |
| MSI Vector GP66 12UGS | |
| MSI Vector GP76 12UGS-434 | |
| Aorus 17 XE4 | |
| MSI GP76 Leopard 10UG | |
| Asus ROG Strix G17 G713QE-RB74 | |
| Asus ROG Zephyrus M16 GU603H | |
| Lenovo Legion 5 Pro 16 G7 i7 RTX 3070Ti | |
* ... Meglio usare valori piccoli
Dispositivi di archiviazione

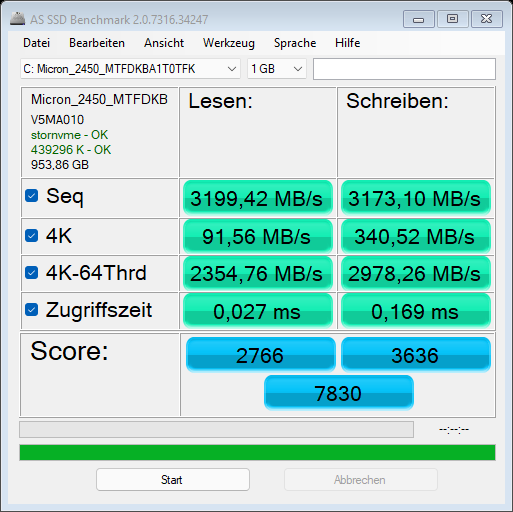
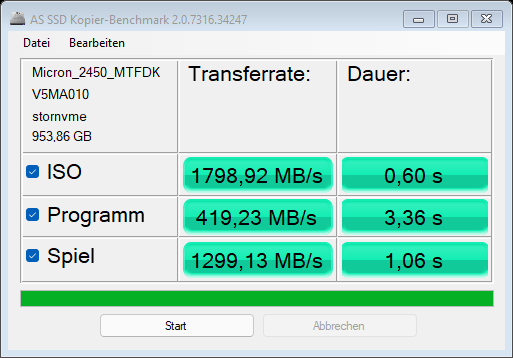
L'unità SSD M.2 2280 NVMe da 1 TB di Micron utilizza il più recente standard PCIe4x4, ma deve essere considerata un'unità SSD economica che raggiunge solo la velocità PCIe 3.0.
Tuttavia, è possibile installare due dischi rigidi più veloci e anche in configurazione RAID (0,1). Il campo di confronto offre SSD più veloci, ma almeno il predecessore è chiaramente superato.
| MSI Vector GP76 12UGS-434 GeForce RTX 3070 Ti Laptop GPU, i7-12700H, Micron 2450 1TB MTFDKBA1T0TFK | MSI GP76 Leopard 10UG GeForce RTX 3070 Laptop GPU, i7-10750H, Kingston OM8PCP3512F-AB | Asus ROG Strix G17 G713QE-RB74 GeForce RTX 3050 Ti Laptop GPU, R7 5800H, Samsung PM991 MZVLQ512HBLU | Aorus 17 XE4 GeForce RTX 3070 Ti Laptop GPU, i7-12700H, Gigabyte AG470S1TB-SI B10 | Schenker XMG NEO 17 GM7TG8S GeForce RTX 3080 Laptop GPU, i7-11800H, Samsung SSD 980 Pro 1TB MZ-V8P1T0BW | Lenovo Legion 5 Pro 16 G7 i7 RTX 3070Ti GeForce RTX 3070 Ti Laptop GPU, i7-12700H, Samsung PM9A1 MZVL21T0HCLR | Asus ROG Zephyrus M16 GU603H GeForce RTX 3070 Laptop GPU, i9-11900H, Samsung PM9A1 MZVL22T0HBLB | MSI Vector GP66 12UGS GeForce RTX 3070 Ti Laptop GPU, i9-12900H | |
|---|---|---|---|---|---|---|---|---|
| AS SSD | -98% | -45% | 13% | 27% | 36% | 9% | -5% | |
| Seq Read (MB/s) | 3199 | 1659 -48% | 2602 -19% | 5031 57% | 5223 63% | 5036 57% | 5615 76% | 3080 -4% |
| Seq Write (MB/s) | 3173 | 921 -71% | 1218 -62% | 3162 0% | 3922 24% | 3784 19% | 4297 35% | 2997 -6% |
| 4K Read (MB/s) | 91.56 | 51 -44% | 42.31 -54% | 108 18% | 82.2 -10% | 88.1 -4% | 55.3 -40% | 70 -24% |
| 4K Write (MB/s) | 340.52 | 120.1 -65% | 122 -64% | 308.6 -9% | 207.6 -39% | 240.4 -29% | 170.5 -50% | 352 3% |
| 4K-64 Read (MB/s) | 2355 | 463.5 -80% | 1182 -50% | 2938 25% | 2439 4% | 2788 18% | 2591 10% | 1630 -31% |
| 4K-64 Write (MB/s) | 2978 | 909 -69% | 972 -67% | 3371 13% | 2652 -11% | 3424 15% | 3190 7% | 2435 -18% |
| Access Time Read * (ms) | 0.027 | 0.179 -563% | 0.101 -274% | 0.048 -78% | 0.022 19% | 0.02 26% | 0.04 -48% | 0.033 -22% |
| Access Time Write * (ms) | 0.169 | 0.032 81% | 0.096 43% | 0.013 92% | 0.021 88% | 0.018 89% | 0.025 85% | 0.425 -151% |
| Score Read (Points) | 2766 | 680 -75% | 1484 -46% | 3549 28% | 3044 10% | 3380 22% | 3208 16% | 2008 -27% |
| Score Write (Points) | 3636 | 1121 -69% | 1216 -67% | 3996 10% | 3252 -11% | 4043 11% | 3790 4% | 3087 -15% |
| Score Total (Points) | 7830 | 2130 -73% | 3394 -57% | 9279 19% | 7794 0% | 9094 16% | 8563 9% | 6130 -22% |
| Copy ISO MB/s (MB/s) | 1799 | 1538 -15% | 1967 9% | 3221 79% | 3221 79% | 3576 99% | ||
| Copy Program MB/s (MB/s) | 419 | 805 92% | 458.2 9% | 1151 175% | 939 124% | 791 89% | ||
| Copy Game MB/s (MB/s) | 1299 | 1418 9% | 1194 -8% | 1194 -8% | 1995 54% | 2134 64% |
* ... Meglio usare valori piccoli

* ... Meglio usare valori piccoli
Sustained Read Performance: DiskSpd Read Loop, Queue Depth 8
GPU
MSI promette un boost clock superiore di 100 MHz, pari a 1.585 MHz, per laRTX 3070 Ti (8 GB DI VRAM). Complessivamente, la GPU è più lenta di circa il 5% rispetto a una RTX 3080 Ti mobile RTX 3080 e circa il 10% in meno rispetto a una RTX-3070. Il sottile Asus ROG Zephyrus M16 viene addirittura battuto dell'80%.
Nel settore mobile non esistono praticamente GPU più potenti. Va notato che i risultati in modalità Extreme sono superiori di circa il 7%. La modalità silenziosa riduce i risultati solo del 10%, mentre le ventole sono molto più silenziose e si possono persino usare gli altoparlanti interni durante il gioco. Tuttavia, questo aumenta le temperature di superficie.
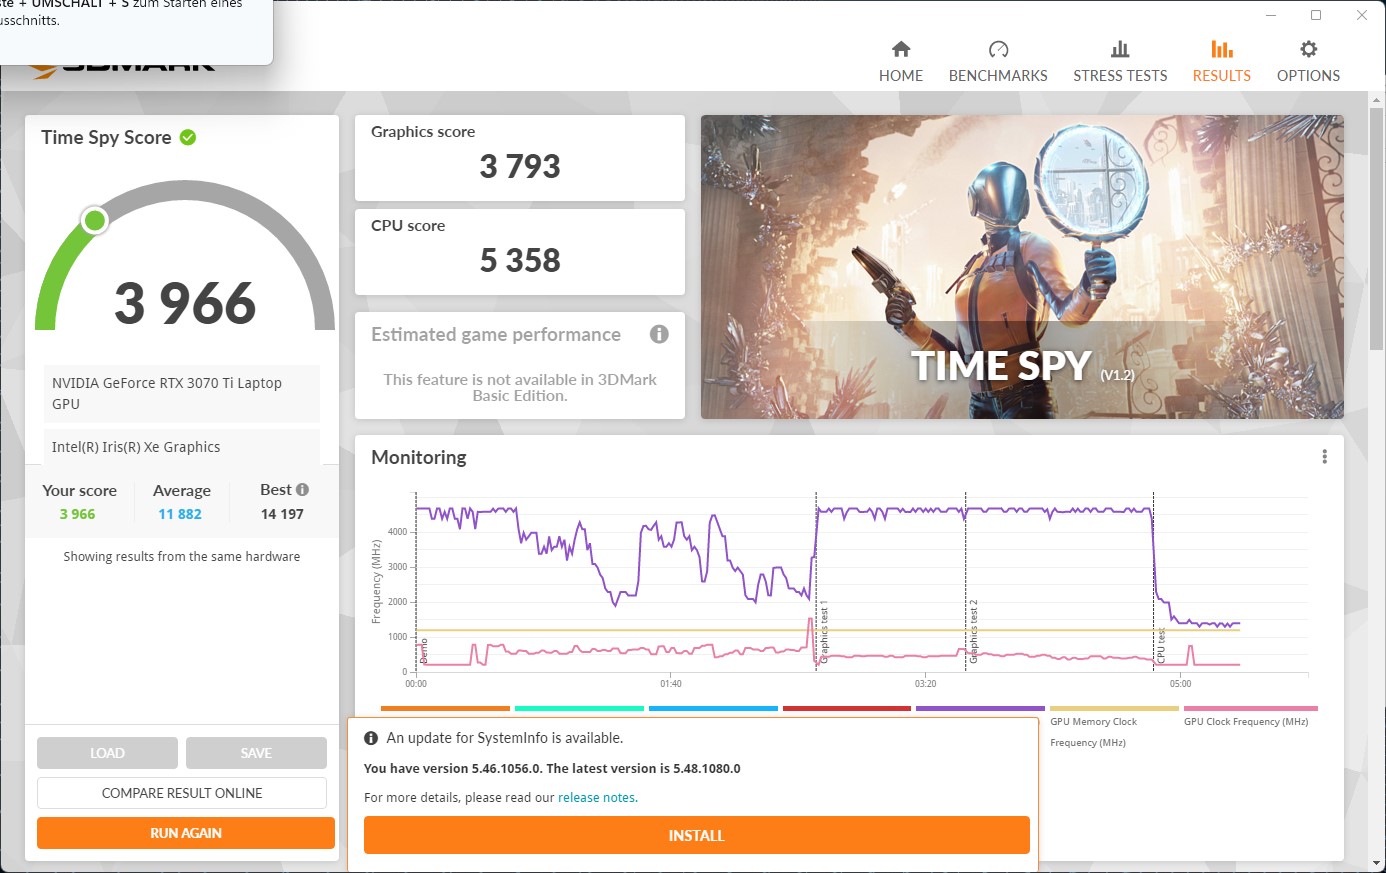
In modalità batteria, il TGP e quindi le prestazioni si riducono notevolmente: Con un consumo totale consentito di 50 watt (CPU: 15 W + GPU: 35 W), il risultato di 3DMark Time Spy è quasi triplicato ed è quindi approssimativamente al livello di unaGTX 1650 Ti.
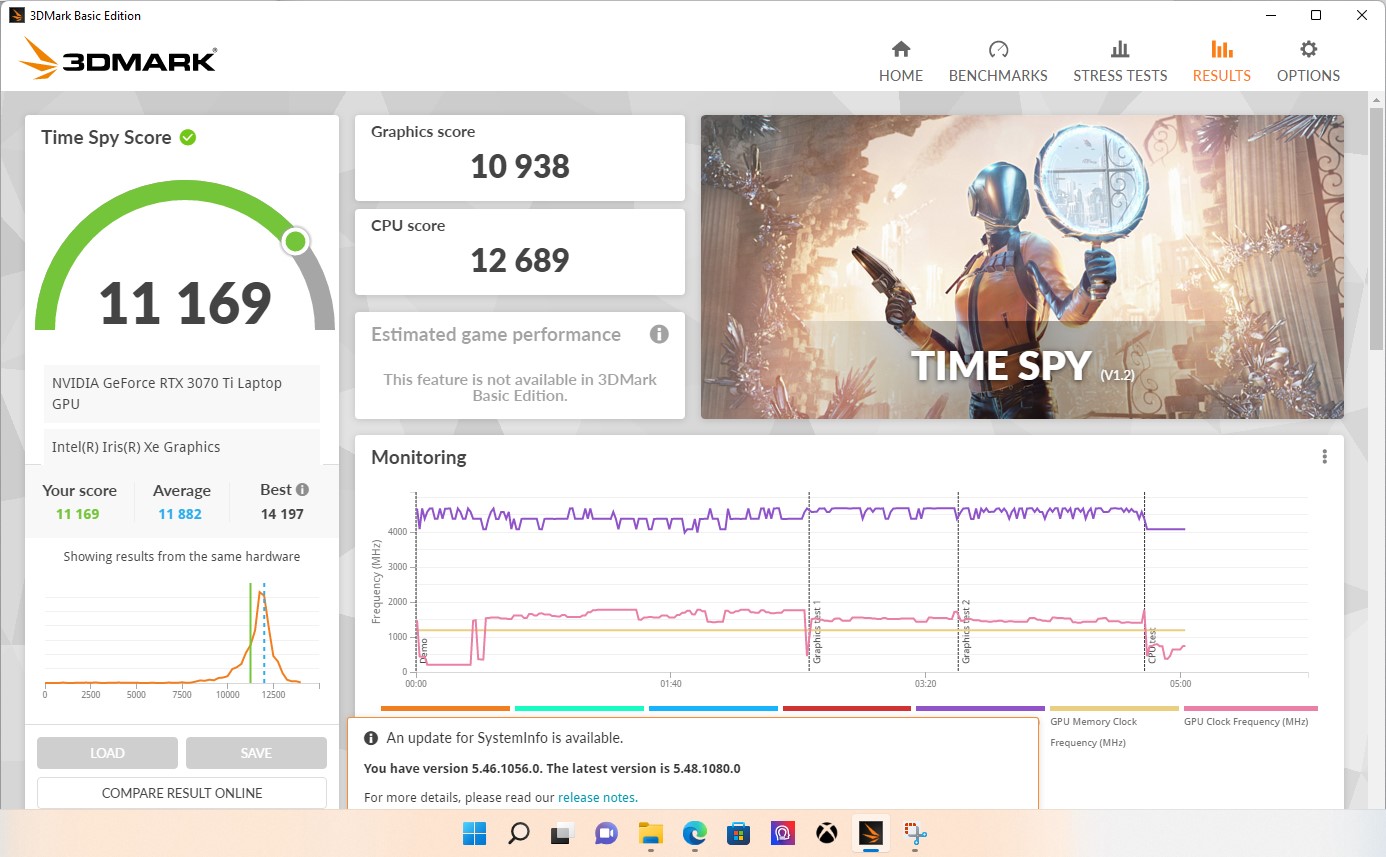
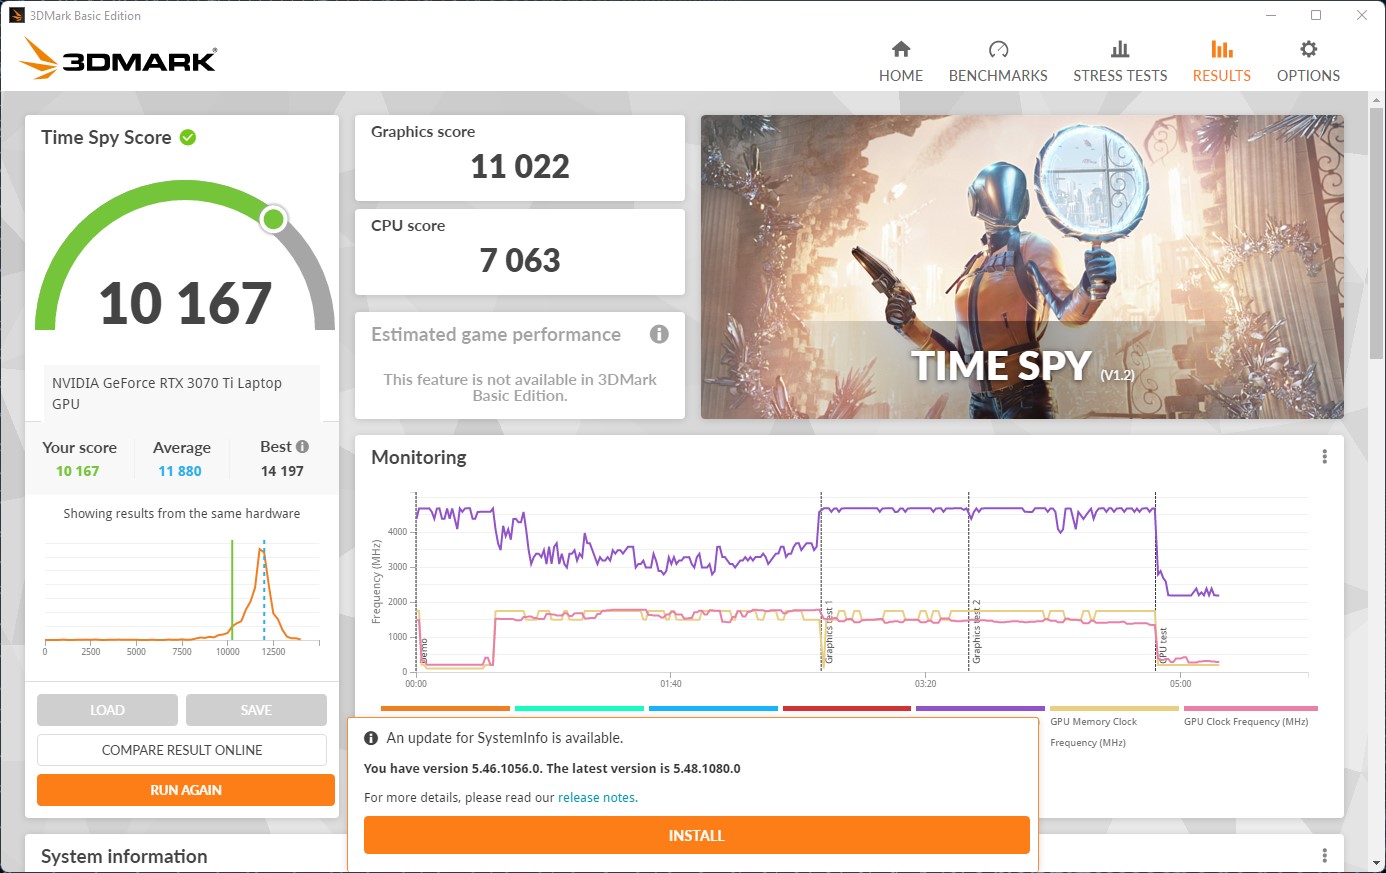
| 3DMark 11 Performance | 32326 punti | |
| 3DMark Fire Strike Score | 25633 punti | |
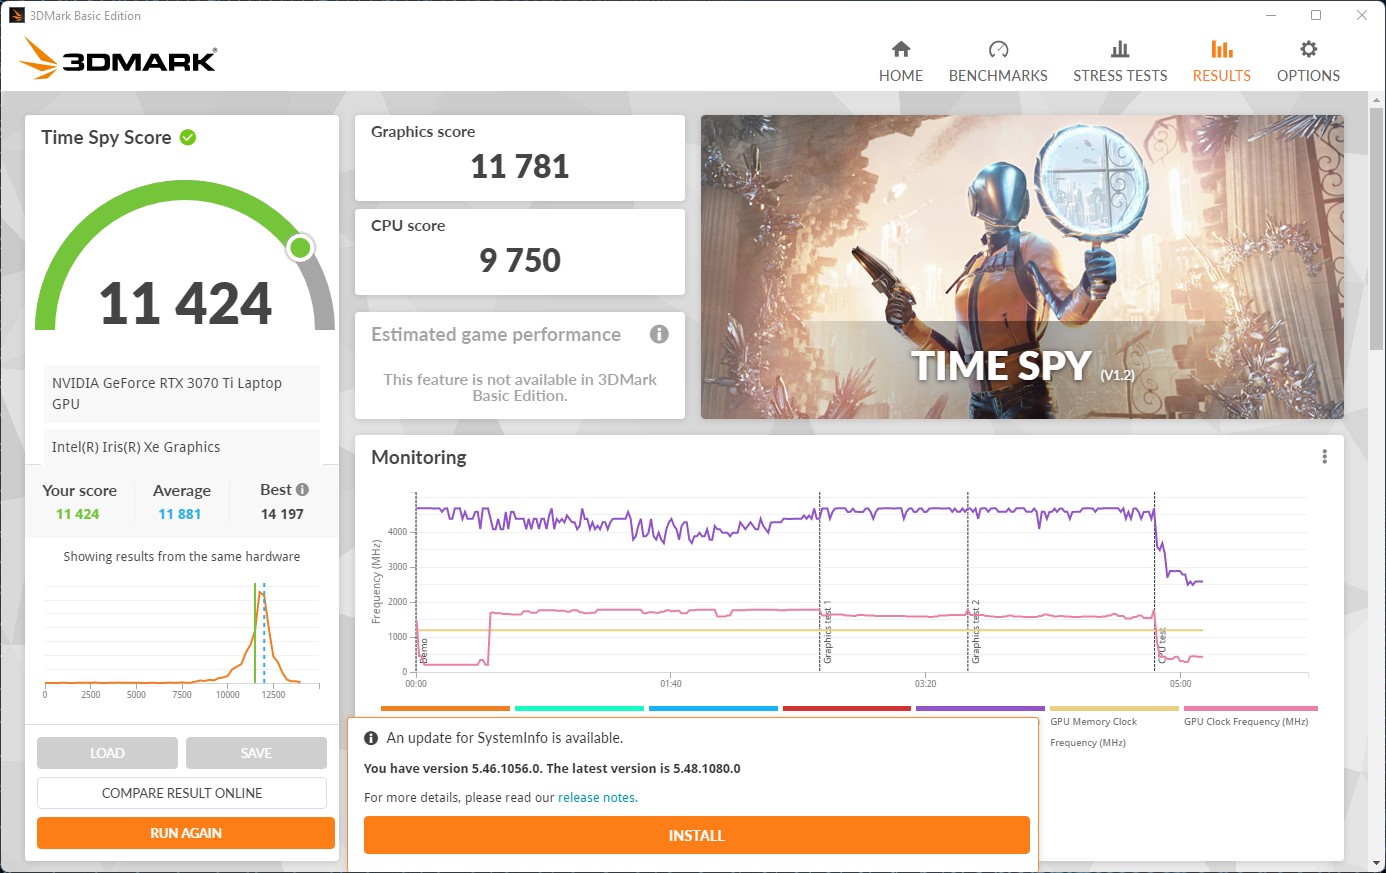
| 3DMark Time Spy Score | 11169 punti | |
Aiuto | ||
Prestazioni di gioco
Le solide prestazioni della RTX 3070 Ti con il suo TGP da 150 watt si riflettono anche nel gioco. Tutti i giochi funzionano con FPS elevati. Anche alle impostazioni massime e con un monitor esterno corrispondente, le risoluzioni 4K sono impeccabili.
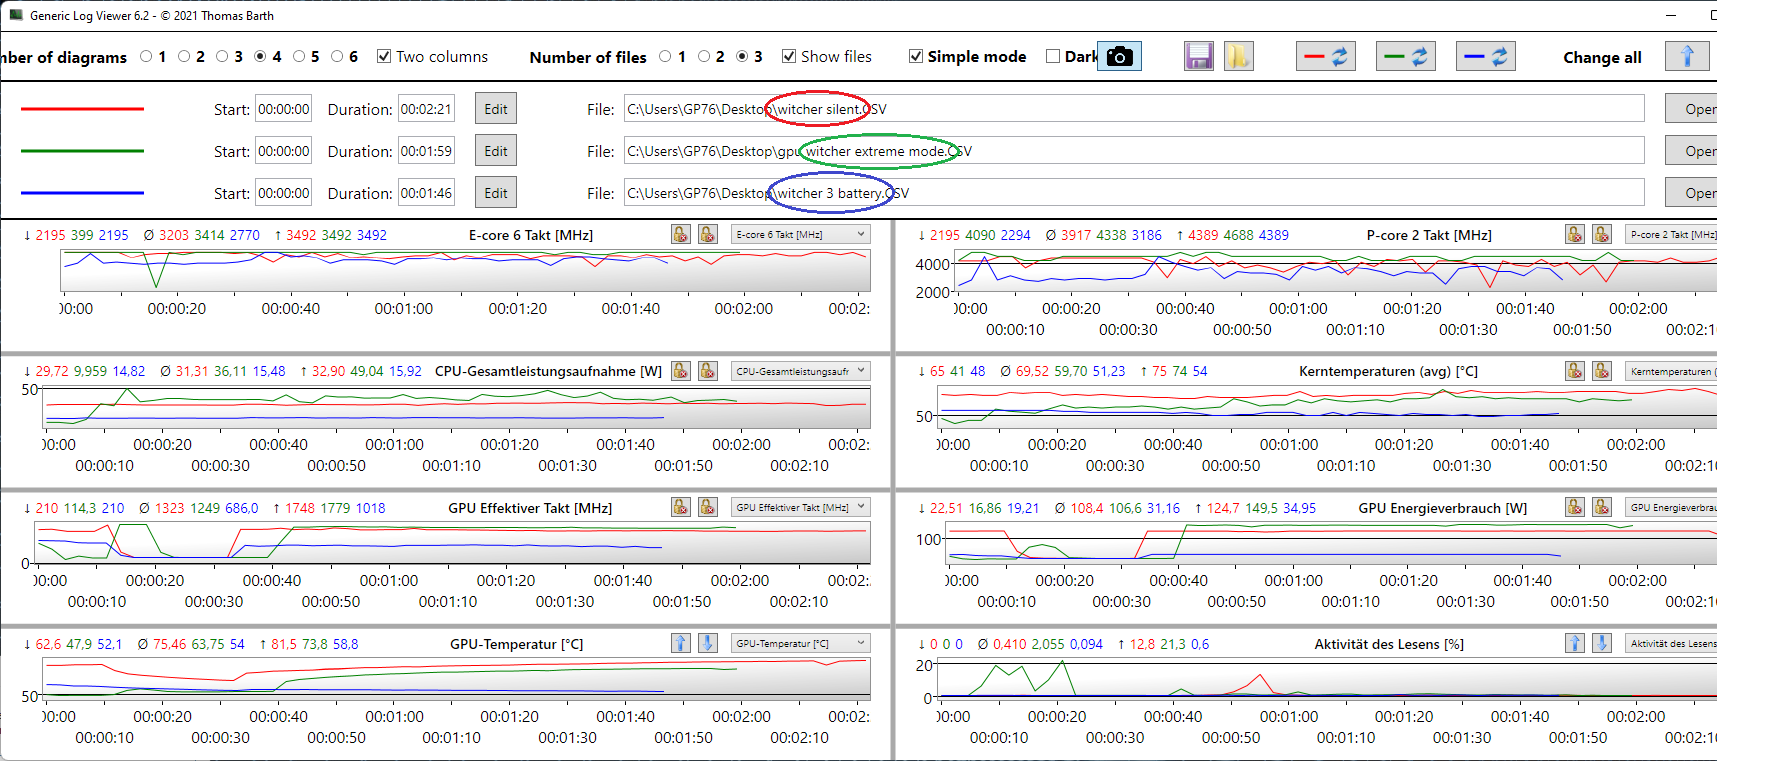
Mentre The Witcher 3 raggiunge i 113 FPS con le impostazioni massime @FHD, questi scendono leggermente a 105 FPS in modalità silenziosa e a poco meno di 24 FPS in modalità batteria, quindi bisogna ridurre notevolmente i dettagli senza un alimentatore esterno.
Il grafico seguente mostra le modalità "Extreme", "Silent" e "Battery". Il TGP scende a circa 125 watt in modalità Silent. L'orologio della GPU è quasi completamente utilizzato in modalità Extreme a 1.780 MHz.
| Elden Ring | |
| 1920x1080 High Preset | |
| MSI Vector GP76 12UGS-434 | |
| Media NVIDIA GeForce RTX 3070 Ti Laptop GPU (59.8 - 59.9, n=2) | |
| 1920x1080 Maximum Preset | |
| Media NVIDIA GeForce RTX 3070 Ti Laptop GPU (46.3 - 59.7, n=2) | |
| MSI Vector GP76 12UGS-434 | |
| Elex 2 | |
| 1920x1080 High / On AA:FX AF:16x | |
| MSI Vector GP76 12UGS-434 | |
| Media NVIDIA GeForce RTX 3070 Ti Laptop GPU (83 - 99.4, n=3) | |
| Aorus 17 XE4 | |
| 1920x1080 Ultra / On AA:SM AF:16x | |
| MSI Vector GP76 12UGS-434 | |
| Media NVIDIA GeForce RTX 3070 Ti Laptop GPU (75 - 89, n=3) | |
| Aorus 17 XE4 | |
Il grafico Witcher 3 non rivela cali di frame e stuttering nelle modalità testate.
Witcher 3 FPS Diagram
| basso | medio | alto | ultra | |
|---|---|---|---|---|
| GTA V (2015) | 179.1 | 167.9 | 109.7 | |
| The Witcher 3 (2015) | 219 | 112.8 | ||
| Dota 2 Reborn (2015) | 164.8 | 150.7 | 140.9 | 134.5 |
| Final Fantasy XV Benchmark (2018) | 107.7 | |||
| X-Plane 11.11 (2018) | 139.1 | 114.7 | 91.1 | |
| Far Cry 5 (2018) | 147 | 138 | ||
| Strange Brigade (2018) | 263 | 222 | 195.1 | |
| Shadow of the Tomb Raider (2018) | 131 | 129 | ||
| Elden Ring (2022) | 59.9 | 46.3 | ||
| Elex 2 (2022) | 99.4 | 89 |
Emissioni del Vector GP76: Modalità silenziosa per la vittoria
Rumore
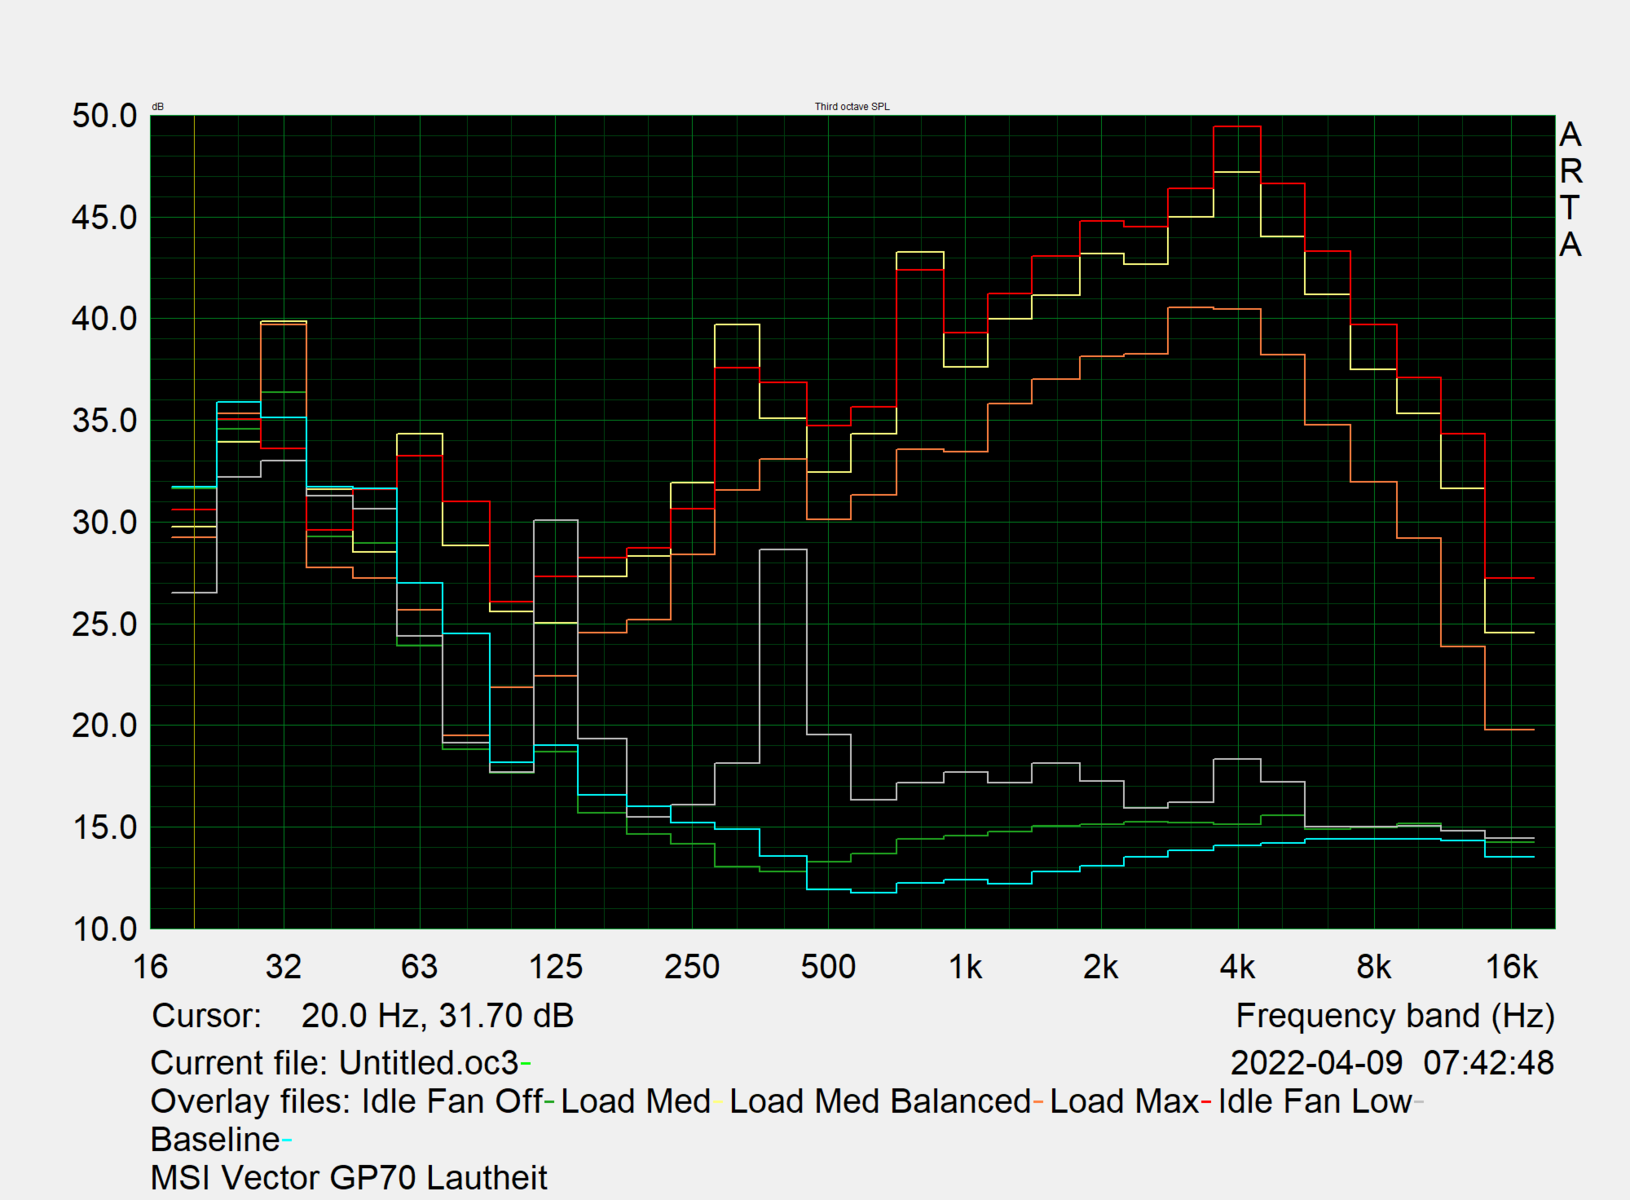
Quando è al minimo, l'MSI Vector GP76 è quasi silenzioso e, poiché la modalità Silent non limita le prestazioni della CPU, non c'è un rumore eccessivamente fastidioso della ventola sotto carico appropriato e non si sentono frequenze elevate.
Quando si gioca in modalità Extreme, tuttavia, il rumore diventa piuttosto forte, al punto da risultare fastidioso. In questo caso sarebbe opportuno utilizzare un sistema audio esterno o delle cuffie, oppure la modalità Silent. Ma anche in modalità Bilanciata, il rumore è molto migliore, con una perdita minima di prestazioni
Rumorosità
| Idle |
| 27 / 27 / 30.1 dB(A) |
| Sotto carico |
| 54.4 / 56.2 dB(A) |
 | ||
30 dB silenzioso 40 dB(A) udibile 50 dB(A) rumoroso |
||
min: | ||
| MSI Vector GP76 12UGS-434 GeForce RTX 3070 Ti Laptop GPU, i7-12700H, Micron 2450 1TB MTFDKBA1T0TFK | MSI GP76 Leopard 10UG GeForce RTX 3070 Laptop GPU, i7-10750H, Kingston OM8PCP3512F-AB | Asus ROG Strix G17 G713QE-RB74 GeForce RTX 3050 Ti Laptop GPU, R7 5800H, Samsung PM991 MZVLQ512HBLU | Aorus 17 XE4 GeForce RTX 3070 Ti Laptop GPU, i7-12700H, Gigabyte AG470S1TB-SI B10 | Schenker XMG NEO 17 GM7TG8S GeForce RTX 3080 Laptop GPU, i7-11800H, Samsung SSD 980 Pro 1TB MZ-V8P1T0BW | Lenovo Legion 5 Pro 16 G7 i7 RTX 3070Ti GeForce RTX 3070 Ti Laptop GPU, i7-12700H, Samsung PM9A1 MZVL21T0HCLR | Asus ROG Zephyrus M16 GU603H GeForce RTX 3070 Laptop GPU, i9-11900H, Samsung PM9A1 MZVL22T0HBLB | MSI Vector GP66 12UGS GeForce RTX 3070 Ti Laptop GPU, i9-12900H | |
|---|---|---|---|---|---|---|---|---|
| Noise | -2% | 13% | -0% | 16% | 2% | -6% | 13% | |
| off /ambiente * (dB) | 25.6 | 24 6% | 24.9 3% | 24 6% | 23 10% | 24.6 4% | 25 2% | 22.9 11% |
| Idle Minimum * (dB) | 27 | 25 7% | 25.1 7% | 30 -11% | 23 15% | 28.4 -5% | 25 7% | 23.4 13% |
| Idle Average * (dB) | 27 | 32 -19% | 25.1 7% | 31 -15% | 23 15% | 28.4 -5% | 31 -15% | 23.4 13% |
| Idle Maximum * (dB) | 30.1 | 34 -13% | 25.1 17% | 34 -13% | 23 24% | 28.4 6% | 42 -40% | 27.4 9% |
| Load Average * (dB) | 54.4 | 54 1% | 36.3 33% | 44 19% | 39.5 27% | 49.4 9% | 48 12% | 36 34% |
| Load Maximum * (dB) | 56.2 | 54 4% | 49.9 11% | 49 13% | 55.09 2% | 54.7 3% | 56 -0% | 58 -3% |
| Witcher 3 ultra * (dB) | 51 | 49.9 | 51 | 54.5 | 49.4 | 52 | 58.2 |
* ... Meglio usare valori piccoli
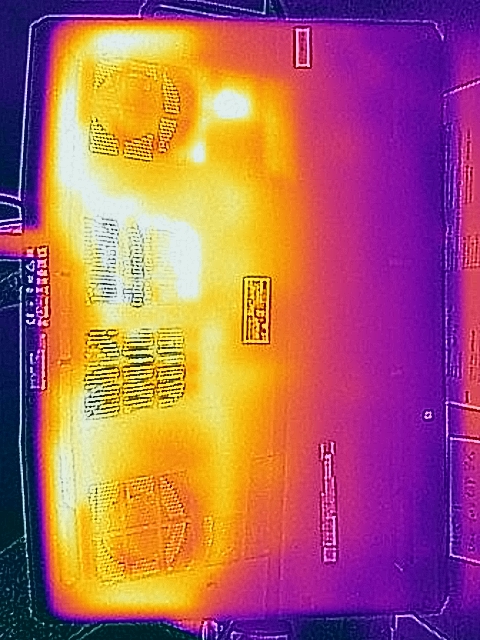
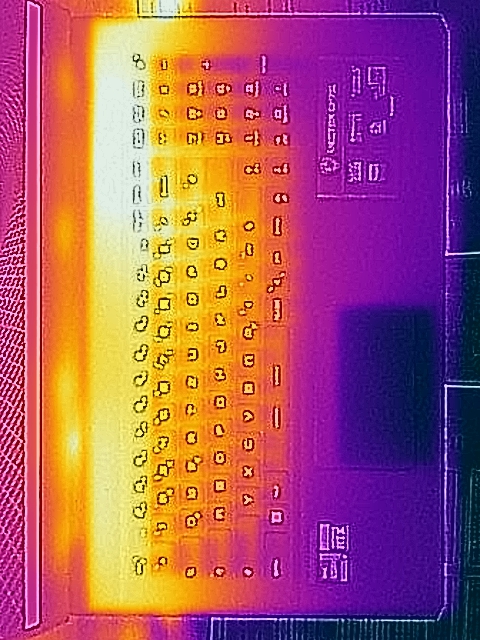
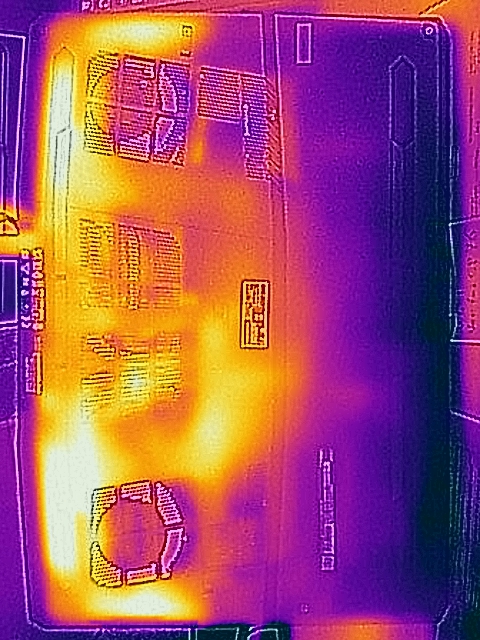
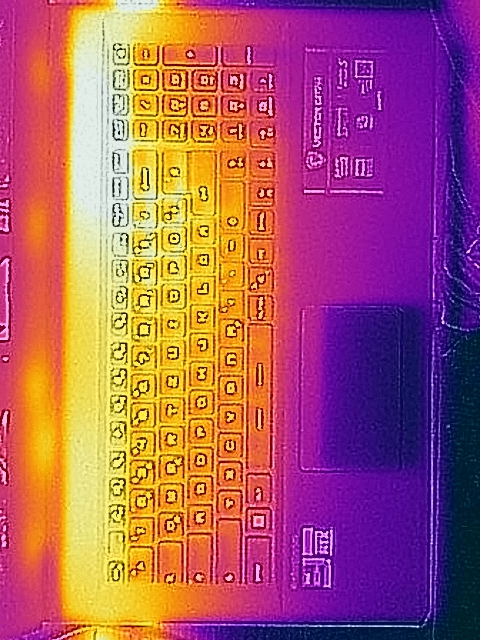
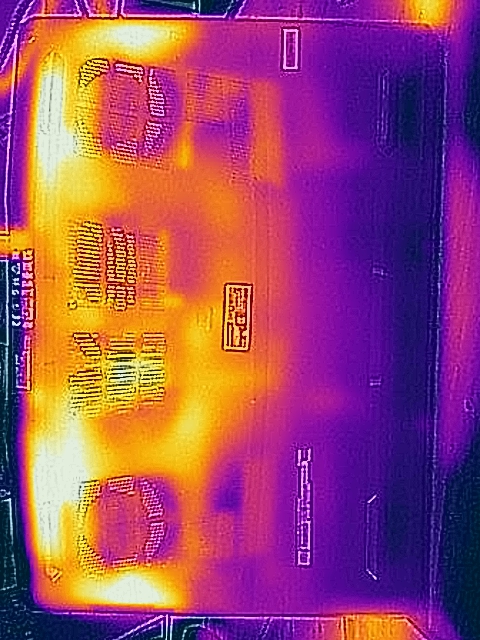
Temperatura
Il portatile da gioco di MSI è abbastanza fresco in ogni scenario, tranne che in modalità silenziosa durante il gioco, quando le ventole girano molto più lentamente. Tuttavia, le superfici non diventano mai troppo calde. I dispositivi più sottili comeMSI Stealth GS66 o il Razer Blade 15si scontrano con temperature significativamente più elevate.
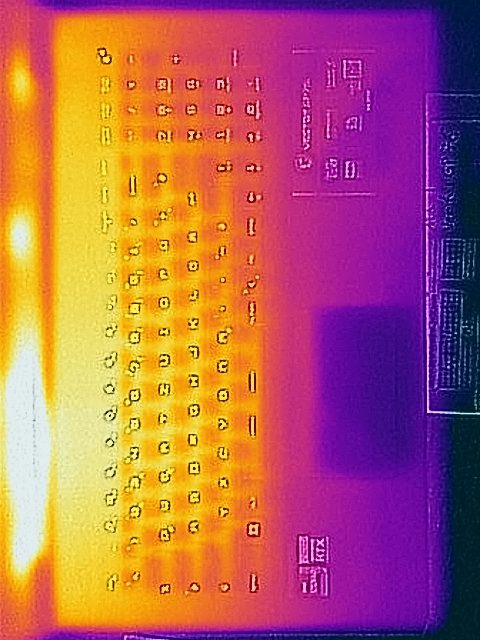
(-) La temperatura massima sul lato superiore è di 46.3 °C / 115 F, rispetto alla media di 40.4 °C / 105 F, che varia da 21.2 a 68.8 °C per questa classe Gaming.
(±) Il lato inferiore si riscalda fino ad un massimo di 45 °C / 113 F, rispetto alla media di 43.2 °C / 110 F
(+) In idle, la temperatura media del lato superiore è di 30.8 °C / 87 F, rispetto alla media deld ispositivo di 33.9 °C / 93 F.
(±) Riproducendo The Witcher 3, la temperatura media per il lato superiore e' di 34.8 °C / 95 F, rispetto alla media del dispositivo di 33.9 °C / 93 F.
(+) I poggiapolsi e il touchpad sono piu' freddi della temperatura della pelle con un massimo di 27.4 °C / 81.3 F e sono quindi freddi al tatto.
(±) La temperatura media della zona del palmo della mano di dispositivi simili e'stata di 28.8 °C / 83.8 F (+1.4 °C / 2.5 F).
| MSI Vector GP76 12UGS-434 Intel Core i7-12700H, NVIDIA GeForce RTX 3070 Ti Laptop GPU | MSI GP76 Leopard 10UG Intel Core i7-10750H, NVIDIA GeForce RTX 3070 Laptop GPU | Asus ROG Strix G17 G713QE-RB74 AMD Ryzen 7 5800H, NVIDIA GeForce RTX 3050 Ti Laptop GPU | Aorus 17 XE4 Intel Core i7-12700H, NVIDIA GeForce RTX 3070 Ti Laptop GPU | Schenker XMG NEO 17 GM7TG8S Intel Core i7-11800H, NVIDIA GeForce RTX 3080 Laptop GPU | Lenovo Legion 5 Pro 16 G7 i7 RTX 3070Ti Intel Core i7-12700H, NVIDIA GeForce RTX 3070 Ti Laptop GPU | Asus ROG Zephyrus M16 GU603H Intel Core i9-11900H, NVIDIA GeForce RTX 3070 Laptop GPU | MSI Vector GP66 12UGS Intel Core i9-12900H, NVIDIA GeForce RTX 3070 Ti Laptop GPU | |
|---|---|---|---|---|---|---|---|---|
| Heat | 7% | -0% | -2% | -12% | 0% | -12% | 4% | |
| Maximum Upper Side * (°C) | 46.3 | 43 7% | 43.8 5% | 50 -8% | 51 -10% | 45.3 2% | 52 -12% | 40.2 13% |
| Maximum Bottom * (°C) | 45 | 47 -4% | 47.2 -5% | 58 -29% | 62 -38% | 61.2 -36% | 53 -18% | 43.8 3% |
| Idle Upper Side * (°C) | 34.2 | 30 12% | 33.4 2% | 30 12% | 35 -2% | 28.6 16% | 38 -11% | 34.8 -2% |
| Idle Bottom * (°C) | 38.3 | 33 14% | 39.4 -3% | 32 16% | 38 1% | 31.4 18% | 41 -7% | 37 3% |
* ... Meglio usare valori piccoli
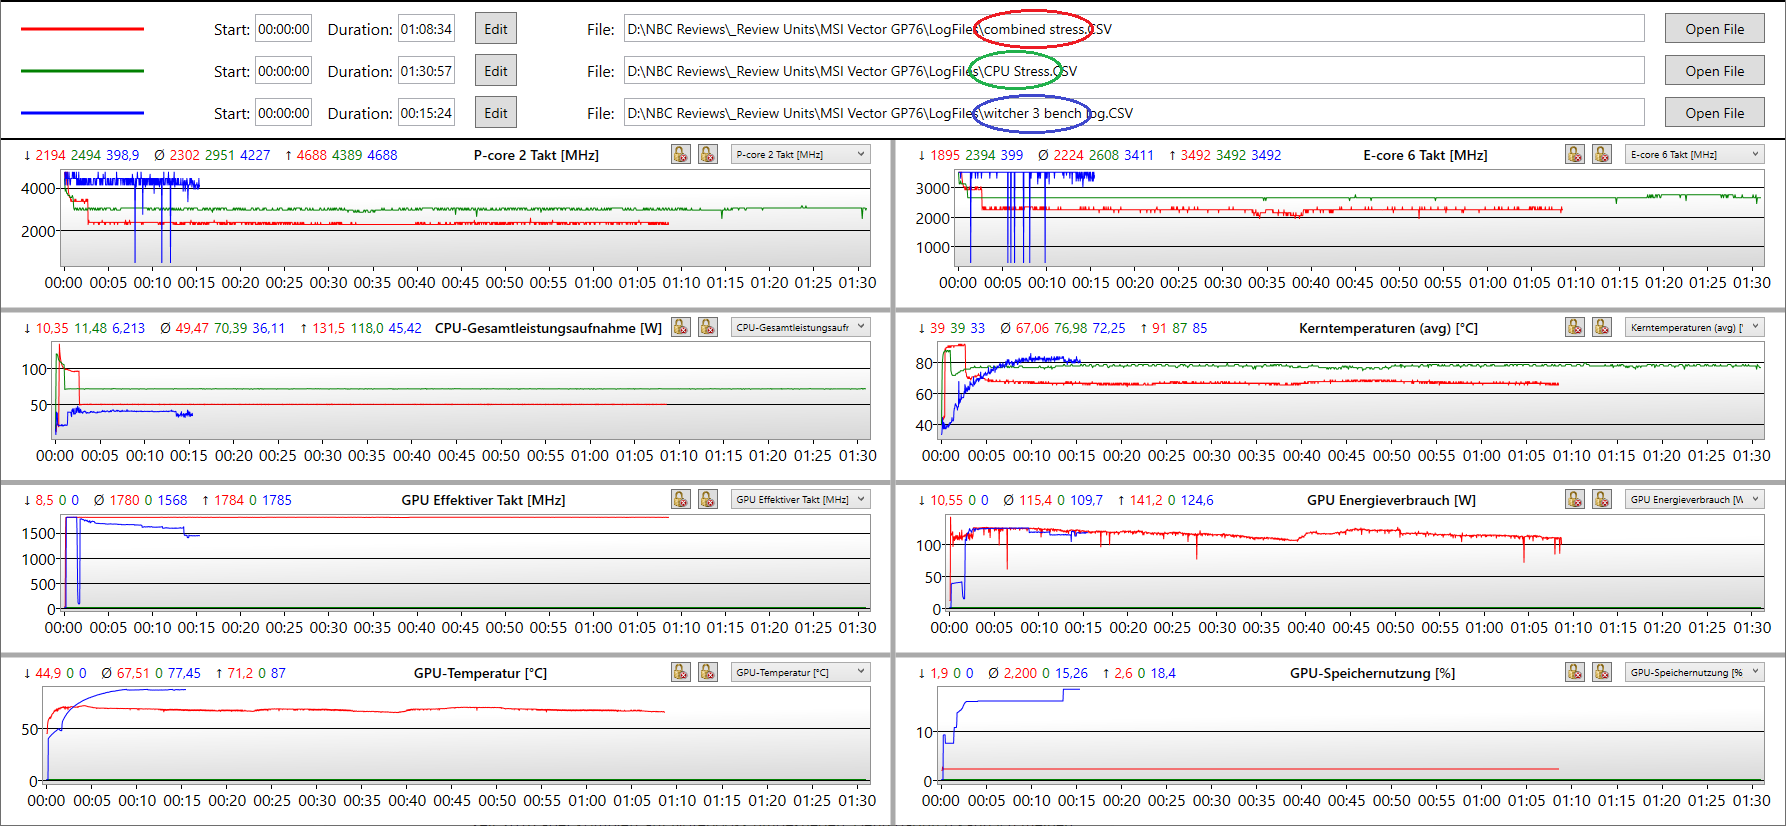
Stress test
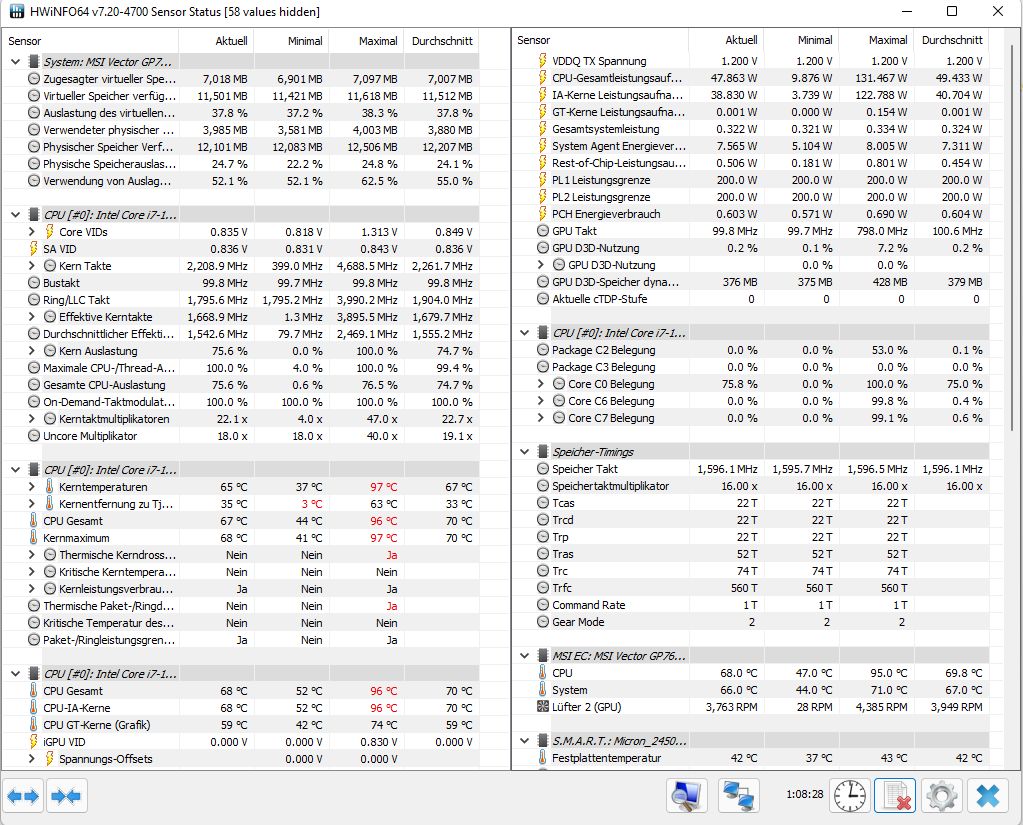
A 2,3 GHz, la CPU lavora solo 100 MHz al di sotto della velocità di clock di base nello stress test combinato (Prime95 + FurMark), mentre il più piccolo Vector GP66 gestisce solo 1 GHz. La GPU può funzionare alla massima velocità di clock anche in questo scenario estremo. Quindi il throttling non entra in gioco e non si nota alcuna riduzione delle prestazioni nel benchmark 3D subito dopo lo stress test.
Il processore è partito inizialmente con 131 watt, ma è stato rapidamente ridotto a 50 watt, mantenendo le temperature dei core molto basse. Anche le temperature della GPU Nvidia possono essere descritte come poco appariscenti, sebbene consumi ancora oltre 140 watt. In condizioni di puro stress per la CPU, la GPU si mantiene a 70 watt costanti (modalità estrema) e rimane abbastanza fresca a 76°C.
| Clock della CPU (GHz) | Clock della GPU (MHz) | Temperatura media della CPU (°C) | Temperatura media della GPU (°C) | |
| Sistema inattivo | -- | 200 | 36 | 40 |
| Stress Prime95 | 2,6 | 200 | 77 | -- |
| Prime95 + FurMark Stress | 2,2 | 1,780 | 67 | 68 |
| Witcher 3 Stress | 3.4 | 1.780 | 82 | 78 |
| Witcher 3 @Batteria | 3,2 | 1.000 | 51 | 59 |
Altoparlanti
Gli altoparlanti sono decenti, anche se Asus fa di meglio con il suoSerie SCARe. Ma sono sicuramente migliori della serie Aorus di Gigabyte.
Gli alti e i medi sono riprodotti molto bene, mentre i bassi sono rudimentali. Il volume massimo è buono. Non si può ottenere molto di più da un sistema di altoparlanti stereo con 2,5 watt.
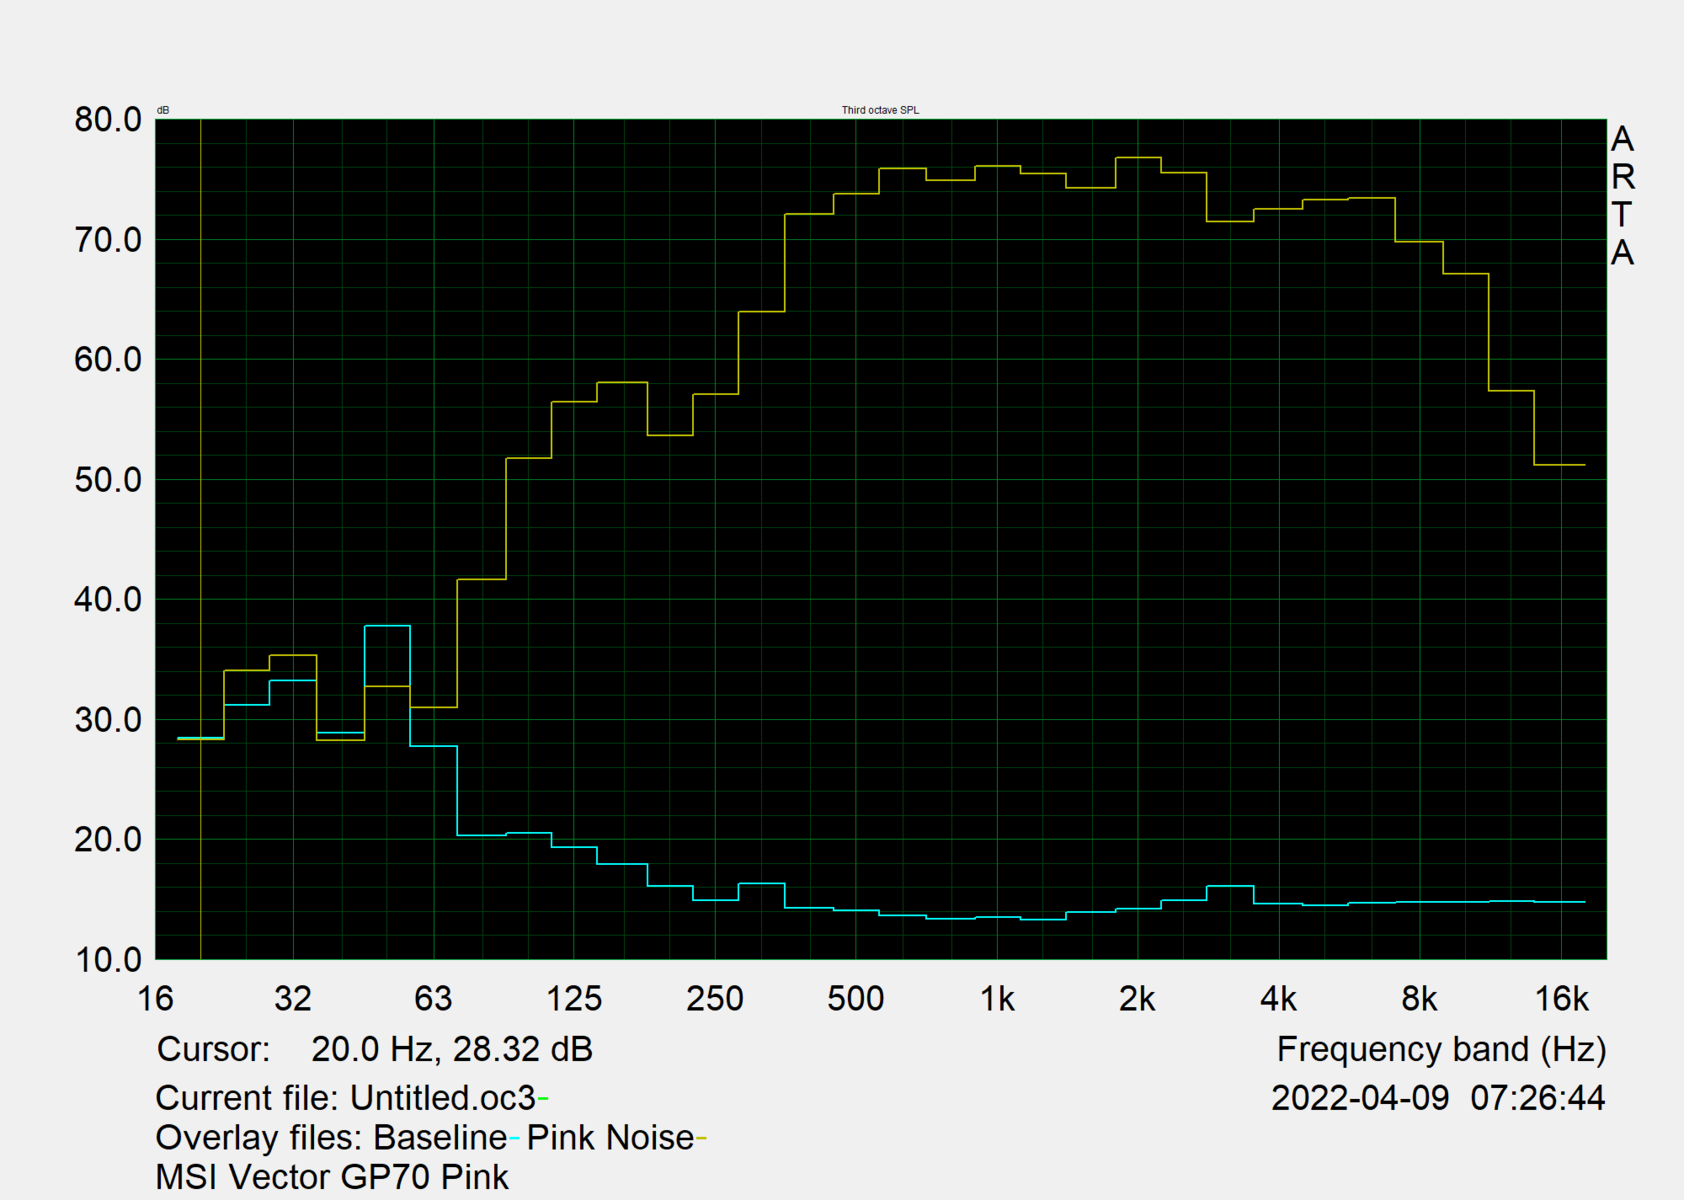
MSI Vector GP76 12UGS-434 analisi audio
(±) | potenza degli altiparlanti media ma buona (76.7 dB)
Bassi 100 - 315 Hz
(-) | quasi nessun basso - in media 15.3% inferiori alla media
(±) | la linearità dei bassi è media (9% delta rispetto alla precedente frequenza)
Medi 400 - 2000 Hz
(+) | medi bilanciati - solo only 2.8% rispetto alla media
(+) | medi lineari (4% delta rispetto alla precedente frequenza)
Alti 2 - 16 kHz
(+) | Alti bilanciati - appena 2% dalla media
(+) | alti lineari (3.4% delta rispetto alla precedente frequenza)
Nel complesso 100 - 16.000 Hz
(+) | suono nel complesso lineare (12.6% differenza dalla media)
Rispetto alla stessa classe
» 16% di tutti i dispositivi testati in questa classe è stato migliore, 3% simile, 81% peggiore
» Il migliore ha avuto un delta di 6%, medio di 18%, peggiore di 132%
Rispetto a tutti i dispositivi testati
» 11% di tutti i dispositivi testati in questa classe è stato migliore, 2% similare, 86% peggiore
» Il migliore ha avuto un delta di 4%, medio di 24%, peggiore di 134%
Asus ROG Strix G17 G713QE-RB74 analisi audio
(±) | potenza degli altiparlanti media ma buona (73.5 dB)
Bassi 100 - 315 Hz
(±) | bassi ridotti - in media 13% inferiori alla media
(±) | la linearità dei bassi è media (9.8% delta rispetto alla precedente frequenza)
Medi 400 - 2000 Hz
(±) | medi elevati - circa 5.6% superiore alla media
(+) | medi lineari (6.5% delta rispetto alla precedente frequenza)
Alti 2 - 16 kHz
(+) | Alti bilanciati - appena 3.4% dalla media
(±) | la linearità degli alti è media (12% delta rispetto alla precedente frequenza)
Nel complesso 100 - 16.000 Hz
(±) | la linearità complessiva del suono è media (16.9% di differenza rispetto alla media
Rispetto alla stessa classe
» 44% di tutti i dispositivi testati in questa classe è stato migliore, 11% simile, 45% peggiore
» Il migliore ha avuto un delta di 6%, medio di 18%, peggiore di 132%
Rispetto a tutti i dispositivi testati
» 30% di tutti i dispositivi testati in questa classe è stato migliore, 8% similare, 62% peggiore
» Il migliore ha avuto un delta di 4%, medio di 24%, peggiore di 134%
Gestione dell'alimentazione: MSI migliora la durata della batteria del Vector GP76
Consumo di energia
Per una macchina da gioco, il consumo in idle di 15,6 watt è da medio a buono, mentre il consumo in standby di 0,5 watt è piacevole e promette un'autonomia di oltre 5 giorni (di solito molto più lunga nella pratica).
Il consumo massimo permanente in condizioni di carico e gioco combinato è di poco inferiore a 200 watt. In linea di principio, un valore elevato è positivo, in quanto significa che la GPU può consumare molta energia e quindi lavorare più velocemente. In condizioni di puro carico della CPU, il valore (secondo HWInfo) dovrebbe essere compreso tra 50 e 80 watt, a seconda della modalità.
In modalità Balanced e Silent, i valori di consumo sono inferiori secondo la tabella precedente ("Condizioni di test"). Un picco di carico di poco meno di 320 watt si verifica solo molto brevemente all'inizio dello stress test combinato e non si verifica nell'uso quotidiano. Nel complesso, l'alimentatore da 280 watt è sufficientemente dimensionato.
| Off / Standby | |
| Idle | |
| Sotto carico |
|
Leggenda:
min: | |
| MSI Vector GP76 12UGS-434 i7-12700H, GeForce RTX 3070 Ti Laptop GPU, Micron 2450 1TB MTFDKBA1T0TFK, IPS, 1920x1080, 17.3" | MSI GP76 Leopard 10UG i7-10750H, GeForce RTX 3070 Laptop GPU, Kingston OM8PCP3512F-AB, IPS, 1920x1080, 17.3" | Asus ROG Strix G17 G713QE-RB74 R7 5800H, GeForce RTX 3050 Ti Laptop GPU, Samsung PM991 MZVLQ512HBLU, IPS, 1920x1080, 17.3" | Aorus 17 XE4 i7-12700H, GeForce RTX 3070 Ti Laptop GPU, Gigabyte AG470S1TB-SI B10, IPS, 1920x1080, 17.3" | Schenker XMG NEO 17 GM7TG8S i7-11800H, GeForce RTX 3080 Laptop GPU, Samsung SSD 980 Pro 1TB MZ-V8P1T0BW, IPS, 2560x1440, 17.3" | Lenovo Legion 5 Pro 16 G7 i7 RTX 3070Ti i7-12700H, GeForce RTX 3070 Ti Laptop GPU, Samsung PM9A1 MZVL21T0HCLR, IPS, 2560x1600, 16" | Asus ROG Zephyrus M16 GU603H i9-11900H, GeForce RTX 3070 Laptop GPU, Samsung PM9A1 MZVL22T0HBLB, IPS, 2560x1600, 16" | MSI Vector GP66 12UGS i9-12900H, GeForce RTX 3070 Ti Laptop GPU, , IPS, 1920x1080, 15.6" | Media NVIDIA GeForce RTX 3070 Ti Laptop GPU | Media della classe Gaming | |
|---|---|---|---|---|---|---|---|---|---|---|
| Power Consumption | 10% | 29% | -12% | -12% | 12% | 8% | -24% | -0% | 6% | |
| Idle Minimum * (Watt) | 13.5 | 12 11% | 9.2 32% | 20 -48% | 19 -41% | 8.6 36% | 11 19% | 17.5 -30% | 14.2 ? -5% | 13.2 ? 2% |
| Idle Average * (Watt) | 15.6 | 16 -3% | 12.6 19% | 23 -47% | 25 -60% | 17.6 -13% | 20 -28% | 20.1 -29% | 19.9 ? -28% | 18.9 ? -21% |
| Idle Maximum * (Watt) | 20.6 | 28 -36% | 23.3 -13% | 28 -36% | 28 -36% | 18.5 10% | 30 -46% | 47.3 -130% | 26.2 ? -27% | 24.3 ? -18% |
| Load Average * (Watt) | 198 | 92 54% | 89.3 55% | 120 39% | 105 47% | 110 44% | 111 44% | 107.3 46% | 125.8 ? 36% | 108 ? 45% |
| Witcher 3 ultra * (Watt) | 199 | 198 1% | 136 32% | 196 2% | 223 -12% | 227 -14% | 156 22% | 225 -13% | ||
| Load Maximum * (Watt) | 319 | 210 34% | 162.7 49% | 257 19% | 226 29% | 294.6 8% | 197 38% | 277.7 13% | 248 ? 22% | 254 ? 20% |
* ... Meglio usare valori piccoli
Power Consumption Witcher 3 / Stress test
Power Consumption with external monitor
Durata della batteria
La durata della batteria è migliorata in media del 20% rispetto al predecessore. Il resto del campo di prova non offre molto di più anche con batterie più potenti, a parte il sottileZephyrus M16.
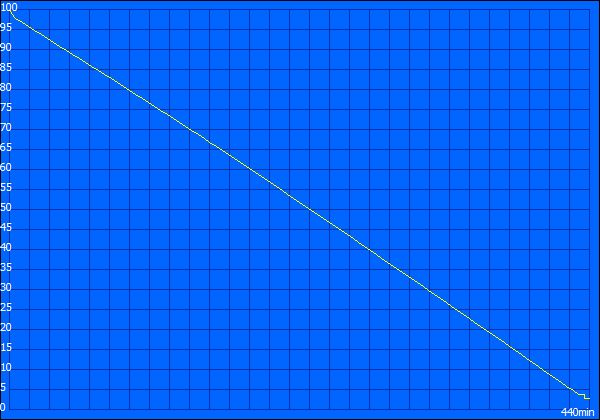
Nel nostro test WLAN sono state raggiunte poco più di 5 ore con una luminosità di 150 cd/m² in modalità prestazioni bilanciate di Windows. La batteria da 65 Wh ha richiesto quasi 2,5 ore per essere ricaricata completamente. Si tratta di un tempo significativamente più lungo rispetto a molti altri notebook di qualsiasi categoria.
| MSI Vector GP76 12UGS-434 i7-12700H, GeForce RTX 3070 Ti Laptop GPU, 65 Wh | MSI GP76 Leopard 10UG i7-10750H, GeForce RTX 3070 Laptop GPU, 65 Wh | Asus ROG Strix G17 G713QE-RB74 R7 5800H, GeForce RTX 3050 Ti Laptop GPU, 56 Wh | Aorus 17 XE4 i7-12700H, GeForce RTX 3070 Ti Laptop GPU, 99 Wh | Schenker XMG NEO 17 GM7TG8S i7-11800H, GeForce RTX 3080 Laptop GPU, 62 Wh | Lenovo Legion 5 Pro 16 G7 i7 RTX 3070Ti i7-12700H, GeForce RTX 3070 Ti Laptop GPU, 80 Wh | Asus ROG Zephyrus M16 GU603H i9-11900H, GeForce RTX 3070 Laptop GPU, 90 Wh | MSI Vector GP66 12UGS i9-12900H, GeForce RTX 3070 Ti Laptop GPU, 65 Wh | Media della classe Gaming | |
|---|---|---|---|---|---|---|---|---|---|
| Autonomia della batteria | -31% | 12% | 4% | -17% | -30% | 42% | -7% | 14% | |
| Reader / Idle (h) | 7.3 | 5.6 -23% | 11.1 52% | 8.6 18% | 13.3 82% | 7.9 8% | 8.71 ? 19% | ||
| WiFi v1.3 (h) | 5.1 | 4.2 -18% | 6 18% | 5.1 0% | 3.7 -27% | 5.4 6% | 7.7 51% | 5.7 12% | 7.02 ? 38% |
| Load (h) | 1.7 | 0.8 -53% | 1.1 -35% | 1.6 -6% | 1.6 -6% | 0.6 -65% | 1.6 -6% | 1 -41% | 1.47 ? -14% |
| H.264 (h) | 6.1 | 3.7 | 6.3 | 8.26 ? |
Pro
Contro
Verdetto: prestazioni al top su tutti i livelli grazie alla grafica MSI Vector
I vantaggi sono evidenti: il Vector GP76 è un vero e proprio gamer con il suo display a 360 Hz e tempi di risposta rapidissimi. Inoltre, il Core i7-12700H ha una potenza doppia rispetto alla CPU del suo predecessore e un altro punto di forza è rappresentato dalla Nvidia RTX 3070 Ti con un consumo reale di 150 watt. Ciò colloca il dispositivo nella fascia alta del nostro database.
Il Vector è anche in grado di operare in modo piuttosto silenzioso, offre una gamma sonora completa, una migliore autonomia della batteria, una tastiera RGB configurabile con i tasti, uno chassis molto stabile e buone opzioni di aggiornamento. Inoltre, il display produce un'immagine piacevole, ricca e chiara, ma potrebbe essere un po' più luminoso e offrire risoluzioni più elevate come opzioni.
L'MSI Vector GP76 opera con velocità su tutti i livelli: Display, CPU e GPU con TGP da 150 watt. Le critiche riguardano solo aree minori, come lo schermo un po' scuro.
Inoltre, non c'è Thunderbolt e non c'è Power Delivery via USB-C. L'alimentatore è pesante e ingombrante e non c'è un lettore di schede SD. L'unità SSD non è la più veloce sul mercato e le prestazioni si riducono notevolmente in modalità batteria. Inoltre, il prezzo attuale di 2.649 dollari è un po' alto.
Se si riesce a convivere con queste limitazioni, si ottiene una macchina da gioco molto solida. In alternativa, potete scegliere Zephyrus M16 se per voi la compattezza è più importante delle prestazioni, oppure Legion 5 Pro per un valore migliore, uno schermo più luminoso, una tastiera migliore e il Core i9 scatenato. Anche Asus ROG Strix G17 è una buona scelta con la giusta configurazione (display QHD + RTX 3070) perché non solo è conveniente ed estremamente robusto, ma è anche molto silenzioso e fresco grazie ad AMD. Ha anche la migliore tastiera della sua categoria.
Prezzo e disponibilità
Il nostro modello recensito (12UGS-434) non sembra essere disponibile al di fuori della Germania al momento della pubblicazione. Amazon US offre invece due varianti: 12UGS-298 e 12UGS-61. Il primo è dotato di un Intel i7-12700H e il secondo di un Intel i9-12900HK . I prezzi partono rispettivamente da 2.449,00 e 2.649,00 dollari e sono soggetti a variazioni a seconda della configurazione SSD scelta.
MSI Vector GP76 12UGS-434
- 05/06/2022 v7 (old)
Marvin Gollor
Price comparison

