Recensione del portatile MSI Vector GP66 12UGS: 150 W TGP GeForce RTX 3070 Ti sweet spot
MSI è stata una delle prime grandi aziende a rendere disponibili i portatili da gioco di 12a generazione Alder Lake-H all'inizio del mese scorso. Anche se i nuovi modelli MSI sono quasi visivamente identici ai modelli di 11a generazione dello scorso anno, portano con sé CPU e GPU più veloci e nuove opzioni di visualizzazione che gli appassionati possono apprezzare.
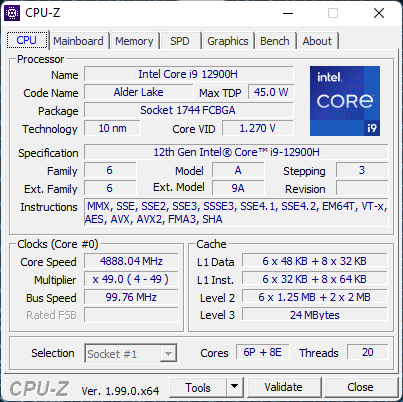
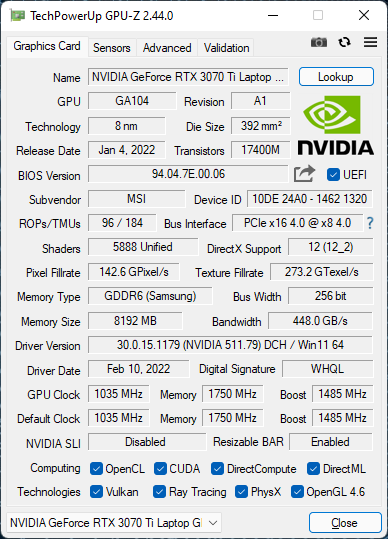
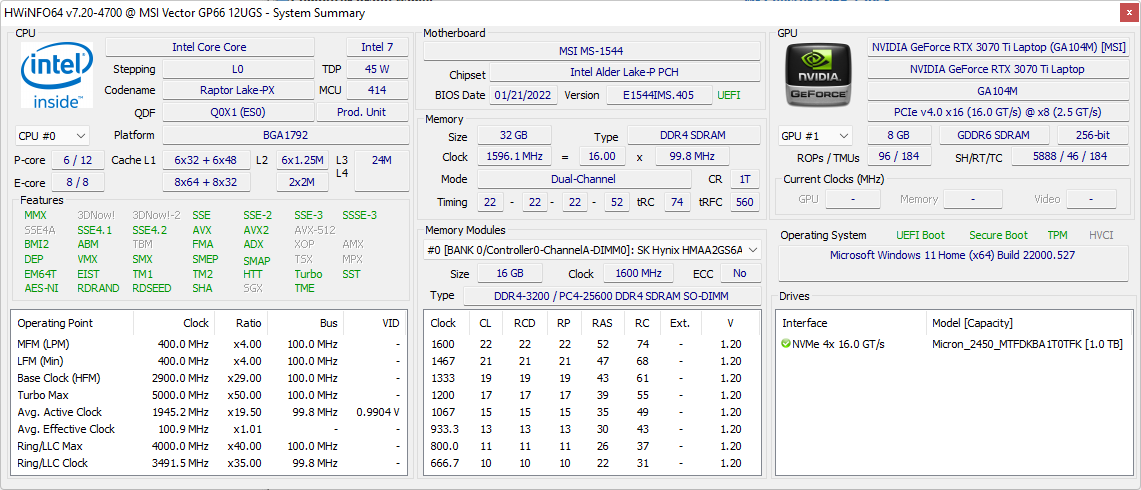
L'unità in esame oggi è il Vector GP66 che succede al GP66 Leopard. La nostra configurazione specifica con la CPU Core i9-12900H, 150 W GeForce RTX 3070 Ti GPU, 32 GB di RAM, 360 Hz 1080p IPS display, e 1 TB NVMe SSD può essere trovato online per circa $2400 USD. Altre SKU sono disponibili con RTX 3060, RTX 3080, display QHD 165 Hz o FHD 144 Hz, o Core i7-12700H invece.
Le alternative all'MSI Vector includono altri portatili da gioco da 15,6 pollici di fascia media superiore come la Asus ROG Strix, Razer Blade 15 Modello Base, Dell serie G15, o il Lenovo Legion S7 serie. L'MSI Vector non deve essere confuso con il Maingear Vector.
Altre recensioni su MSI:
Potenziali concorrenti a confronto
Punteggio | Data | Modello | Peso | Altezza | Dimensione | Risoluzione | Prezzo |
|---|---|---|---|---|---|---|---|
| 86.9 % v7 (old) | 03/2022 | MSI Vector GP66 12UGS i9-12900H, GeForce RTX 3070 Ti Laptop GPU | 2.3 kg | 23.4 mm | 15.60" | 1920x1080 | |
| 85.4 % v7 (old) | 12/2021 | MSI GP66 Leopard 11UH-028 i7-11800H, GeForce RTX 3080 Laptop GPU | 2.3 kg | 23.4 mm | 15.60" | 1920x1080 | |
| 79.2 % v7 (old) | 09/2021 | MSI Katana GF66 11UG-220 i7-11800H, GeForce RTX 3070 Laptop GPU | 2.3 kg | 25 mm | 15.60" | 1920x1080 | |
| 85.9 % v7 (old) | 06/2021 | Asus TUF Gaming F15 FX506HM i7-11800H, GeForce RTX 3060 Laptop GPU | 2.3 kg | 24.9 mm | 15.60" | 1920x1080 | |
| 85.5 % v7 (old) | 03/2021 | Razer Blade 15 Base Edition 2021, i7-10750H RTX 3060 i7-10750H, GeForce RTX 3060 Laptop GPU | 2.1 kg | 19.9 mm | 15.60" | 1920x1080 | |
| 84.7 % v7 (old) | 06/2021 | Alienware m15 R5 Ryzen Edition R7 5800H, GeForce RTX 3060 Laptop GPU | 2.5 kg | 22.85 mm | 15.60" | 1920x1080 |
Caso
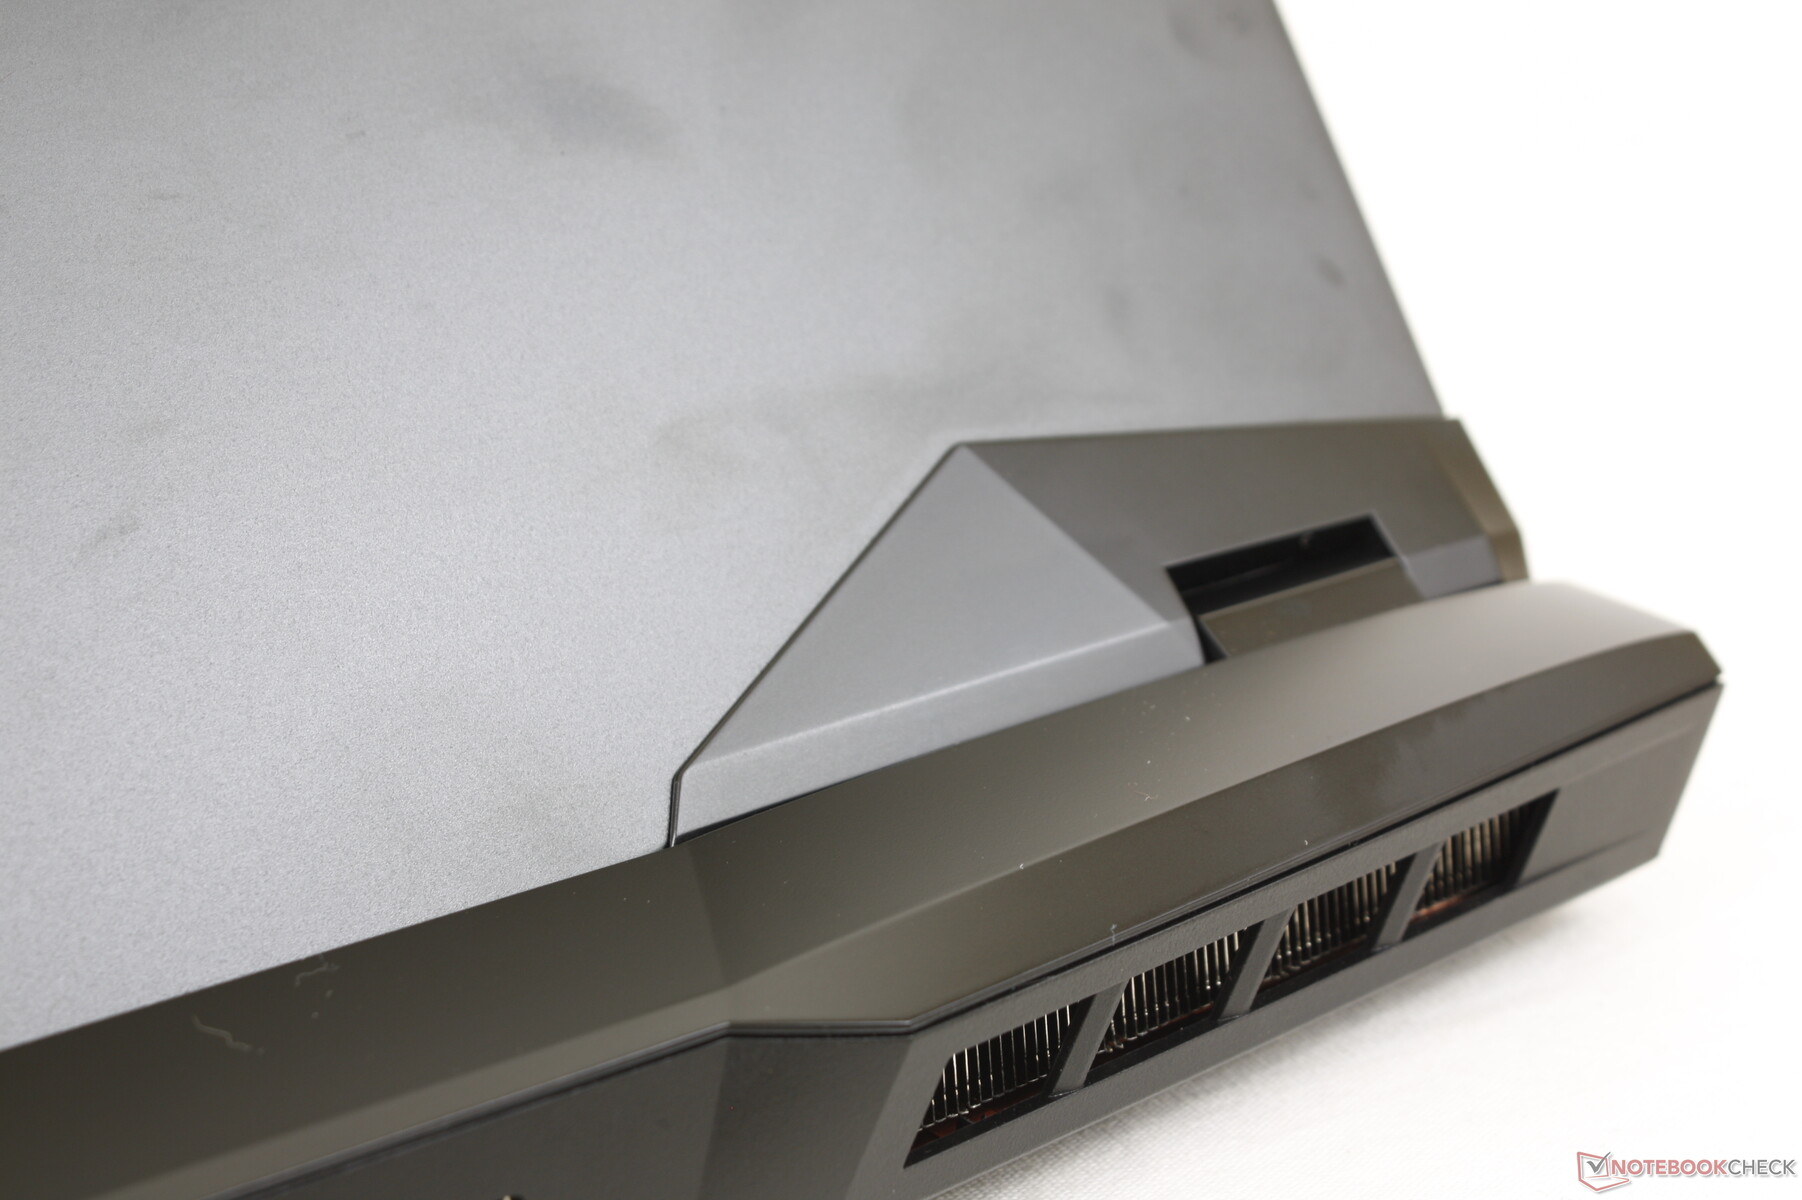
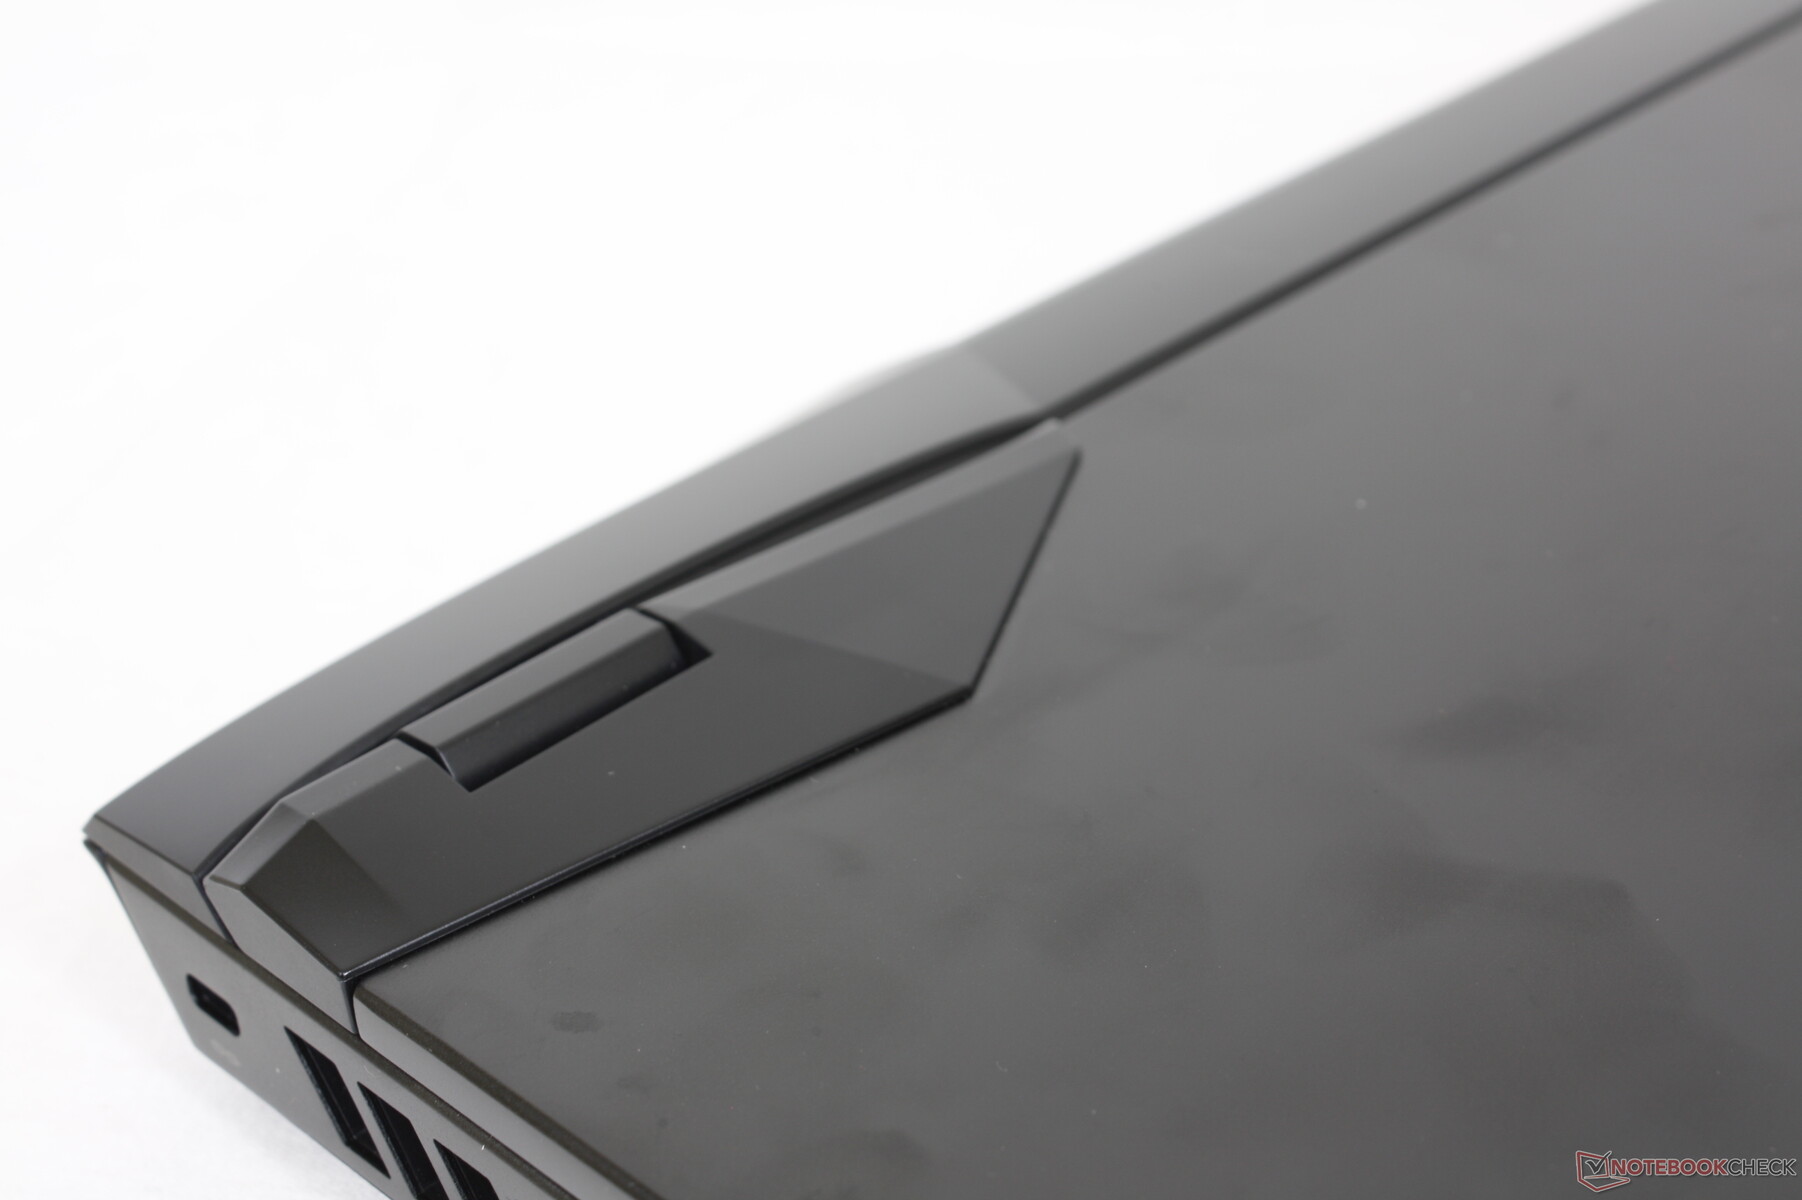
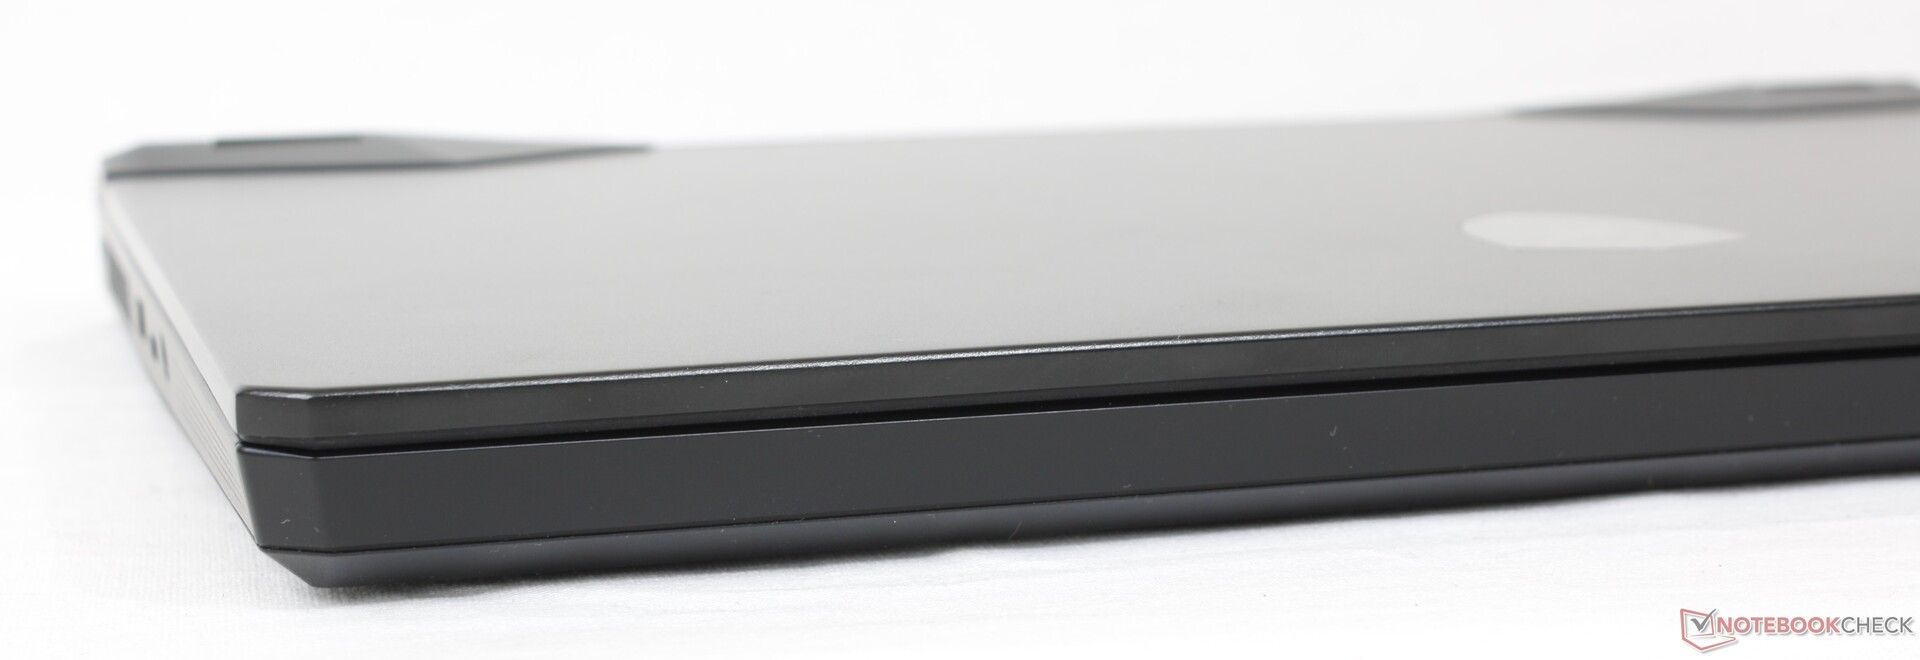
MSI ha ridisegnato il suo GP66 all'inizio dell'anno scorso e quindi è ancora troppo presto per un altro aggiornamento visivo. Pertanto, si consiglia di controllare le nostre recensioni esistenti sul GP66 con Intel 10th gen e GP66 con Intel di 11a generazione dato che la maggior parte dei nostri commenti sul telaio sono ancora validi per il nostro modello GP66 12th gen Intel. Ci sono ancora alcune differenze minori per quanto riguarda le porte, tuttavia, che esamineremo nella prossima sezione.
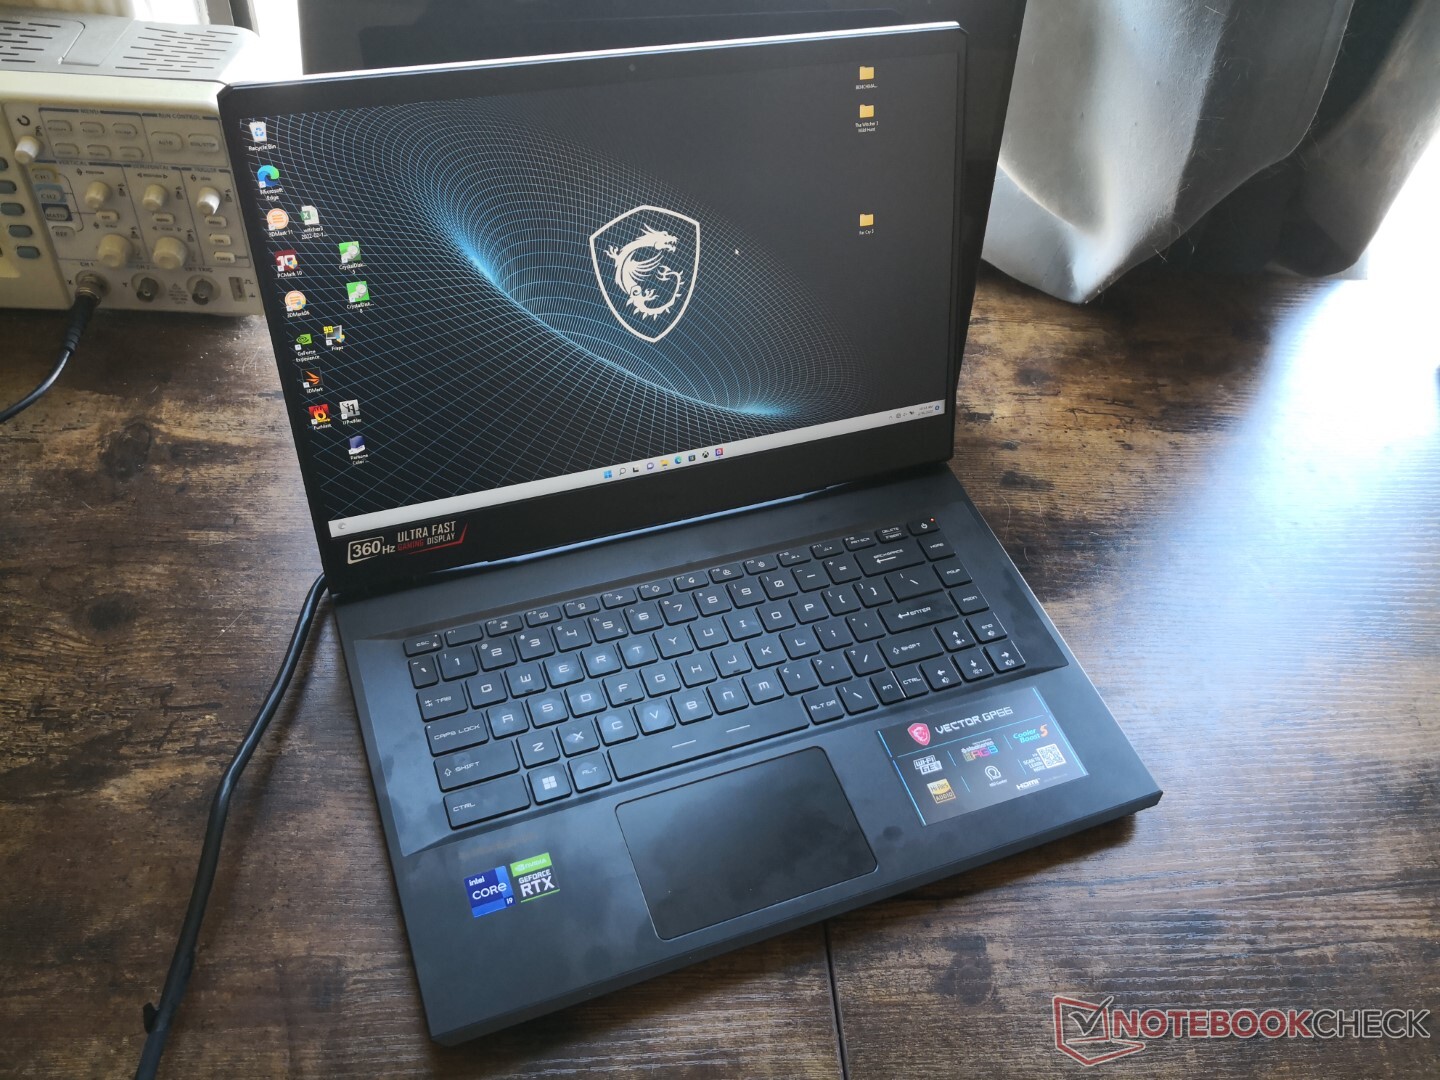
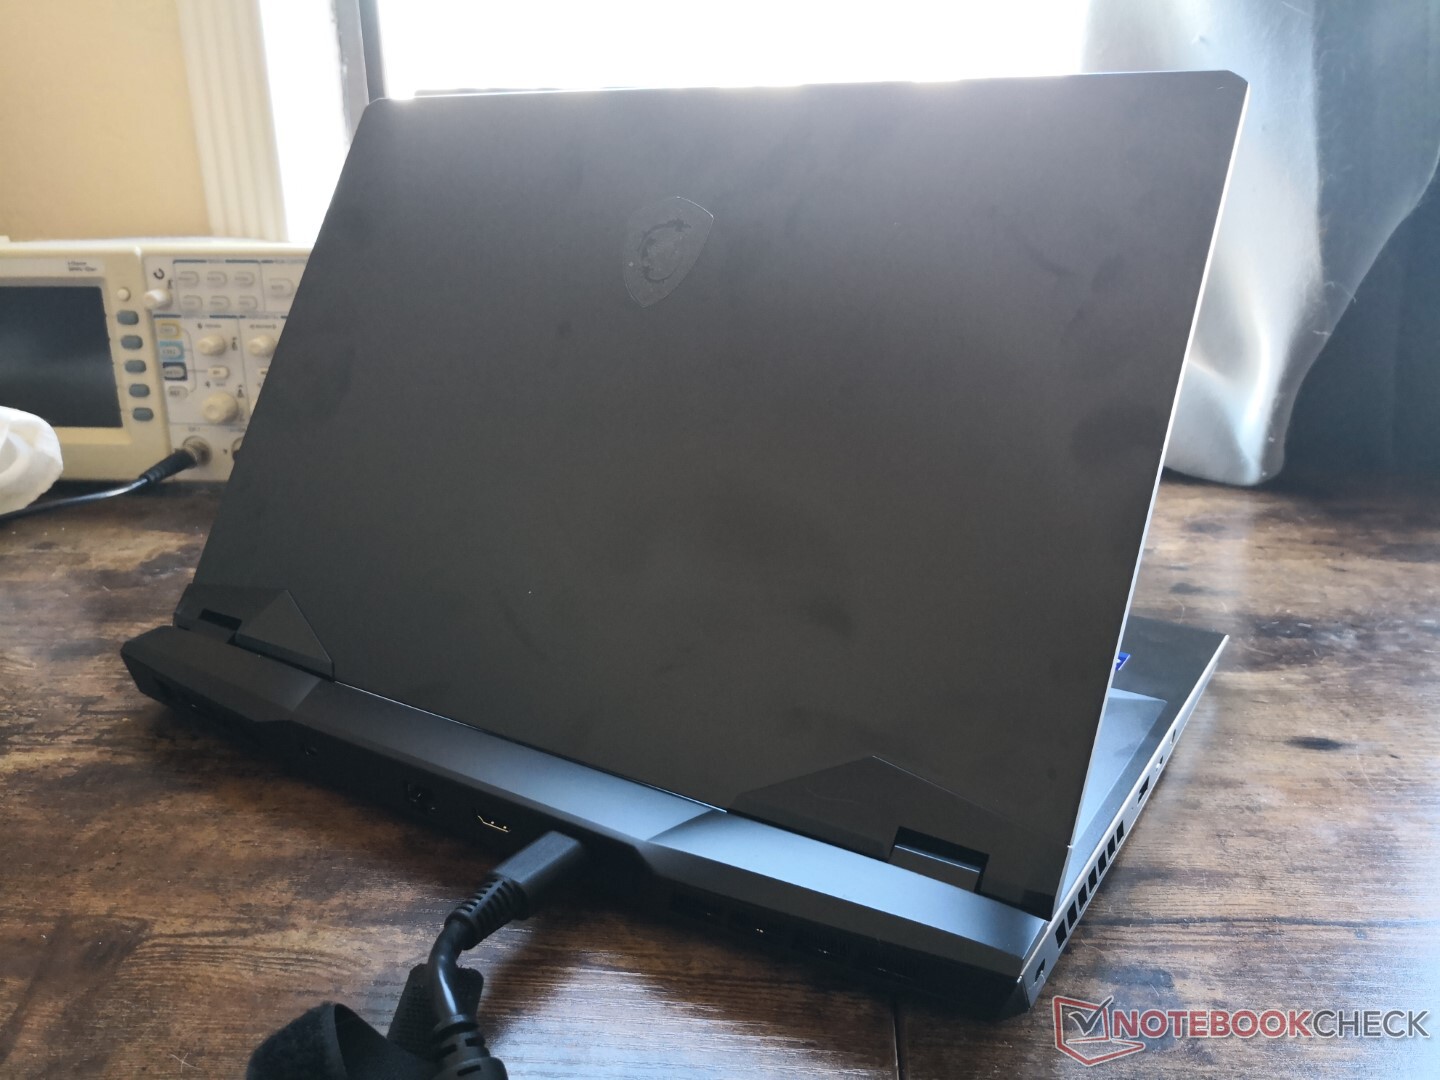
La mancanza di grandi cambiamenti significa che il Vector GP66 2022 soffre ancora degli stessi difetti che abbiamo trovato sul nostro GP66 Leopard 2021. In particolare, il pezzo del bordo anteriore della nostra unità a volte si allentava per lasciare delle prime impressioni non proprio positive. Il design visivo è altrimenti un derivato più elegante e sottile della più grande serie GE o GT.
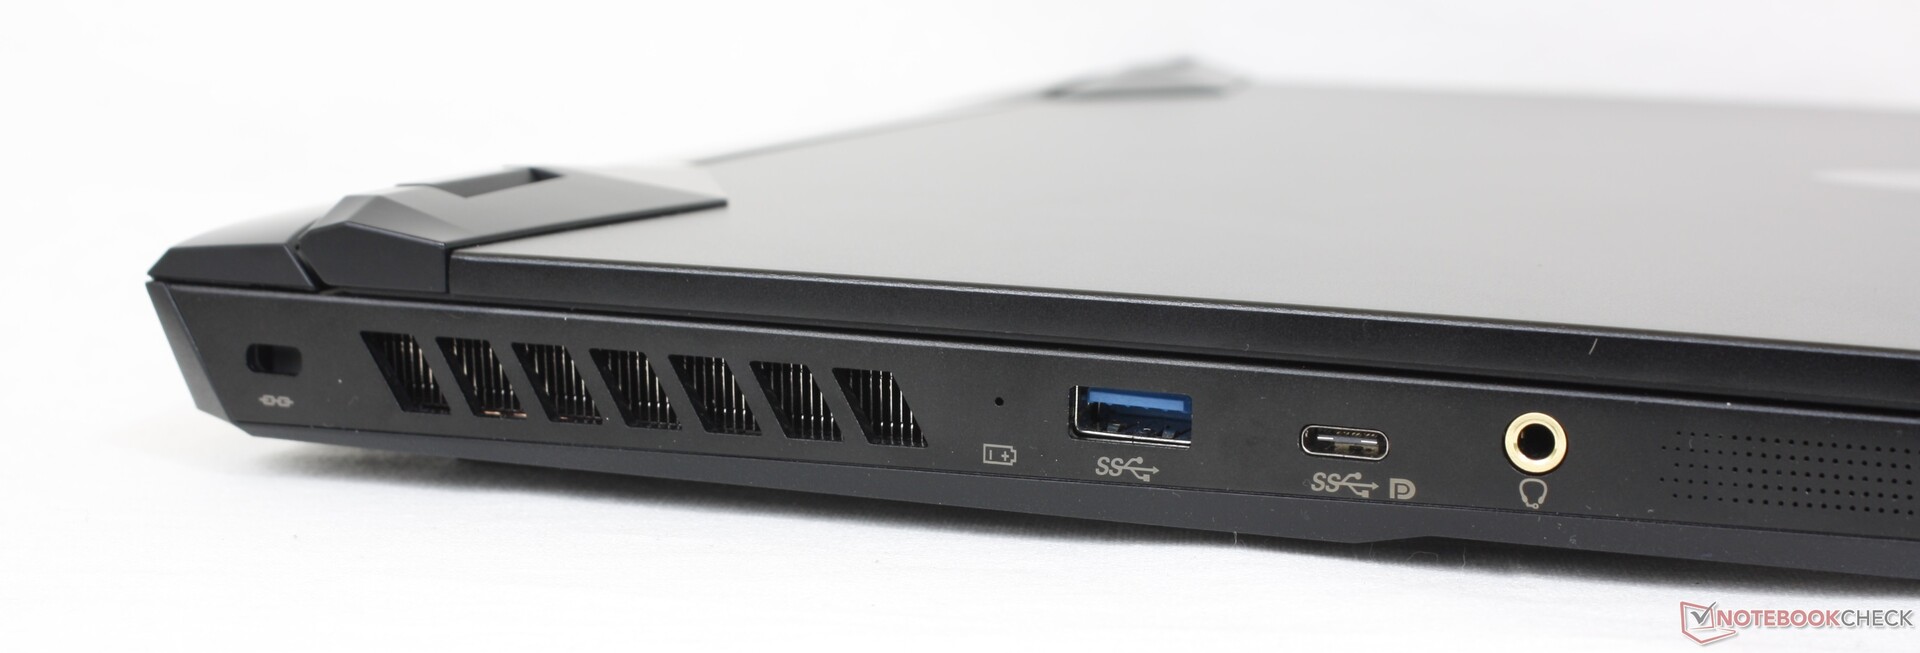
Connettività
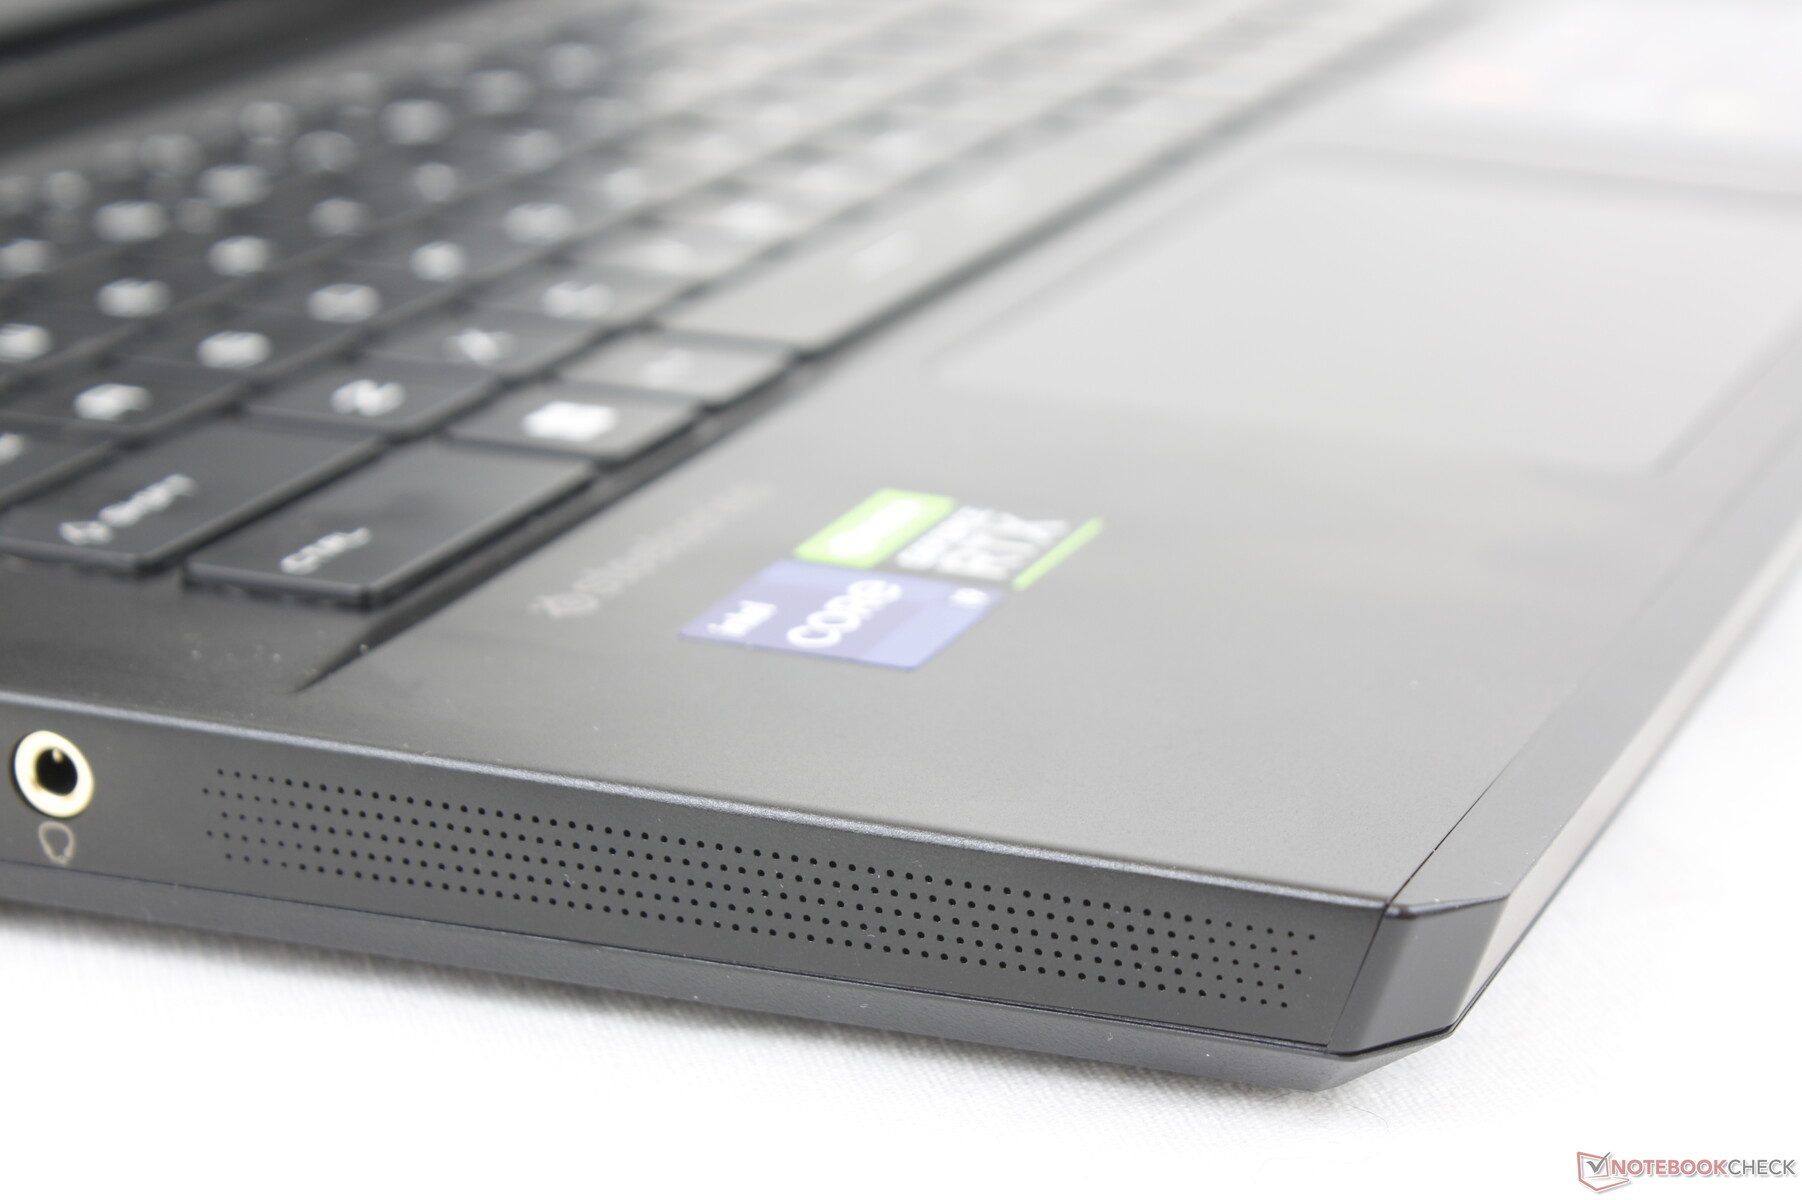
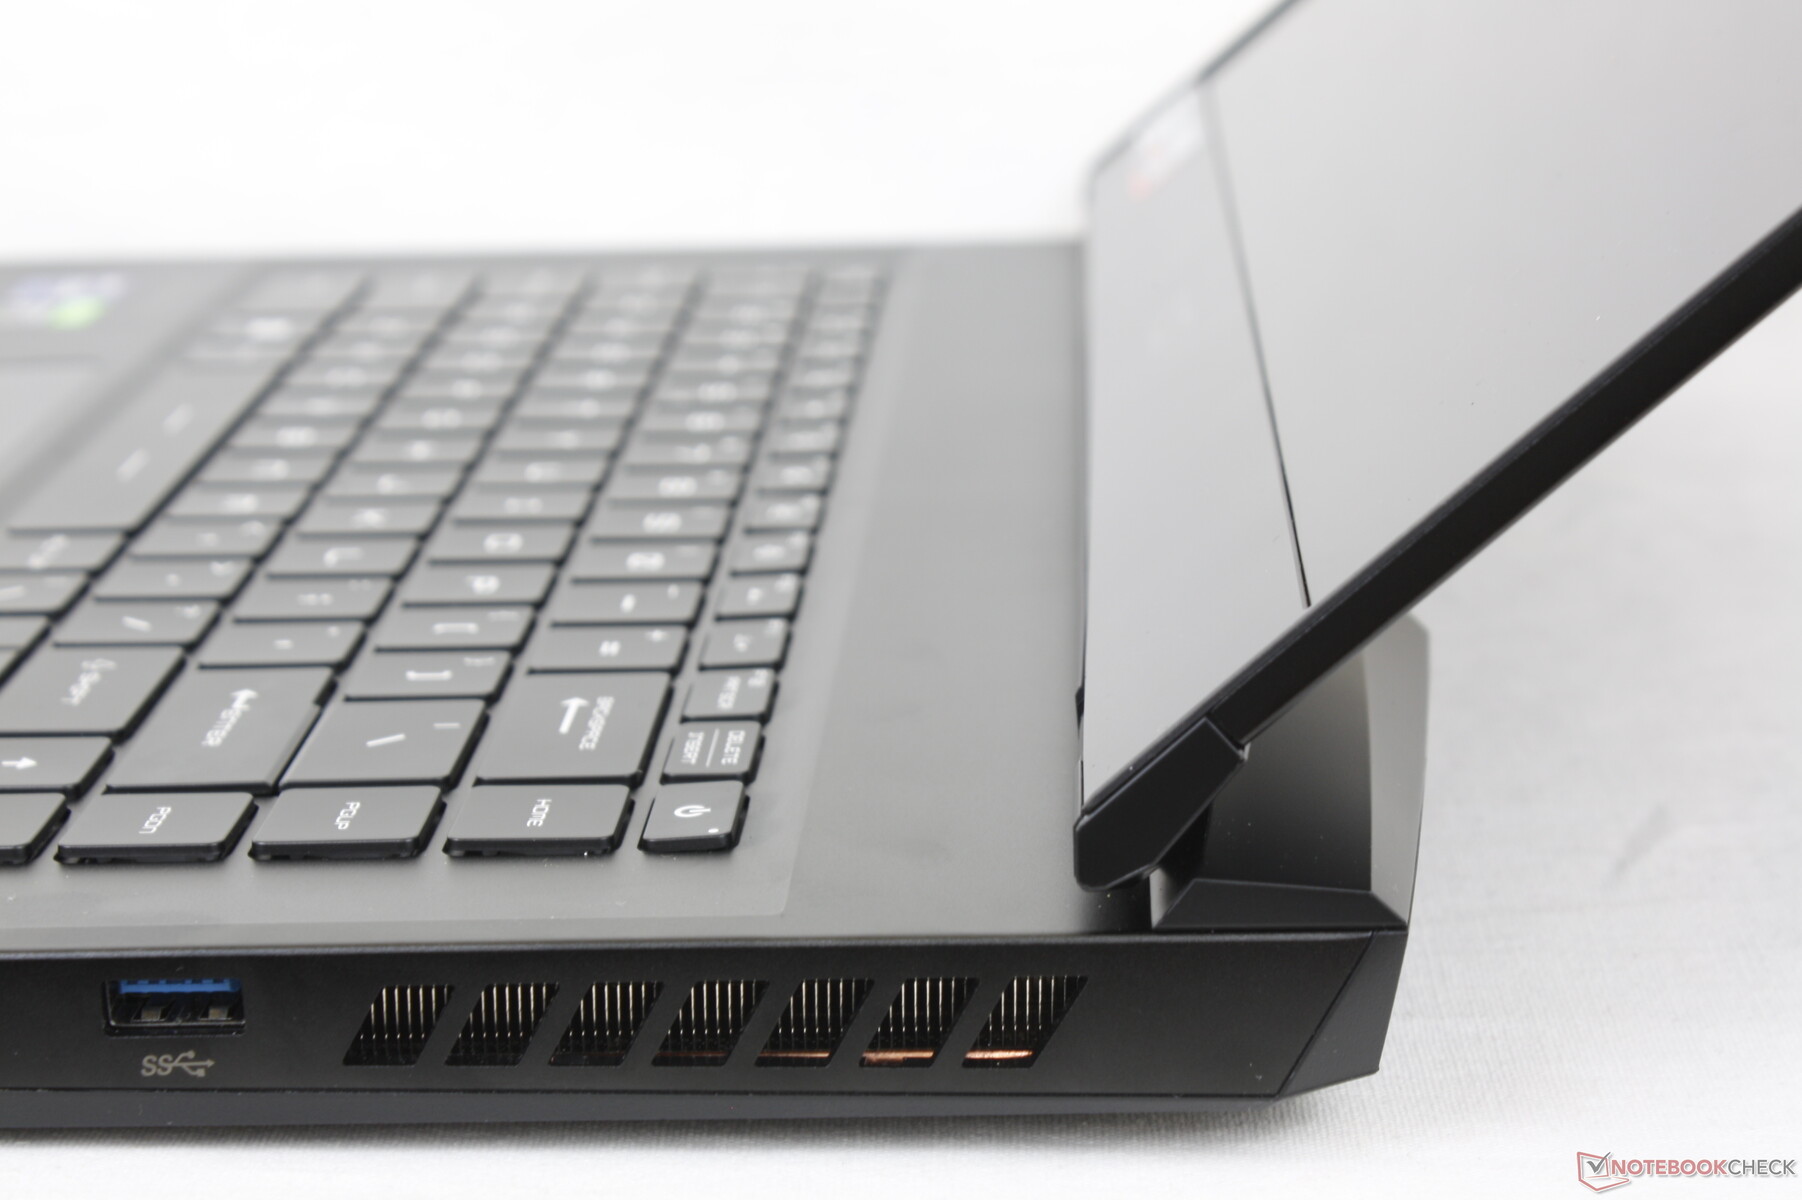
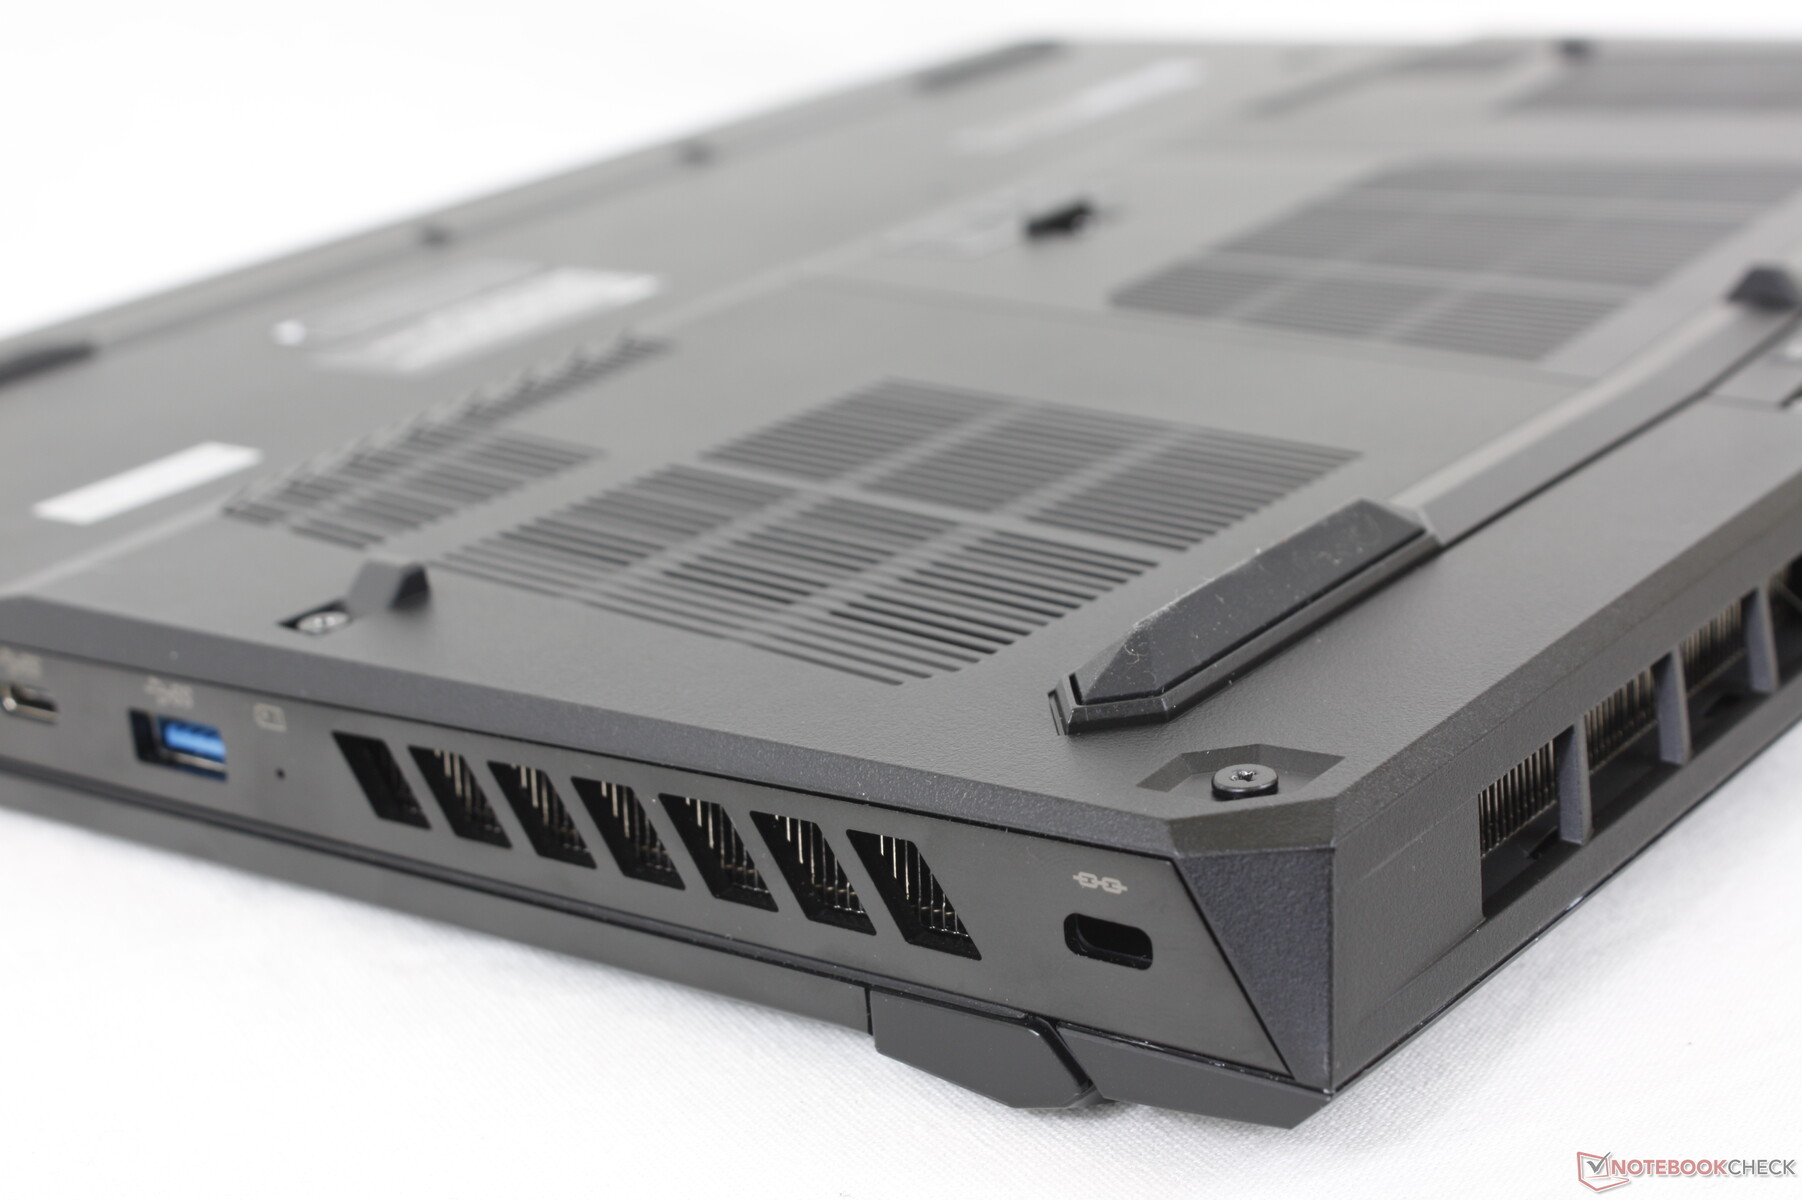
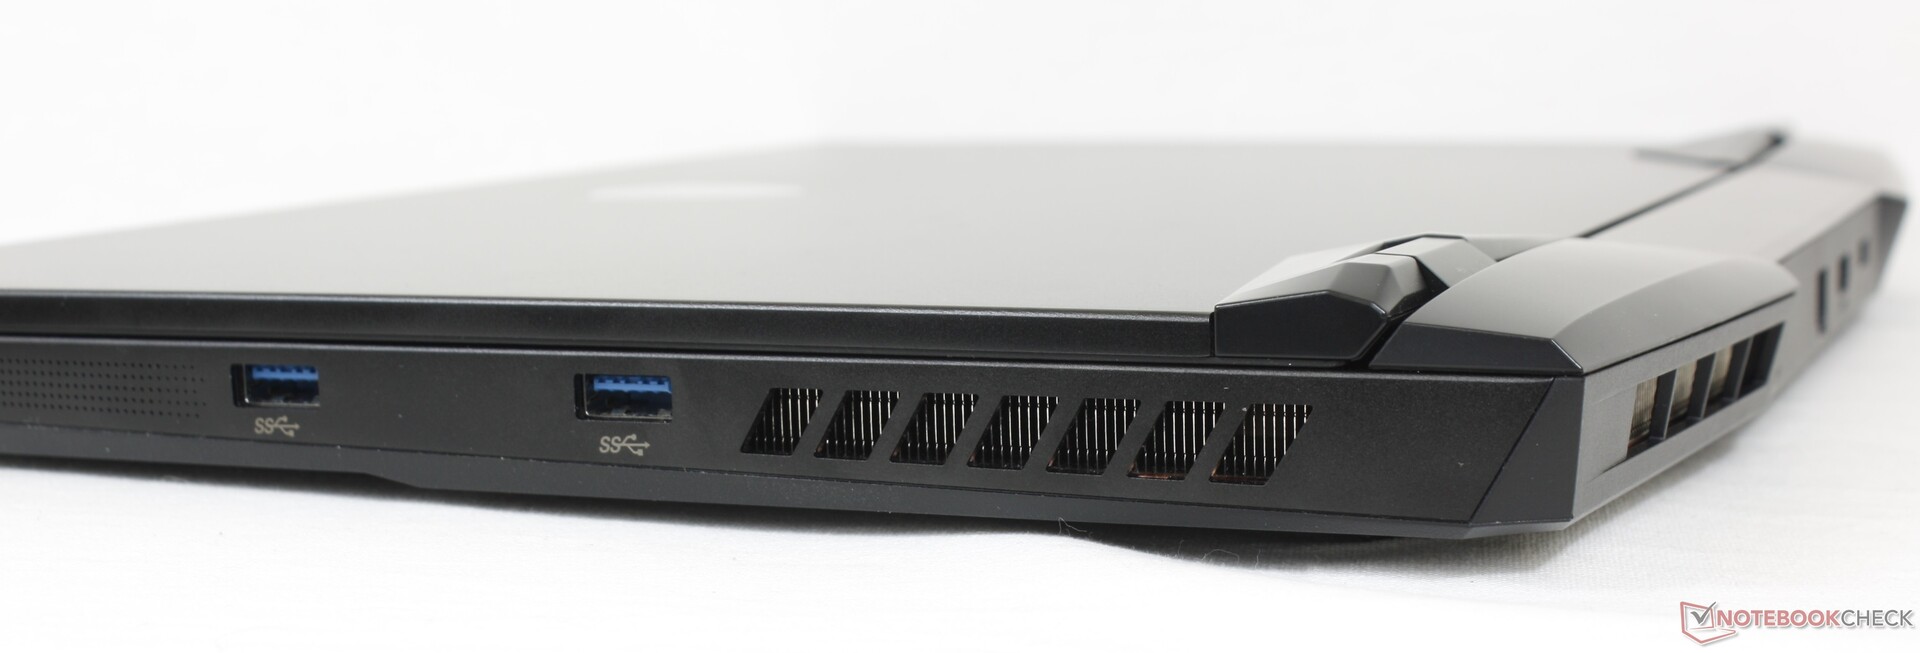
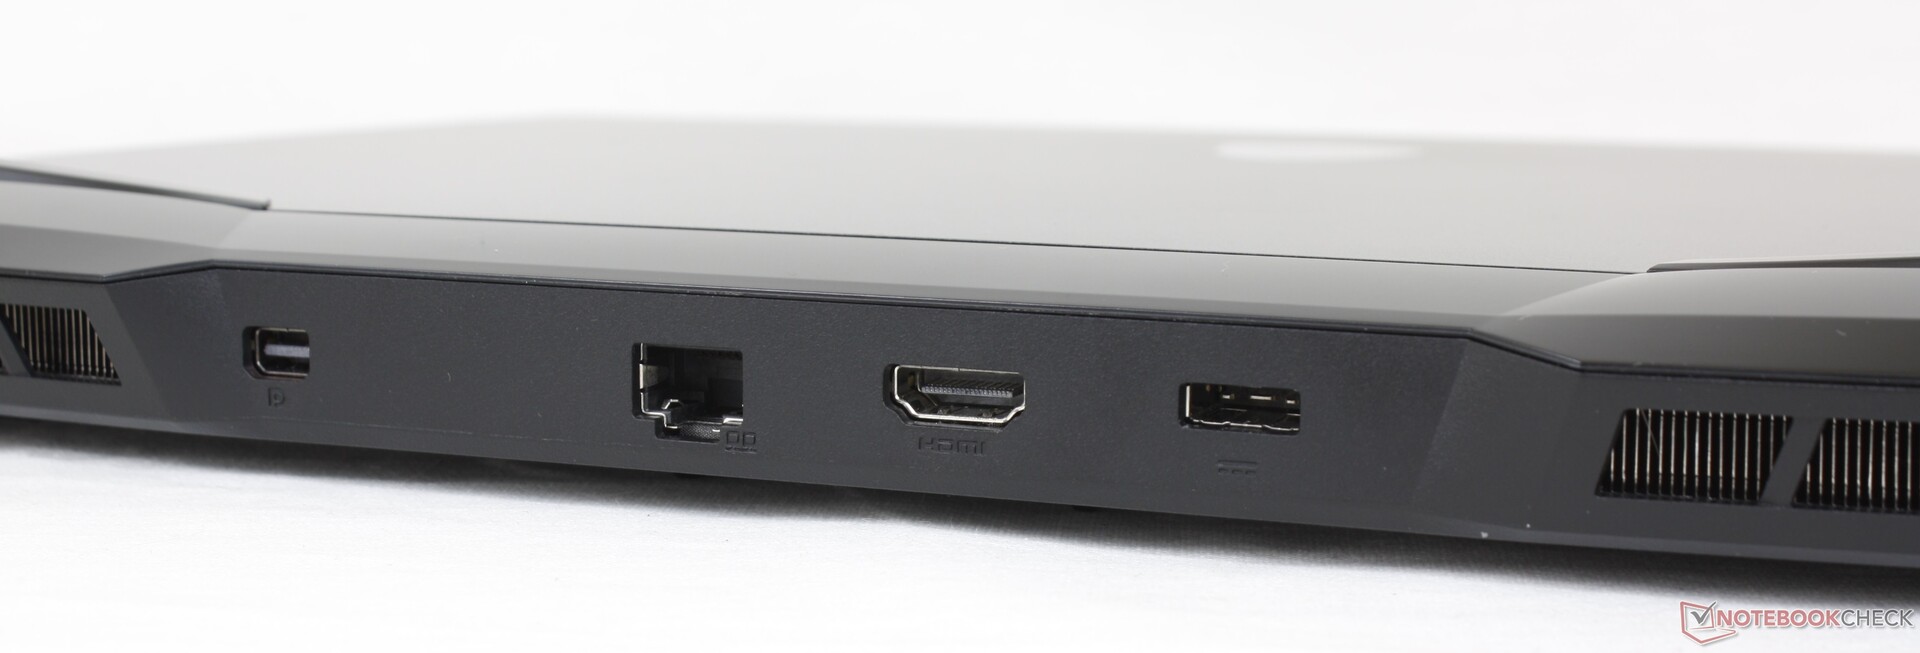
Le opzioni delle porte sono leggermente diverse da quelle offerte sul GP66 Leopard. Per uno, la porta USB-C che era lungo la parte posteriore del GP66 Leopard è ora lungo il bordo sinistro per un accesso più facile. Inoltre, è stata aggiunta una mini-DisplayPort per una maggiore compatibilità con i monitor esterni che supportano la sincronizzazione adattiva
Si noti che la porta USB-C continua a non supportare Thunderbolt. Gli utenti dovranno passare alla più costosa serie MSI GS, GE, o GT per questa caratteristica.
Comunicazione
Webcam
La fotocamera rimane 720p e senza supporto per IR o Windows Hello. I portatili MSI continuano ad usare un otturatore elettronico invece di un otturatore fisico a differenza della maggior parte degli Ultrabooks o dei portatili business.


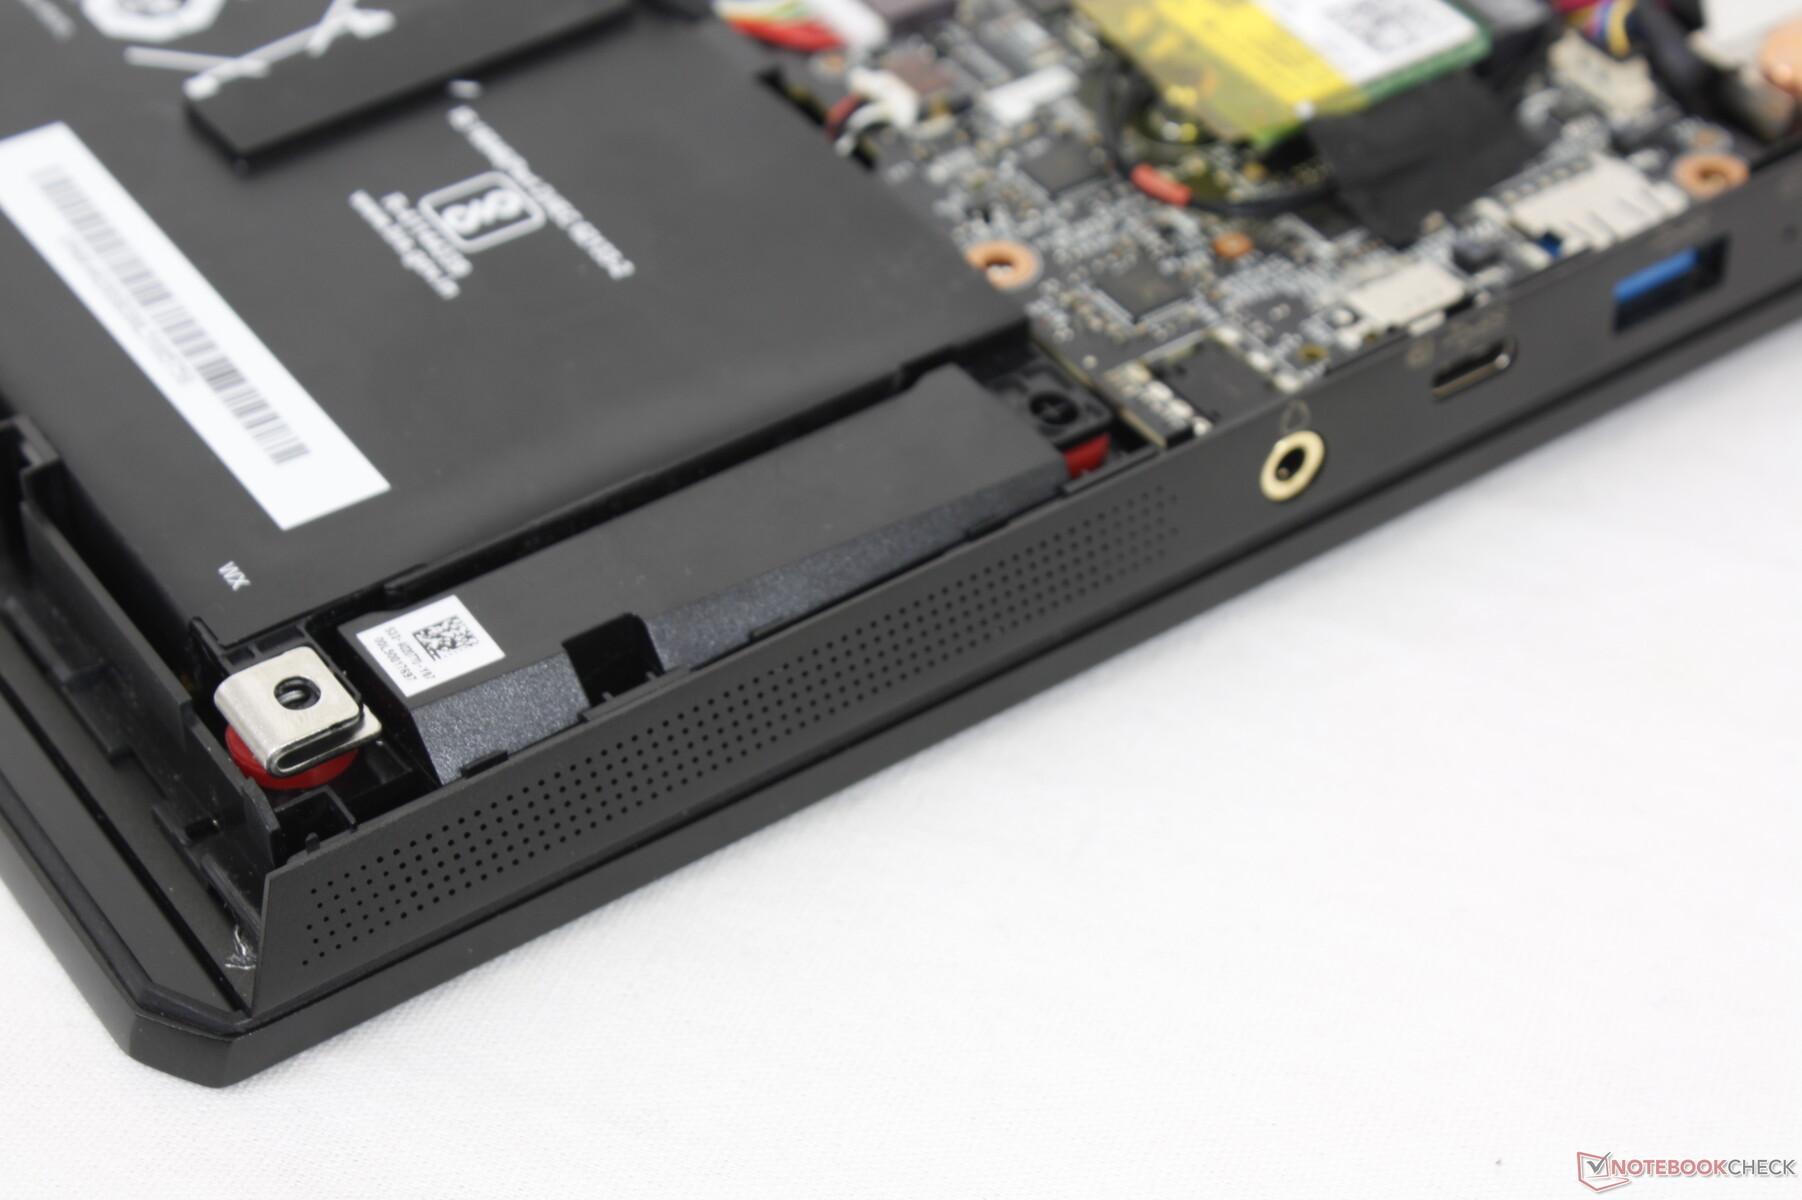
Manutenzione
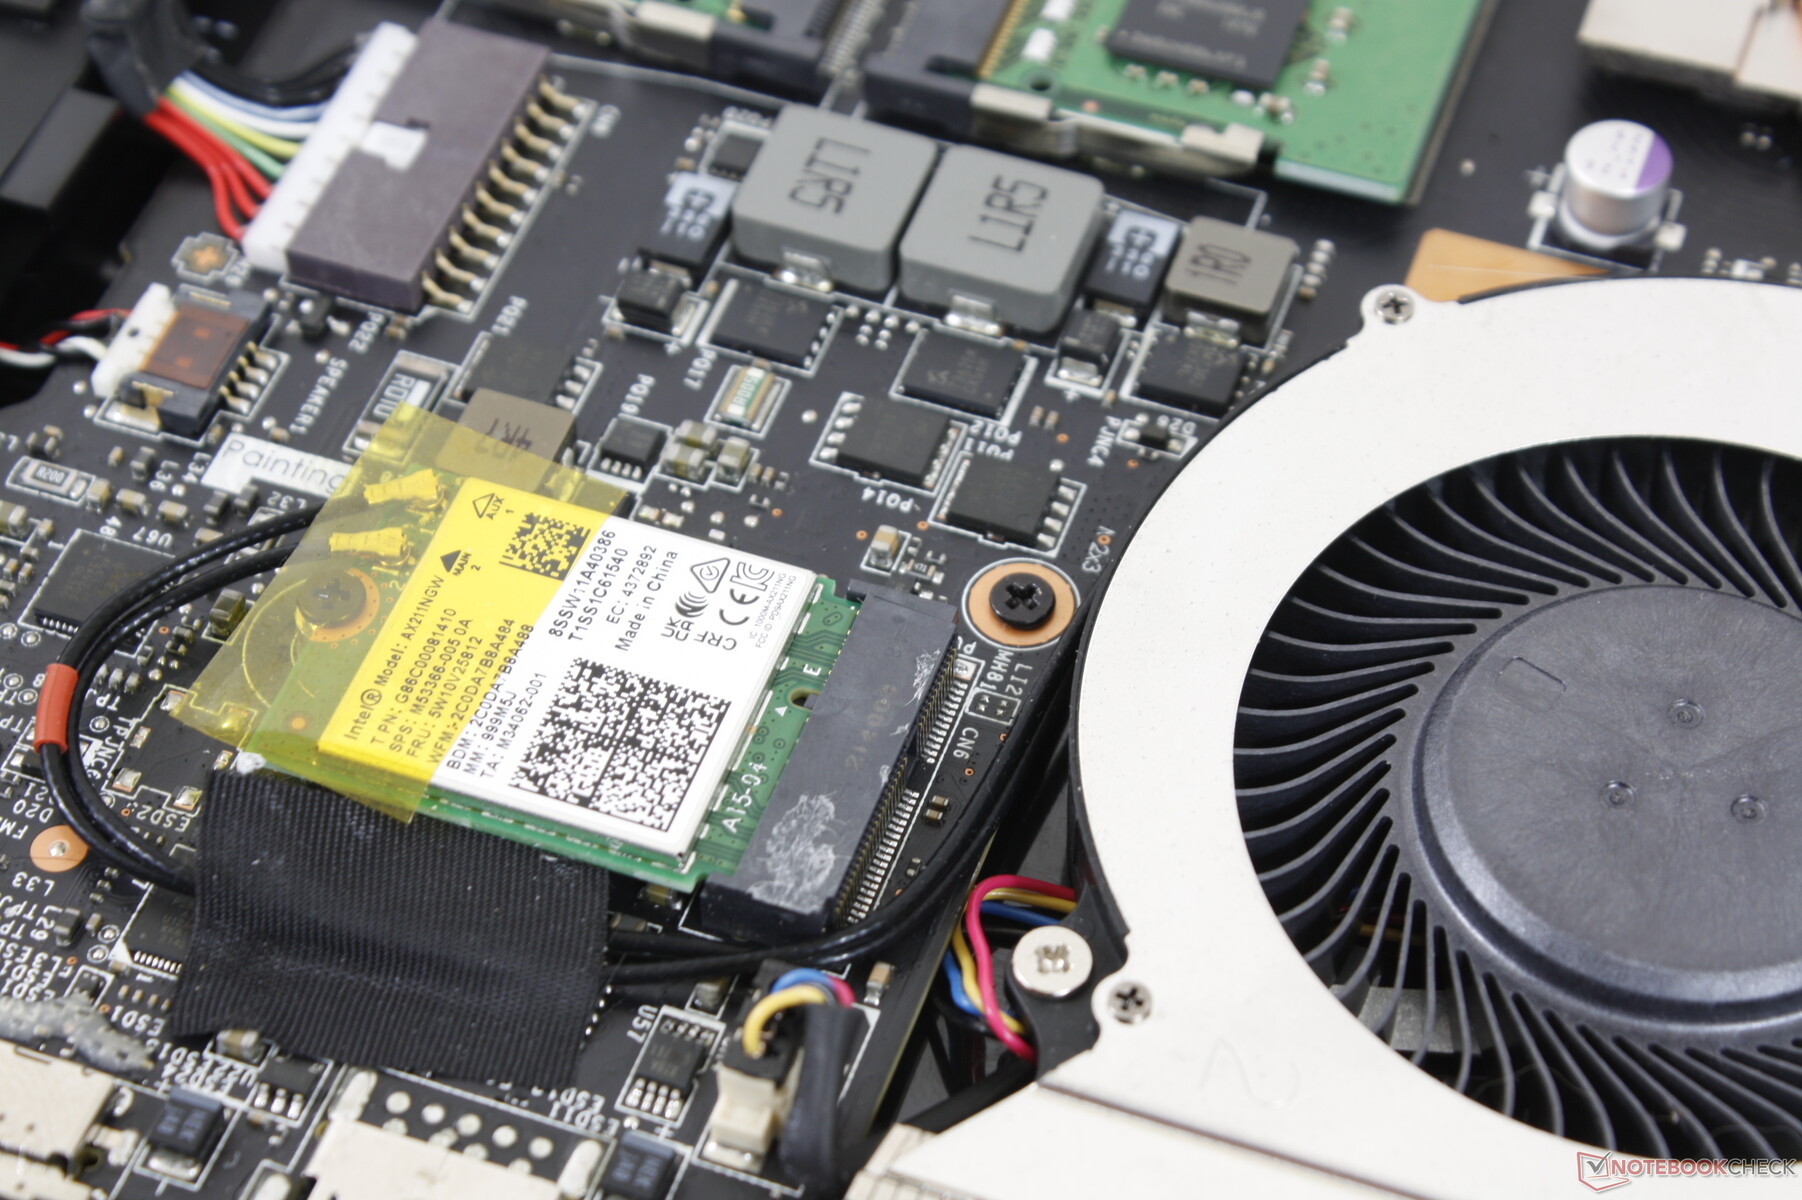
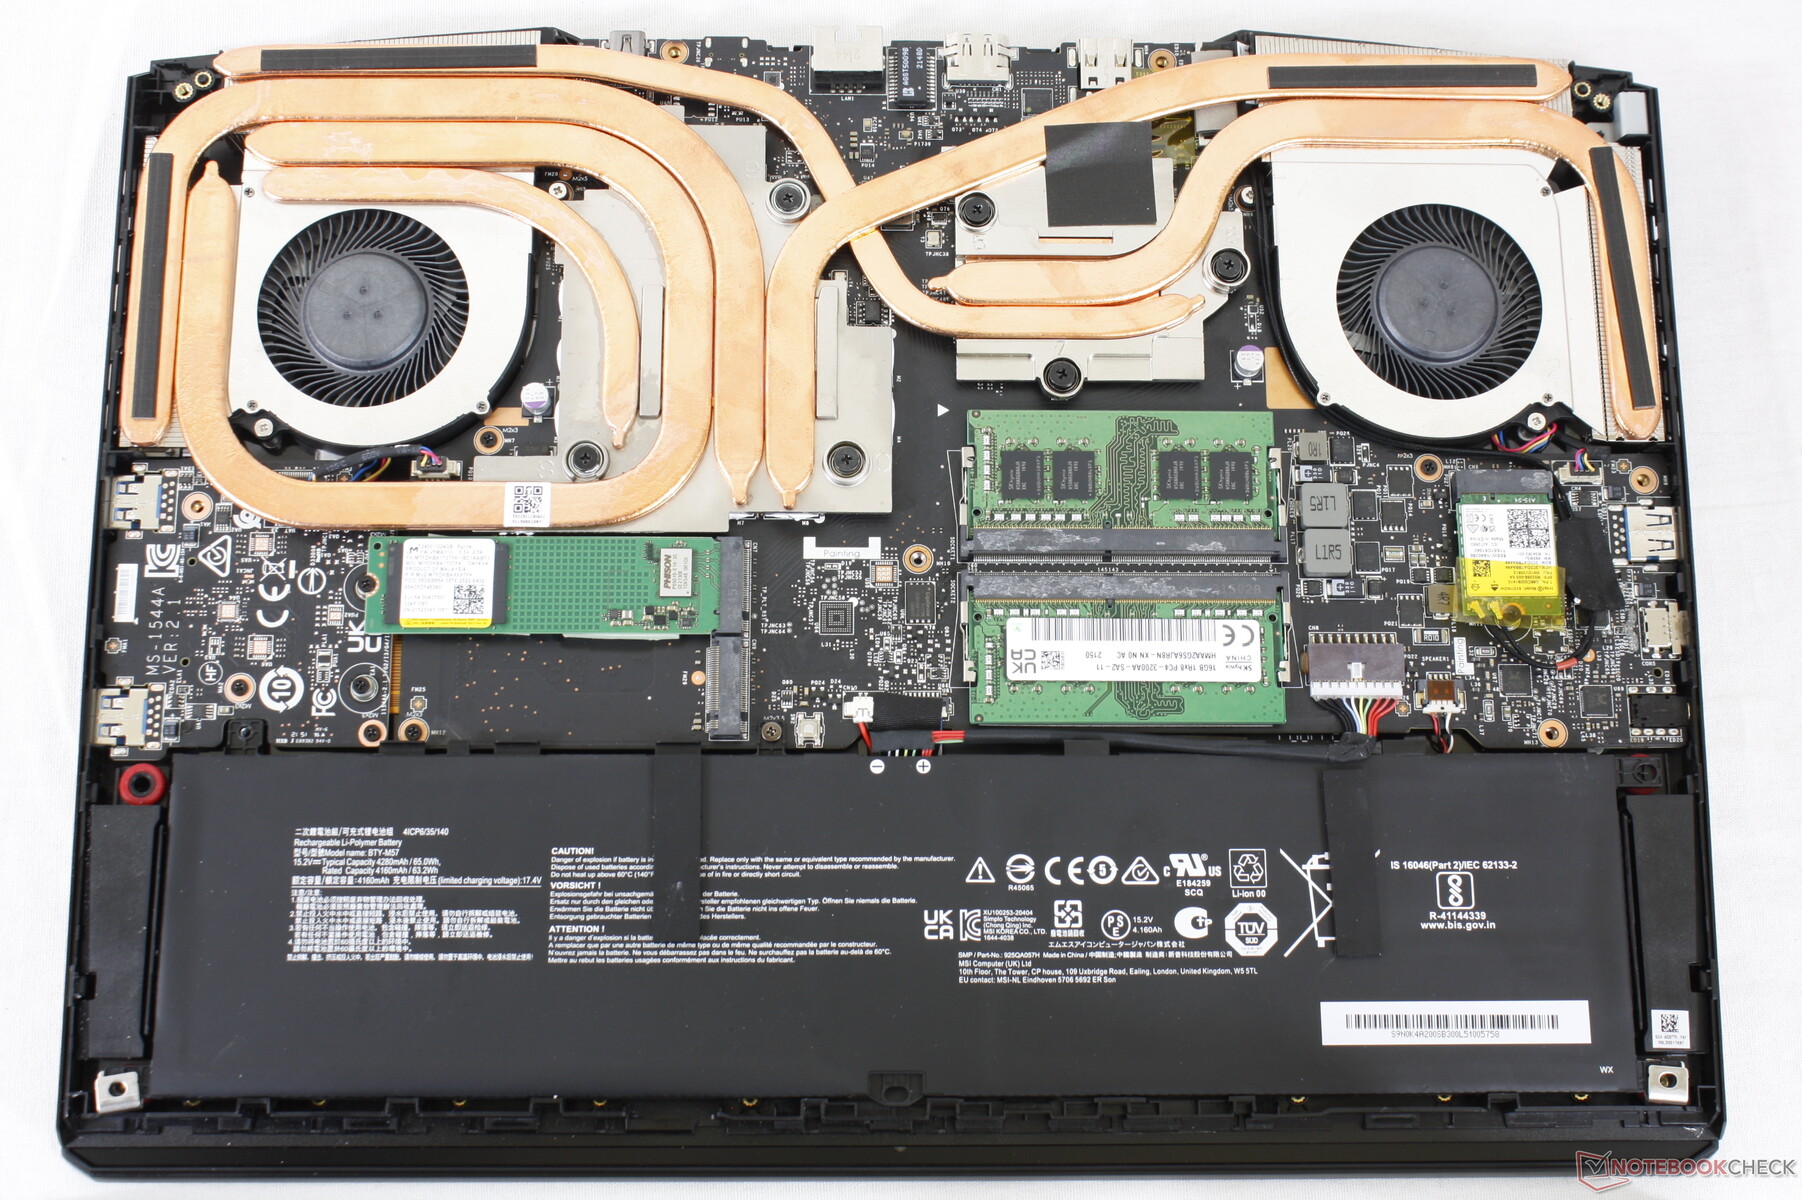
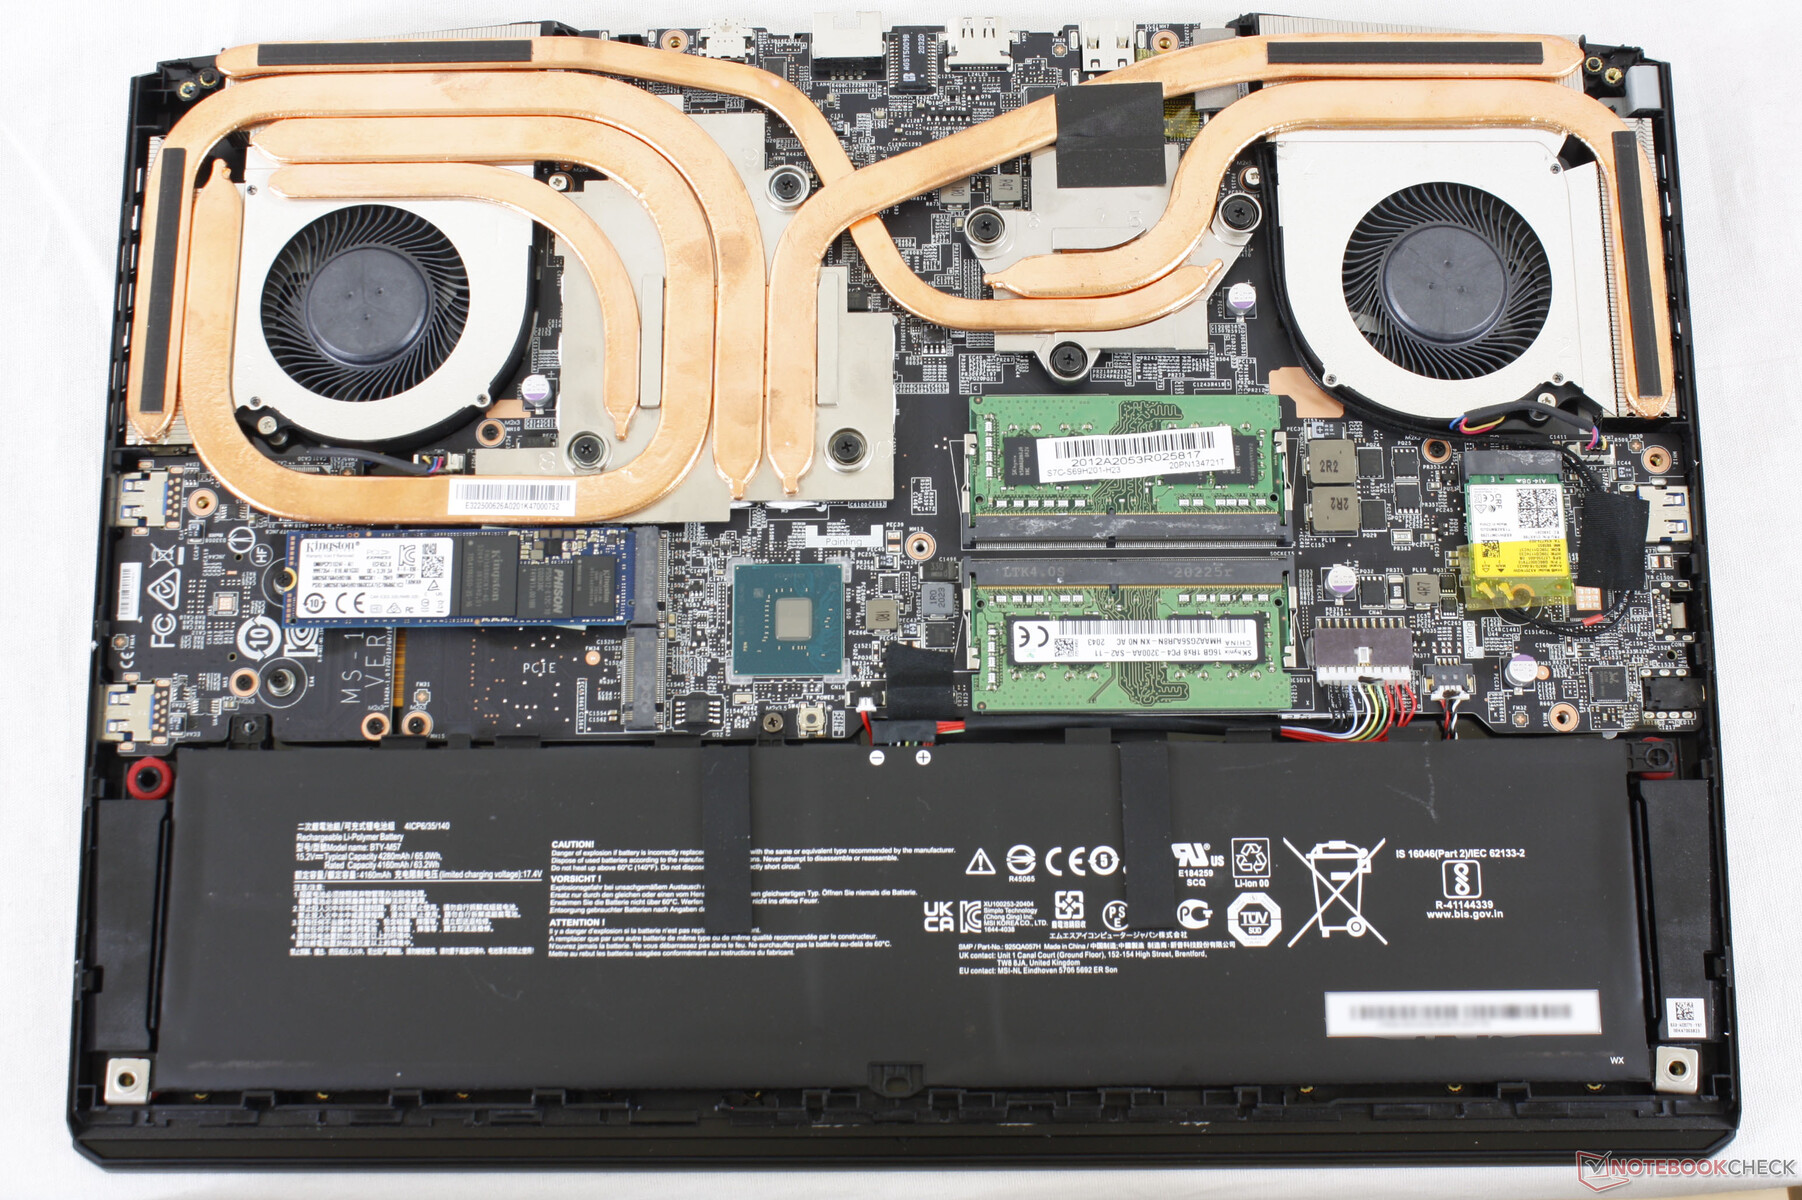
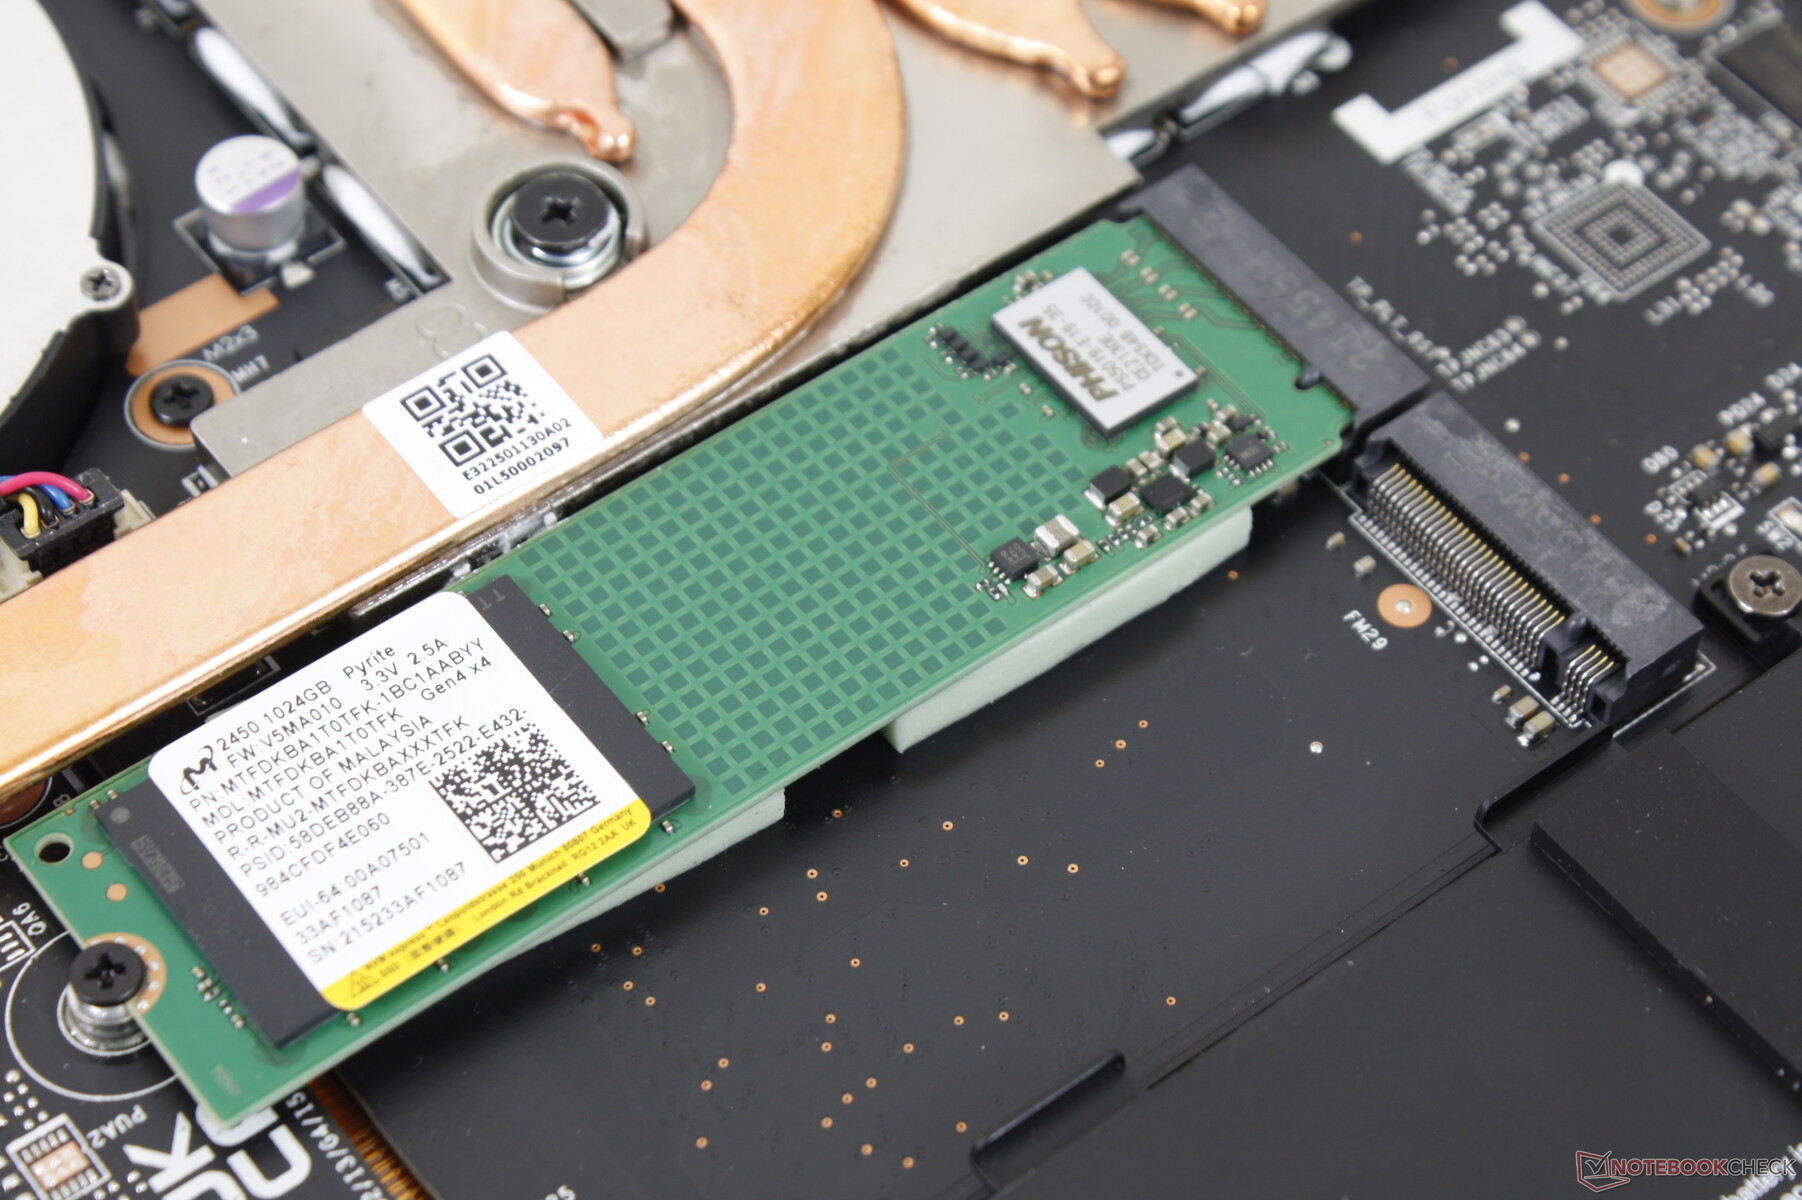
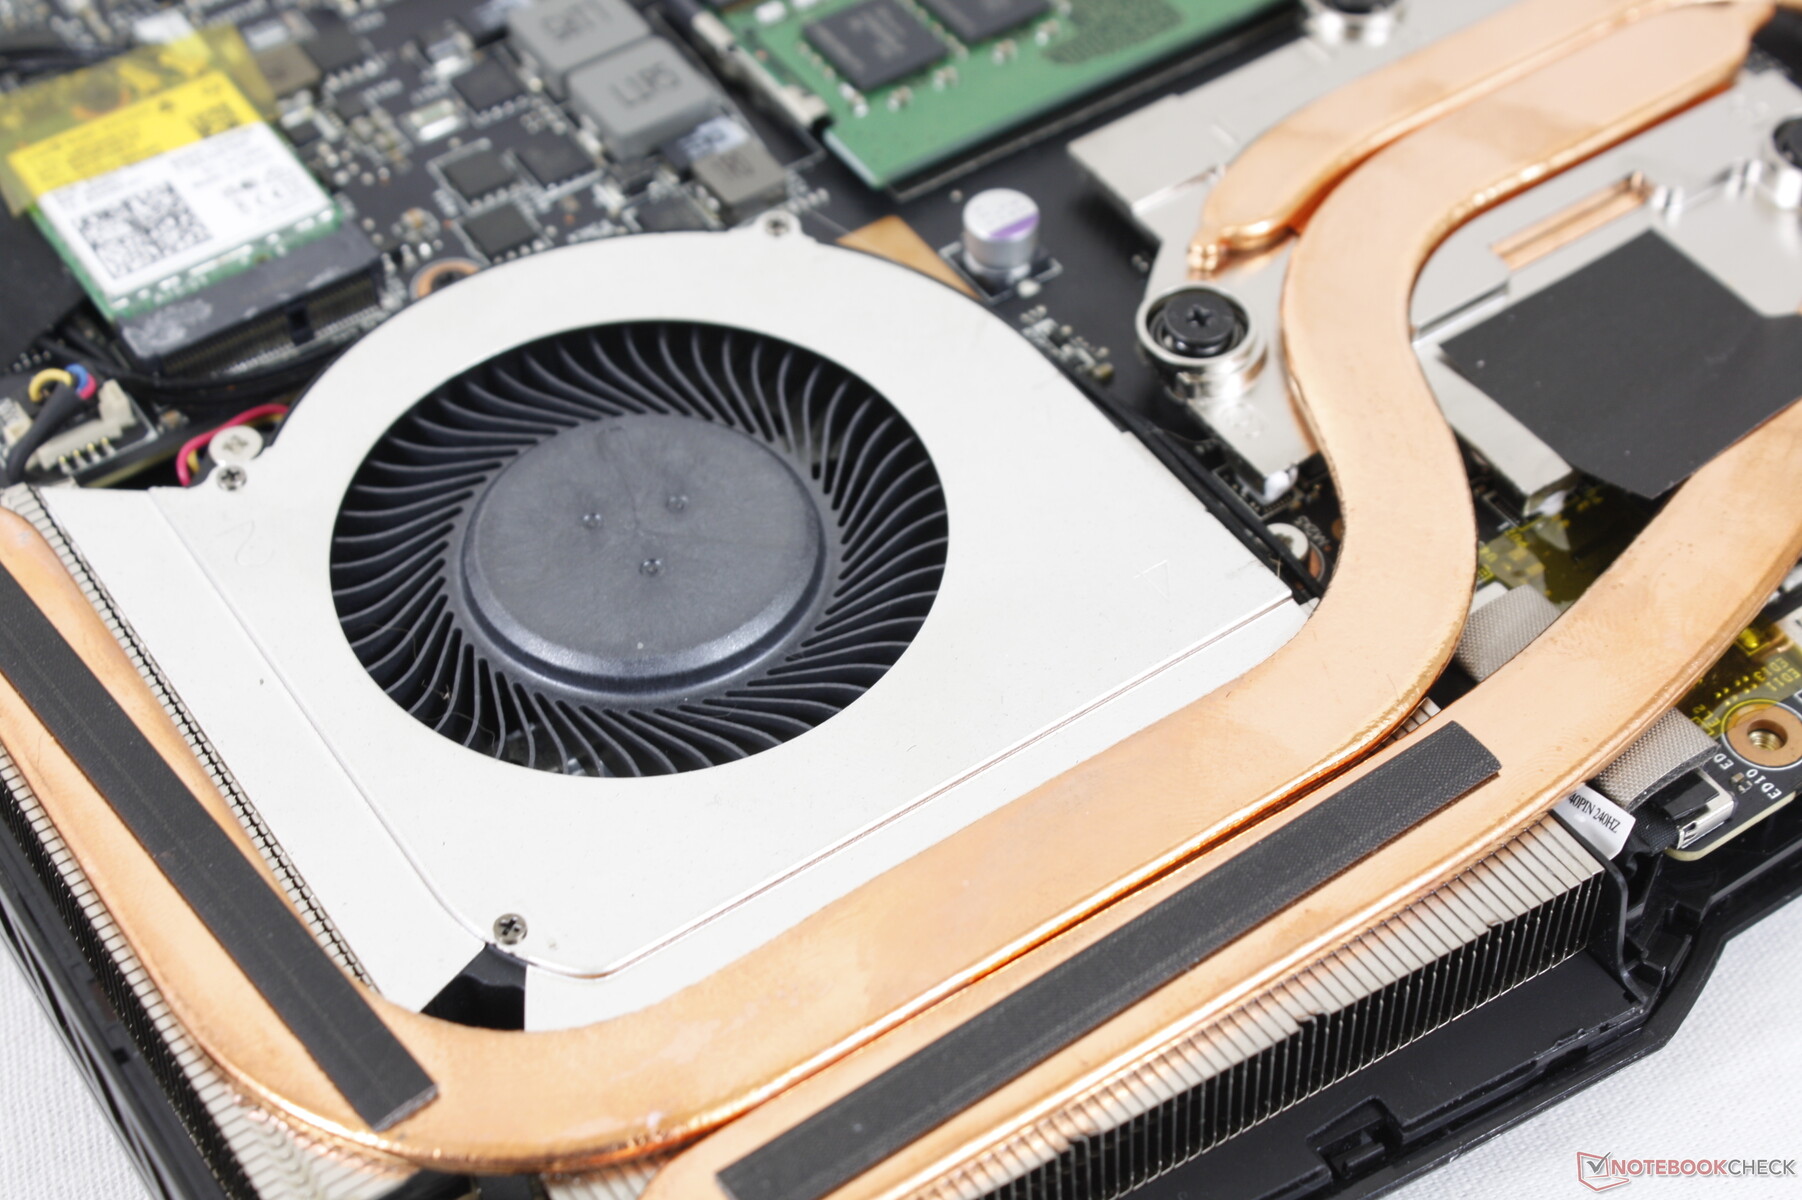
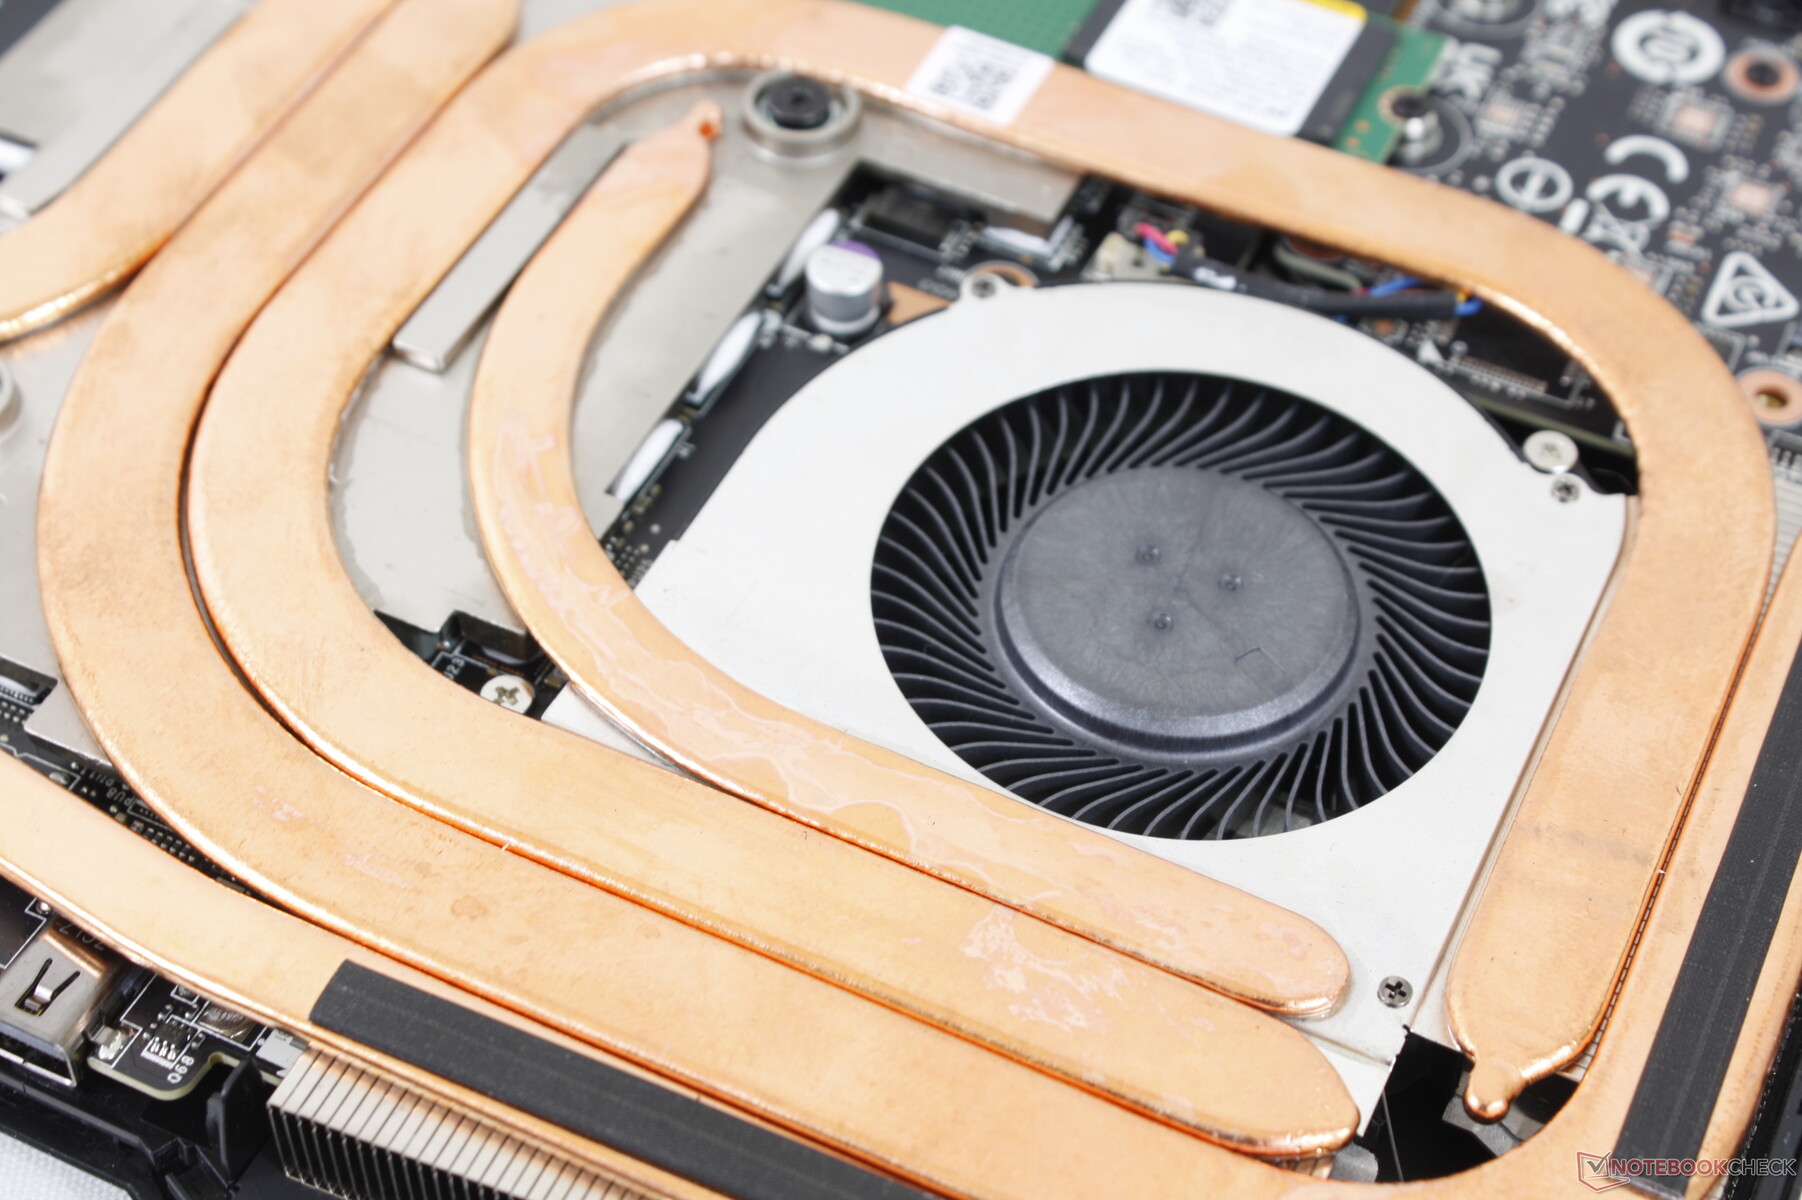
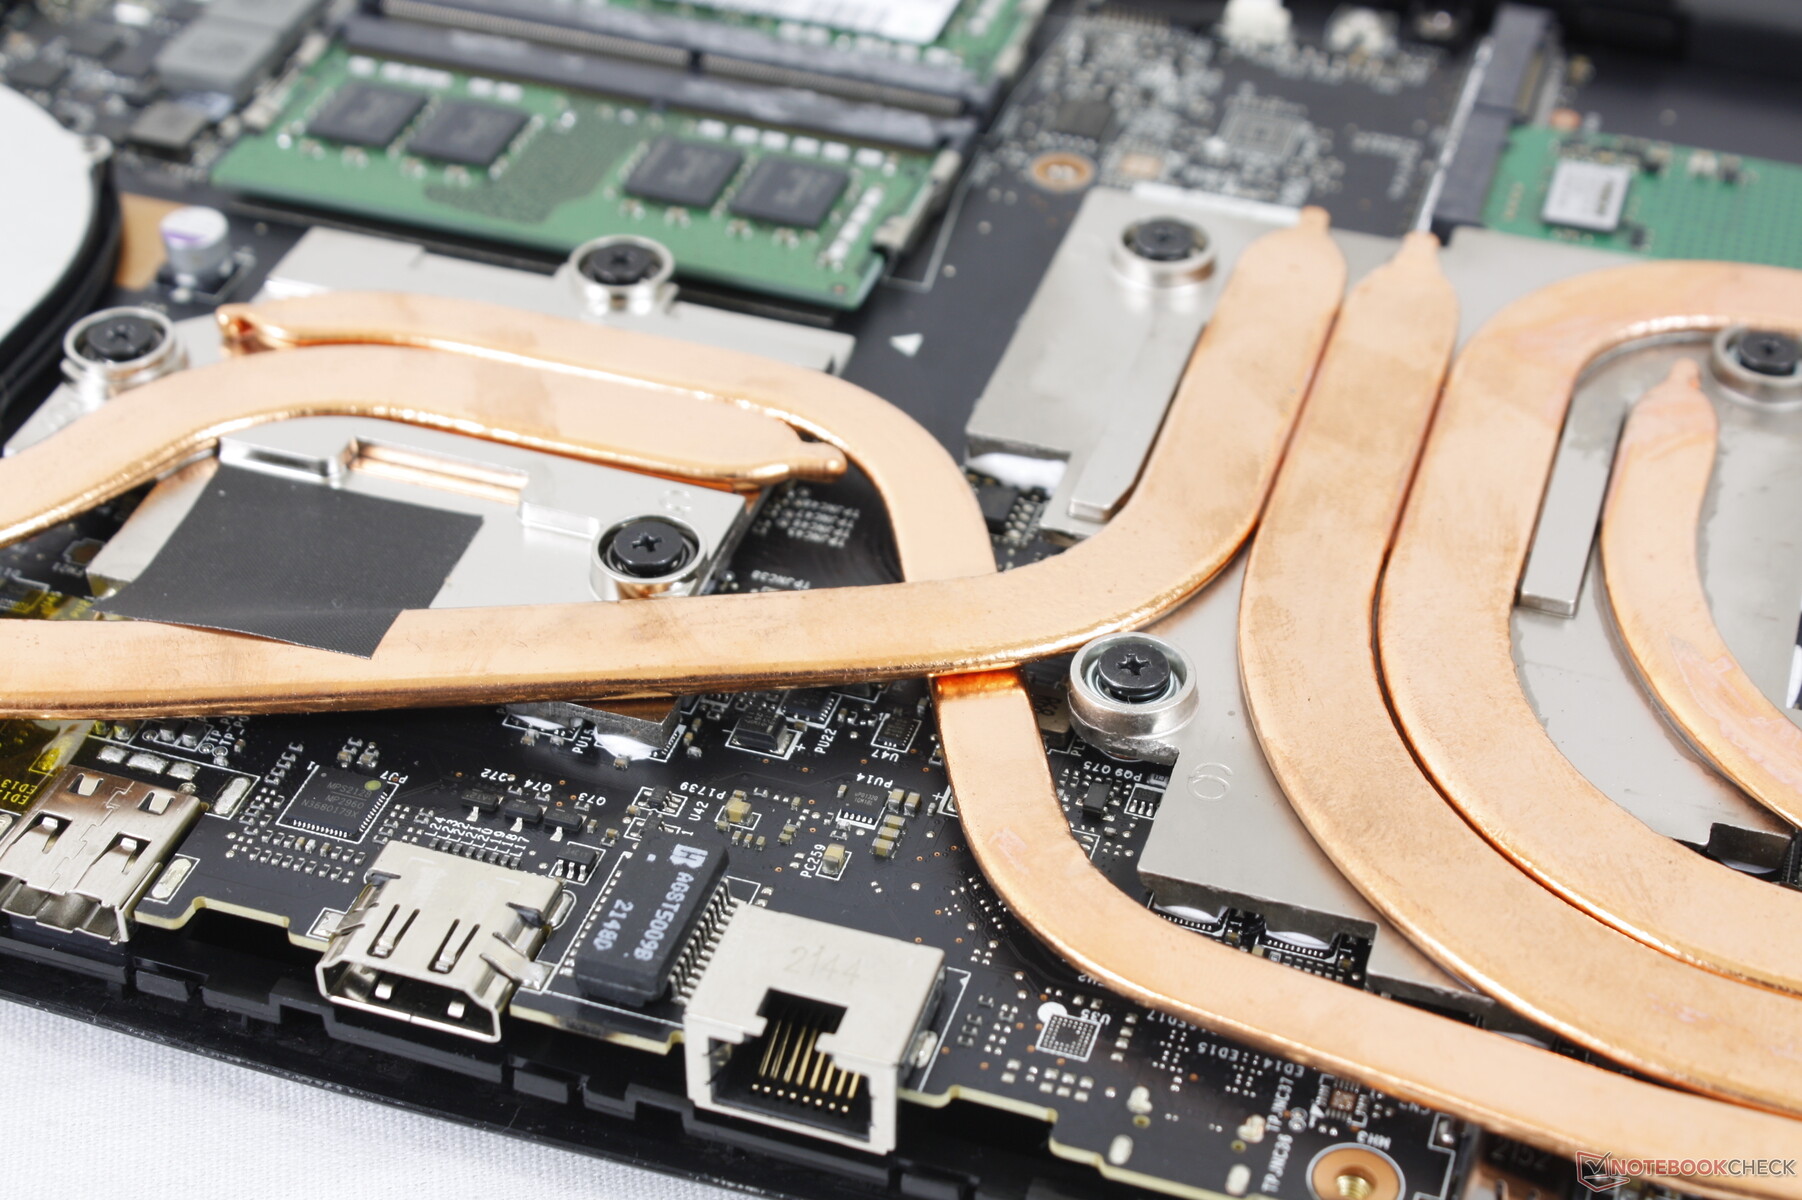
Il pannello inferiore è fissato da 11 viti Philips con nessuna sotto una base di gomma per una manutenzione più facile. Notate che un adesivo "sigillo di fabbrica" deve essere rotto, comunque.
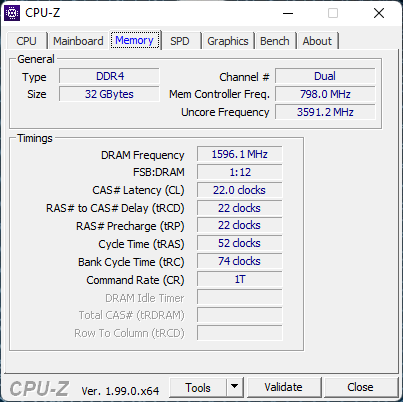
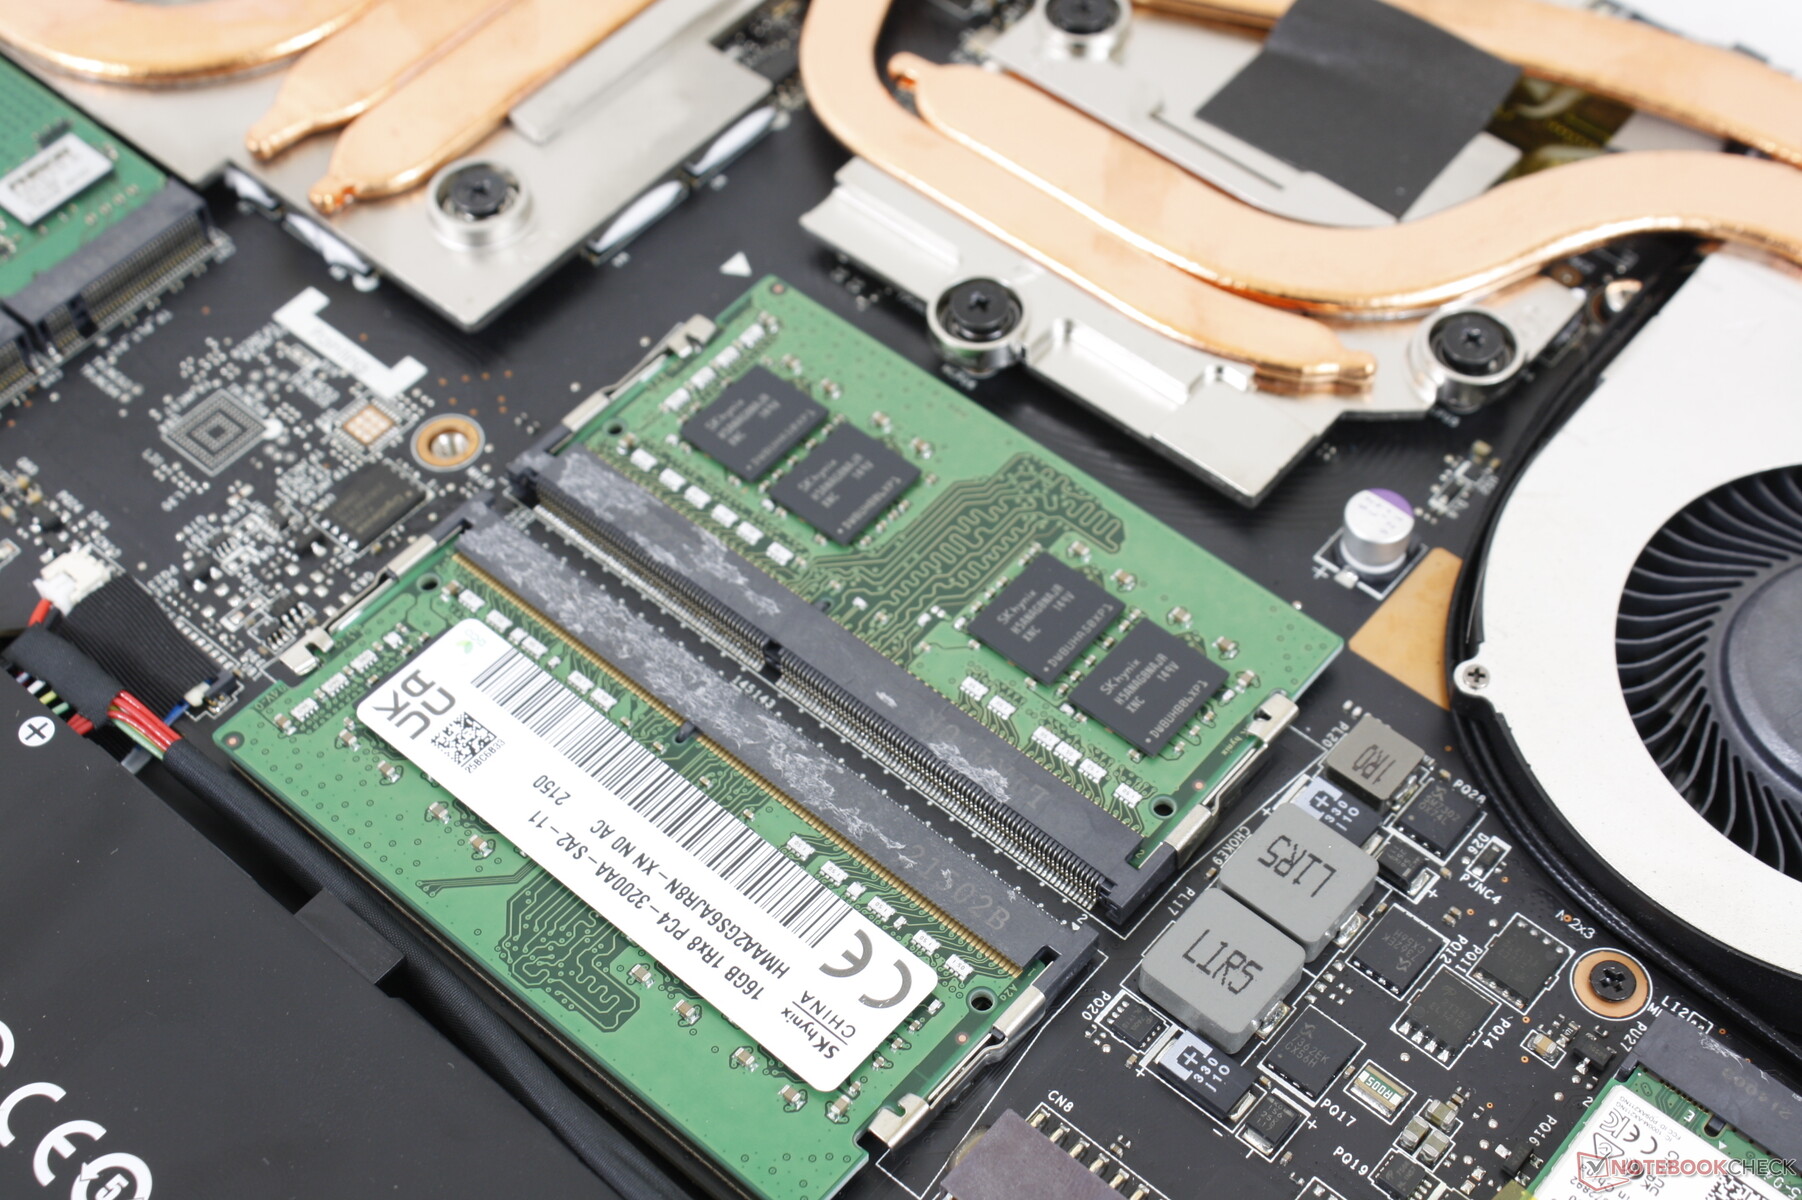
Il layout interno è essenzialmente identico al GP66 Leopard come mostrato qui sotto. Gli utenti hanno accesso diretto a entrambi gli slot SODIMM ed entrambi gli slot M.2 2280 PCIe4 x4. I portatili di fascia alta come ilGM7AG8P potrebbero essere dotati di supporto per RAM DDR5 più veloci.
Accessori e garanzia
Non ci sono extra nella scatola a parte l'adattatore AC o la documentazione. La solita garanzia limitata di un anno si applica negli Stati Uniti
Dispositivi di input
Tastiera e touchpad
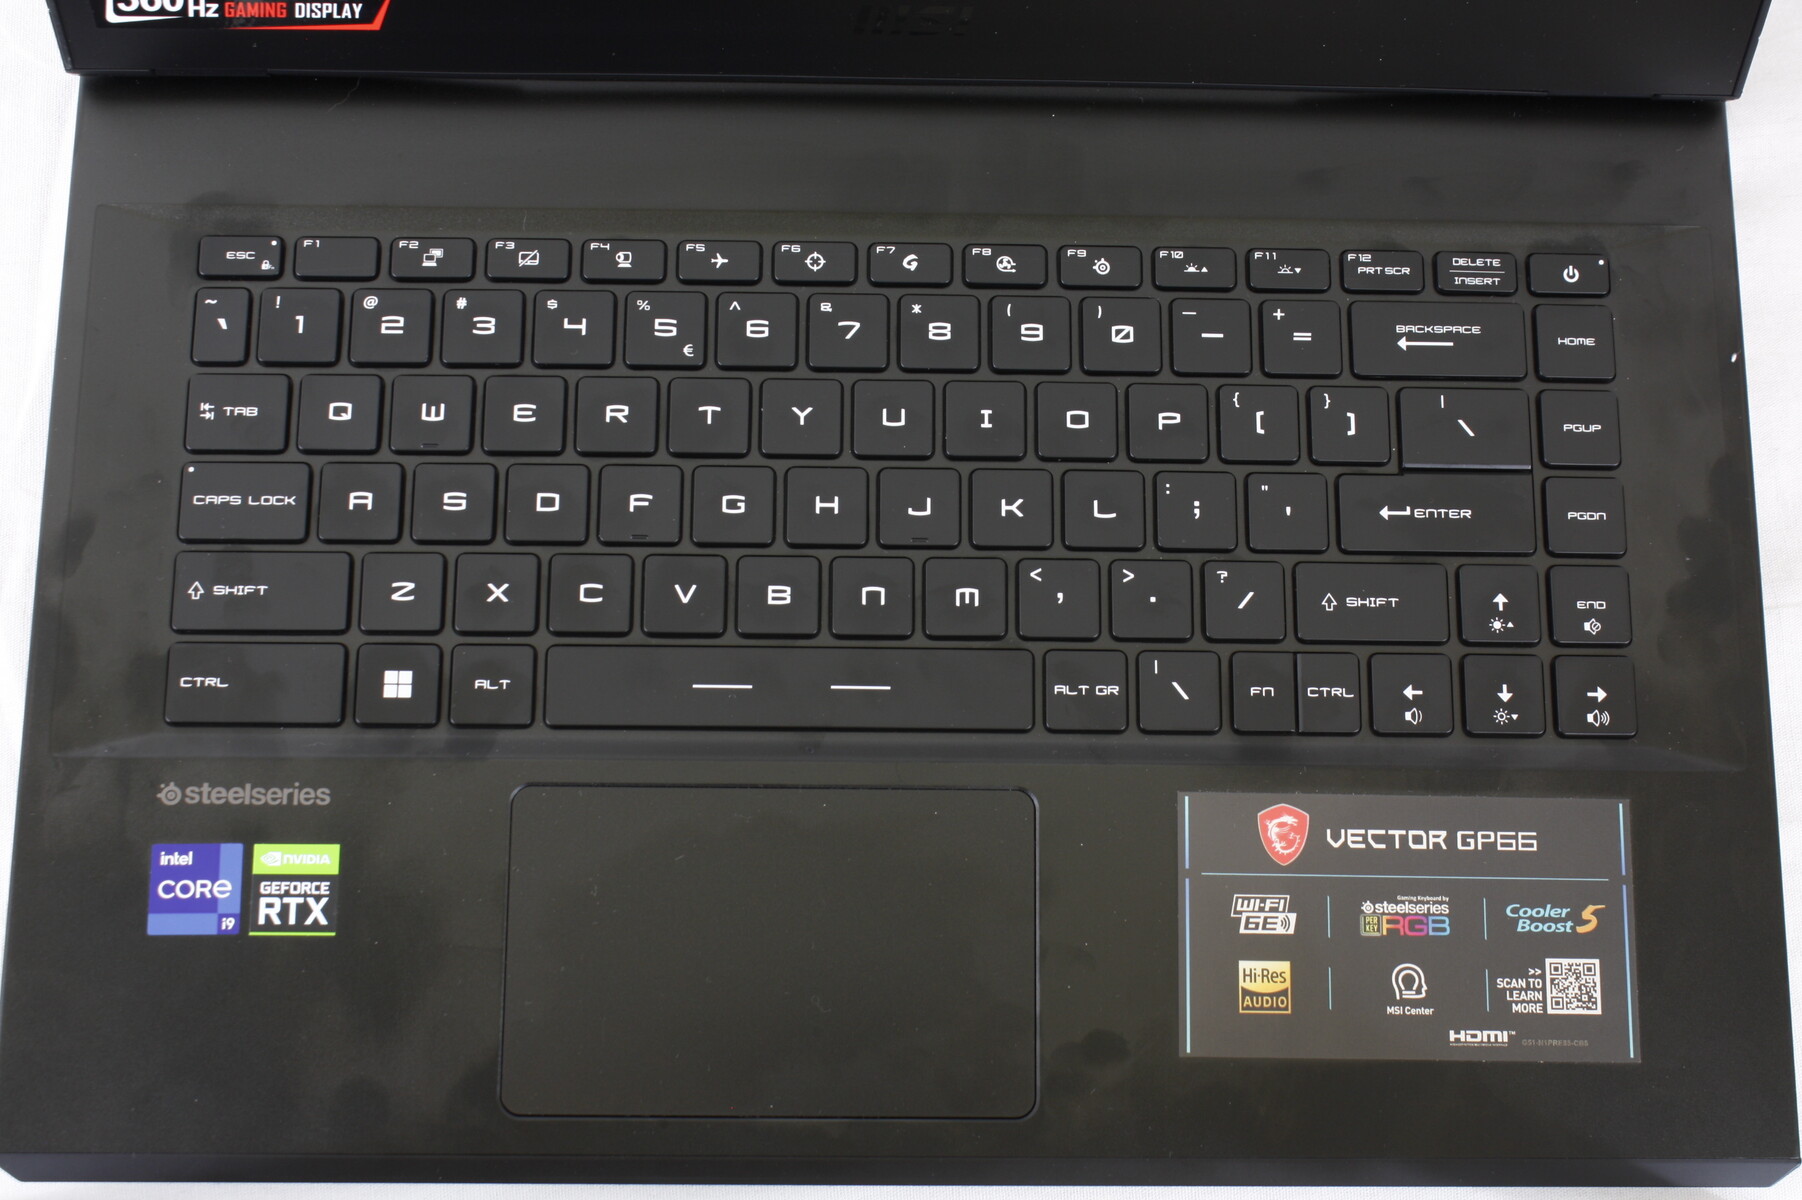
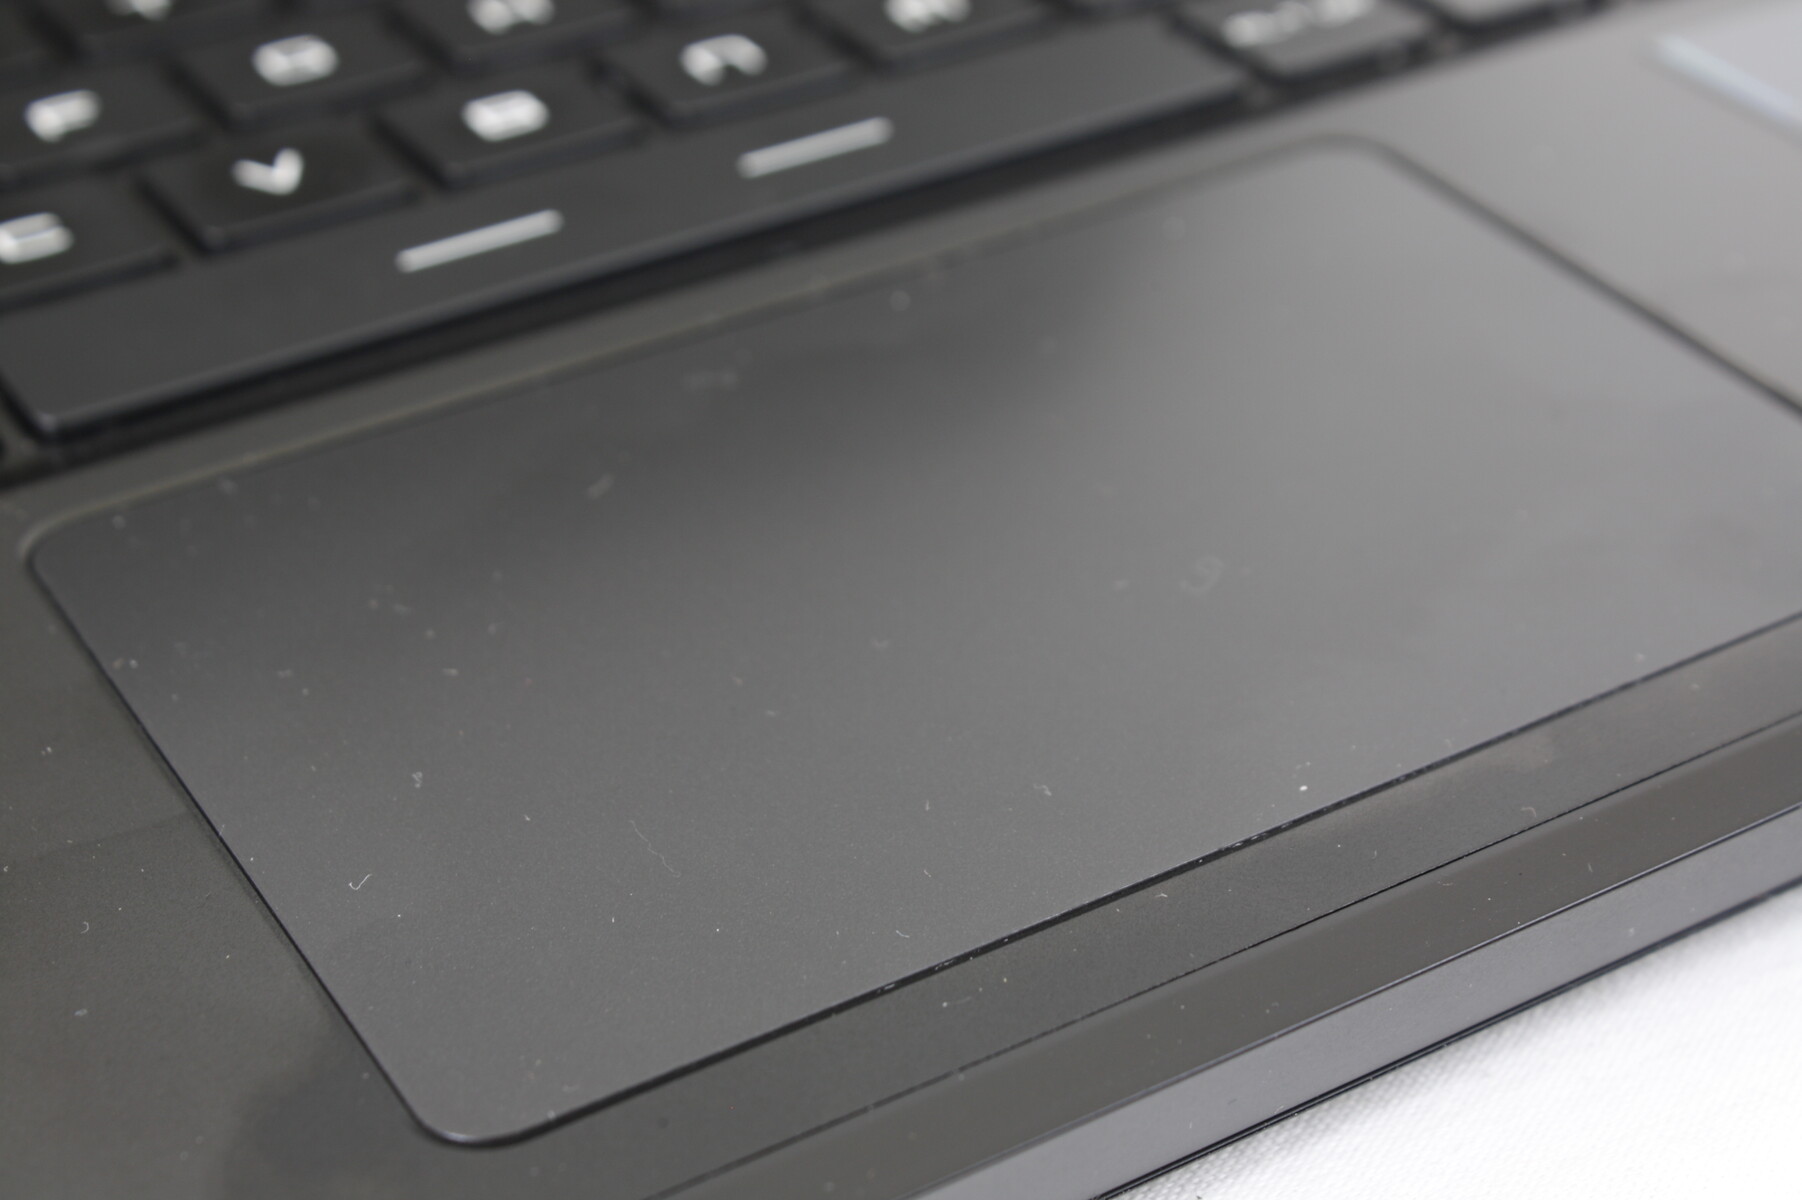
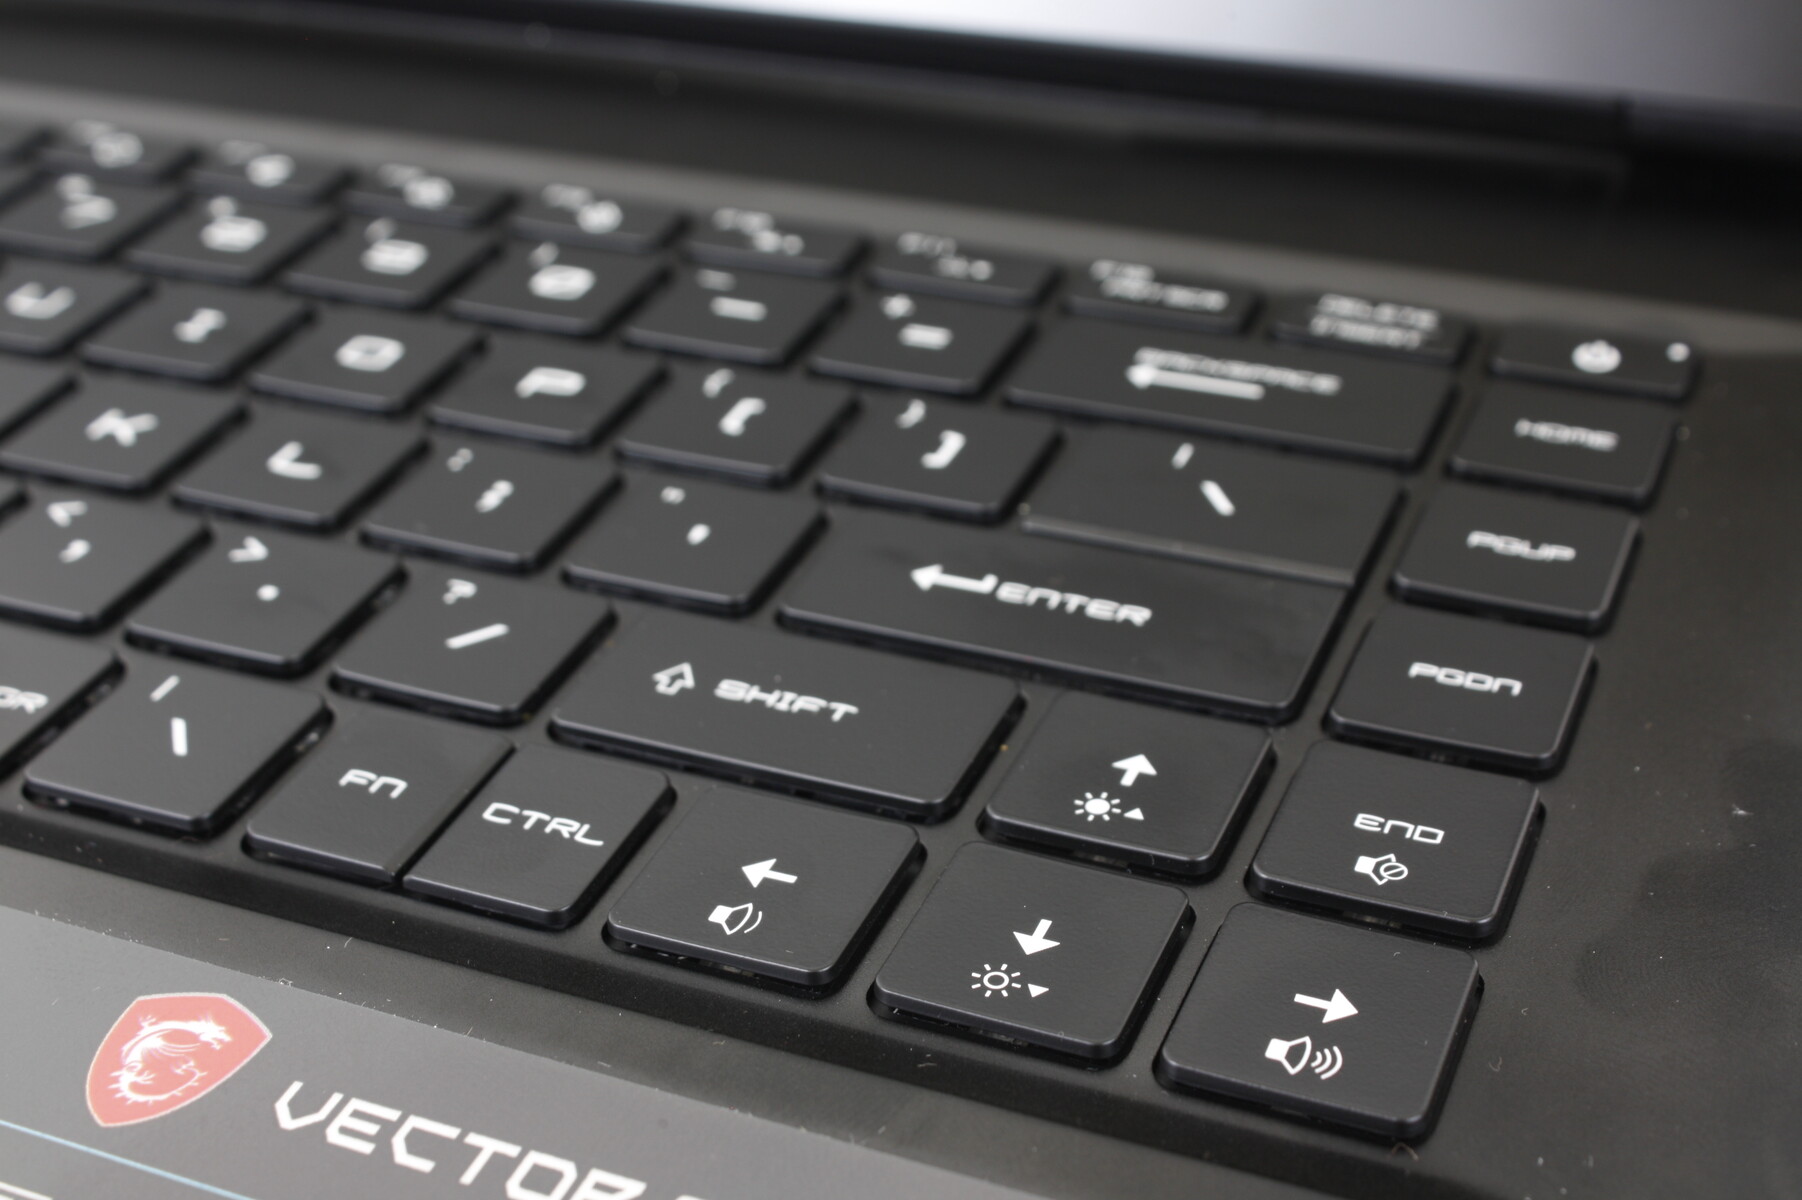
La tastiera con illuminazione RGB per tasto e il clickpad (10,5 x 6,5 cm) rimangono invariati dall'originale 2020 GP66 Leopard. Anche se l'esperienza di digitazione è soddisfacente se non un po' troppo morbida, il clic sul clickpad continua ad essere troppo spugnoso. Il controllo del cursore era più facile sul vecchio GP65 in quanto integrava i pulsanti fisici del mouse che sono stati abbandonati quando si è passati al design del GP66.

Visualizza
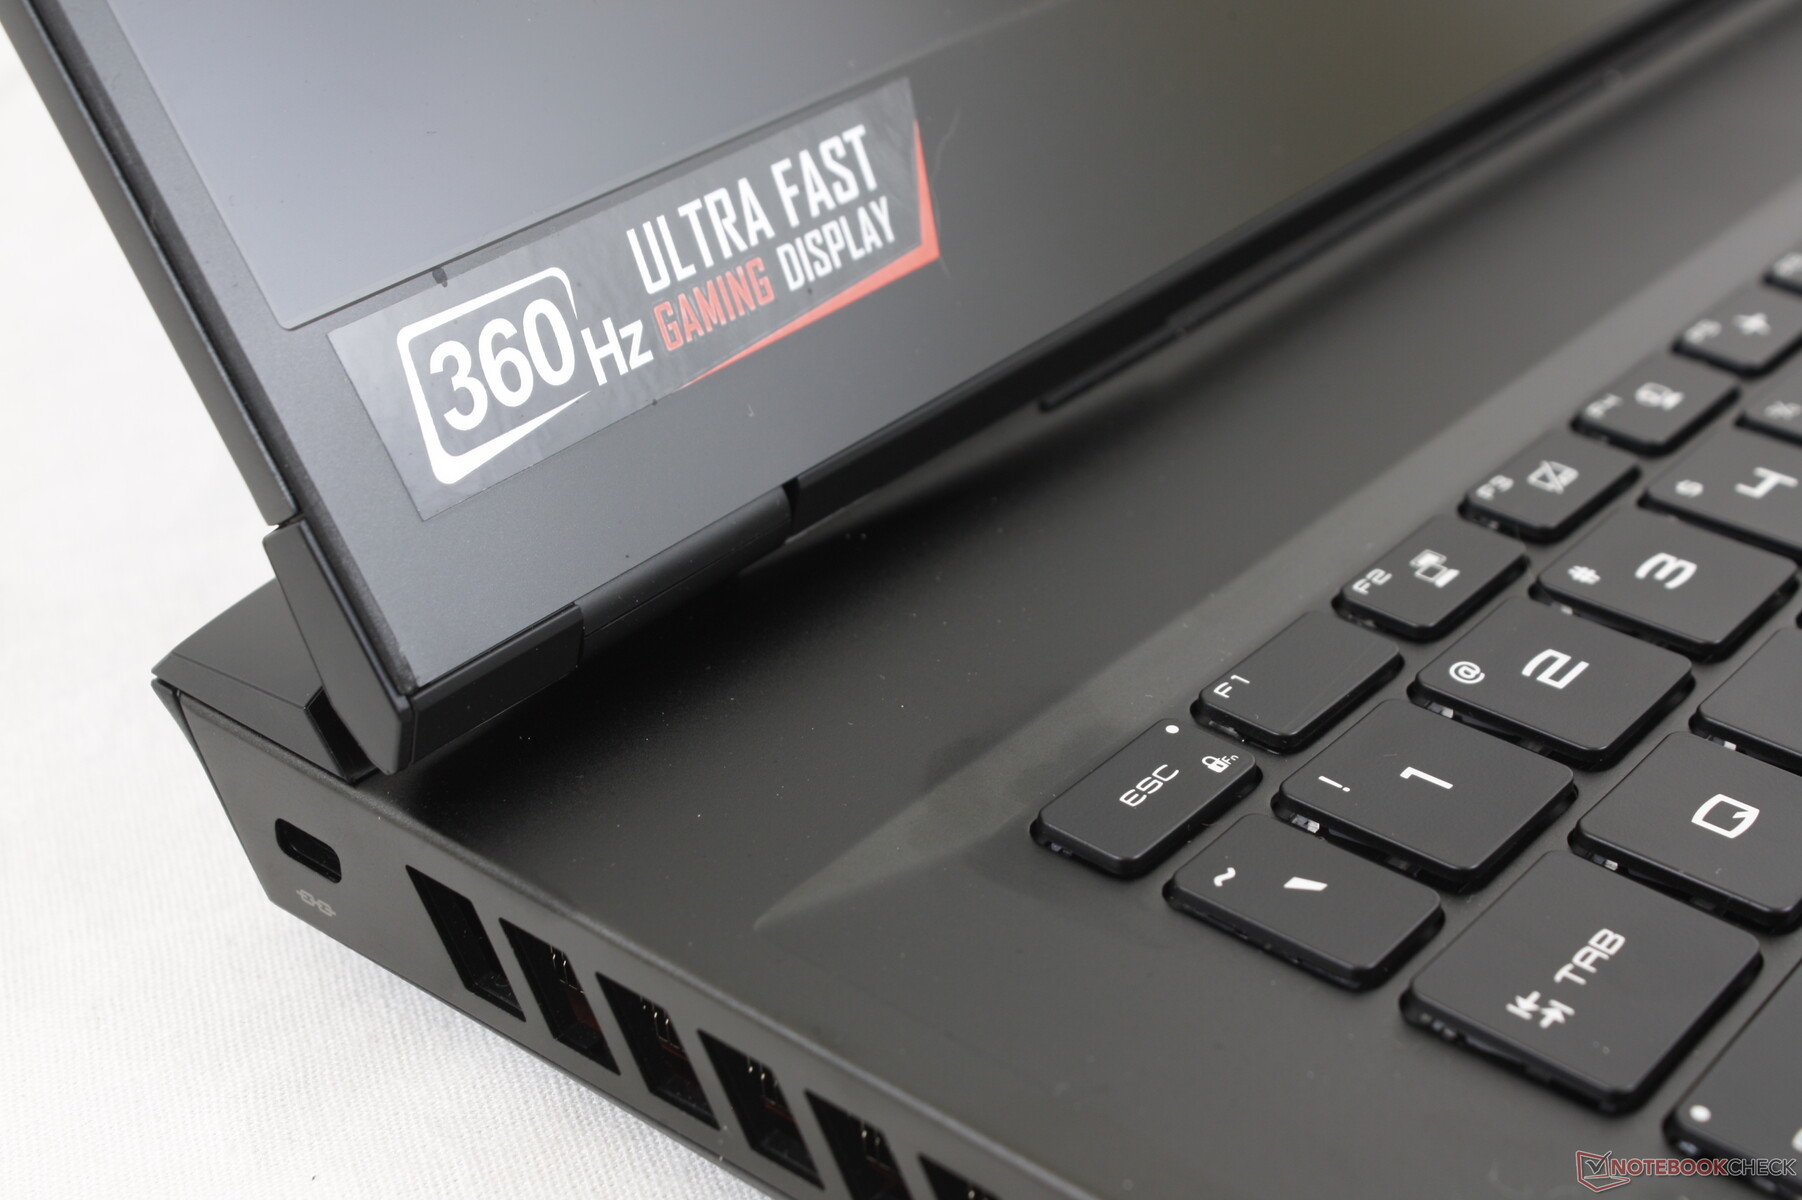
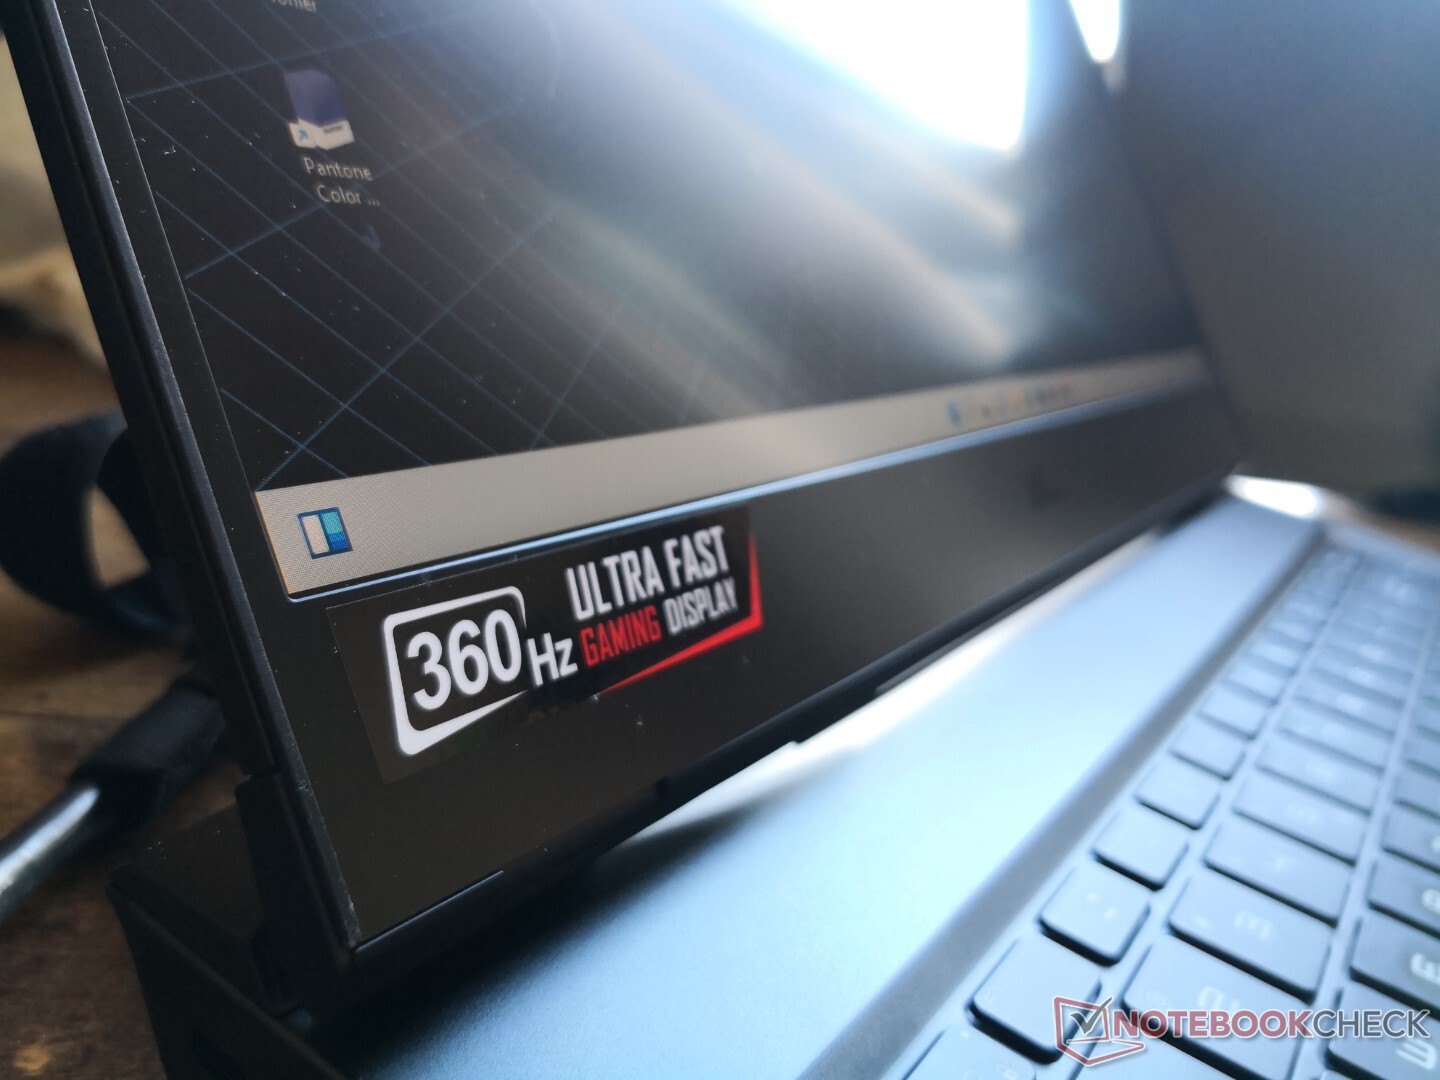
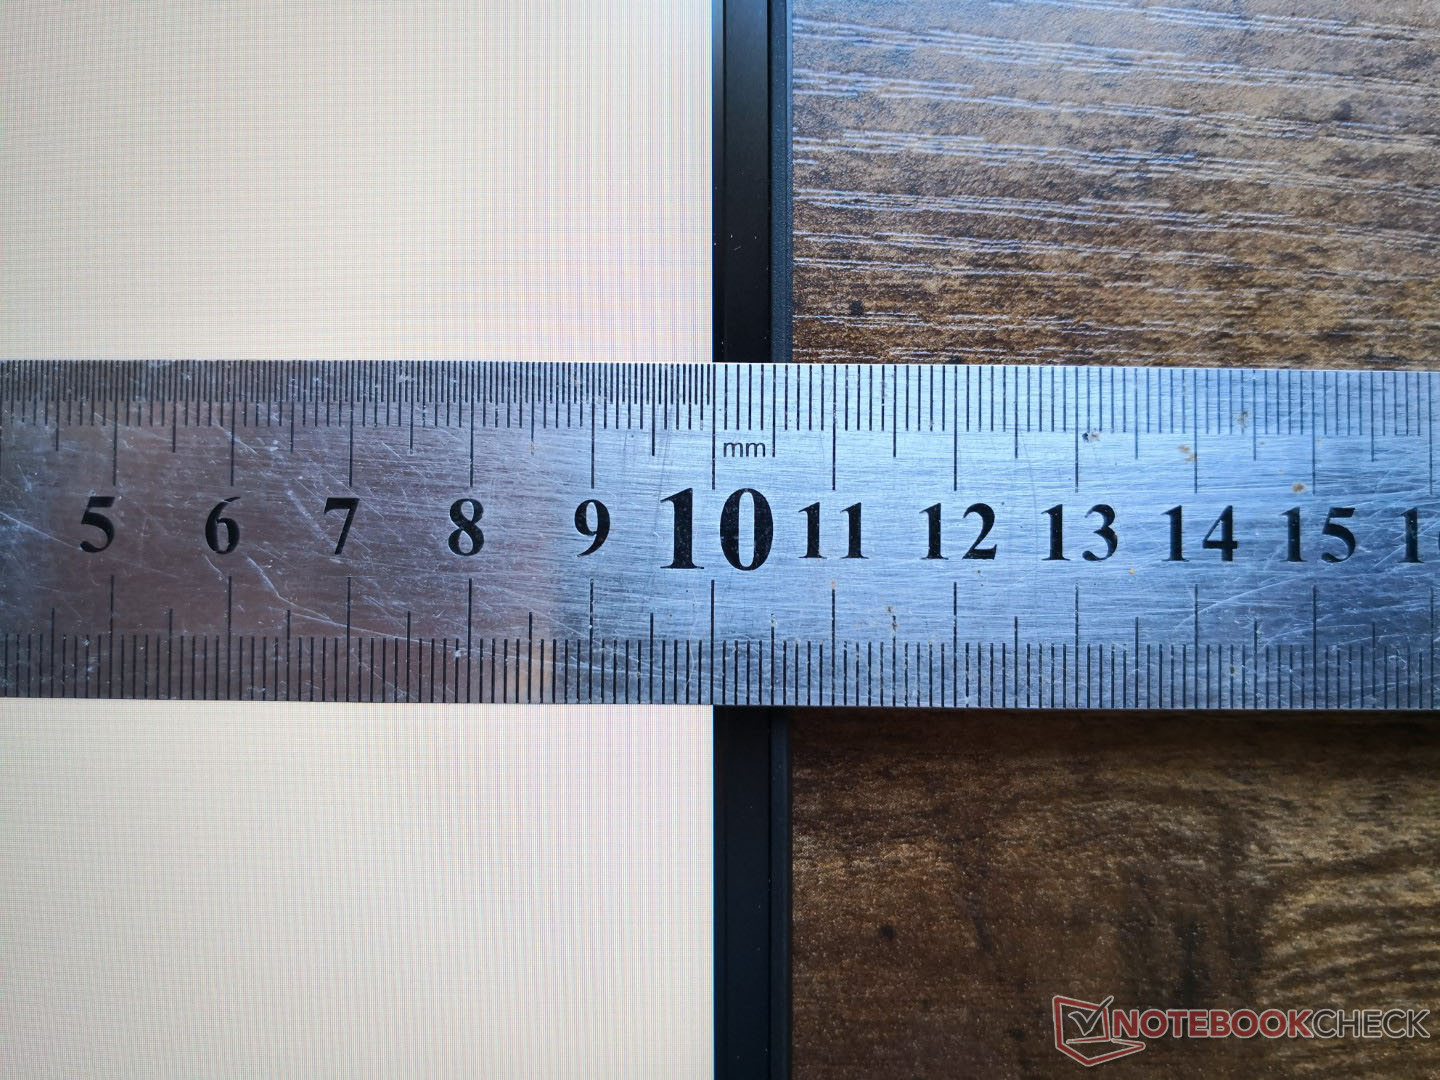
Il Vector GP66 è il primo portatile nel nostro database a venire con il pannello IPS BOE NE156FHM-NZ3 a 360 Hz in contrasto con il pannello IPS LG LP156WFG-SPB3 a 144 Hz sul nostro vecchio GP66 Leopard. Il pannello BOE offre sia tassi di aggiornamento più veloci che tempi di risposta grigio-grigio, pur mantenendo la stessa copertura completa sRGB e lo stesso rapporto di contrasto del suddetto pannello LG. La luminosità massima è leggermente inferiore, ma non di molto. È un pannello di fascia alta adatto a un PC da gioco di fascia media superiore.
Tenete a mente che MSI offre anche un'opzione più lenta a 144 Hz su SKU meno costose del Vector GP66. I colori su questo pannello a 144 Hz sono significativamente peggiori a solo ~60% di sRGB e quindi potrebbe essere saggio evitare queste SKU se la qualità del display è una priorità.

| |||||||||||||||||||||||||
Distribuzione della luminosità: 85 %
Al centro con la batteria: 353.1 cd/m²
Contrasto: 929:1 (Nero: 0.38 cd/m²)
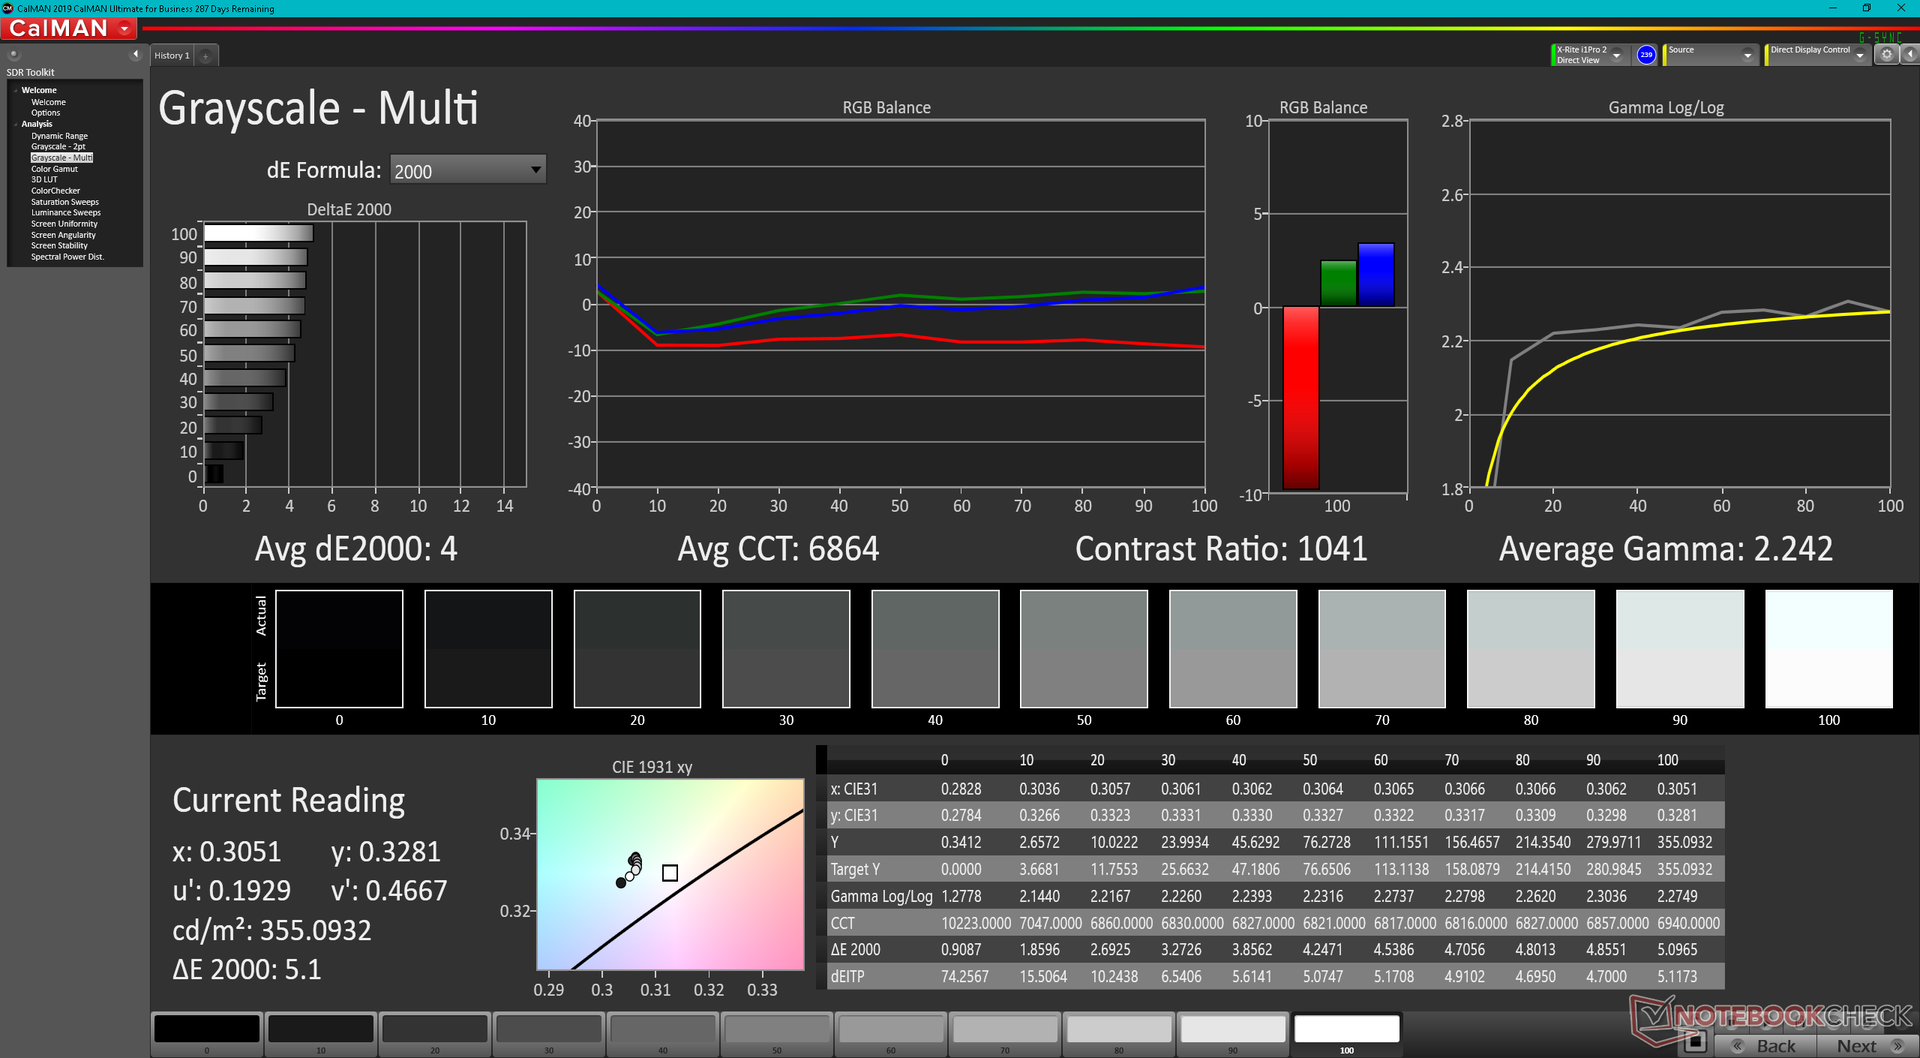
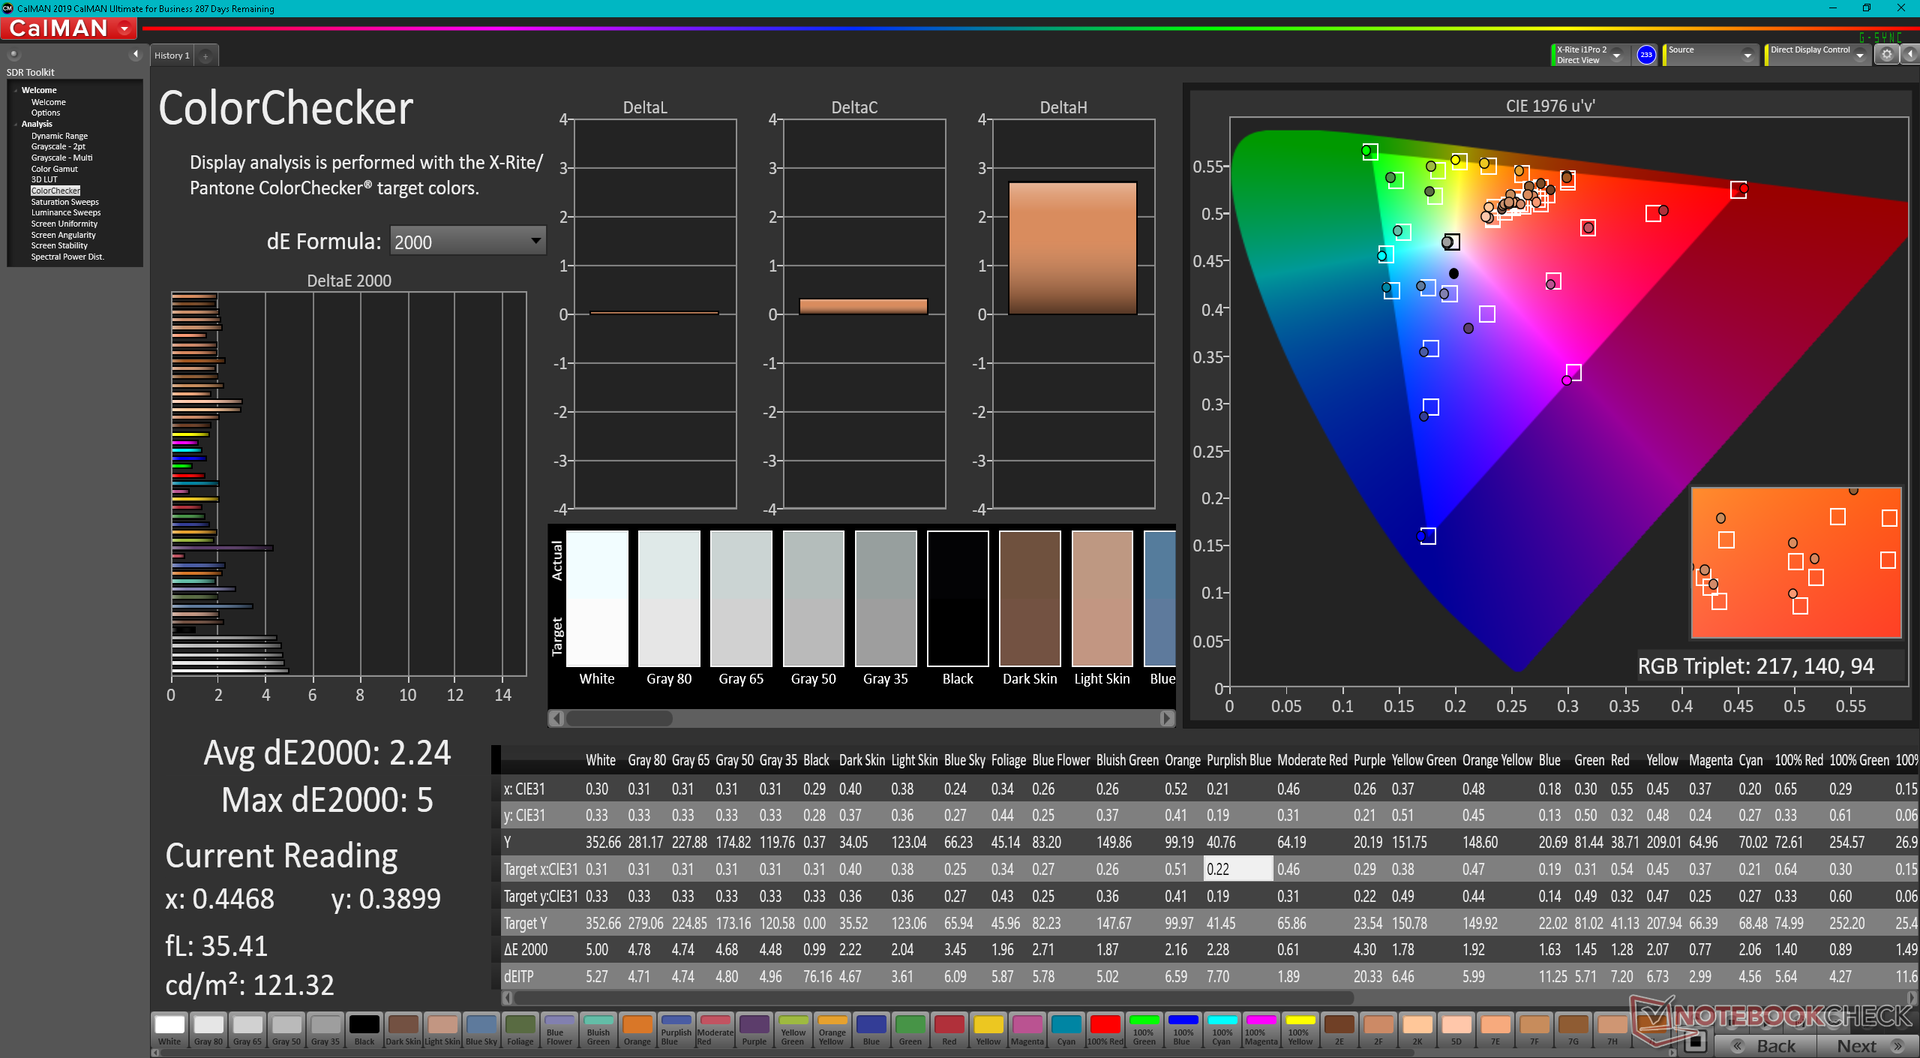
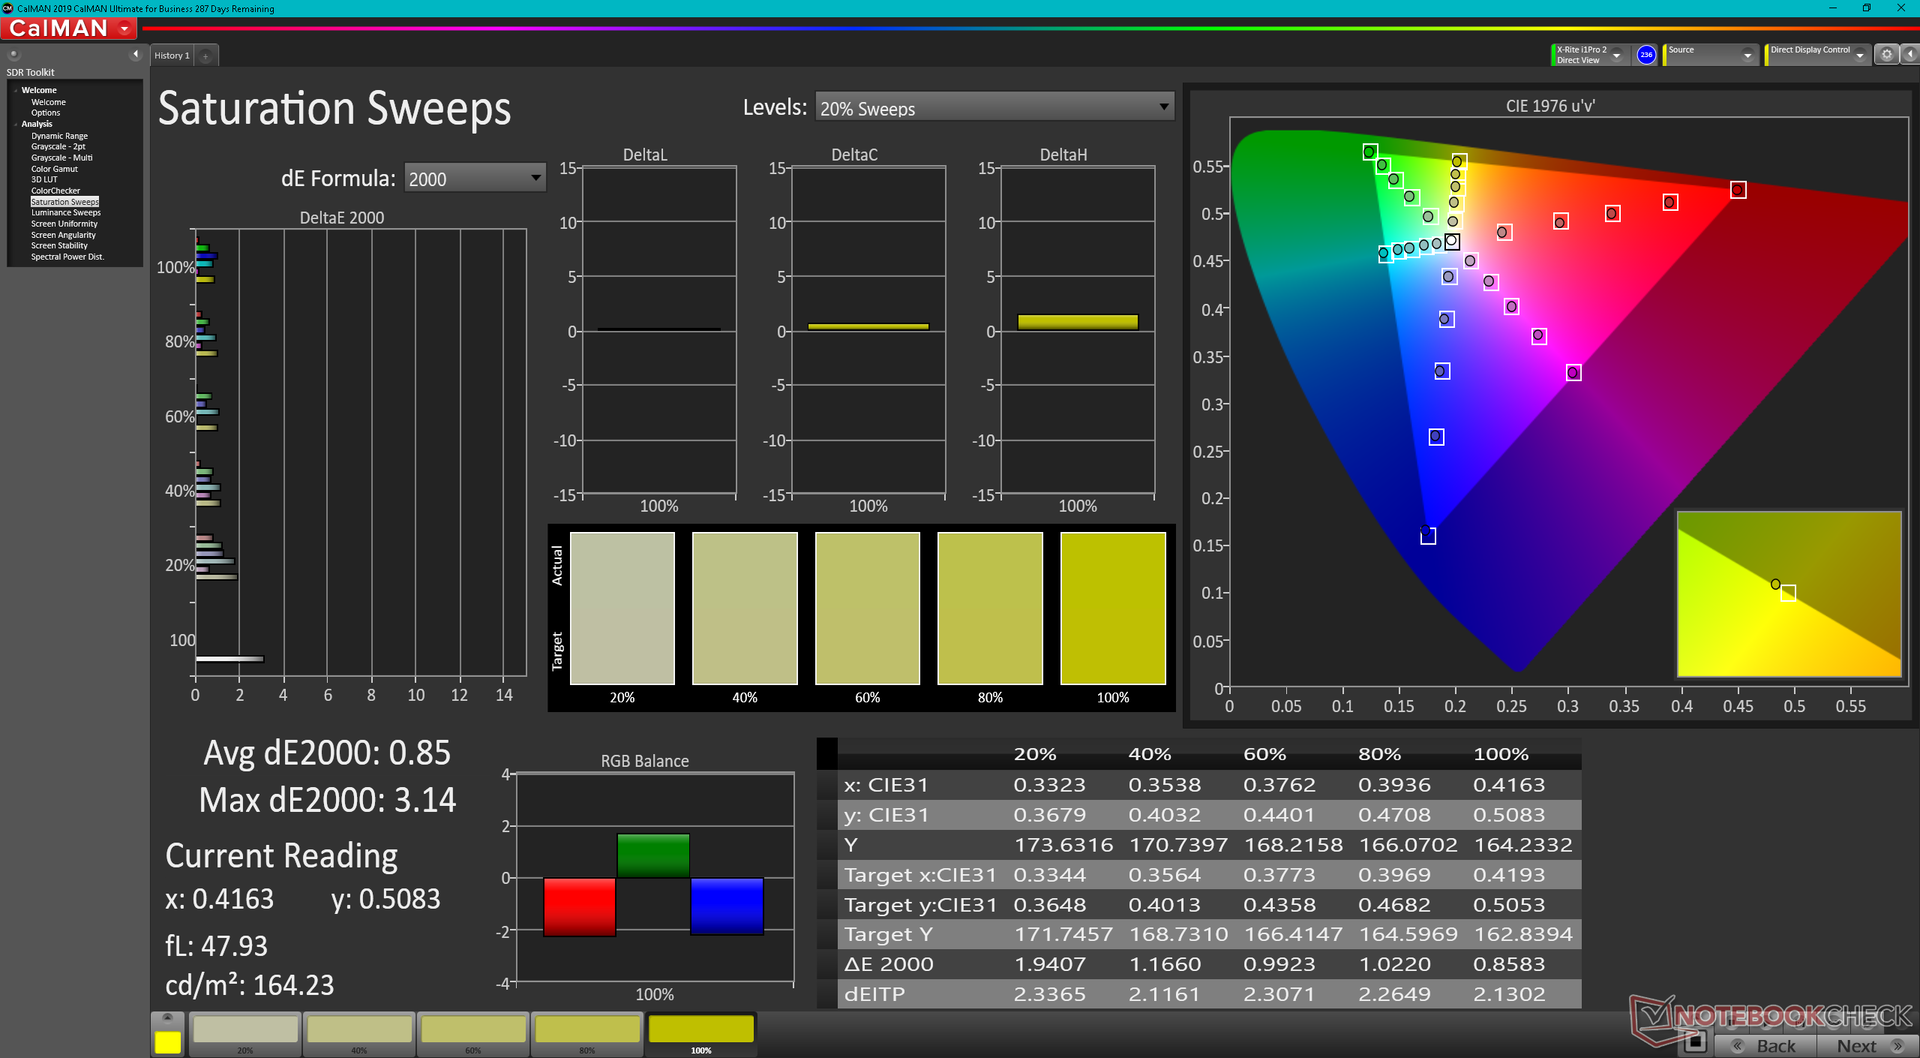
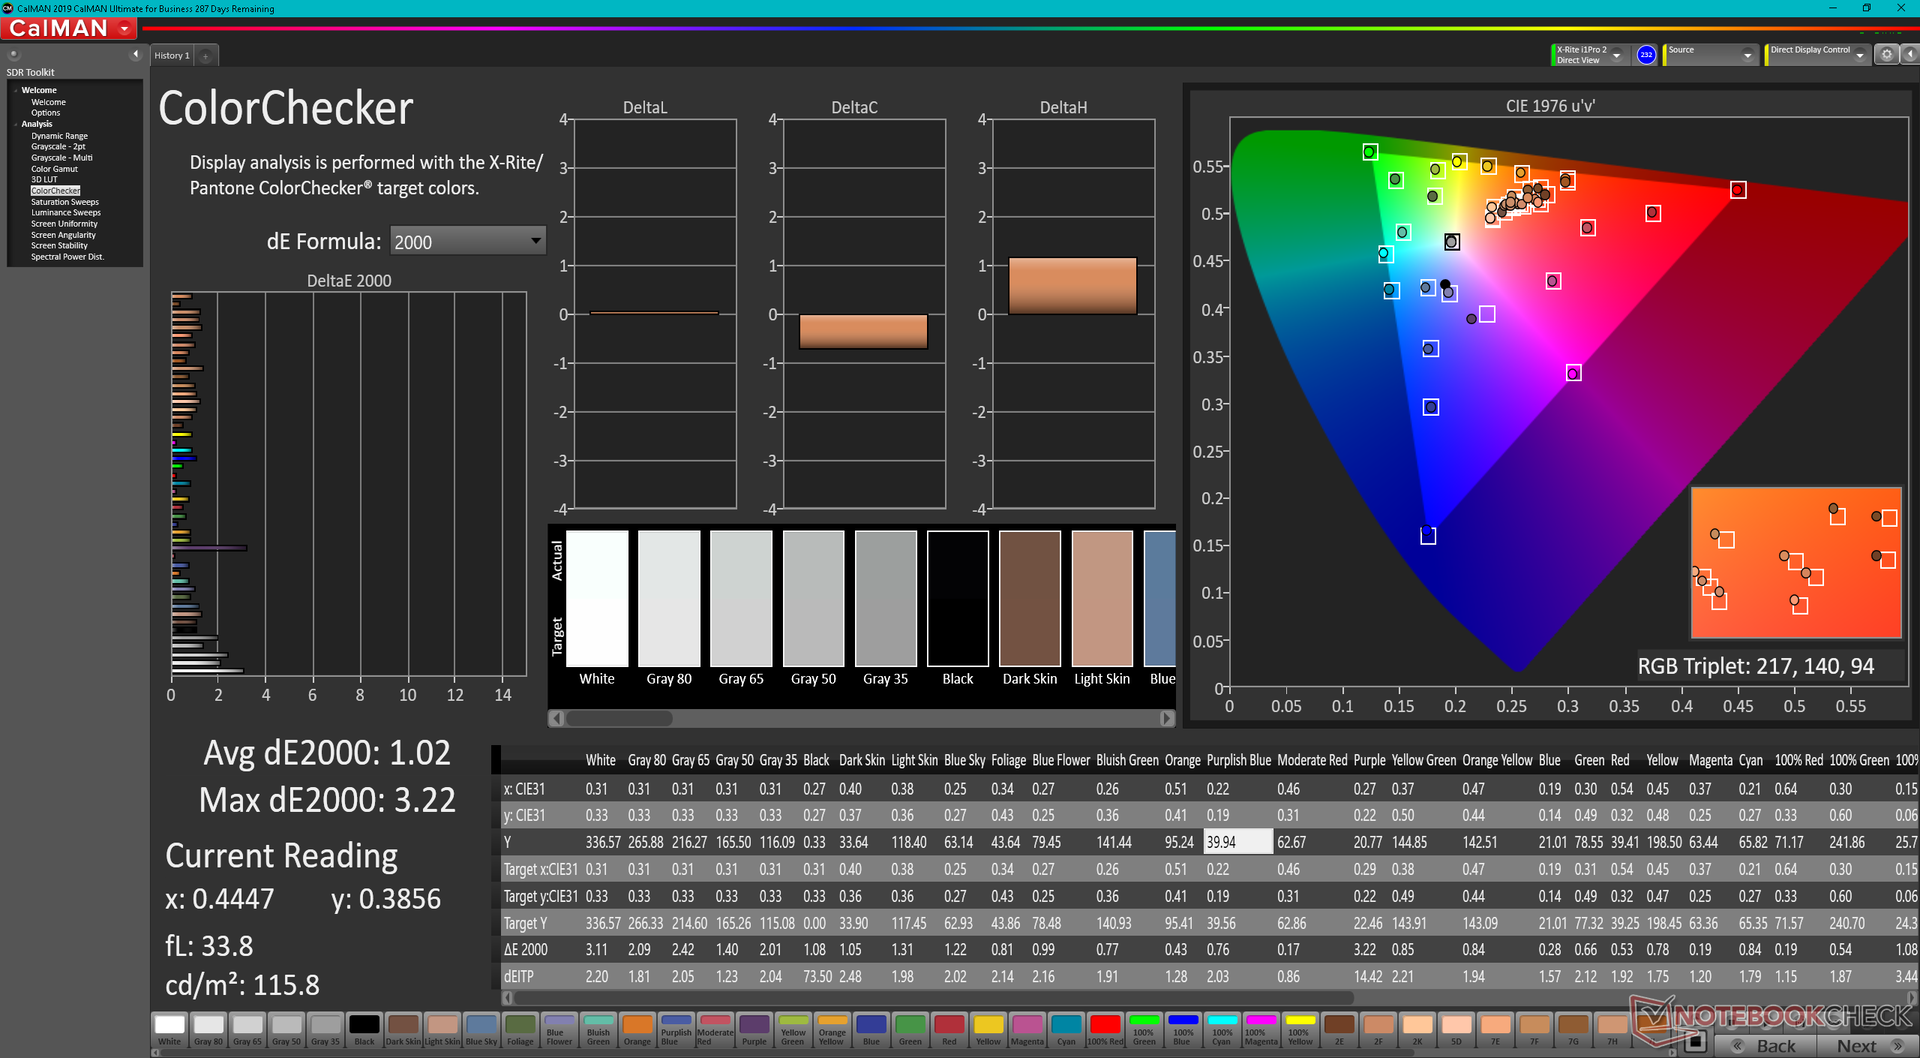
ΔE ColorChecker Calman: 2.24 | ∀{0.5-29.43 Ø4.71}
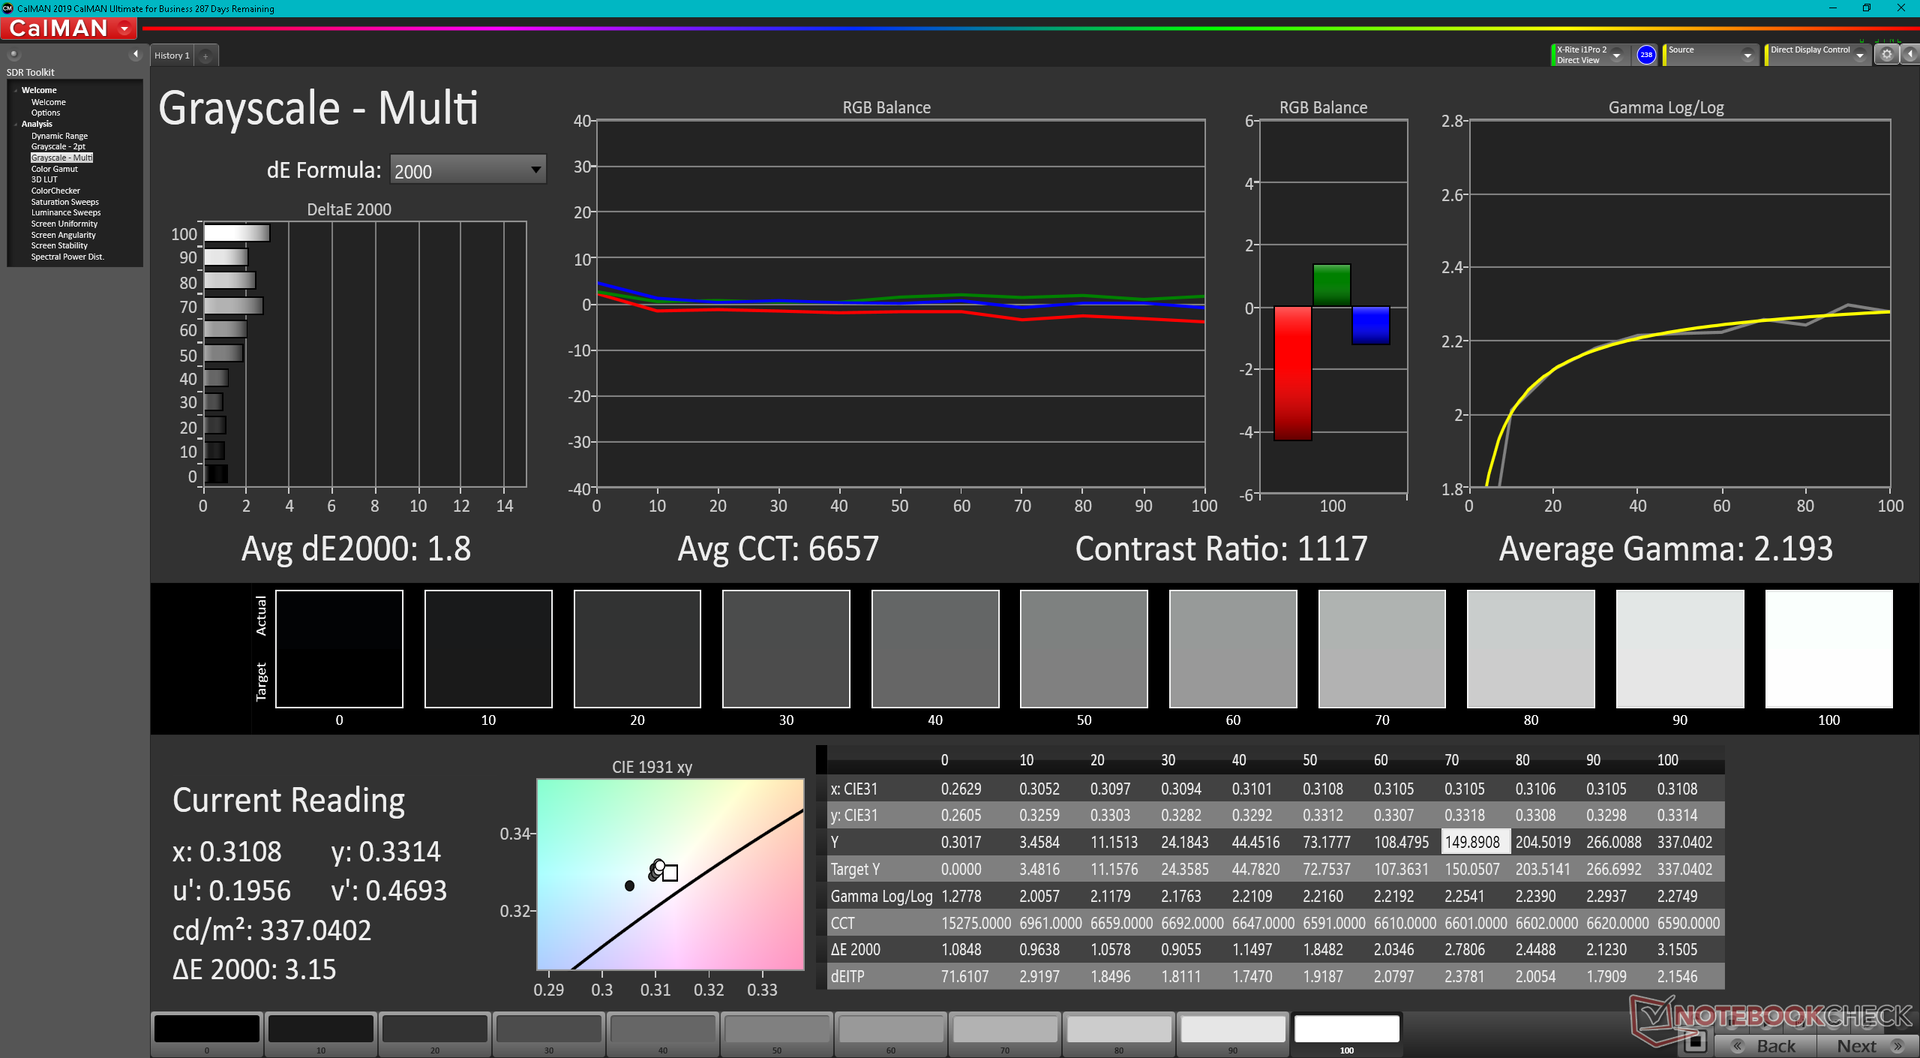
calibrated: 1.02
ΔE Greyscale Calman: 4 | ∀{0.09-98 Ø4.96}
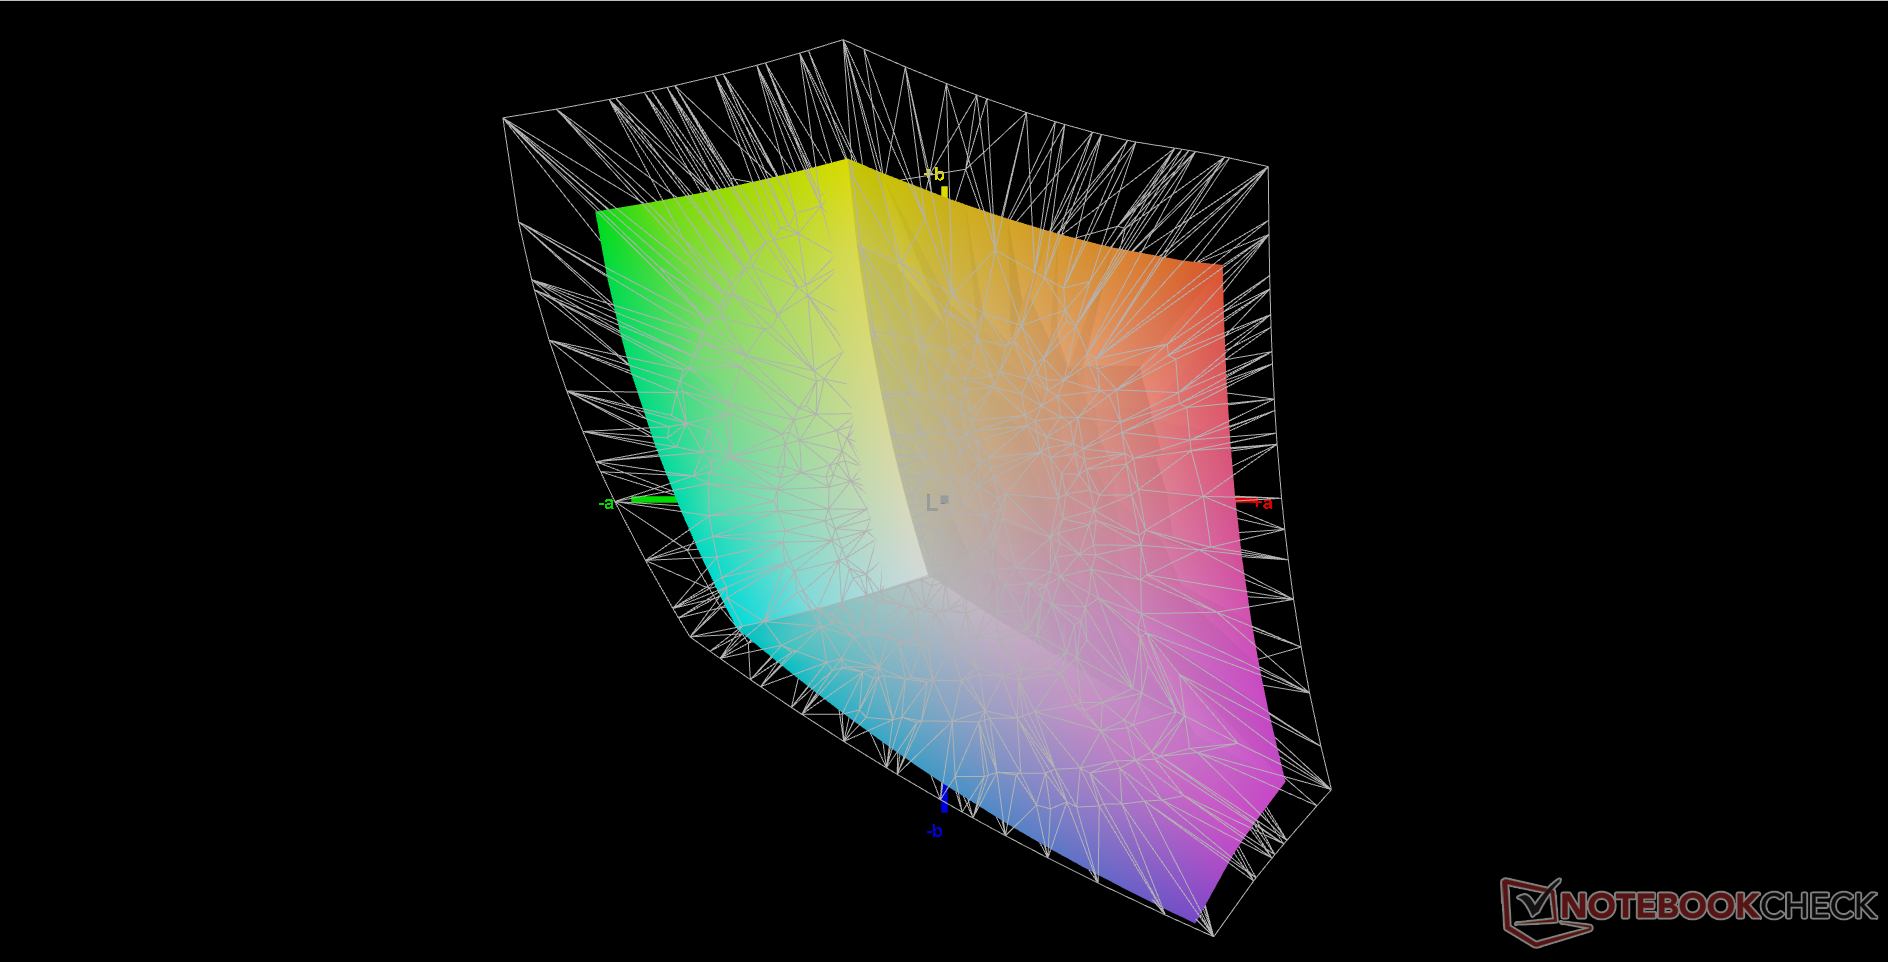
72.1% AdobeRGB 1998 (Argyll 3D)
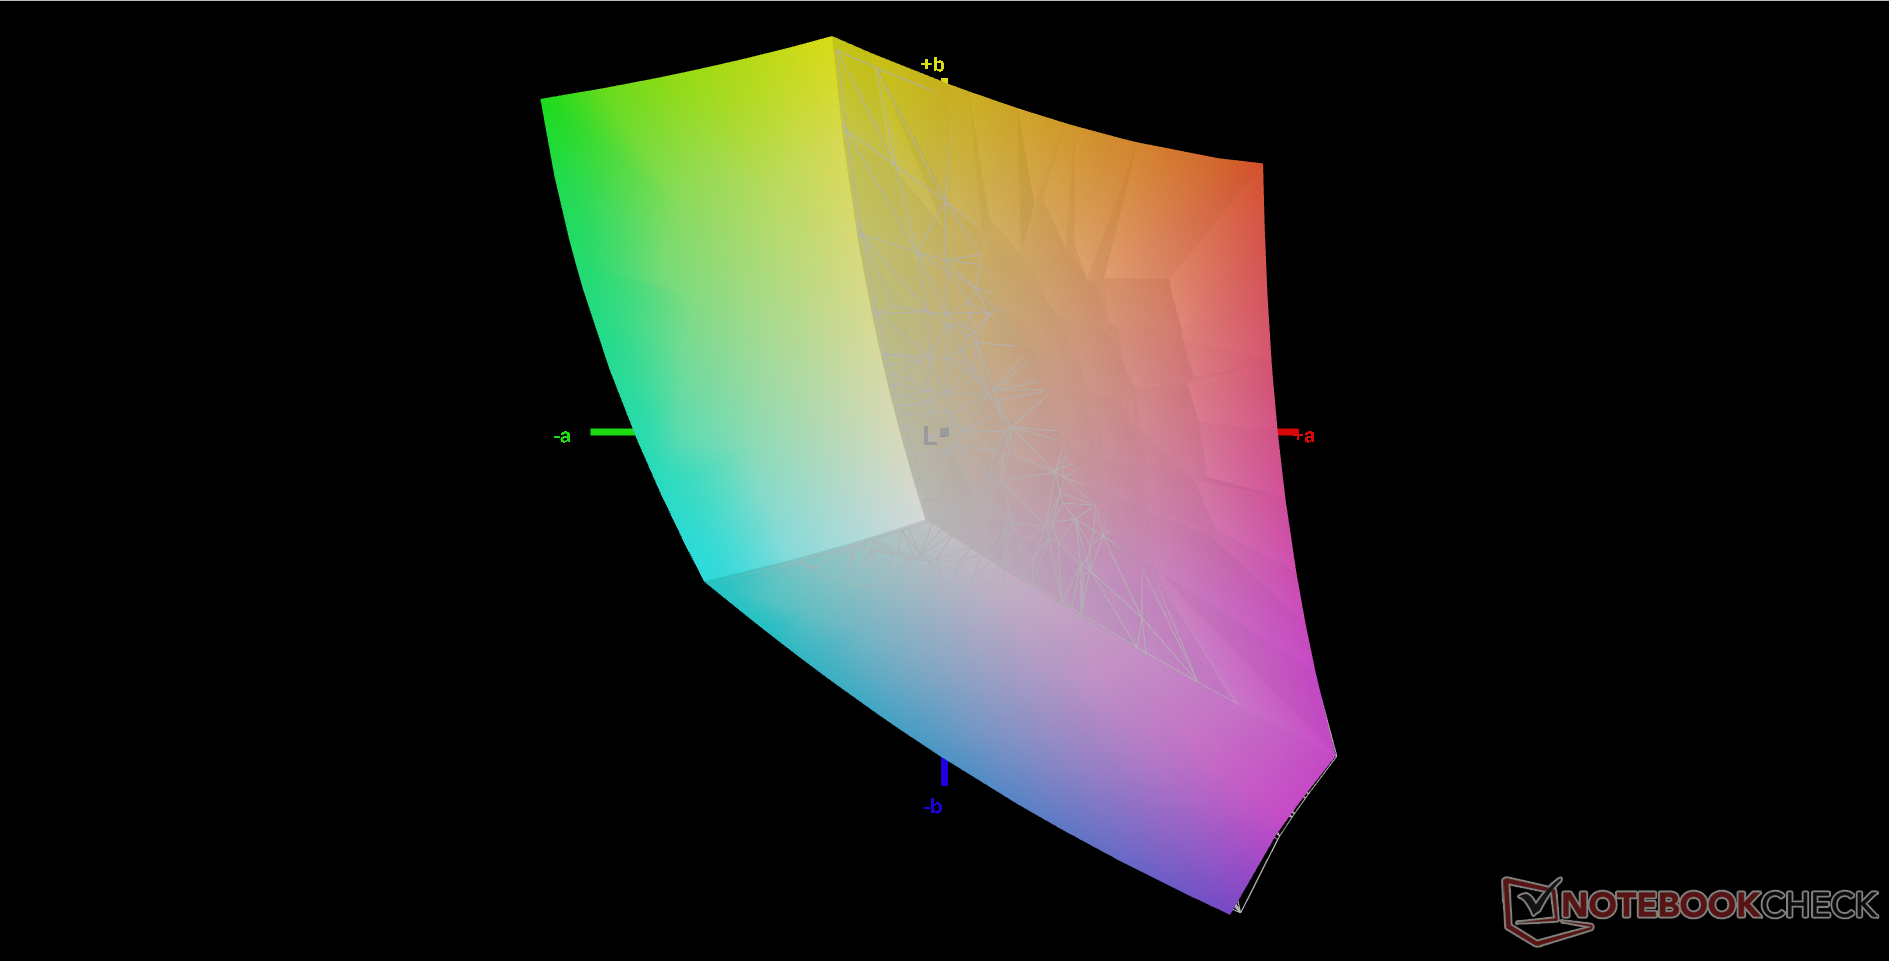
99.5% sRGB (Argyll 3D)
70.1% Display P3 (Argyll 3D)
Gamma: 2.24
CCT: 6864 K
| MSI Vector GP66 12UGS BOE NE156FHM-NZ3, IPS, 1920x1080, 15.6" | MSI GP66 Leopard 11UH-028 LGD0625 (LP156WFG-SPB3), IPS, 1920x1080, 15.6" | MSI Katana GF66 11UG-220 AU Optronics B156HAN08.0, IPS, 1920x1080, 15.6" | Asus TUF Gaming F15 FX506HM Chi Mei N156HRA-EA1, IPS, 1920x1080, 15.6" | Razer Blade 15 Base Edition 2021, i7-10750H RTX 3060 BOE NV156FHM-N4K, IPS, 1920x1080, 15.6" | Alienware m15 R5 Ryzen Edition B156HAN, IPS, 1920x1080, 15.6" | |
|---|---|---|---|---|---|---|
| Display | -6% | -7% | -39% | -8% | ||
| Display P3 Coverage (%) | 70.1 | 65.2 -7% | 65.4 -7% | 41.9 -40% | 64.3 -8% | |
| sRGB Coverage (%) | 99.5 | 95.8 -4% | 91.3 -8% | 62.9 -37% | 91.8 -8% | |
| AdobeRGB 1998 Coverage (%) | 72.1 | 66 -8% | 66.7 -7% | 43.3 -40% | 65.5 -9% | |
| Response Times | -77% | -23% | -258% | -28% | 22% | |
| Response Time Grey 50% / Grey 80% * (ms) | 5.8 ? | 14 ? -141% | 7.4 ? -28% | 28.4 ? -390% | 8.8 ? -52% | 4 ? 31% |
| Response Time Black / White * (ms) | 9.6 ? | 10.8 ? -13% | 11.2 ? -17% | 21.6 ? -125% | 10 ? -4% | 8.4 ? 12% |
| PWM Frequency (Hz) | 1000 ? | |||||
| Screen | -21% | -30% | -71% | -32% | 2% | |
| Brightness middle (cd/m²) | 353.1 | 390 10% | 307 -13% | 268.3 -24% | 317.2 -10% | 329 -7% |
| Brightness (cd/m²) | 325 | 362 11% | 321 -1% | 257 -21% | 306 -6% | 321 -1% |
| Brightness Distribution (%) | 85 | 87 2% | 83 -2% | 84 -1% | 89 5% | 92 8% |
| Black Level * (cd/m²) | 0.38 | 0.41 -8% | 0.27 29% | 0.34 11% | 0.31 18% | 0.27 29% |
| Contrast (:1) | 929 | 951 2% | 1137 22% | 789 -15% | 1023 10% | 1219 31% |
| Colorchecker dE 2000 * | 2.24 | 2.66 -19% | 4.67 -108% | 5.05 -125% | 4.37 -95% | 2.78 -24% |
| Colorchecker dE 2000 max. * | 5 | 7.14 -43% | 7.53 -51% | 15.43 -209% | 6.62 -32% | 4.88 2% |
| Colorchecker dE 2000 calibrated * | 1.02 | 2.56 -151% | 2.41 -136% | 3.21 -215% | 2.67 -162% | 1.63 -60% |
| Greyscale dE 2000 * | 4 | 3.63 9% | 4.5 -13% | 5.5 -38% | 4.5 -13% | 2.5 37% |
| Gamma | 2.24 98% | 2.57 86% | 2.276 97% | 2.35 94% | 2.4 92% | 2.106 104% |
| CCT | 6864 95% | 6894 94% | 6824 95% | 7392 88% | 7418 88% | 6201 105% |
| Color Space (Percent of AdobeRGB 1998) (%) | 59.2 | 76 | ||||
| Color Space (Percent of sRGB) (%) | 91.4 | 99 | ||||
| Media totale (Programma / Settaggio) | -35% /
-26% | -20% /
-24% | -123% /
-91% | -23% /
-26% | 12% /
5% |
* ... Meglio usare valori piccoli
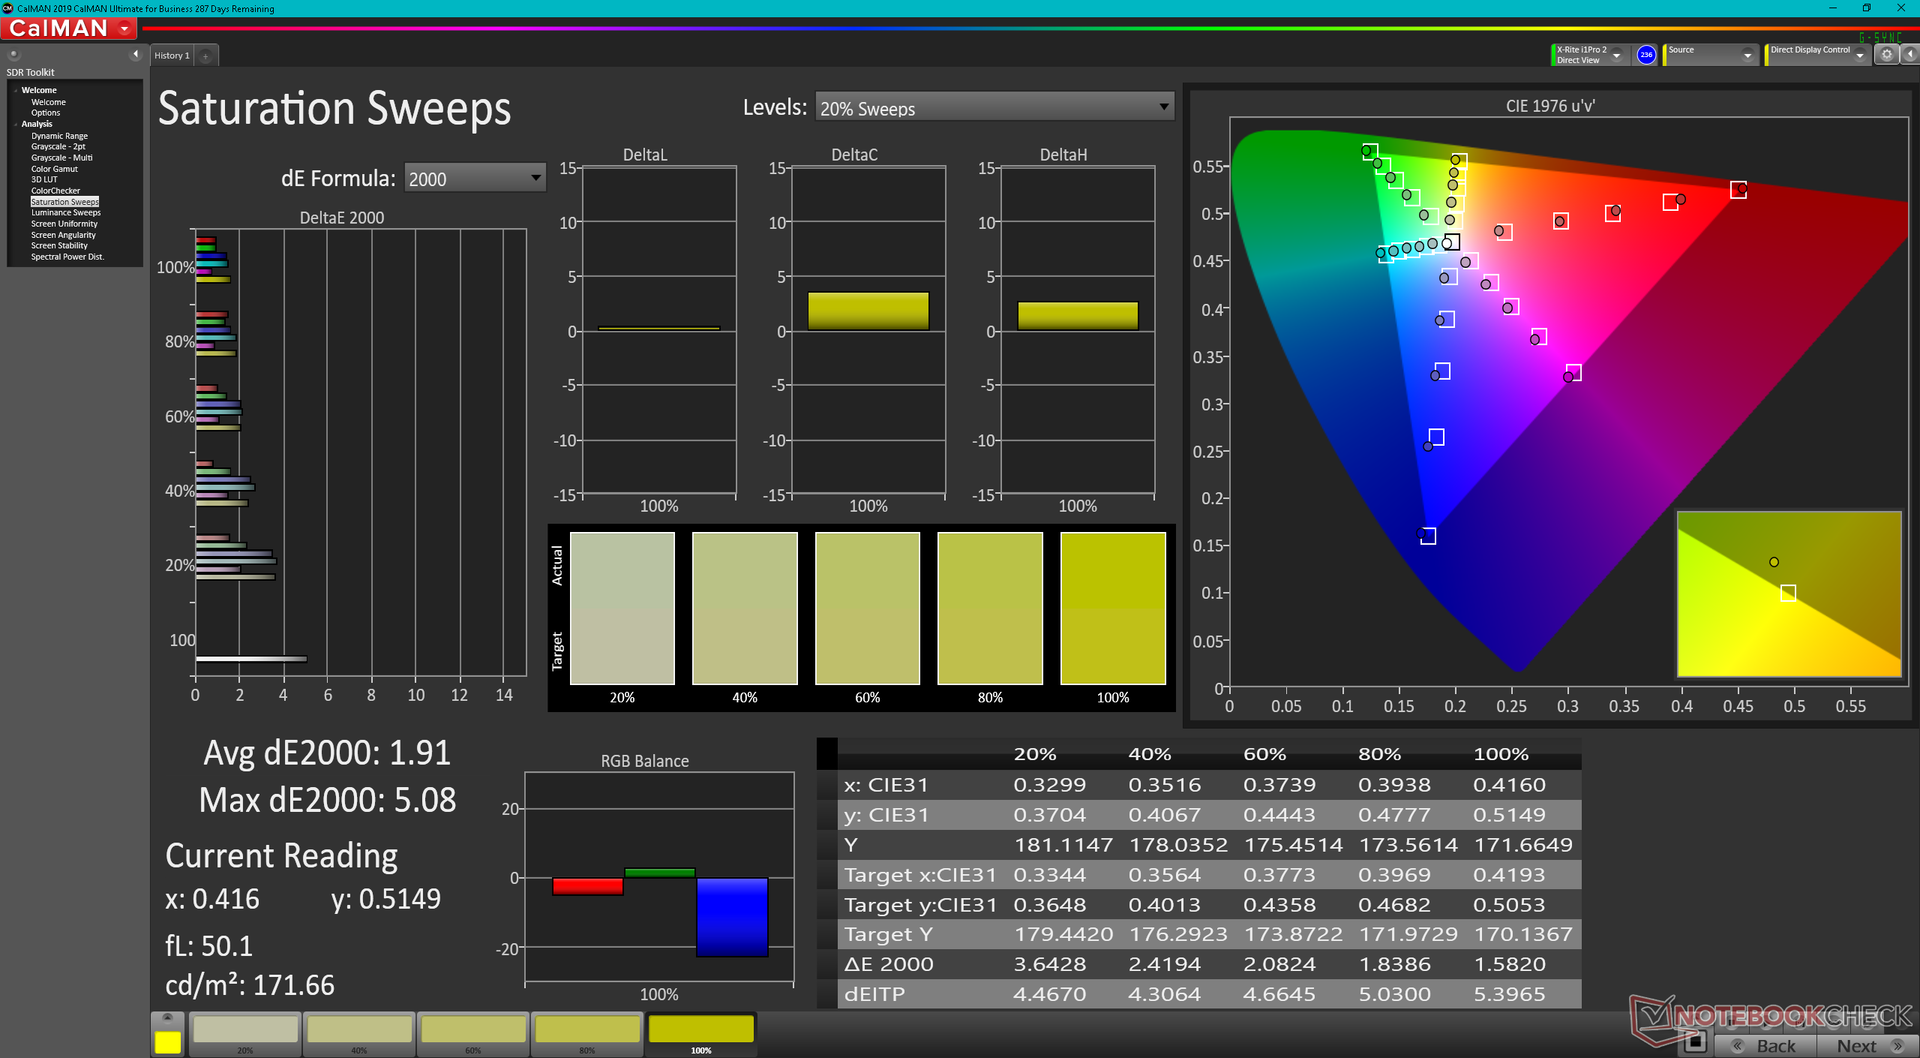
Il pannello copre tutto l'sRGB e anche un po' di più dell'AdobeRGB rispetto ai pannelli del GF66 Katana o del GP66 Leopard. Siamo felici di vedere un pannello di alta qualità qui rispetto al Chi Mei sull'Asus TUF Gaming F15 che copre una gamma significativamente più stretta
Il display è calibrato decentemente out-of-the-box anche se la sua temperatura di colore potrebbe essere leggermente più calda. Una calibrazione con colorimetro X-Rite risolve questo problema per migliorare i valori DeltaE medi della scala di grigi e del colore da 4 e 2,24 a soli 1,8 e 1,02, rispettivamente
Tempi di risposta del Display
| ↔ Tempi di risposta dal Nero al Bianco | ||
|---|---|---|
| 9.6 ms ... aumenta ↗ e diminuisce ↘ combinato | ↗ 5.2 ms Incremento | 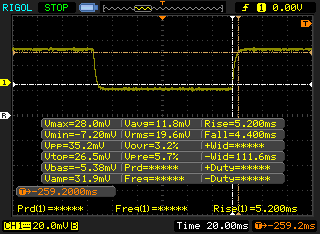 |
| ↘ 4.4 ms Calo | ||
| Lo schermo mostra veloci tempi di risposta durante i nostri tests e dovrebbe esere adatto al gaming In confronto, tutti i dispositivi di test variano da 0.1 (minimo) a 240 (massimo) ms. » 26 % di tutti i dispositivi è migliore. Questo significa che i tempi di risposta rilevati sono migliori rispettto alla media di tutti i dispositivi testati (19.8 ms). | ||
| ↔ Tempo di risposta dal 50% Grigio all'80% Grigio | ||
| 5.8 ms ... aumenta ↗ e diminuisce ↘ combinato | ↗ 3.4 ms Incremento | 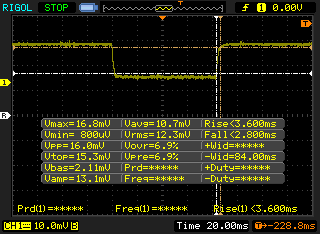 |
| ↘ 2.4 ms Calo | ||
| Lo schermo ha mostrato valori di risposta molto veloci nei nostri tests ed è molto adatto per i gaming veloce. In confronto, tutti i dispositivi di test variano da 0.165 (minimo) a 636 (massimo) ms. » 19 % di tutti i dispositivi è migliore. Questo significa che i tempi di risposta rilevati sono migliori rispettto alla media di tutti i dispositivi testati (31 ms). | ||
Sfarfallio dello schermo / PWM (Pulse-Width Modulation)
| flickering dello schermo / PWM non rilevato | 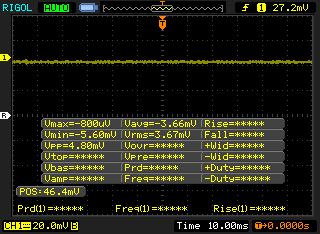 | ||
In confronto: 52 % di tutti i dispositivi testati non utilizza PWM per ridurre la luminosita' del display. Se è rilevato PWM, una media di 7757 (minimo: 5 - massimo: 343500) Hz è stata rilevata. | |||

Performance
Condizioni di test
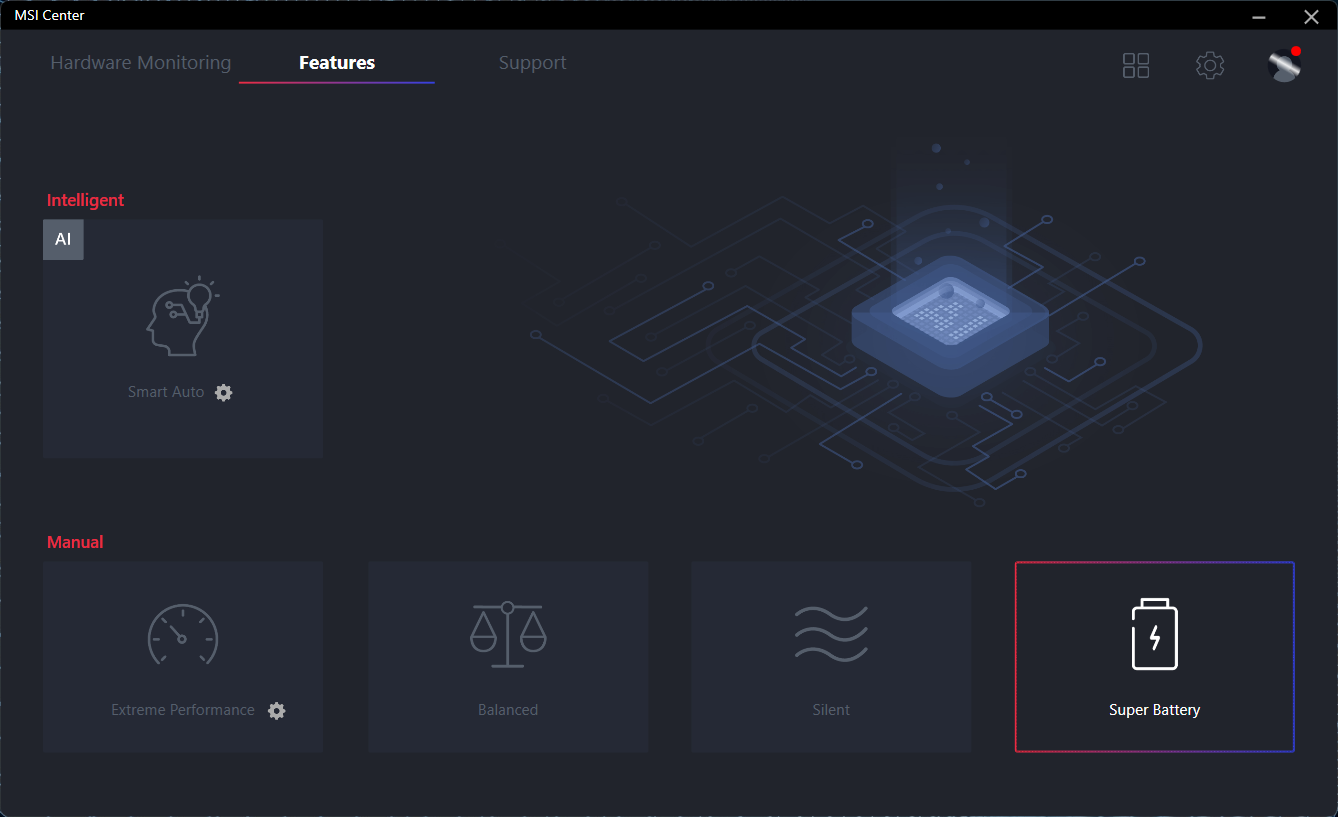
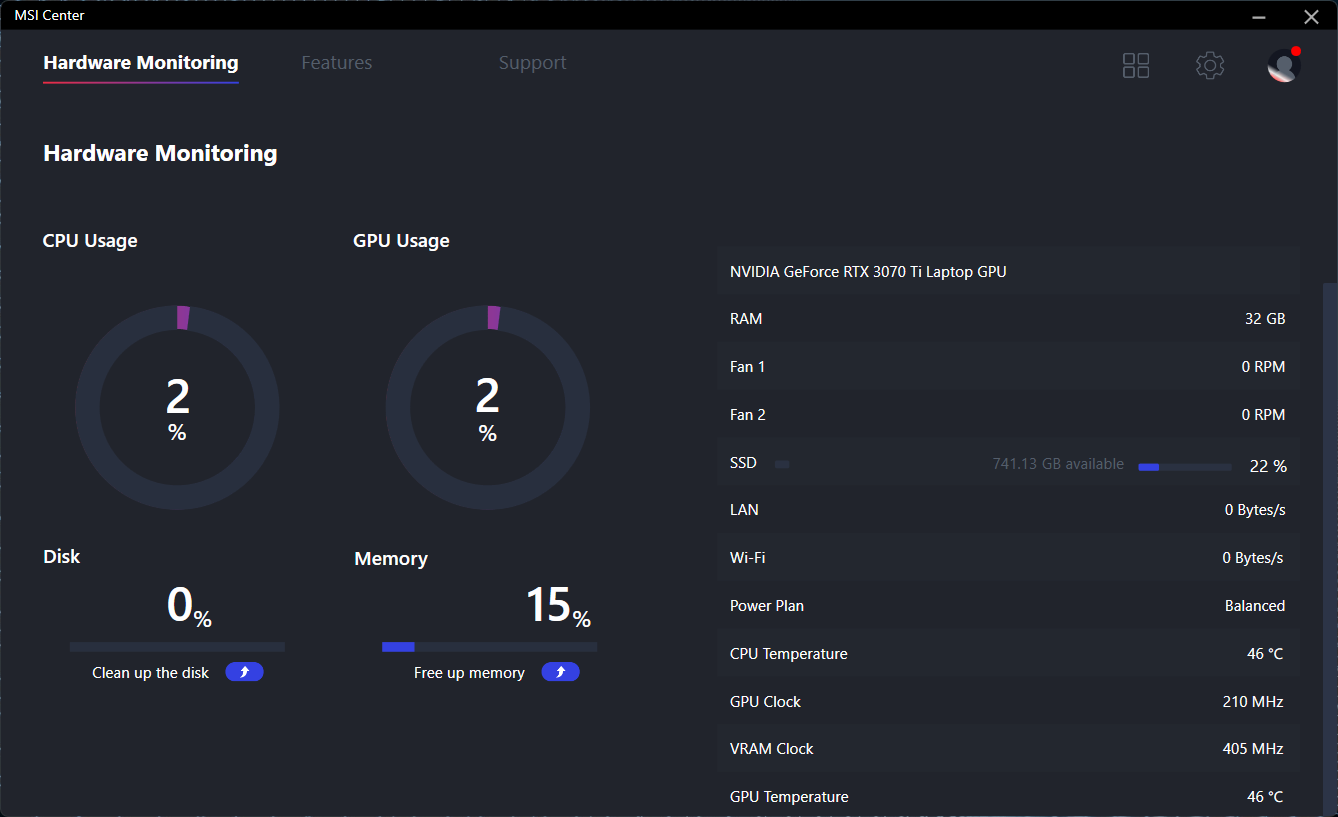
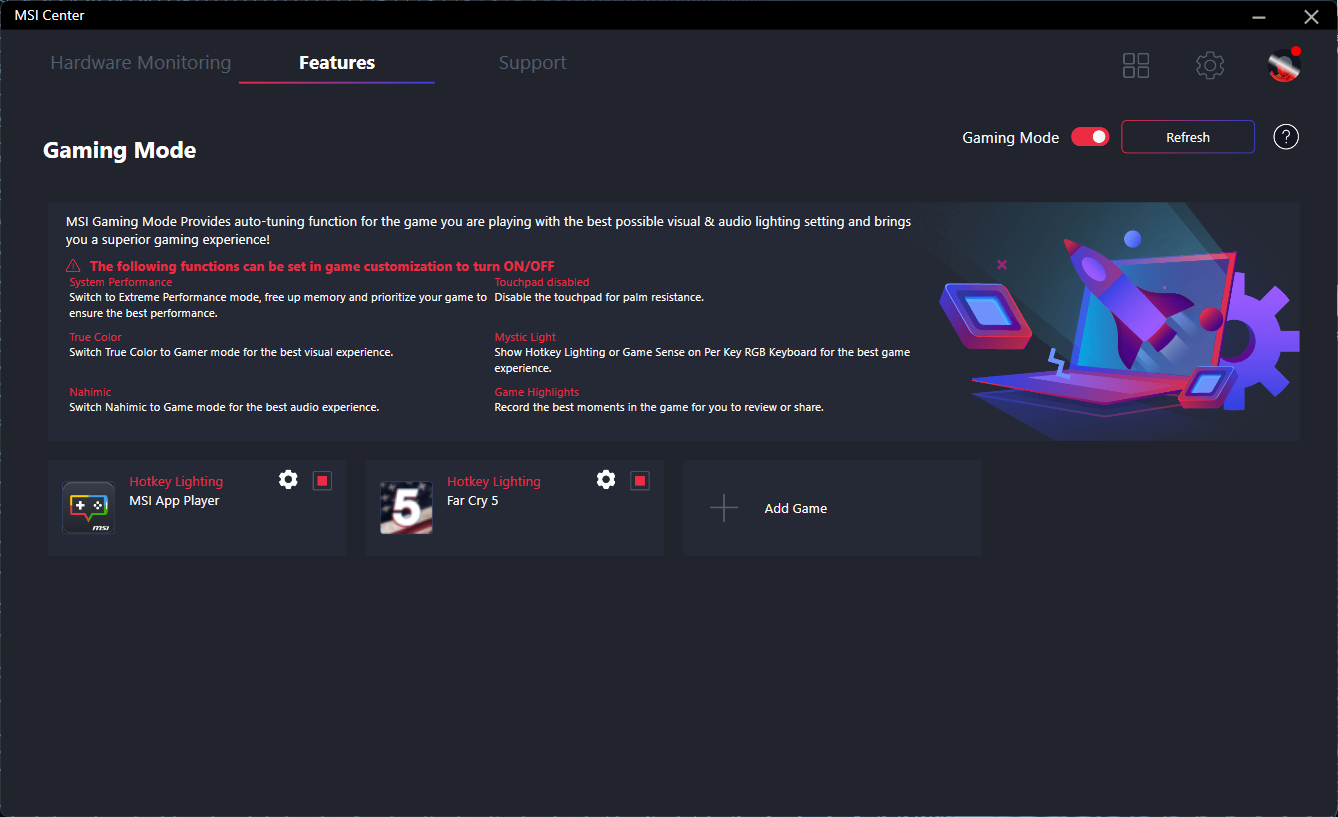
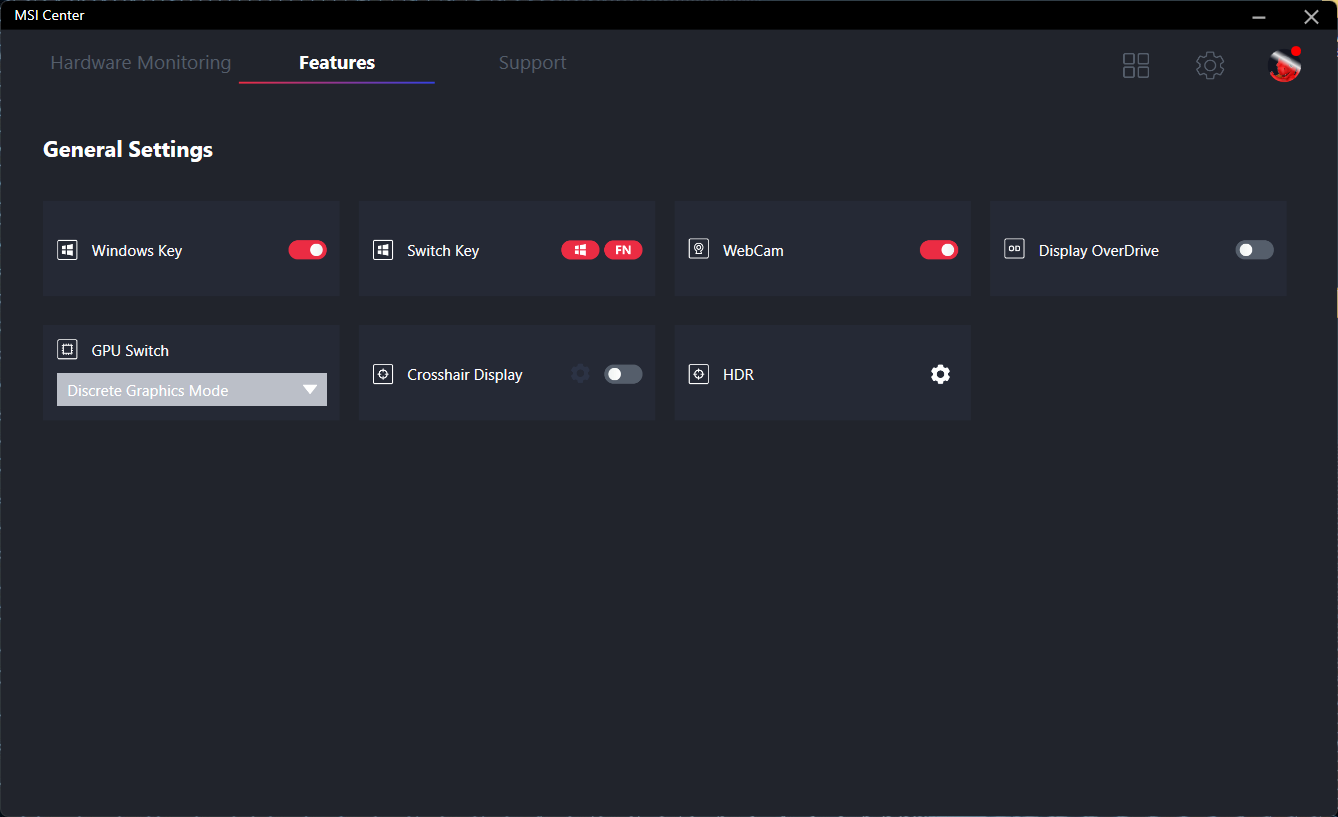
La nostra unità è stata impostata in modalità Extreme Performance con la GPU discreta attiva tramite il software MSI Center per ottenere i massimi punteggi possibili. Raccomandiamo vivamente agli utenti di familiarizzare con questo software, dato che molte caratteristiche importanti sono gestite qui, tra cui MSHybrid, monitoraggio hardware, HDR e altre impostazioni QoL. Per gli effetti di illuminazione della tastiera, gli utenti devono fare affidamento sul software preinstallato SteelSeries GG
Un riavvio è richiesto se si passa tra le modalità MSHybrid e GPU discreta.
Processore
Il Core i9-12900H è circa il 25% e il 35% più veloce nelle applicazioni single-threaded e multi-threaded, rispettivamente, rispetto al Core i7-11800H che si trova sul GP66 Leopard. Le prestazioni complessive possono anche superare il desktop più affamato di energiaCore i9-11900K. La serie Zen 3 H di AMD ha precedentemente detenuto la corona delle prestazioni prima del lancio della serie Alder Lake-H di Intel.
Maggiori informazioni su Alder Lake possono essere trovate sulla nostra panoramica della piattaforma qui.
Cinebench R15 Multi Loop
Cinebench R23: Multi Core | Single Core
Cinebench R15: CPU Multi 64Bit | CPU Single 64Bit
Blender: v2.79 BMW27 CPU
7-Zip 18.03: 7z b 4 | 7z b 4 -mmt1
Geekbench 5.5: Multi-Core | Single-Core
HWBOT x265 Benchmark v2.2: 4k Preset
LibreOffice : 20 Documents To PDF
R Benchmark 2.5: Overall mean
| Cinebench R20 / CPU (Multi Core) | |
| Intel Core i9-12900K | |
| MSI Vector GP66 12UGS | |
| MSI MEG Z590 ACE | |
| Media Intel Core i9-12900H (2681 - 7471, n=28) | |
| Eurocom Nightsky ARX315 | |
| MSI GP66 Leopard 11UH-028 | |
| HP ZBook Fury 15 G8 | |
| MSI Alpha 15 B5EEK-008 | |
| MSI Delta 15 A5EFK | |
| Alienware m15 R4 | |
| MSI GE65 Raider 9SF-049US | |
| Razer Blade 15 Advanced Model Early 2021 | |
| Cinebench R20 / CPU (Single Core) | |
| Intel Core i9-12900K | |
| MSI Vector GP66 12UGS | |
| Media Intel Core i9-12900H (624 - 738, n=28) | |
| MSI MEG Z590 ACE | |
| HP ZBook Fury 15 G8 | |
| Eurocom Nightsky ARX315 | |
| MSI GP66 Leopard 11UH-028 | |
| MSI Delta 15 A5EFK | |
| MSI Alpha 15 B5EEK-008 | |
| Alienware m15 R4 | |
| Razer Blade 15 Advanced Model Early 2021 | |
| MSI GE65 Raider 9SF-049US | |
| Cinebench R23 / Multi Core | |
| Intel Core i9-12900K | |
| MSI Vector GP66 12UGS | |
| MSI MEG Z590 ACE | |
| Media Intel Core i9-12900H (7359 - 19648, n=28) | |
| Eurocom Nightsky ARX315 | |
| MSI GP66 Leopard 11UH-028 | |
| HP ZBook Fury 15 G8 | |
| MSI Alpha 15 B5EEK-008 | |
| MSI Delta 15 A5EFK | |
| Razer Blade 15 Advanced Model Early 2021 | |
| Cinebench R23 / Single Core | |
| Intel Core i9-12900K | |
| MSI Vector GP66 12UGS | |
| Media Intel Core i9-12900H (1634 - 1930, n=28) | |
| MSI MEG Z590 ACE | |
| HP ZBook Fury 15 G8 | |
| Eurocom Nightsky ARX315 | |
| MSI GP66 Leopard 11UH-028 | |
| MSI Delta 15 A5EFK | |
| MSI Alpha 15 B5EEK-008 | |
| Razer Blade 15 Advanced Model Early 2021 | |
| Cinebench R15 / CPU Multi 64Bit | |
| Intel Core i9-12900K | |
| Media Intel Core i9-12900H (1395 - 3077, n=28) | |
| MSI Vector GP66 12UGS | |
| MSI MEG Z590 ACE | |
| Eurocom Nightsky ARX315 | |
| MSI Delta 15 A5EFK | |
| MSI GP66 Leopard 11UH-028 | |
| MSI Alpha 15 B5EEK-008 | |
| HP ZBook Fury 15 G8 | |
| MSI GE65 Raider 9SF-049US | |
| Alienware m15 R4 | |
| Razer Blade 15 Advanced Model Early 2021 | |
| Cinebench R15 / CPU Single 64Bit | |
| Intel Core i9-12900K | |
| MSI Vector GP66 12UGS | |
| Media Intel Core i9-12900H (235 - 277, n=29) | |
| MSI MEG Z590 ACE | |
| Eurocom Nightsky ARX315 | |
| HP ZBook Fury 15 G8 | |
| MSI Delta 15 A5EFK | |
| MSI Alpha 15 B5EEK-008 | |
| MSI GP66 Leopard 11UH-028 | |
| Alienware m15 R4 | |
| Razer Blade 15 Advanced Model Early 2021 | |
| MSI GE65 Raider 9SF-049US | |
| Blender / v2.79 BMW27 CPU | |
| Razer Blade 15 Advanced Model Early 2021 | |
| Alienware m15 R4 | |
| HP ZBook Fury 15 G8 | |
| MSI Alpha 15 B5EEK-008 | |
| MSI GP66 Leopard 11UH-028 | |
| MSI Delta 15 A5EFK | |
| Media Intel Core i9-12900H (160 - 451, n=28) | |
| Eurocom Nightsky ARX315 | |
| MSI Vector GP66 12UGS | |
| MSI MEG Z590 ACE | |
| Intel Core i9-12900K | |
| 7-Zip 18.03 / 7z b 4 | |
| Intel Core i9-12900K | |
| Eurocom Nightsky ARX315 | |
| MSI Vector GP66 12UGS | |
| MSI MEG Z590 ACE | |
| Media Intel Core i9-12900H (34684 - 76677, n=28) | |
| MSI Delta 15 A5EFK | |
| MSI Alpha 15 B5EEK-008 | |
| MSI GP66 Leopard 11UH-028 | |
| HP ZBook Fury 15 G8 | |
| Alienware m15 R4 | |
| Razer Blade 15 Advanced Model Early 2021 | |
| 7-Zip 18.03 / 7z b 4 -mmt1 | |
| Intel Core i9-12900K | |
| Eurocom Nightsky ARX315 | |
| MSI MEG Z590 ACE | |
| MSI Vector GP66 12UGS | |
| Media Intel Core i9-12900H (5302 - 6289, n=28) | |
| HP ZBook Fury 15 G8 | |
| MSI Delta 15 A5EFK | |
| MSI GP66 Leopard 11UH-028 | |
| MSI Alpha 15 B5EEK-008 | |
| Alienware m15 R4 | |
| Razer Blade 15 Advanced Model Early 2021 | |
| Geekbench 5.5 / Multi-Core | |
| Intel Core i9-12900K | |
| MSI Vector GP66 12UGS | |
| Media Intel Core i9-12900H (8519 - 14376, n=31) | |
| MSI MEG Z590 ACE | |
| Eurocom Nightsky ARX315 | |
| MSI GP66 Leopard 11UH-028 | |
| MSI Delta 15 A5EFK | |
| MSI Alpha 15 B5EEK-008 | |
| Alienware m15 R4 | |
| Razer Blade 15 Advanced Model Early 2021 | |
| Geekbench 5.5 / Single-Core | |
| Intel Core i9-12900K | |
| MSI Vector GP66 12UGS | |
| Media Intel Core i9-12900H (1631 - 1897, n=31) | |
| MSI MEG Z590 ACE | |
| Eurocom Nightsky ARX315 | |
| MSI GP66 Leopard 11UH-028 | |
| MSI Delta 15 A5EFK | |
| MSI Alpha 15 B5EEK-008 | |
| Alienware m15 R4 | |
| Razer Blade 15 Advanced Model Early 2021 | |
| HWBOT x265 Benchmark v2.2 / 4k Preset | |
| Intel Core i9-12900K | |
| MSI Vector GP66 12UGS | |
| MSI MEG Z590 ACE | |
| Eurocom Nightsky ARX315 | |
| Media Intel Core i9-12900H (8.05 - 22.5, n=28) | |
| MSI Delta 15 A5EFK | |
| MSI GP66 Leopard 11UH-028 | |
| MSI Alpha 15 B5EEK-008 | |
| HP ZBook Fury 15 G8 | |
| Alienware m15 R4 | |
| Razer Blade 15 Advanced Model Early 2021 | |
| LibreOffice / 20 Documents To PDF | |
| MSI Alpha 15 B5EEK-008 | |
| Razer Blade 15 Advanced Model Early 2021 | |
| MSI Delta 15 A5EFK | |
| HP ZBook Fury 15 G8 | |
| Alienware m15 R4 | |
| MSI GP66 Leopard 11UH-028 | |
| Eurocom Nightsky ARX315 | |
| Media Intel Core i9-12900H (36.8 - 59.8, n=28) | |
| MSI MEG Z590 ACE | |
| Intel Core i9-12900K | |
| MSI Vector GP66 12UGS | |
| R Benchmark 2.5 / Overall mean | |
| Razer Blade 15 Advanced Model Early 2021 | |
| Alienware m15 R4 | |
| MSI GP66 Leopard 11UH-028 | |
| HP ZBook Fury 15 G8 | |
| MSI Alpha 15 B5EEK-008 | |
| MSI Delta 15 A5EFK | |
| Eurocom Nightsky ARX315 | |
| MSI MEG Z590 ACE | |
| Media Intel Core i9-12900H (0.4218 - 0.506, n=28) | |
| MSI Vector GP66 12UGS | |
| Intel Core i9-12900K | |
* ... Meglio usare valori piccoli
AIDA64: FP32 Ray-Trace | FPU Julia | CPU SHA3 | CPU Queen | FPU SinJulia | FPU Mandel | CPU AES | CPU ZLib | FP64 Ray-Trace | CPU PhotoWorxx
| Performance rating | |
| MSI GP66 Leopard 11UH-028 | |
| Alienware m15 R5 Ryzen Edition | |
| Media Intel Core i9-12900H | |
| MSI Vector GP66 12UGS | |
| MSI Katana GF66 11UG-220 -9! | |
| Asus TUF Gaming F15 FX506HM -9! | |
| AIDA64 / FP32 Ray-Trace | |
| MSI GP66 Leopard 11UH-028 | |
| Alienware m15 R5 Ryzen Edition | |
| Media Intel Core i9-12900H (4074 - 18289, n=29) | |
| MSI Vector GP66 12UGS | |
| AIDA64 / FPU Julia | |
| Alienware m15 R5 Ryzen Edition | |
| MSI GP66 Leopard 11UH-028 | |
| Media Intel Core i9-12900H (22307 - 93236, n=29) | |
| MSI Vector GP66 12UGS | |
| AIDA64 / CPU SHA3 | |
| MSI GP66 Leopard 11UH-028 | |
| Alienware m15 R5 Ryzen Edition | |
| Media Intel Core i9-12900H (1378 - 4215, n=29) | |
| MSI Vector GP66 12UGS | |
| AIDA64 / CPU Queen | |
| MSI Vector GP66 12UGS | |
| Media Intel Core i9-12900H (78172 - 111241, n=28) | |
| Alienware m15 R5 Ryzen Edition | |
| MSI GP66 Leopard 11UH-028 | |
| AIDA64 / FPU SinJulia | |
| Alienware m15 R5 Ryzen Edition | |
| MSI GP66 Leopard 11UH-028 | |
| MSI Vector GP66 12UGS | |
| Media Intel Core i9-12900H (5709 - 10410, n=29) | |
| AIDA64 / FPU Mandel | |
| Alienware m15 R5 Ryzen Edition | |
| MSI GP66 Leopard 11UH-028 | |
| Media Intel Core i9-12900H (11257 - 45581, n=29) | |
| MSI Vector GP66 12UGS | |
| AIDA64 / CPU AES | |
| MSI GP66 Leopard 11UH-028 | |
| Alienware m15 R5 Ryzen Edition | |
| MSI Vector GP66 12UGS | |
| Media Intel Core i9-12900H (31935 - 151546, n=29) | |
| AIDA64 / CPU ZLib | |
| MSI Vector GP66 12UGS | |
| Media Intel Core i9-12900H (449 - 1193, n=29) | |
| MSI GP66 Leopard 11UH-028 | |
| Alienware m15 R5 Ryzen Edition | |
| Asus TUF Gaming F15 FX506HM | |
| MSI Katana GF66 11UG-220 | |
| AIDA64 / FP64 Ray-Trace | |
| MSI GP66 Leopard 11UH-028 | |
| Alienware m15 R5 Ryzen Edition | |
| Media Intel Core i9-12900H (2235 - 10511, n=29) | |
| MSI Vector GP66 12UGS | |
| AIDA64 / CPU PhotoWorxx | |
| Media Intel Core i9-12900H (20960 - 48269, n=30) | |
| MSI Vector GP66 12UGS | |
| MSI GP66 Leopard 11UH-028 | |
| Alienware m15 R5 Ryzen Edition | |
Prestazioni del sistema
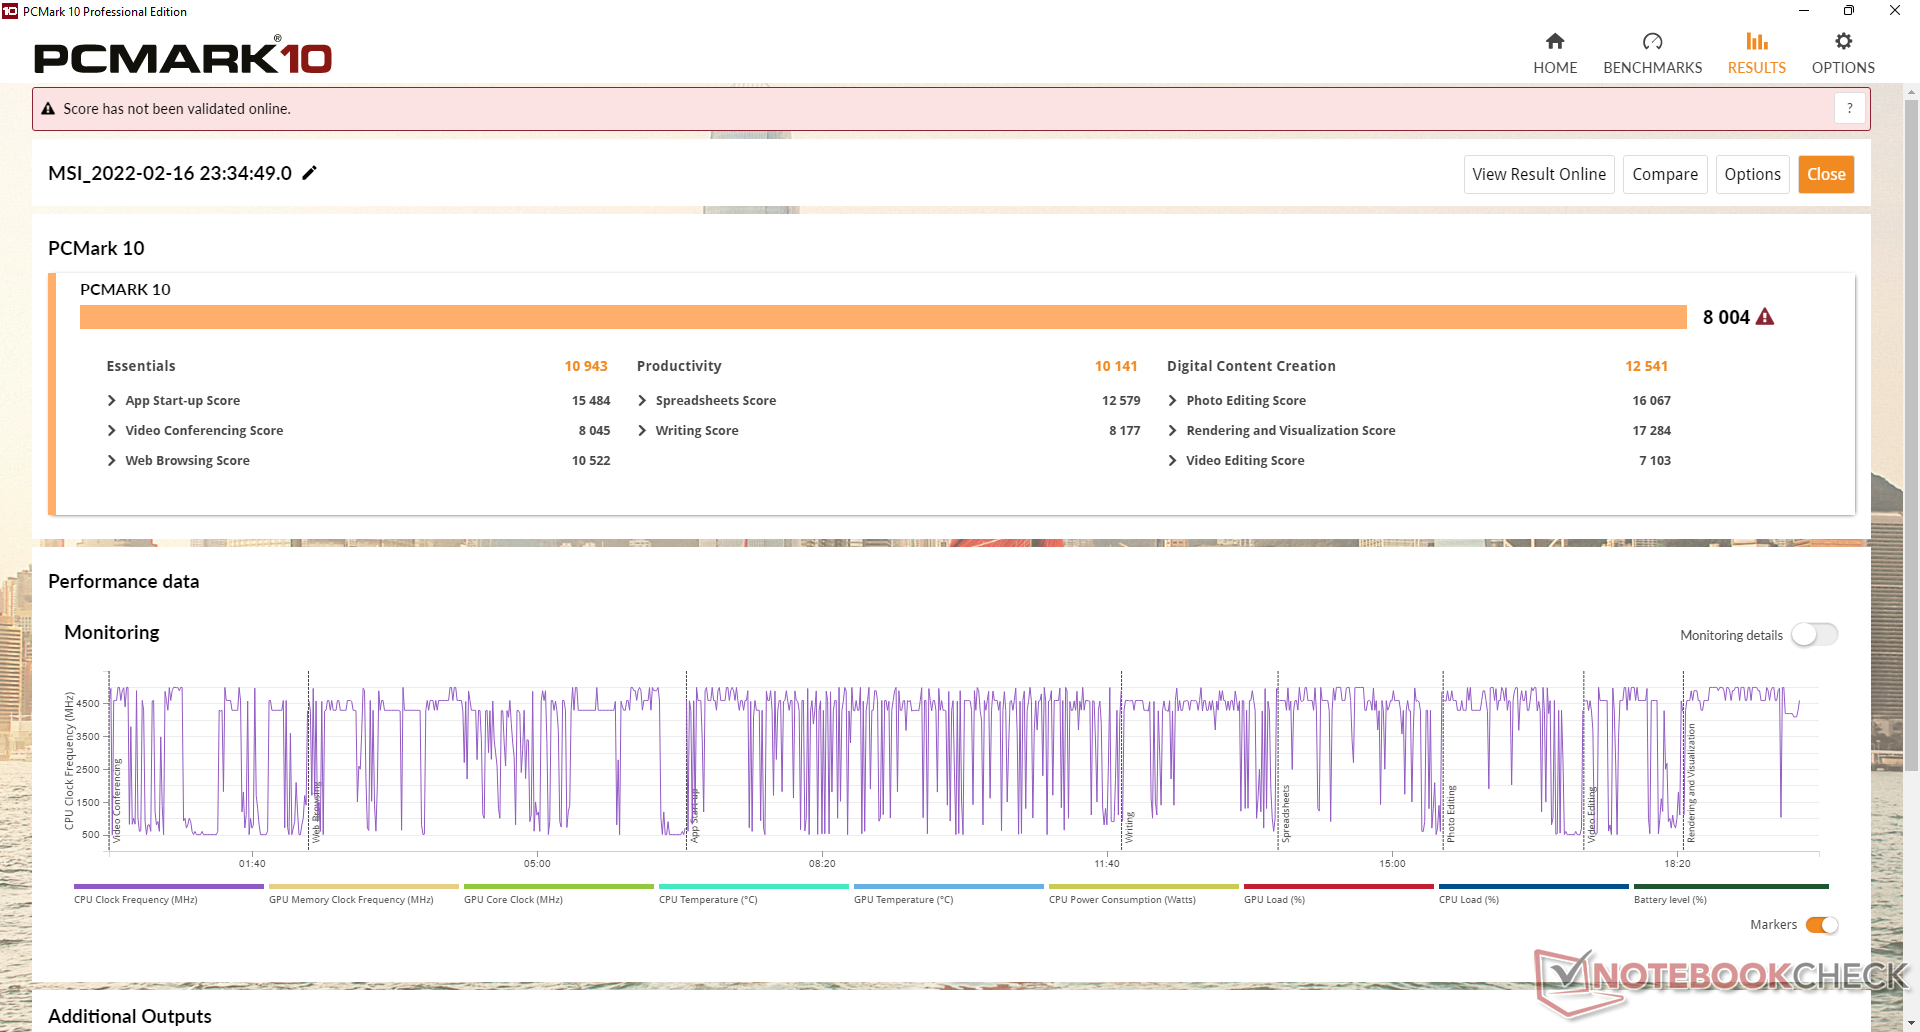
I risultati di PCMark sono tra i più alti del nostro database con poco più di 8000 punti. IlMSI Raider GE76 equipaggiato con il Core i9-12900HK sbloccato e la più veloce GeForce RTX 3080 Ti restituisce punteggi essenzialmente identici al nostro GP66
Vale la pena notare che abbiamo sperimentato problemi di risveglio e di sonno con la nostra unità di test dove lo schermo a volte rimaneva nero quando si passava da una modalità GPU all'altra o quando si entrava in modalità sleep. Un riavvio duro sarebbe quindi necessario.
| PCMark 10 / Score | |
| MSI Vector GP66 12UGS | |
| Media Intel Core i9-12900H, NVIDIA GeForce RTX 3070 Ti Laptop GPU (7087 - 8072, n=6) | |
| MSI GP66 Leopard 11UH-028 | |
| Asus TUF Gaming F15 FX506HM | |
| MSI Katana GF66 11UG-220 | |
| Alienware m15 R5 Ryzen Edition | |
| Razer Blade 15 Base Edition 2021, i7-10750H RTX 3060 | |
| PCMark 10 / Essentials | |
| MSI Vector GP66 12UGS | |
| Media Intel Core i9-12900H, NVIDIA GeForce RTX 3070 Ti Laptop GPU (10266 - 11663, n=6) | |
| Asus TUF Gaming F15 FX506HM | |
| MSI GP66 Leopard 11UH-028 | |
| Razer Blade 15 Base Edition 2021, i7-10750H RTX 3060 | |
| Alienware m15 R5 Ryzen Edition | |
| MSI Katana GF66 11UG-220 | |
| PCMark 10 / Productivity | |
| Media Intel Core i9-12900H, NVIDIA GeForce RTX 3070 Ti Laptop GPU (9402 - 10742, n=6) | |
| MSI Vector GP66 12UGS | |
| MSI Katana GF66 11UG-220 | |
| Alienware m15 R5 Ryzen Edition | |
| Asus TUF Gaming F15 FX506HM | |
| MSI GP66 Leopard 11UH-028 | |
| Razer Blade 15 Base Edition 2021, i7-10750H RTX 3060 | |
| PCMark 10 / Digital Content Creation | |
| MSI Vector GP66 12UGS | |
| Media Intel Core i9-12900H, NVIDIA GeForce RTX 3070 Ti Laptop GPU (10009 - 12541, n=6) | |
| MSI GP66 Leopard 11UH-028 | |
| MSI Katana GF66 11UG-220 | |
| Asus TUF Gaming F15 FX506HM | |
| Alienware m15 R5 Ryzen Edition | |
| Razer Blade 15 Base Edition 2021, i7-10750H RTX 3060 | |
| PCMark 10 Score | 8004 punti | |
Aiuto | ||
| AIDA64 / Memory Copy | |
| Media Intel Core i9-12900H (34438 - 74264, n=29) | |
| MSI Vector GP66 12UGS | |
| MSI GP66 Leopard 11UH-028 | |
| Alienware m15 R5 Ryzen Edition | |
| AIDA64 / Memory Read | |
| Media Intel Core i9-12900H (36365 - 74642, n=29) | |
| MSI GP66 Leopard 11UH-028 | |
| MSI Vector GP66 12UGS | |
| Alienware m15 R5 Ryzen Edition | |
| AIDA64 / Memory Write | |
| Media Intel Core i9-12900H (32276 - 67858, n=29) | |
| MSI Vector GP66 12UGS | |
| MSI GP66 Leopard 11UH-028 | |
| Alienware m15 R5 Ryzen Edition | |
| AIDA64 / Memory Latency | |
| MSI GP66 Leopard 11UH-028 | |
| MSI Vector GP66 12UGS | |
| Media Intel Core i9-12900H (74.7 - 118.1, n=28) | |
| Alienware m15 R5 Ryzen Edition | |
| Asus TUF Gaming F15 FX506HM | |
| MSI Katana GF66 11UG-220 | |
| MSI Katana GF66 11UG-220 | |
* ... Meglio usare valori piccoli
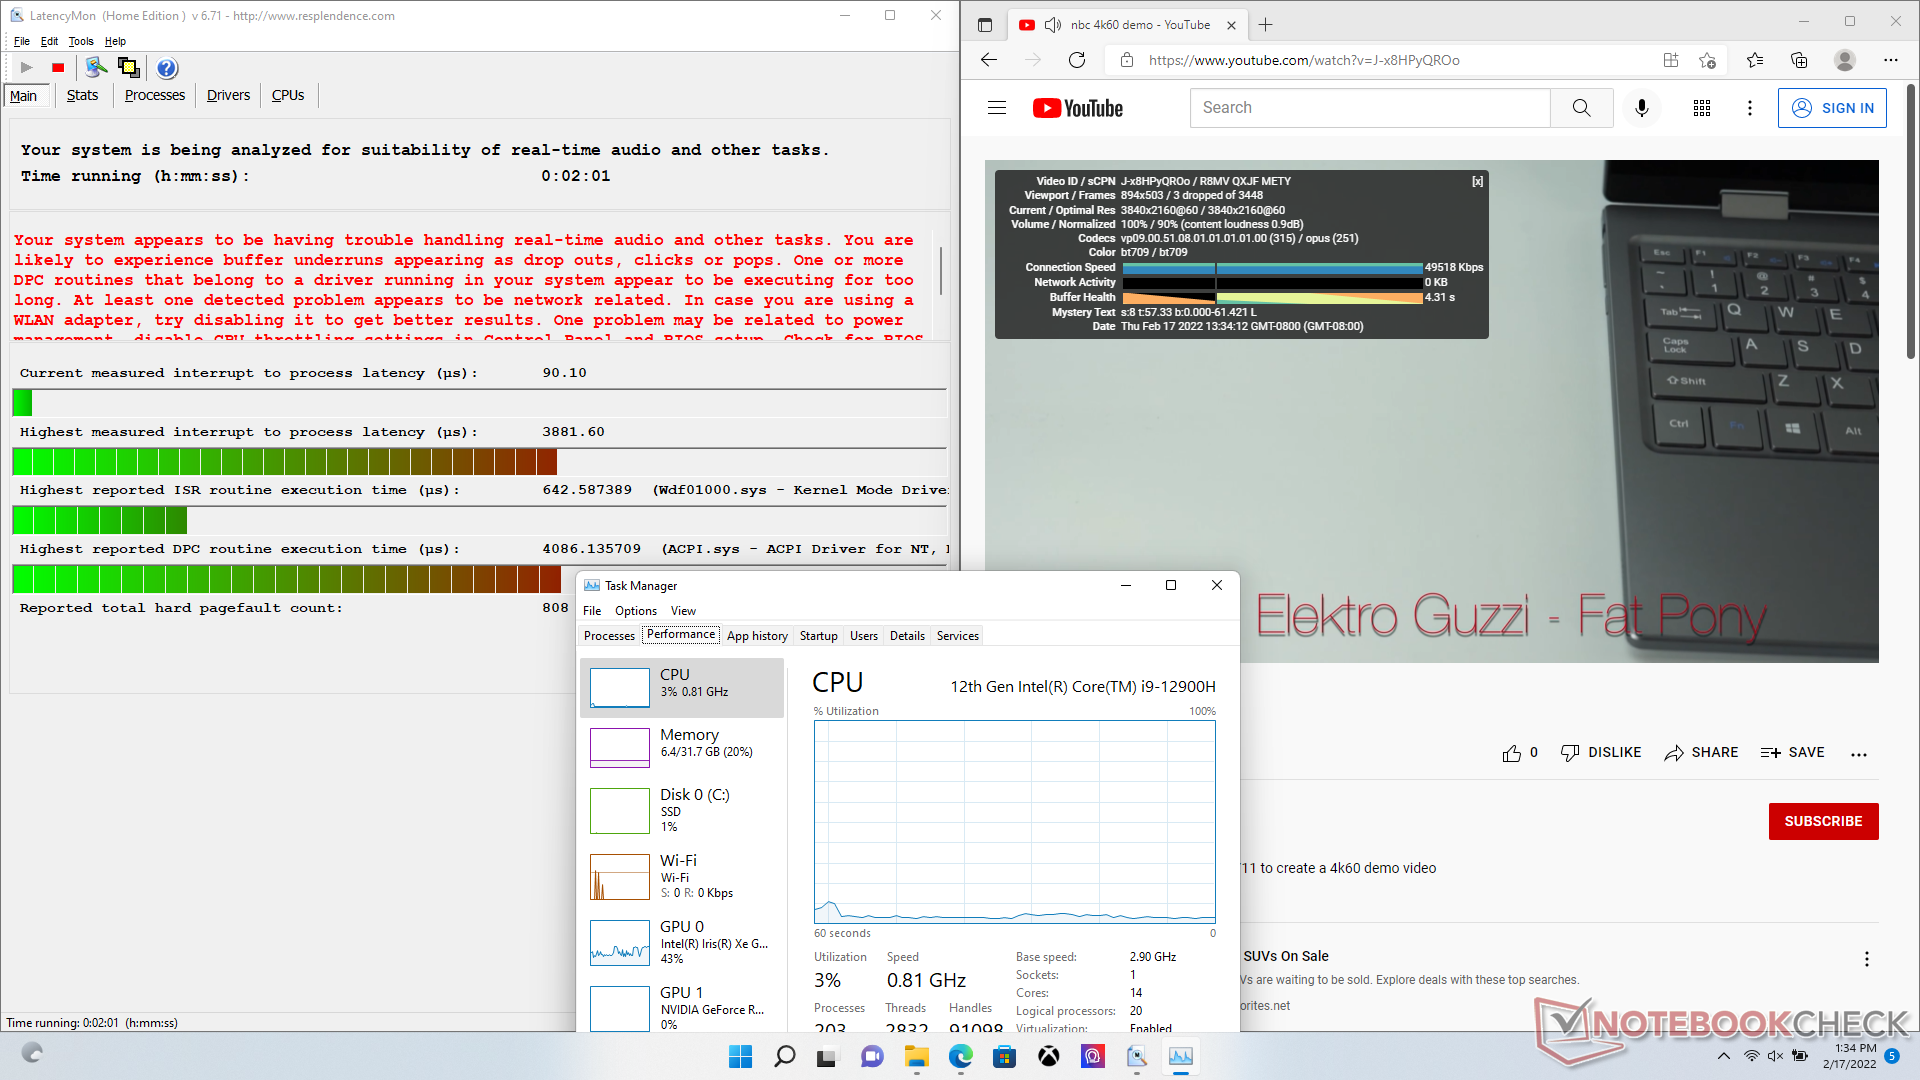
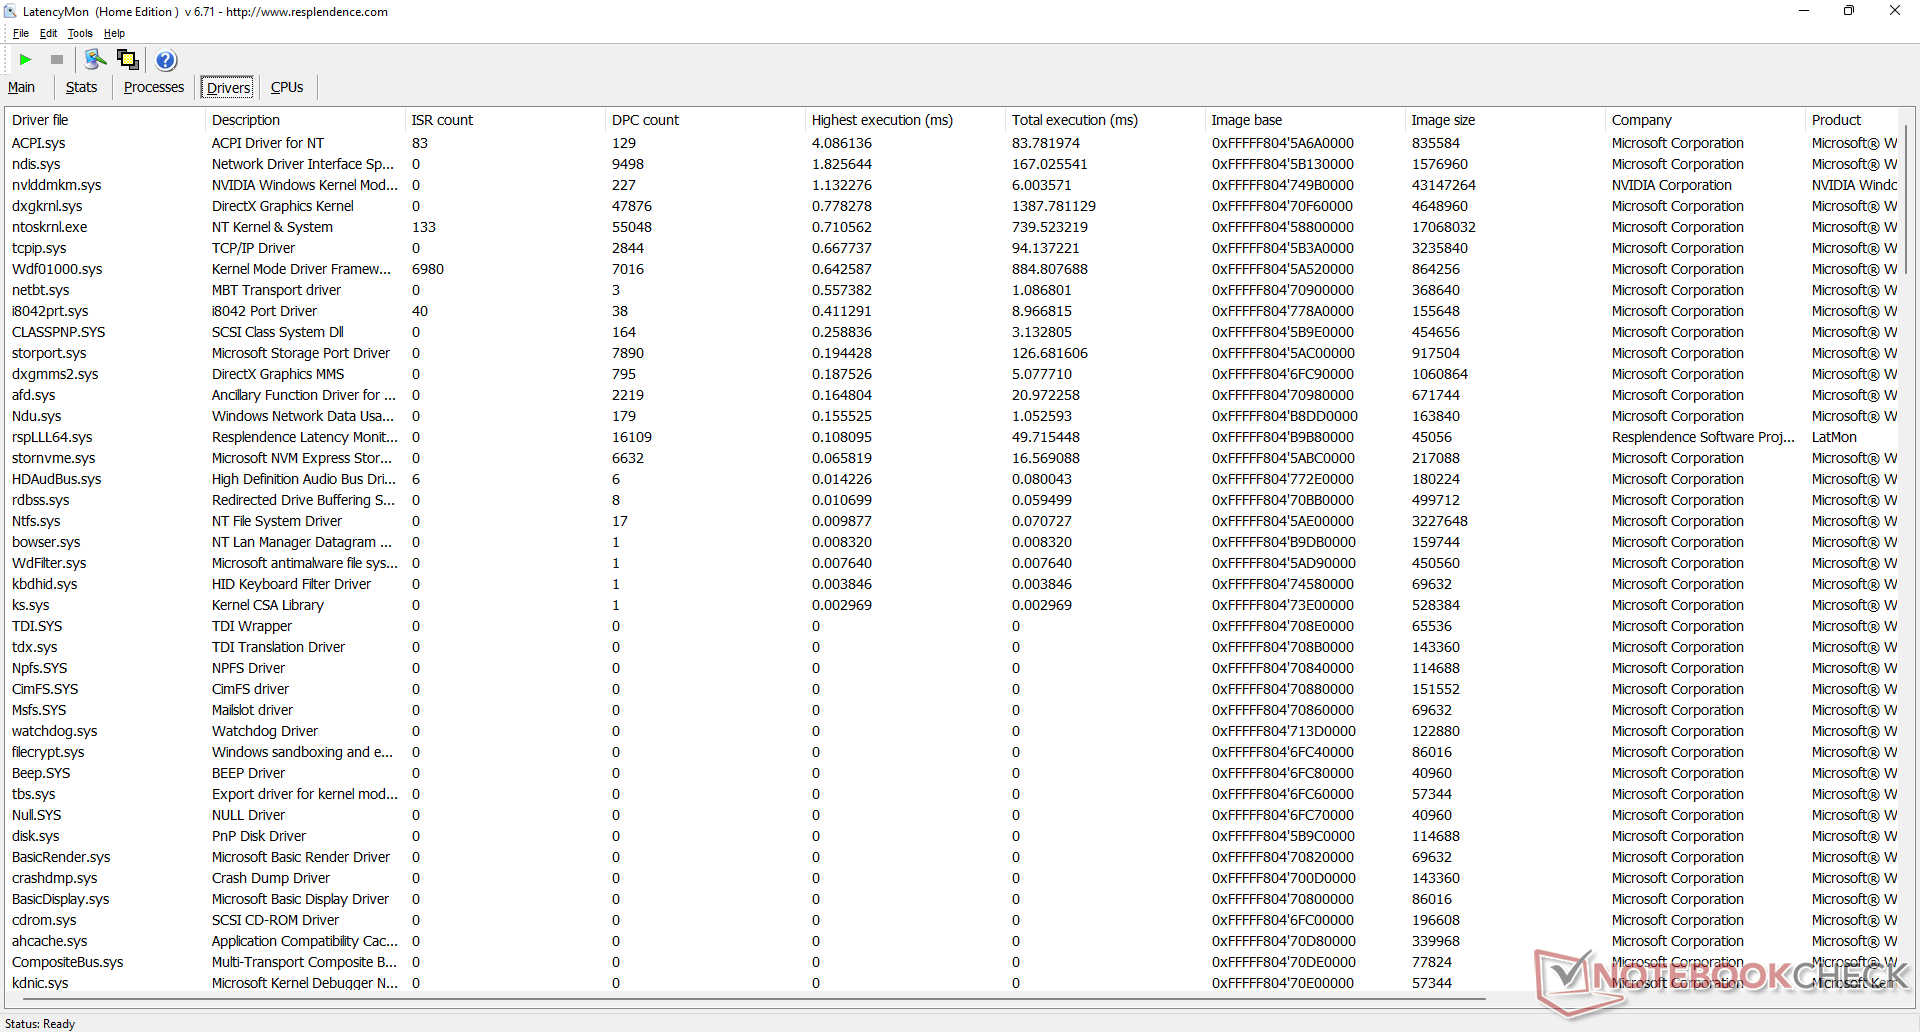
Latenza DPC
LatencyMon rivela problemi di DPC quando si aprono più schede del browser sulla nostra homepage. la riproduzione di video 4K a 60 FPS è altrimenti liscia con solo 3 fotogrammi caduti durante il nostro test video di un minuto.
| DPC Latencies / LatencyMon - interrupt to process latency (max), Web, Youtube, Prime95 | |
| MSI Vector GP66 12UGS | |
| Asus TUF Gaming F15 FX506HM | |
| MSI Katana GF66 11UG-220 | |
| MSI GP66 Leopard 11UH-028 | |
| Razer Blade 15 Base Edition 2021, i7-10750H RTX 3060 | |
| Alienware m15 R5 Ryzen Edition | |
* ... Meglio usare valori piccoli
Dispositivi di archiviazione
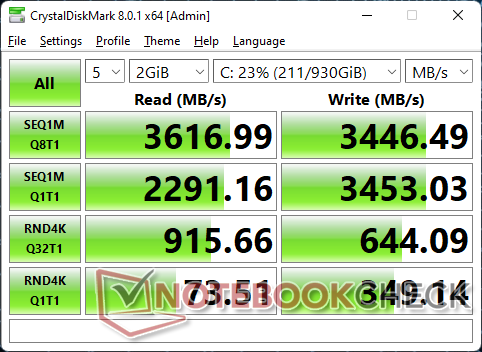
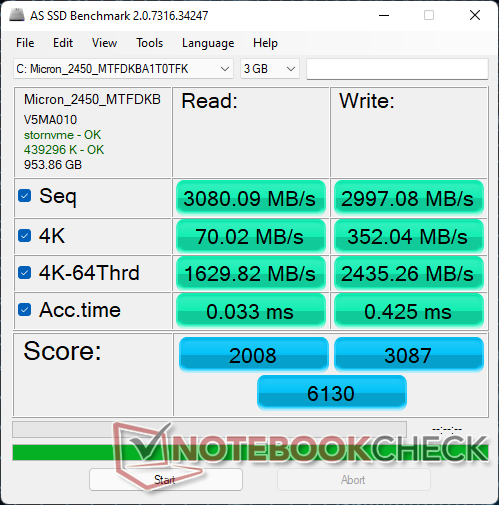
La nostra unità di prova è equipaggiata con il budget 1 TB Micron 2450 MTFDKBA1T0TFK SSD PCIe4 x4 NVMe. A differenza di molti altri SSD PCIe4 x4 che possono raggiungere velocità di trasferimento a nord di 7000 MB/s, il Micron 2450 da 1 TB promette solo fino a 3500 MB/s in lettura e 3000 MB/s in scrittura per essere paragonabile alla maggior parte degli SSD PCIe3 x4. Naturalmente, gli utenti possono ancora scambiare o installare un disco PCIe4 x4 più veloce se lo desiderano, proprio come quello che era incluso nel nostro GP66 Leopard. I modelli MSI di fascia alta come la serie GT o GS hanno maggiori probabilità di venire con unità PCIe4 più veloci di Samsung
L'unità nel nostro campione non avrebbe mostrato problemi nel mantenere la sua massima velocità di lettura di 3500 MB/s per periodi prolungati.

* ... Meglio usare valori piccoli
Disk Throttling: DiskSpd Read Loop, Queue Depth 8
Prestazioni della GPU
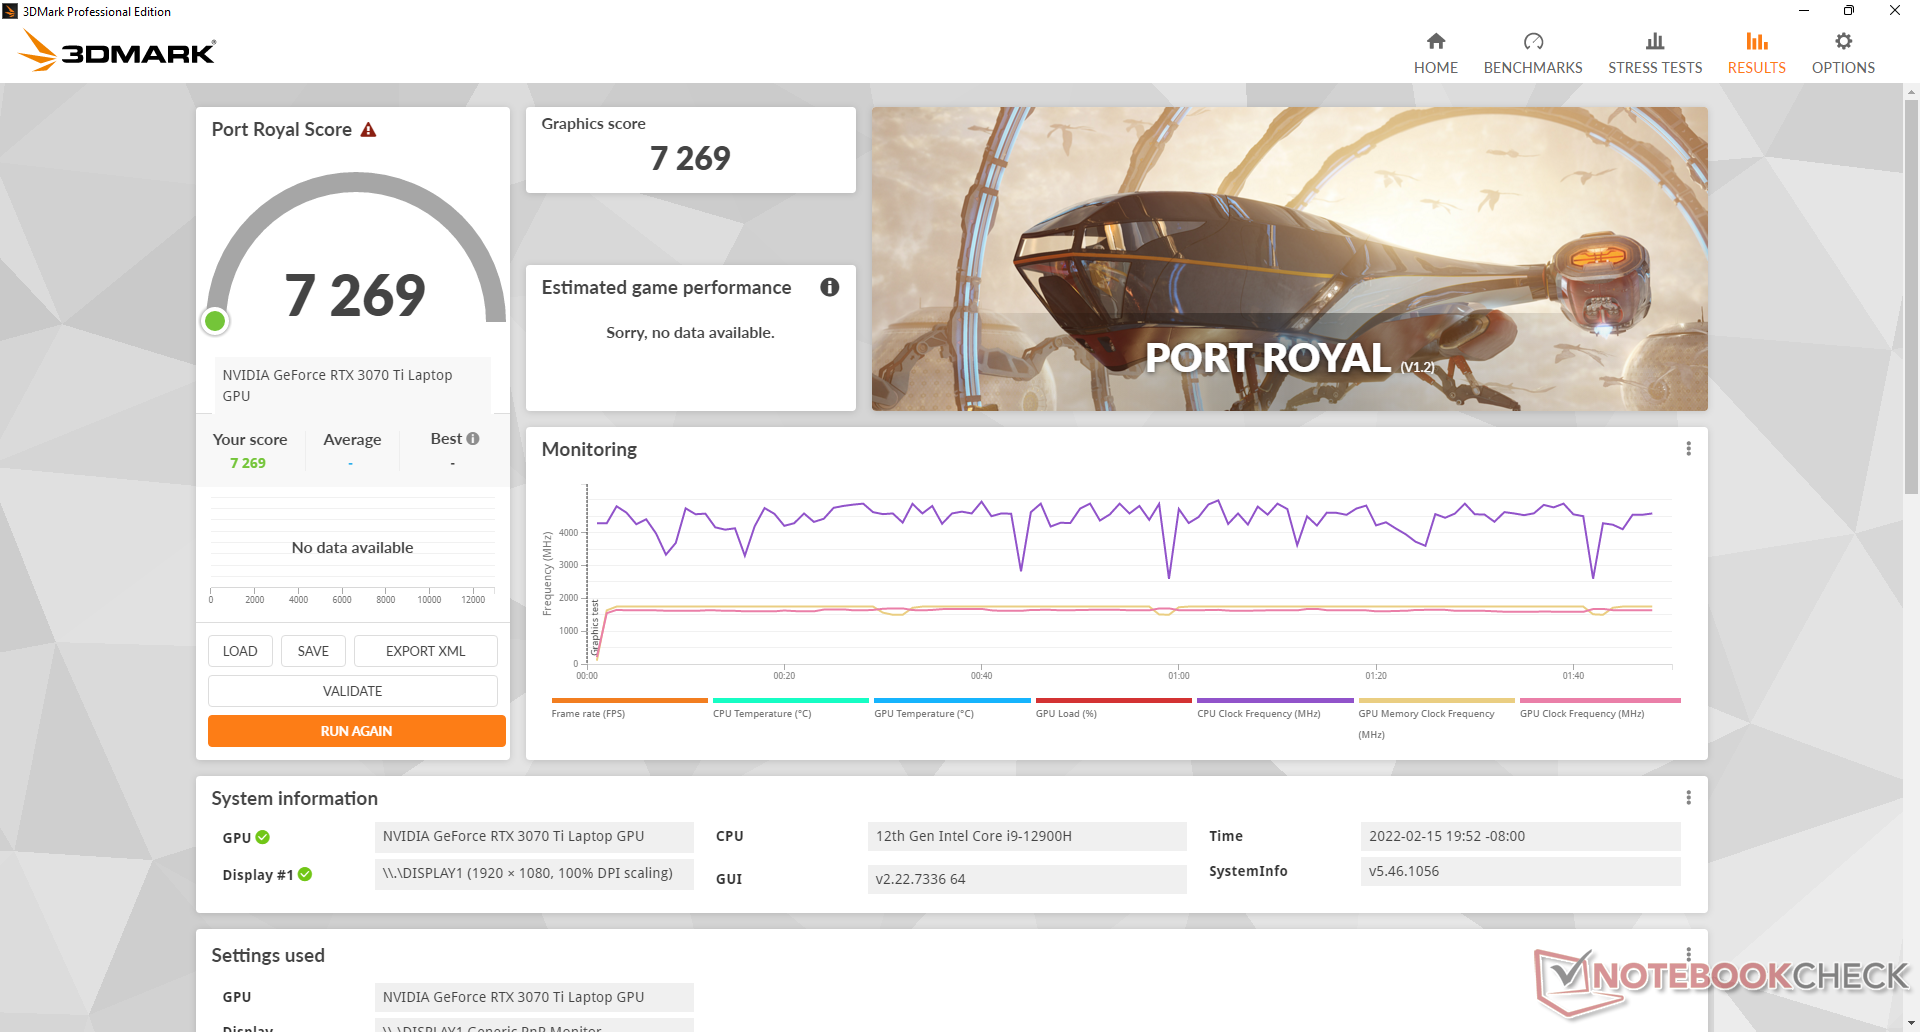
Le prestazioni grafiche sono solo circa il 5-10 per cento più lente del mobile GeForce RTX 3080 Ti o circa il 15-20 per cento più veloce della mobile GeForce RTX 3070 come si trova sul modello ADATA XPG Xenia 15. Questi risultati mettono il nostro GeForce RTX 3070 Ti mobile entro il 5-15 per cento del desktop GeForce RTX 3070.
L'esecuzione in modalità MSHybrid invece della modalità dGPU non comporta un deficit di prestazioni. Il punteggio Time Spy Graphics in modalità MSHybrid è essenzialmente lo stesso del punteggio in modalità dGPU (11880 punti contro 11739 punti).
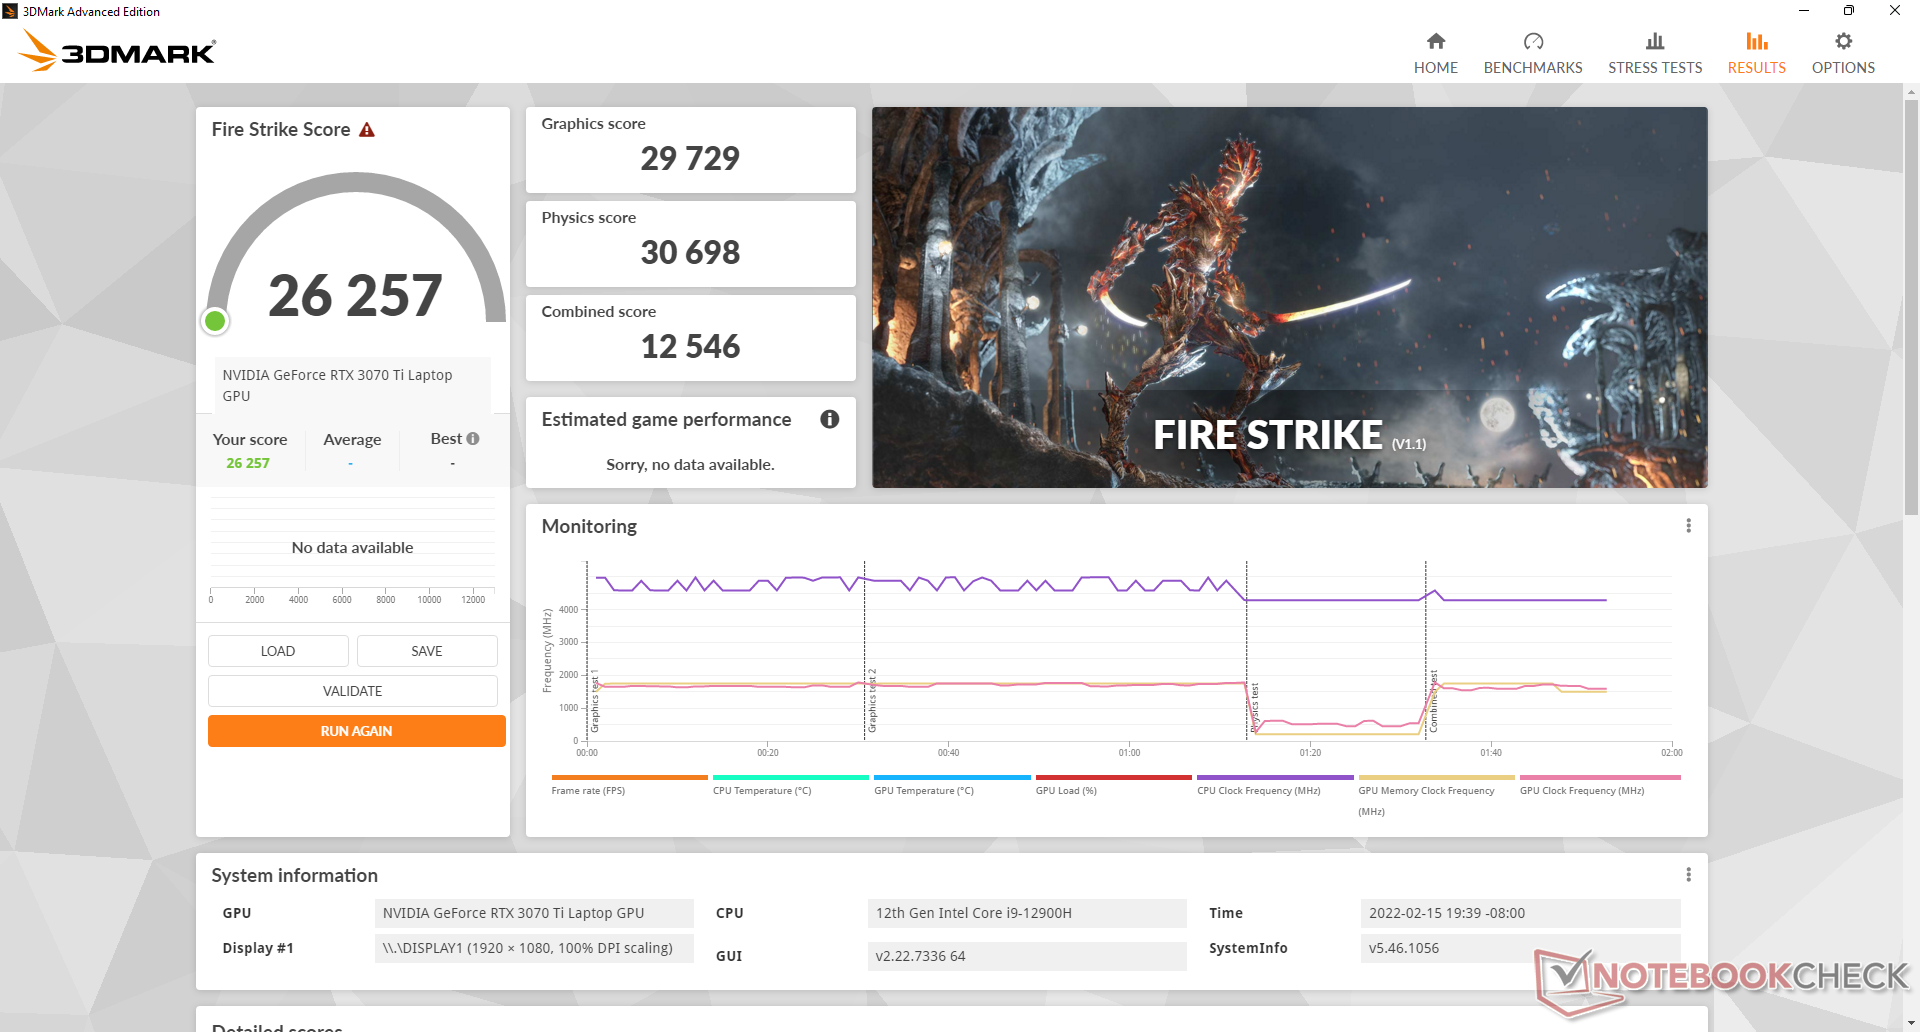
Le prestazioni grafiche in modalità bilanciata sono ridotte solo dal 4 al 5 per cento, con il compromesso di un rumore della ventola molto più silenzioso e di processori e superfici più caldi. Il nostro punteggio Fire Strike Graphics scende a 28508 punti da 29729 punti quando si usa la modalità Balanced.
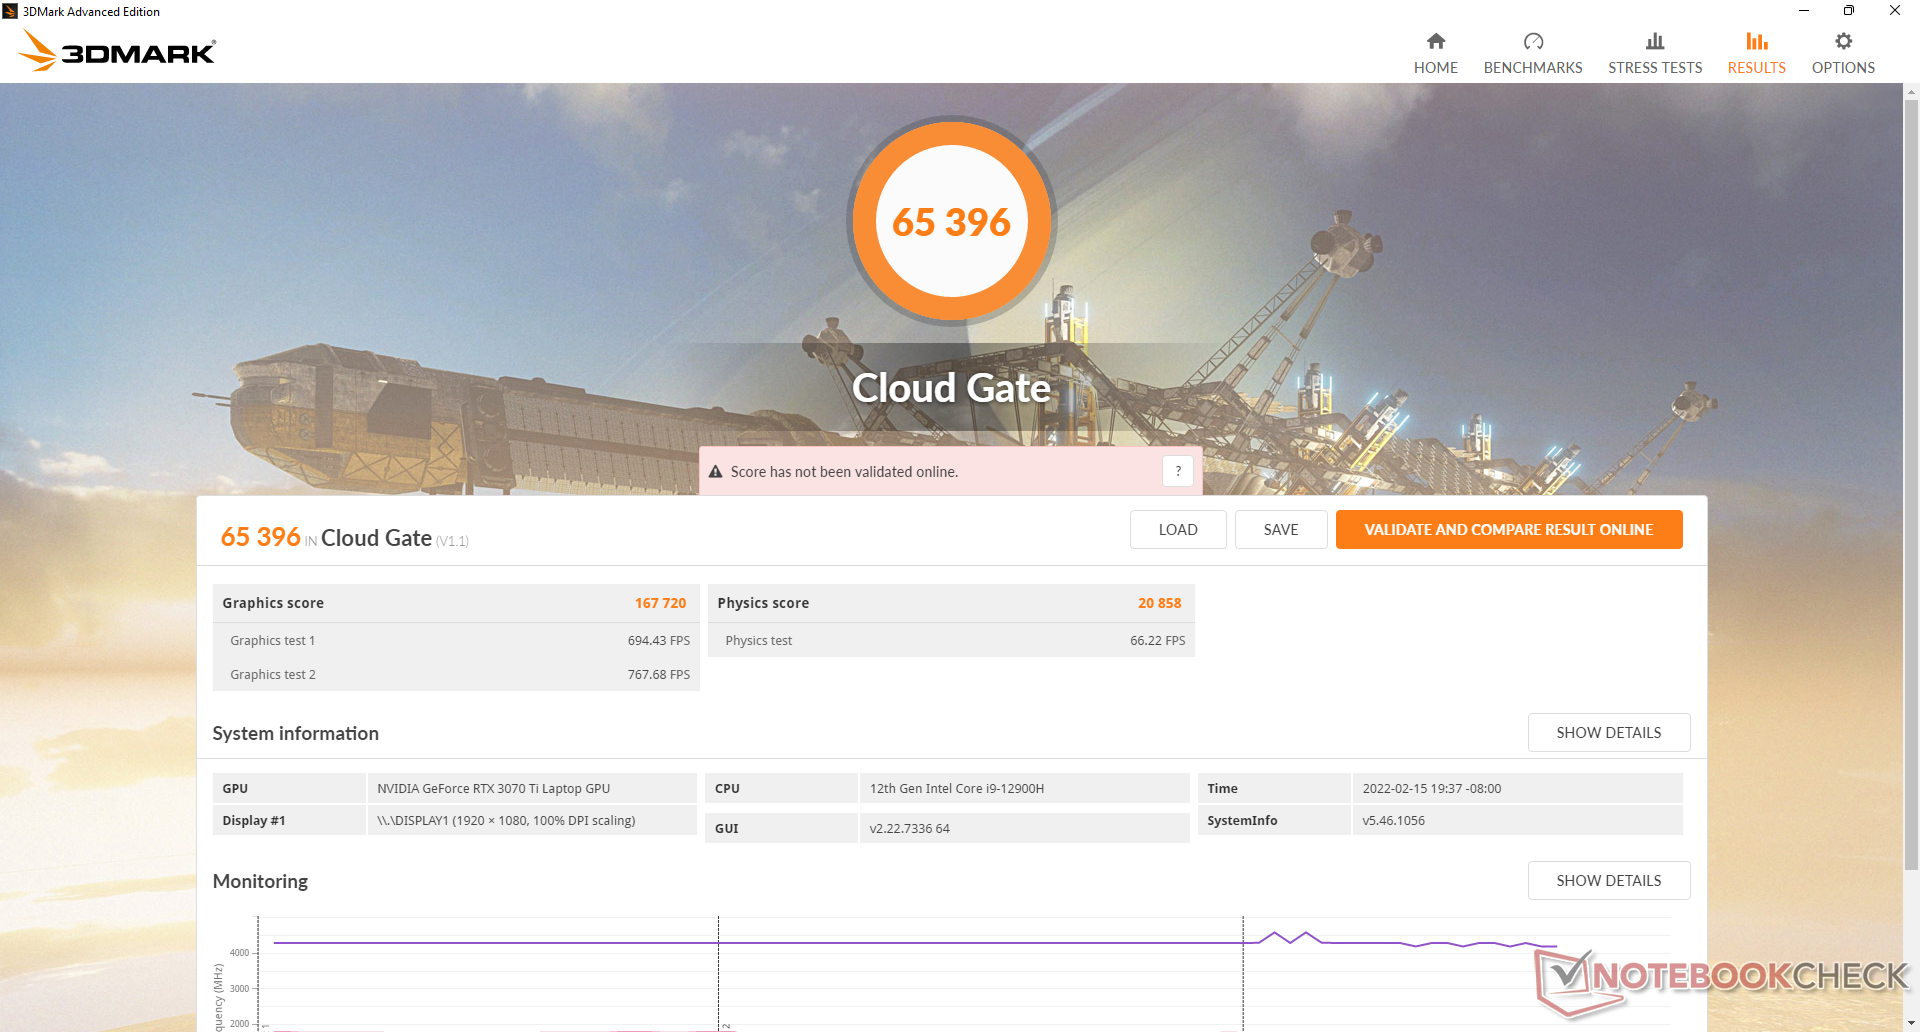
Si noti che i punteggi di 3DMark sono fino al 20 per cento più veloci rispetto alla MSI GS66 equipaggiata con la stessa GeForce RTX 3070 Ti a causa del più alto obiettivo TGP del nostro GP66 (150 W contro 105 W).
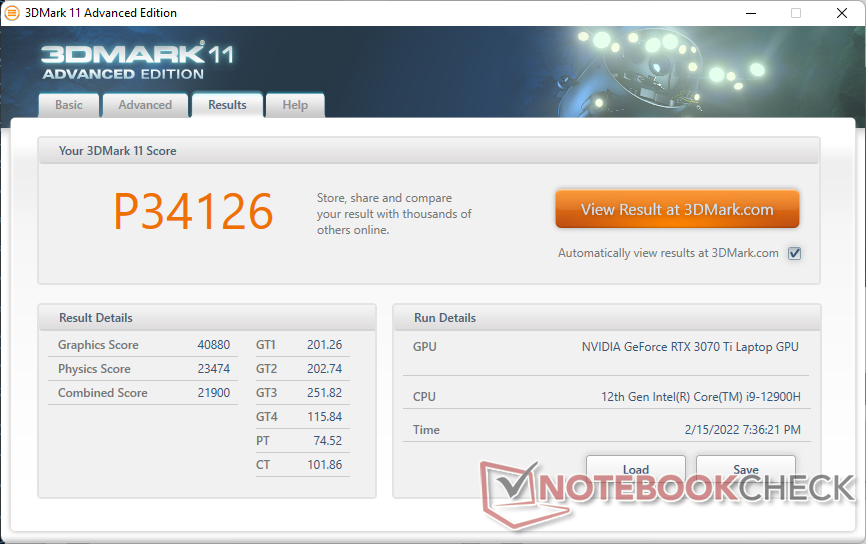
| 3DMark 11 Performance | 34126 punti | |
| 3DMark Cloud Gate Standard Score | 65396 punti | |
| 3DMark Fire Strike Score | 26257 punti | |
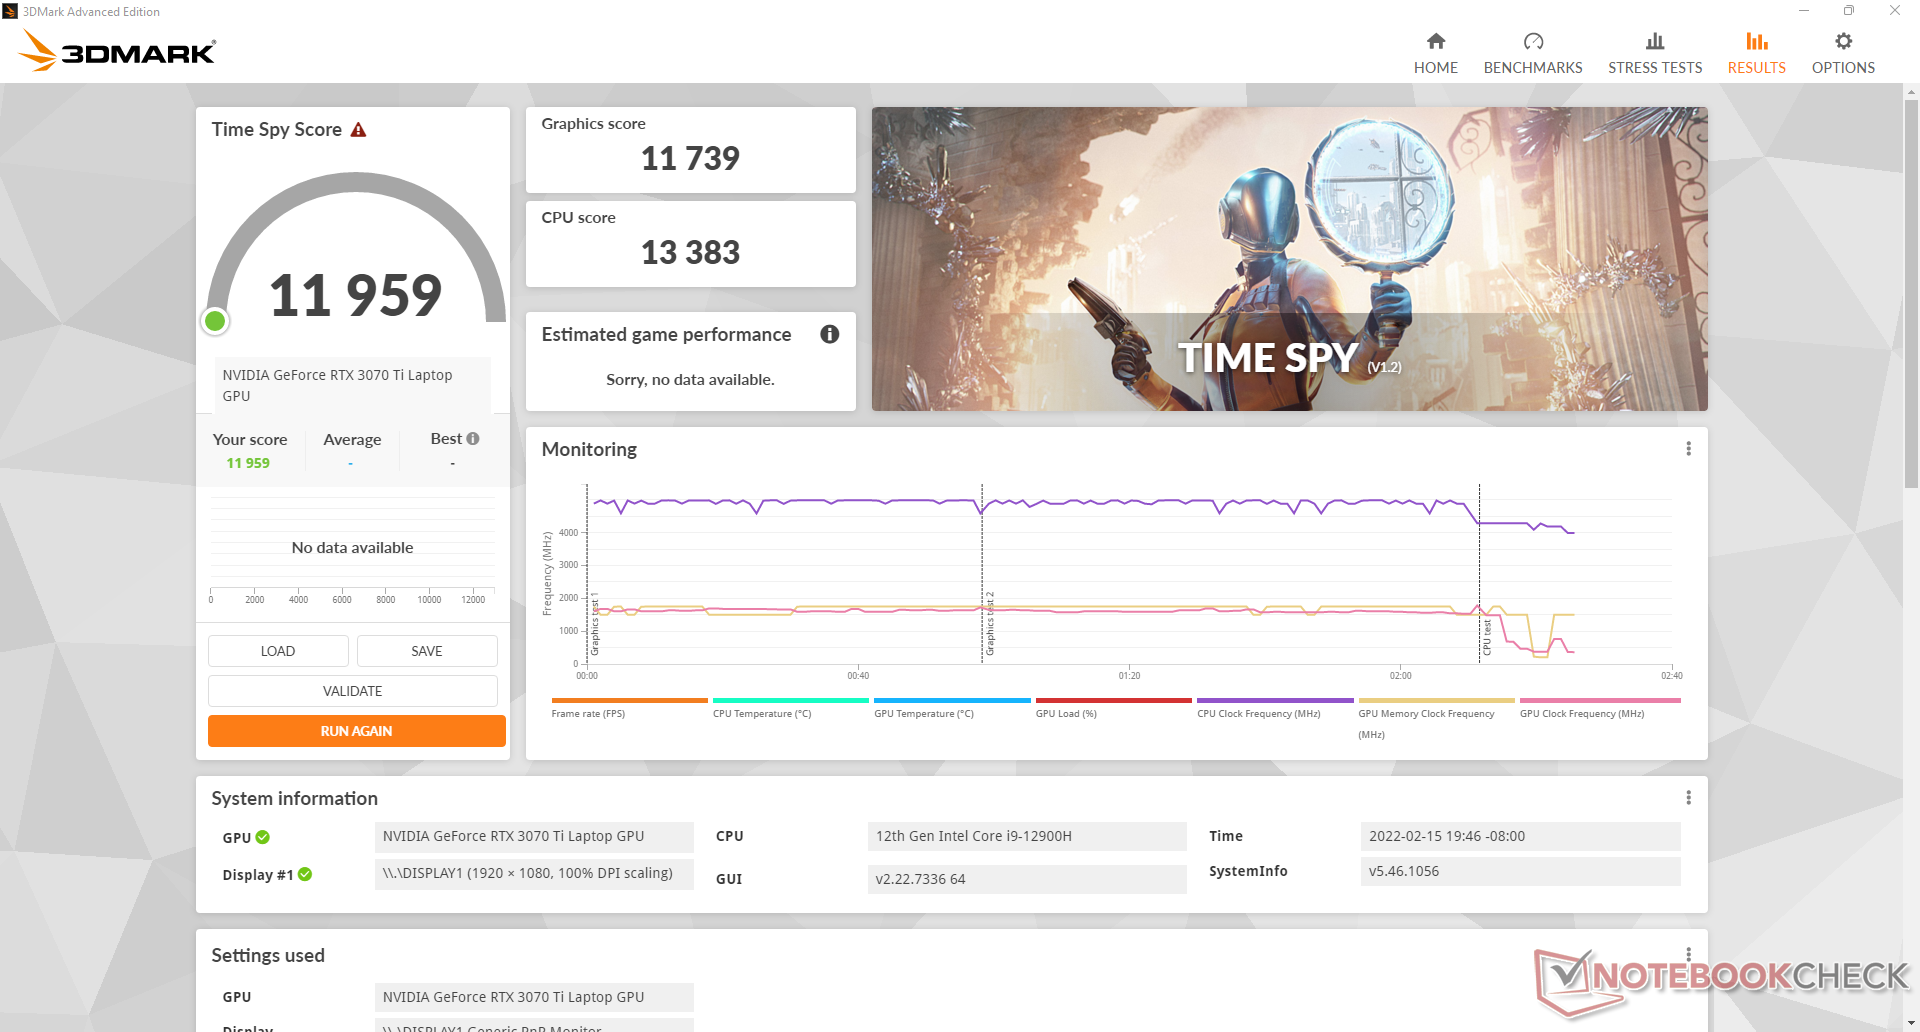
| 3DMark Time Spy Score | 11959 punti | |
Aiuto | ||
Witcher 3 FPS Chart
| basso | medio | alto | ultra | |
|---|---|---|---|---|
| GTA V (2015) | 185 | 184 | 179 | 123 |
| The Witcher 3 (2015) | 492.3 | 360 | 223.9 | 114.6 |
| Dota 2 Reborn (2015) | 185 | 169 | 164 | 155 |
| Final Fantasy XV Benchmark (2018) | 207 | 152 | 115 | |
| X-Plane 11.11 (2018) | 161 | 143 | 112 | |
| Far Cry 5 (2018) | 180 | 152 | 145 | 136 |
| Strange Brigade (2018) | 471 | 298 | 244 | 213 |
Emissioni
Rumore di sistema
Il rumore della ventola dipende fortemente dai quattro profili di alimentazione MSI Center: Super Battery, Silent, Balanced e Extreme Performance. Ci sarà sempre un po' di rumore della ventola a circa 26,8 dB(A) contro uno sfondo silenzioso di 24,7 dB(A) anche quando è impostato sulla modalità Silent, ma questo livello è abbastanza basso da essere difficile da notare durante l'uso quotidiano. Raccomandiamo questa modalità se si tratta semplicemente di navigazione web o streaming video, poiché le ventole pulsano molto meno frequentemente rispetto alle altre due modalità più veloci
Il gioco in modalità Balanced comporterebbe un rumore della ventola di poco meno di 40 dB(A) rispetto a 58 dB(A) se in modalità Extreme Performance. Le prestazioni della GPU saranno un po' più lente in modalità Balanced, ma il risparmio di rumore è significativo. La gamma superiore a 50 dB(A) è generalmente più rumorosa della maggior parte degli altri portatili da gioco che abbiamo testato.
Rumorosità
| Idle |
| 23.4 / 23.4 / 27.4 dB(A) |
| Sotto carico |
| 36 / 58 dB(A) |
 | ||
30 dB silenzioso 40 dB(A) udibile 50 dB(A) rumoroso |
||
min: | ||
| MSI Vector GP66 12UGS GeForce RTX 3070 Ti Laptop GPU, i9-12900H | MSI GP66 Leopard 11UH-028 GeForce RTX 3080 Laptop GPU, i7-11800H, Samsung PM9A1 MZVL21T0HCLR | MSI Katana GF66 11UG-220 GeForce RTX 3070 Laptop GPU, i7-11800H, Kingston OM8PDP3512B-AI1 | Asus TUF Gaming F15 FX506HM GeForce RTX 3060 Laptop GPU, i7-11800H, SK Hynix HFM001TD3JX013N | Razer Blade 15 Base Edition 2021, i7-10750H RTX 3060 GeForce RTX 3060 Laptop GPU, i7-10750H, Samsung SSD PM981a MZVLB512HBJQ | Alienware m15 R5 Ryzen Edition GeForce RTX 3060 Laptop GPU, R7 5800H, Toshiba KBG40ZNS512G NVMe | |
|---|---|---|---|---|---|---|
| Noise | 1% | -19% | 7% | -0% | -5% | |
| off /ambiente * (dB) | 22.9 | 23 -0% | 25 -9% | 24.8 -8% | 25.3 -10% | 24 -5% |
| Idle Minimum * (dB) | 23.4 | 23 2% | 34 -45% | 24.6 -5% | 25.4 -9% | 24 -3% |
| Idle Average * (dB) | 23.4 | 23 2% | 35 -50% | 24.9 -6% | 25.4 -9% | 25 -7% |
| Idle Maximum * (dB) | 27.4 | 30.11 -10% | 36 -31% | 24.9 9% | 25.4 7% | 35 -28% |
| Load Average * (dB) | 36 | 41.86 -16% | 48 -33% | 27.1 25% | 42.5 -18% | 44 -22% |
| Witcher 3 ultra * (dB) | 58.2 | 47.79 18% | 46 21% | 46.4 20% | 42 28% | 48 18% |
| Load Maximum * (dB) | 58 | 53 9% | 49 16% | 49 16% | 52.2 10% | 50 14% |
* ... Meglio usare valori piccoli
Temperatura
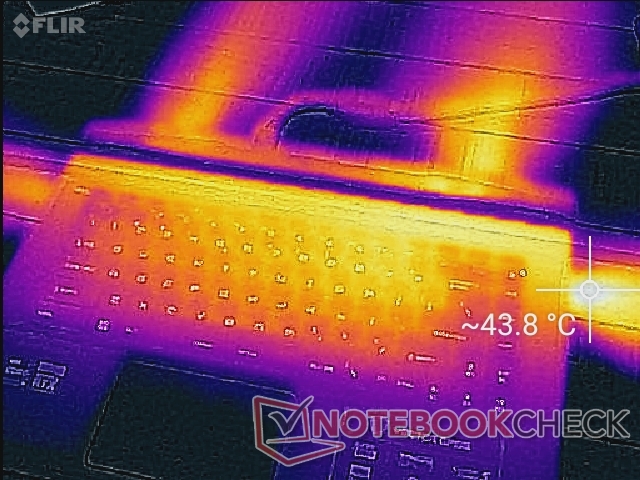
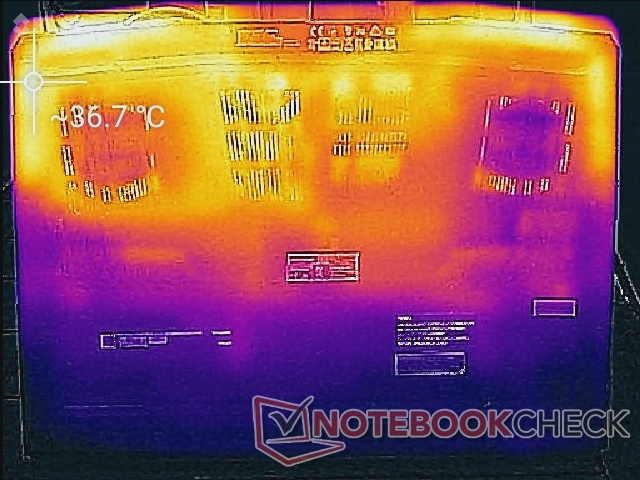
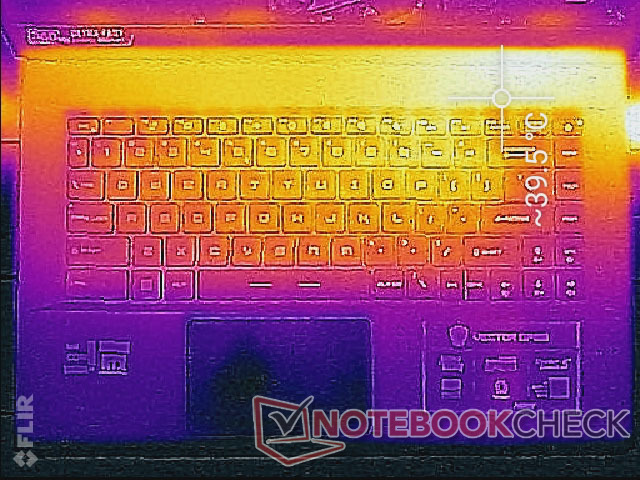
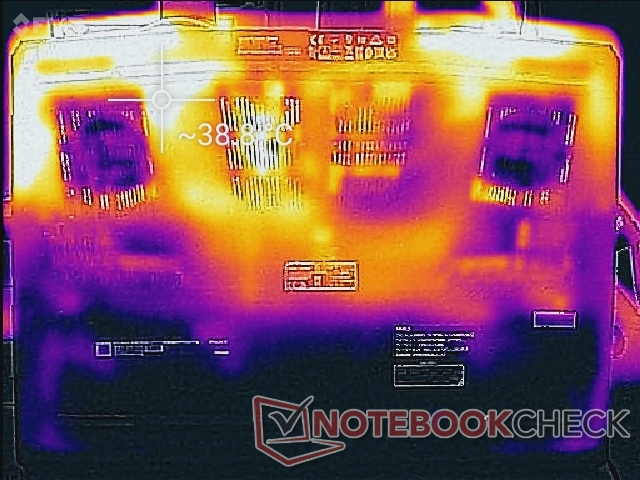
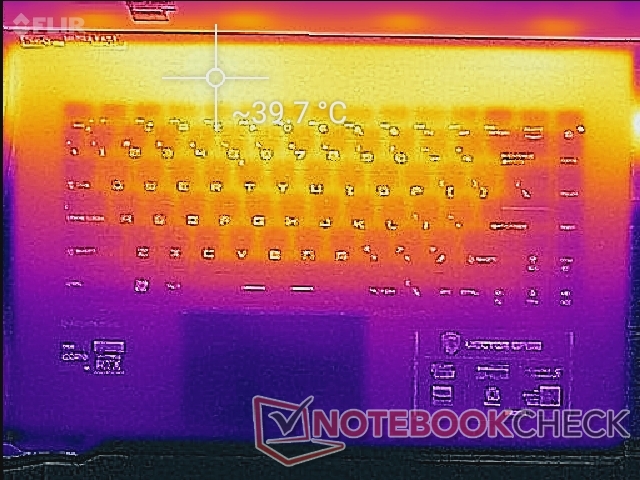
Le temperature di superficie sono altamente dipendenti dall'impostazione del profilo di potenza MSI Center. Quando è in modalità bilanciata, i punti caldi possono essere caldi fino a 49 C rispetto ai soli 42 C dell'impostazione Extreme Performance poiché un tetto di RPM della ventola più alto è legato alla modalità Extreme Performance
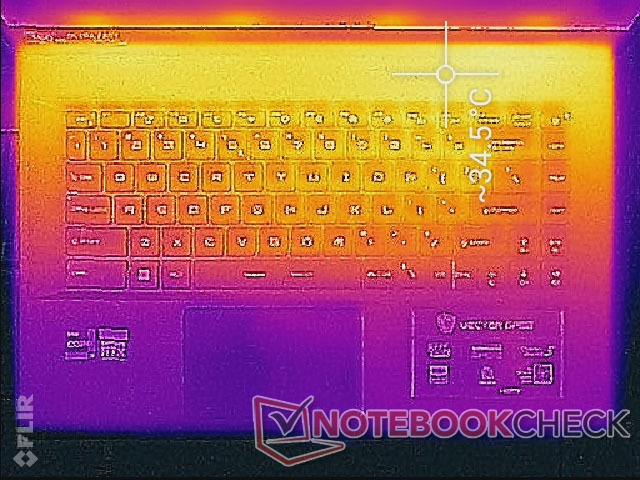
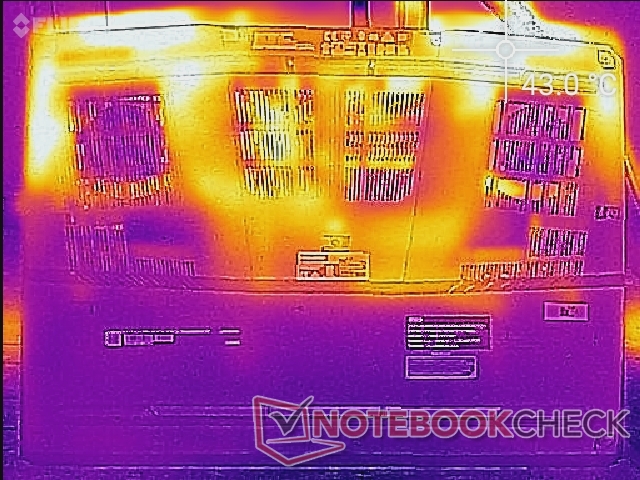
I punti caldi sono concentrati lungo i quadranti posteriori dello chassis come mostrato dalle nostre mappe di temperatura qui sotto. I tasti della tastiera e i poggiapolsi possono essere caldi ma mai fastidiosi o scomodi. Il più sottile GS66 o Razer Blade 15 hanno poggiapolsi e tastiere più caldi in confronto di più di qualche grado ciascuno in media.
(±) La temperatura massima sul lato superiore è di 40.2 °C / 104 F, rispetto alla media di 40.4 °C / 105 F, che varia da 21.2 a 68.8 °C per questa classe Gaming.
(±) Il lato inferiore si riscalda fino ad un massimo di 43.8 °C / 111 F, rispetto alla media di 43.2 °C / 110 F
(+) In idle, la temperatura media del lato superiore è di 29.6 °C / 85 F, rispetto alla media deld ispositivo di 33.9 °C / 93 F.
(+) Riproducendo The Witcher 3, la temperatura media per il lato superiore e' di 30.7 °C / 87 F, rispetto alla media del dispositivo di 33.9 °C / 93 F.
(+) I poggiapolsi e il touchpad sono piu' freddi della temperatura della pelle con un massimo di 24.8 °C / 76.6 F e sono quindi freddi al tatto.
(+) La temperatura media della zona del palmo della mano di dispositivi simili e'stata di 28.8 °C / 83.8 F (+4 °C / 7.2 F).
| MSI Vector GP66 12UGS Intel Core i9-12900H, NVIDIA GeForce RTX 3070 Ti Laptop GPU | MSI GP66 Leopard 11UH-028 Intel Core i7-11800H, NVIDIA GeForce RTX 3080 Laptop GPU | MSI Katana GF66 11UG-220 Intel Core i7-11800H, NVIDIA GeForce RTX 3070 Laptop GPU | Asus TUF Gaming F15 FX506HM Intel Core i7-11800H, NVIDIA GeForce RTX 3060 Laptop GPU | Razer Blade 15 Base Edition 2021, i7-10750H RTX 3060 Intel Core i7-10750H, NVIDIA GeForce RTX 3060 Laptop GPU | Alienware m15 R5 Ryzen Edition AMD Ryzen 7 5800H, NVIDIA GeForce RTX 3060 Laptop GPU | |
|---|---|---|---|---|---|---|
| Heat | -2% | -8% | 8% | -6% | -21% | |
| Maximum Upper Side * (°C) | 40.2 | 49 -22% | 56 -39% | 46.4 -15% | 45.2 -12% | 62 -54% |
| Maximum Bottom * (°C) | 43.8 | 47 -7% | 49 -12% | 45.4 -4% | 48 -10% | 61 -39% |
| Idle Upper Side * (°C) | 34.8 | 31 11% | 36 -3% | 26 25% | 34.4 1% | 36 -3% |
| Idle Bottom * (°C) | 37 | 33 11% | 28 24% | 27.4 26% | 37.2 -1% | 33 11% |
* ... Meglio usare valori piccoli
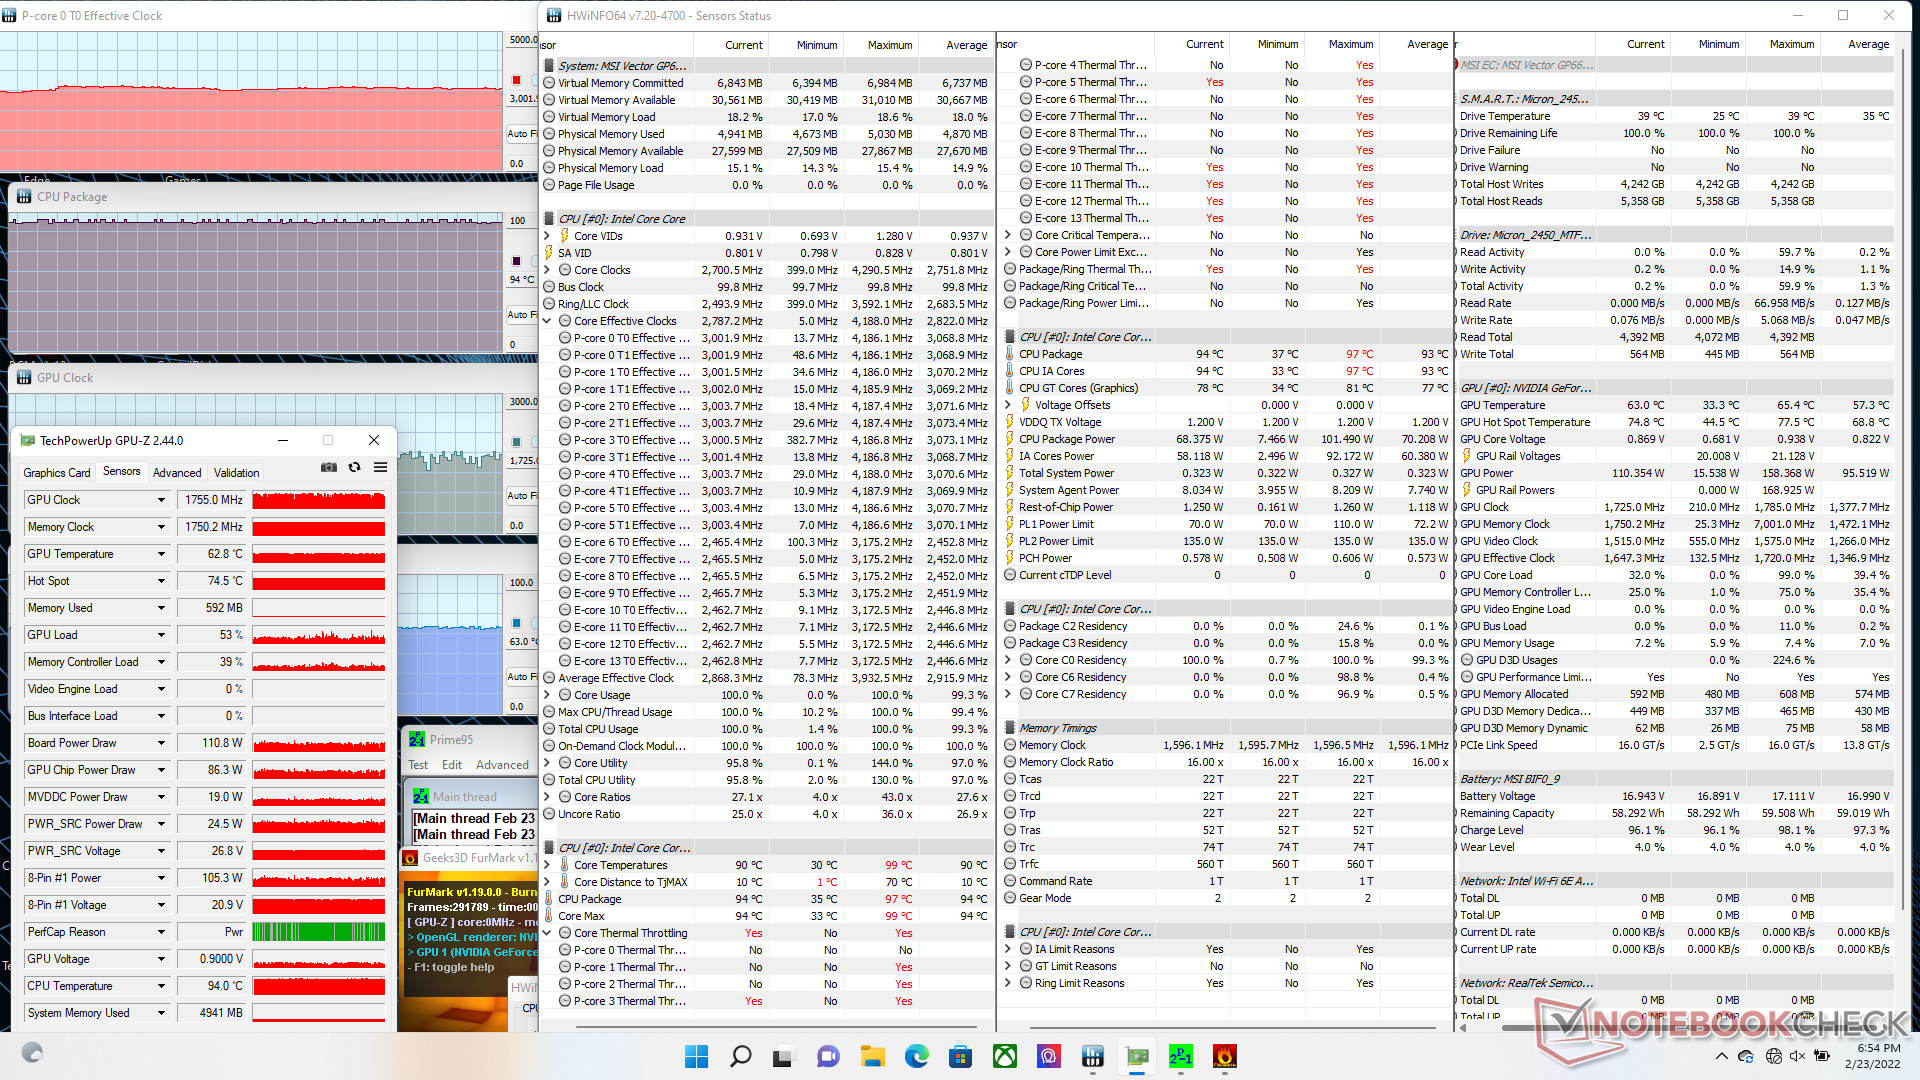
Test di stress
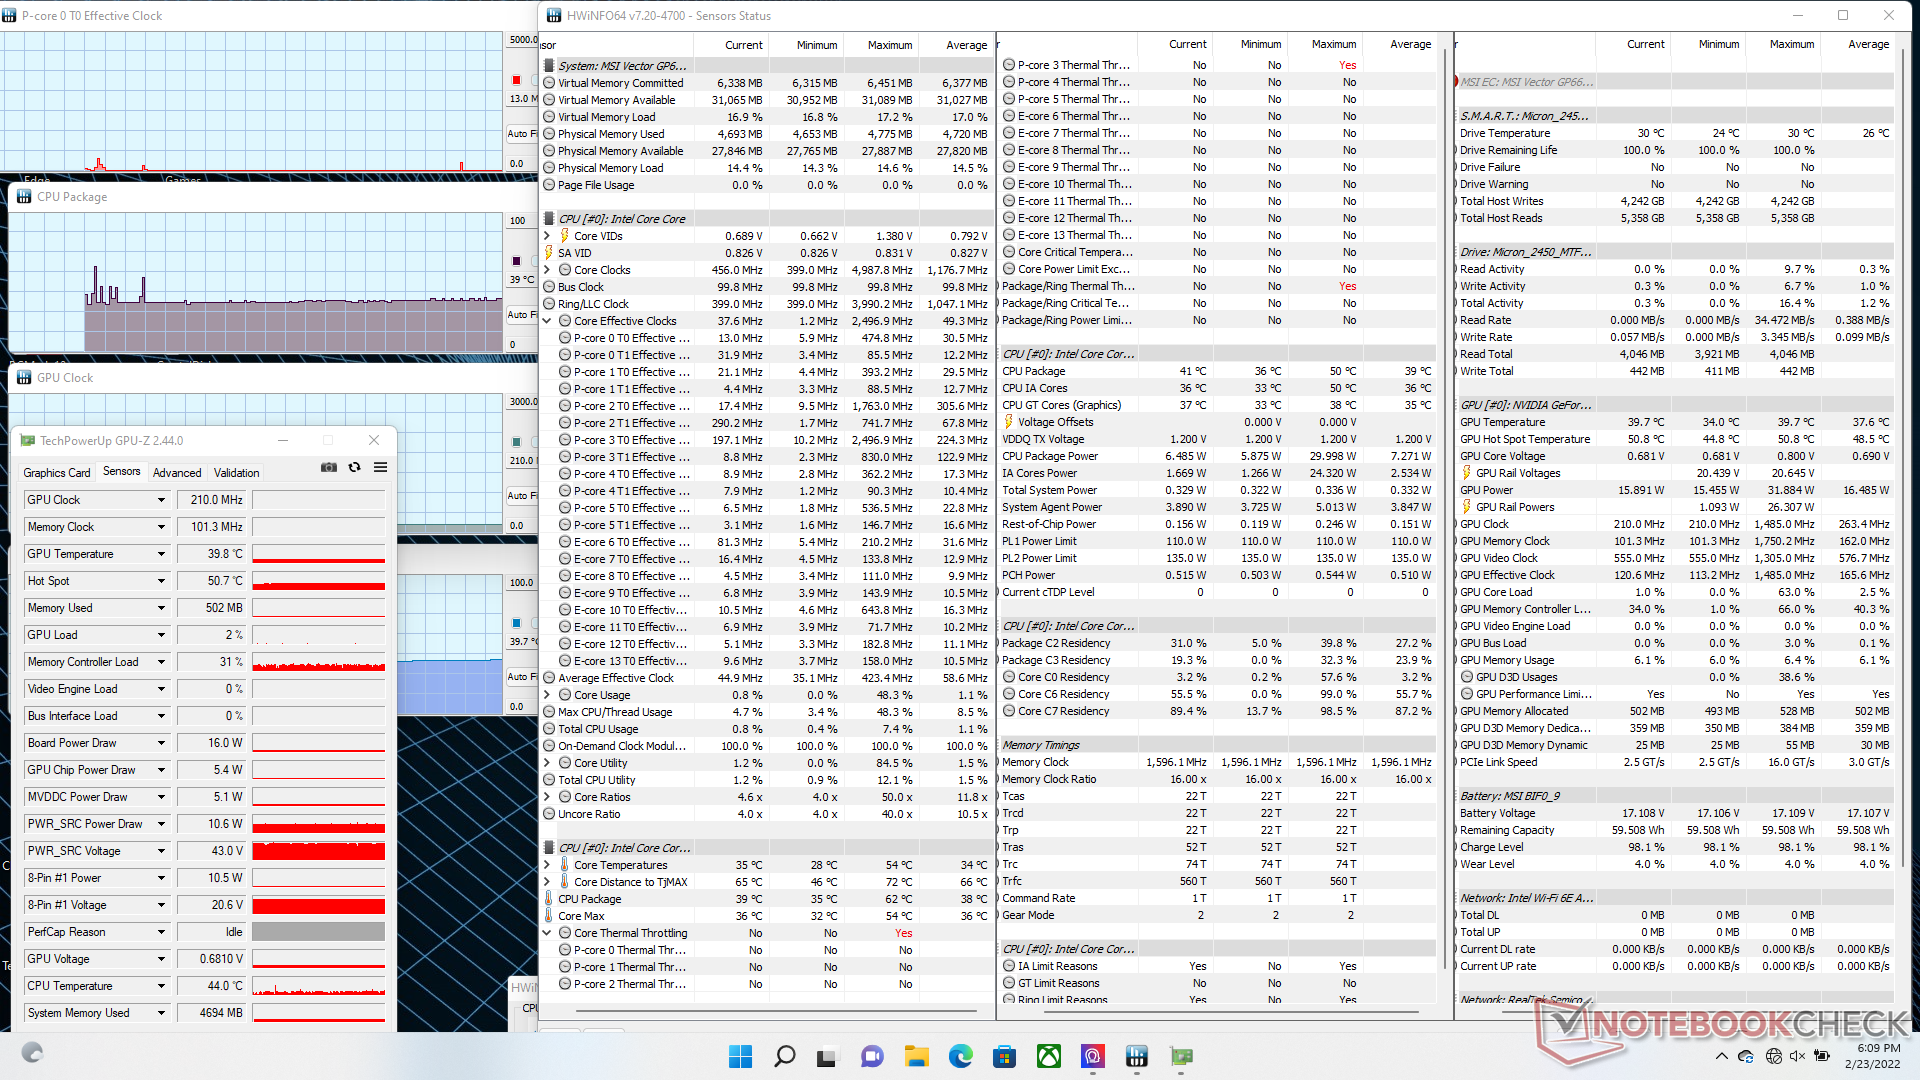
Quando stressato con Prime95 sul profilo Extreme Performance, le frequenze di clock della CPU aumenterebbero fino a 4,2 GHz solo per un secondo o due prima di scendere rapidamente a 3,7 GHz. Dopo un altro minuto circa, la frequenza di clock scendeva ulteriormente a soli 3 GHz per mantenere una temperatura del core di 90 C. La potenza del pacchetto CPU raggiungeva inizialmente i 100 W all'avvio di Prime95 prima di scendere e stabilizzarsi a 70 W. La stessa CPU Core i9-12900H nel più grande Uniwill Technology GM7AG8P sarebbe più veloce (3.2 GHz vs. 3.0 GHz) e più fredda (80 C vs. 90 C), rispettivamente, e con un TDP stabile più alto (75 W vs. 70 W) di quello che abbiamo registrato sul nostro Vector GP66.
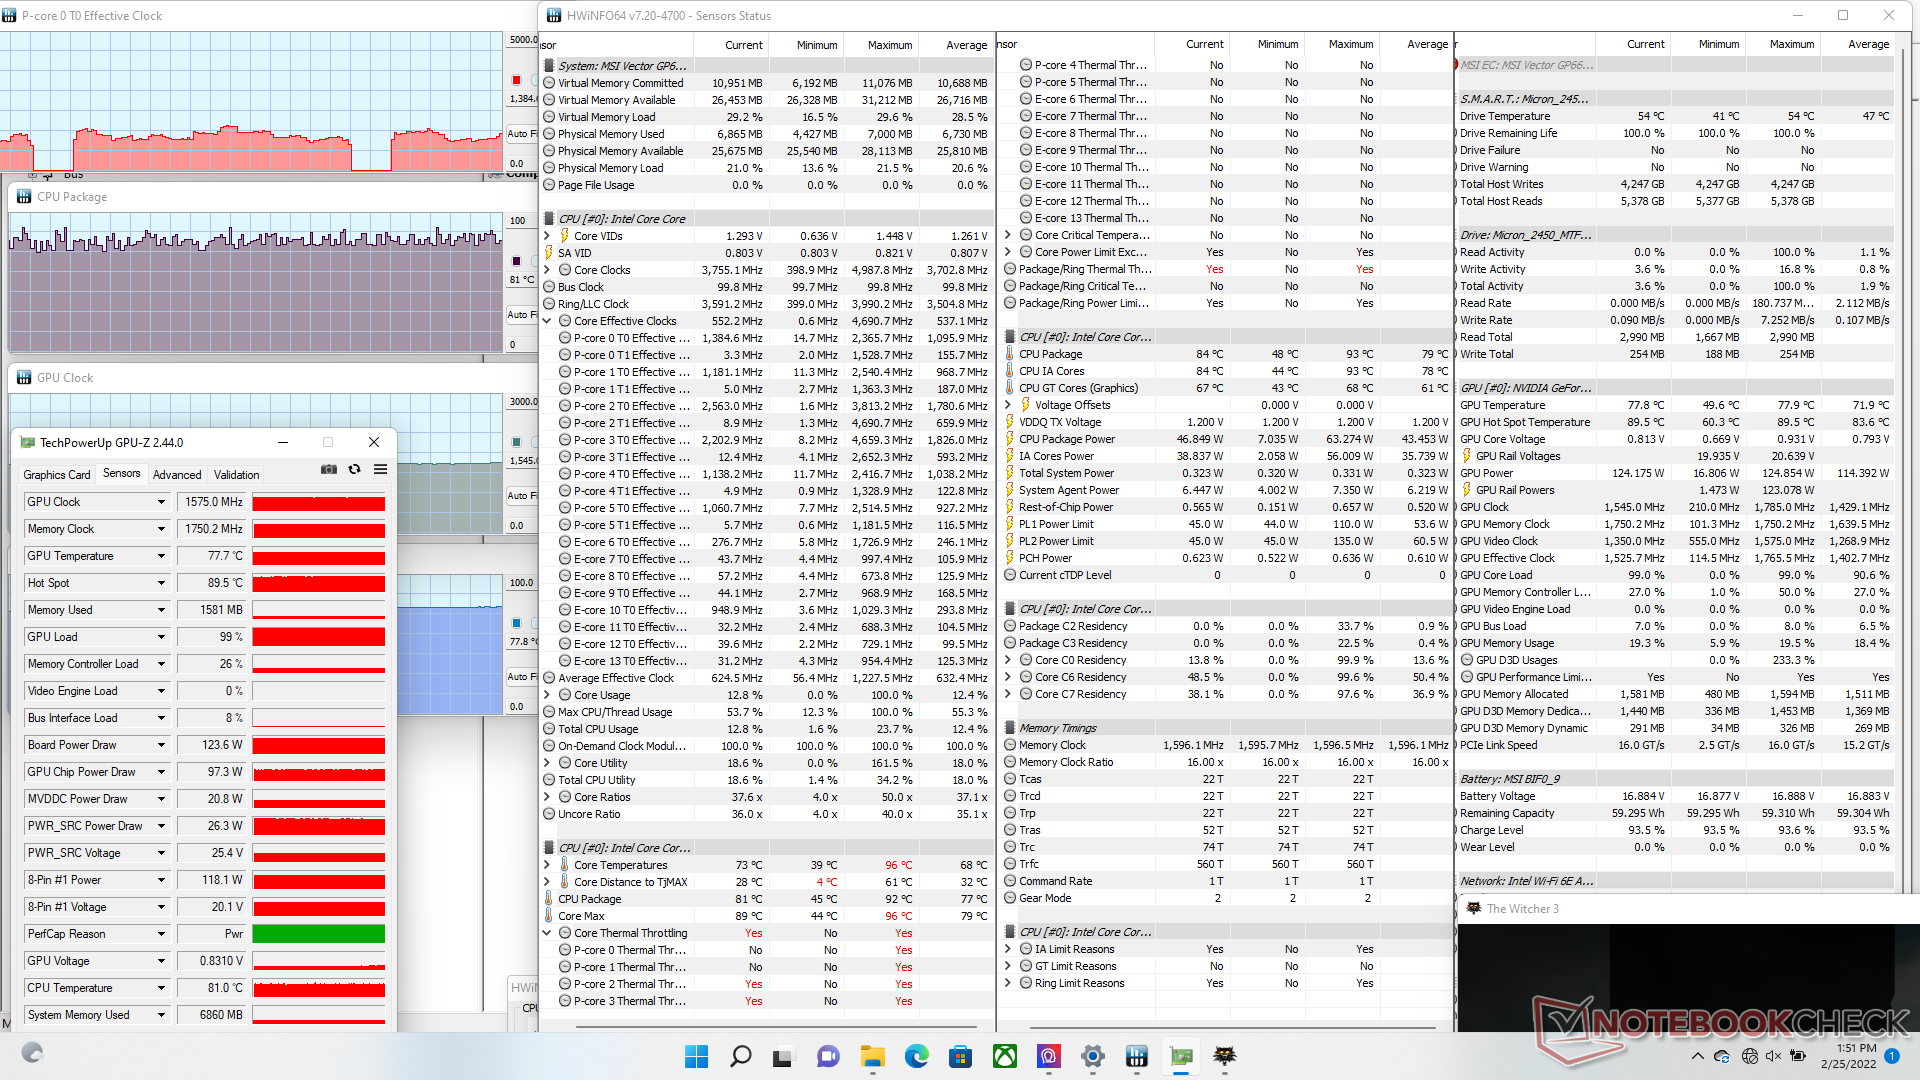
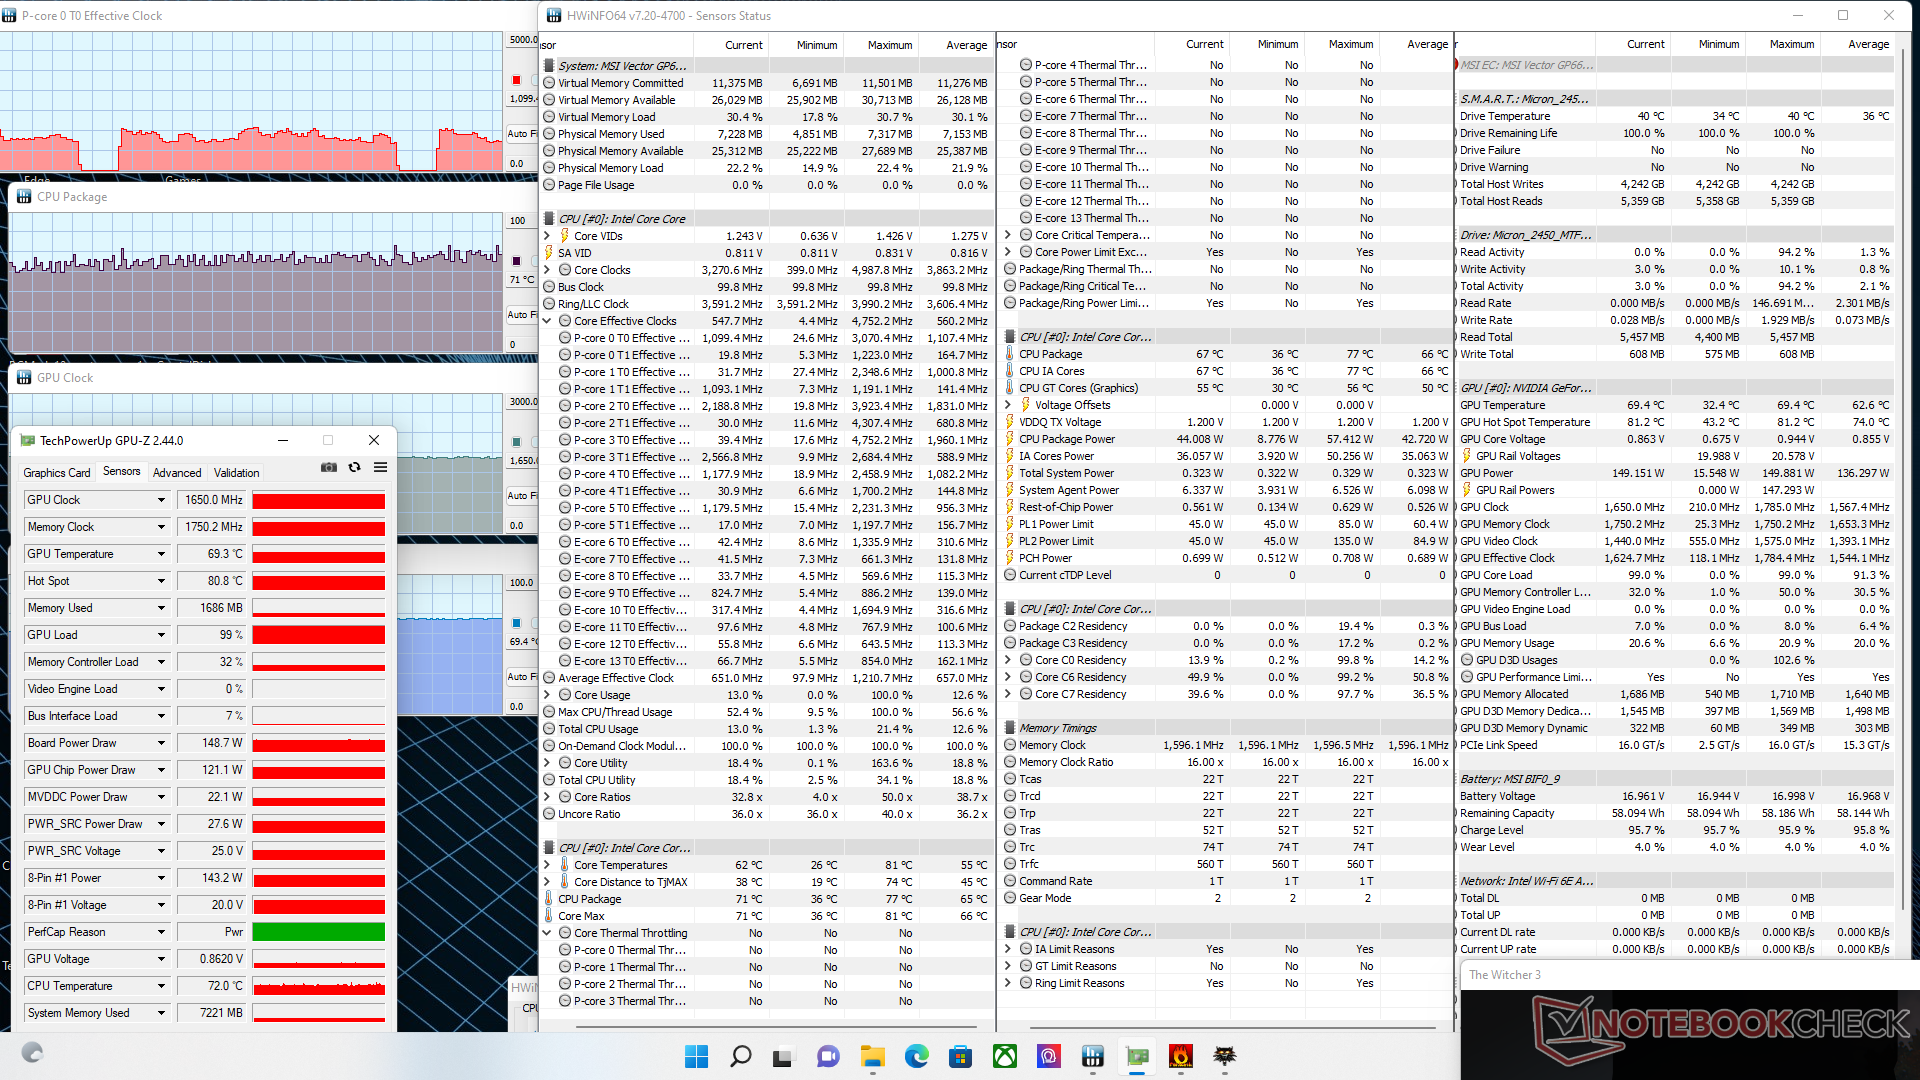
Le temperature di CPU e GPU si stabilizzavano a 71 C e 70 C, rispettivamente, con il profilo Extreme Performance. Scendere al profilo Balanced porterebbe a temperature più alte per CPU e GPU di 85 C e 78 C, rispettivamente, e un clock rate della GPU leggermente più lento (1650 MHz contro 1755 MHz). Le frequenze di clock sono comunque significativamente più veloci di quello che abbiamo osservato su MSI GS66 (1155 MHz) che viene fornito con la stessa GPU GeForce RTX 3070 Ti anche se con un TGP inferiore (105 W vs 150 W).
L'esecuzione con la batteria limiterà le prestazioni in modo significativo. Un test su Fire Strike con le batterie restituirebbe Fisica e Grafica di 10913 punti e 6061 punti, rispettivamente, rispetto a 30698 e 29729 punti con la rete elettrica.
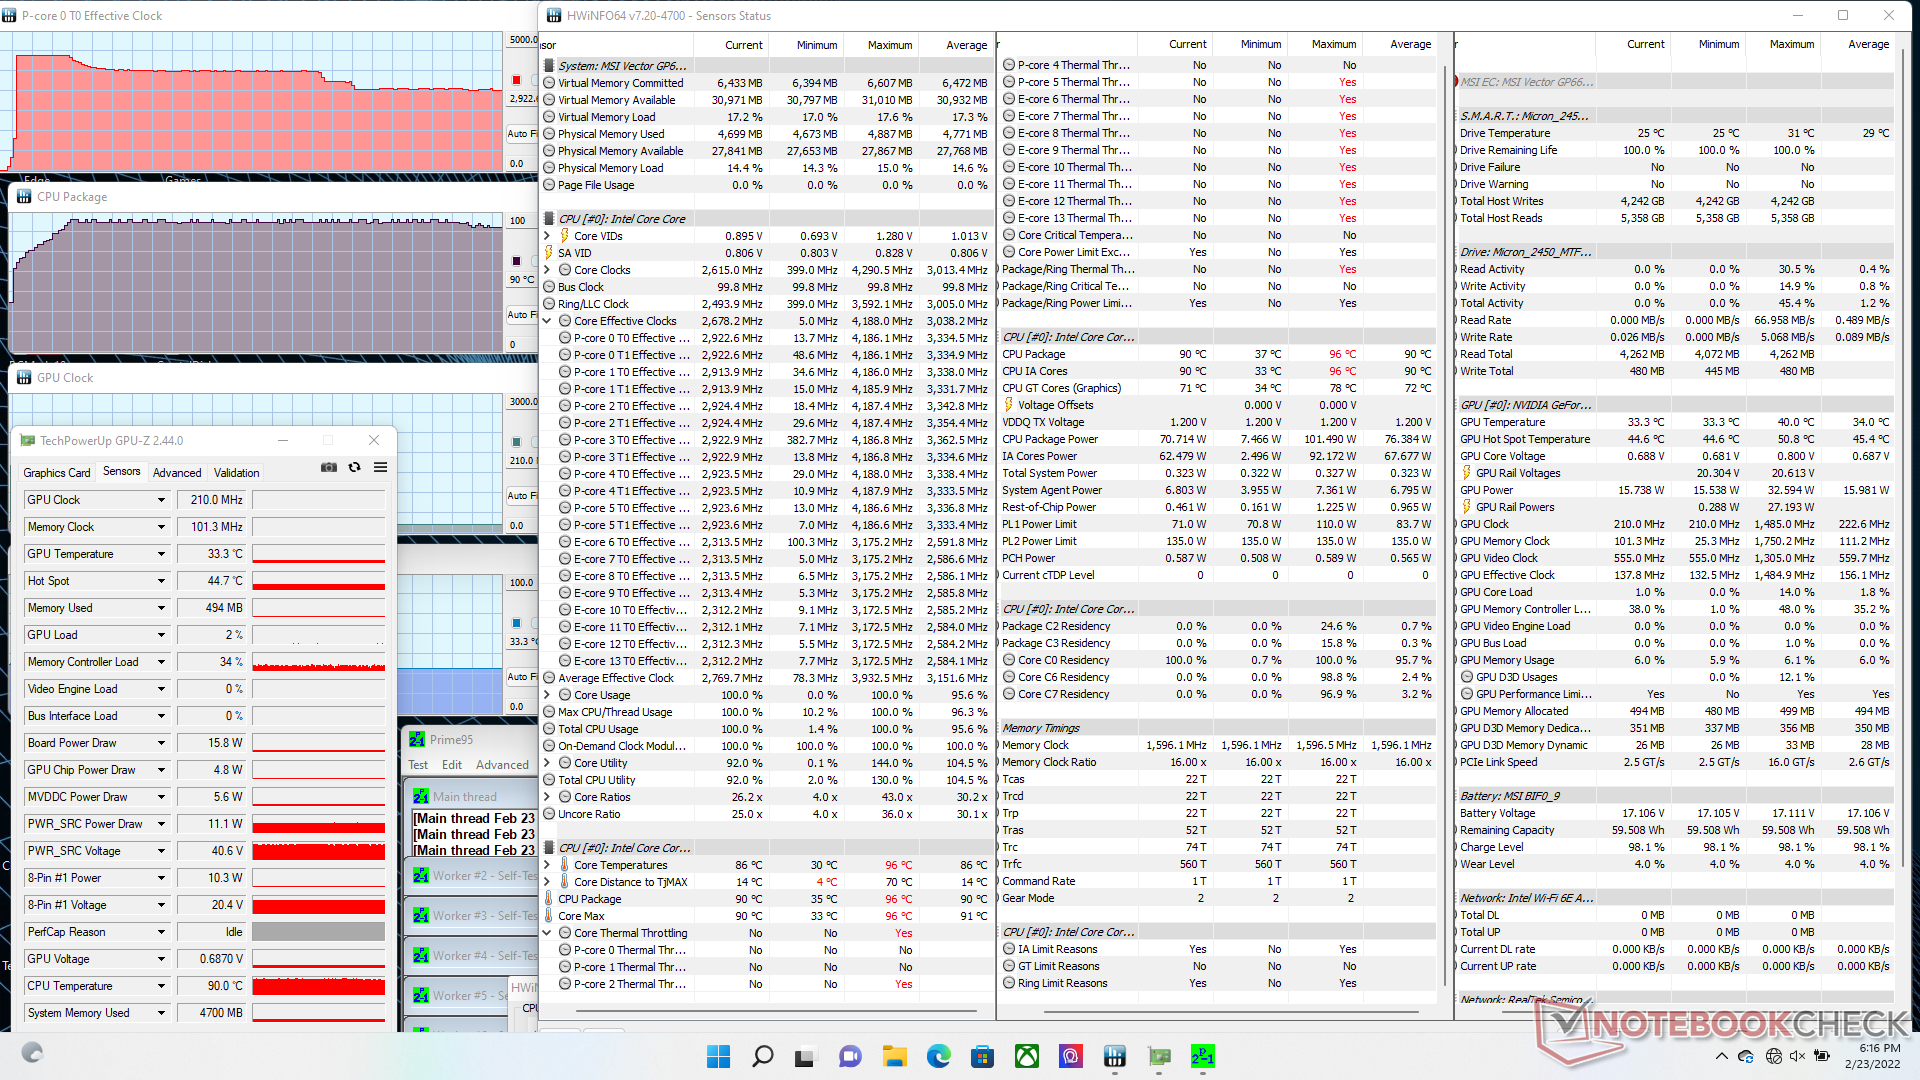
| CPU Clock (GHz) | GPU Clock (MHz) | Temperatura media della CPU (°C) | Temperatura media della GPU (°C) | |
| Sistema inattivo (modalità bilanciata) | -- | -- | 39 | 40 |
| Prime95 Stress (modalità prestazioni estreme) | 3.0 | -- | 90 | 33 |
| Prime95 + FurMark Stress (Modalità prestazioni estreme) | 3.0 | 1755 | 94 | 63 |
| Witcher 3 Stress (modalità Extreme Performance) | ~1.0 | 1650 | 71 | 70 |
| Witcher 3 Stress (Modalità bilanciata) | ~1.0 | 1515 | 85 | 78 |
Altoparlanti
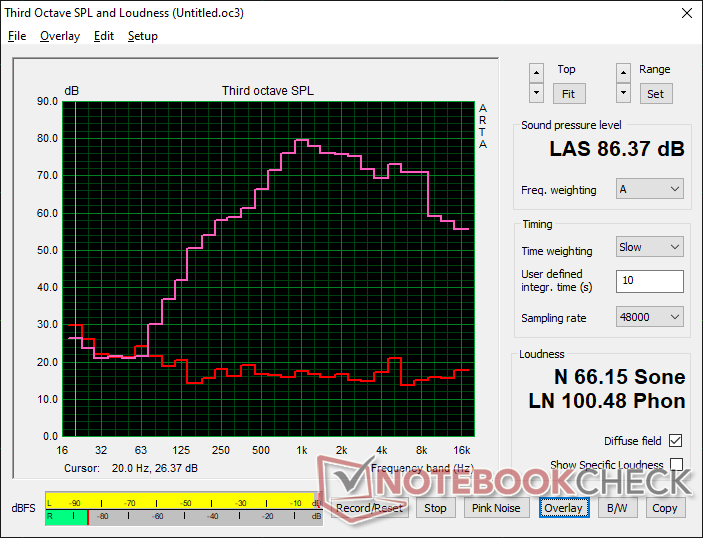
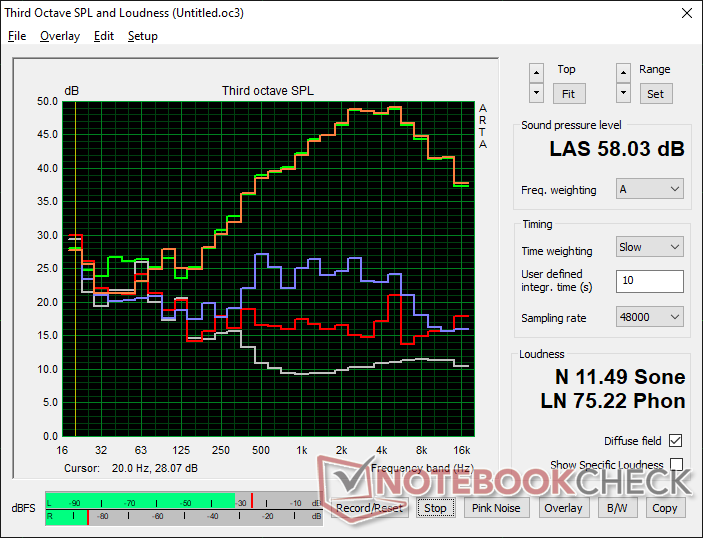
MSI Vector GP66 12UGS analisi audio
(+) | gli altoparlanti sono relativamente potenti (86.4 dB)
Bassi 100 - 315 Hz
(-) | quasi nessun basso - in media 19.2% inferiori alla media
(±) | la linearità dei bassi è media (9.1% delta rispetto alla precedente frequenza)
Medi 400 - 2000 Hz
(±) | medi elevati - circa 6.5% superiore alla media
(+) | medi lineari (5.8% delta rispetto alla precedente frequenza)
Alti 2 - 16 kHz
(+) | Alti bilanciati - appena 3.7% dalla media
(+) | alti lineari (6.5% delta rispetto alla precedente frequenza)
Nel complesso 100 - 16.000 Hz
(±) | la linearità complessiva del suono è media (18.1% di differenza rispetto alla media
Rispetto alla stessa classe
» 57% di tutti i dispositivi testati in questa classe è stato migliore, 8% simile, 35% peggiore
» Il migliore ha avuto un delta di 6%, medio di 18%, peggiore di 132%
Rispetto a tutti i dispositivi testati
» 39% di tutti i dispositivi testati in questa classe è stato migliore, 8% similare, 54% peggiore
» Il migliore ha avuto un delta di 4%, medio di 23%, peggiore di 134%
Apple MacBook Pro 16 2021 M1 Pro analisi audio
(+) | gli altoparlanti sono relativamente potenti (84.7 dB)
Bassi 100 - 315 Hz
(+) | bassi buoni - solo 3.8% dalla media
(+) | bassi in lineaa (5.2% delta rispetto alla precedente frequenza)
Medi 400 - 2000 Hz
(+) | medi bilanciati - solo only 1.3% rispetto alla media
(+) | medi lineari (2.1% delta rispetto alla precedente frequenza)
Alti 2 - 16 kHz
(+) | Alti bilanciati - appena 1.9% dalla media
(+) | alti lineari (2.7% delta rispetto alla precedente frequenza)
Nel complesso 100 - 16.000 Hz
(+) | suono nel complesso lineare (4.6% differenza dalla media)
Rispetto alla stessa classe
» 0% di tutti i dispositivi testati in questa classe è stato migliore, 0% simile, 100% peggiore
» Il migliore ha avuto un delta di 5%, medio di 17%, peggiore di 45%
Rispetto a tutti i dispositivi testati
» 0% di tutti i dispositivi testati in questa classe è stato migliore, 0% similare, 100% peggiore
» Il migliore ha avuto un delta di 4%, medio di 23%, peggiore di 134%
Gestione dell'energia
Consumo di energia
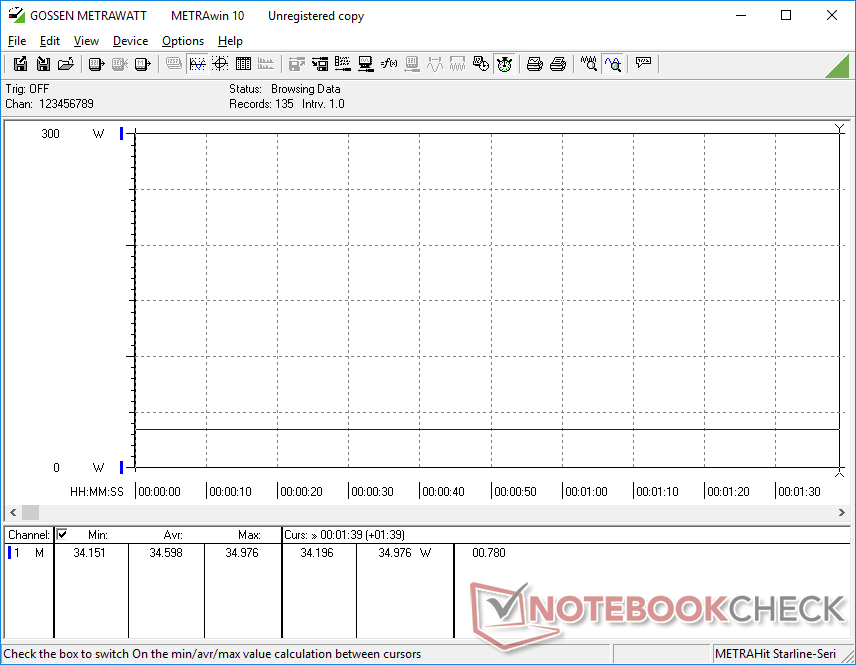
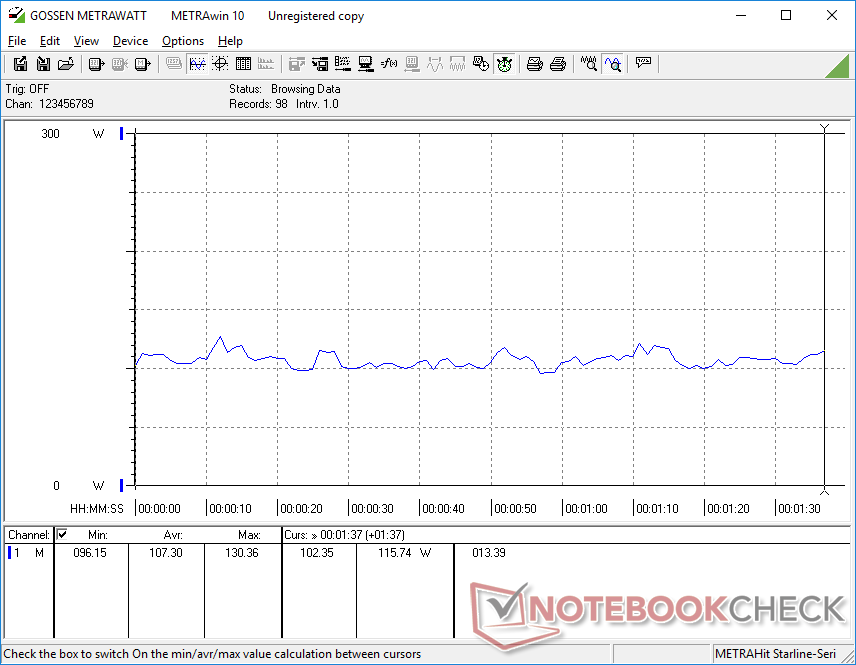
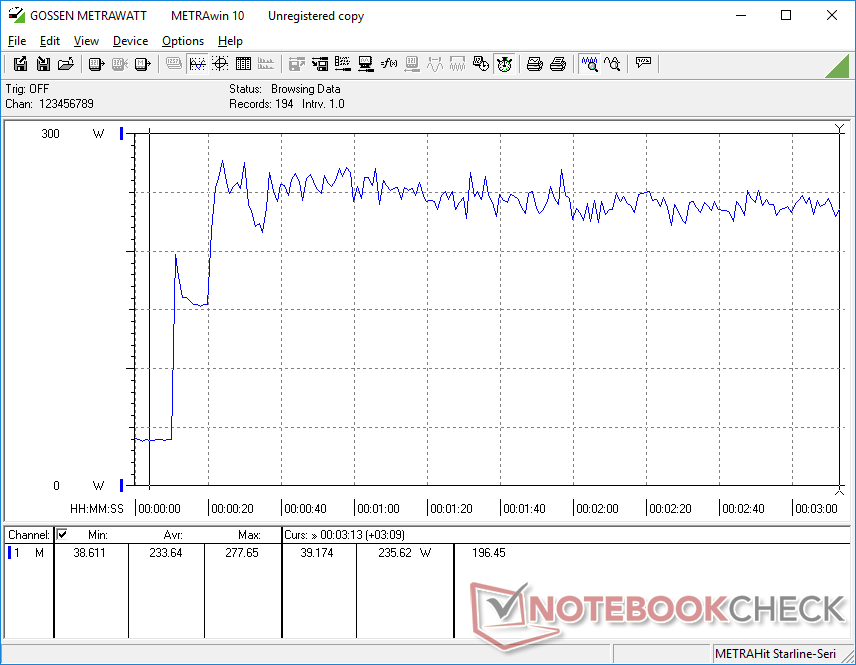
Aspettatevi un consumo energetico più elevato in generale sul Vector GP66 rispetto al GP66 Leopard dell'anno scorso a causa della sua maggiore frequenza di aggiornamento del display nativo (360 Hz contro 144 Hz), obiettivi PL della CPU più elevati (70 W contro 45 W) e TGP più alto (150 W contro 140 W). L'esecuzione di giochi disegnerà circa 20 W in più dalla presa per essere più esigente di molti altri portatili da gioco da 17 pollici dotati di GeForce RTX 3080 grafica. Anche se gli utenti stanno ottenendo prestazioni più elevate anno dopo anno soprattutto in termini di CPU, le prestazioni per watt potrebbero non essere molto migliori.
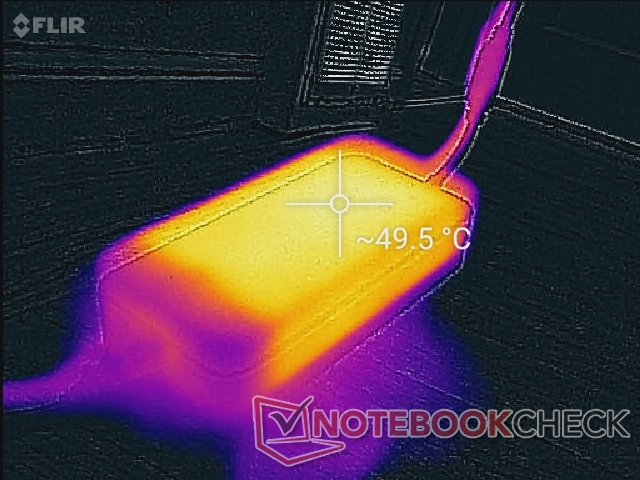
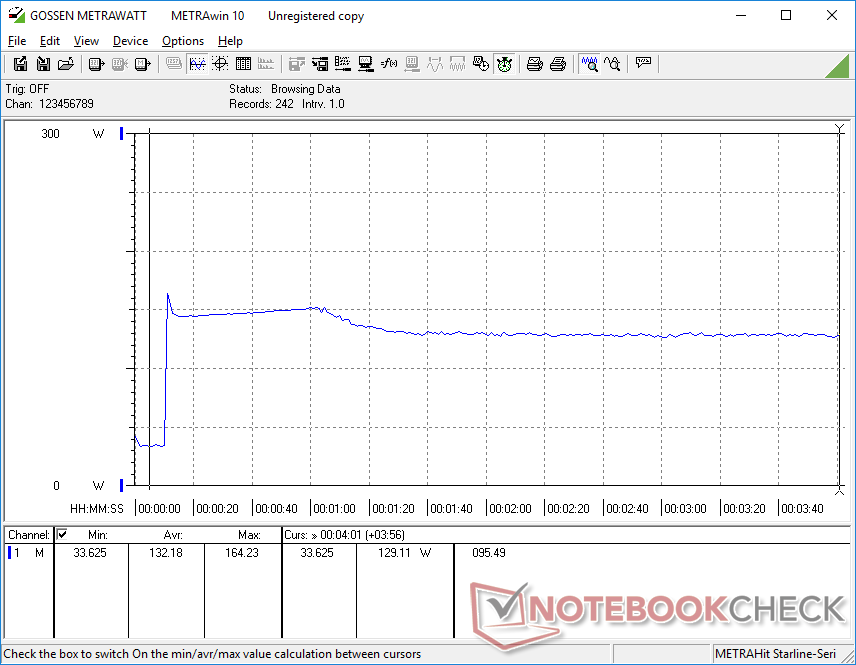
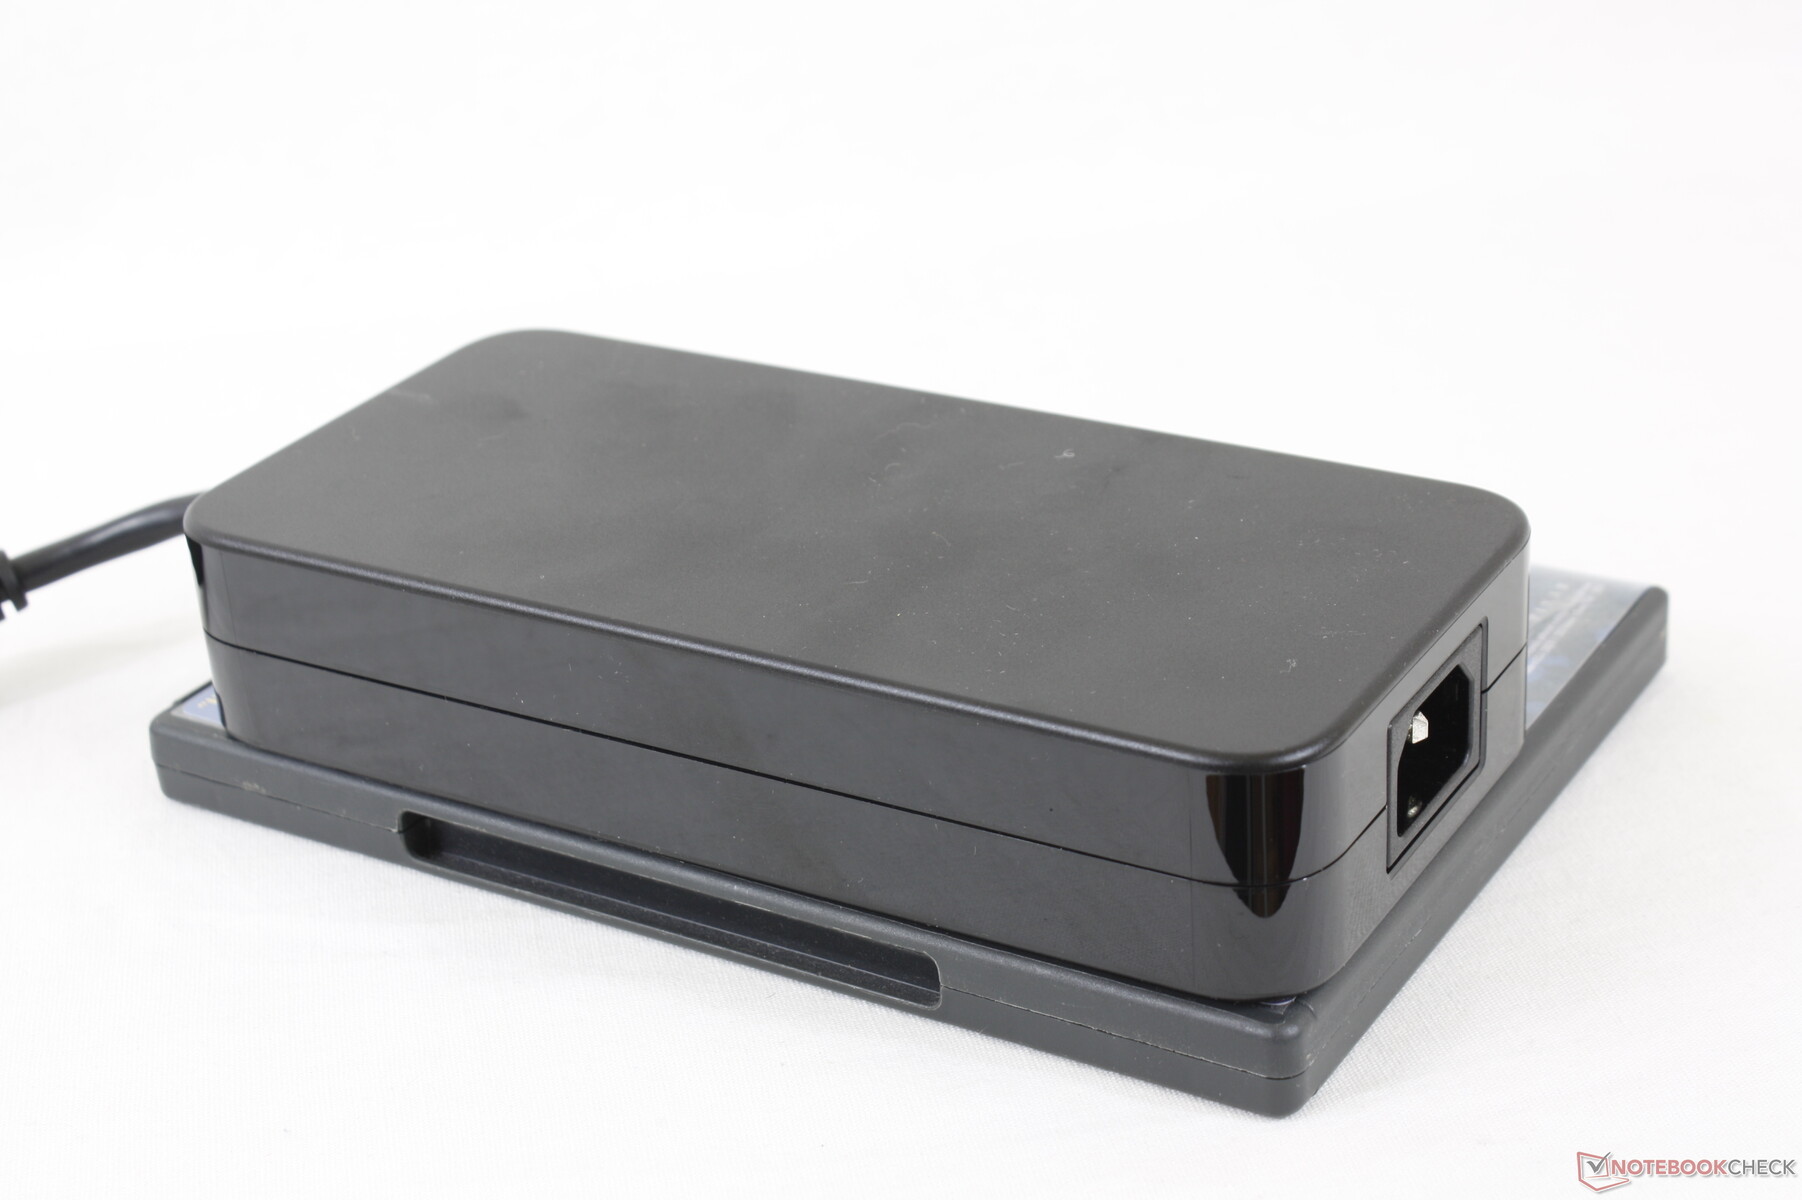
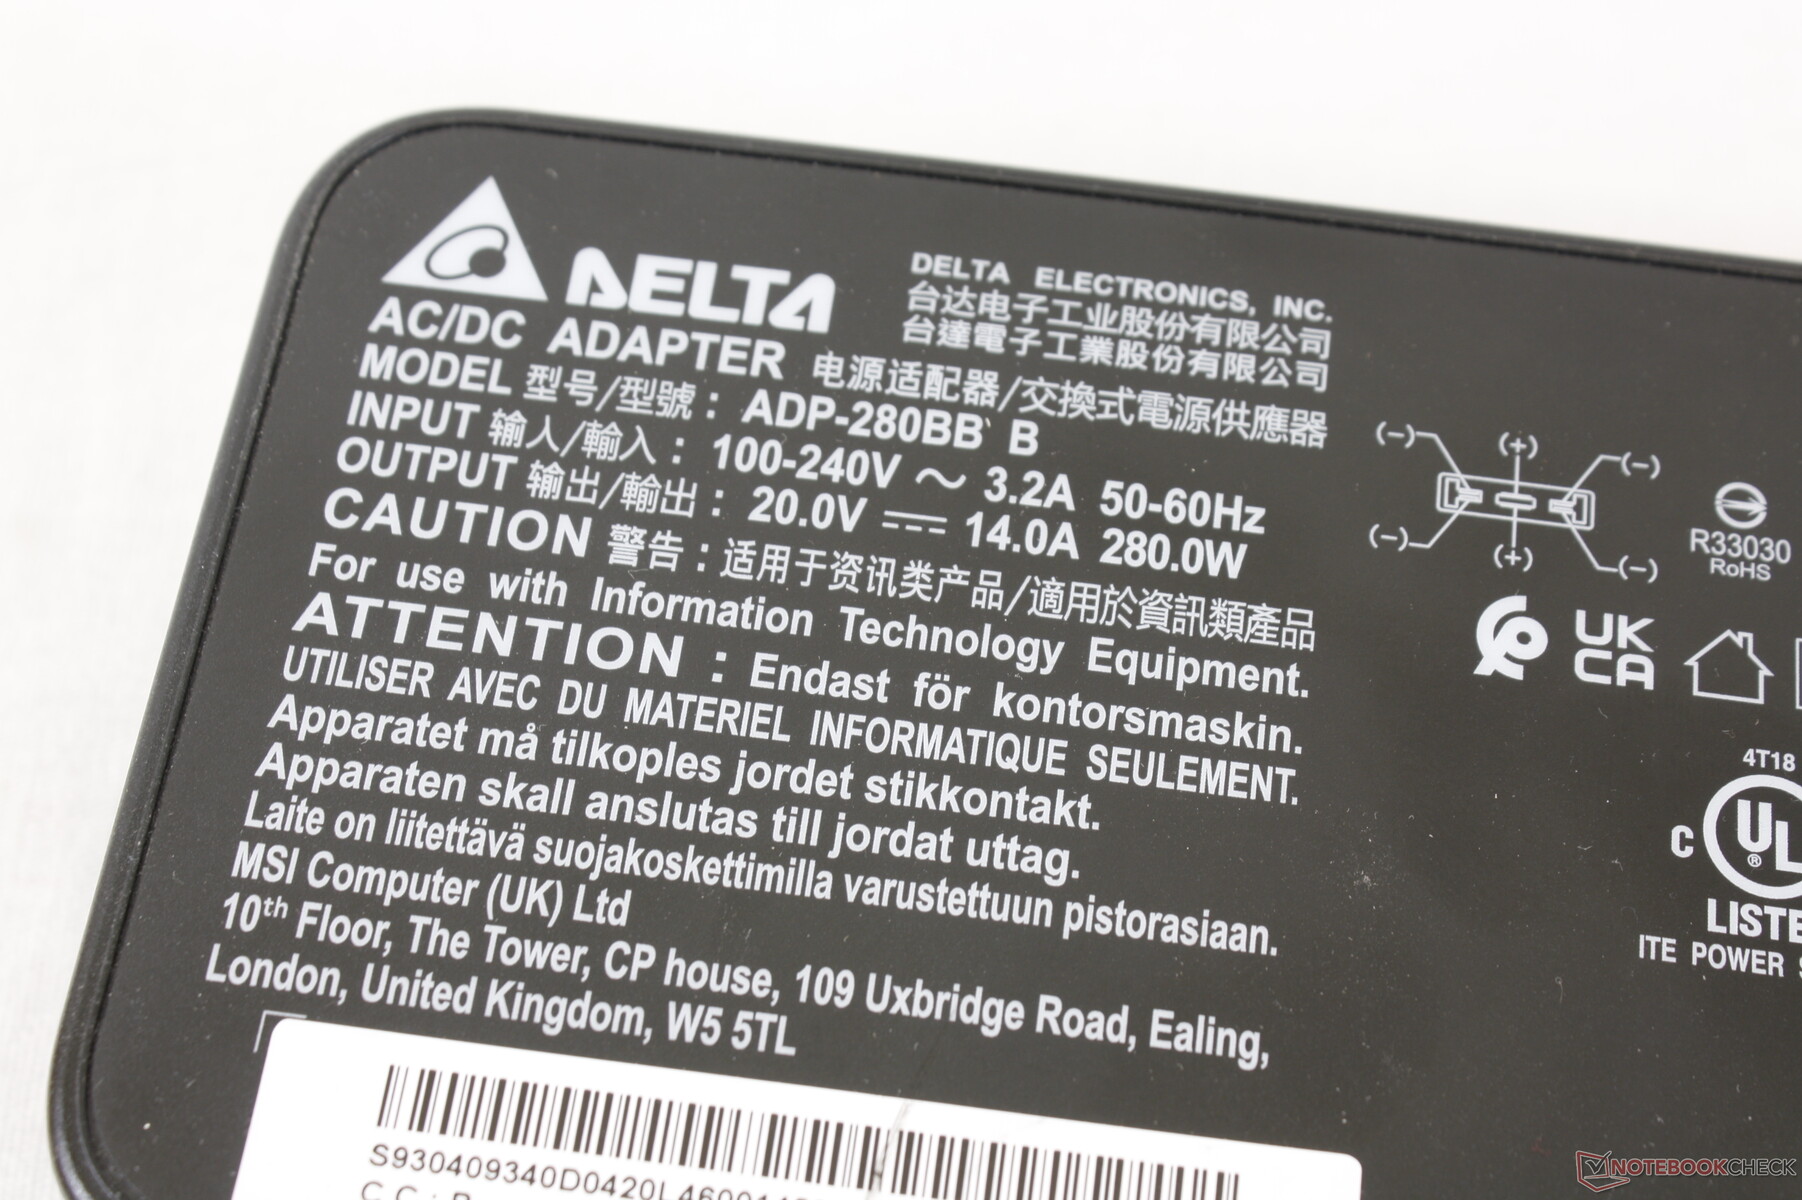
Siamo in grado di registrare un consumo massimo temporaneo di 278 W dal grande adattatore AC da 280 W (~18 x 8,5 x 3,5 cm) quando si eseguono contemporaneamente Prime95 e FurMark. La batteria si ricarica ancora ad un ritmo decente durante il gioco.
| Off / Standby | |
| Idle | |
| Sotto carico |
|
Leggenda:
min: | |
| MSI Vector GP66 12UGS i9-12900H, GeForce RTX 3070 Ti Laptop GPU, , IPS, 1920x1080, 15.6" | MSI GP66 Leopard 11UH-028 i7-11800H, GeForce RTX 3080 Laptop GPU, Samsung PM9A1 MZVL21T0HCLR, IPS, 1920x1080, 15.6" | MSI Katana GF66 11UG-220 i7-11800H, GeForce RTX 3070 Laptop GPU, Kingston OM8PDP3512B-AI1, IPS, 1920x1080, 15.6" | Asus TUF Gaming F15 FX506HM i7-11800H, GeForce RTX 3060 Laptop GPU, SK Hynix HFM001TD3JX013N, IPS, 1920x1080, 15.6" | Razer Blade 15 Base Edition 2021, i7-10750H RTX 3060 i7-10750H, GeForce RTX 3060 Laptop GPU, Samsung SSD PM981a MZVLB512HBJQ, IPS, 1920x1080, 15.6" | Alienware m15 R5 Ryzen Edition R7 5800H, GeForce RTX 3060 Laptop GPU, Toshiba KBG40ZNS512G NVMe, IPS, 1920x1080, 15.6" | |
|---|---|---|---|---|---|---|
| Power Consumption | 24% | 38% | 36% | 28% | 23% | |
| Idle Minimum * (Watt) | 17.5 | 13 26% | 8 54% | 9.5 46% | 11.7 33% | 11 37% |
| Idle Average * (Watt) | 20.1 | 17 15% | 12 40% | 12.1 40% | 16 20% | 14 30% |
| Idle Maximum * (Watt) | 47.3 | 18 62% | 22 53% | 22.5 52% | 29.3 38% | 25 47% |
| Load Average * (Watt) | 107.3 | 96 11% | 98 9% | 99.5 7% | 95.6 11% | 123 -15% |
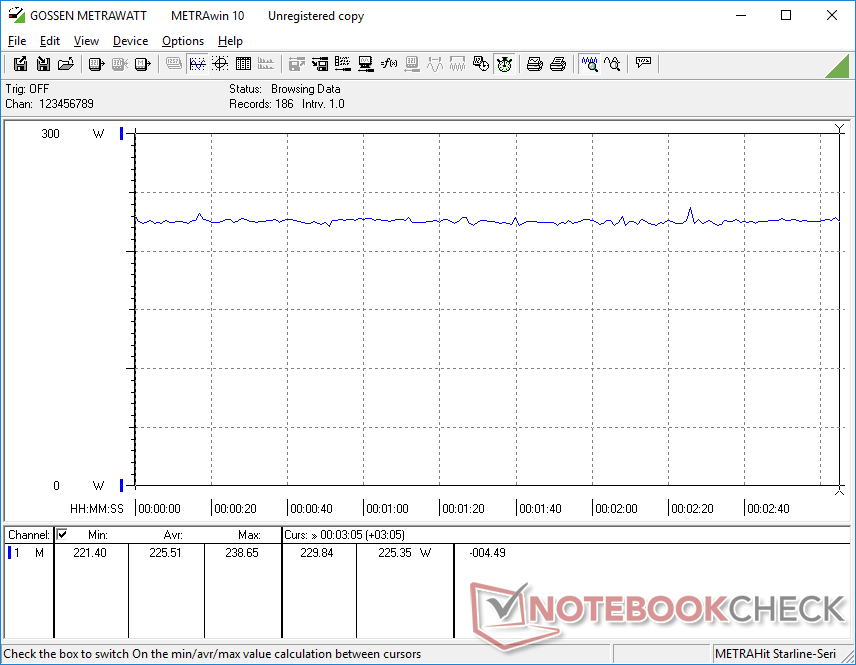
| Witcher 3 ultra * (Watt) | 225 | 207 8% | 152 32% | 157 30% | 141.3 37% | 176 22% |
| Load Maximum * (Watt) | 277.7 | 223 20% | 162 42% | 173.5 38% | 197 29% | 226 19% |
* ... Meglio usare valori piccoli
Power Consumption Witcher 3 / Stresstest
Power Consumption external Monitor
Durata della batteria
La capacità della batteria è la stessa tra il GP66 Vector e il GP66 Leopard dell'anno scorso a 65 Wh. Tuttavia, siamo in grado di registrare tempi di esecuzione WLAN più lunghi sul modello più recente di poco più di due ore aggiuntive. Raccomandiamo di far funzionare il sistema in modalità MSHybrid per estendere la durata della batteria se la modalità dGPU non è una priorità.
La ricarica da vuoto a piena capacità con l'adattatore AC incluso richiede circa 2,5 ore rispetto alle 2 ore o più veloce della maggior parte degli altri portatili. La ricarica con adattatori USB-C non è supportata a differenza di molte alternative di Asus o Razer.
| MSI Vector GP66 12UGS i9-12900H, GeForce RTX 3070 Ti Laptop GPU, 65 Wh | MSI GP66 Leopard 11UH-028 i7-11800H, GeForce RTX 3080 Laptop GPU, 65 Wh | MSI Katana GF66 11UG-220 i7-11800H, GeForce RTX 3070 Laptop GPU, 90 Wh | Asus TUF Gaming F15 FX506HM i7-11800H, GeForce RTX 3060 Laptop GPU, 90 Wh | Razer Blade 15 Base Edition 2021, i7-10750H RTX 3060 i7-10750H, GeForce RTX 3060 Laptop GPU, 65 Wh | Alienware m15 R5 Ryzen Edition R7 5800H, GeForce RTX 3060 Laptop GPU, 86 Wh | |
|---|---|---|---|---|---|---|
| Autonomia della batteria | -9% | 9% | 59% | 11% | 22% | |
| Reader / Idle (h) | 7.9 | 9.1 15% | 11 39% | 7.8 -1% | 14.7 86% | |
| WiFi v1.3 (h) | 5.7 | 3.6 -37% | 5.3 -7% | 7.9 39% | 4.8 -16% | 5.1 -11% |
| Load (h) | 1 | 1.2 20% | 1.2 20% | 2 100% | 1.5 50% | 0.9 -10% |
| H.264 (h) | 3.5 | 8.8 | ||||
| Witcher 3 ultra (h) | 0.8 | 1.6 |
Pro
Contro
Verdetto
Le termiche migliorate del GP66 rispetto al GP65 hanno permesso di supportare una grafica TGP più potente da 150 W rispetto ai soli ~100 W del Razer Blade 15 o MSI GS66 serie. In altre parole, stai ottenendo una delle migliori versioni di mobile GeForce RTX 3070 Ti su qualsiasi portatile da 15,6 pollici al momento a causa del più alto tetto TGP del GP66. Il GS66 può essere più sottile e più portatile, ma il suo GeForce RTX 3070 Ti è anche notevolmente più lento come conseguenza diretta. Per un'esperienza più equilibrata, il GP66 sarebbe l'opzione migliore.
La modalità Extreme Performance è necessaria se volete spremere più prestazioni possibili dalla GPU. Questa modalità è anche la più rumorosa in termini di rumore delle ventole, il che significa che le ventole più rumorose della media sono inevitabili se si vogliono ottenere le massime prestazioni. Giocare in modalità bilanciata invece limiterebbe il rumore delle ventole in modo significativo per solo un piccolo ~5 per cento di calo delle prestazioni grafiche. Troviamo che questa modalità sia ideale per i giocatori che non amano usare le cuffie o sono altrimenti infastiditi da computer portatili da gioco extra-forte.
Il Vector GP66 bilancia la portabilità e le prestazioni meglio della maggior parte degli altri portatili da gioco ultrasottili con le sue opzioni di GPU a 150 W di maggiore potenza.
Per le revisioni future, ci piacerebbe vedere miglioramenti sia al clickpad spugnoso che alla sostenibilità delle prestazioni dell'SSD PCIe4 x4. Il clickpad è un downgrade rispetto al vecchio GP65, mentre la mancanza di un diffusore di calore per l'SSD NVMe significa che le velocità di trasferimento si strozzeranno dopo un breve periodo di uso intensivo.
Prezzo e disponibilità
La nostra esatta configurazione recensita è attualmente disponibile su Best Buy per $2400 USD.
MSI Vector GP66 12UGS
- 03/03/2022 v7 (old)
Allen Ngo
Price comparison

