Recensione del laptop Asus ROG Strix G15 G512LW: Molto meglio del G512LI
Mentre l'Asus ROG Strix G15 G512LI viene fornito con il display GeForce GTX 1650 Ti e 144 Hz, l'Asus ROG Strix G15 G512LW viene fornito con la GeForce RTX 2070 molto più potente e con un display da 240 Hz ancora più veloce. Entrambi i modelli condividono lo stesso telaio, ma con un paio di importanti differenze che noteremo in questa recensione.
Consigliamo di dare un'occhiata alla nostra recensione del G512LLI per saperne di più sulle caratteristiche fisiche del G512LW, dato che quasi tutti i nostri commenti esistenti sono ancora validi. Questa pagina esplorerà le prestazioni e le differenze di display tra la G512LW e la G512LI e altri portatili da 15,6 pollici gaming come l'MSI GP65 o l'Alienware m15 R3. La nostra configurazione può essere trovata su Computer Upgrade King per circa $1500 USD e oltre a seconda della RAM e dello storage
Altre recensioni Asus:
Punteggio | Data | Modello | Peso | Altezza | Dimensione | Risoluzione | Prezzo |
|---|---|---|---|---|---|---|---|
| 83.4 % v7 (old) | 11/2020 | Asus ROG Strix G15 G512LW i7-10750H, GeForce RTX 2070 Mobile | 2.3 kg | 25.8 mm | 15.60" | 1920x1080 | |
| 80.8 % v7 (old) | 07/2020 | Asus ROG Strix G15 G512LI i7-10750H, GeForce GTX 1650 Ti Mobile | 2.3 kg | 25.8 mm | 15.60" | 1920x1080 | |
| 86.9 % v7 (old) | 08/2020 | Razer Blade 15 RTX 2070 Super Max-Q i7-10875H, GeForce RTX 2070 Super Max-Q | 2.1 kg | 17.8 mm | 15.60" | 1920x1080 | |
| 83.2 % v7 (old) | 05/2020 | MSI GP65 10SFK-047US i7-10750H, GeForce RTX 2070 Mobile | 2.3 kg | 27.5 mm | 15.60" | 1920x1080 | |
| 84.4 % v7 (old) | 07/2020 | Asus ROG Strix Scar 15 G532LWS i9-10980HK, GeForce RTX 2070 Super Mobile | 2.4 kg | 24.9 mm | 15.60" | 1920x1080 | |
| 84.8 % v7 (old) | 08/2020 | Alienware m15 R3 P87F i7-10750H, GeForce RTX 2070 Mobile | 2.3 kg | 19.9 mm | 15.60" | 1920x1080 |
Case
Comunicazione
L'Intel AX201 viene fornita di serie per la connessione Wi-Fi 6 e Bluetooth 5.1. La velocità media di trasmissione è stranamente più lenta questa volta a 790 Mbps quando è collegato al nostro router Netgear RAX200. I risultati non migliorano nemmeno dopo aver resettato il nostro router e il nostro portatile.
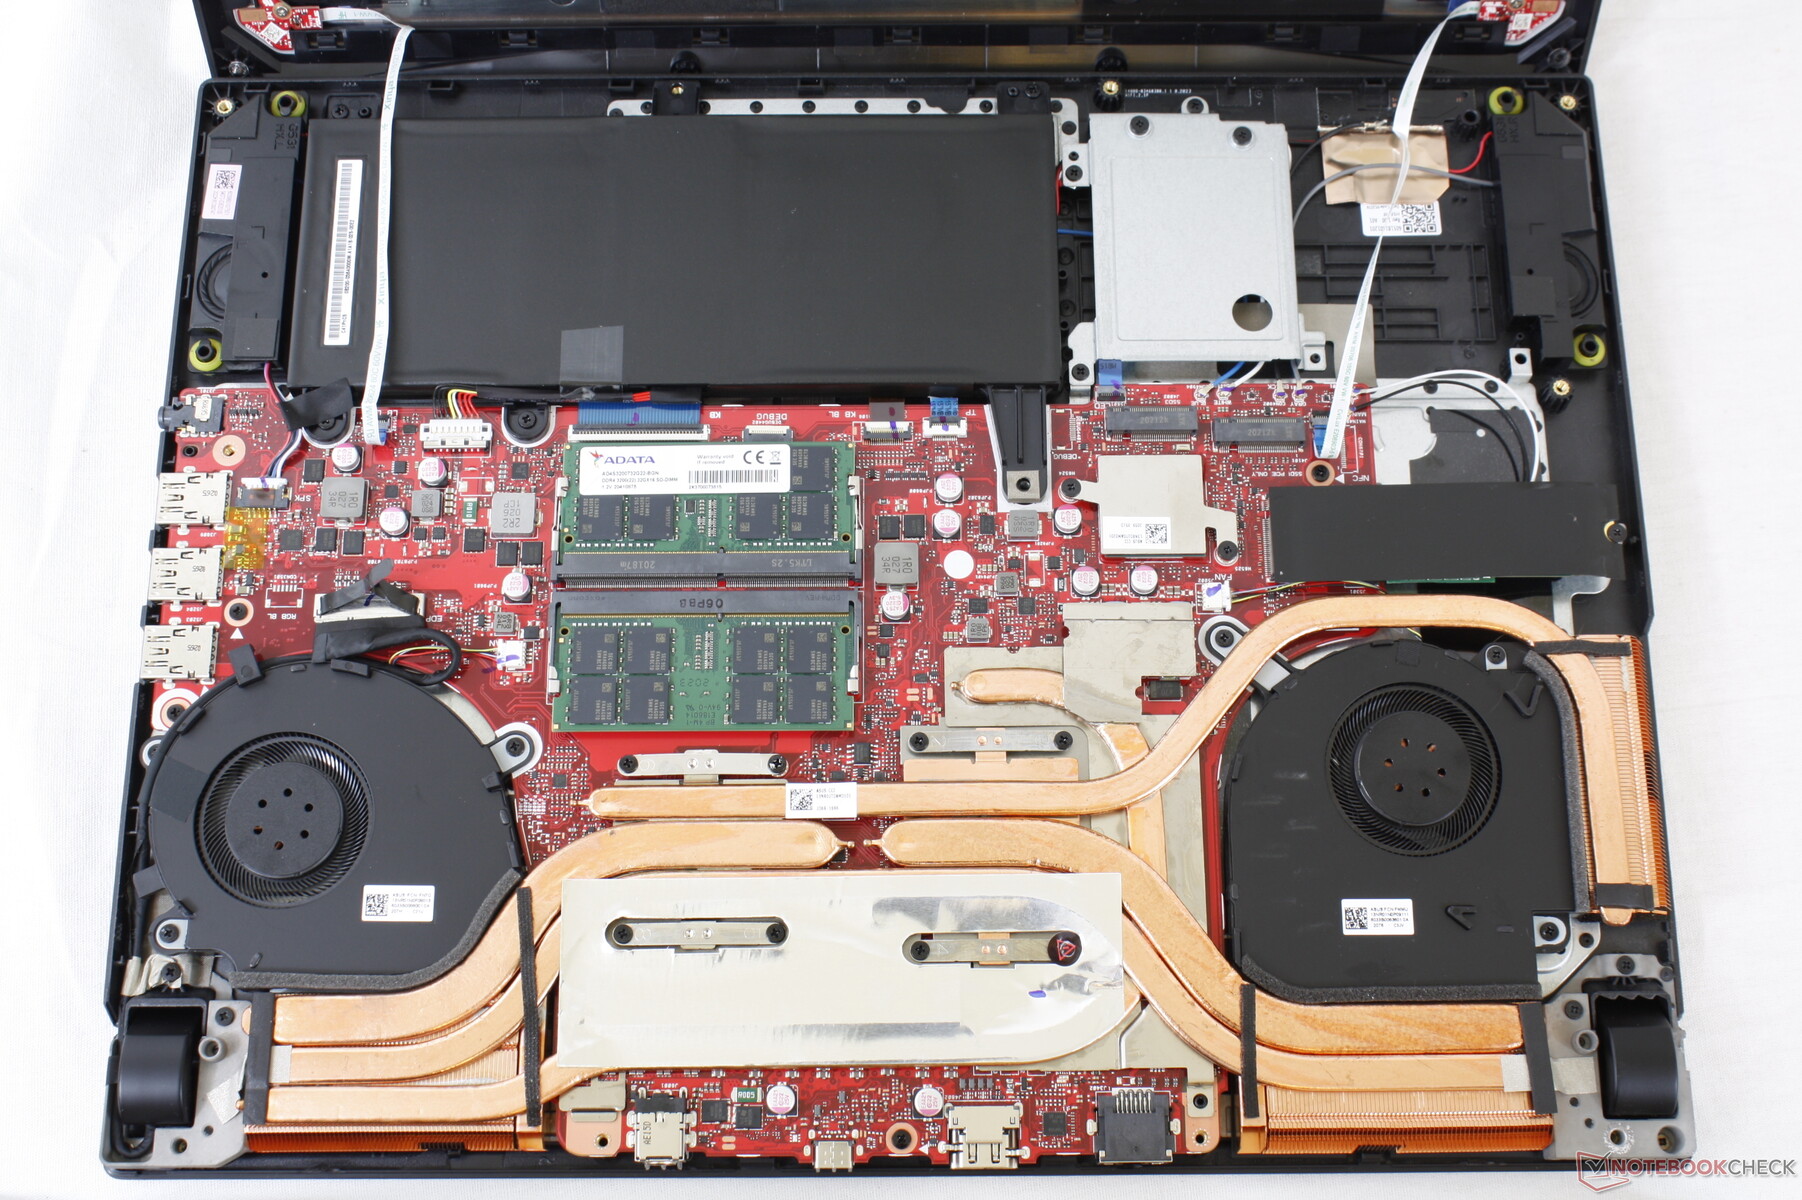
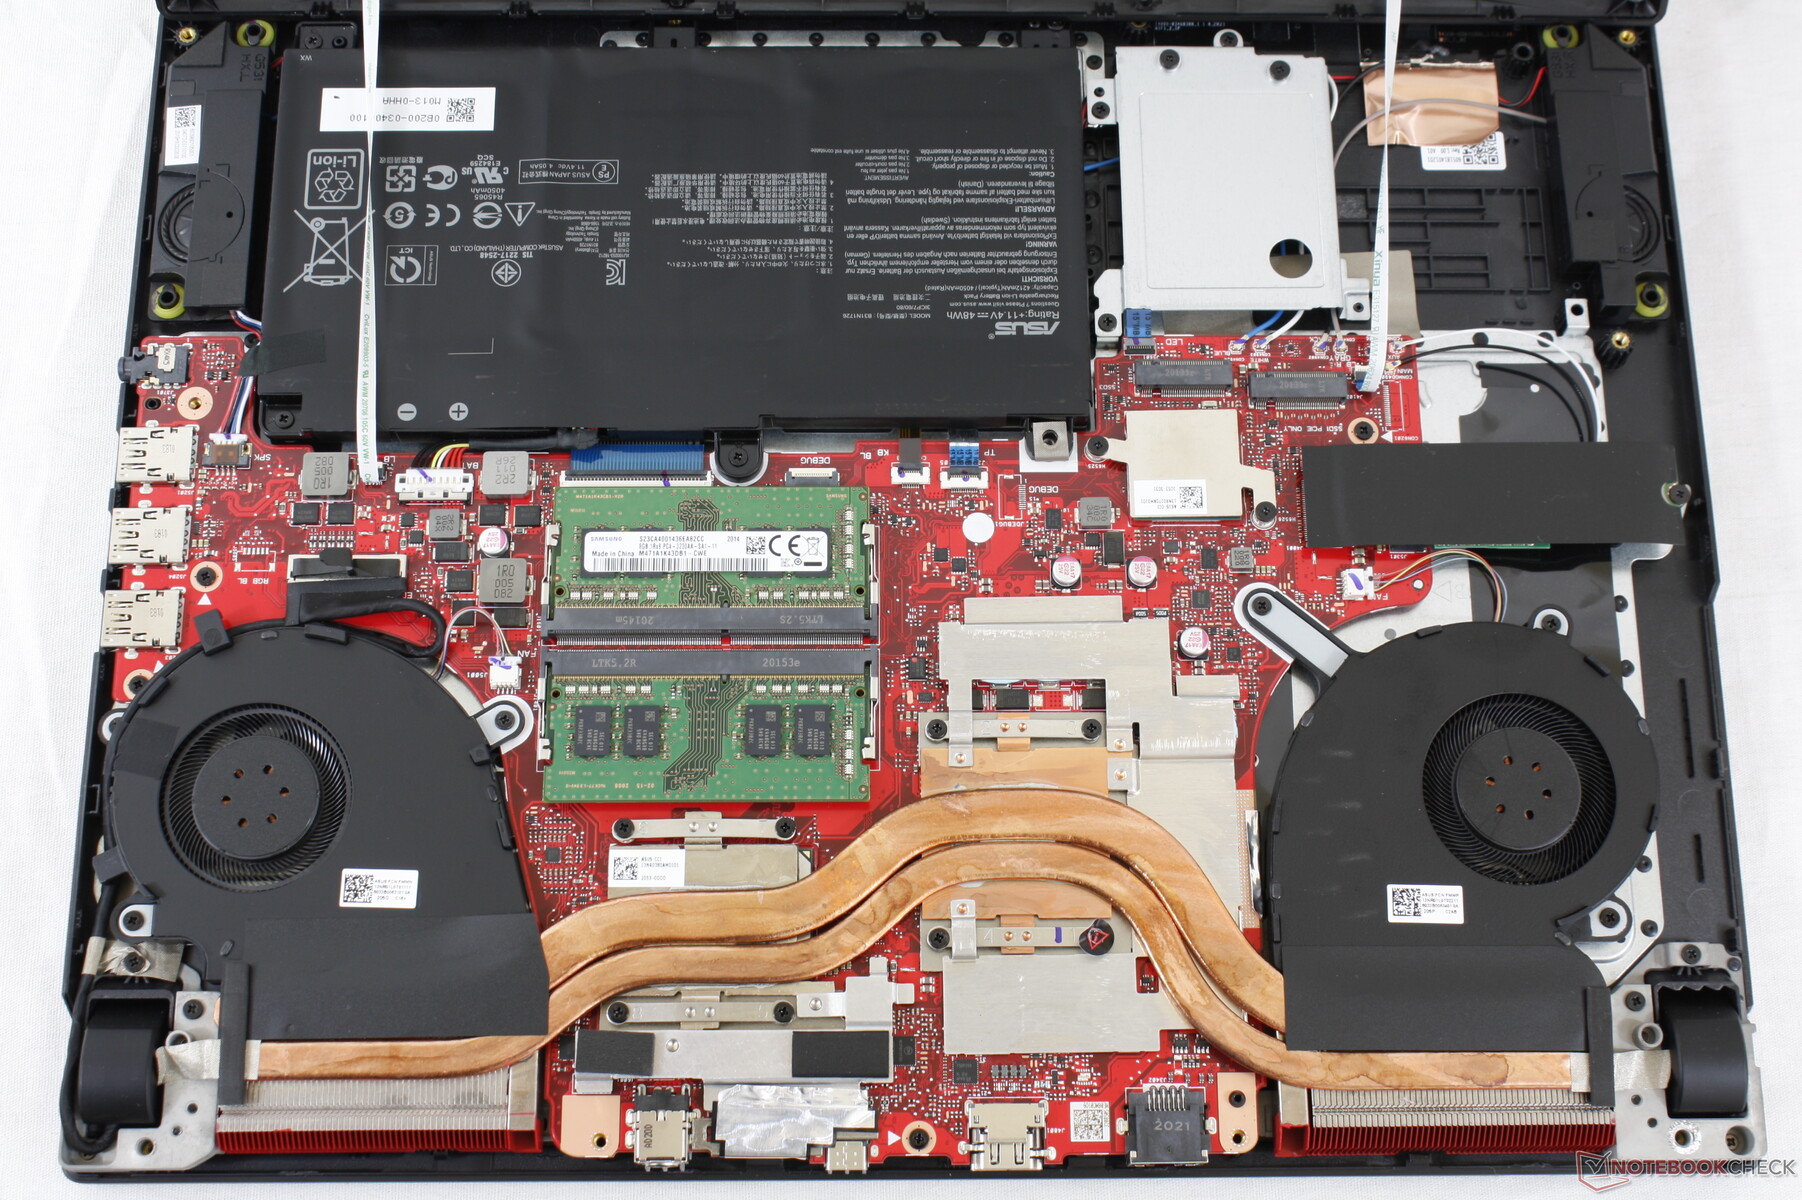
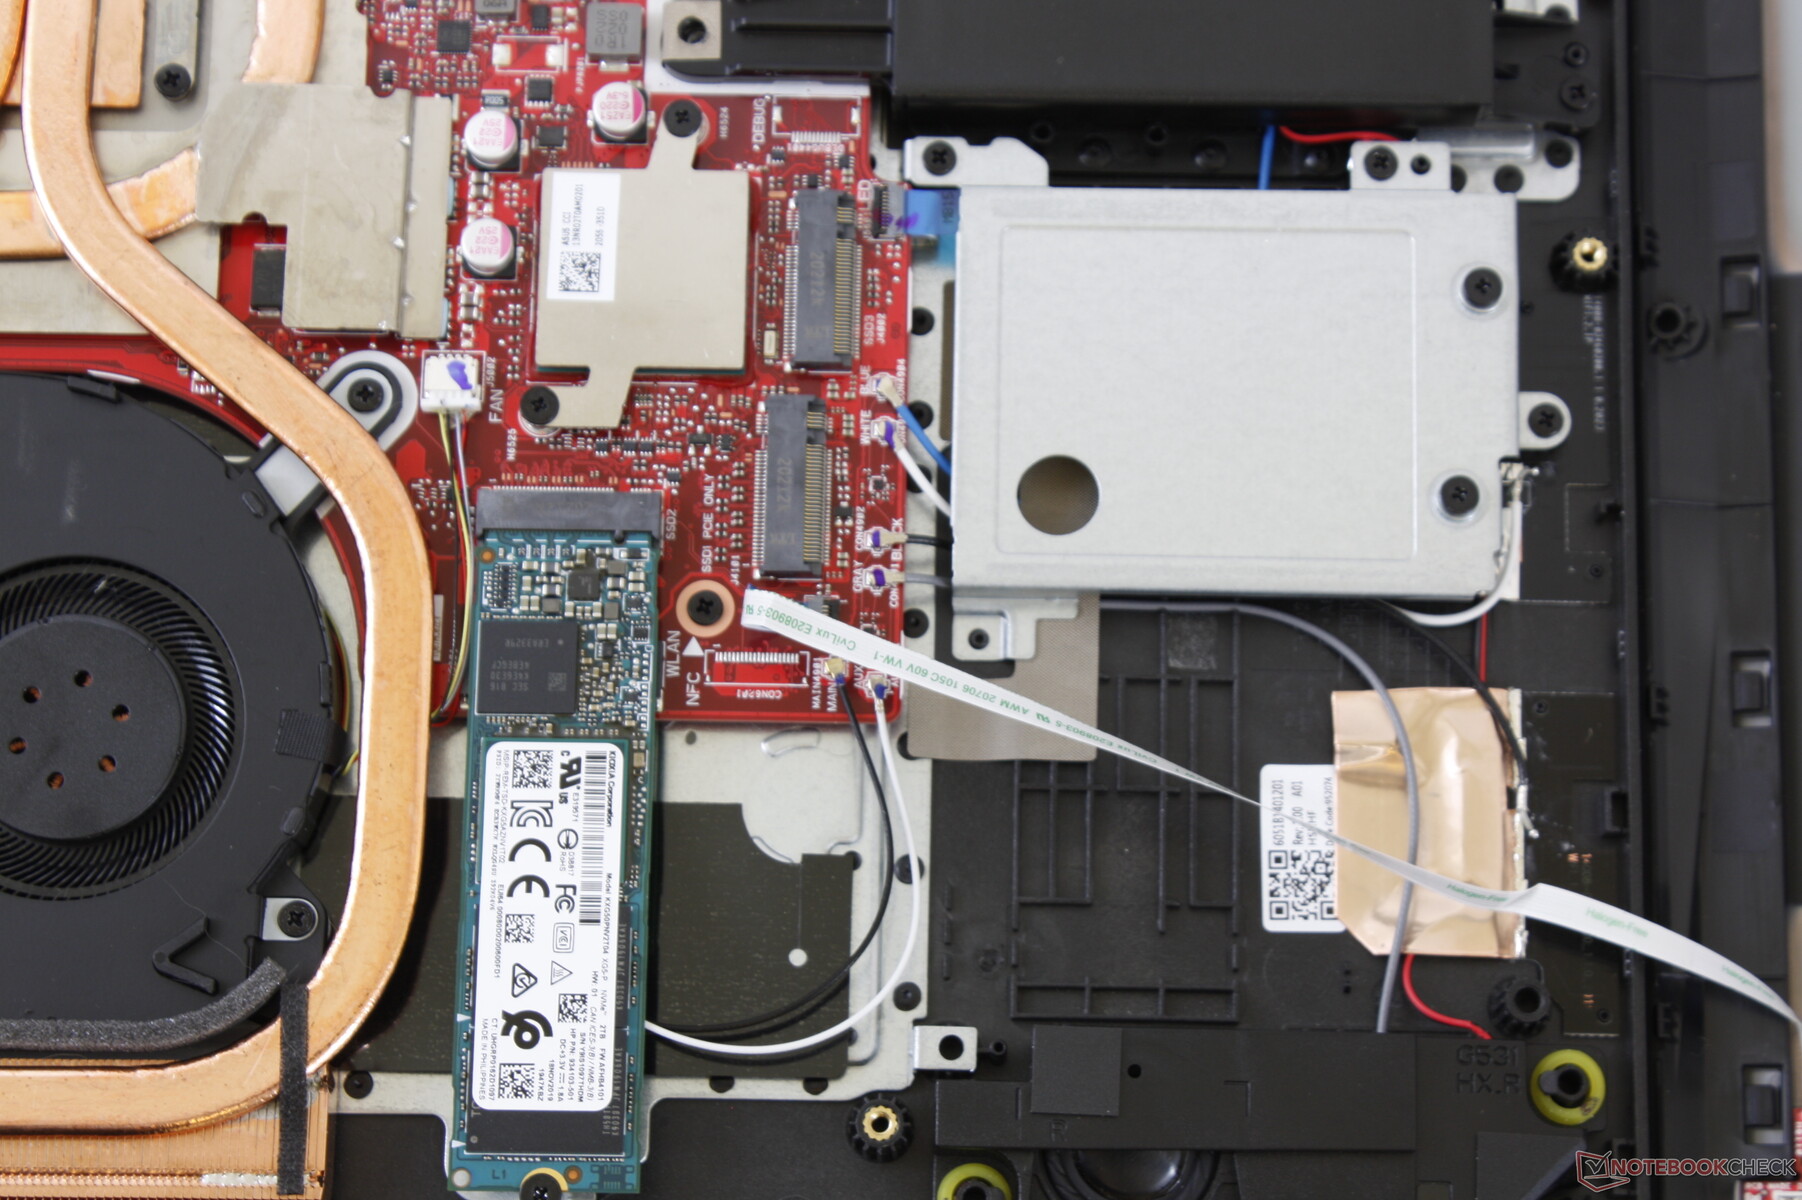
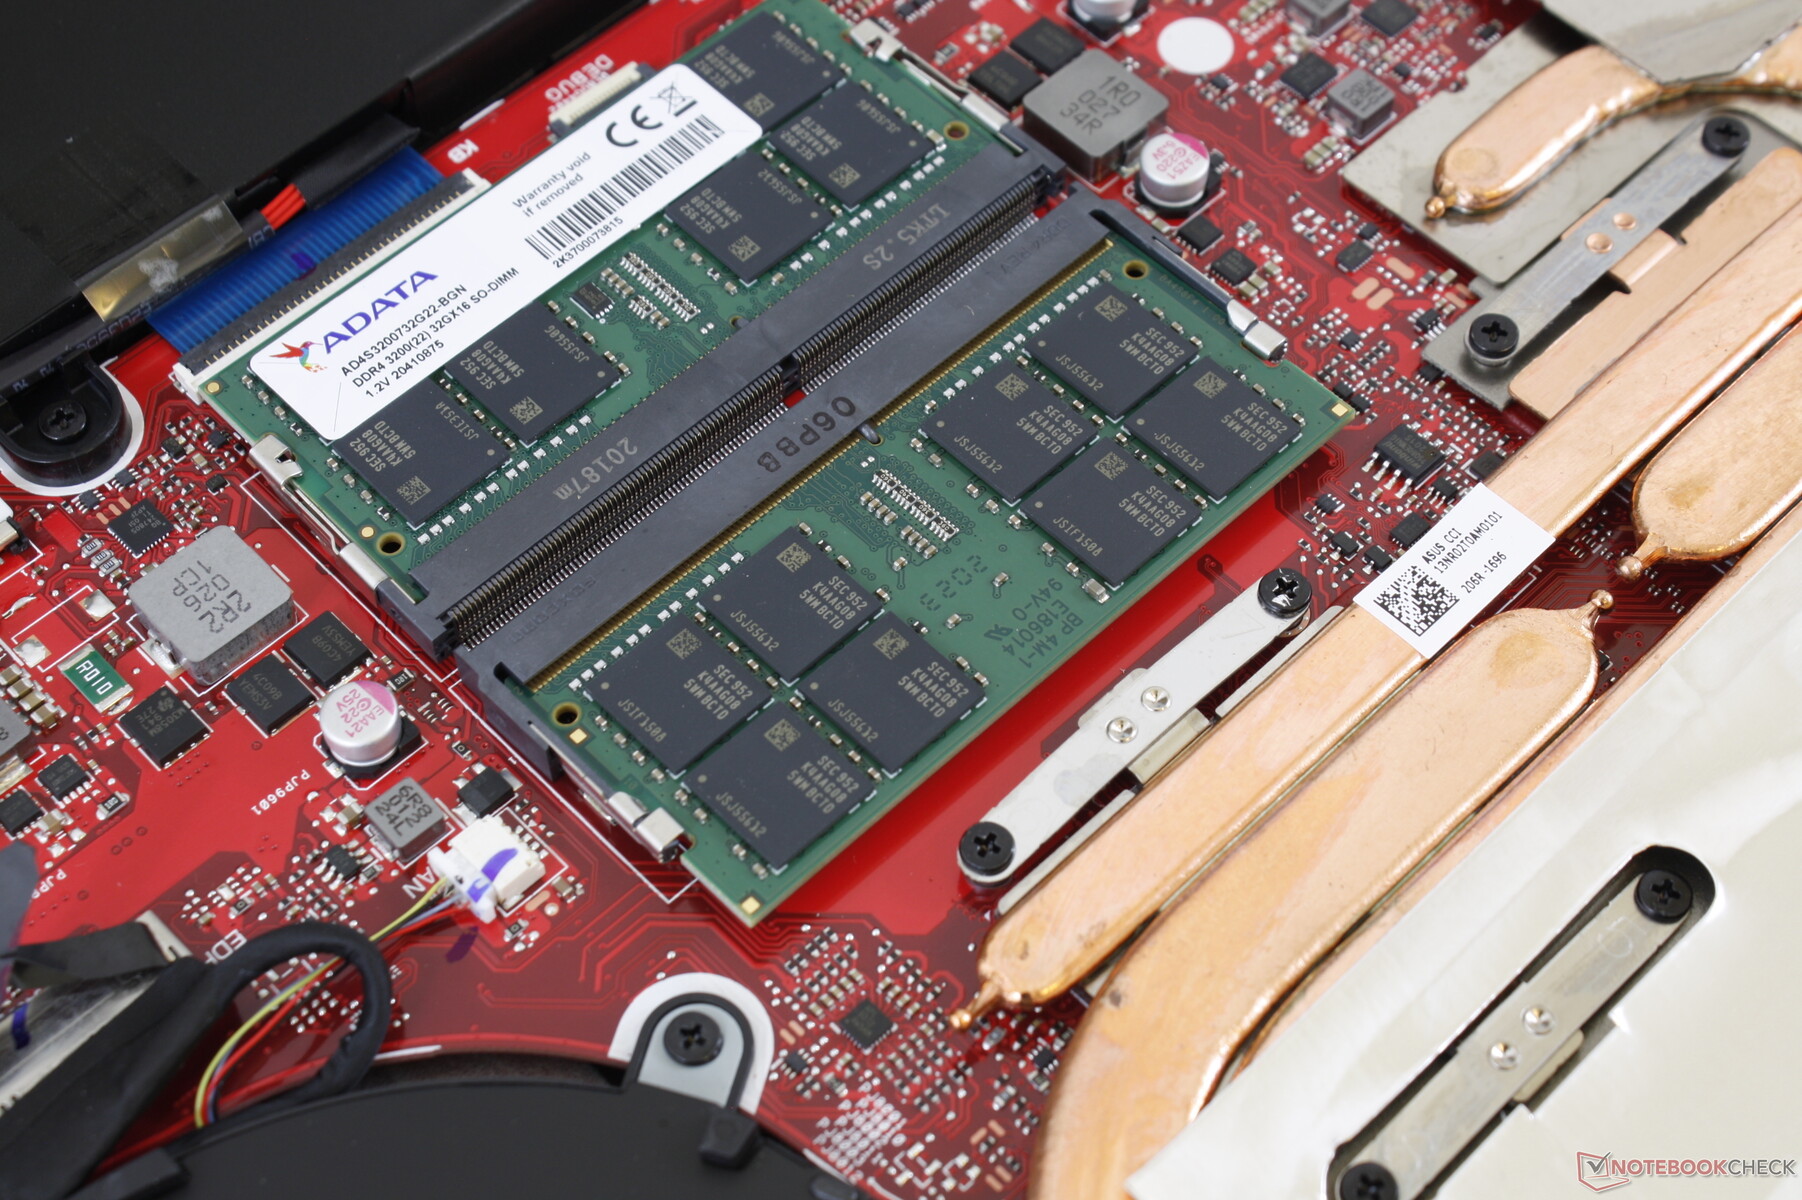
Manutenzione
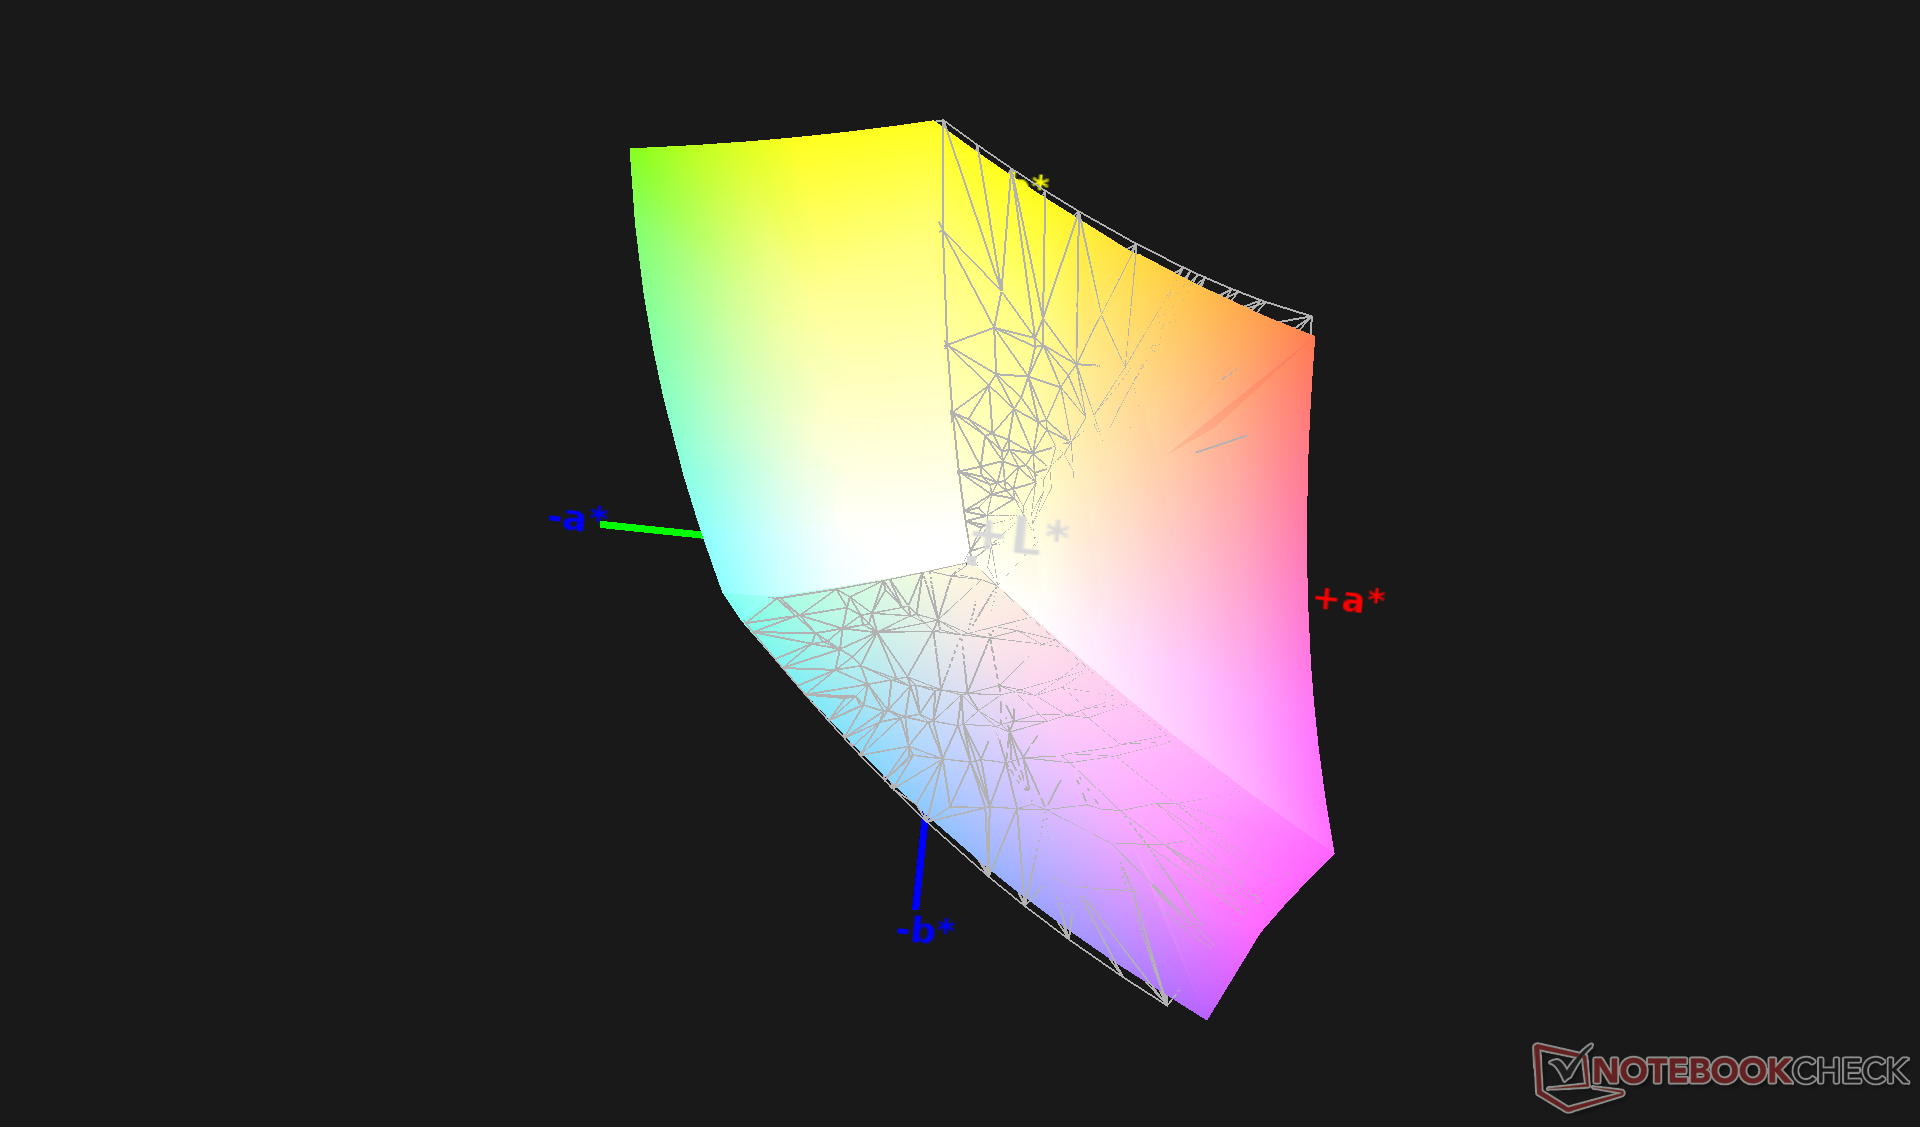
Display
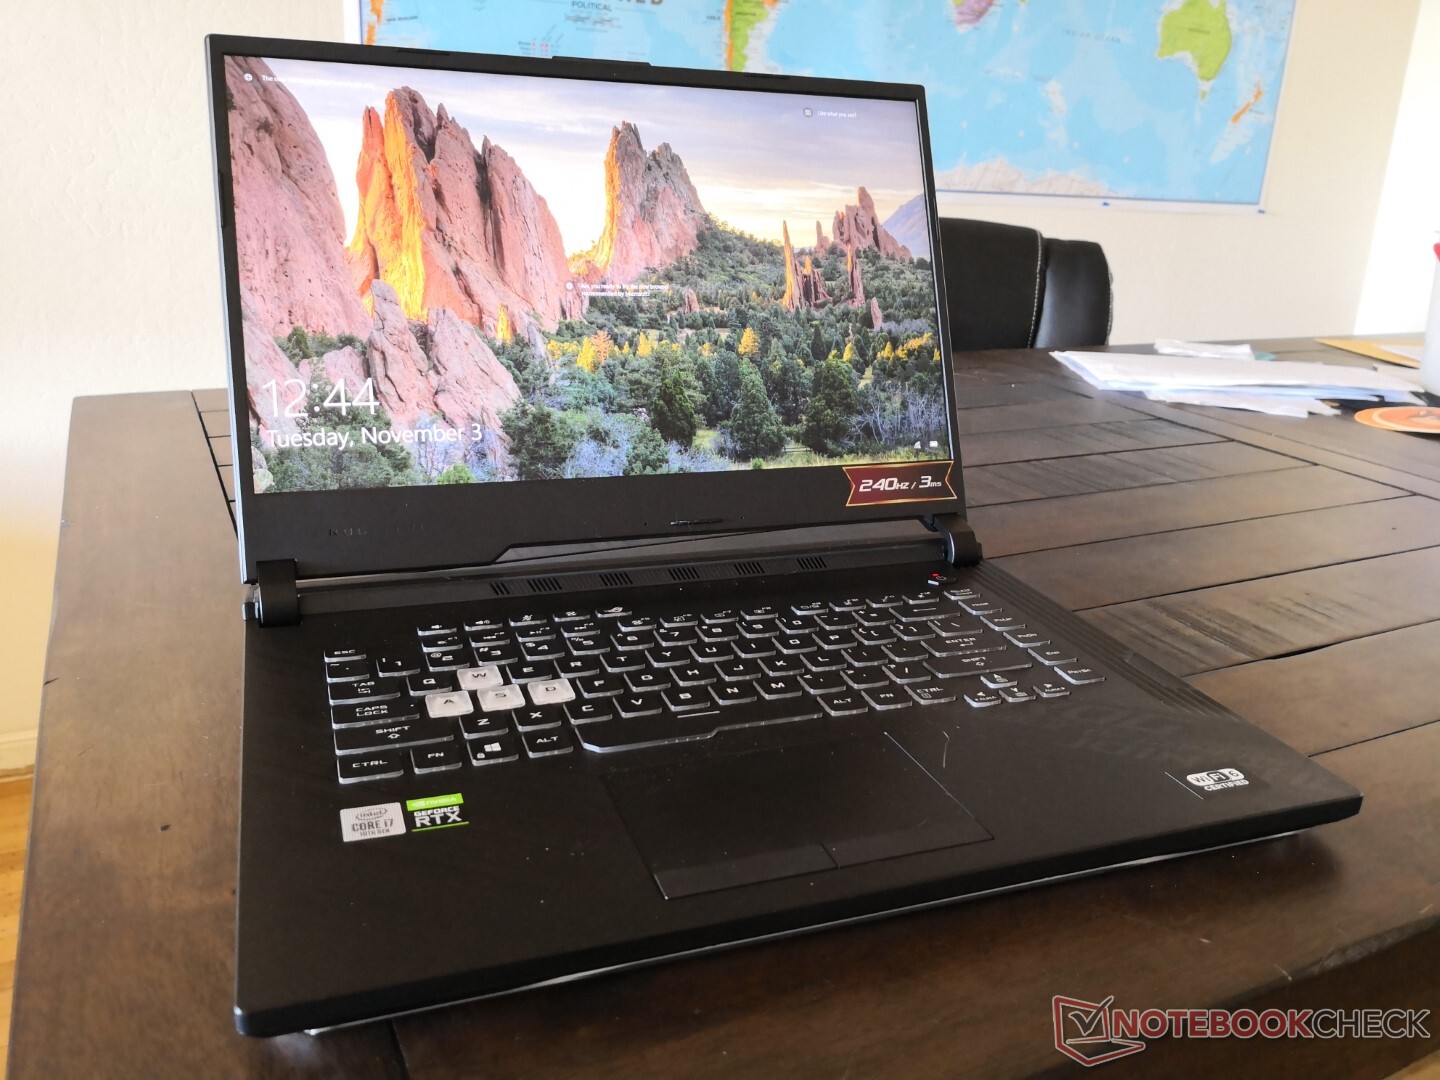
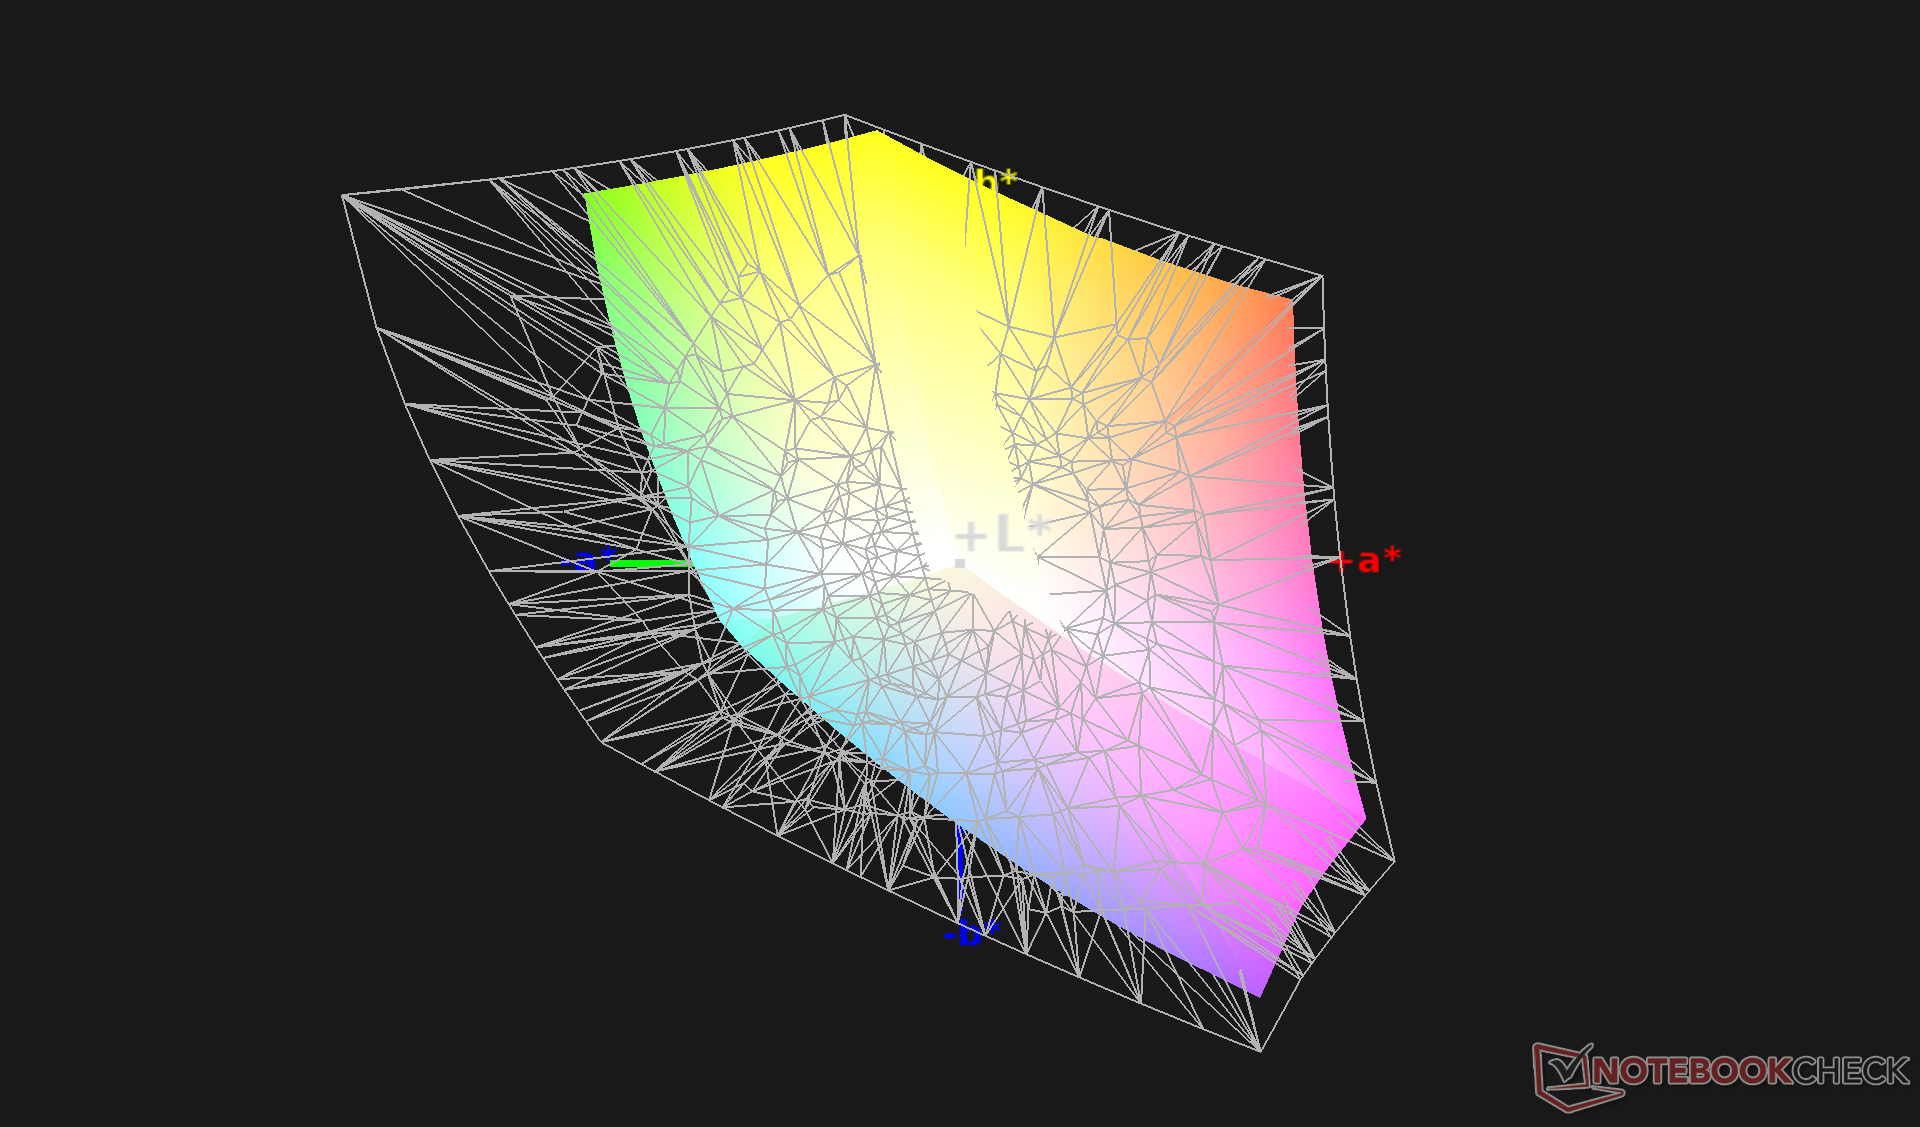
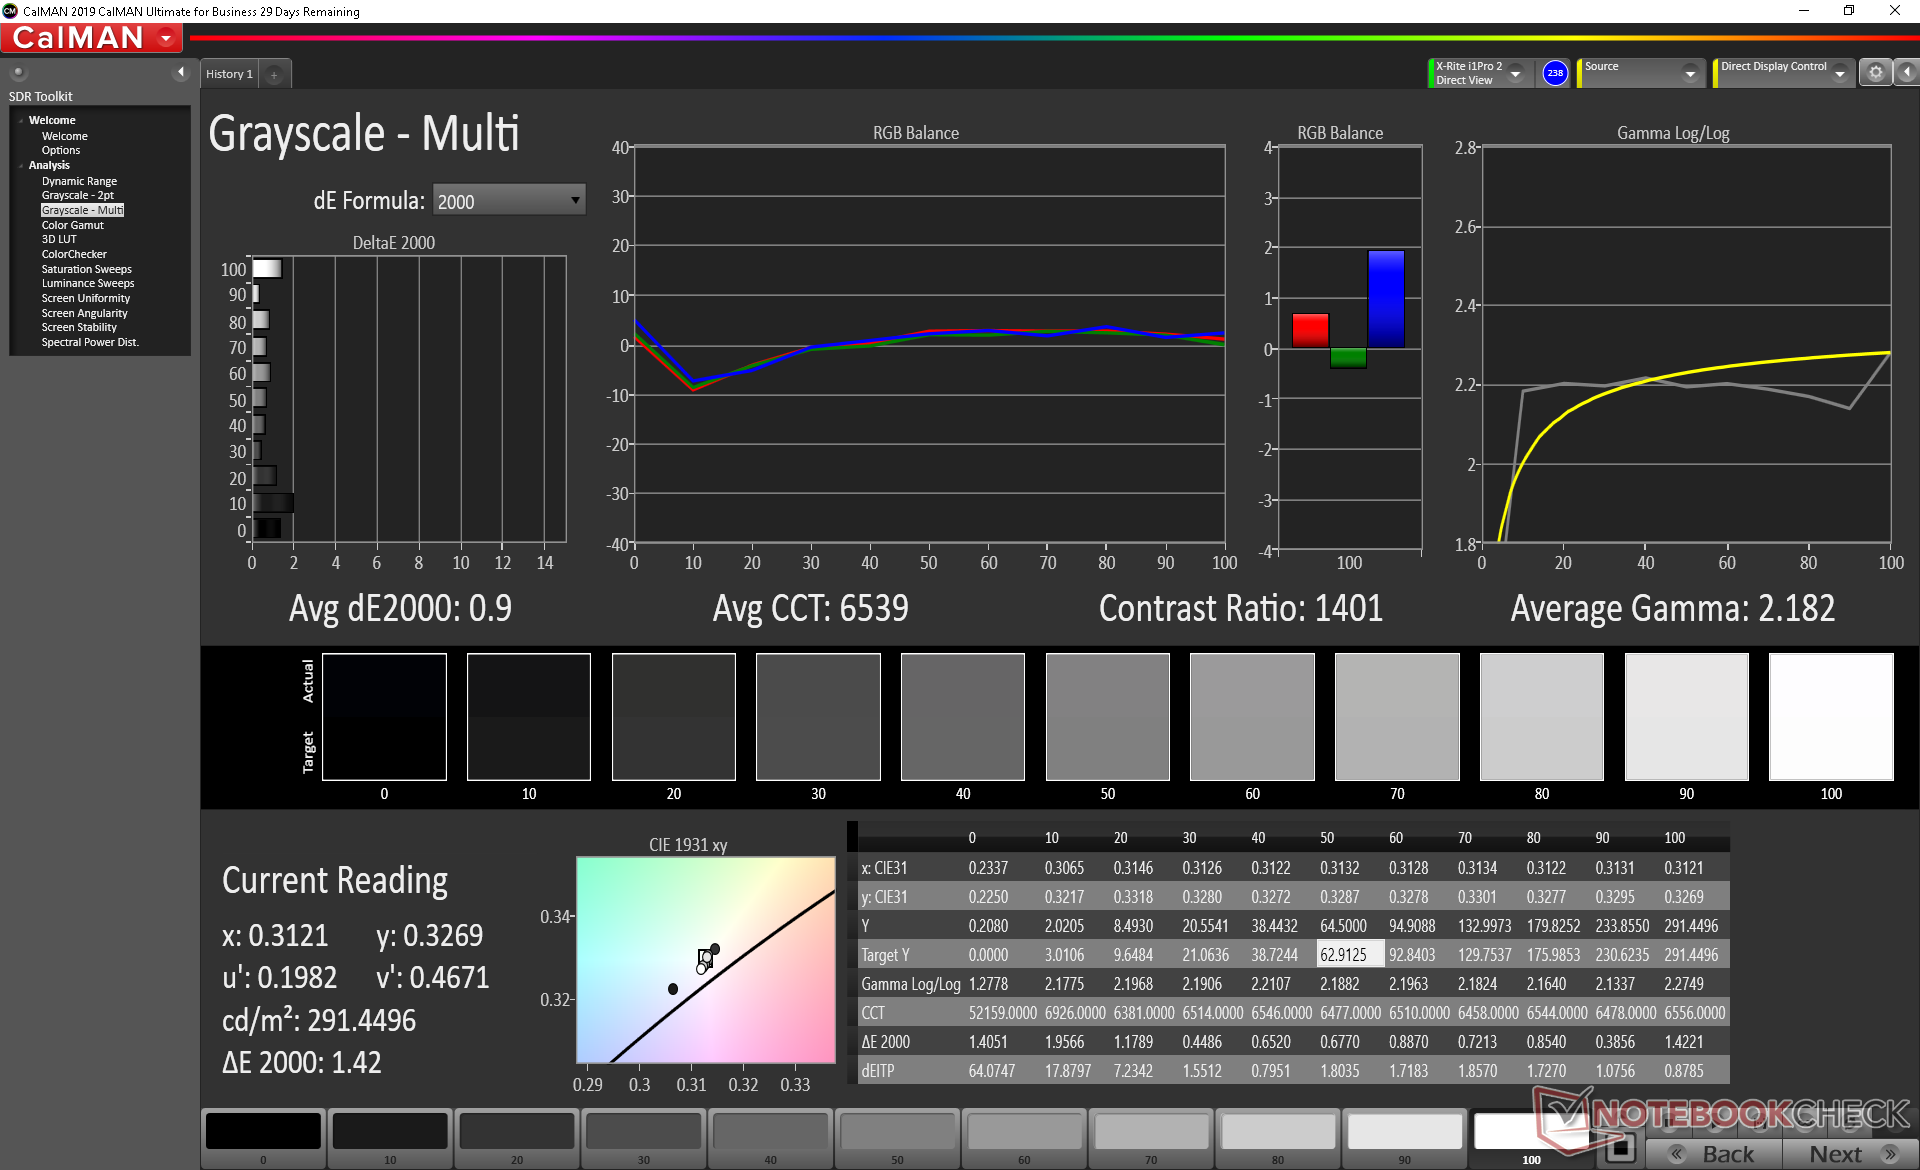
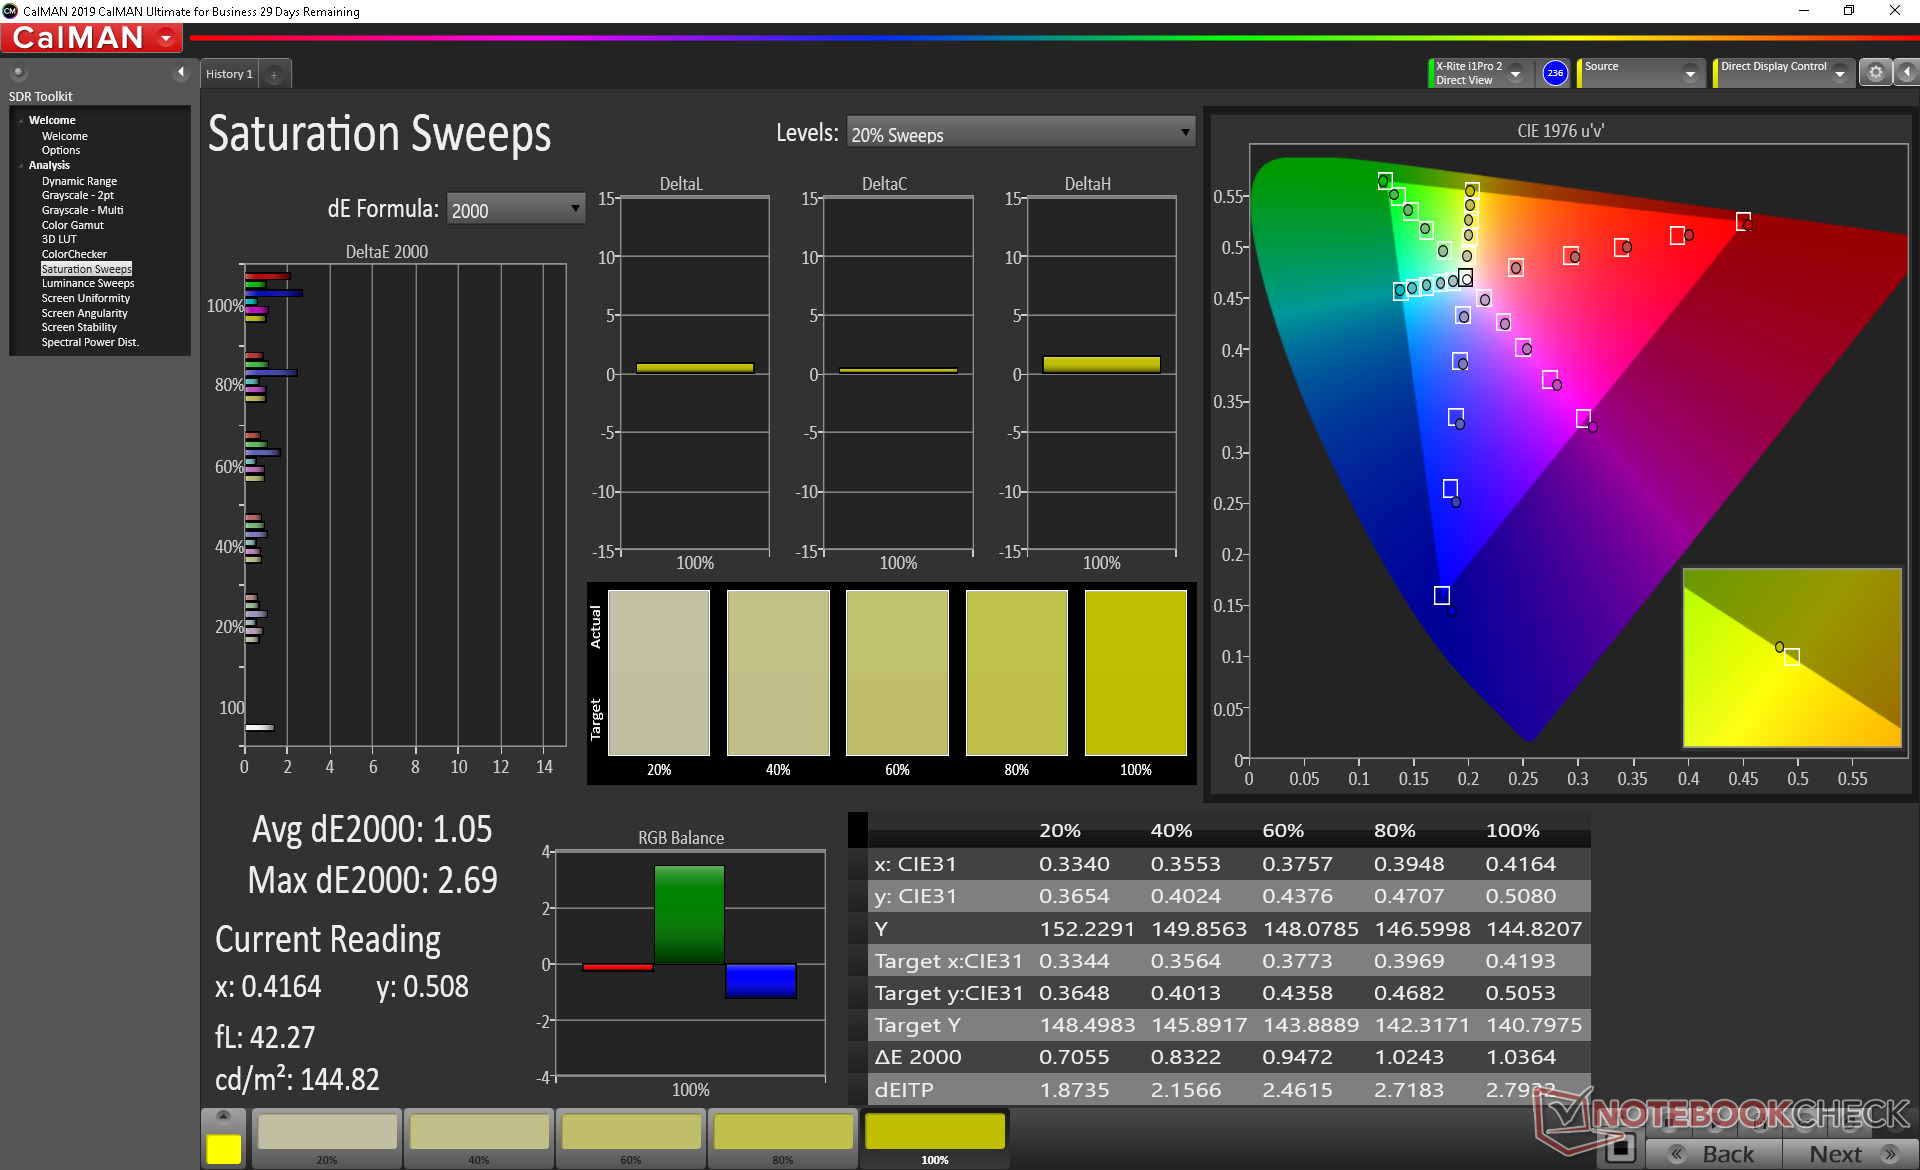
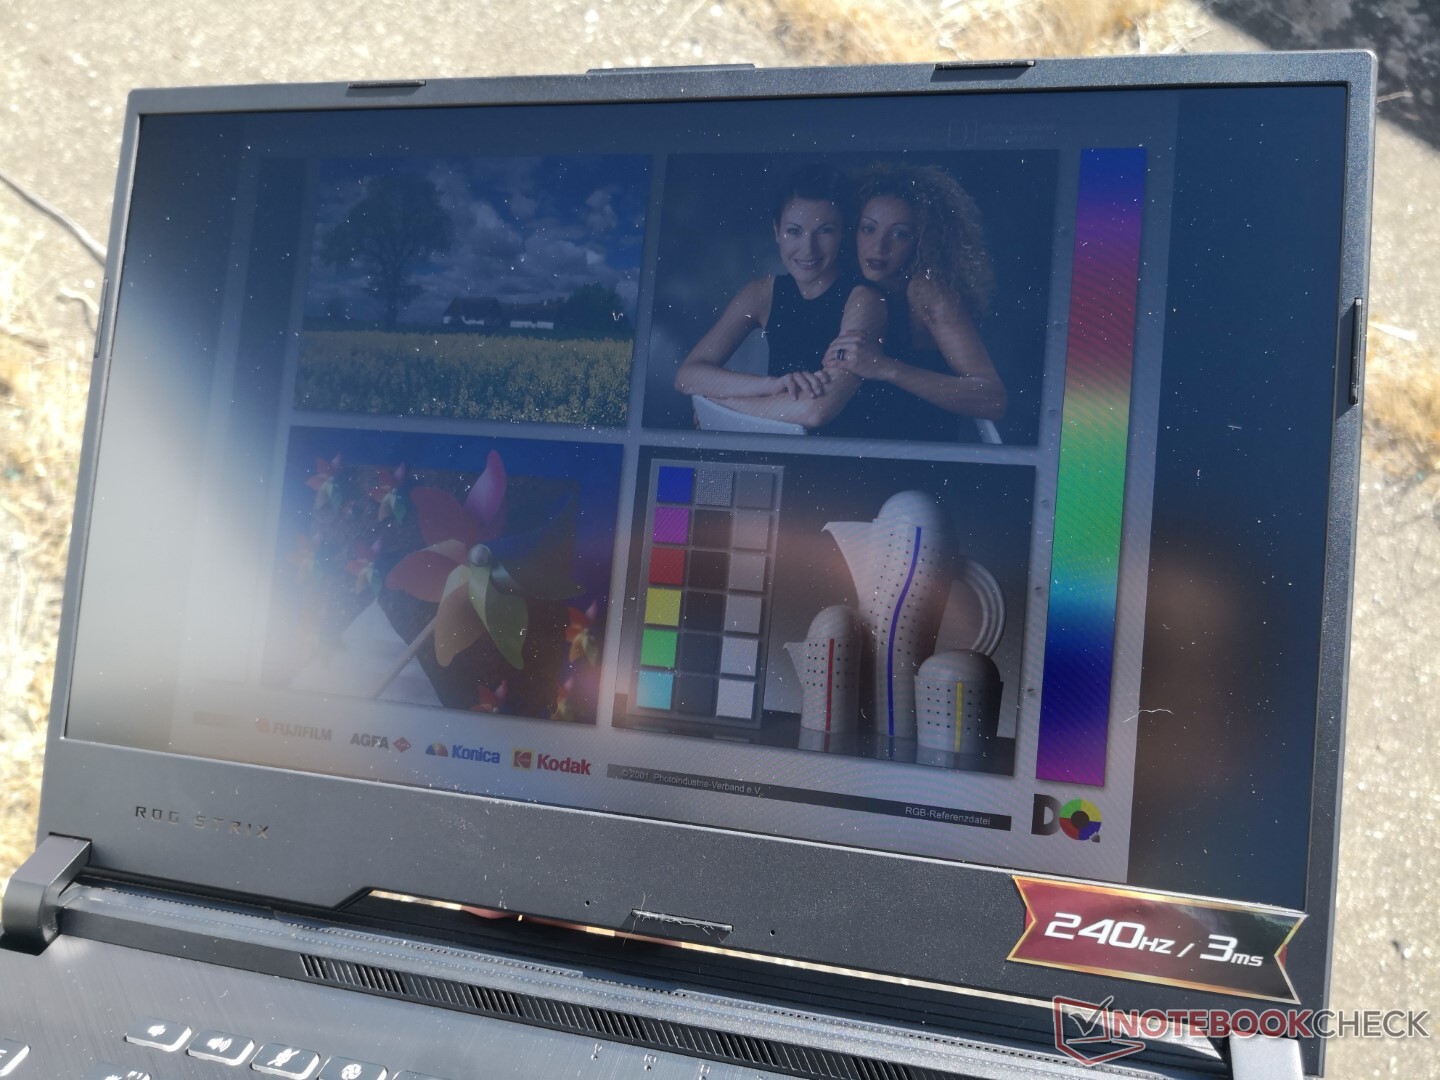
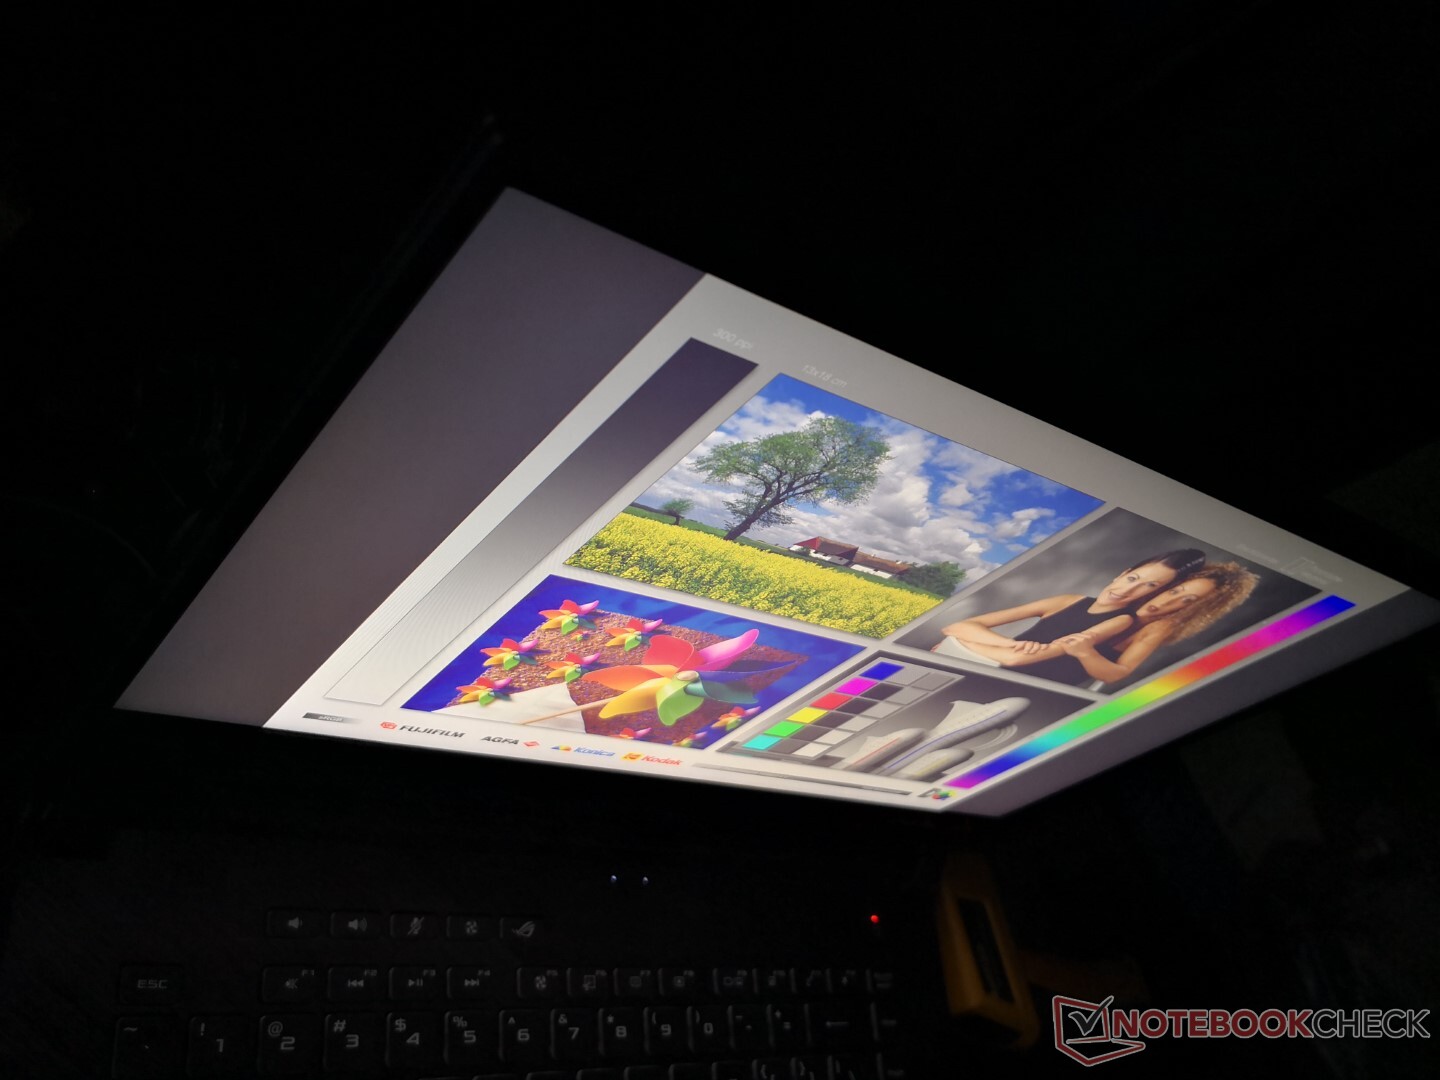
Il pannello Sharp da 240 Hz del nostro G512LW è superiore al pannello Panda a 144 Hz del più economico G512LI sotto ogni aspetto. La cosa più importante è che il contrasto, lo spazio di colore e i tempi di risposta in bianco e nero sono significativamente migliori per un'esperienza visiva che riflette il prezzo a quattro cifre. In passato ci siamo lamentati dei pannelli Panda e quindi è un sollievo non vederne uno in questo entusiasmante livello del G512LW.

| |||||||||||||||||||||||||
Distribuzione della luminosità: 92 %
Al centro con la batteria: 300.9 cd/m²
Contrasto: 971:1 (Nero: 0.31 cd/m²)
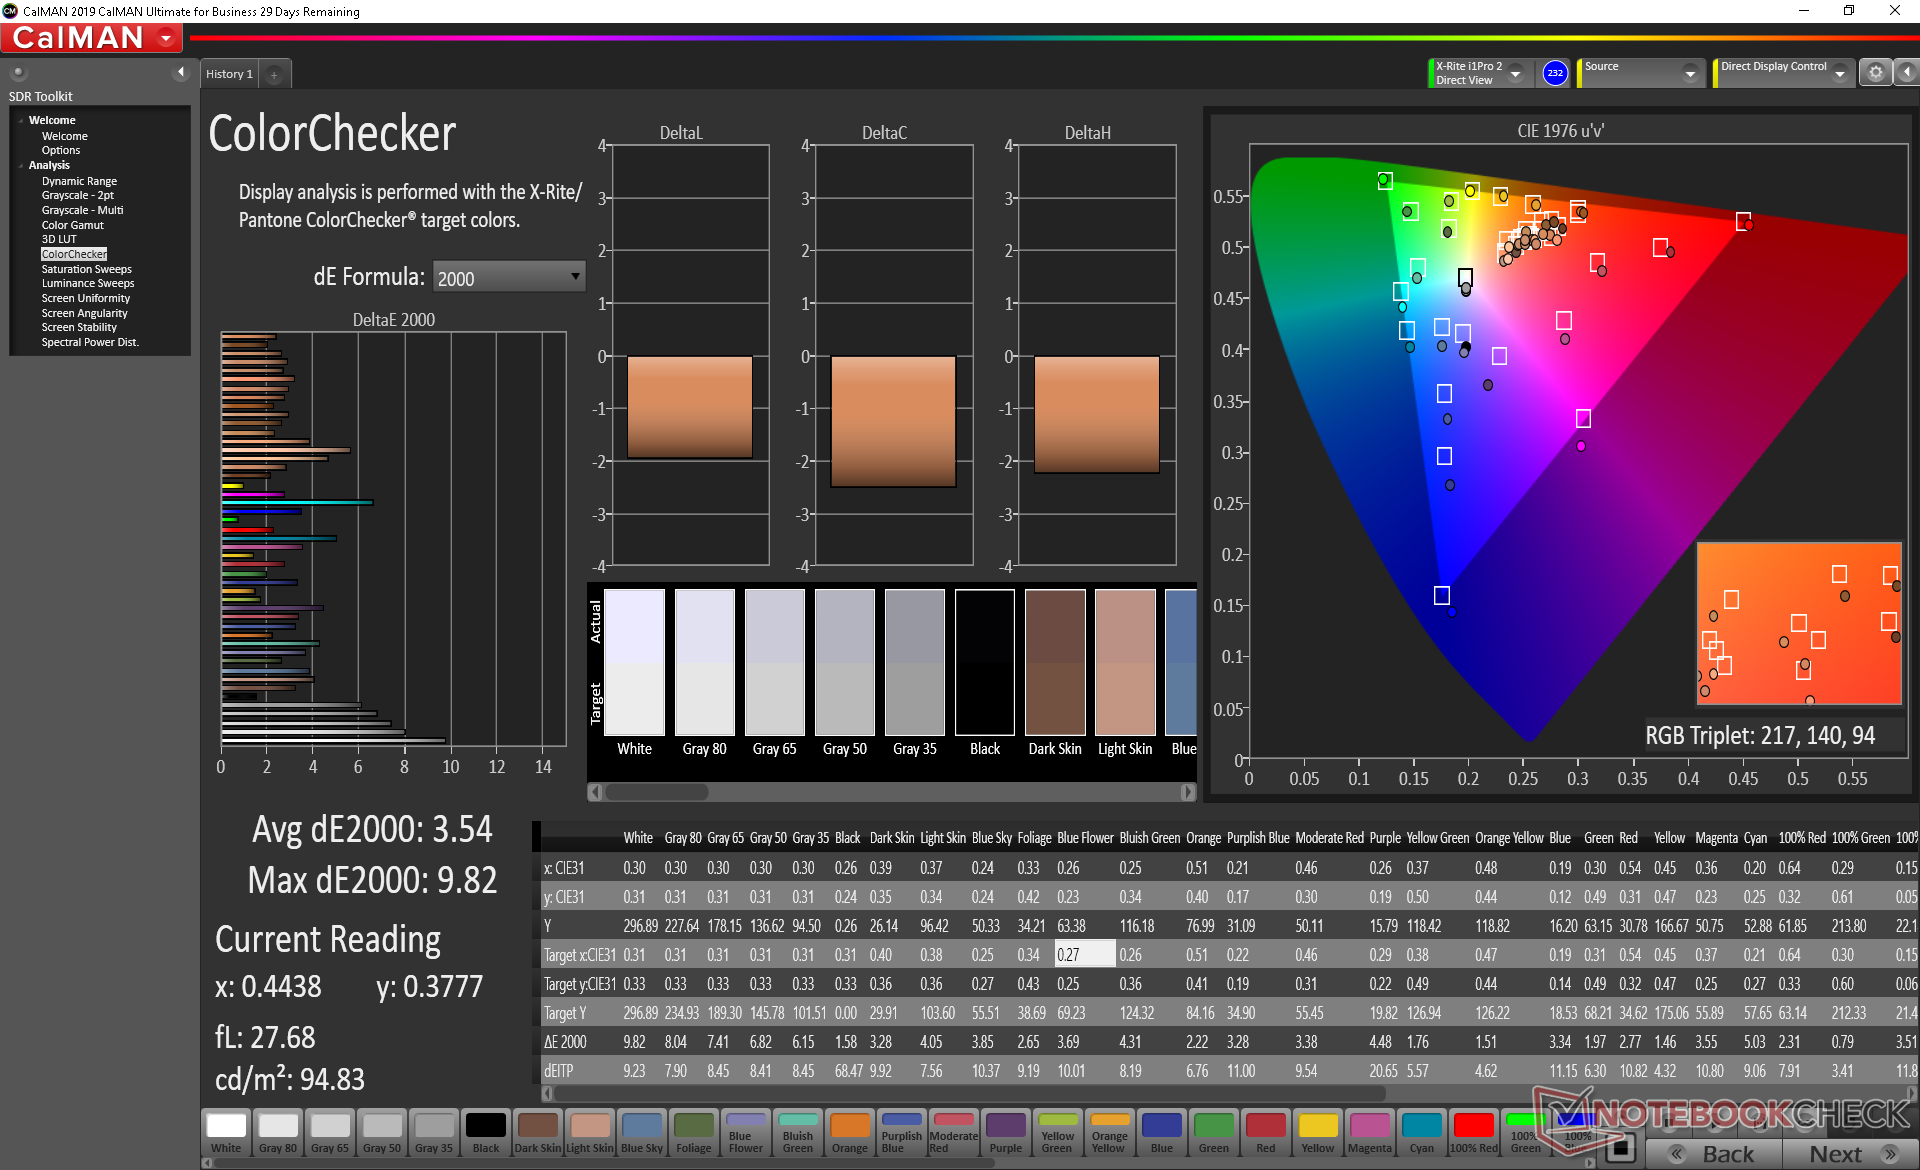
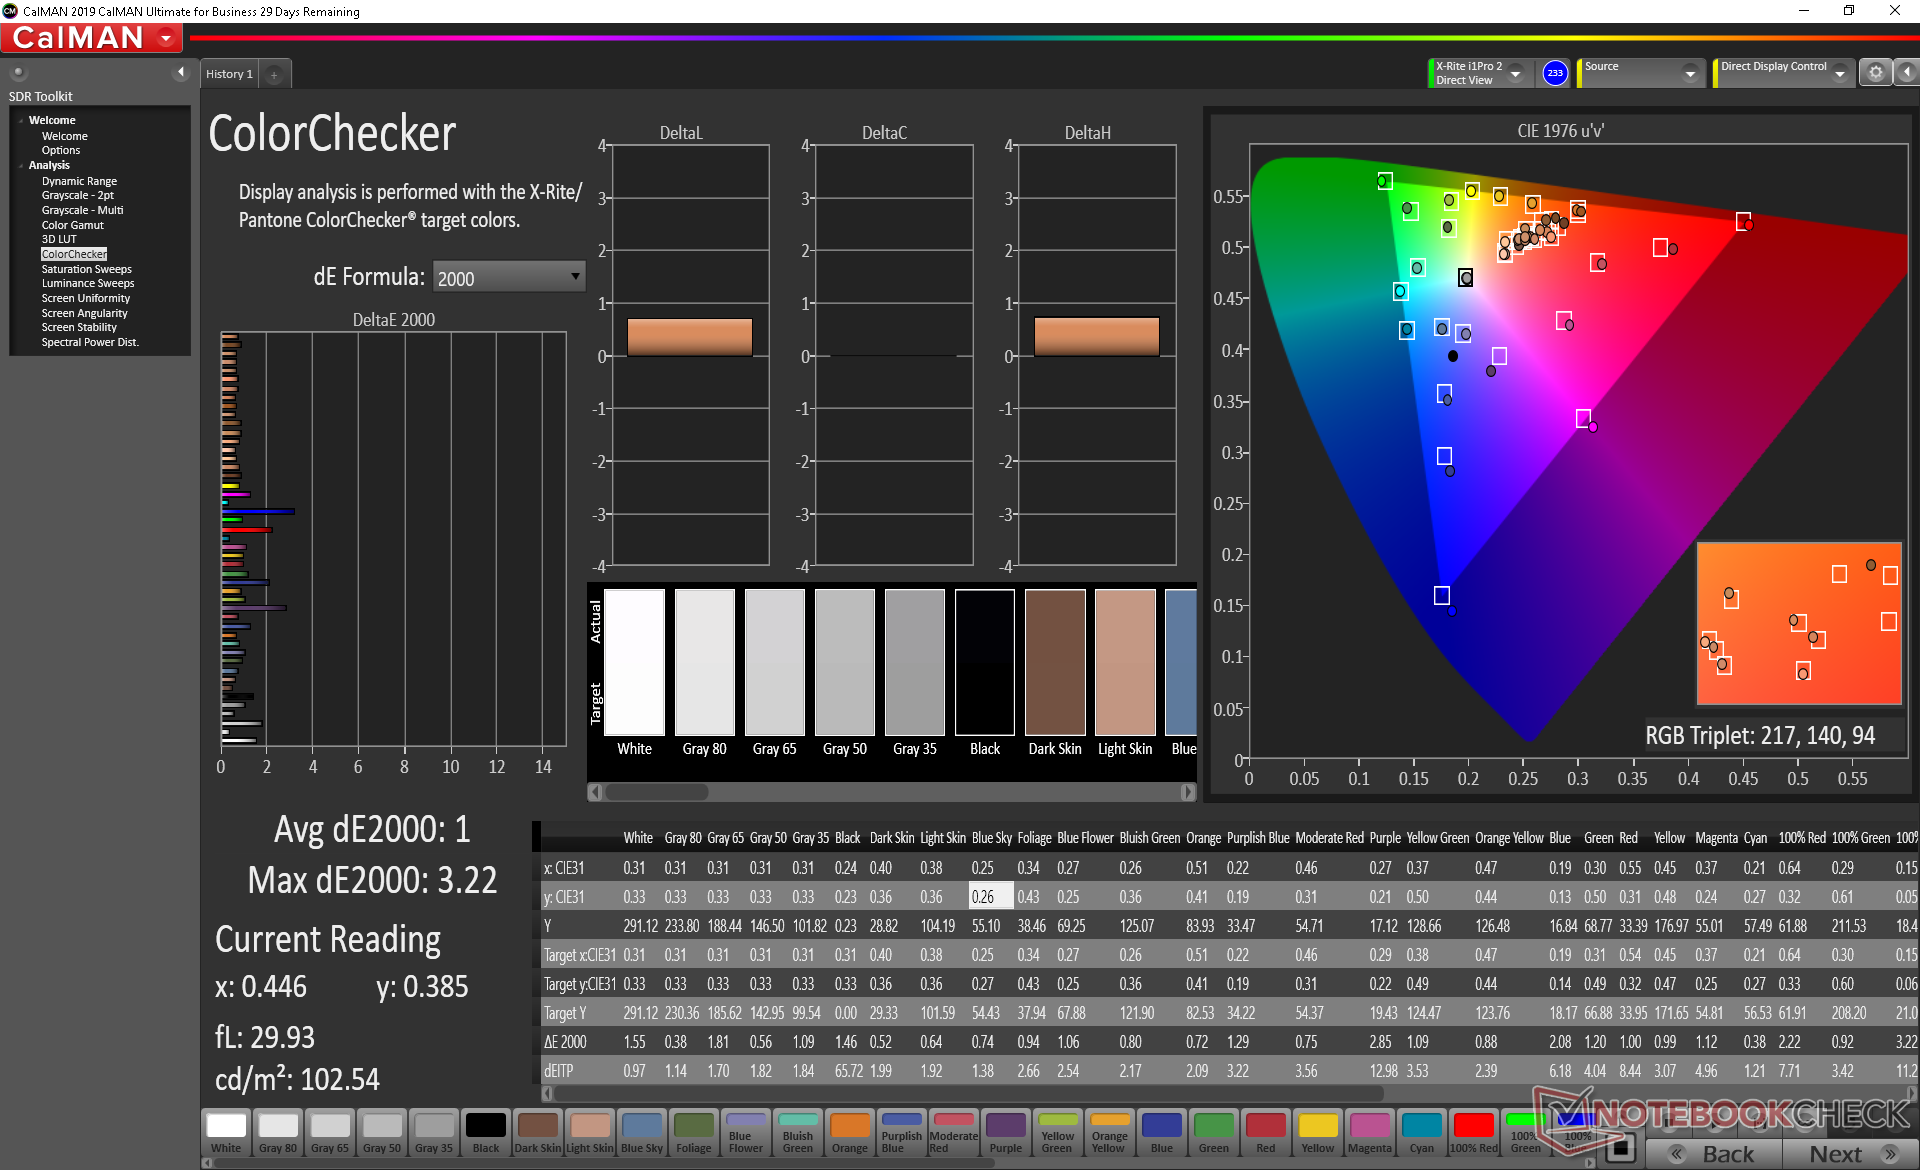
ΔE ColorChecker Calman: 3.54 | ∀{0.5-29.43 Ø4.72}
calibrated: 1
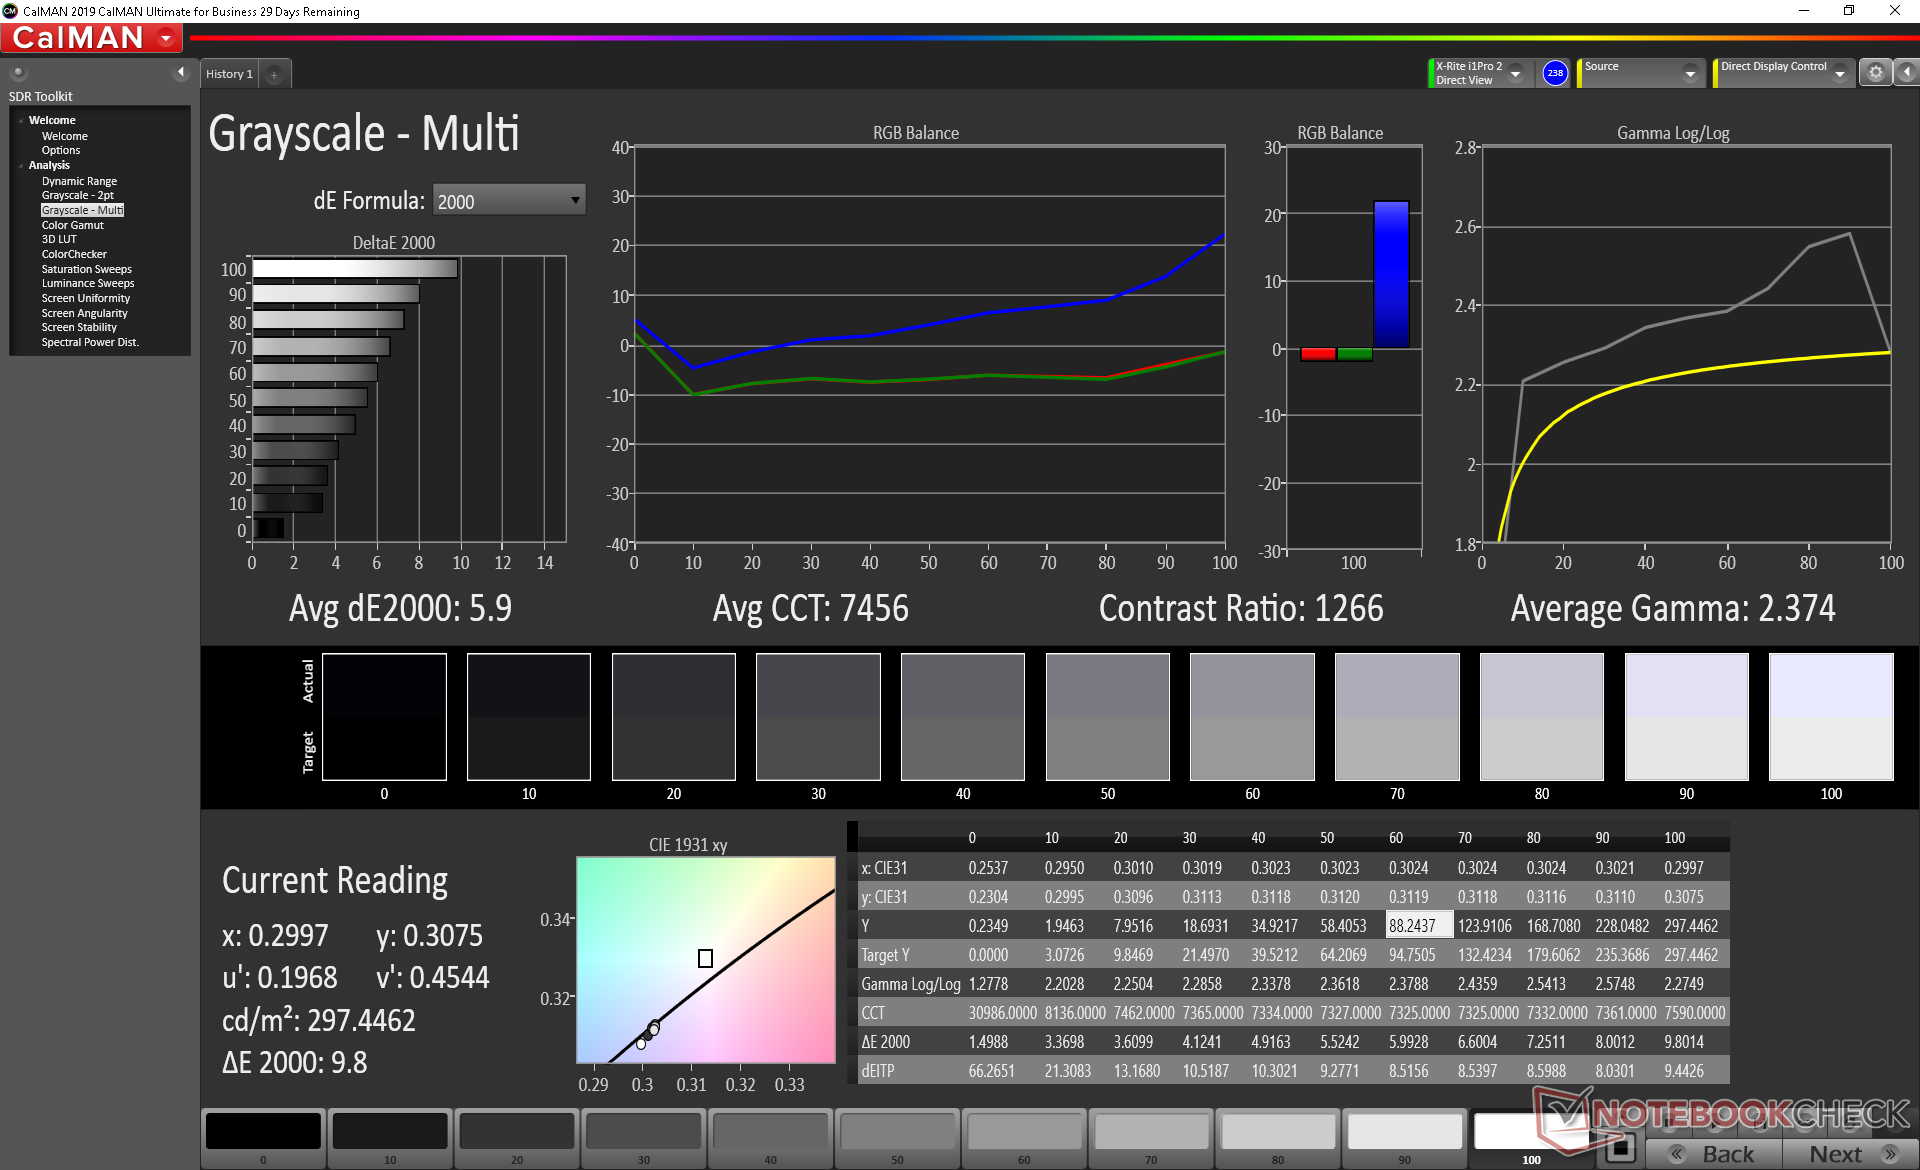
ΔE Greyscale Calman: 5.9 | ∀{0.09-98 Ø4.97}
98.3% sRGB (Argyll 1.6.3 3D)
63.3% AdobeRGB 1998 (Argyll 1.6.3 3D)
68.5% AdobeRGB 1998 (Argyll 3D)
98.3% sRGB (Argyll 3D)
67.8% Display P3 (Argyll 3D)
Gamma: 2.37
CCT: 7456 K
| Asus ROG Strix G15 G512LW Sharp LQ156M1JW09, IPS, 15.6", 1920x1080 | Asus ROG Strix G15 G512LI Panda LM156LF-2F01, IPS, 15.6", 1920x1080 | Razer Blade 15 RTX 2070 Super Max-Q AU Optronics B156HAN12.0, IPS, 15.6", 1920x1080 | MSI GP65 10SFK-047US LG Philips LP156WFG-SPB3, IPS, 15.6", 1920x1080 | Asus ROG Strix Scar 15 G532LWS AU Optronics B156HAN12.0, IPS, 15.6", 1920x1080 | Alienware m15 R3 P87F AU Optronics B156HAN, IPS, 15.6", 1920x1080 | |
|---|---|---|---|---|---|---|
| Display | -40% | 2% | -5% | 3% | 1% | |
| Display P3 Coverage (%) | 67.8 | 39.73 -41% | 69.4 2% | 63.5 -6% | 69.9 3% | 68.6 1% |
| sRGB Coverage (%) | 98.3 | 59.8 -39% | 98.8 1% | 94.4 -4% | 99.6 1% | 98.9 1% |
| AdobeRGB 1998 Coverage (%) | 68.5 | 41.06 -40% | 70.5 3% | 65.1 -5% | 71.4 4% | 69.8 2% |
| Response Times | -138% | 52% | 10% | 11% | 36% | |
| Response Time Grey 50% / Grey 80% * (ms) | 16 ? | 33.6 ? -110% | 3.2 ? 80% | 10.4 ? 35% | 14.4 ? 10% | 4 ? 75% |
| Response Time Black / White * (ms) | 10.4 ? | 27.6 ? -165% | 8 ? 23% | 12 ? -15% | 9.2 ? 12% | 10.8 ? -4% |
| PWM Frequency (Hz) | 23580 ? | |||||
| Screen | -57% | 3% | -8% | 22% | 7% | |
| Brightness middle (cd/m²) | 300.9 | 271.2 -10% | 345.4 15% | 384.9 28% | 307.2 2% | 326.7 9% |
| Brightness (cd/m²) | 289 | 252 -13% | 342 18% | 358 24% | 301 4% | 316 9% |
| Brightness Distribution (%) | 92 | 79 -14% | 90 -2% | 87 -5% | 91 -1% | 87 -5% |
| Black Level * (cd/m²) | 0.31 | 0.53 -71% | 0.34 -10% | 0.67 -116% | 0.21 32% | 0.33 -6% |
| Contrast (:1) | 971 | 512 -47% | 1016 5% | 574 -41% | 1463 51% | 990 2% |
| Colorchecker dE 2000 * | 3.54 | 5.04 -42% | 3.18 10% | 2.43 31% | 1.85 48% | 2.4 32% |
| Colorchecker dE 2000 max. * | 9.82 | 16.07 -64% | 6.57 33% | 4.58 53% | 3.92 60% | 6.06 38% |
| Colorchecker dE 2000 calibrated * | 1 | 4.26 -326% | 1.77 -77% | 2.03 -103% | 1.26 -26% | 1.51 -51% |
| Greyscale dE 2000 * | 5.9 | 3.4 42% | 3.8 36% | 2.6 56% | 2 66% | 3.2 46% |
| Gamma | 2.37 93% | 2.09 105% | 2.15 102% | 2.2 100% | 2.15 102% | 2.13 103% |
| CCT | 7456 87% | 7079 92% | 7109 91% | 6981 93% | 6479 100% | 7129 91% |
| Color Space (Percent of AdobeRGB 1998) (%) | 63.3 | 37.8 -40% | 64.3 2% | 59.7 -6% | 65 3% | 63.7 1% |
| Color Space (Percent of sRGB) (%) | 98.3 | 59.5 -39% | 99 1% | 93.9 -4% | 99.7 1% | 99.2 1% |
| Media totale (Programma / Settaggio) | -78% /
-64% | 19% /
9% | -1% /
-5% | 12% /
17% | 15% /
9% |
* ... Meglio usare valori piccoli
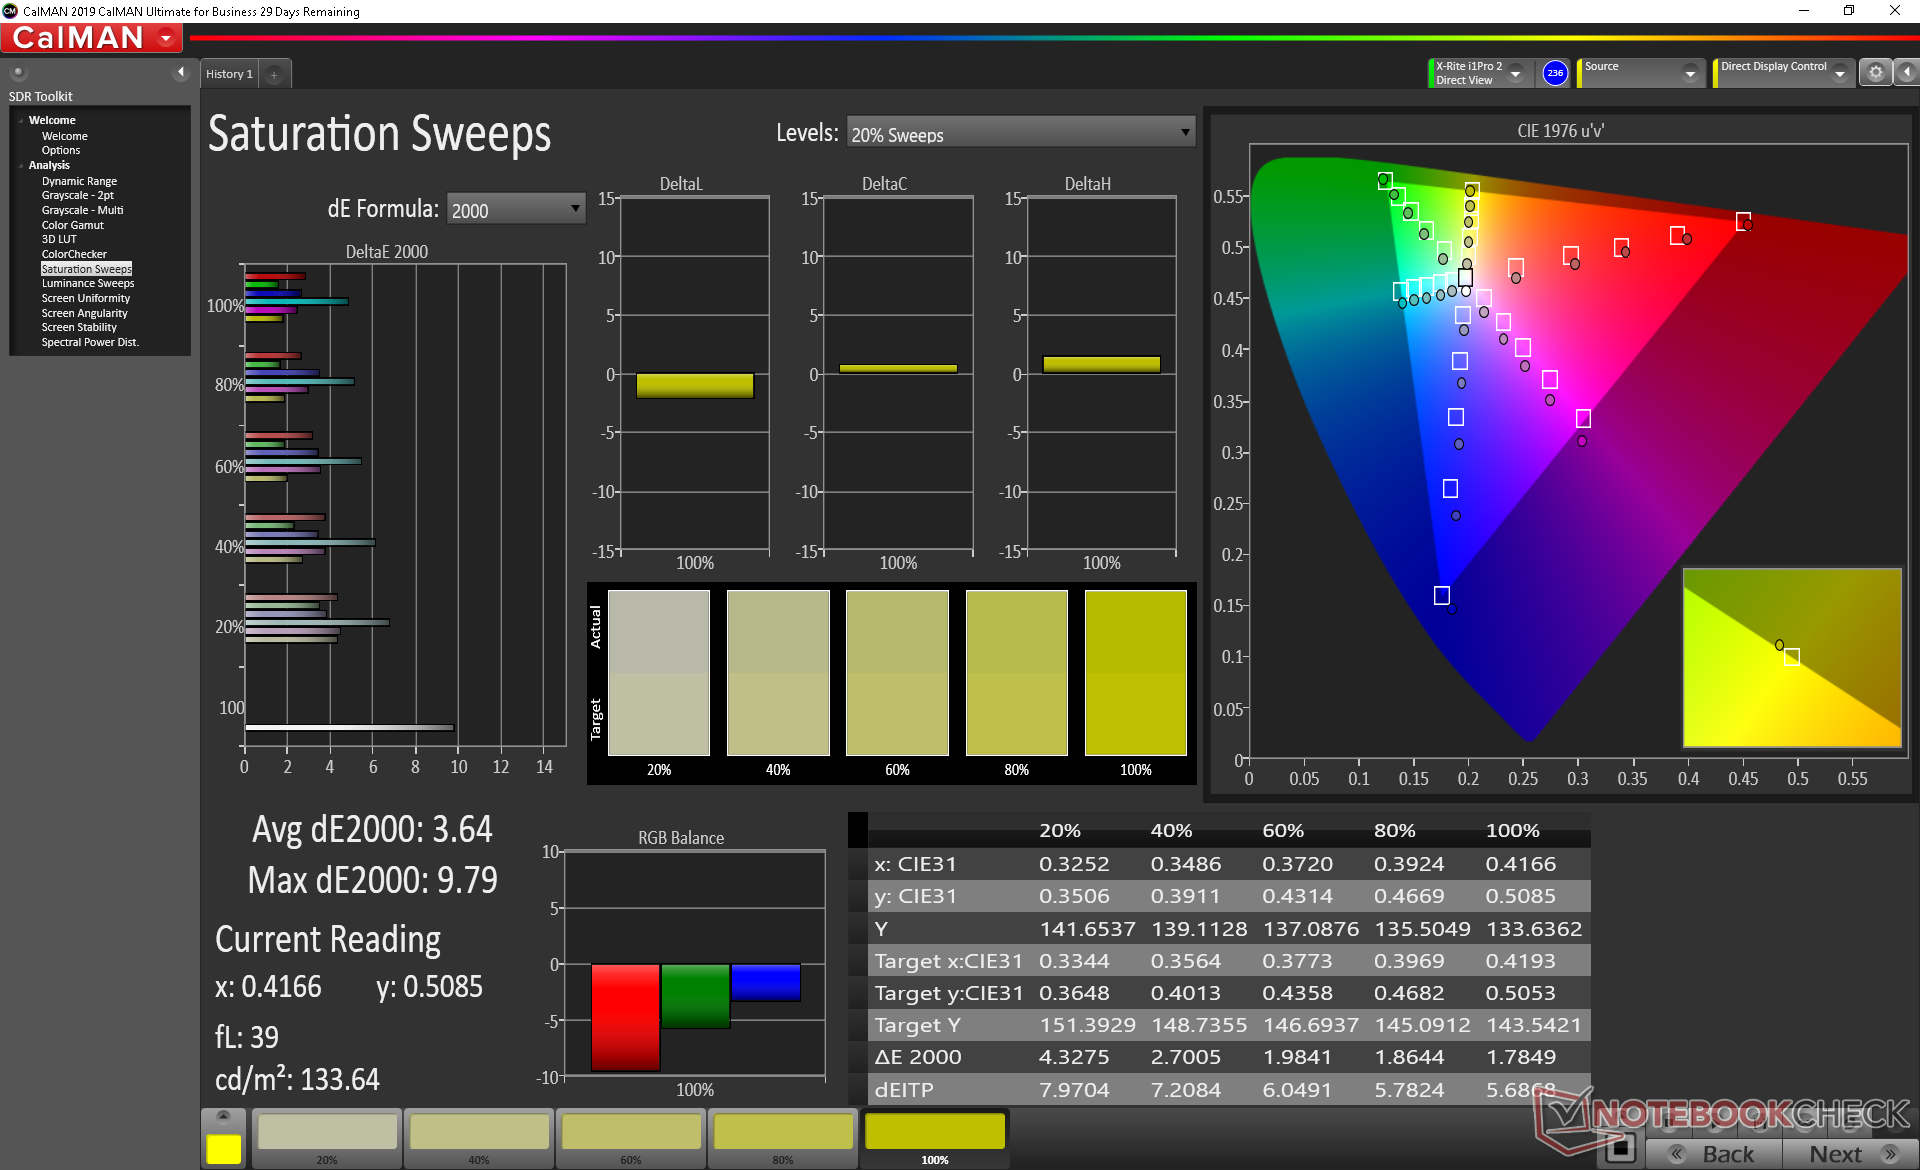
Il display avrebbe potuto essere meglio calibrato considerando la fascia di prezzo. La temperatura del colore è troppo calda, il che influisce sulla scala di grigi media e sulla precisione del colore. Dopo aver calibrato il pannello da soli, la precisione è migliorata notevolmente in tutti i settori. Raccomandiamo una calibrazione, se possibile, o almeno una regolazione manuale della scala dei grigi per una migliore immagine.
Tempi di risposta del Display
| ↔ Tempi di risposta dal Nero al Bianco | ||
|---|---|---|
| 10.4 ms ... aumenta ↗ e diminuisce ↘ combinato | ↗ 5.2 ms Incremento | 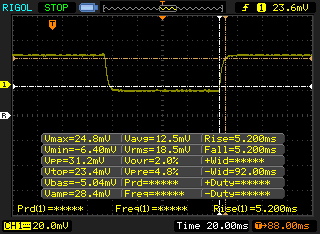 |
| ↘ 5.2 ms Calo | ||
| Lo schermo mostra buoni tempi di risposta durante i nostri tests, ma potrebbe essere troppo lento per i gamers competitivi. In confronto, tutti i dispositivi di test variano da 0.1 (minimo) a 240 (massimo) ms. » 28 % di tutti i dispositivi è migliore. Questo significa che i tempi di risposta rilevati sono migliori rispettto alla media di tutti i dispositivi testati (19.8 ms). | ||
| ↔ Tempo di risposta dal 50% Grigio all'80% Grigio | ||
| 16 ms ... aumenta ↗ e diminuisce ↘ combinato | ↗ 8.4 ms Incremento | 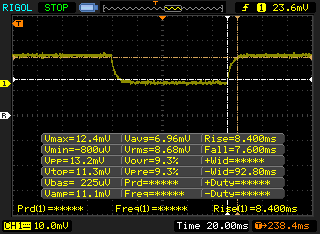 |
| ↘ 7.6 ms Calo | ||
| Lo schermo mostra buoni tempi di risposta durante i nostri tests, ma potrebbe essere troppo lento per i gamers competitivi. In confronto, tutti i dispositivi di test variano da 0.165 (minimo) a 636 (massimo) ms. » 30 % di tutti i dispositivi è migliore. Questo significa che i tempi di risposta rilevati sono migliori rispettto alla media di tutti i dispositivi testati (31 ms). | ||
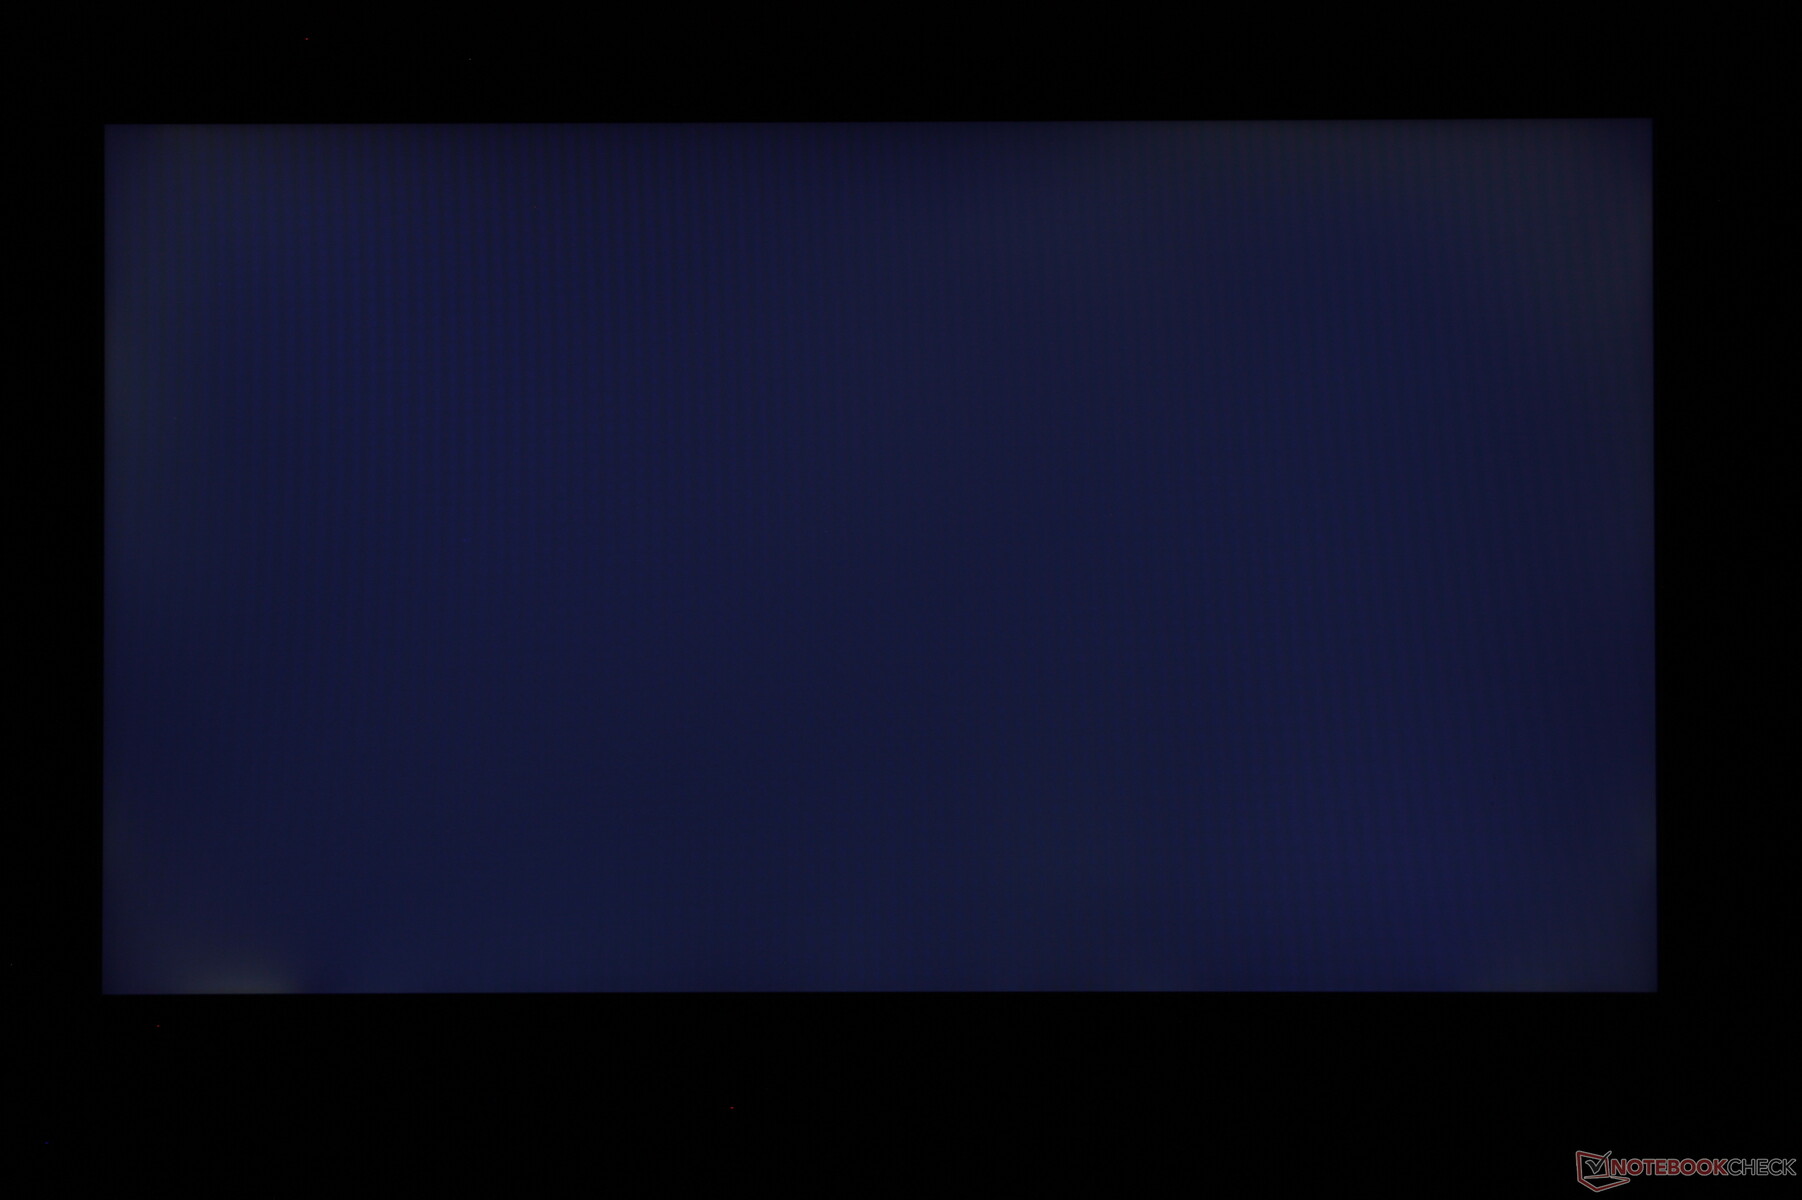
Sfarfallio dello schermo / PWM (Pulse-Width Modulation)
| flickering dello schermo / PWM rilevato | 23580 Hz | ≤ 29 % settaggio luminosita' | 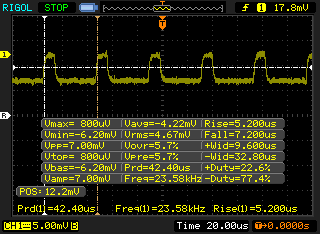 |
Il display sfarfalla a 23580 Hz (Probabilmente a causa dell'uso di PWM) Flickering rilevato ad una luminosita' di 29 % o inferiore. Non dovrebbe verificarsi flickering o PWM sopra questo valore di luminosita'. La frequenza di 23580 Hz è abbastanza alta, quindi la maggioranza degli utenti sensibili al PWM non dovrebbero notare alcun flickering. In confronto: 52 % di tutti i dispositivi testati non utilizza PWM per ridurre la luminosita' del display. Se è rilevato PWM, una media di 7753 (minimo: 5 - massimo: 343500) Hz è stata rilevata. | |||
Prestazioni
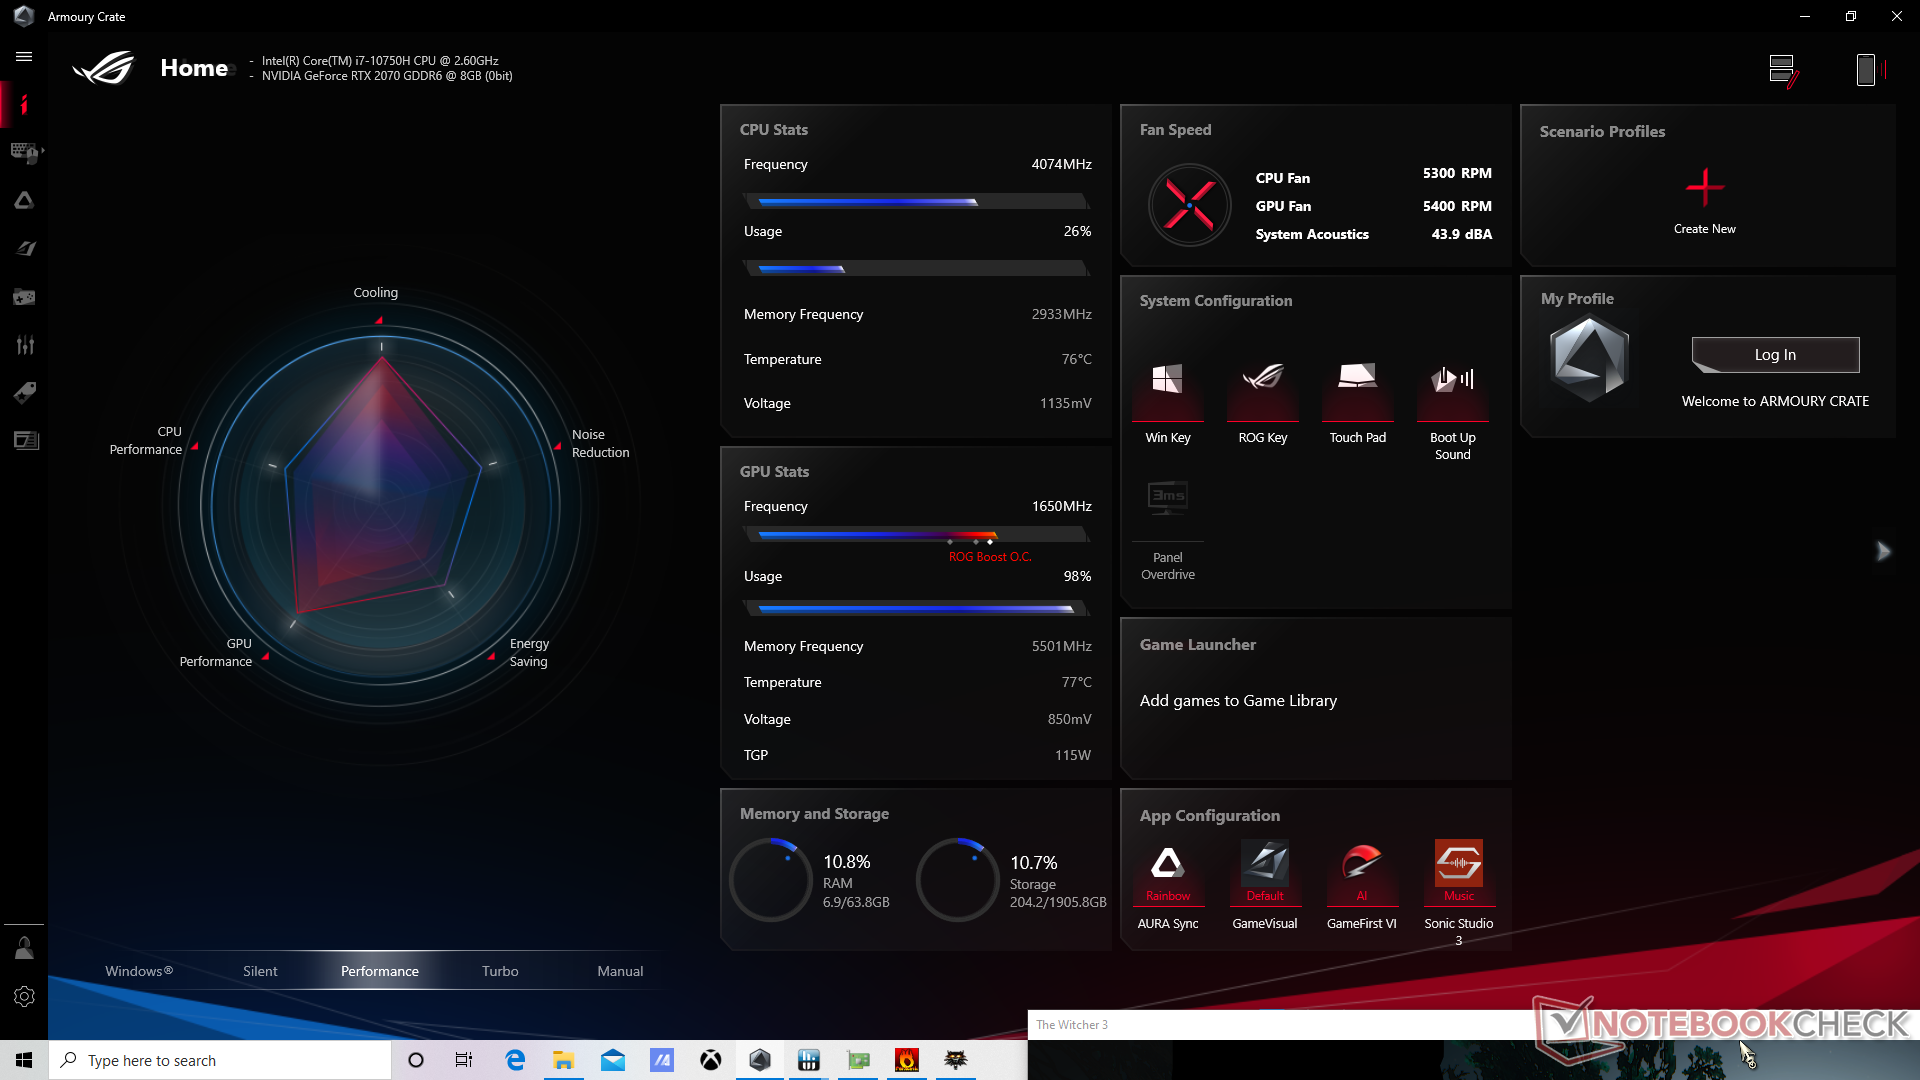
Tutti i benchmarks sotto riportati sono stati eseguiti in modalità Asus Turbo. Si consiglia ai proprietari di familiarizzare con Armoury Crate in quanto i profili di potenza sono legati direttamente a questo software.
Processore
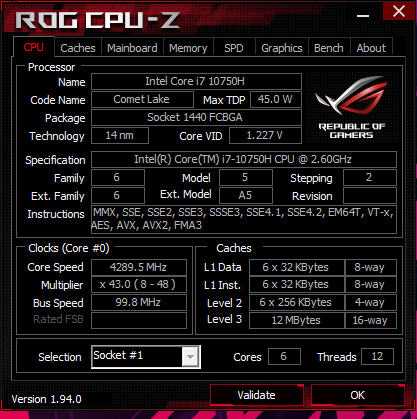
Le prestazioni multi-thread della CPU sono circa dal 5 al 10% più veloci rispetto alla media dei laptop presenti nel nostro database dotati della stessa CPU Core i7-10750H. La sostenibilità delle prestazioni è eccellente e anche un po' meglio del G512LI, come dimostra il nostro test di loop CineBench R15 xT di seguito riportato.
Cinebench R15: CPU Multi 64Bit | CPU Single 64Bit
Blender: v2.79 BMW27 CPU
7-Zip 18.03: 7z b 4 -mmt1 | 7z b 4
Geekbench 5.5: Single-Core | Multi-Core
HWBOT x265 Benchmark v2.2: 4k Preset
LibreOffice : 20 Documents To PDF
R Benchmark 2.5: Overall mean
| HWBOT x265 Benchmark v2.2 / 4k Preset | |
| Asus Zephyrus S15 GX502L | |
| Asus ROG Strix Scar 15 G532LWS | |
| Eurocom Nightsky RX15 | |
| Asus ROG Zephyrus G15 GA502IU-ES76 | |
| MSI Bravo 15 A4DCR | |
| Asus ROG Strix G15 G512LW | |
| Asus ROG Strix G15 G512LI | |
| Media Intel Core i7-10750H (5.54 - 11.6, n=43) | |
| Acer Nitro 5 AN515-44-R5FT | |
| Gateway Creator Series 15.6 GWTN156-3BK | |
| LibreOffice / 20 Documents To PDF | |
| MSI Bravo 15 A4DCR | |
| Acer Nitro 5 AN515-44-R5FT | |
| Asus ROG Zephyrus G15 GA502IU-ES76 | |
| Gateway Creator Series 15.6 GWTN156-3BK | |
| Media Intel Core i7-10750H (43.1 - 99.2, n=43) | |
| Asus ROG Strix G15 G512LI | |
| Asus ROG Strix Scar 15 G532LWS | |
| Asus Zephyrus S15 GX502L | |
| Asus ROG Strix G15 G512LW | |
| R Benchmark 2.5 / Overall mean | |
| Gateway Creator Series 15.6 GWTN156-3BK | |
| Acer Nitro 5 AN515-44-R5FT | |
| Asus ROG Strix G15 G512LI | |
| Media Intel Core i7-10750H (0.578 - 0.708, n=42) | |
| Asus ROG Strix G15 G512LW | |
| MSI Bravo 15 A4DCR | |
| Asus Zephyrus S15 GX502L | |
| Asus ROG Zephyrus G15 GA502IU-ES76 | |
| Asus ROG Strix Scar 15 G532LWS | |
Cinebench R15: CPU Multi 64Bit | CPU Single 64Bit
Blender: v2.79 BMW27 CPU
7-Zip 18.03: 7z b 4 -mmt1 | 7z b 4
Geekbench 5.5: Single-Core | Multi-Core
HWBOT x265 Benchmark v2.2: 4k Preset
LibreOffice : 20 Documents To PDF
R Benchmark 2.5: Overall mean
* ... Meglio usare valori piccoli
Prestazioni del sistema
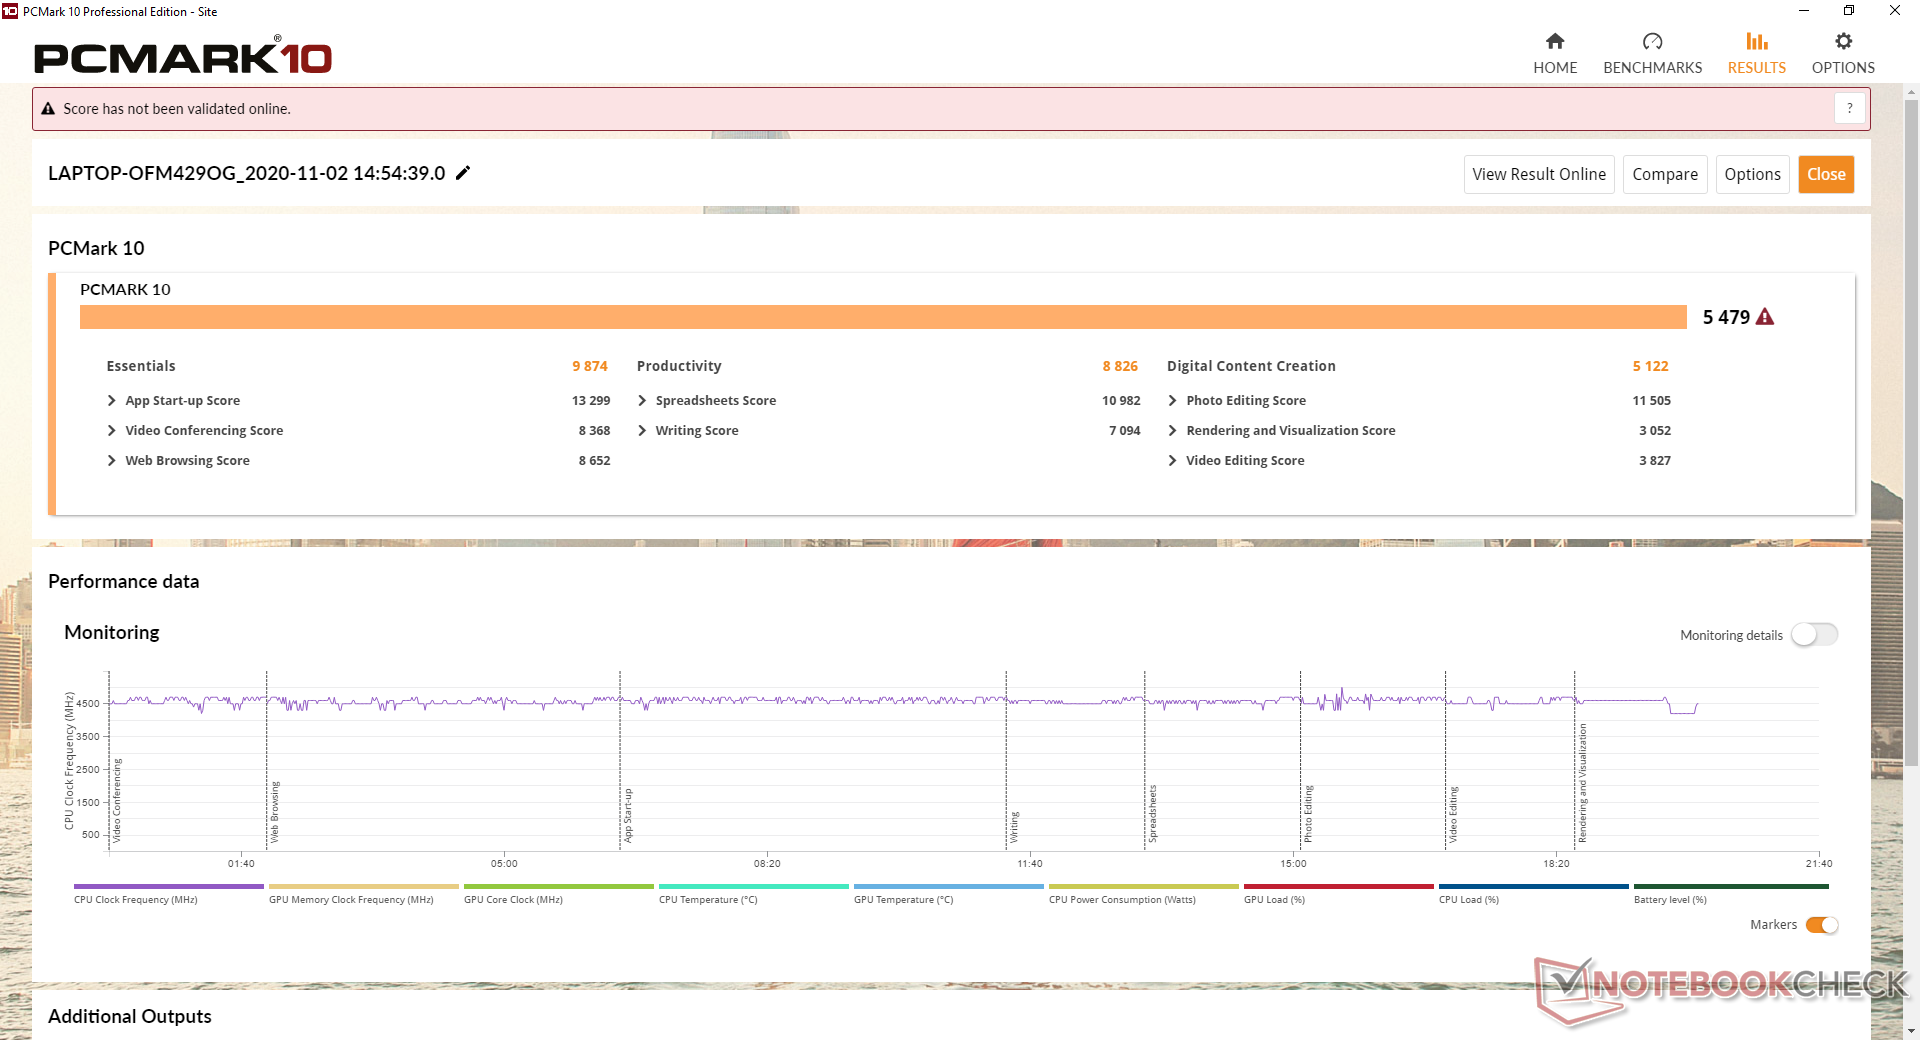
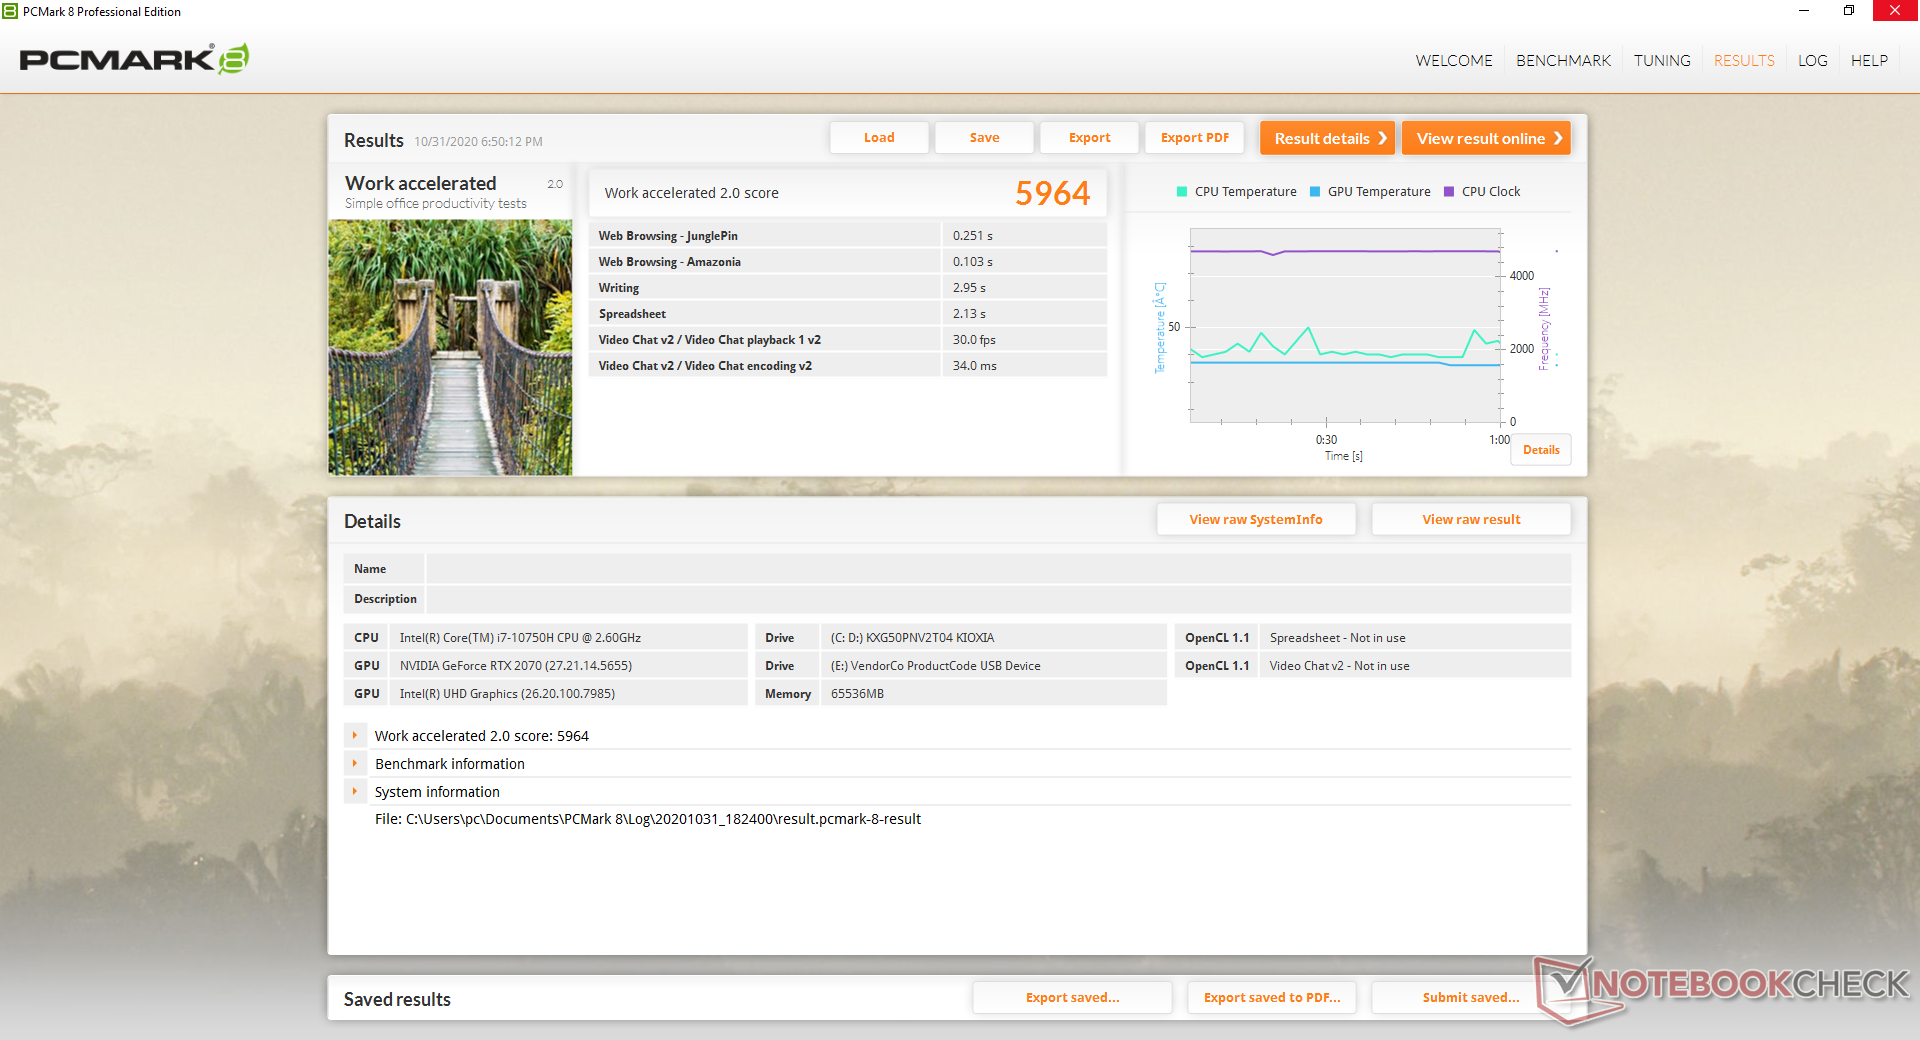
I punteggi di PCMark 10 rispecchiano le attese, tranne che per la Creazione di Contenuti Digitali, dove il nostro sistema ha un punteggio inferiore al G512LI. Sospettiamo che la lentezza di scrittura del nostro SSD M.2 Toshiba possa essere il colpevole, dato che la maggior parte degli altri portatili di questa categoria tende ad avere unità di archiviazione molto più veloci. Il Samsung PM981a, ad esempio, è quasi tre volte più veloce sotto questo aspetto.
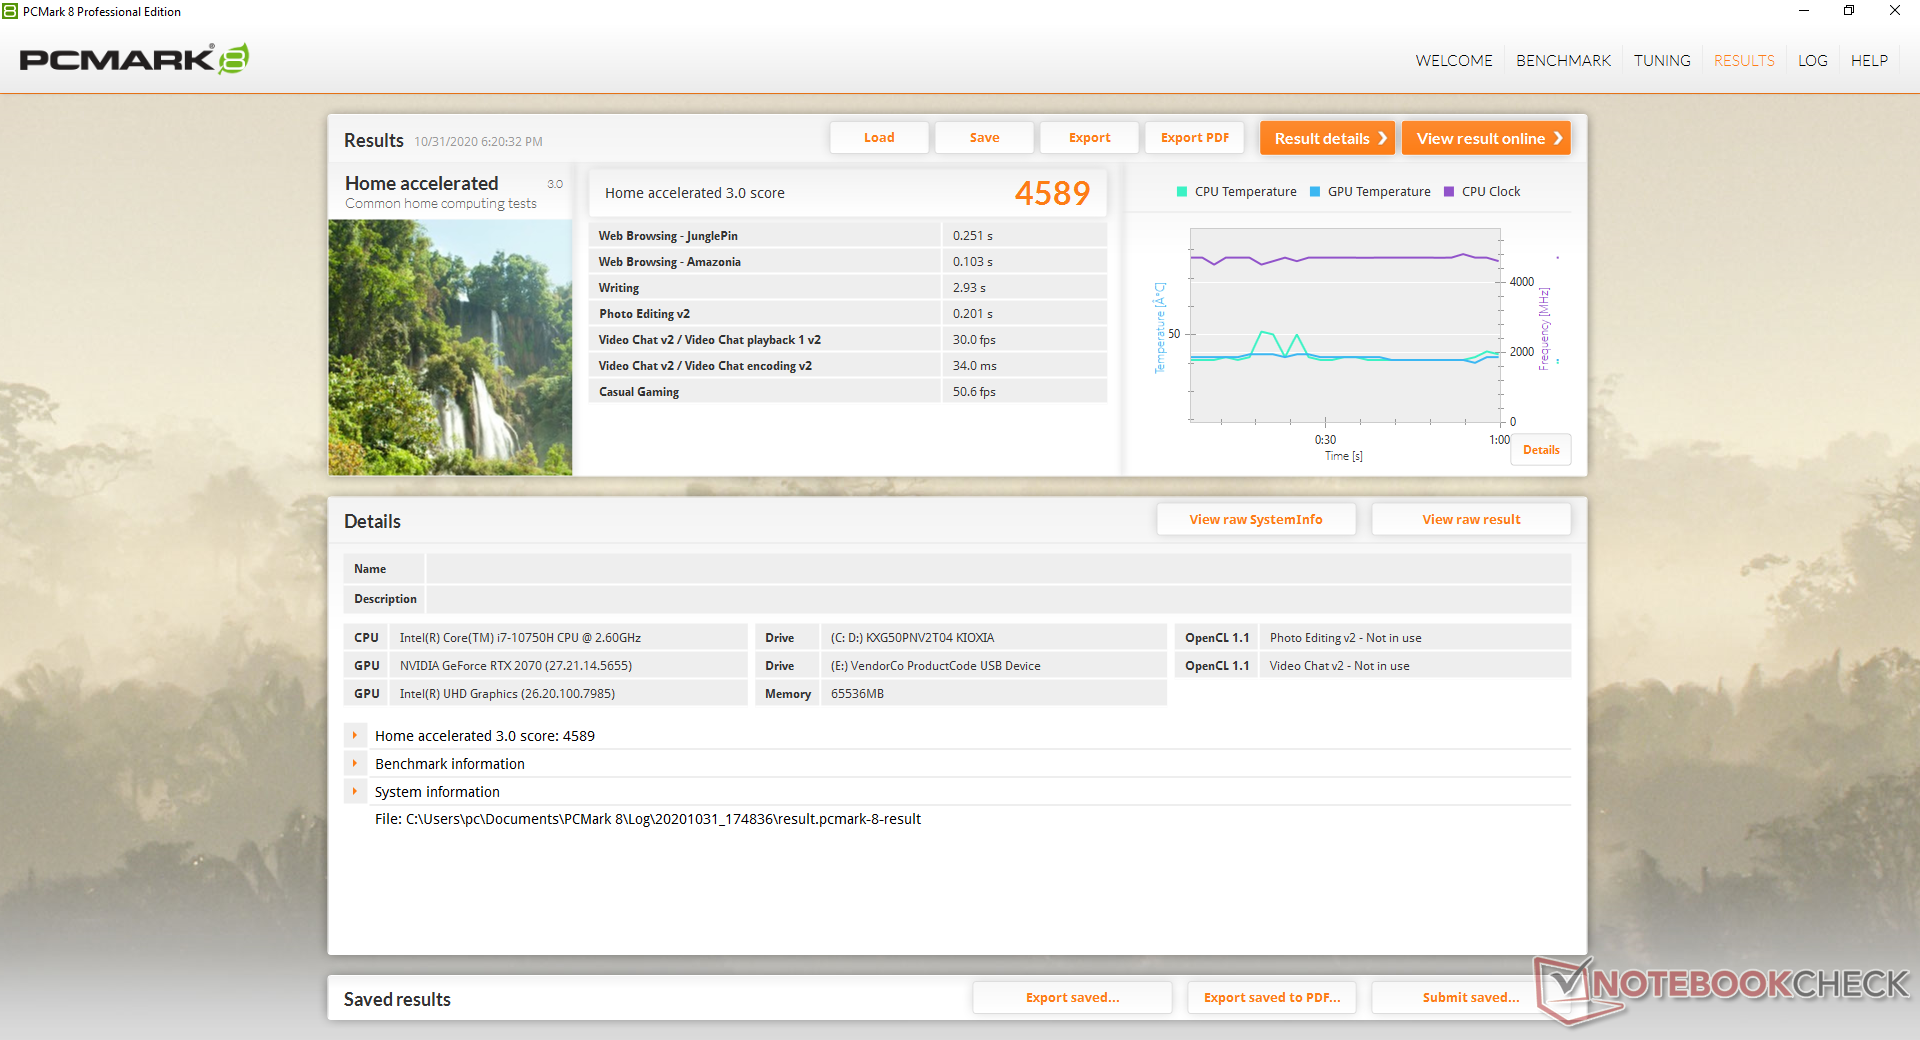
| PCMark 8 Home Score Accelerated v2 | 4589 punti | |
| PCMark 8 Work Score Accelerated v2 | 5964 punti | |
| PCMark 10 Score | 5479 punti | |
Aiuto | ||
Latenza DPC
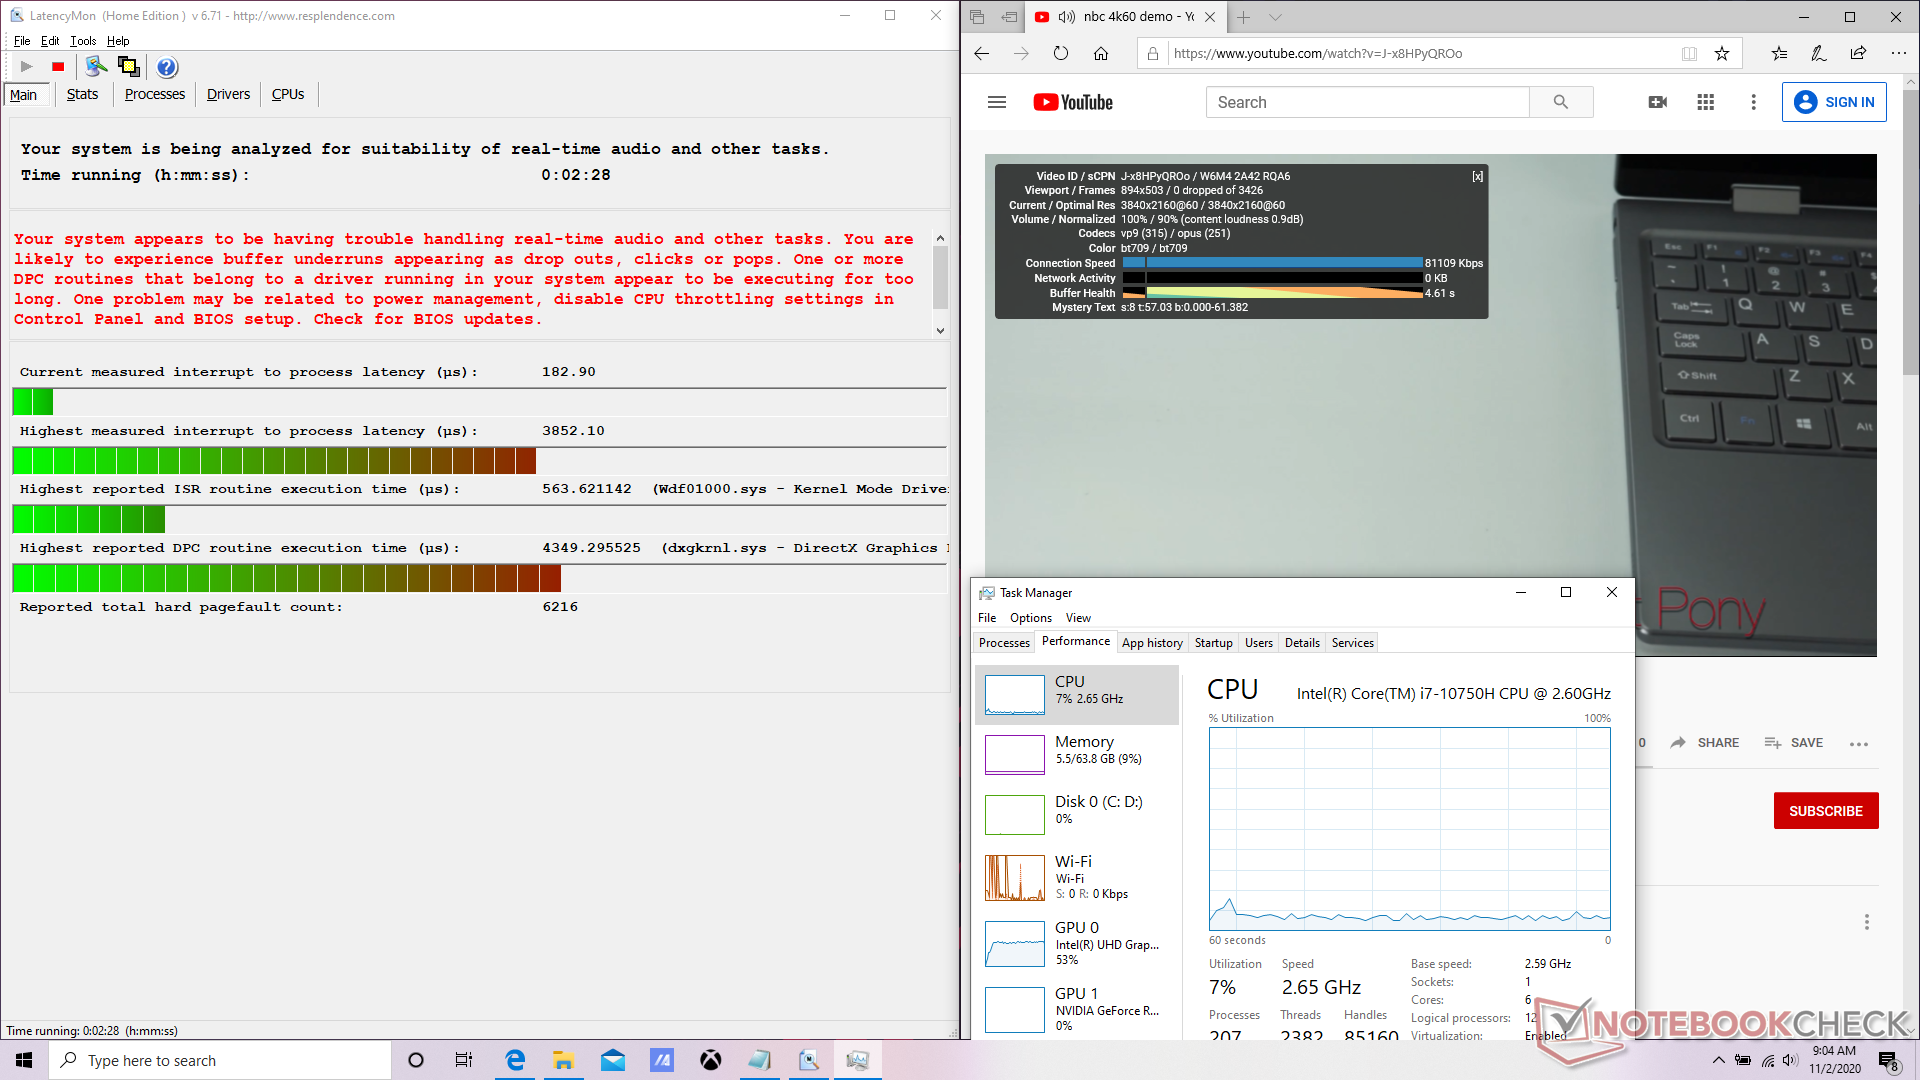
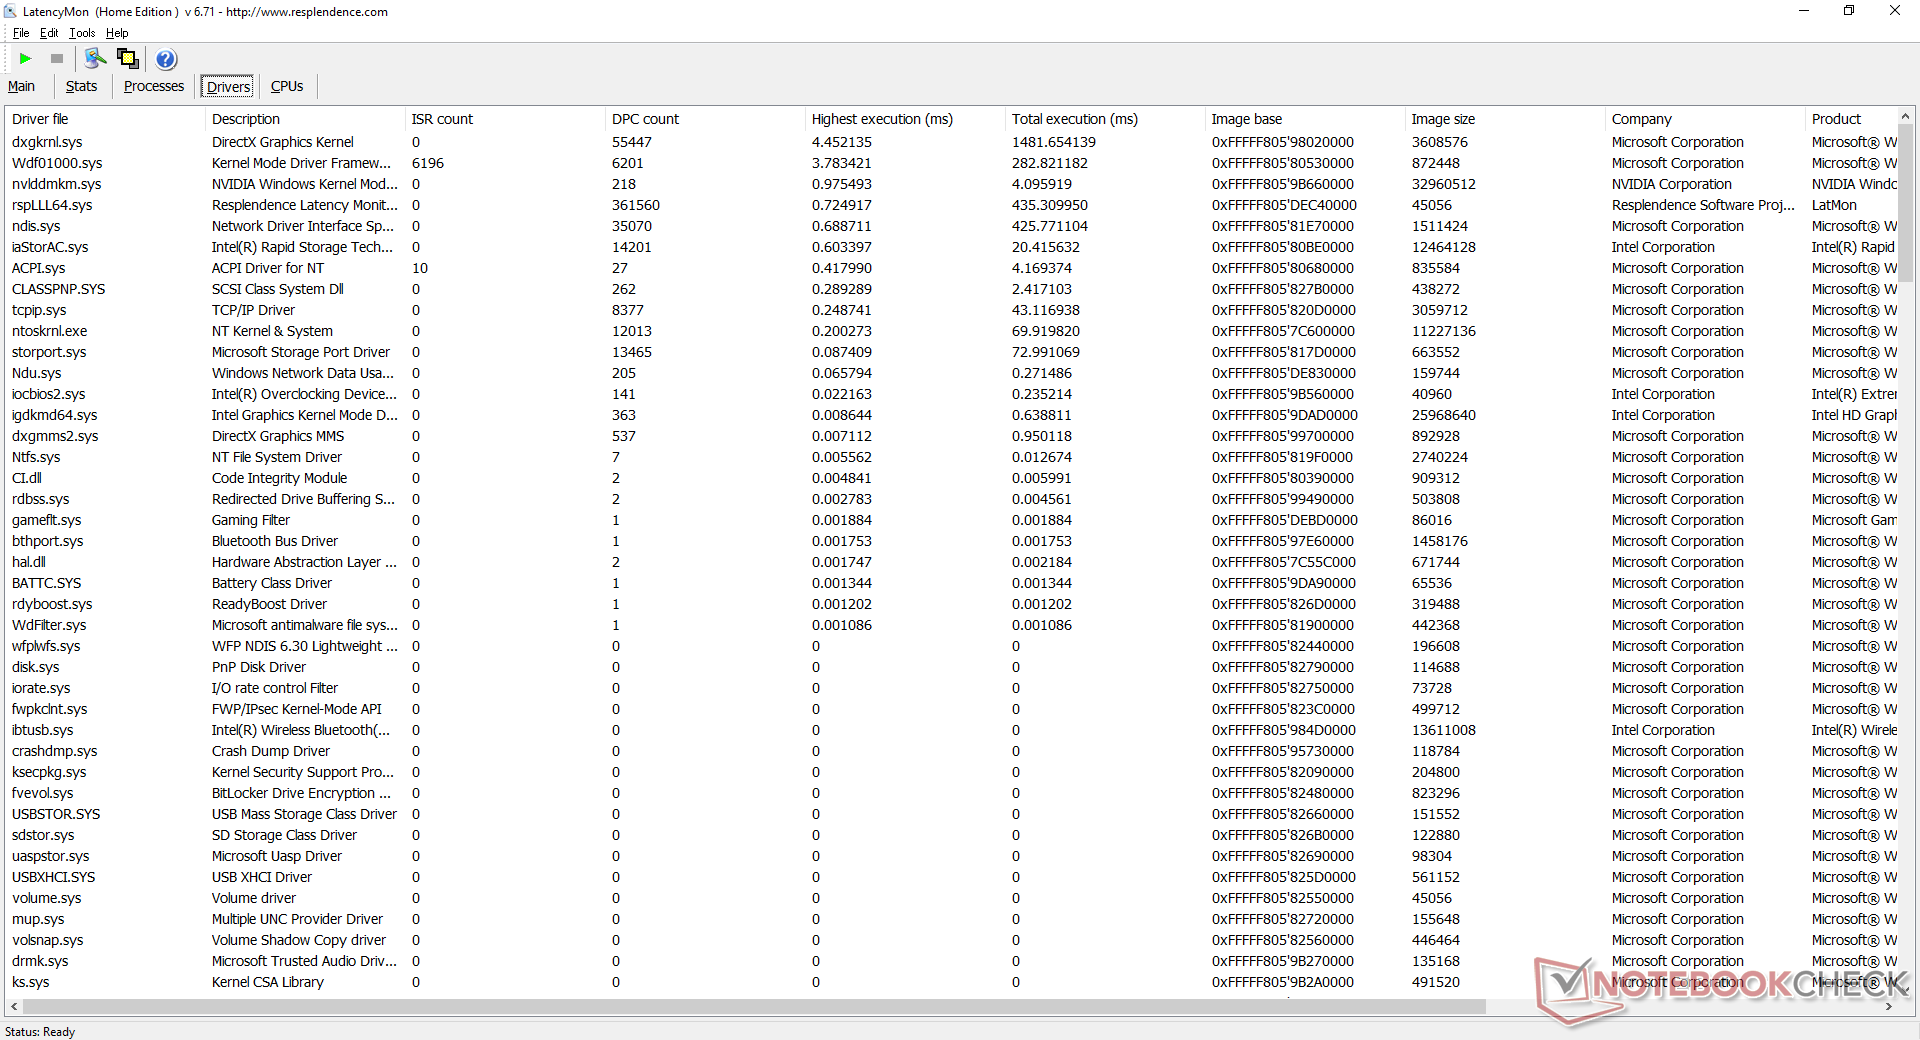
| DPC Latencies / LatencyMon - interrupt to process latency (max), Web, Youtube, Prime95 | |
| Asus ROG Strix G15 G512LW | |
| Razer Blade 15 RTX 2070 Super Max-Q | |
| Asus ROG Strix Scar 15 G532LWS | |
| Asus ROG Strix G15 G512LI | |
| Alienware m15 R3 P87F | |
| MSI GP65 10SFK-047US | |
* ... Meglio usare valori piccoli
Dispositivi di memorizzazione
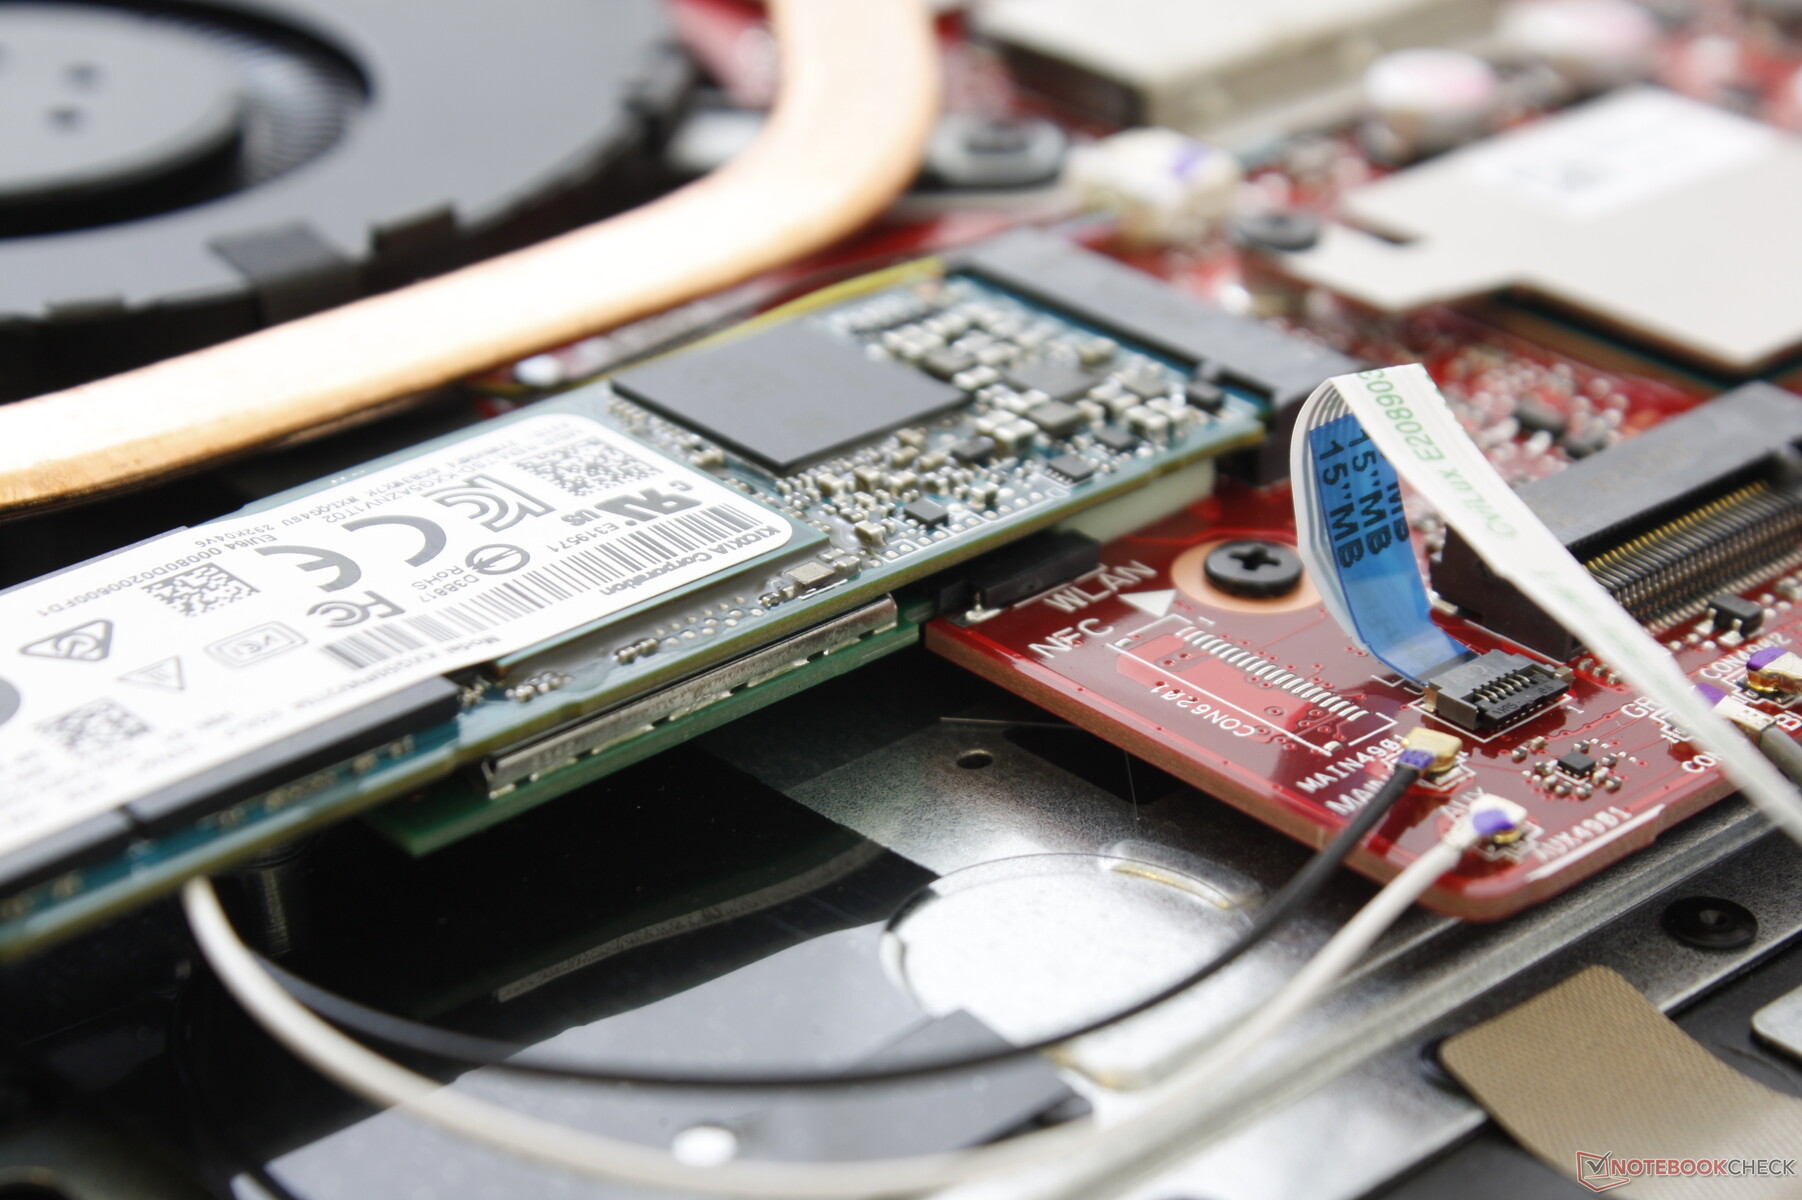
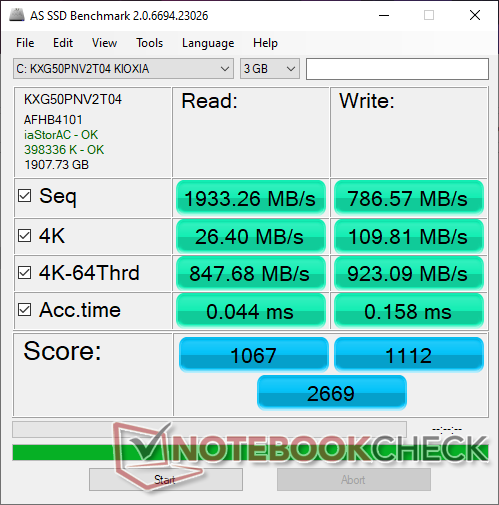
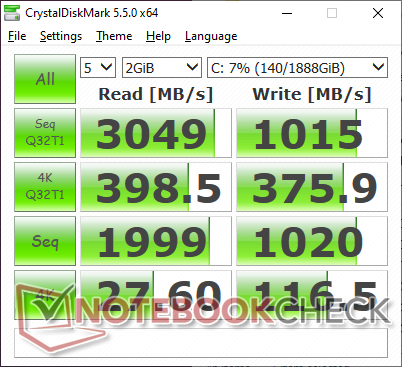
CUKUSA ha configurato la nostra unità con un SSD NVMe M.2 Toshiba XG5-P da 2 TB. Sebbene le velocità di lettura sequenziale siano veloci, le velocità di scrittura sono lente per un SSD PCIe a soli 790 MB/s circa secondo l'AS SSD.
| Asus ROG Strix G15 G512LW Toshiba XG5-P KXG50PNV2T04 | Asus ROG Strix G15 G512LI Intel SSD 660p SSDPEKNW512G8 | Razer Blade 15 RTX 2070 Super Max-Q Samsung SSD PM981a MZVLB512HBJQ | Asus ROG Strix Scar 15 G532LWS 2x Intel SSD 660p 1TB SSDPEKNW010T8 (RAID 0) | Alienware m15 R3 P87F 2x Micron 2200S 512 GB (RAID 0) | |
|---|---|---|---|---|---|
| AS SSD | -24% | 46% | 29% | 14% | |
| Seq Read (MB/s) | 1933 | 1157 -40% | 1957 1% | 1982 3% | 2058 6% |
| Seq Write (MB/s) | 787 | 675 -14% | 2092 166% | 1444 83% | 2316 194% |
| 4K Read (MB/s) | 26.4 | 49.99 89% | 50.2 90% | 50.3 91% | 39.72 50% |
| 4K Write (MB/s) | 109.8 | 114 4% | 96.5 -12% | 120.1 9% | 62.9 -43% |
| 4K-64 Read (MB/s) | 848 | 322.2 -62% | 1594 88% | 1016 20% | 1334 57% |
| 4K-64 Write (MB/s) | 923 | 759 -18% | 2005 117% | 1351 46% | 1271 38% |
| Access Time Read * (ms) | 0.044 | 0.07 -59% | 0.057 -30% | 0.044 -0% | 0.062 -41% |
| Access Time Write * (ms) | 0.158 | 0.137 13% | 0.112 29% | 0.109 31% | 0.388 -146% |
| Score Read (Points) | 1067 | 488 -54% | 1840 72% | 1264 18% | 1580 48% |
| Score Write (Points) | 1112 | 940 -15% | 2310 108% | 1615 45% | 1565 41% |
| Score Total (Points) | 2669 | 1673 -37% | 5103 91% | 3510 32% | 3968 49% |
| Copy ISO MB/s (MB/s) | 3210 | 939 -71% | 1793 -44% | 3474 8% | 1685 -48% |
| Copy Program MB/s (MB/s) | 728 | 489.9 -33% | 573 -21% | 751 3% | 669 -8% |
| Copy Game MB/s (MB/s) | 1499 | 895 -40% | 1418 -5% | 1684 12% | 1493 0% |
| CrystalDiskMark 5.2 / 6 | 1% | 62% | 51% | 46% | |
| Write 4K (MB/s) | 116.5 | 125.4 8% | 139.8 20% | 128.4 10% | 67.3 -42% |
| Read 4K (MB/s) | 27.6 | 52.7 91% | 48.62 76% | 53.7 95% | 41.47 50% |
| Write Seq (MB/s) | 1020 | 943 -8% | 2260 122% | 1875 84% | 2239 120% |
| Read Seq (MB/s) | 1999 | 1383 -31% | 2135 7% | 2315 16% | 2112 6% |
| Write 4K Q32T1 (MB/s) | 375.9 | 437.9 16% | 499.3 33% | 427.2 14% | 488.9 30% |
| Read 4K Q32T1 (MB/s) | 398.5 | 334.9 -16% | 552 39% | 440.7 11% | 557 40% |
| Write Seq Q32T1 (MB/s) | 1015 | 960 -5% | 2960 192% | 2793 175% | 2654 161% |
| Read Seq Q32T1 (MB/s) | 3049 | 1530 -50% | 3269 7% | 3101 2% | 3137 3% |
| Media totale (Programma / Settaggio) | -12% /
-15% | 54% /
52% | 40% /
37% | 30% /
26% |
* ... Meglio usare valori piccoli

Throttling disco: DiskSpd Read Loop, Queue Depth 8
Prestazioni della GPU
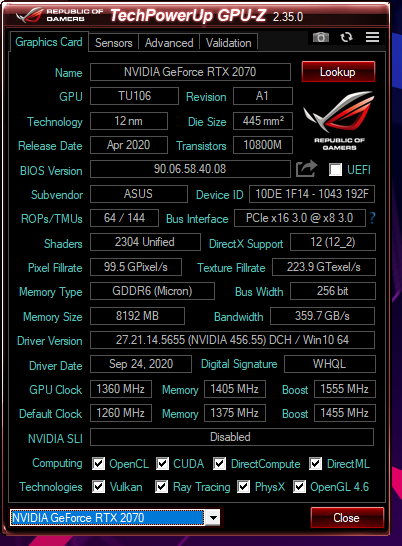
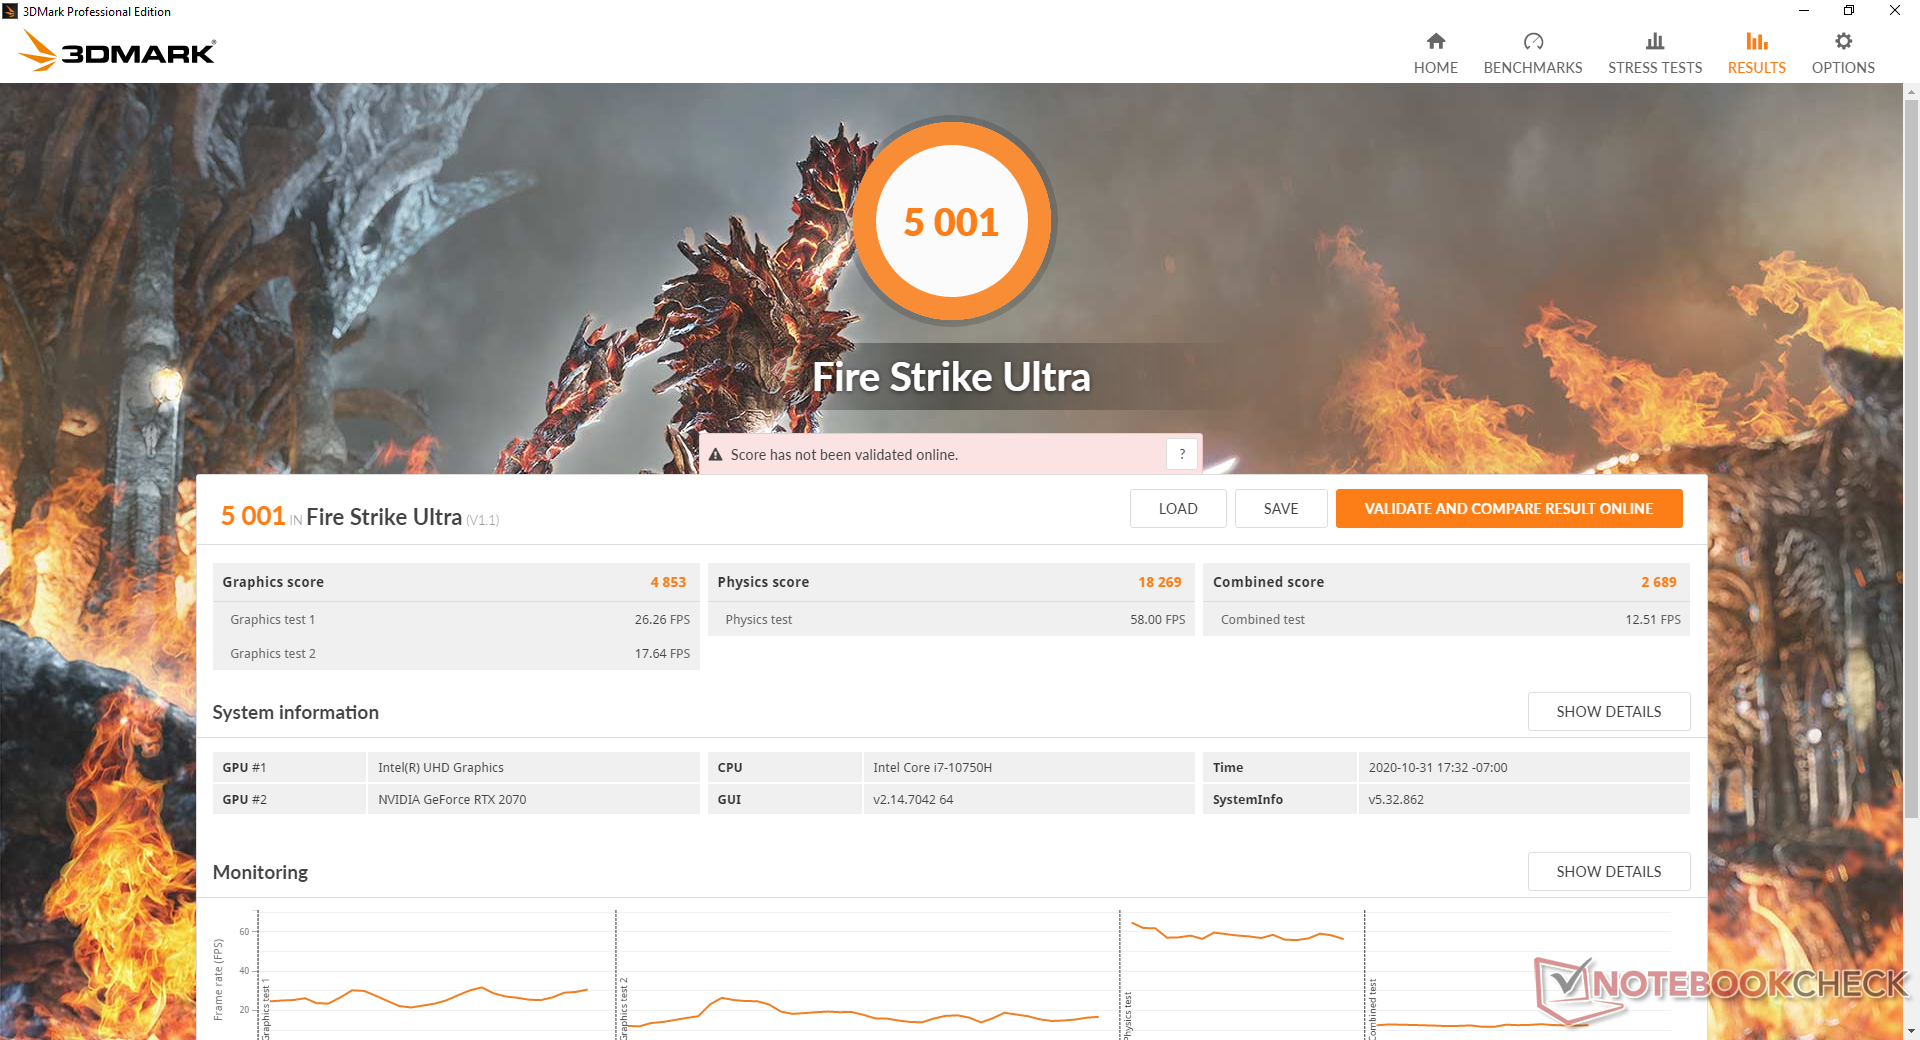
Le prestazioni grafiche arrivano a pochi punti percentuali rispetto alla media delle GeForce RTX 2070 mobili nel nostro database. Una vera e propria GeForce RTX 2070 desktop Recensione della scheda grafica desktop Asus ROG Strix RTX 2070 OCè circa il 10-20% più veloce secondo i benchmarks 3DMark. Scegliendo la G512LW rispetto alla GTX 1650 Ti-powered G512LI, gli utenti avranno a disposizione una potenza grafica circa due volte superiore.
Si noti che le prestazioni grafiche sono leggermente superiori se impostate in modalità Turbo (7826 punti nella grafica Time Spy) rispetto alla modalità Performance (7543 punti).
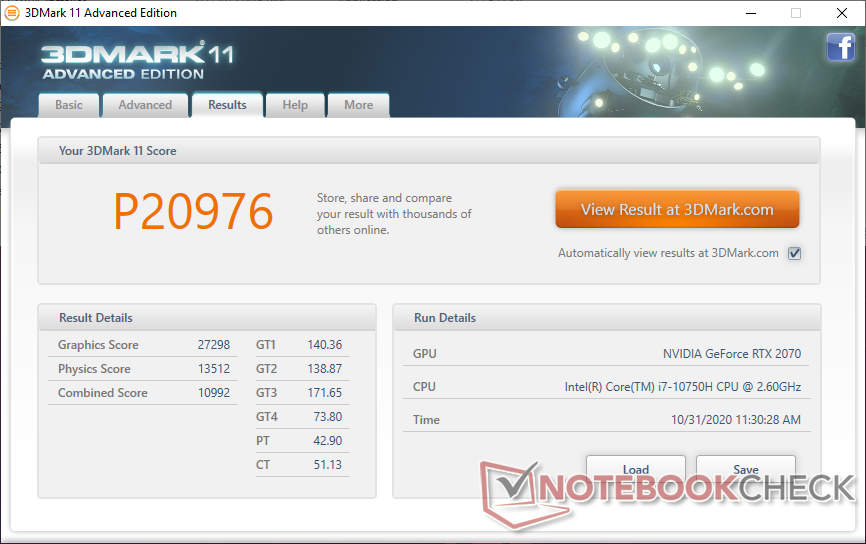
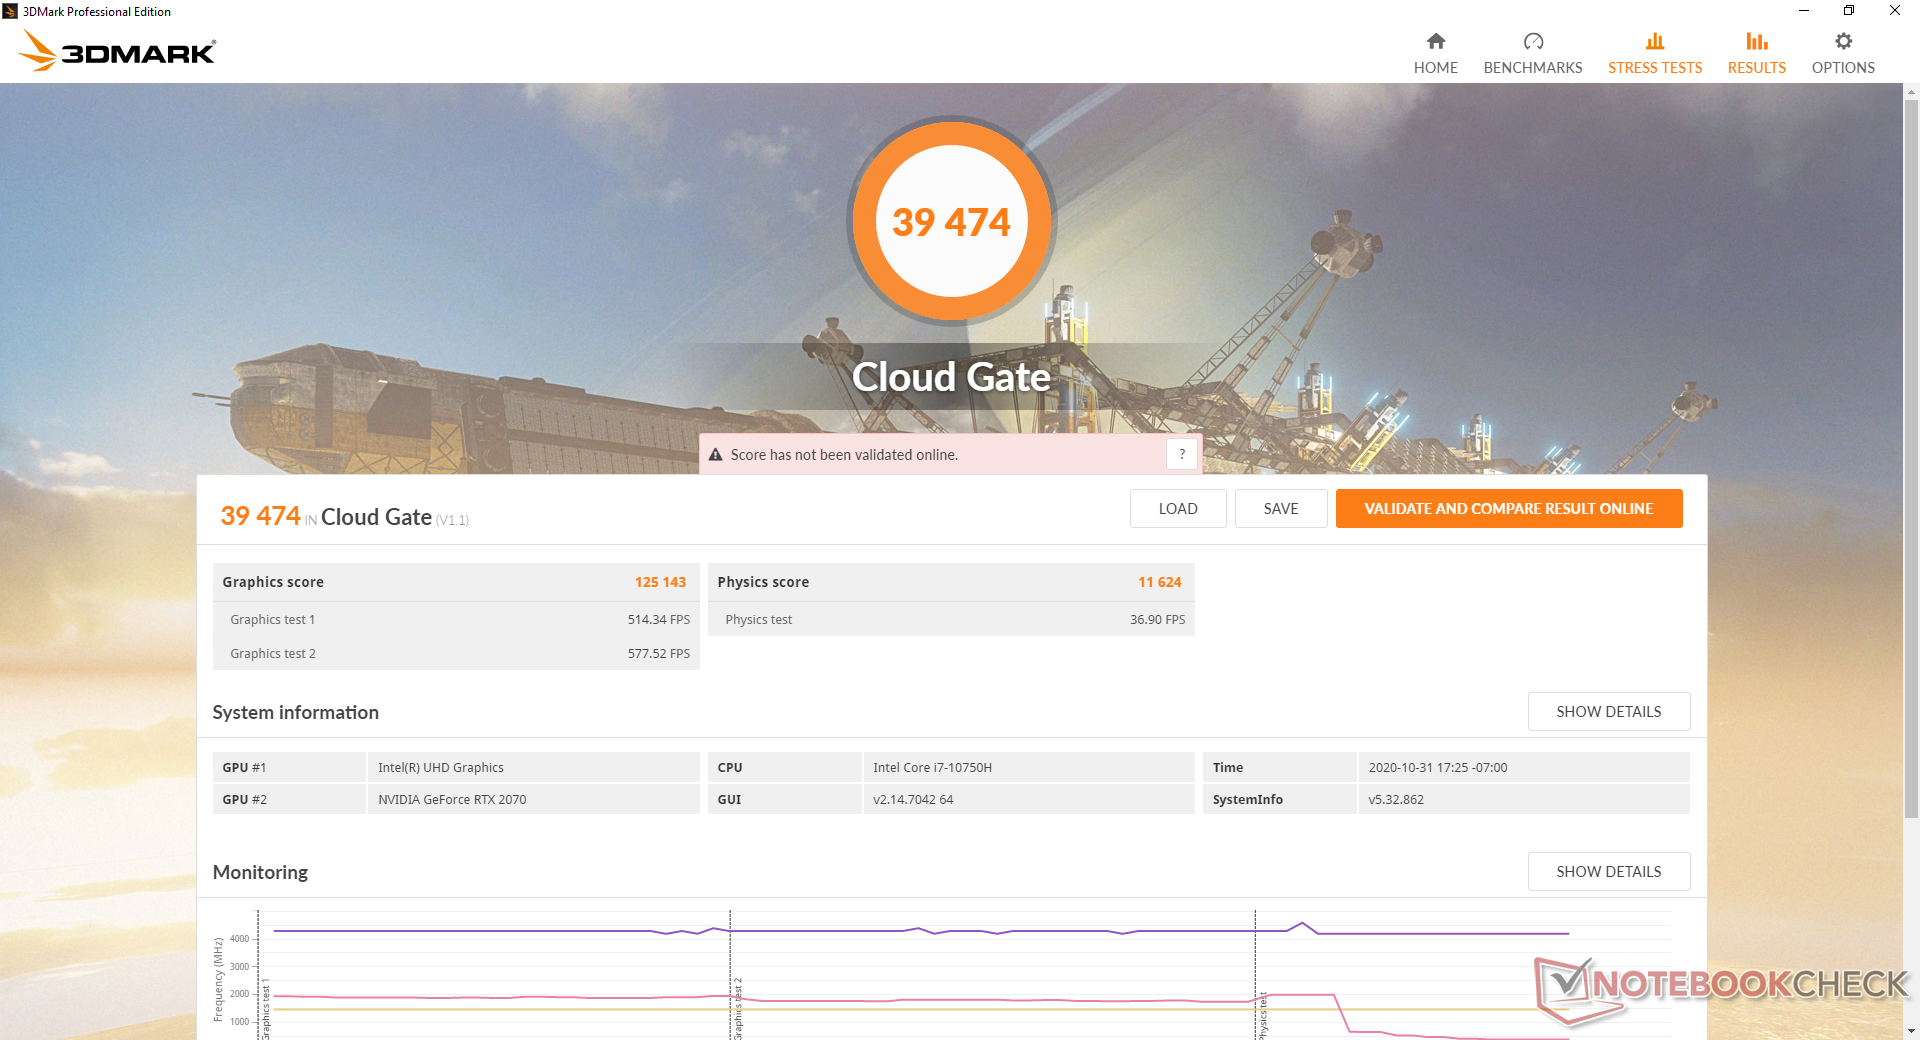
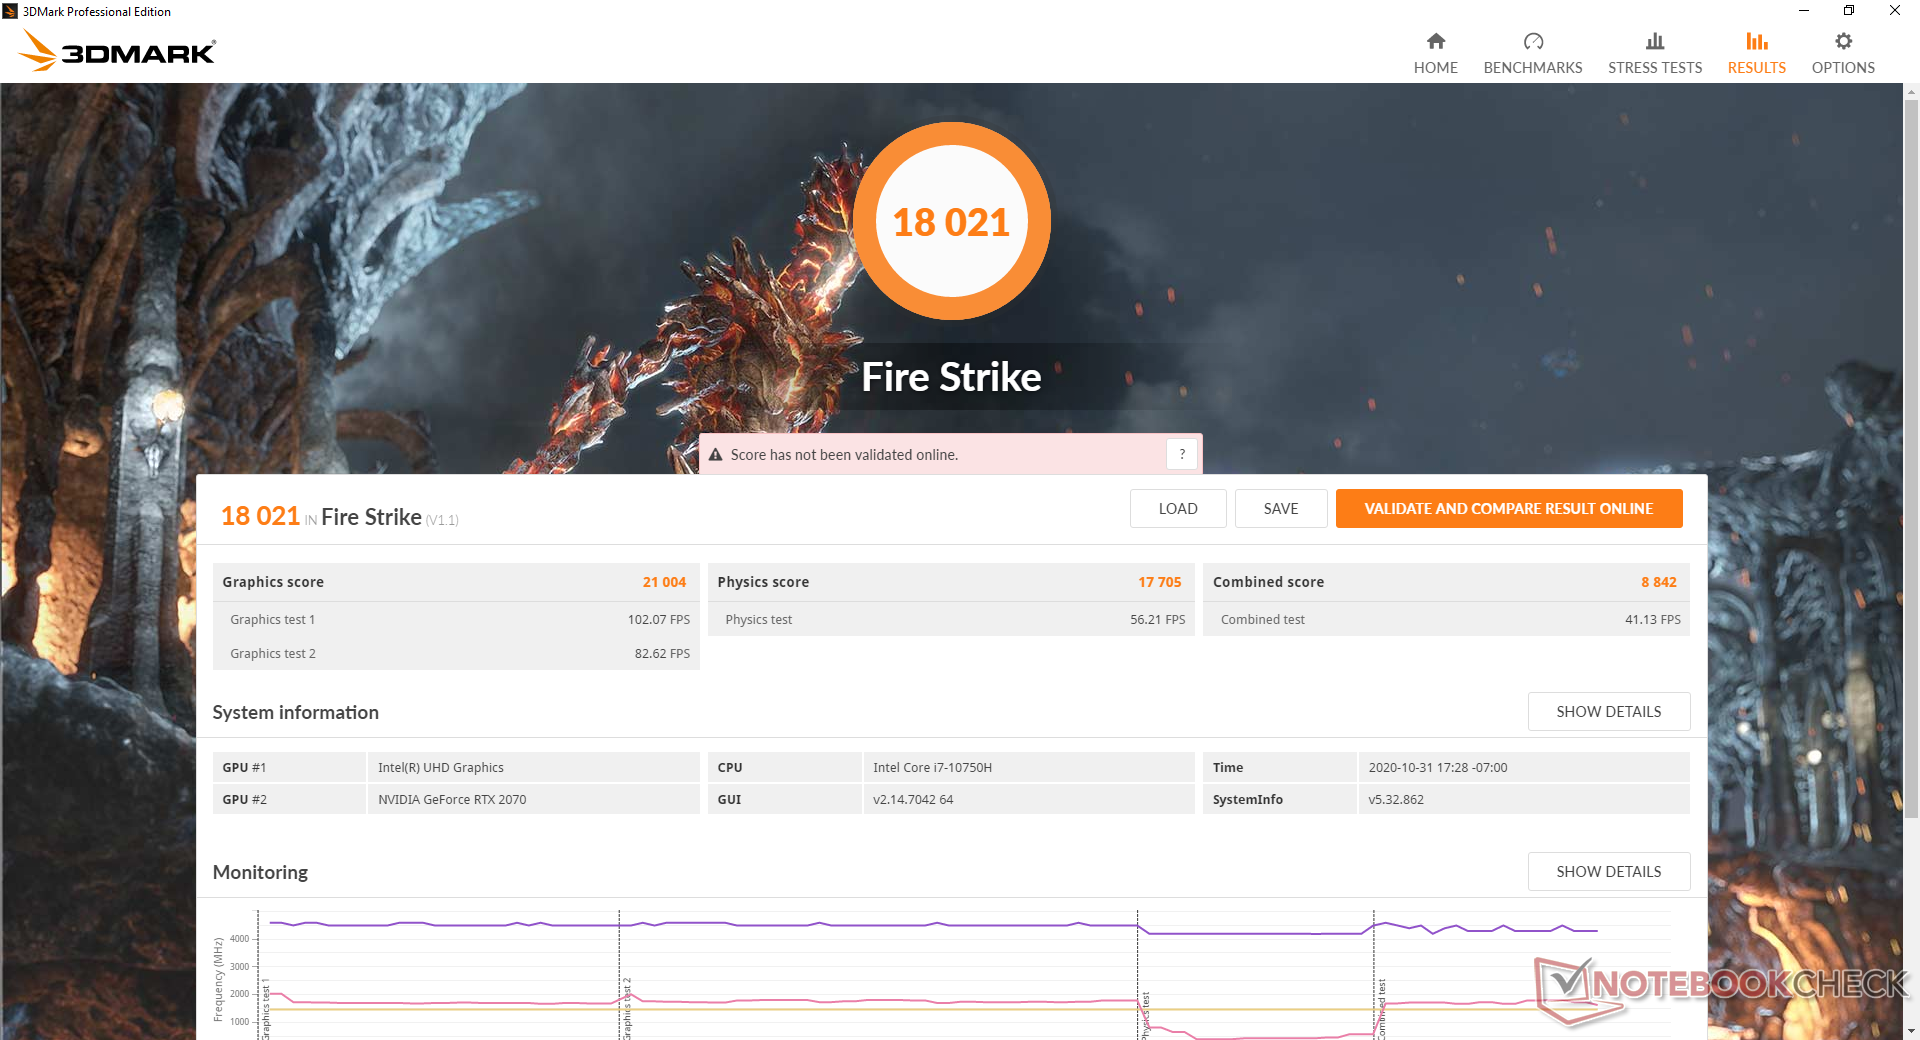

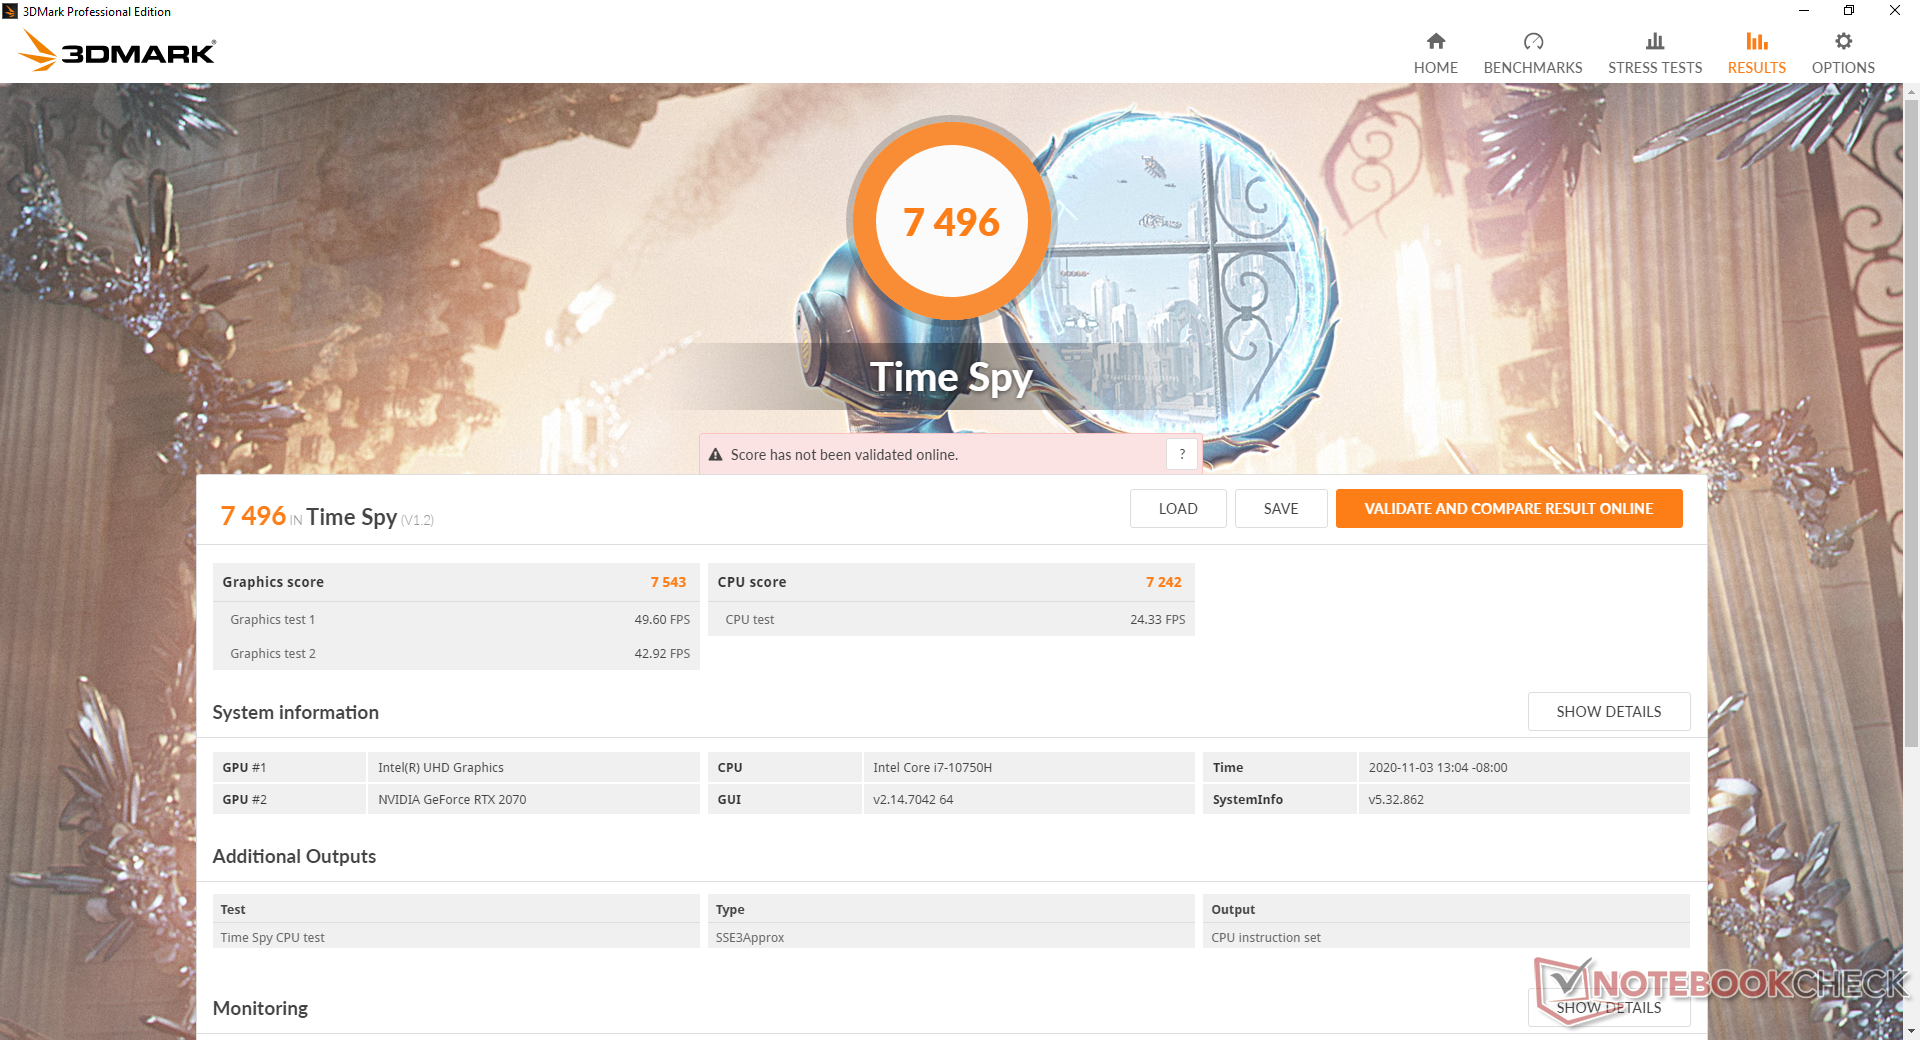
| 3DMark 11 Performance | 20976 punti | |
| 3DMark Cloud Gate Standard Score | 39474 punti | |
| 3DMark Fire Strike Score | 18021 punti | |
| 3DMark Time Spy Score | 7718 punti | |
Aiuto | ||
| basso | medio | alto | ultra | |
|---|---|---|---|---|
| GTA V (2015) | 178 | 170 | 148 | 82 |
| The Witcher 3 (2015) | 303.3 | 227.2 | 144.5 | 78.2 |
| Dota 2 Reborn (2015) | 149 | 130 | 124 | 117 |
| Final Fantasy XV Benchmark (2018) | 151 | 106 | 80.6 | |
| X-Plane 11.11 (2018) | 105 | 90.5 | 77.5 | |
| Strange Brigade (2018) | 313 | 183 | 149 | 125 |
Emissioni
Rumorosità di sistema
Il rumore della ventola è più forte di quello registrato sul G512LI nonostante la soluzione di raffreddamento potenziata. Lanciando the Witcher 3 in modalità Performance e Turbo si sente un rumore della ventola di 52,6 dB(A) e 54,1 dB(A), rispettivamente, rispetto ai soli 47,9 dB(A) a 49,3 dB(A) rilevati sul G512LI. Questo è altrettanto rumoroso o più rumoroso del Razer Blade 15 o dell'MSI GP65, entrambi di dimensioni inferiori rispetto all'Asus.
Per carichi poco impegnativi come lo streaming video o la navigazione web, il sistema non è mai veramente silenzioso anche quando è impostato in modalità "Silenzioso". Il rumore della ventola tende a fluttuare intorno ai 30-34 dB(A) che, pur non essendo particolarmente fastidioso, è certamente percepibile. Si consiglia di utilizzare la modalità Silenziosa per ridurre il pulsare casuale delle ventole.
| Asus ROG Strix G15 G512LW GeForce RTX 2070 Mobile, i7-10750H, Toshiba XG5-P KXG50PNV2T04 | Asus ROG Strix G15 G512LI GeForce GTX 1650 Ti Mobile, i7-10750H, Intel SSD 660p SSDPEKNW512G8 | Razer Blade 15 RTX 2070 Super Max-Q GeForce RTX 2070 Super Max-Q, i7-10875H, Samsung SSD PM981a MZVLB512HBJQ | MSI GP65 10SFK-047US GeForce RTX 2070 Mobile, i7-10750H, Samsung SSD PM981 MZVLB1T0HALR | Asus ROG Strix Scar 15 G532LWS GeForce RTX 2070 Super Mobile, i9-10980HK, 2x Intel SSD 660p 1TB SSDPEKNW010T8 (RAID 0) | Alienware m15 R3 P87F GeForce RTX 2070 Mobile, i7-10750H, 2x Micron 2200S 512 GB (RAID 0) | |
|---|---|---|---|---|---|---|
| Noise | -8% | 2% | -9% | -8% | 2% | |
| off /ambiente * (dB) | 25.7 | 27.7 -8% | 27 -5% | 29.3 -14% | 26.5 -3% | 26.3 -2% |
| Idle Minimum * (dB) | 25.7 | 34.2 -33% | 27 -5% | 31.9 -24% | 27.1 -5% | 26.7 -4% |
| Idle Average * (dB) | 29.7 | 36 -21% | 27 9% | 31.9 -7% | 32.2 -8% | 26.7 10% |
| Idle Maximum * (dB) | 34 | 36.6 -8% | 27 21% | 33.5 1% | 34 -0% | 30.7 10% |
| Load Average * (dB) | 38.9 | 44.3 -14% | 44.7 -15% | 47 -21% | 52.4 -35% | 40.2 -3% |
| Witcher 3 ultra * (dB) | 54.1 | 47.9 11% | 51.2 5% | 53.8 1% | 57.5 -6% | 51 6% |
| Load Maximum * (dB) | 57.4 | 49.3 14% | 54 6% | 56.7 1% | 57.5 -0% | 59.7 -4% |
* ... Meglio usare valori piccoli
Rumorosità
| Idle |
| 25.7 / 29.7 / 34 dB(A) |
| Sotto carico |
| 38.9 / 57.4 dB(A) |
 | ||
30 dB silenzioso 40 dB(A) udibile 50 dB(A) rumoroso |
||
min: | ||
Temperature
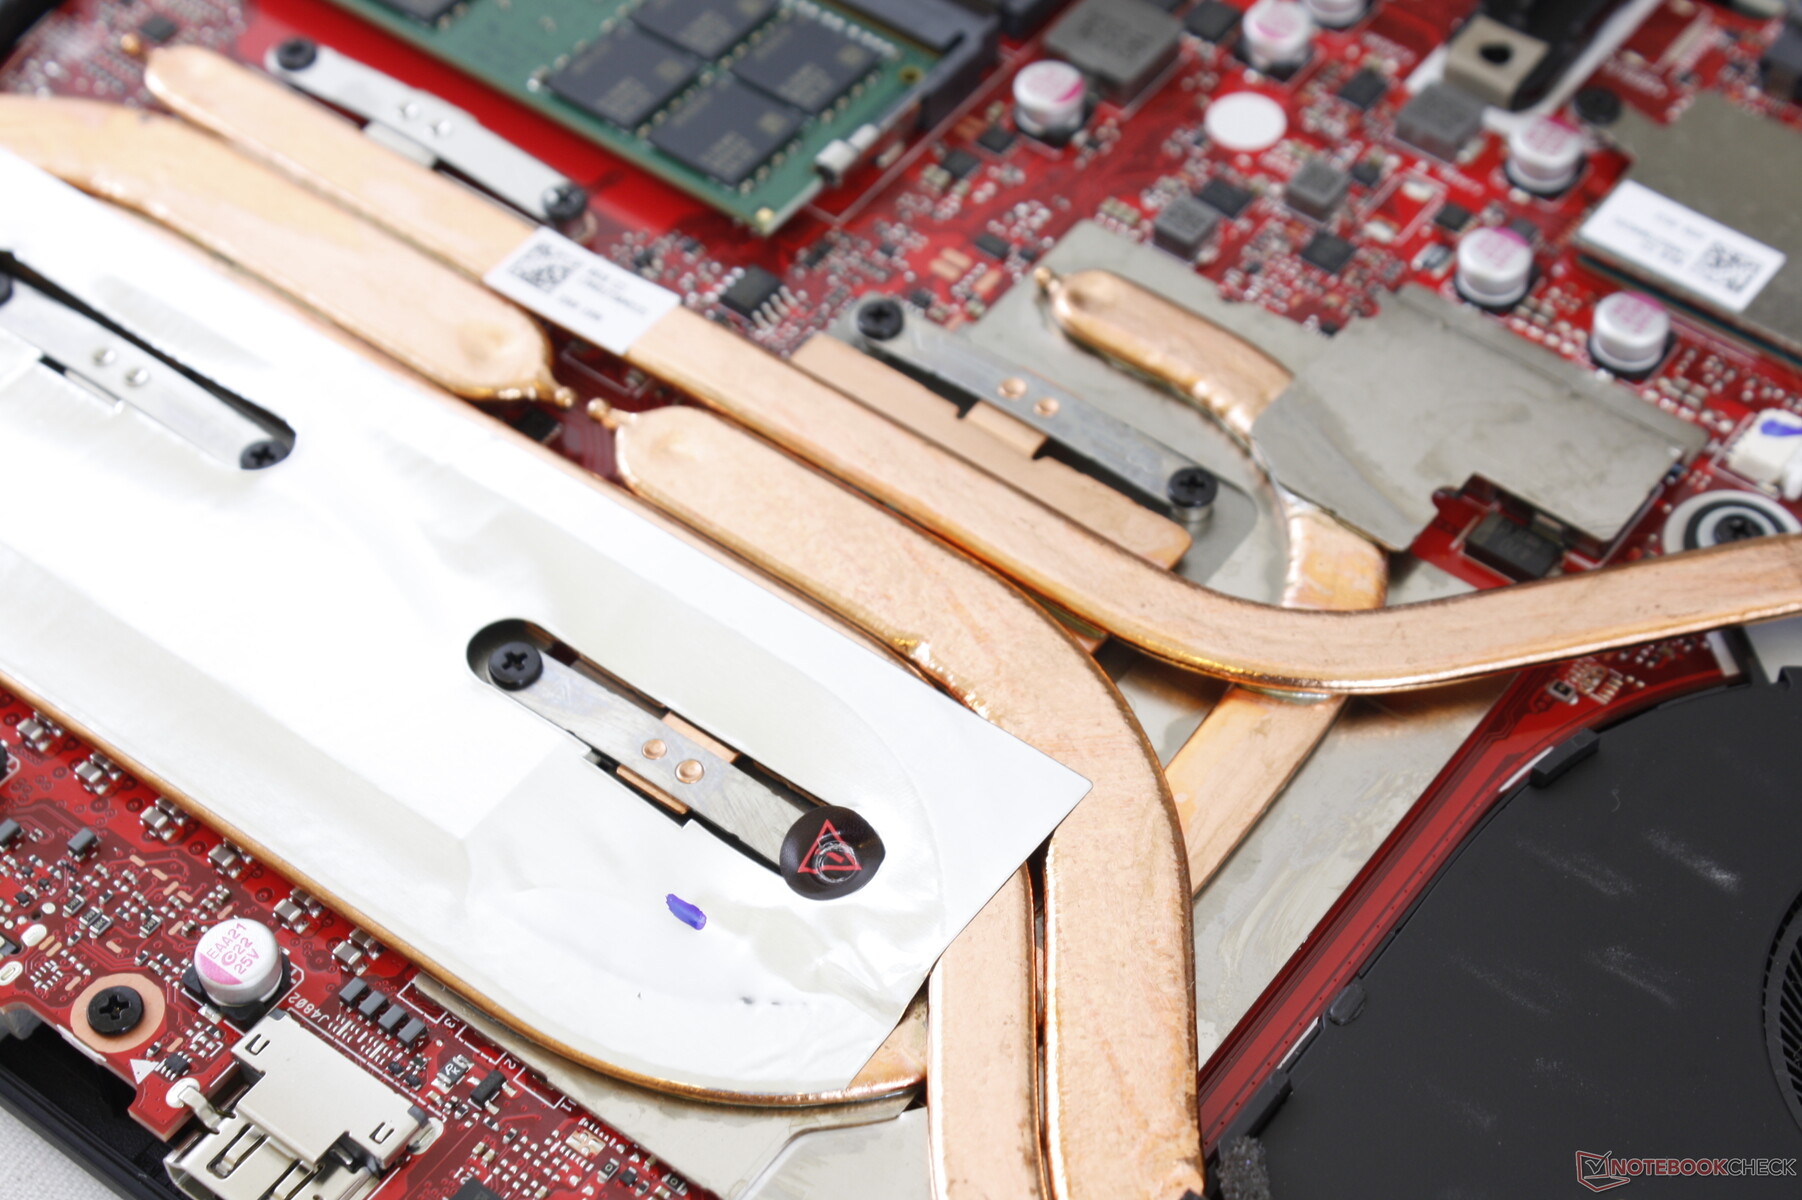
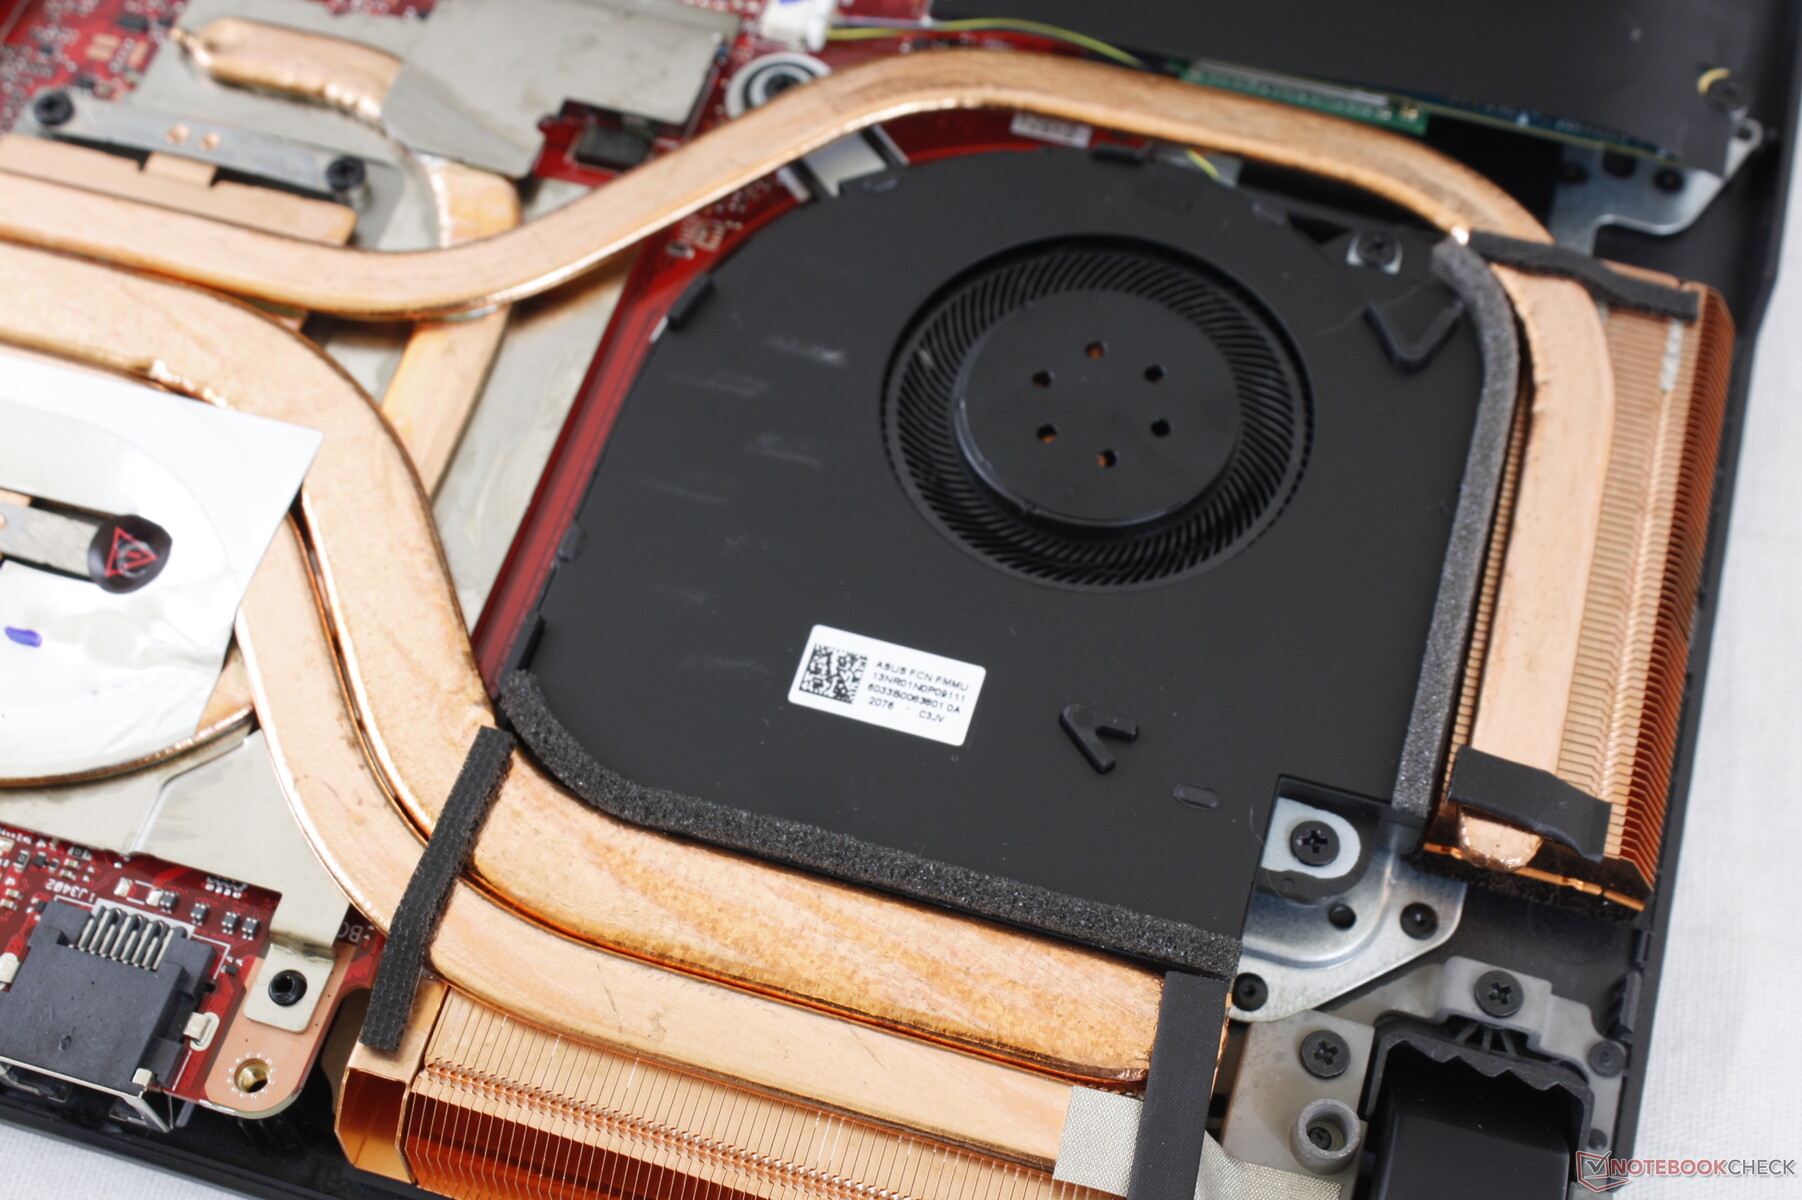
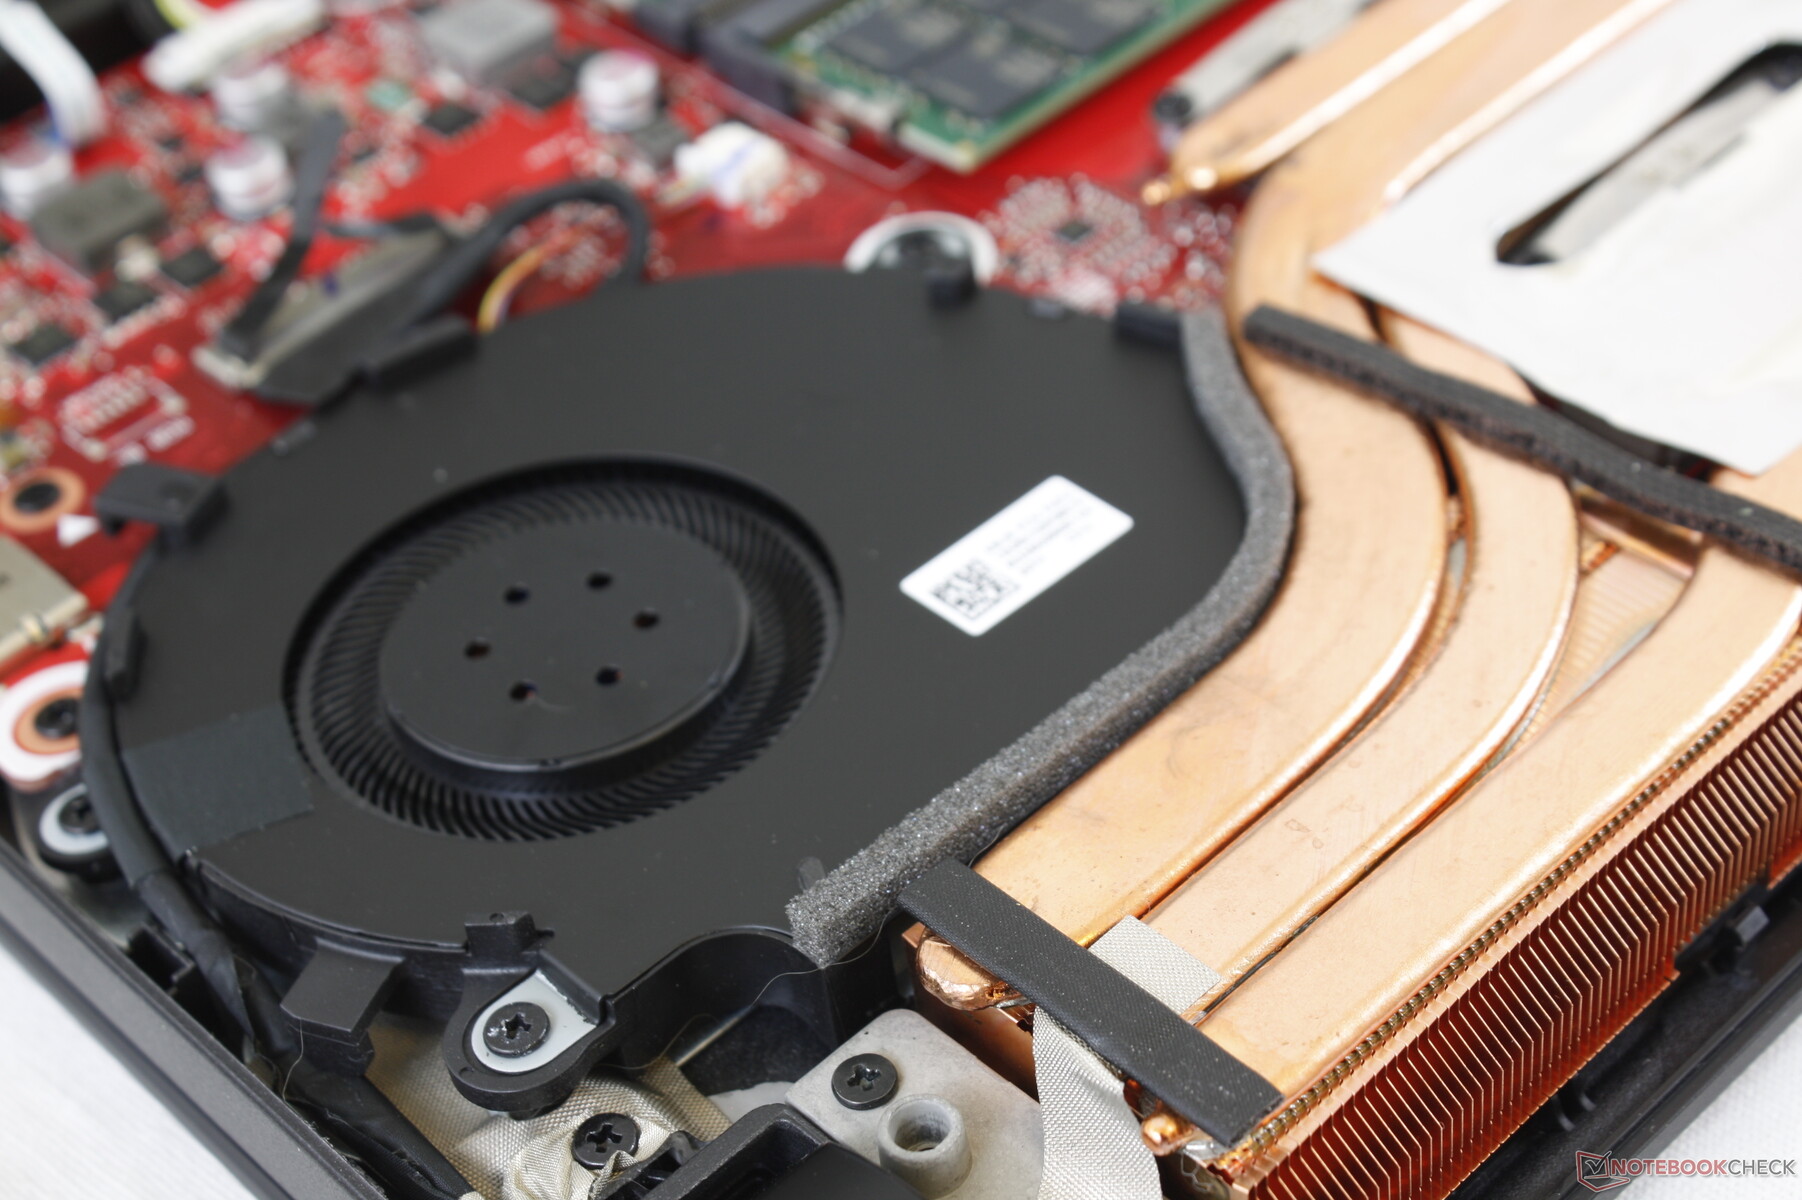
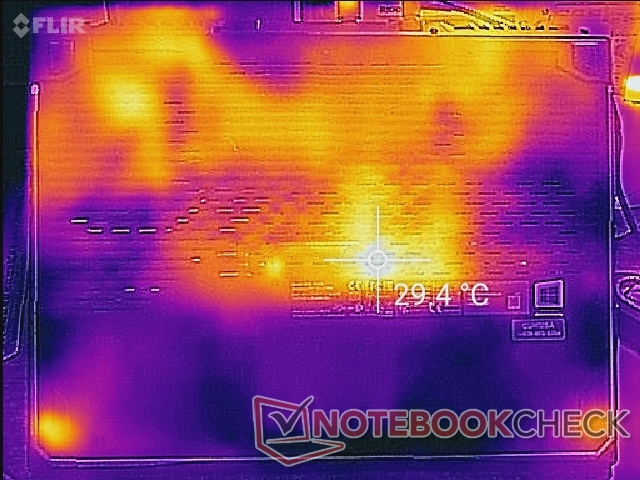
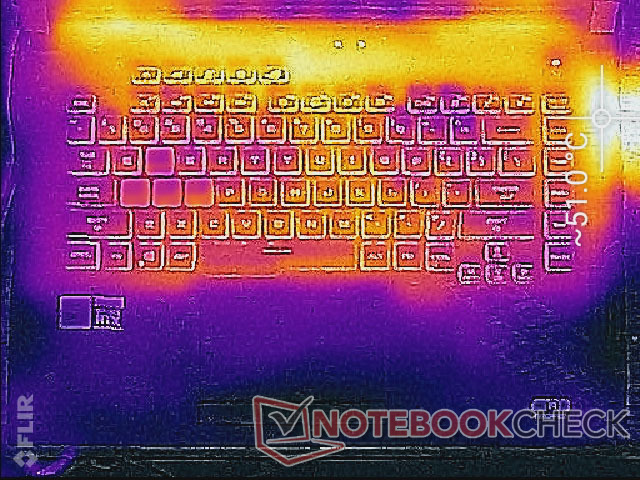
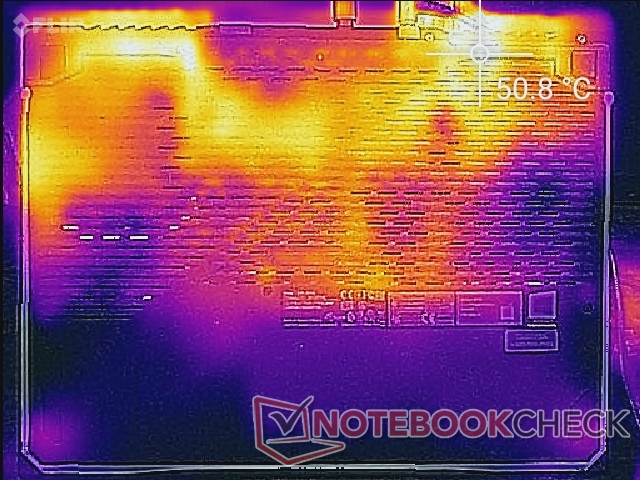
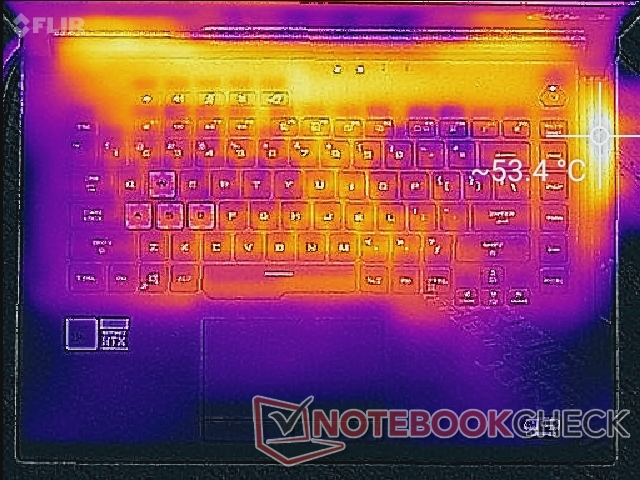
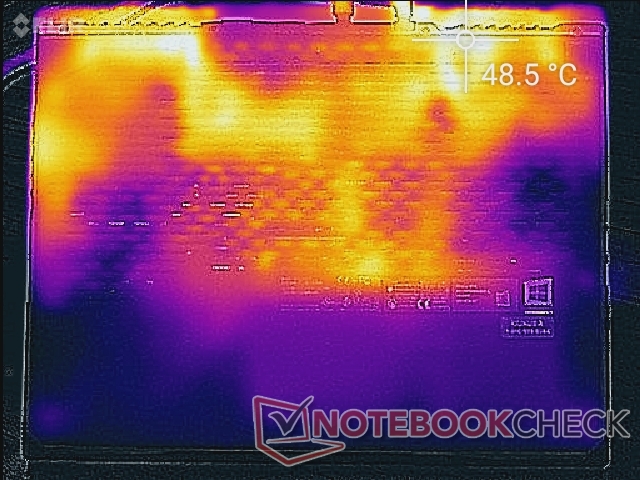
Le temperature di superficiali sono leggermente diverse da quelle del G512LI perché il G512LW incorpora una ventola supplementare lungo il bordo destro del telaio. Di conseguenza, il bordo destro del laptop sarà molto più caldo di questo stesso punto del G512LI. I poggiapolsi e la maggior parte dei tasti della tastiera rimangono più freddi al tatto, specialmente se paragonati ai laptop gaming unibody ultrasottili come il Razer Blade 15.
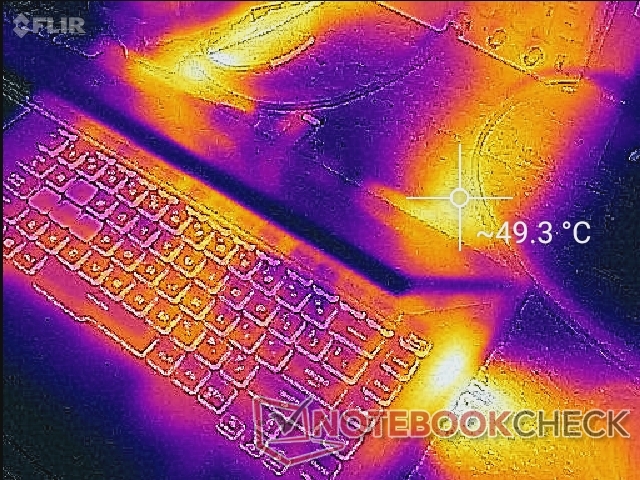
(-) La temperatura massima sul lato superiore è di 53.4 °C / 128 F, rispetto alla media di 40.4 °C / 105 F, che varia da 21.2 a 68.8 °C per questa classe Gaming.
(-) Il lato inferiore si riscalda fino ad un massimo di 49 °C / 120 F, rispetto alla media di 43.2 °C / 110 F
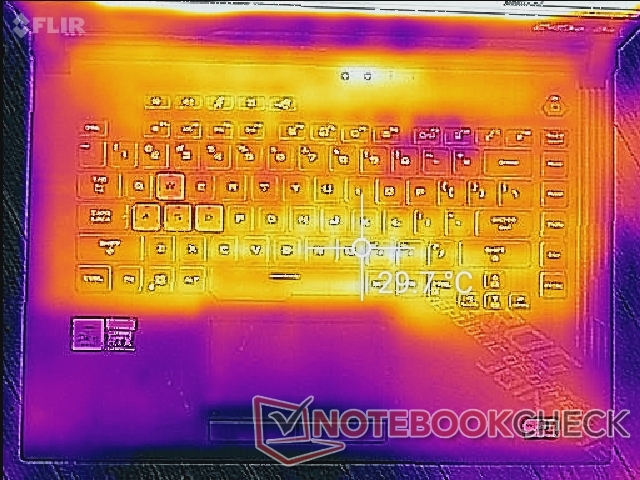
(+) In idle, la temperatura media del lato superiore è di 28.4 °C / 83 F, rispetto alla media deld ispositivo di 33.9 °C / 93 F.
(±) Riproducendo The Witcher 3, la temperatura media per il lato superiore e' di 34.1 °C / 93 F, rispetto alla media del dispositivo di 33.9 °C / 93 F.
(+) I poggiapolsi e il touchpad sono piu' freddi della temperatura della pelle con un massimo di 27.6 °C / 81.7 F e sono quindi freddi al tatto.
(±) La temperatura media della zona del palmo della mano di dispositivi simili e'stata di 28.8 °C / 83.8 F (+1.2 °C / 2.1 F).
Stress Test
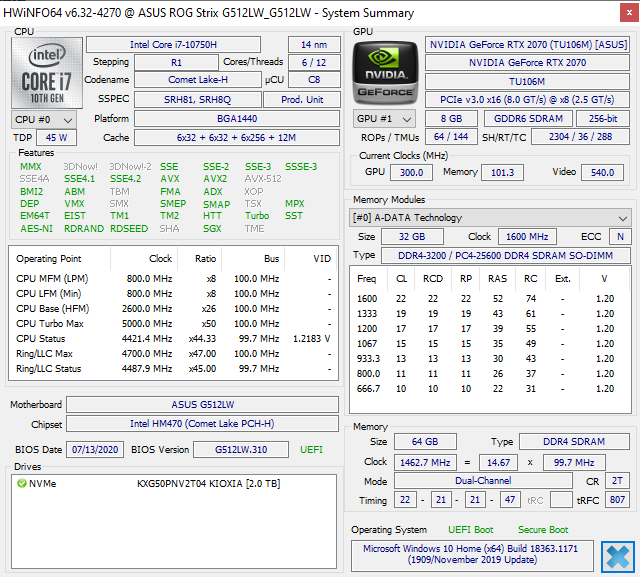
Quando è stressata con Prime95, la CPU s attesta a 4,2 GHz senza scendere successivamente rispecchiando i risultati del nostro CineBench R15 xT loop test di cui sopra. Il portatile è in grado di mantenere alti i valori di Turbo Boost clock a tempo indeterminato.
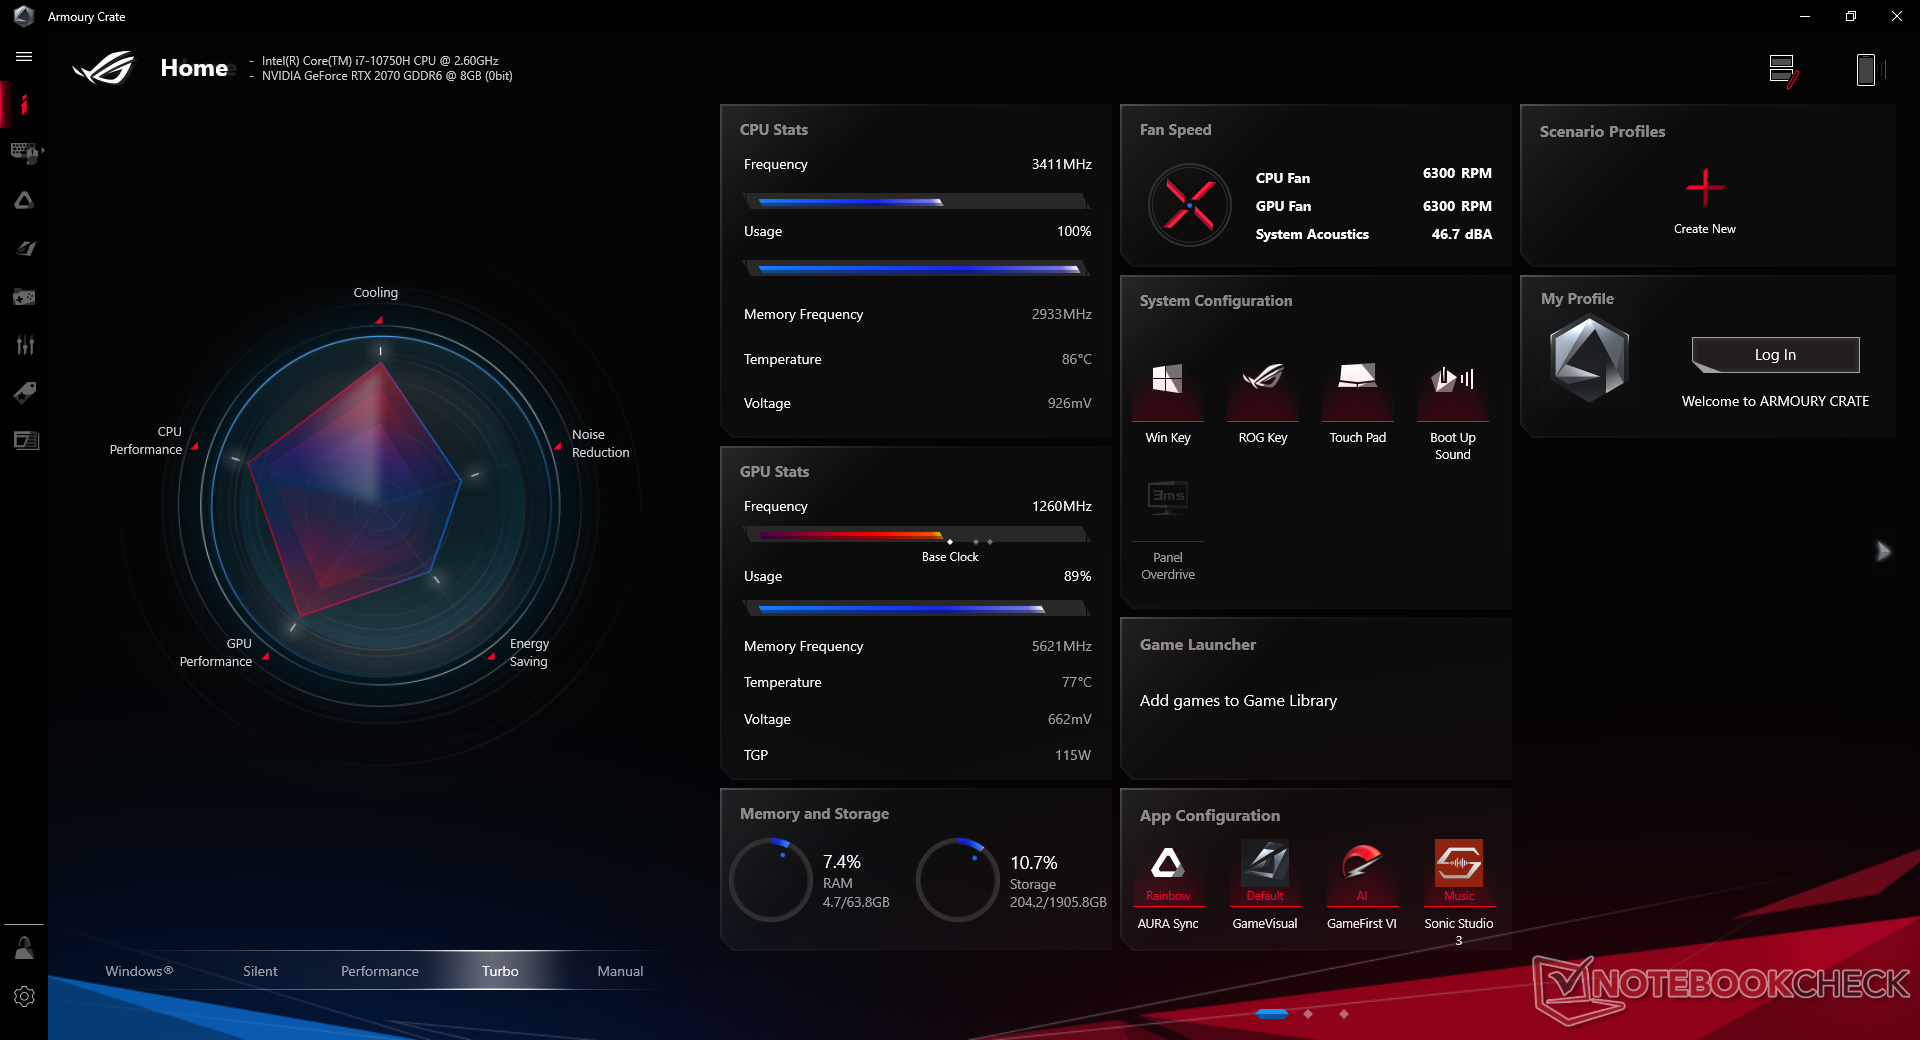
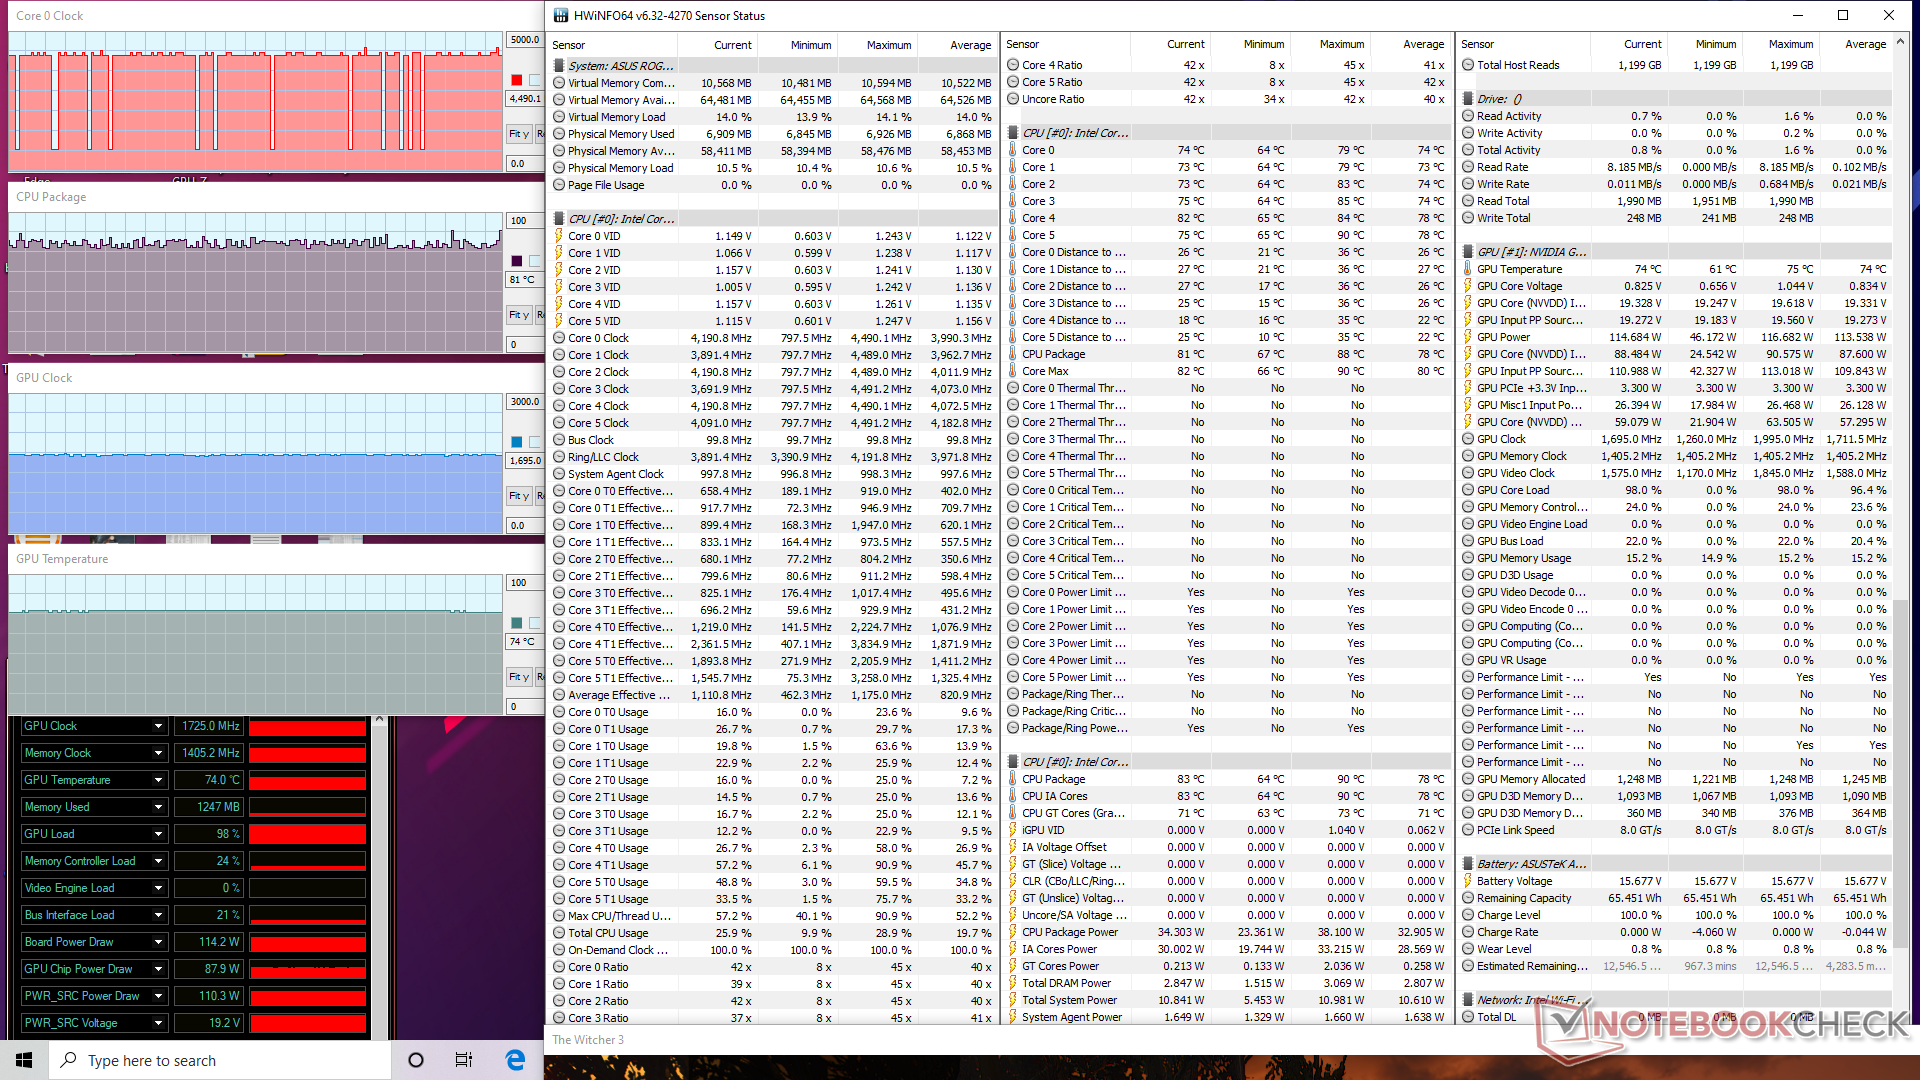
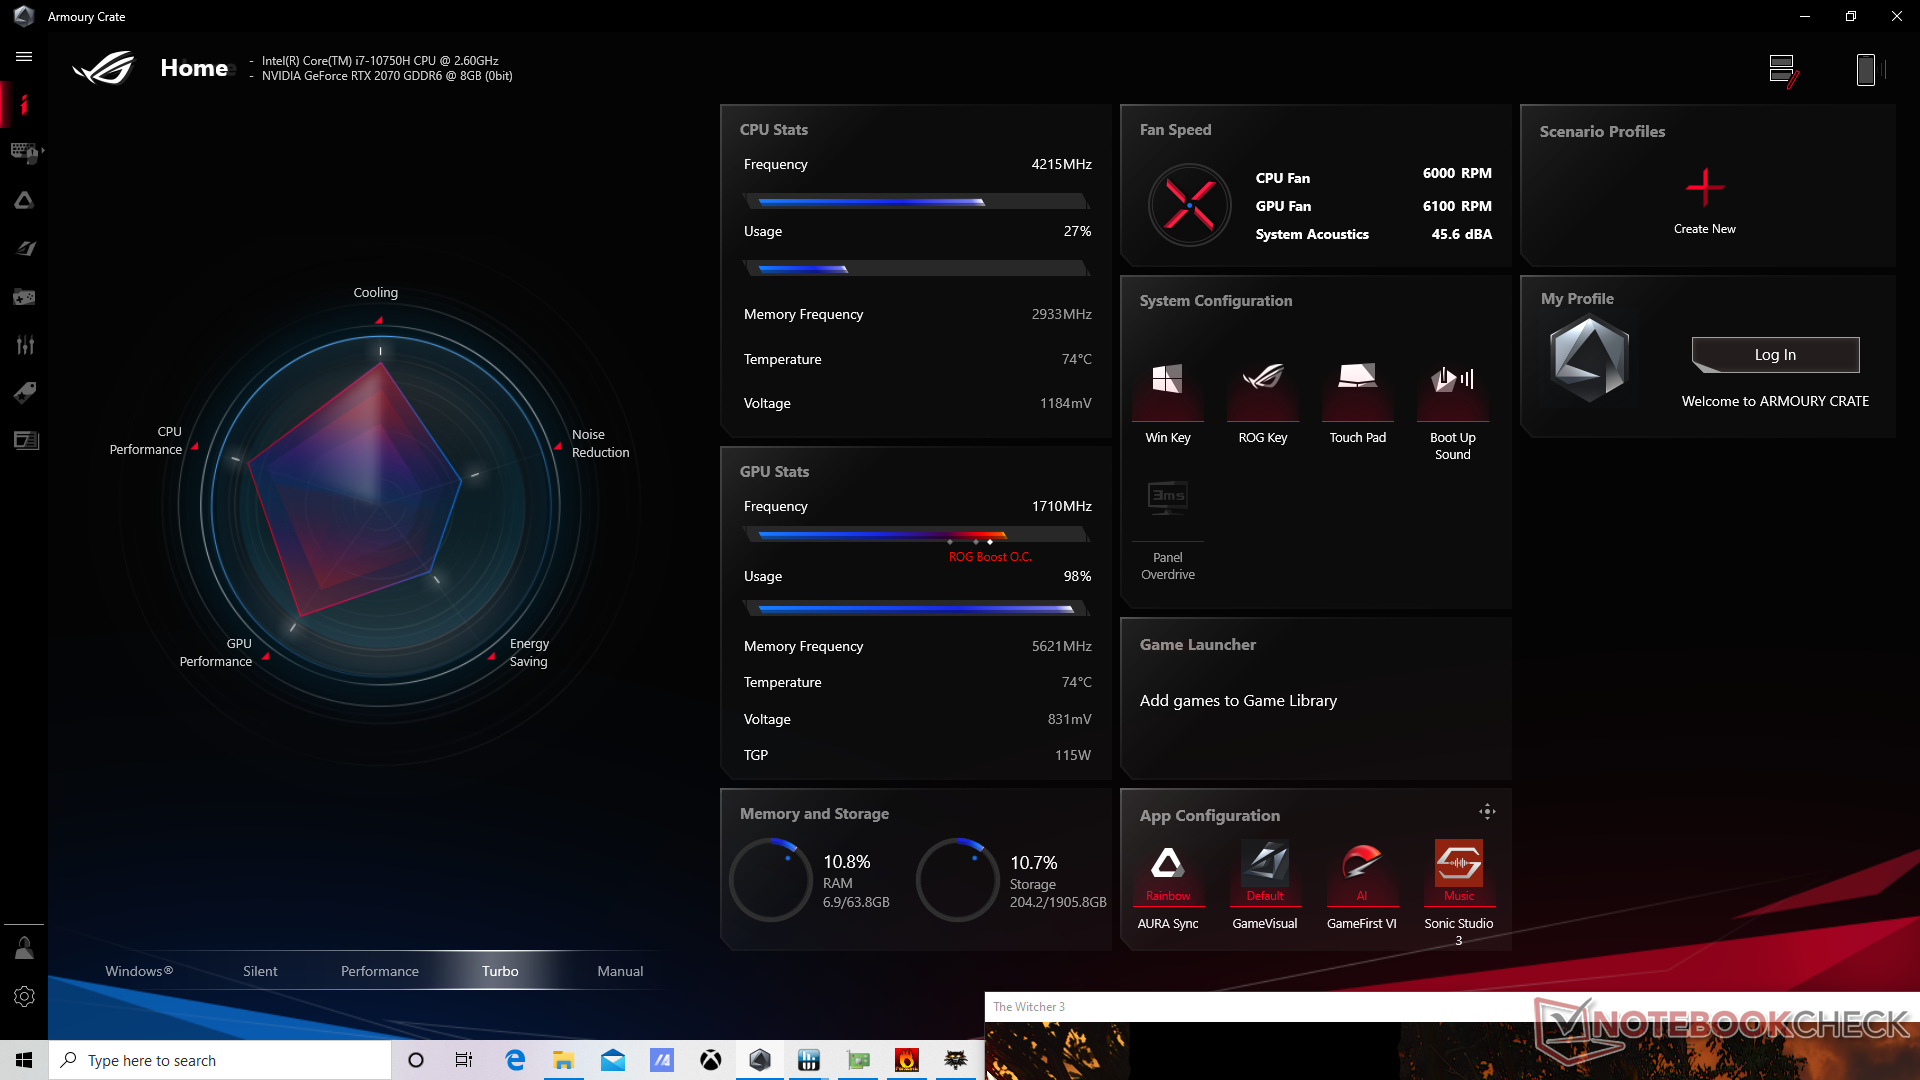
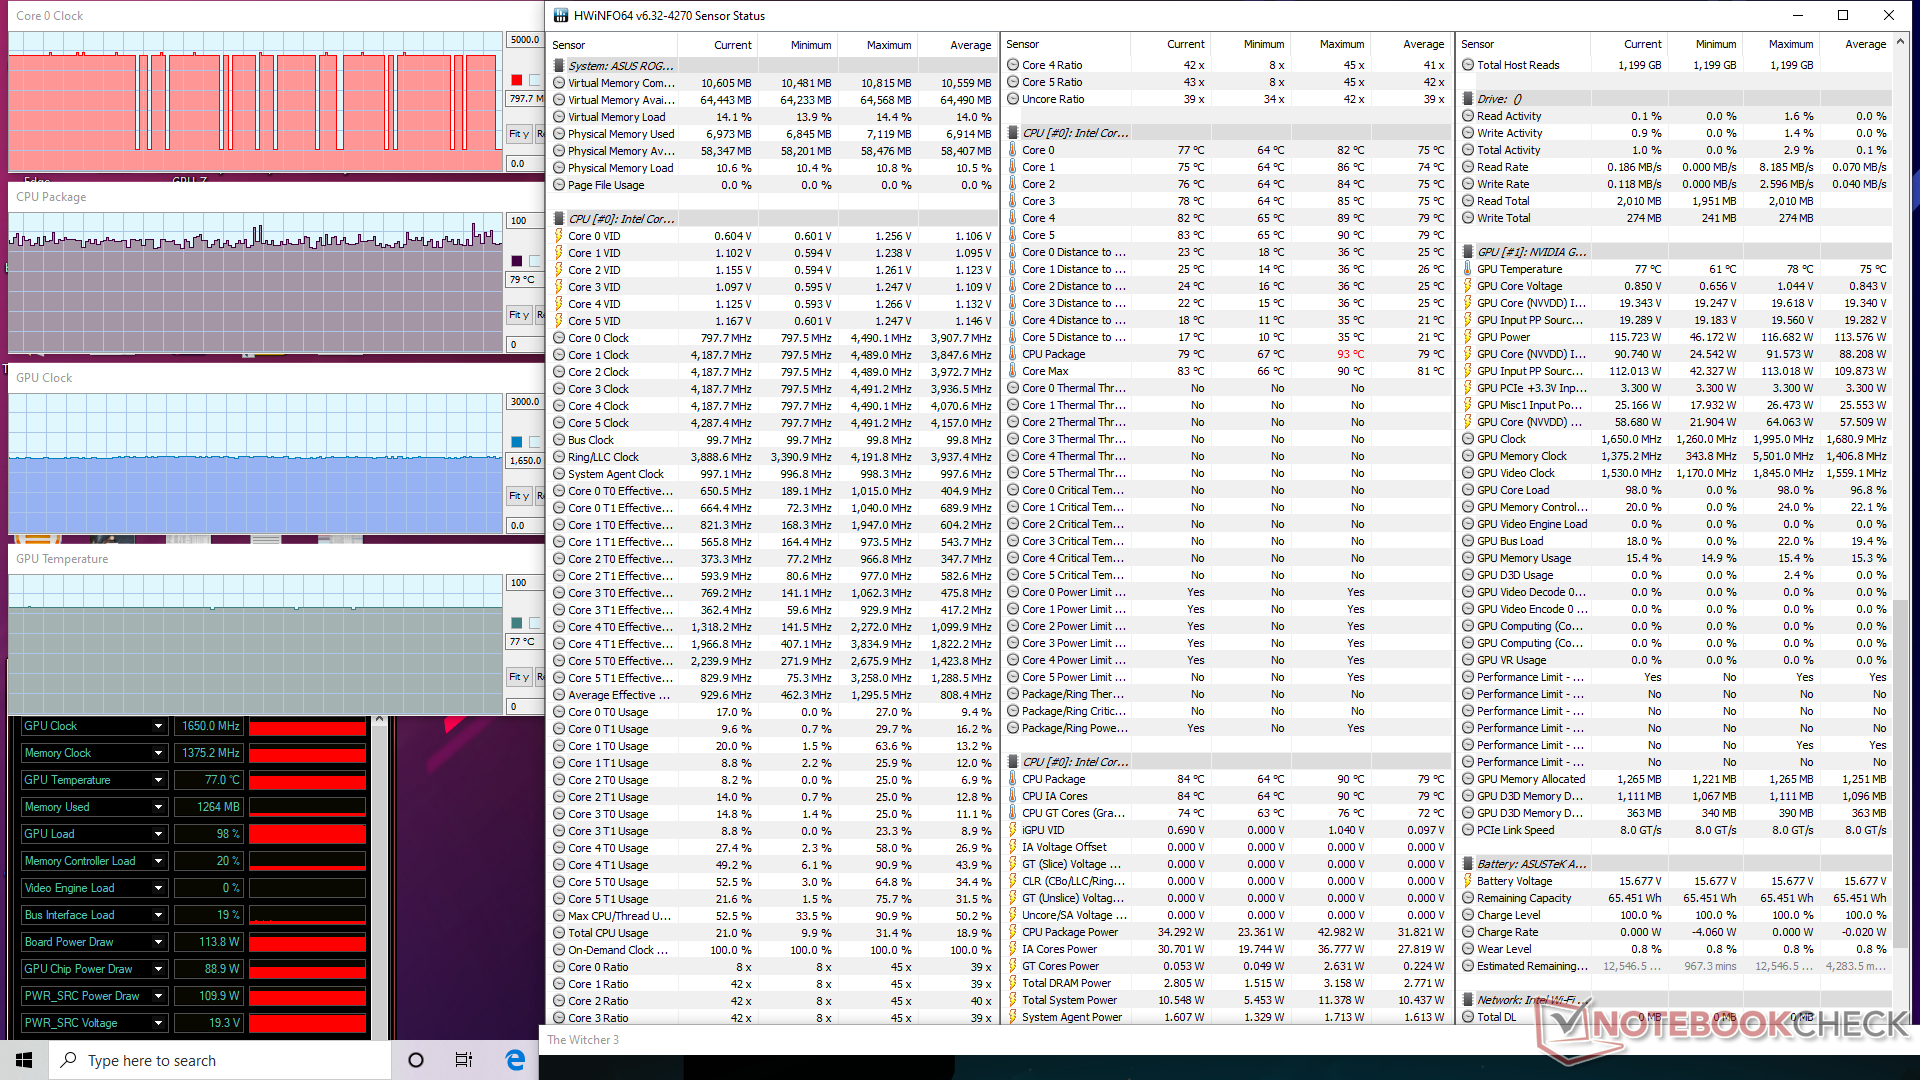
Lanciando The Witcher 3 in modalità Turbo si ottengono frequenze di clock leggermente più alte (1725 MHz vs. 1650 MHz) e frequenze di memoria (1405,2 MHz vs. 1375,2 MHz) rispetto alla modalità Performance senza influire sulle temperature del core, poiché anche il numero di giri della ventola aumenta leggermente. Le temperature di CPU e GPU si attestano rispettivamente a circa 80° C e 74° C, rispetto ai soli 60° C ciascuno del G512LI più lento in condizioni di gioco simili.
Usando la batteria si avrà un impatto sulle prestazioni. Un test 3DMark 11 effettuato usando la batteria restituisce punteggi Physics e Graphics di 9811 e 10435 punti, rispettivamente, rispetto ai 13512 e 27298 punti ottenuti conil collegamento alla rete elettrica.
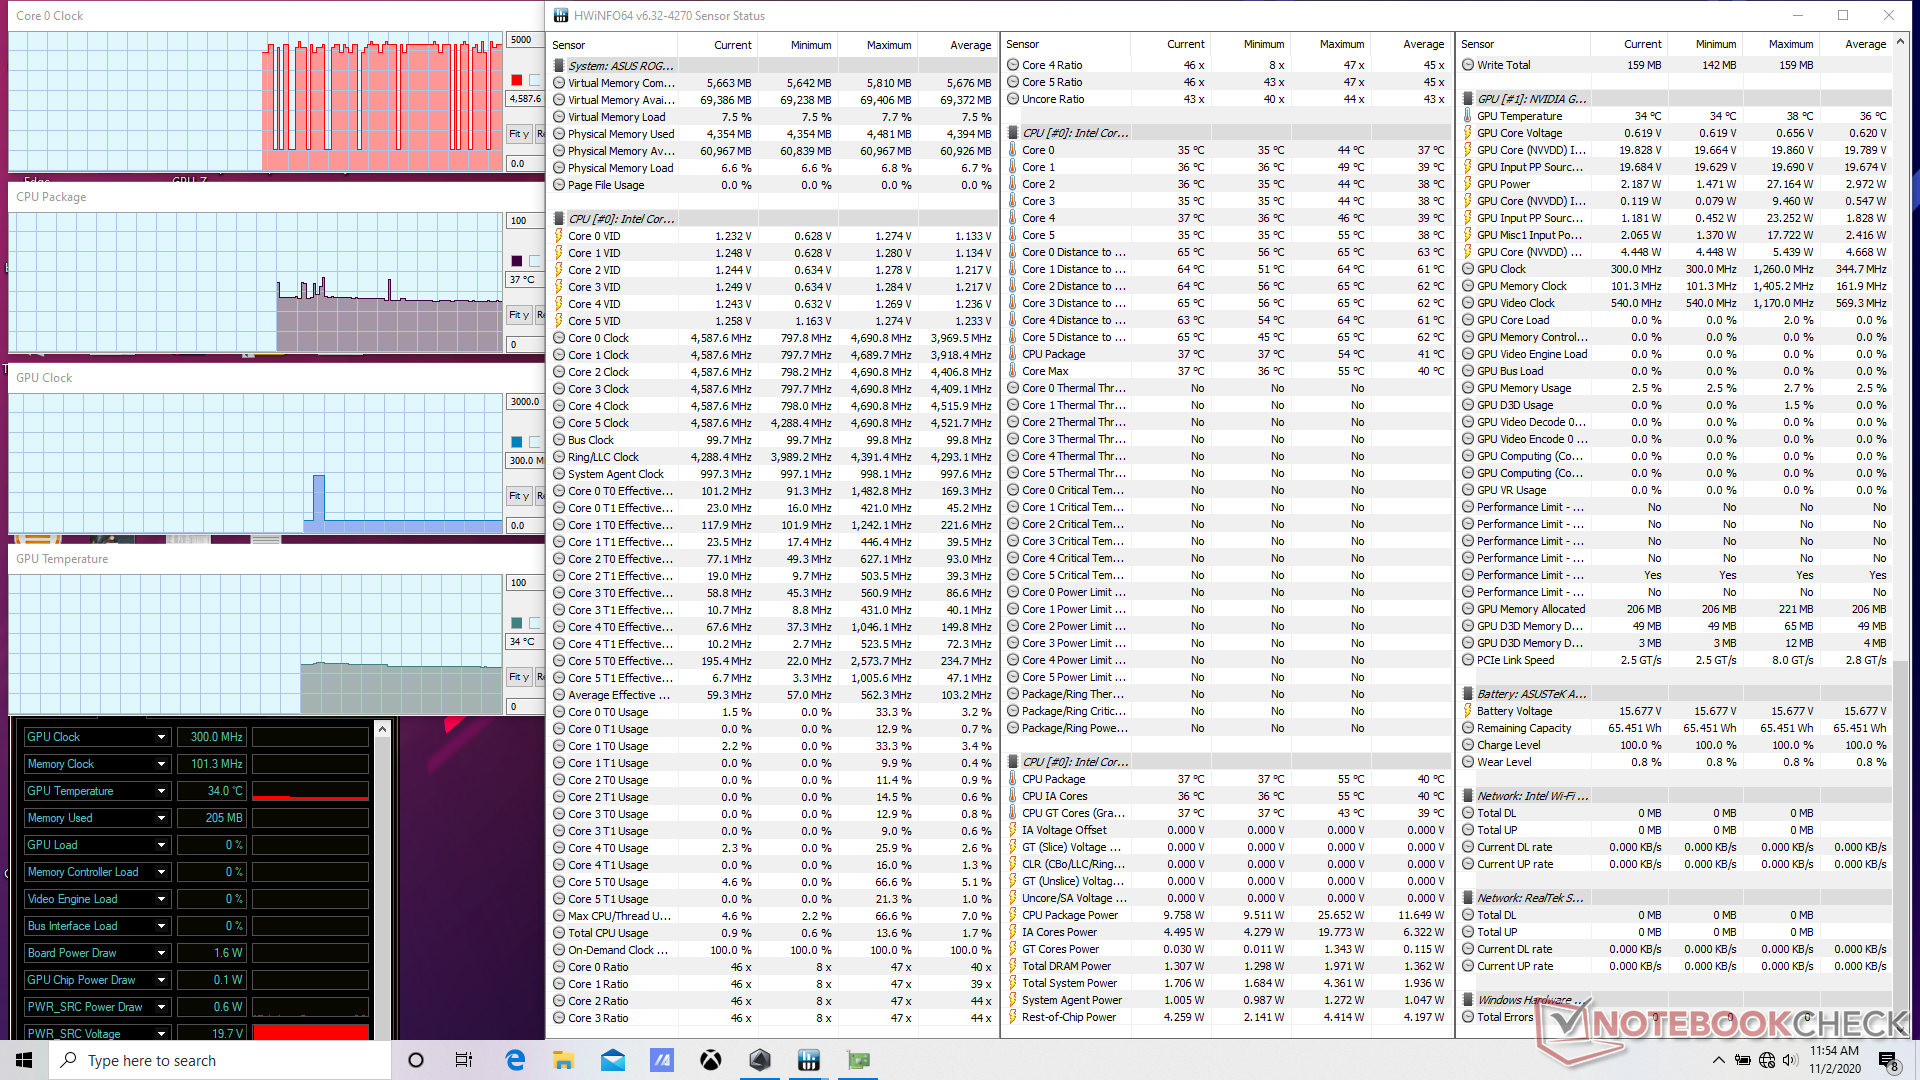
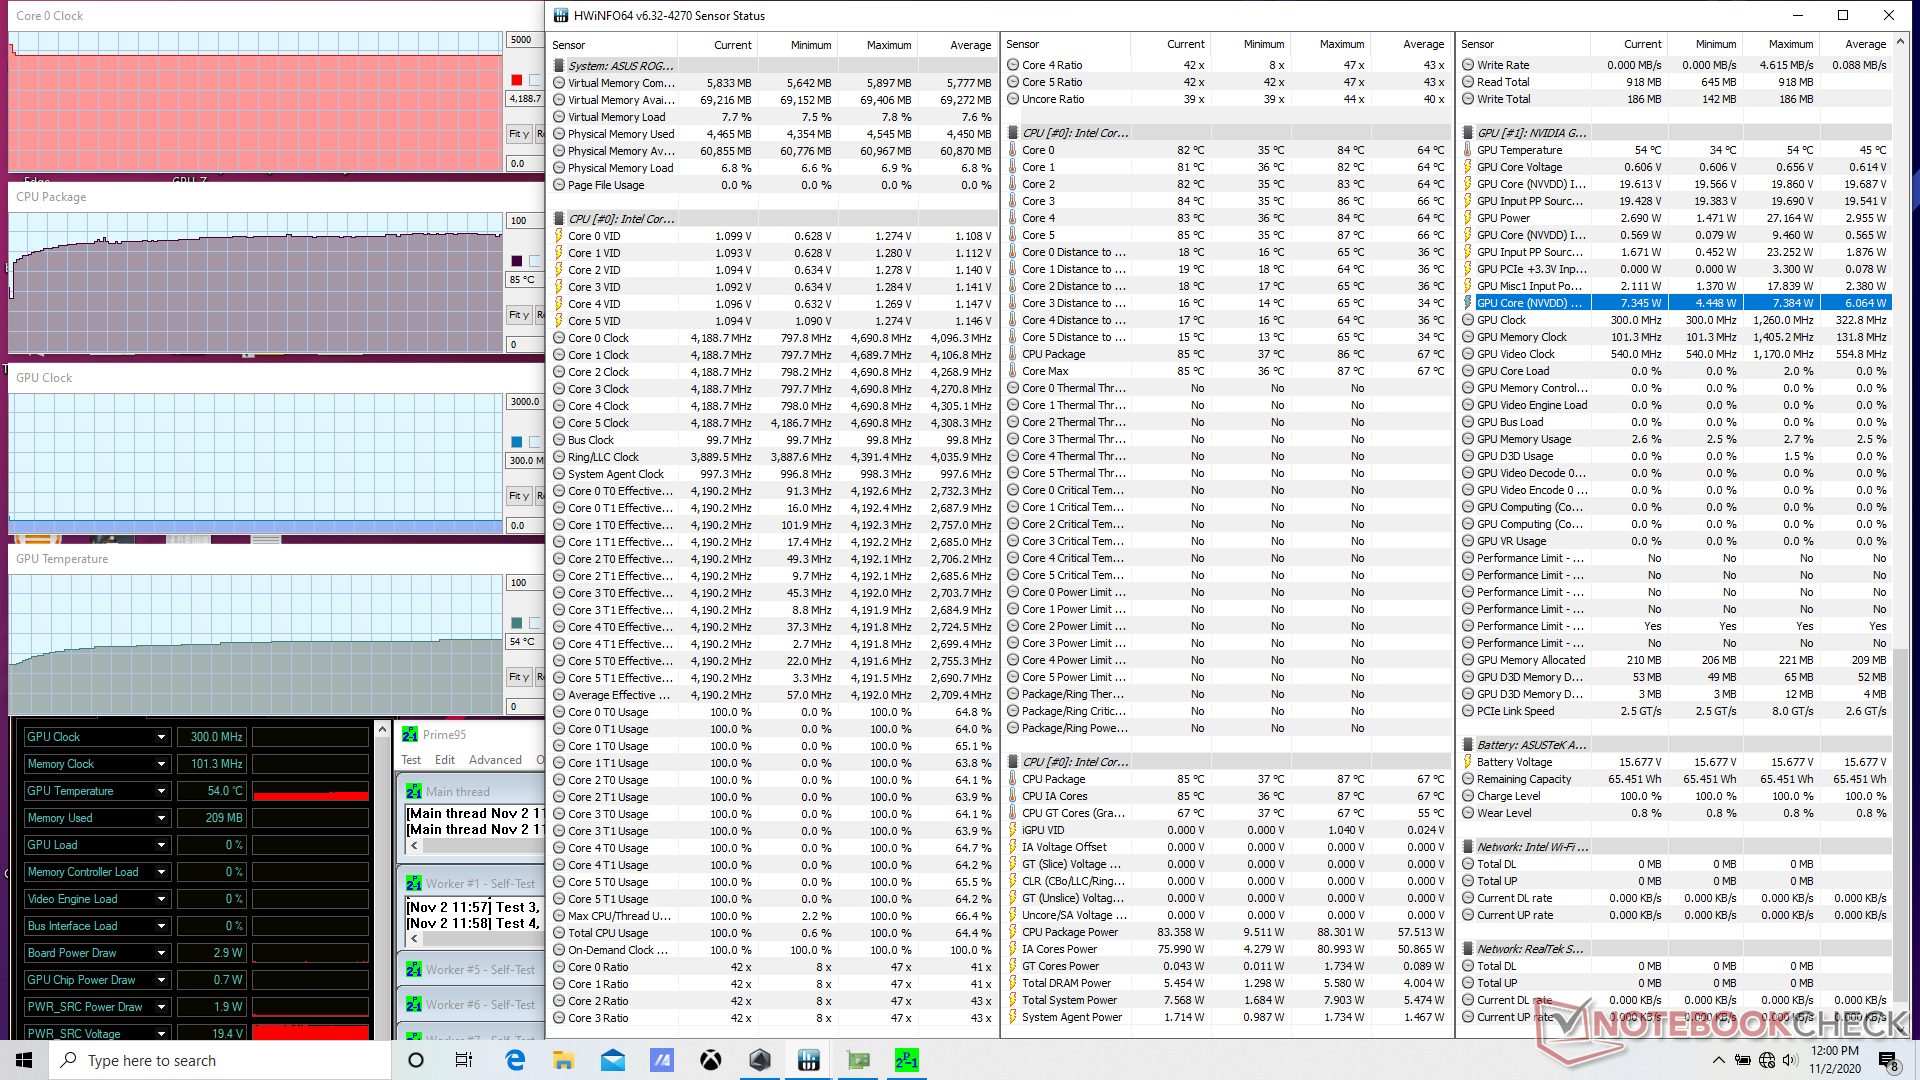
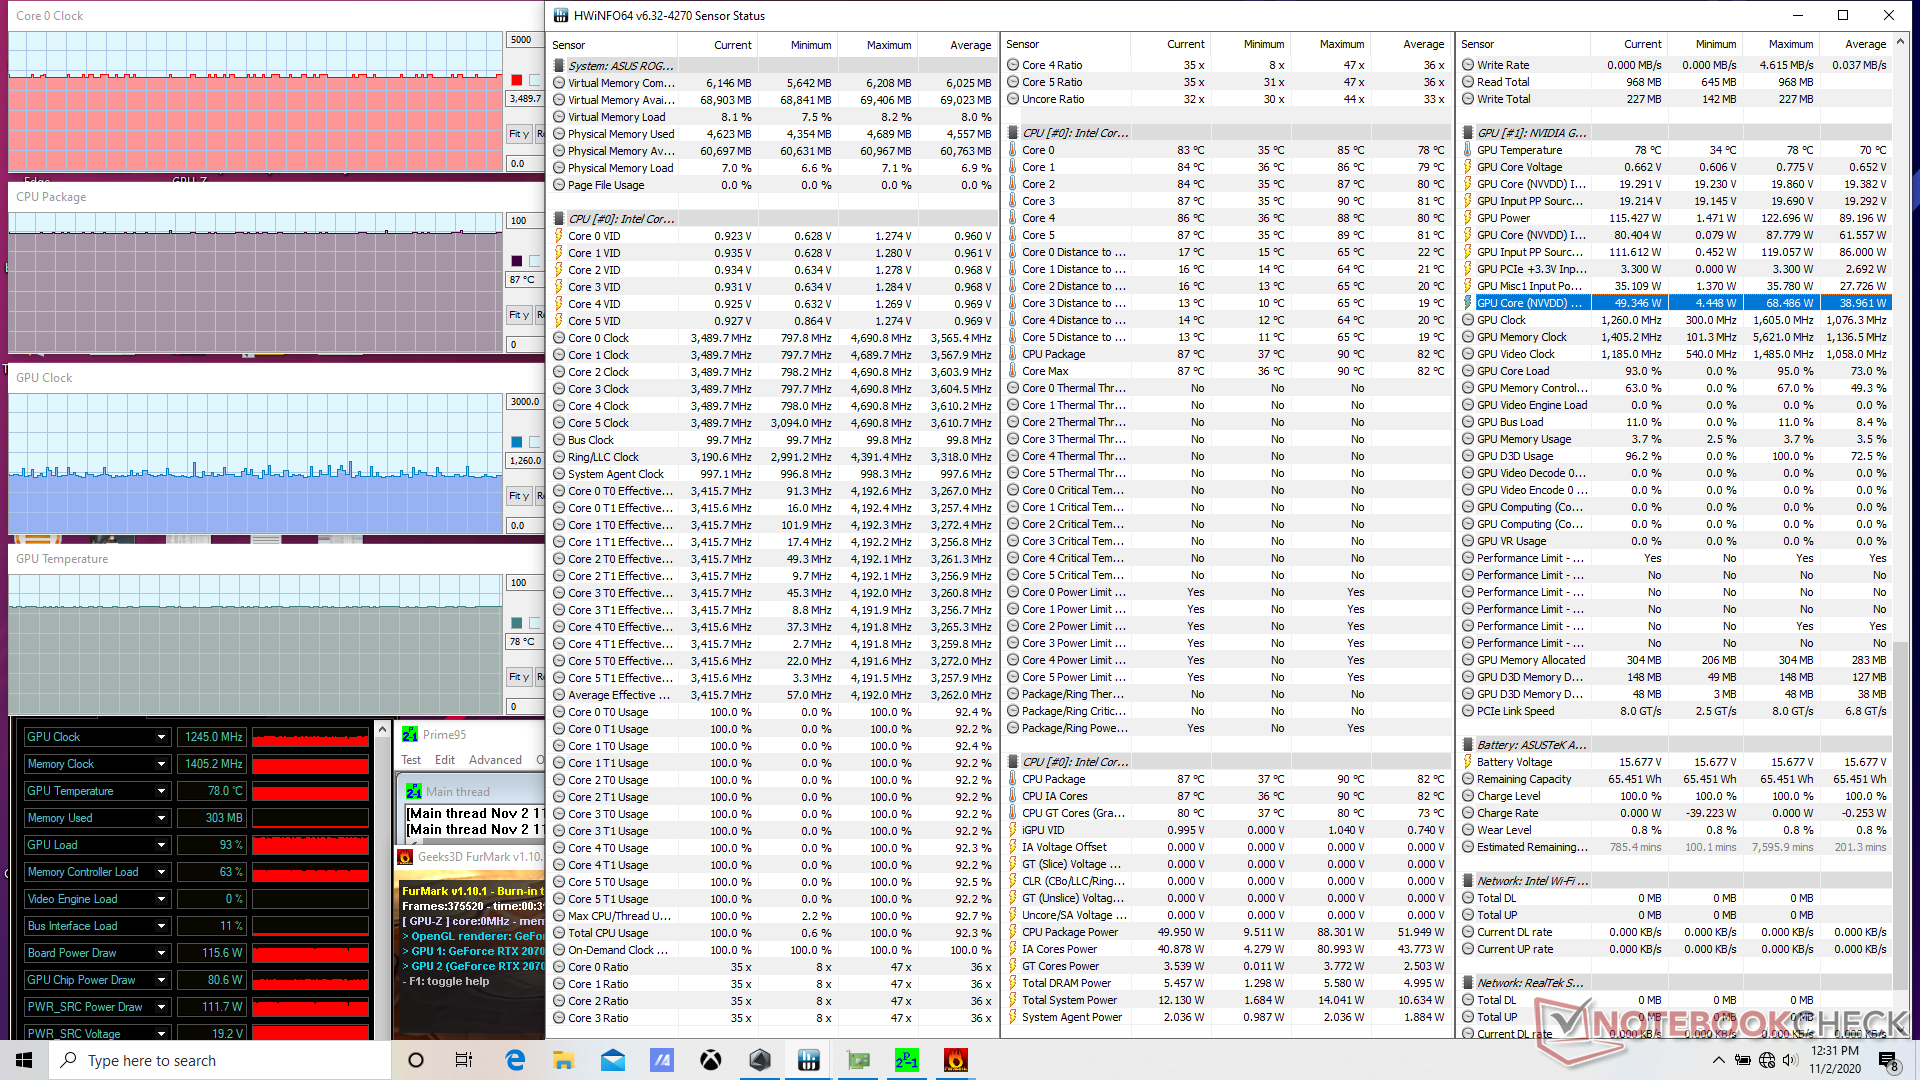
| Orologio PCU(GHz) | Orologio GPU (MHz) | Temperatura media dellaCPU (°C) | Temperatura media dellaGPU (°C) | |
| Sistema inattivo | -------- | 37 | 34 | |
| Prime95 Stress | 4.2 | -- | 85 | 54 |
| Prime95 + FurMark Stress (modalità Turbo) | 3,4 - 3,5 | 1245 | 87 | 78 |
| Witcher 3 Stress (Modalità Performance) | 0,8 - 4,2 | 1650 | ~79 | 77 |
| Witcher 3 Stress (modalità Turbo | 0,8 - 4,2 | 1725 | ~80 | 74 |
Altoparlanti


Asus ROG Strix G15 G512LW analisi audio
(+) | gli altoparlanti sono relativamente potenti (83.8 dB)
Bassi 100 - 315 Hz
(±) | bassi ridotti - in media 8.8% inferiori alla media
(±) | la linearità dei bassi è media (7.8% delta rispetto alla precedente frequenza)
Medi 400 - 2000 Hz
(±) | medi elevati - circa 7.5% superiore alla media
(+) | medi lineari (6.2% delta rispetto alla precedente frequenza)
Alti 2 - 16 kHz
(+) | Alti bilanciati - appena 2.4% dalla media
(+) | alti lineari (6% delta rispetto alla precedente frequenza)
Nel complesso 100 - 16.000 Hz
(±) | la linearità complessiva del suono è media (16.4% di differenza rispetto alla media
Rispetto alla stessa classe
» 42% di tutti i dispositivi testati in questa classe è stato migliore, 6% simile, 52% peggiore
» Il migliore ha avuto un delta di 6%, medio di 18%, peggiore di 132%
Rispetto a tutti i dispositivi testati
» 27% di tutti i dispositivi testati in questa classe è stato migliore, 6% similare, 67% peggiore
» Il migliore ha avuto un delta di 4%, medio di 23%, peggiore di 134%
Apple MacBook 12 (Early 2016) 1.1 GHz analisi audio
(+) | gli altoparlanti sono relativamente potenti (83.6 dB)
Bassi 100 - 315 Hz
(±) | bassi ridotti - in media 11.3% inferiori alla media
(±) | la linearità dei bassi è media (14.2% delta rispetto alla precedente frequenza)
Medi 400 - 2000 Hz
(+) | medi bilanciati - solo only 2.4% rispetto alla media
(+) | medi lineari (5.5% delta rispetto alla precedente frequenza)
Alti 2 - 16 kHz
(+) | Alti bilanciati - appena 2% dalla media
(+) | alti lineari (4.5% delta rispetto alla precedente frequenza)
Nel complesso 100 - 16.000 Hz
(+) | suono nel complesso lineare (10.2% differenza dalla media)
Rispetto alla stessa classe
» 7% di tutti i dispositivi testati in questa classe è stato migliore, 2% simile, 91% peggiore
» Il migliore ha avuto un delta di 5%, medio di 18%, peggiore di 53%
Rispetto a tutti i dispositivi testati
» 5% di tutti i dispositivi testati in questa classe è stato migliore, 1% similare, 94% peggiore
» Il migliore ha avuto un delta di 4%, medio di 23%, peggiore di 134%
Gestione Energetica
Consumo di energia
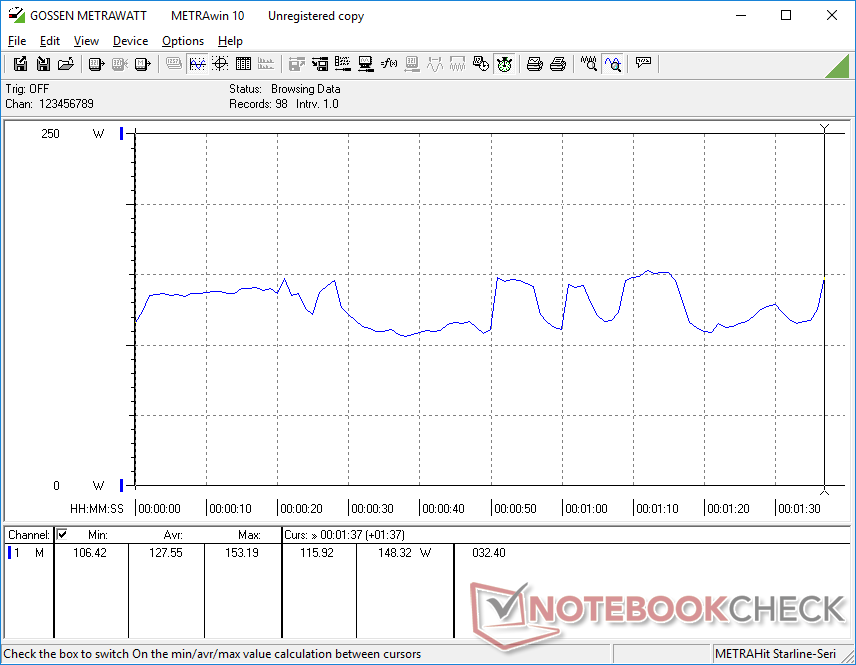
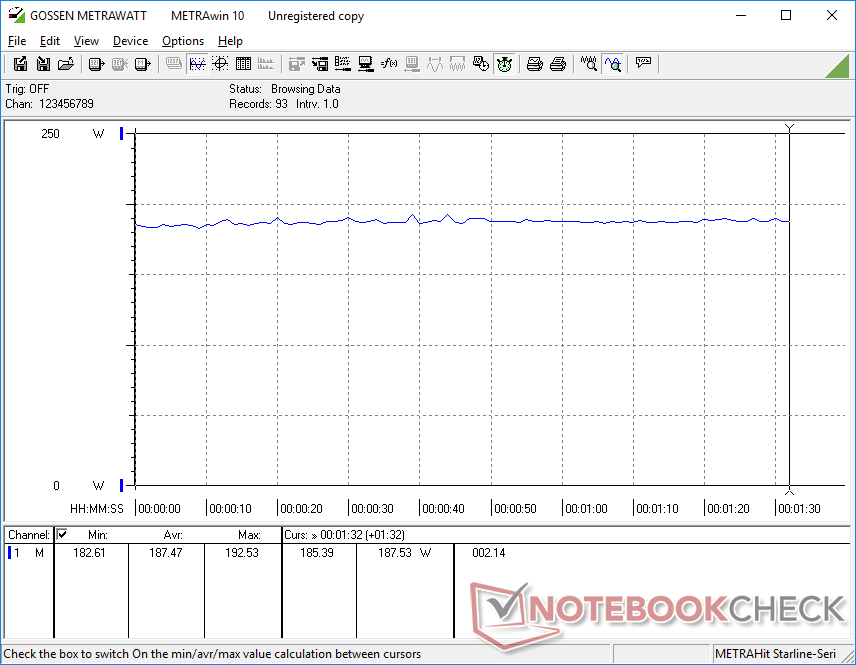
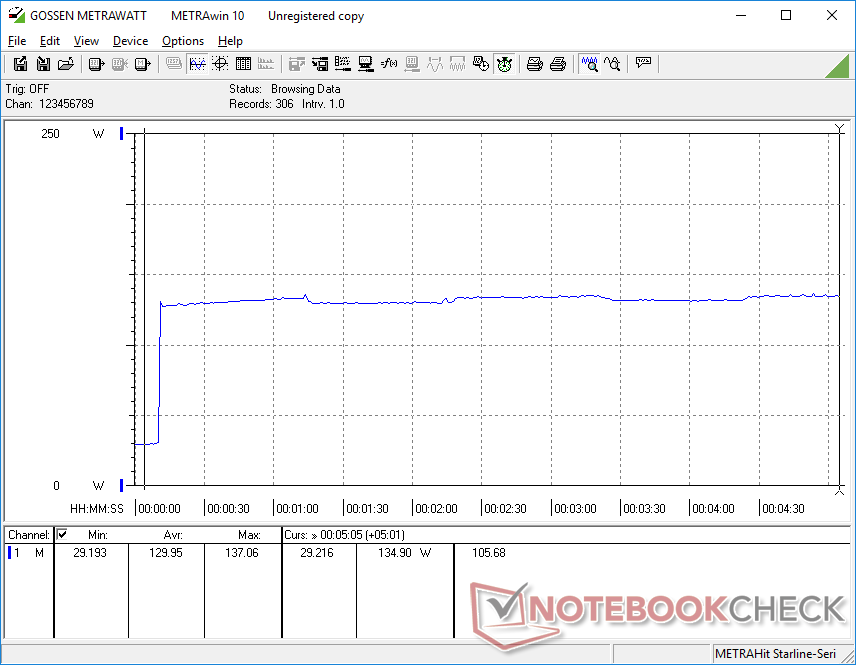
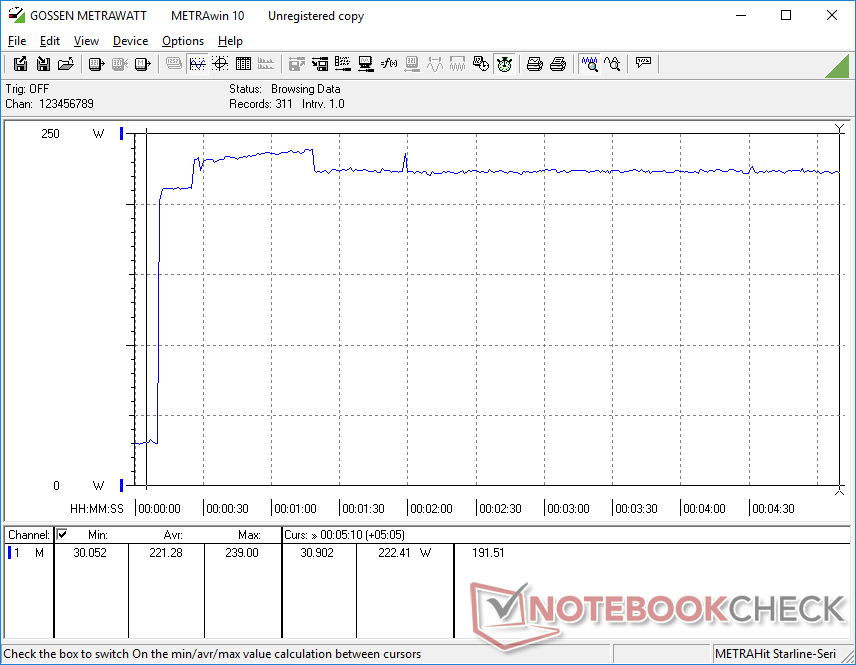
Il funzionamento a vuoto sul desktop richiederà tra 16 W e 31 W a seconda del profilo di luminosità e potenza. Per il resto, il gaming richiederà circa 187 W risultando simile a quello che abbiamo registrato sul MSI GP65 10SFK dotato della stessa CPU e GPU. Il consumo è circa 2 volte superiore a quello del G512LI che si allinea con le prestazioni grafiche 2 volte superiori di cui sopra.
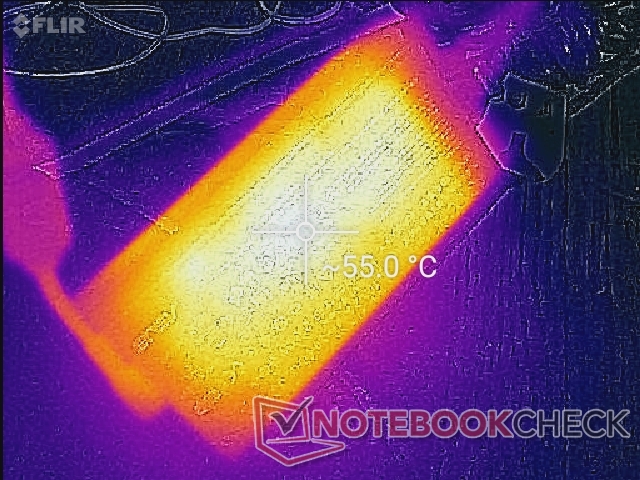
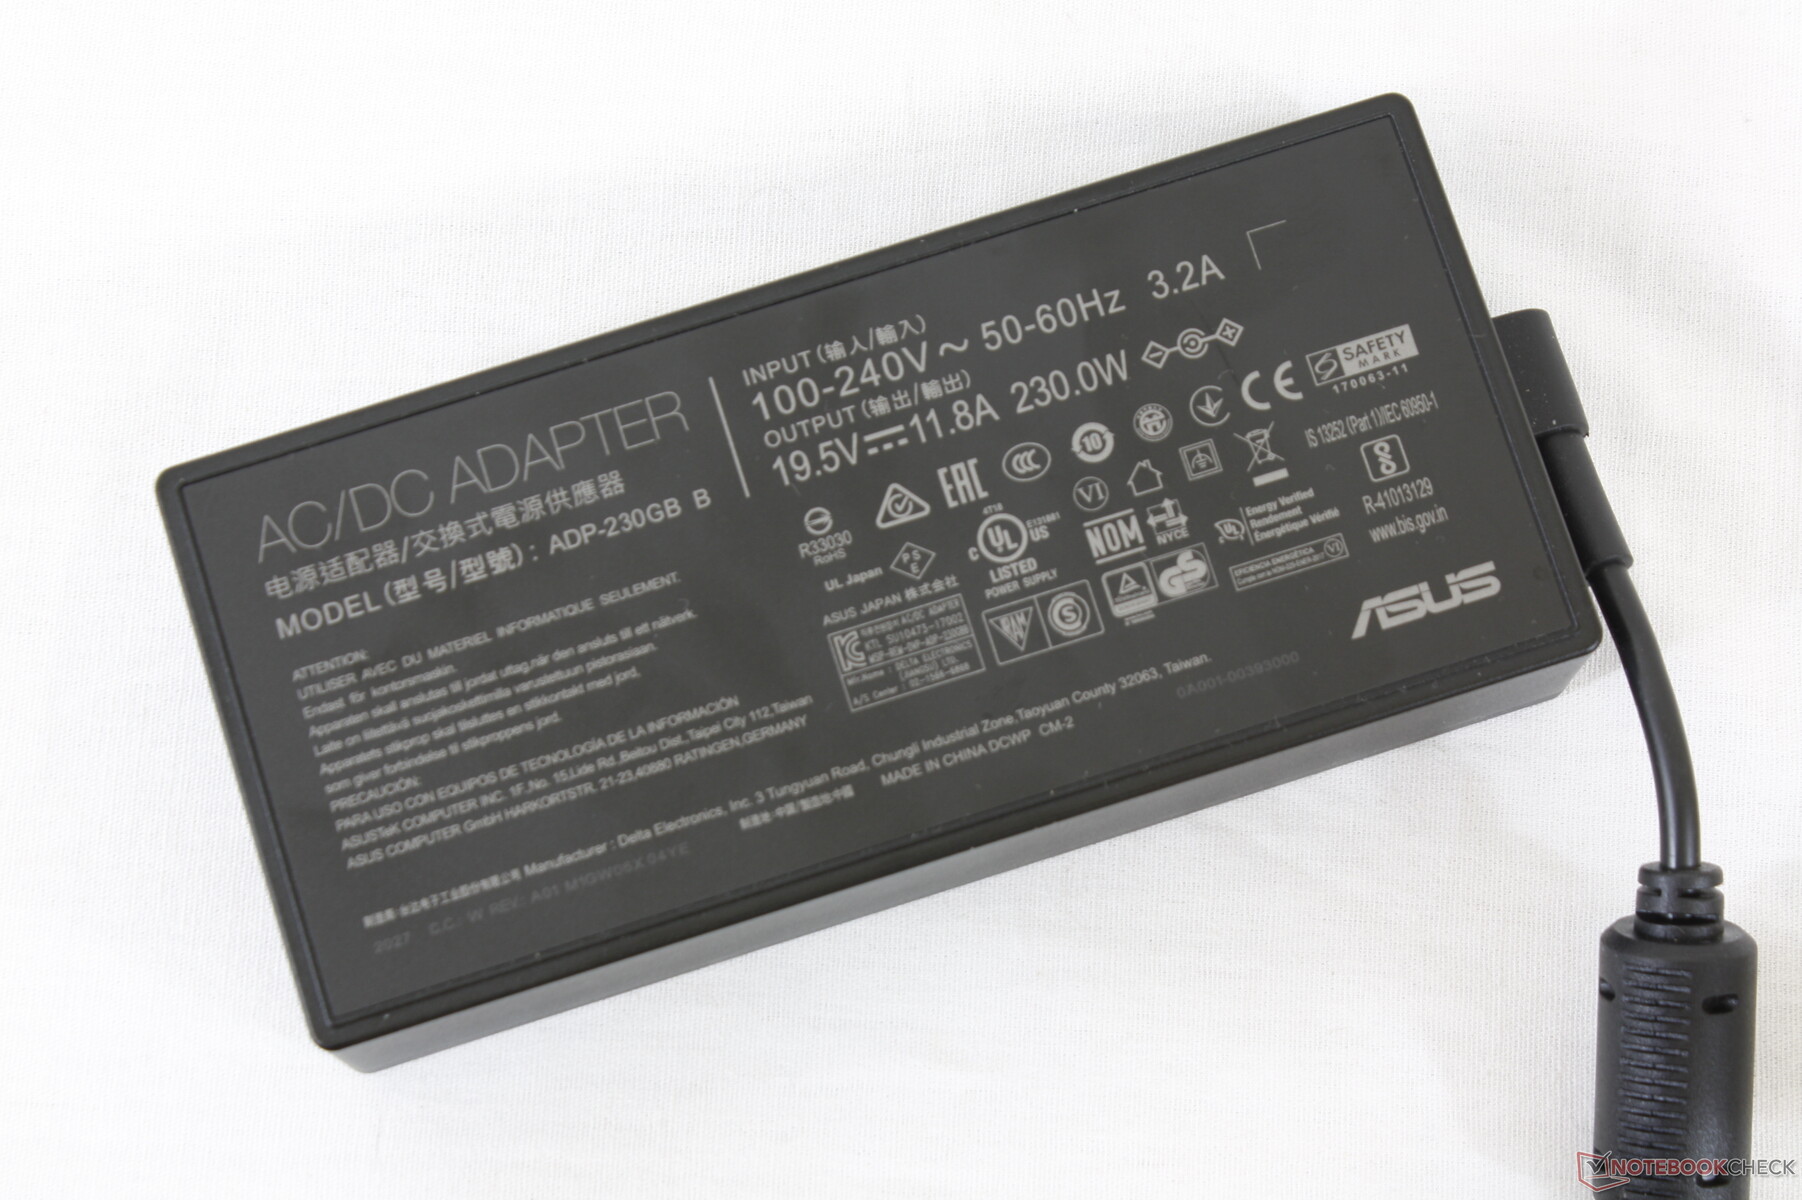
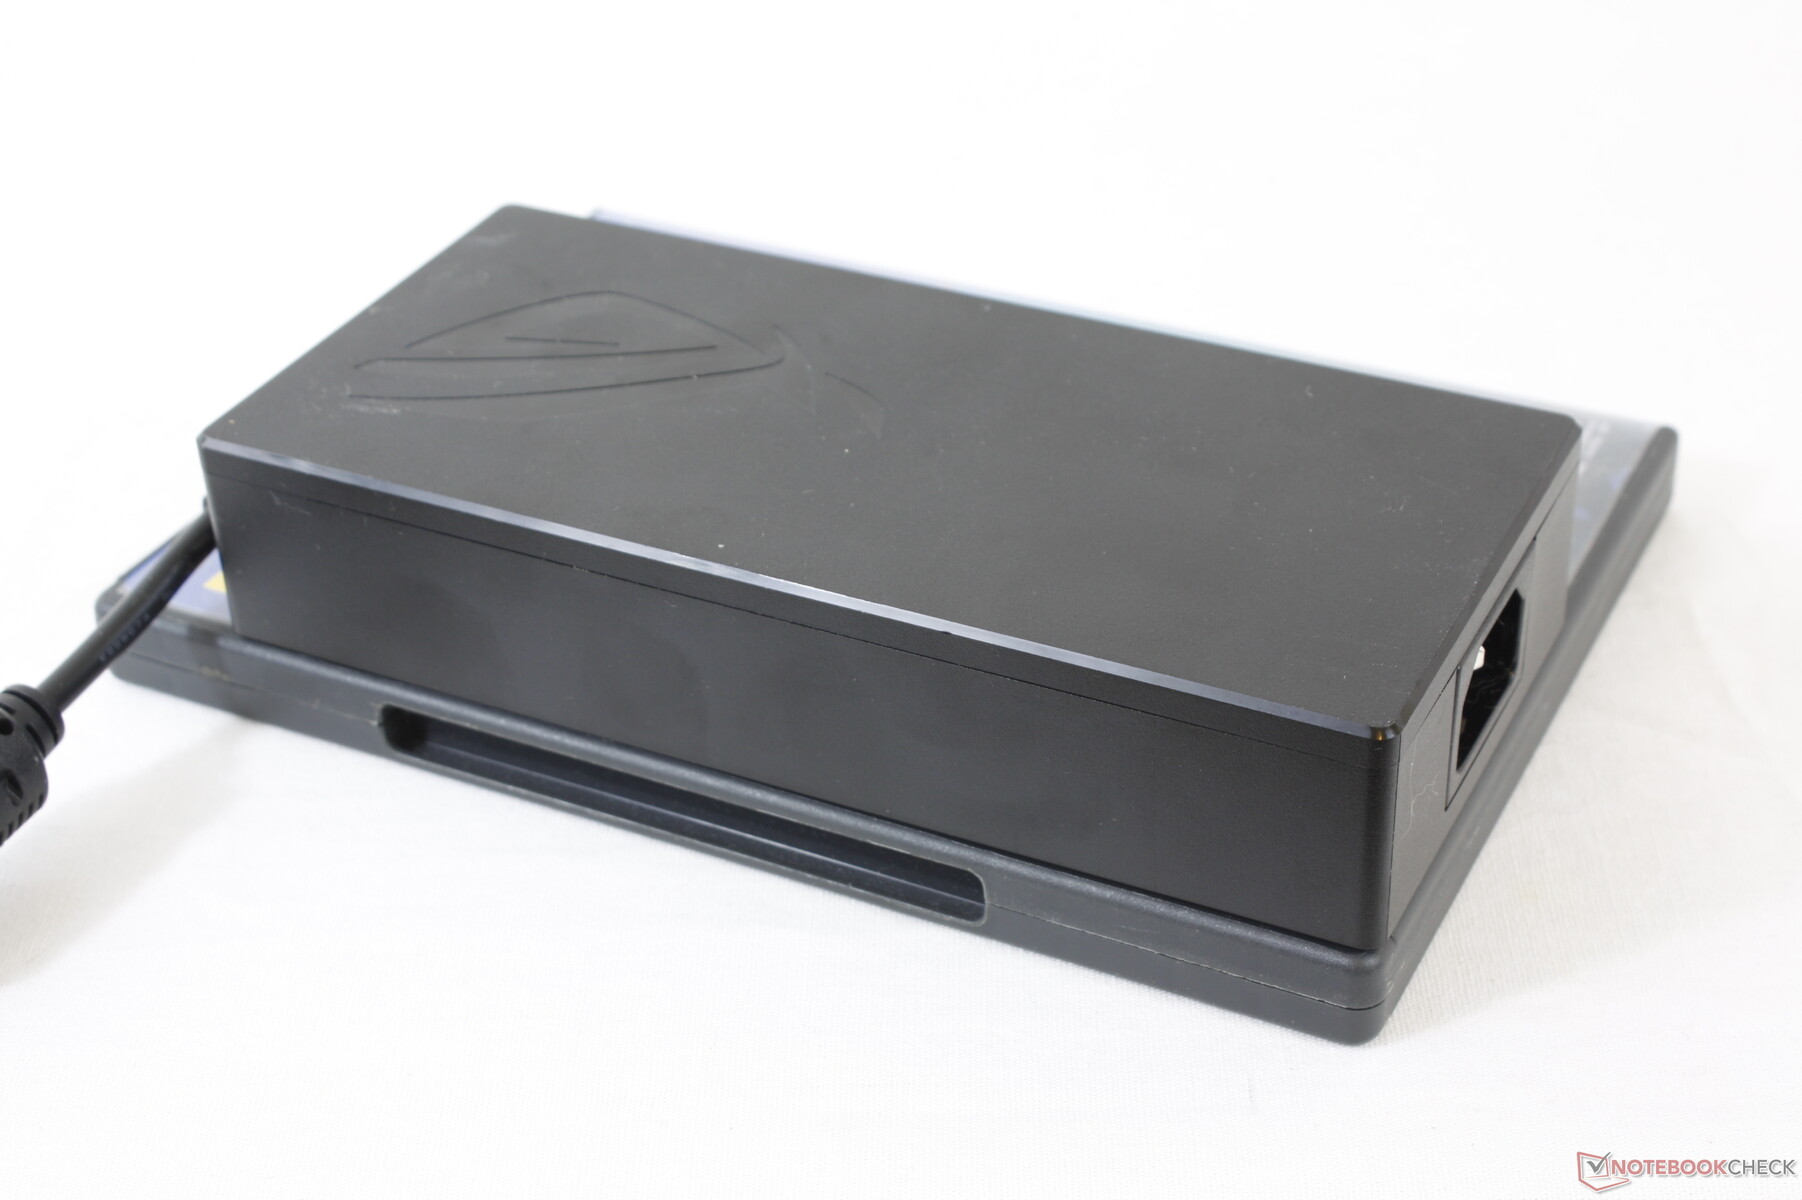
Si noti che il G512LW viene fornito con un alimentatore da 240 W più grande (~16,5 x 7,5 x 3,2 cm) rispetto all'alimentatore da 150 W per il G512LI a causa della più impegnativa GPU RTX 2070.
| Off / Standby | |
| Idle | |
| Sotto carico |
|
Leggenda:
min: | |
| Asus ROG Strix G15 G512LW i7-10750H, GeForce RTX 2070 Mobile, Toshiba XG5-P KXG50PNV2T04, IPS, 1920x1080, 15.6" | Asus ROG Strix G15 G512LI i7-10750H, GeForce GTX 1650 Ti Mobile, Intel SSD 660p SSDPEKNW512G8, IPS, 1920x1080, 15.6" | Razer Blade 15 RTX 2070 Super Max-Q i7-10875H, GeForce RTX 2070 Super Max-Q, Samsung SSD PM981a MZVLB512HBJQ, IPS, 1920x1080, 15.6" | MSI GP65 10SFK-047US i7-10750H, GeForce RTX 2070 Mobile, Samsung SSD PM981 MZVLB1T0HALR, IPS, 1920x1080, 15.6" | Asus ROG Strix Scar 15 G532LWS i9-10980HK, GeForce RTX 2070 Super Mobile, 2x Intel SSD 660p 1TB SSDPEKNW010T8 (RAID 0), IPS, 1920x1080, 15.6" | |
|---|---|---|---|---|---|
| Power Consumption | 43% | 5% | 14% | 12% | |
| Idle Minimum * (Watt) | 16.2 | 5.7 65% | 14.3 12% | 14.2 12% | 8 51% |
| Idle Average * (Watt) | 24.1 | 9.3 61% | 22.3 7% | 18.8 22% | 9.8 59% |
| Idle Maximum * (Watt) | 30.8 | 20.9 32% | 36.9 -20% | 23.9 22% | 25.8 16% |
| Load Average * (Watt) | 127.6 | 105.1 18% | 118.4 7% | 96.9 24% | 169 -32% |
| Witcher 3 ultra * (Watt) | 187.5 | 94.5 50% | 153.7 18% | 185 1% | 201 -7% |
| Load Maximum * (Watt) | 239 | 160.8 33% | 220.8 8% | 233.4 2% | 271.6 -14% |
* ... Meglio usare valori piccoli
Durata della batteria
Asus ha aumentato la capacità della batteria da 48 Wh sul G512LI a 66 Wh sul nostro G512LW. Conseguentemente, l'autonomia WLAN è quasi due ore più lunga arrivando a poco meno di 6,5 ore di utilizzo della WLAN nel mondo reale. La ricarica completa richiede ancora meno di 1,5 ore.
| Asus ROG Strix G15 G512LW i7-10750H, GeForce RTX 2070 Mobile, 66 Wh | Asus ROG Strix G15 G512LI i7-10750H, GeForce GTX 1650 Ti Mobile, 48 Wh | Razer Blade 15 RTX 2070 Super Max-Q i7-10875H, GeForce RTX 2070 Super Max-Q, 80 Wh | MSI GP65 10SFK-047US i7-10750H, GeForce RTX 2070 Mobile, 51 Wh | Asus ROG Strix Scar 15 G532LWS i9-10980HK, GeForce RTX 2070 Super Mobile, 66 Wh | Alienware m15 R3 P87F i7-10750H, GeForce RTX 2070 Mobile, 86 Wh | |
|---|---|---|---|---|---|---|
| Autonomia della batteria | -30% | -2% | -42% | -23% | -56% | |
| WiFi v1.3 (h) | 6.4 | 4.5 -30% | 6.3 -2% | 3.7 -42% | 4.9 -23% | 2.8 -56% |
| Reader / Idle (h) | 13.3 | 8.1 | 5 | |||
| Load (h) | 1.4 | 1.5 | 0.7 |
Pro
Contro
Giudizio complessivo

Un display scadente può rovinare un portatile gaming altrimenti buono. Mentre il meno costoso ROG Strix G15 G512LI si comporta bene, i suoi lenti tempi di risposta del display e la limitata riproduzione dei colori rendono l'esperienza gaming inferiore alla media. Fortunatamente, il G512LW utilizza un pannello completamente diverso che si adatta meglio al target di giocatori hardcore o competitivi.
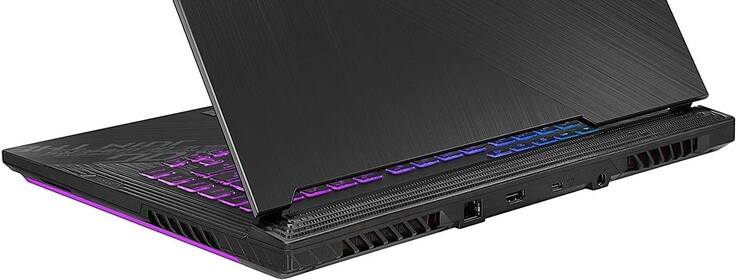
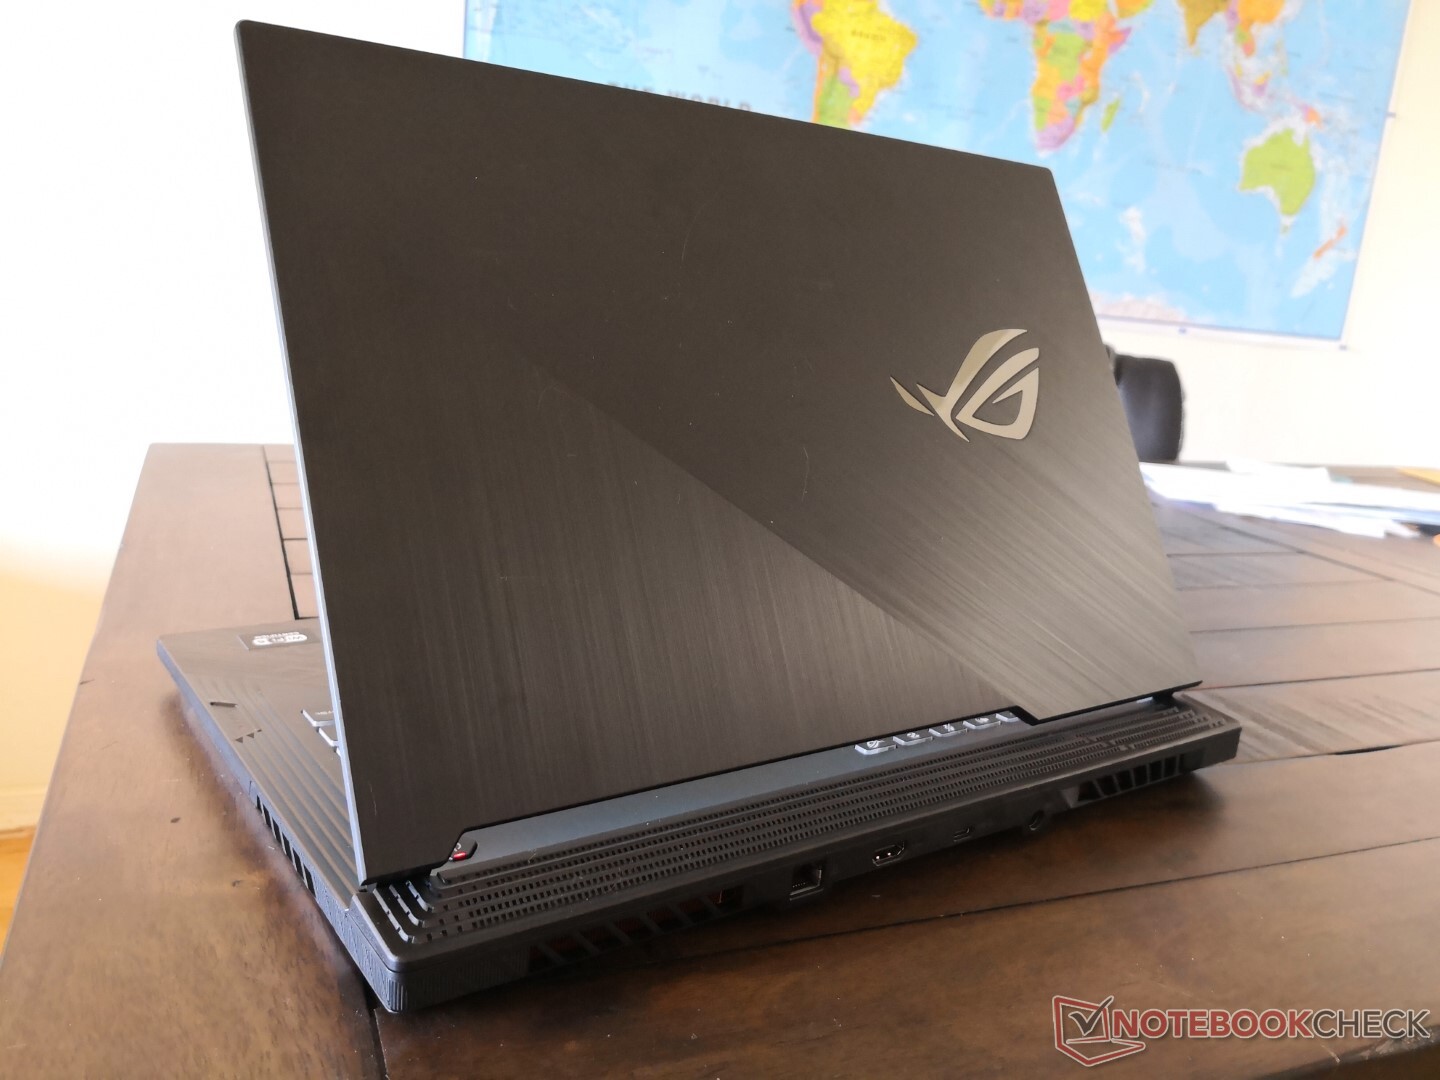
Gli svantaggi principali rimangono tutti comuni sulla serie G512. I profili di potenza della Armoury Crate continuano a scontrarsi con i profili di potenza di Windows. La modalità turbo, in particolare, è necessaria per ottenere il massimo delle prestazioni dal G512, il che significa che il massimo rumore delle ventole sarà inevitabile per molti giocatori. Nel frattempo, le dimensioni sono grandi soprattutto in lunghezza a causa della sporgenza posteriore. Thunderbolt 3, webcam, lettore di schede SD e persino Asus Keystone sono tutti assenti, il che può infastidire gli utenti che si affidano a queste caratteristiche. C'è molta potenza ed espandibilità sotto il cofano se si può fare i conti con l'ingombro grande, i tasti freccia piccoli e le ventole rumorose.
Prestazioni eccellenti a temperature decenti, specialmente se si considera la GeForce RTX 2070 a piena potenza all'interno. I proprietari apprezzeranno il display a 240 Hz e la RAM e la memoria espandibile, ma le ventole rumorose potrebbero essere fastidiose senza un paio di cuffie.
Asus ROG Strix G15 G512LW
- 11/04/2020 v7 (old)
Allen Ngo
Price comparison
