Recensione del Laptop MSI GP65 10SFK: l'Intel Core i7 10th Gen lascia il segno
MSI ha annunciato all'inizio di questo mese la spedizione del primo lotto di laptops gaming con processori Intel 10th gen Comet Lake-H. Abbiamo già testato il rinnovato MSI GF75 10SCXR e il nuovissimo MSI GS66 10SFS da allora ci saranno altri arrivi nel prossimo futuro.
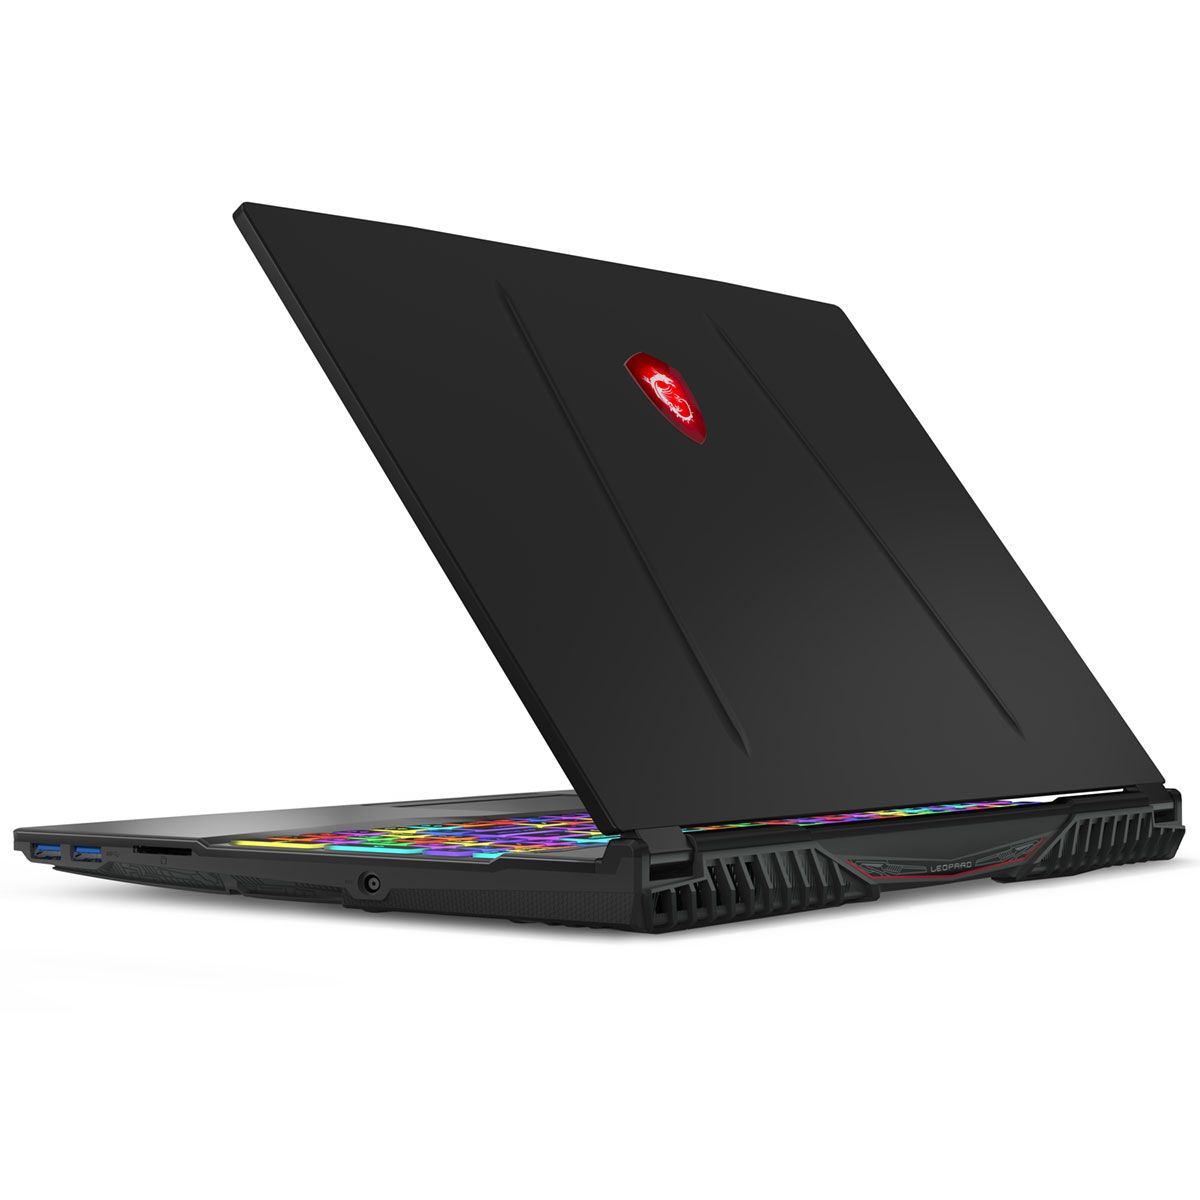
L'ultimo modello che abbiamo oggi è il GP65 10SFK per sostituire il GP65 9SE dell'anno scorso. A parte le differenze di CPU, GPU e pannello display, tuttavia, il telaio rimane identico anno dopo anno. Raccomandiamo di dare un'occhiata alla nostra attuale recensione del GP65 9SE, poiché molti dei nostri commenti sono validi anche in questo caso.
Il GP65 compete direttamente con altri portatili da 15,6 pollici di fascia media come l'Asus TUF FX505, l'HP Omen 15, l'Aorus 15 e il Lenovo Legion Y540. La nostra configurazione specifica con la CPU Core i7-10750H, la GPU GeForce RTX 2070 e il display FHD a 144 Hz è disponibile online per circa 1500 dollari.
Altre recensioni MSI:
Punteggio | Data | Modello | Peso | Altezza | Dimensione | Risoluzione | Prezzo |
|---|---|---|---|---|---|---|---|
| 83.2 % v7 (old) | 05/2020 | MSI GP65 10SFK-047US i7-10750H, GeForce RTX 2070 Mobile | 2.3 kg | 27.5 mm | 15.60" | 1920x1080 | |
| 82.1 % v7 (old) | 10/2019 | Asus Strix Scar III G531GW-AZ062T i7-9750H, GeForce RTX 2070 Mobile | 2.4 kg | 25 mm | 15.60" | 1920x1080 | |
| 80.4 % v6 (old) | 07/2019 | Asus TUF FX505DT-EB73 R7 3750H, GeForce GTX 1650 Mobile | 2.2 kg | 26.8 mm | 15.60" | 1920x1080 | |
| 86.2 % v6 (old) | 07/2019 | HP Omen 15-dc1303ng i7-8750H, GeForce RTX 2070 Max-Q | 2.4 kg | 25 mm | 15.60" | 1920x1080 | |
| 85.5 % v6 (old) | 06/2019 | Aorus 15-SA i7-9750H, GeForce GTX 1660 Ti Mobile | 2.1 kg | 24.4 mm | 15.60" | 1920x1080 |
Case
SD Card Reader
| SD Card Reader | |
| average JPG Copy Test (av. of 3 runs) | |
| HP Omen 15-dc1303ng (Toshiba Exceria Pro SDXC 64 GB UHS-II) | |
| MSI GP65 10SFK-047US (Toshiba Exceria Pro SDXC 64 GB UHS-II) | |
| MSI GP65 Leopard 9SE-225US | |
| MSI GP62 7REX-1045US (Toshiba Exceria Pro SDXC 64 GB UHS-II) | |
| maximum AS SSD Seq Read Test (1GB) | |
| HP Omen 15-dc1303ng (Toshiba Exceria Pro SDXC 64 GB UHS-II) | |
| MSI GP65 10SFK-047US (Toshiba Exceria Pro SDXC 64 GB UHS-II) | |
| MSI GP65 Leopard 9SE-225US | |
| MSI GP62 7REX-1045US (Toshiba Exceria Pro SDXC 64 GB UHS-II) | |
Comunicazioni
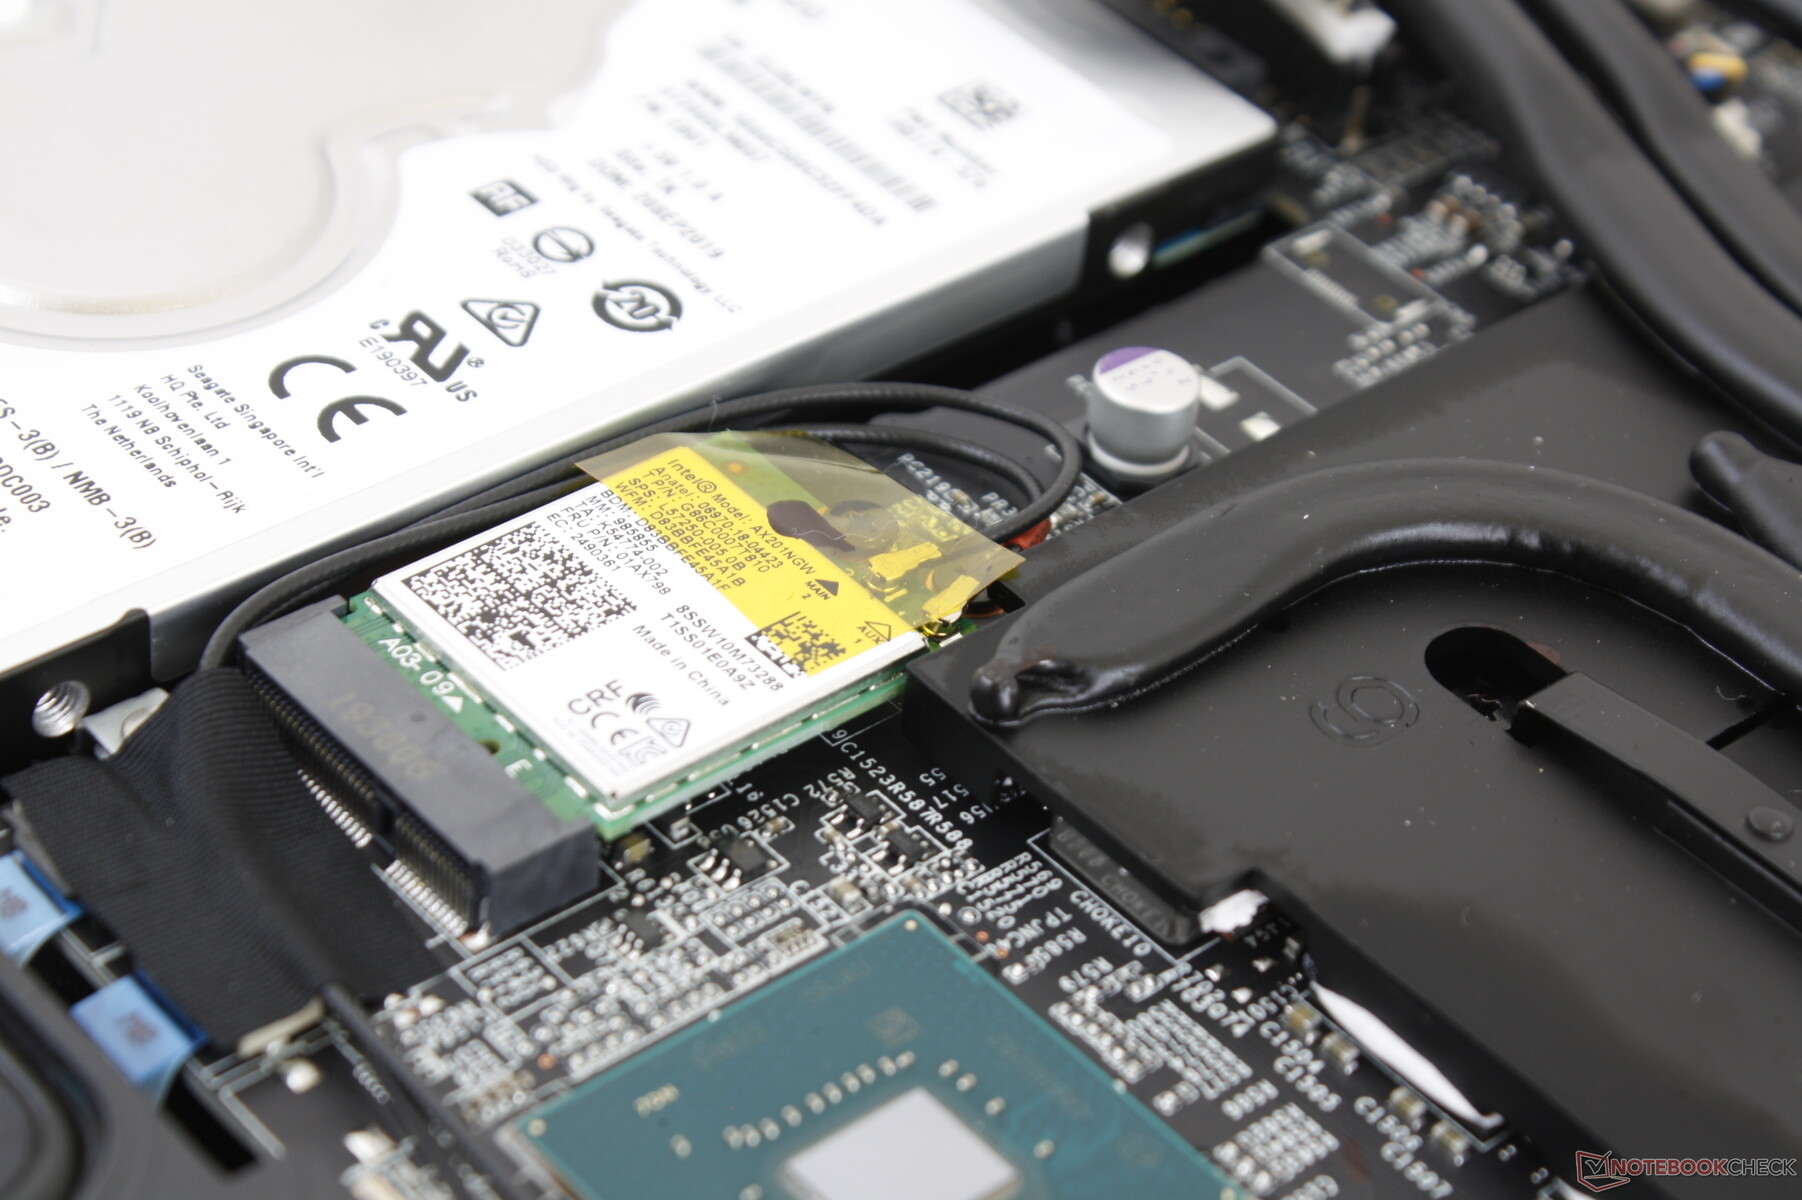
L'Intel AX201 è ora disponibile di serie con connettività 802.11ax o Wi-Fi 6, mentre il modello dell'anno scorso era dotato di Wi-Fi 5. Non abbiamo riscontrato alcun problema quando ci siamo collegati al nostro router di prova Netgear RAX200.
Webcam


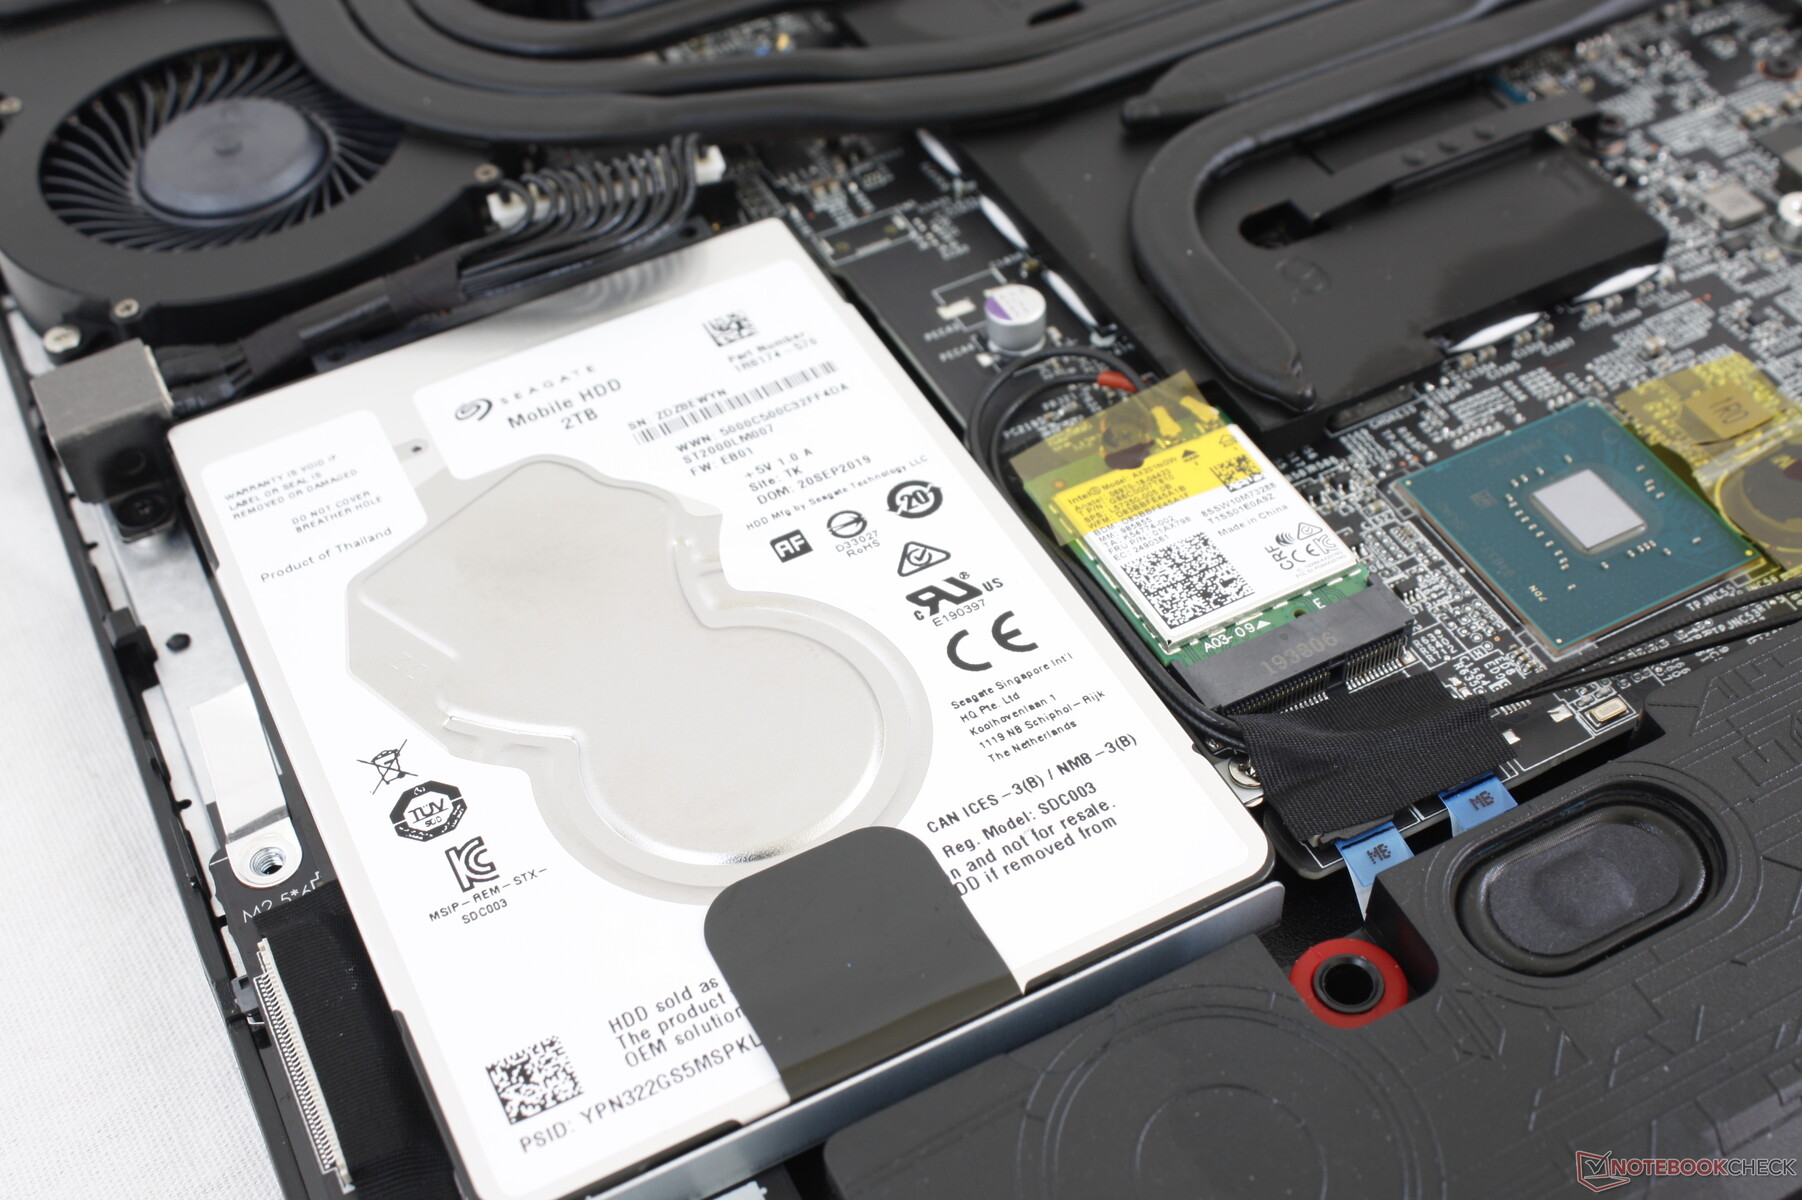
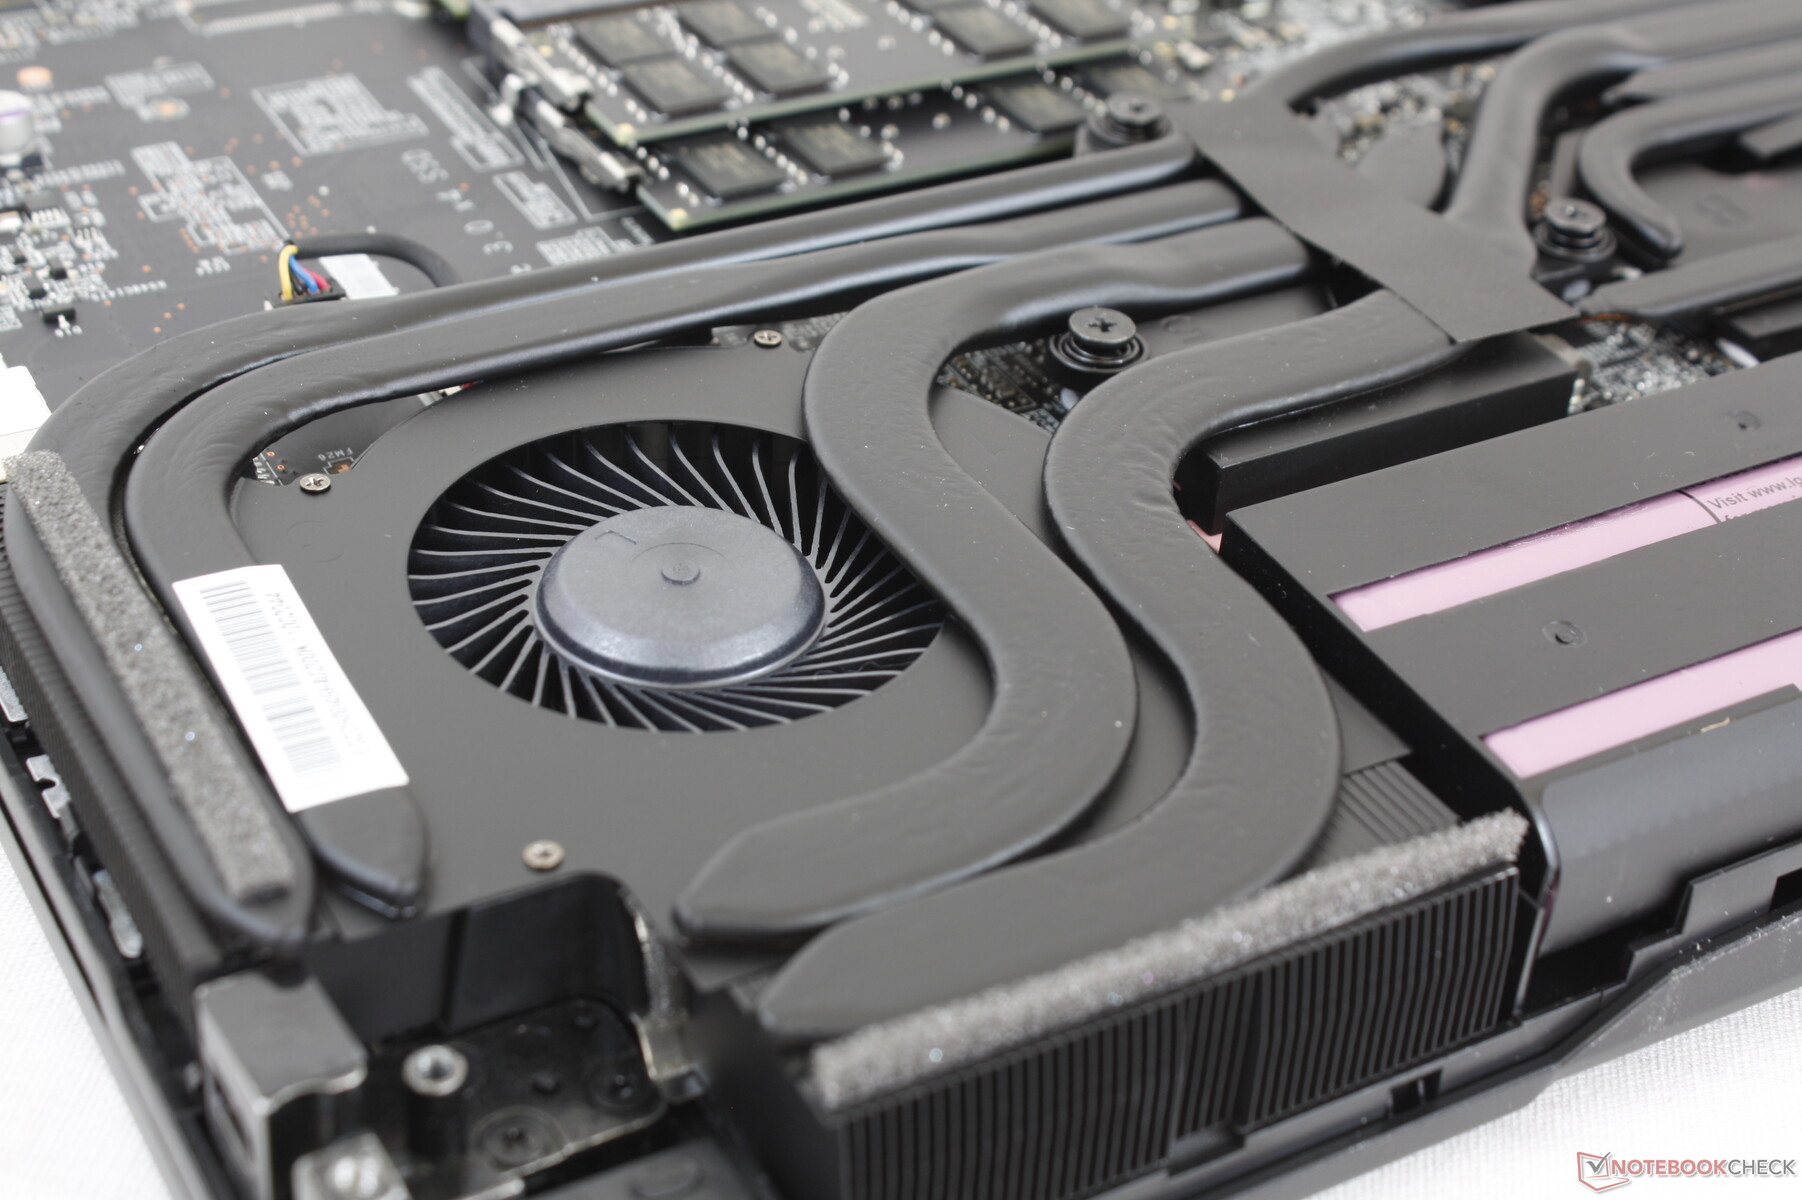
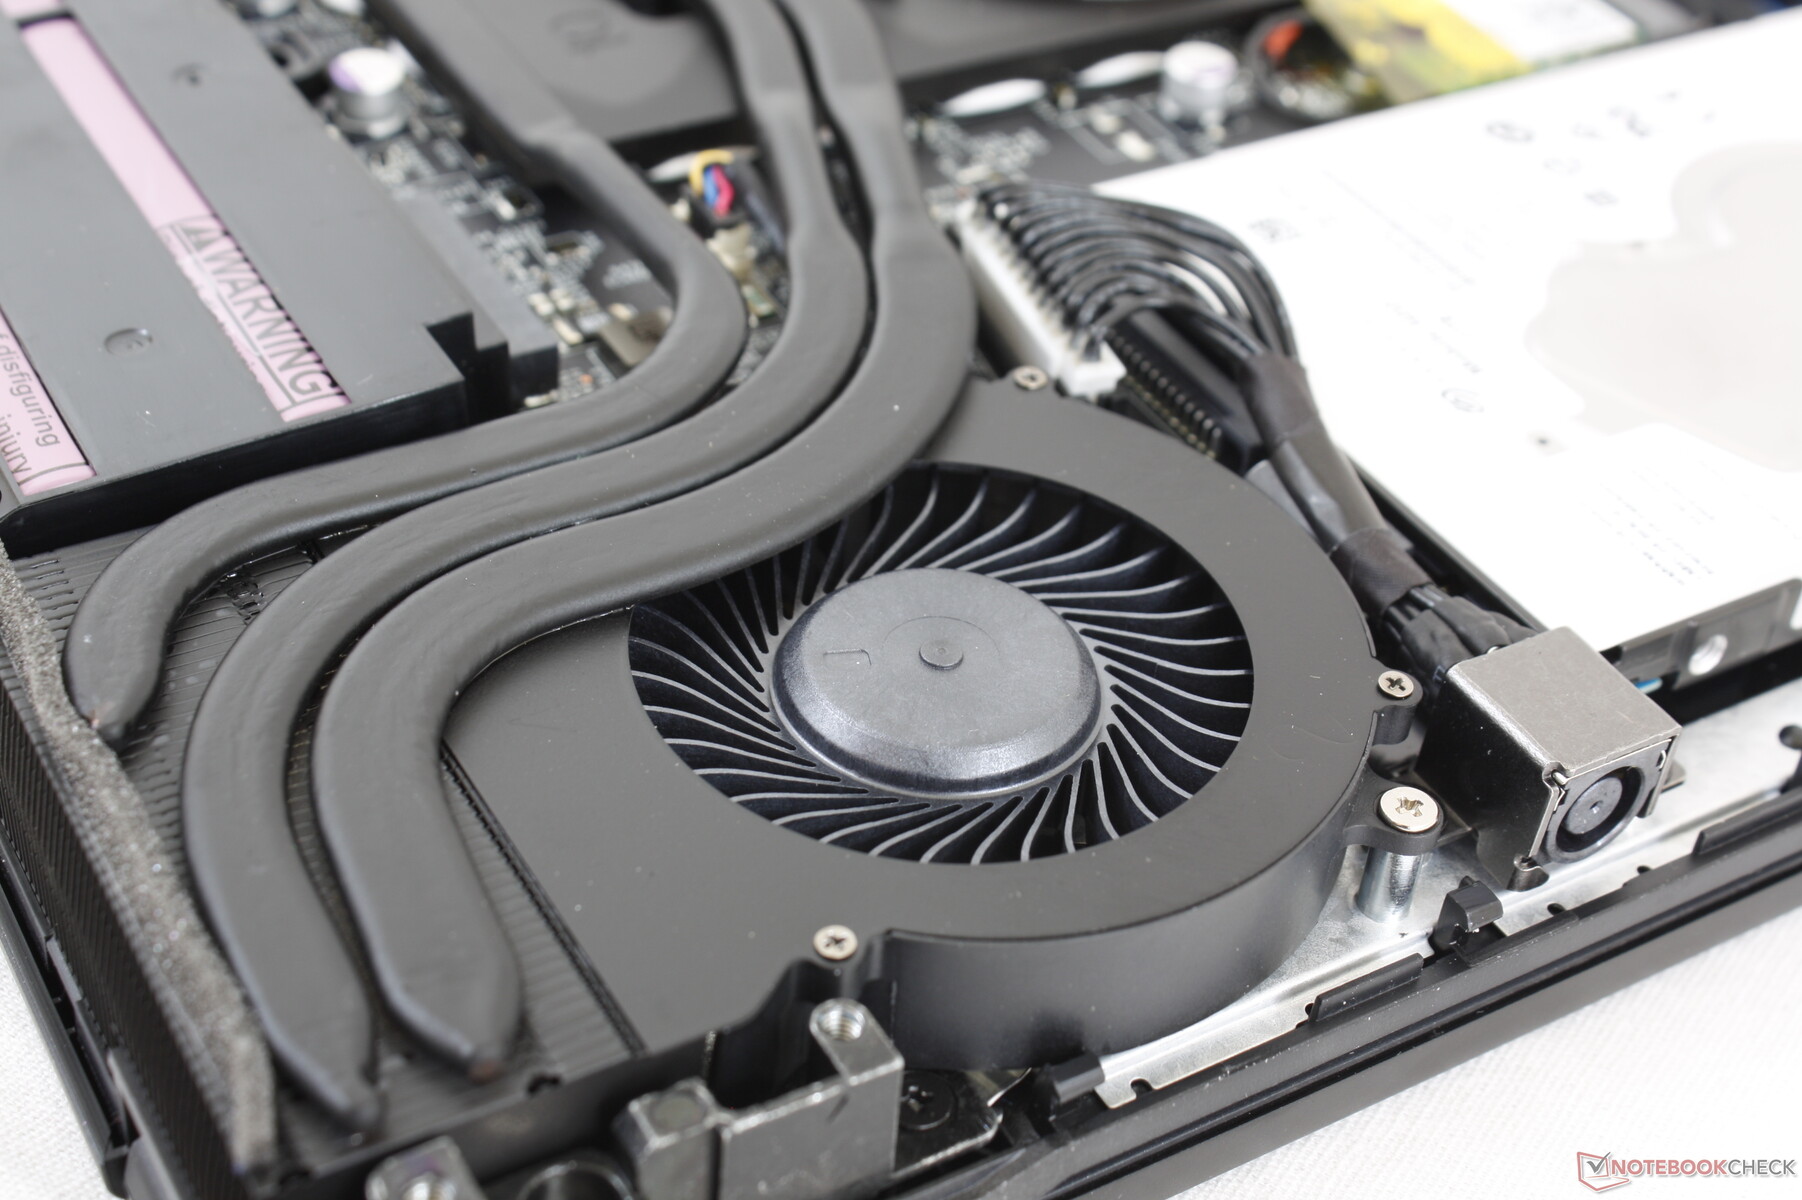
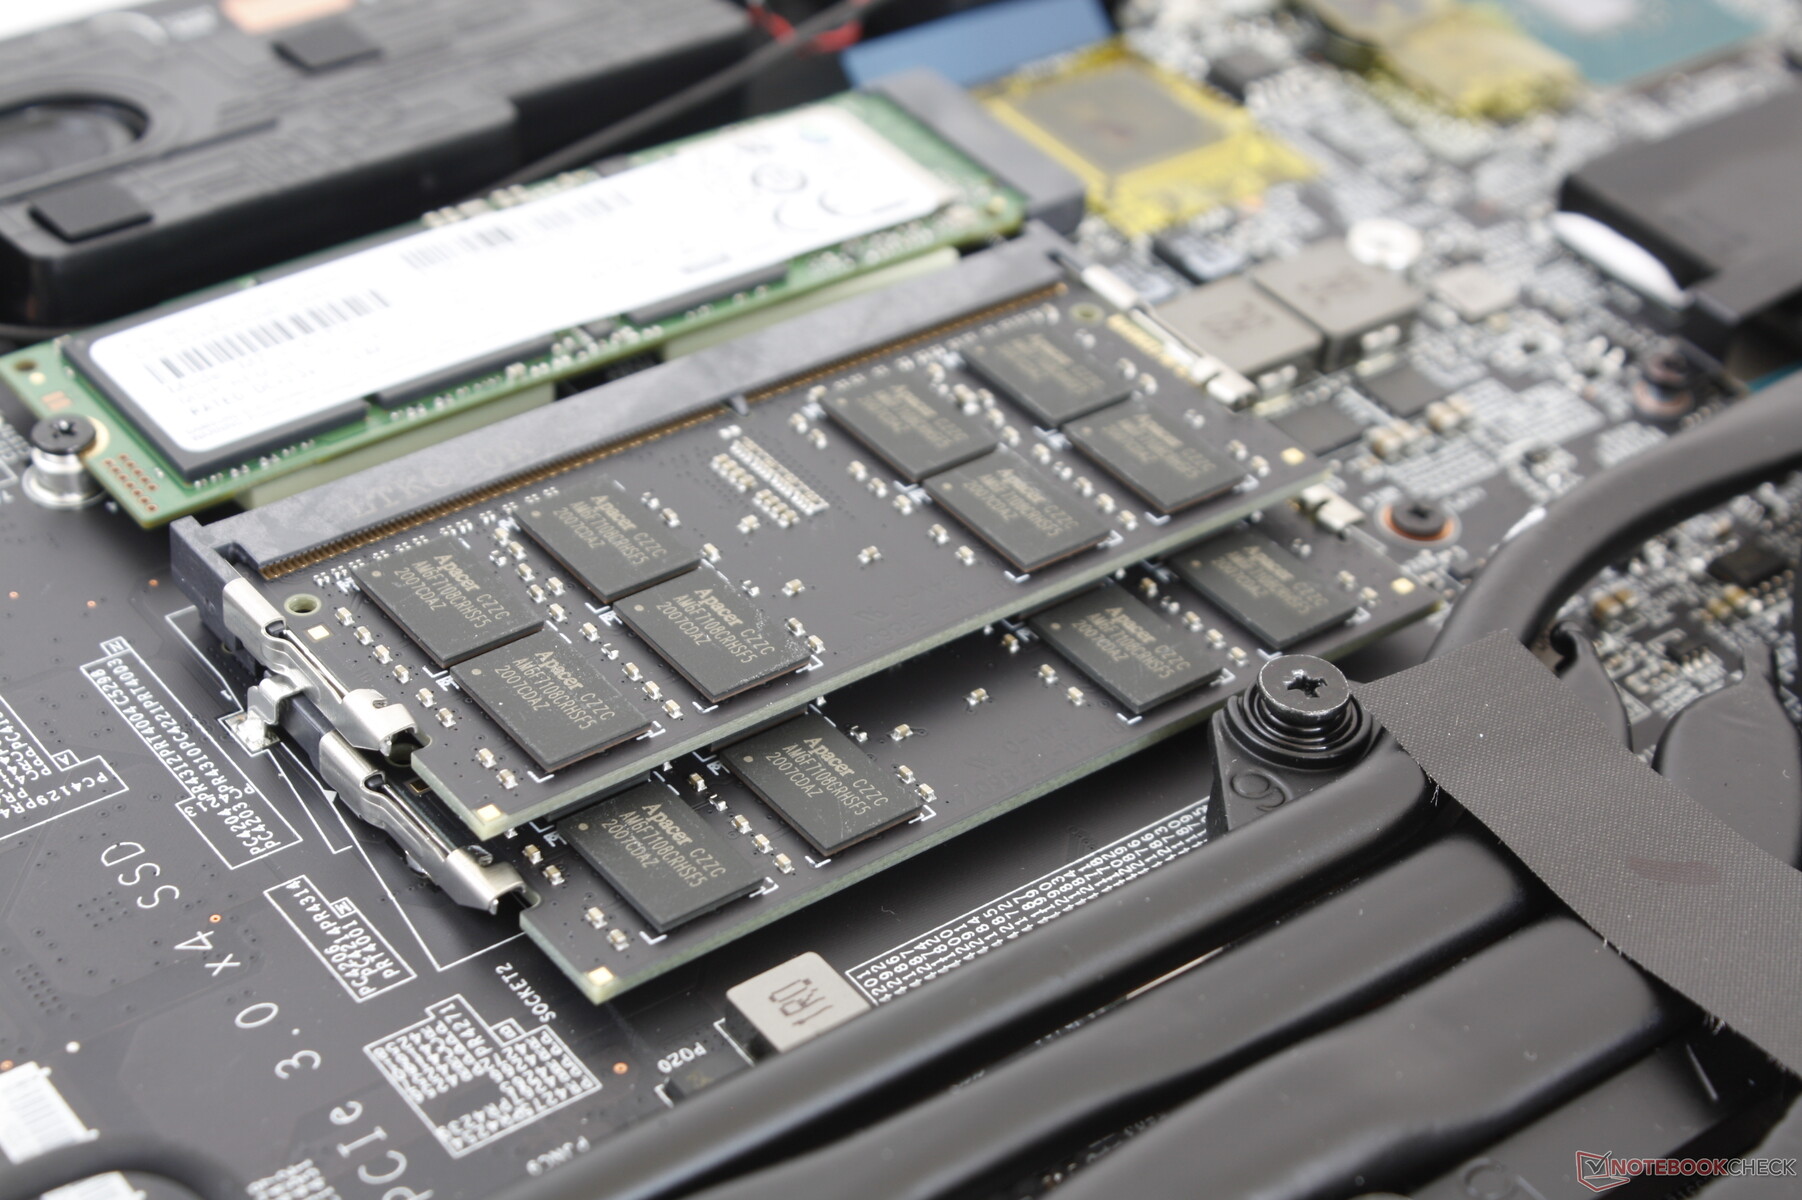
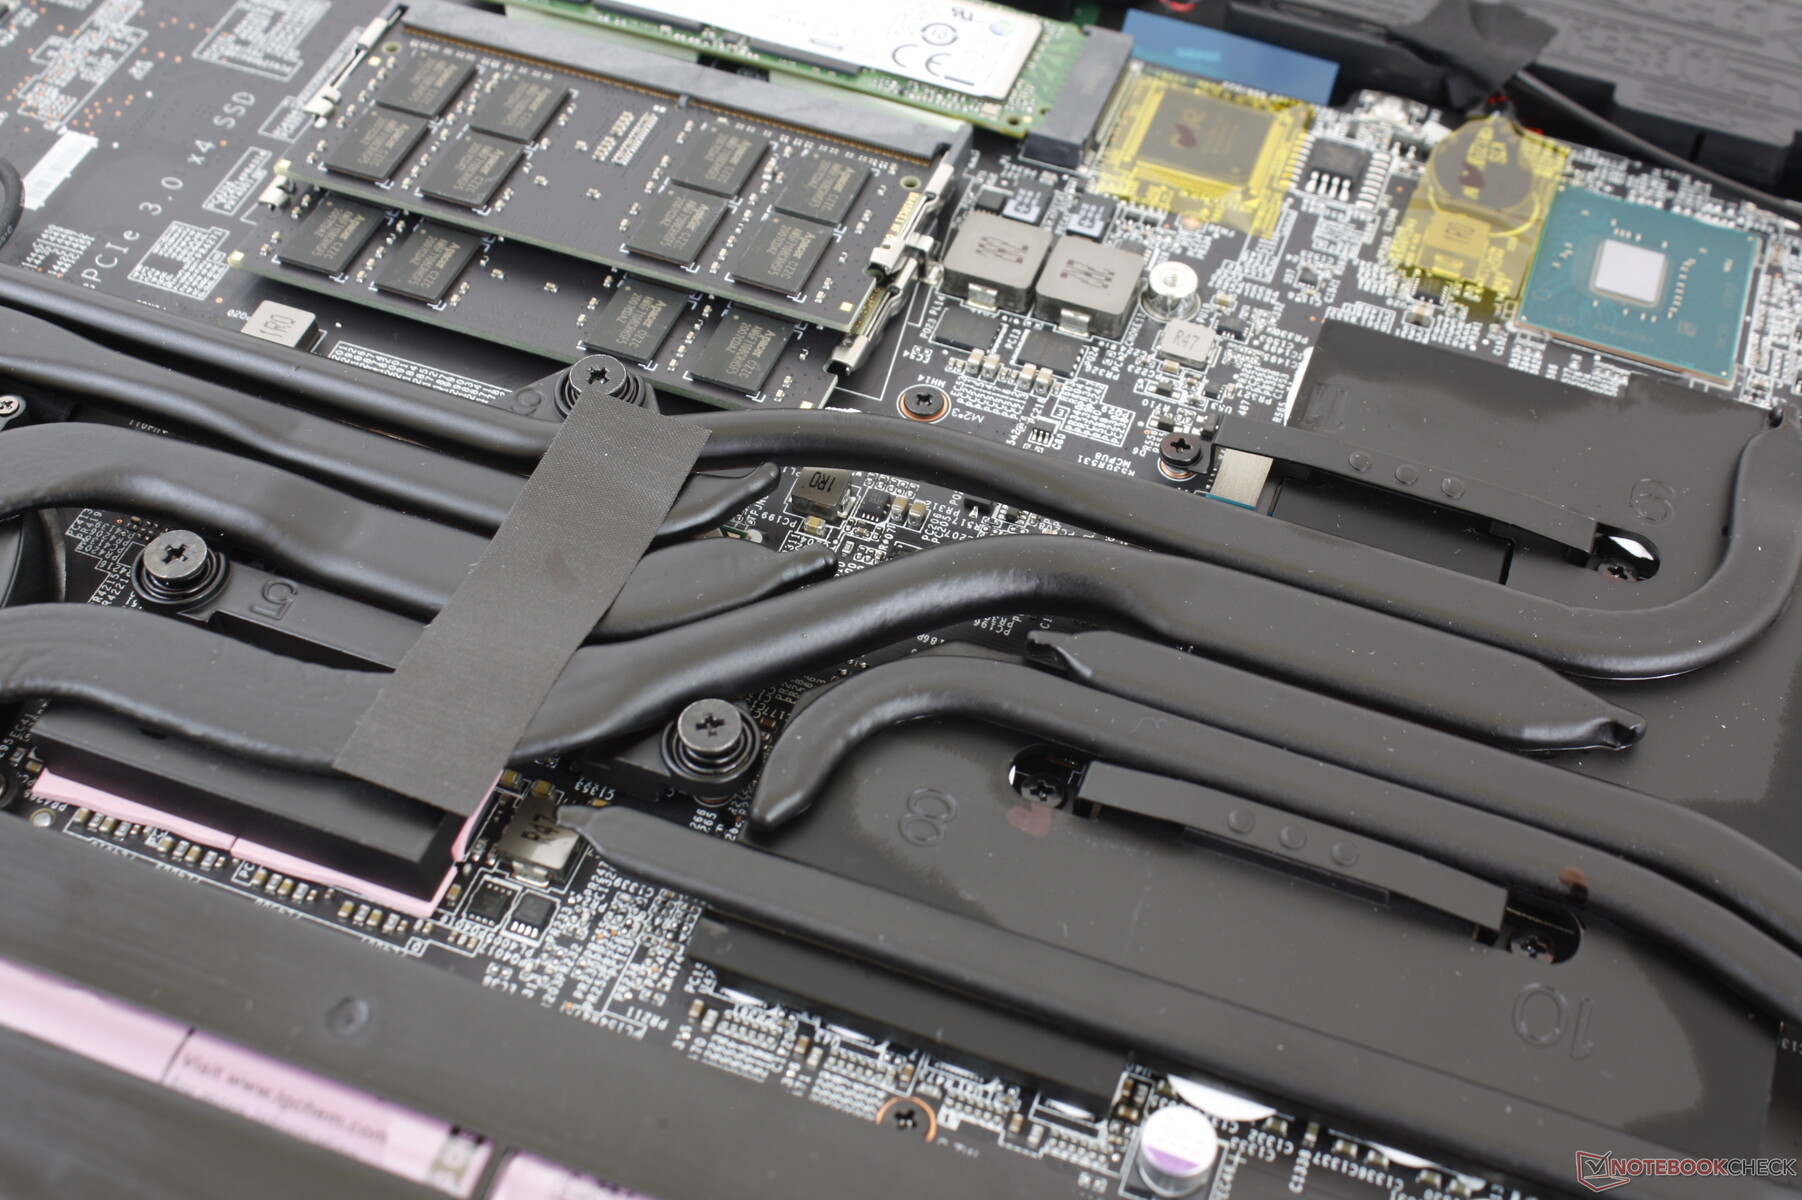
Manutenzione
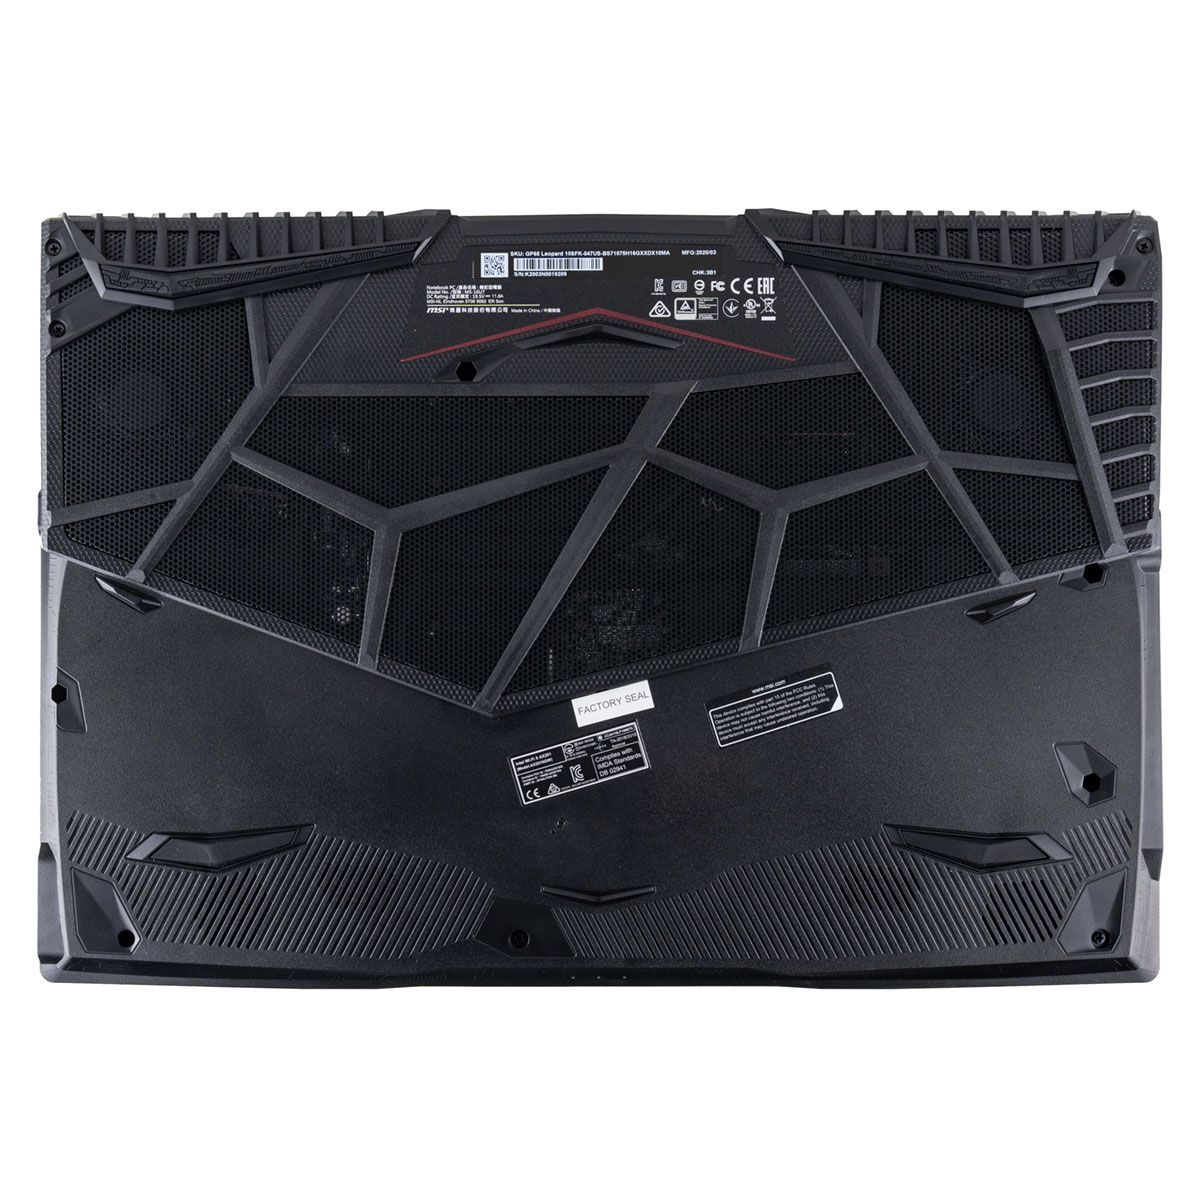
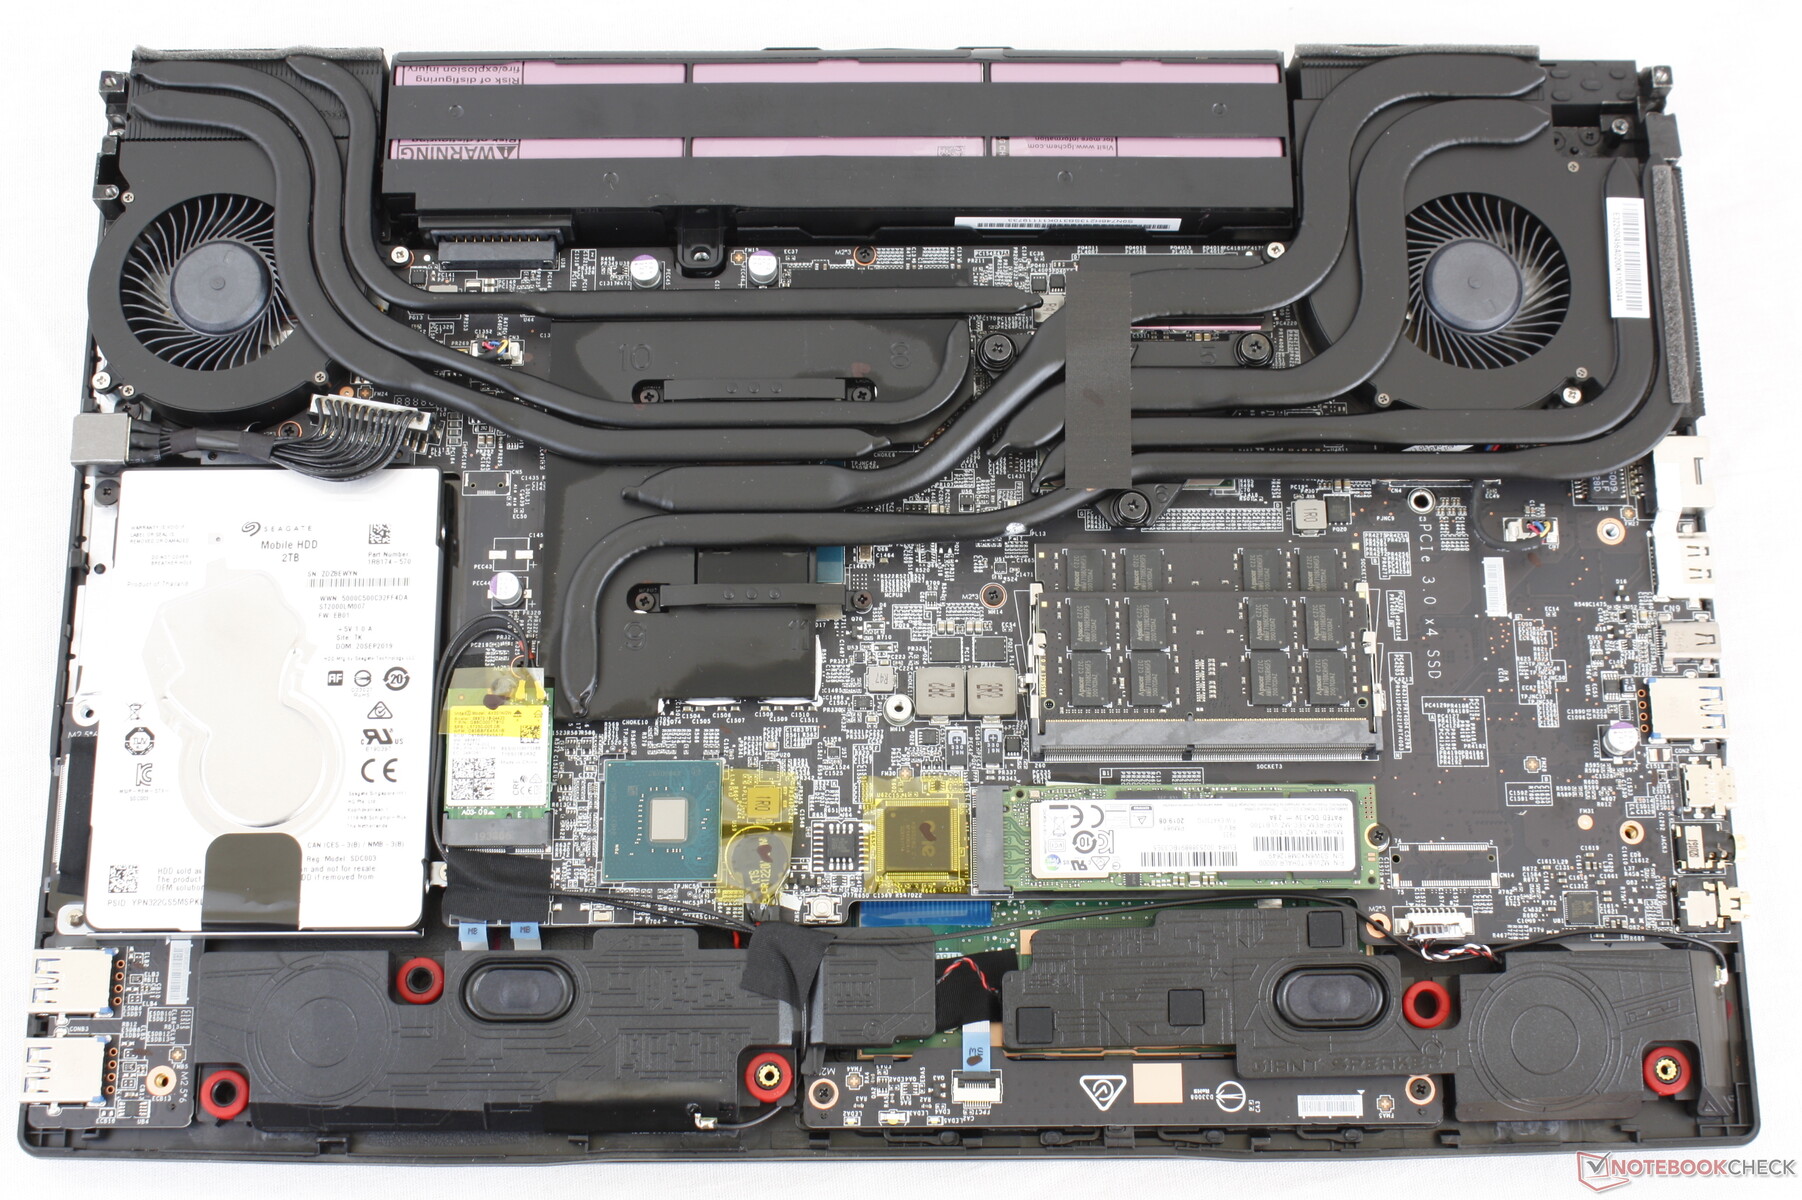
Il pannello inferiore è fissato da diverse viti Philips, tra cui una che è sotto un adesivo con il sigillo di garanzia. La rimozione del pannello può essere complicata in quanto le chiusure intorno ai bordi e agli angoli sono scomode e difficili da staccare. Una volta all'interno, gli utenti avranno accesso a due alloggiamenti e due slot SODIMM. Si noti che il secondo slot M.2 2280 adiacente agli slot SODIMM viene rimosso sulla serie GP65.
Accessori e Garanzia
Non ci sono extra nella confezione oltre alle solite documentazioni e all'alimentatore. La garanzia limitata standard di un anno si applica con una protezione aggiuntiva disponibile se acquistata presso CUKUSA.
Display
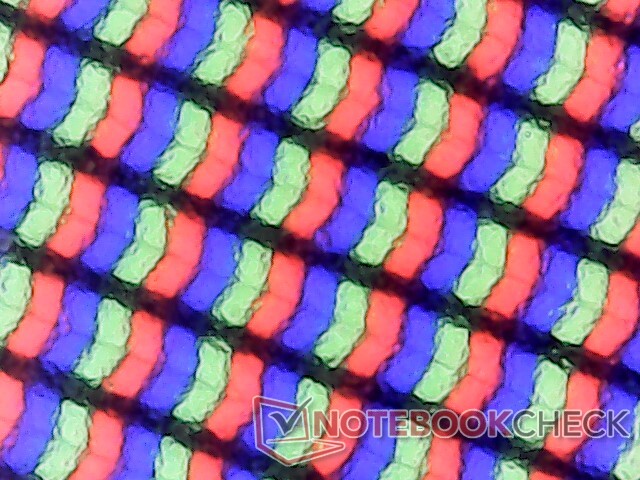
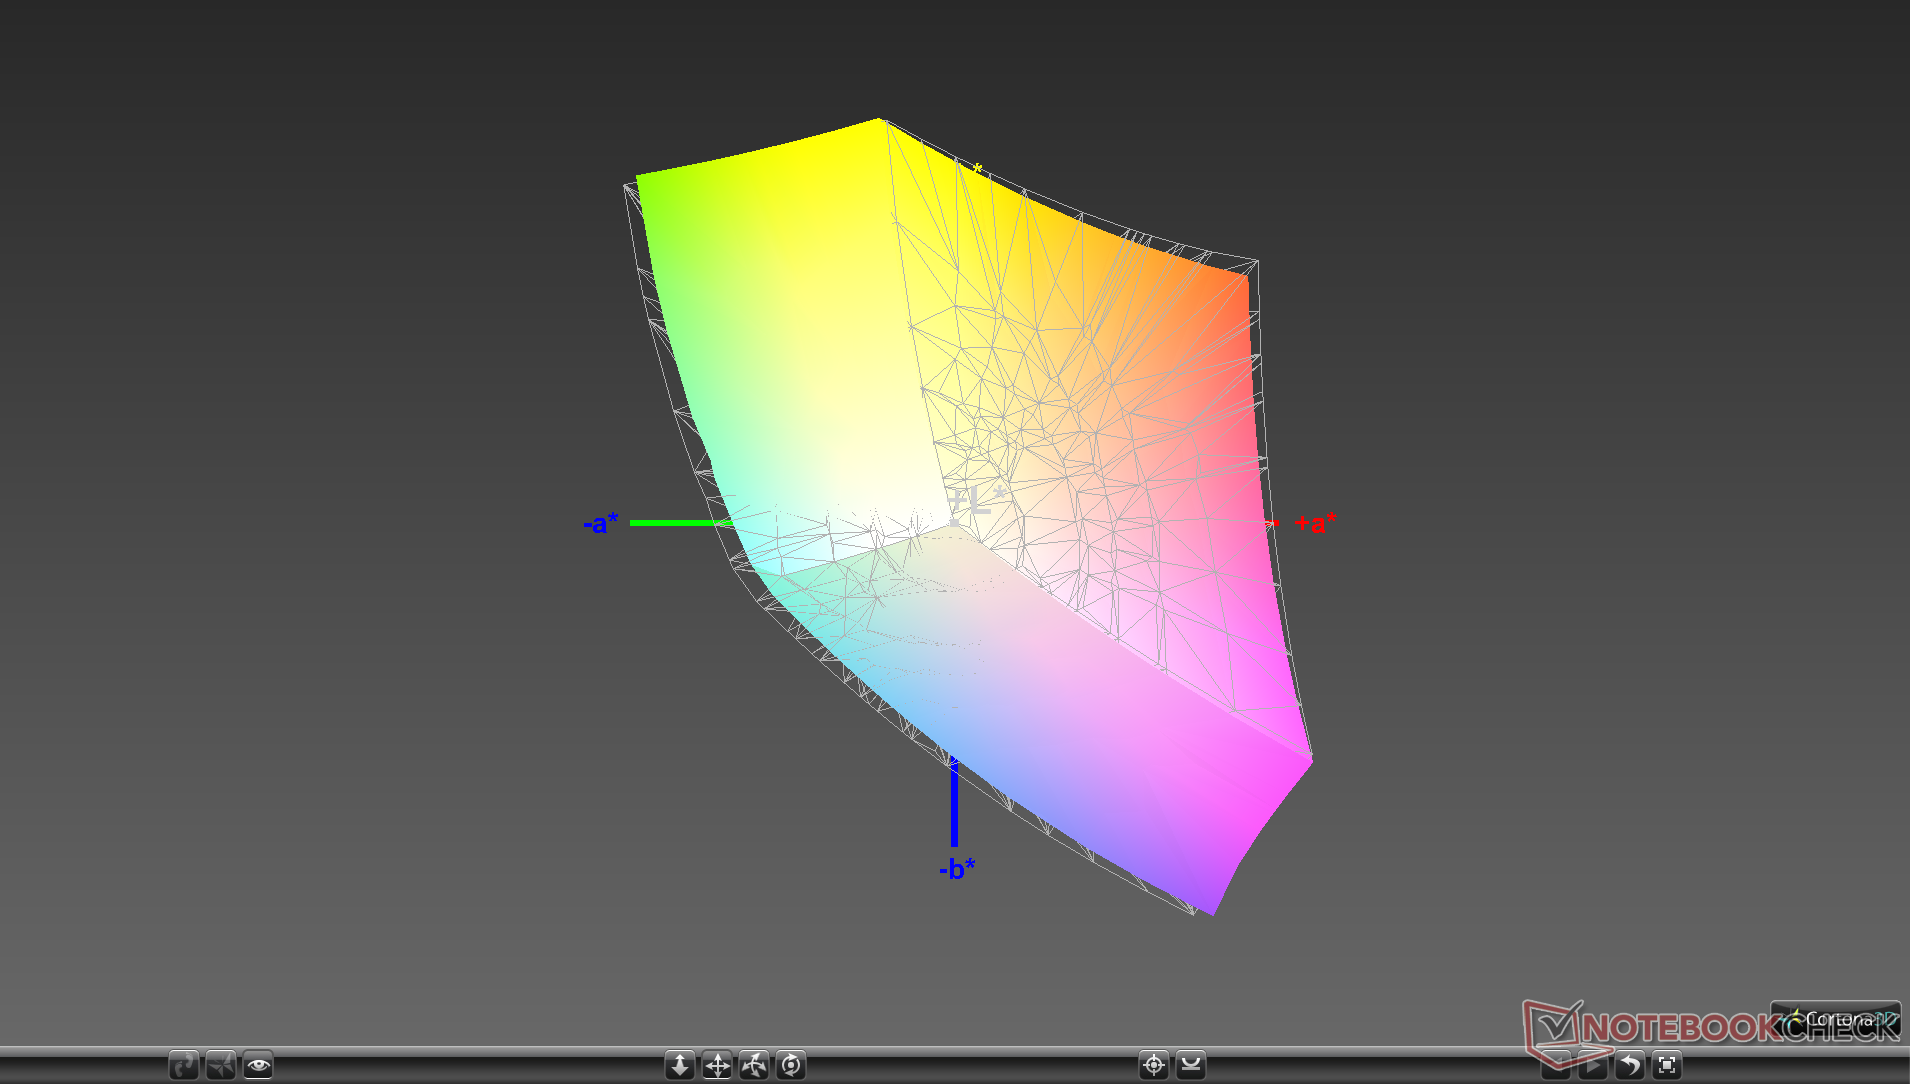
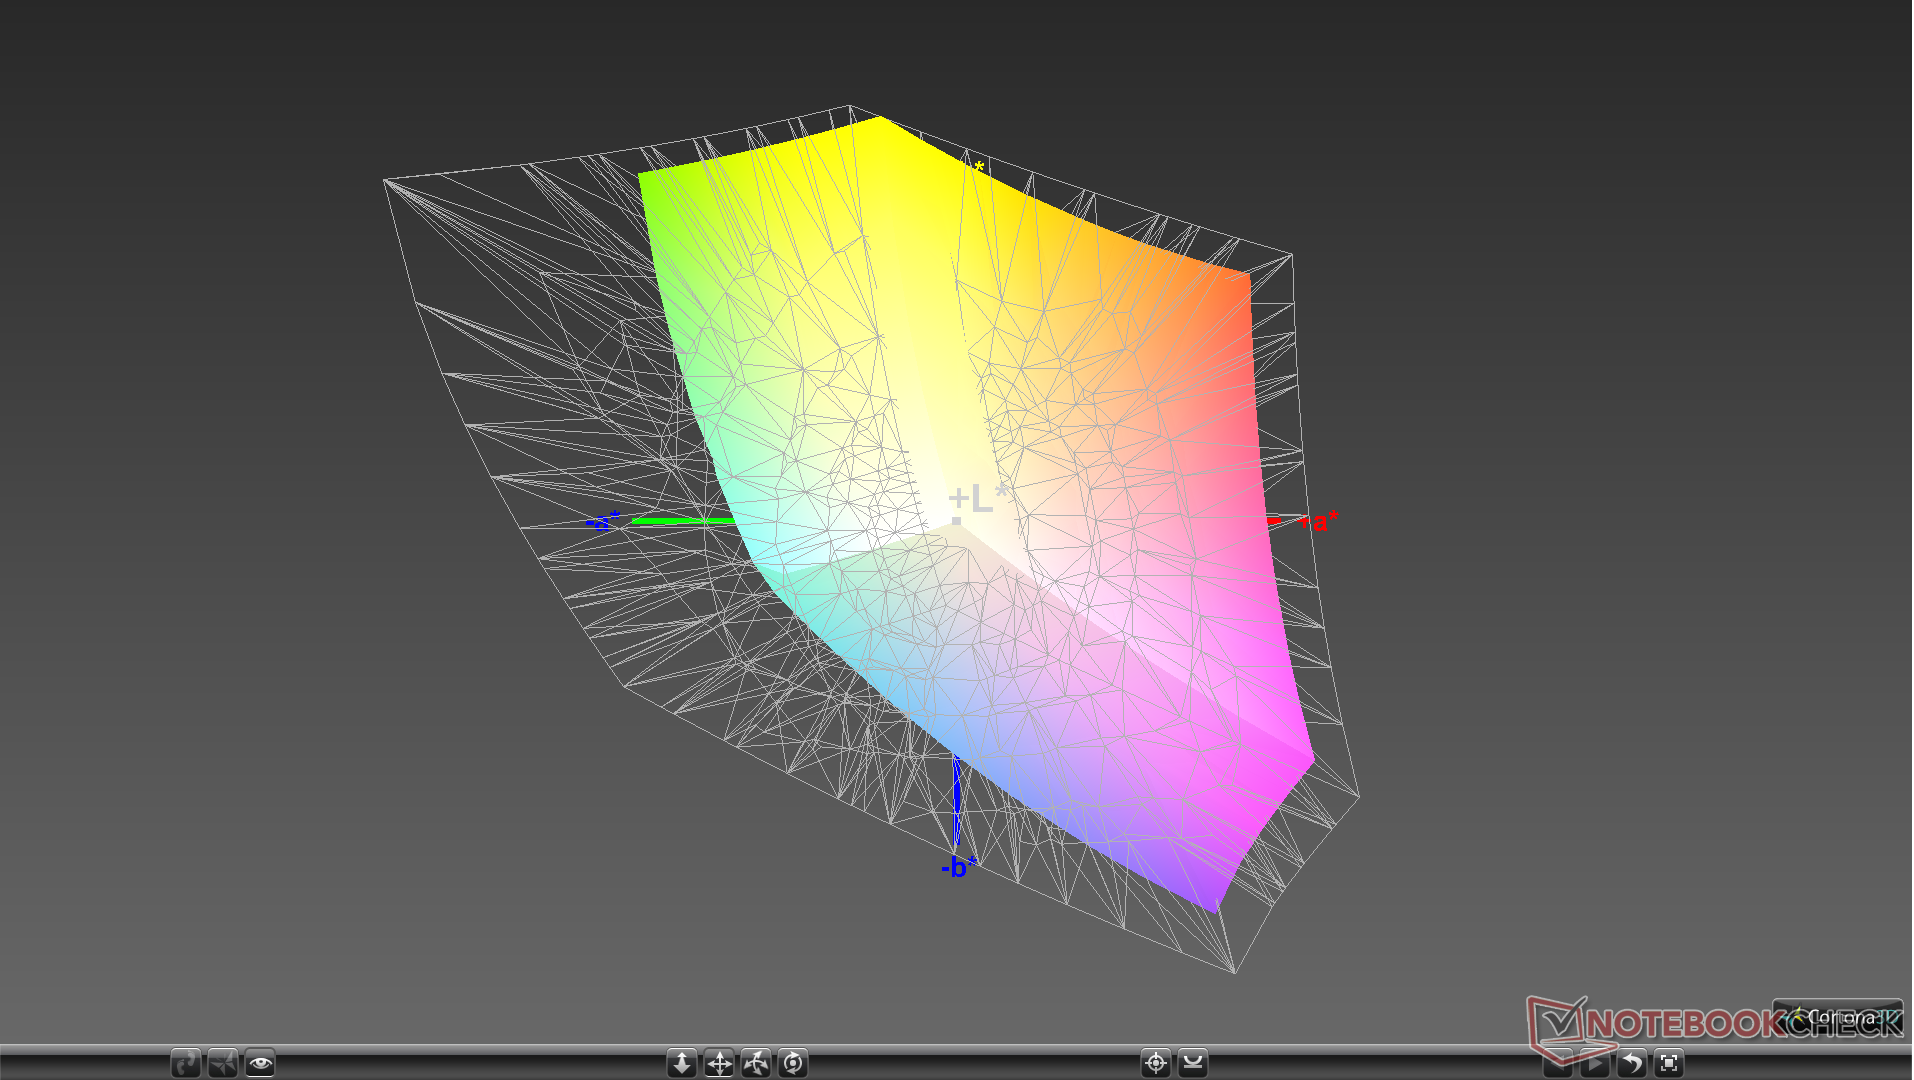
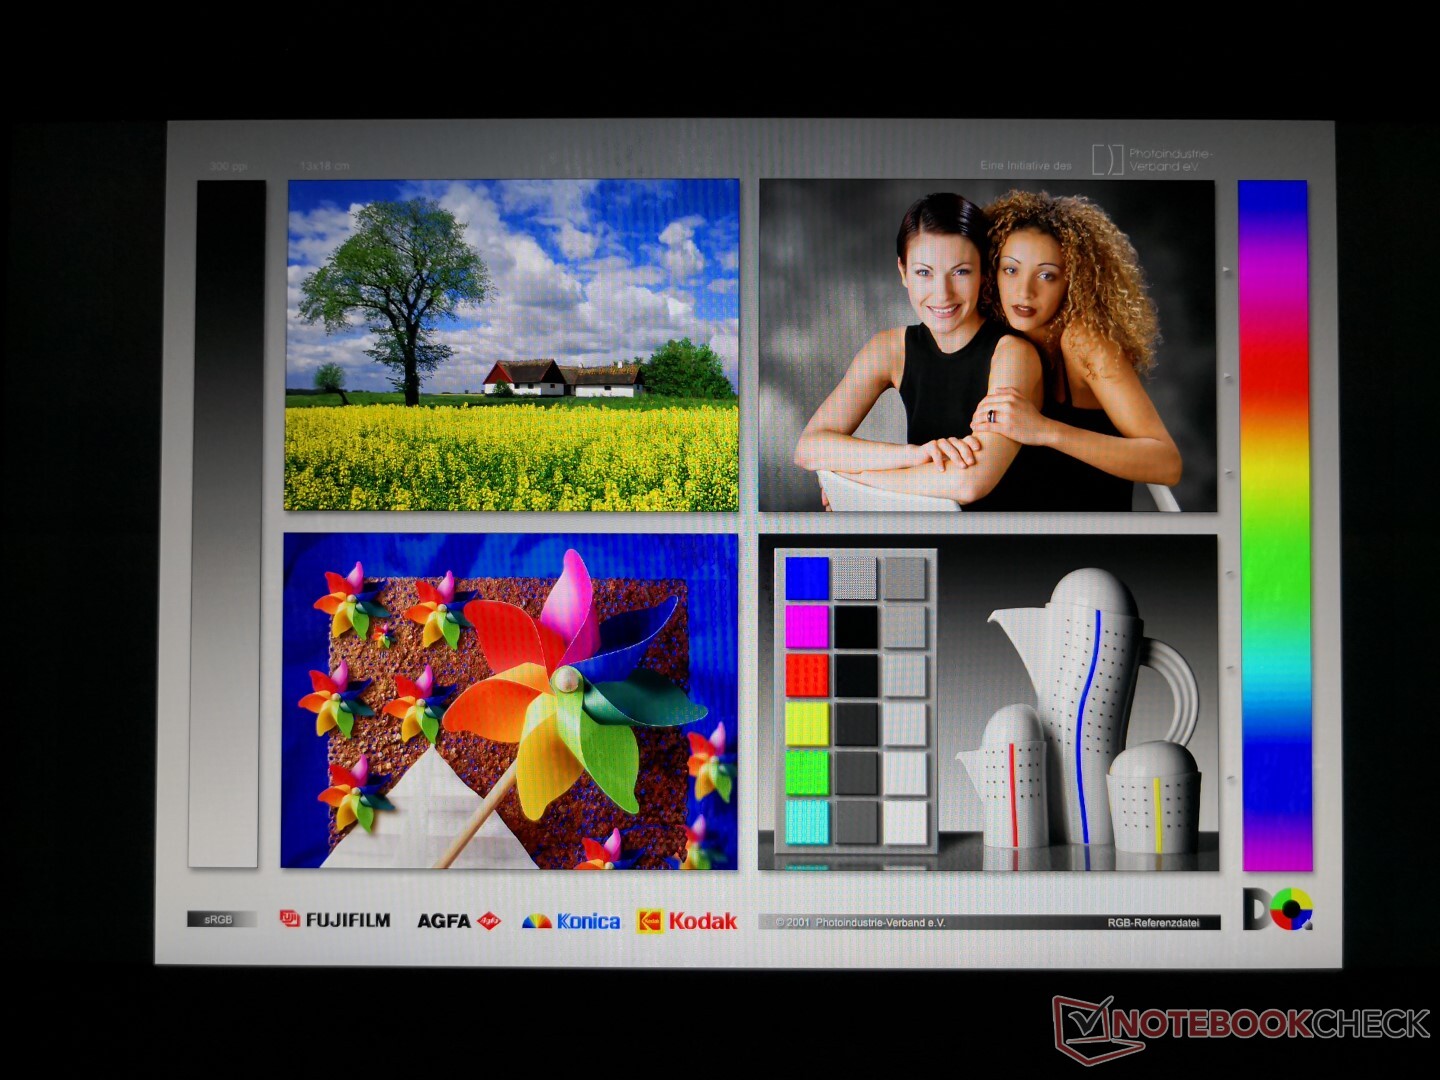
Il pannello IPS LG Philips LP156WFG-SPB3 del nostro MSI è il primo ad apparire nel nostro database. Un pannello LP156WFG-SPB2 simile si trova sull'Aorus 15 con quasi le stesse caratteristiche, tra cui la frequenza di aggiornamento nativa di 144 Hz, i tempi di risposta veloce in bianco-nero e grigio-grigio e uno spazio colore relativamente ampio.
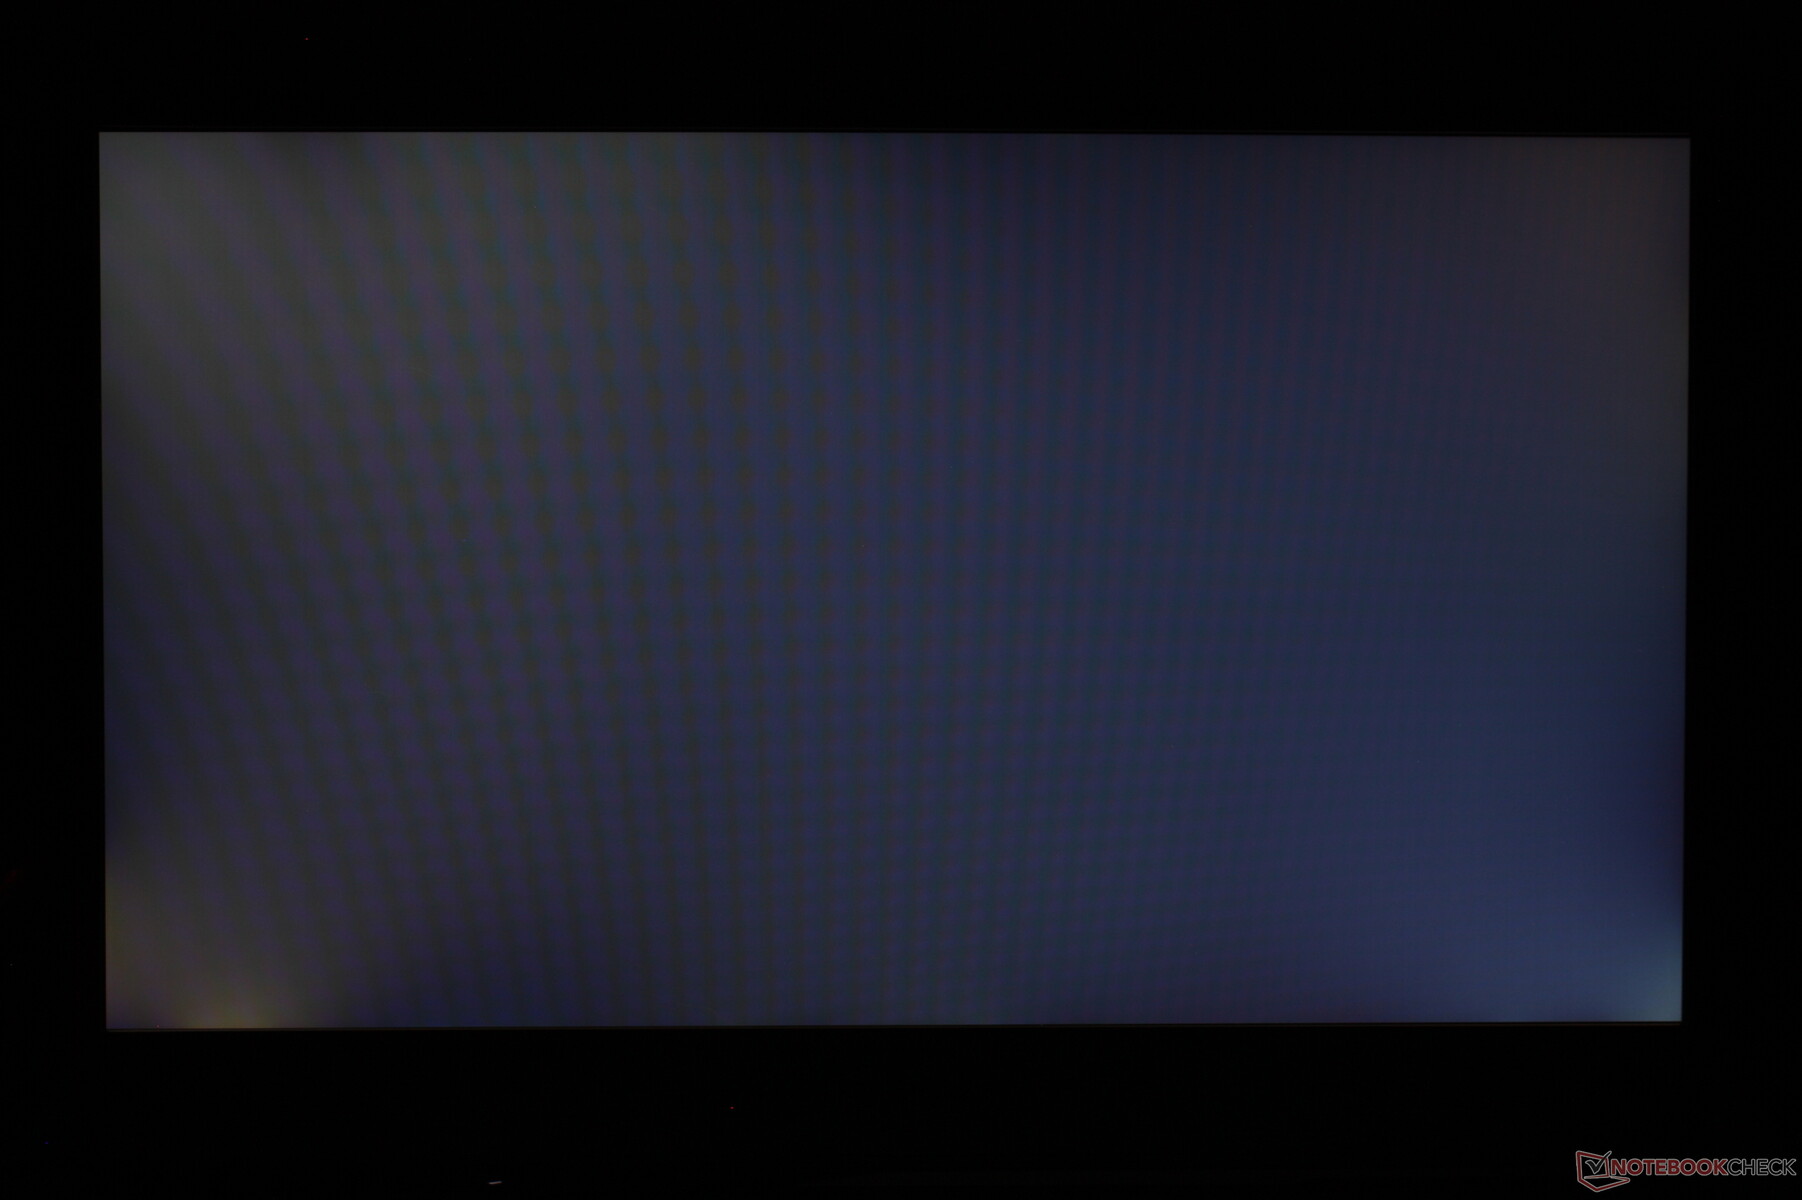
Il pannello sul nostro MSI è notevolmente più luminoso della media per la sua categoria con 390 nits. In confronto, altri portatili da gioco come l'Asus Strix Scar III o il Dell Alienware m15 tendono a superare i 300 nits. Lo svantaggio principale del pannello è il suo rapporto di contrasto medio di circa 600:1, mentre i pannelli dei laptops gaming più costosi come il GS65 sono più vicini a 1000:1.

| |||||||||||||||||||||||||
Distribuzione della luminosità: 87 %
Al centro con la batteria: 384.9 cd/m²
Contrasto: 574:1 (Nero: 0.67 cd/m²)
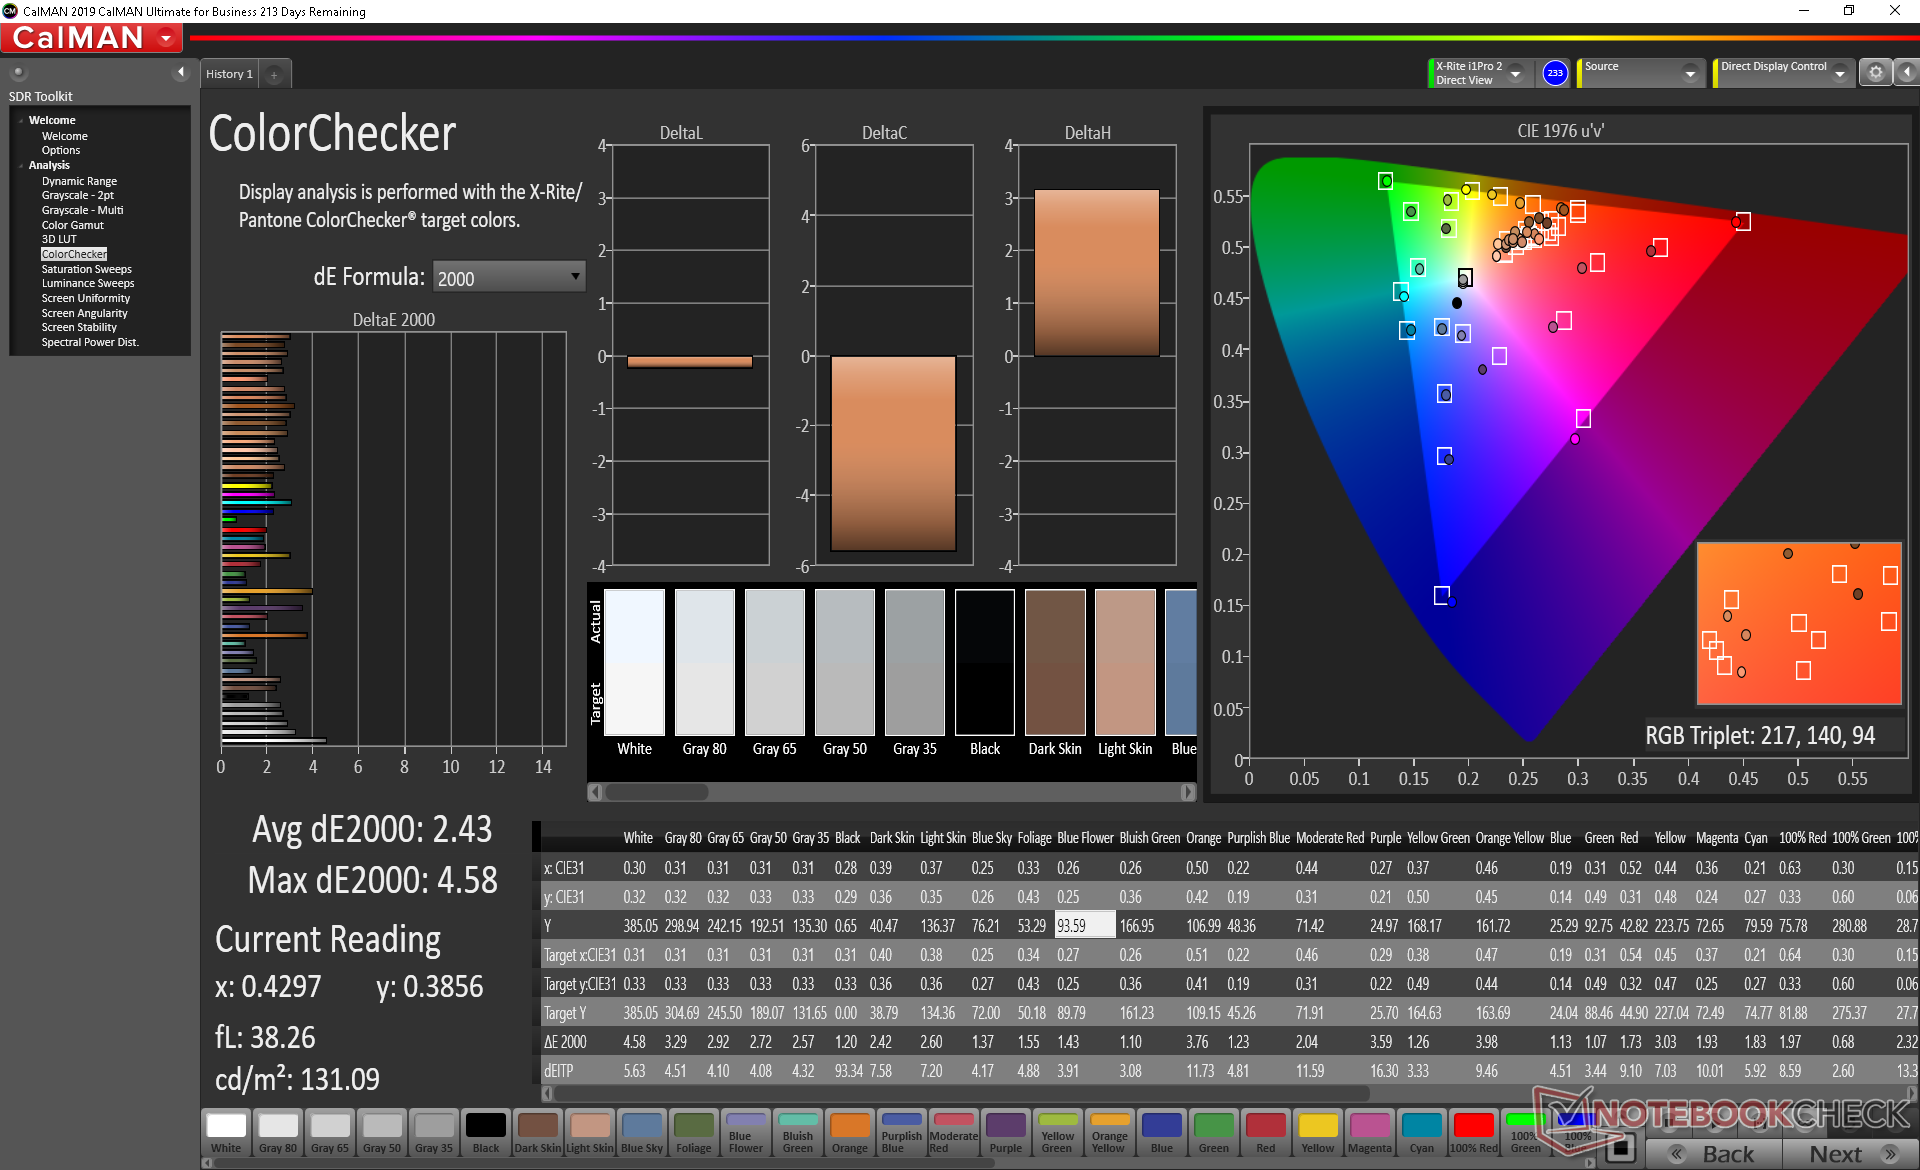
ΔE ColorChecker Calman: 2.43 | ∀{0.5-29.43 Ø4.71}
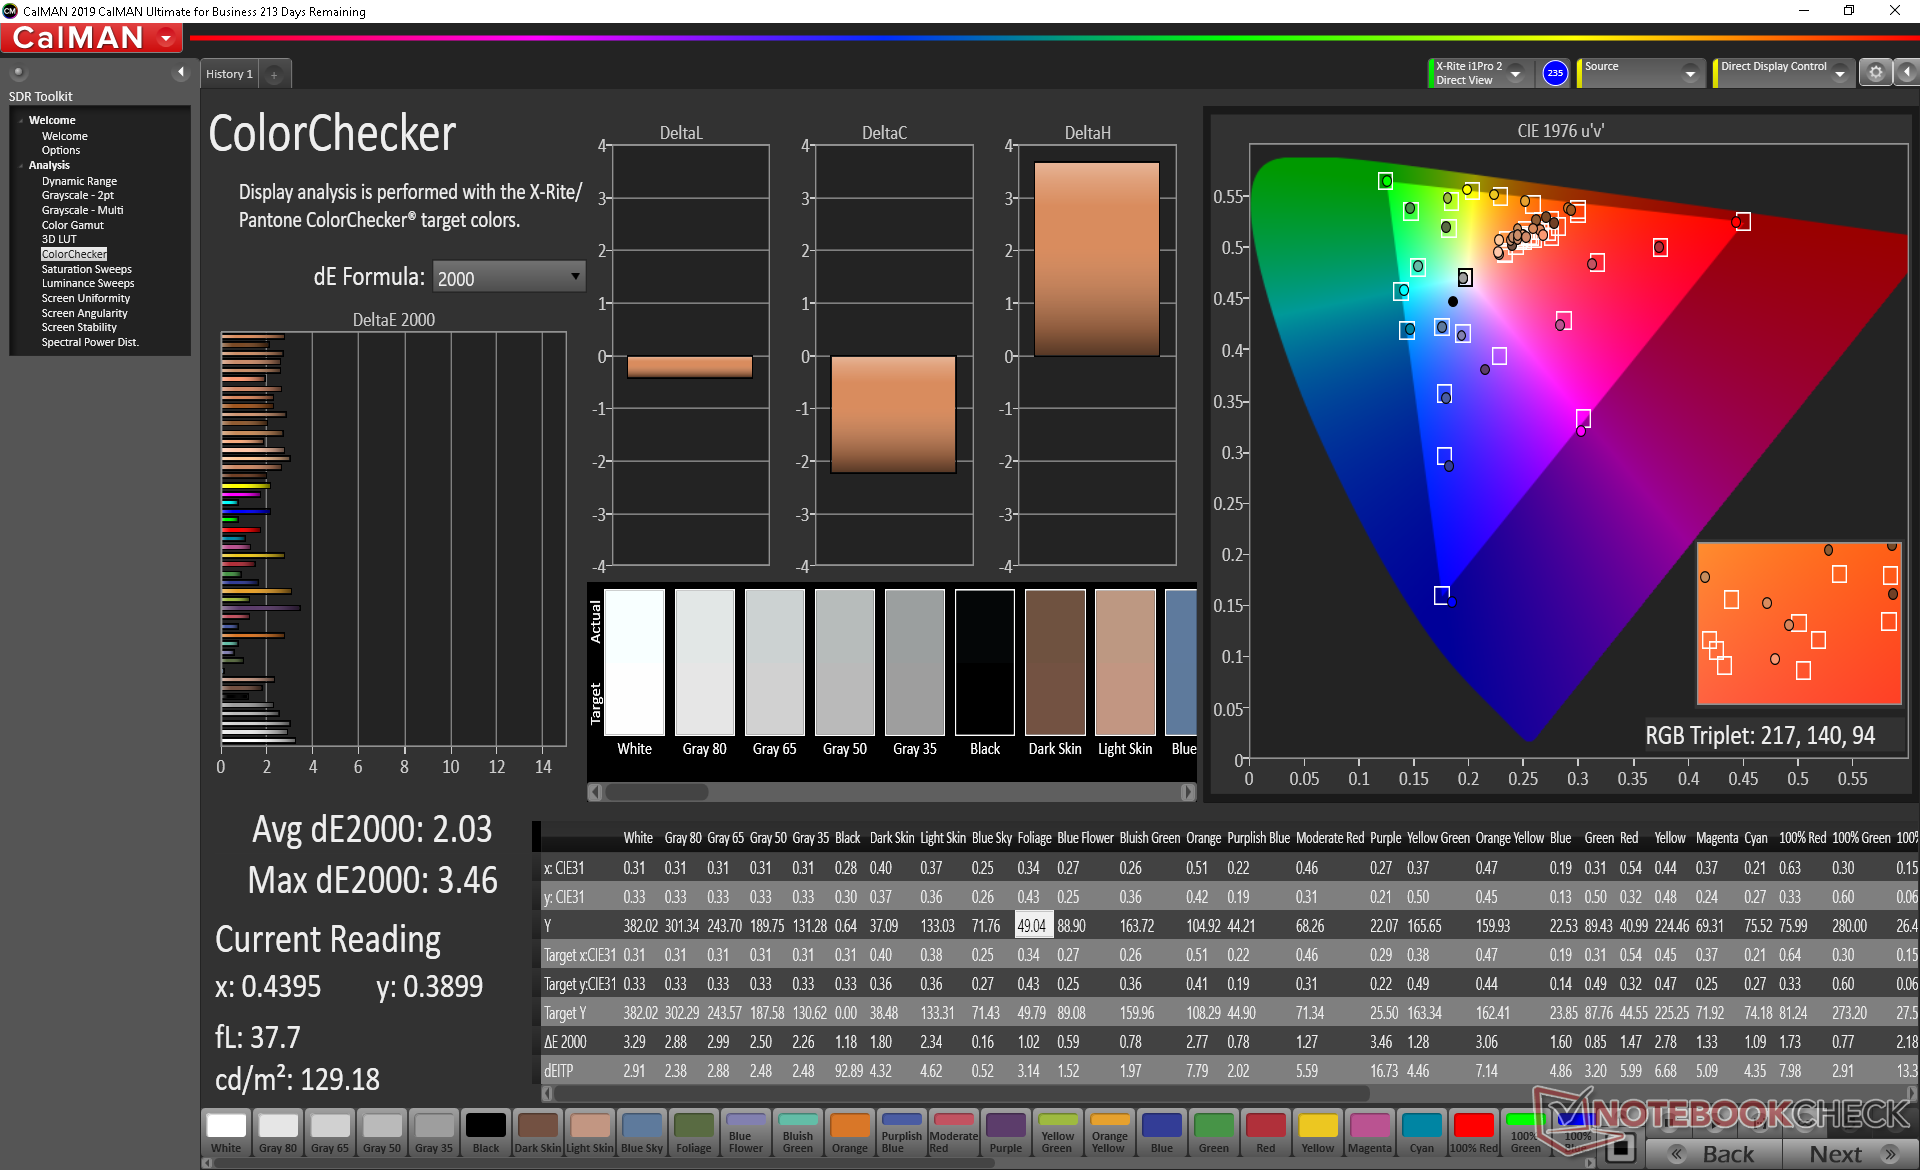
calibrated: 2.03
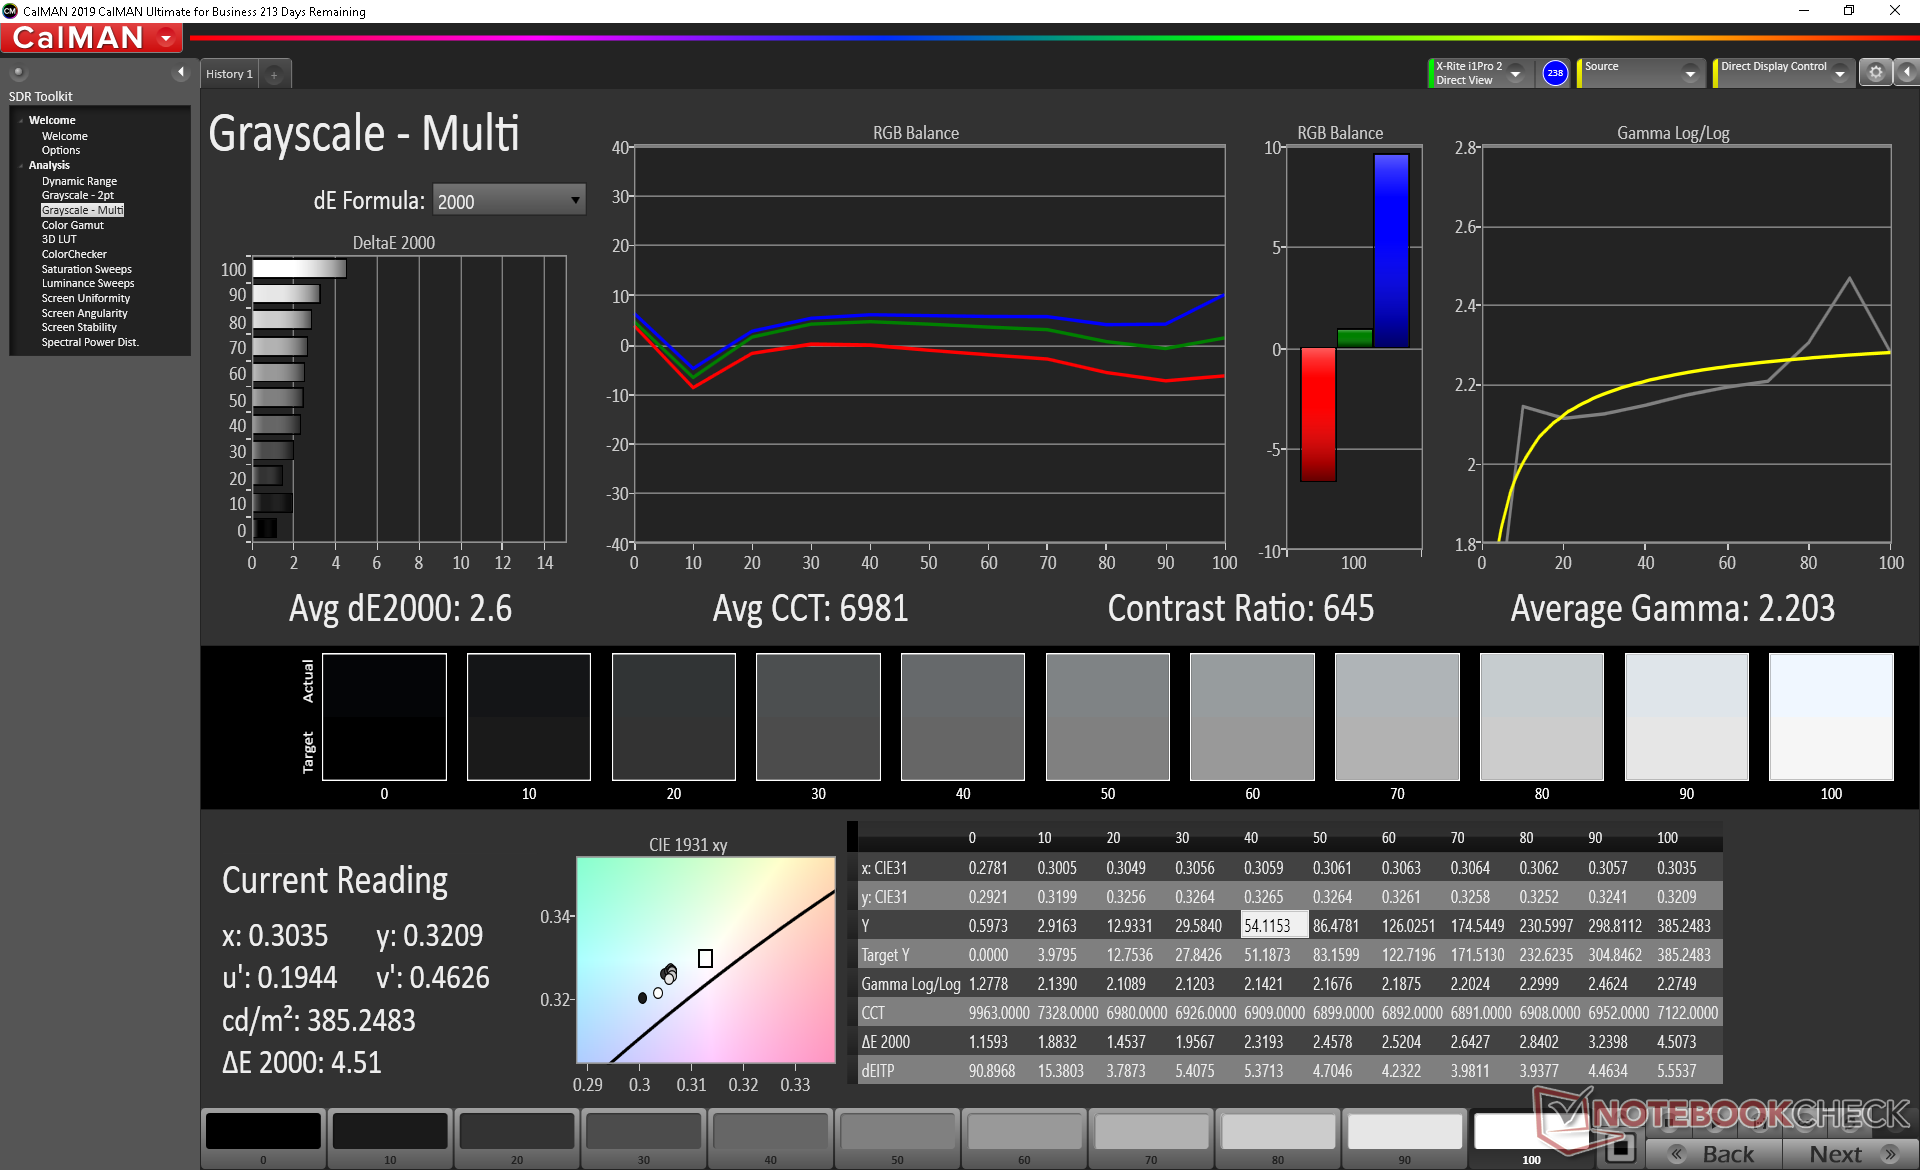
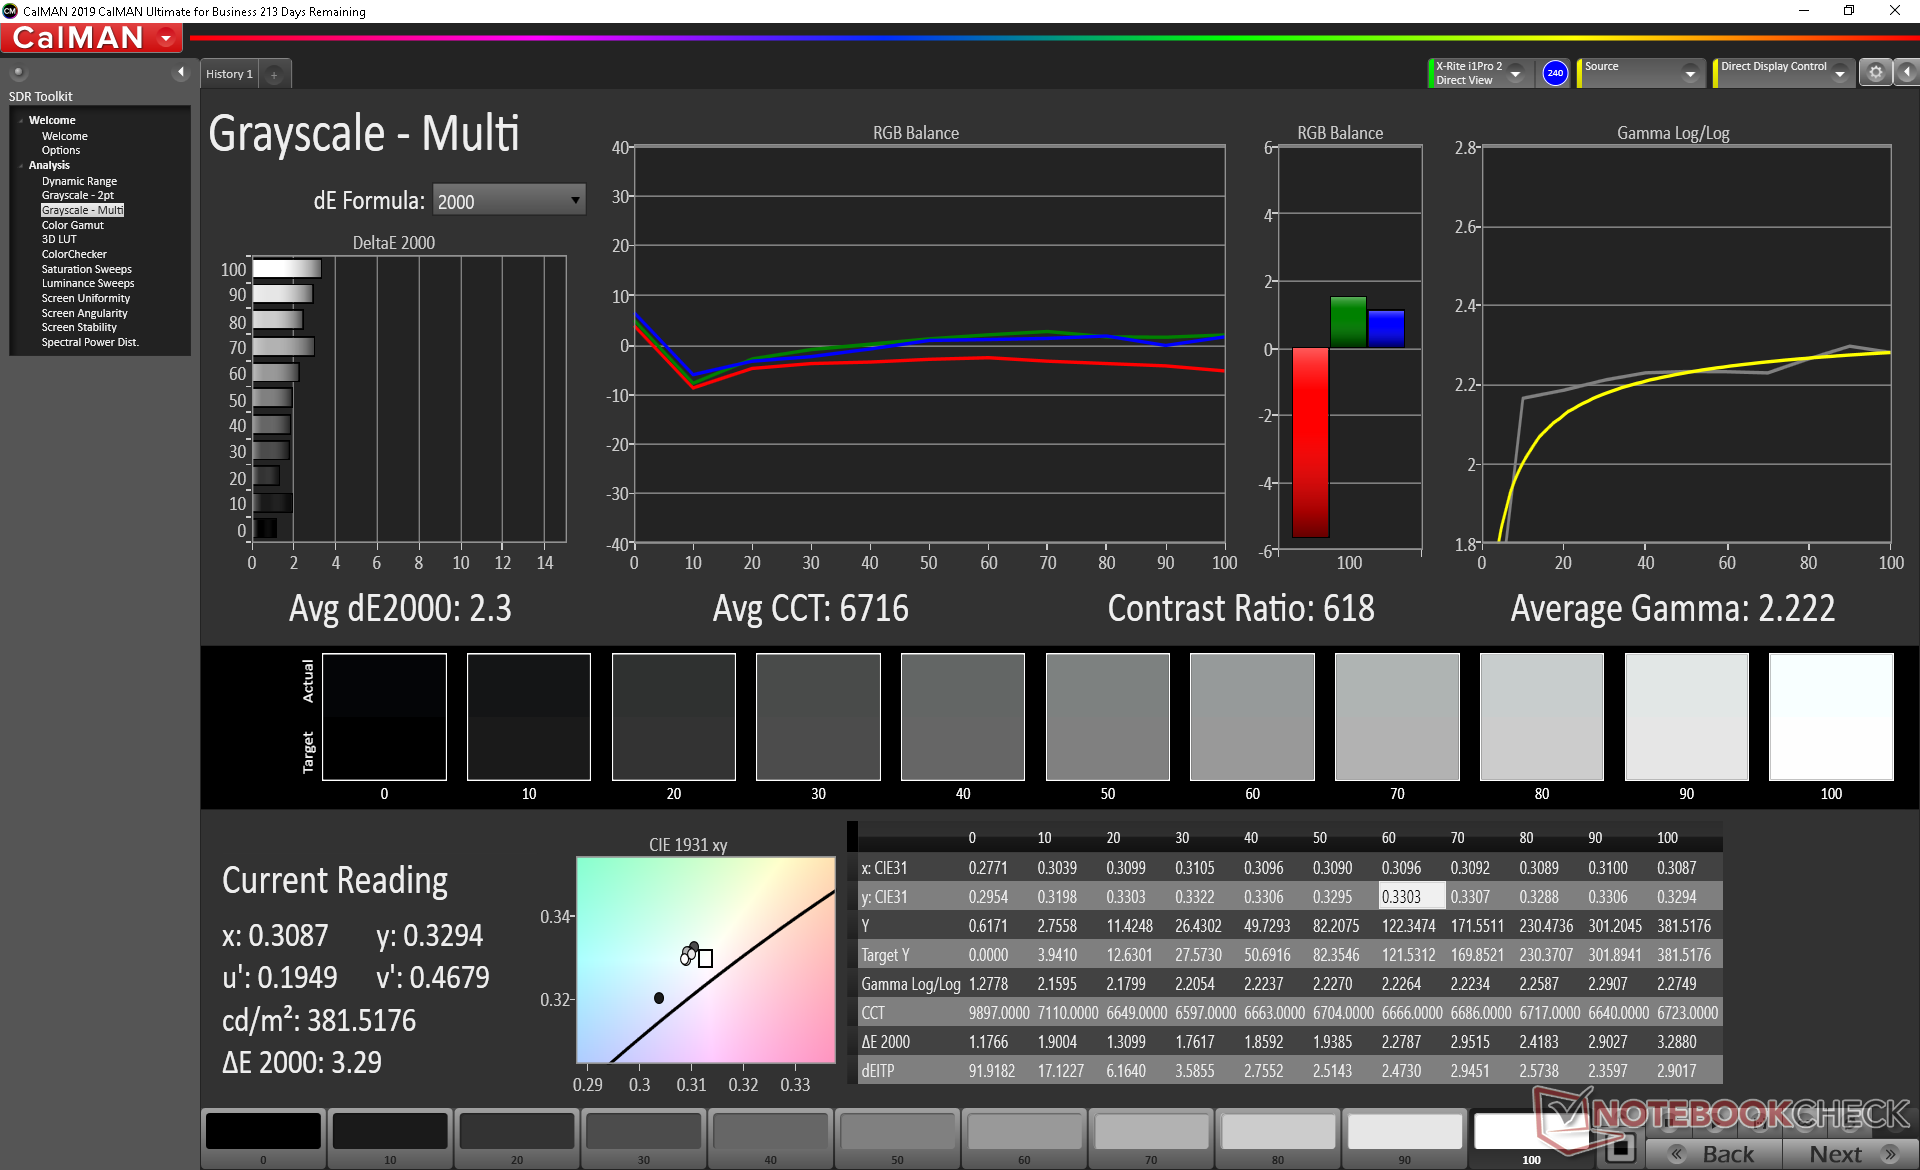
ΔE Greyscale Calman: 2.6 | ∀{0.09-98 Ø4.96}
93.9% sRGB (Argyll 1.6.3 3D)
59.7% AdobeRGB 1998 (Argyll 1.6.3 3D)
65.1% AdobeRGB 1998 (Argyll 3D)
94.4% sRGB (Argyll 3D)
63.5% Display P3 (Argyll 3D)
Gamma: 2.2
CCT: 6981 K
| MSI GP65 10SFK-047US LG Philips LP156WFG-SPB3, IPS, 15.6", 1920x1080 | MSI GP65 Leopard 9SE-225US LG Philips LGD0625, IPS, 15.6", 1920x1080 | Asus Strix Scar III G531GW-AZ062T Sharp LQ156M1JW09 (SHP14D3), IPS, 15.6", 1920x1080 | Asus TUF FX505DT-EB73 Panda LM156LF-GL, IPS, 15.6", 1920x1080 | HP Omen 15-dc1303ng LG Philips LGD05C0, IPS, 15.6", 1920x1080 | MSI GP62 7REX-1045US CMN N156HGE-EAL, TN LED, 15.6", 1920x1080 | |
|---|---|---|---|---|---|---|
| Display | 2% | 4% | -37% | -0% | 23% | |
| Display P3 Coverage (%) | 63.5 | 64.8 2% | 66.2 4% | 39.56 -38% | 63.8 0% | 85.8 35% |
| sRGB Coverage (%) | 94.4 | 96.2 2% | 97.1 3% | 59.5 -37% | 93.4 -1% | 100 6% |
| AdobeRGB 1998 Coverage (%) | 65.1 | 66.3 2% | 67.6 4% | 40.91 -37% | 65 0% | 84.2 29% |
| Response Times | 11% | -10% | -161% | -14% | -174% | |
| Response Time Grey 50% / Grey 80% * (ms) | 10.4 ? | 9.6 ? 8% | 15 ? -44% | 30.4 ? -192% | 14 ? -35% | 34.4 ? -231% |
| Response Time Black / White * (ms) | 12 ? | 10.4 ? 13% | 9 ? 25% | 27.6 ? -130% | 11 ? 8% | 26 ? -117% |
| PWM Frequency (Hz) | 250 ? | 200 ? | ||||
| Screen | 15% | -16% | -61% | 2% | -104% | |
| Brightness middle (cd/m²) | 384.9 | 348.3 -10% | 309 -20% | 286.2 -26% | 316 -18% | 265.7 -31% |
| Brightness (cd/m²) | 358 | 327 -9% | 284 -21% | 267 -25% | 295 -18% | 243 -32% |
| Brightness Distribution (%) | 87 | 85 -2% | 88 1% | 84 -3% | 84 -3% | 87 0% |
| Black Level * (cd/m²) | 0.67 | 0.4 40% | 0.42 37% | 0.33 51% | 0.42 37% | 0.63 6% |
| Contrast (:1) | 574 | 871 52% | 736 28% | 867 51% | 752 31% | 422 -26% |
| Colorchecker dE 2000 * | 2.43 | 1.6 34% | 3.99 -64% | 5.45 -124% | 2.7 -11% | 9.6 -295% |
| Colorchecker dE 2000 max. * | 4.58 | 5.07 -11% | 8.3 -81% | 18.08 -295% | 5.65 -23% | 18.5 -304% |
| Colorchecker dE 2000 calibrated * | 2.03 | 1 51% | 1.12 45% | 4.47 -120% | 1.58 22% | |
| Greyscale dE 2000 * | 2.6 | 2.3 12% | 5.43 -109% | 5.3 -104% | 2.35 10% | 12.7 -388% |
| Gamma | 2.2 100% | 2.203 100% | 2.57 86% | 2.1 105% | 2.41 91% | 2.01 109% |
| CCT | 6981 93% | 6707 97% | 7767 84% | 7679 85% | 6904 94% | 13654 48% |
| Color Space (Percent of AdobeRGB 1998) (%) | 59.7 | 61 2% | 63 6% | 37.6 -37% | 60 1% | 76 27% |
| Color Space (Percent of sRGB) (%) | 93.9 | 96 2% | 97 3% | 59.1 -37% | 93 -1% | 100 6% |
| Media totale (Programma / Settaggio) | 9% /
12% | -7% /
-11% | -86% /
-69% | -4% /
-0% | -85% /
-88% |
* ... Meglio usare valori piccoli
Lo spazio colore copre circa il 94% di sRGB e il 60% di AdobeRGB risultando inferiore allo spazio colore disponibile sul vecchio pannello GP62 TN. Tuttavia, i tempi di risposta superiori, la velocità di aggiornamento, gli angoli di visualizzazione e la qualità complessiva del pannello più recente compensano il deficit di colore.
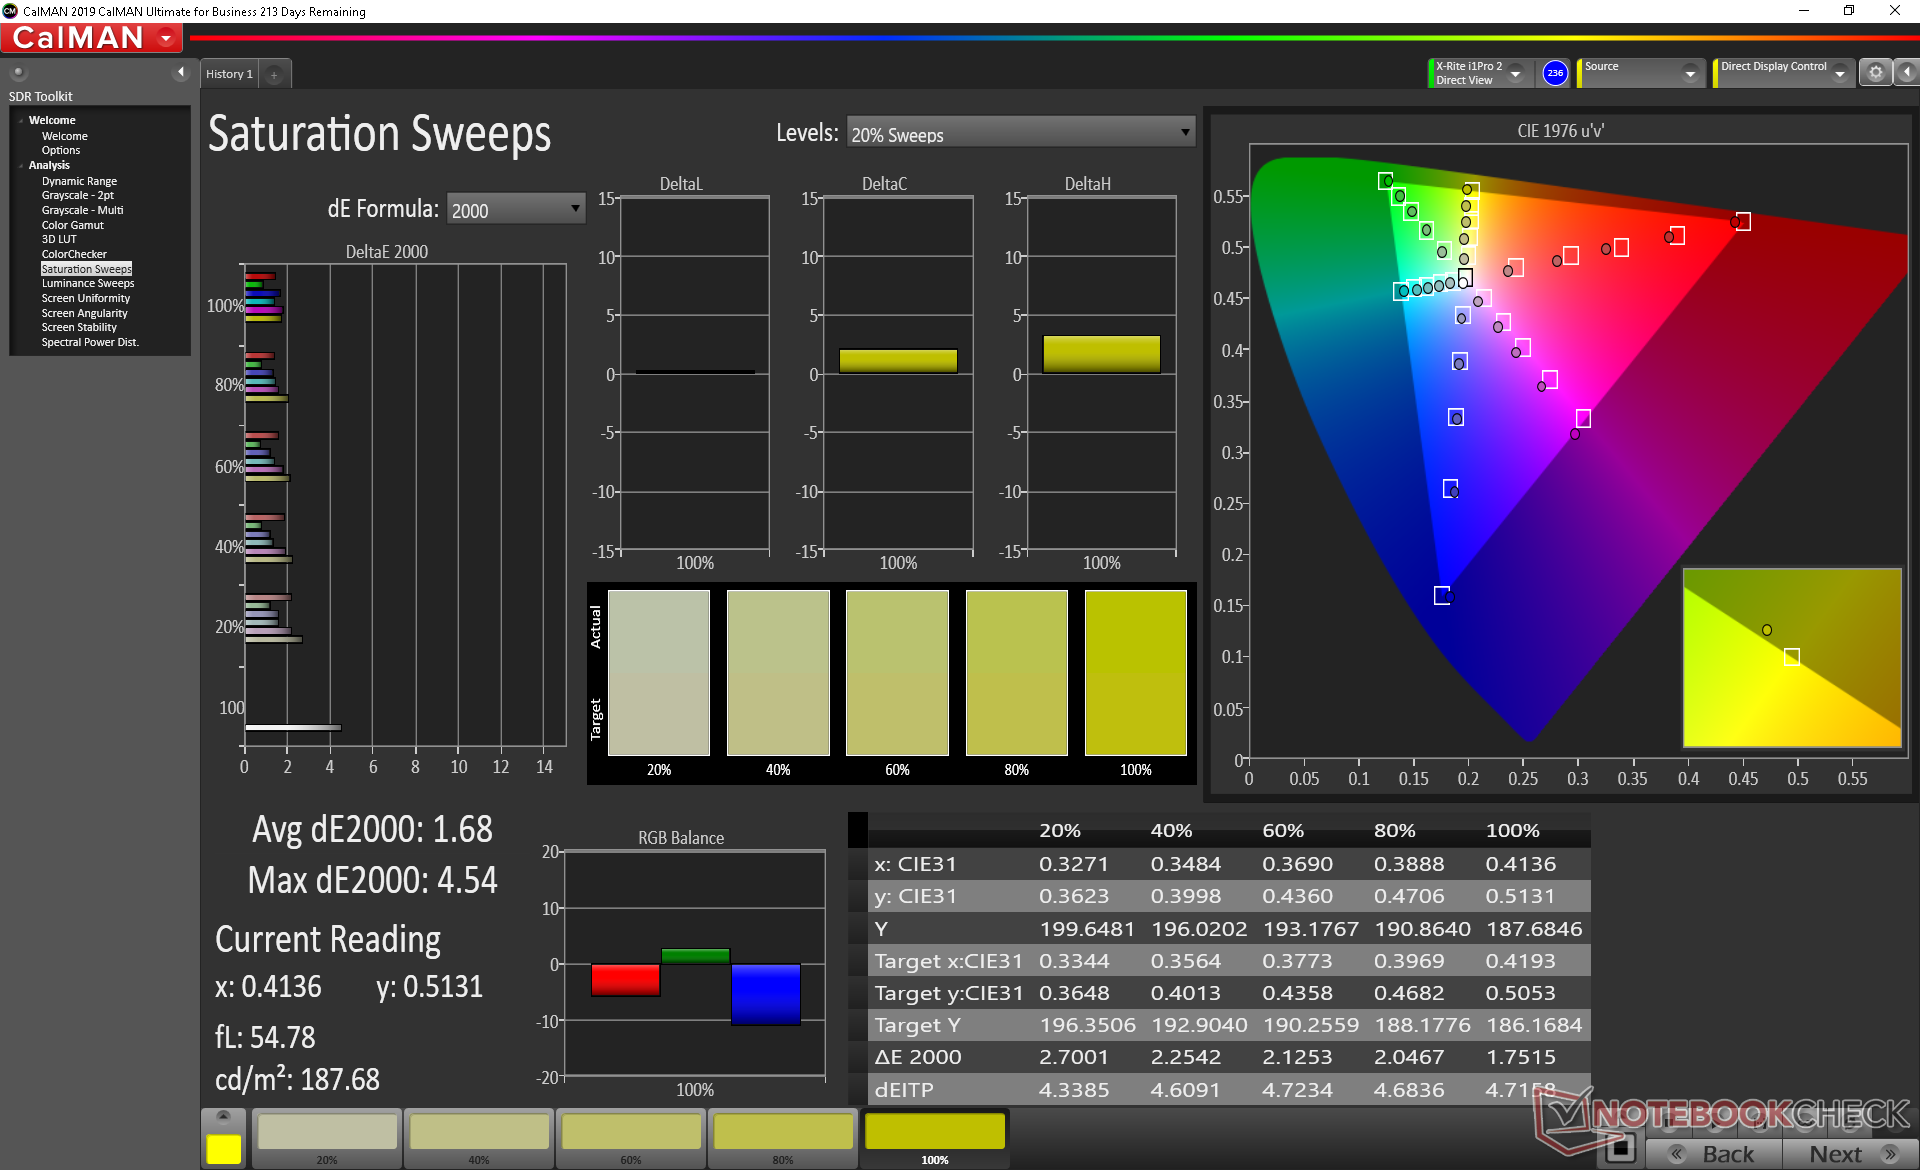
Le misurazioni con un colorimetro X-Rite rivelano un display ben calibrato. Calibrando ulteriormente il display, si possono ottenere solo miglioramenti marginali, il che significa che gli utenti finali non dovranno fare nient'altro per ottenere il massimo dal display.

Tempi di risposta del Display
| ↔ Tempi di risposta dal Nero al Bianco | ||
|---|---|---|
| 12 ms ... aumenta ↗ e diminuisce ↘ combinato | ↗ 6.8 ms Incremento | 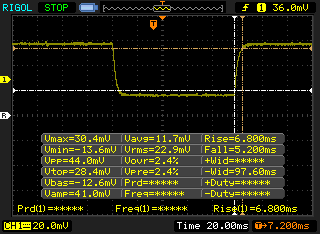 |
| ↘ 5.2 ms Calo | ||
| Lo schermo mostra buoni tempi di risposta durante i nostri tests, ma potrebbe essere troppo lento per i gamers competitivi. In confronto, tutti i dispositivi di test variano da 0.1 (minimo) a 240 (massimo) ms. » 32 % di tutti i dispositivi è migliore. Questo significa che i tempi di risposta rilevati sono migliori rispettto alla media di tutti i dispositivi testati (19.8 ms). | ||
| ↔ Tempo di risposta dal 50% Grigio all'80% Grigio | ||
| 10.4 ms ... aumenta ↗ e diminuisce ↘ combinato | ↗ 6.4 ms Incremento | 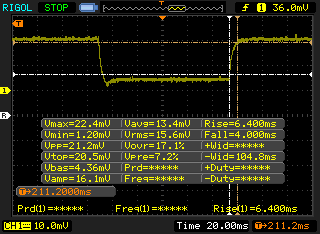 |
| ↘ 4 ms Calo | ||
| Lo schermo mostra buoni tempi di risposta durante i nostri tests, ma potrebbe essere troppo lento per i gamers competitivi. In confronto, tutti i dispositivi di test variano da 0.165 (minimo) a 636 (massimo) ms. » 24 % di tutti i dispositivi è migliore. Questo significa che i tempi di risposta rilevati sono migliori rispettto alla media di tutti i dispositivi testati (30.9 ms). | ||
Sfarfallio dello schermo / PWM (Pulse-Width Modulation)
| flickering dello schermo / PWM non rilevato | 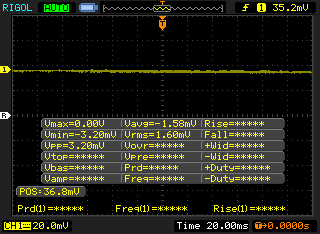 | ||
In confronto: 52 % di tutti i dispositivi testati non utilizza PWM per ridurre la luminosita' del display. Se è rilevato PWM, una media di 7744 (minimo: 5 - massimo: 343500) Hz è stata rilevata. | |||
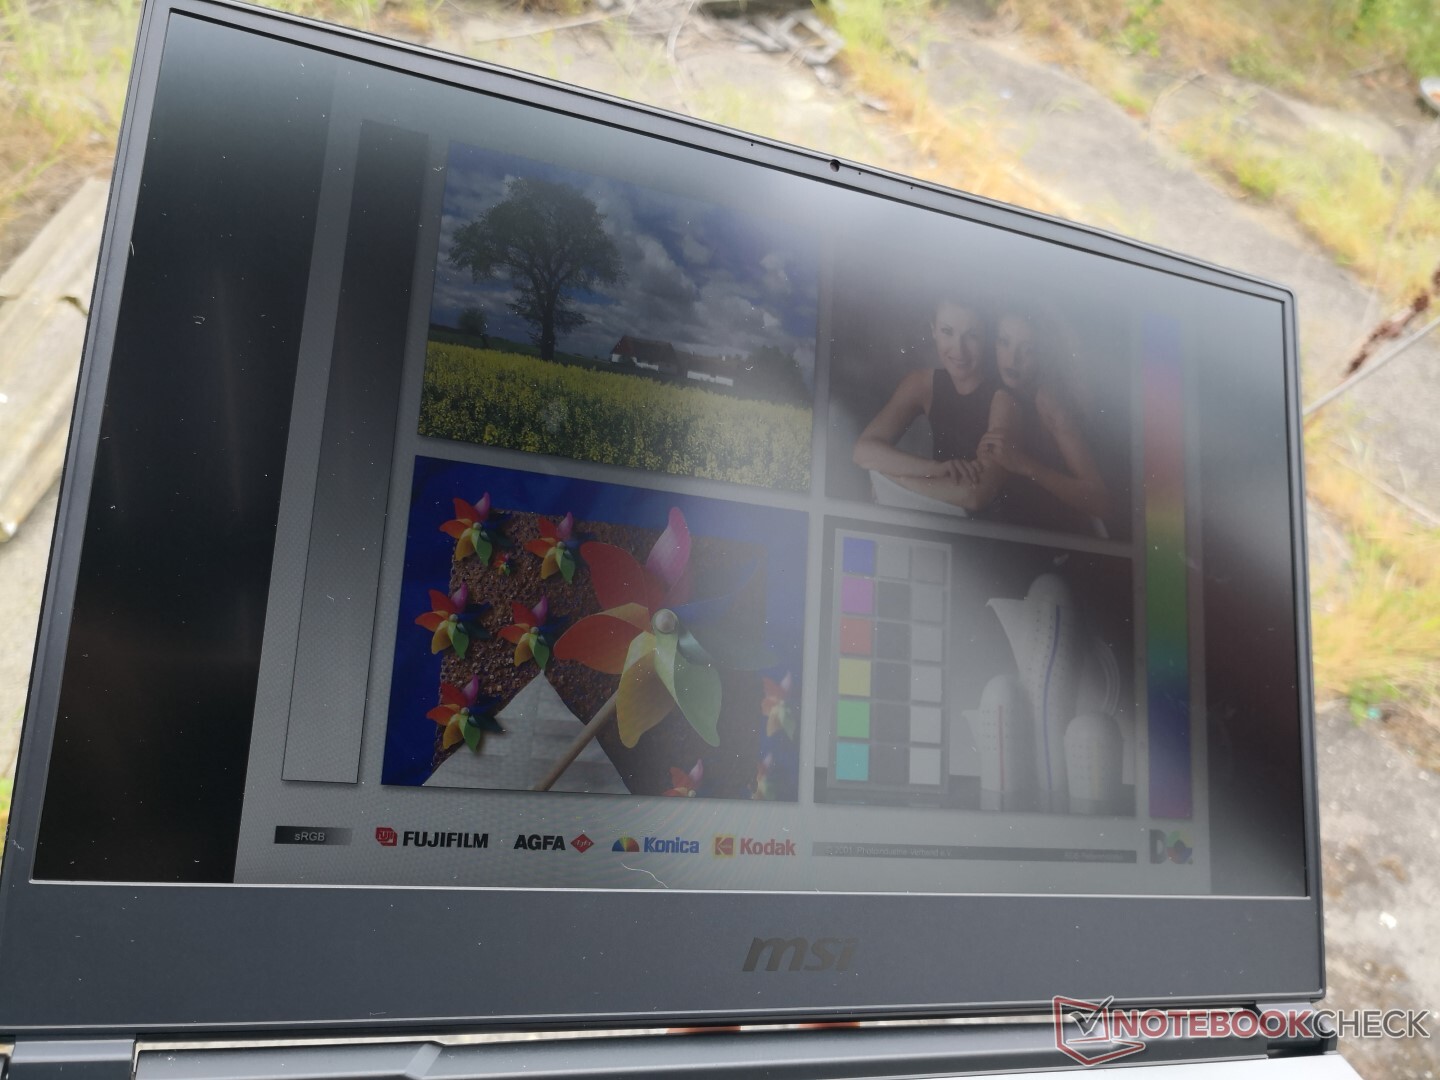
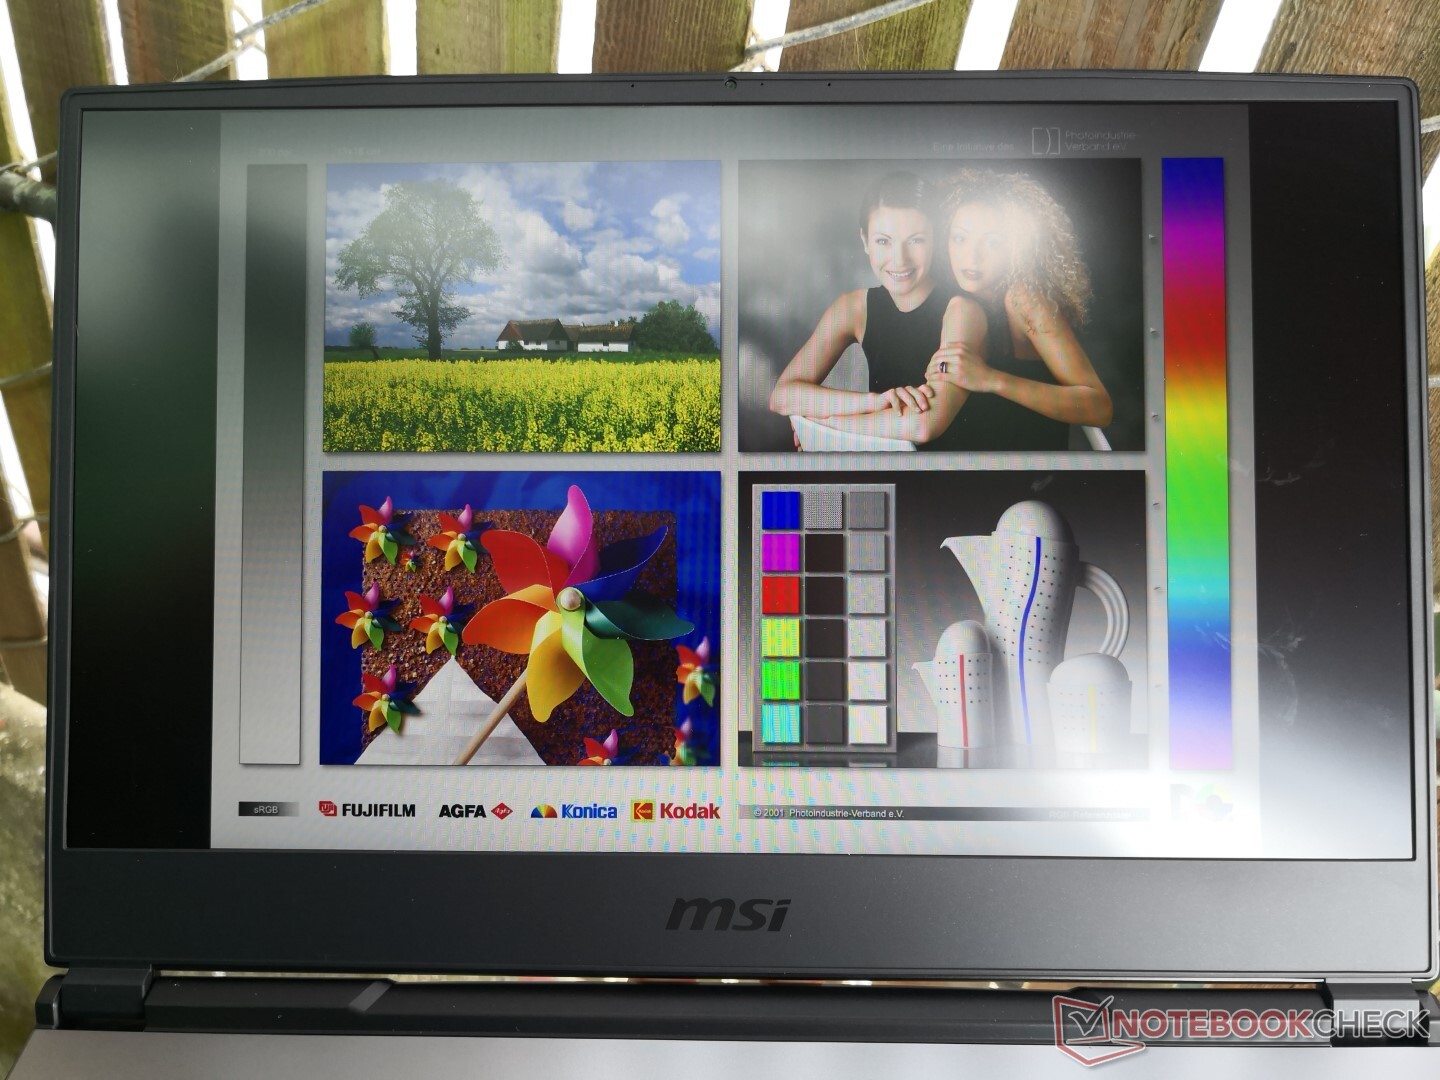
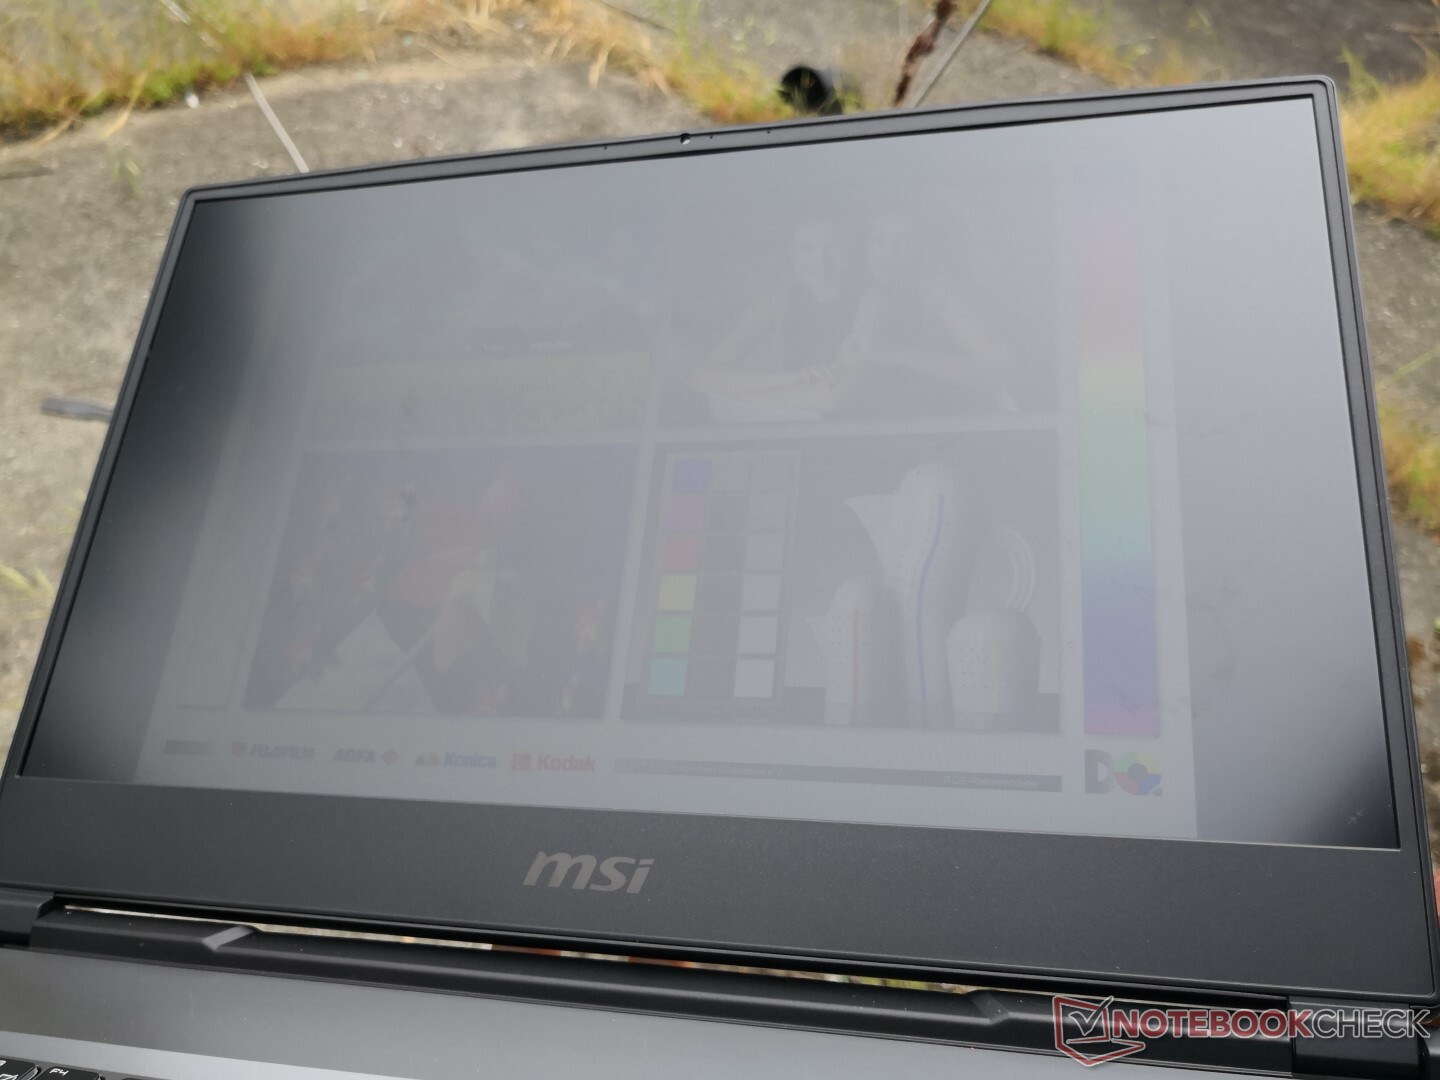
La visibilità all'aperto è ancora nella media della categoria, poiché i portatili da gioco non sono progettati per essere utilizzati all'aperto frequentemente. La maggior parte degli Ultrabooks hanno display più luminosi per attenuare meglio i riflessi e i colori sbiaditi.
Prestazioni

Processore
Le prestazioni della CPU sono circa dal 5 al 15% più veloci rispetto alla media dei portatili Core i7-9750H. Gli utenti che passano da un vecchio portatile Core i7-8750H vedranno guadagni più significativi dell'11-27% circa. I guadagni relativamente minori da gen a gen non sono inaspettati, dato che Comet Lake-H condivide lo stesso silicio a 14 nm del Coffee Lake-H.
La sostenibilità delle prestazioni è comunque eccellente. L'esecuzione di CineBench R15 Multi-Thread in loop comporta un calo delle prestazioni di solo il 4% nel tempo.
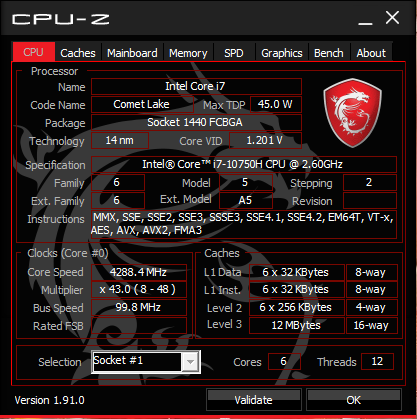
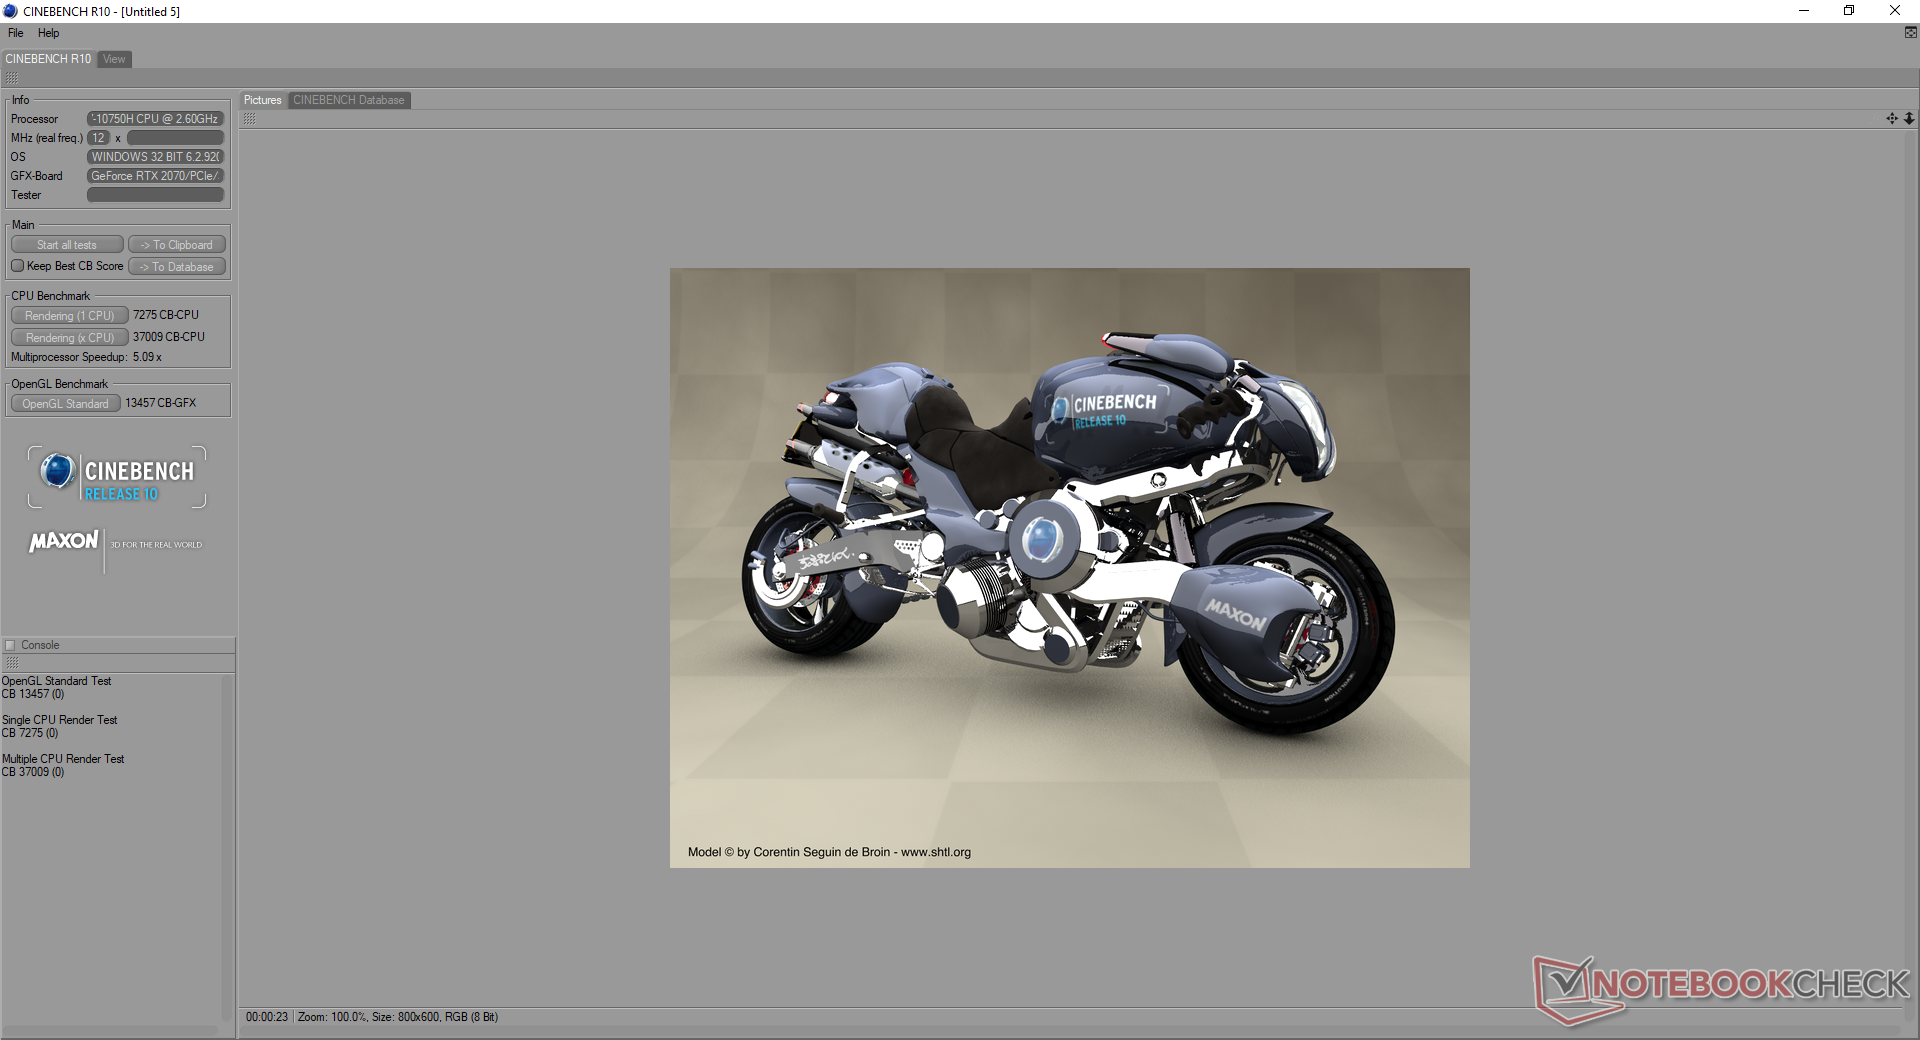
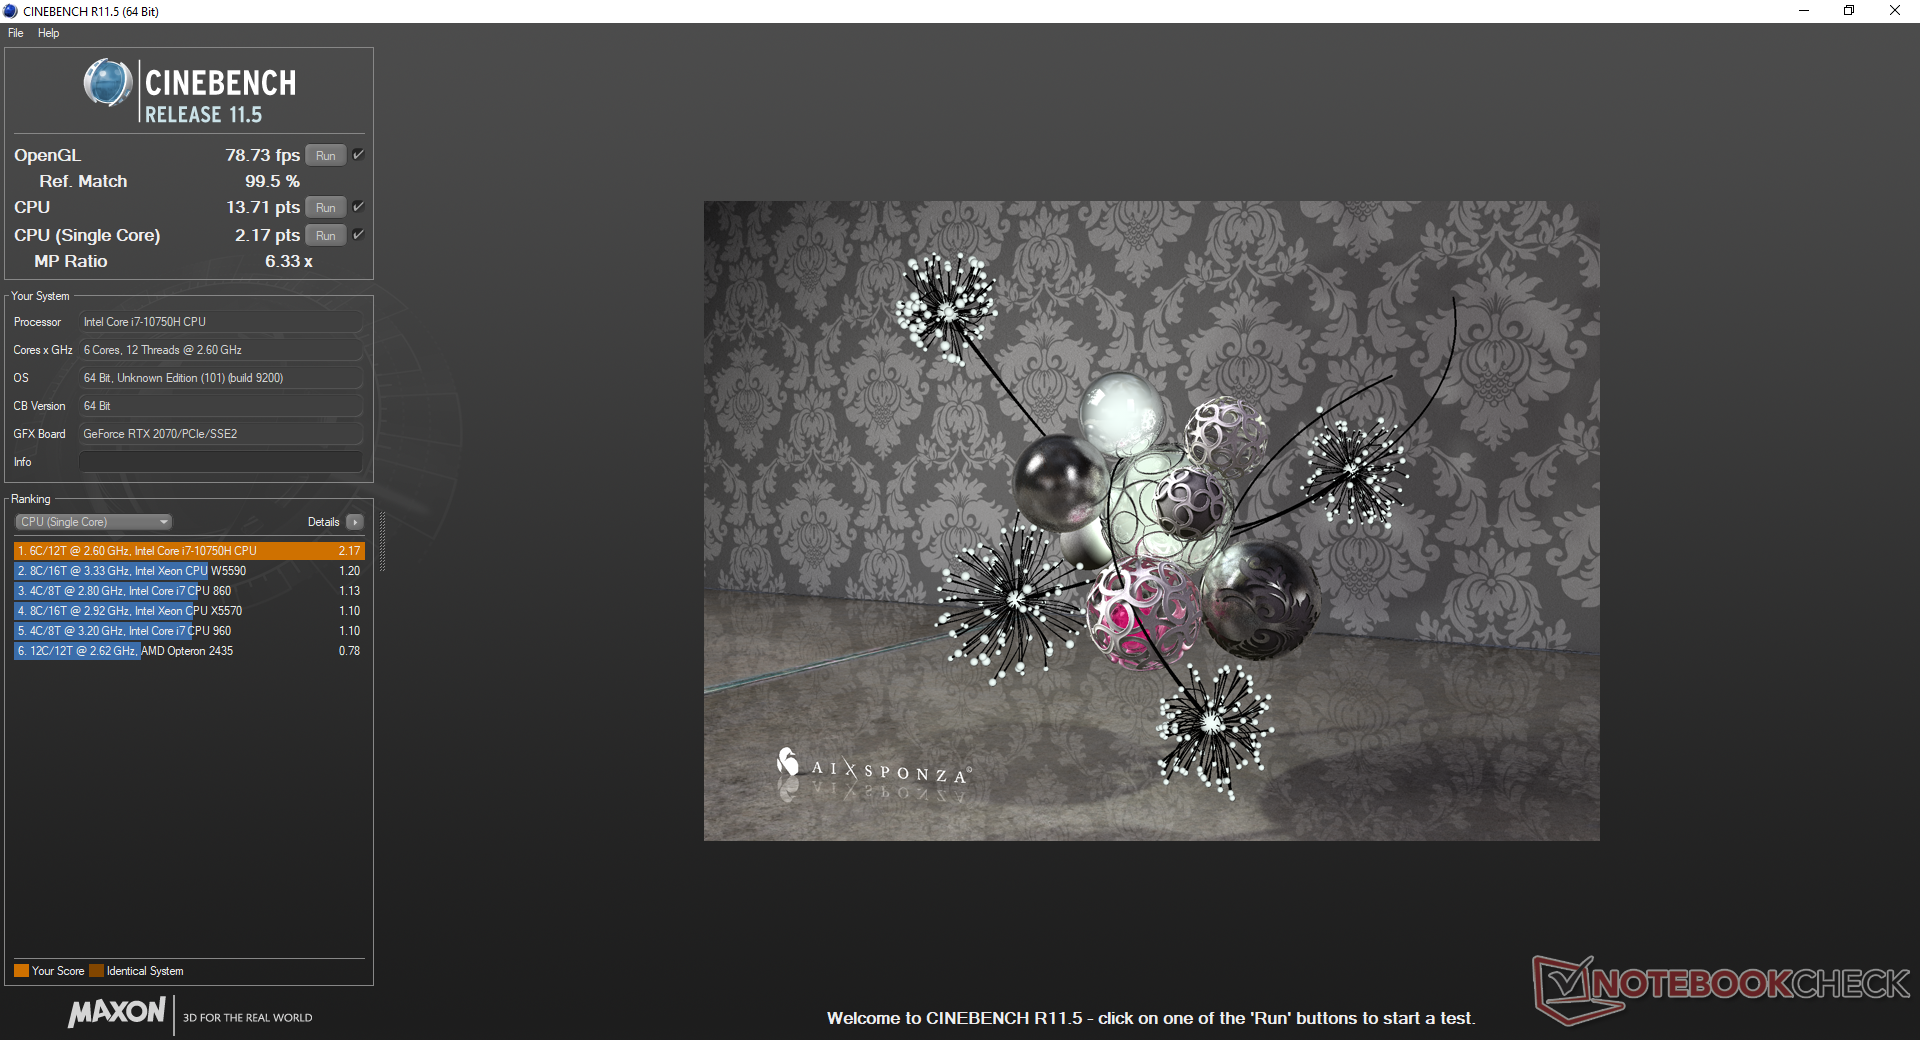
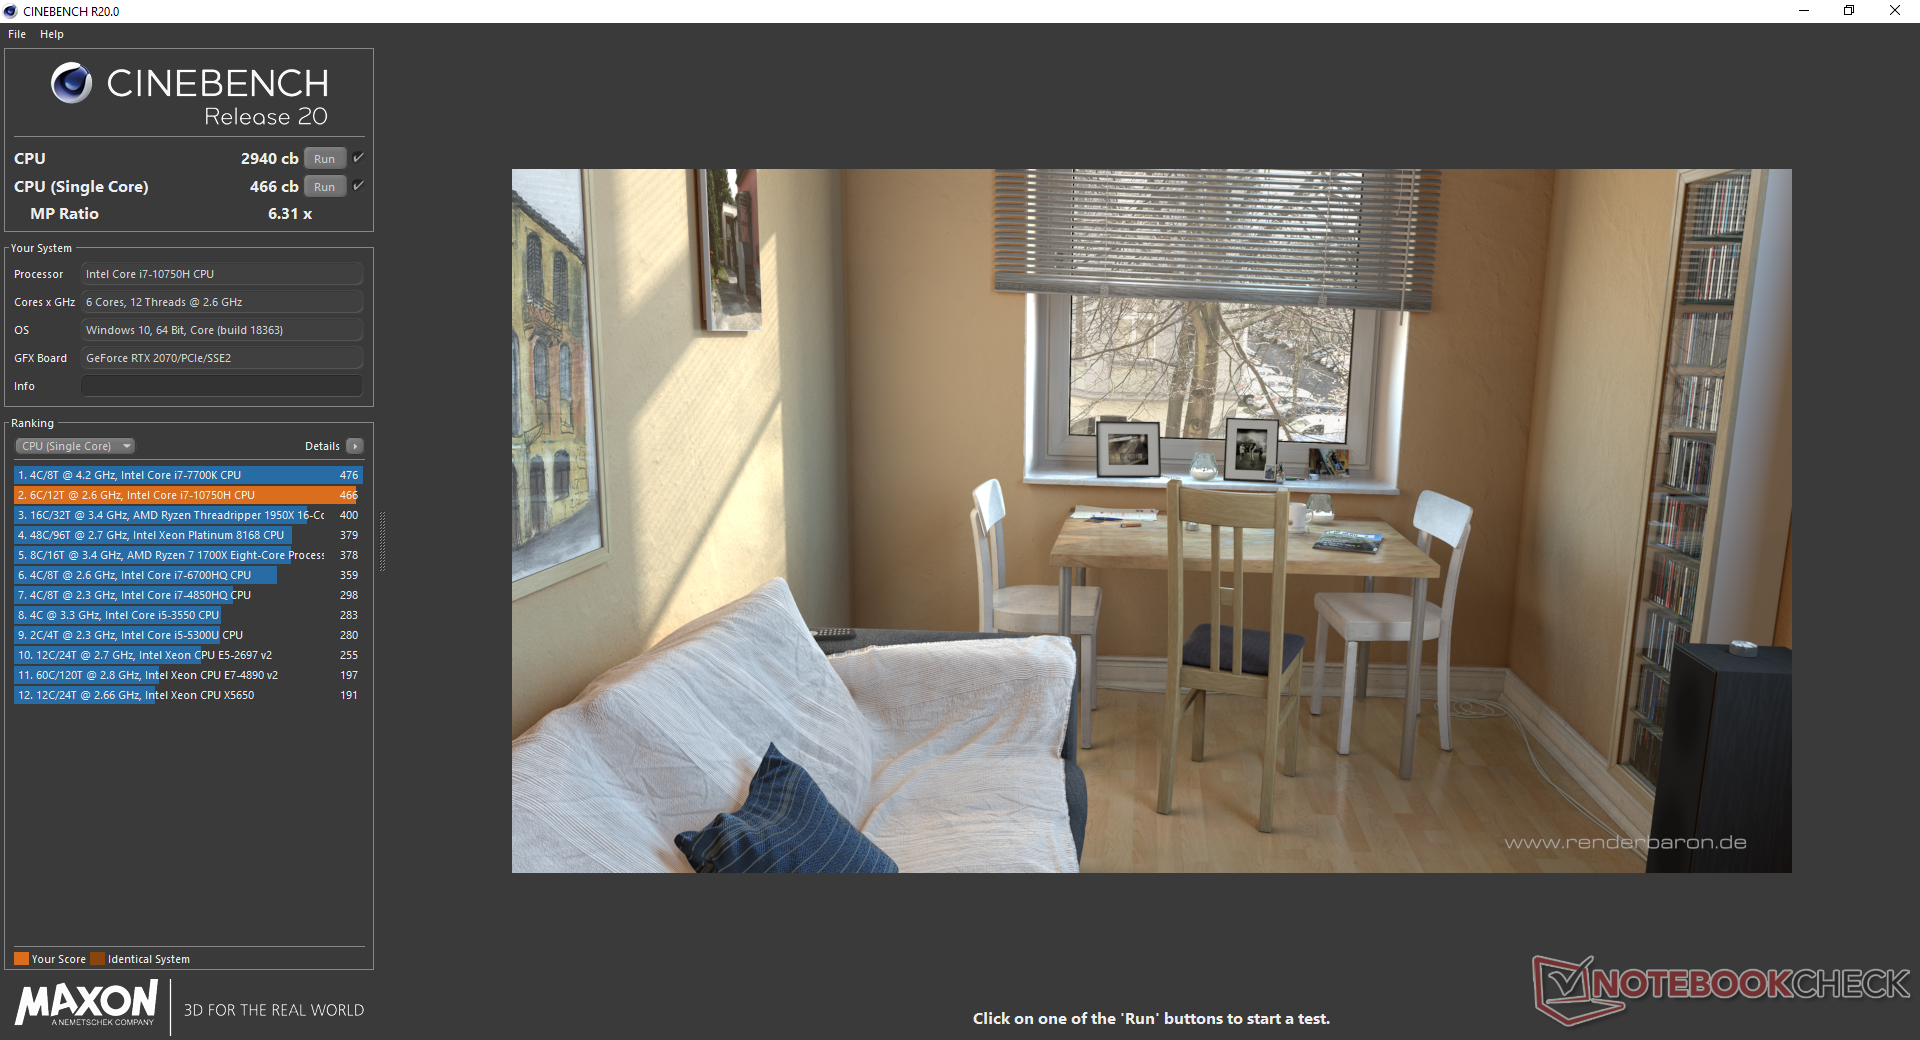
Consultate la nostra pagina dedicata sul Core i7-10750H per maggiori dettagli tecnici e confronti di benchmarks. L'hexa-core Core i7-10750H è solo un passo indietro rispetto all'otta-core Core i7-10875H disponibile sul Gigabyte Aero 15.
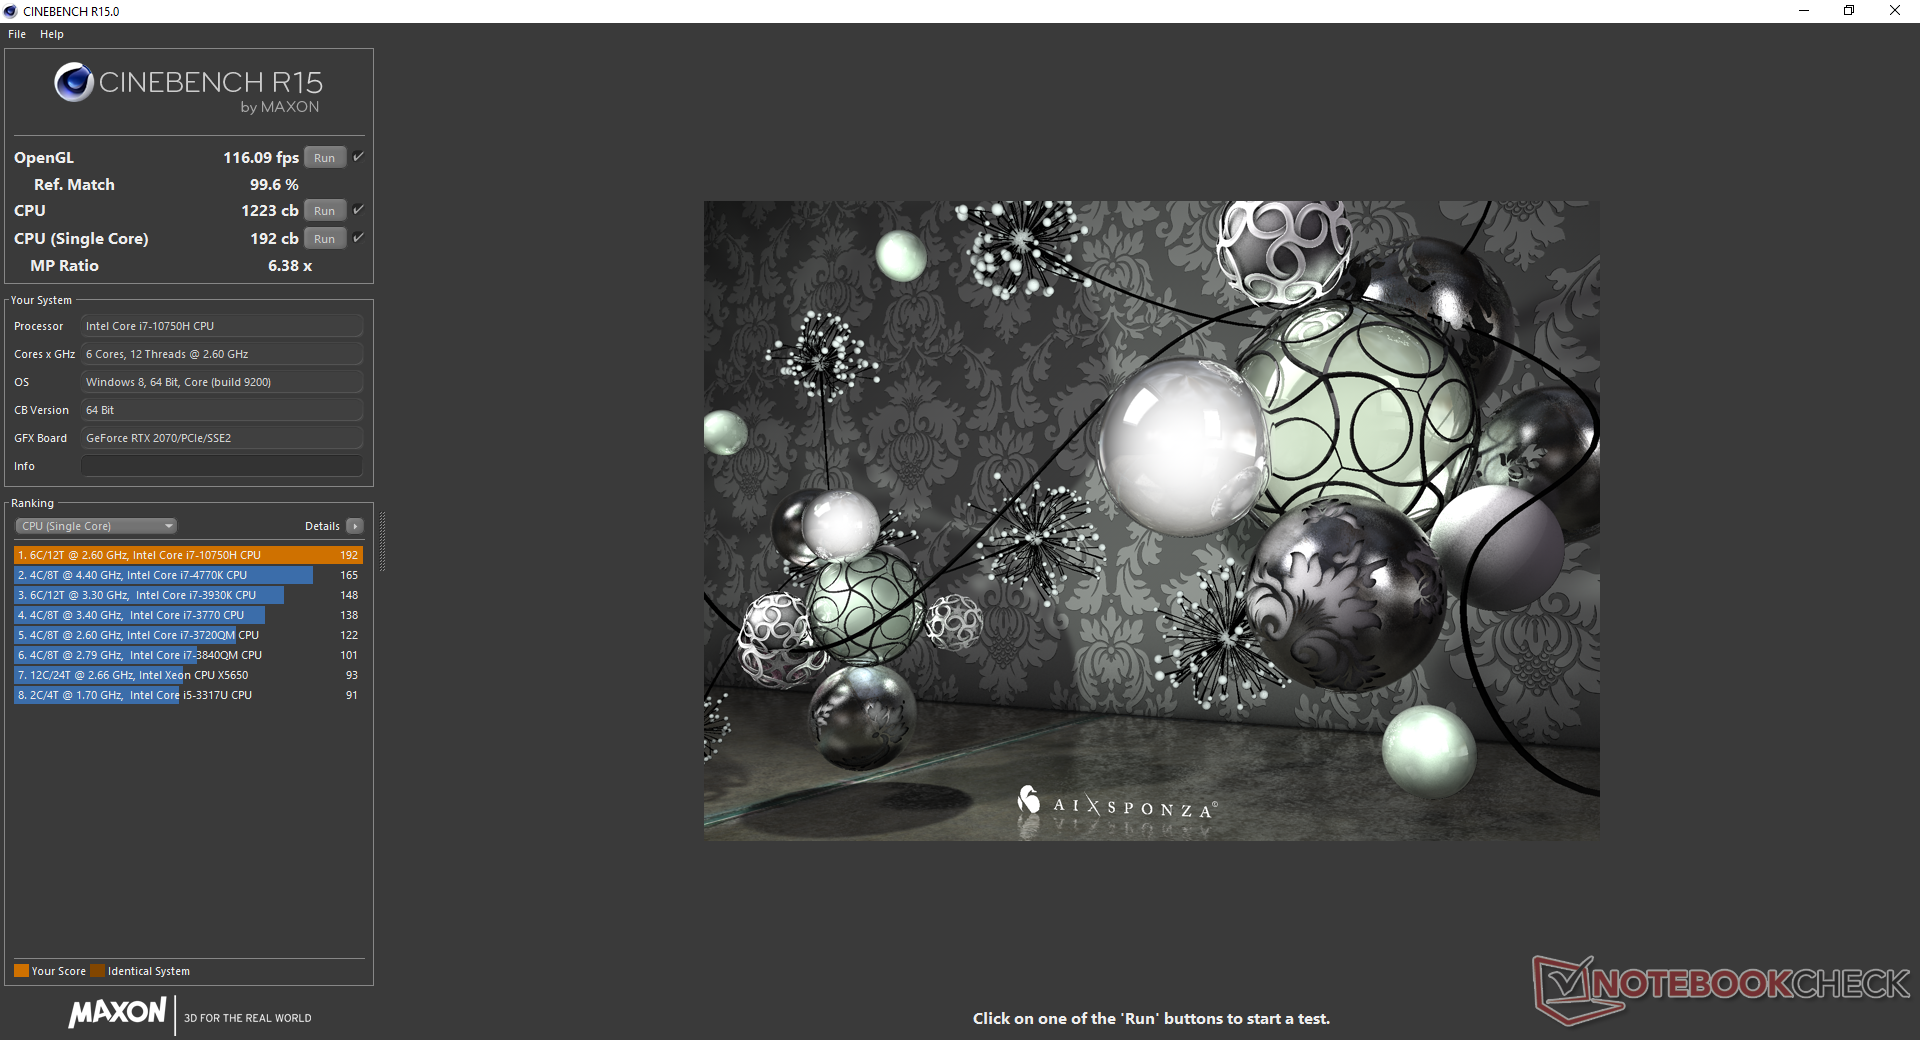
Cinebench R15: CPU Single 64Bit | CPU Multi 64Bit
Blender: v2.79 BMW27 CPU
7-Zip 18.03: 7z b 4 -mmt1 | 7z b 4
Geekbench 5.5: Single-Core | Multi-Core
HWBOT x265 Benchmark v2.2: 4k Preset
LibreOffice : 20 Documents To PDF
R Benchmark 2.5: Overall mean
| Cinebench R20 / CPU (Multi Core) | |
| Asus Zephyrus G14 GA401IV | |
| Eurocom Nightsky RX15 | |
| AMD Ryzen 1800X - Asus Crosshair VI Hero | |
| MSI GE65 Raider 9SF-049US | |
| Gigabyte Aero 17 HDR XB | |
| MSI GP65 10SFK-047US | |
| Media Intel Core i7-9750H (2017 - 3133, n=55) | |
| Schenker Key 16 | |
| MSI GF75 Thin 10SCXR | |
| MSI GF63 Thin 9SC | |
| MSI Alpha 15 A3DDK-034 | |
| Cinebench R20 / CPU (Single Core) | |
| Gigabyte Aero 17 HDR XB | |
| Asus Zephyrus G14 GA401IV | |
| Eurocom Nightsky RX15 | |
| MSI GE65 Raider 9SF-049US | |
| MSI GP65 10SFK-047US | |
| Media Intel Core i7-9750H (416 - 486, n=55) | |
| MSI GF75 Thin 10SCXR | |
| MSI GF63 Thin 9SC | |
| Schenker Key 16 | |
| AMD Ryzen 1800X - Asus Crosshair VI Hero | |
| MSI Alpha 15 A3DDK-034 | |
| Cinebench R15 / CPU Single 64Bit | |
| Gigabyte Aero 17 HDR XB | |
| Eurocom Nightsky RX15 | |
| MSI GE65 Raider 9SF-049US | |
| MSI GP65 Leopard 9SE-225US | |
| Asus Zephyrus G14 GA401IV | |
| MSI GP65 10SFK-047US | |
| Media Intel Core i7-9750H (170 - 194, n=82) | |
| MSI GF75 Thin 10SCXR | |
| MSI GF63 Thin 9SC | |
| Schenker Key 16 | |
| AMD Ryzen 1800X - Asus Crosshair VI Hero | |
| MSI Alpha 15 A3DDK-034 | |
| Cinebench R15 / CPU Multi 64Bit | |
| Asus Zephyrus G14 GA401IV | |
| Eurocom Nightsky RX15 | |
| Gigabyte Aero 17 HDR XB | |
| MSI GE65 Raider 9SF-049US | |
| AMD Ryzen 1800X - Asus Crosshair VI Hero | |
| MSI GP65 10SFK-047US | |
| MSI GP65 Leopard 9SE-225US | |
| Media Intel Core i7-9750H (952 - 1306, n=85) | |
| Schenker Key 16 | |
| MSI GF75 Thin 10SCXR | |
| MSI GF63 Thin 9SC | |
| MSI Alpha 15 A3DDK-034 | |
| Blender / v2.79 BMW27 CPU | |
| MSI GF75 Thin 10SCXR | |
| Eurocom Nightsky RX15 | |
| Media Intel Core i7-9750H (342 - 495, n=21) | |
| MSI GP65 10SFK-047US | |
| Gigabyte Aero 17 HDR XB | |
| Asus Zephyrus G14 GA401IV | |
| AMD Ryzen 1800X - Asus Crosshair VI Hero | |
| 7-Zip 18.03 / 7z b 4 -mmt1 | |
| Gigabyte Aero 17 HDR XB | |
| Eurocom Nightsky RX15 | |
| MSI GP65 10SFK-047US | |
| Media Intel Core i7-9750H (4580 - 5090, n=21) | |
| MSI GF75 Thin 10SCXR | |
| Asus Zephyrus G14 GA401IV | |
| 7-Zip 18.03 / 7z b 4 | |
| Asus Zephyrus G14 GA401IV | |
| Gigabyte Aero 17 HDR XB | |
| Eurocom Nightsky RX15 | |
| MSI GP65 10SFK-047US | |
| Media Intel Core i7-9750H (28512 - 35174, n=21) | |
| MSI GF75 Thin 10SCXR | |
| Geekbench 5.5 / Single-Core | |
| Gigabyte Aero 17 HDR XB | |
| Asus Zephyrus G14 GA401IV | |
| MSI GP65 10SFK-047US | |
| Media Intel Core i7-9750H (1117 - 1251, n=13) | |
| MSI GF75 Thin 10SCXR | |
| MSI Alpha 15 A3DDK-034 | |
| Geekbench 5.5 / Multi-Core | |
| Asus Zephyrus G14 GA401IV | |
| Gigabyte Aero 17 HDR XB | |
| MSI GP65 10SFK-047US | |
| Media Intel Core i7-9750H (4859 - 6262, n=13) | |
| MSI GF75 Thin 10SCXR | |
| MSI Alpha 15 A3DDK-034 | |
| HWBOT x265 Benchmark v2.2 / 4k Preset | |
| Eurocom Nightsky RX15 | |
| Asus Zephyrus G14 GA401IV | |
| Gigabyte Aero 17 HDR XB | |
| MSI GP65 10SFK-047US | |
| Media Intel Core i7-9750H (7.1 - 10.7, n=21) | |
| MSI GF75 Thin 10SCXR | |
| LibreOffice / 20 Documents To PDF | |
| MSI GP65 10SFK-047US | |
| Gigabyte Aero 17 HDR XB | |
| Media Intel Core i7-9750H (54.5 - 64.7, n=9) | |
| MSI GF75 Thin 10SCXR | |
| R Benchmark 2.5 / Overall mean | |
| MSI GF75 Thin 10SCXR | |
| Media Intel Core i7-9750H (0.608 - 0.695, n=14) | |
| MSI GP65 10SFK-047US | |
| Gigabyte Aero 17 HDR XB | |
* ... Meglio usare valori piccoli
Prestazioni di sistema
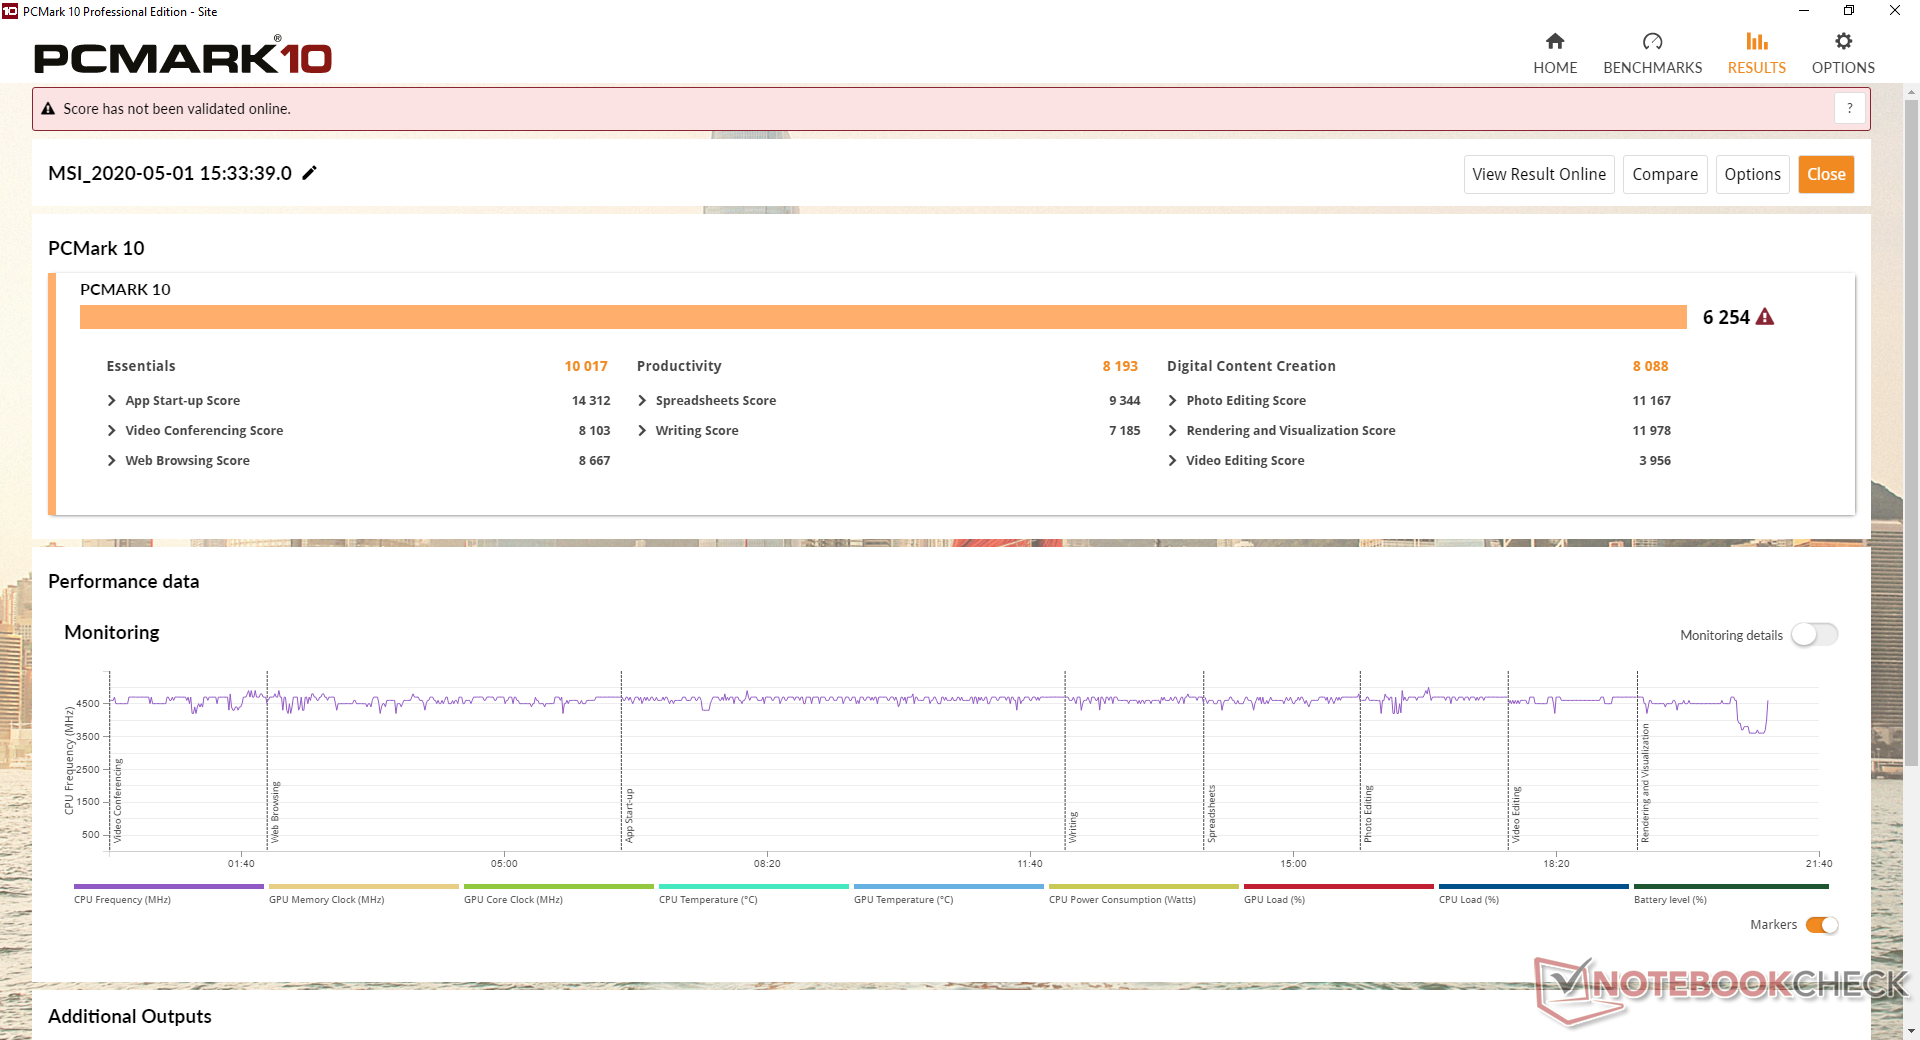
Anche se le differenze sono minori, i benchmarks PCMark sono costantemente più alti rispetto alla GP65 del 2019. Gli utenti che si aggiornano da molto più vecchi portatili Core i5-7300HQ o i7-7700HQ da gioco come il GP62 vedranno guadagni più significativi.
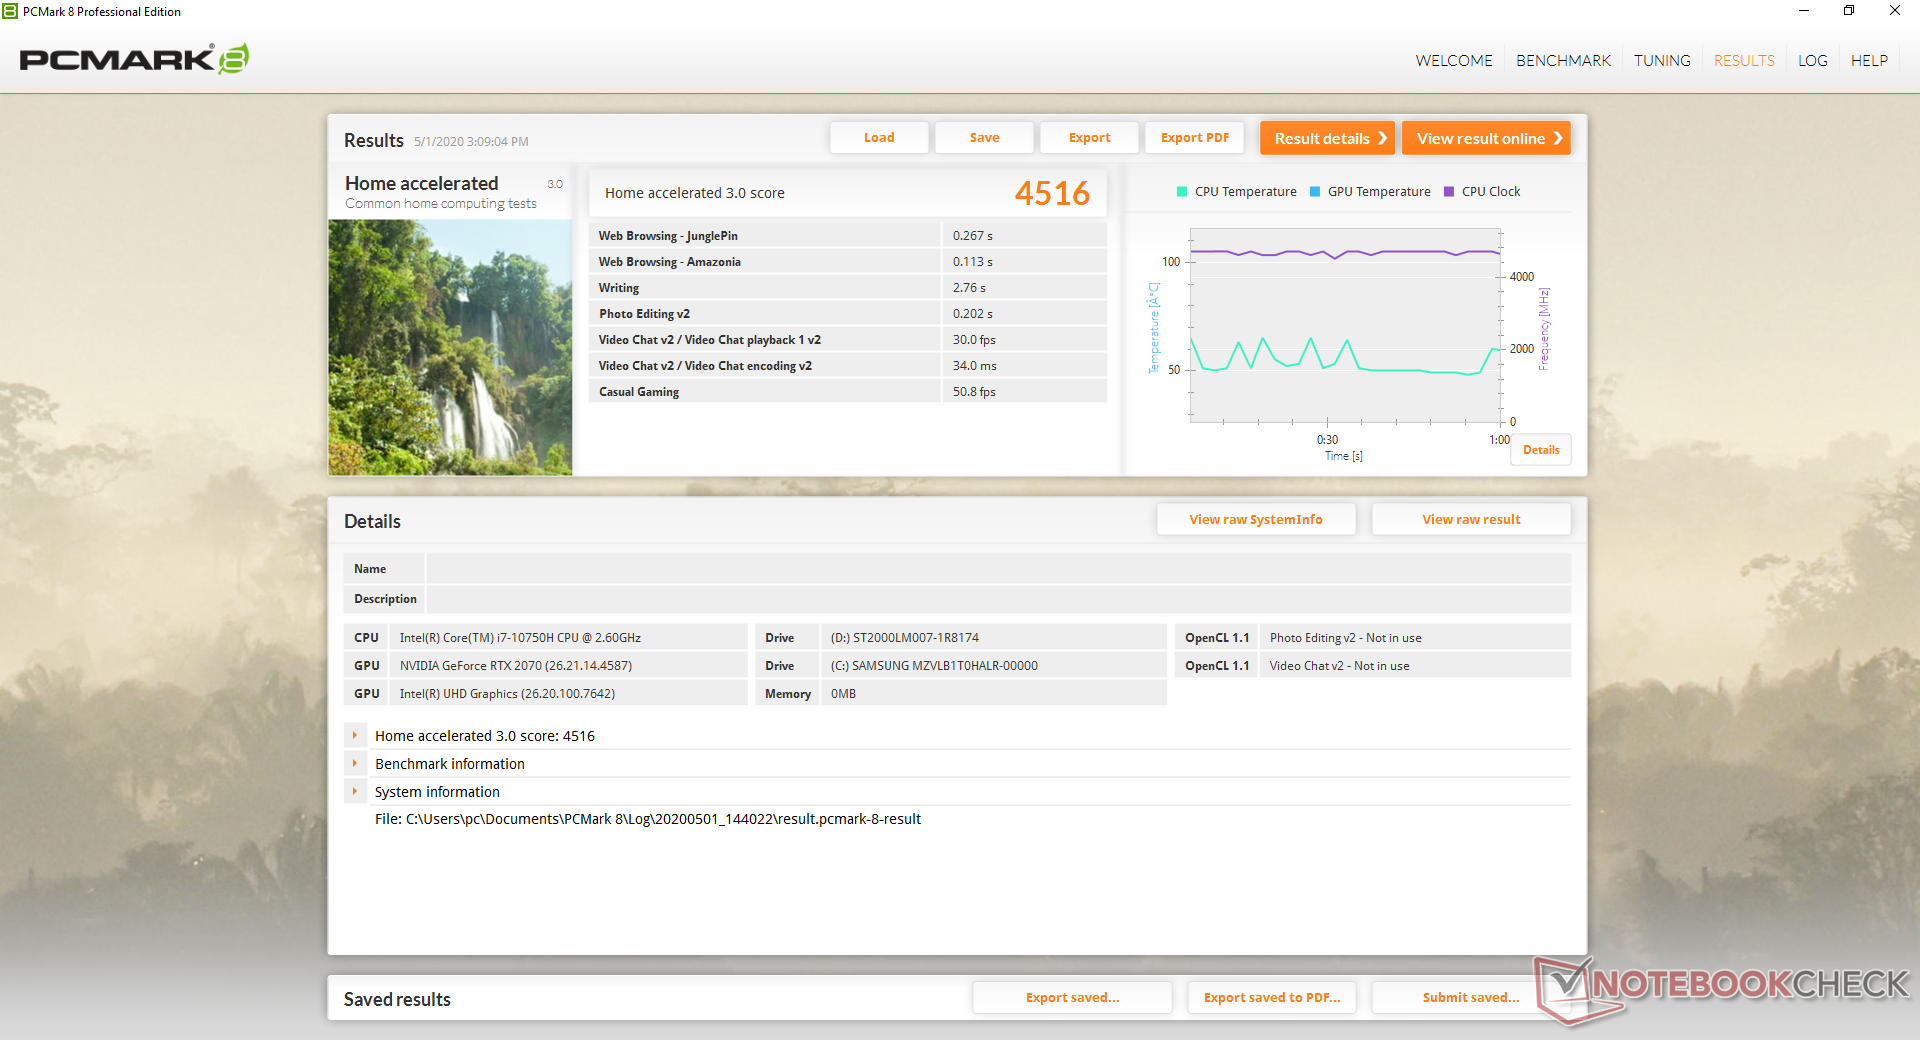
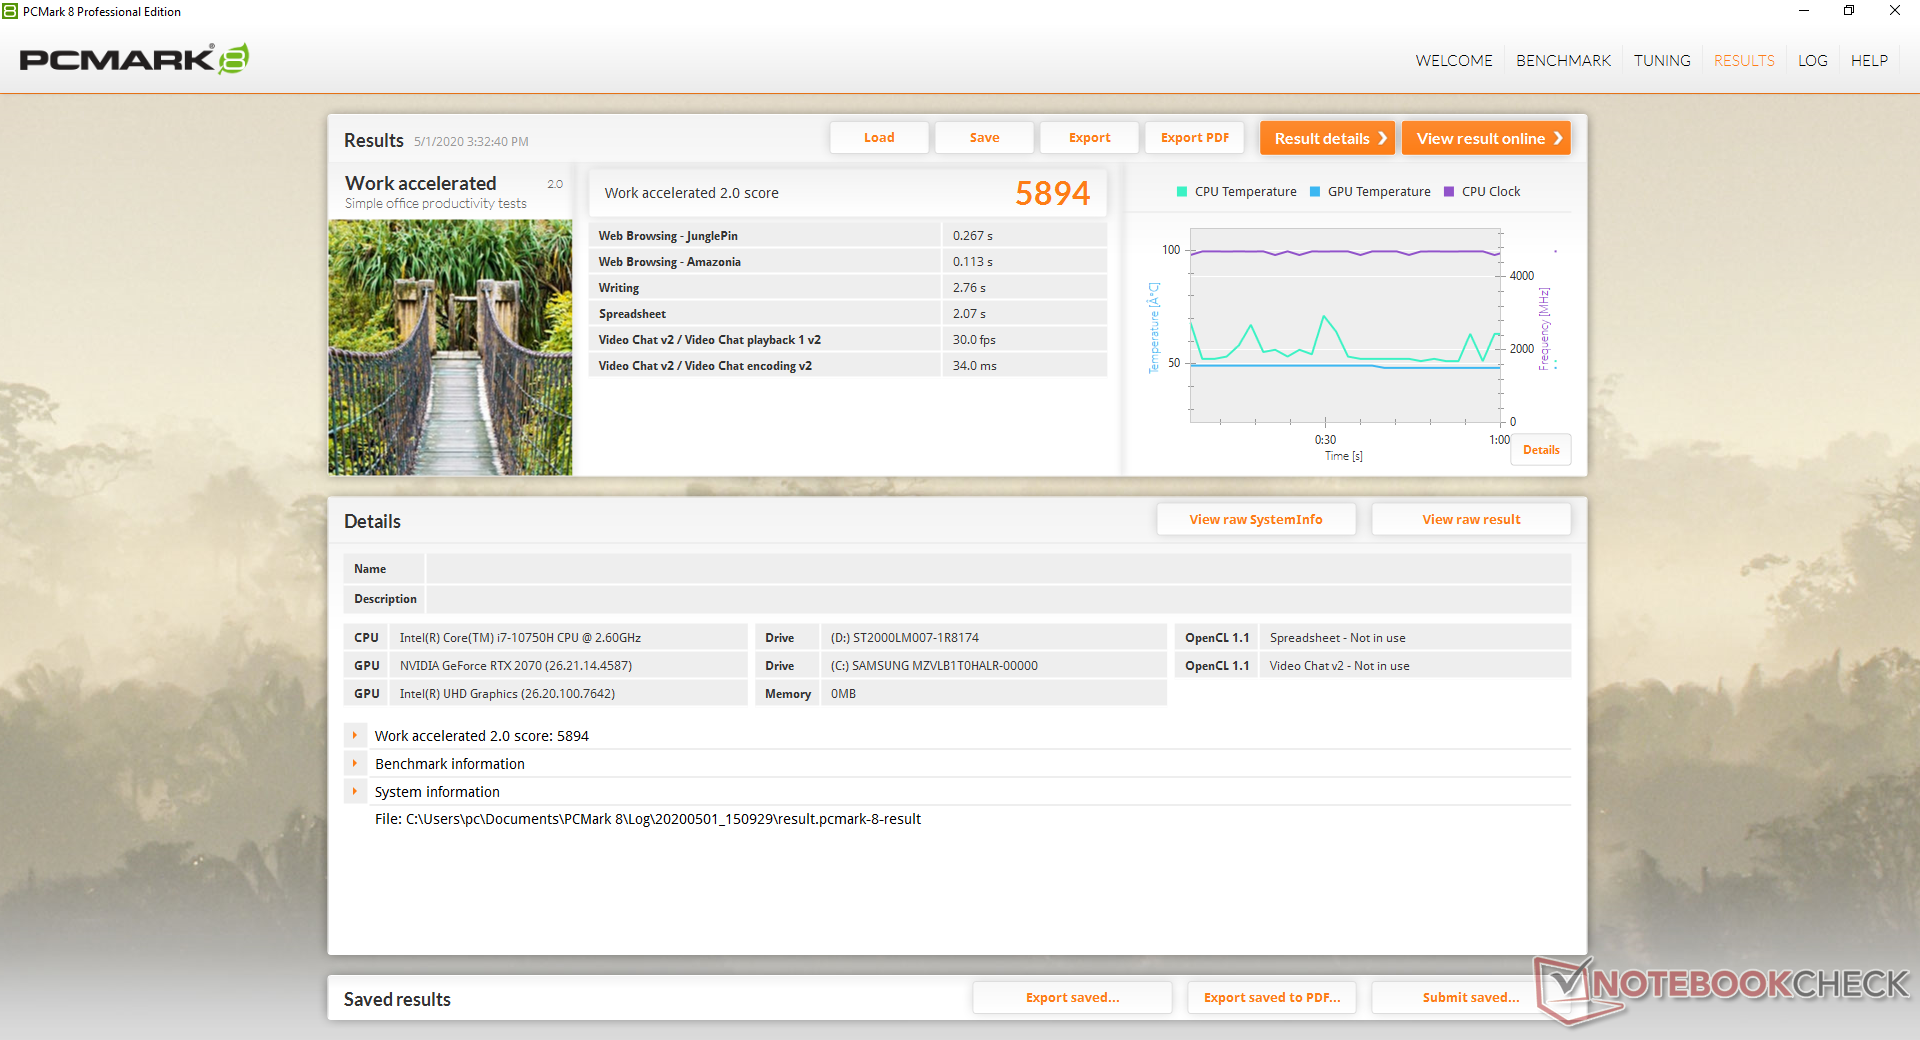
| PCMark 8 Home Score Accelerated v2 | 4516 punti | |
| PCMark 8 Work Score Accelerated v2 | 5894 punti | |
| PCMark 10 Score | 6254 punti | |
Aiuto | ||
Latenza DPC
LatencyMon mostra i problemi di latenza del DPC quando si aprono più schede del browser. Per fortuna, la riproduzione di video 4k è fluida e non fa diminuire i fotogrammi.
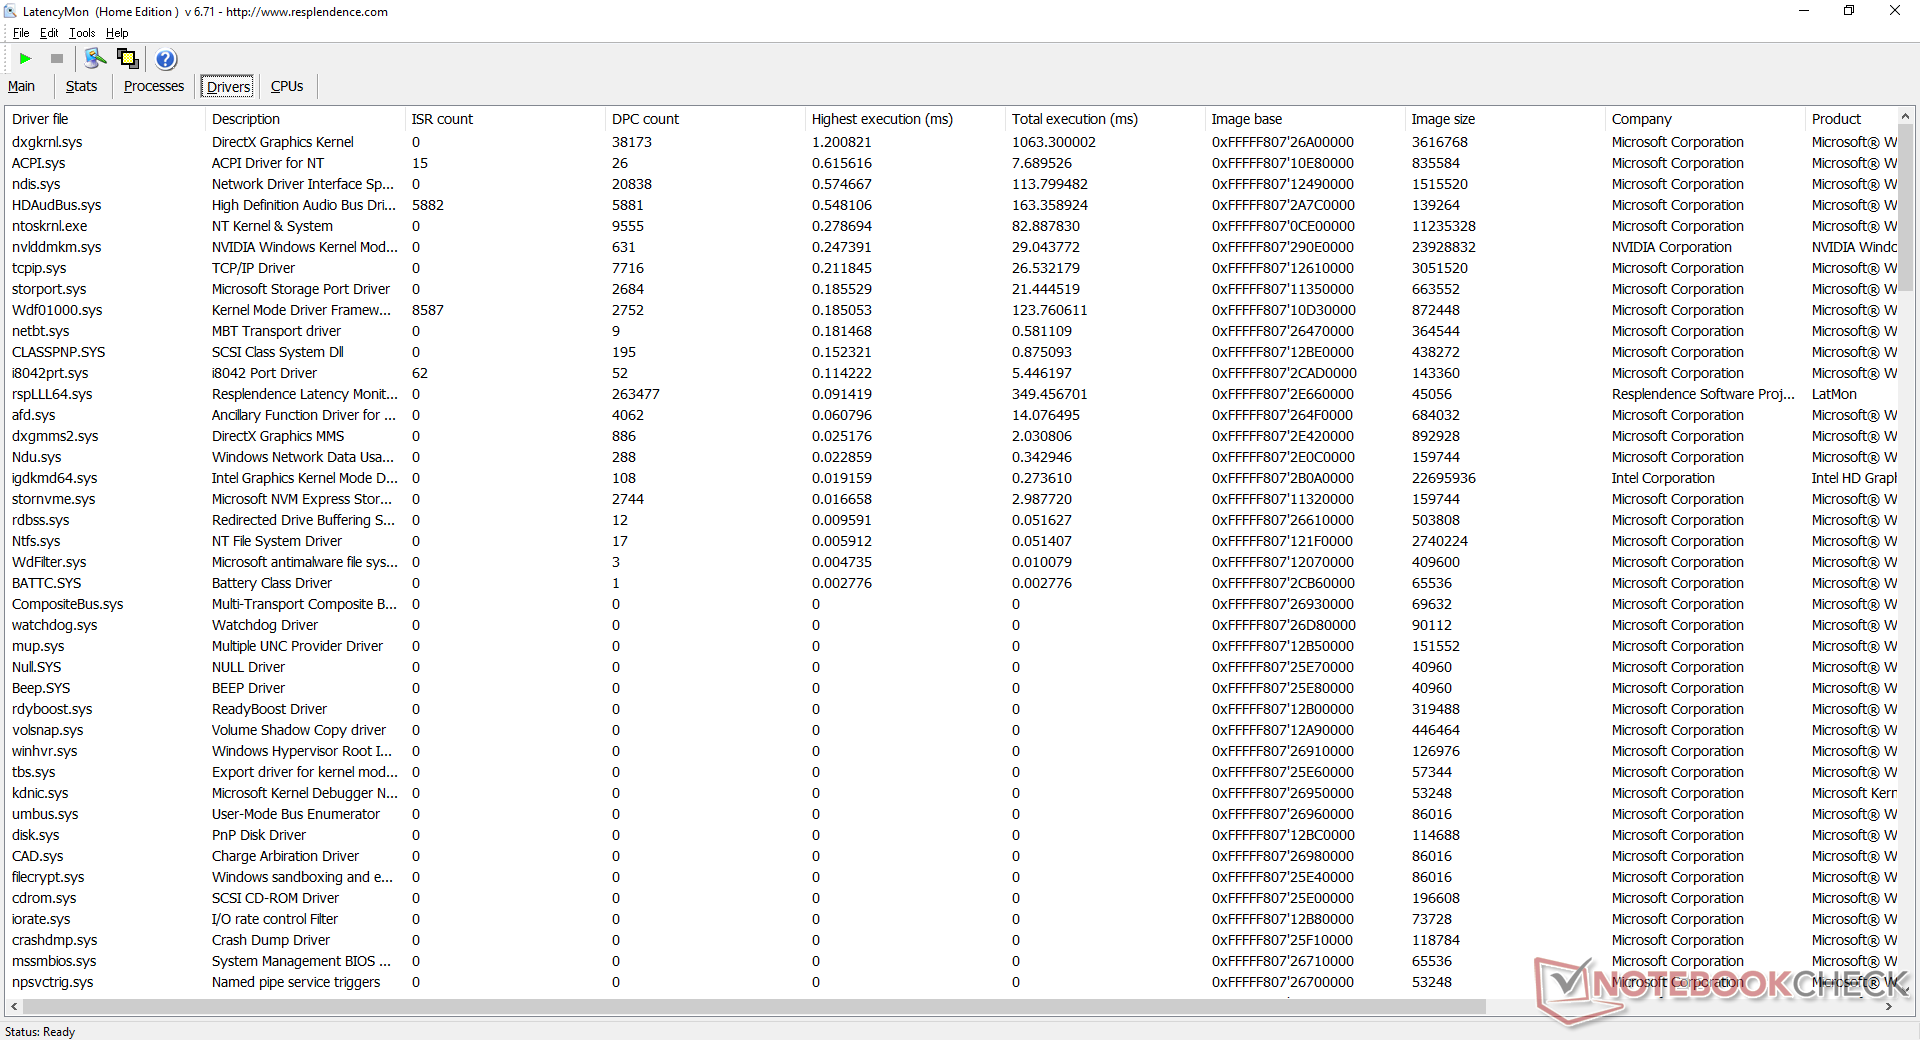
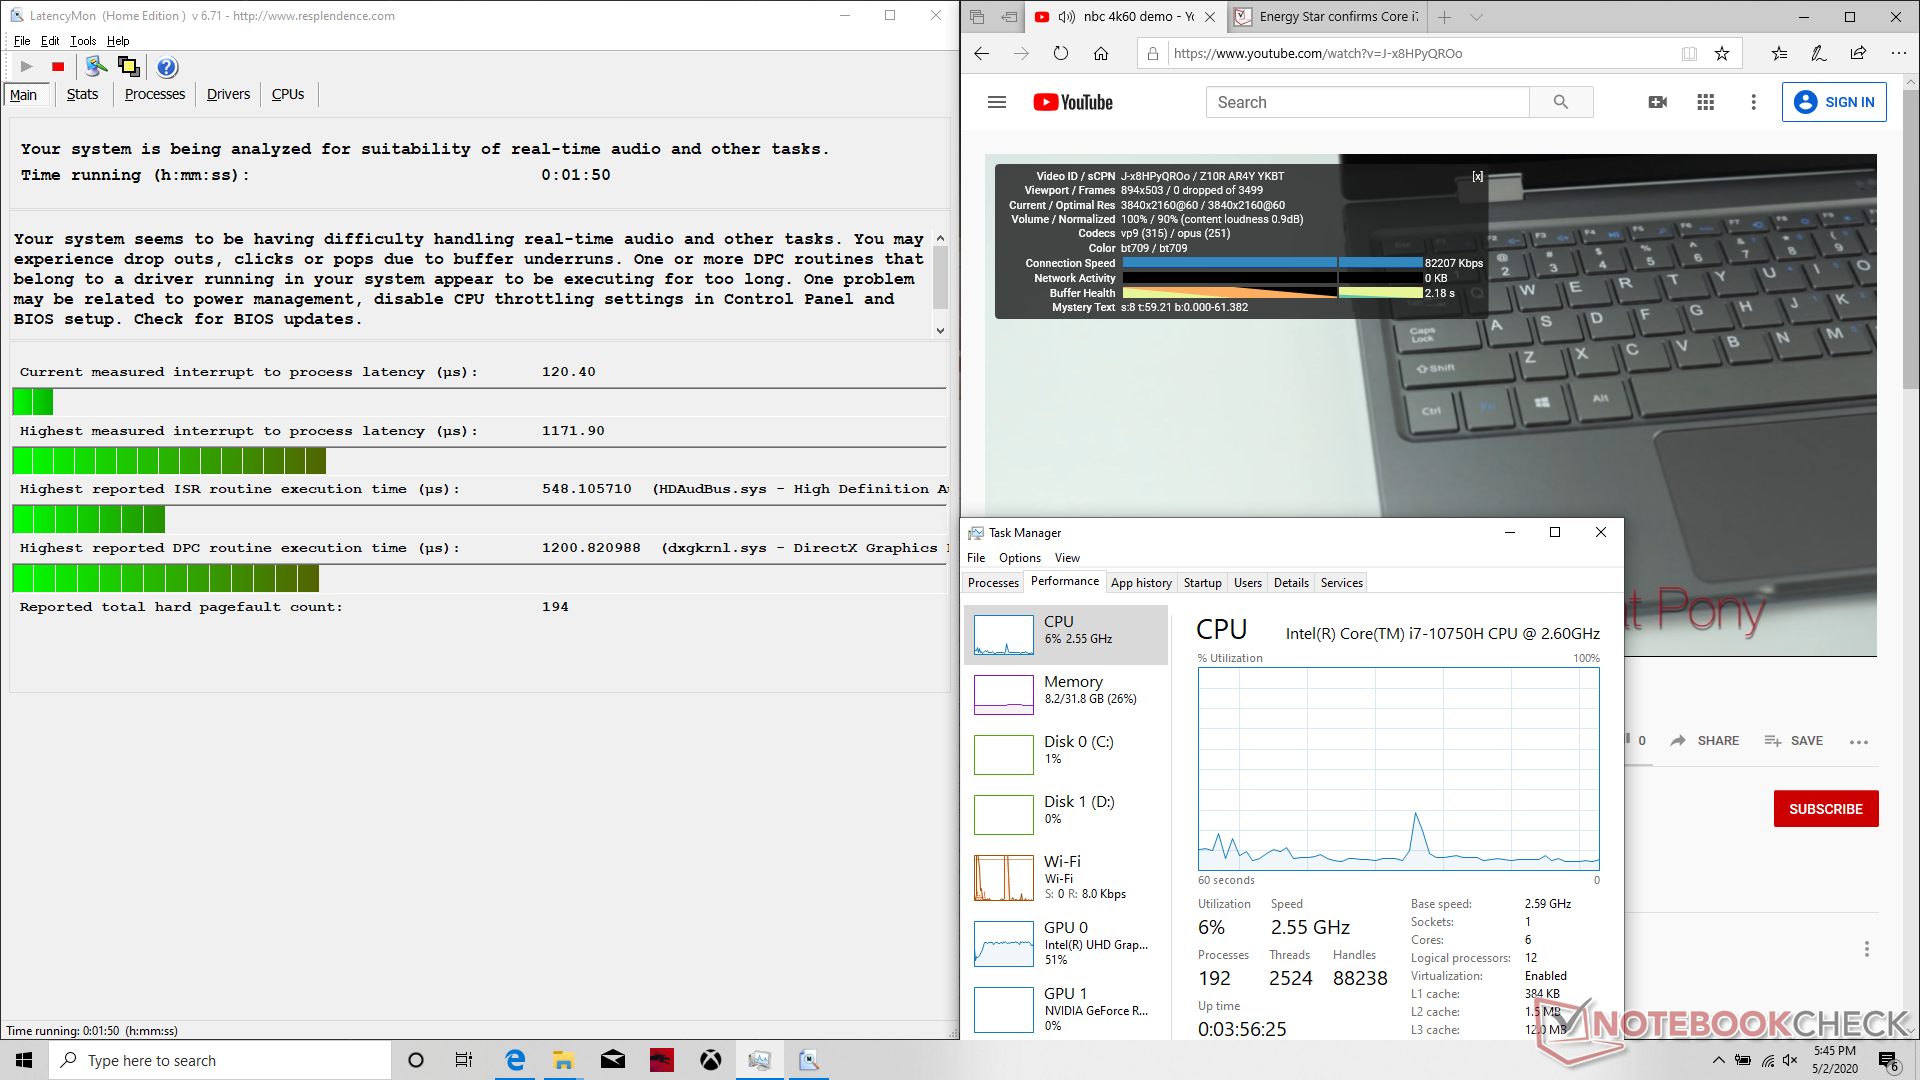
| DPC Latencies / LatencyMon - interrupt to process latency (max), Web, Youtube, Prime95 | |
| MSI GP65 10SFK-047US | |
* ... Meglio usare valori piccoli
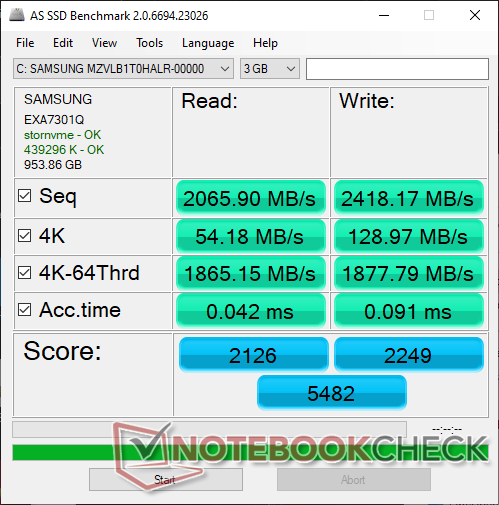
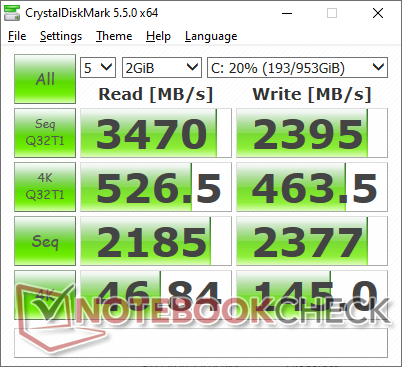
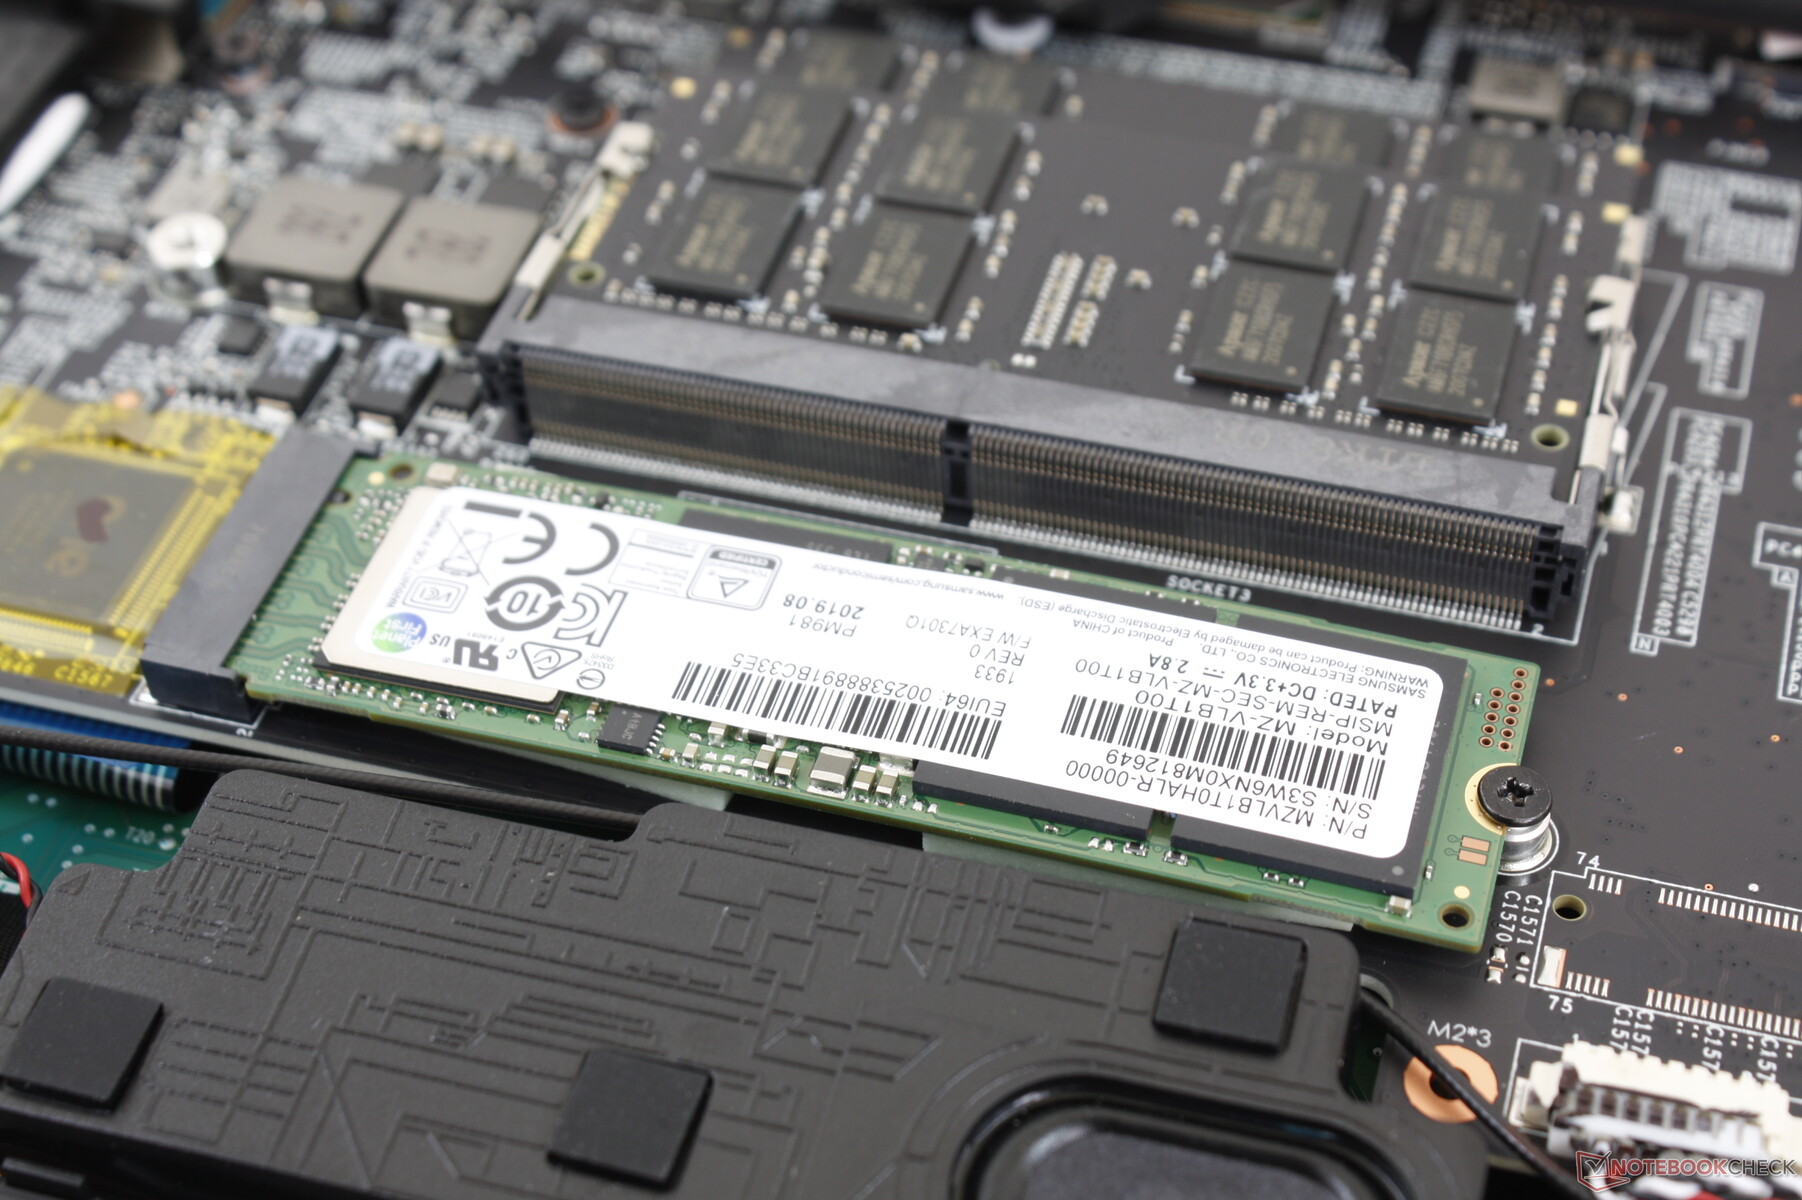
Dispositivi di archiviazione
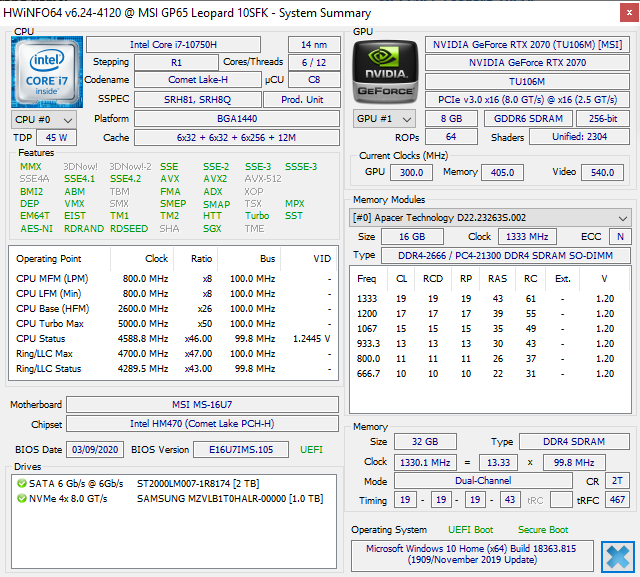
La nostra unità di test viene fornita con un'unità SSD Samsung PM981 da 1 TB e un'unità secondaria ST2000LM007 HDD Seagate da 2 TB. L'unità gira a soli 5400 RPM, ma il veloce SSD NVMe compensa decisamente. Il Samsung PM981 è più veloce della serie Intel 660p o della serie Toshiba XG3 che si trova comunemente sugli Ultrabooks e altri portatili gaming.
Consultate la nostra tabella di SSD ed HDD per ulteriori confronti di benchmarks.
| MSI GP65 10SFK-047US Samsung SSD PM981 MZVLB1T0HALR | Asus Strix Scar III G531GW-AZ062T Intel SSD 660p SSDPEKNW512G8 | Asus TUF FX505DT-EB73 Intel SSD 660p SSDPEKNW512G8 | HP Omen 15-dc1303ng Samsung SSD PM981 MZVLB256HAHQ | MSI GP62 7REX-1045US Toshiba NVMe THNSN5128GP | MSI GP65 Leopard 9SE-225US Toshiba KBG30ZMT512G | |
|---|---|---|---|---|---|---|
| AS SSD | -79% | -46% | -19% | -49% | -94% | |
| Seq Read (MB/s) | 2066 | 1163 -44% | 1019 -51% | 2485 20% | 1848 -11% | 1307 -37% |
| Seq Write (MB/s) | 2418 | 919 -62% | 889 -63% | 1575 -35% | 601 -75% | 730 -70% |
| 4K Read (MB/s) | 54.2 | 48.88 -10% | 48.22 -11% | 53.4 -1% | 35.84 -34% | 27.58 -49% |
| 4K Write (MB/s) | 129 | 90.1 -30% | 115.5 -10% | 113.5 -12% | 112 -13% | 80.3 -38% |
| 4K-64 Read (MB/s) | 1865 | 323.8 -83% | 321.5 -83% | 725 -61% | 628 -66% | 878 -53% |
| 4K-64 Write (MB/s) | 1878 | 403.8 -78% | 787 -58% | 1371 -27% | 428.2 -77% | 246.8 -87% |
| Access Time Read * (ms) | 0.042 | 0.24 -471% | 0.065 -55% | 0.059 -40% | 0.079 -88% | 0.231 -450% |
| Access Time Write * (ms) | 0.091 | 0.046 49% | 0.047 48% | 0.032 65% | 0.034 63% | 0.223 -145% |
| Score Read (Points) | 2126 | 489 -77% | 472 -78% | 1027 -52% | 849 -60% | 1036 -51% |
| Score Write (Points) | 2249 | 586 -74% | 992 -56% | 1642 -27% | 600 -73% | 400 -82% |
| Score Total (Points) | 5482 | 1332 -76% | 1717 -69% | 3163 -42% | 1829 -67% | 1940 -65% |
| Copy ISO MB/s (MB/s) | 2927 | 1269 -57% | 942 -68% | 1128 -61% | 993 -66% | |
| Copy Program MB/s (MB/s) | 728 | 452.8 -38% | 444.5 -39% | 326.3 -55% | 309.5 -57% | |
| Copy Game MB/s (MB/s) | 1614 | 755 -53% | 867 -46% | 442.8 -73% | 582 -64% | |
| CrystalDiskMark 5.2 / 6 | -34% | -33% | -27% | -25% | -33% | |
| Write 4K (MB/s) | 145 | 133.3 -8% | 137.5 -5% | 50.2 -65% | 158.4 9% | 99.3 -32% |
| Read 4K (MB/s) | 46.84 | 55.3 18% | 57 22% | 35.32 -25% | 45.04 -4% | 46.96 0% |
| Write Seq (MB/s) | 2377 | 980 -59% | 984 -59% | 991 -58% | 622 -74% | |
| Read Seq (MB/s) | 2185 | 1406 -36% | 1564 -28% | 1526 -30% | 1592 -27% | |
| Write 4K Q32T1 (MB/s) | 463.5 | 286.3 -38% | 237.4 -49% | 445.1 -4% | 434.2 -6% | 240.1 -48% |
| Read 4K Q32T1 (MB/s) | 527 | 331.5 -37% | 340.7 -35% | 526 0% | 590 12% | 581 10% |
| Write Seq Q32T1 (MB/s) | 2395 | 976 -59% | 959 -60% | 1647 -31% | 630 -74% | 686 -71% |
| Read Seq Q32T1 (MB/s) | 3470 | 1520 -56% | 1732 -50% | 3427 -1% | 2108 -39% | 1581 -54% |
| Write 4K Q8T8 (MB/s) | 748 | 268.1 | ||||
| Read 4K Q8T8 (MB/s) | 344.6 | 977 | ||||
| Media totale (Programma / Settaggio) | -57% /
-63% | -40% /
-41% | -23% /
-22% | -37% /
-41% | -64% /
-75% |
* ... Meglio usare valori piccoli

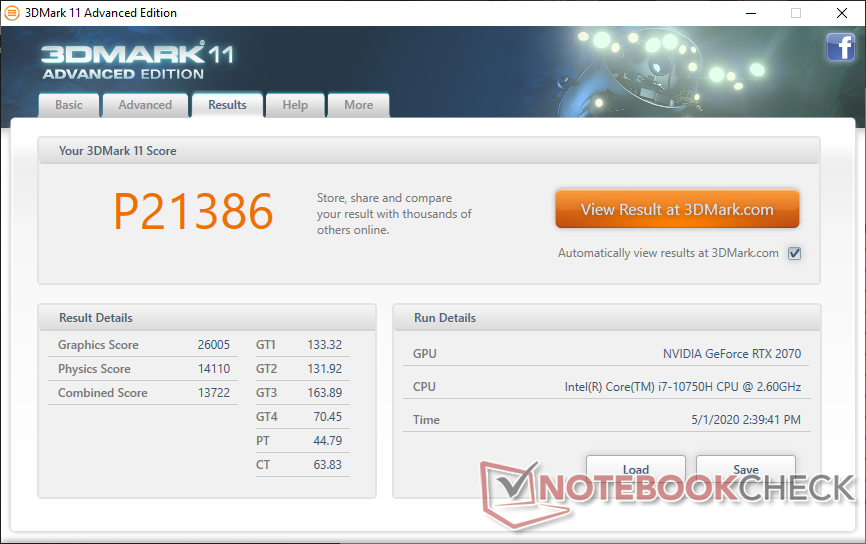
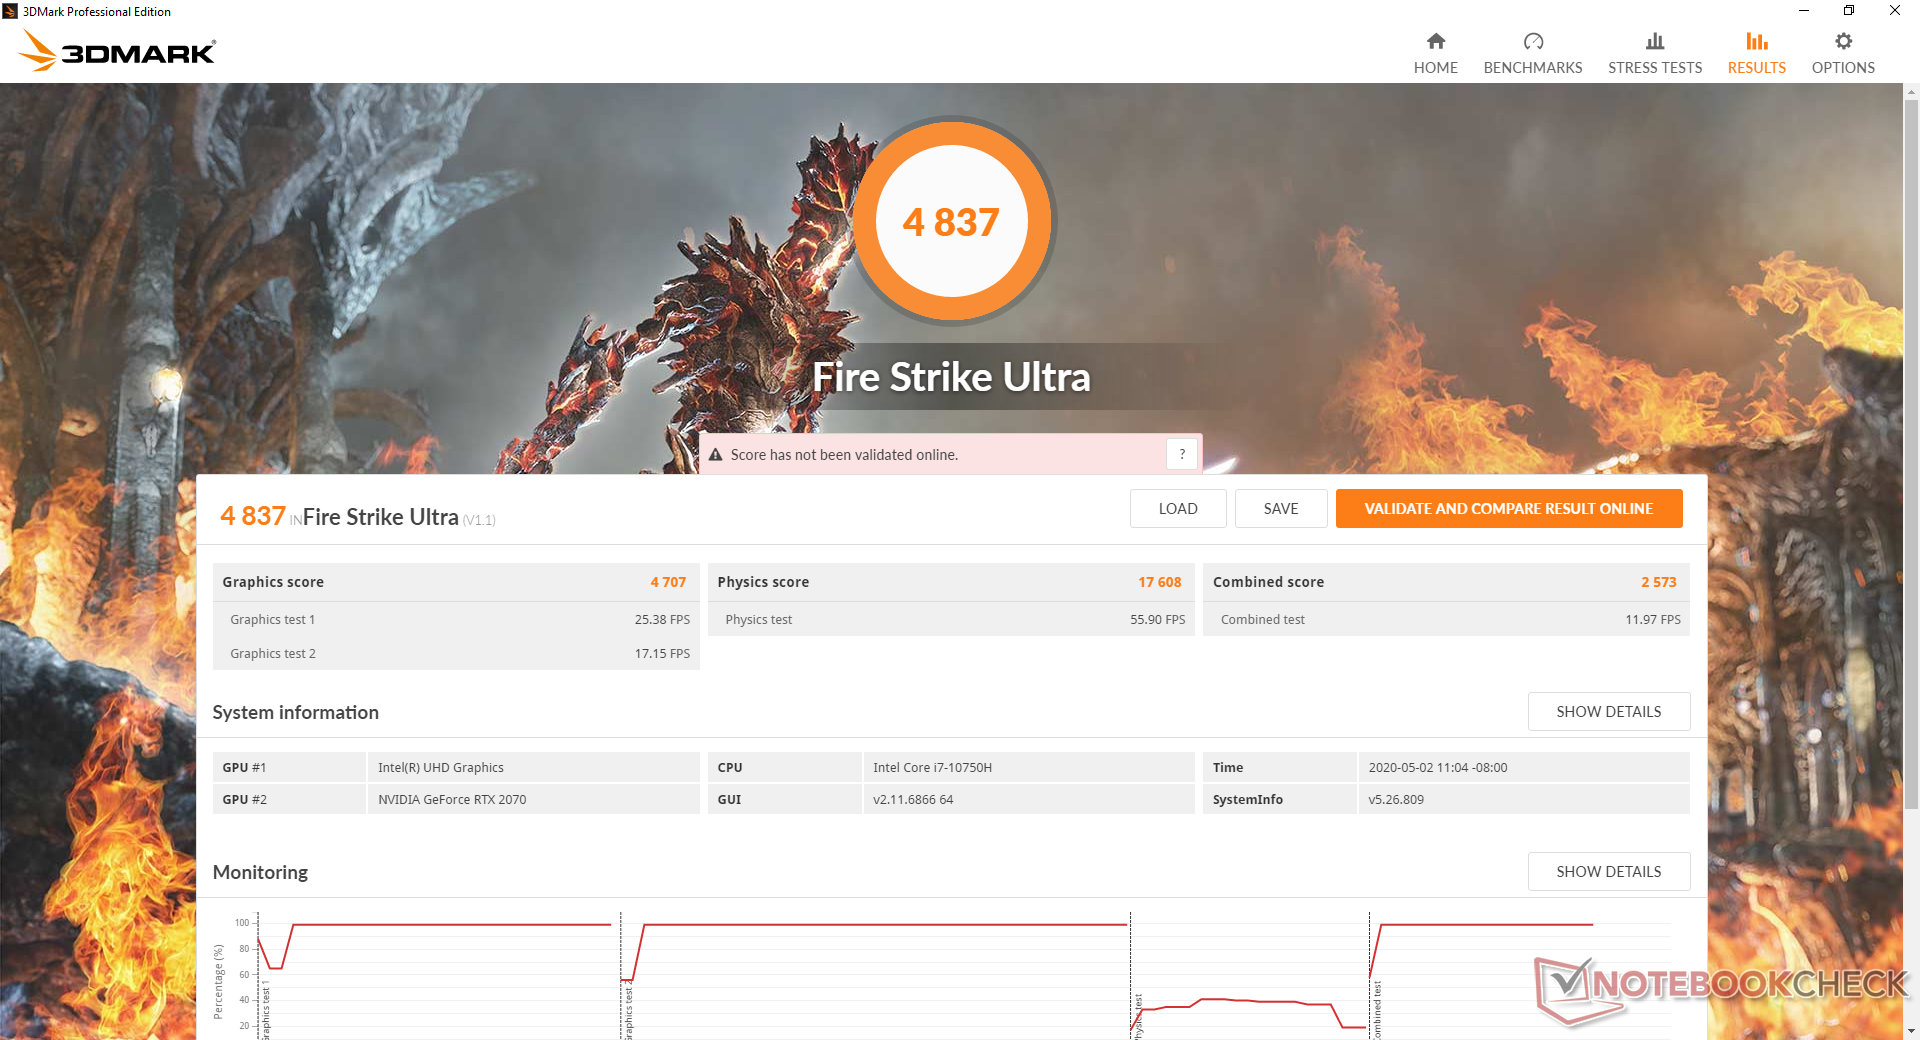
Prestazioni GPU
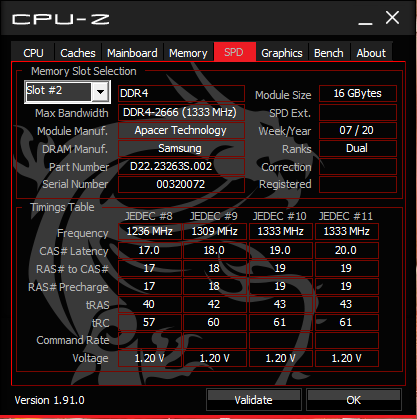
La GeForce RTX 2070 mobile nel nostro MSI si comporta secondo le nostre attese, risultando dal 10 al 14% più veloce della GeForce RTX 2070 Max-Q o il 22% più lenta della GeForce RTX 2070 desktop. Le prestazioni quando il gioco è leggermente superiore alla media di pochi punti percentuali, probabilmente a causa sia del nuovo processore che dei 32 GB di RAM DDR4-2666.
In idle con The Witcher 3 per un'ora mostra frame rate costanti senza salti inaspettati per una prestazione di gioco regolare.
Consultate la nostra pagina dedicata alla GeForce RTX 2070 mobile per maggiori informazioni tecniche e confronti di benchmarks.
| 3DMark 06 Standard Score | 39513 punti | |
| 3DMark 11 Performance | 21386 punti | |
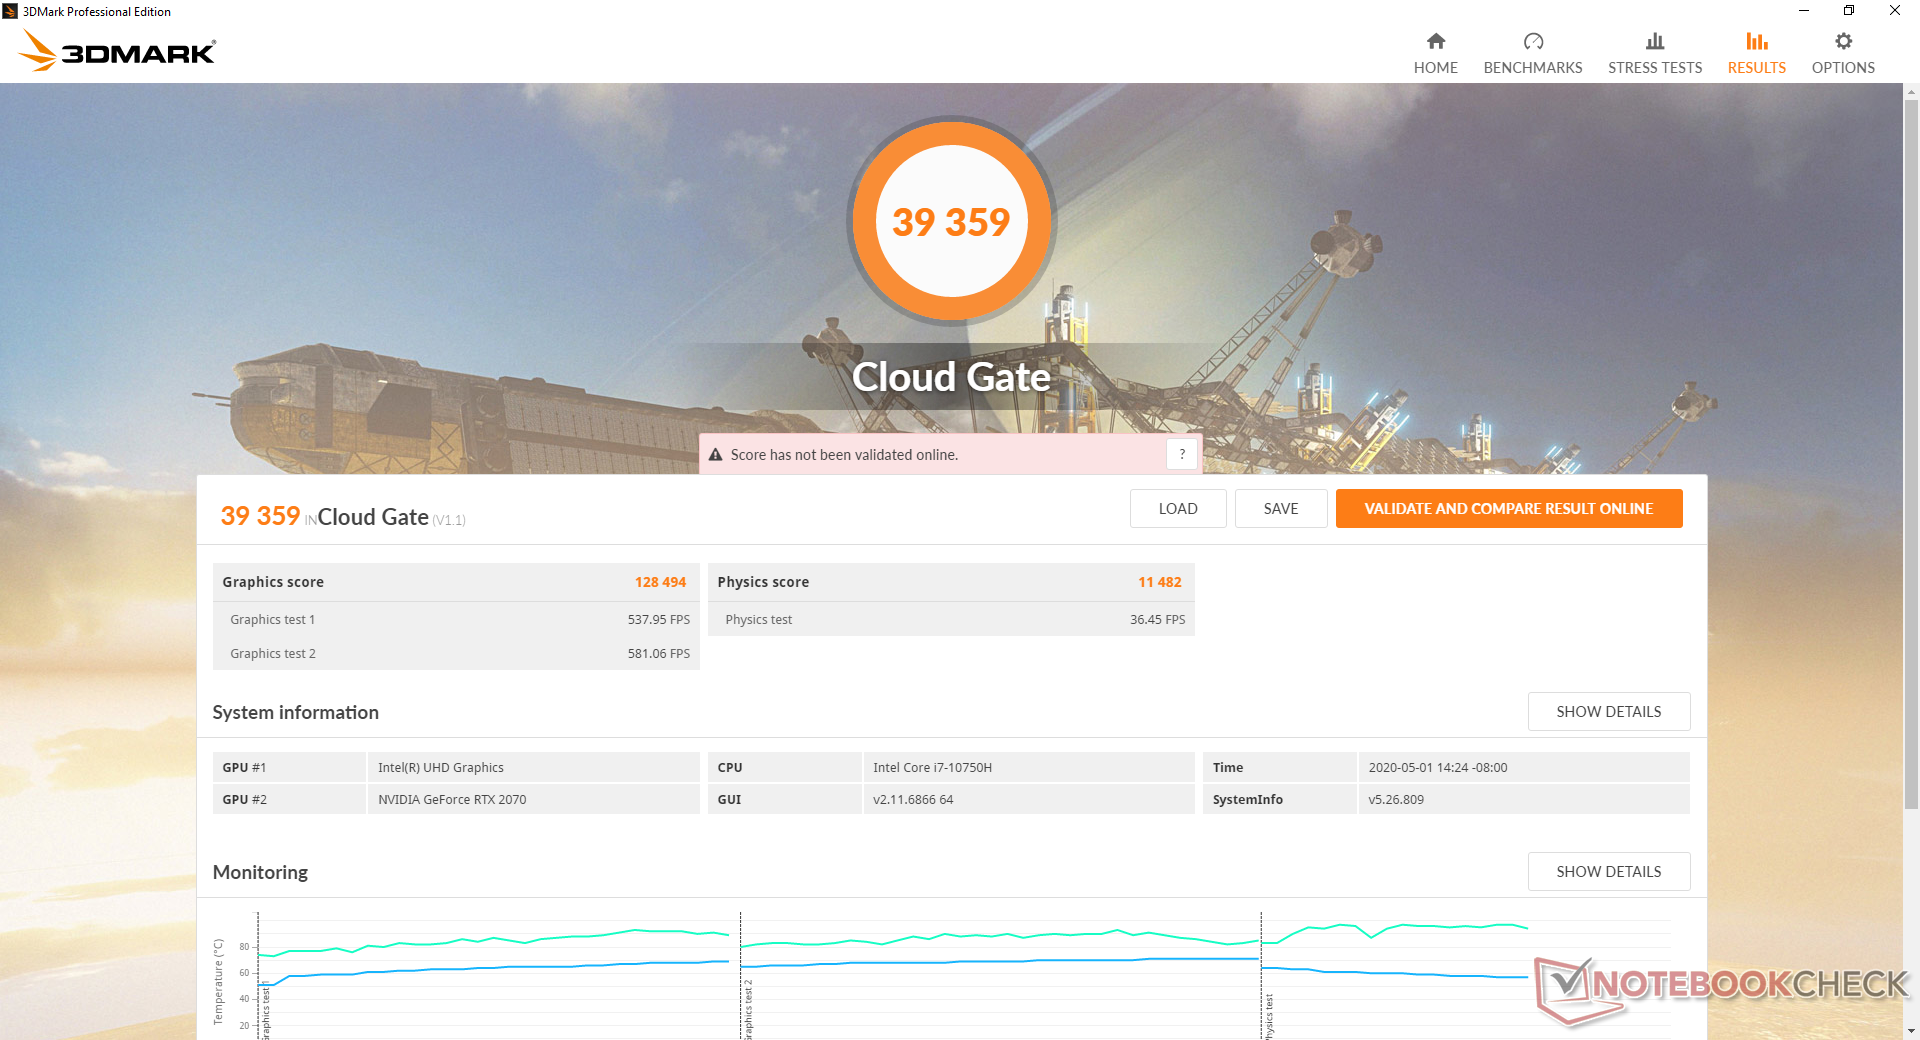
| 3DMark Cloud Gate Standard Score | 39359 punti | |
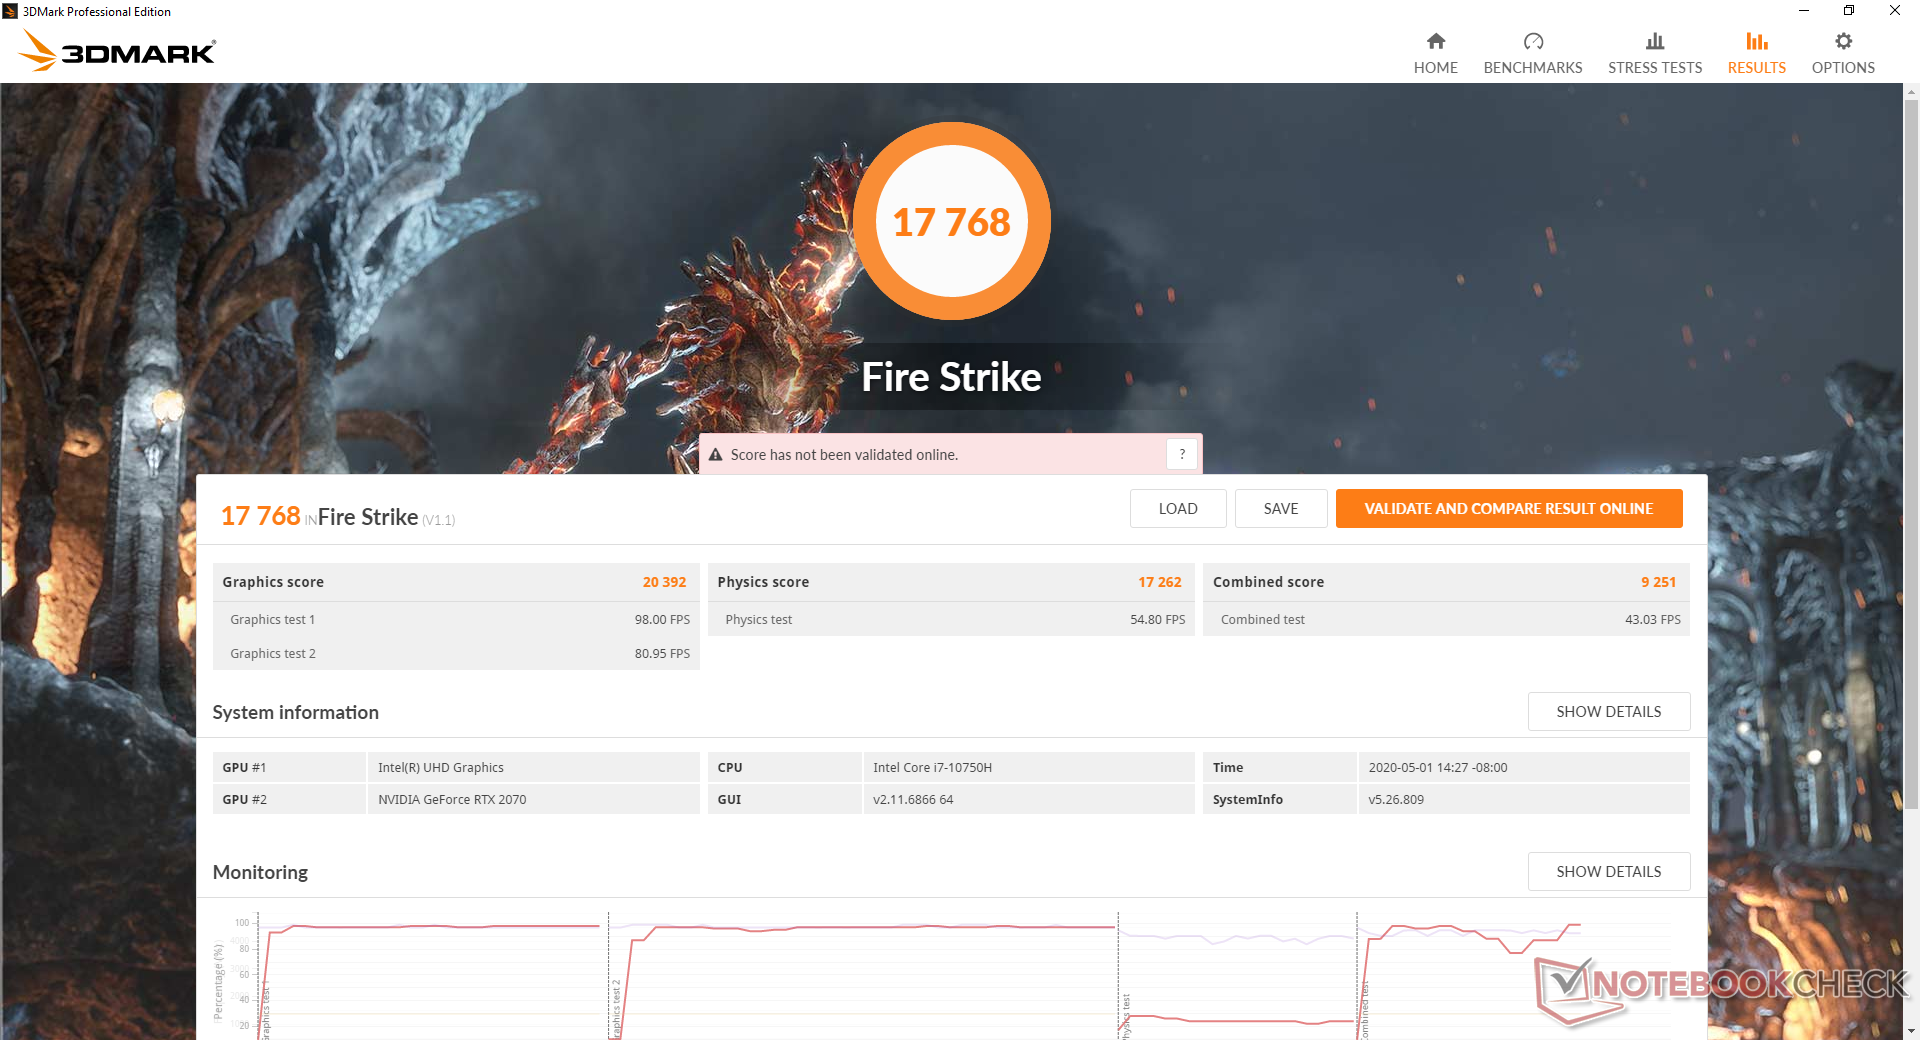
| 3DMark Fire Strike Score | 17768 punti | |
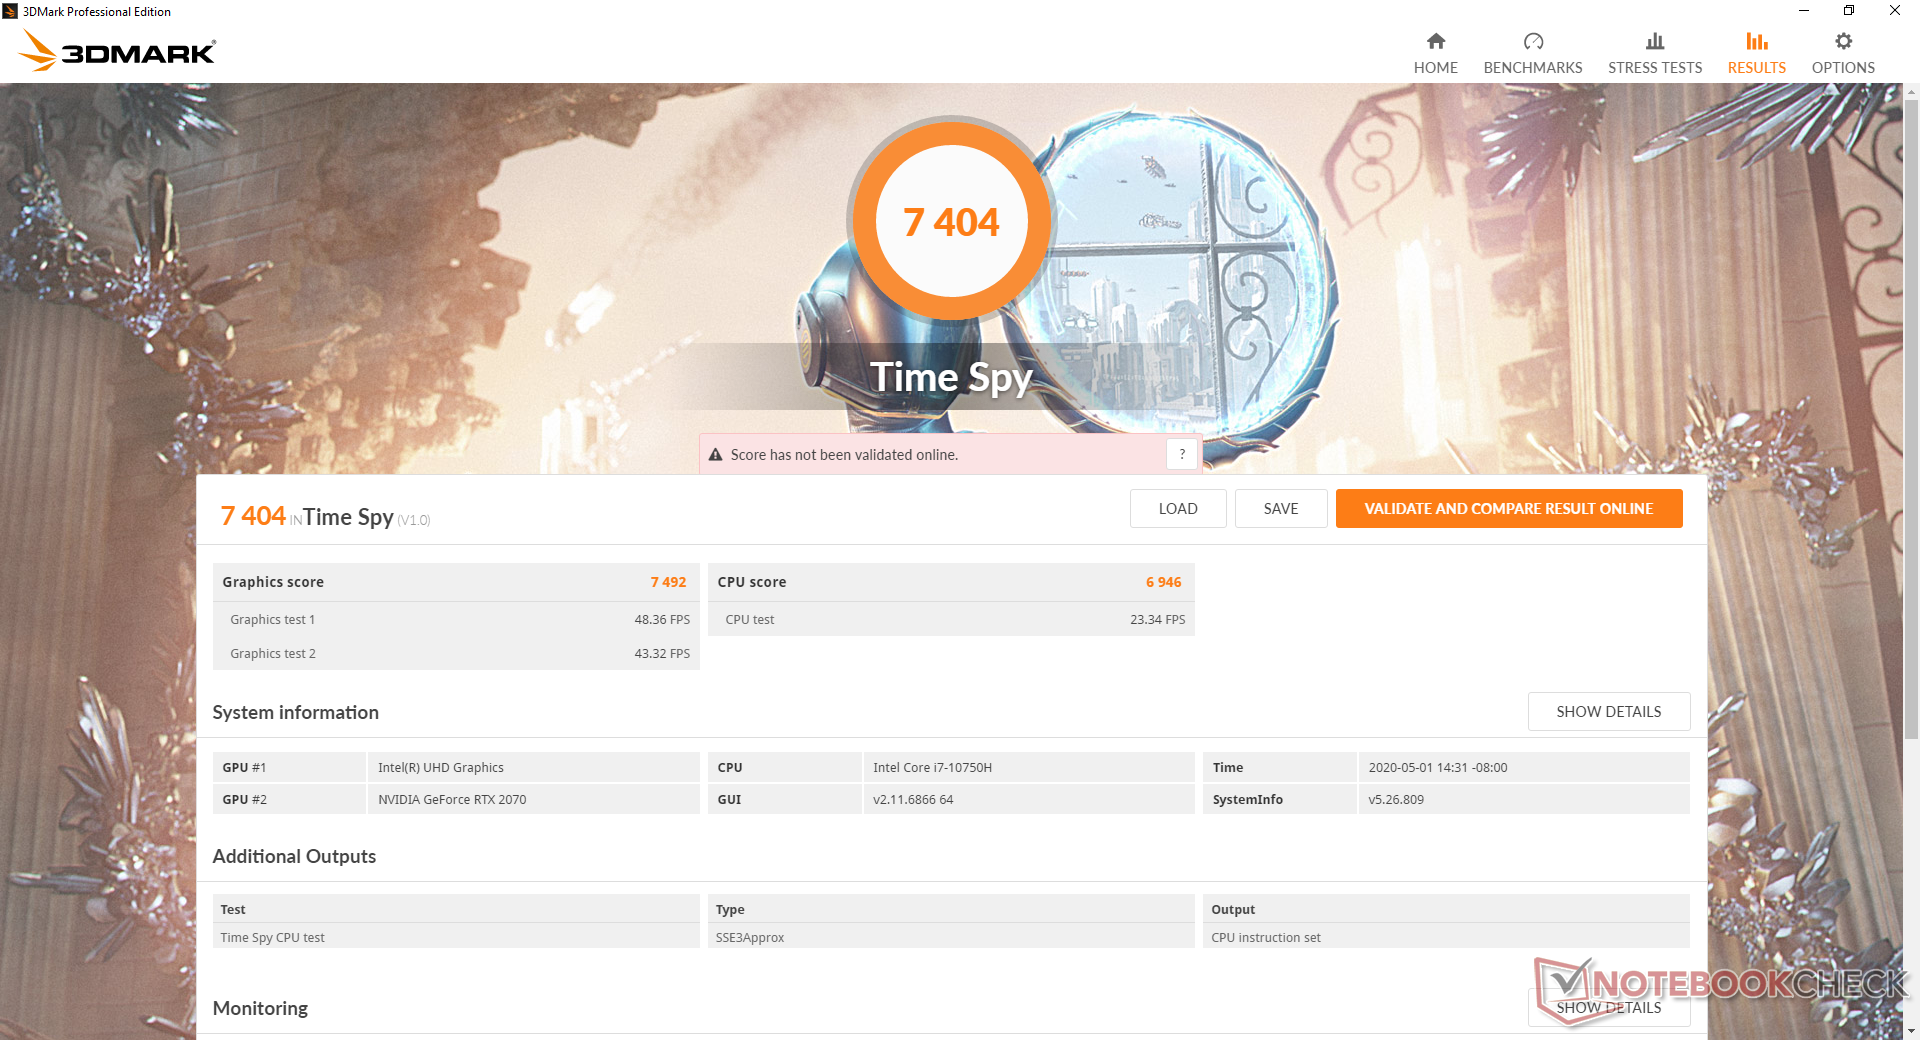
| 3DMark Time Spy Score | 7404 punti | |
Aiuto | ||
| Shadow of the Tomb Raider | |
| 1280x720 Lowest Preset | |
| Eurocom Sky X4C i9-9900KS | |
| MSI GF65 9SD | |
| MSI GP65 10SFK-047US | |
| Walmart EVOO Gaming 17 | |
| MSI RTX 2080 Gaming X Trio | |
| Media NVIDIA GeForce RTX 2070 Mobile (91.3 - 160, n=9) | |
| Asus G752VS | |
| Alienware 17 R4 | |
| 1920x1080 Medium Preset | |
| Eurocom Sky X4C i9-9900KS | |
| MSI RTX 2080 Gaming X Trio | |
| MSI GP65 10SFK-047US | |
| Media NVIDIA GeForce RTX 2070 Mobile (86 - 114, n=10) | |
| Walmart EVOO Gaming 17 | |
| Asus G752VS | |
| Alienware 17 R4 | |
| MSI GF65 9SD | |
| 1920x1080 Highest Preset AA:T | |
| Eurocom Sky X4C i9-9900KS | |
| MSI RTX 2080 Gaming X Trio | |
| MSI GP65 10SFK-047US | |
| Media NVIDIA GeForce RTX 2070 Mobile (74.2 - 97, n=11) | |
| Walmart EVOO Gaming 17 | |
| Alienware 17 R4 | |
| Asus G752VS | |
| MSI GF65 9SD | |
| The Witcher 3 | |
| 1024x768 Low Graphics & Postprocessing | |
| Eurocom Sky X4C i9-9900KS | |
| MSI GP65 10SFK-047US | |
| MSI RTX 2080 Gaming X Trio | |
| Walmart EVOO Gaming 17 | |
| Media NVIDIA GeForce RTX 2070 Mobile (193.9 - 357, n=12) | |
| MSI GF65 9SD | |
| 1366x768 Medium Graphics & Postprocessing | |
| Eurocom Sky X4C i9-9900KS | |
| MSI RTX 2080 Gaming X Trio | |
| MSI GP65 10SFK-047US | |
| Media NVIDIA GeForce RTX 2070 Mobile (154 - 250, n=12) | |
| Walmart EVOO Gaming 17 | |
| MSI GF65 9SD | |
| 1920x1080 High Graphics & Postprocessing (Nvidia HairWorks Off) | |
| MSI RTX 2080 Gaming X Trio | |
| Eurocom Sky X4C i9-9900KS | |
| MSI GP65 10SFK-047US | |
| Media NVIDIA GeForce RTX 2070 Mobile (115.7 - 160.8, n=17) | |
| Walmart EVOO Gaming 17 | |
| MSI GF65 9SD | |
| 1920x1080 Ultra Graphics & Postprocessing (HBAO+) | |
| MSI RTX 2080 Gaming X Trio | |
| Eurocom Sky X4C i9-9900KS | |
| MSI GP65 10SFK-047US | |
| Media NVIDIA GeForce RTX 2070 Mobile (64 - 82.1, n=21) | |
| Walmart EVOO Gaming 17 | |
| MSI GF65 9SD | |
| basso | medio | alto | ultra | |
|---|---|---|---|---|
| BioShock Infinite (2013) | 352 | 316 | 288.9 | 164.6 |
| The Witcher 3 (2015) | 326.4 | 244.5 | 160.8 | 82.1 |
| Dota 2 Reborn (2015) | 152 | 139 | 128 | 120 |
| X-Plane 11.11 (2018) | 102 | 91.7 | 77.5 | |
| Shadow of the Tomb Raider (2018) | 135 | 107 | 102 | 93 |
Emissioni
Rumorosità di sistema
Le ventole sono sempre attive indipendentemente dall'impostazione per un rumore minimo di ventola di 31,9 dB(A) su uno sfondo di 29,3 dB(A). Sarà udibile in una stanza silenziosa, ma essenzialmente impercettibile negli uffici.
Quando si esegue la prima scena del benchmark di 3DMark 06, il rumore delle ventole aumenterà costantemente fino a raggiungere 47 dB(A) verso la fine del benchmark di 90 secondi. I risultati sono molto più alti di quelli che abbiamo registrato sul GP65 dell'anno scorso con la GPU RTX 2060 più lenta. Per fortuna, il rumore delle ventole rimane costante a soli 33,5 dB(A) se semplicemente si naviga sul web o si effettua lo streaming video.
Quando si esegue The Witcher 3, il rumore della ventola si stabilizza a quasi 54 dB(A) risultando più rumoroso rispetto alla maggior parte dei portatili da gioco in condizioni simili. Se Cooler Boost è abilitato, il rumore della ventola salirà a quasi 57 dB(A) indipendentemente dal carico sullo schermo.
Non possiamo notare alcun rumore elettronico dalla nostra unità di test, ma il rumore costante della ventola l'avrebbe comunque coperto.
| MSI GP65 10SFK-047US GeForce RTX 2070 Mobile, i7-10750H, Samsung SSD PM981 MZVLB1T0HALR | Asus Strix Scar III G531GW-AZ062T GeForce RTX 2070 Mobile, i7-9750H, Intel SSD 660p SSDPEKNW512G8 | Asus TUF FX505DT-EB73 GeForce GTX 1650 Mobile, R7 3750H, Intel SSD 660p SSDPEKNW512G8 | HP Omen 15-dc1303ng GeForce RTX 2070 Max-Q, i7-8750H, Samsung SSD PM981 MZVLB256HAHQ | MSI GP62 7REX-1045US GeForce GTX 1050 Ti Mobile, i7-7700HQ, Toshiba NVMe THNSN5128GP | MSI GP65 Leopard 9SE-225US GeForce RTX 2060 Mobile, i7-9750H, Toshiba KBG30ZMT512G | |
|---|---|---|---|---|---|---|
| Noise | 5% | 10% | 3% | 7% | 12% | |
| off /ambiente * (dB) | 29.3 | 30 -2% | 28.2 4% | 30.5 -4% | 28 4% | 28.2 4% |
| Idle Minimum * (dB) | 31.9 | 30.6 4% | 28.2 12% | 32.8 -3% | 32.2 -1% | 29.5 8% |
| Idle Average * (dB) | 31.9 | 30.6 4% | 28.2 12% | 32.8 -3% | 32.2 -1% | 29.6 7% |
| Idle Maximum * (dB) | 33.5 | 37.7 -13% | 31.4 6% | 32.8 2% | 32.2 4% | 29.6 12% |
| Load Average * (dB) | 47 | 36.5 22% | 39.8 15% | 42.5 10% | 40.9 13% | 33 30% |
| Witcher 3 ultra * (dB) | 53.8 | 52.1 3% | 47 13% | 45.4 16% | 47.2 12% | |
| Load Maximum * (dB) | 56.7 | 48.1 15% | 50.2 11% | 47.5 16% | 48.6 14% | 52 8% |
* ... Meglio usare valori piccoli
Rumorosità
| Idle |
| 31.9 / 31.9 / 33.5 dB(A) |
| Sotto carico |
| 47 / 56.7 dB(A) |
 | ||
30 dB silenzioso 40 dB(A) udibile 50 dB(A) rumoroso |
||
min: | ||
Temperature
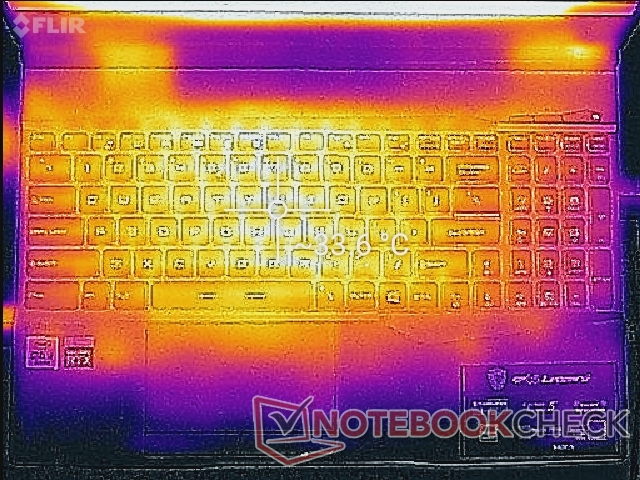
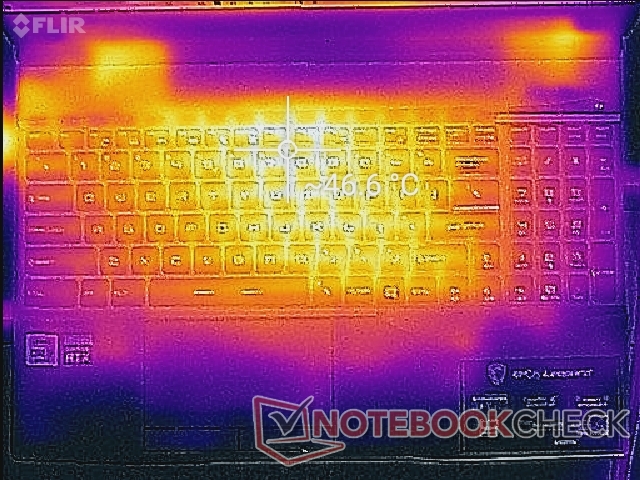
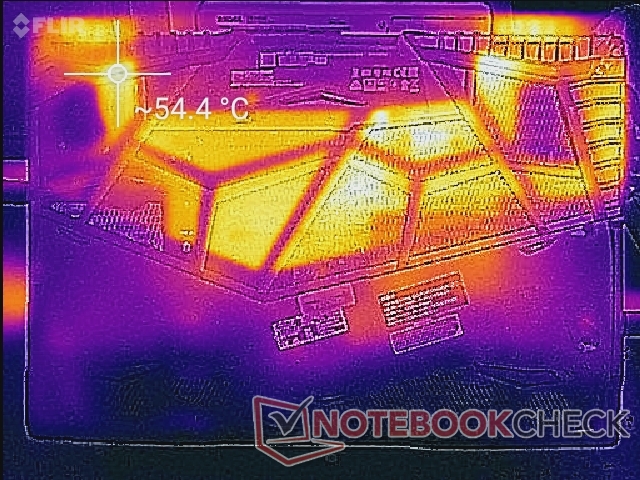
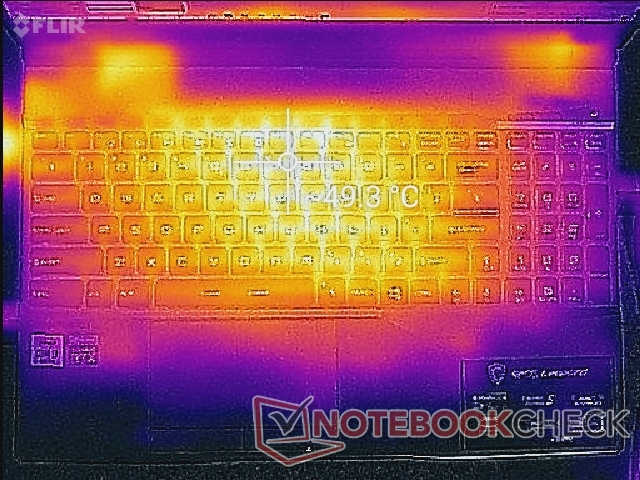
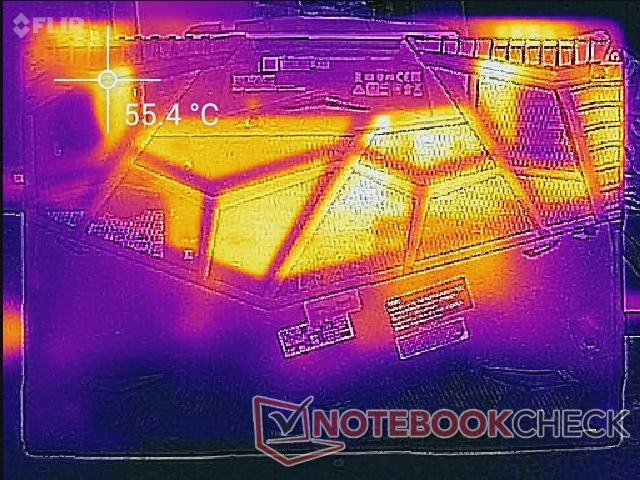
Le temperature di superficie sono all'incirca le stesse che abbiamo misurato sul GP65 dell'anno scorso, anche se questa SKU più recente viene fornita con la più potente GPU GeForce RTX 2070. Il gaming, per esempio, fa sì che il centro della tastiera si stabilizzi a circa 46 °C - 49 °C. Plaudiamo a MSI per aver incluso griglie di ventilazione molto grandi sul pannello inferiore, a differenza di alcuni altri portatili da gioco come lo Zephyrus G14 o G15.
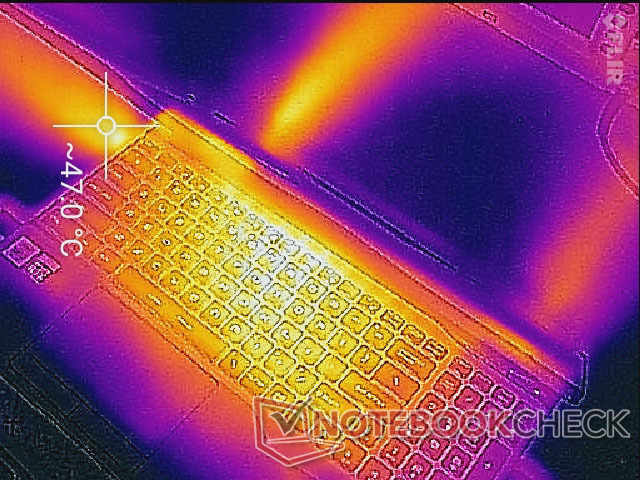
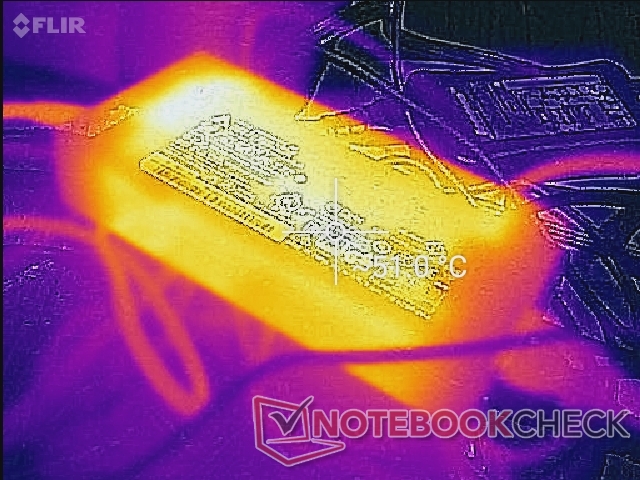
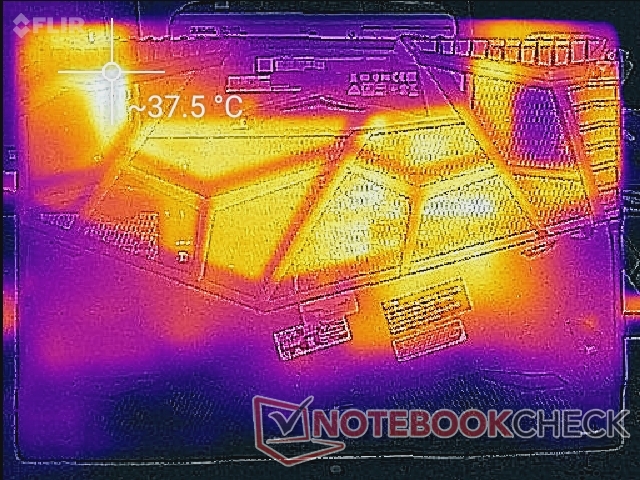
(-) La temperatura massima sul lato superiore è di 49.4 °C / 121 F, rispetto alla media di 40.4 °C / 105 F, che varia da 21.2 a 68.8 °C per questa classe Gaming.
(-) Il lato inferiore si riscalda fino ad un massimo di 57.2 °C / 135 F, rispetto alla media di 43.2 °C / 110 F
(+) In idle, la temperatura media del lato superiore è di 30.6 °C / 87 F, rispetto alla media deld ispositivo di 33.9 °C / 93 F.
(±) Riproducendo The Witcher 3, la temperatura media per il lato superiore e' di 34.3 °C / 94 F, rispetto alla media del dispositivo di 33.9 °C / 93 F.
(+) I poggiapolsi e il touchpad sono piu' freddi della temperatura della pelle con un massimo di 30.8 °C / 87.4 F e sono quindi freddi al tatto.
(±) La temperatura media della zona del palmo della mano di dispositivi simili e'stata di 28.8 °C / 83.8 F (-2 °C / -3.6 F).
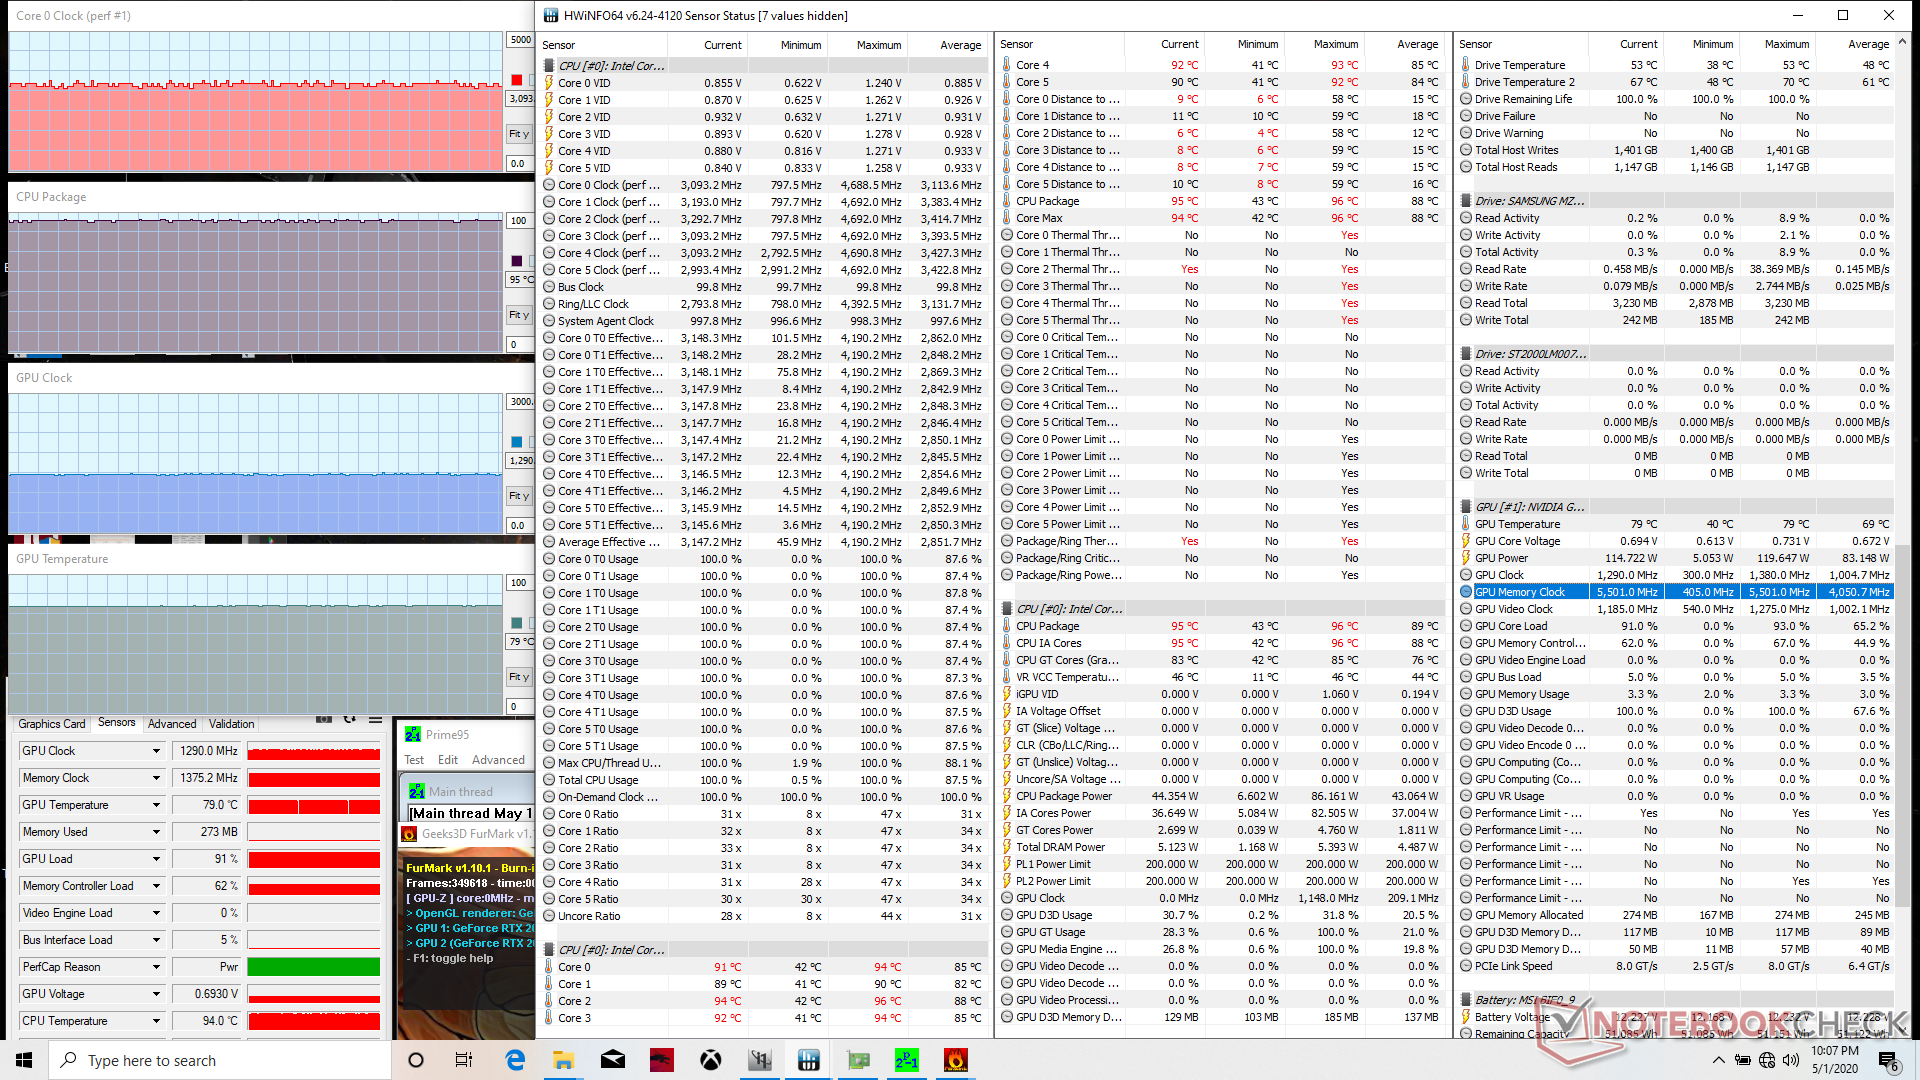
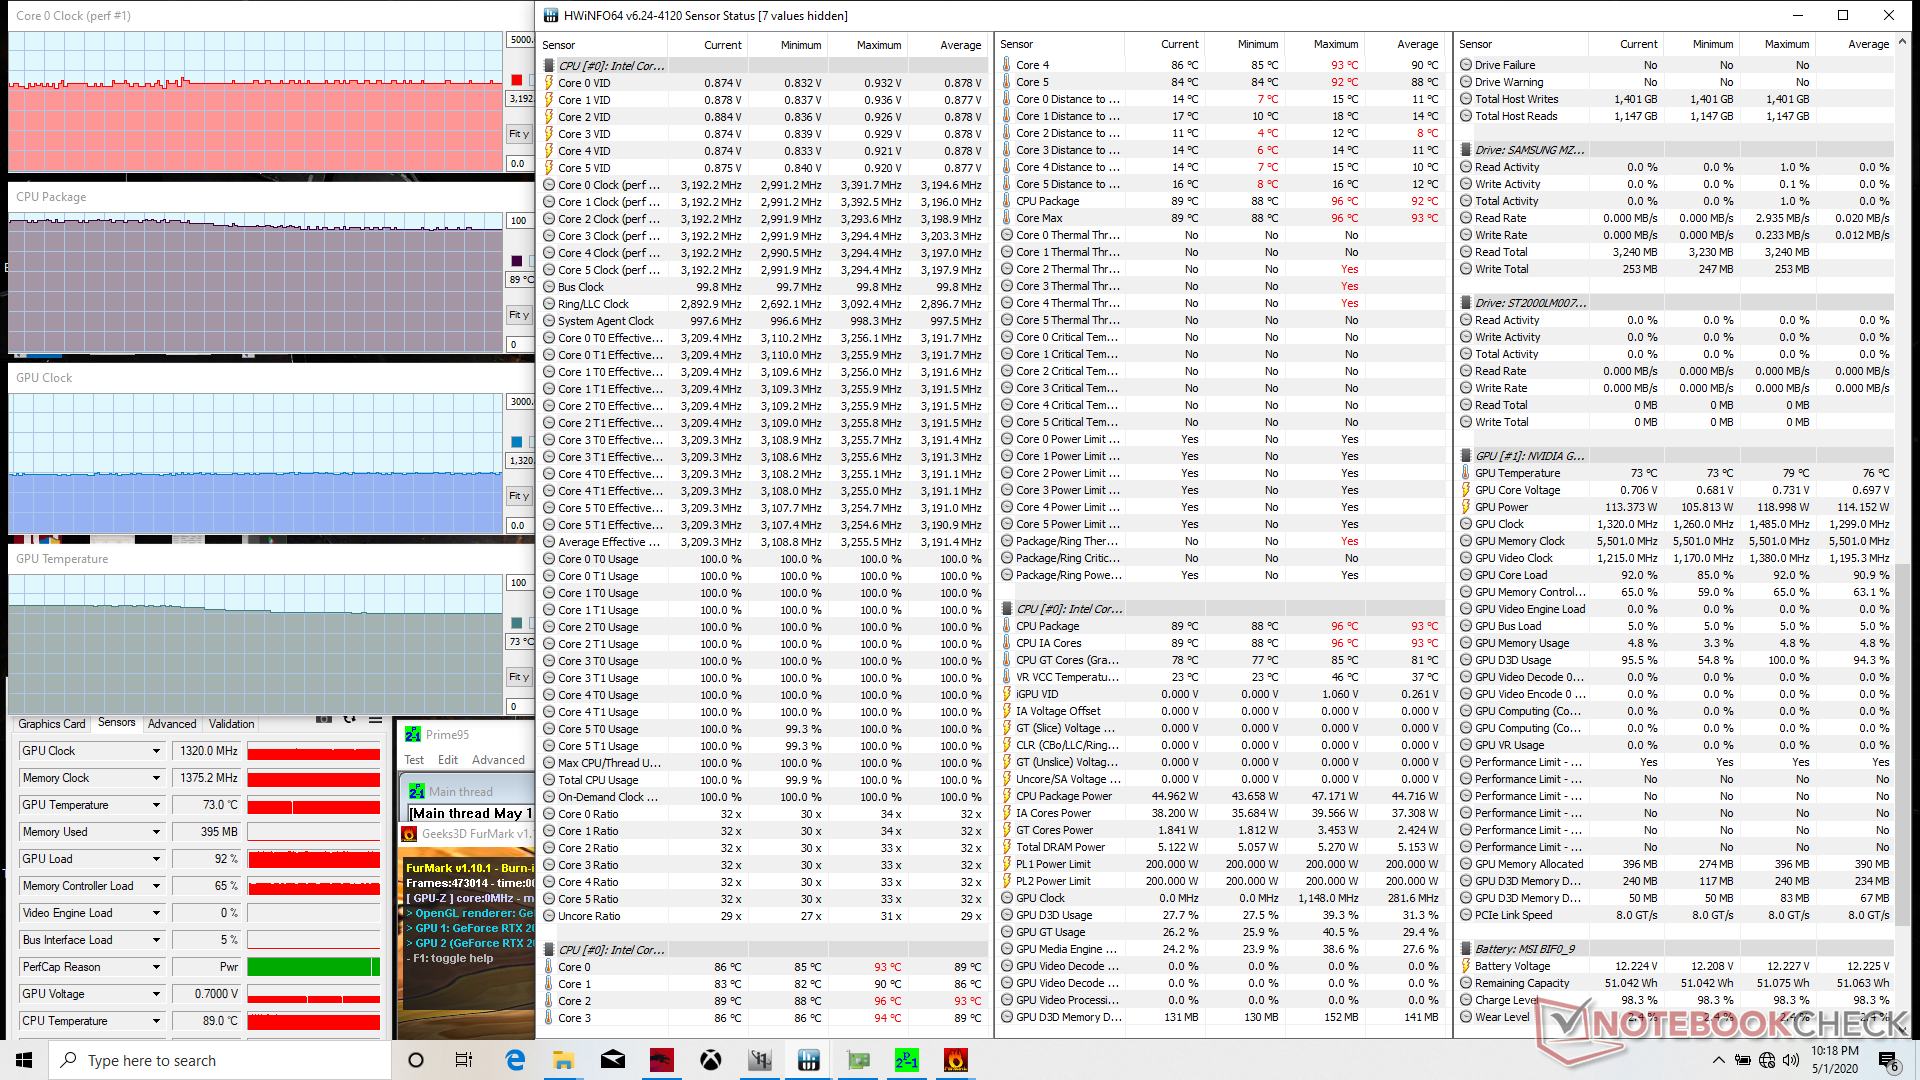
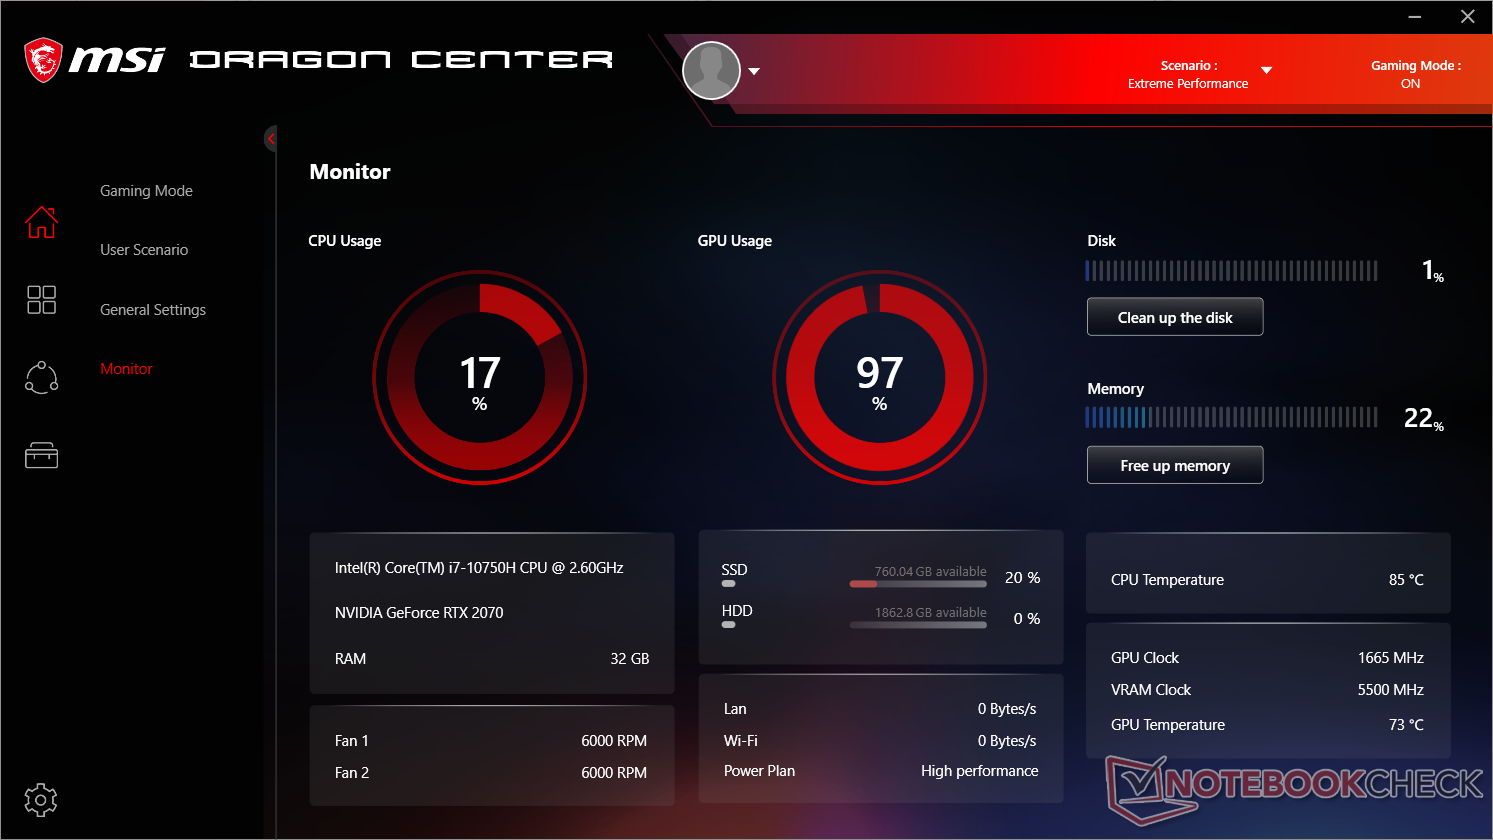
Stress Test
Stressiamo il sistema con carichi sintetici per identificare eventuali problemi di strozzamento o di stabilità. Quando si esegue Prime95, la CPU arriva a 4,2 GHz per i primi secondi prima di scendere costantemente a 3,7 GHz stabili. La temperatura del core si stabilizza ad una temperatura molto elevata di 95 °C. Se si esegue sia Prime95 che FurMark contemporaneamente, la CPU scende ancora di più a 3,1 GHz mantenendo la stessa temperatura del core di 95 °C. Abilitando la modalità Cooler Boost (cioè la modalità Maximum Fan), le temperature del core diminuiranno di pochi gradi mantenendo i valori di clock relativamente uguali a quelli mostrati nelle schermate sottostanti.
L'esecuzione di The Witcher 3 è più rappresentativa dei carichi di gioco del mondo reale. Ciononostante, la CPU si stabilizza comunque a ben 96 °C, mentre la GPU è solo un po' più fredda a 79 °C. In confronto, il più vecchio Core i7-9750H dell'MSI GS65 si stabilizza a un più ragionevole valore di 81 °C in condizioni simili.
Utilizzando la batteria si avrà un impatto sulle prestazioni. Un Fire Strike 3DMark Fire Strike con la batteria restituisce i punteggi di Physics e Graphics di 11586 e 5328 punti, rispettivamente. rispetto ai 15923 e 18962 punti ottenuti con il collegamento alla rete elettrica.
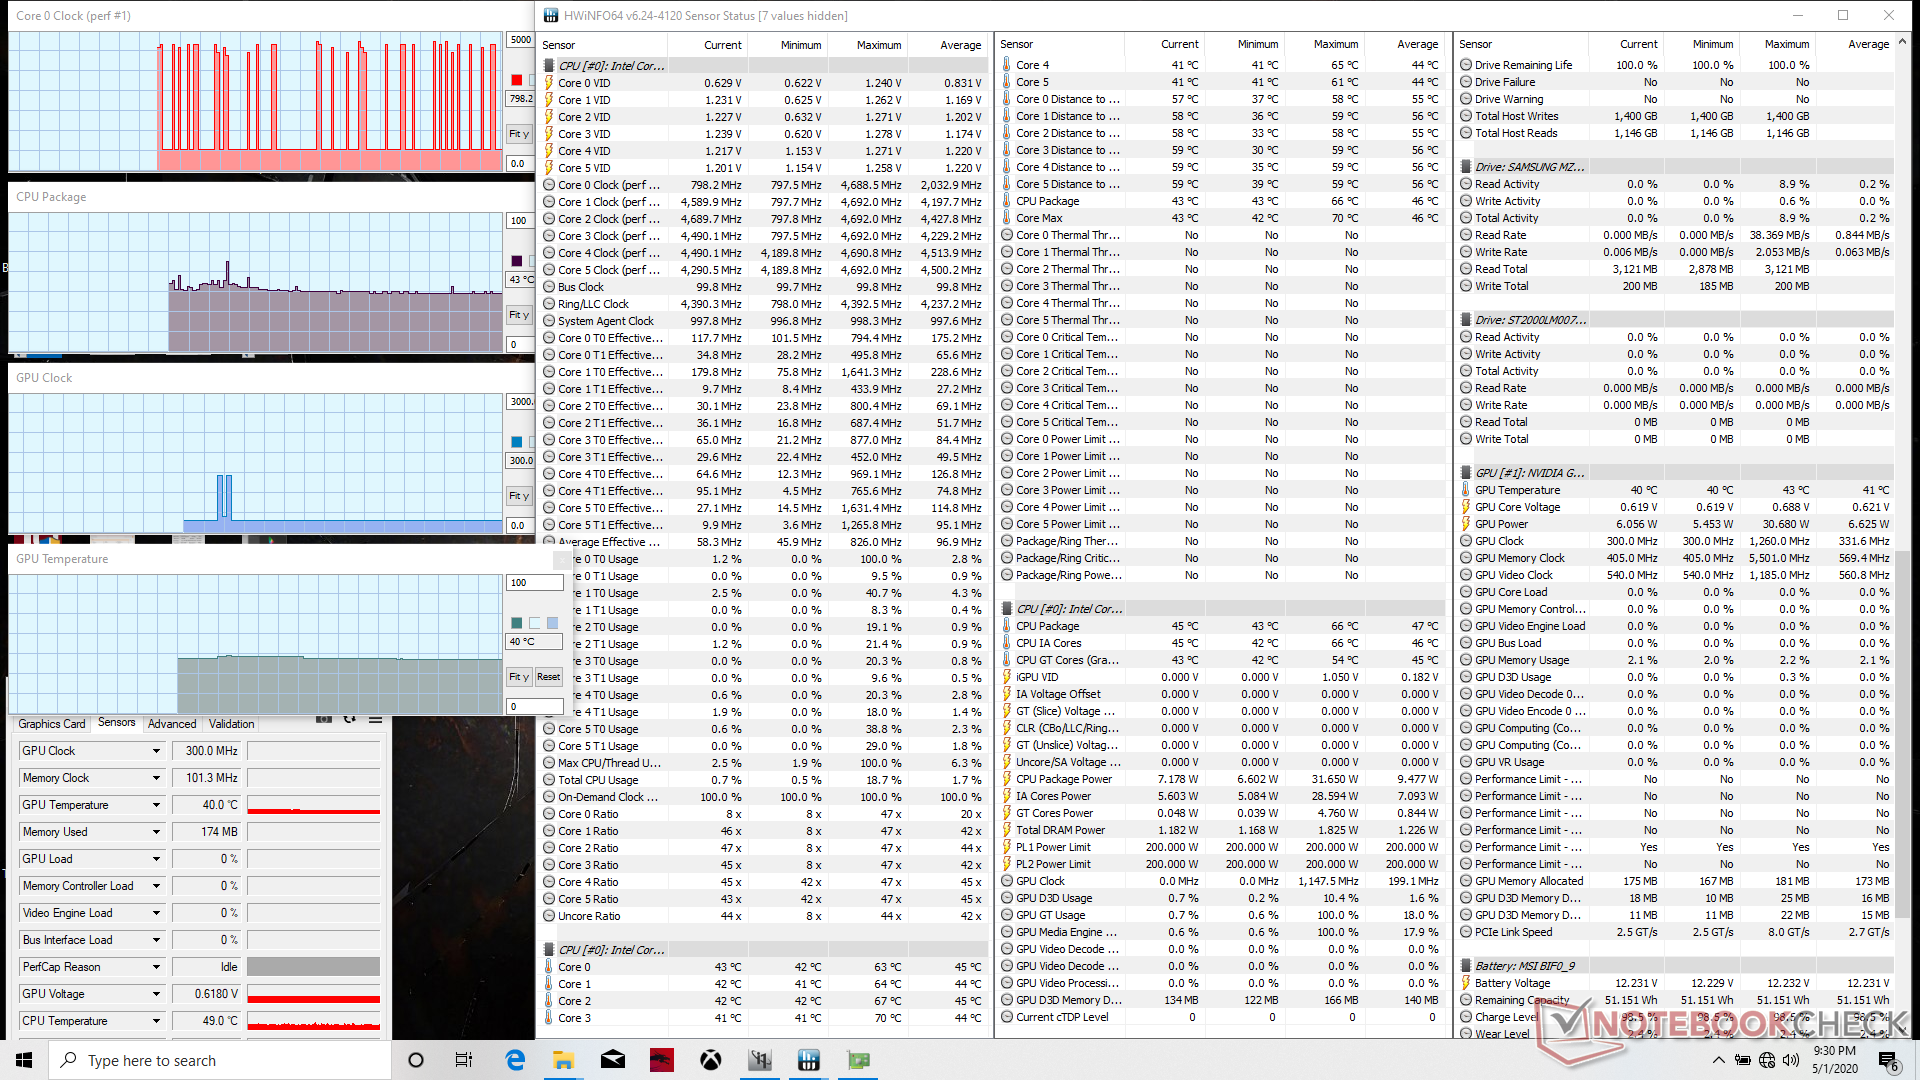
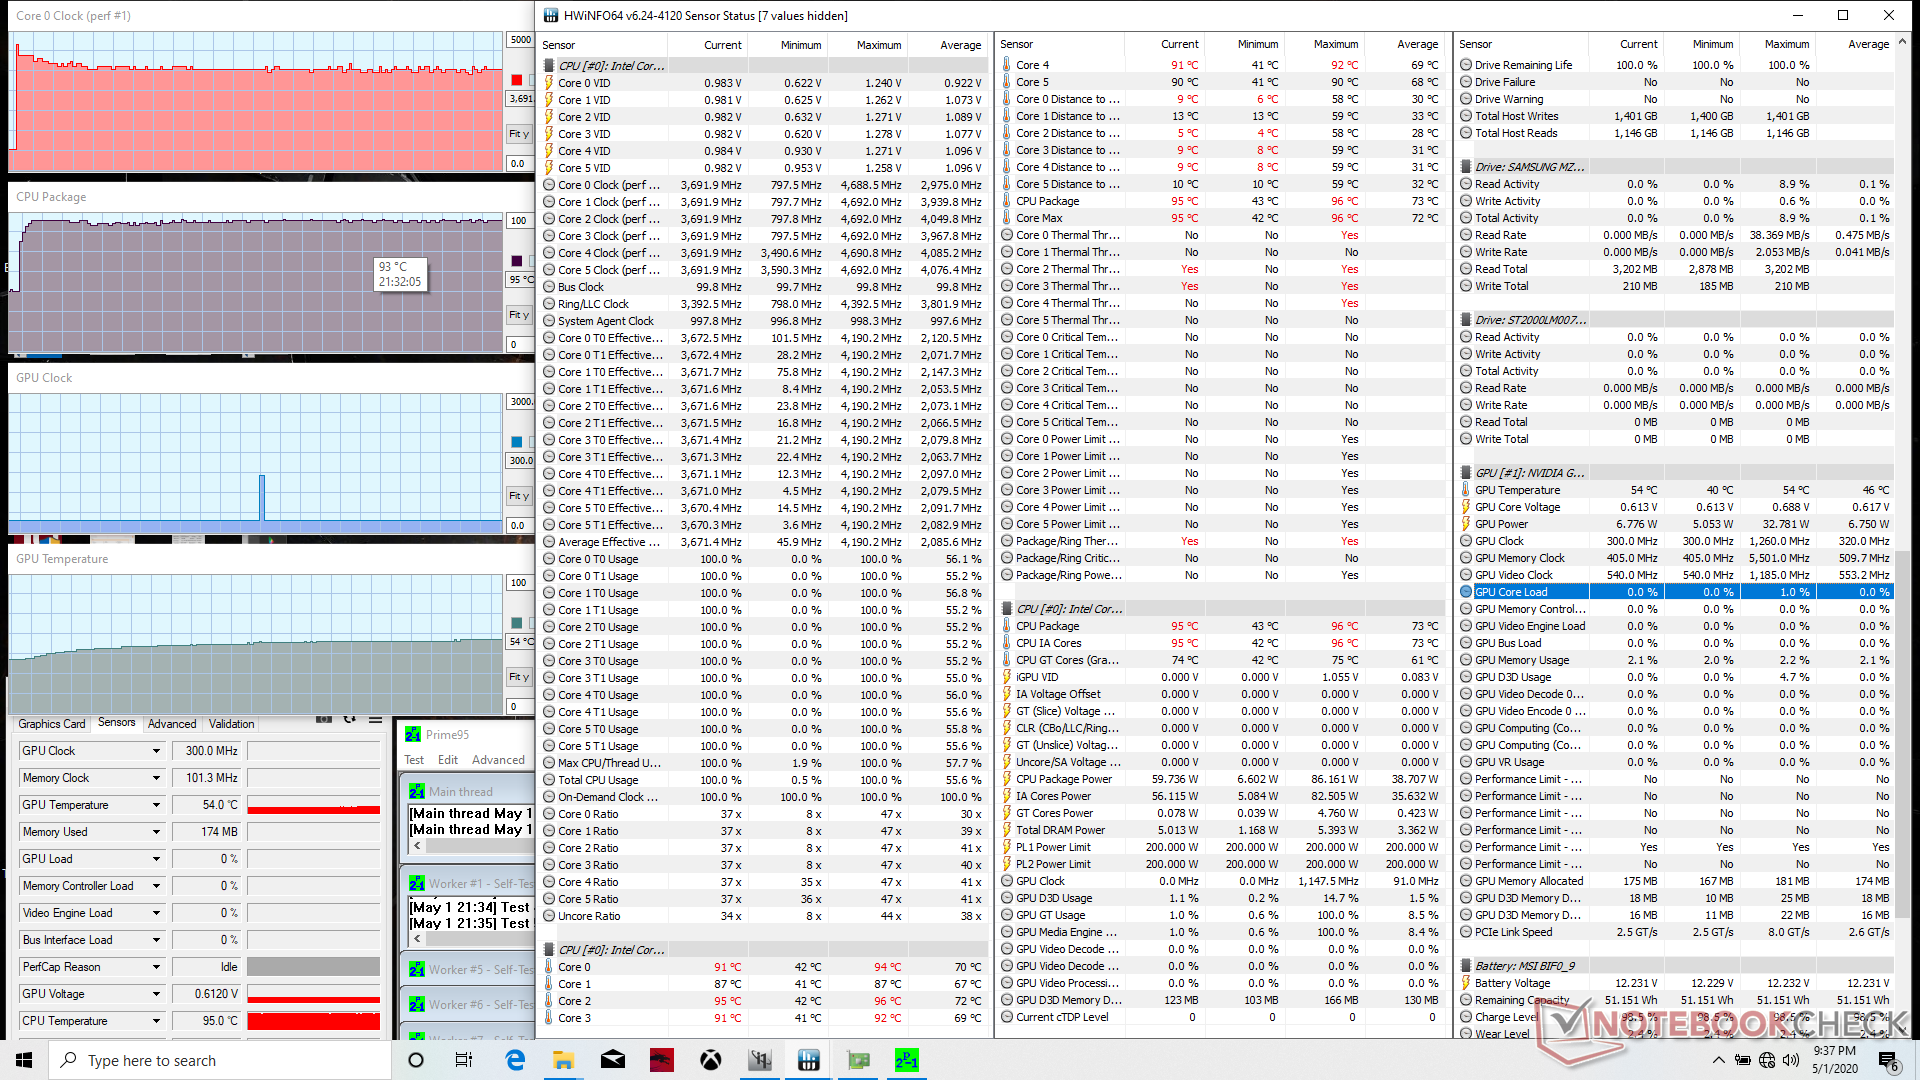
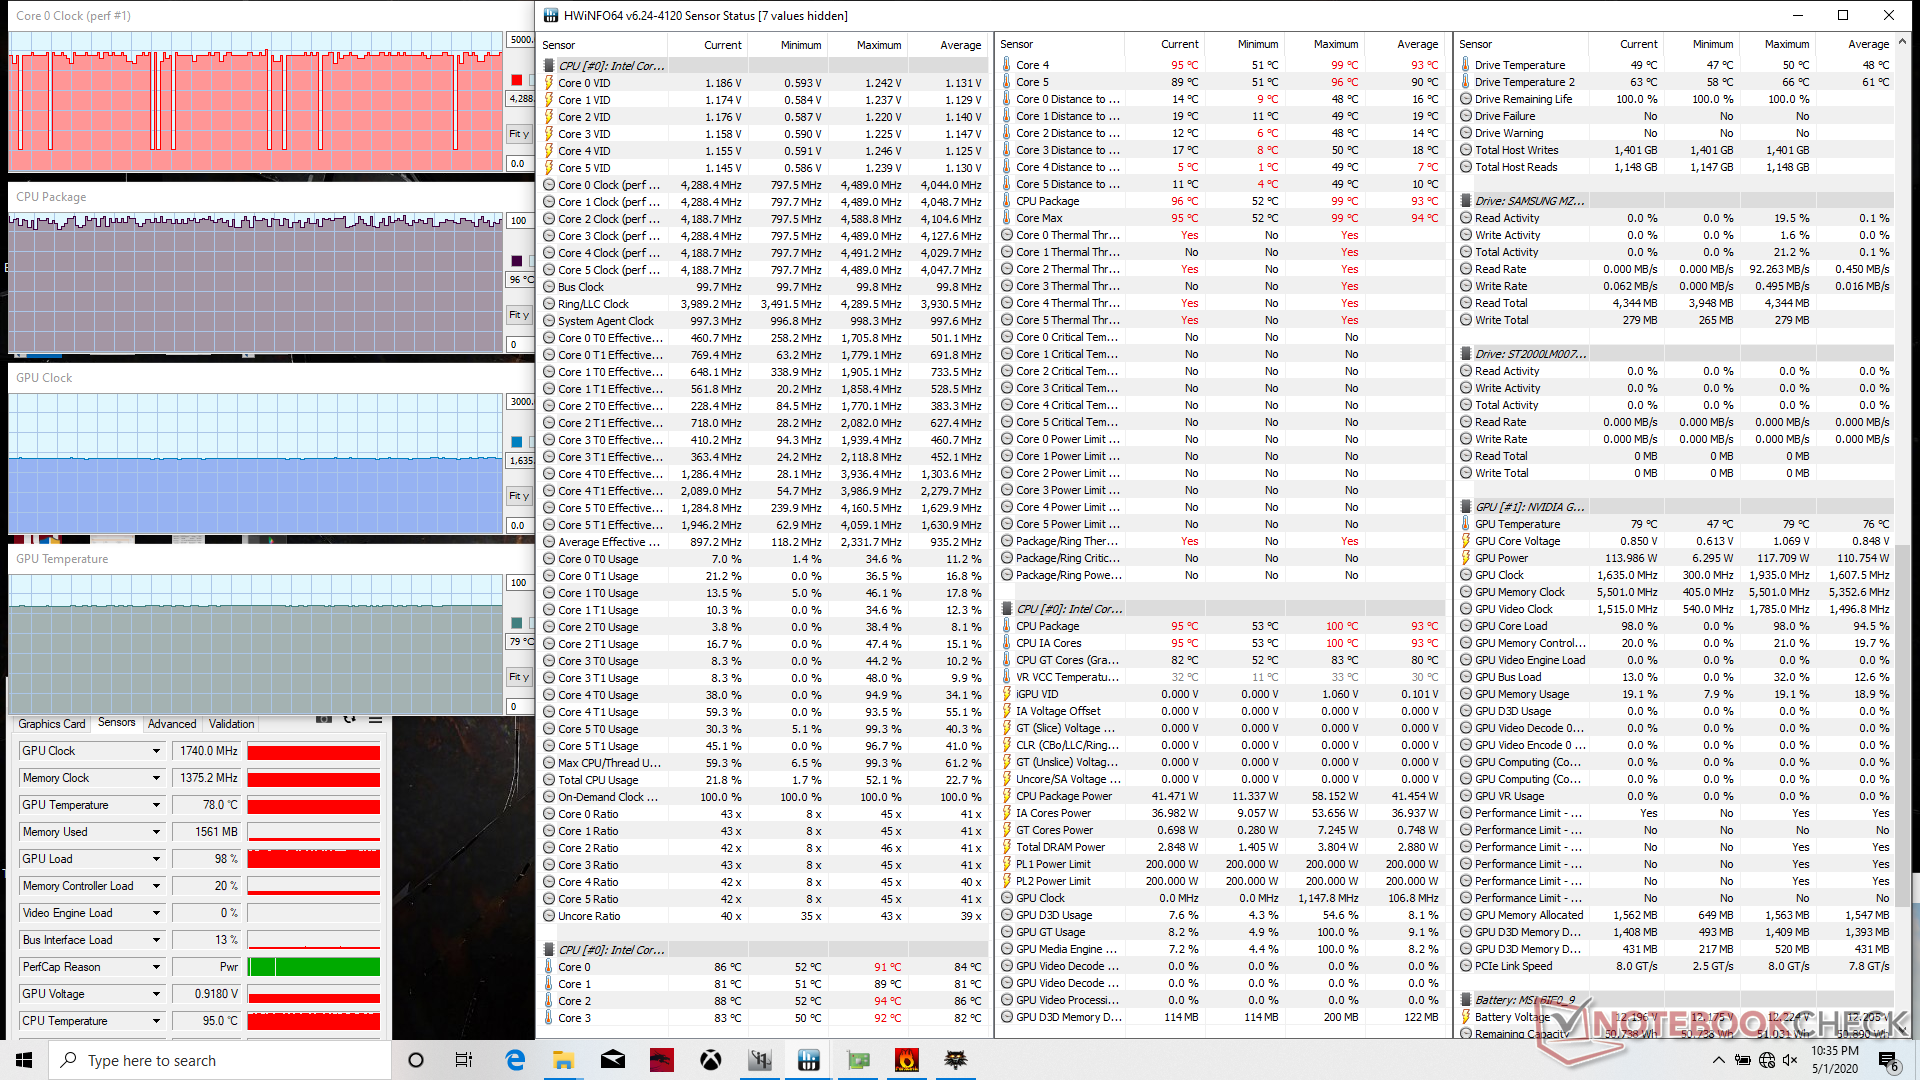
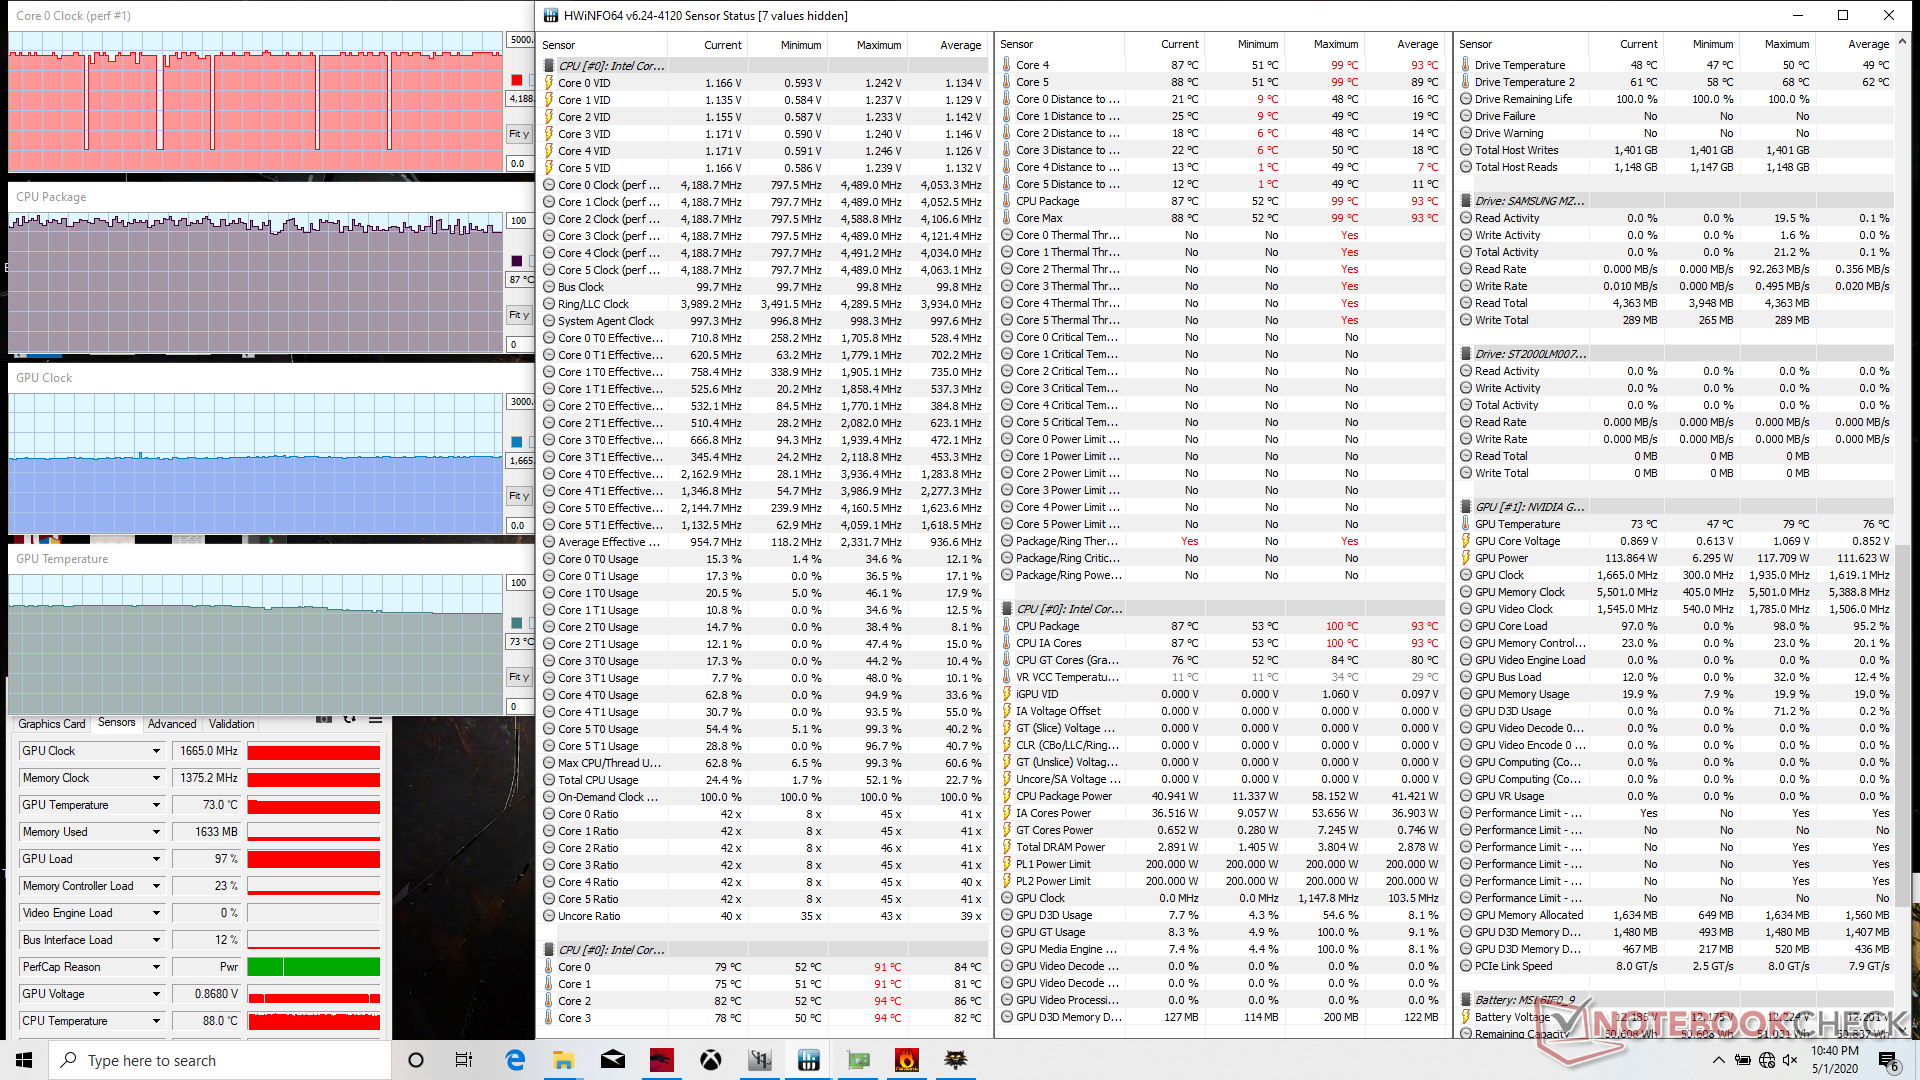

| CPU Clock (GHz) | GPU Clock (MHz) | Average CPU Temperature (°C) | Average GPU Temperature (°C) | |
| System Idle | -- | -- | 43 | 40 |
| Prime95 Stress | 3.7 | -- | 95 | 54 |
| Prime95 + FurMark Stress | 3.1 - 3.2 | 1290 | 95 | 79 |
| Prime95 + FurMark Stress (Cooler Boost on) | 3.1 - 3.2 | 1320 | 89 | 73 |
| Witcher 3 Stress | ~4.2 | 1740 | 96 | 79 |
Altoparlanti


MSI GP65 10SFK-047US analisi audio
(+) | gli altoparlanti sono relativamente potenti (90.3 dB)
Bassi 100 - 315 Hz
(-) | quasi nessun basso - in media 28.5% inferiori alla media
(+) | bassi in lineaa (6.2% delta rispetto alla precedente frequenza)
Medi 400 - 2000 Hz
(±) | medi ridotti - circa 8.2% inferiori alla media
(±) | linearità dei medi adeguata (9.1% delta rispetto alla precedente frequenza)
Alti 2 - 16 kHz
(+) | Alti bilanciati - appena 1.8% dalla media
(+) | alti lineari (4% delta rispetto alla precedente frequenza)
Nel complesso 100 - 16.000 Hz
(±) | la linearità complessiva del suono è media (23.5% di differenza rispetto alla media
Rispetto alla stessa classe
» 85% di tutti i dispositivi testati in questa classe è stato migliore, 5% simile, 10% peggiore
» Il migliore ha avuto un delta di 6%, medio di 18%, peggiore di 132%
Rispetto a tutti i dispositivi testati
» 70% di tutti i dispositivi testati in questa classe è stato migliore, 6% similare, 24% peggiore
» Il migliore ha avuto un delta di 4%, medio di 23%, peggiore di 134%
Apple MacBook 12 (Early 2016) 1.1 GHz analisi audio
(+) | gli altoparlanti sono relativamente potenti (83.6 dB)
Bassi 100 - 315 Hz
(±) | bassi ridotti - in media 11.3% inferiori alla media
(±) | la linearità dei bassi è media (14.2% delta rispetto alla precedente frequenza)
Medi 400 - 2000 Hz
(+) | medi bilanciati - solo only 2.4% rispetto alla media
(+) | medi lineari (5.5% delta rispetto alla precedente frequenza)
Alti 2 - 16 kHz
(+) | Alti bilanciati - appena 2% dalla media
(+) | alti lineari (4.5% delta rispetto alla precedente frequenza)
Nel complesso 100 - 16.000 Hz
(+) | suono nel complesso lineare (10.2% differenza dalla media)
Rispetto alla stessa classe
» 7% di tutti i dispositivi testati in questa classe è stato migliore, 2% simile, 90% peggiore
» Il migliore ha avuto un delta di 5%, medio di 18%, peggiore di 53%
Rispetto a tutti i dispositivi testati
» 5% di tutti i dispositivi testati in questa classe è stato migliore, 1% similare, 94% peggiore
» Il migliore ha avuto un delta di 4%, medio di 23%, peggiore di 134%
Gestione Energetica
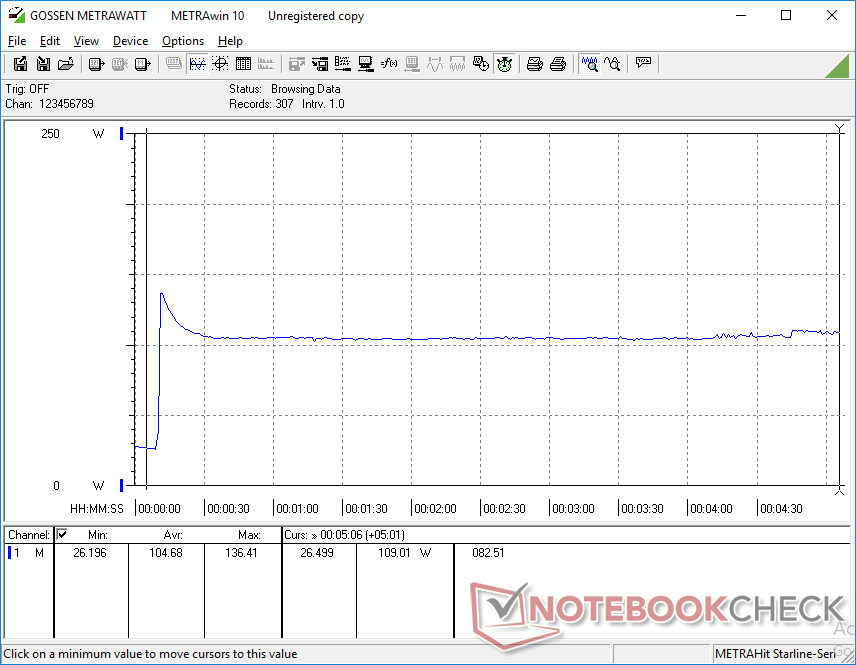
Consumo Energetico
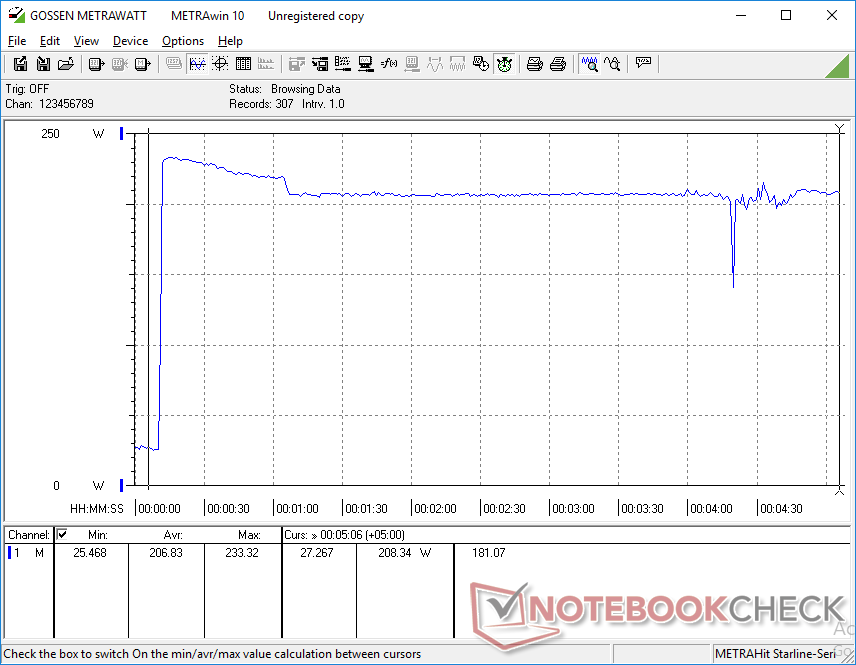
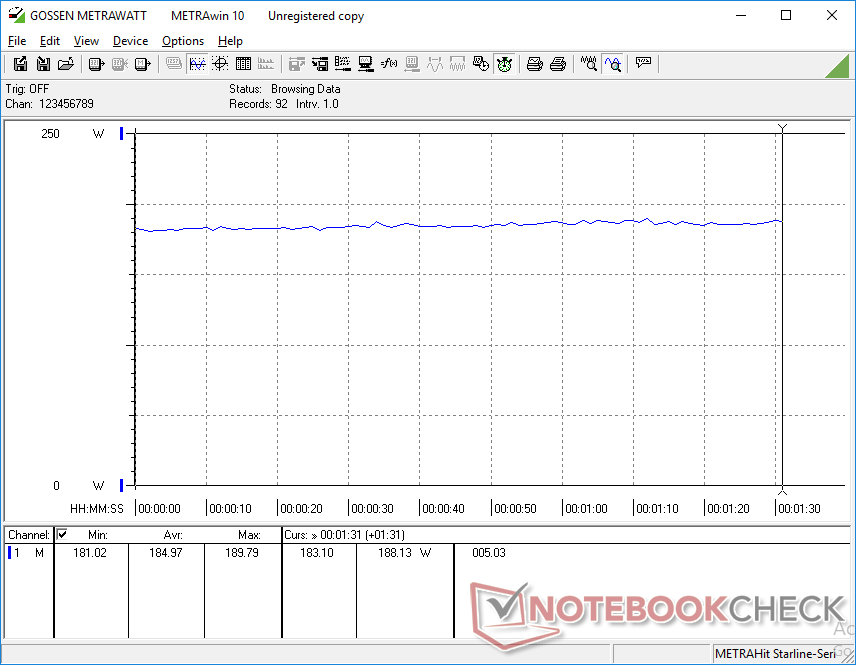
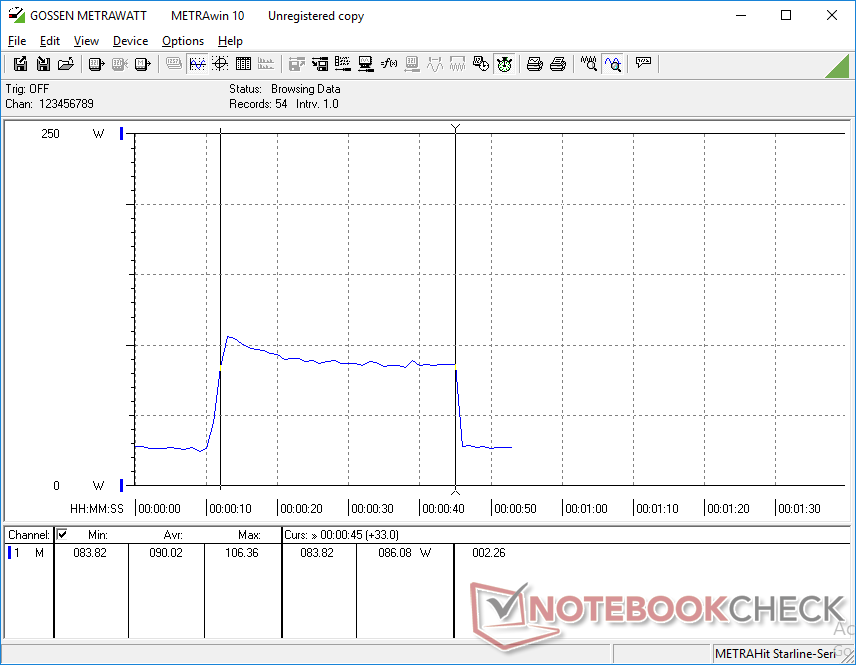
In idle sulla scrivania assorbe una potenza compresa tra 14 W e 24 W rispetto ai 13 W e 21 W del GP65. Nel frattempo, l'esecuzione di The Witcher 3 consuma una media di 185 W risultando essere del 20% in più rispetto alla GP65 del 2019 con la GeForce RTX 2060. Non a caso, la nostra RTX 2070 supera anche l'RTX 2060 di circa il 20% nei benchmark 3DMark mostrando una prestazione lineare per watt tra RTX 2060 e RTX 2070.
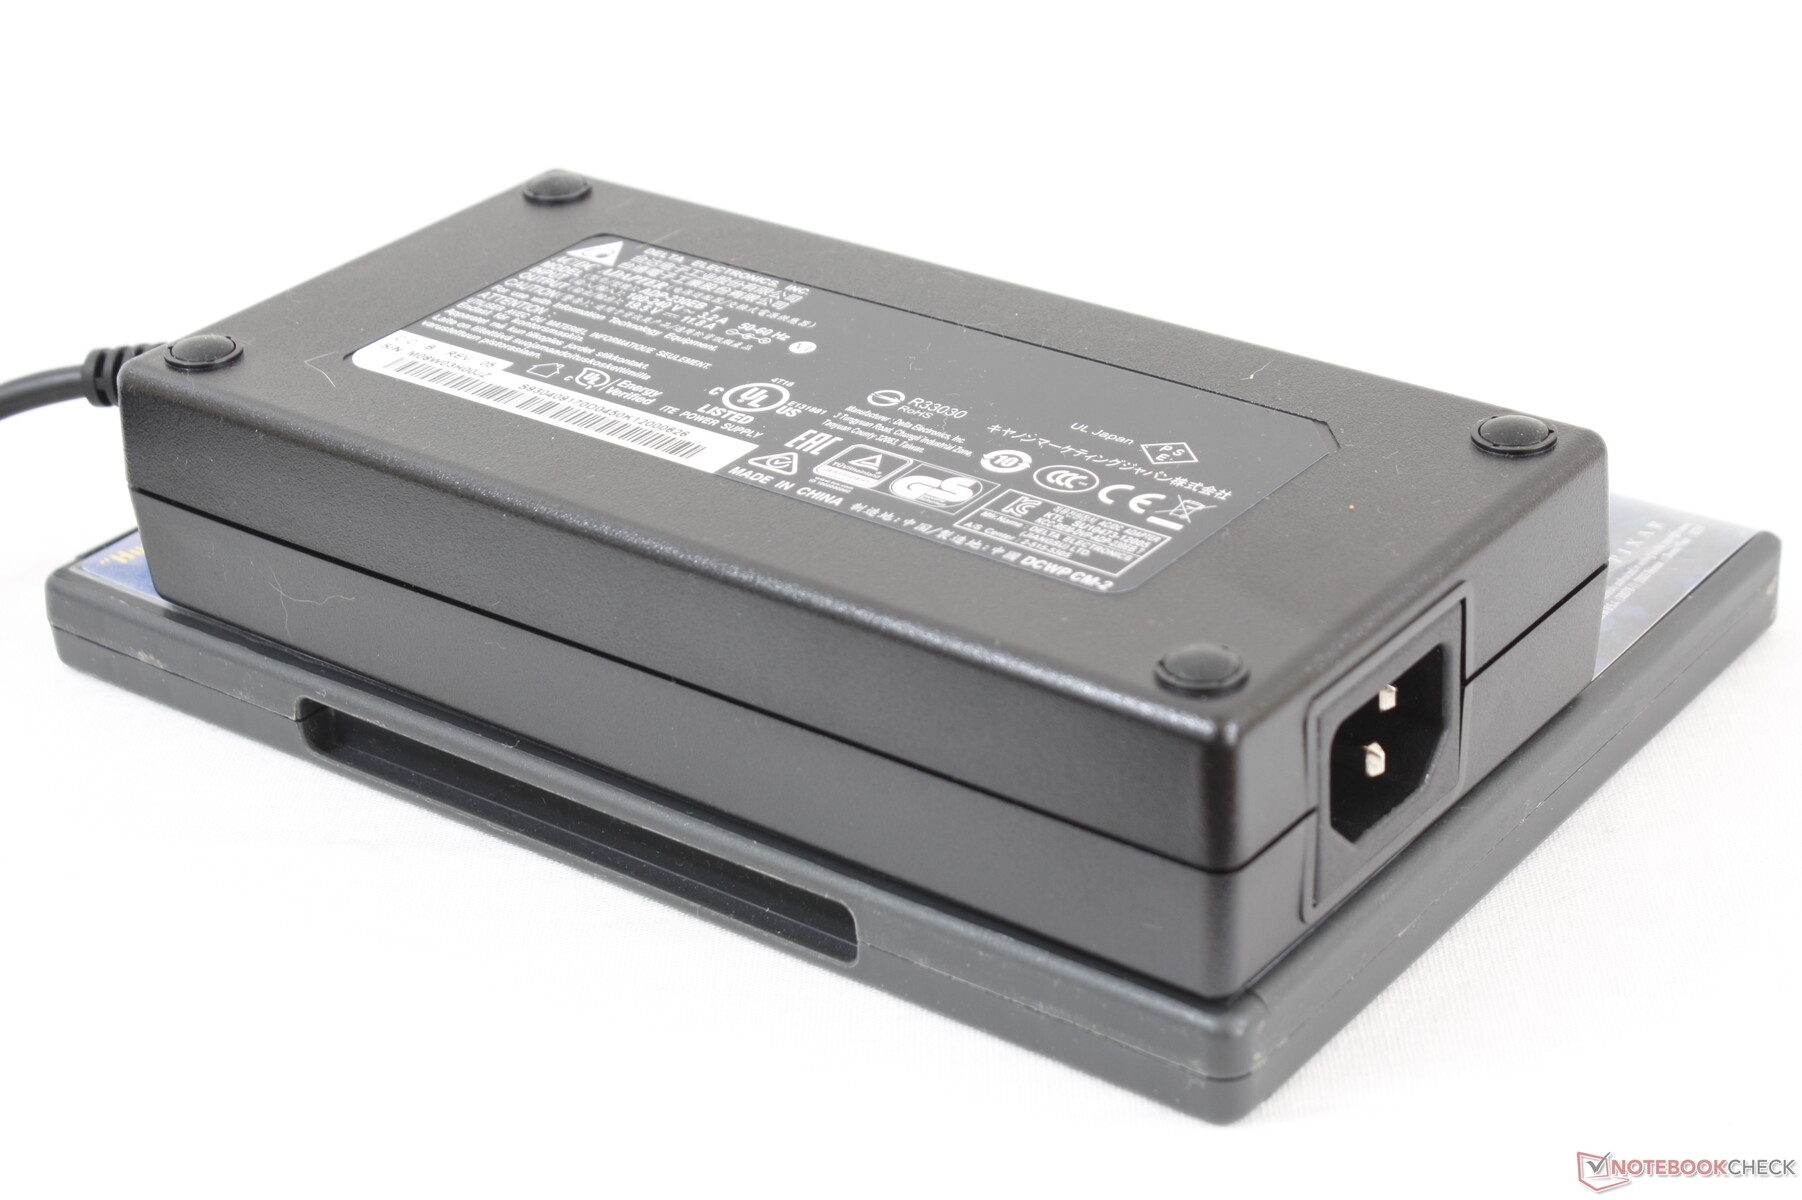
Il massimo che siamo in grado di registrare è di 233,4 W dal grande (~16,8 x 8,3 x 3,5 cm) alimentatore da 230 W quando si utilizzano contemporaneamente sia Prime95 che FurMark. Questo valore di consumo di picco è solo temporaneo, come mostrato dai nostri grafici qui sotto. Se confrontato con l'Asus Strix Scar III G531GW e lo Schenker XMG Pro 15 con la stessa GPU RTX 2070 ma con la vecchia CPU Core i7-9750H, il valore di consumo di picco del nostro MSI è ancora ben al di sopra dell'Asus (196 W) mentre è inferiore allo Schenker (245 W). Qualsiasi vantaggio in termini di consumo energetico da gen a gen tra le due CPU sarà molto minore.
| Off / Standby | |
| Idle | |
| Sotto carico |
|
Leggenda:
min: | |
| MSI GP65 10SFK-047US i7-10750H, GeForce RTX 2070 Mobile, Samsung SSD PM981 MZVLB1T0HALR, IPS, 1920x1080, 15.6" | Asus Strix Scar III G531GW-AZ062T i7-9750H, GeForce RTX 2070 Mobile, Intel SSD 660p SSDPEKNW512G8, IPS, 1920x1080, 15.6" | HP Omen 15-dc1303ng i7-8750H, GeForce RTX 2070 Max-Q, Samsung SSD PM981 MZVLB256HAHQ, IPS, 1920x1080, 15.6" | MSI GP62 7REX-1045US i7-7700HQ, GeForce GTX 1050 Ti Mobile, Toshiba NVMe THNSN5128GP, TN LED, 1920x1080, 15.6" | Aorus 15-SA i7-9750H, GeForce GTX 1660 Ti Mobile, Intel SSD 760p SSDPEKKW512G8, IPS, 1920x1080, 15.6" | MSI GP65 Leopard 9SE-225US i7-9750H, GeForce RTX 2060 Mobile, Toshiba KBG30ZMT512G, IPS, 1920x1080, 15.6" | Schenker XMG Pro 15 i7-9750H, GeForce RTX 2070 Mobile, Samsung SSD 970 EVO Plus 500GB, IPS, 1920x1080, 15.6" | |
|---|---|---|---|---|---|---|---|
| Power Consumption | 11% | 12% | 22% | -4% | 8% | -4% | |
| Idle Minimum * (Watt) | 14.2 | 11.4 20% | 14.7 -4% | 14.6 -3% | 20 -41% | 13.6 4% | 15 -6% |
| Idle Average * (Watt) | 18.8 | 13.5 28% | 18.6 1% | 17.2 9% | 23 -22% | 17.9 5% | 19 -1% |
| Idle Maximum * (Watt) | 23.9 | 21.6 10% | 22.6 5% | 17.3 28% | 29 -21% | 20.6 14% | 26 -9% |
| Load Average * (Watt) | 96.9 | 106 -9% | 90 7% | 82.7 15% | 87 10% | 96 1% | 101 -4% |
| Witcher 3 ultra * (Watt) | 185 | 186 -1% | 107 42% | 136 26% | 154.6 16% | 177 4% | |
| Load Maximum * (Watt) | 233.4 | 196 16% | 120 49% | 136.7 41% | 173 26% | 218.6 6% | 245 -5% |
* ... Meglio usare valori piccoli
Autonomia della batteria
I tempi di autonomia sono quasi identici a quelli che abbiamo osservato sul GP65 dell'anno scorso, il che significa che gli utenti possono aspettarsi meno di 4 ore di utilizzo della WLAN nel mondo reale. La ricarica completa richiede poco meno di 2 ore.
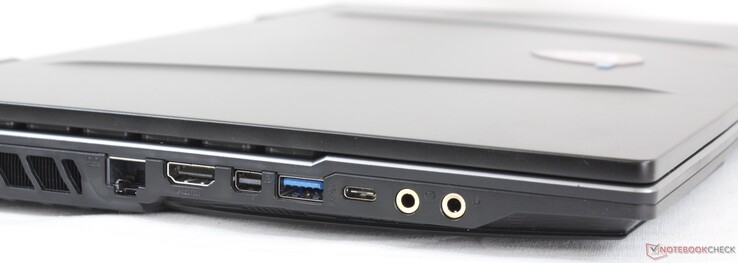
Il sistema non può essere ricaricato tramite USB Type-C, a differenza dell'Asus Zephyrus M.
| MSI GP65 10SFK-047US i7-10750H, GeForce RTX 2070 Mobile, 51 Wh | Asus Strix Scar III G531GW-AZ062T i7-9750H, GeForce RTX 2070 Mobile, 66 Wh | Asus TUF FX505DT-EB73 R7 3750H, GeForce GTX 1650 Mobile, 48 Wh | HP Omen 15-dc1303ng i7-8750H, GeForce RTX 2070 Max-Q, 70 Wh | MSI GP62 7REX-1045US i7-7700HQ, GeForce GTX 1050 Ti Mobile, 41 Wh | Aorus 15-SA i7-9750H, GeForce GTX 1660 Ti Mobile, 62 Wh | MSI GP65 Leopard 9SE-225US i7-9750H, GeForce RTX 2060 Mobile, 51 Wh | |
|---|---|---|---|---|---|---|---|
| Autonomia della batteria | 51% | 30% | -11% | -22% | -24% | 5% | |
| WiFi v1.3 (h) | 3.7 | 5.6 51% | 4.8 30% | 3.3 -11% | 2.9 -22% | 2.8 -24% | 3.9 5% |
| Reader / Idle (h) | 7.8 | 5 | 4.3 | 3.5 | 6 | ||
| Load (h) | 1.5 | 1.2 | 0.7 | 2 | 1.1 |
Pro
Contro
Valutazione Complessiva

Sulla serie Comet Lake-U, le differenze di prestazioni gen-to-gen tra questa e la serie Whiskey Lake-U sono minime, a meno che non si opti per l'high-end Comet Lake-U Core i7-10710U. Altrimenti, opzioni minori come il Core i7-10510U avranno prestazioni quasi identiche a quelle del vecchio Core i7-8565U.
Lo stesso si può dire della serie Comet Lake-H. Il Core i7-10750H si comporta in modo molto simile al Core i7-9750H al punto che qualsiasi differenza sarebbe impercettibile, soprattutto se il gaming riguarda i giochi più legati alla GPU piuttosto che alla CPU. Gli utenti dovranno invece considerare l'opzione Core i7-10875H di fascia più alta per qualsiasi significativo guadagno di prestazioni grezze rispetto al Core i7-9750H.
Anche se non è la notizia che la maggior parte degli appassionati ama sentire, è comunque una buona notizia per i giocatori che cercano di aggiornare i loro vecchi portatili. Il fatto che la 10a generazione Comet Lake-H sia solo marginalmente più veloce della 9a generazione Coffee Lake-H a livello di SKU di fascia media significa che è possibile passare a un laptop gaming Intel di 9a generazione e ottenere ancora essenzialmente la stessa esperienza di gioco di un più costoso modello Intel di 10a generazione. Il denaro risparmiato potrebbe essere utilizzato per aggiornare altri aspetti più tangibili del laptop come il display o la RAM o anche un modello migliore, come l'MSI GS65, GE65, o GS65.
L'MSI GP65 10SFK è lo stesso portatile del GP65 9SE dell'anno scorso, ma con un processore leggermente più veloce e più recente. Gli utenti non si lasceranno sfuggire nessuna caratteristica entusiasmante o enormi vantaggi in termini di prestazioni, grazie all'utilizzo di una CPU Coffee Lake-H.
MSI GP65 10SFK-047US
- 05/06/2020 v7 (old)
Allen Ngo
Price comparison
