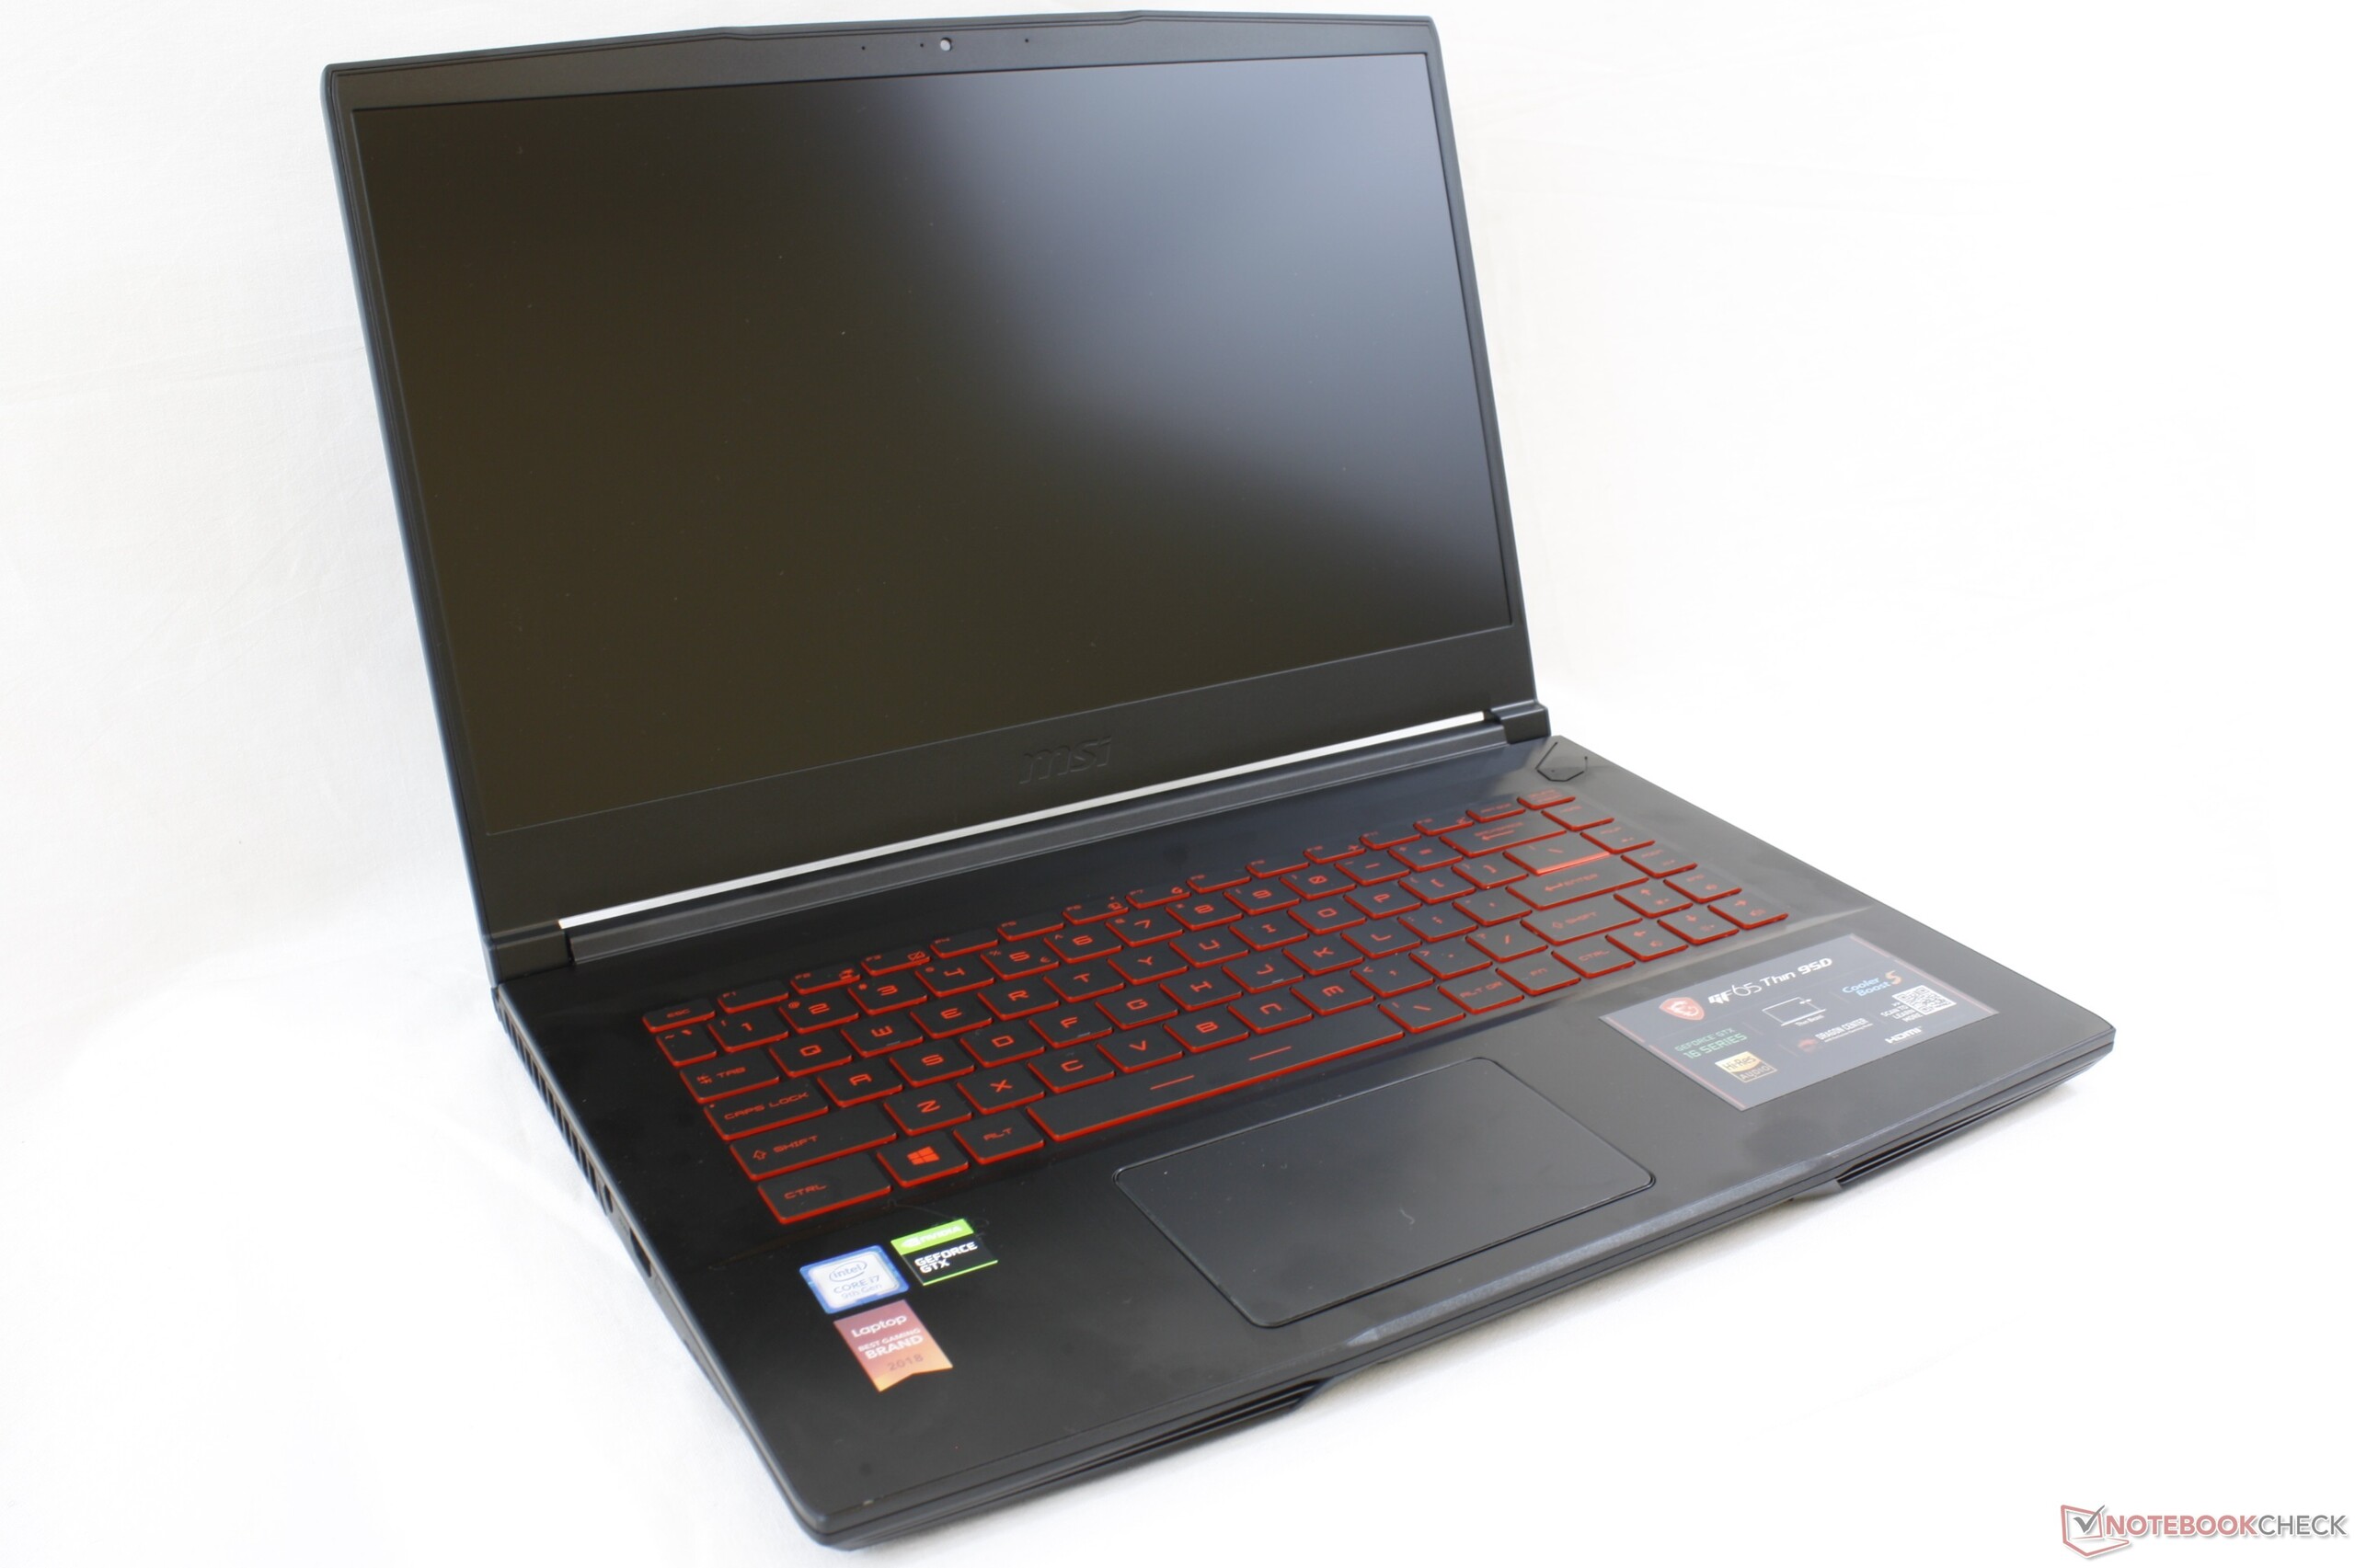
Recensione del Laptop MSI GF65 9SD: GeForce GTX 1660 Ti che costa meno di $1000
Punteggio | Data | Modello | Peso | Altezza | Dimensione | Risoluzione | Prezzo |
|---|---|---|---|---|---|---|---|
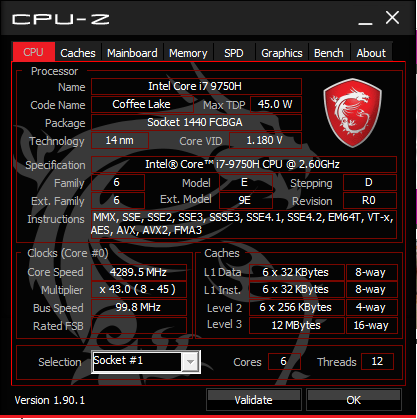
| 78.8 % v7 (old) | 10/2019 | MSI GF65 9SD i7-9750H, GeForce GTX 1660 Ti Mobile | 1.9 kg | 21.7 mm | 15.60" | 1920x1080 | |
| 80.4 % v6 (old) | 07/2019 | Asus TUF FX505DT-EB73 R7 3750H, GeForce GTX 1650 Mobile | 2.2 kg | 26.8 mm | 15.60" | 1920x1080 | |
| 82.3 % v7 (old) | 10/2019 | Dell G7 7590 i7-9750H, GeForce RTX 2060 Mobile | 2.5 kg | 19.9 mm | 15.60" | 1920x1080 | |
| 82.3 % v7 (old) | 08/2019 | Lenovo Legion Y540-15IRH-81SX00B2GE i7-9750H, GeForce GTX 1660 Ti Mobile | 2.2 kg | 26 mm | 15.60" | 1920x1080 |
| Networking | |
| iperf3 transmit AX12 | |
| Aorus 15-SA | |
| Lenovo Legion Y540-15IRH-81SX00B2GE | |
| Asus TUF FX505DT-EB73 | |
| MSI GF63 8RC | |
| MSI GF65 9SD | |
| iperf3 receive AX12 | |
| Aorus 15-SA | |
| MSI GF65 9SD | |
| Lenovo Legion Y540-15IRH-81SX00B2GE | |
| Asus TUF FX505DT-EB73 | |
| MSI GF63 8RC | |
| |||||||||||||||||||||||||
Distribuzione della luminosità: 90 %
Al centro con la batteria: 258.5 cd/m²
Contrasto: 923:1 (Nero: 0.28 cd/m²)
ΔE ColorChecker Calman: 5.36 | ∀{0.5-29.43 Ø4.73}
calibrated: 4.92
ΔE Greyscale Calman: 3.4 | ∀{0.09-98 Ø4.97}
53.8% sRGB (Argyll 1.6.3 3D)
34.2% AdobeRGB 1998 (Argyll 1.6.3 3D)
37.26% AdobeRGB 1998 (Argyll 3D)
54.1% sRGB (Argyll 3D)
36.06% Display P3 (Argyll 3D)
Gamma: 2.06
CCT: 6192 K
| MSI GF65 9SD AU Optronics B156HAN13.0, IPS, 15.6", 1920x1080 | MSI GF63 8RC AU Optronics B156HAN02.1, IPS, 15.6", 1920x1080 | Asus TUF FX505DT-EB73 Panda LM156LF-GL, IPS, 15.6", 1920x1080 | Aorus 15-SA LG Philips LP156WFG-SPB2 (LGD05E8), IPS, 15.6", 1920x1080 | Dell G7 7590 AU Optronics B156HAN, IPS, 15.6", 1920x1080 | Lenovo Legion Y540-15IRH-81SX00B2GE BOE 084D, IPS, 15.6", 1920x1080 | |
|---|---|---|---|---|---|---|
| Display | 9% | 10% | 76% | 73% | 74% | |
| Display P3 Coverage (%) | 36.06 | 39.43 9% | 39.56 10% | 64.3 78% | 64.4 79% | 63.6 76% |
| sRGB Coverage (%) | 54.1 | 59.3 10% | 59.5 10% | 93.6 73% | 90 66% | 91.7 70% |
| AdobeRGB 1998 Coverage (%) | 37.26 | 40.73 9% | 40.91 10% | 65.6 76% | 65.3 75% | 65.2 75% |
| Response Times | 0% | 3% | 53% | 58% | 64% | |
| Response Time Grey 50% / Grey 80% * (ms) | 35.2 ? | 33.2 ? 6% | 30.4 ? 14% | 15.6 ? 56% | 14 ? 60% | 8.8 ? 75% |
| Response Time Black / White * (ms) | 25.6 ? | 27.2 ? -6% | 27.6 ? -8% | 12.8 ? 50% | 11.2 ? 56% | 12 ? 53% |
| PWM Frequency (Hz) | ||||||
| Screen | -3% | -2% | 30% | -3% | 29% | |
| Brightness middle (cd/m²) | 258.5 | 266.6 3% | 286.2 11% | 266 3% | 330.5 28% | 299 16% |
| Brightness (cd/m²) | 254 | 257 1% | 267 5% | 254 0% | 324 28% | 290 14% |
| Brightness Distribution (%) | 90 | 89 -1% | 84 -7% | 90 0% | 91 1% | 89 -1% |
| Black Level * (cd/m²) | 0.28 | 0.29 -4% | 0.33 -18% | 0.28 -0% | 0.71 -154% | 0.29 -4% |
| Contrast (:1) | 923 | 919 0% | 867 -6% | 950 3% | 465 -50% | 1031 12% |
| Colorchecker dE 2000 * | 5.36 | 5.93 -11% | 5.45 -2% | 3.11 42% | 5.33 1% | 3.7 31% |
| Colorchecker dE 2000 max. * | 23.23 | 16.28 30% | 18.08 22% | 5.84 75% | 11.08 52% | 7 70% |
| Colorchecker dE 2000 calibrated * | 4.92 | 3.6 27% | 4.47 9% | 1.37 72% | 3.63 26% | 2 59% |
| Greyscale dE 2000 * | 3.4 | 6.8 -100% | 5.3 -56% | 3.94 -16% | 6.7 -97% | 4.1 -21% |
| Gamma | 2.06 107% | 2.43 91% | 2.1 105% | 2.53 87% | 2.24 98% | 2.19 100% |
| CCT | 6192 105% | 7192 90% | 7679 85% | 6210 105% | 8035 81% | 7166 91% |
| Color Space (Percent of AdobeRGB 1998) (%) | 34.2 | 37.6 10% | 37.6 10% | 60 75% | 58.3 70% | 59.3 73% |
| Color Space (Percent of sRGB) (%) | 53.8 | 59.3 10% | 59.1 10% | 93 73% | 89.5 66% | 91.5 70% |
| Media totale (Programma / Settaggio) | 2% /
-0% | 4% /
1% | 53% /
41% | 43% /
19% | 56% /
42% |
* ... Meglio usare valori piccoli
Tempi di risposta del Display
| ↔ Tempi di risposta dal Nero al Bianco | ||
|---|---|---|
| 25.6 ms ... aumenta ↗ e diminuisce ↘ combinato | ↗ 12.4 ms Incremento | 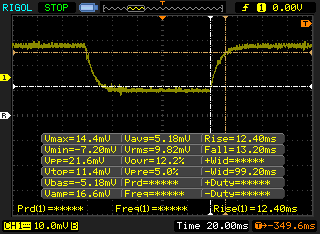 |
| ↘ 13.2 ms Calo | ||
| Lo schermo mostra tempi di risposta relativamente lenti nei nostri tests e potrebbe essere troppo lento per i gamers. In confronto, tutti i dispositivi di test variano da 0.1 (minimo) a 240 (massimo) ms. » 61 % di tutti i dispositivi è migliore. Questo significa che i tempi di risposta rilevati sono peggiori rispetto alla media di tutti i dispositivi testati (19.9 ms). | ||
| ↔ Tempo di risposta dal 50% Grigio all'80% Grigio | ||
| 35.2 ms ... aumenta ↗ e diminuisce ↘ combinato | ↗ 18 ms Incremento | 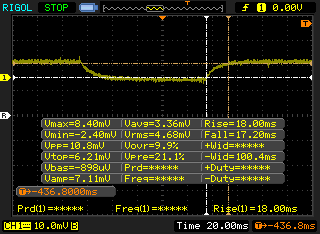 |
| ↘ 17.2 ms Calo | ||
| Lo schermo mostra tempi di risposta lenti nei nostri tests e sarà insoddisfacente per i gamers. In confronto, tutti i dispositivi di test variano da 0.165 (minimo) a 636 (massimo) ms. » 49 % di tutti i dispositivi è migliore. Questo significa che i tempi di risposta rilevati sono peggiori rispetto alla media di tutti i dispositivi testati (31.1 ms). | ||
Sfarfallio dello schermo / PWM (Pulse-Width Modulation)
| flickering dello schermo / PWM non rilevato | 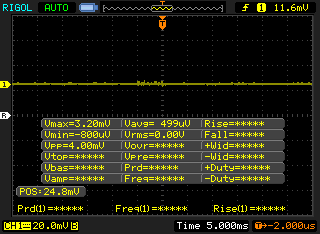 | ||
In confronto: 52 % di tutti i dispositivi testati non utilizza PWM per ridurre la luminosita' del display. Se è rilevato PWM, una media di 7784 (minimo: 5 - massimo: 343500) Hz è stata rilevata. | |||
| wPrime 2.10 - 1024m | |
| Dell XPS 13 7390 2-in-1 Core i7 | |
| MSI GF62VR 7RF-877 | |
| MSI GV62 8RE-016US | |
| Asus ROG Zephyrus G15 GA502DU | |
| Media Intel Core i7-9750H (n=1) | |
| MSI GE75 9SG | |
* ... Meglio usare valori piccoli
| PCMark 8 Home Score Accelerated v2 | 4205 punti | |
| PCMark 8 Work Score Accelerated v2 | 5357 punti | |
| PCMark 10 Score | 5508 punti | |
Aiuto | ||
| MSI GF65 9SD Kingston RBUSNS8154P3512GJ | Asus TUF FX505DT-EB73 Intel SSD 660p SSDPEKNW512G8 | Aorus 15-SA Intel SSD 760p SSDPEKKW512G8 | Dell G7 7590 Toshiba BG3 KBG30ZMS256G | Lenovo Legion Y540-15IRH-81SX00B2GE WDC PC SN720 SDAPNTW-512G | |
|---|---|---|---|---|---|
| AS SSD | 7% | 50% | -52% | 92% | |
| Seq Read (MB/s) | 1148 | 1019 -11% | 2601 127% | 1013 -12% | 2927 155% |
| Seq Write (MB/s) | 962 | 889 -8% | 1507 57% | 203.8 -79% | 2149 123% |
| 4K Read (MB/s) | 22.87 | 48.22 111% | 56.3 146% | 29.57 29% | 42.43 86% |
| 4K Write (MB/s) | 80.6 | 115.5 43% | 110.3 37% | 71.4 -11% | 147.1 83% |
| 4K-64 Read (MB/s) | 772 | 321.5 -58% | 877 14% | 332.1 -57% | 1286 67% |
| 4K-64 Write (MB/s) | 711 | 787 11% | 914 29% | 152.9 -78% | 1432 101% |
| Access Time Read * (ms) | 0.125 | 0.065 48% | 0.05 60% | 0.183 -46% | 0.065 48% |
| Access Time Write * (ms) | 0.138 | 0.047 66% | 0.034 75% | 0.248 -80% | 0.026 81% |
| Score Read (Points) | 910 | 472 -48% | 1193 31% | 463 -49% | 1621 78% |
| Score Write (Points) | 887 | 992 12% | 1175 32% | 245 -72% | 1794 102% |
| Score Total (Points) | 2254 | 1717 -24% | 2938 30% | 913 -59% | 4208 87% |
| Copy ISO MB/s (MB/s) | 1103 | 942 -15% | 2104 91% | 263.6 -76% | |
| Copy Program MB/s (MB/s) | 537 | 444.5 -17% | 387.7 -28% | 213.8 -60% | |
| Copy Game MB/s (MB/s) | 997 | 867 -13% | 1021 2% | 188 -81% |
* ... Meglio usare valori piccoli

| 3DMark 11 Performance | 18059 punti | |
| 3DMark Cloud Gate Standard Score | 36975 punti | |
| 3DMark Fire Strike Score | 13483 punti | |
| 3DMark Time Spy Score | 5825 punti | |
Aiuto | ||
| Shadow of the Tomb Raider - 1920x1080 Highest Preset AA:T | |
| Zotac GeForce GTX 1660 Ti 6 GB | |
| Dell G7 7590 | |
| Media NVIDIA GeForce GTX 1660 Ti Mobile (62 - 73, n=8) | |
| MSI GL73 8SE-010US | |
| MSI GF65 9SD | |
| Asus ROG Zephyrus G15 GA502DU | |
| MSI GF75 Thin 9SC | |
| basso | medio | alto | ultra | |
|---|---|---|---|---|
| BioShock Infinite (2013) | 317.1 | 264 | 250.9 | 128.6 |
| The Witcher 3 (2015) | 287.9 | 191.6 | 116 | 60.6 |
| Shadow of the Tomb Raider (2018) | 135 | 81 | 72 | 64 |
| MSI GF65 9SD GeForce GTX 1660 Ti Mobile, i7-9750H, Kingston RBUSNS8154P3512GJ | MSI GF63 8RC GeForce GTX 1050 Mobile, i5-8300H, Seagate BarraCuda Pro Compute 1TB ST1000LM049 | Lenovo Legion Y540-15IRH-81SX00B2GE GeForce GTX 1660 Ti Mobile, i7-9750H, WDC PC SN720 SDAPNTW-512G | Dell G7 7590 GeForce RTX 2060 Mobile, i7-9750H, Toshiba BG3 KBG30ZMS256G | Aorus 15-SA GeForce GTX 1660 Ti Mobile, i7-9750H, Intel SSD 760p SSDPEKKW512G8 | Asus ROG Zephyrus G15 GA502DU GeForce GTX 1660 Ti Max-Q, R7 3750H, Intel SSD 660p SSDPEKNW512G8 | |
|---|---|---|---|---|---|---|
| Noise | 6% | 12% | 5% | -7% | 3% | |
| off /ambiente * (dB) | 28.7 | 28 2% | 29.3 -2% | 28.4 1% | 29 -1% | 28 2% |
| Idle Minimum * (dB) | 33.3 | 33.8 -2% | 29.3 12% | 29.5 11% | 32 4% | 29.4 12% |
| Idle Average * (dB) | 33.9 | 34 -0% | 29.3 14% | 29.6 13% | 35 -3% | 31.9 6% |
| Idle Maximum * (dB) | 33.9 | 34.2 -1% | 29.3 14% | 29.6 13% | 41 -21% | 33 3% |
| Load Average * (dB) | 41 | 37.3 9% | 35.7 13% | 45 -10% | 54 -32% | 41.2 -0% |
| Witcher 3 ultra * (dB) | 49.5 | 43.4 12% | 44.2 11% | 51.5 -4% | 52 -5% | 53.8 -9% |
| Load Maximum * (dB) | 59.5 | 46 23% | 45.6 23% | 53 11% | 56 6% | 55.7 6% |
* ... Meglio usare valori piccoli
Rumorosità
| Idle |
| 33.3 / 33.9 / 33.9 dB(A) |
| Sotto carico |
| 41 / 59.5 dB(A) |
 | ||
30 dB silenzioso 40 dB(A) udibile 50 dB(A) rumoroso |
||
min: | ||
(-) La temperatura massima sul lato superiore è di 52.8 °C / 127 F, rispetto alla media di 40.4 °C / 105 F, che varia da 21.2 a 68.8 °C per questa classe Gaming.
(-) Il lato inferiore si riscalda fino ad un massimo di 53 °C / 127 F, rispetto alla media di 43.2 °C / 110 F
(+) In idle, la temperatura media del lato superiore è di 26.5 °C / 80 F, rispetto alla media deld ispositivo di 33.9 °C / 93 F.
(±) Riproducendo The Witcher 3, la temperatura media per il lato superiore e' di 33.4 °C / 92 F, rispetto alla media del dispositivo di 33.9 °C / 93 F.
(+) I poggiapolsi e il touchpad sono piu' freddi della temperatura della pelle con un massimo di 26.2 °C / 79.2 F e sono quindi freddi al tatto.
(+) La temperatura media della zona del palmo della mano di dispositivi simili e'stata di 28.8 °C / 83.8 F (+2.6 °C / 4.6 F).
MSI GF65 9SD analisi audio
(+) | gli altoparlanti sono relativamente potenti (84.6 dB)
Bassi 100 - 315 Hz
(-) | quasi nessun basso - in media 19.5% inferiori alla media
(-) | bassi non lineari (15.4% delta rispetto alla precedente frequenza)
Medi 400 - 2000 Hz
(+) | medi bilanciati - solo only 1.9% rispetto alla media
(+) | medi lineari (5.8% delta rispetto alla precedente frequenza)
Alti 2 - 16 kHz
(+) | Alti bilanciati - appena 2.5% dalla media
(±) | la linearità degli alti è media (10.5% delta rispetto alla precedente frequenza)
Nel complesso 100 - 16.000 Hz
(±) | la linearità complessiva del suono è media (17.4% di differenza rispetto alla media
Rispetto alla stessa classe
» 48% di tutti i dispositivi testati in questa classe è stato migliore, 12% simile, 40% peggiore
» Il migliore ha avuto un delta di 6%, medio di 18%, peggiore di 132%
Rispetto a tutti i dispositivi testati
» 33% di tutti i dispositivi testati in questa classe è stato migliore, 8% similare, 59% peggiore
» Il migliore ha avuto un delta di 4%, medio di 24%, peggiore di 134%
Apple MacBook 12 (Early 2016) 1.1 GHz analisi audio
(+) | gli altoparlanti sono relativamente potenti (83.6 dB)
Bassi 100 - 315 Hz
(±) | bassi ridotti - in media 11.3% inferiori alla media
(±) | la linearità dei bassi è media (14.2% delta rispetto alla precedente frequenza)
Medi 400 - 2000 Hz
(+) | medi bilanciati - solo only 2.4% rispetto alla media
(+) | medi lineari (5.5% delta rispetto alla precedente frequenza)
Alti 2 - 16 kHz
(+) | Alti bilanciati - appena 2% dalla media
(+) | alti lineari (4.5% delta rispetto alla precedente frequenza)
Nel complesso 100 - 16.000 Hz
(+) | suono nel complesso lineare (10.2% differenza dalla media)
Rispetto alla stessa classe
» 7% di tutti i dispositivi testati in questa classe è stato migliore, 2% simile, 91% peggiore
» Il migliore ha avuto un delta di 5%, medio di 18%, peggiore di 53%
Rispetto a tutti i dispositivi testati
» 5% di tutti i dispositivi testati in questa classe è stato migliore, 1% similare, 94% peggiore
» Il migliore ha avuto un delta di 4%, medio di 24%, peggiore di 134%
| Off / Standby | |
| Idle | |
| Sotto carico |
|
Leggenda:
min: | |
| MSI GF65 9SD i7-9750H, GeForce GTX 1660 Ti Mobile, Kingston RBUSNS8154P3512GJ, IPS, 1920x1080, 15.6" | Asus ROG Zephyrus G15 GA502DU R7 3750H, GeForce GTX 1660 Ti Max-Q, Intel SSD 660p SSDPEKNW512G8, IPS, 1920x1080, 15.6" | MSI GF63 8RC i5-8300H, GeForce GTX 1050 Mobile, Seagate BarraCuda Pro Compute 1TB ST1000LM049, IPS, 1920x1080, 15.6" | Aorus 15-SA i7-9750H, GeForce GTX 1660 Ti Mobile, Intel SSD 760p SSDPEKKW512G8, IPS, 1920x1080, 15.6" | Dell G7 7590 i7-9750H, GeForce RTX 2060 Mobile, Toshiba BG3 KBG30ZMS256G, IPS, 1920x1080, 15.6" | Lenovo Legion Y7000P-1060 i7-8750H, GeForce GTX 1060 Mobile, Samsung SSD PM981 MZVLB256HAHQ, IPS, 1920x1080, 15.6" | |
|---|---|---|---|---|---|---|
| Power Consumption | 6% | 29% | -38% | -35% | 14% | |
| Idle Minimum * (Watt) | 9.5 | 7.4 22% | 5.4 43% | 20 -111% | 11.2 -18% | 4.9 48% |
| Idle Average * (Watt) | 12.4 | 8.6 31% | 10.4 16% | 23 -85% | 16.3 -31% | 8.1 35% |
| Idle Maximum * (Watt) | 22 | 39.1 -78% | 10.5 52% | 29 -32% | 46.2 -110% | 16.5 25% |
| Load Average * (Watt) | 80.8 | 65.9 18% | 84.7 -5% | 87 -8% | 123.3 -53% | 109.2 -35% |
| Witcher 3 ultra * (Watt) | 133.9 | 106.9 20% | 92.7 31% | 136 -2% | 135.6 -1% | 124.6 7% |
| Load Maximum * (Watt) | 187.1 | 141.3 24% | 119.9 36% | 173 8% | 181.5 3% | 175.2 6% |
* ... Meglio usare valori piccoli
| MSI GF65 9SD i7-9750H, GeForce GTX 1660 Ti Mobile, 51 Wh | Asus ROG Zephyrus G15 GA502DU R7 3750H, GeForce GTX 1660 Ti Max-Q, 76 Wh | MSI GF63 8RC i5-8300H, GeForce GTX 1050 Mobile, 51 Wh | Lenovo Legion Y540-15IRH-81SX00B2GE i7-9750H, GeForce GTX 1660 Ti Mobile, 57 Wh | Dell G7 7590 i7-9750H, GeForce RTX 2060 Mobile, 60 Wh | Aorus 15-SA i7-9750H, GeForce GTX 1660 Ti Mobile, 62 Wh | |
|---|---|---|---|---|---|---|
| Autonomia della batteria | 57% | 8% | -53% | -10% | -45% | |
| WiFi v1.3 (h) | 5.1 | 8 57% | 5.5 8% | 2.4 -53% | 4.6 -10% | 2.8 -45% |
| Reader / Idle (h) | 15.3 | 9.5 | 4 | 11.1 | 3.5 | |
| Load (h) | 2.1 | 0.9 | 1.3 | 1.8 | 2 |
Pro
Contro

L'aggiornamento più importante del vecchio GF63 è la GPU GTX 1660 Ti del GF65. Il GF63 è limitato alla GTX 1050 Ti che offre prestazioni grafiche inferiori di circa il 50% rispetto alla GTX 1660 Ti. La differenza in termini di gaming sarà tangibile.
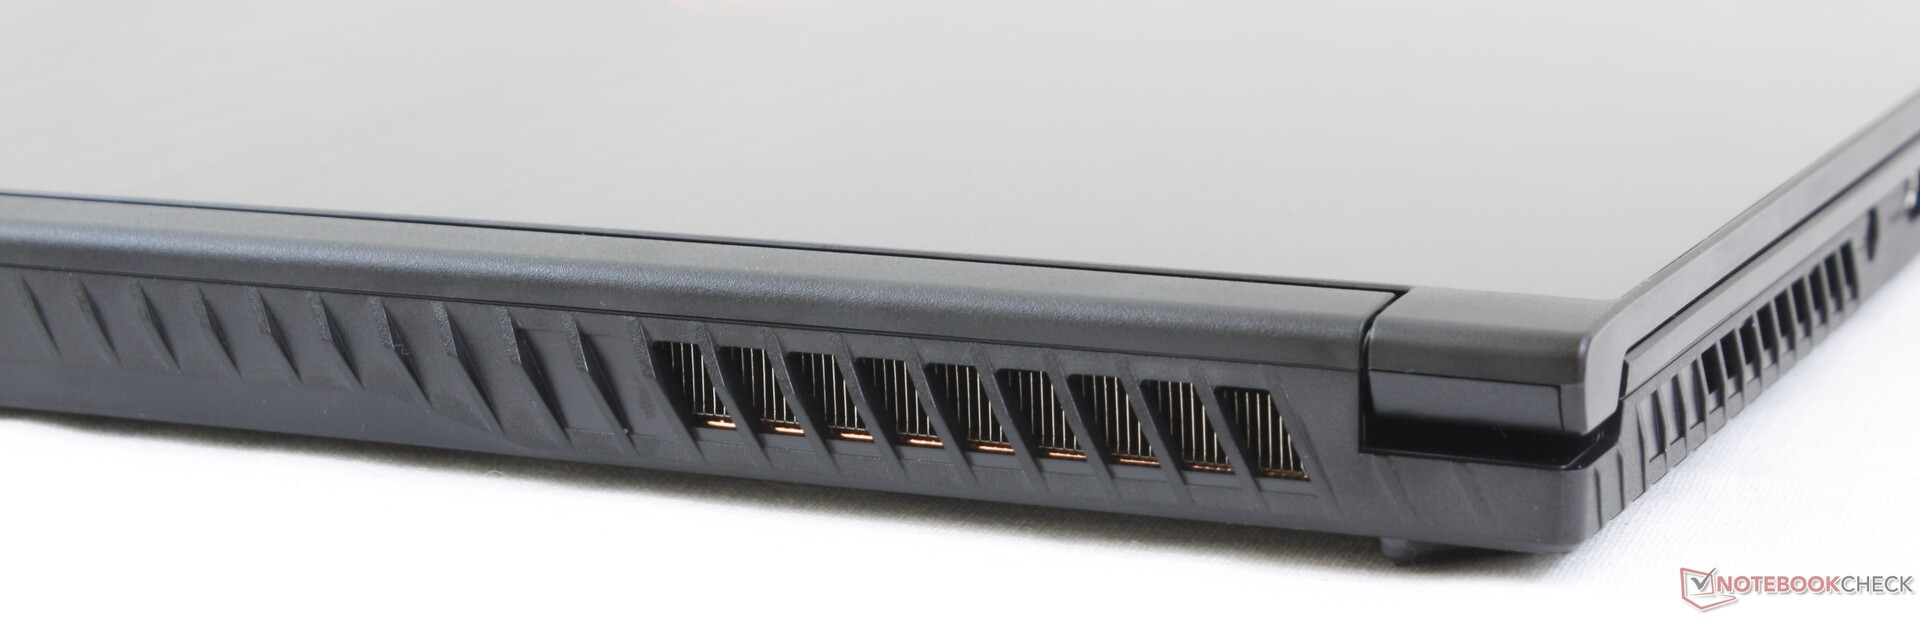
Oltre allo scambio di GPU, il GF65 presenta ulteriori slots M.2, opzioni di display a 120/144 Hz, ventole e tubi termici in rame sotto il cofano per accogliere le GPU più assetate di potenza. Quasi tutto il resto è quasi uguale, compresa la durata media della batteria, i tempi di risposta in bianco e nero, lo chassis economico, i grandi altoparlanti e la facilità di manutenzione moderatamente difficile. Un cambiamento importante, tuttavia, è il rumore della ventola perché il GF65 sarà più rumoroso del suo predecessore durante il gaming.
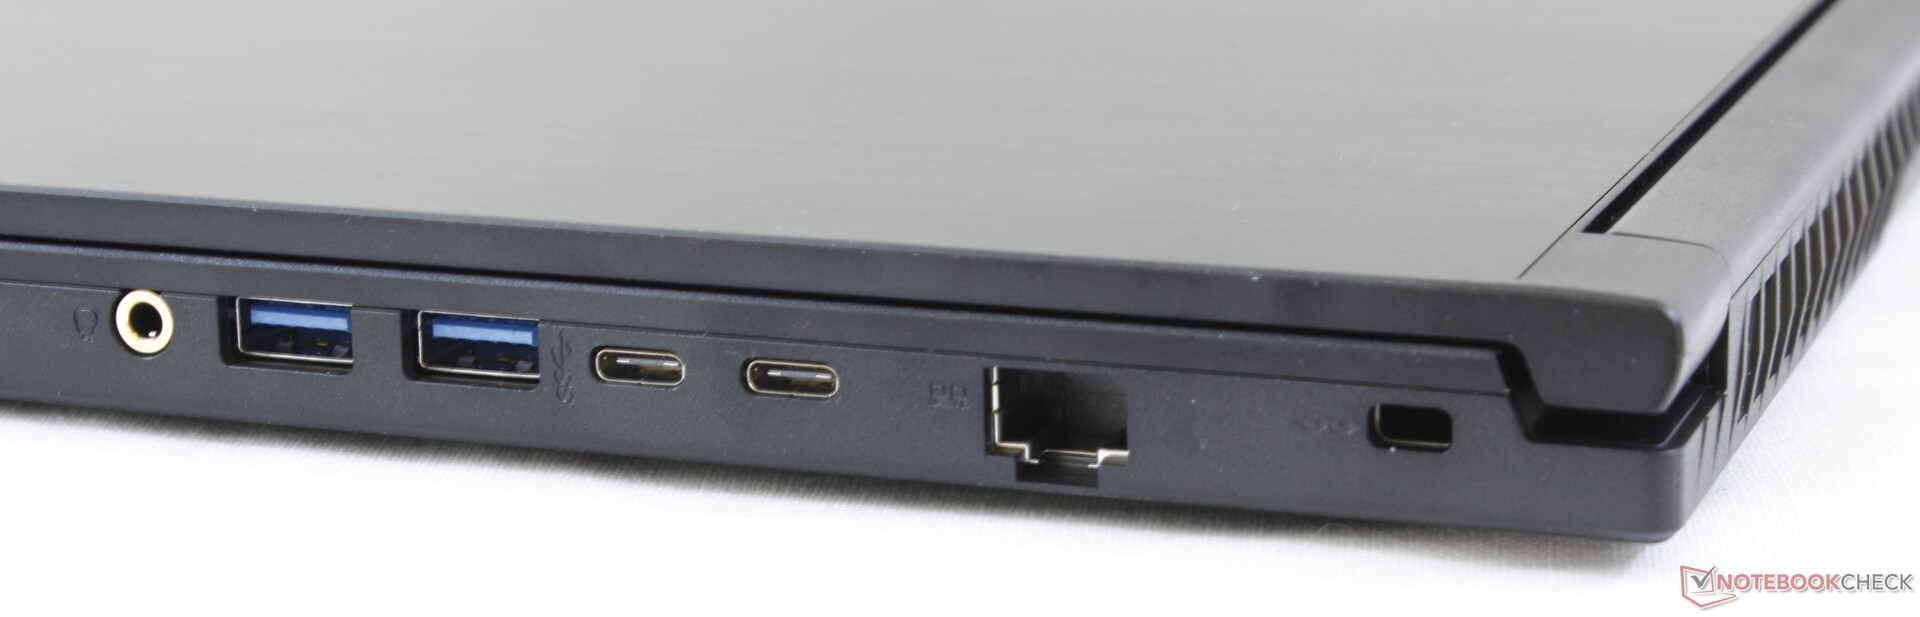
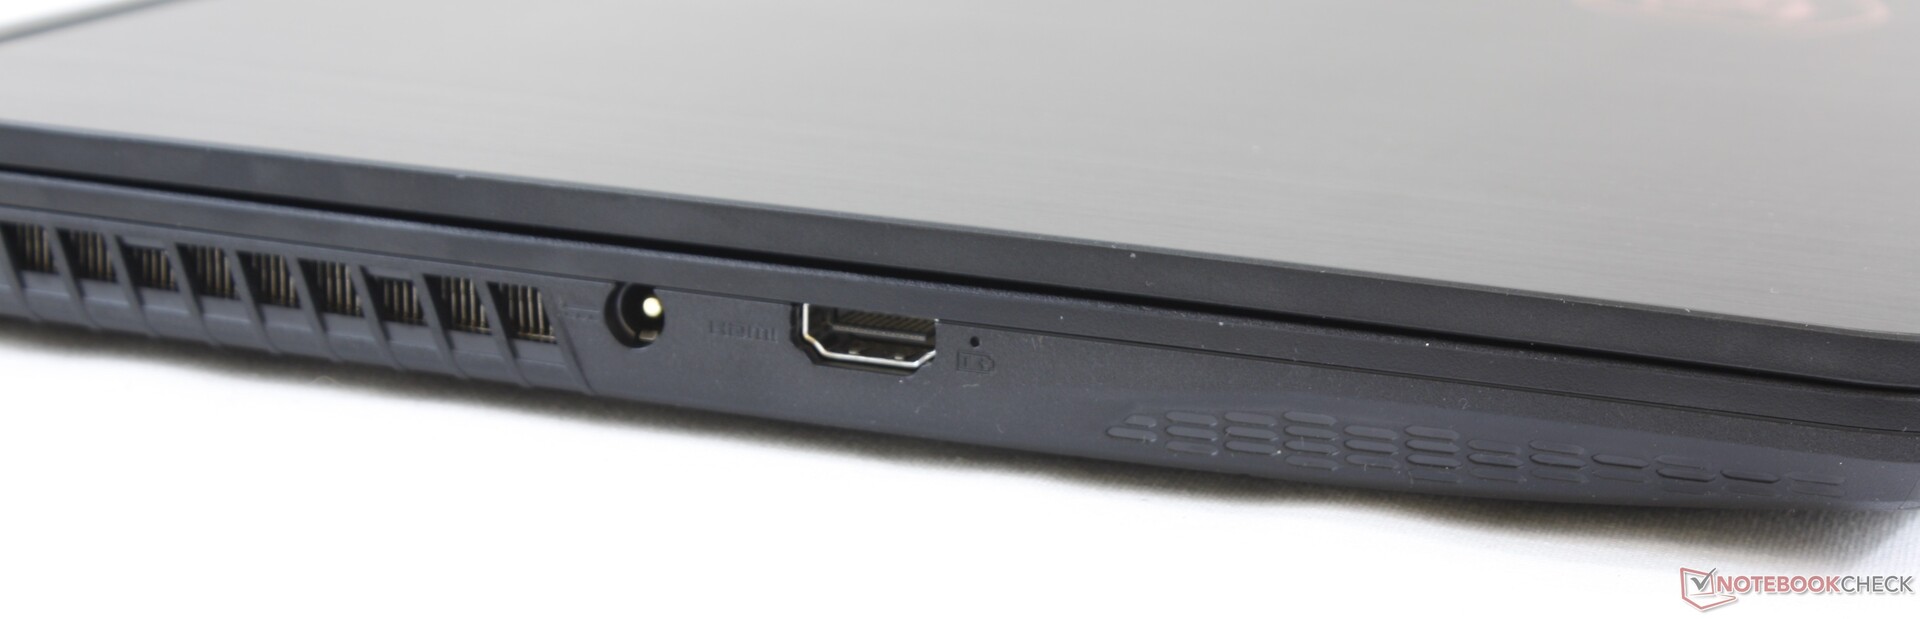
L'MSI GF65 GTX 1660 Ti che costa meno di 1.000 dollari offre molto, soprattutto se si considera che i portatili GTX 1060 più lenti sono stati lanciati a prezzi ancora più alti. Dovrete far fronte all'elevato rumore della ventola, al livello moderato di ghosting e al posizionamento non convenzionale delle porte.
MSI GF65 9SD
- 05/15/2020 v7 (old)
Allen Ngo
Price comparison
