Recensione del portatile MSI GF65 Thin 10UE: GeForce RTX 3060 con un prezzo contenuto
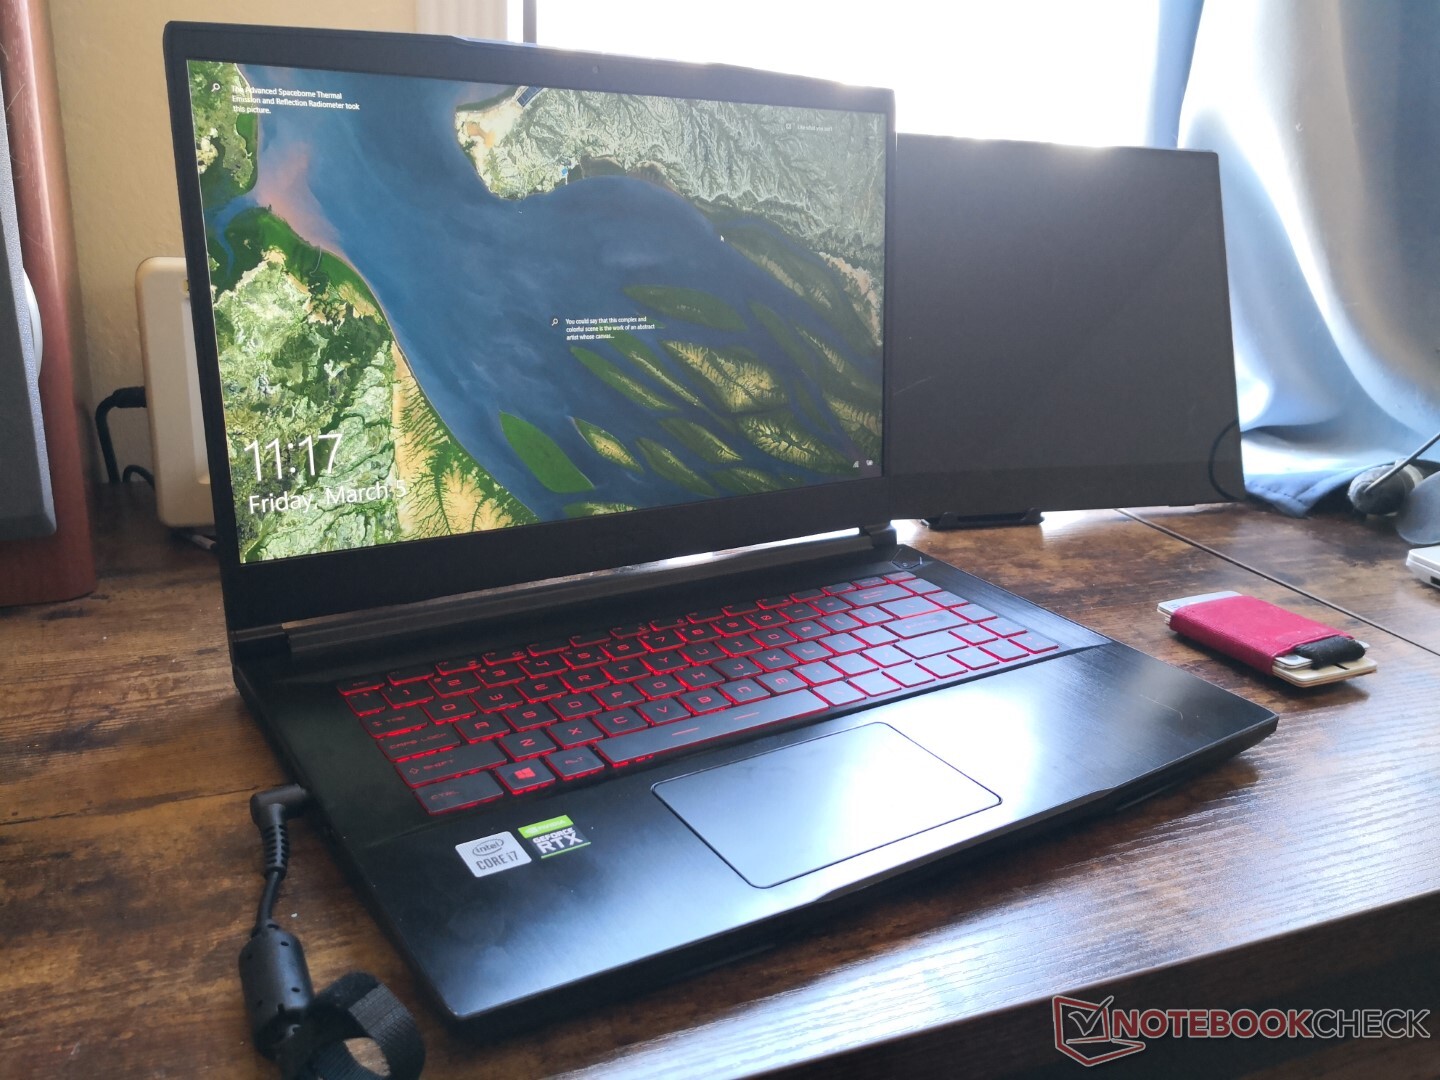
L'MSI GF65 è uno dei laptop per il gaming da 15,6 pollici meno costosi che si possano comprare con una GeForce RTX 3060. La nostra versione di test viene fornita con il Core i7-10750H di decima generazione, la GPU RTX 30, 32 GB di RAM e 1 TB di SSD Samsung per circa $1650 USD da CUKUSA. Tuttavia, meno RAM, storage e opzioni Core i5 sono disponibili per prezzi molto più bassi a partire da 999 dollari.
Esternamente, il GF65 10UE ha lo stesso design dello chassis del GF65 9SD del 2020 e quindi molti dei nostri commenti sono ancora validi. Raccomandiamo di controllare la nostra recensione sulla versione 2020 per saperne di più sulle caratteristiche fisiche del portatile.
La serie MSI GF compete con altri portatili gaming economici come il Lenovo Legion 5, Dell G5, Acer Nitro 5, o la serie Asus TUF.
Altre recensioni su MSI:
Confronto con i potenziali concorrenti
Punteggio | Data | Modello | Peso | Altezza | Dimensione | Risoluzione | Prezzo |
|---|---|---|---|---|---|---|---|
| 80.4 % v7 (old) | 03/2021 | MSI GF65 Thin 10UE i7-10750H, GeForce RTX 3060 Laptop GPU | 1.9 kg | 21.7 mm | 15.60" | 1920x1080 | |
| 85 % v7 (old) | 02/2021 | Asus ROG Strix G15 G513QR R9 5900HX, GeForce RTX 3070 Laptop GPU | 2.3 kg | 27.2 mm | 15.60" | 1920x1080 | |
| 84.9 % v7 (old) | 03/2021 | Schenker XMG Core 15 Ampere R7 4800H, GeForce RTX 3060 Laptop GPU | 2 kg | 22.9 mm | 15.60" | 2560x1440 | |
| 84 % v7 (old) | 02/2021 | MSI GS66 Stealth 10UG i7-10870H, GeForce RTX 3070 Laptop GPU | 2.1 kg | 19.8 mm | 15.60" | 1920x1080 | |
| 86.4 % v7 (old) | 02/2021 | Aorus 15G XC i7-10870H, GeForce RTX 3070 Laptop GPU | 2.1 kg | 23 mm | 15.60" | 1920x1080 | |
| 86.3 % v7 (old) | 12/2020 | Lenovo Legion 7 15IMH05-81YT001VGE i9-10980HK, GeForce RTX 2080 Super Max-Q | 2.4 kg | 19.9 mm | 15.60" | 1920x1080 |
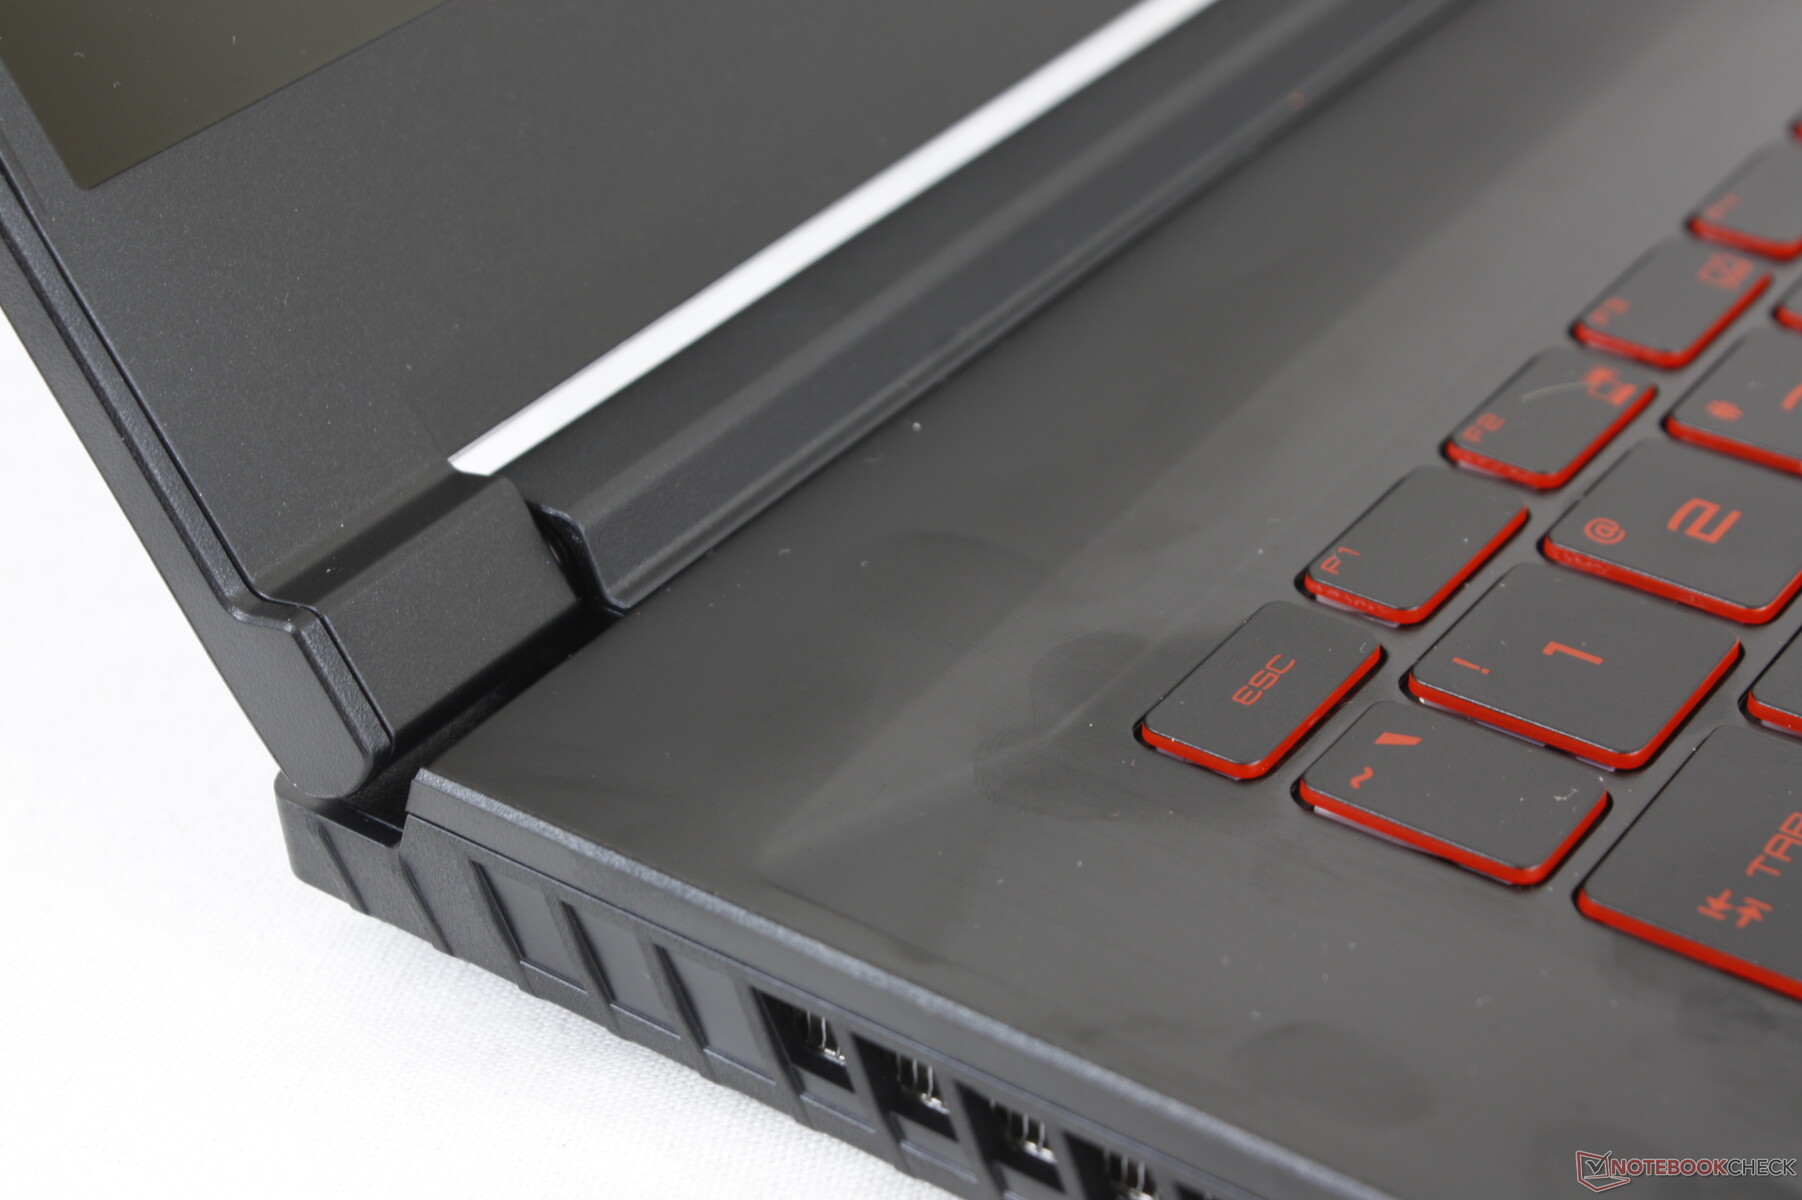
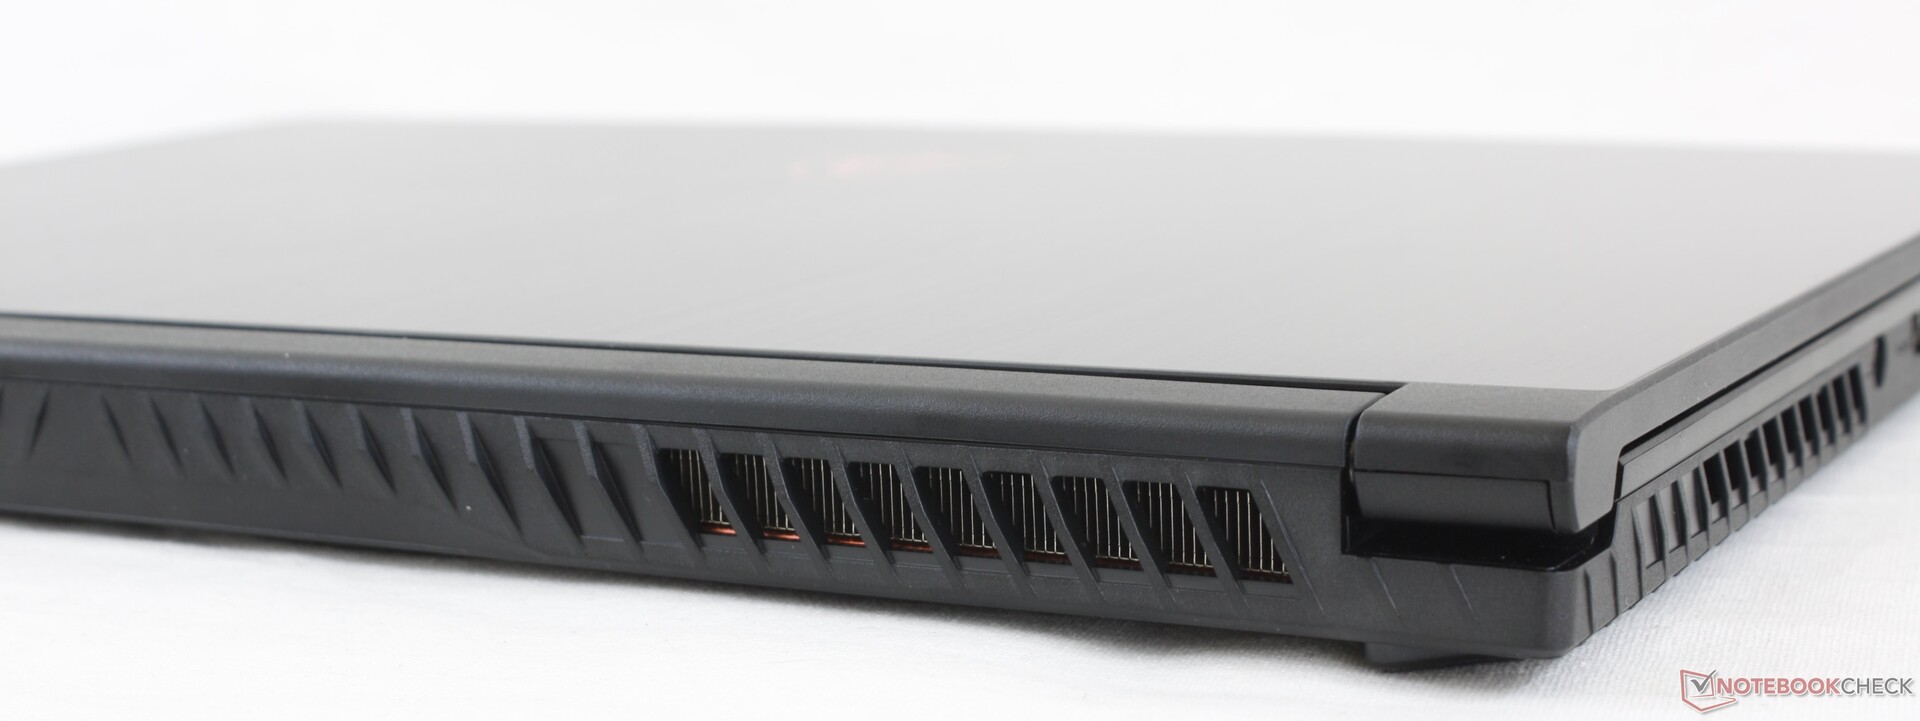
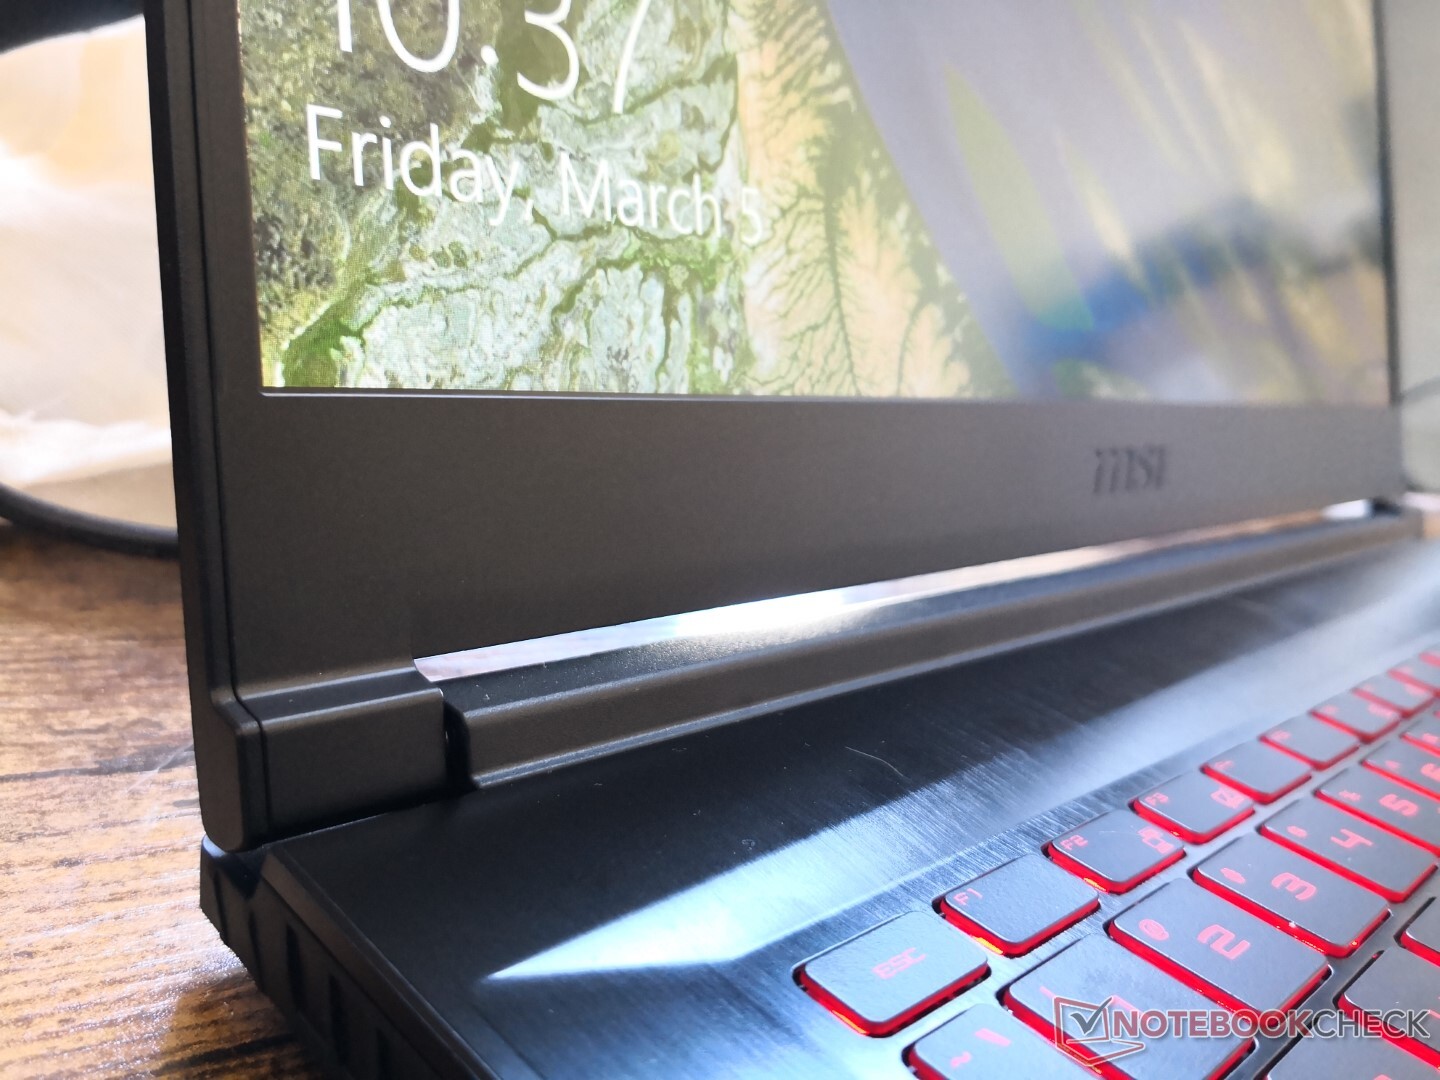
Case
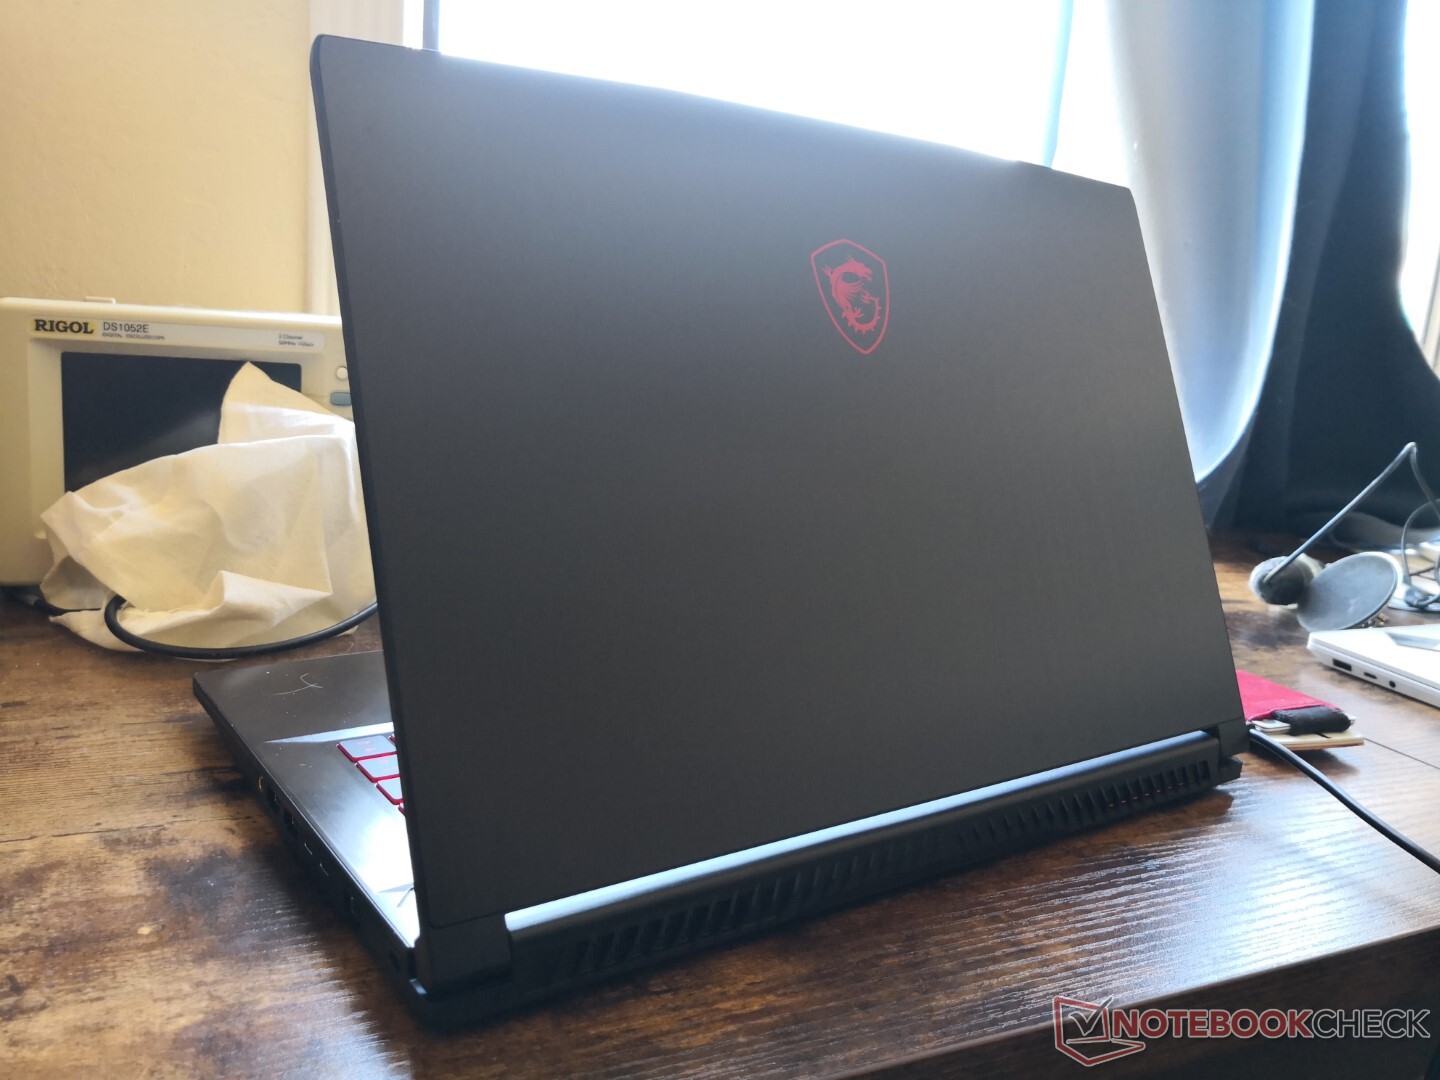
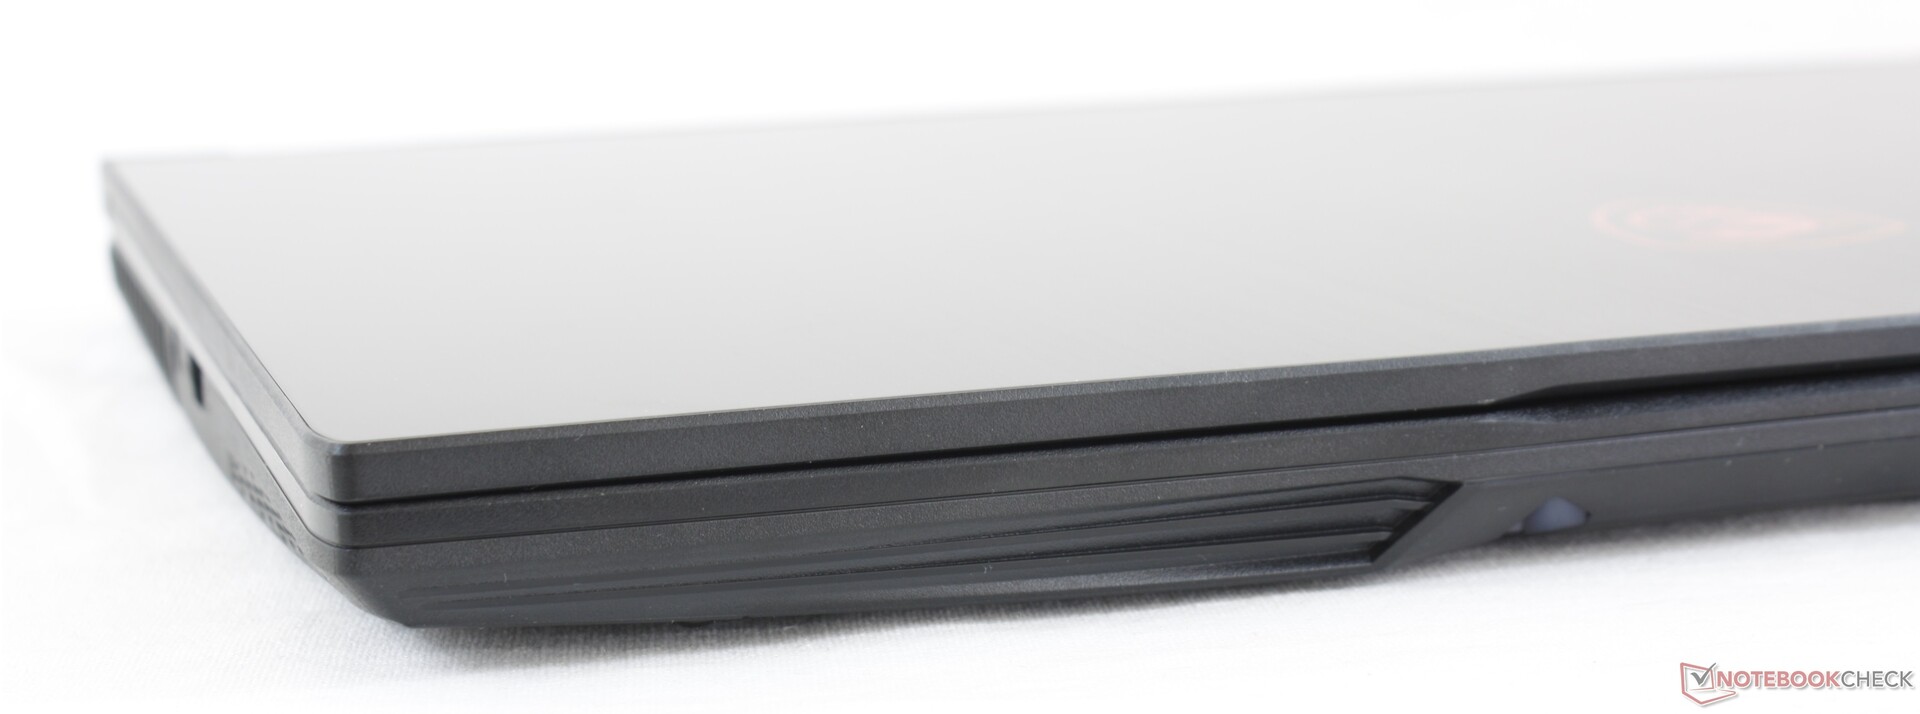
Le superfici sembrano sottili e si deformano più facilmente rispetto ai modelli di fascia alta della serie GE o GT di MSI. Il GF65 non appare così lussuoso come risultato, il che è da aspettarsi da un portatile da gioco entry-level. I modelli concorrenti Asus TUF, che sono leggermente più pesanti, appaiono più solidi.
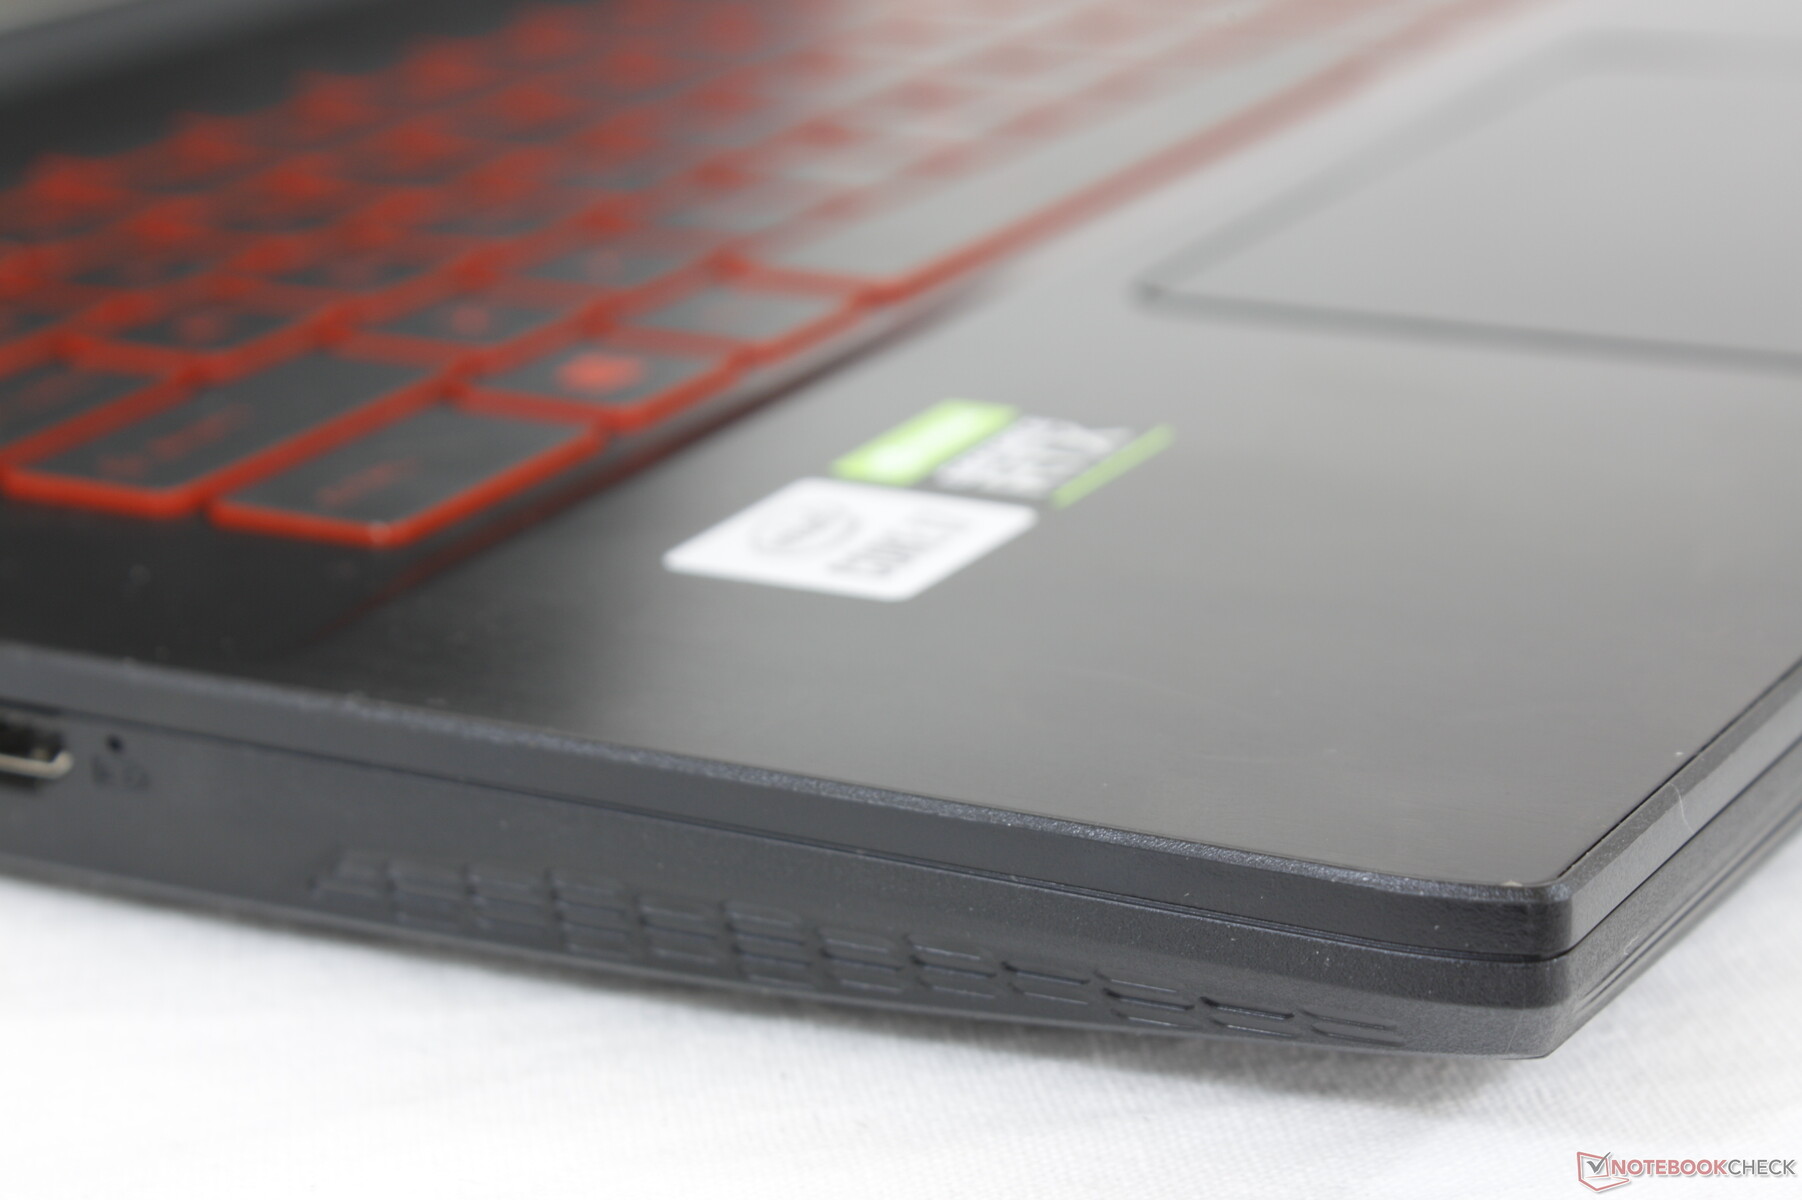
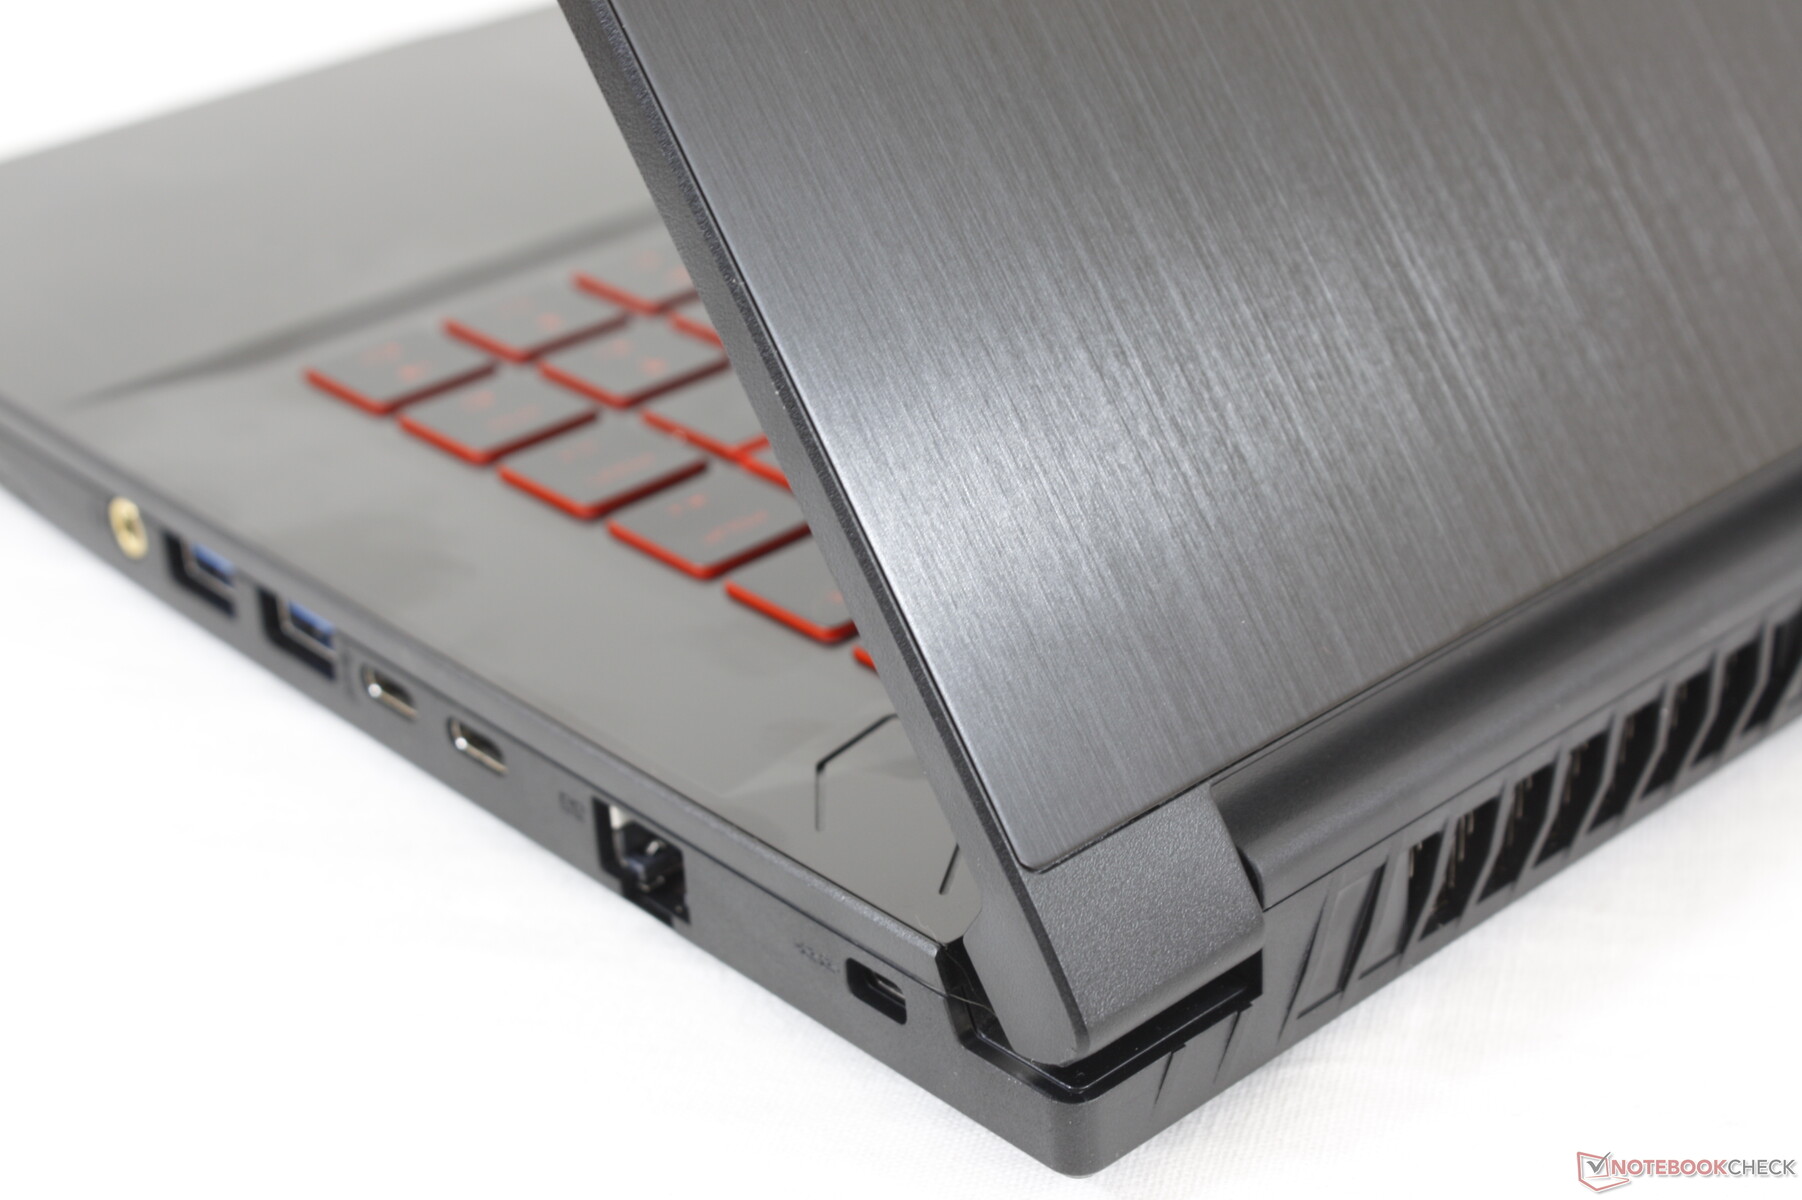
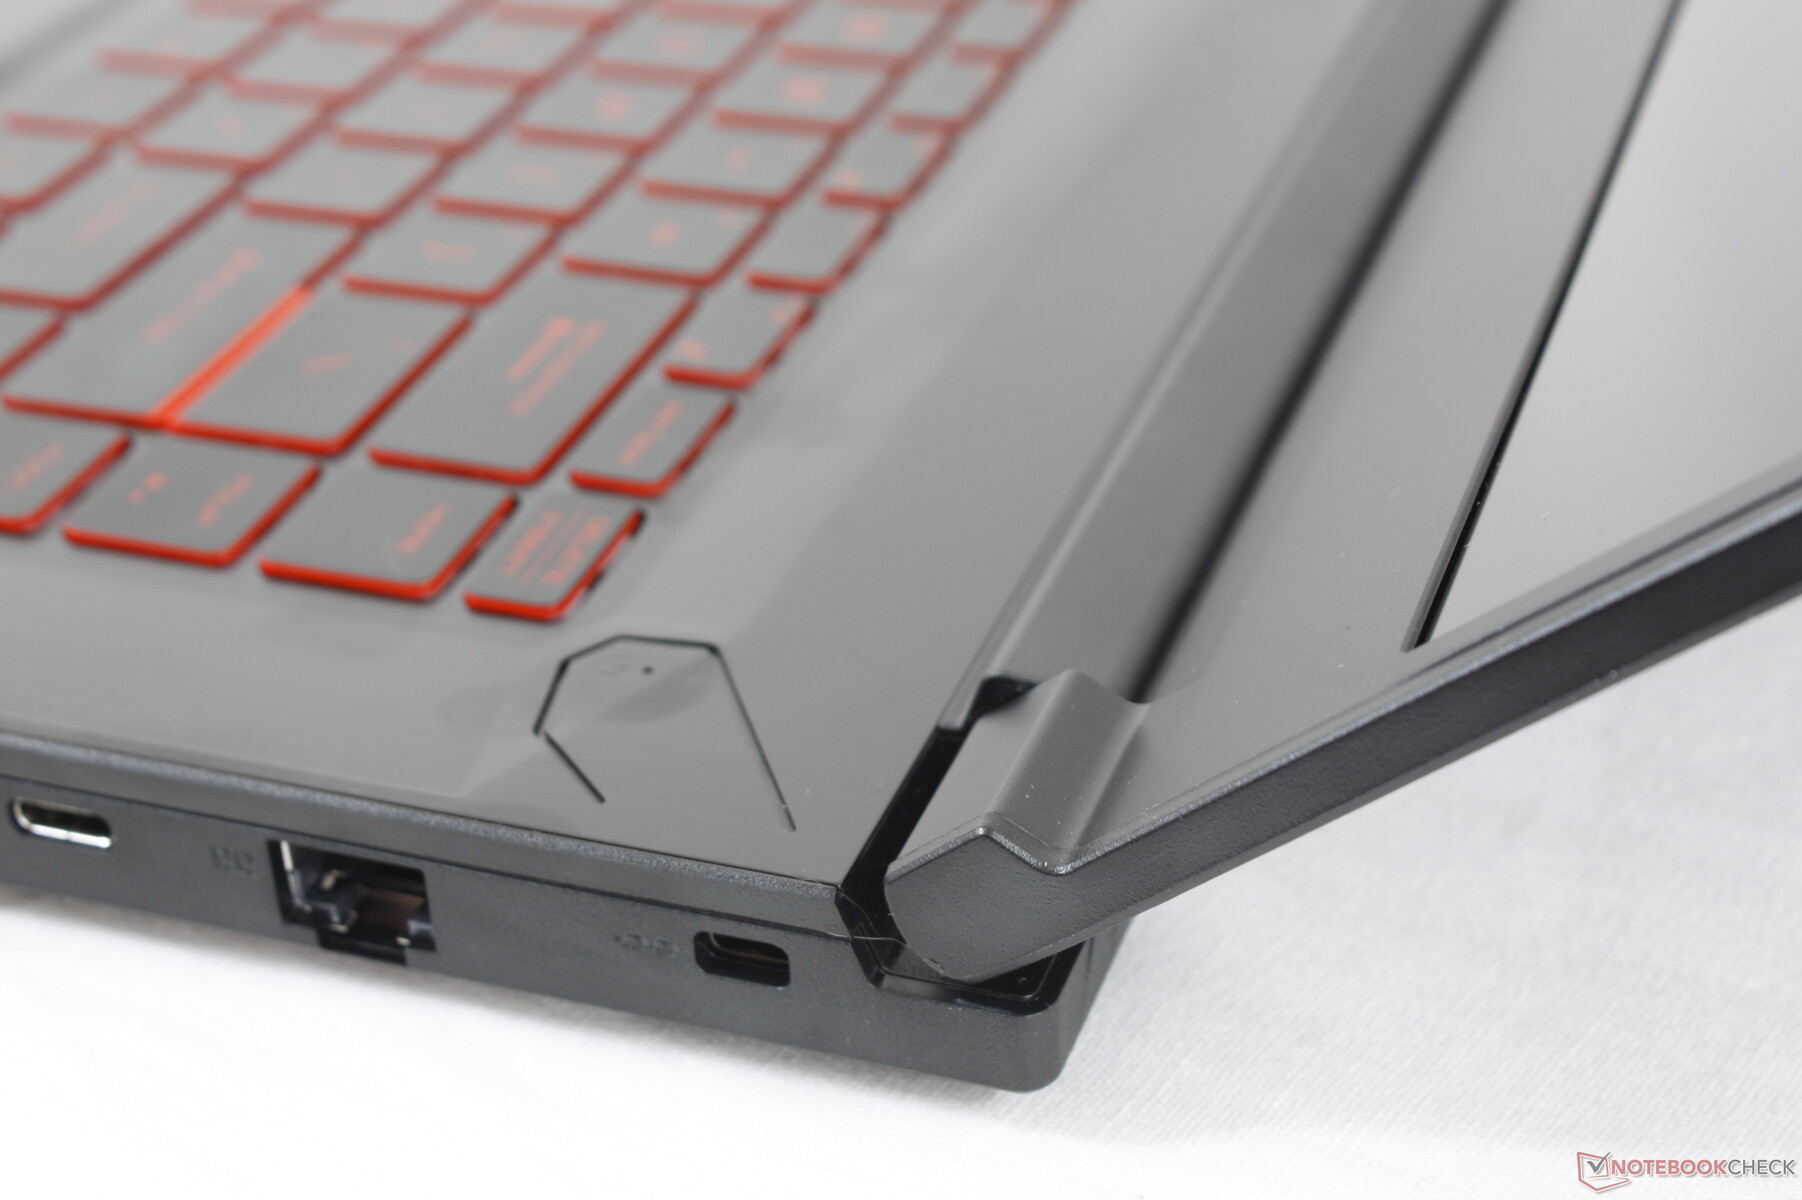
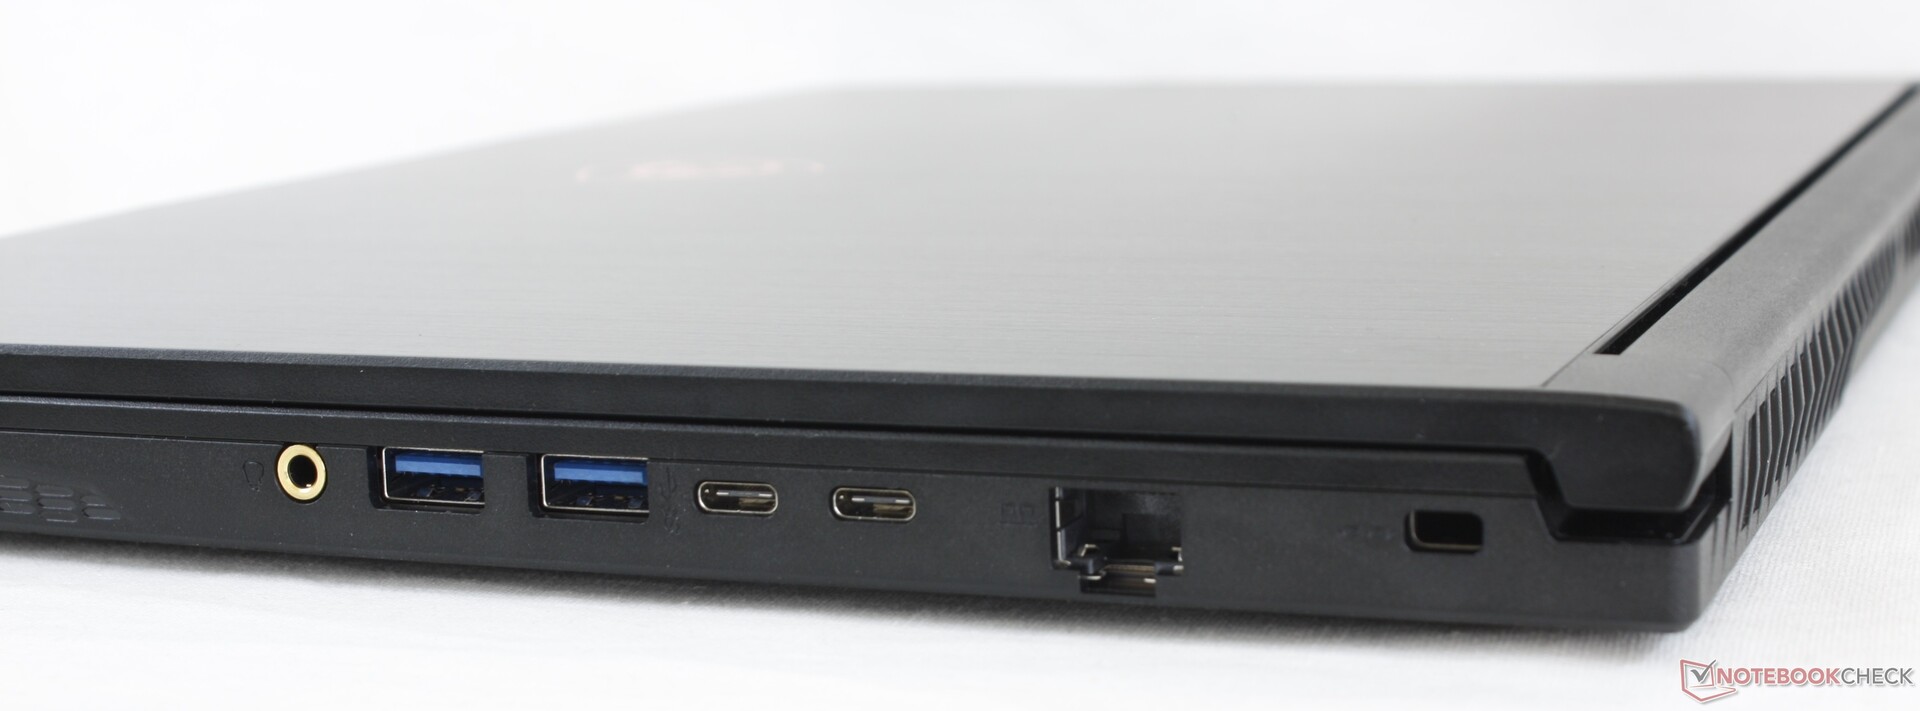
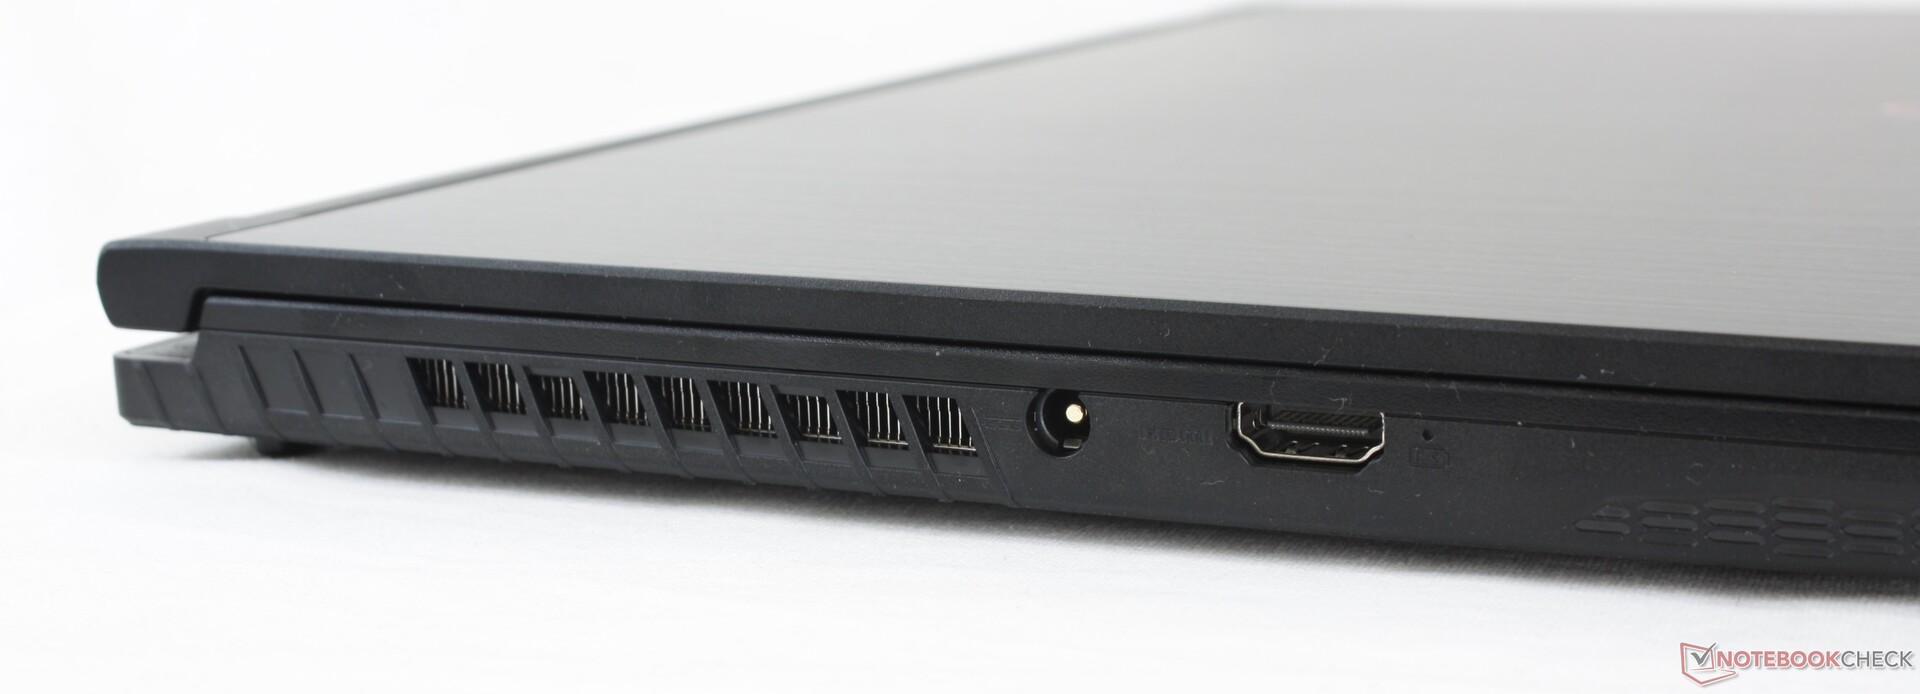
Connessioni
Le opzioni delle porte rimangono identiche tranne che per un cambiamento notevole: la porta HDMI 1.4 sul GF65 9SD dell'anno scorso è stata aggiornata a HDMI 2.0 per il pieno supporto di monitor esterni 4K60 FPS. Le porte USB-C continuano ad essere, tuttavia, incompatibili con i monitor esterni.
Comunicazioni
Moduli di comunicazione wired e wireless integrati, soluzioni alternative disponibili (UMTS)?, Irregolarità (ricezione radio)?
Webcam


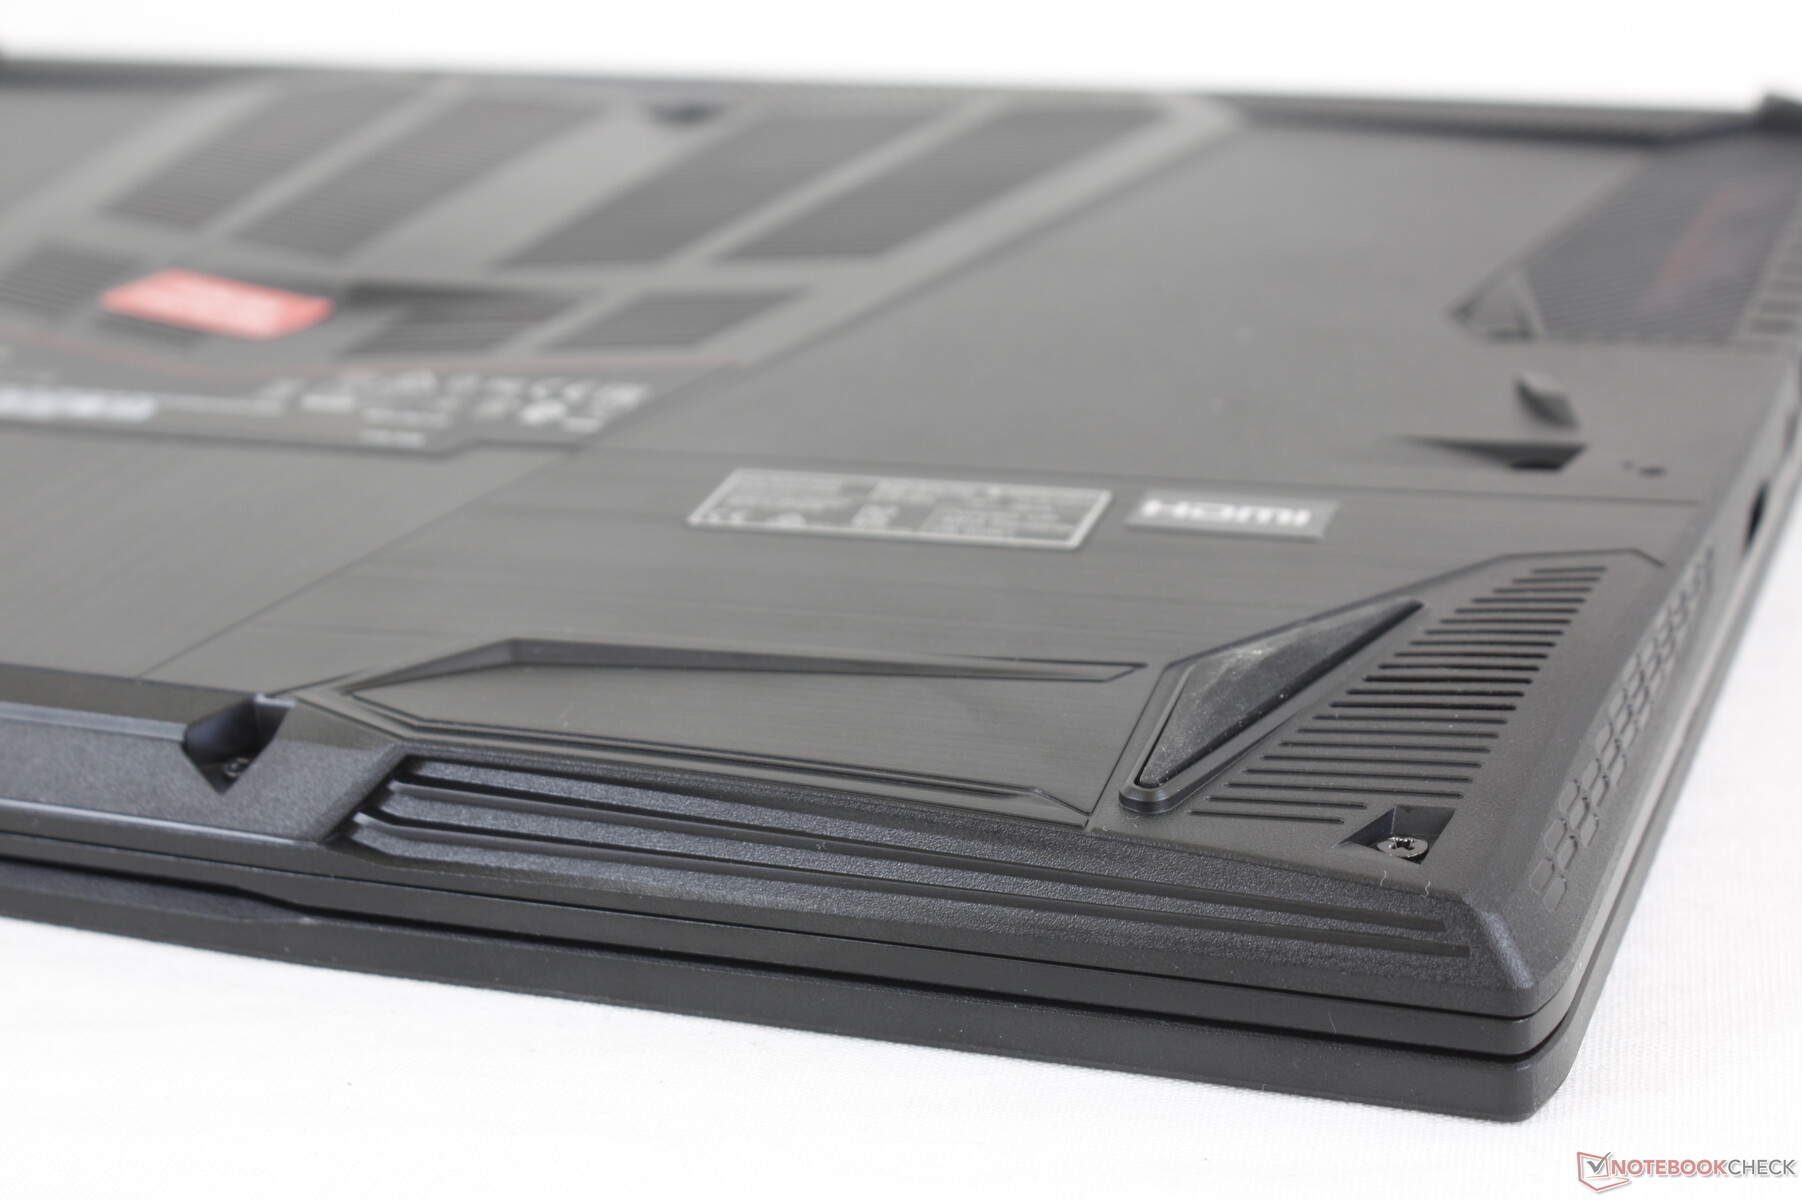
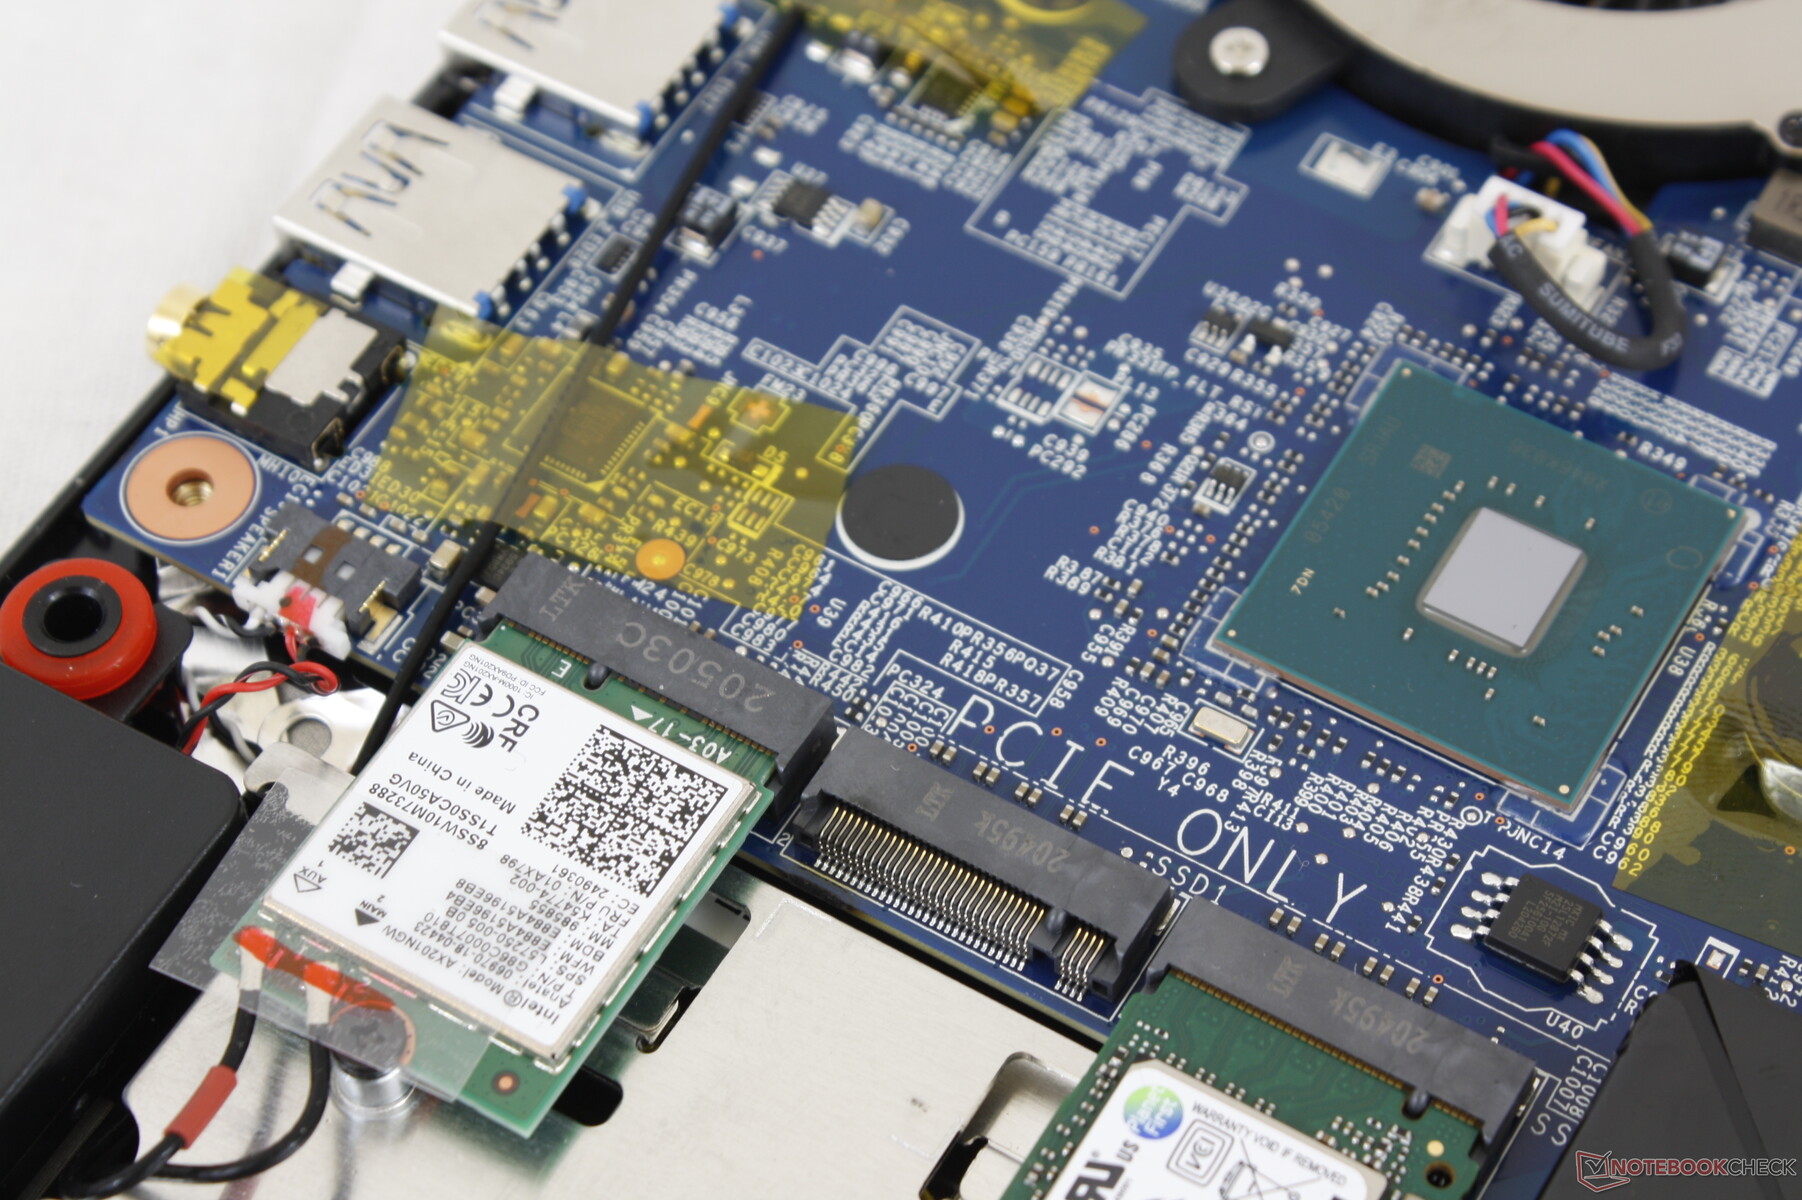
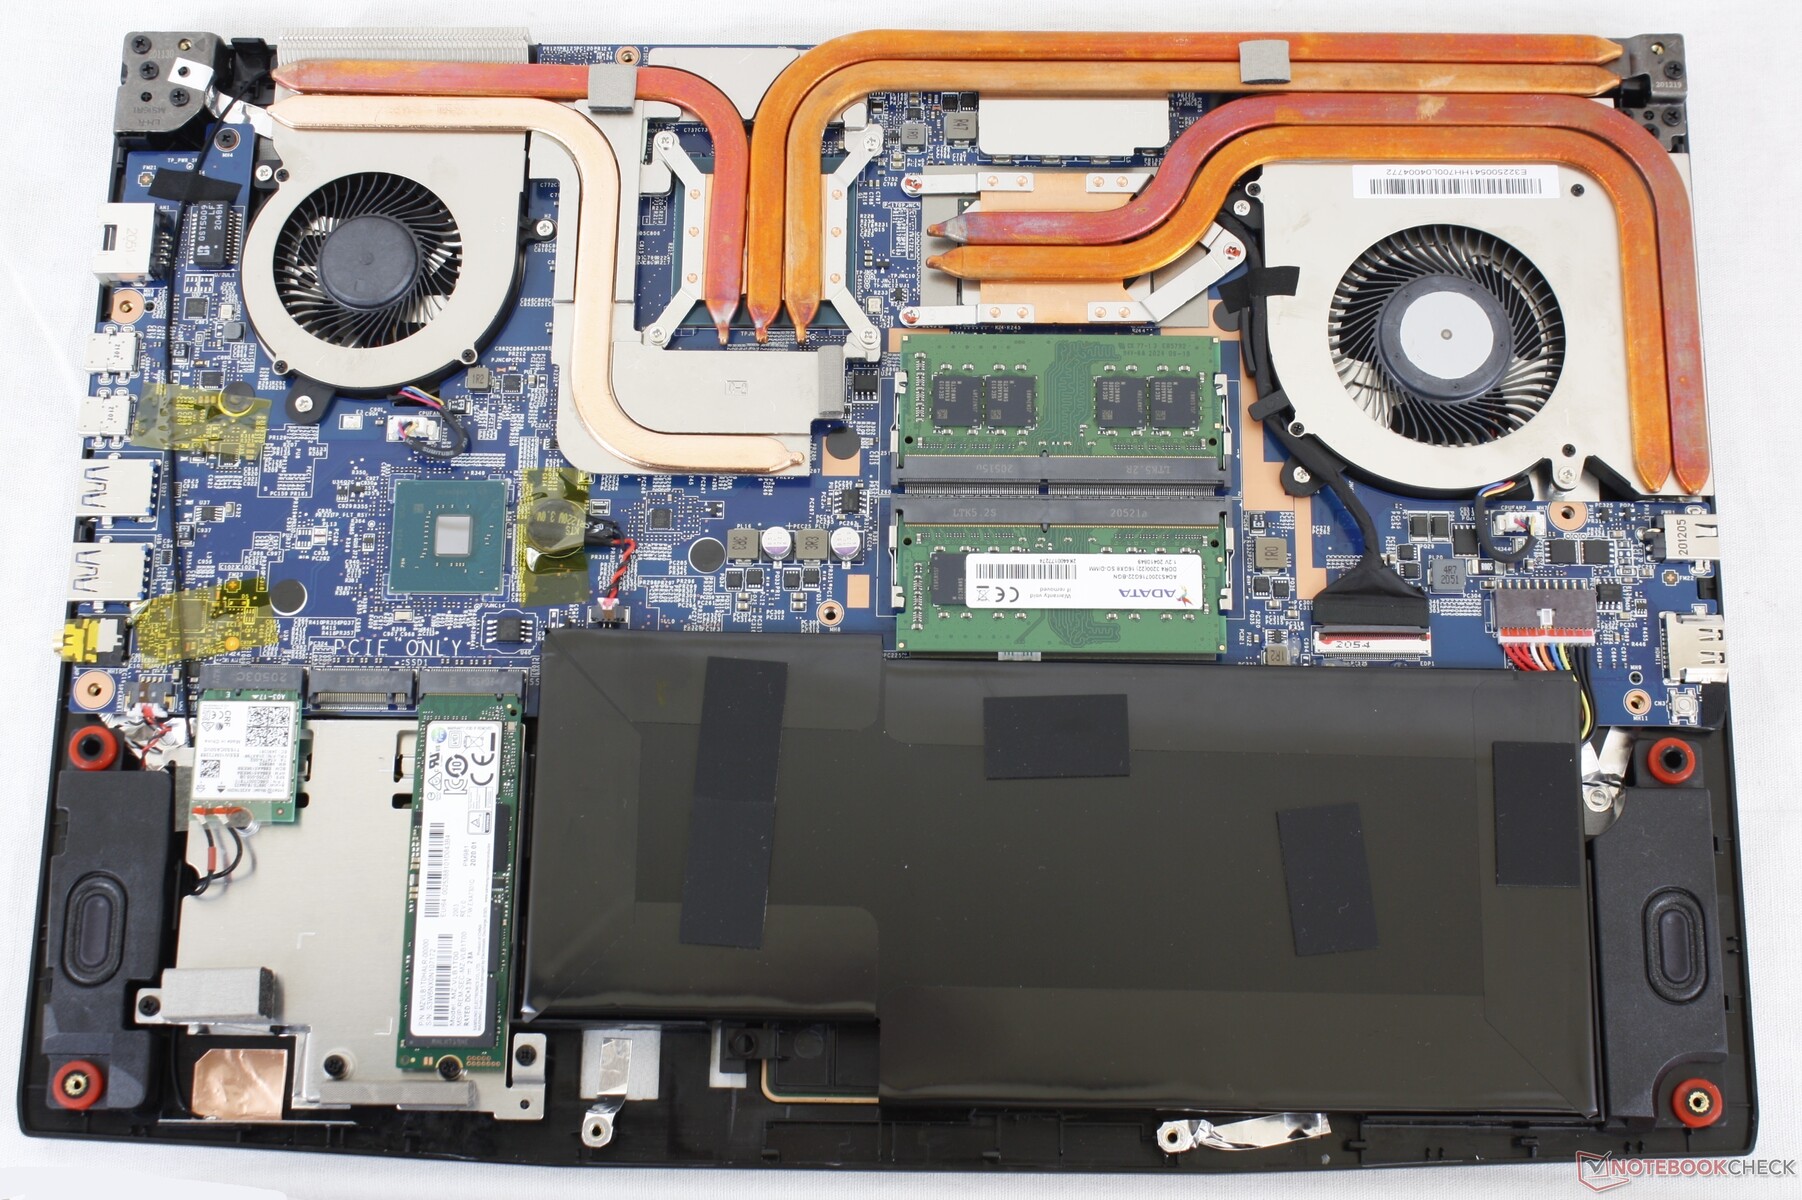
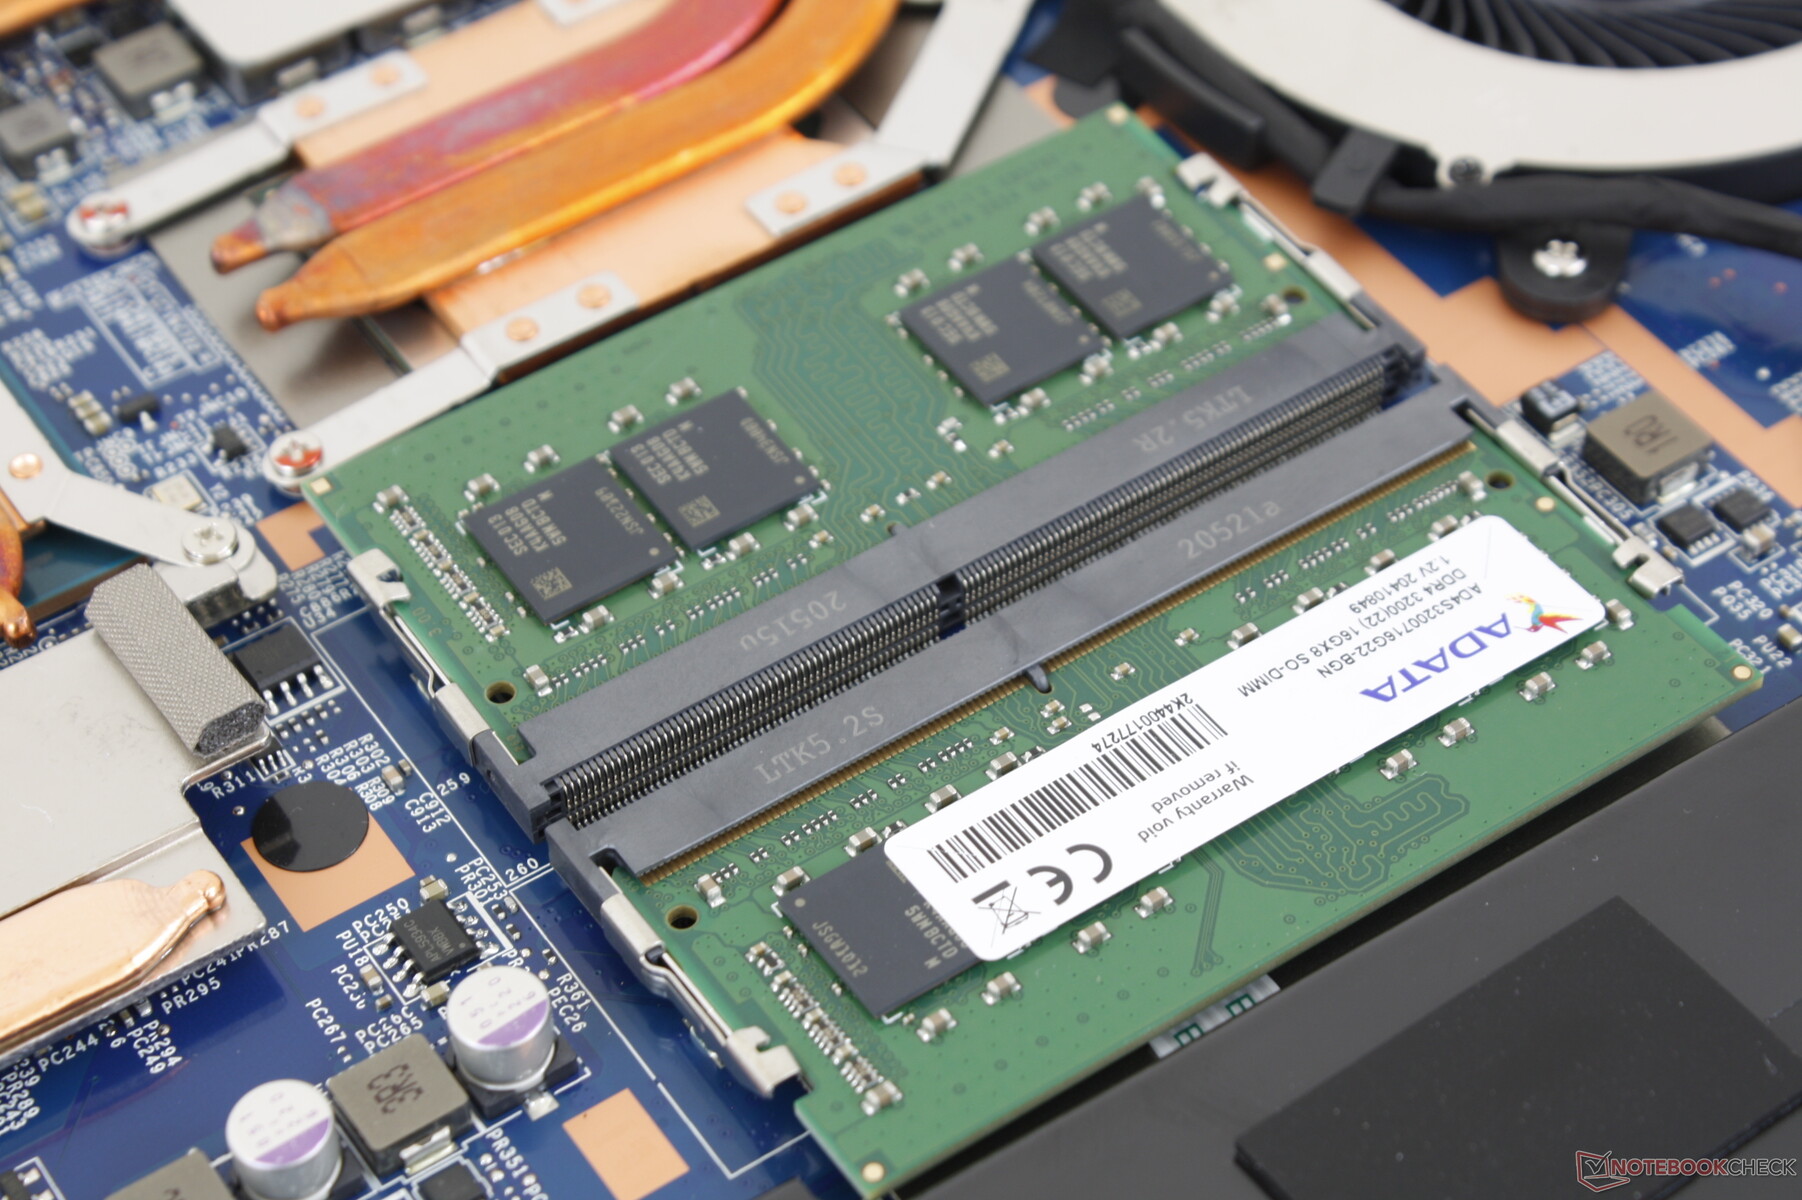
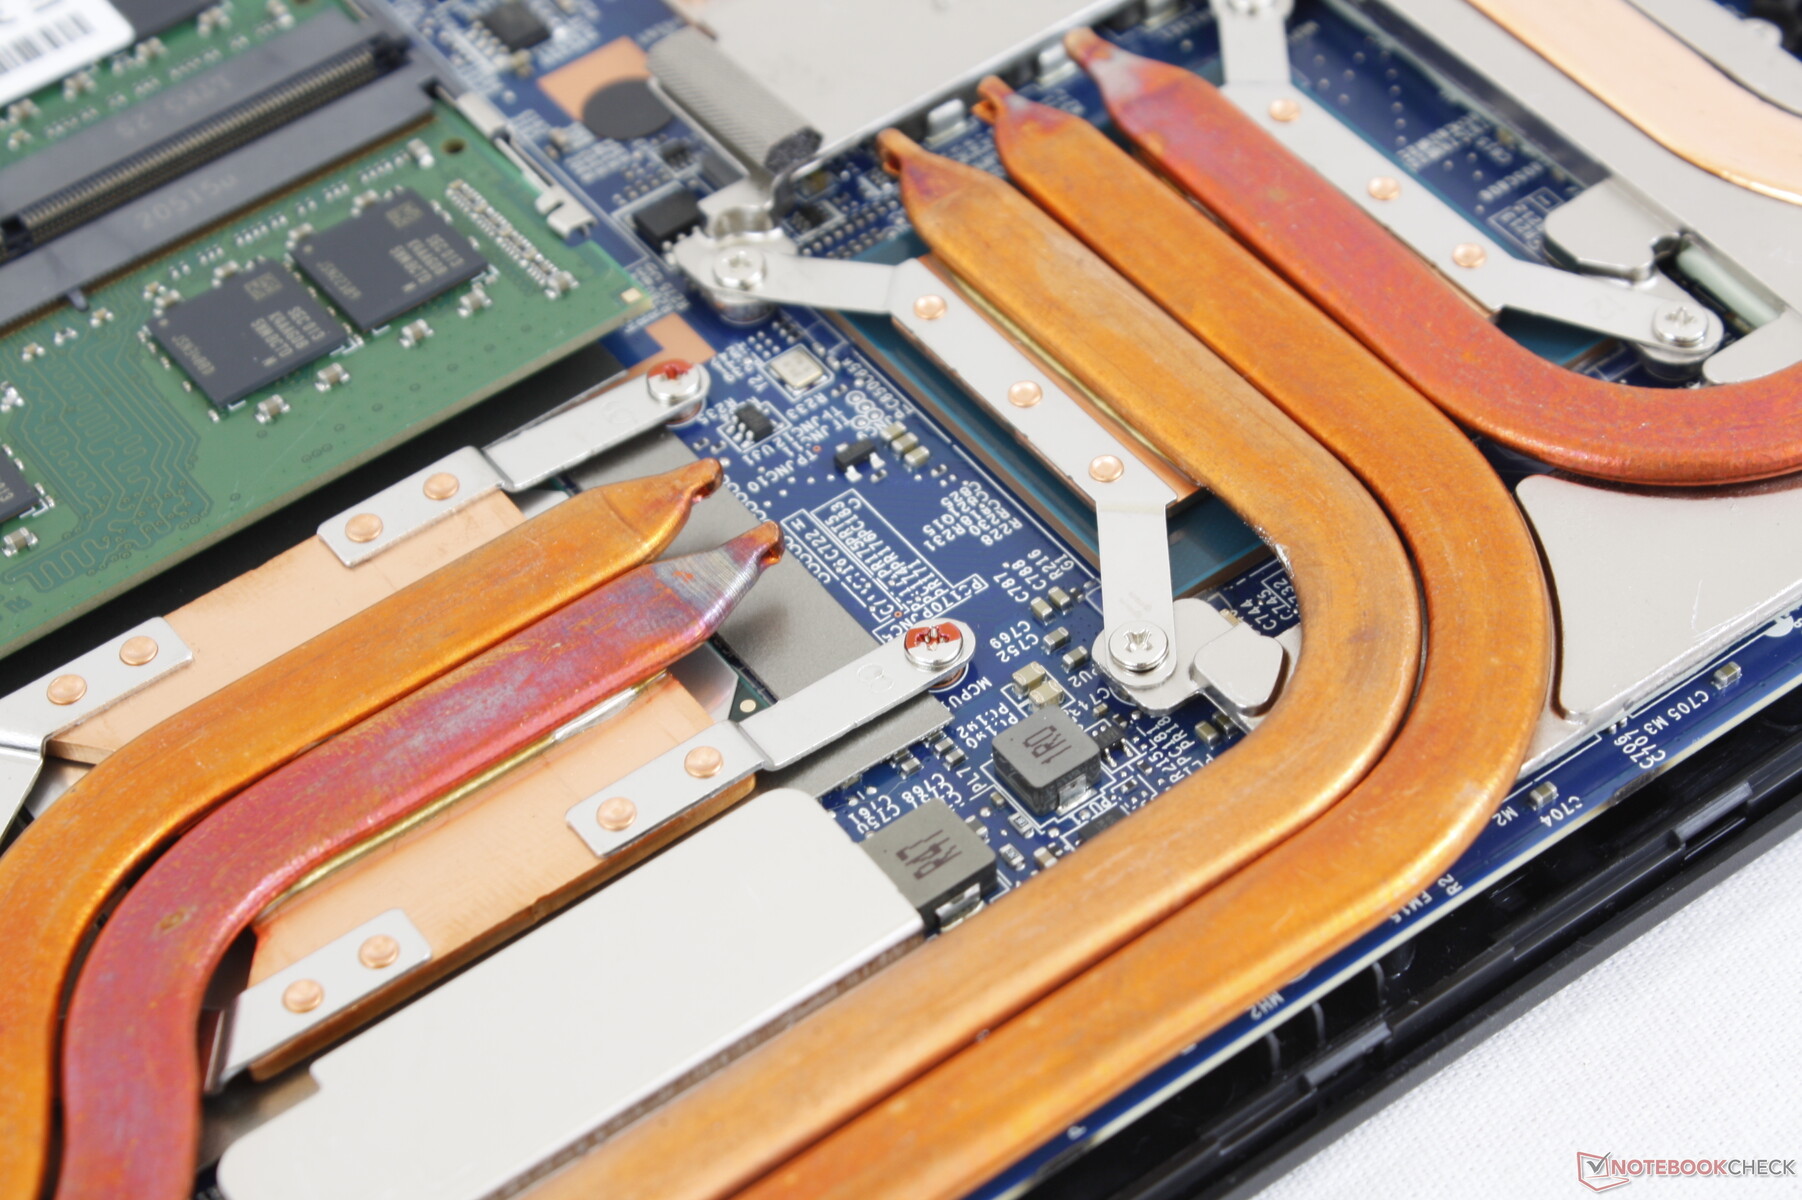
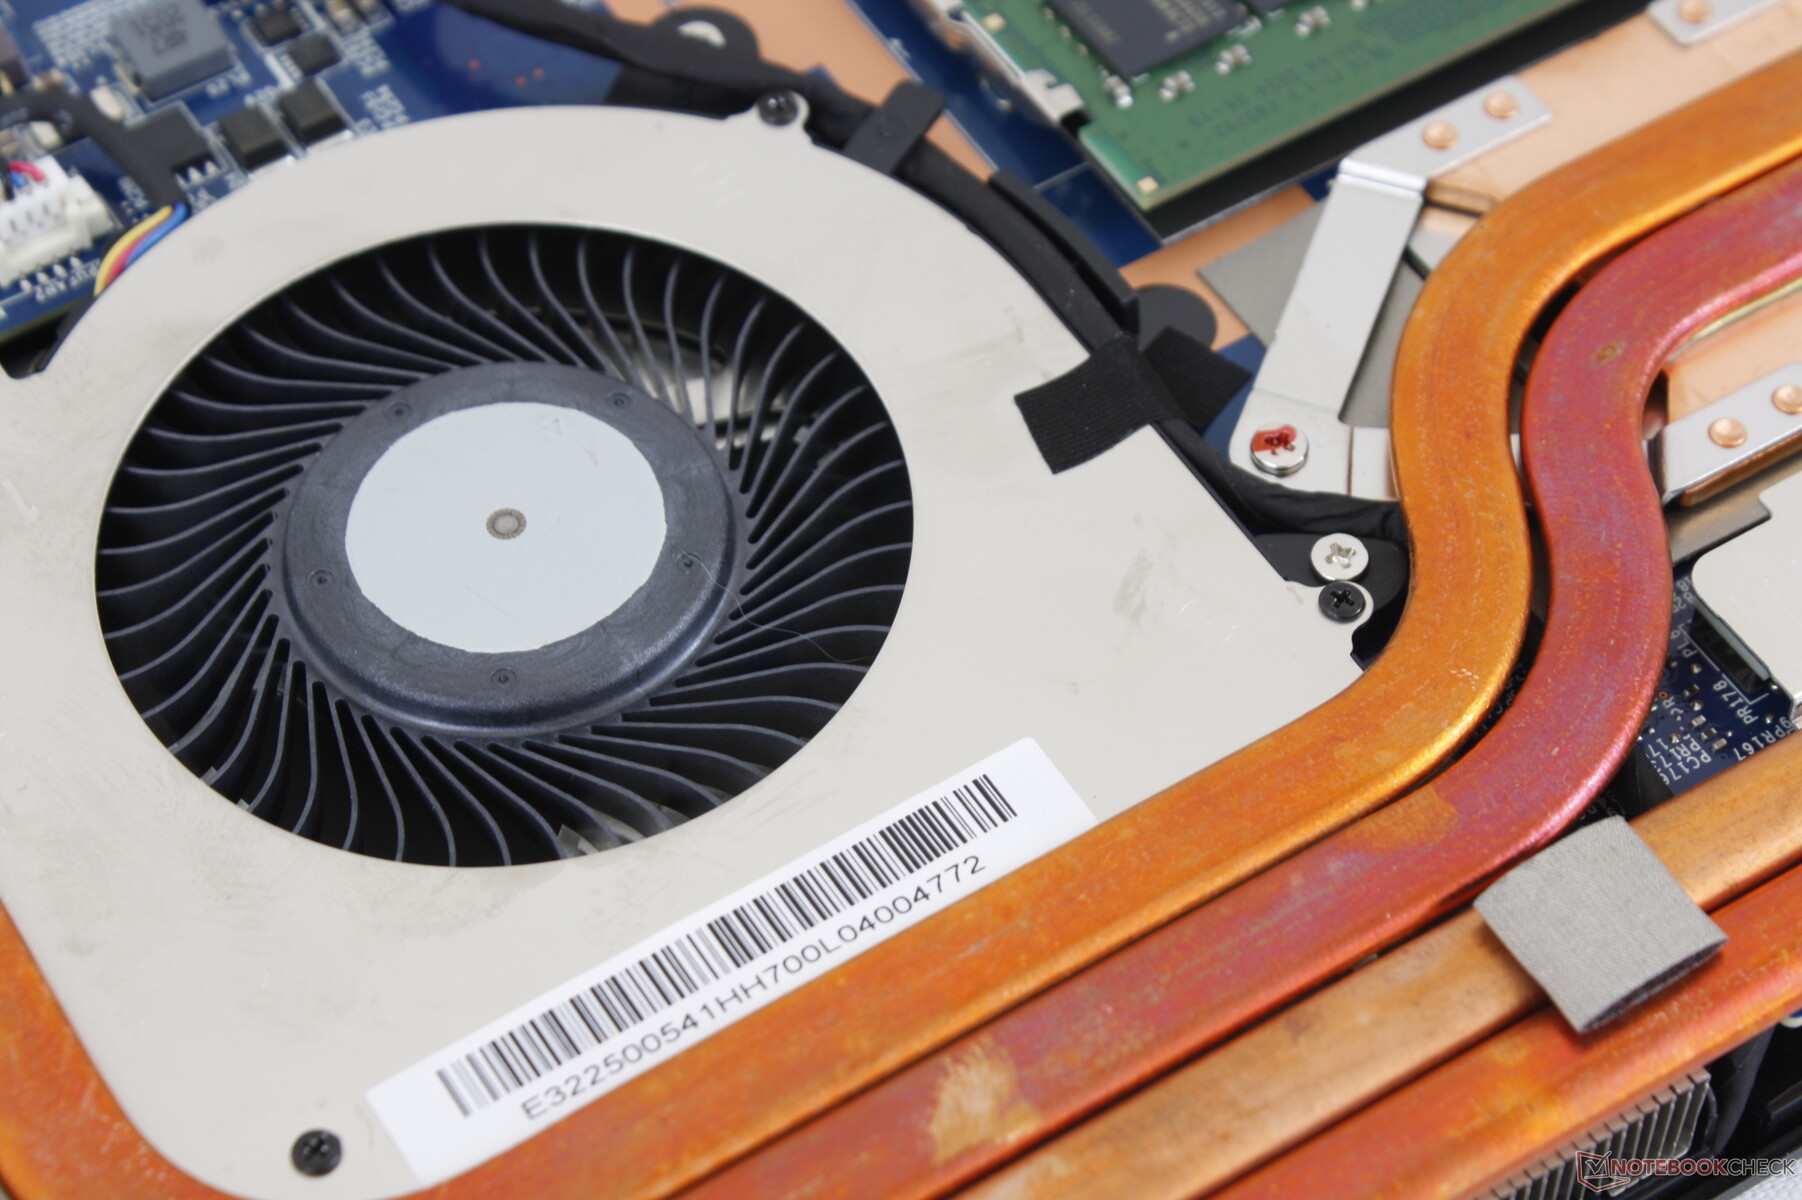
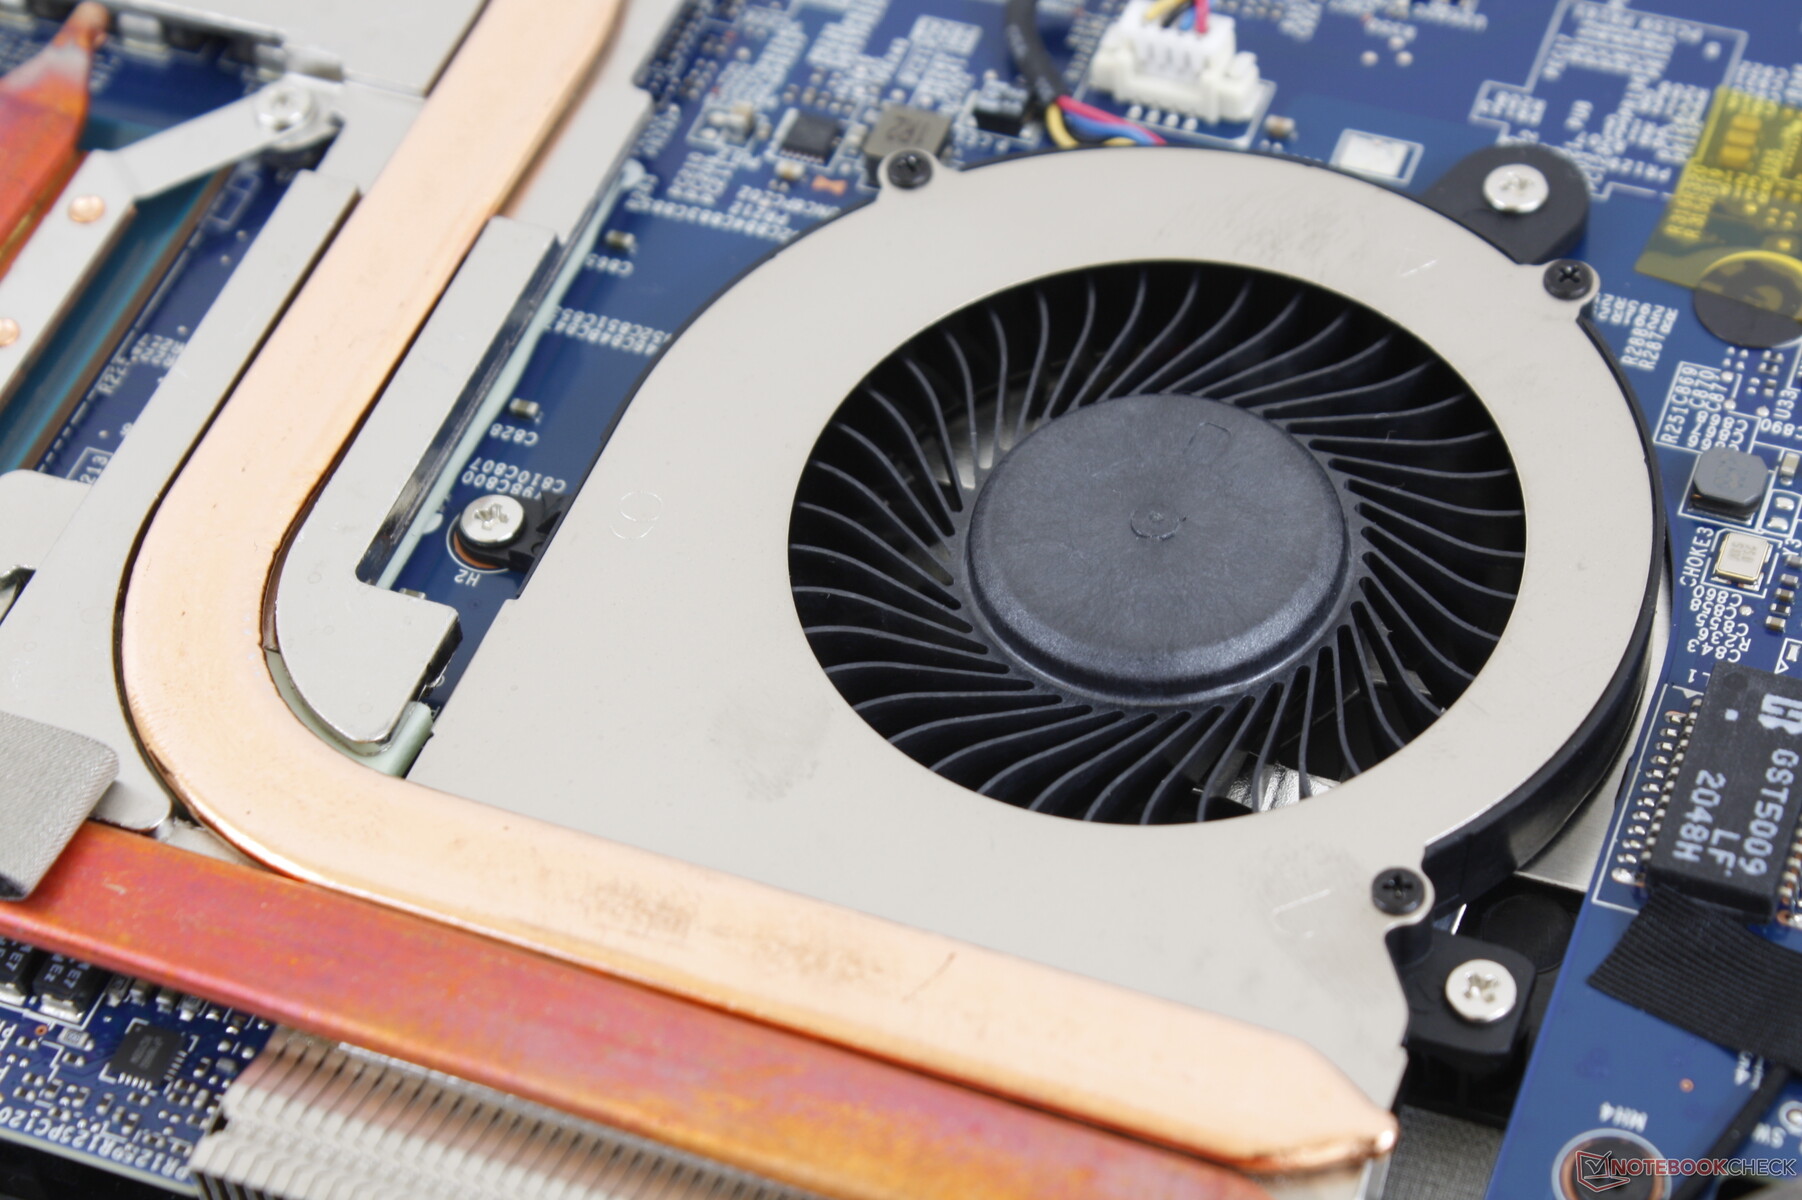
Manutenzione
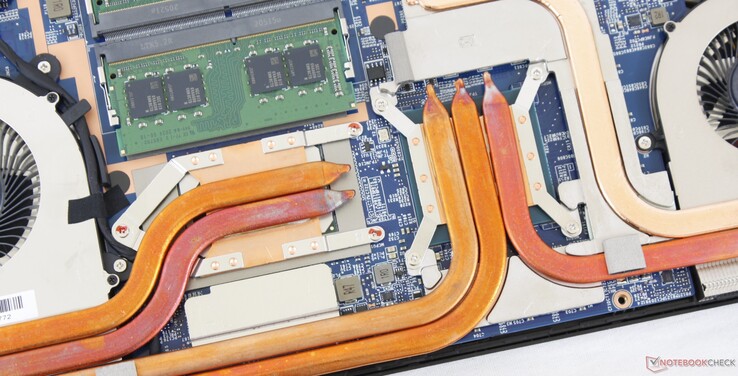
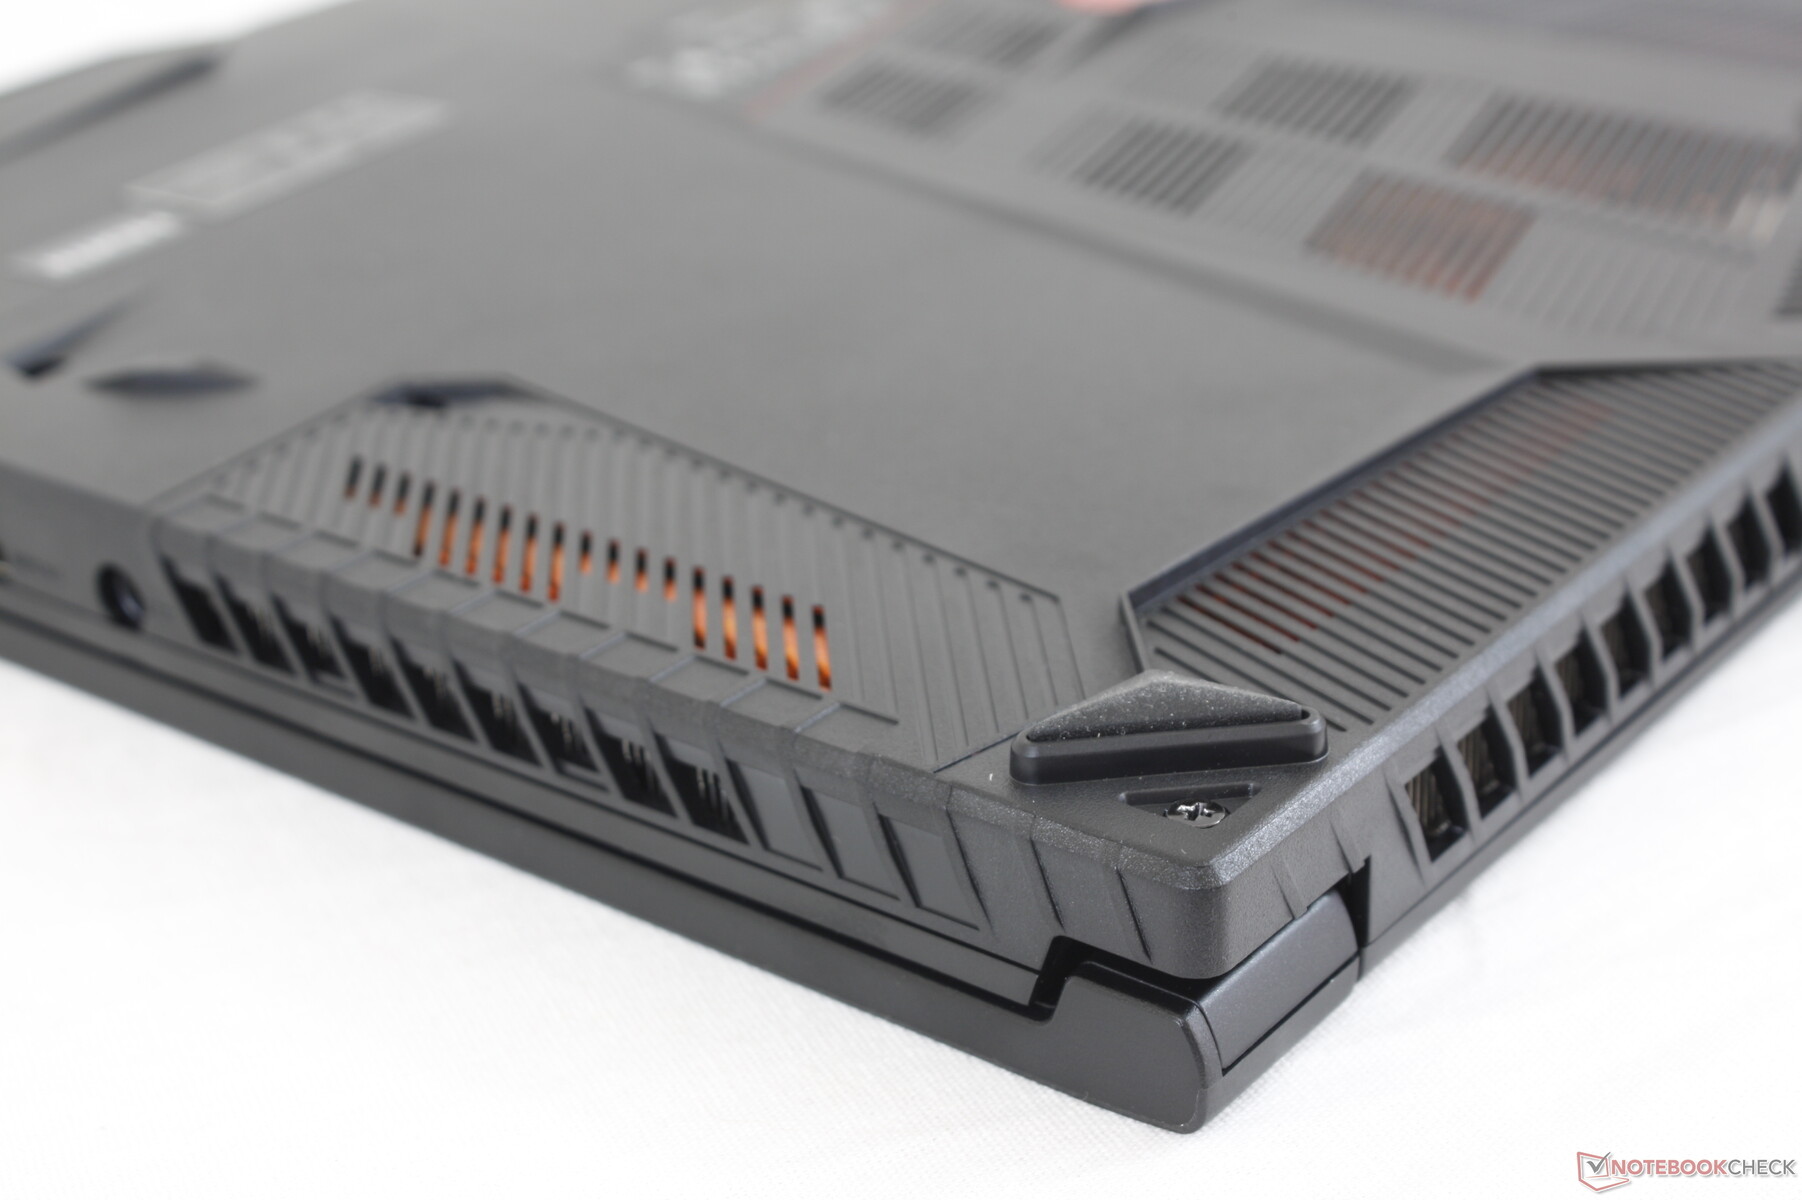
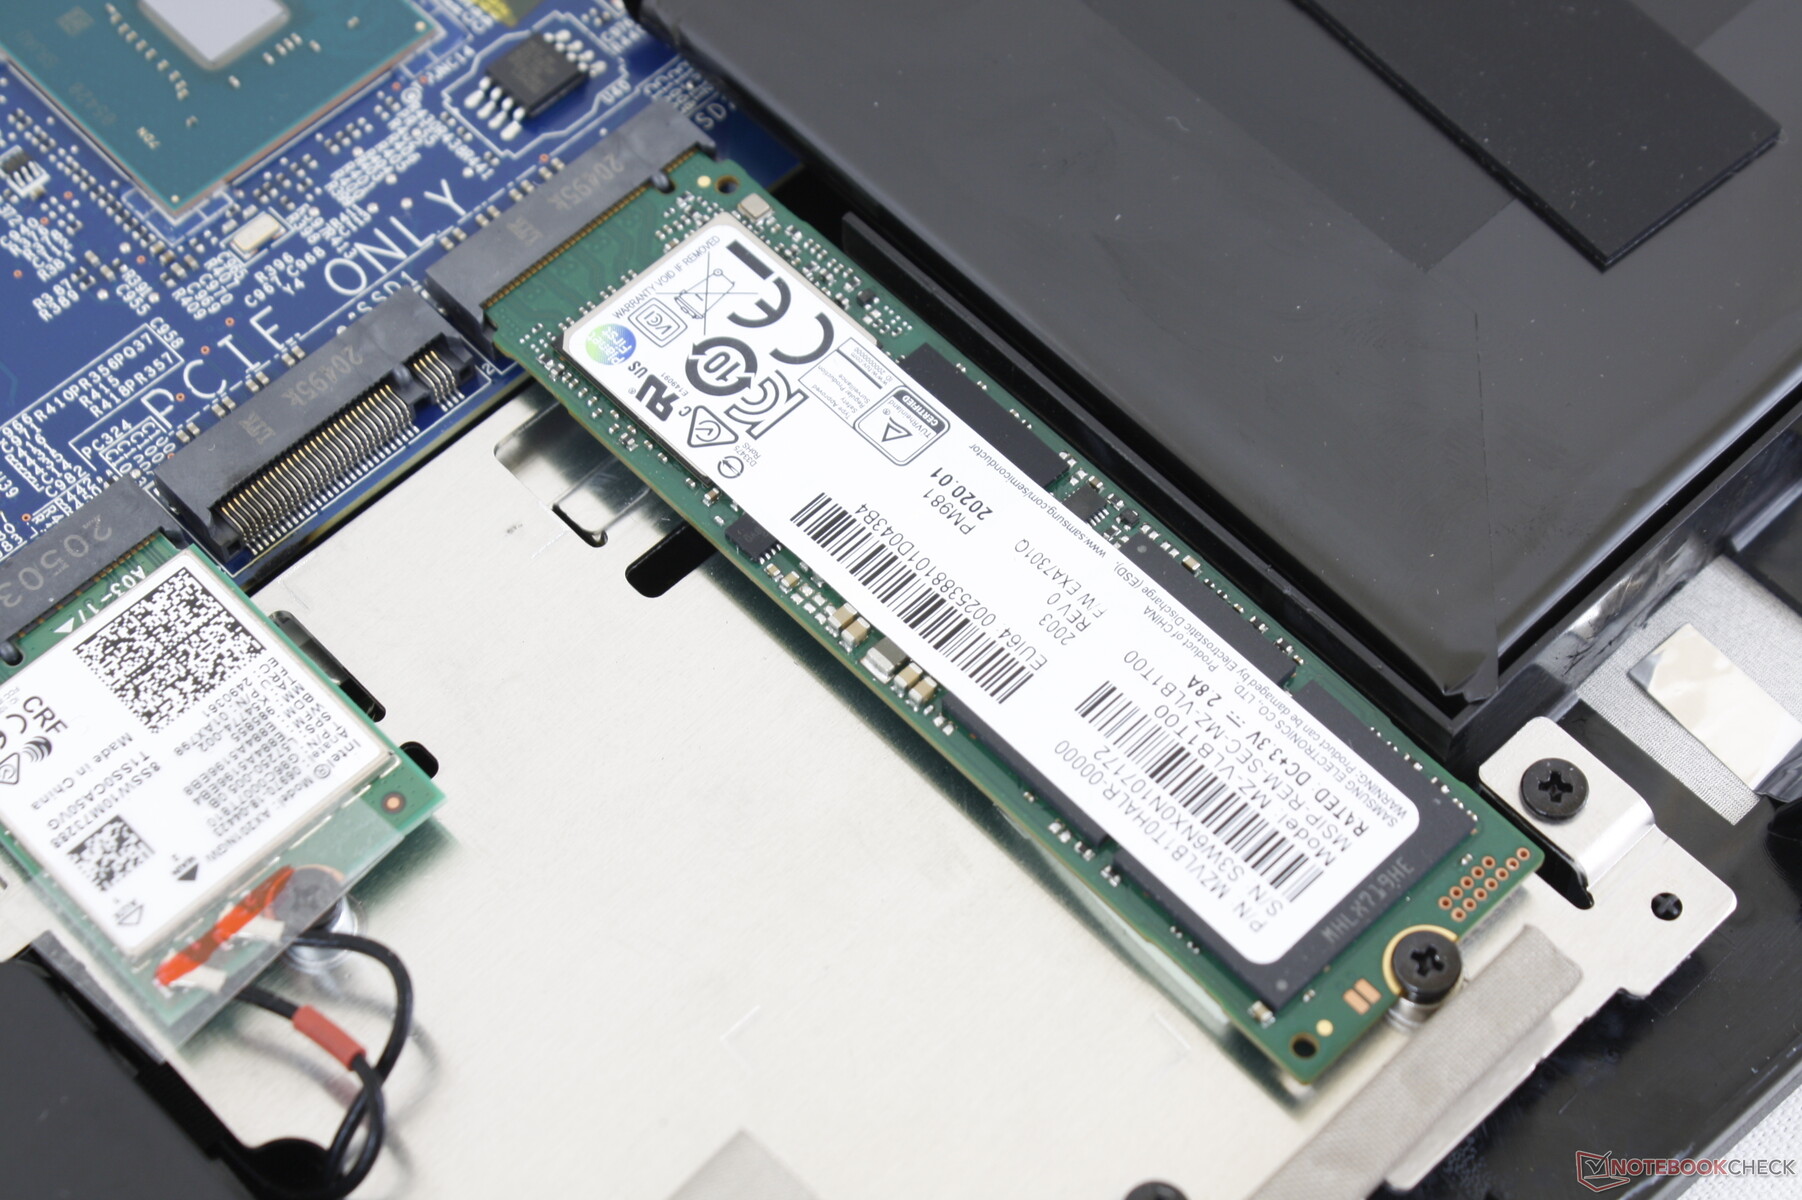
La manutenzione richiede solo un cacciavite Philips rendendo gli aggiornamenti relativamente facili. I proprietari dovrebbero fare attenzione quando rimuovono il pannello inferiore perché il jack audio può rimanere bloccato lungo il bordo.
Accessori e garanzia
Non ci sono extra nella confezione oltre al solito adattatore AC e ai documenti. La garanzia limitata standard di un anno si applica mentre qualsiasi componente installato da CUKUSA, come la RAM o lo storage, avrà invece una copertura di tre anni.
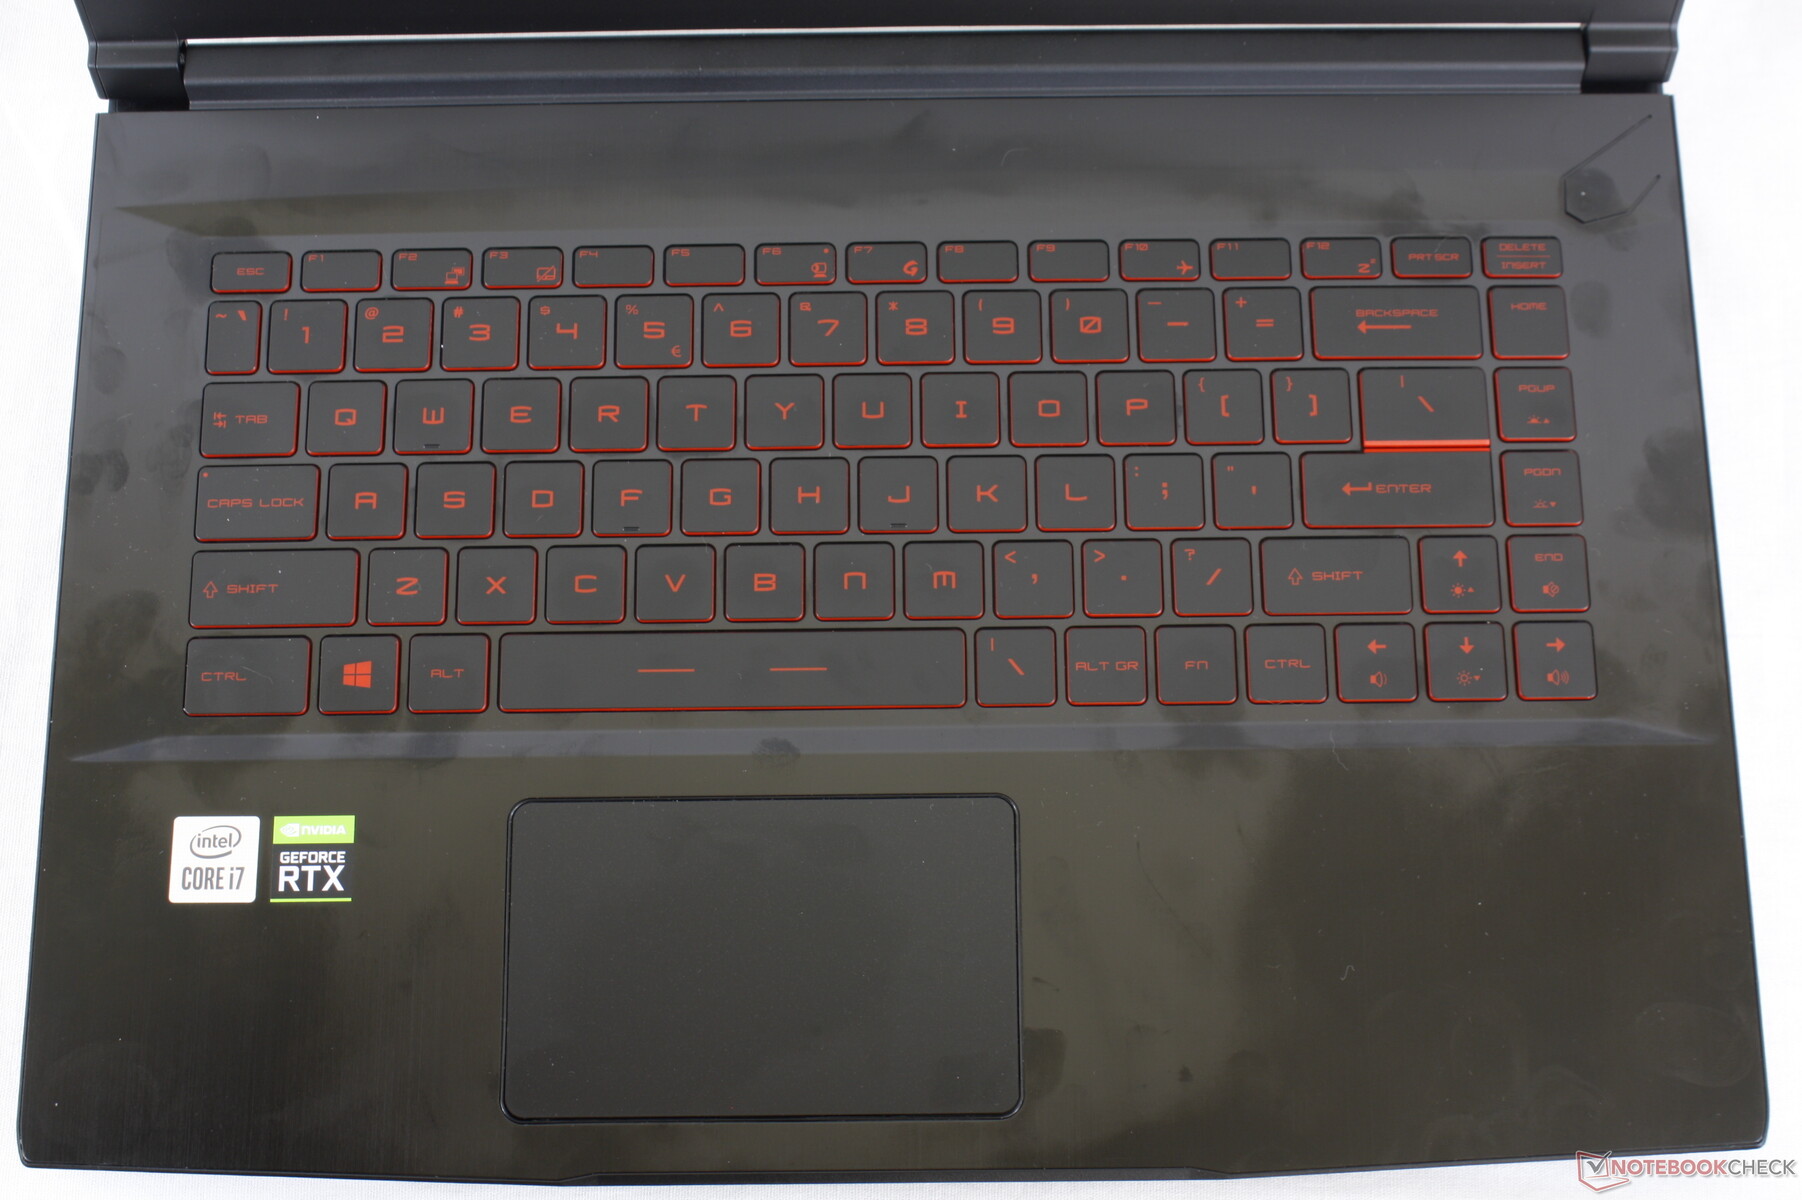
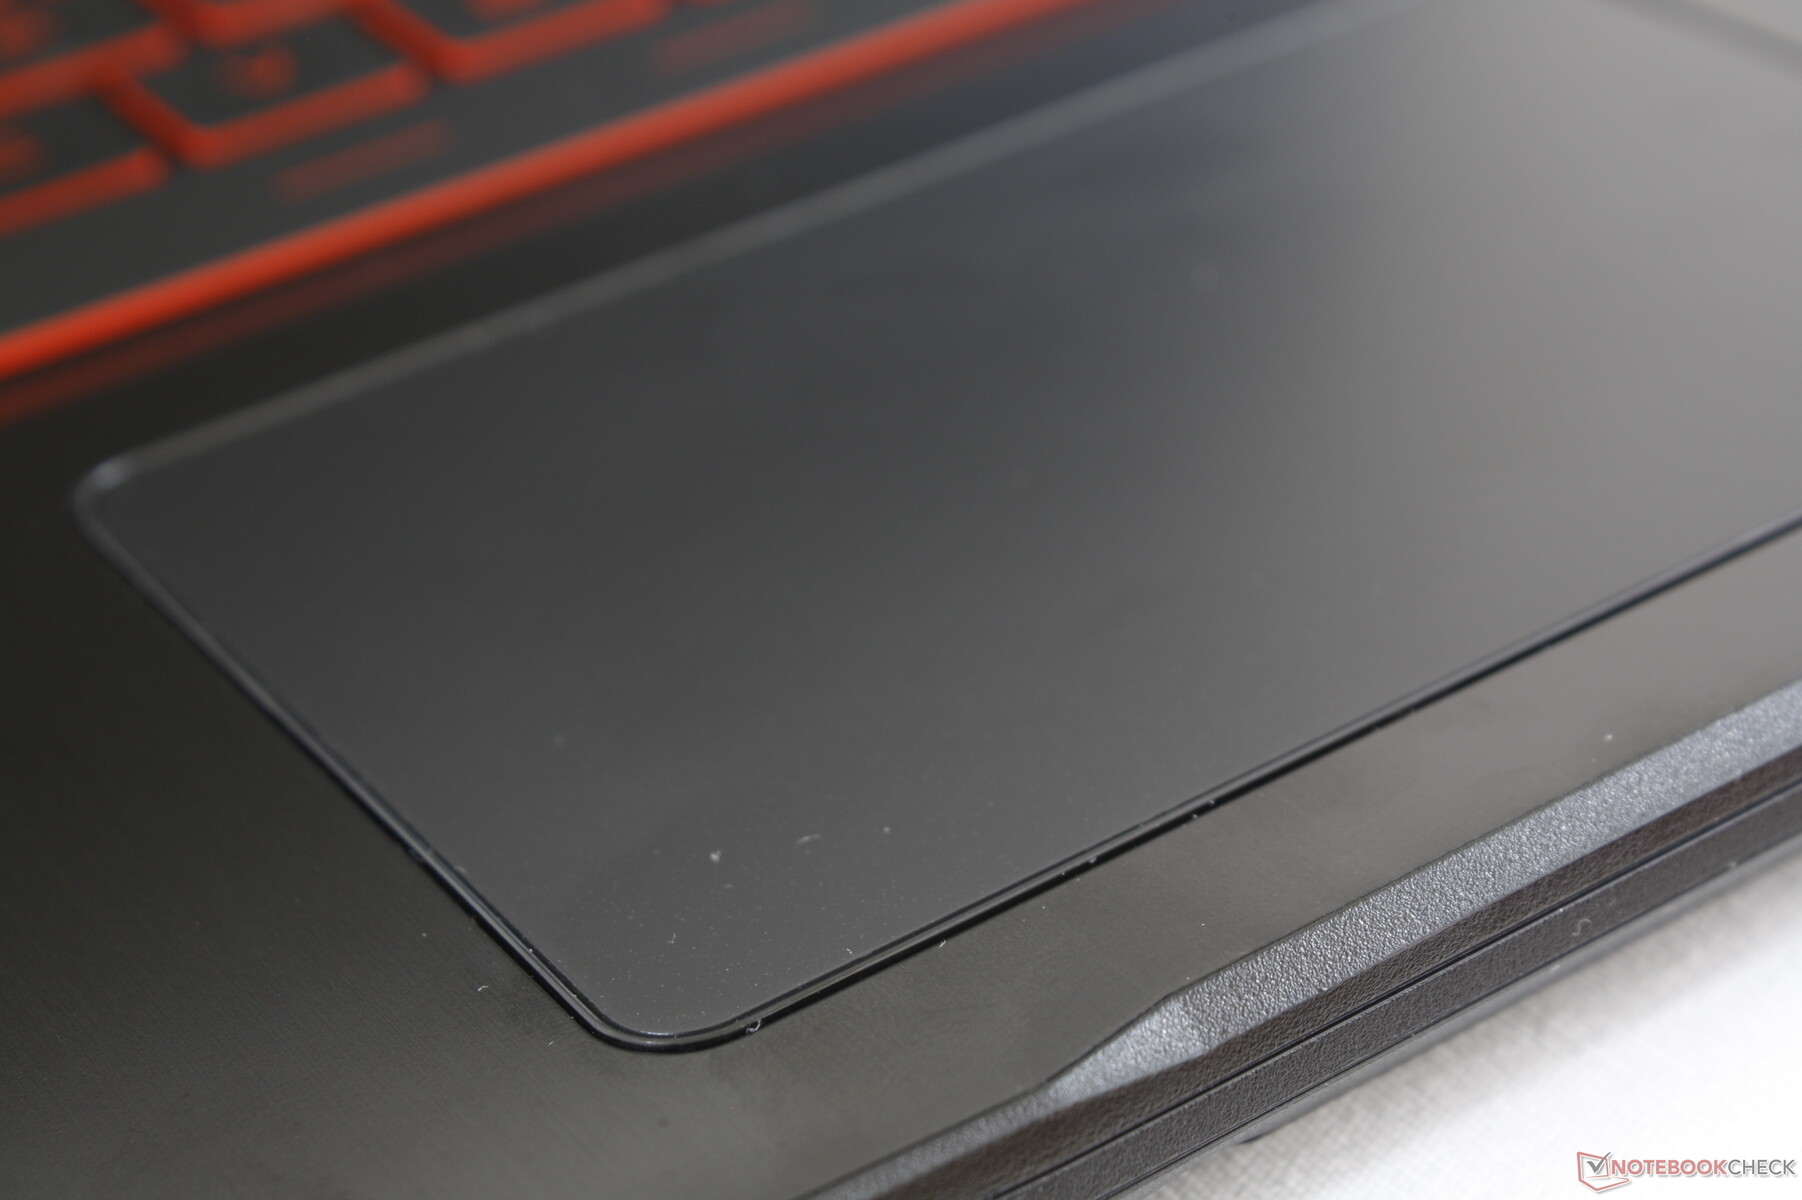
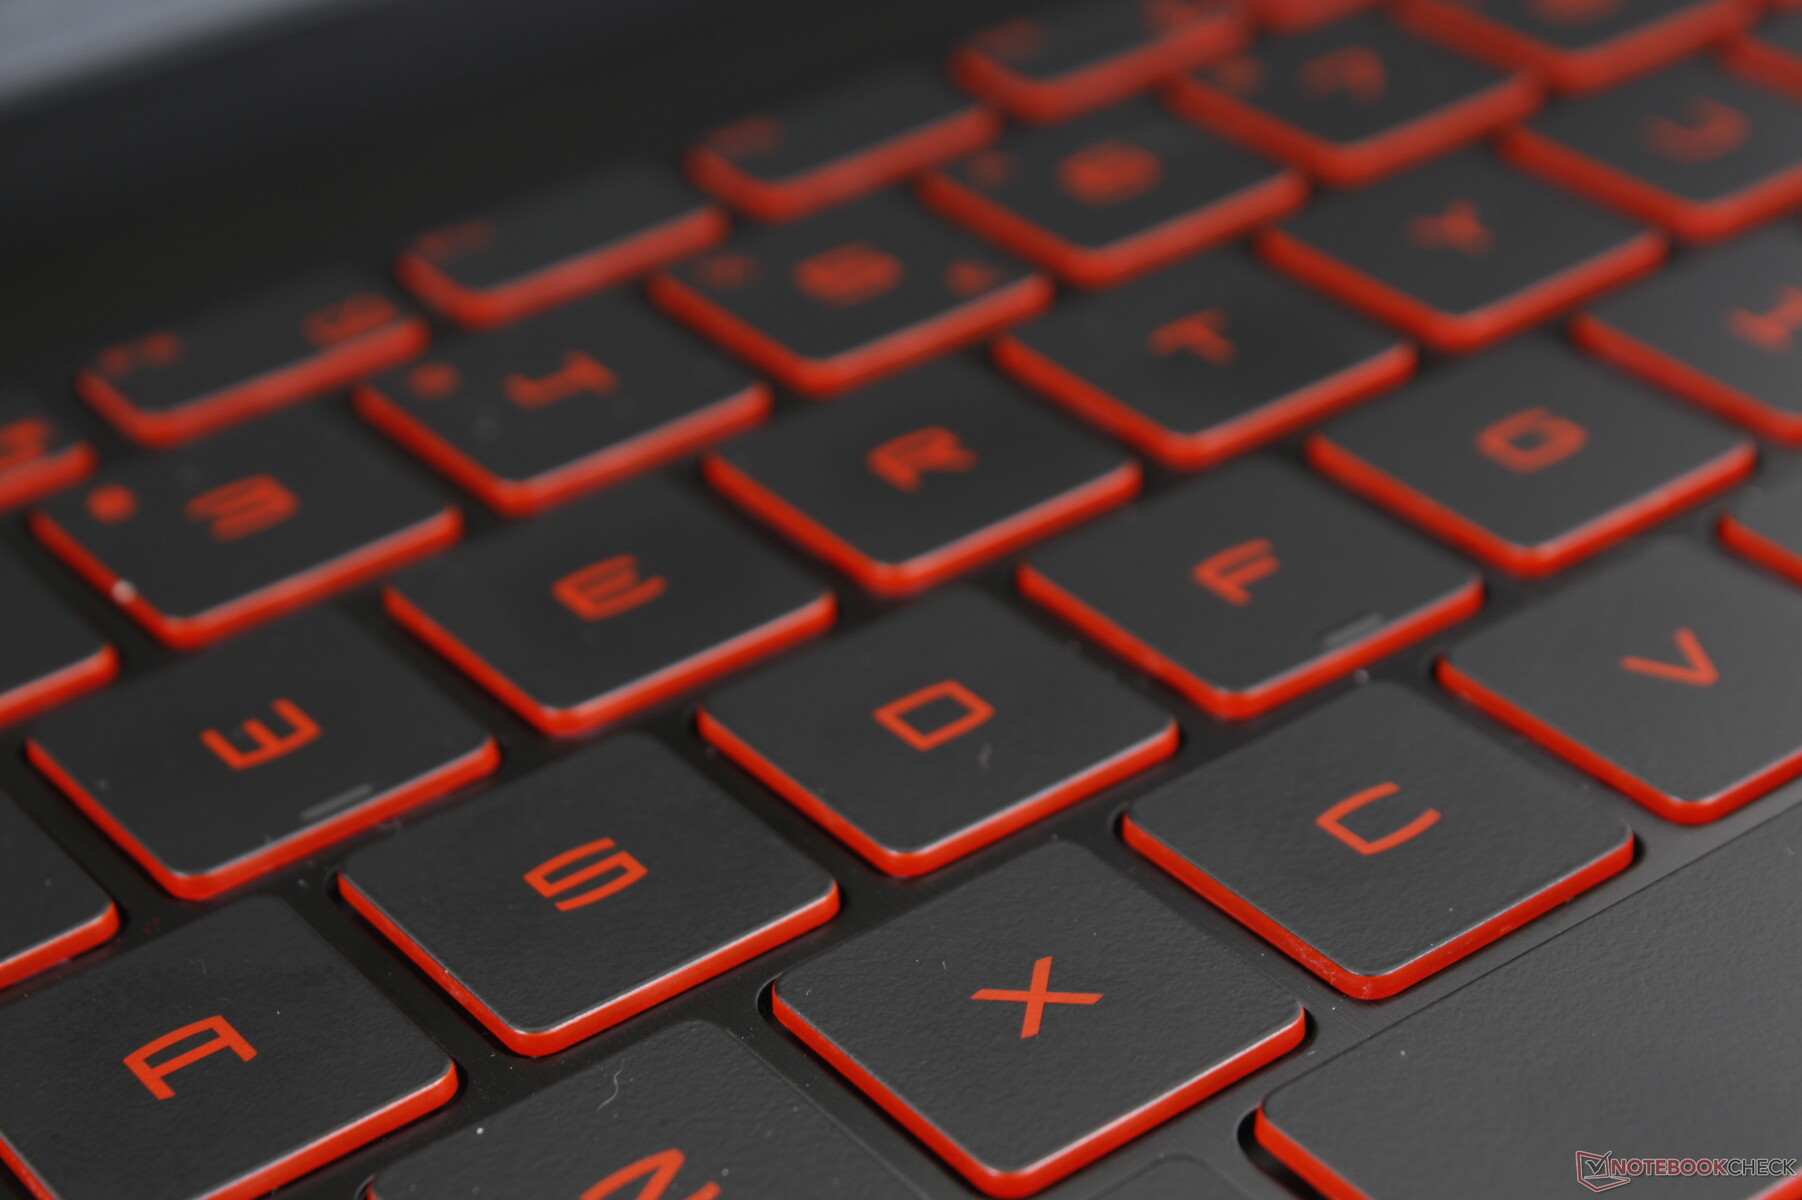
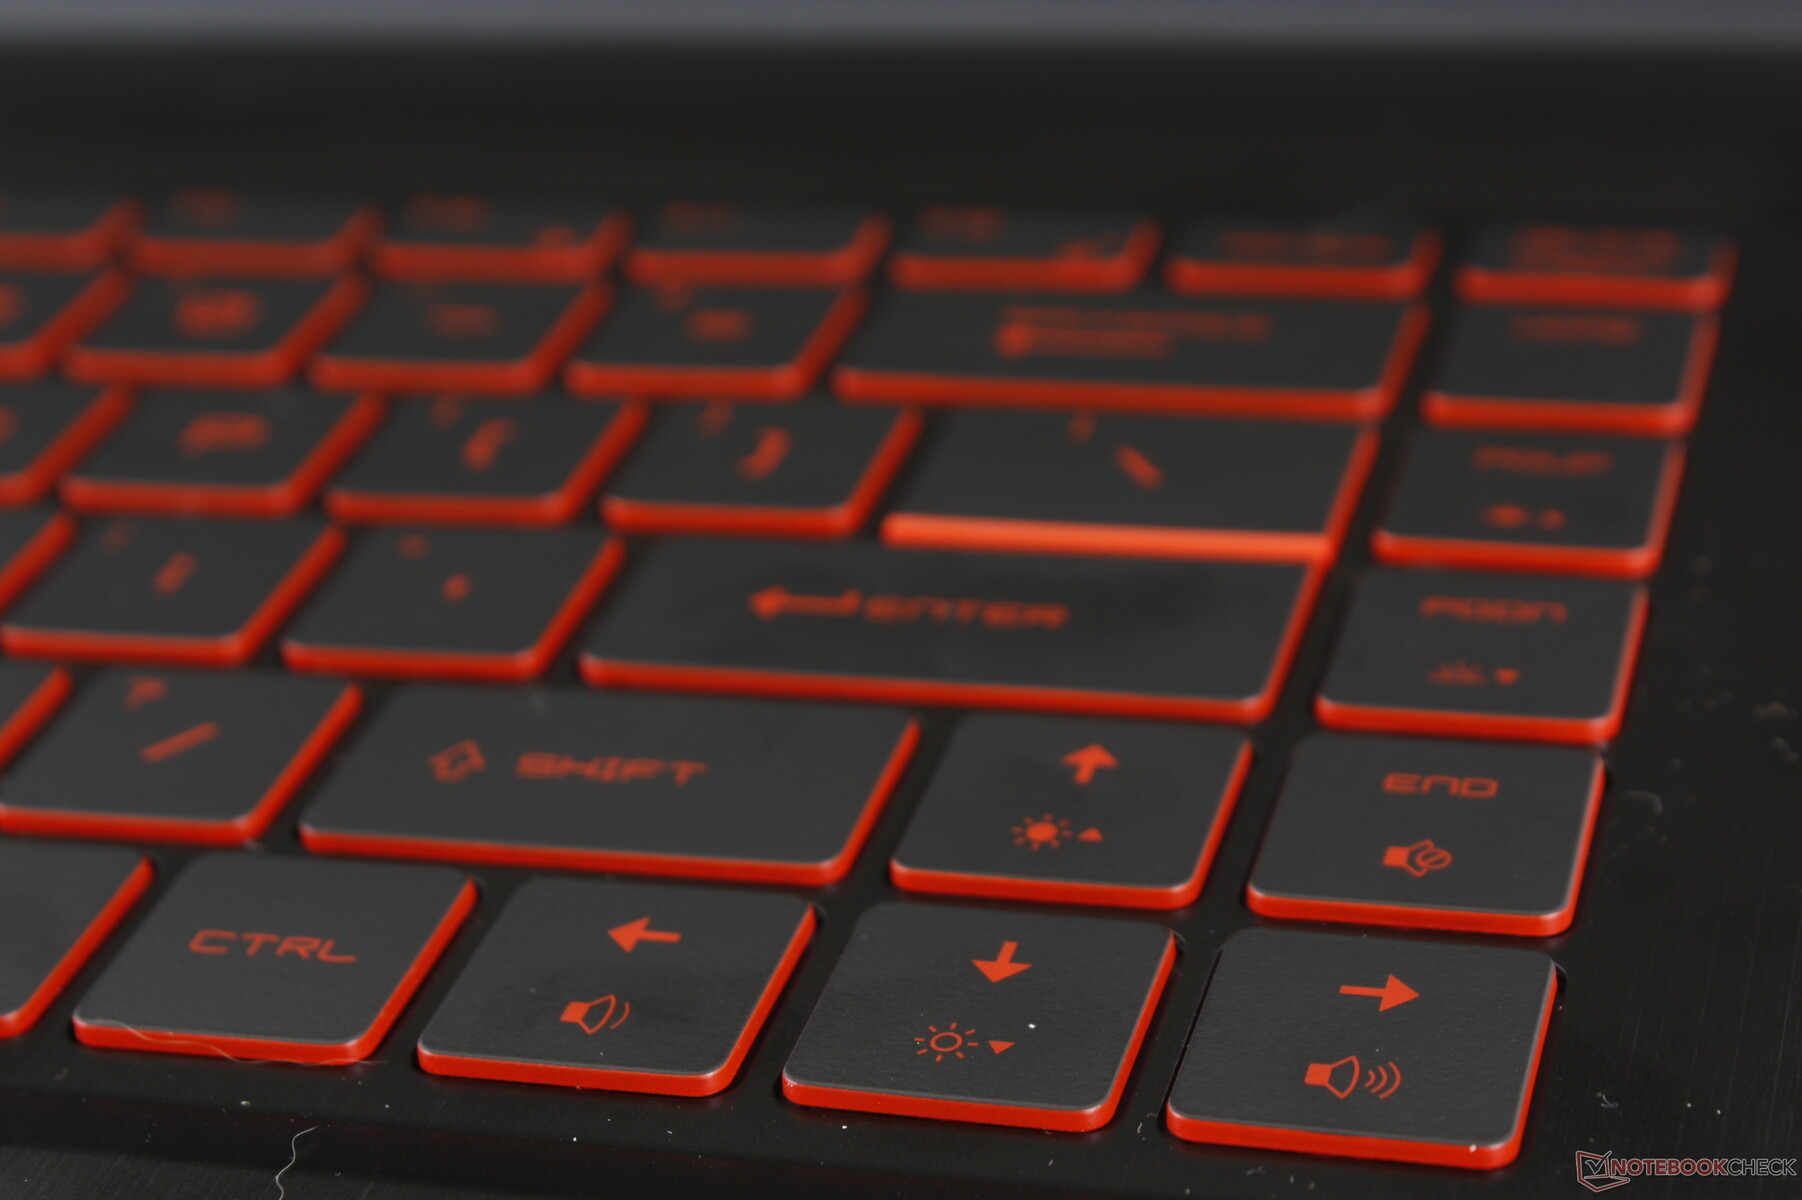
Dispositivi di input
Display
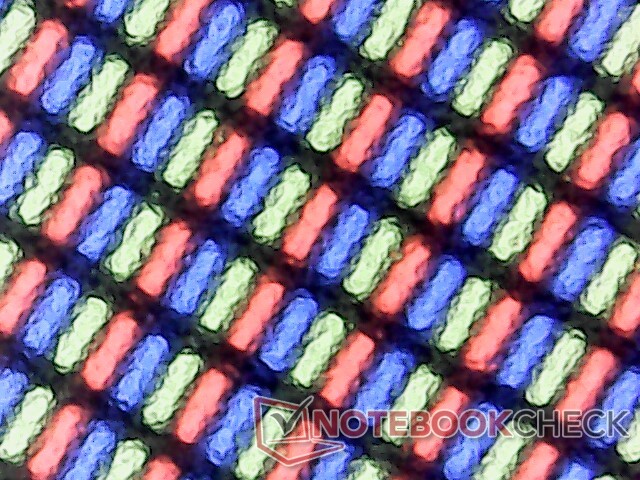
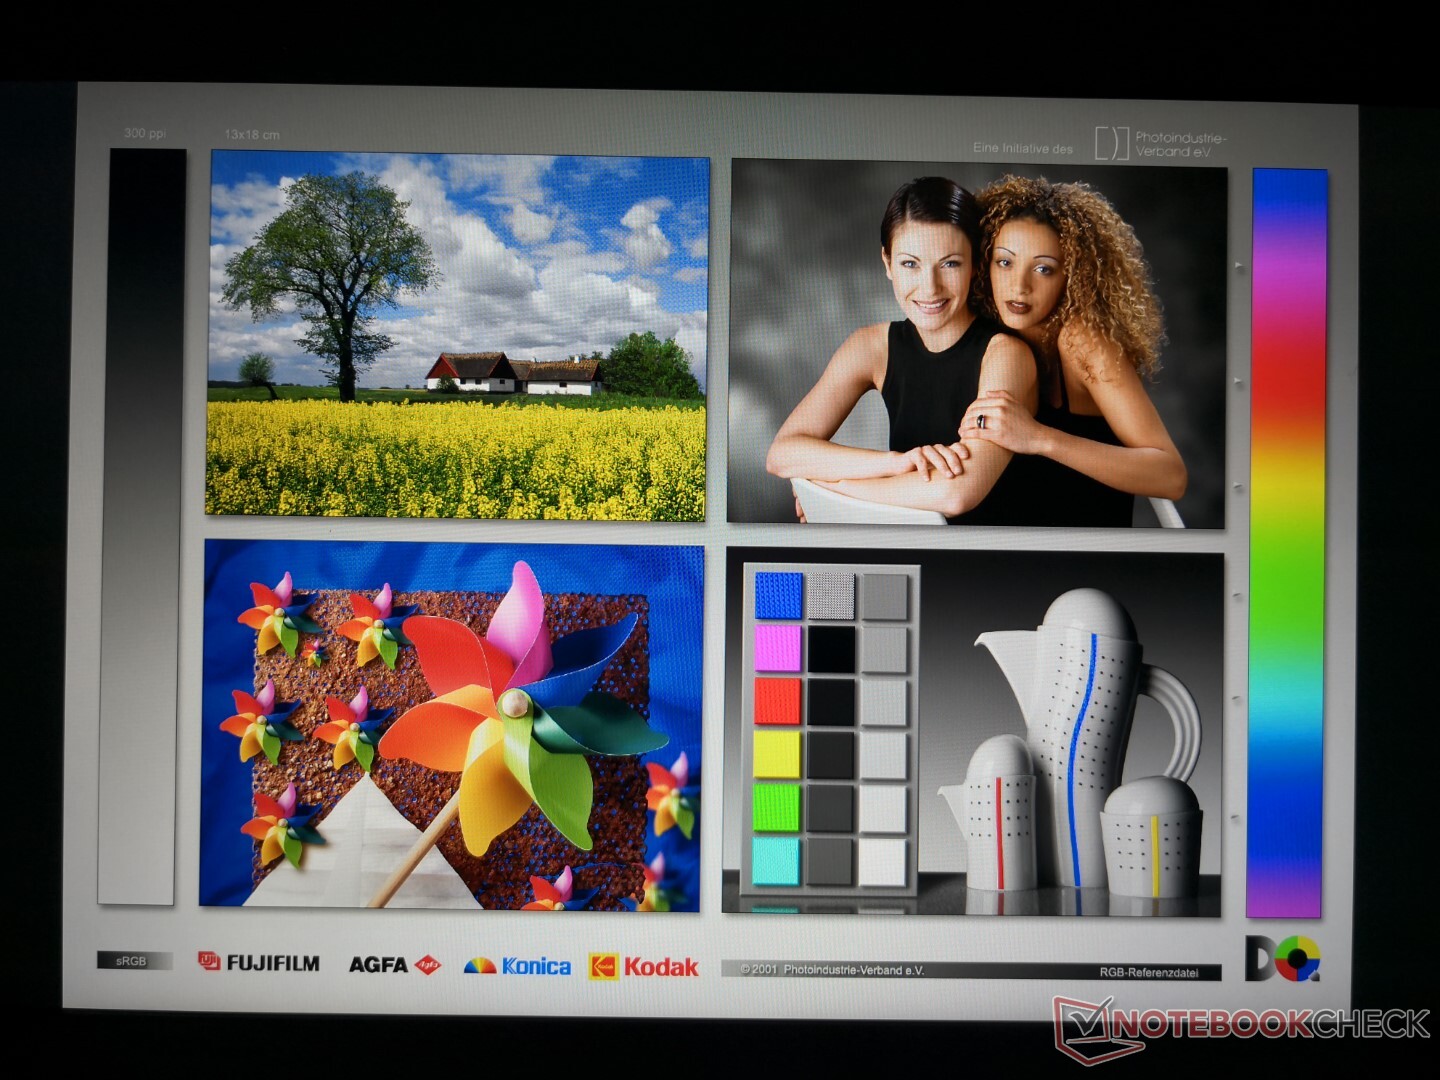
Il GF65 10UE usa un pannello AU Optronics diverso dal vecchio GF65 9SD (AUO B156HAN08.4 vs. AUO B156HAN13.0) con la principale differenza tra loro nella frequenza di aggiornamento (144 Hz vs. 120 Hz). A parte questo, i pannelli sono quasi identici, compresi i loro tempi di risposta bianco-nero medi e una gamma sotto la media. Il contrasto è abbastanza alto, oltre 1000:1, ma la limitata riproduzione dei colori diminuisce questo vantaggio.
Soggettivamente, il display è molto fluido durante il gaming e l'uso generale - basta essere preparati per un po' di ghosting e non aspettarsi che i colori siano sgargianti.


| |||||||||||||||||||||||||
Distribuzione della luminosità: 91 %
Al centro con la batteria: 266.5 cd/m²
Contrasto: 1481:1 (Nero: 0.18 cd/m²)
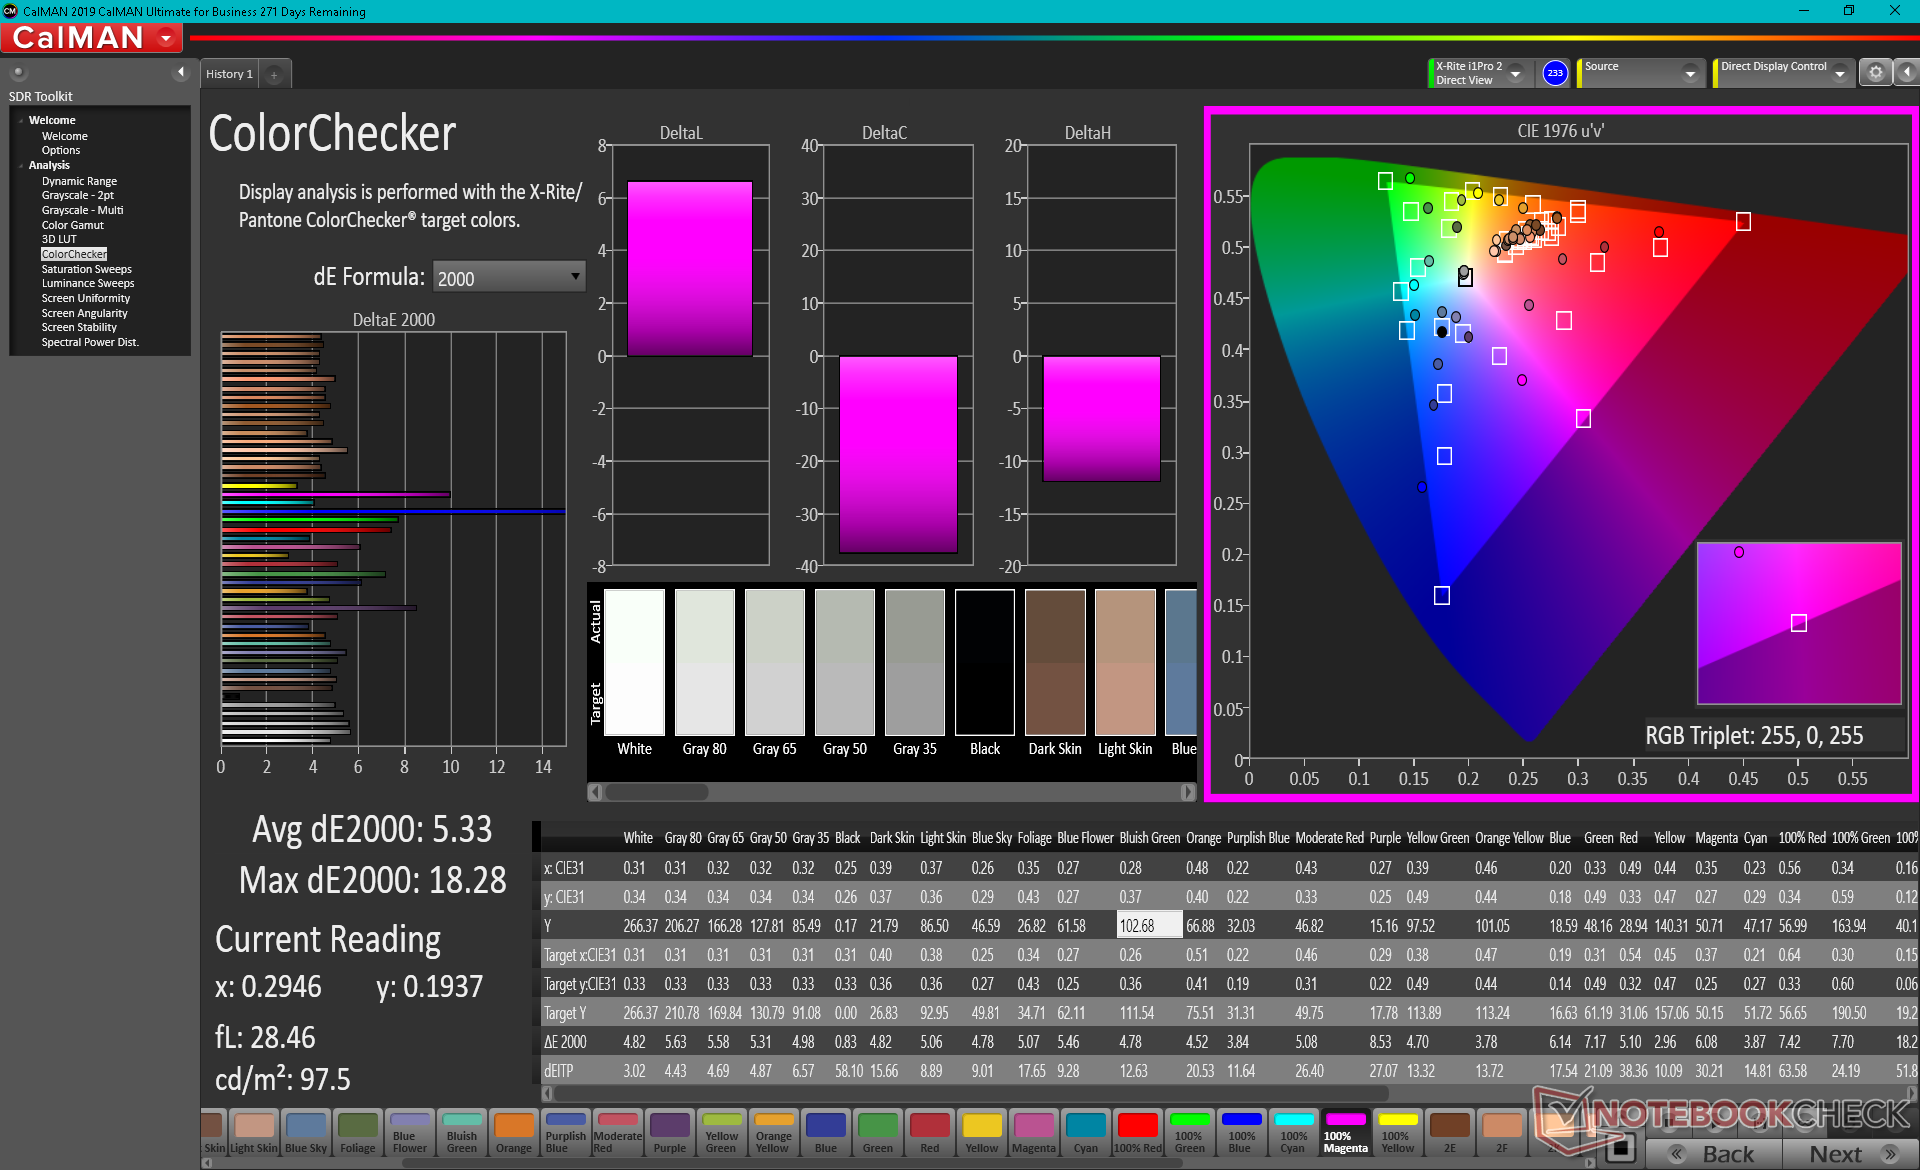
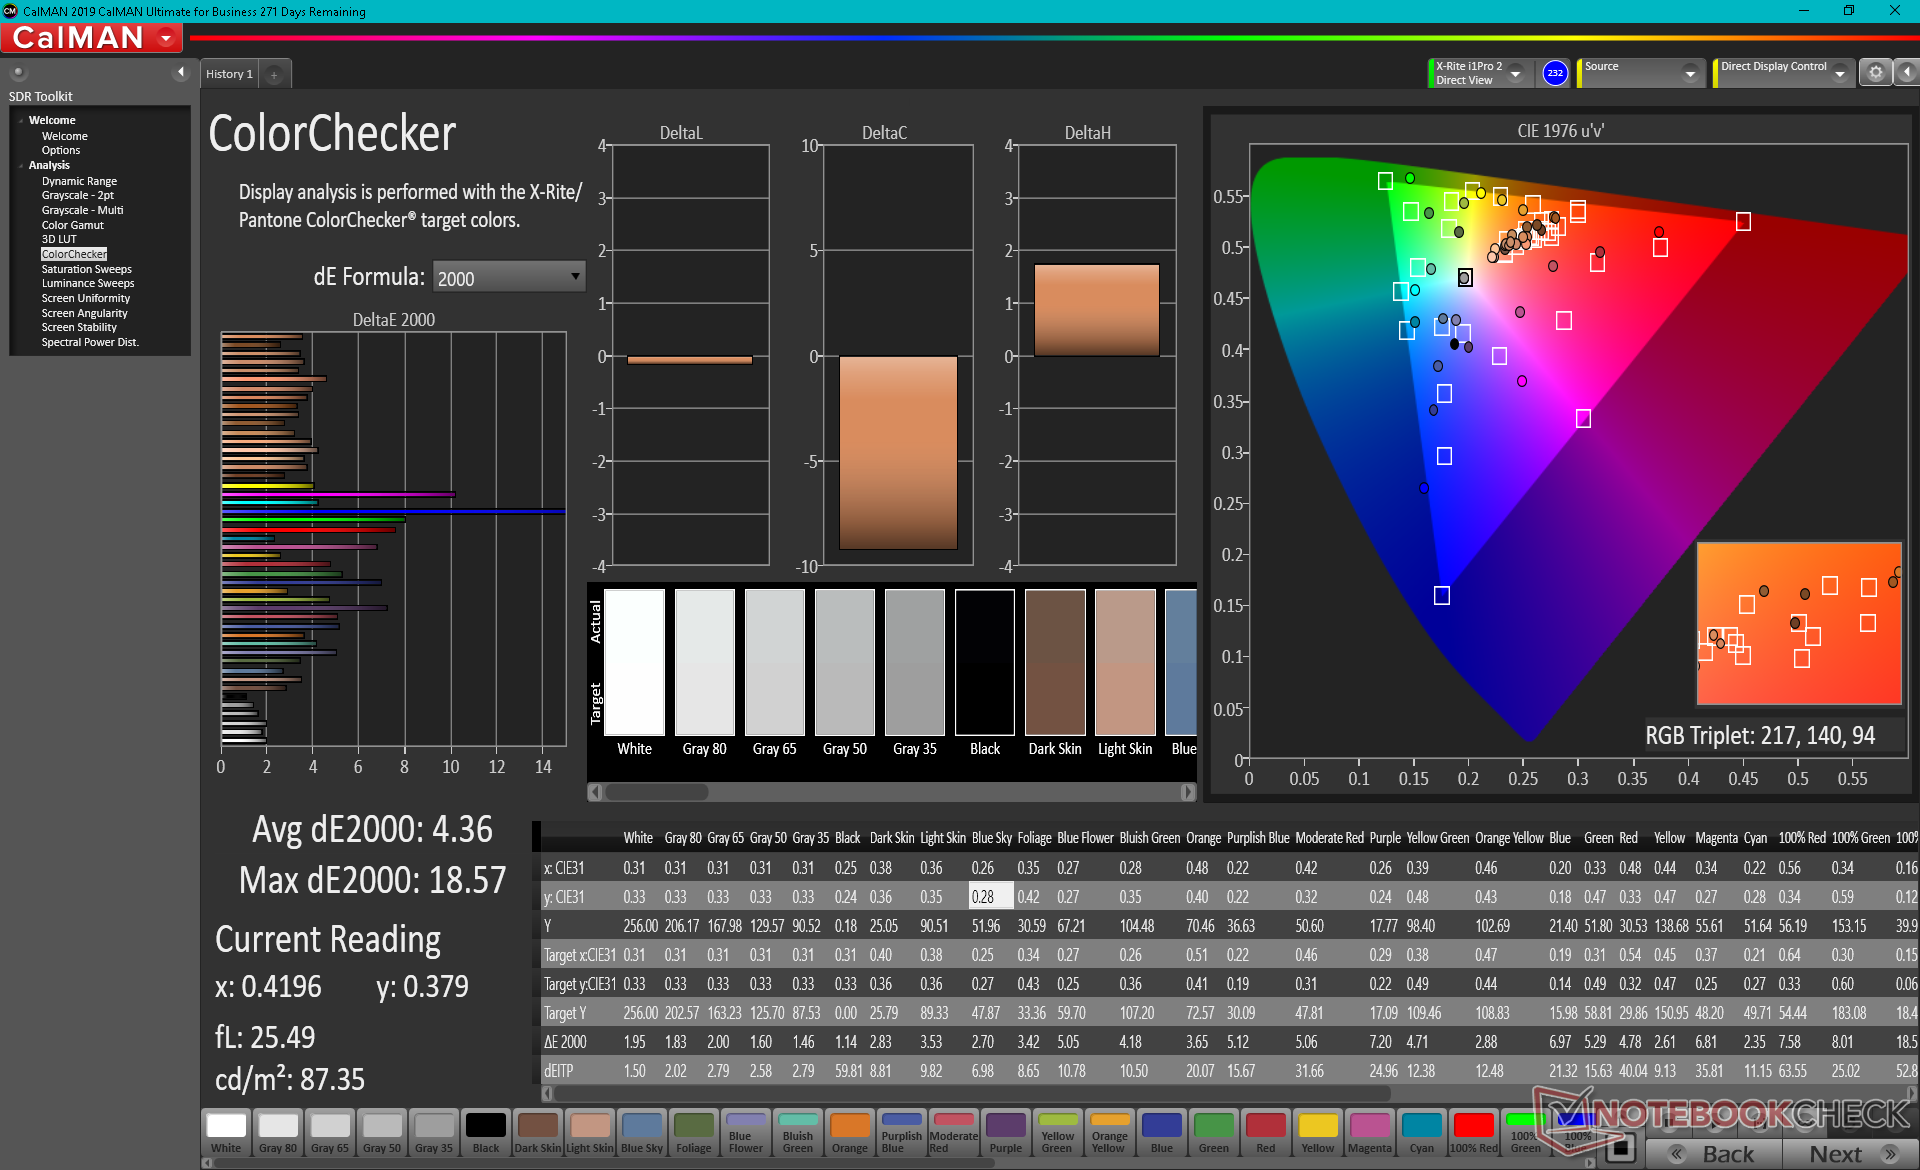
ΔE ColorChecker Calman: 5.33 | ∀{0.5-29.43 Ø4.73}
calibrated: 4.36
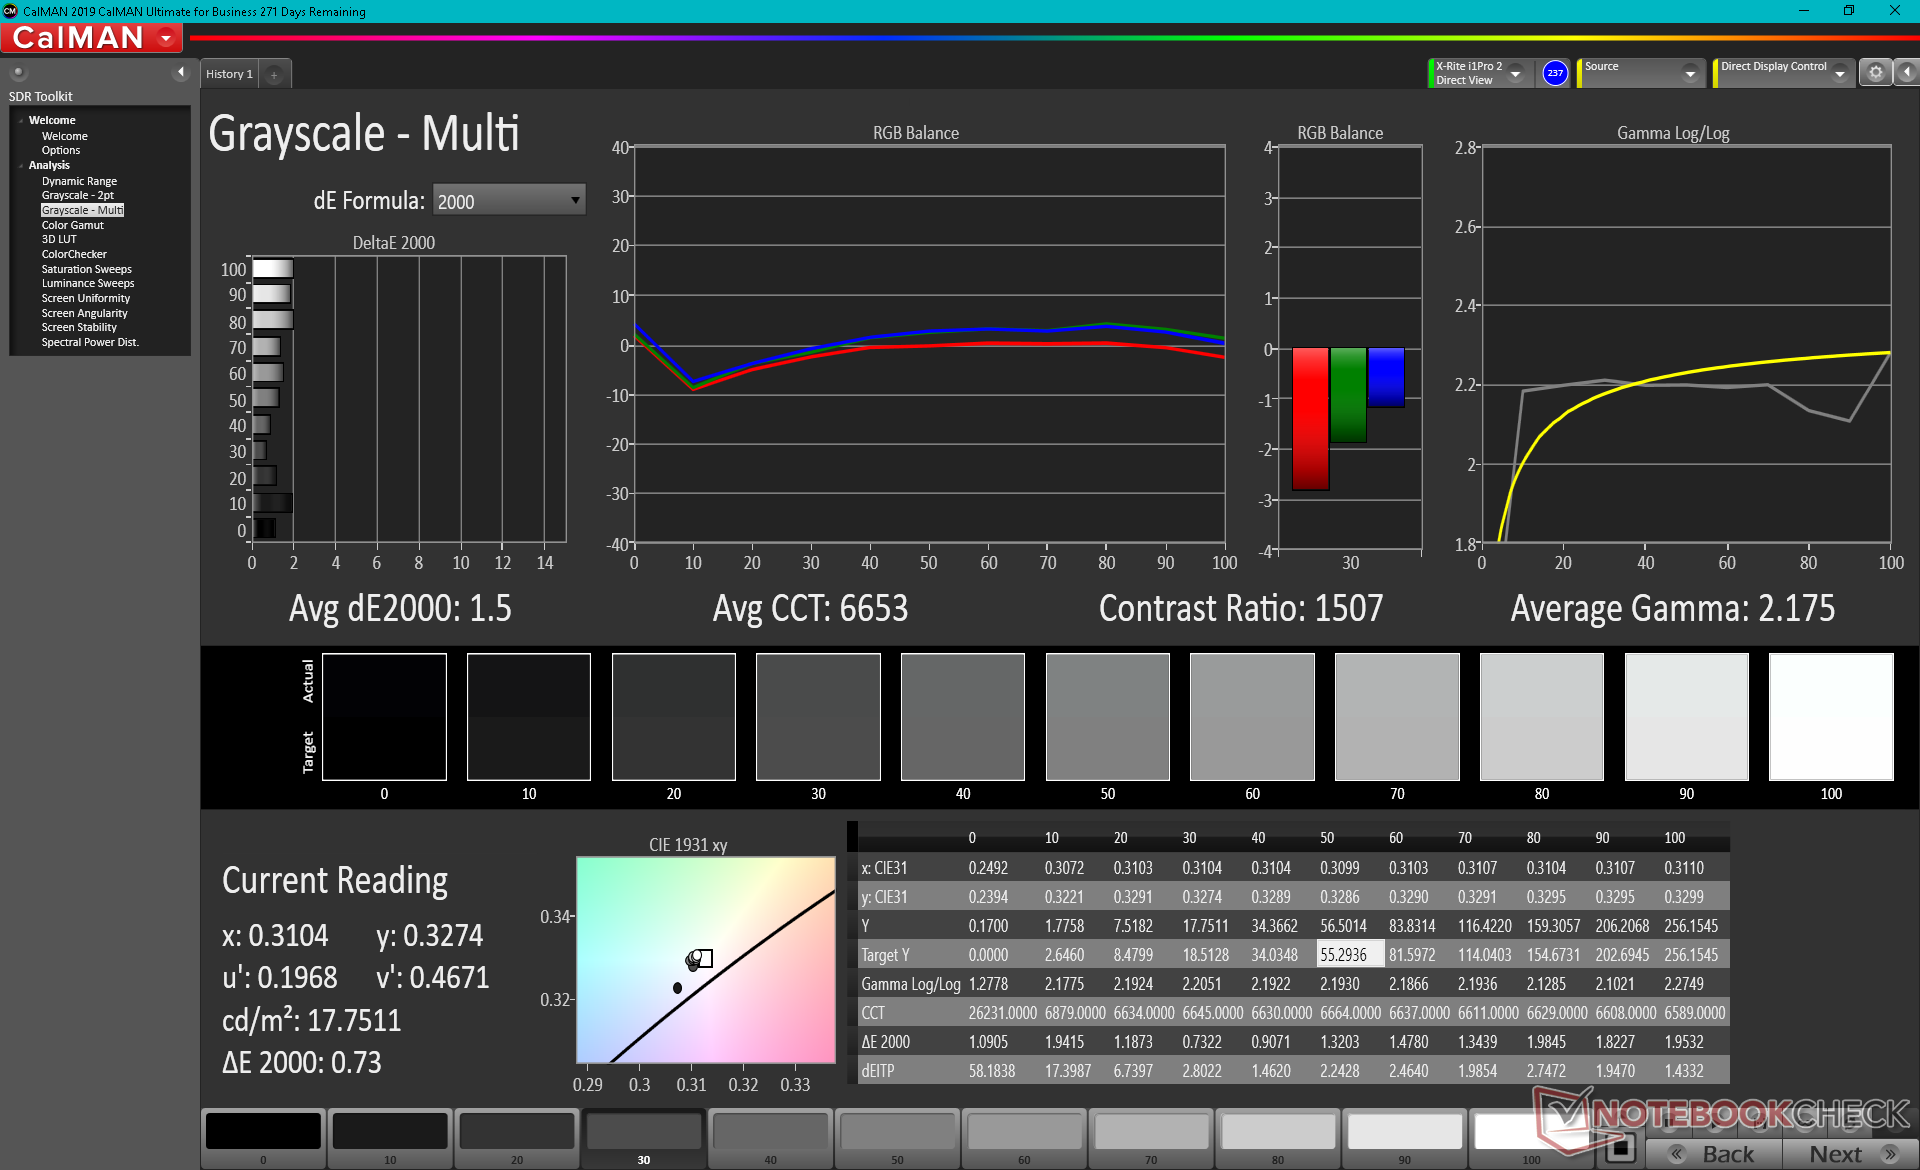
ΔE Greyscale Calman: 4.5 | ∀{0.09-98 Ø4.97}
55.8% sRGB (Argyll 1.6.3 3D)
35.6% AdobeRGB 1998 (Argyll 1.6.3 3D)
38.9% AdobeRGB 1998 (Argyll 3D)
56.3% sRGB (Argyll 3D)
37.65% Display P3 (Argyll 3D)
Gamma: 2.35
CCT: 6289 K
| MSI GF65 Thin 10UE AU Optronics B156HAN08.4, IPS, 15.6", 1920x1080 | Asus ROG Strix G15 G513QR LQ156M1JW25, IPS, 15.6", 1920x1080 | Schenker XMG Core 15 Ampere BOE CQ NE156QHM-NY2, IPS, 15.6", 2560x1440 | MSI GS66 Stealth 10UG AU Optronics B156HAN12.0, IPS, 15.6", 1920x1080 | Aorus 15G XC Sharp LQ156M1JW03, IPS, 15.6", 1920x1080 | Lenovo Legion 7 15IMH05-81YT001VGE AUO048E, IPS, 15.6", 1920x1080 | |
|---|---|---|---|---|---|---|
| Display | 74% | 81% | 78% | 73% | 82% | |
| Display P3 Coverage (%) | 37.65 | 67.7 80% | 69.8 85% | 67.7 80% | 65.6 74% | 70.3 87% |
| sRGB Coverage (%) | 56.3 | 94.3 67% | 98.8 75% | 98.4 75% | 97.5 73% | 99.4 77% |
| AdobeRGB 1998 Coverage (%) | 38.9 | 68.2 75% | 70.7 82% | 69.1 78% | 67.1 72% | 71.3 83% |
| Response Times | 75% | 64% | 62% | 72% | 77% | |
| Response Time Grey 50% / Grey 80% * (ms) | 36.8 ? | 8.2 ? 78% | 14.8 ? 60% | 14.4 ? 61% | 9.6 ? 74% | 8 ? 78% |
| Response Time Black / White * (ms) | 31.6 ? | 9.2 ? 71% | 10.4 ? 67% | 11.6 ? 63% | 9.6 ? 70% | 8 ? 75% |
| PWM Frequency (Hz) | 24040 ? | |||||
| Screen | 27% | 40% | 29% | 37% | 47% | |
| Brightness middle (cd/m²) | 266.5 | 308 16% | 347 30% | 259.5 -3% | 288 8% | 470 76% |
| Brightness (cd/m²) | 262 | 288 10% | 328 25% | 264 1% | 270 3% | 468 79% |
| Brightness Distribution (%) | 91 | 86 -5% | 89 -2% | 90 -1% | 89 -2% | 85 -7% |
| Black Level * (cd/m²) | 0.18 | 0.23 -28% | 0.27 -50% | 0.25 -39% | 0.25 -39% | 0.21 -17% |
| Contrast (:1) | 1481 | 1339 -10% | 1285 -13% | 1038 -30% | 1152 -22% | 2238 51% |
| Colorchecker dE 2000 * | 5.33 | 3.28 38% | 1.66 69% | 2.52 53% | 1.19 78% | 3.28 38% |
| Colorchecker dE 2000 max. * | 18.28 | 8.51 53% | 3.03 83% | 5.55 70% | 3.79 79% | 7.31 60% |
| Colorchecker dE 2000 calibrated * | 4.36 | 0.83 81% | 1.23 72% | 1.93 56% | 0.71 84% | 0.8 82% |
| Greyscale dE 2000 * | 4.5 | 5 -11% | 1.6 64% | 1.7 62% | 1.6 64% | 4.49 -0% |
| Gamma | 2.35 94% | 2.057 107% | 2.278 97% | 2.04 108% | 2.229 99% | 2.4 92% |
| CCT | 6289 103% | 7393 88% | 6430 101% | 6414 101% | 6539 99% | 7438 87% |
| Color Space (Percent of AdobeRGB 1998) (%) | 35.6 | 68 91% | 71 99% | 63.3 78% | 67 88% | 65 83% |
| Color Space (Percent of sRGB) (%) | 55.8 | 90 61% | 94 68% | 98.8 77% | 90 61% | 99 77% |
| Media totale (Programma / Settaggio) | 59% /
42% | 62% /
51% | 56% /
43% | 61% /
48% | 69% /
58% |
* ... Meglio usare valori piccoli
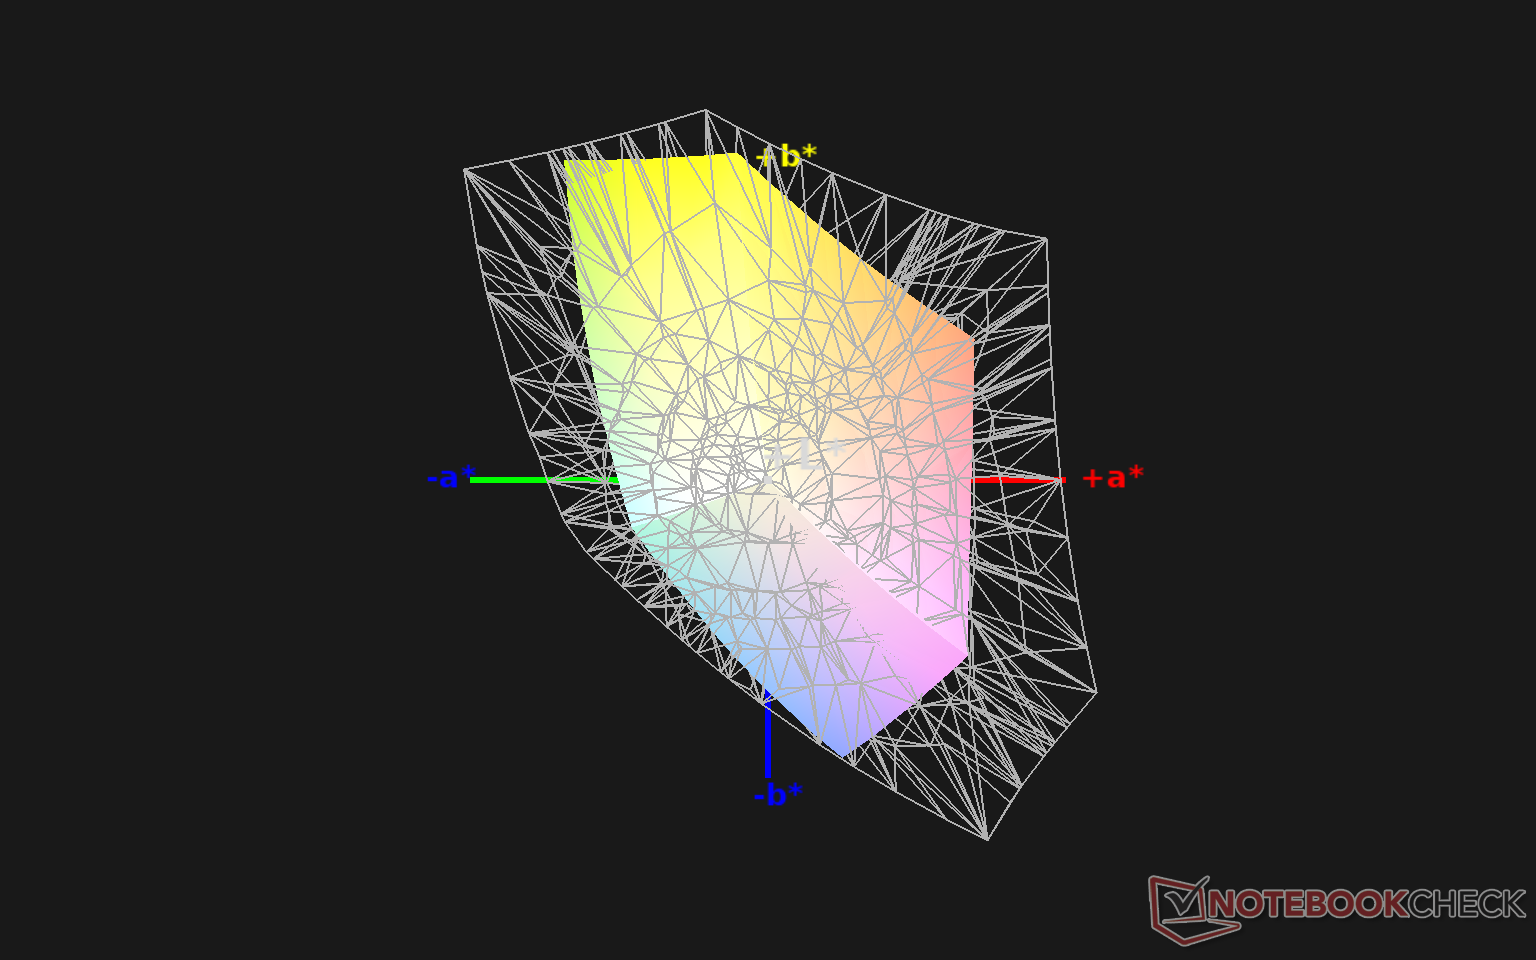
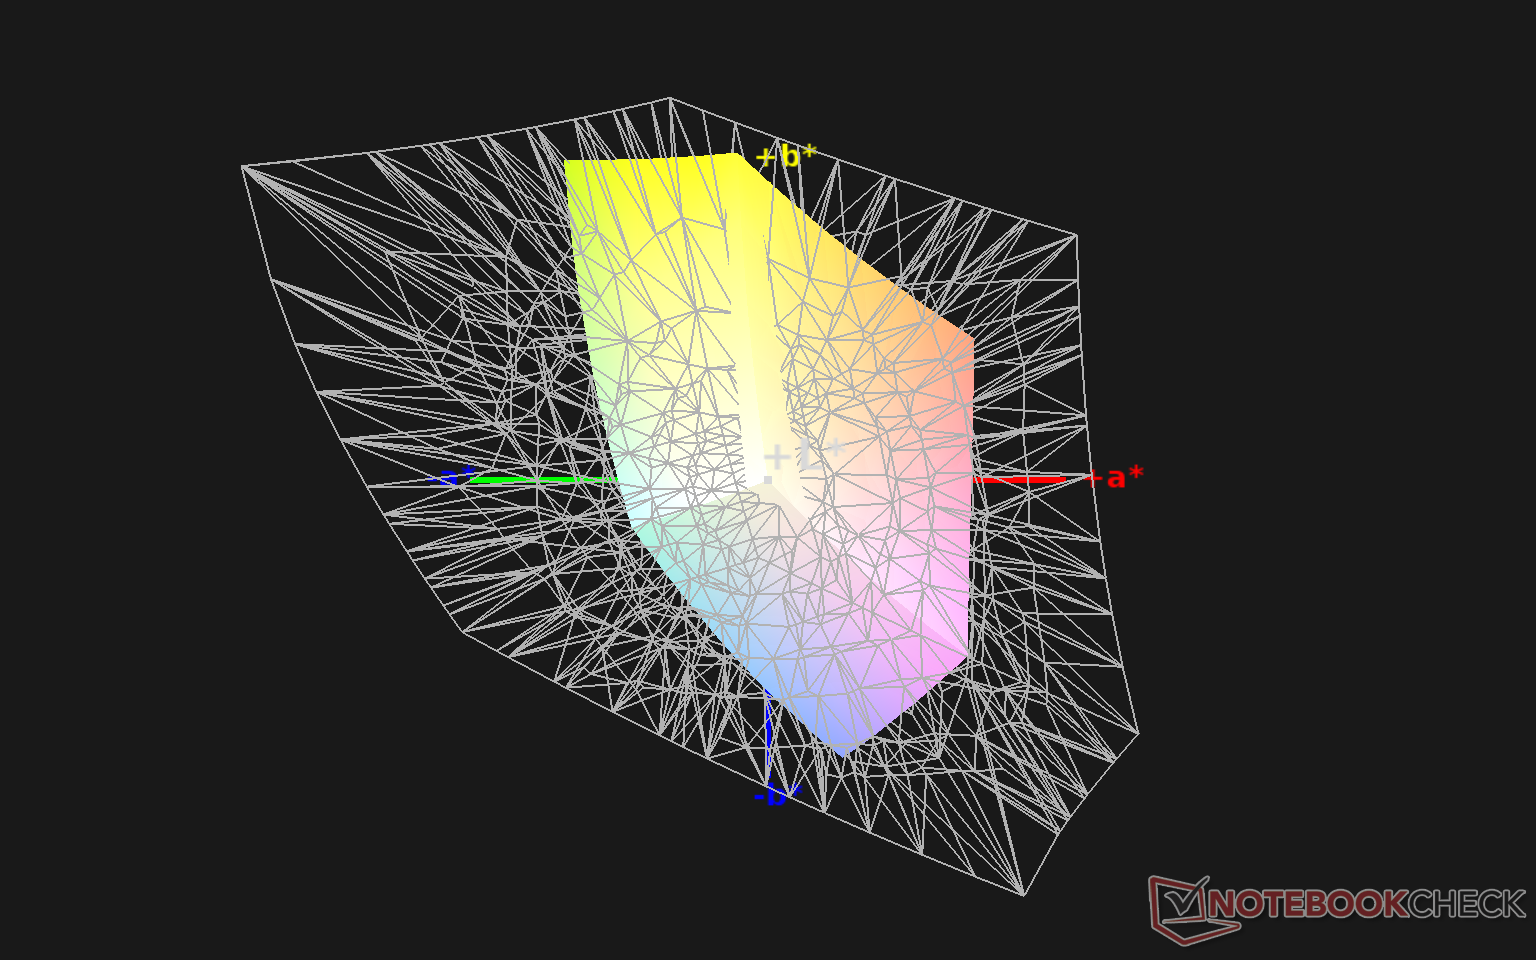
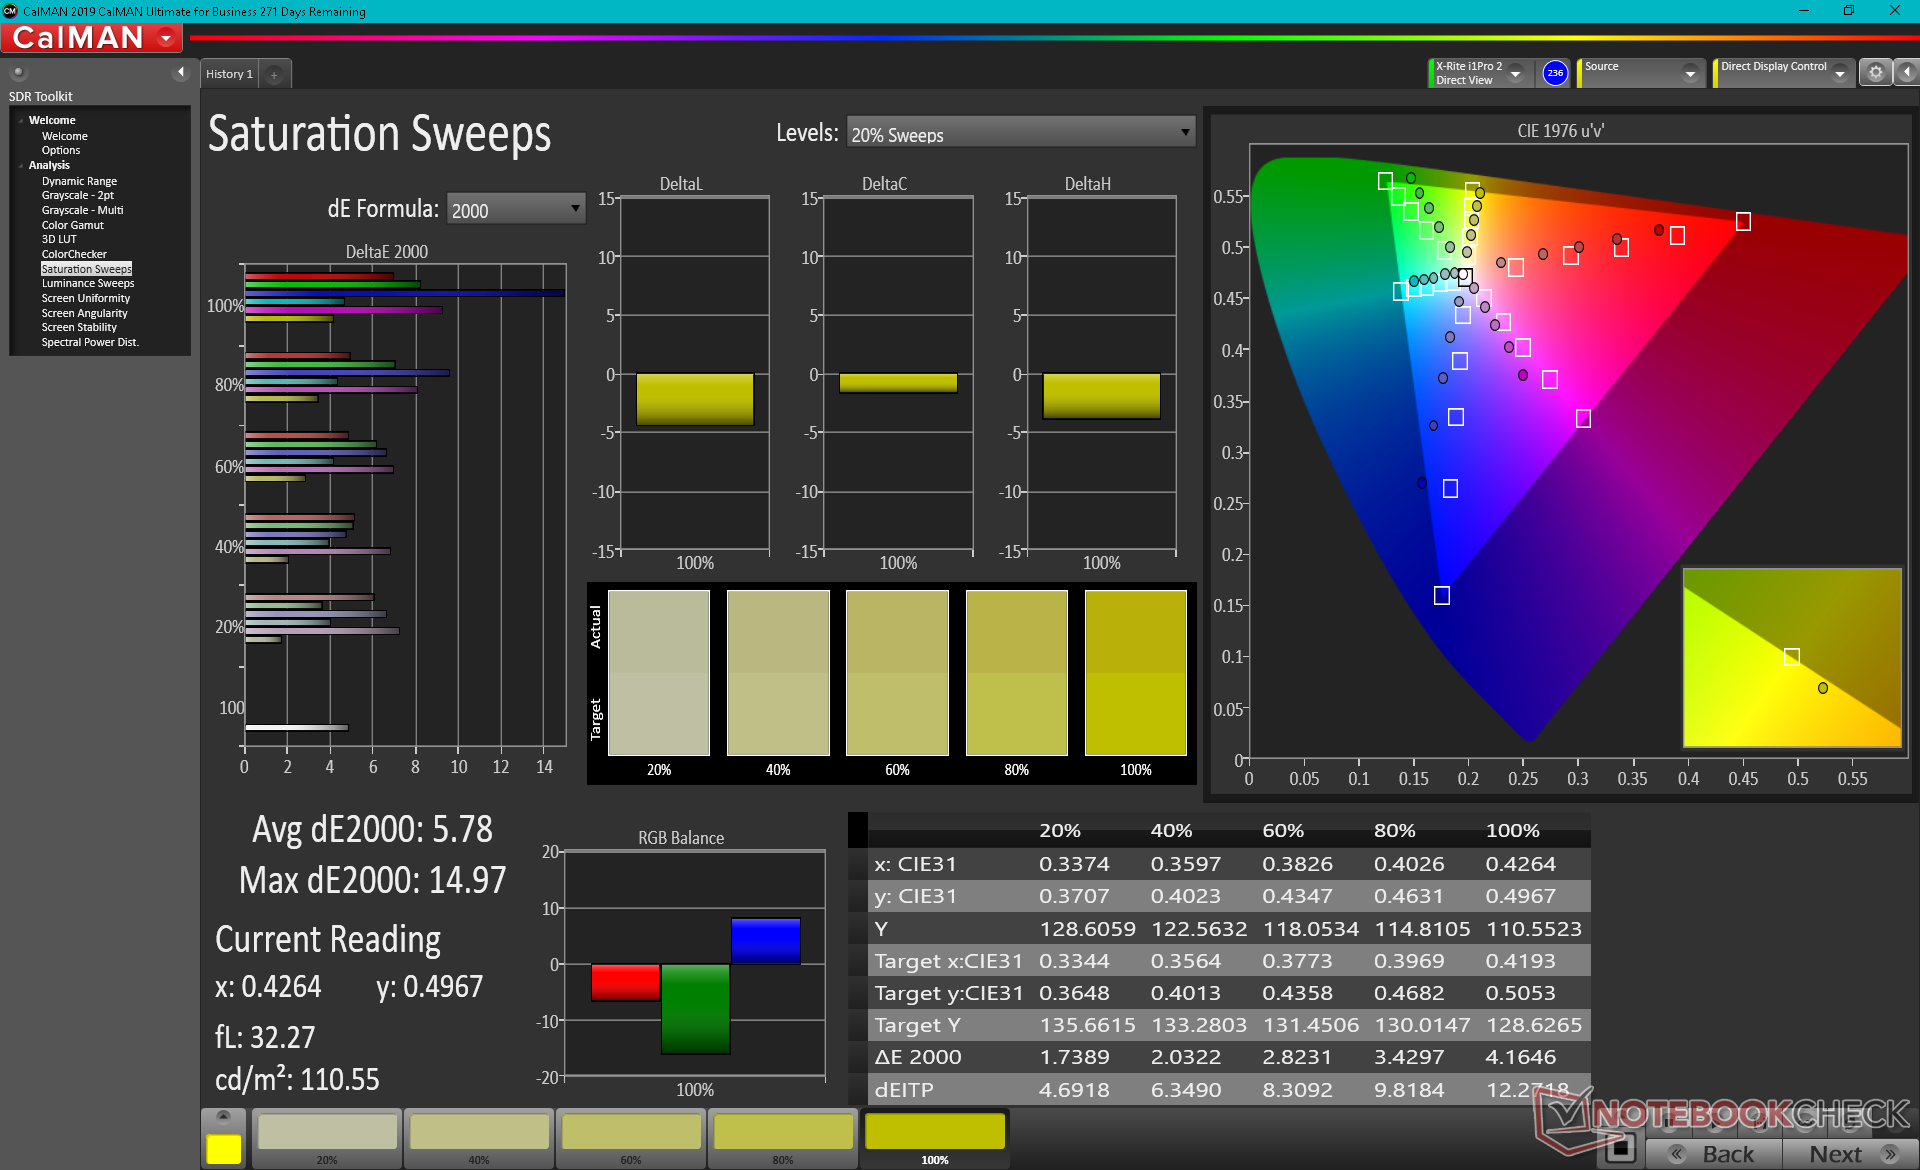
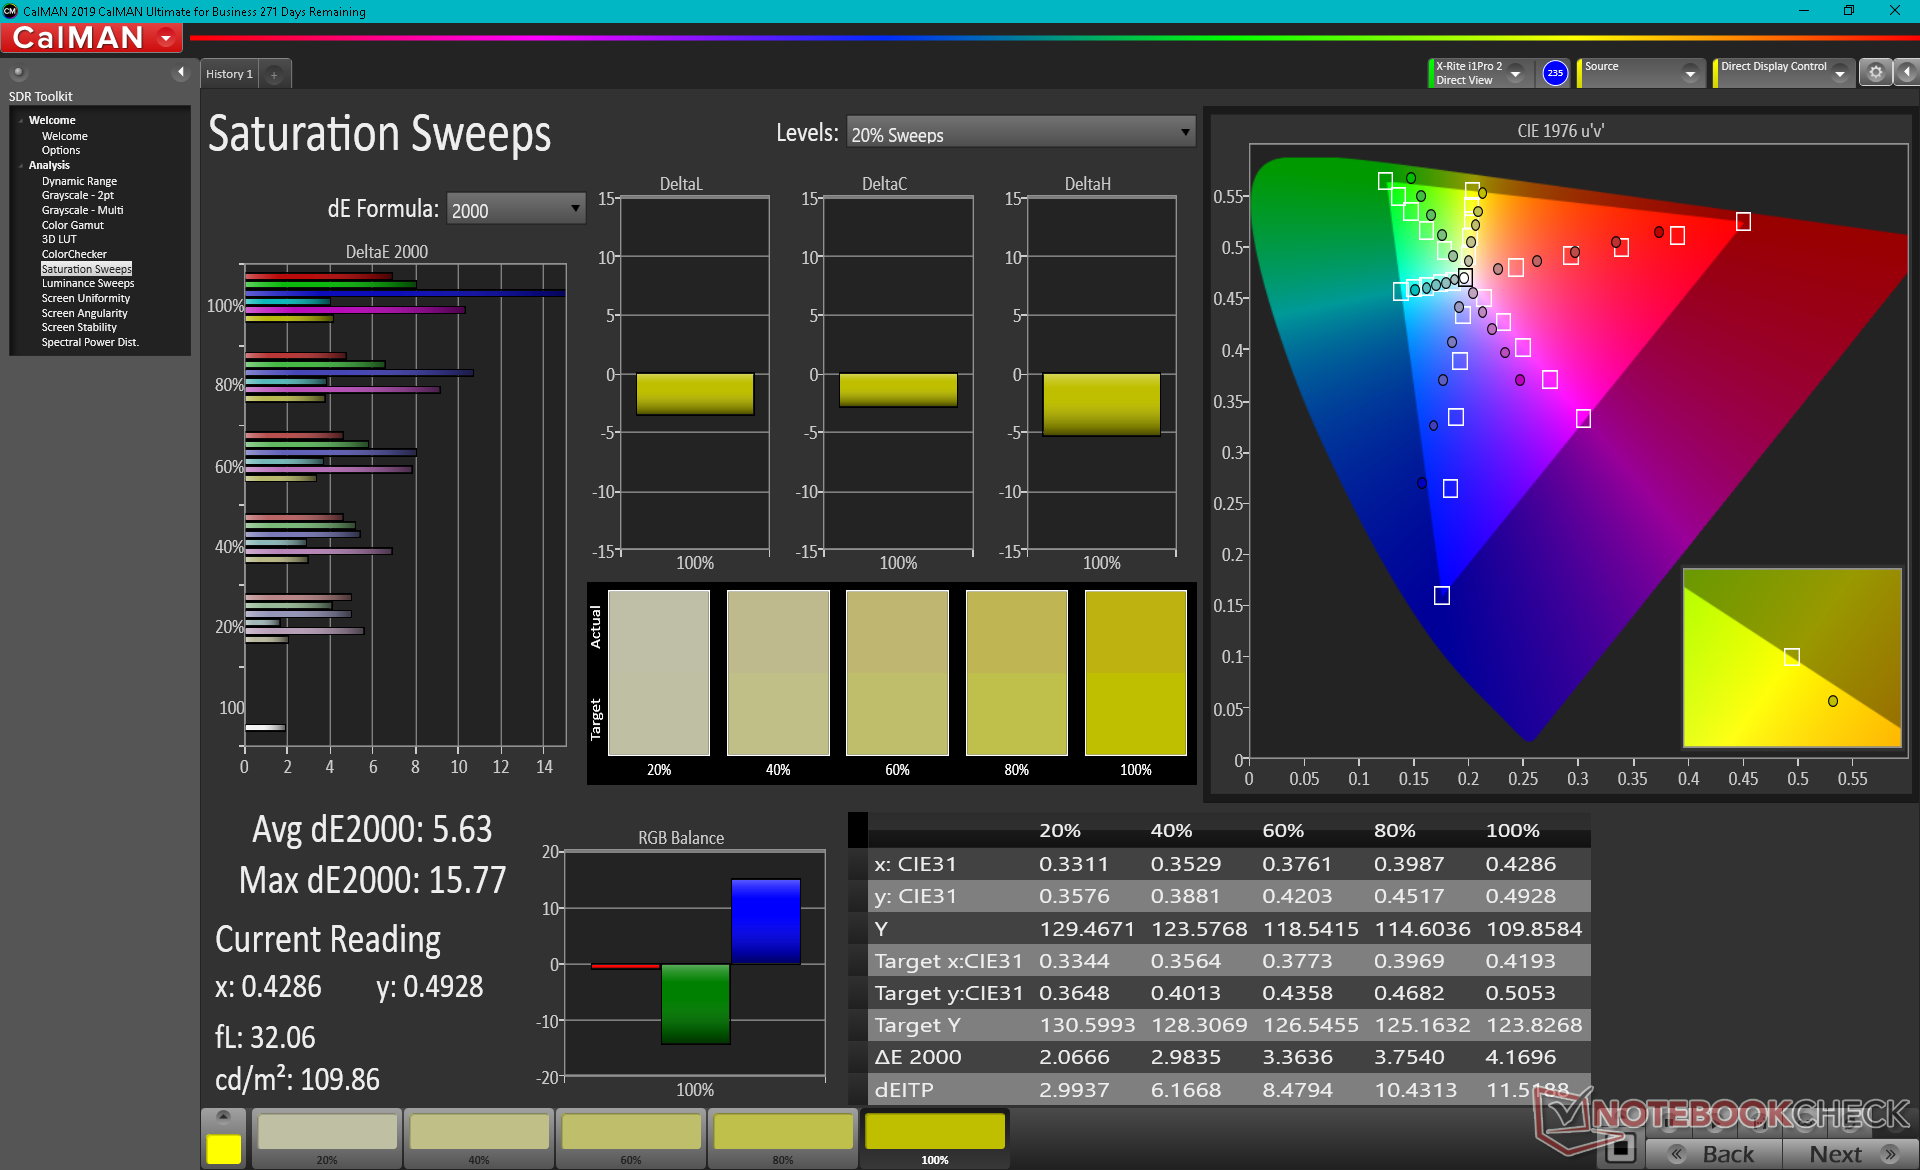
Lo spazio colore copre solo il 56% e il 36% di sRGB e AdobeRGB, rispettivamente, risultato indicativo di un pannello economico nonostante l'alta frequenza di aggiornamento nativa di 144 Hz. La maggior parte degli Ultrabooks di fascia media o migliore o dei portatili gaming coprono almeno il 90% di sRGB per colori più profondi. I colori limitati qui non sono un problema quando si gioca, ma gli editor grafici vorranno evitare di usare questo pannello.
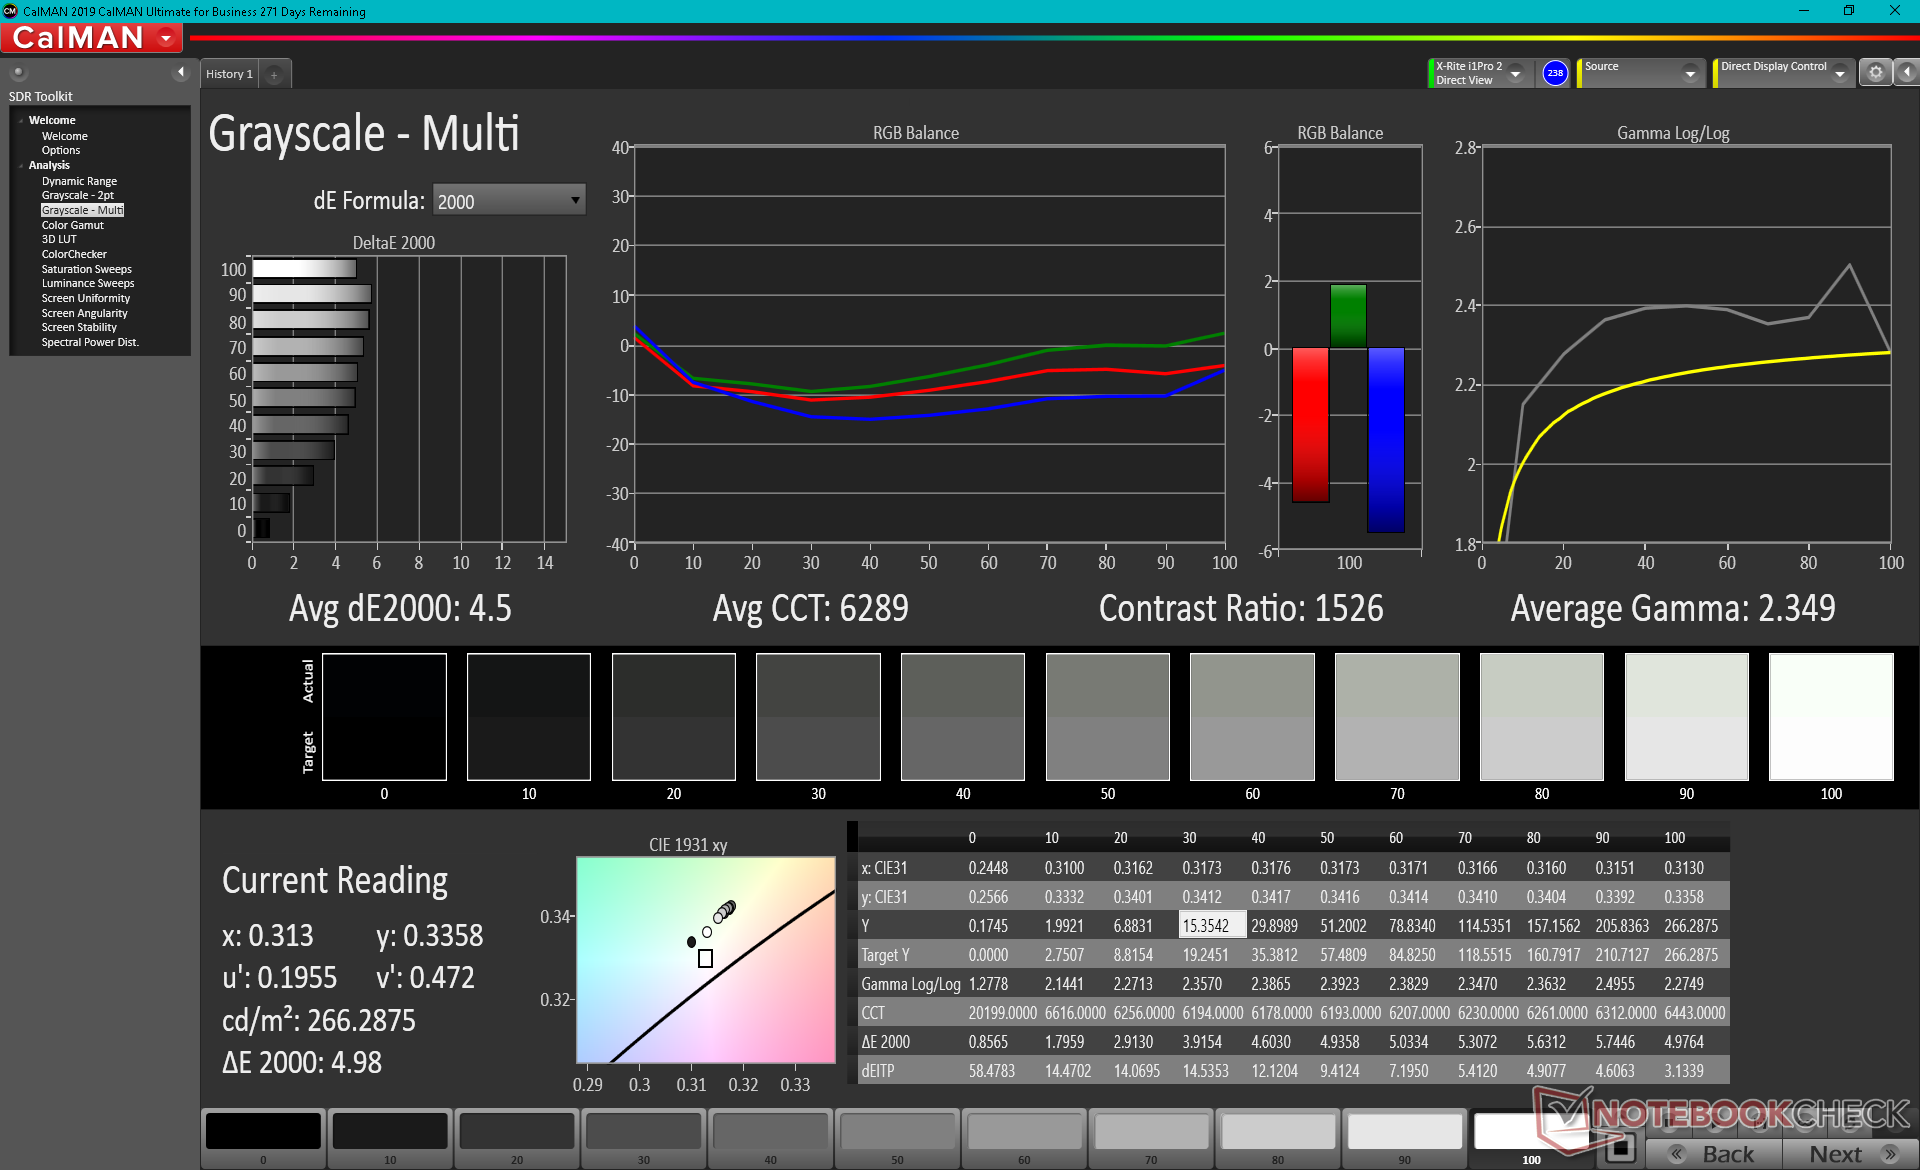
Le misurazioni del colorimetro X-Rite mostrano una temperatura di colore troppo calda, che la nostra calibrazione è in grado di correggere per livelli di scala di grigi più precisi. La precisione del colore, comunque, rimane sotto la media specialmente quando si trovano a livelli di saturazione più alti a causa del ristretto spazio di colore menzionato sopra. Il blu in particolare è rappresentato in modo più impreciso di ogni altro colore testato con un ampio margine.
Tempi di risposta del Display
| ↔ Tempi di risposta dal Nero al Bianco | ||
|---|---|---|
| 31.6 ms ... aumenta ↗ e diminuisce ↘ combinato | ↗ 18.4 ms Incremento | 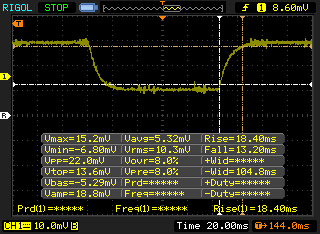 |
| ↘ 13.2 ms Calo | ||
| Lo schermo mostra tempi di risposta lenti nei nostri tests e sarà insoddisfacente per i gamers. In confronto, tutti i dispositivi di test variano da 0.1 (minimo) a 240 (massimo) ms. » 85 % di tutti i dispositivi è migliore. Questo significa che i tempi di risposta rilevati sono peggiori rispetto alla media di tutti i dispositivi testati (19.9 ms). | ||
| ↔ Tempo di risposta dal 50% Grigio all'80% Grigio | ||
| 36.8 ms ... aumenta ↗ e diminuisce ↘ combinato | ↗ 19.2 ms Incremento | 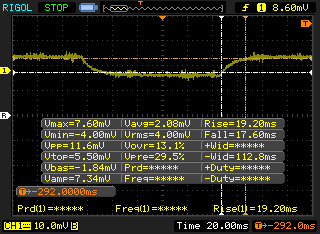 |
| ↘ 17.6 ms Calo | ||
| Lo schermo mostra tempi di risposta lenti nei nostri tests e sarà insoddisfacente per i gamers. In confronto, tutti i dispositivi di test variano da 0.165 (minimo) a 636 (massimo) ms. » 53 % di tutti i dispositivi è migliore. Questo significa che i tempi di risposta rilevati sono peggiori rispetto alla media di tutti i dispositivi testati (31.1 ms). | ||
Sfarfallio dello schermo / PWM (Pulse-Width Modulation)
| flickering dello schermo / PWM non rilevato | 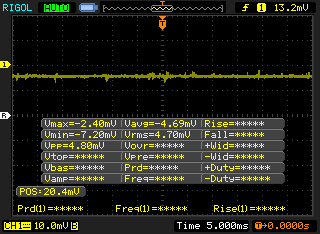 | ||
In confronto: 52 % di tutti i dispositivi testati non utilizza PWM per ridurre la luminosita' del display. Se è rilevato PWM, una media di 7798 (minimo: 5 - massimo: 343500) Hz è stata rilevata. | |||
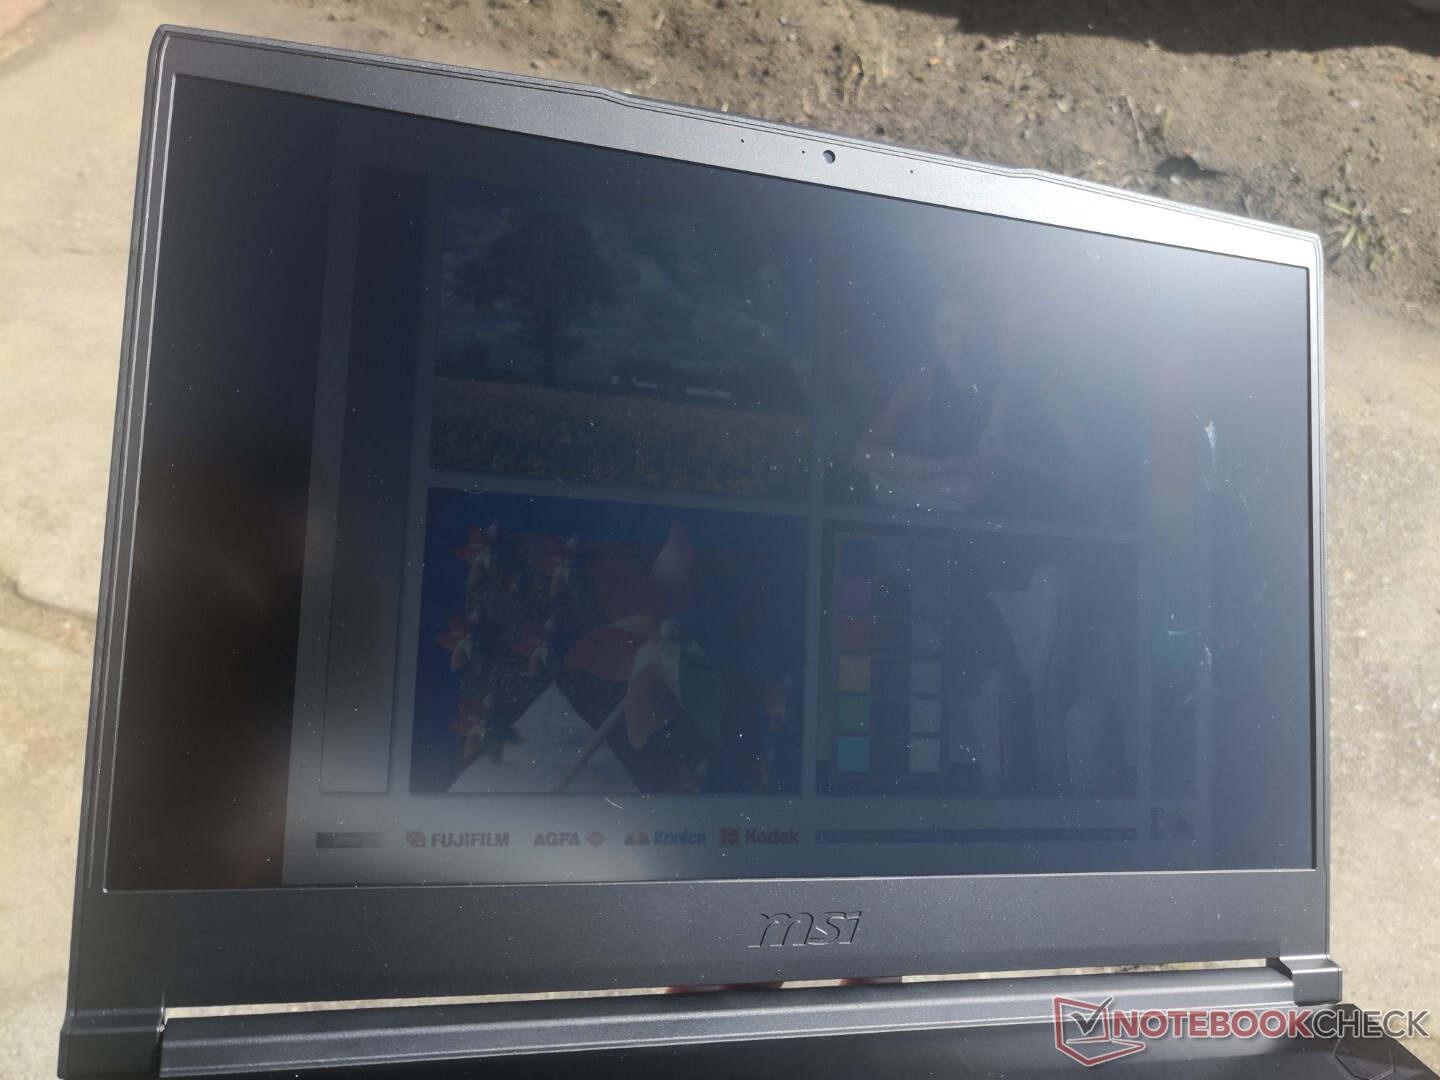
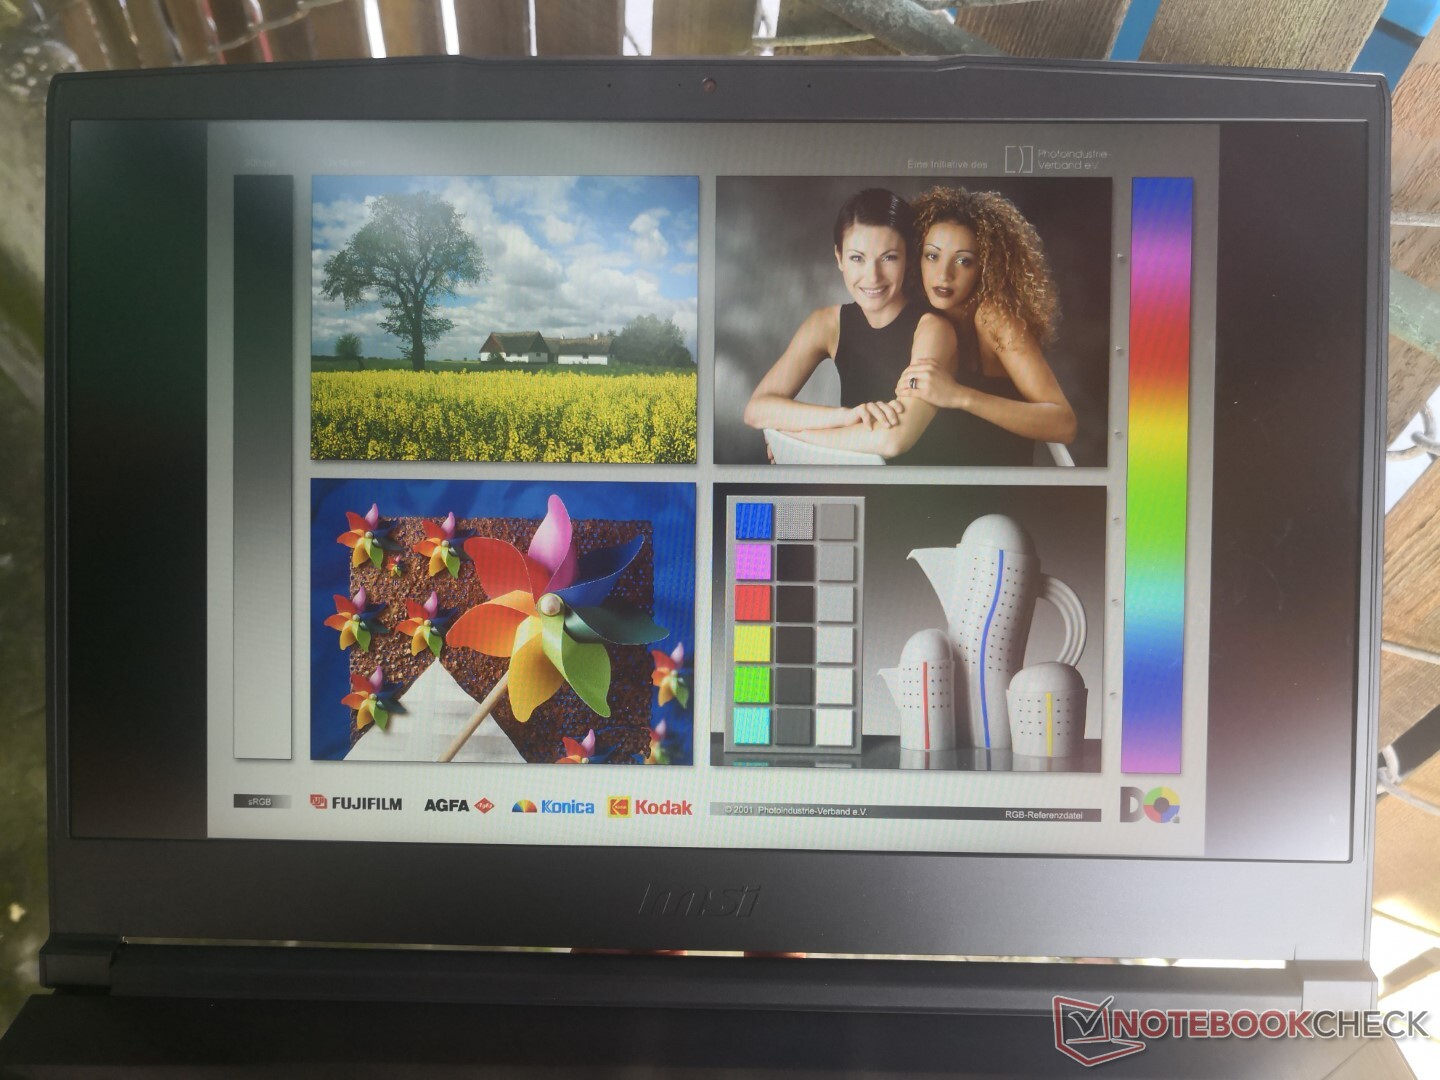
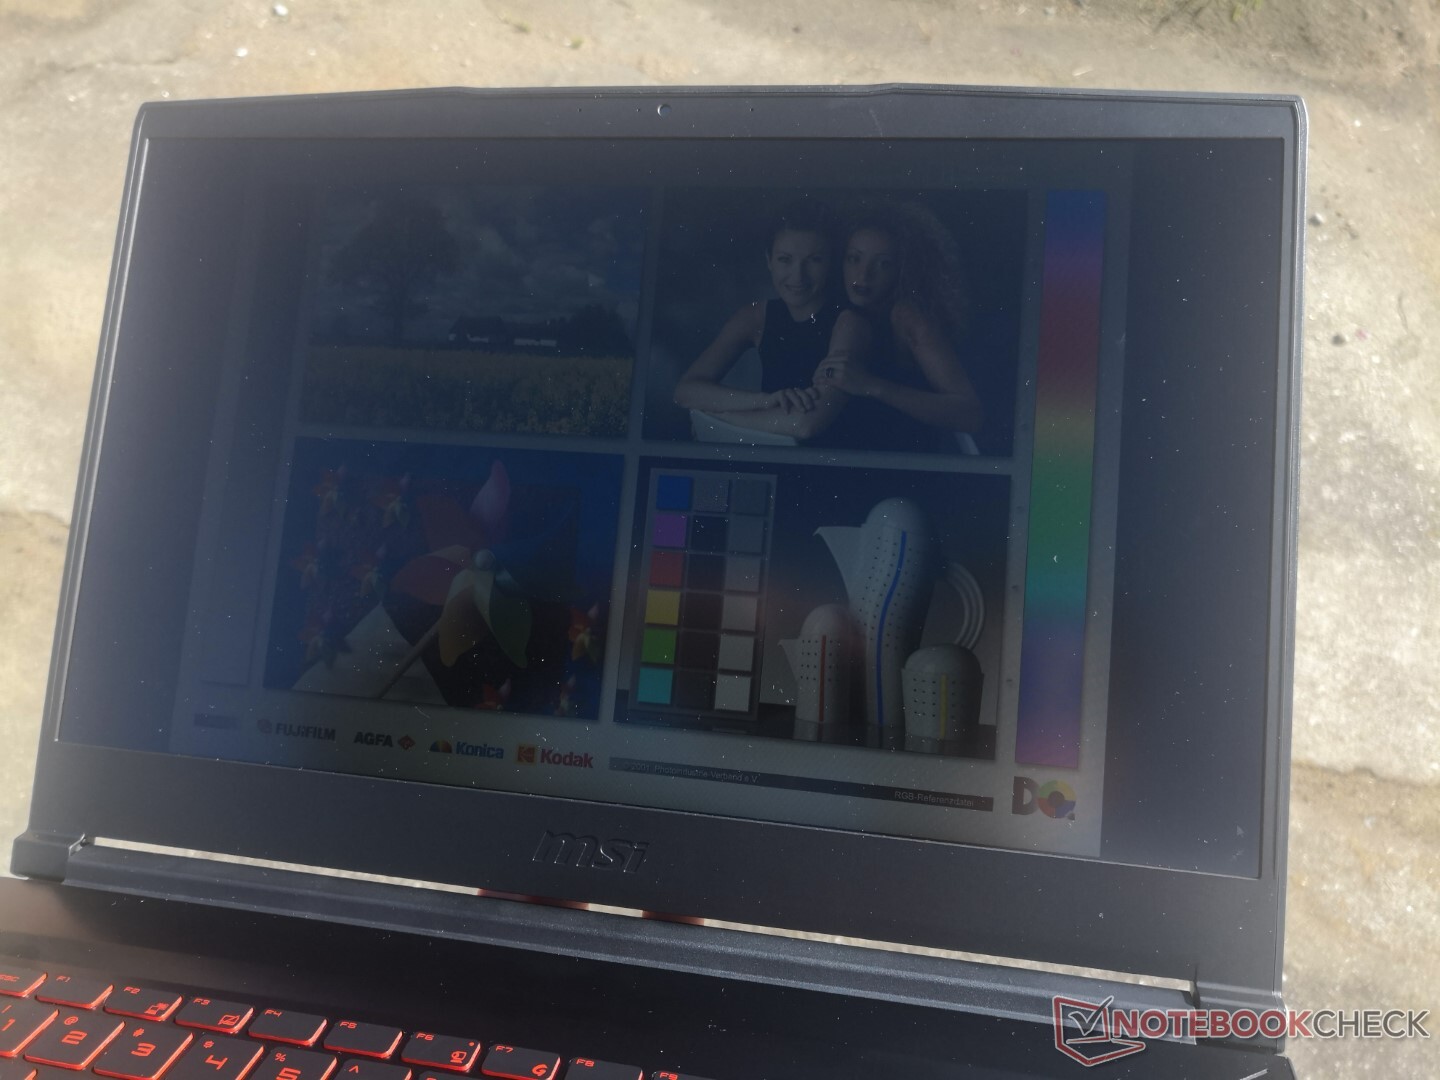
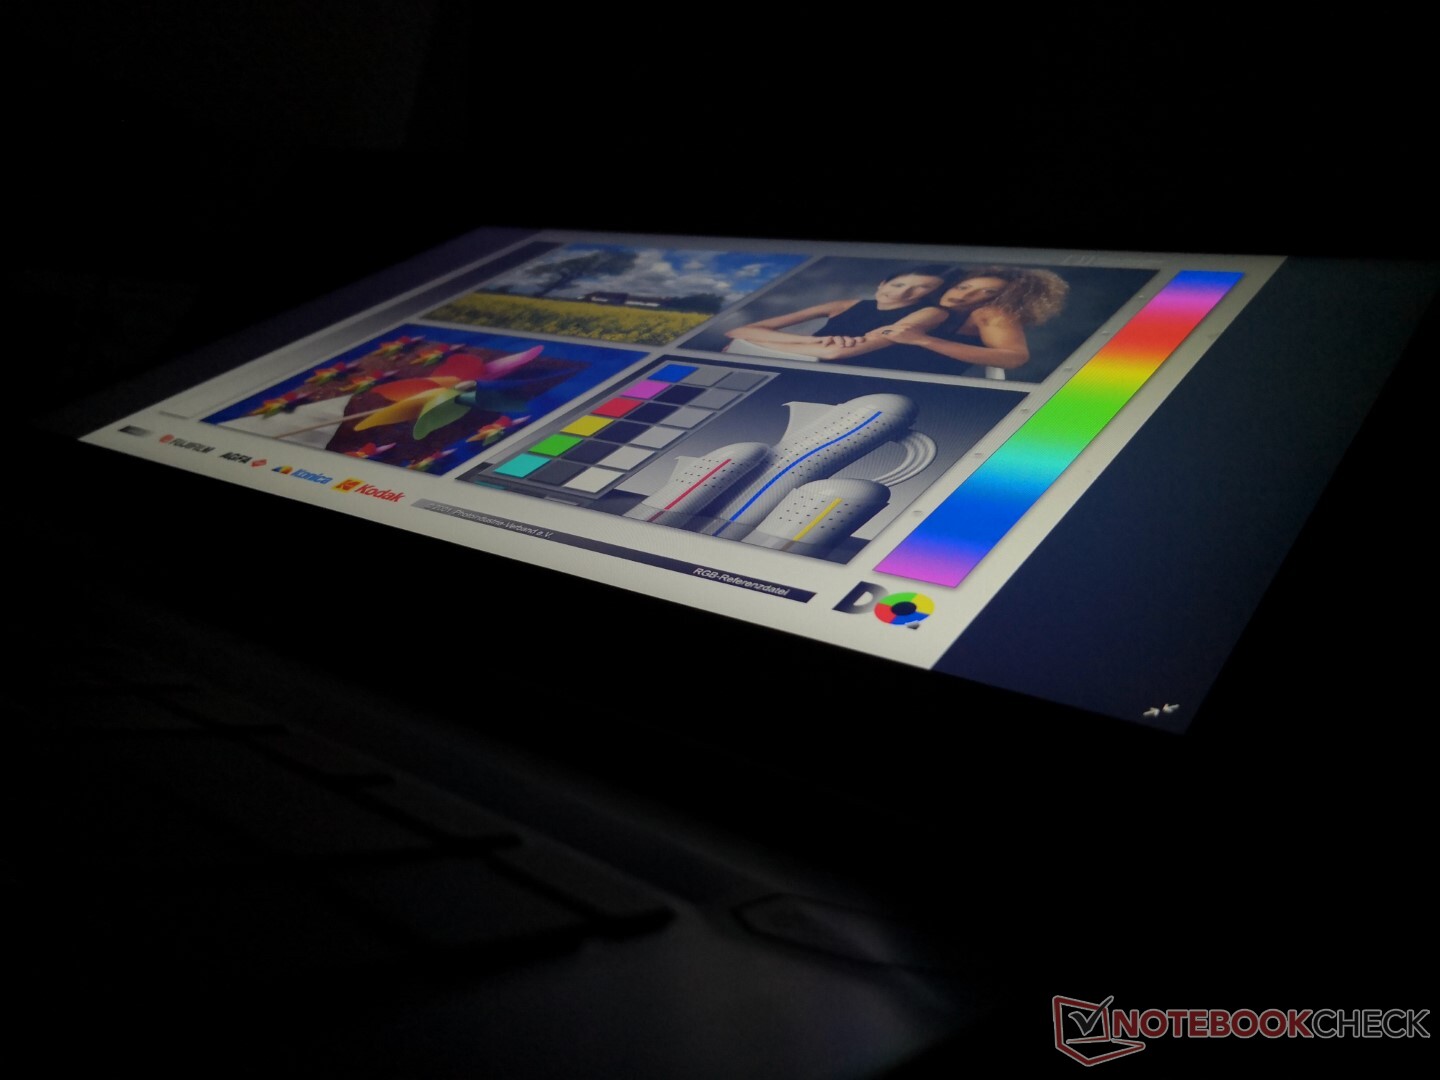
La visibilità all'aperto è sotto la media, dato che il display non è più luminoso o meno luminoso del GF65 9SD uscente. La luminosità massima è un po' più bassa rispetto alla maggior parte dei portatili gaming, dove 300 nits o più sono più comuni.
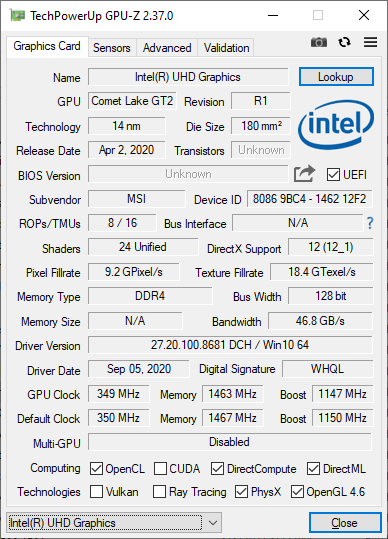
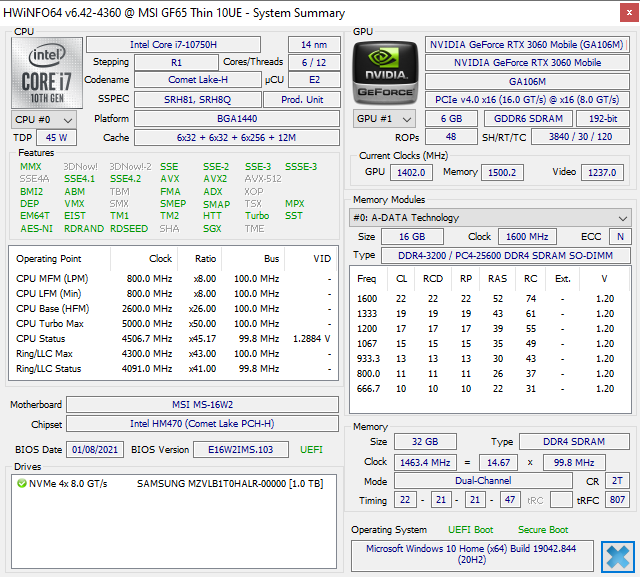
Prestazioni
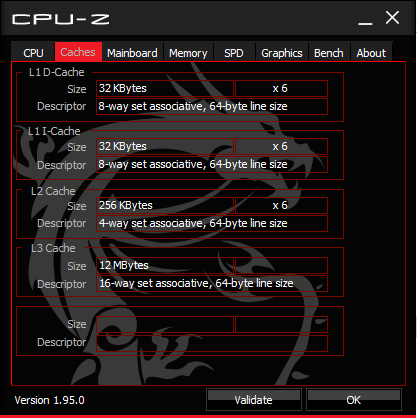
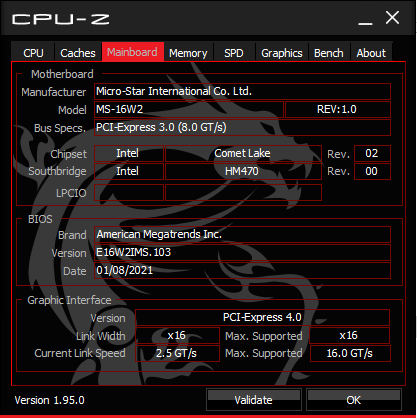
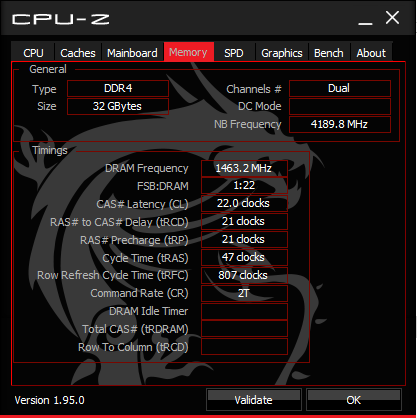
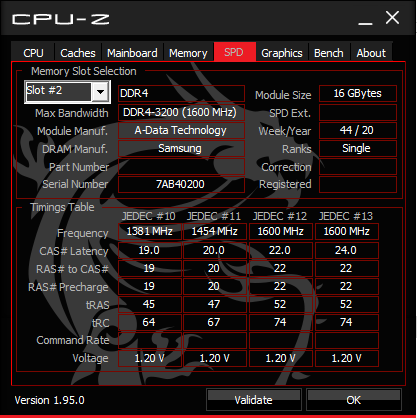
MSI ha aggiornato il display (da 120 Hz a 144 Hz) e la RAM (da 2666 MHz a 3200 MHz) dal vecchio GF65 9SD. La CPU e la GPU sono state aggiornate rispettivamente da Coffee Lake-H a Comet Lake-H e da Nvidia Turing a Ampere.
Sono disponibili anche versioni Core i5-10200H e i5-10500H inferiori, ma il display IPS a 144 Hz e GeForce RTX 3060 rimangono fissi su tutte le configurazioni al momento della recensione.
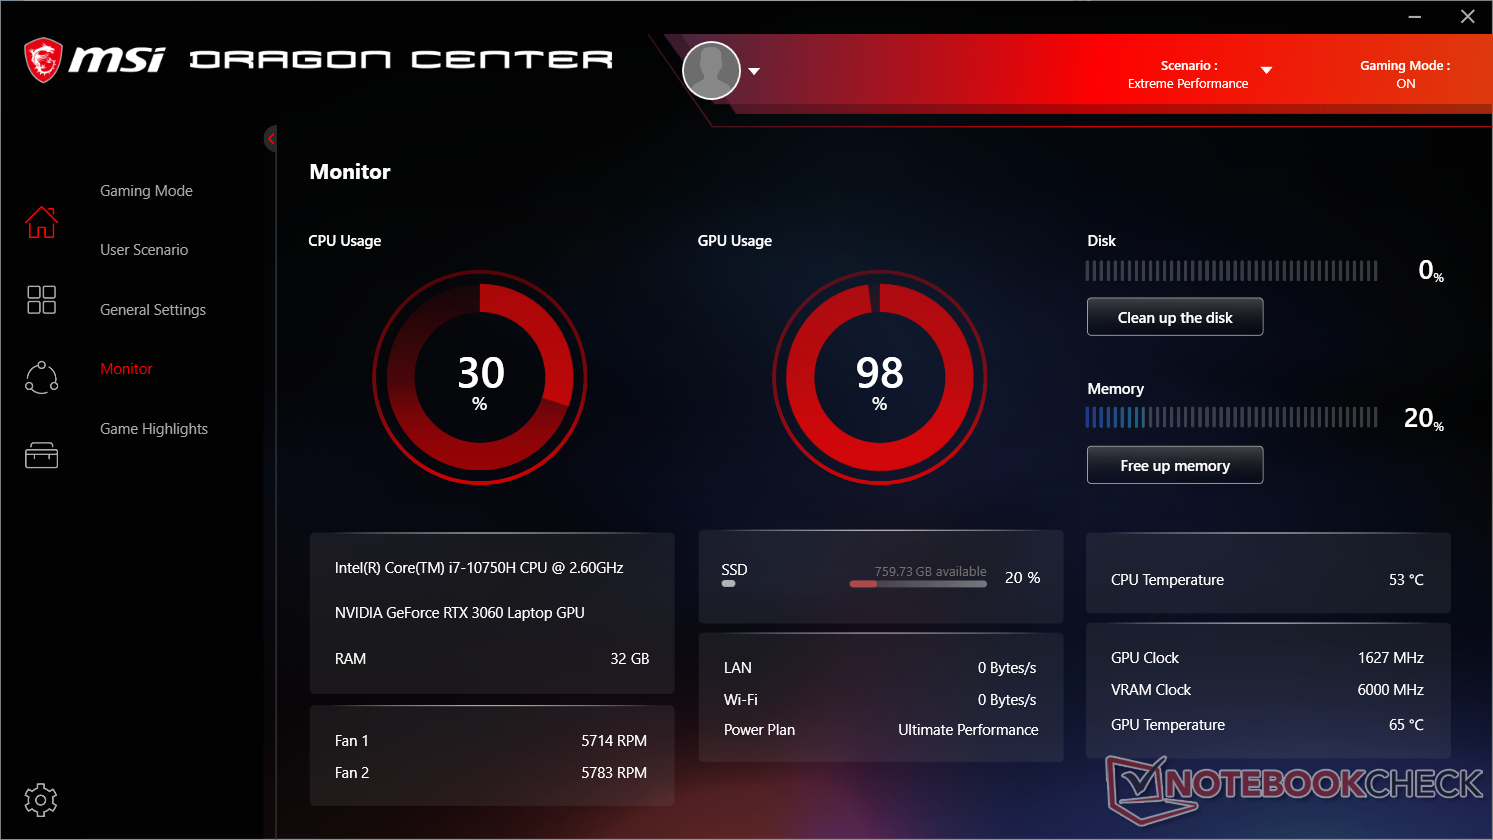
Abbiamo impostato il nostro sistema sulla modalità MSI Extreme Performance prima di eseguire qualsiasi benchmark di prestazioni qui sotto.
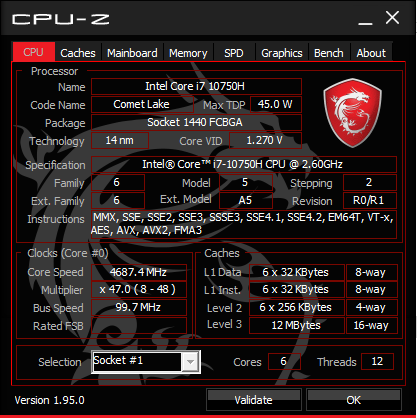
Processore
Le prestazioni della CPU multi-thread sono più lente della media del Core i7-10750H nel nostro database di circa il 10-15%. Infatti, il vecchio Core i7-9750H nel Maingear Vector 15 è in grado di superare costantemente il nostro MSI di qualche punto percentuale nei carichi multi-thread. Per prestazioni più elevate, gli utenti dovrebbero abilitare la modalità Cooler Boost (o la modalità massima della ventola) come dettagliato nella nostra sezione Stress Test qui sotto.
Cinebench R15: CPU Multi 64Bit | CPU Single 64Bit
Blender: v2.79 BMW27 CPU
7-Zip 18.03: 7z b 4 -mmt1 | 7z b 4
Geekbench 5.5: Single-Core | Multi-Core
HWBOT x265 Benchmark v2.2: 4k Preset
LibreOffice : 20 Documents To PDF
R Benchmark 2.5: Overall mean
| Blender / v2.79 BMW27 CPU | |
| Gateway Creator Series 15.6 GWTN156-3BK | |
| MSI GF65 Thin 10UE | |
| Media Intel Core i7-10750H (322 - 587, n=43) | |
| HP Pavilion Gaming 15-ec1206ng | |
| Asus Zephyrus G14 GA401IV | |
| Aorus 15P XC | |
| Asus ROG Strix Scar 15 G532LWS | |
| Schenker XMG Core 15 Ampere | |
| 7-Zip 18.03 / 7z b 4 -mmt1 | |
| Asus ROG Strix Scar 15 G532LWS | |
| Aorus 15P XC | |
| MSI GF65 Thin 10UE | |
| Media Intel Core i7-10750H (4504 - 5470, n=43) | |
| Schenker XMG Core 15 Ampere | |
| Asus Zephyrus G14 GA401IV | |
| Gateway Creator Series 15.6 GWTN156-3BK | |
| HP Pavilion Gaming 15-ec1206ng | |
| 7-Zip 18.03 / 7z b 4 | |
| Schenker XMG Core 15 Ampere | |
| Asus Zephyrus G14 GA401IV | |
| Asus ROG Strix Scar 15 G532LWS | |
| Aorus 15P XC | |
| HP Pavilion Gaming 15-ec1206ng | |
| Media Intel Core i7-10750H (26040 - 37345, n=43) | |
| MSI GF65 Thin 10UE | |
| Gateway Creator Series 15.6 GWTN156-3BK | |
| Geekbench 5.5 / Single-Core | |
| Asus ROG Strix Scar 15 G532LWS | |
| MSI GF65 Thin 10UE | |
| Aorus 15P XC | |
| Media Intel Core i7-10750H (1114 - 1333, n=43) | |
| Asus Zephyrus G14 GA401IV | |
| Schenker XMG Core 15 Ampere | |
| HP Pavilion Gaming 15-ec1206ng | |
| Gateway Creator Series 15.6 GWTN156-3BK | |
| Geekbench 5.5 / Multi-Core | |
| Asus ROG Strix Scar 15 G532LWS | |
| Schenker XMG Core 15 Ampere | |
| Aorus 15P XC | |
| Asus Zephyrus G14 GA401IV | |
| MSI GF65 Thin 10UE | |
| Media Intel Core i7-10750H (4443 - 6674, n=43) | |
| HP Pavilion Gaming 15-ec1206ng | |
| Gateway Creator Series 15.6 GWTN156-3BK | |
| HWBOT x265 Benchmark v2.2 / 4k Preset | |
| Schenker XMG Core 15 Ampere | |
| Asus ROG Strix Scar 15 G532LWS | |
| Aorus 15P XC | |
| Asus Zephyrus G14 GA401IV | |
| HP Pavilion Gaming 15-ec1206ng | |
| Media Intel Core i7-10750H (5.54 - 11.6, n=43) | |
| MSI GF65 Thin 10UE | |
| Gateway Creator Series 15.6 GWTN156-3BK | |
| LibreOffice / 20 Documents To PDF | |
| HP Pavilion Gaming 15-ec1206ng | |
| Schenker XMG Core 15 Ampere | |
| Gateway Creator Series 15.6 GWTN156-3BK | |
| Aorus 15P XC | |
| Media Intel Core i7-10750H (43.1 - 99.2, n=43) | |
| Asus ROG Strix Scar 15 G532LWS | |
| MSI GF65 Thin 10UE | |
| R Benchmark 2.5 / Overall mean | |
| Gateway Creator Series 15.6 GWTN156-3BK | |
| Media Intel Core i7-10750H (0.578 - 0.708, n=42) | |
| HP Pavilion Gaming 15-ec1206ng | |
| MSI GF65 Thin 10UE | |
| Aorus 15P XC | |
| Schenker XMG Core 15 Ampere | |
| Asus ROG Strix Scar 15 G532LWS | |
* ... Meglio usare valori piccoli
Prestazioni del sistema
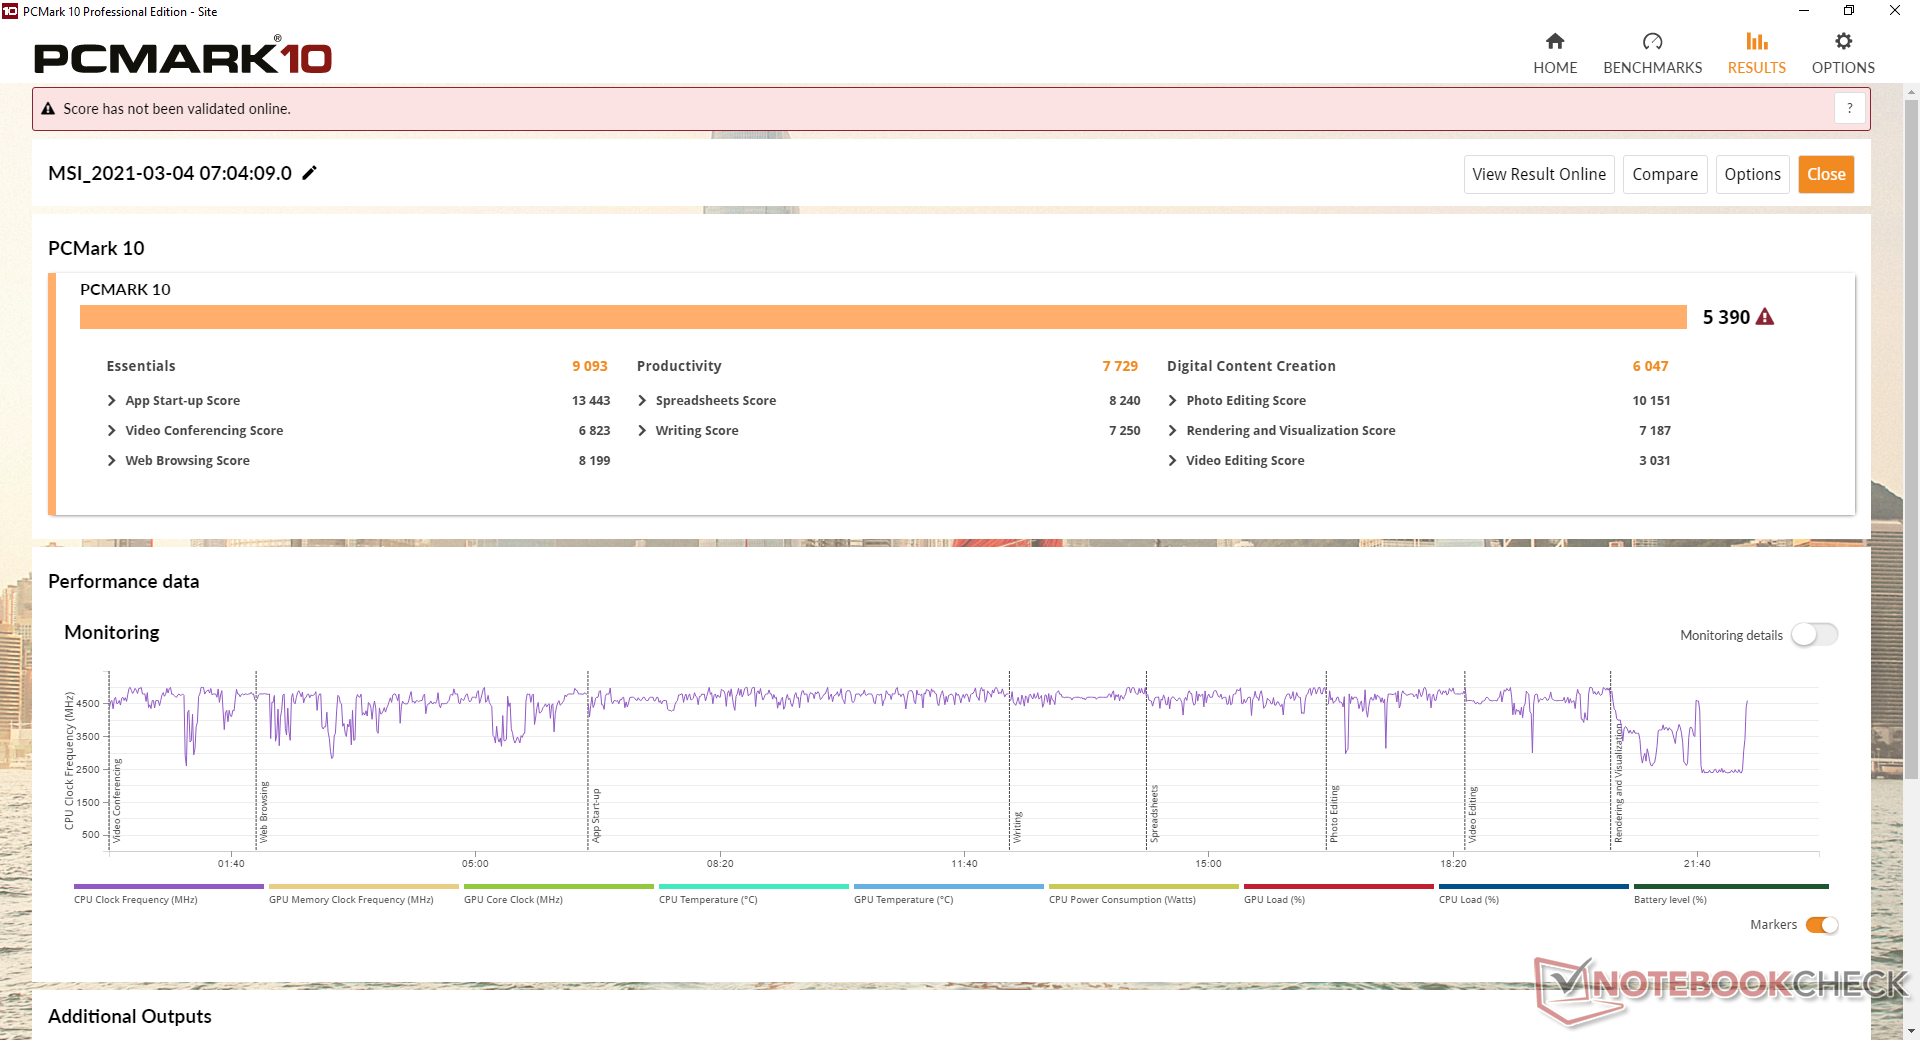
| PCMark 10 Score | 5390 punti | |
Aiuto | ||
Latenza DPC
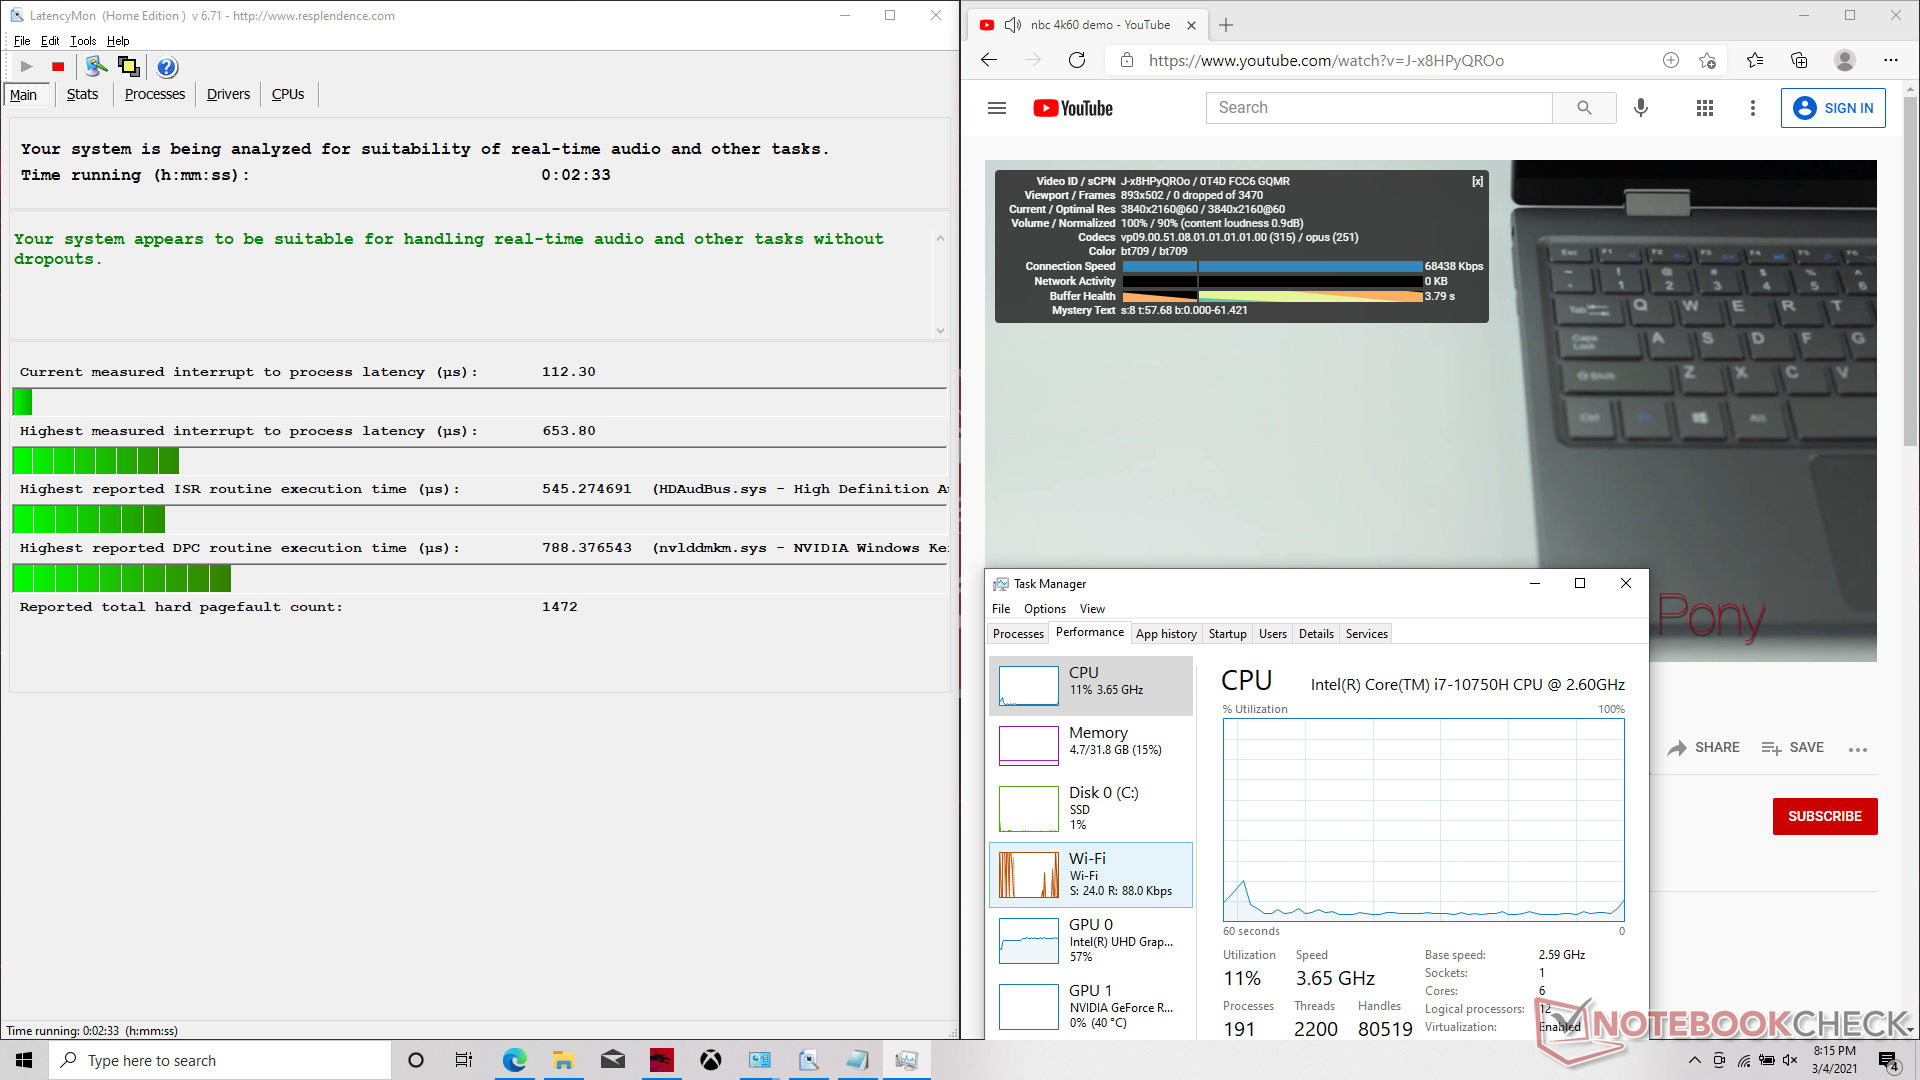
LatencyMon non mostra alcun problema di latenza DPC quando si aprono più schede del browser sulla nostra homepage e nessun fotogramma caduto durante la riproduzione di contenuti 4K60 su YouTube.
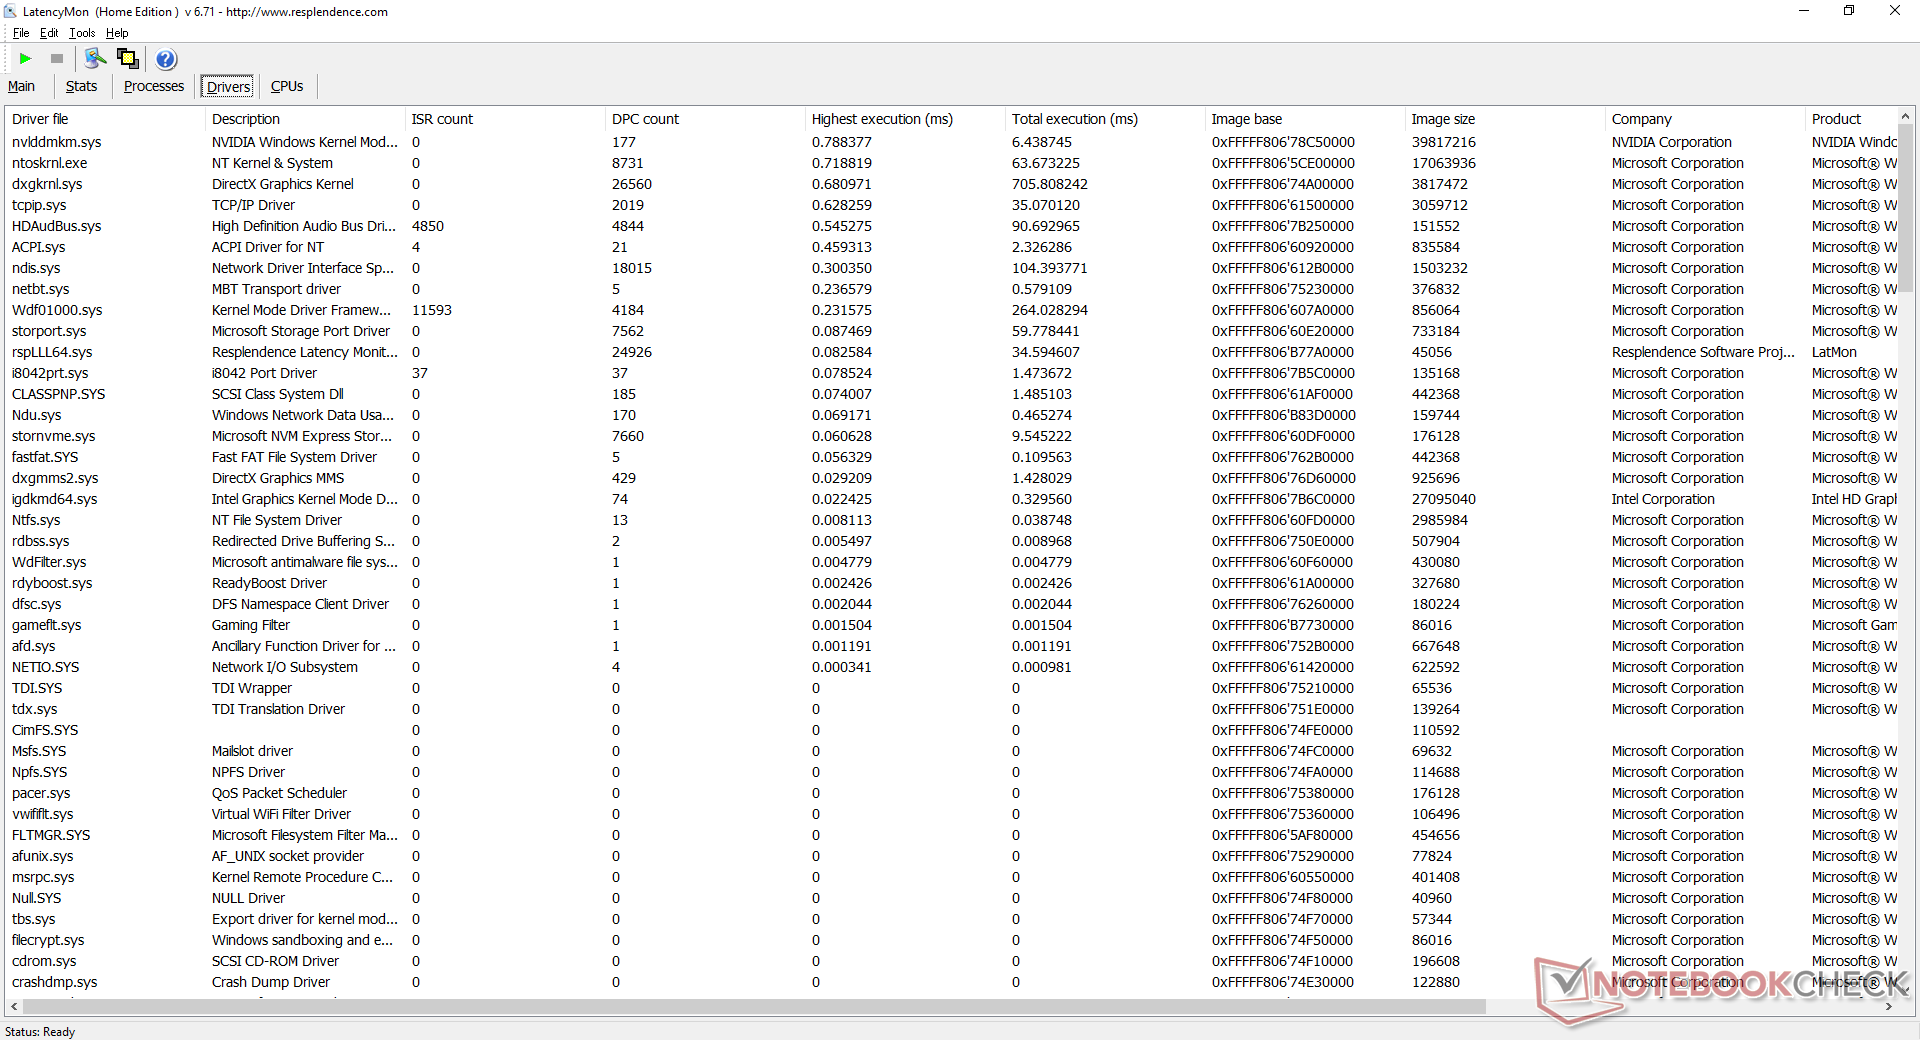
| DPC Latencies / LatencyMon - interrupt to process latency (max), Web, Youtube, Prime95 | |
| Aorus 15G XC | |
| Lenovo Legion 7 15IMH05-81YT001VGE | |
| MSI GF65 Thin 10UE | |
| MSI GS66 Stealth 10UG | |
| Schenker XMG Core 15 Ampere | |
| Asus ROG Strix G15 G513QR | |
* ... Meglio usare valori piccoli
Dispositivi di archiviazione
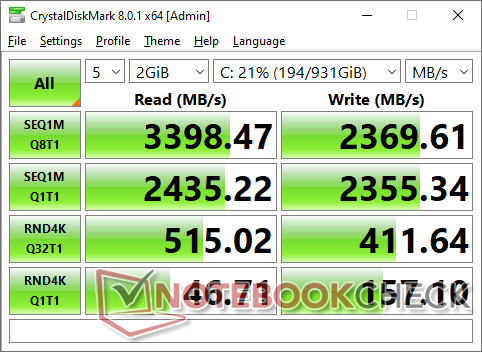
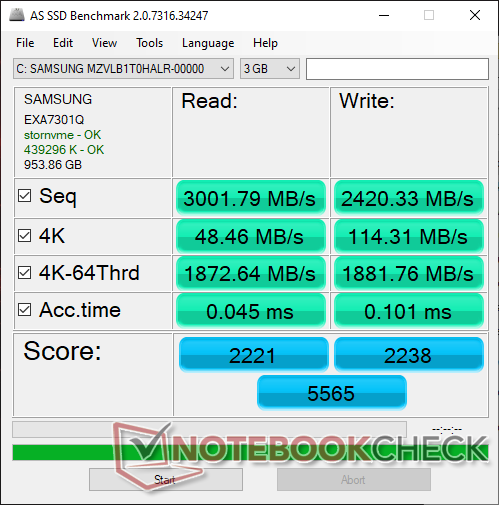
La nostra unità viene fornita con un SSD Samsung PM981 NVMe da 1 TB, ma altri venditori avranno probabilmente qualcosa di diverso a seconda della capacità desiderata e del prezzo. Siamo in grado di raggiungere e mantenere la velocità teorica di lettura sequenziale di 3200 MB/s dell'unità, come mostrato dal nostro test in loop DiskSpd qui sotto.
| MSI GF65 Thin 10UE Samsung SSD PM981 MZVLB1T0HALR | Asus ROG Strix G15 G513QR SK Hynix HFM001TD3JX013N | Schenker XMG Core 15 Ampere Samsung SSD 970 EVO Plus 1TB | MSI GS66 Stealth 10UG WDC PC SN730 SDBPNTY-1T00 | Lenovo Legion 7 15IMH05-81YT001VGE 2x Samsung PM981a MZVLB1T0HBLR (RAID 0) | |
|---|---|---|---|---|---|
| AS SSD | -7% | 10% | -4% | -7% | |
| Seq Read (MB/s) | 3002 | 2881 -4% | 2829 -6% | 2198 -27% | 3088 3% |
| Seq Write (MB/s) | 2420 | 1570 -35% | 2646 9% | 2596 7% | 2561 6% |
| 4K Read (MB/s) | 48.46 | 52.4 8% | 54.8 13% | 43.81 -10% | 43.01 -11% |
| 4K Write (MB/s) | 114.3 | 124 8% | 179.1 57% | 115.5 1% | 102 -11% |
| 4K-64 Read (MB/s) | 1873 | 1334 -29% | 1734 -7% | 1692 -10% | 1549 -17% |
| 4K-64 Write (MB/s) | 1882 | 2189 16% | 2396 27% | 2162 15% | 1378 -27% |
| Access Time Read * (ms) | 0.045 | 0.055 -22% | 0.033 27% | 0.056 -24% | 0.051 -13% |
| Access Time Write * (ms) | 0.101 | 0.03 70% | 0.021 79% | 0.098 3% | 0.037 63% |
| Score Read (Points) | 2221 | 1675 -25% | 2072 -7% | 1956 -12% | 1901 -14% |
| Score Write (Points) | 2238 | 2470 10% | 2839 27% | 2537 13% | 1737 -22% |
| Score Total (Points) | 5565 | 4943 -11% | 5965 7% | 5513 -1% | 4583 -18% |
| Copy ISO MB/s (MB/s) | 2421 | 1277 -47% | 2119 -12% | 2236 -8% | 2684 11% |
| Copy Program MB/s (MB/s) | 705 | 575 -18% | 406.1 -42% | 690 -2% | 544 -23% |
| Copy Game MB/s (MB/s) | 1490 | 1272 -15% | 1086 -27% | 1546 4% | 1116 -25% |
| CrystalDiskMark 5.2 / 6 | 14% | 4% | 8% | ||
| Write 4K (MB/s) | 157.3 | 139.1 -12% | 163.1 4% | 110.4 -30% | |
| Read 4K (MB/s) | 46.69 | 47.59 2% | 48.97 5% | 55.1 18% | |
| Write Seq (MB/s) | 2389 | 2917 22% | 2607 9% | ||
| Read Seq (MB/s) | 2196 | 2586 18% | 2316 5% | ||
| Write 4K Q32T1 (MB/s) | 407.6 | 511 25% | 338 -17% | 466.6 14% | |
| Read 4K Q32T1 (MB/s) | 519 | 571 10% | 475.6 -8% | 517 0% | |
| Write Seq Q32T1 (MB/s) | 2401 | 3263 36% | 3090 29% | 3424 43% | |
| Read Seq Q32T1 (MB/s) | 3344 | 3567 7% | 3421 2% | 3519 5% | |
| Write 4K Q8T8 (MB/s) | 1496 | ||||
| Read 4K Q8T8 (MB/s) | 1597 | ||||
| Media totale (Programma / Settaggio) | -7% /
-7% | 12% /
12% | 0% /
-1% | 1% /
-2% |
* ... Meglio usare valori piccoli

Throttling Disco: DiskSpd Read Loop, Queue Depth 8
Prestazioni della GPU
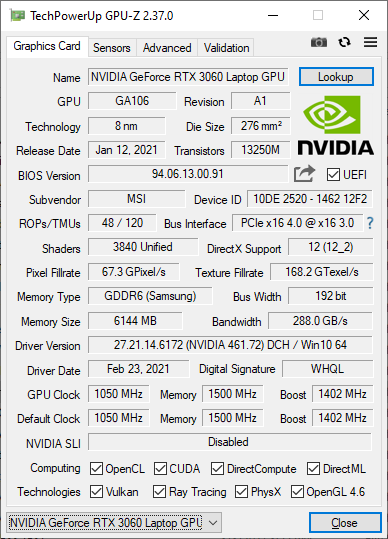
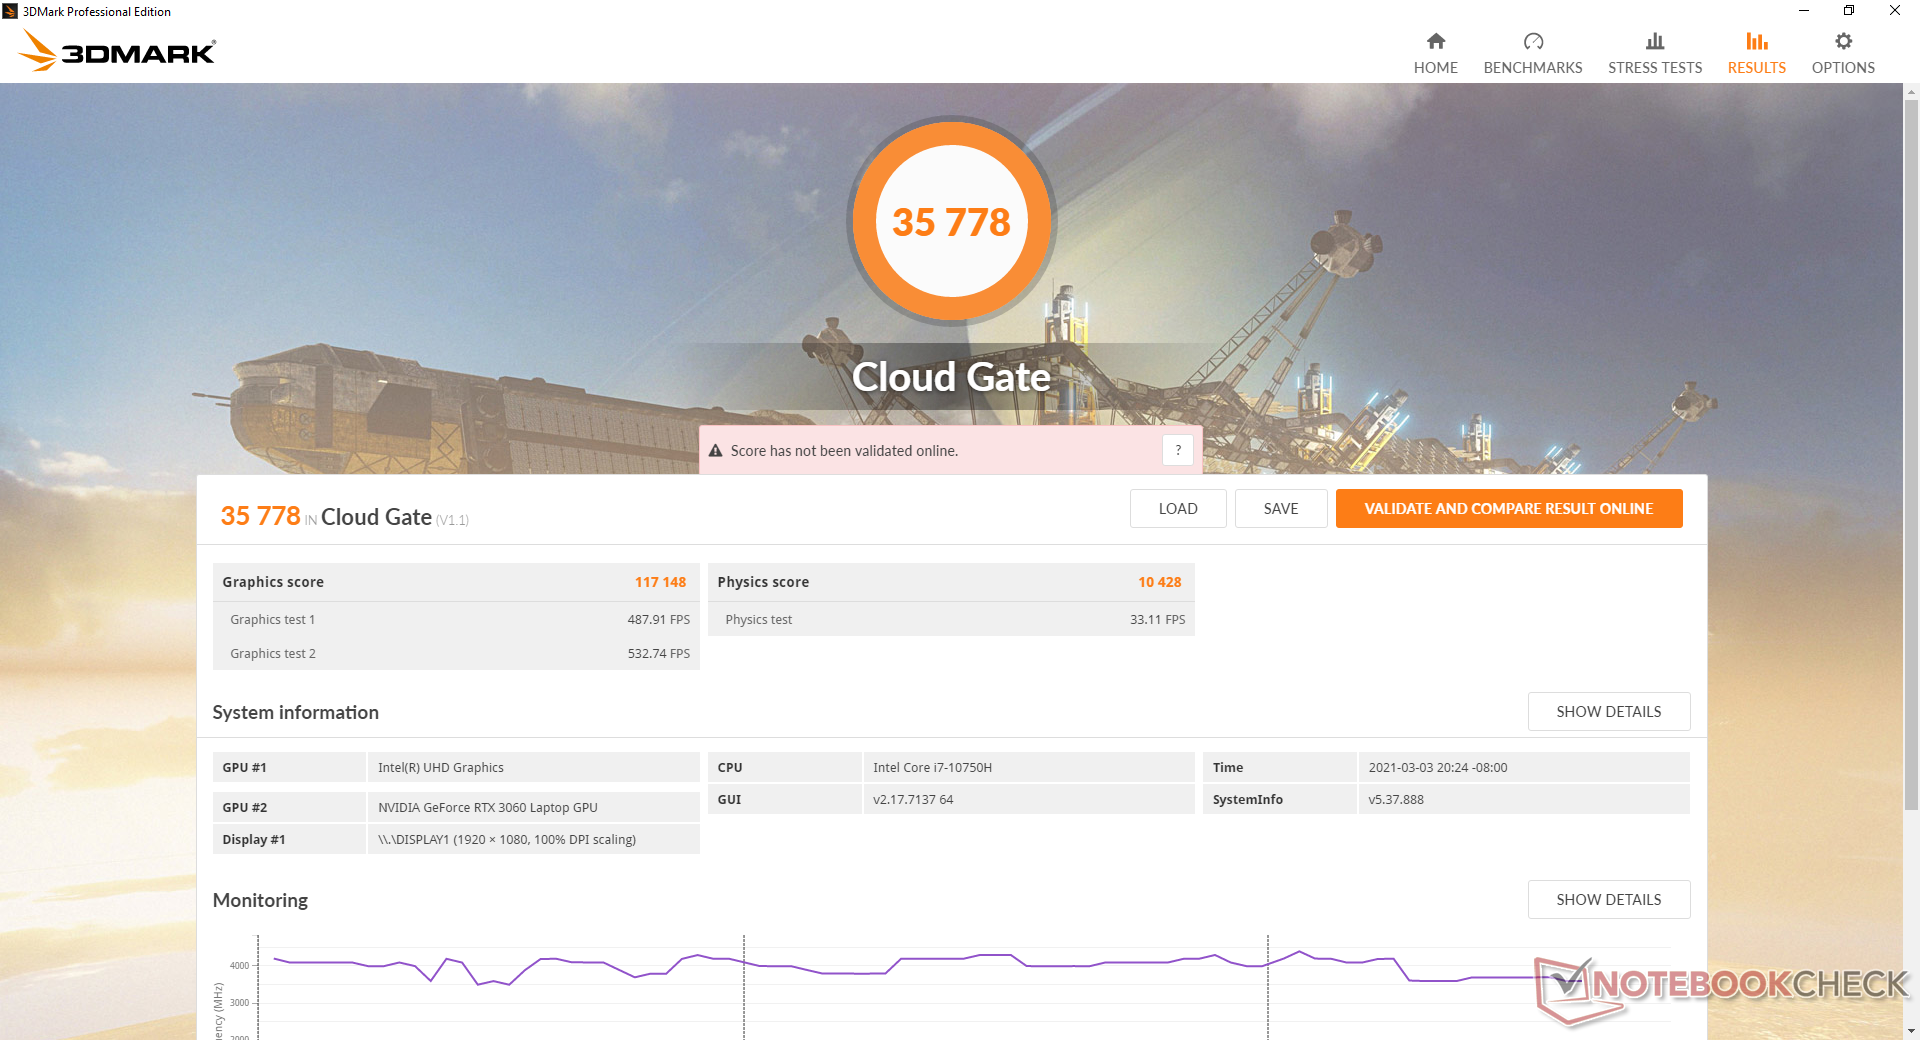
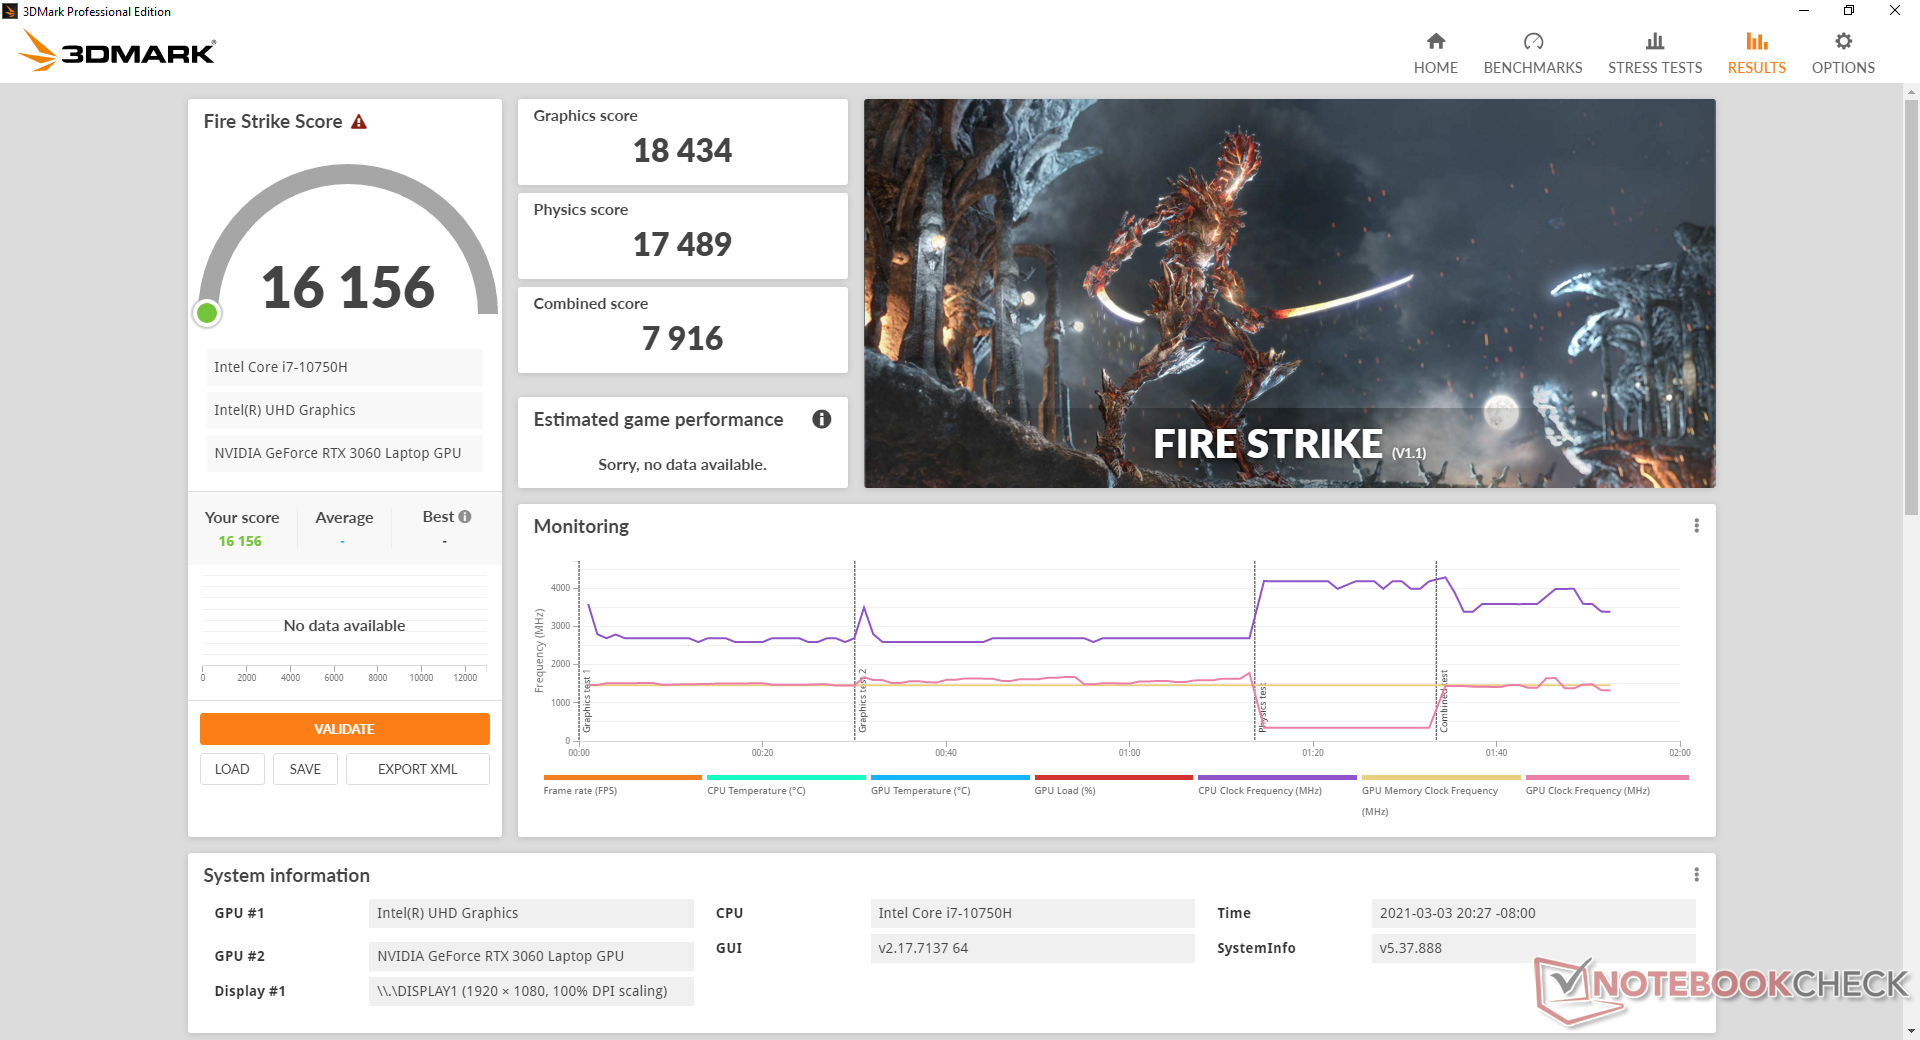
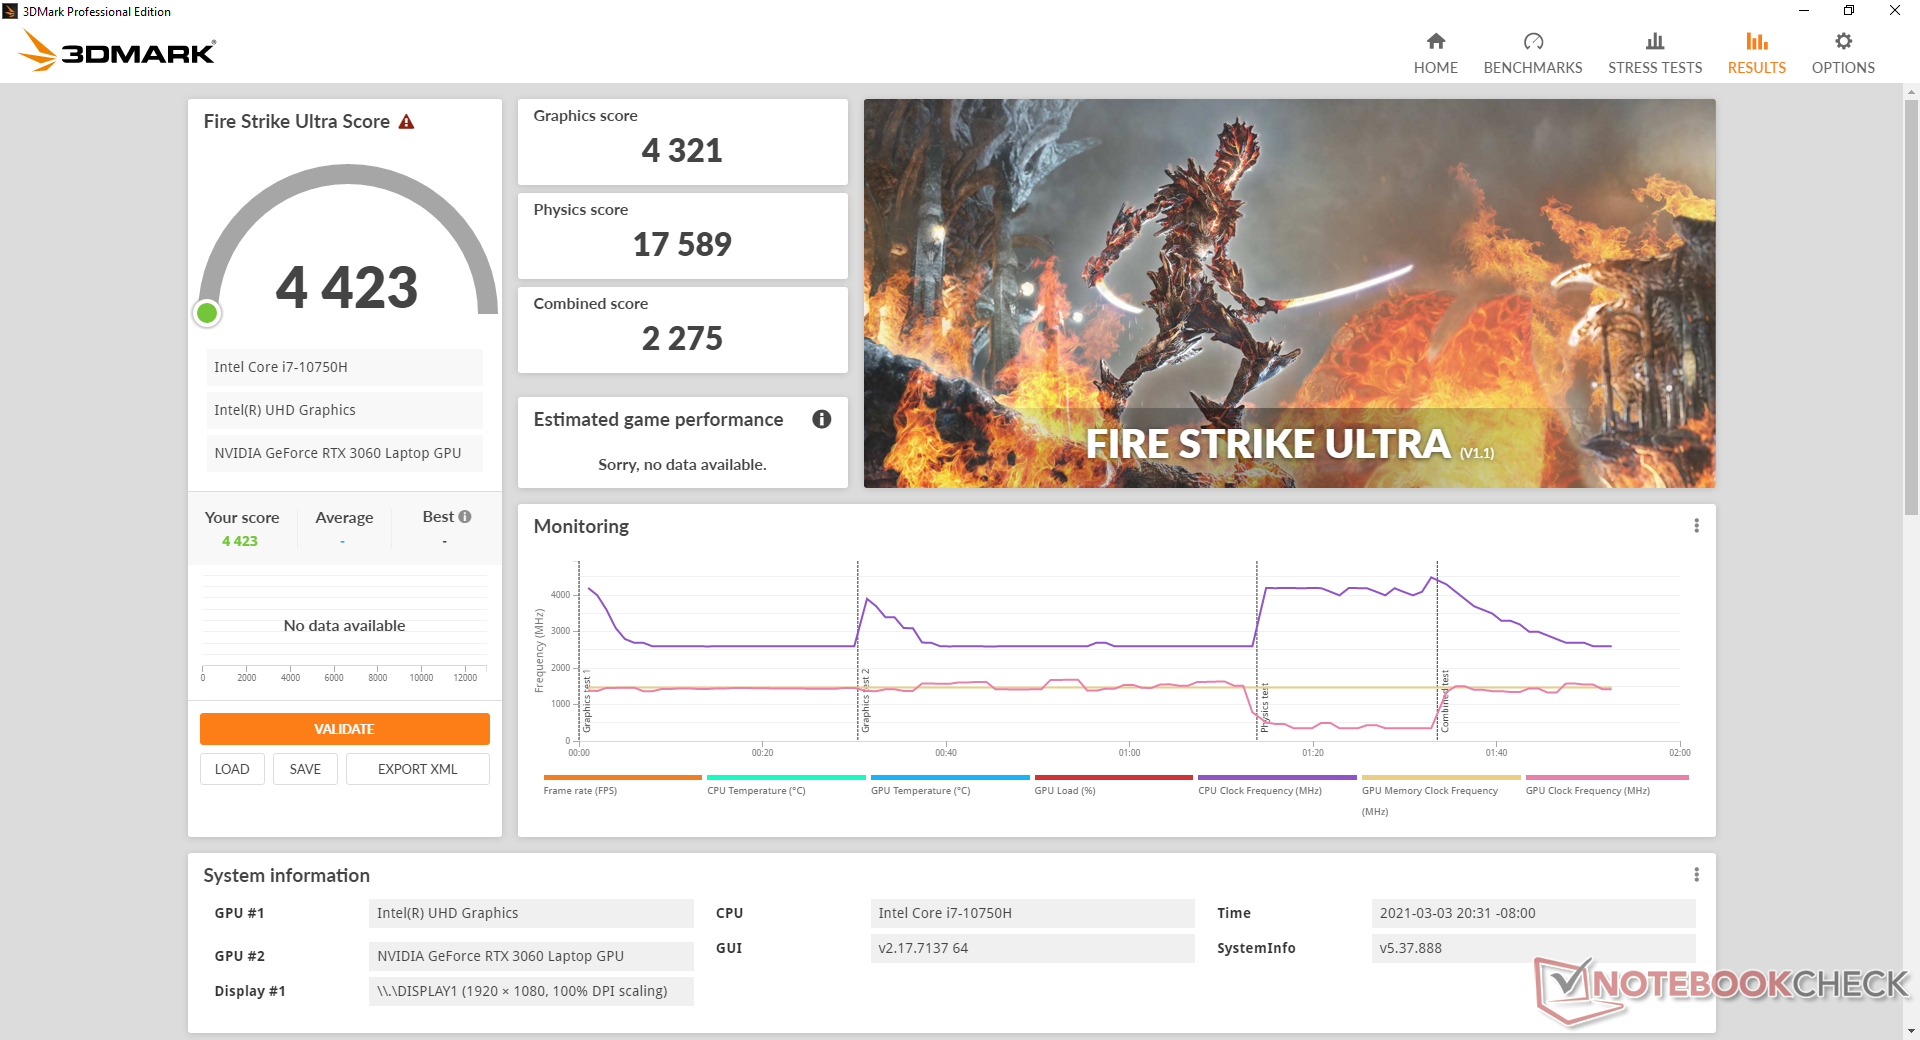
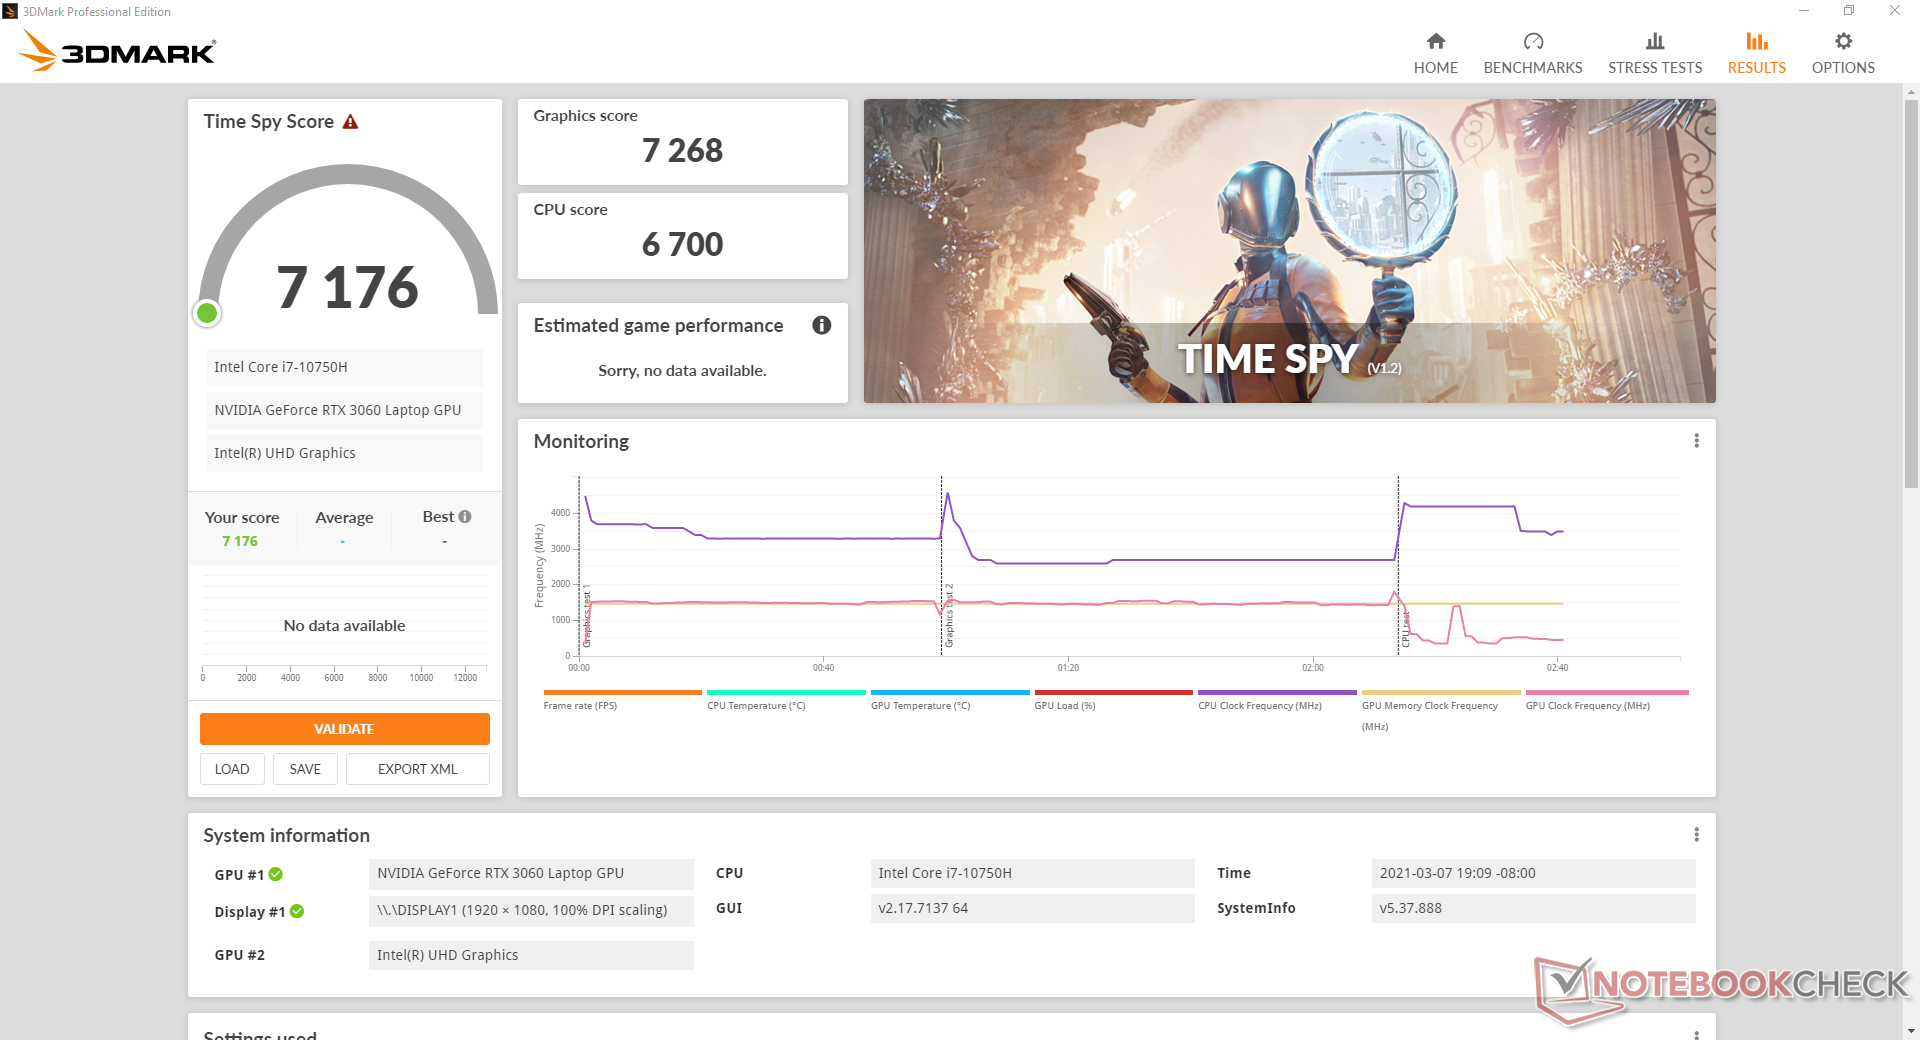
Dei quattro portatili che abbiamo testato finora con la RTX 3060 mobile GeForce , il nostro MSI GF65 è il più lento del gruppo di circa il 15% secondo i benchmarks di 3DMark. Le prestazioni grezze sono ancora superiori alla RTX 2060 mobile, anche se solo di circa il 15%. I possessori di laptops GeForce RTX 2070 potranno comunque godere di prestazioni grafiche leggermente più veloci di questo laptop RTX 3060.
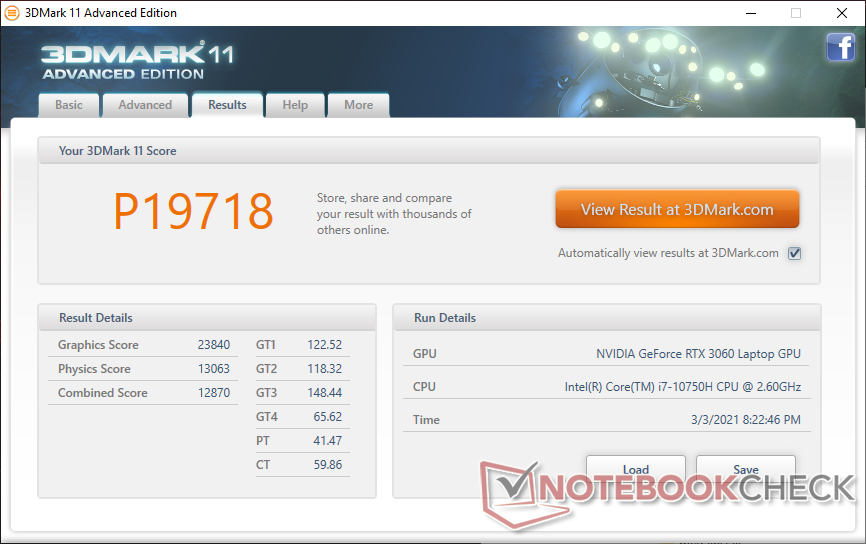
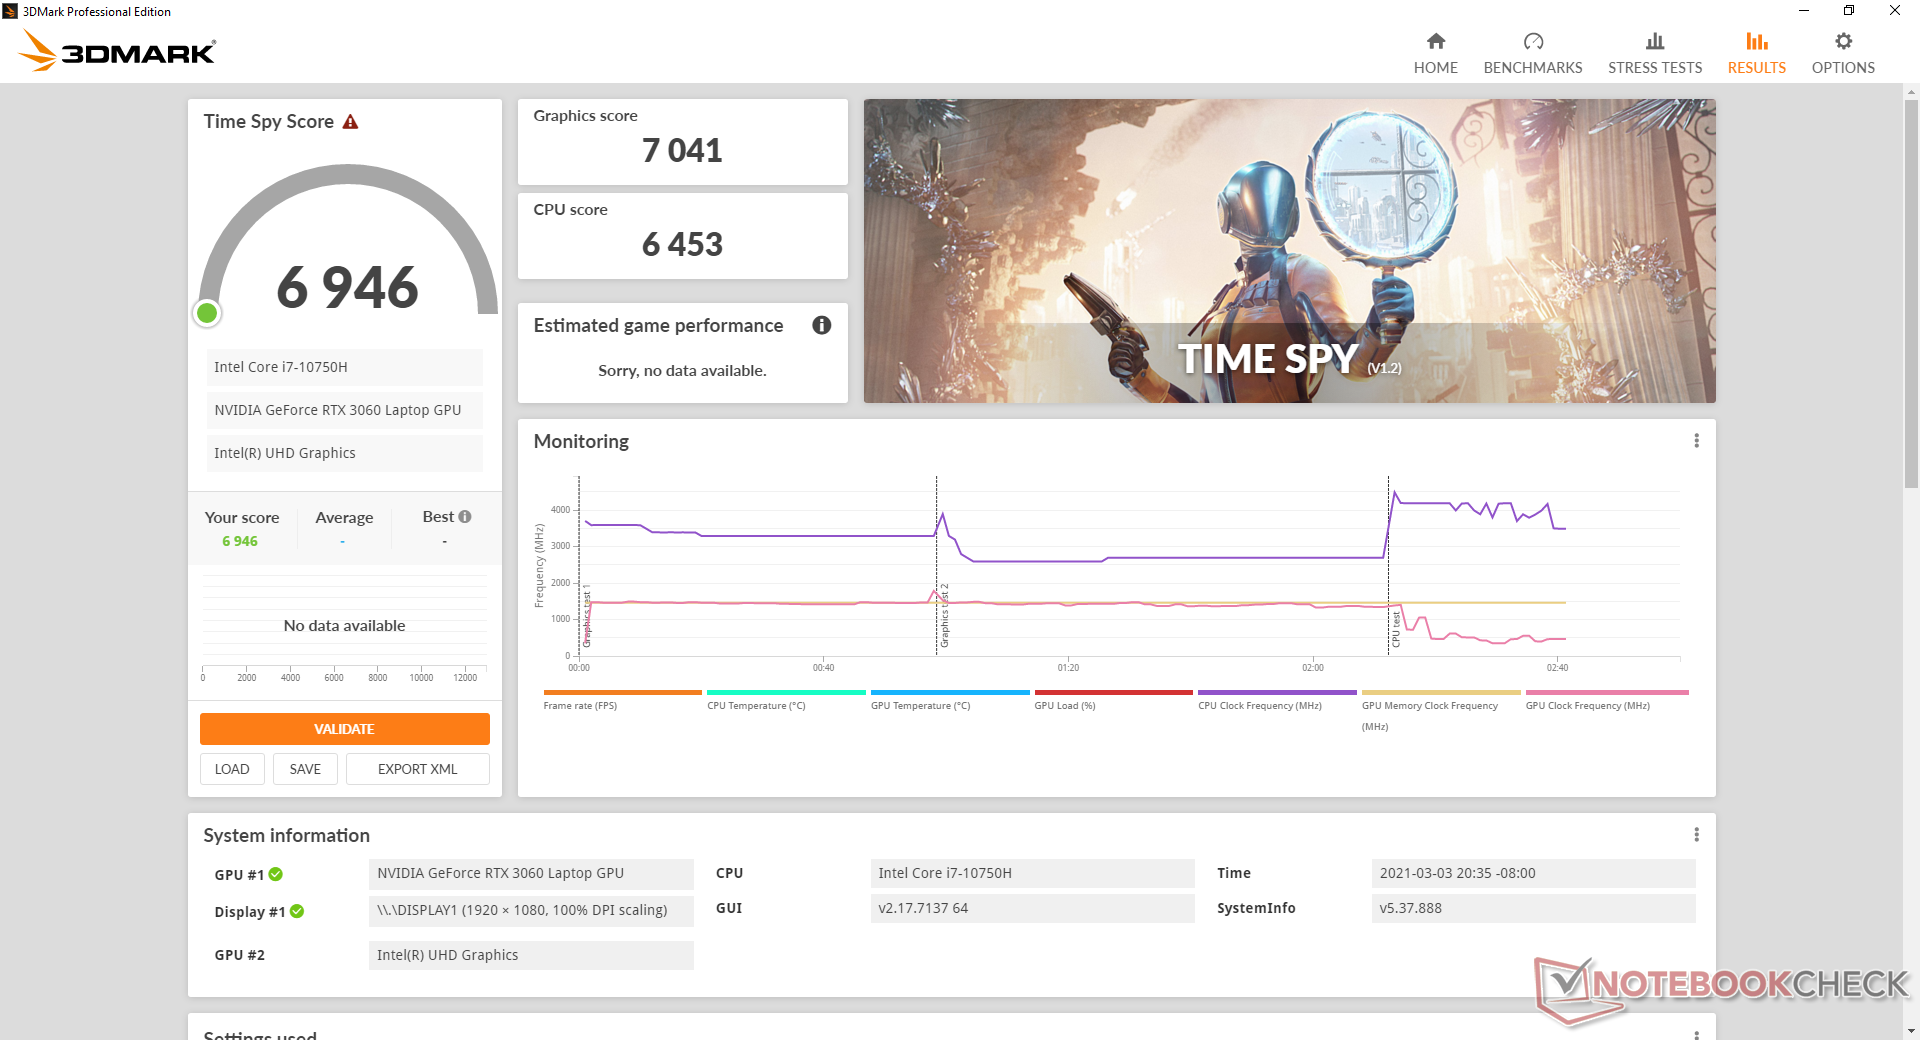
| 3DMark 11 Performance | 19718 punti | |
| 3DMark Cloud Gate Standard Score | 35778 punti | |
| 3DMark Fire Strike Score | 16156 punti | |
| 3DMark Time Spy Score | 6946 punti | |
Aiuto | ||
| Dota 2 Reborn - 3840x2160 ultra (3/3) best looking | |
| MSI GF65 Thin 10UE | |
| Media NVIDIA GeForce RTX 3060 Laptop GPU (46.9 - 107, n=11) | |
| basso | medio | alto | ultra | QHD | 4K | |
|---|---|---|---|---|---|---|
| GTA V (2015) | 164 | 152 | 120 | 69.2 | ||
| The Witcher 3 (2015) | 294 | 223.2 | 134.2 | 68.7 | ||
| Dota 2 Reborn (2015) | 125 | 116 | 109 | 90.7 | 94.9 | |
| Final Fantasy XV Benchmark (2018) | 124 | 89.8 | 70.3 | 53.6 | 30.7 | |
| X-Plane 11.11 (2018) | 83.6 | 73 | 62.2 | 62.3 | ||
| Far Cry 5 (2018) | 131 | 108 | 103 | 97 | ||
| Strange Brigade (2018) | 269 | 172 | 138 | 121 |
Emissioni
Rumorosità
Quando è collegato a una presa di corrente, il rumore della ventola sarà sempre presente, indipendentemente dall'impostazione, anche quando è impostato sulla modalità "Silent" di MSI. Le ventole diventeranno veramente silenziose solo se usiamo la batteria. Altrimenti, le ventole saranno sempre udibili a 33 dB(A) durante le attività a basso consumo come la navigazione web o lo streaming video, il che può essere un po' fastidioso.
Il rumore delle ventole durante il gamign in modalità Extreme Performance si aggirerà intorno ai 40 dB(A) risultando essere più discreto di quello che abbiamo osservato sul GF65 9SD. Tuttavia, questo può aumentare durante il gaming a seconda del carico della CPU. Abilitando la modalità Cooler Boost il rumore della ventola salirà a 59 dB(A).
| MSI GF65 Thin 10UE GeForce RTX 3060 Laptop GPU, i7-10750H, Samsung SSD PM981 MZVLB1T0HALR | Asus ROG Strix G15 G513QR GeForce RTX 3070 Laptop GPU, R9 5900HX, SK Hynix HFM001TD3JX013N | Schenker XMG Core 15 Ampere GeForce RTX 3060 Laptop GPU, R7 4800H, Samsung SSD 970 EVO Plus 1TB | MSI GS66 Stealth 10UG GeForce RTX 3070 Laptop GPU, i7-10870H, WDC PC SN730 SDBPNTY-1T00 | Aorus 15G XC GeForce RTX 3070 Laptop GPU, i7-10870H, ESR512GTLCG-EAC-4 | Lenovo Legion 7 15IMH05-81YT001VGE GeForce RTX 2080 Super Max-Q, i9-10980HK, 2x Samsung PM981a MZVLB1T0HBLR (RAID 0) | MSI GF65 9SD GeForce GTX 1660 Ti Mobile, i7-9750H, Kingston RBUSNS8154P3512GJ | |
|---|---|---|---|---|---|---|---|
| Noise | 4% | 6% | -5% | 4% | 8% | -6% | |
| off /ambiente * (dB) | 24.7 | 24 3% | 24 3% | 26.2 -6% | 25 -1% | 24.4 1% | 28.7 -16% |
| Idle Minimum * (dB) | 33.1 | 25 24% | 26 21% | 34 -3% | 29 12% | 24.4 26% | 33.3 -1% |
| Idle Average * (dB) | 33.1 | 31 6% | 28 15% | 34 -3% | 30 9% | 24.4 26% | 33.9 -2% |
| Idle Maximum * (dB) | 33.1 | 33 -0% | 30 9% | 34 -3% | 31 6% | 24.4 26% | 33.9 -2% |
| Load Average * (dB) | 42.7 | 45 -5% | 42 2% | 47.2 -11% | 41 4% | 49.3 -15% | 41 4% |
| Witcher 3 ultra * (dB) | 40.6 | 48 -18% | 50 -23% | 46.3 -14% | 47 -16% | 54 -33% | 49.5 -22% |
| Load Maximum * (dB) | 59.4 | 50 16% | 52 12% | 58.2 2% | 51 14% | 46.6 22% | 59.5 -0% |
* ... Meglio usare valori piccoli
Rumorosità
| Idle |
| 33.1 / 33.1 / 33.1 dB(A) |
| Sotto carico |
| 42.7 / 59.4 dB(A) |
 | ||
30 dB silenzioso 40 dB(A) udibile 50 dB(A) rumoroso |
||
min: | ||
Temperature
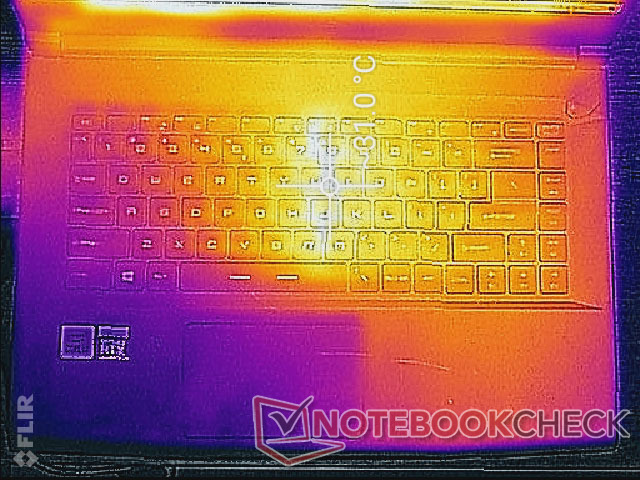
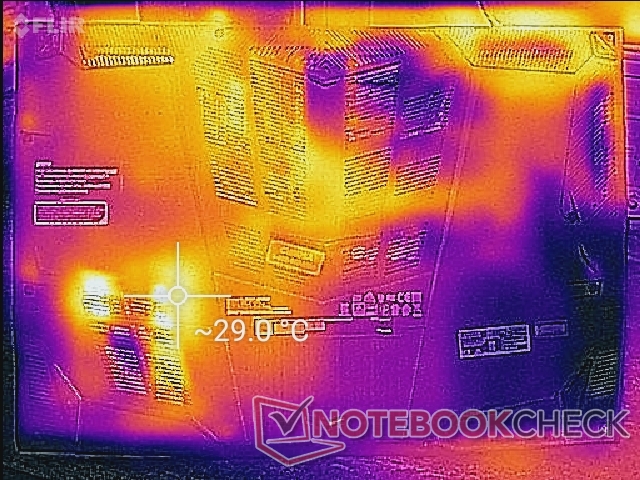
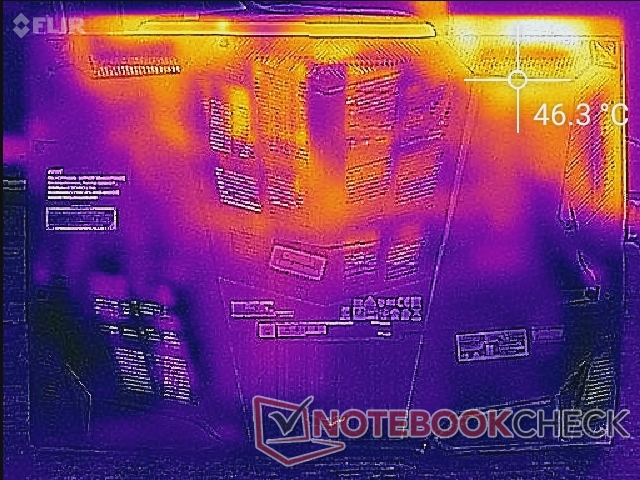
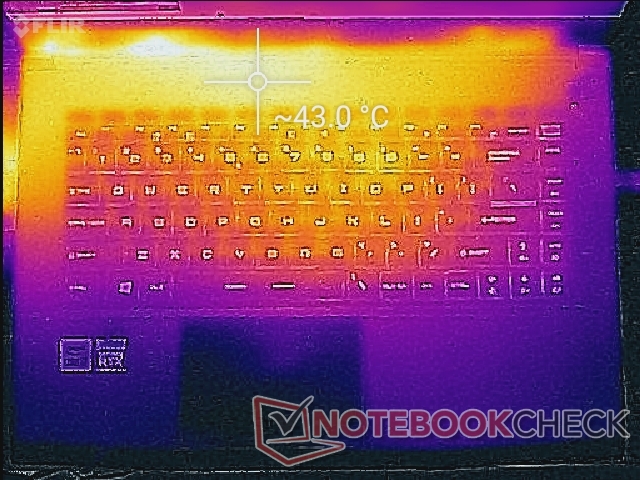
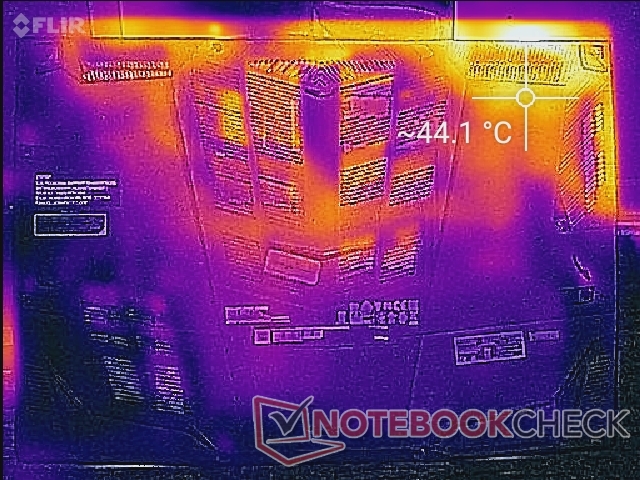
Le temperature di superficie sono più calde verso i quadranti posteriori lontano dai tasti WASD e dai tasti freccia. I punti più caldi possono arrivare fino a 44° C quando si gioca, il che è molto vicino a quello che abbiamo registrato sul vecchio GF65 9SD. Gran parte della superficie inferiore rimane relativamente fredda quando si gioca.
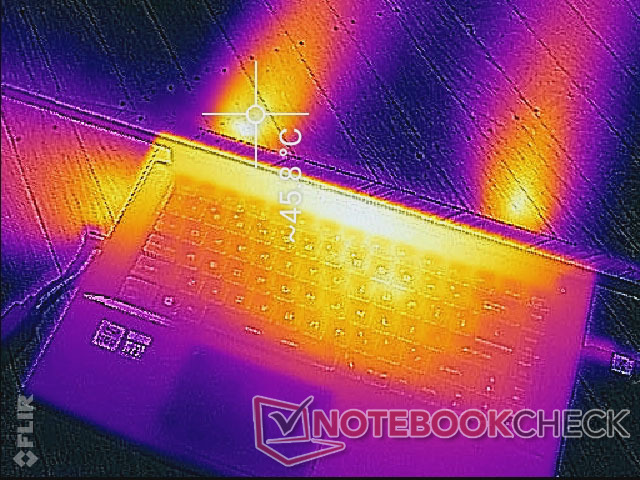
(±) La temperatura massima sul lato superiore è di 43.4 °C / 110 F, rispetto alla media di 40.4 °C / 105 F, che varia da 21.2 a 68.8 °C per questa classe Gaming.
(±) Il lato inferiore si riscalda fino ad un massimo di 41.8 °C / 107 F, rispetto alla media di 43.2 °C / 110 F
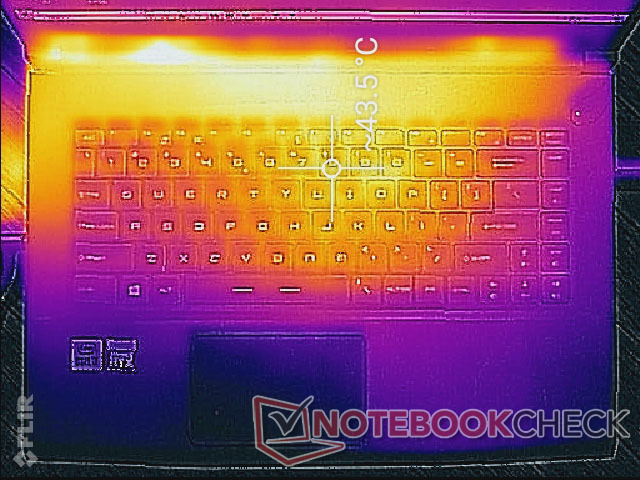
(+) In idle, la temperatura media del lato superiore è di 27.6 °C / 82 F, rispetto alla media deld ispositivo di 33.9 °C / 93 F.
(±) Riproducendo The Witcher 3, la temperatura media per il lato superiore e' di 33.9 °C / 93 F, rispetto alla media del dispositivo di 33.9 °C / 93 F.
(+) I poggiapolsi e il touchpad sono piu' freddi della temperatura della pelle con un massimo di 27.4 °C / 81.3 F e sono quindi freddi al tatto.
(±) La temperatura media della zona del palmo della mano di dispositivi simili e'stata di 28.8 °C / 83.8 F (+1.4 °C / 2.5 F).
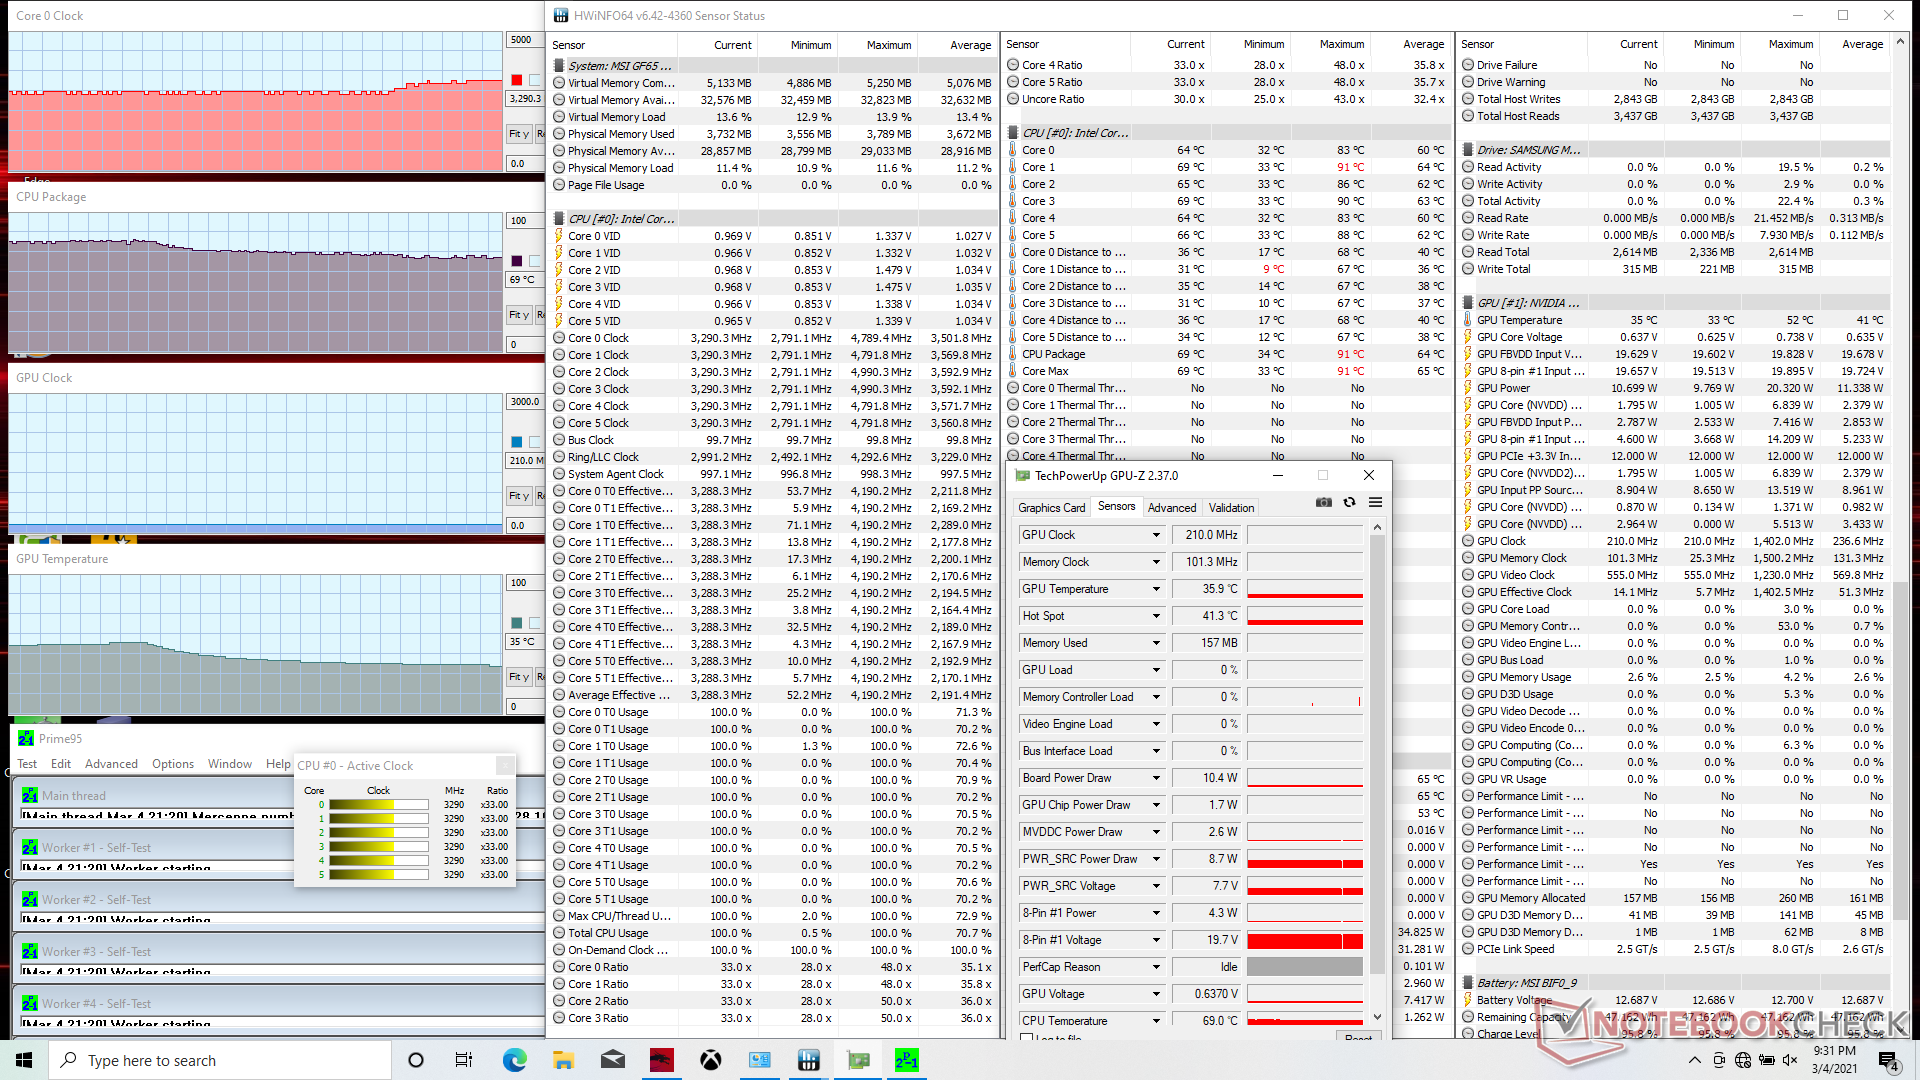
Stress Test
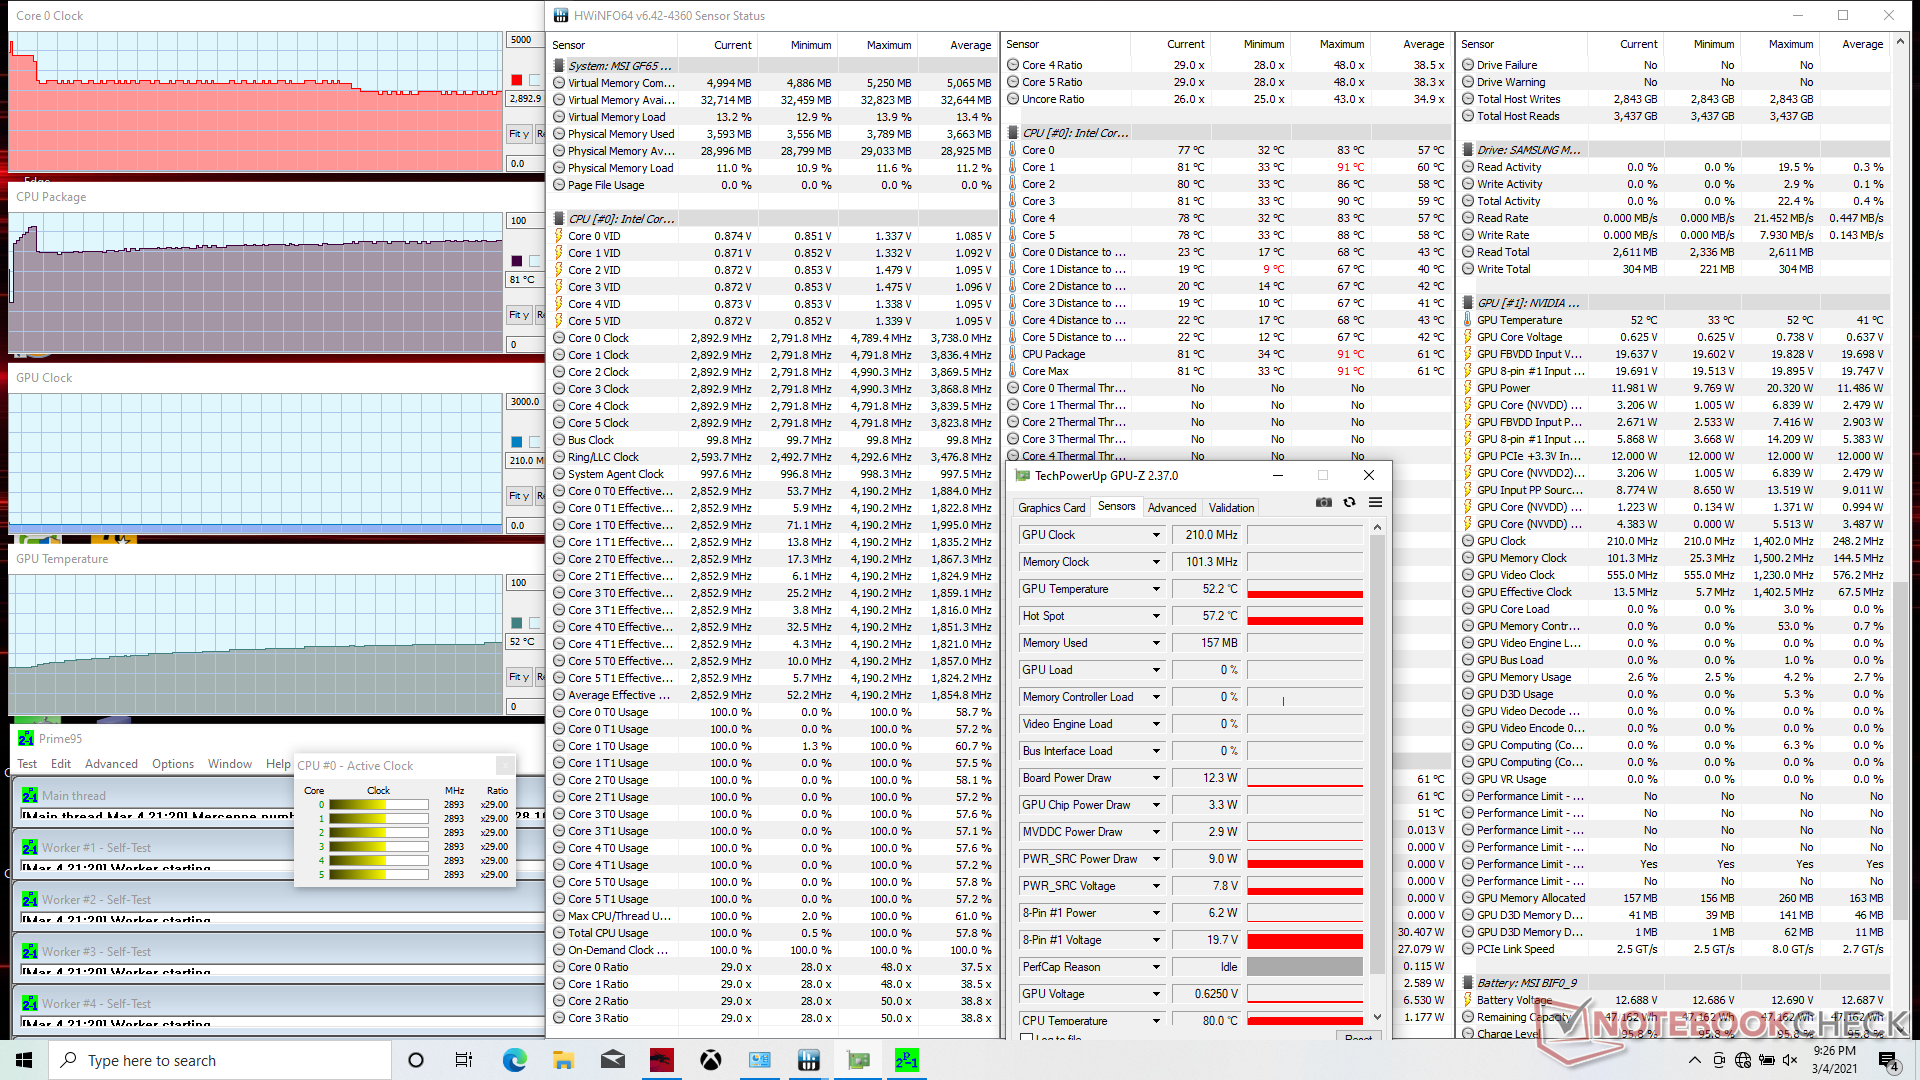
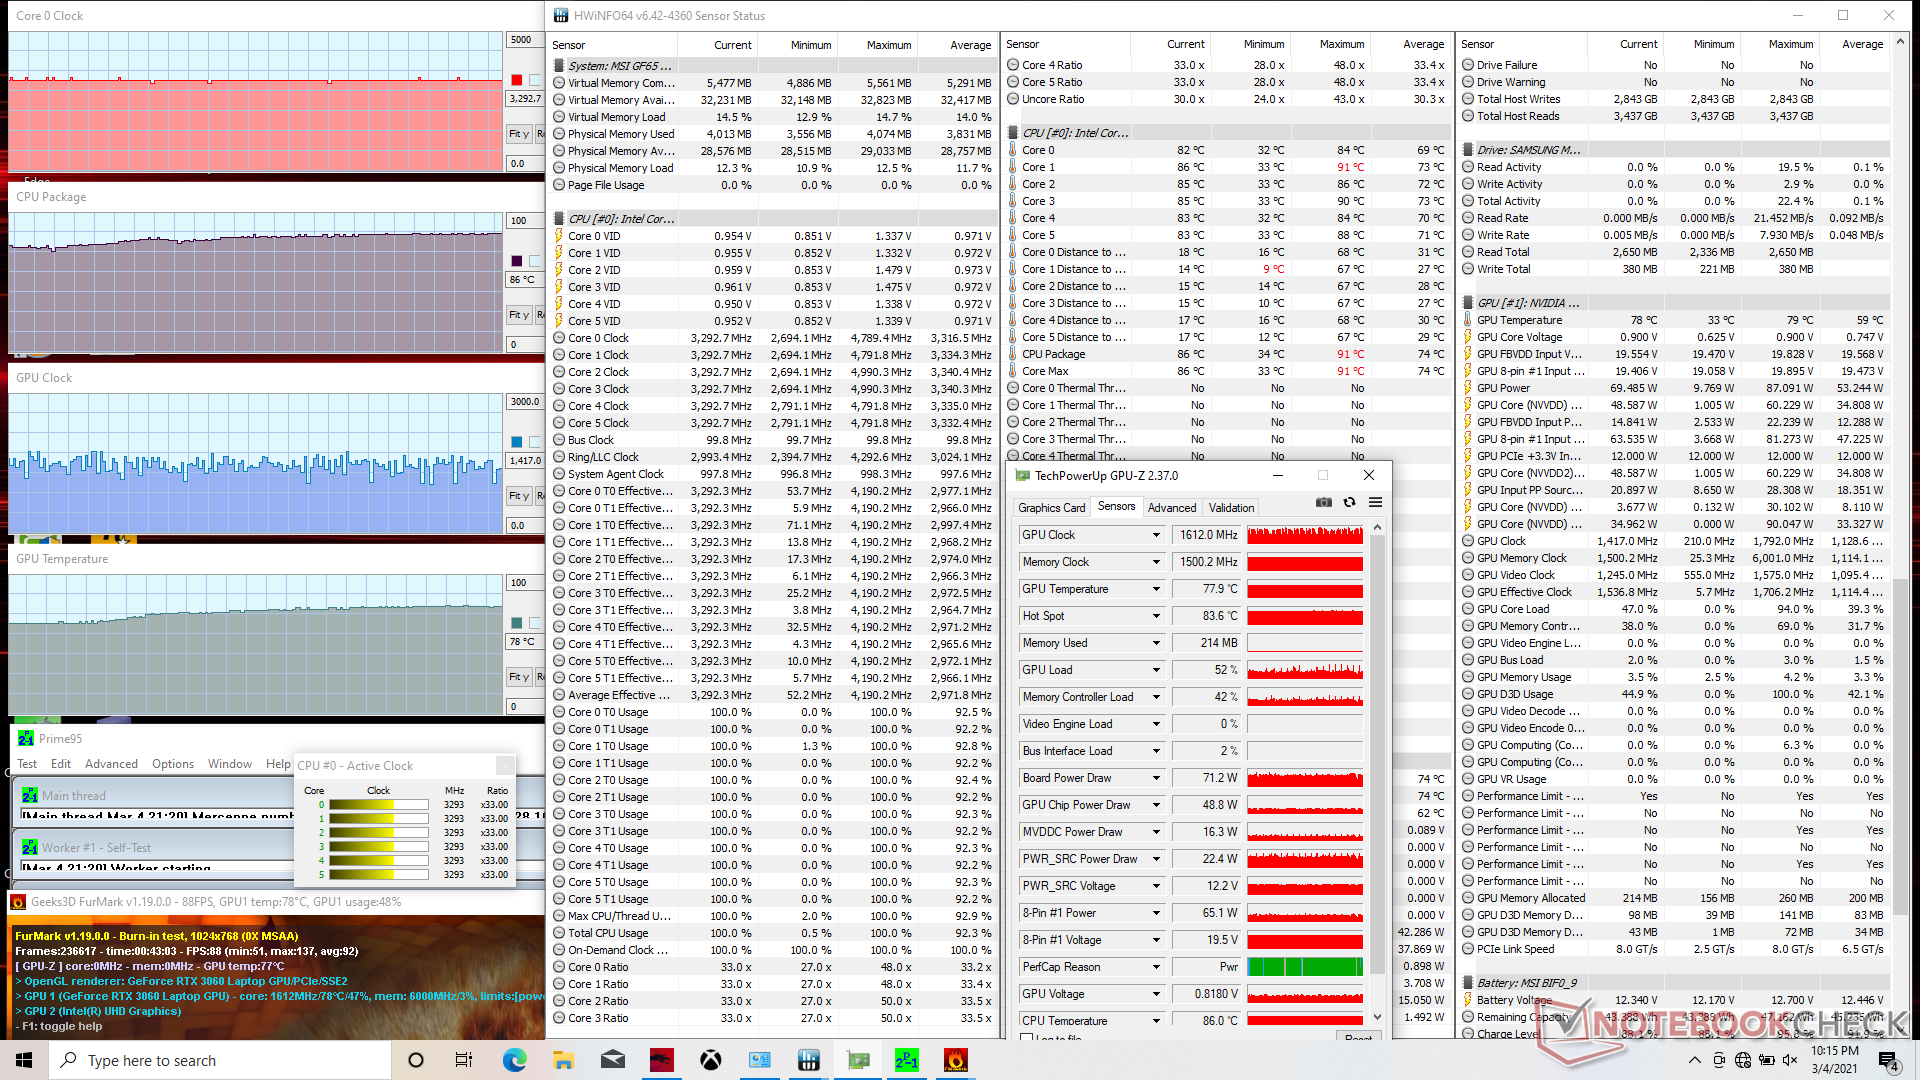
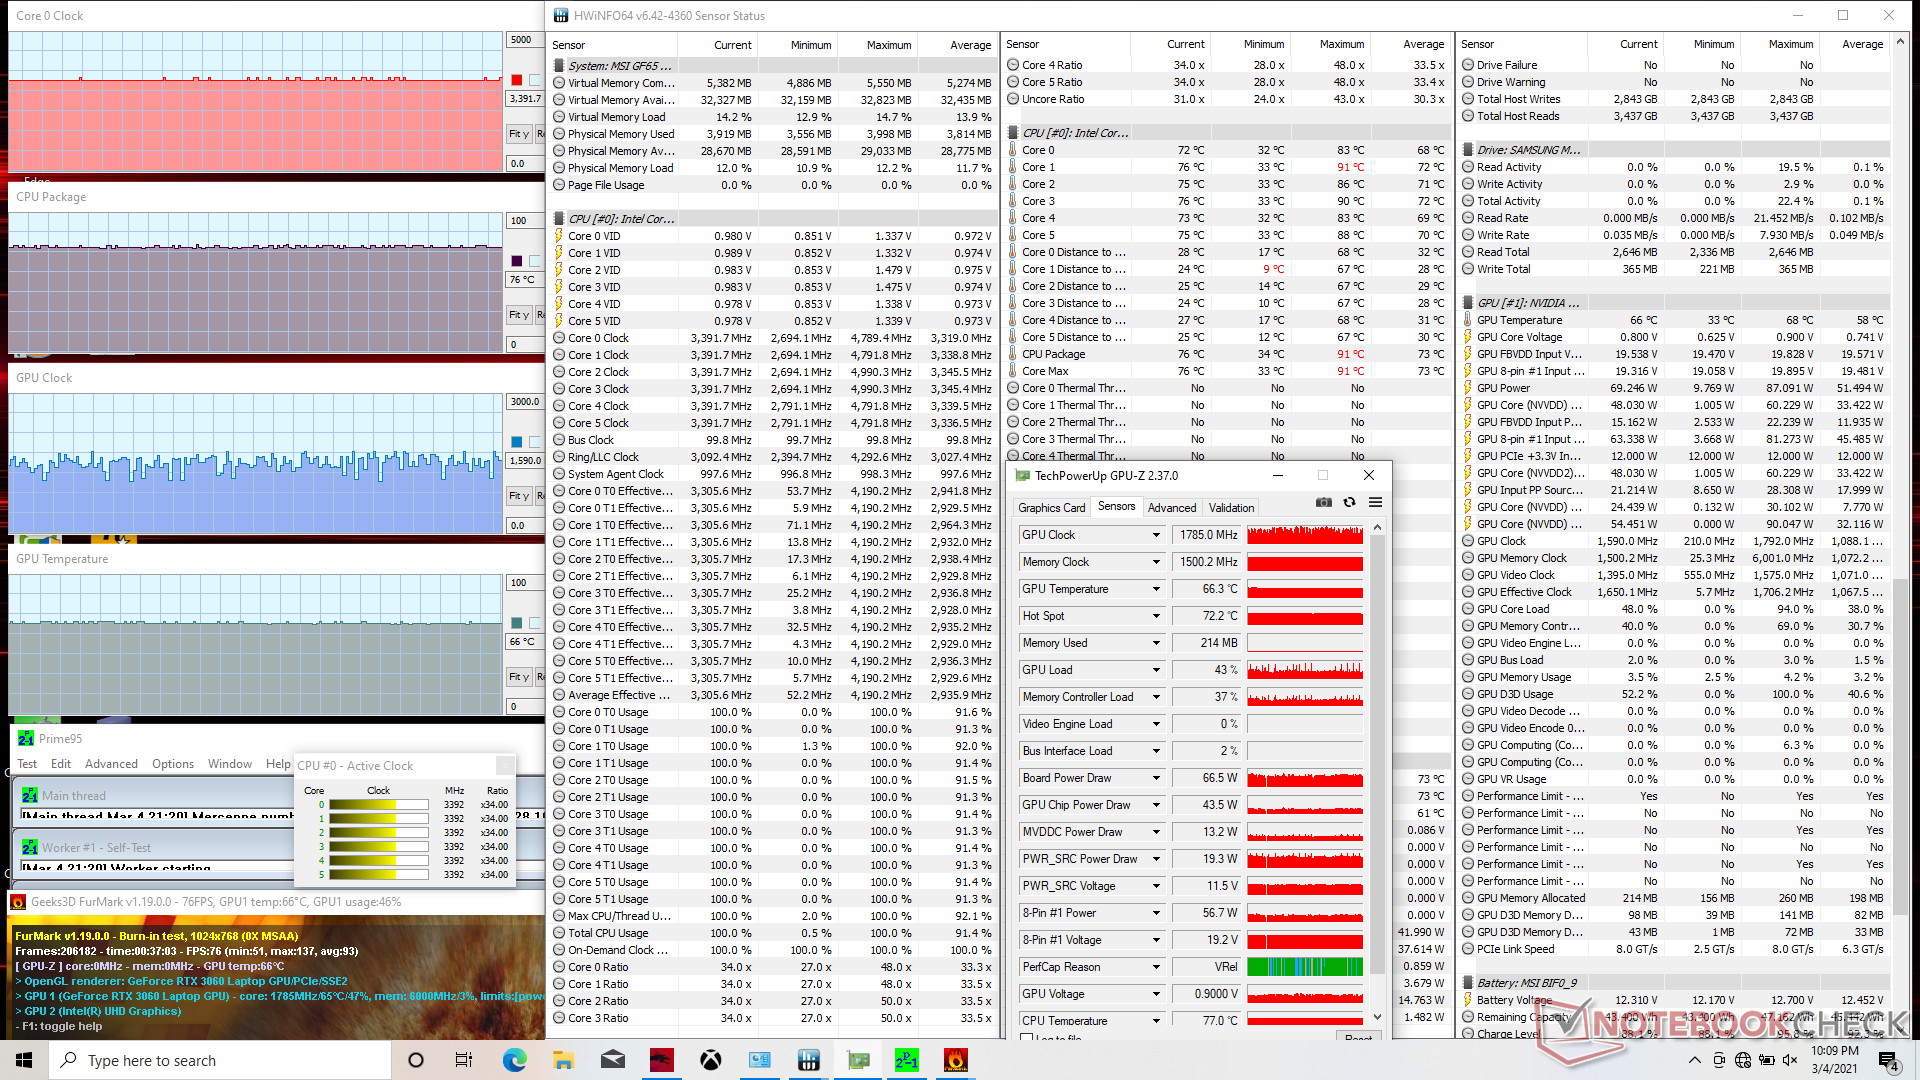
Quando si esegue Prime95 in modalità Extreme Performance, la frequenza di clock della CPU raggiunge i 4.2 GHz solo per i primi secondi fino a raggiungere una temperatura del core di 91° C. La frequenza di clock e la temperatura scendono costantemente e si stabilizzano rispettivamente a 2.8 GHz e 72° C. Se Cooler Boost è abilitato, le frequenze di clock e la temperatura aumenteranno, rispettivamente, a 3.3 GHz e diminuiranno a 69° C.
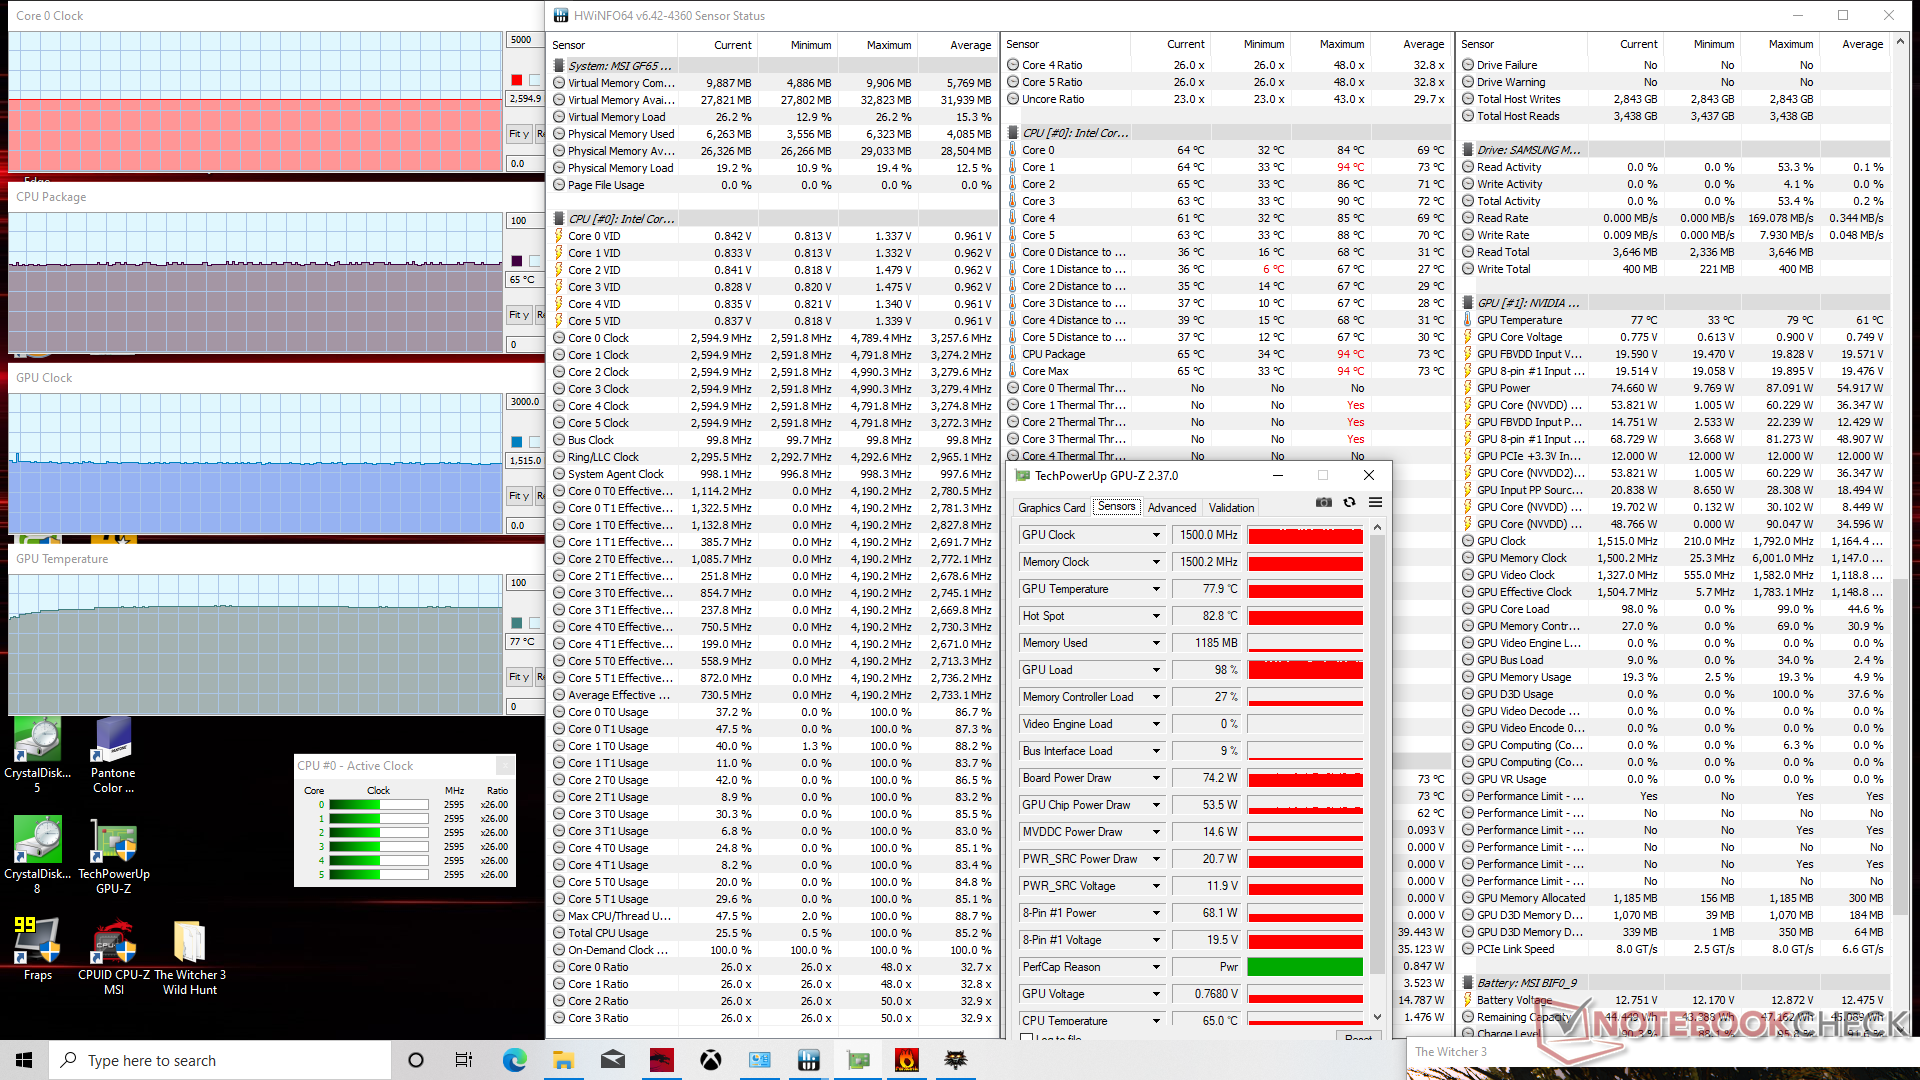
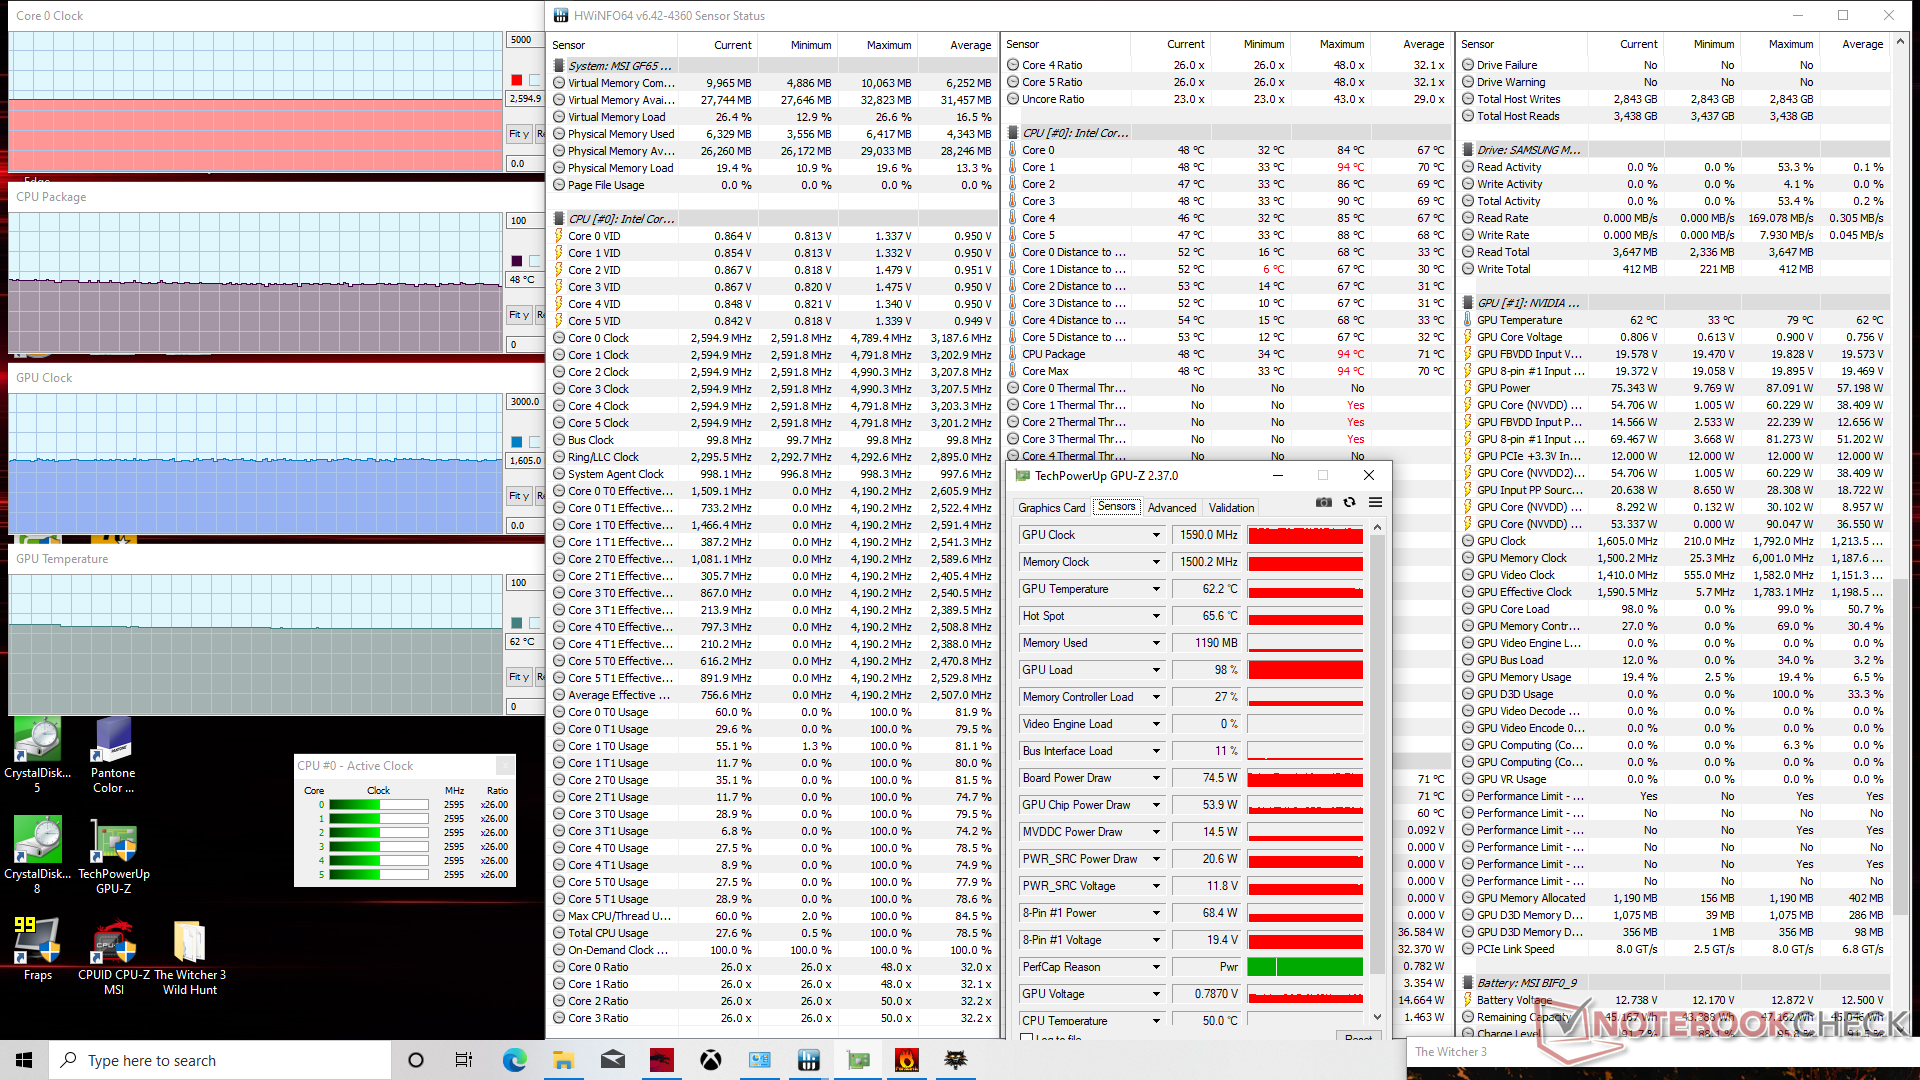
L'esecuzione di The Witcher 3 fa sì che la CPU e la GPU si stabilizzino rispettivamente a 65° C e 77° C, che sono intervalli relativamente freddi per un portatile gaming. Abilitando il Cooler Boost, le temperature di CPU e GPU si riducono ulteriormente a soli 48° C e 62° C, rispettivamente, mentre la frequenza di clock media della GPU si sposta leggermente da 1515 MHz a 1590 MHz. La funzione Cooler Boost non è quindi vitale per il gaming, ma può essere utile per coloro che vogliono le massime prestazioni di CPU Turbo Boost dai loro sistemi GF65.
Il funzionamento a batteria limiterà le prestazioni. Un Fire Strike eseguito con le batterie restituisce punteggi Physics e Graphics di 10559 e 12438 punti, rispettivamente, rispetto a 17489 e 18434 punti con l'alimentazione di rete.

| Clock della CPU (GHz)Clock della GPU(MHz)Temperatura media dellaCPU (°C)Temperaturamedia dellaGPU (°C) |
| Sistema inattivo |
| Prime95 Stress (Cooler Boost off) |
| Prime95 Stress (CoolerBoost on) |
| Witcher 3 Stress (Cooler Boost off) |
| Witcher 3 Stress (Cooler Boost on) |
| Prime95 + FurMark Stress (Cooler Boost off) |
| Prime95 + FurMark Stress (Cooler Boost on) |
Casse


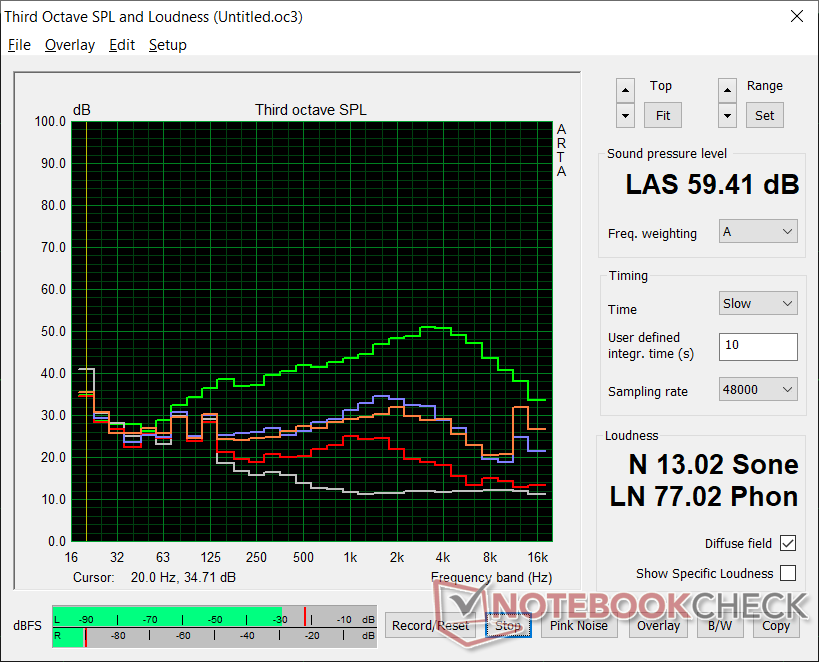
MSI GF65 Thin 10UE analisi audio
(±) | potenza degli altiparlanti media ma buona (80.7 dB)
Bassi 100 - 315 Hz
(-) | quasi nessun basso - in media 19.6% inferiori alla media
(-) | bassi non lineari (16.1% delta rispetto alla precedente frequenza)
Medi 400 - 2000 Hz
(+) | medi bilanciati - solo only 3.2% rispetto alla media
(±) | linearità dei medi adeguata (7.6% delta rispetto alla precedente frequenza)
Alti 2 - 16 kHz
(+) | Alti bilanciati - appena 3.6% dalla media
(±) | la linearità degli alti è media (8.6% delta rispetto alla precedente frequenza)
Nel complesso 100 - 16.000 Hz
(±) | la linearità complessiva del suono è media (17.9% di differenza rispetto alla media
Rispetto alla stessa classe
» 54% di tutti i dispositivi testati in questa classe è stato migliore, 9% simile, 37% peggiore
» Il migliore ha avuto un delta di 6%, medio di 18%, peggiore di 132%
Rispetto a tutti i dispositivi testati
» 37% di tutti i dispositivi testati in questa classe è stato migliore, 8% similare, 55% peggiore
» Il migliore ha avuto un delta di 4%, medio di 24%, peggiore di 134%
Apple MacBook 12 (Early 2016) 1.1 GHz analisi audio
(+) | gli altoparlanti sono relativamente potenti (83.6 dB)
Bassi 100 - 315 Hz
(±) | bassi ridotti - in media 11.3% inferiori alla media
(±) | la linearità dei bassi è media (14.2% delta rispetto alla precedente frequenza)
Medi 400 - 2000 Hz
(+) | medi bilanciati - solo only 2.4% rispetto alla media
(+) | medi lineari (5.5% delta rispetto alla precedente frequenza)
Alti 2 - 16 kHz
(+) | Alti bilanciati - appena 2% dalla media
(+) | alti lineari (4.5% delta rispetto alla precedente frequenza)
Nel complesso 100 - 16.000 Hz
(+) | suono nel complesso lineare (10.2% differenza dalla media)
Rispetto alla stessa classe
» 7% di tutti i dispositivi testati in questa classe è stato migliore, 2% simile, 91% peggiore
» Il migliore ha avuto un delta di 5%, medio di 18%, peggiore di 53%
Rispetto a tutti i dispositivi testati
» 5% di tutti i dispositivi testati in questa classe è stato migliore, 1% similare, 94% peggiore
» Il migliore ha avuto un delta di 4%, medio di 24%, peggiore di 134%
Gestione energetica
Consumo energetico
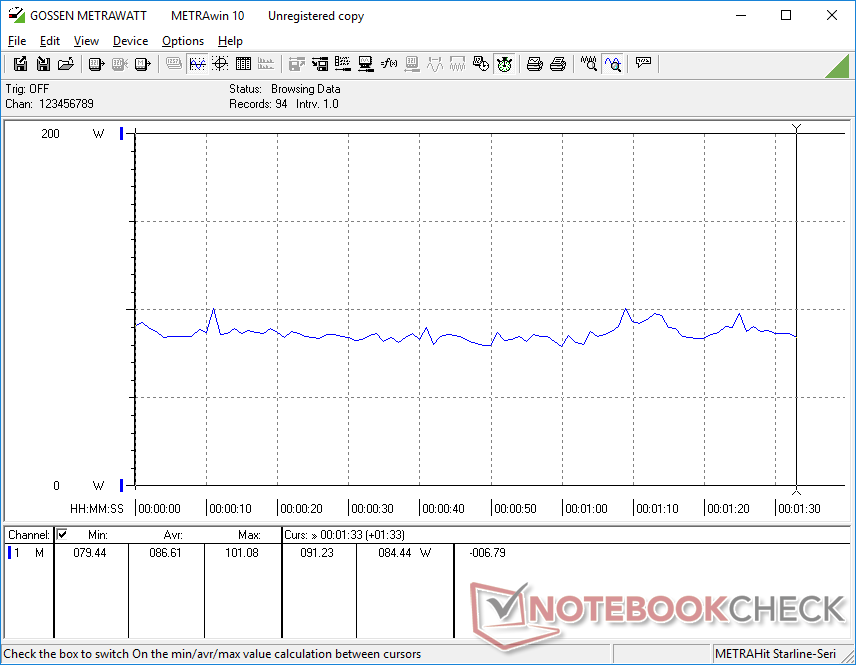
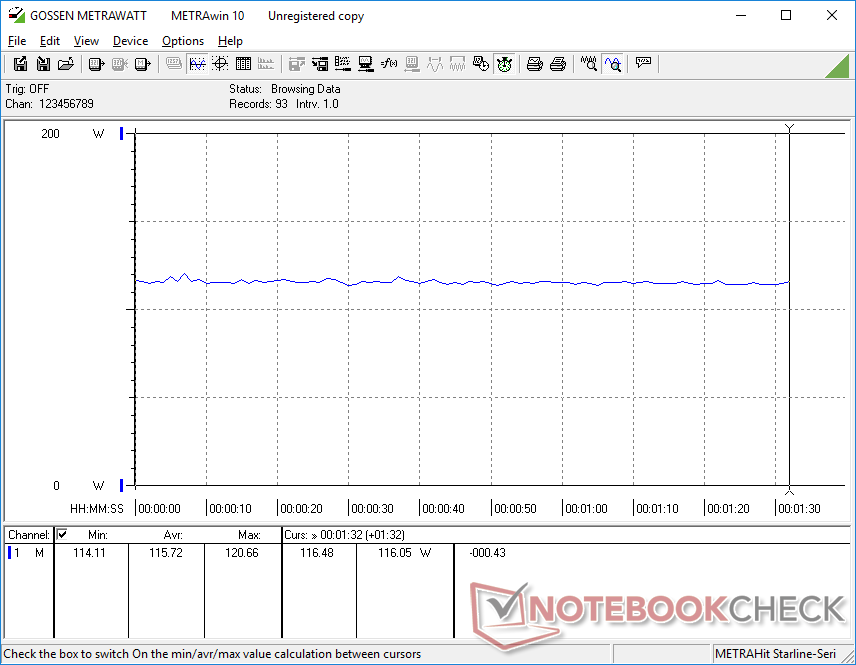
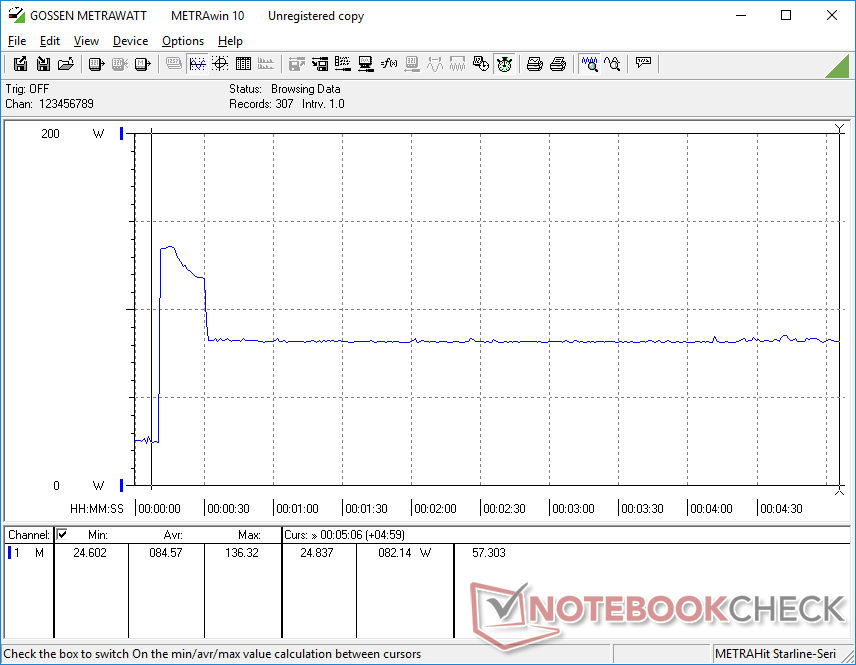
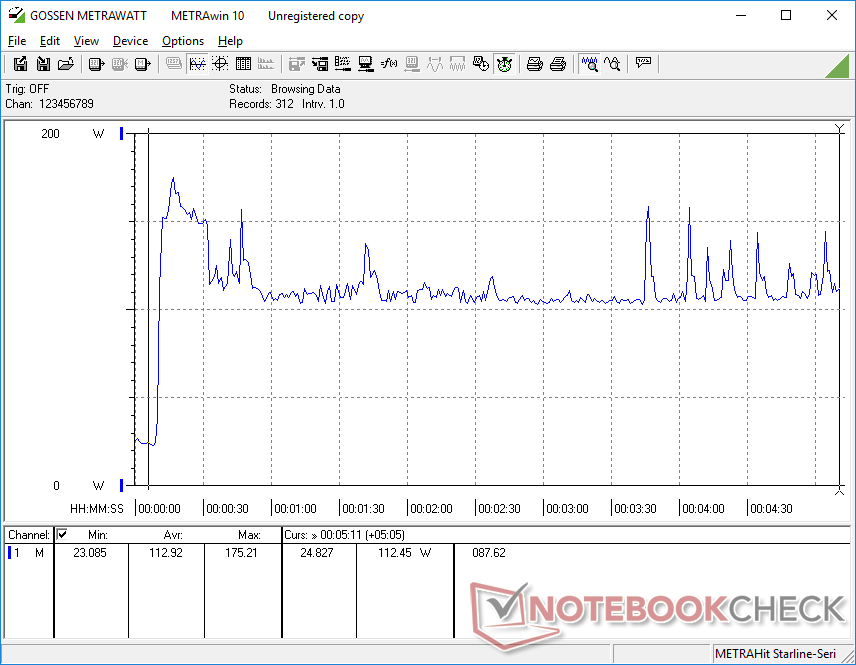
Il sistema consuma leggermente meno energia rispetto al vecchio GF65 9SD. L'esecuzione di The Witcher 3 richiede circa 116 W rispetto ai 134 W del vecchio modello, anche se la nostra RTX 3060 è in grado di fornire una spinta del 15% nella potenza grafica grezza rispetto alla GTX 1660 Ti. Lo Schenker XMG Core 15 con la stessa GPU RTX 3060 consuma significativamente più energia del nostro MSI probabilmente perché punta a valori TGP più alti e altre differenze di processore.
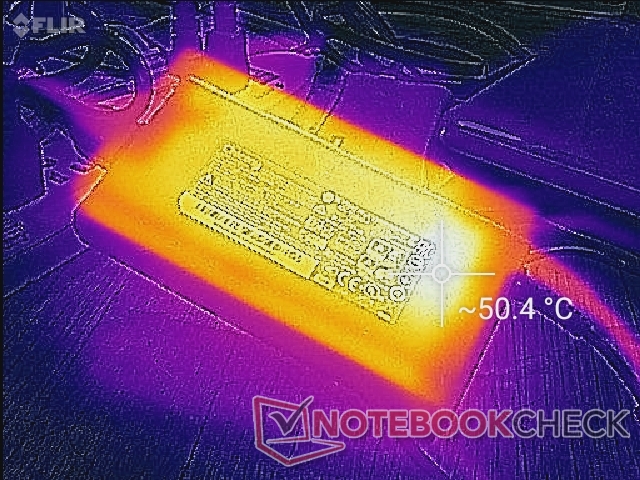
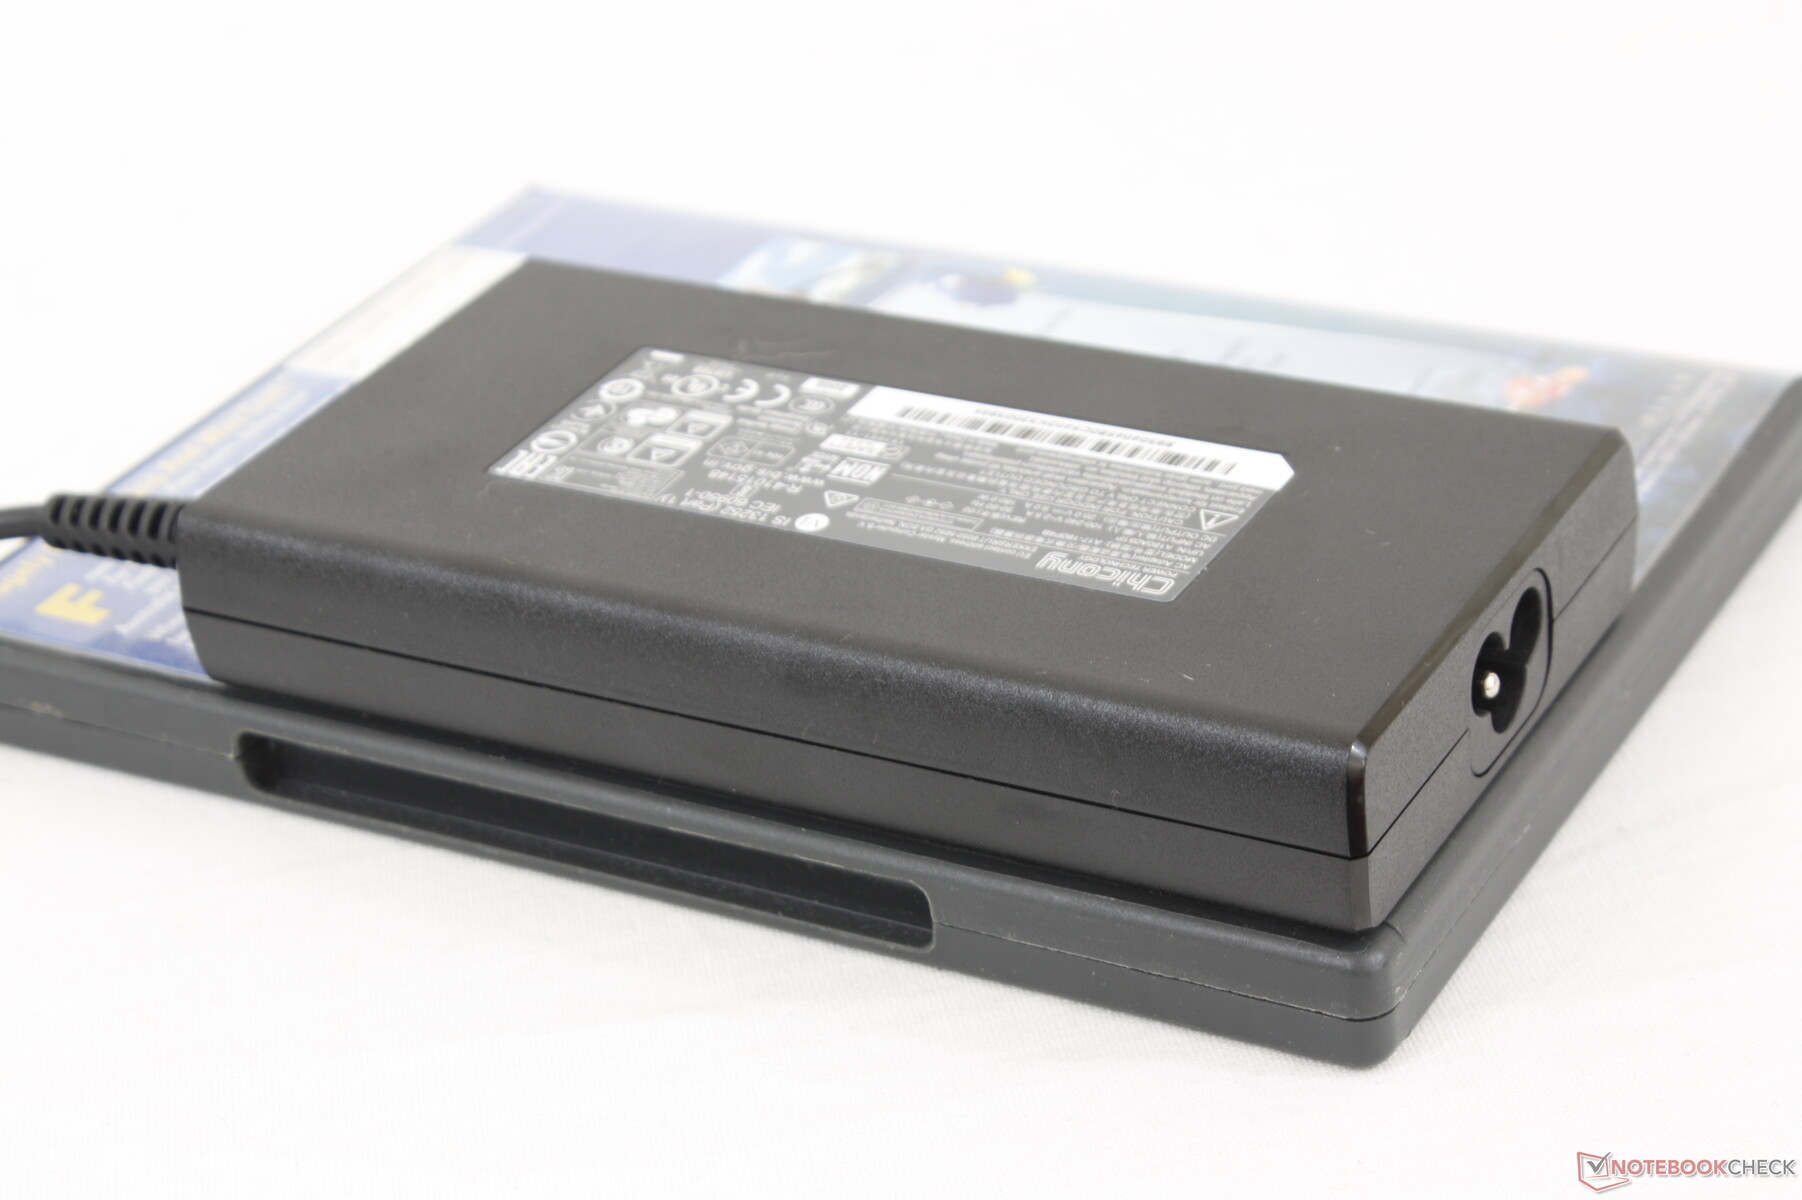
Siamo in grado di misurare un consumo massimo di 175,2 W W dal piccolo (~14,4 x 7,5 x 2,3 cm) adattatore AC da 180 W quando si eseguono Prime95 e FurMark contemporaneamente. La carica della batteria rallenta significativamente quando si eseguono carichi estremi e può anche andare in stallo, che è quello che abbiamo osservato durante il nostro stress test di cui sopra.
| Off / Standby | |
| Idle | |
| Sotto carico |
|
Leggenda:
min: | |
| MSI GF65 Thin 10UE i7-10750H, GeForce RTX 3060 Laptop GPU, Samsung SSD PM981 MZVLB1T0HALR, IPS, 1920x1080, 15.6" | Asus ROG Strix G15 G513QR R9 5900HX, GeForce RTX 3070 Laptop GPU, SK Hynix HFM001TD3JX013N, IPS, 1920x1080, 15.6" | Schenker XMG Core 15 Ampere R7 4800H, GeForce RTX 3060 Laptop GPU, Samsung SSD 970 EVO Plus 1TB, IPS, 2560x1440, 15.6" | Aorus 15G XC i7-10870H, GeForce RTX 3070 Laptop GPU, ESR512GTLCG-EAC-4, IPS, 1920x1080, 15.6" | Lenovo Legion 7 15IMH05-81YT001VGE i9-10980HK, GeForce RTX 2080 Super Max-Q, 2x Samsung PM981a MZVLB1T0HBLR (RAID 0), IPS, 1920x1080, 15.6" | MSI GF65 9SD i7-9750H, GeForce GTX 1660 Ti Mobile, Kingston RBUSNS8154P3512GJ, IPS, 1920x1080, 15.6" | |
|---|---|---|---|---|---|---|
| Power Consumption | -27% | -35% | -48% | -24% | -17% | |
| Idle Minimum * (Watt) | 5.4 | 4 26% | 11 -104% | 13 -141% | 9 -67% | 9.5 -76% |
| Idle Average * (Watt) | 12.8 | 9 30% | 14 -9% | 16 -25% | 12.6 2% | 12.4 3% |
| Idle Maximum * (Watt) | 19.5 | 36 -85% | 20 -3% | 30 -54% | 17 13% | 22 -13% |
| Load Average * (Watt) | 86.6 | 130 -50% | 94 -9% | 92 -6% | 115 -33% | 80.8 7% |
| Witcher 3 ultra * (Watt) | 115.7 | 174 -50% | 167 -44% | 154 -33% | 159 -37% | 133.9 -16% |
| Load Maximum * (Watt) | 175.2 | 227 -30% | 251 -43% | 223 -27% | 216 -23% | 187.1 -7% |
* ... Meglio usare valori piccoli
Durata della batteria
I tempi di autonomia sono in media di circa 4,5 ore di utilizzo nel mondo reale WLAN con il profilo di alimentazione Balanced. I risultati non sono molto diversi dal GF65 dell'anno scorso, dato che la capacità della batteria non è cambiata.
La ricarica completa richiede poco più di due ore. Il sistema non può essere ricaricato via USB-C.
| MSI GF65 Thin 10UE i7-10750H, GeForce RTX 3060 Laptop GPU, 51 Wh | Asus ROG Strix G15 G513QR R9 5900HX, GeForce RTX 3070 Laptop GPU, 90 Wh | Schenker XMG Core 15 Ampere R7 4800H, GeForce RTX 3060 Laptop GPU, 62 Wh | MSI GS66 Stealth 10UG i7-10870H, GeForce RTX 3070 Laptop GPU, 99.9 Wh | Aorus 15G XC i7-10870H, GeForce RTX 3070 Laptop GPU, 99 Wh | Lenovo Legion 7 15IMH05-81YT001VGE i9-10980HK, GeForce RTX 2080 Super Max-Q, 80 Wh | MSI GF65 9SD i7-9750H, GeForce GTX 1660 Ti Mobile, 51 Wh | |
|---|---|---|---|---|---|---|---|
| Autonomia della batteria | 58% | 2% | 50% | 44% | 1% | 11% | |
| Reader / Idle (h) | 11.1 | 7.8 -30% | 10.8 -3% | 9.6 -14% | |||
| WiFi v1.3 (h) | 4.6 | 7.4 61% | 5.8 26% | 7.1 54% | 6.3 37% | 3.4 -26% | 5.1 11% |
| Load (h) | 1.1 | 1.7 55% | 1.2 9% | 2.2 100% | 2.3 109% | 1.4 27% |
Pro
Contro
Valutazione complessiva dell'MSI GF65 con GeForce RTX 3060

La GeForce RTX 3060 mobile opera in un ampio intervallo di TGP tra 60 W e 115 W. I produttori di laptops sono liberi di puntare a qualsiasi valore di TGP che desiderano all'interno di questo intervallo, il che significa che obiettivi TGP più alti porteranno a prestazioni più elevate. Questo significa anche che alcuni portatili possono preferire prestazioni marginalmente più lente di altri anche se sono dotati della stessa GPU.
L'MSI GF65 10UE è un portatile RTX 3060 relativamente economico e, forse non a caso, è anche dotato di una GPU RTX 3060 più lenta della media. Altri portatili che abbiamo testato finora con la stessa GPU sono circa il 10-15% più veloci. Anche le prestazioni della CPU sono leggermente più lente della media, a meno che gli utenti non decidano di attivare la modalità Cooler Boost. Colori, tempi di risposta in bianco e nero, Thunderbolt e DisplayPort sono nella media o completamente omessi.
I gamers che vogliono massimizzare le prestazioni in rapporto a quanto spendono senza sacrificare la RAM o l'aggiornabilità SSD troveranno il leggero MSI GF65 attraente. Per prestazioni pure più elevate, la maggior parte degli altri portatili gaming con la stessa GeForce RTX 3060 è più veloce.
La facilità di manutenzione, l'elevata frequenza di aggiornamento del display e le temperature relativamente fresche durante il gaming sono ancora alcuni dei nostri aspetti preferiti del GF65. Nonostante questo, i potenziali acquirenti dovrebbero essere consapevoli delle caratteristiche che si perderanno.
Prezzo e disponibilità
La nostra esatta configurazione è attualmente disponibile su Amazon per 1649 dollari. Una configurazione con soli 8 GB di RAM e 512 GB di storage è disponibile per 1299 dollari.
MSI GF65 Thin 10UE
- 03/08/2021 v7 (old)
Allen Ngo
Price comparison
