Notebookcheck Logo

Recensione della scheda grafica NVIDIA GeForce RTX 3060 Ti Founders Edition: Flagship 1440p Ultra e gaming 4K per 400 dollari

Per noi. La NVIDIA RTX 3060 Ti continua la tradizione di Ampere di centellinare le prestazioni di fascia alta della generazione precedente a prezzi inferiori. La RTX 3060 Ti in realtà succede alla RTX 2060 Super ma mira ad essere la scheda go-to per i giochi 1440p Ultra offrendo essenzialmente prestazioni RTX 2080 Super per 400 dollari. Portiamo la NVIDIA RTX 3060 Ti Founders Edition a fare un giro per vedere se è davvero così.

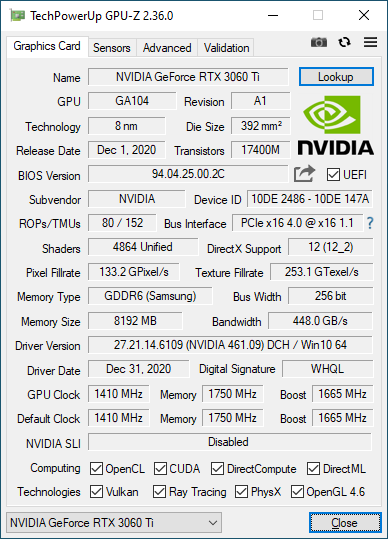
Già nel dicembre 2020, NVIDIA ha annunciato ufficialmente la GeForce RTX 3060 Ti che si rivolge alla stragrande maggioranza dei gamers da 1080p e 1440p. La RTX 3060 Ti è basata sulla stessa GPU GA104 a 8 nm della RTX 3070, ma ha solo 4.864 cores CUDA.

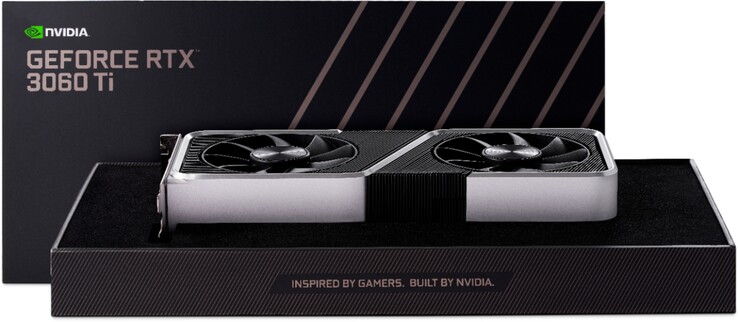
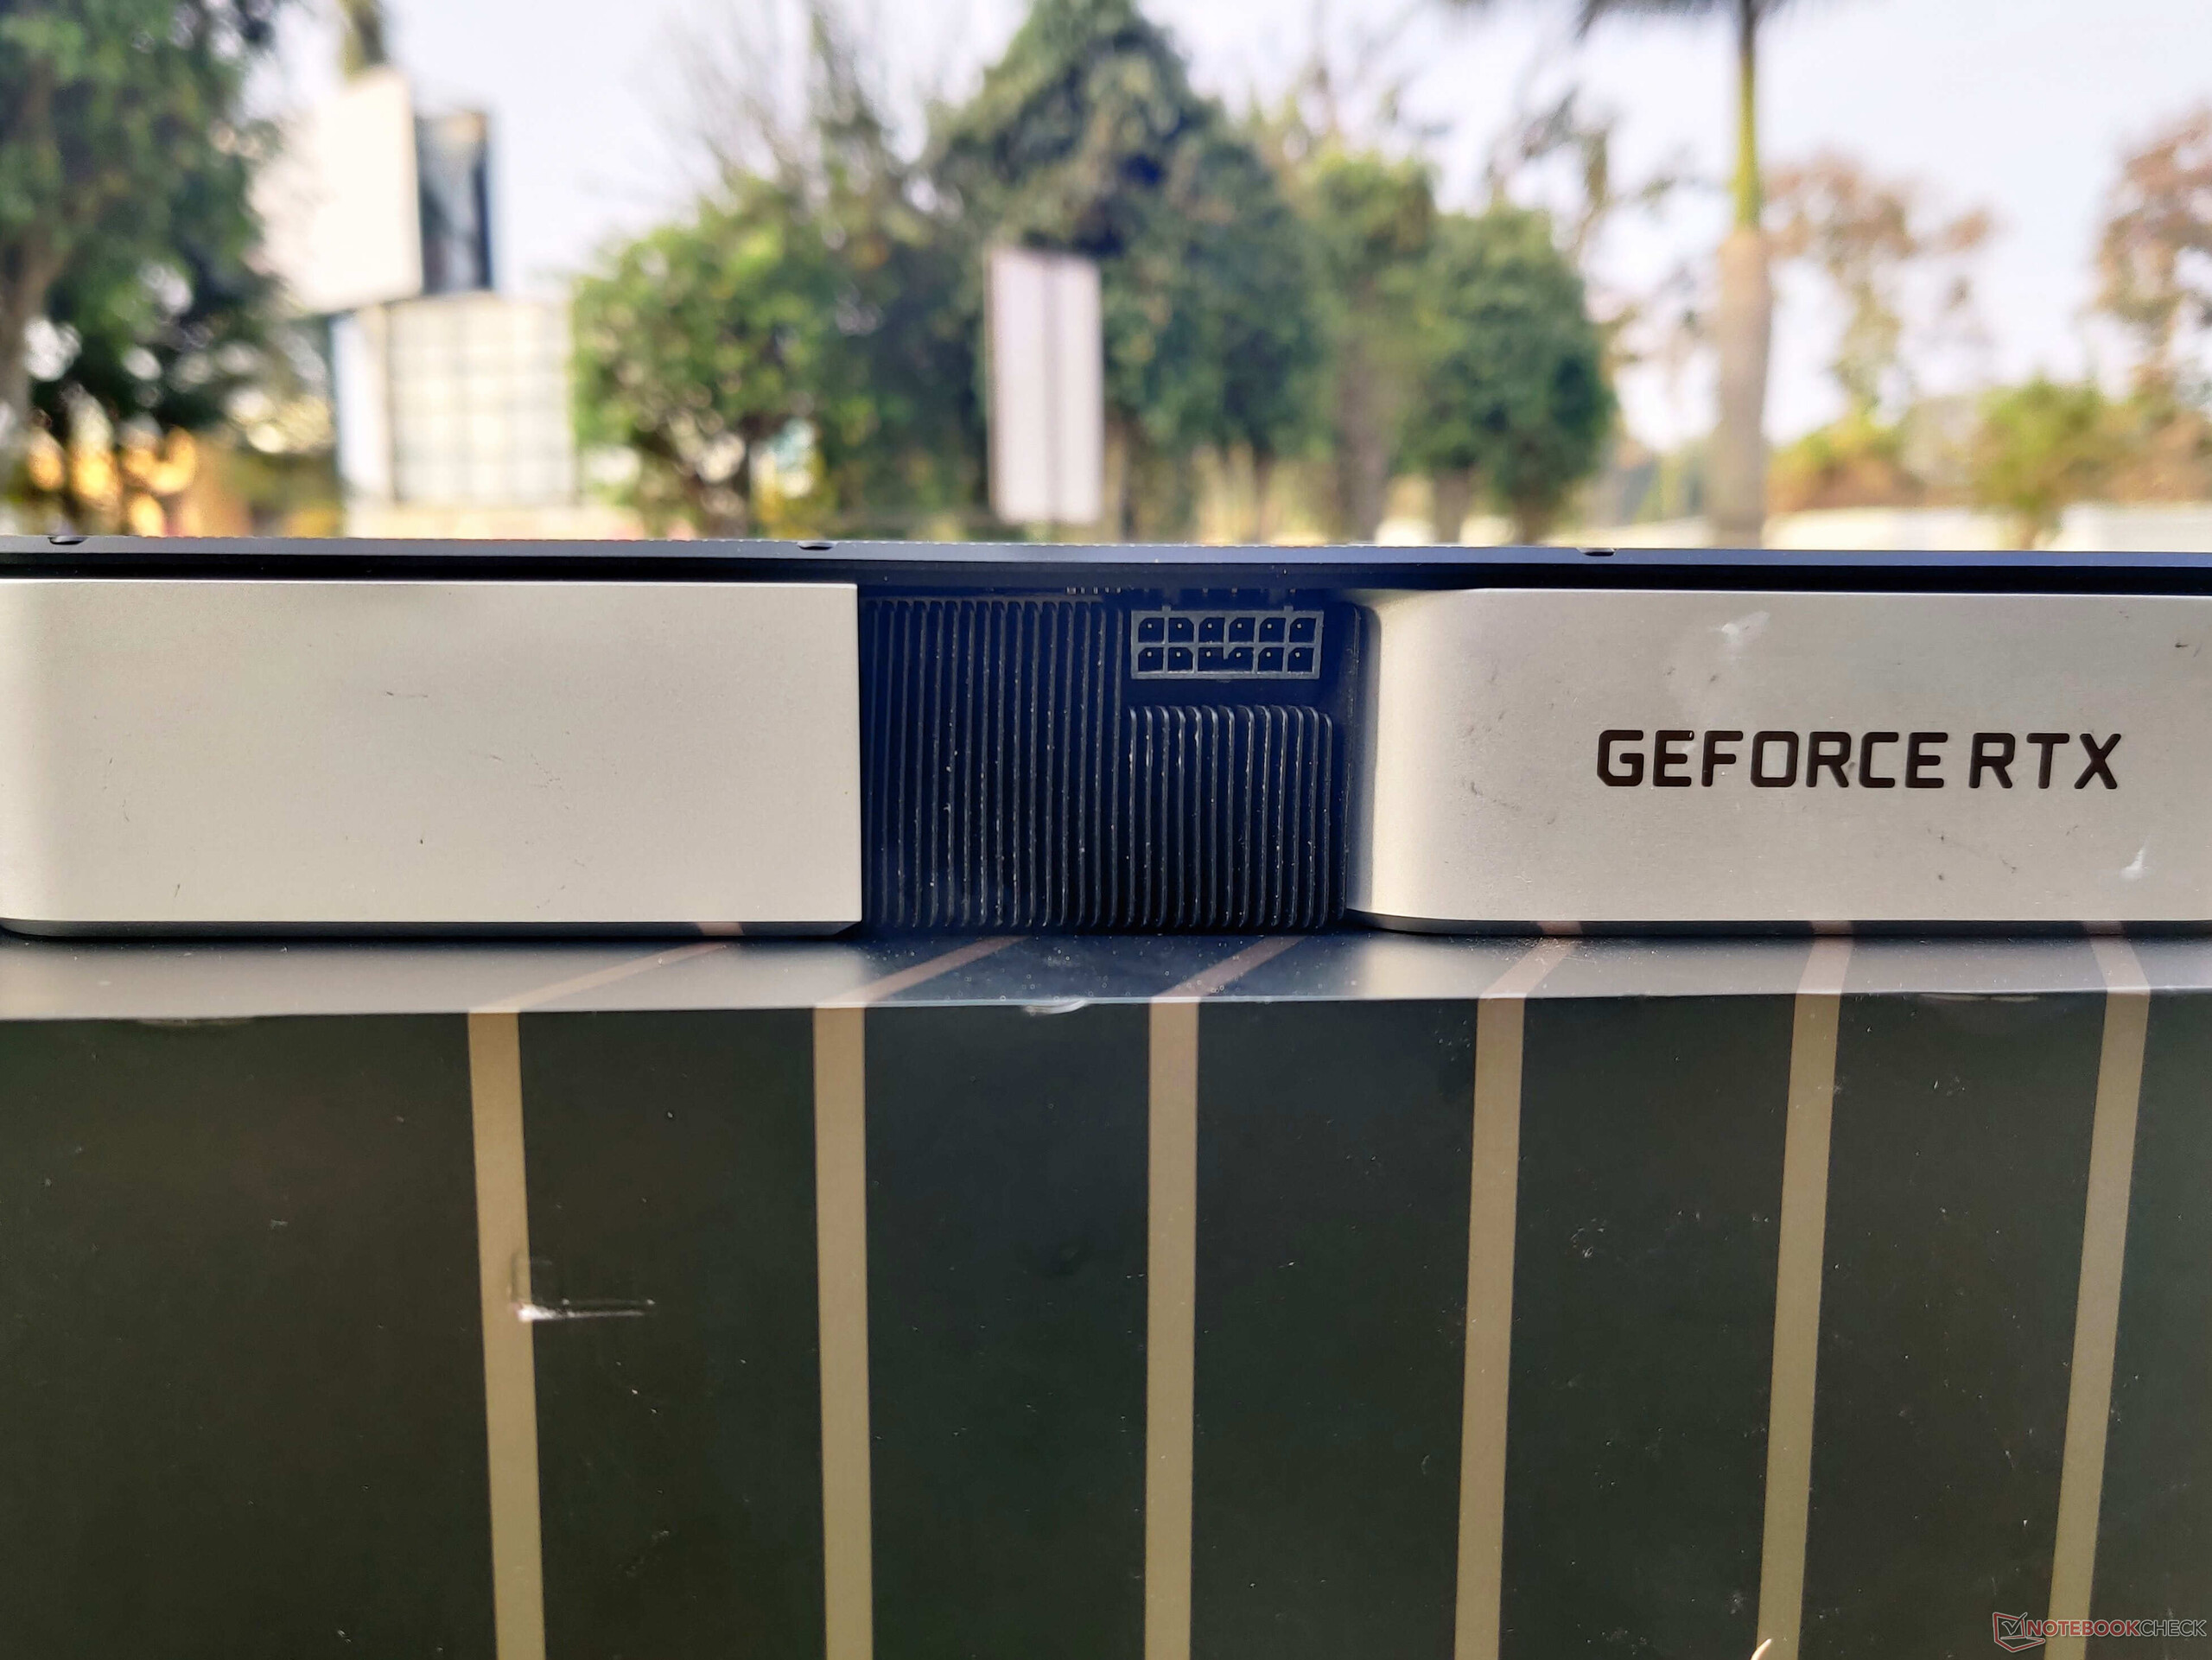
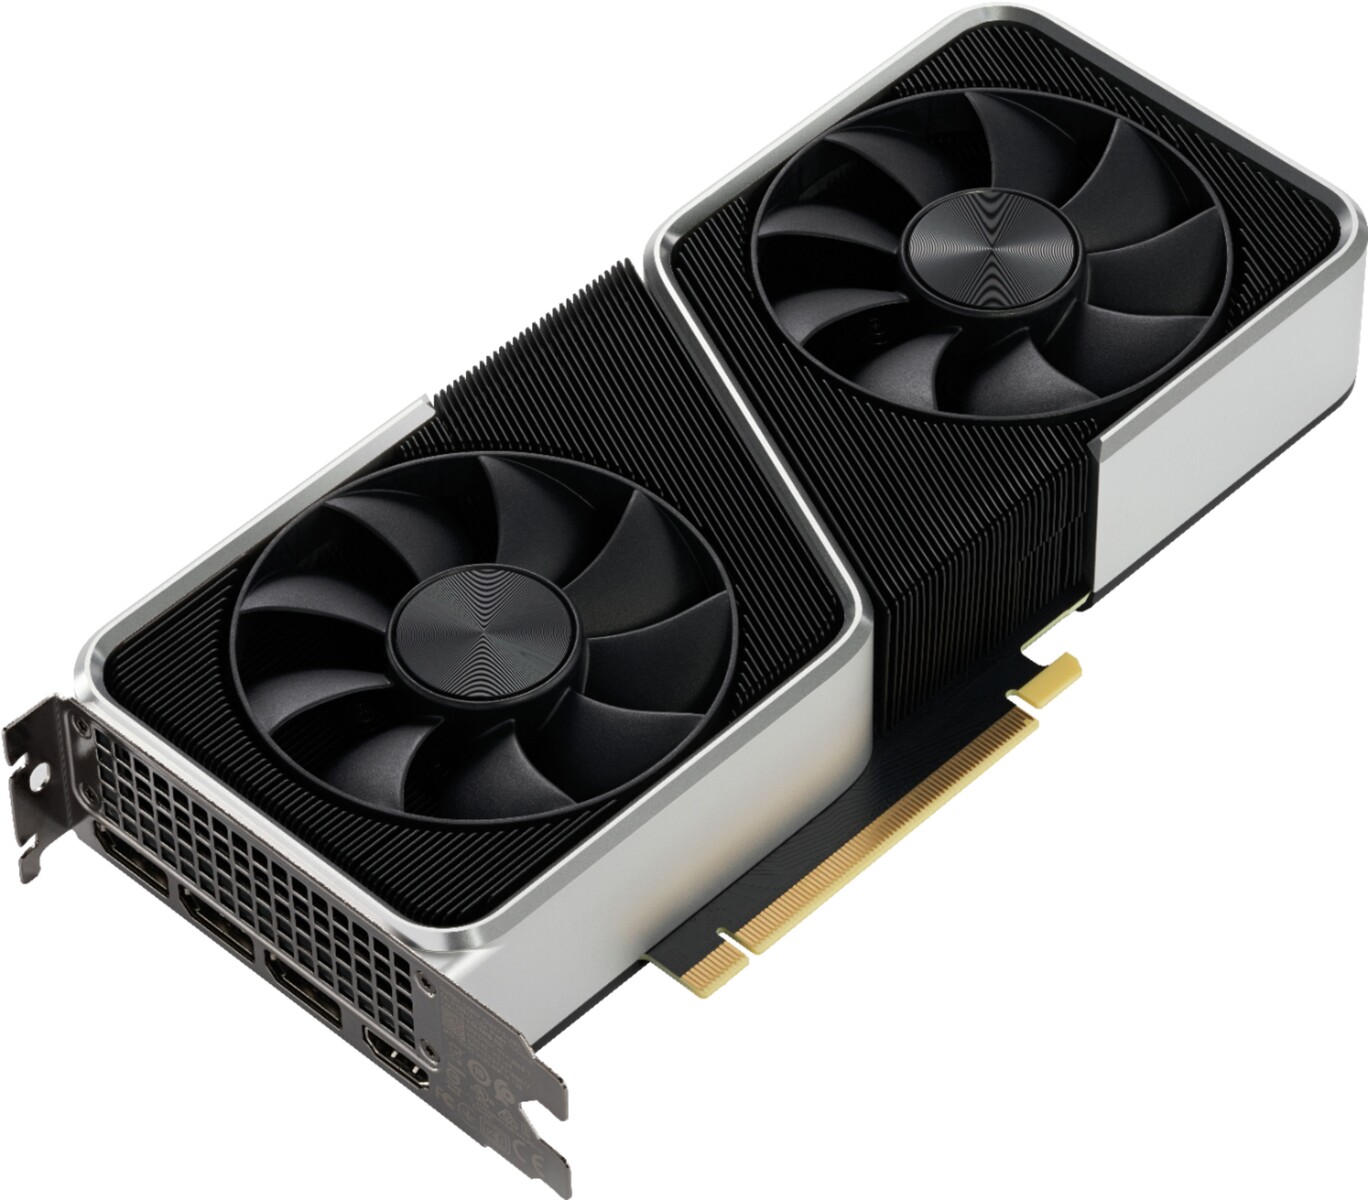
Abbiamo provato la scheda RTX 3060 Ti Founders Edition (FE) di NVIDIA per la recensione. La RTX 3060 Ti FE ha un design simile al resto delle schede Ampere FE, compreso l'uso di un connettore di alimentazione Molex MicroFit 3.0 a 12 pin. Tuttavia, a differenza delle altre schede Ampere FE finora, possiamo vedere una brillante finitura metallica argentata che conferisce un aspetto premium.

Con un prezzo di 400 dollari, la RTX 3060 Ti può essere considerata il successore spirituale della RTX 2060 Super. Tuttavia, la scheda è destinata a offrire prestazioni superiori a quelle della RTX 2080 Super per 300 dollari in meno, il che la rende un potenziale affare in più di un modo per i giocatori di 1440p Ultra e 1080p ad alta frequenza di aggiornamento.

In questa recensione, abbiamo testato la RTX 3060 Ti FE per valutare se offre davvero il buon rapporto prezzo/prestazioni che NVIDIA sostiene di avere.

Confronto della RTX 3060 Ti con altre GPU NVIDIA

Specifiche RTX3090 RTX3080 FE RTX3070 FE RTX3060 Ti FE TitanRTX RTX2080 Ti RTX2080 Super RTX2070 Super TITANX Pascal
Chip GA102 GA102 GA104 GA104 TU102 TU102 TU104 TU104 GP102
Processo FinFET 8 nm 8 nm 8 nm 8nm 12 nm 12 nm 12 nm 16 nm
CUDA cores 10,496 8,704 5,888 4,864 4,608 4,352 3,072 2,560 3,584
Textureunits 328 272 184 152 288 272 192 160 224
Tensor cores 328 3rd Gen. 272 3rd Gen. 184 3rd Gen. 1523rd Gen. 576 2nd Gen. 544 2nd Gen. 384 2nd Gen. 320 2nd Gen. -
RTcores 82 68 46 38 72 68 48 40 -
GPU base clock 1,395 MHz 1,440 MHz 1,500 MHz 1,410 MHz 1,350 MHz 1,350 MHz 1,650 MHz 1,605 MHz 1,417 MHz
GPU boost clock 1,695 MHz 1,710 MHz 1,750 MHz 1,665 MHz 1,770 MHz 1,545 MHz 1,815 MHz 1,770 MHz 1,531 MHz
Memoriabus 384-bit 320-bit 256-bit 256-bit 384-bit 352-bit 256-bit 256-bit 384-bit
Larghezza di banda di memoria 936 GB/s 760 GB/s 448 GB/s 448GB/s 672 GB/s 616 GB/s 495.9 GB/s 448 GB/s 480.4 GB/s
Memoria video 24 GB GDDR6X 10 GB GDDR6X 8 GB GDDR6 8GB GDDR6 24 GB GDDR6 11 GB GDDR6 8 GB GDDR6 8 GB GDDR6 12 GB GDDR5X
Consumo energetico 350 W 320 W 220 W 200W 280 W 250 W 250 W 215 W 250 W

Un tour della NVIDIA GeForce RTX 3060 Ti Founders Edition

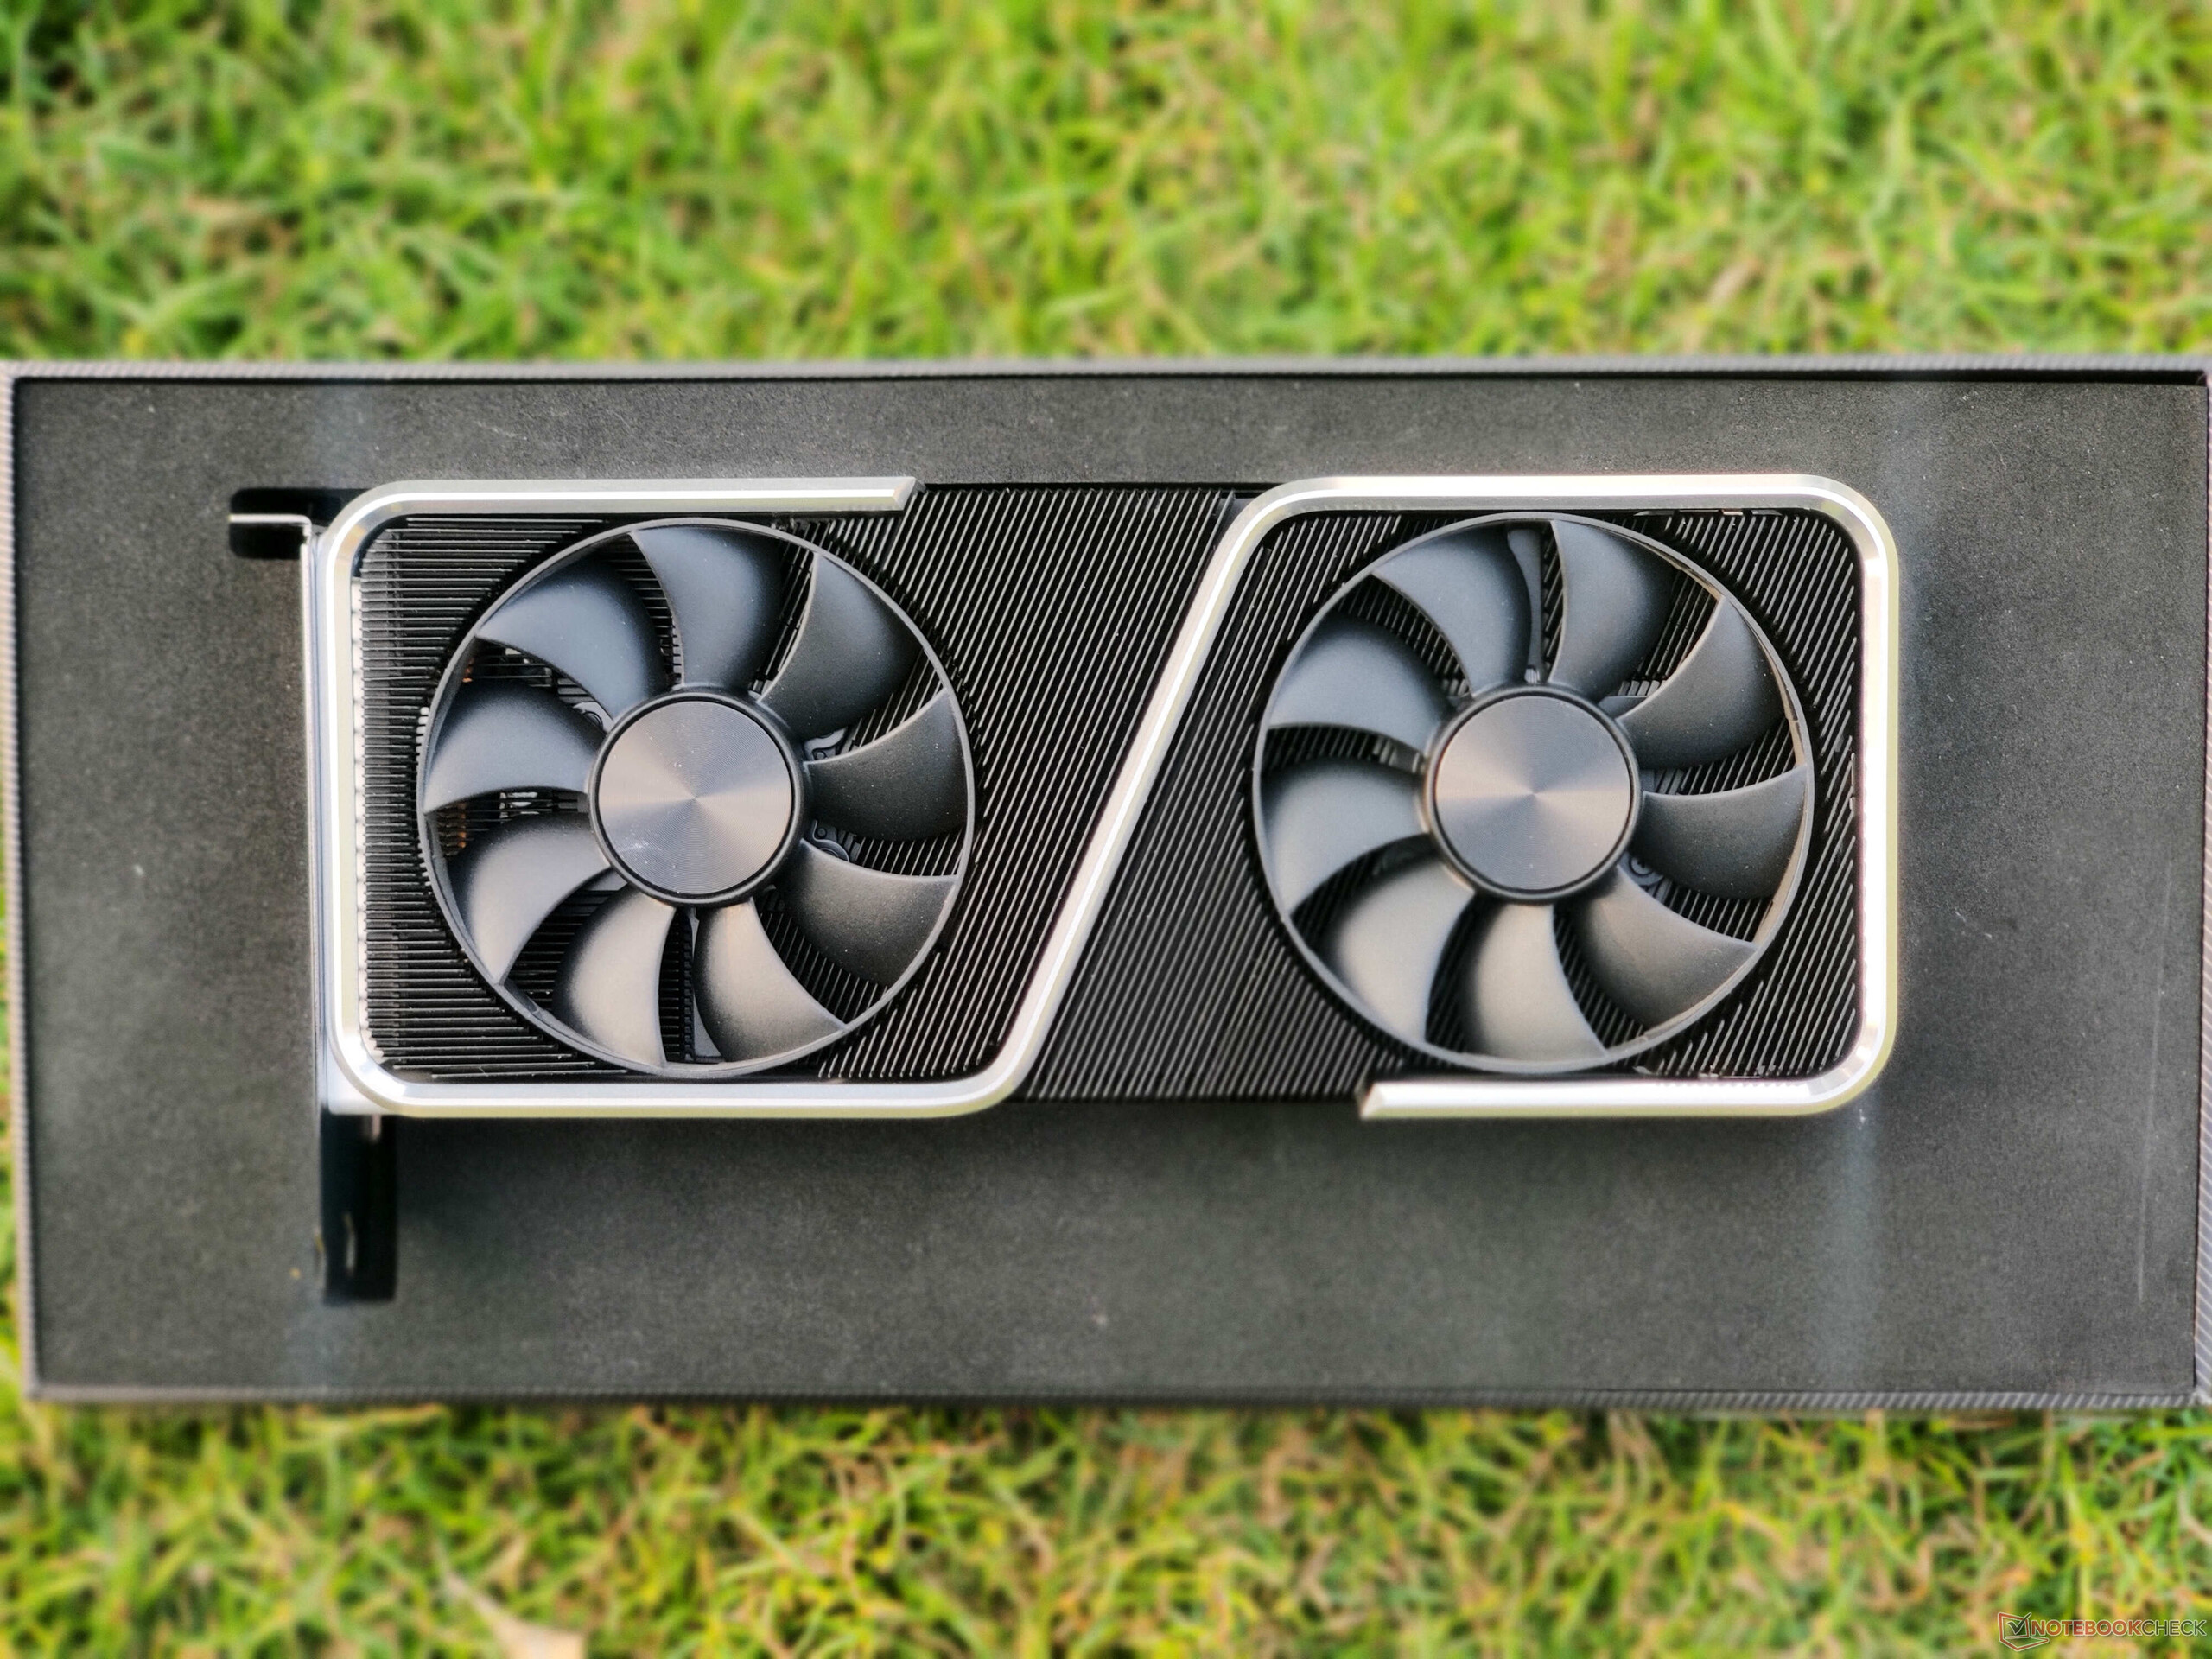
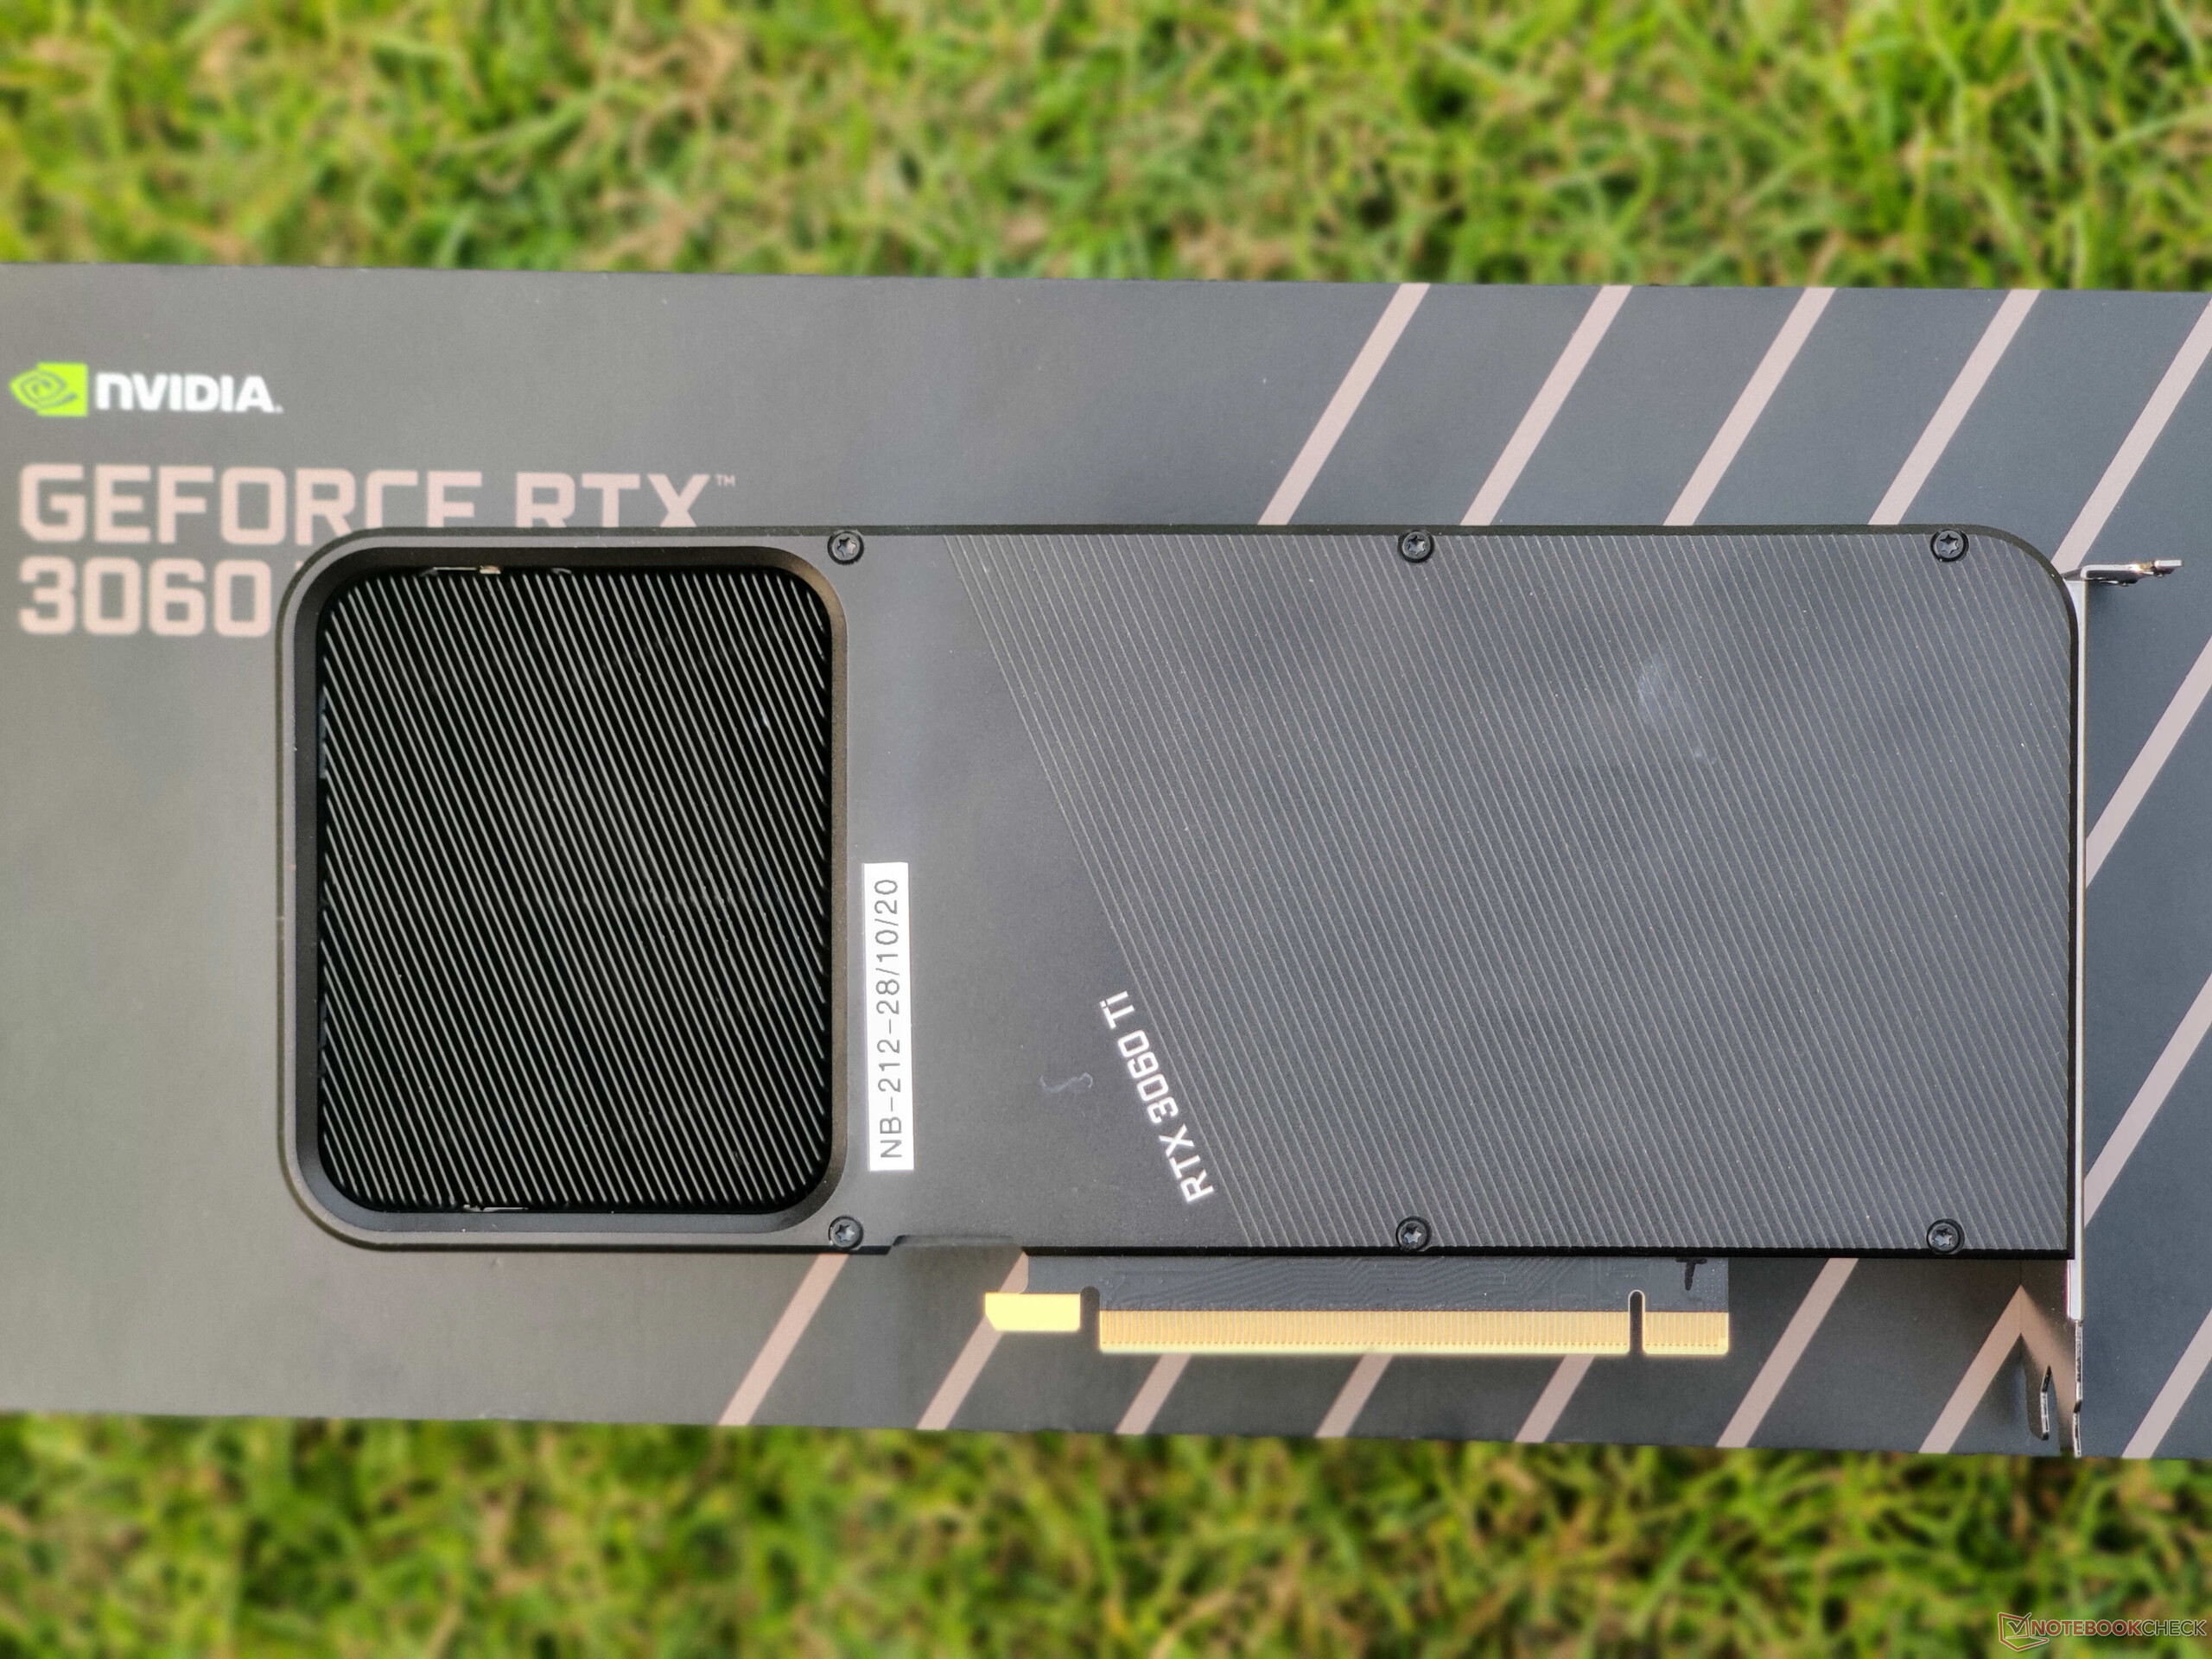
La RTX 3060 Ti Founders Edition incarna il nuovo linguaggio di design di NVIDIA che aiuta con una migliore dissipazione del calore e bassi livelli di rumore, almeno rispetto alle schede FE della generazione precedente. La scheda sembra abbastanza senza pretese, ma il telaio in metallo argento brillante conferisce un aspetto premium. È ben costruito senza torsioni, scricchiolii o rivestimenti di plastica fragile.

Simile al resto delle schede NVIDIA Ampere Founders Edition, la RTX 3060 Ti FE è anche dotata di un connettore di alimentazione Molex MicroFit 3.0 a 12 pin che si trova verso il centro. NVIDIA include un connettore da 8-pin a 12-pin nella confezione.

Il connettore a 12-pin sembra in qualche modo ridondante qui ed è un netto punto debole sul fronte estetico (per non parlare dei problemi di gestione dei cavi), dato che la RTX 3060 Ti consuma meno di 300 W e può facilmente accontentarsi del solo connettore PSU standard a 8-pin.

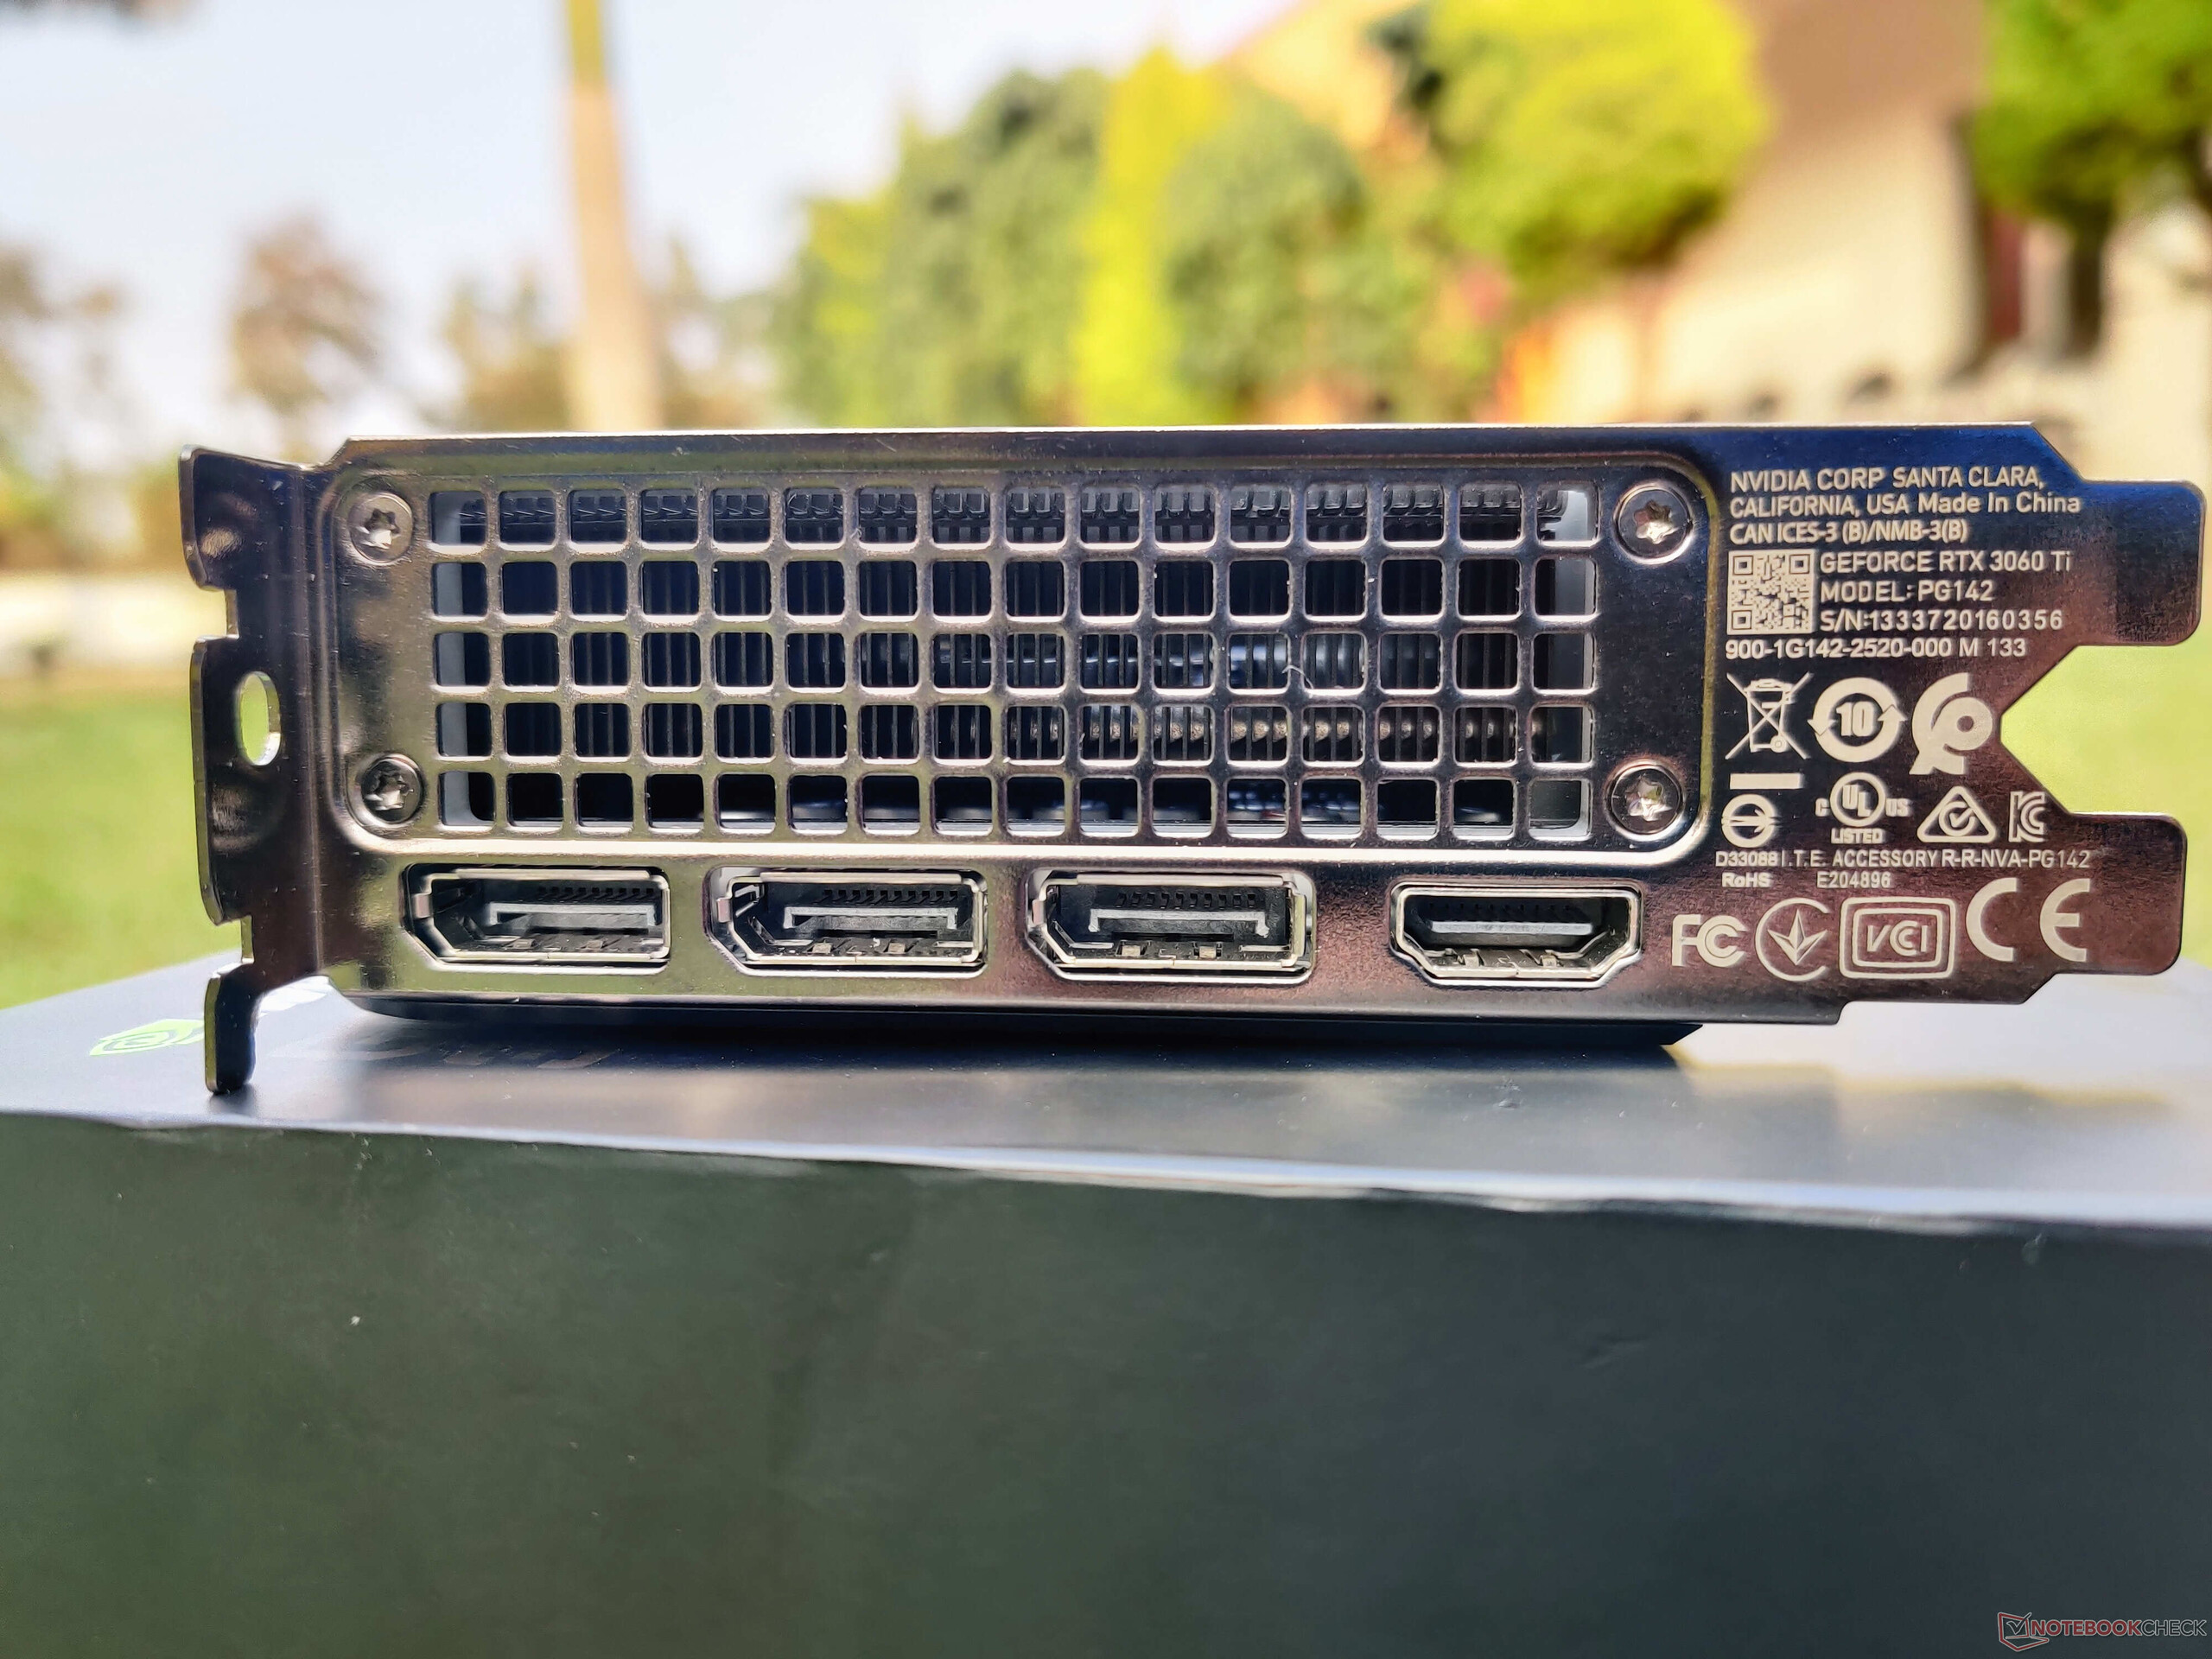
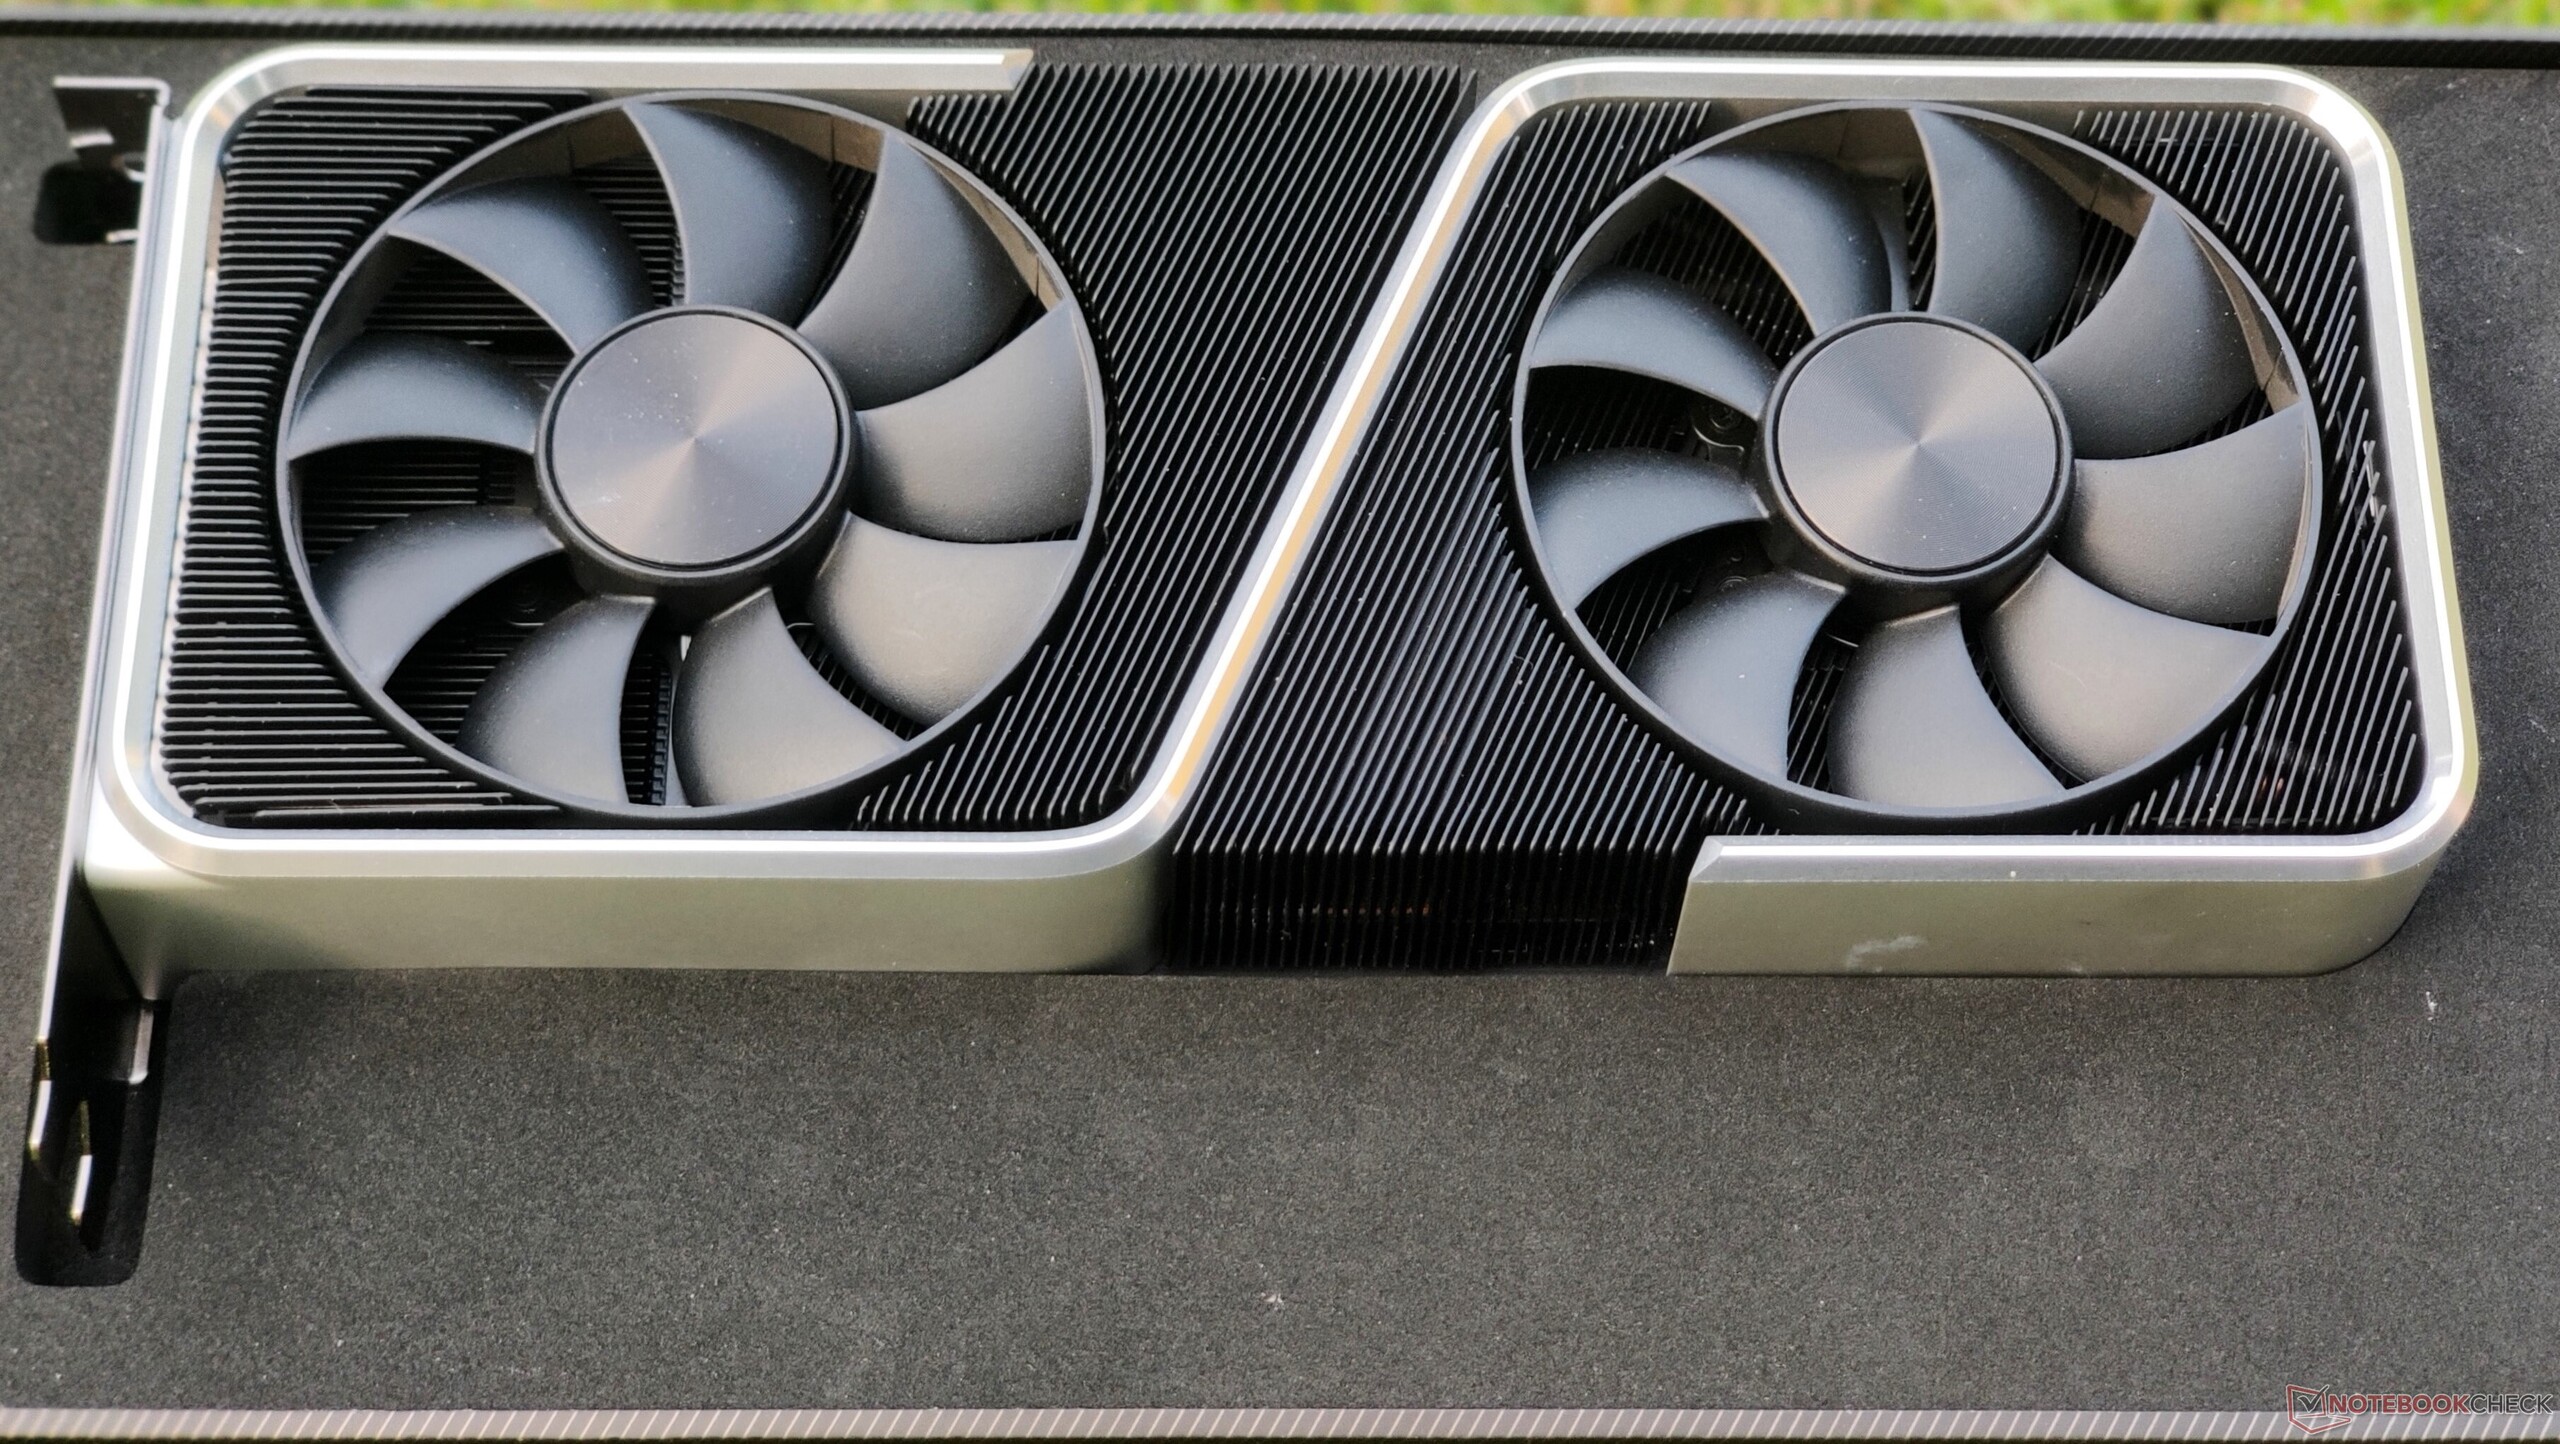
Le opzioni di connettività sono standard e includono tre porte DisplayPort 1.4a e una HDMI 2.1. Le doppie ventole a 9 pale offrono un raffreddamento efficace e hanno un profilo di rumore molto buono sotto carico, come vedremo più avanti nella recensione. Viene fornito un backplate in metallo che non solo aiuta con la protezione ma presenta anche un paio di pad termici sotto per dissipare il calore lontano dai VRM di memoria posti sul retro del PCB.

La NVIDIA GeForce RTX 3060 Ti Founders Edition viene venduta al dettaglio per 399,99 dollari (₹35,900) e viene fornita con una garanzia di tre anni.

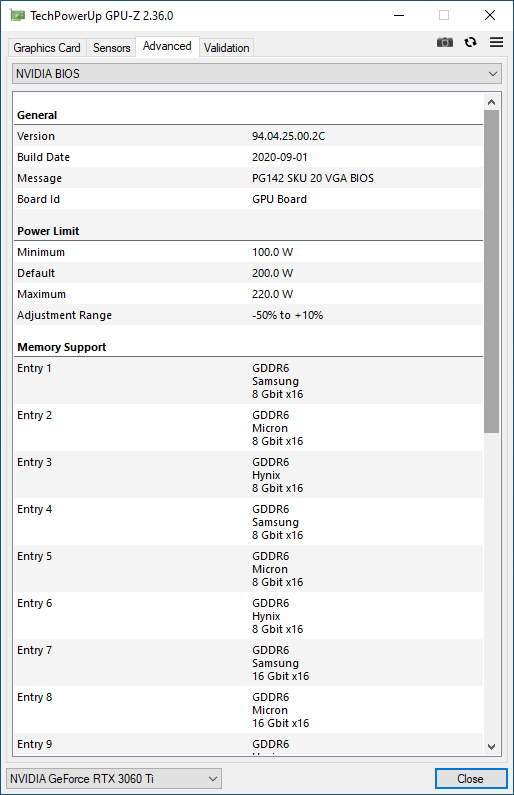
La RTX 3060 Ti FE offre un clock di base di 1.410 MHz e può arrivare fino a 1.665 MHz. È possibile aumentare il taget di potenza di 200 W di altri 20 W. Poiché la scheda manca di qualsiasi forma di bling RGB, la potenza aggiuntiva è per lo più utilizzata dalla GPU stessa. Detto questo, lo spazio effettivo per l'overclocking non è molto.

La RTX 3060 Ti offre 8 GB di GDDR6 VRAM su un bus di memoria a 256 bit con una larghezza di banda massima di 448 GB/s. Anche se questo può sembrare poco in confronto alle offerte di fascia alta di NVIDIA e tutte le schede Radeon RX 6000 di AMD finora, date le capacità della RTX 3060 Ti, gli 8 GB di VRAM dovrebbero essere adeguati a meno che non vi lanciate in applicazioni professionali o carichi di lavoro pesanti che possono richiedere una memoria video più alta. Non ci siamo imbattuti in alcun problema di limitazione della memoria durante tutto il nostro test.

Condizioni di test

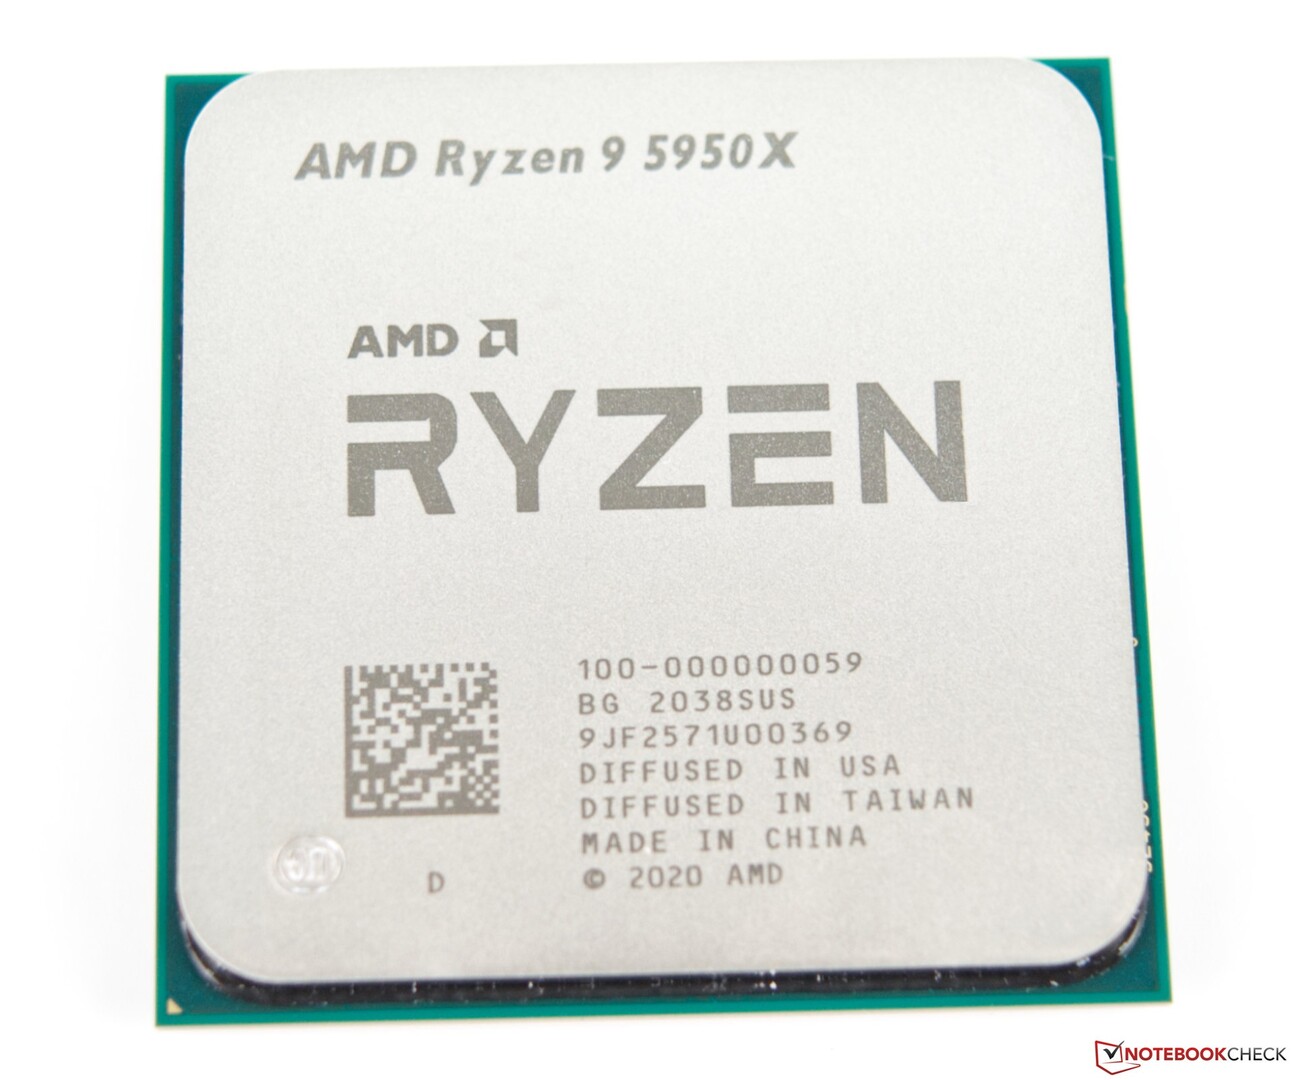
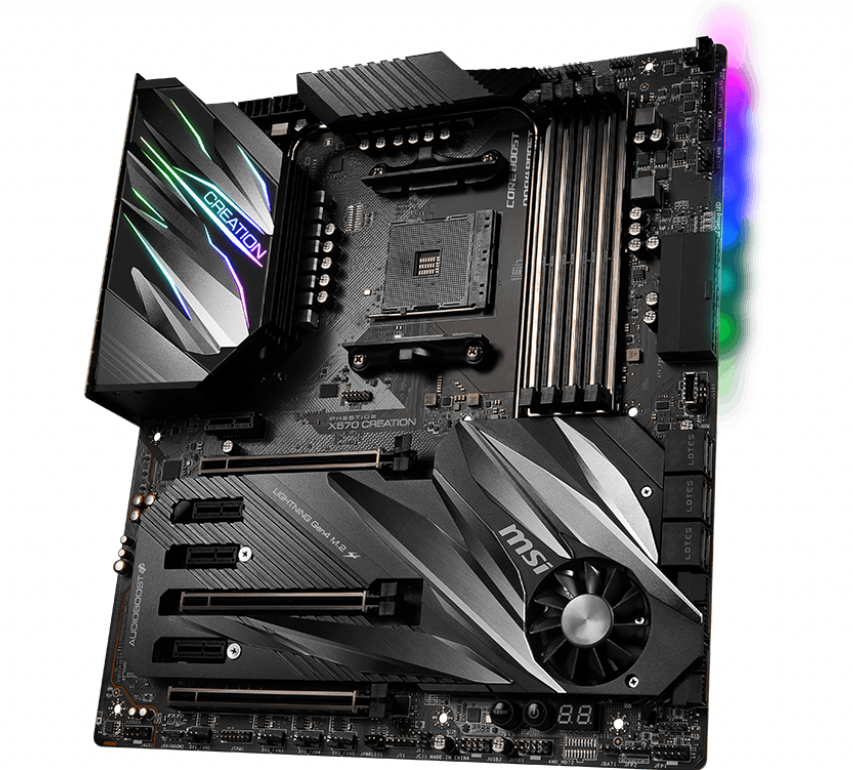
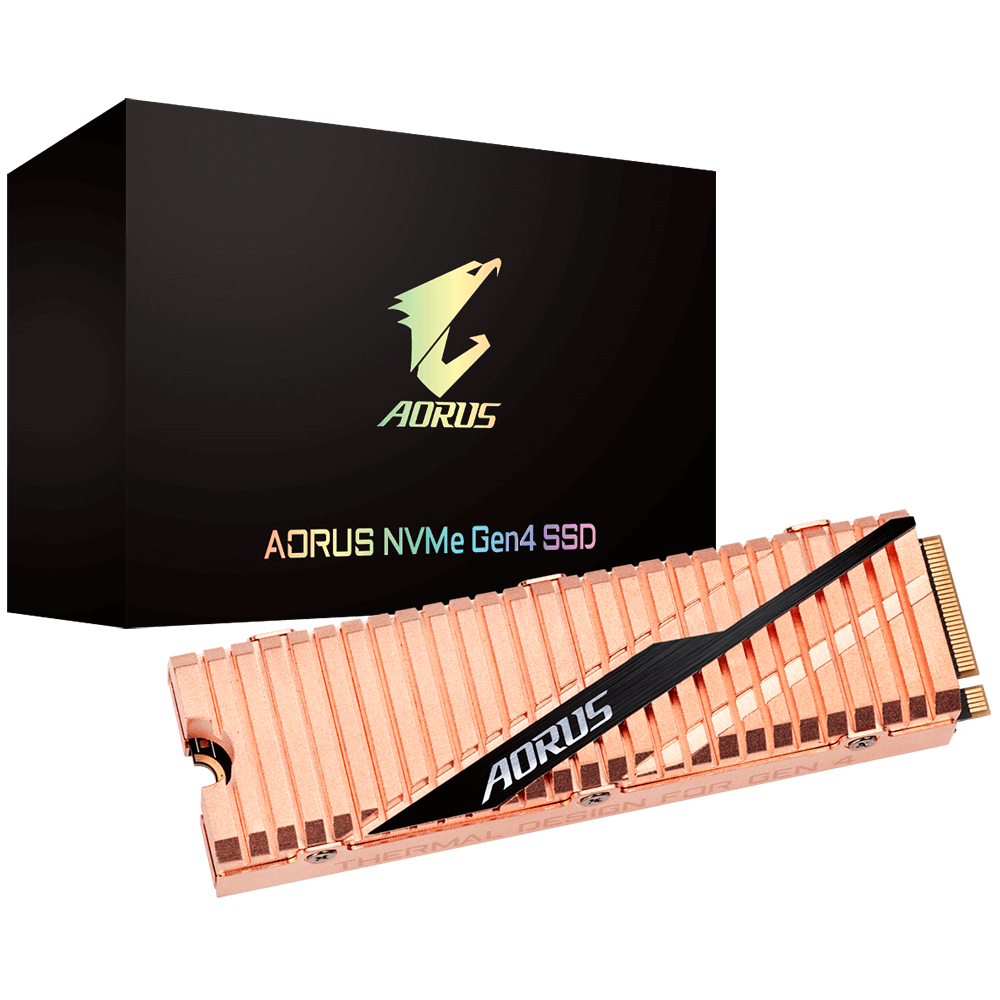
Il nostro sistema di test è composto da un processore AMD Ryzen 9 5950X 16-cores 32-threads, scheda madre MSI Prestige X570 Creation, 32 GB (16 GB x2) di RAM G.SKILL Trident Z Neo DDR4-3200 (timing 16-19-19-39) e un SSD Gigabyte Aorus NVMe Gen4 da 1 TB.

Windows 10 con gli ultimi aggiornamenti cumulativi (Build 19041.746) è stato installato sull'SSD PCIe Aorus NVMe Gen4 mentre due SSD Crucial MX500 SATA da 1 TB sono stati utilizzati per eseguire i benchmarks e i giochi.

Un dispositivo di raffreddamento Corsair iCUE H115i Elite Capellix AIO ha contribuito a mantenere fresco il mastodontico Ryzen 9 5950X. L'intera build era alloggiata in un case Corsair iCUE 4000X RGB con un Thermaltake Toughpower 850 W 80 Plus Gold come alimentatore scelto. Abbiamo eseguito tutti i test con il case chiuso in modo da rirodurre il classico scenario di utilizzo.

La RTX 3060 Ti FE è stata abbinata a una smart TV OnePlus U Series 55U1 che funziona a 4K 60 Hz. L'output del colore è stato impostato su RGB a 32 bit nel pannello di controllo NVIDIA, mentre lo scaling del desktop di Windows è stato impostato al 100%.

Ringraziamo AMD per aver fornito la CPU Ryzen 9 5950X, Corsair per il dispositivo di raffreddamento iCUE Elite Capellix AIO e il case iCUE 4000X, e OnePlus per la TV U Series 55U1 4K.

CPU AMD Ryzen 9 5950X
Scheda madre MSI Prestige X570 Creation. (Fonte immagine: MSI)
SSD Gigabyte Aorus NVMe Gen4. (Fonte immagine: Gigabyte)
G.SKILL Trident Z Neo DDR4-3600 RAM. (Fonte di immagine: G.SKILL)

Benchmarks sintetici

Le prestazioni della RTX 3060 Ti sono allo stesso livello di una RTX 2080 Super e possono essere fino al 32% superiori rispetto ad una RTX 2060 Super, mentre seguono la RTX 3070 di circa il 10% nei test 3DMark.

Una tendenza simile si vede anche con i benchmarks Unigine Heaven e Valley. Vediamo che il delta di prestazioni tra le schede è più alto nei test DirectX che in quelli OpenGL. Mentre la RTX 3060 Ti è solo circa l'8% più veloce della RTX 2080 Super in Heaven 4.0 DirectX, Valley 1.0 DirectX porta questa differenza a un significativo 27%. Unigine Superposition mostra che la RTX 3060 Ti è dal 12% al 14% più lenta della RTX 3070 ma virtualmente pareggia con la media della RTX 2080 Super in tutti i test tranne 720p low.

3DMark
2560x1440 Time Spy Graphics
MSI GeForce RTX 3090 Suprim X
NVIDIA GeForce RTX 3090, R9 5900X
19571 Points +69%
Media NVIDIA GeForce RTX 3090
  (18685 - 20433, n=17)
19266 Points +66%
MSI GeForce RTX 3080 Gaming X Trio
NVIDIA GeForce RTX 3080, R9 5900X
17604 Points +52%
AMD Radeon RX 6800 XT
AMD Radeon RX 6800 XT, R9 5950X
17603 Points +52%
Media NVIDIA GeForce RTX 3080
  (17467 - 17604, n=2)
17536 Points +51%
AMD Ryzen 9 5900X
NVIDIA Titan RTX, R9 5900X
15283 Points +32%
KFA2 GeForce RTX 2080 Ti EX
NVIDIA GeForce RTX 2080 Ti (Desktop), R9 3900X
13744 Points +19%
Zotac Gaming GeForce RTX 3070 Twin Edge
NVIDIA GeForce RTX 3070, R9 5950X
13024 Points +12%
Media NVIDIA GeForce RTX 3070
  (11043 - 13579, n=7)
12616 Points +9%
NVIDIA GeForce RTX 3060 Ti FE
NVIDIA GeForce RTX 3060 Ti, R9 5950X
11590 Points
Nvidia GeForce RTX 2080 Super
NVIDIA GeForce RTX 2080 Super (Desktop), R7 2700X
11477 Points -1%
Media NVIDIA GeForce RTX 2080 Super (Desktop)
  (11313 - 11542, n=4)
11439 Points -1%
Nvidia GeForce RTX 2070 Super
NVIDIA GeForce RTX 2070 Super (Desktop), R7 2700X
10094 Points -13%
Media NVIDIA GeForce RTX 2070 Super (Desktop)
  (9564 - 10094, n=8)
9846 Points -15%
Nvidia GeForce RTX 2060 Super
NVIDIA GeForce RTX 2060 Super (Desktop), R7 2700X
8795 Points -24%
AMD Radeon RX 5700 XT
AMD Radeon RX 5700 XT (Desktop), R7 2700X
8673 Points -25%
Media NVIDIA GeForce RTX 2060 Super (Desktop)
  (8396 - 8795, n=7)
8631 Points -26%
KFA 2 GeForce GTX 1660 Super
NVIDIA GeForce GTX 1660 Super (Desktop), R9 3900X
6021 Points -48%
KFA2 GeForce GTX 1650 Super EX One Click OC
NVIDIA GeForce GTX 1650 Super (Desktop), R9 5900X
4632 Points -60%
3840x2160 Fire Strike Ultra Graphics
AMD Radeon RX 6800 XT
AMD Radeon RX 6800 XT, R9 5950X
12626 Points +77%
MSI GeForce RTX 3090 Suprim X
NVIDIA GeForce RTX 3090, R9 5900X
12371 Points +74%
Media NVIDIA GeForce RTX 3090
  (11613 - 12587, n=14)
12289 Points +72%
Media NVIDIA GeForce RTX 3080
  (10645 - 10793, n=2)
10719 Points +50%
MSI GeForce RTX 3080 Gaming X Trio
NVIDIA GeForce RTX 3080, R9 5900X
10645 Points +49%
AMD Ryzen 9 5900X
NVIDIA Titan RTX, R9 5900X
8649 Points +21%
Media NVIDIA GeForce RTX 3070
  (8043 - 8483, n=5)
8250 Points +16%
Zotac Gaming GeForce RTX 3070 Twin Edge
NVIDIA GeForce RTX 3070, R9 5950X
8043 Points +13%
KFA2 GeForce RTX 2080 Ti EX
NVIDIA GeForce RTX 2080 Ti (Desktop), R9 3900X
7925 Points +11%
NVIDIA GeForce RTX 3060 Ti FE
NVIDIA GeForce RTX 3060 Ti, R9 5950X
7126 Points
Media NVIDIA GeForce RTX 2080 Super (Desktop)
  (6500 - 6700, n=3)
6585 Points -8%
Nvidia GeForce RTX 2080 Super
NVIDIA GeForce RTX 2080 Super (Desktop), R7 2700X
6500 Points -9%
AMD Radeon RX 5700 XT
AMD Radeon RX 5700 XT (Desktop), R7 2700X
5955 Points -16%
Nvidia GeForce RTX 2070 Super
NVIDIA GeForce RTX 2070 Super (Desktop), R7 2700X
5786 Points -19%
Media NVIDIA GeForce RTX 2070 Super (Desktop)
  (2290 - 5882, n=7)
5313 Points -25%
Nvidia GeForce RTX 2060 Super
NVIDIA GeForce RTX 2060 Super (Desktop), R7 2700X
5175 Points -27%
Media NVIDIA GeForce RTX 2060 Super (Desktop)
  (5067 - 5224, n=6)
5164 Points -28%
KFA 2 GeForce GTX 1660 Super
NVIDIA GeForce GTX 1660 Super (Desktop), R9 3900X
3088 Points -57%
KFA2 GeForce GTX 1650 Super EX One Click OC
NVIDIA GeForce GTX 1650 Super (Desktop), R9 5900X
2186 Points -69%
Fire Strike Extreme Graphics
AMD Radeon RX 6800 XT
AMD Radeon RX 6800 XT, R9 5950X
25015 Points +80%
Media NVIDIA GeForce RTX 3090
  (22075 - 24730, n=14)
23806 Points +71%
MSI GeForce RTX 3090 Suprim X
NVIDIA GeForce RTX 3090, R9 5900X
23114 Points +66%
Media NVIDIA GeForce RTX 3080
  (20007 - 20861, n=2)
20434 Points +47%
MSI GeForce RTX 3080 Gaming X Trio
NVIDIA GeForce RTX 3080, R9 5900X
20007 Points +44%
AMD Ryzen 9 5900X
NVIDIA Titan RTX, R9 5900X
17176 Points +24%
Media NVIDIA GeForce RTX 3070
  (15503 - 16276, n=5)
15859 Points +14%
KFA2 GeForce RTX 2080 Ti EX
NVIDIA GeForce RTX 2080 Ti (Desktop), R9 3900X
15603 Points +12%
Zotac Gaming GeForce RTX 3070 Twin Edge
NVIDIA GeForce RTX 3070, R9 5950X
15503 Points +12%
NVIDIA GeForce RTX 3060 Ti FE
NVIDIA GeForce RTX 3060 Ti, R9 5950X
13898 Points
Media NVIDIA GeForce RTX 2080 Super (Desktop)
  (12968 - 13551, n=3)
13172 Points -5%
Nvidia GeForce RTX 2080 Super
NVIDIA GeForce RTX 2080 Super (Desktop), R7 2700X
12968 Points -7%
AMD Radeon RX 5700 XT
AMD Radeon RX 5700 XT (Desktop), R7 2700X
12209 Points -12%
Media NVIDIA GeForce RTX 2070 Super (Desktop)
  (11382 - 12044, n=7)
11850 Points -15%
Nvidia GeForce RTX 2070 Super
NVIDIA GeForce RTX 2070 Super (Desktop), R7 2700X
11634 Points -16%
Media NVIDIA GeForce RTX 2060 Super (Desktop)
  (10182 - 10726, n=6)
10498 Points -24%
Nvidia GeForce RTX 2060 Super
NVIDIA GeForce RTX 2060 Super (Desktop), R7 2700X
10481 Points -25%
KFA 2 GeForce GTX 1660 Super
NVIDIA GeForce GTX 1660 Super (Desktop), R9 3900X
6935 Points -50%
KFA2 GeForce GTX 1650 Super EX One Click OC
NVIDIA GeForce GTX 1650 Super (Desktop), R9 5900X
5135 Points -63%
1920x1080 Fire Strike Graphics
AMD Radeon RX 6800 XT
AMD Radeon RX 6800 XT, R9 5950X
49735 Points +77%
Media NVIDIA GeForce RTX 3090
  (41298 - 49282, n=17)
46856 Points +66%
MSI GeForce RTX 3090 Suprim X
NVIDIA GeForce RTX 3090, R9 5900X
42688 Points +52%
Media NVIDIA GeForce RTX 3080
  (37604 - 40910, n=2)
39257 Points +39%
MSI GeForce RTX 3080 Gaming X Trio
NVIDIA GeForce RTX 3080, R9 5900X
37604 Points +34%
AMD Ryzen 9 5900X
NVIDIA Titan RTX, R9 5900X
34722 Points +23%
KFA2 GeForce RTX 2080 Ti EX
NVIDIA GeForce RTX 2080 Ti (Desktop), R9 3900X
32081 Points +14%
Zotac Gaming GeForce RTX 3070 Twin Edge
NVIDIA GeForce RTX 3070, R9 5950X
31252 Points +11%
Media NVIDIA GeForce RTX 3070
  (20357 - 33270, n=7)
28949 Points +3%
NVIDIA GeForce RTX 3060 Ti FE
NVIDIA GeForce RTX 3060 Ti, R9 5950X
28145 Points
Media NVIDIA GeForce RTX 2080 Super (Desktop)
  (26824 - 28968, n=4)
27647 Points -2%
Nvidia GeForce RTX 2080 Super
NVIDIA GeForce RTX 2080 Super (Desktop), R7 2700X
27075 Points -4%
AMD Radeon RX 5700 XT
AMD Radeon RX 5700 XT (Desktop), R7 2700X
25383 Points -10%
Media NVIDIA GeForce RTX 2070 Super (Desktop)
  (22819 - 25799, n=8)
24645 Points -12%
Nvidia GeForce RTX 2070 Super
NVIDIA GeForce RTX 2070 Super (Desktop), R7 2700X
24151 Points -14%
Nvidia GeForce RTX 2060 Super
NVIDIA GeForce RTX 2060 Super (Desktop), R7 2700X
21970 Points -22%
Media NVIDIA GeForce RTX 2060 Super (Desktop)
  (20522 - 22764, n=7)
21970 Points -22%
KFA 2 GeForce GTX 1660 Super
NVIDIA GeForce GTX 1660 Super (Desktop), R9 3900X
15498 Points -45%
KFA2 GeForce GTX 1650 Super EX One Click OC
NVIDIA GeForce GTX 1650 Super (Desktop), R9 5900X
11688 Points -58%
Unigine Heaven 4.0
Extreme Preset DX11
Media NVIDIA GeForce RTX 3090
  (272 - 315, n=11)
300 fps +59%
MSI GeForce RTX 3090 Suprim X
NVIDIA GeForce RTX 3090, R9 5900X
283.5 fps +50%
MSI GeForce RTX 3080 Gaming X Trio
NVIDIA GeForce RTX 3080, R9 5900X
252.5 fps +34%
AMD Radeon RX 6800 XT
AMD Radeon RX 6800 XT, R9 5950X
247.9 fps +31%
Media NVIDIA GeForce RTX 3080
  (233 - 253, n=2)
243 fps +29%
AMD Ryzen 9 5900X
NVIDIA Titan RTX, R9 5900X
237.1 fps +26%
KFA2 GeForce RTX 2080 Ti EX
NVIDIA GeForce RTX 2080 Ti (Desktop), R9 3900X
215.2 fps +14%
Zotac Gaming GeForce RTX 3070 Twin Edge
NVIDIA GeForce RTX 3070, R9 5950X
213.7 fps +13%
Media NVIDIA GeForce RTX 3070
  (196.4 - 214, n=5)
206 fps +9%
NVIDIA GeForce RTX 3060 Ti FE
NVIDIA GeForce RTX 3060 Ti, R9 5950X
188.6 (43.6min - 434.5max) fps
Nvidia GeForce RTX 2080 Super
NVIDIA GeForce RTX 2080 Super (Desktop), R7 2700X
175.2 fps -7%
Media NVIDIA GeForce RTX 2080 Super (Desktop)
  ()
175.2 fps -7%
Media NVIDIA GeForce RTX 2070 Super (Desktop)
  (160.1 - 172.3, n=4)
167.1 fps -11%
Nvidia GeForce RTX 2070 Super
NVIDIA GeForce RTX 2070 Super (Desktop), R7 2700X
160.1 fps -15%
Media NVIDIA GeForce RTX 2060 Super (Desktop)
  (140.4 - 146.1, n=4)
143.3 fps -24%
Nvidia GeForce RTX 2060 Super
NVIDIA GeForce RTX 2060 Super (Desktop), R7 2700X
141.7 fps -25%
AMD Radeon RX 5700 XT
AMD Radeon RX 5700 XT (Desktop), R7 2700X
132.5 fps -30%
KFA 2 GeForce GTX 1660 Super
NVIDIA GeForce GTX 1660 Super (Desktop), R9 3900X
98.3 fps -48%
KFA2 GeForce GTX 1650 Super EX One Click OC
NVIDIA GeForce GTX 1650 Super (Desktop), R9 5900X
71.9 fps -62%
Extreme Preset OpenGL
MSI GeForce RTX 3090 Suprim X
NVIDIA GeForce RTX 3090, R9 5900X
273.7 fps +59%
Media NVIDIA GeForce RTX 3090
  (188.2 - 284, n=10)
270 fps +57%
MSI GeForce RTX 3080 Gaming X Trio
NVIDIA GeForce RTX 3080, R9 5900X
243.2 fps +41%
Media NVIDIA GeForce RTX 3080
  (232 - 243, n=2)
238 fps +38%
AMD Ryzen 9 5900X
NVIDIA Titan RTX, R9 5900X
215.1 fps +25%
KFA2 GeForce RTX 2080 Ti EX
NVIDIA GeForce RTX 2080 Ti (Desktop), R9 3900X
204.4 fps +19%
AMD Radeon RX 6800 XT
AMD Radeon RX 6800 XT, R9 5950X
204 fps +18%
Media NVIDIA GeForce RTX 3070
  (187.5 - 196.1, n=4)
192.5 fps +12%
NVIDIA GeForce RTX 3060 Ti FE
NVIDIA GeForce RTX 3060 Ti, R9 5950X
172.3 (11.4min - 371.5max) fps
Nvidia GeForce RTX 2080 Super
NVIDIA GeForce RTX 2080 Super (Desktop), R7 2700X
167.5 fps -3%
Media NVIDIA GeForce RTX 2080 Super (Desktop)
  ()
167.5 fps -3%
Media NVIDIA GeForce RTX 2070 Super (Desktop)
  (153.5 - 157.1, n=4)
155.4 fps -10%
Nvidia GeForce RTX 2070 Super
NVIDIA GeForce RTX 2070 Super (Desktop), R7 2700X
153.5 fps -11%
Media NVIDIA GeForce RTX 2060 Super (Desktop)
  (132.3 - 133.9, n=4)
133.1 fps -23%
Nvidia GeForce RTX 2060 Super
NVIDIA GeForce RTX 2060 Super (Desktop), R7 2700X
132.3 fps -23%
AMD Radeon RX 5700 XT
AMD Radeon RX 5700 XT (Desktop), R7 2700X
110.2 fps -36%
KFA 2 GeForce GTX 1660 Super
NVIDIA GeForce GTX 1660 Super (Desktop), R9 3900X
92.2 fps -46%
KFA2 GeForce GTX 1650 Super EX One Click OC
NVIDIA GeForce GTX 1650 Super (Desktop), R9 5900X
68.9 fps -60%
Unigine Valley 1.0
1920x1080 Extreme HD DirectX AA:x8
Media NVIDIA GeForce RTX 3090
  (184.2 - 247, n=11)
225 fps +47%
MSI GeForce RTX 3090 Suprim X
NVIDIA GeForce RTX 3090, R9 5900X
196 fps +28%
AMD Radeon RX 6800 XT
AMD Radeon RX 6800 XT, R9 5950X
190.6 fps +24%
MSI GeForce RTX 3080 Gaming X Trio
NVIDIA GeForce RTX 3080, R9 5900X
181.8 fps +19%
AMD Ryzen 9 5900X
NVIDIA Titan RTX, R9 5900X
180.1 fps +18%
Media NVIDIA GeForce RTX 3080
  (176.2 - 181.8, n=2)
179 fps +17%
Zotac Gaming GeForce RTX 3070 Twin Edge
NVIDIA GeForce RTX 3070, R9 5950X
168.1 fps +10%
Media NVIDIA GeForce RTX 3070
  (155.1 - 168.5, n=5)
161.2 fps +5%
KFA2 GeForce RTX 2080 Ti EX
NVIDIA GeForce RTX 2080 Ti (Desktop), R9 3900X
159.4 fps +4%
NVIDIA GeForce RTX 3060 Ti FE
NVIDIA GeForce RTX 3060 Ti, R9 5950X
153.2 (48.2min - 297.9max) fps
Media NVIDIA GeForce RTX 2070 Super (Desktop)
  (113.7 - 127.4, n=4)
122.5 fps -20%
Nvidia GeForce RTX 2080 Super
NVIDIA GeForce RTX 2080 Super (Desktop), R7 2700X
120.2 fps -22%
Media NVIDIA GeForce RTX 2080 Super (Desktop)
  ()
120.2 fps -22%
Nvidia GeForce RTX 2070 Super
NVIDIA GeForce RTX 2070 Super (Desktop), R7 2700X
113.7 fps -26%
Media NVIDIA GeForce RTX 2060 Super (Desktop)
  (106.9 - 114.1, n=4)
111.3 fps -27%
Nvidia GeForce RTX 2060 Super
NVIDIA GeForce RTX 2060 Super (Desktop), R7 2700X
106.9 fps -30%
AMD Radeon RX 5700 XT
AMD Radeon RX 5700 XT (Desktop), R7 2700X
106.3 fps -31%
KFA 2 GeForce GTX 1660 Super
NVIDIA GeForce GTX 1660 Super (Desktop), R9 3900X
77.6 fps -49%
KFA2 GeForce GTX 1650 Super EX One Click OC
NVIDIA GeForce GTX 1650 Super (Desktop), R9 5900X
54.1 fps -65%
1920x1080 Extreme HD Preset OpenGL AA:x8
Media NVIDIA GeForce RTX 3090
  (158.8 - 226, n=10)
203 fps +53%
MSI GeForce RTX 3090 Suprim X
NVIDIA GeForce RTX 3090, R9 5900X
187.8 fps +41%
MSI GeForce RTX 3080 Gaming X Trio
NVIDIA GeForce RTX 3080, R9 5900X
172 fps +29%
Media NVIDIA GeForce RTX 3080
  (163.8 - 172, n=2)
167.9 fps +26%
AMD Ryzen 9 5900X
NVIDIA Titan RTX, R9 5900X
158.5 fps +19%
AMD Radeon RX 6800 XT
AMD Radeon RX 6800 XT, R9 5950X
158.2 fps +19%
KFA2 GeForce RTX 2080 Ti EX
NVIDIA GeForce RTX 2080 Ti (Desktop), R9 3900X
145.1 fps +9%
Media NVIDIA GeForce RTX 3070
  (140.2 - 144.9, n=4)
142.7 fps +7%
NVIDIA GeForce RTX 3060 Ti FE
NVIDIA GeForce RTX 3060 Ti, R9 5950X
132.9 (48.3min - 236.1max) fps
Nvidia GeForce RTX 2080 Super
NVIDIA GeForce RTX 2080 Super (Desktop), R7 2700X
114.5 fps -14%
Media NVIDIA GeForce RTX 2080 Super (Desktop)
  ()
114.5 fps -14%
Media NVIDIA GeForce RTX 2070 Super (Desktop)
  (105.6 - 112, n=4)
109.5 fps -18%
Nvidia GeForce RTX 2070 Super
NVIDIA GeForce RTX 2070 Super (Desktop), R7 2700X
105.6 fps -21%
Media NVIDIA GeForce RTX 2060 Super (Desktop)
  (97.6 - 101.5, n=4)
99.5 fps -25%
Nvidia GeForce RTX 2060 Super
NVIDIA GeForce RTX 2060 Super (Desktop), R7 2700X
98.3 fps -26%
AMD Radeon RX 5700 XT
AMD Radeon RX 5700 XT (Desktop), R7 2700X
89.1 fps -33%
KFA 2 GeForce GTX 1660 Super
NVIDIA GeForce GTX 1660 Super (Desktop), R9 3900X
70.4 fps -47%
KFA2 GeForce GTX 1650 Super EX One Click OC
NVIDIA GeForce GTX 1650 Super (Desktop), R9 5900X
51.1 fps -62%
Unigine Superposition
7680x4320 8k Optimized
MSI GeForce RTX 3090 Suprim X
NVIDIA GeForce RTX 3090, R9 5900X
7521 Points +85%
Media NVIDIA GeForce RTX 3090
  (6969 - 7521, n=11)
7144 Points +76%
MSI GeForce RTX 3080 Gaming X Trio
NVIDIA GeForce RTX 3080, R9 5900X
6346 Points +56%
Media NVIDIA GeForce RTX 3080
  (6243 - 6346, n=2)
6295 Points +55%
AMD Ryzen 9 5900X
NVIDIA Titan RTX, R9 5900X
5402 Points +33%
AMD Radeon RX 6800 XT
AMD Radeon RX 6800 XT, R9 5950X
5256 Points +30%
Media NVIDIA GeForce RTX 3070
  (4587 - 4695, n=5)
4624 Points +14%
Zotac Gaming GeForce RTX 3070 Twin Edge
NVIDIA GeForce RTX 3070, R9 5950X
4602 Points +13%
NVIDIA GeForce RTX 3060 Ti FE
NVIDIA GeForce RTX 3060 Ti, R9 5950X
4056 Points
Media NVIDIA GeForce RTX 2080 Super (Desktop)
  ()
3989 Points -2%
Media NVIDIA GeForce RTX 2070 Super (Desktop)
  (3419 - 3435, n=3)
3429 Points -15%
Media NVIDIA GeForce RTX 2060 Super (Desktop)
  (2873 - 2914, n=3)
2900 Points -29%
KFA 2 GeForce GTX 1660 Super
NVIDIA GeForce GTX 1660 Super (Desktop), R9 3900X
1964 Points -52%
KFA2 GeForce GTX 1650 Super EX One Click OC
NVIDIA GeForce GTX 1650 Super (Desktop), R9 5900X
1087 Points -73%
3840x2160 4k Optimized
MSI GeForce RTX 3090 Suprim X
NVIDIA GeForce RTX 3090, R9 5900X
16868 Points +83%
Media NVIDIA GeForce RTX 3090
  (15794 - 16868, n=11)
16326 Points +77%
MSI GeForce RTX 3080 Gaming X Trio
NVIDIA GeForce RTX 3080, R9 5900X
14243 Points +54%
Media NVIDIA GeForce RTX 3080
  (13984 - 14243, n=2)
14114 Points +53%
AMD Radeon RX 6800 XT
AMD Radeon RX 6800 XT, R9 5950X
13471 Points +46%
AMD Ryzen 9 5900X
NVIDIA Titan RTX, R9 5900X
12186 Points +32%
Zotac Gaming GeForce RTX 3070 Twin Edge
NVIDIA GeForce RTX 3070, R9 5950X
10704 Points +16%
Media NVIDIA GeForce RTX 3070
  (10544 - 10755, n=5)
10667 Points +16%
Media NVIDIA GeForce RTX 2080 Super (Desktop)
  ()
9338 Points +1%
NVIDIA GeForce RTX 3060 Ti FE
NVIDIA GeForce RTX 3060 Ti, R9 5950X
9224 Points
Media NVIDIA GeForce RTX 2070 Super (Desktop)
  (8096 - 8111, n=3)
8101 Points -12%
Media NVIDIA GeForce RTX 2060 Super (Desktop)
  (6747 - 6863, n=3)
6811 Points -26%
KFA 2 GeForce GTX 1660 Super
NVIDIA GeForce GTX 1660 Super (Desktop), R9 3900X
4755 Points -48%
KFA2 GeForce GTX 1650 Super EX One Click OC
NVIDIA GeForce GTX 1650 Super (Desktop), R9 5900X
3724 Points -60%
1920x1080 1080p Extreme
MSI GeForce RTX 3090 Suprim X
NVIDIA GeForce RTX 3090, R9 5900X
12694 Points +78%
Media NVIDIA GeForce RTX 3090
  (11806 - 12694, n=11)
12209 Points +71%
MSI GeForce RTX 3080 Gaming X Trio
NVIDIA GeForce RTX 3080, R9 5900X
10822 Points +52%
Media NVIDIA GeForce RTX 3080
  (10572 - 10822, n=2)
10697 Points +50%
AMD Radeon RX 6800 XT
AMD Radeon RX 6800 XT, R9 5950X
10046 Points +41%
AMD Ryzen 9 5900X
NVIDIA Titan RTX, R9 5900X
9056 Points +27%
Media NVIDIA GeForce RTX 3070
  (8276 - 8507, n=5)
8354 Points +17%
Zotac Gaming GeForce RTX 3070 Twin Edge
NVIDIA GeForce RTX 3070, R9 5950X
8336 Points +17%
NVIDIA GeForce RTX 3060 Ti FE
NVIDIA GeForce RTX 3060 Ti, R9 5950X
7142 Points
Media NVIDIA GeForce RTX 2080 Super (Desktop)
  ()
7080 Points -1%
Media NVIDIA GeForce RTX 2070 Super (Desktop)
  (6161 - 6178, n=3)
6169 Points -14%
Media NVIDIA GeForce RTX 2060 Super (Desktop)
  (5049 - 5143, n=3)
5105 Points -29%
KFA 2 GeForce GTX 1660 Super
NVIDIA GeForce GTX 1660 Super (Desktop), R9 3900X
3171 Points -56%
KFA2 GeForce GTX 1650 Super EX One Click OC
NVIDIA GeForce GTX 1650 Super (Desktop), R9 5900X
2305 Points -68%
1920x1080 1080p High
Media NVIDIA GeForce RTX 3090
  (23626 - 27207, n=11)
26018 Points +68%
MSI GeForce RTX 3090 Suprim X
NVIDIA GeForce RTX 3090, R9 5900X
25953 Points +68%
AMD Radeon RX 6800 XT
AMD Radeon RX 6800 XT, R9 5950X
22265 Points +44%
MSI GeForce RTX 3080 Gaming X Trio
NVIDIA GeForce RTX 3080, R9 5900X
21912 Points +42%
Media NVIDIA GeForce RTX 3080
  (21333 - 21912, n=2)
21623 Points +40%
AMD Ryzen 9 5900X
NVIDIA Titan RTX, R9 5900X
20315 Points +31%
Zotac Gaming GeForce RTX 3070 Twin Edge
NVIDIA GeForce RTX 3070, R9 5950X
17491 Points +13%
Media NVIDIA GeForce RTX 3070
  (17054 - 17491, n=5)
17312 Points +12%
Media NVIDIA GeForce RTX 2080 Super (Desktop)
  ()
15558 Points +1%
NVIDIA GeForce RTX 3060 Ti FE
NVIDIA GeForce RTX 3060 Ti, R9 5950X
15479 Points
Media NVIDIA GeForce RTX 2070 Super (Desktop)
  (13655 - 13832, n=3)
13765 Points -11%
Media NVIDIA GeForce RTX 2060 Super (Desktop)
  (11421 - 11785, n=3)
11649 Points -25%
KFA 2 GeForce GTX 1660 Super
NVIDIA GeForce GTX 1660 Super (Desktop), R9 3900X
8212 Points -47%
KFA2 GeForce GTX 1650 Super EX One Click OC
NVIDIA GeForce GTX 1650 Super (Desktop), R9 5900X
6468 Points -58%
1280x720 720p Low
Media NVIDIA GeForce RTX 3090
  (33329 - 54879, n=10)
46049 Points +20%
AMD Ryzen 9 5900X
NVIDIA Titan RTX, R9 5900X
40994 Points +7%
Zotac Gaming GeForce RTX 3070 Twin Edge
NVIDIA GeForce RTX 3070, R9 5950X
39277 Points +2%
Media NVIDIA GeForce RTX 2070 Super (Desktop)
  (26742 - 45424, n=3)
38495 Points 0%
NVIDIA GeForce RTX 3060 Ti FE
NVIDIA GeForce RTX 3060 Ti, R9 5950X
38414 Points
AMD Radeon RX 6800 XT
AMD Radeon RX 6800 XT, R9 5950X
36452 Points -5%
Media NVIDIA GeForce RTX 2060 Super (Desktop)
  (26634 - 40961, n=3)
35859 Points -7%
Media NVIDIA GeForce RTX 3070
  (27330 - 40007, n=5)
34576 Points -10%
MSI GeForce RTX 3090 Suprim X
NVIDIA GeForce RTX 3090, R9 5900X
33329 Points -13%
MSI GeForce RTX 3080 Gaming X Trio
NVIDIA GeForce RTX 3080, R9 5900X
32183 Points -16%
Media NVIDIA GeForce RTX 3080
  (30851 - 32183, n=2)
31517 Points -18%
Media NVIDIA GeForce RTX 2080 Super (Desktop)
  ()
26907 Points -30%
KFA 2 GeForce GTX 1660 Super
NVIDIA GeForce GTX 1660 Super (Desktop), R9 3900X
25313 Points -34%
KFA2 GeForce GTX 1650 Super EX One Click OC
NVIDIA GeForce GTX 1650 Super (Desktop), R9 5900X
22323 Points -42%
3DMark 11 Performance
33117 punti
3DMark Cloud Gate Standard Score
66922 punti
3DMark Fire Strike Score
27043 punti
3DMark Fire Strike Extreme Score
13790 punti
3DMark Time Spy Score
11520 punti
Aiuto

Benchmarks di calcolo

La RTX 3060 Ti FE offre prestazioni di calcolo decenti con circa il 25% di punteggi più alti in ComputeMark rispetto alla media della RTX 2080 Super. Anche LuxMark mostra benefici decenti con la RTX 3060 Ti FE che è solo circa il 6% più lenta della media della RTX 3070.

ComputeMark v2.1
1024x600 Normal, QJuliaRayTrace
Media NVIDIA GeForce RTX 3090
  (16403 - 18223, n=10)
17454 Points +73%
MSI GeForce RTX 3090 Suprim X
NVIDIA GeForce RTX 3090, R9 5900X
17058 Points +69%
MSI GeForce RTX 3080 Gaming X Trio
NVIDIA GeForce RTX 3080, R9 5900X
15508 Points +54%
Media NVIDIA GeForce RTX 3080
  (14718 - 15508, n=2)
15113 Points +50%
Media NVIDIA GeForce RTX 3070
  (11510 - 11816, n=3)
11665 Points +16%
AMD Radeon RX 6800 XT
AMD Radeon RX 6800 XT, R9 5950X
11304 Points +12%
NVIDIA GeForce RTX 3060 Ti FE
NVIDIA GeForce RTX 3060 Ti, R9 5950X
10072 Points
KFA2 GeForce RTX 2080 Ti EX
NVIDIA GeForce RTX 2080 Ti (Desktop), R9 3900X
9104 Points -10%
Nvidia GeForce RTX 2080 Super
NVIDIA GeForce RTX 2080 Super (Desktop), R7 2700X
7258 Points -28%
Media NVIDIA GeForce RTX 2080 Super (Desktop)
  ()
7258 Points -28%
Media NVIDIA GeForce RTX 2070 Super (Desktop)
  (6155 - 6158, n=2)
6157 Points -39%
Nvidia GeForce RTX 2070 Super
NVIDIA GeForce RTX 2070 Super (Desktop), R7 2700X
6155 Points -39%
AMD Radeon RX 5700 XT
AMD Radeon RX 5700 XT (Desktop), R7 2700X
5761 Points -43%
Nvidia GeForce RTX 2060 Super
NVIDIA GeForce RTX 2060 Super (Desktop), R7 2700X
5271 Points -48%
Media NVIDIA GeForce RTX 2060 Super (Desktop)
  (5270 - 5271, n=2)
5271 Points -48%
KFA 2 GeForce GTX 1660 Super
NVIDIA GeForce GTX 1660 Super (Desktop), R9 3900X
3656 Points -64%
KFA2 GeForce GTX 1650 Super EX One Click OC
NVIDIA GeForce GTX 1650 Super (Desktop), R9 5900X
3419 Points -66%
1024x600 Normal, Mandel Scalar
MSI GeForce RTX 3090 Suprim X
NVIDIA GeForce RTX 3090, R9 5900X
11197 Points +84%
Media NVIDIA GeForce RTX 3090
  (10650 - 11564, n=10)
11162 Points +83%
AMD Radeon RX 6800 XT
AMD Radeon RX 6800 XT, R9 5950X
10018 Points +65%
MSI GeForce RTX 3080 Gaming X Trio
NVIDIA GeForce RTX 3080, R9 5900X
9938 Points +63%
Media NVIDIA GeForce RTX 3080
  (9554 - 9938, n=2)
9746 Points +60%
Media NVIDIA GeForce RTX 3070
  (7042 - 7314, n=3)
7169 Points +18%
NVIDIA GeForce RTX 3060 Ti FE
NVIDIA GeForce RTX 3060 Ti, R9 5950X
6087 Points
KFA2 GeForce RTX 2080 Ti EX
NVIDIA GeForce RTX 2080 Ti (Desktop), R9 3900X
5679 Points -7%
AMD Radeon RX 5700 XT
AMD Radeon RX 5700 XT (Desktop), R7 2700X
4869 Points -20%
Nvidia GeForce RTX 2080 Super
NVIDIA GeForce RTX 2080 Super (Desktop), R7 2700X
4525 Points -26%
Media NVIDIA GeForce RTX 2080 Super (Desktop)
  ()
4525 Points -26%
Nvidia GeForce RTX 2070 Super
NVIDIA GeForce RTX 2070 Super (Desktop), R7 2700X
3782 Points -38%
Media NVIDIA GeForce RTX 2070 Super (Desktop)
  (3748 - 3782, n=2)
3765 Points -38%
Nvidia GeForce RTX 2060 Super
NVIDIA GeForce RTX 2060 Super (Desktop), R7 2700X
3185 Points -48%
Media NVIDIA GeForce RTX 2060 Super (Desktop)
  (3169 - 3185, n=2)
3177 Points -48%
KFA 2 GeForce GTX 1660 Super
NVIDIA GeForce GTX 1660 Super (Desktop), R9 3900X
2149 Points -65%
KFA2 GeForce GTX 1650 Super EX One Click OC
NVIDIA GeForce GTX 1650 Super (Desktop), R9 5900X
1984 Points -67%
1024x600 Normal, Mandel Vector
Media NVIDIA GeForce RTX 3090
  (8038 - 10097, n=10)
9467 Points +98%
AMD Radeon RX 6800 XT
AMD Radeon RX 6800 XT, R9 5950X
8399 Points +76%
MSI GeForce RTX 3090 Suprim X
NVIDIA GeForce RTX 3090, R9 5900X
8341 Points +74%
MSI GeForce RTX 3080 Gaming X Trio
NVIDIA GeForce RTX 3080, R9 5900X
7540 Points +58%
Media NVIDIA GeForce RTX 3080
  (7148 - 7540, n=2)
7344 Points +54%
Media NVIDIA GeForce RTX 3070
  (5364 - 6266, n=3)
5707 Points +19%
NVIDIA GeForce RTX 3060 Ti FE
NVIDIA GeForce RTX 3060 Ti, R9 5950X
4782 Points
KFA2 GeForce RTX 2080 Ti EX
NVIDIA GeForce RTX 2080 Ti (Desktop), R9 3900X
4695 Points -2%
AMD Radeon RX 5700 XT
AMD Radeon RX 5700 XT (Desktop), R7 2700X
4246 Points -11%
Nvidia GeForce RTX 2080 Super
NVIDIA GeForce RTX 2080 Super (Desktop), R7 2700X
3835 Points -20%
Media NVIDIA GeForce RTX 2080 Super (Desktop)
  ()
3835 Points -20%
Nvidia GeForce RTX 2070 Super
NVIDIA GeForce RTX 2070 Super (Desktop), R7 2700X
3358 Points -30%
Media NVIDIA GeForce RTX 2070 Super (Desktop)
  (3348 - 3358, n=2)
3353 Points -30%
Media NVIDIA GeForce RTX 2060 Super (Desktop)
  (2939 - 2948, n=2)
2944 Points -38%
Nvidia GeForce RTX 2060 Super
NVIDIA GeForce RTX 2060 Super (Desktop), R7 2700X
2939 Points -39%
KFA 2 GeForce GTX 1660 Super
NVIDIA GeForce GTX 1660 Super (Desktop), R9 3900X
2169 Points -55%
KFA2 GeForce GTX 1650 Super EX One Click OC
NVIDIA GeForce GTX 1650 Super (Desktop), R9 5900X
2060 Points -57%
1024x600 Normal, Fluid 2DTexArr
MSI GeForce RTX 3090 Suprim X
NVIDIA GeForce RTX 3090, R9 5900X
4560 Points +74%
Media NVIDIA GeForce RTX 3090
  (4344 - 4608, n=10)
4492 Points +72%
MSI GeForce RTX 3080 Gaming X Trio
NVIDIA GeForce RTX 3080, R9 5900X
4159 Points +59%
Media NVIDIA GeForce RTX 3080
  (4087 - 4159, n=2)
4123 Points +57%
AMD Radeon RX 6800 XT
AMD Radeon RX 6800 XT, R9 5950X
3947 Points +51%
KFA2 GeForce RTX 2080 Ti EX
NVIDIA GeForce RTX 2080 Ti (Desktop), R9 3900X
3444 Points +32%
Media NVIDIA GeForce RTX 3070
  (2666 - 2706, n=3)
2692 Points +3%
Nvidia GeForce RTX 2080 Super
NVIDIA GeForce RTX 2080 Super (Desktop), R7 2700X
2655 Points +1%
Media NVIDIA GeForce RTX 2080 Super (Desktop)
  ()
2655 Points +1%
NVIDIA GeForce RTX 3060 Ti FE
NVIDIA GeForce RTX 3060 Ti, R9 5950X
2619 Points
Media NVIDIA GeForce RTX 2070 Super (Desktop)
  (2331 - 2354, n=2)
2343 Points -11%
Nvidia GeForce RTX 2070 Super
NVIDIA GeForce RTX 2070 Super (Desktop), R7 2700X
2331 Points -11%
Media NVIDIA GeForce RTX 2060 Super (Desktop)
  (2064 - 2101, n=2)
2083 Points -20%
Nvidia GeForce RTX 2060 Super
NVIDIA GeForce RTX 2060 Super (Desktop), R7 2700X
2064 Points -21%
AMD Radeon RX 5700 XT
AMD Radeon RX 5700 XT (Desktop), R7 2700X
1960 Points -25%
KFA 2 GeForce GTX 1660 Super
NVIDIA GeForce GTX 1660 Super (Desktop), R9 3900X
1488 Points -43%
KFA2 GeForce GTX 1650 Super EX One Click OC
NVIDIA GeForce GTX 1650 Super (Desktop), R9 5900X
1015 Points -61%
1024x600 Normal, Fluid 3DTex
Media NVIDIA GeForce RTX 3090
  (5246 - 5520, n=10)
5448 Points +103%
MSI GeForce RTX 3090 Suprim X
NVIDIA GeForce RTX 3090, R9 5900X
5391 Points +101%
AMD Radeon RX 6800 XT
AMD Radeon RX 6800 XT, R9 5950X
5154 Points +92%
MSI GeForce RTX 3080 Gaming X Trio
NVIDIA GeForce RTX 3080, R9 5900X
4450 Points +66%
Media NVIDIA GeForce RTX 3080
  (4417 - 4450, n=2)
4434 Points +65%
KFA2 GeForce RTX 2080 Ti EX
NVIDIA GeForce RTX 2080 Ti (Desktop), R9 3900X
3589 Points +34%
Media NVIDIA GeForce RTX 3070
  (2749 - 2791, n=3)
2772 Points +3%
Nvidia GeForce RTX 2080 Super
NVIDIA GeForce RTX 2080 Super (Desktop), R7 2700X
2736 Points +2%
Media NVIDIA GeForce RTX 2080 Super (Desktop)
  ()
2736 Points +2%
NVIDIA GeForce RTX 3060 Ti FE
NVIDIA GeForce RTX 3060 Ti, R9 5950X
2685 Points
Media NVIDIA GeForce RTX 2070 Super (Desktop)
  (2456 - 2486, n=2)
2471 Points -8%
Nvidia GeForce RTX 2070 Super
NVIDIA GeForce RTX 2070 Super (Desktop), R7 2700X
2456 Points -9%
AMD Radeon RX 5700 XT
AMD Radeon RX 5700 XT (Desktop), R7 2700X
2349 Points -13%
Media NVIDIA GeForce RTX 2060 Super (Desktop)
  (2289 - 2290, n=2)
2290 Points -15%
Nvidia GeForce RTX 2060 Super
NVIDIA GeForce RTX 2060 Super (Desktop), R7 2700X
2289 Points -15%
KFA 2 GeForce GTX 1660 Super
NVIDIA GeForce GTX 1660 Super (Desktop), R9 3900X
1636 Points -39%
KFA2 GeForce GTX 1650 Super EX One Click OC
NVIDIA GeForce GTX 1650 Super (Desktop), R9 5900X
1032 Points -62%
1024x600 Normal, Score
Media NVIDIA GeForce RTX 3090
  (44948 - 49118, n=9)
47804 Points +82%
MSI GeForce RTX 3090 Suprim X
NVIDIA GeForce RTX 3090, R9 5900X
46547 Points +77%
MSI GeForce RTX 3080 Gaming X Trio
NVIDIA GeForce RTX 3080, R9 5900X
41594 Points +58%
Media NVIDIA GeForce RTX 3080
  (39924 - 41594, n=2)
40759 Points +55%
AMD Radeon RX 6800 XT
AMD Radeon RX 6800 XT, R9 5950X
38823 Points +48%
Media NVIDIA GeForce RTX 3070
  (29330 - 30581, n=3)
30004 Points +14%
KFA2 GeForce RTX 2080 Ti EX
NVIDIA GeForce RTX 2080 Ti (Desktop), R9 3900X
26510 Points +1%
NVIDIA GeForce RTX 3060 Ti FE
NVIDIA GeForce RTX 3060 Ti, R9 5950X
26245 Points
Nvidia GeForce RTX 2080 Super
NVIDIA GeForce RTX 2080 Super (Desktop), R7 2700X
21009 Points -20%
Media NVIDIA GeForce RTX 2080 Super (Desktop)
  ()
21009 Points -20%
AMD Radeon RX 5700 XT
AMD Radeon RX 5700 XT (Desktop), R7 2700X
19184 Points -27%
Media NVIDIA GeForce RTX 2070 Super (Desktop)
  (18083 - 18095, n=2)
18089 Points -31%
Nvidia GeForce RTX 2070 Super
NVIDIA GeForce RTX 2070 Super (Desktop), R7 2700X
18083 Points -31%
Media NVIDIA GeForce RTX 2060 Super (Desktop)
  (15749 - 15776, n=2)
15763 Points -40%
Nvidia GeForce RTX 2060 Super
NVIDIA GeForce RTX 2060 Super (Desktop), R7 2700X
15749 Points -40%
KFA 2 GeForce GTX 1660 Super
NVIDIA GeForce GTX 1660 Super (Desktop), R9 3900X
11098 Points -58%
KFA2 GeForce GTX 1650 Super EX One Click OC
NVIDIA GeForce GTX 1650 Super (Desktop), R9 5900X
9510 Points -64%
LuxMark v2.0 64Bit
Room GPUs-only
Media NVIDIA GeForce RTX 3090
  (5727 - 5985, n=9)
5893 Samples/s +46%
MSI GeForce RTX 3090 Suprim X
NVIDIA GeForce RTX 3090, R9 5900X
5727 Samples/s +42%
MSI GeForce RTX 3080 Gaming X Trio
NVIDIA GeForce RTX 3080, R9 5900X
5198 Samples/s +28%
Media NVIDIA GeForce RTX 3080
  (5112 - 5198, n=2)
5155 Samples/s +27%
AMD Radeon RX 6800 XT
AMD Radeon RX 6800 XT, R9 5950X
5057 Samples/s +25%
KFA2 GeForce RTX 2080 Ti EX
NVIDIA GeForce RTX 2080 Ti (Desktop), R9 3900X
4429 Samples/s +9%
NVIDIA GeForce RTX 3060 Ti FE
NVIDIA GeForce RTX 3060 Ti, R9 5950X
4046 Samples/s
Media NVIDIA GeForce RTX 3070
  (2187 - 4293, n=3)
3588 Samples/s -11%
Nvidia GeForce RTX 2080 Super
NVIDIA GeForce RTX 2080 Super (Desktop), R7 2700X
3430 Samples/s -15%
Media NVIDIA GeForce RTX 2080 Super (Desktop)
  ()
3430 Samples/s -15%
Nvidia GeForce RTX 2070 Super
NVIDIA GeForce RTX 2070 Super (Desktop), R7 2700X
3404 Samples/s -16%
Media NVIDIA GeForce RTX 2070 Super (Desktop)
  ()
3404 Samples/s -16%
Media NVIDIA GeForce RTX 2060 Super (Desktop)
  (3274 - 3278, n=2)
3276 Samples/s -19%
Nvidia GeForce RTX 2060 Super
NVIDIA GeForce RTX 2060 Super (Desktop), R7 2700X
3274 Samples/s -19%
KFA 2 GeForce GTX 1660 Super
NVIDIA GeForce GTX 1660 Super (Desktop), R9 3900X
2286 Samples/s -43%
AMD Radeon RX 5700 XT
AMD Radeon RX 5700 XT (Desktop), R7 2700X
2104 Samples/s -48%
KFA2 GeForce GTX 1650 Super EX One Click OC
NVIDIA GeForce GTX 1650 Super (Desktop), R9 5900X
1405 Samples/s -65%
Sala GPUs-only
AMD Radeon RX 6800 XT
AMD Radeon RX 6800 XT, R9 5950X
28023 Samples/s +211%
Media NVIDIA GeForce RTX 3090
  (14590 - 15242, n=9)
14945 Samples/s +66%
MSI GeForce RTX 3090 Suprim X
NVIDIA GeForce RTX 3090, R9 5900X
14590 Samples/s +62%
MSI GeForce RTX 3080 Gaming X Trio
NVIDIA GeForce RTX 3080, R9 5900X
12980 Samples/s +44%
Media NVIDIA GeForce RTX 3080
  (12797 - 12980, n=2)
12889 Samples/s +43%
Media NVIDIA GeForce RTX 3070
  (10096 - 10115, n=3)
10107 Samples/s +12%
KFA2 GeForce RTX 2080 Ti EX
NVIDIA GeForce RTX 2080 Ti (Desktop), R9 3900X
9999 Samples/s +11%
NVIDIA GeForce RTX 3060 Ti FE
NVIDIA GeForce RTX 3060 Ti, R9 5950X
9010 Samples/s
Nvidia GeForce RTX 2080 Super
NVIDIA GeForce RTX 2080 Super (Desktop), R7 2700X
7878 Samples/s -13%
Media NVIDIA GeForce RTX 2080 Super (Desktop)
  ()
7878 Samples/s -13%
Nvidia GeForce RTX 2070 Super
NVIDIA GeForce RTX 2070 Super (Desktop), R7 2700X
7594 Samples/s -16%
Media NVIDIA GeForce RTX 2070 Super (Desktop)
  ()
7594 Samples/s -16%
Media NVIDIA GeForce RTX 2060 Super (Desktop)
  (6980 - 7010, n=2)
6995 Samples/s -22%
Nvidia GeForce RTX 2060 Super
NVIDIA GeForce RTX 2060 Super (Desktop), R7 2700X
6980 Samples/s -23%
AMD Radeon RX 5700 XT
AMD Radeon RX 5700 XT (Desktop), R7 2700X
6188 Samples/s -31%
KFA 2 GeForce GTX 1660 Super
NVIDIA GeForce GTX 1660 Super (Desktop), R9 3900X
4490 Samples/s -50%
KFA2 GeForce GTX 1650 Super EX One Click OC
NVIDIA GeForce GTX 1650 Super (Desktop), R9 5900X
2972 Samples/s -67%
Geekbench 5.5
OpenCL Score
Media NVIDIA GeForce RTX 3090
  (199930 - 224611, n=19)
214008 Points +74%
MSI GeForce RTX 3090 Suprim X
NVIDIA GeForce RTX 3090, R9 5900X
212914 Points +73%
Media NVIDIA GeForce RTX 3080
  (164477 - 192091, n=2)
178284 Points +45%
MSI GeForce RTX 3080 Gaming X Trio
NVIDIA GeForce RTX 3080, R9 5900X
164477 Points +34%
AMD Radeon RX 6800 XT
AMD Radeon RX 6800 XT, R9 5950X
159072 Points +29%
AMD Ryzen 9 5900X
NVIDIA Titan RTX, R9 5900X
149070 Points +21%
Media NVIDIA GeForce RTX 3070
  (134961 - 138625, n=4)
136574 Points +11%
NVIDIA GeForce RTX 3060 Ti FE
NVIDIA GeForce RTX 3060 Ti, R9 5950X
123036 Points
Media NVIDIA GeForce RTX 2080 Super (Desktop)
  (118695 - 127035, n=3)
122884 Points 0%
Media NVIDIA GeForce RTX 2070 Super (Desktop)
  (102914 - 132850, n=2)
117882 Points -4%
Media NVIDIA GeForce RTX 2060 Super (Desktop)
  ()
88698 Points -28%
KFA2 GeForce GTX 1650 Super EX One Click OC
NVIDIA GeForce GTX 1650 Super (Desktop), R9 5900X
54745 Points -56%
Vulkan Score
Media NVIDIA GeForce RTX 3090
  (62516 - 168974, n=19)
128422 Points +45%
NVIDIA GeForce RTX 3060 Ti FE
NVIDIA GeForce RTX 3060 Ti, R9 5950X
88442 Points
MSI GeForce RTX 3080 Gaming X Trio
NVIDIA GeForce RTX 3080, R9 5900X
83486 Points -6%
AMD Radeon RX 6800 XT
AMD Radeon RX 6800 XT, R9 5950X
81098 Points -8%
Media NVIDIA GeForce RTX 3080
  (76596 - 83486, n=2)
80041 Points -9%
Media NVIDIA GeForce RTX 2080 Super (Desktop)
  (62324 - 91321, n=3)
78667 Points -11%
Media NVIDIA GeForce RTX 2070 Super (Desktop)
  (76596 - 80530, n=2)
78563 Points -11%
AMD Ryzen 9 5900X
NVIDIA Titan RTX, R9 5900X
76596 Points -13%
Media NVIDIA GeForce RTX 3070
  (27460 - 107958, n=4)
71908 Points -19%
Media NVIDIA GeForce RTX 2060 Super (Desktop)
  ()
65260 Points -26%
MSI GeForce RTX 3090 Suprim X
NVIDIA GeForce RTX 3090, R9 5900X
62516 Points -29%
KFA2 GeForce GTX 1650 Super EX One Click OC
NVIDIA GeForce GTX 1650 Super (Desktop), R9 5900X
0 Points -100%

Applicazioni professionali

Le schede GeForce non sono realmente destinate a carichi di lavoro professionali come applicazioni CAD/CAM, di energia, automobilistiche o mediche. Questa limitazione deriva principalmente dal driver, dato che NVIDIA vorrebbe idealmente che i professionisti di questi campi usassero la linea Quadro. La Titan RTX, tuttavia, riesce a mantenere il proprio terreno nei test SPECviewperf nonostante l'utilizzo di normali drivers GeForce.

Dando un'occhiata ai benchmarks SPECviewperf 12 e 13, vediamo che la RTX 3060 Ti rimane significativamente indietro rispetto a una Quadro RTX 5000 (laptop) nei carichi di lavoro professionali specializzati, nonostante quest'ultima sia essenzialmente un chip RTX 2080 TU104. Tuttavia, coloro che lavorano su progetti 3D Studio Max e Maya troveranno la RTX 3060 Ti una prestazione decente.

SPECviewperf 2020 è sembrato un po' pesante per la RTX 3060 Ti FE in quanto è un benchmark 4K. La RTX 3080 e la RTX 3090 mostrano evidenti vantaggi, ma la AMD Radeon RX 6800 XT è chiaramente la GPU mainstream più performante quando si tratta di applicazioni professionali.

NVIDIA GeForce RTX 3060 Ti Founders Edition
NVIDIA GeForce RTX 3060 Ti, R9 5950X
MSI GeForce RTX 3080 Gaming X Trio
NVIDIA GeForce RTX 3080, R9 5900X
MSI GeForce RTX 3090 Suprim X
NVIDIA GeForce RTX 3090, R9 5900X
Nvidia GeForce RTX 2080 Super
GeForce RTX 2080 Super (Desktop), R7 2700X
AMD Ryzen 9 5900X
NVIDIA Titan RTX, R9 5900X
AMD Radeon RX 6800 XT
Radeon RX 6800 XT, R9 5950X
Acer ConceptD 9 Pro
Quadro RTX 5000 (Laptop), i9-9980HK
SPECviewperf 12
1%
20%
-9%
312%
80%
296%
1900x1060 Solidworks (sw-03)
71.1
66
-7%
72.3
2%
70.8
0%
174.9
146%
150
111%
230.1
224%
1900x1060 Siemens NX (snx-02)
12.3
12.85
4%
14.91
21%
12.26
0%
273.2
2121%
45.07
266%
258.1
1998%
1900x1060 Showcase (showcase-01)
144
180
25%
236
64%
143.6
0%
191.1
33%
223
55%
126.4
-12%
1900x1060 Medical (medical-01)
59.4
36.93
-38%
42.91
-28%
45
-24%
90.7
53%
77.3
30%
109.3
84%
1900x1060 Maya (maya-04)
197
146
-26%
184
-7%
134.8
-32%
188.3
-4%
118
-40%
179
-9%
1900x1060 Energy (energy-01)
13.9
16.35
18%
20.41
47%
13.09
-6%
28.31
104%
28.39
104%
26
87%
1900x1060 Creo (creo-01)
57.8
65.6
13%
75.4
30%
52.7
-9%
173
199%
119
106%
172.1
198%
1900x1060 Catia (catia-04)
109
116
6%
134
23%
104.2
-4%
262.7
141%
238
118%
220
102%
1900x1060 3ds Max (3dsmax-05)
252
276
10%
322
28%
225.8
-10%
292.6
16%
167
-34%
235.8
-6%
SPECviewperf 13
25%
36%
-3%
290%
91%
270%
Solidworks (sw-04)
99.6
96.5
-3%
95.3
-4%
99.6
0%
196.4
97%
193
94%
203.8
105%
Siemens NX (snx-03)
22.3
24.26
9%
27.03
21%
21.94
-2%
493.4
2113%
81.4
265%
465.3
1987%
Showcase (showcase-02)
145
204
41%
241
66%
144.5
0%
190.5
31%
232
60%
127.1
-12%
Medical (medical-02)
72.2
99
37%
105
45%
71.6
-1%
90.8
26%
130
80%
133.4
85%
Maya (maya-05)
344
440
28%
469
36%
328.7
-4%
458
33%
348
1%
340.8
-1%
Energy (energy-02)
25.6
37.87
48%
45.21
77%
23.78
-7%
52
103%
58.4
128%
57.3
124%
Creo (creo-02)
225
295
31%
316
40%
220.1
-2%
346.5
54%
276
23%
319.8
42%
Catia (catia-05)
161
190
18%
206
28%
157.7
-2%
374.8
133%
412
156%
338.9
110%
3ds Max (3dsmax-06)
252
294
17%
298
18%
227.8
-10%
291.3
16%
284
13%
232.2
-8%
SPECviewperf 2020
58%
85%
300%
107%
3840x2160 Solidworks (solidworks-05)
109
158
45%
180
65%
153
40%
108
-1%
3840x2160 Siemens NX (snx-04)
18.2
19.8
9%
22.6
24%
347
1807%
81.7
349%
3840x2160 Medical (medical-03)
11.4
18.47
62%
21.19
86%
16.42
44%
27.84
144%
3840x2160 Maya (maya-06)
215
293
36%
330
53%
257
20%
224
4%
3840x2160 Energy (energy-03)
14.5
51.7
257%
61.1
321%
58.2
301%
60.8
319%
3840x2160 Creo (creo-03)
76.6
77.6
1%
85.1
11%
113
48%
65
-15%
3840x2160 CATIA (catia-06)
37.9
50
32%
56.6
49%
78.2
106%
42.4
12%
3840x2160 3ds Max (3dsmax-07)
80.1
100
25%
135
69%
108
35%
114
42%
Media totale (Programma / Settaggio)
28% / 27%
47% / 46%
-6% / -6%
301% / 301%
93% / 92%
283% / 283%

Gaming Benchmarks

Fin da subito, la RTX 3060 Ti FE si comporta alla grande fino alla risoluzione QHD Ultra nella maggior parte dei giochi. I giocatori di eSports che preferiscono frame rates più elevati rispetto alla risoluzione saranno anche in grado di fare buon uso di questa scheda a 1080p per guidare monitor con alte frequenze di aggiornamento. È anche possibile giocare a 60 fps+ in 4K Ultra in diversi titoli come Battlefield V, Far Cry New Dawn, Doom Eternal, e F1 2020. Una buona maggioranza dei titoli può anche essere portata a 60 fps+ in 4K modificando le impostazioni di gioco senza compromettere molto la fedeltà visiva.

Le prestazioni del Ray Tracing (RT) sono entro il 7% di una RTX 3070 media, a patto che il gioco non usi RT per l'illuminazione globale, come evidenziato dai risultati di Call of Duty: Black Ops Cold War e Watch Dogs: Legion 1080p Ultra ray tracing benchmark. Questo delta di prestazioni raddoppia nei giochi che utilizzano ampiamente il ray tracing-global illumination come Metro: Exodus e Cyberpunk 2077.

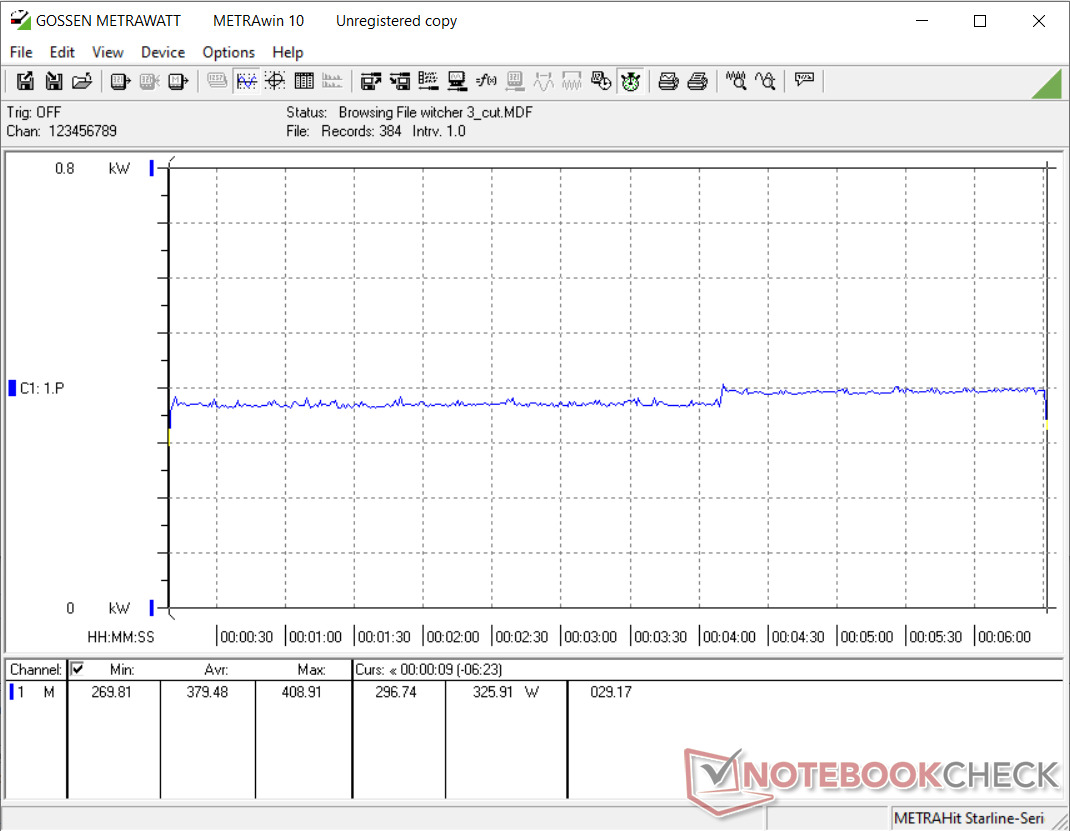
Nel The Witcher 3 Ultra stress test, la RTX 3060 Ti FE è abbastanza stabile nel complesso. Vediamo che i fotogrammi scendono di circa 5 fps oltre la metà del grafico qui sotto, ma l'esperienza complessiva non ne risente molto. Questo indica che il raffreddamento della scheda è all'altezza del compito ed è in grado di prevenire il throttling termico.

0102030405060708090100110Tooltip
NVIDIA GeForce RTX 3060 Ti Founders Edition NVIDIA GeForce RTX 3060 Ti, R9 5950X: Ø108.8 (103-113)
The Witcher 3
1920x1080 Ultra Graphics & Postprocessing (HBAO+)
Media NVIDIA GeForce RTX 3090
  (160 - 192.6, n=16)
179.9 fps +65%
MSI GeForce RTX 3090 Suprim X
NVIDIA GeForce RTX 3090, R9 5900X
160 (140min - 184max) fps +47%
AMD Radeon RX 6800 XT
AMD Radeon RX 6800 XT, R9 5950X
160 (138min - 179max) fps +47%
Media NVIDIA GeForce RTX 3080
  (145 - 152, n=2)
148.5 fps +36%
MSI GeForce RTX 3080 Gaming X Trio
NVIDIA GeForce RTX 3080, R9 5900X
145 (123min - 154max) fps +33%
AMD Ryzen 9 5900X
NVIDIA Titan RTX, R9 5900X
141 (127min - 154max) fps +29%
KFA2 GeForce RTX 2080 Ti EX
NVIDIA GeForce RTX 2080 Ti (Desktop), R9 3900X
135 (118min - 158max) fps +24%
Zotac Gaming GeForce RTX 3070 Twin Edge
NVIDIA GeForce RTX 3070, R9 5950X
123 (120min, 121P1 - 126max) fps +13%
Nvidia GeForce RTX 2080 Super
NVIDIA GeForce RTX 2080 Super (Desktop), R7 2700X
109 (81min - 123max) fps 0%
NVIDIA GeForce RTX 3060 Ti FE
NVIDIA GeForce RTX 3060 Ti, R9 5950X
109 (103min, 105P1 - 113max) fps
Media NVIDIA GeForce RTX 2080 Super (Desktop)
  ()
109 fps 0%
Media NVIDIA GeForce RTX 3070
  (52.8 - 132.2, n=7)
106.1 fps -3%
Media NVIDIA GeForce RTX 2070 Super (Desktop)
  (95.6 - 109.6, n=6)
100.9 fps -7%
Nvidia GeForce RTX 2070 Super
NVIDIA GeForce RTX 2070 Super (Desktop), R7 2700X
97 (83min - 109max) fps -11%
AMD Radeon RX 5700 XT
AMD Radeon RX 5700 XT (Desktop), R7 2700X
92 (79min - 99max) fps -16%
Media NVIDIA GeForce RTX 2060 Super (Desktop)
  (79 - 91.1, n=5)
84.8 fps -22%
Nvidia GeForce RTX 2060 Super
NVIDIA GeForce RTX 2060 Super (Desktop), R7 2700X
79 (67min - 89max) fps -28%
KFA 2 GeForce GTX 1660 Super
NVIDIA GeForce GTX 1660 Super (Desktop), R9 3900X
59.5 (53min - 68max) fps -45%
KFA2 GeForce GTX 1650 Super EX One Click OC
NVIDIA GeForce GTX 1650 Super (Desktop), R9 5900X
43.6 fps -60%
3840x2160 High Graphics & Postprocessing (Nvidia HairWorks Off)
Media NVIDIA GeForce RTX 3090
  (128 - 160.2, n=12)
151.5 fps +86%
MSI GeForce RTX 3090 Suprim X
NVIDIA GeForce RTX 3090, R9 5900X
128 (117min - 138max) fps +57%
Media NVIDIA GeForce RTX 3080
  (114 - 115, n=2)
114.5 fps +41%
MSI GeForce RTX 3080 Gaming X Trio
NVIDIA GeForce RTX 3080, R9 5900X
114 (106min - 122max) fps +40%
AMD Radeon RX 6800 XT
AMD Radeon RX 6800 XT, R9 5950X
110 (97min - 117max) fps +35%
AMD Ryzen 9 5900X
NVIDIA Titan RTX, R9 5900X
104 (97min - 112max) fps +28%
KFA2 GeForce RTX 2080 Ti EX
NVIDIA GeForce RTX 2080 Ti (Desktop), R9 3900X
96 (87min - 109max) fps +18%
Zotac Gaming GeForce RTX 3070 Twin Edge
NVIDIA GeForce RTX 3070, R9 5950X
89.6 (81min, 81P1 - 96max) fps +10%
Media NVIDIA GeForce RTX 3070
  (84 - 93.9, n=5)
89.3 fps +10%
NVIDIA GeForce RTX 3060 Ti FE
NVIDIA GeForce RTX 3060 Ti, R9 5950X
81.3 (74min, 74.57P1 - 88max) fps
Nvidia GeForce RTX 2080 Super
NVIDIA GeForce RTX 2080 Super (Desktop), R7 2700X
79 (71min - 87max) fps -3%
Media NVIDIA GeForce RTX 2080 Super (Desktop)
  ()
79 fps -3%
Nvidia GeForce RTX 2070 Super
NVIDIA GeForce RTX 2070 Super (Desktop), R7 2700X
68 (61min - 74max) fps -16%
Media NVIDIA GeForce RTX 2070 Super (Desktop)
  (65.5 - 71, n=5)
68 fps -16%
Media NVIDIA GeForce RTX 2060 Super (Desktop)
  (57 - 61, n=4)
58.8 fps -28%
Nvidia GeForce RTX 2060 Super
NVIDIA GeForce RTX 2060 Super (Desktop), R7 2700X
57 (51min - 62max) fps -30%
AMD Radeon RX 5700 XT
AMD Radeon RX 5700 XT (Desktop), R7 2700X
52.1 (47min - 57max) fps -36%
KFA 2 GeForce GTX 1660 Super
NVIDIA GeForce GTX 1660 Super (Desktop), R9 3900X
40 (36min - 44max) fps -51%
KFA2 GeForce GTX 1650 Super EX One Click OC
NVIDIA GeForce GTX 1650 Super (Desktop), R9 5900X
29.5 fps -64%
3840x2160 Ultra Graphics & Postprocessing (HBAO+)
Media NVIDIA GeForce RTX 3090
  (85.4 - 98.5, n=8)
93.4 fps +75%
MSI GeForce RTX 3080 Gaming X Trio
NVIDIA GeForce RTX 3080, R9 5900X
85.7 (80min - 93max) fps +60%
MSI GeForce RTX 3090 Suprim X
NVIDIA GeForce RTX 3090, R9 5900X
85.4 (79min - 92max) fps +60%
Media NVIDIA GeForce RTX 3080
  (78 - 85.7, n=2)
81.9 fps +53%
KFA2 GeForce RTX 2080 Ti EX
NVIDIA GeForce RTX 2080 Ti (Desktop), R9 3900X
65 (59min - 71max) fps +21%
Media NVIDIA GeForce RTX 3070
  (59 - 60.3, n=2)
59.7 fps +12%
Zotac Gaming GeForce RTX 3070 Twin Edge
NVIDIA GeForce RTX 3070, R9 5950X
59 (53min, 53.59P1 - 64max) fps +10%
Nvidia GeForce RTX 2080 Super
NVIDIA GeForce RTX 2080 Super (Desktop), R7 2700X
55.2 (49min - 61max) fps +3%
Media NVIDIA GeForce RTX 2080 Super (Desktop)
  (55.2 - 55.2, n=2)
55.2 fps +3%
NVIDIA GeForce RTX 3060 Ti FE
NVIDIA GeForce RTX 3060 Ti, R9 5950X
53.5 (49min, 49P1 - 57max) fps
Media NVIDIA GeForce RTX 2070 Super (Desktop)
  (46.3 - 49.3, n=4)
47.4 fps -11%
Nvidia GeForce RTX 2070 Super
NVIDIA GeForce RTX 2070 Super (Desktop), R7 2700X
46.3 (41min - 50max) fps -13%
AMD Radeon RX 5700 XT
AMD Radeon RX 5700 XT (Desktop), R7 2700X
39.7 (35min - 43max) fps -26%
Media NVIDIA GeForce RTX 2060 Super (Desktop)
  (38.4 - 42.3, n=4)
39.6 fps -26%
Nvidia GeForce RTX 2060 Super
NVIDIA GeForce RTX 2060 Super (Desktop), R7 2700X
38.4 (32min - 42max) fps -28%
KFA 2 GeForce GTX 1660 Super
NVIDIA GeForce GTX 1660 Super (Desktop), R9 3900X
27 (24min - 31max) fps -50%
Shadow of the Tomb Raider
3840x2160 Highest Preset AA:T
Media NVIDIA GeForce RTX 3090
  (89.3 - 99.7, n=12)
96.4 fps +72%
MSI GeForce RTX 3090 Suprim X
NVIDIA GeForce RTX 3090, R9 5900X
95.6 fps +71%
MSI GeForce RTX 3080 Gaming X Trio
NVIDIA GeForce RTX 3080, R9 5900X
87.9 fps +57%
Media NVIDIA GeForce RTX 3080
  (83.9 - 87.9, n=2)
85.9 fps +53%
AMD Radeon RX 6800 XT
AMD Radeon RX 6800 XT, R9 5950X
79.6 fps +42%
AMD Ryzen 9 5900X
NVIDIA Titan RTX, R9 5900X
66.3 fps +18%
Media NVIDIA GeForce RTX 3070
  (61 - 63.5, n=4)
62.3 fps +11%
Zotac Gaming GeForce RTX 3070 Twin Edge
NVIDIA GeForce RTX 3070, R9 5950X
62 fps +11%
KFA2 GeForce RTX 2080 Ti EX
NVIDIA GeForce RTX 2080 Ti (Desktop), R9 3900X
60 fps +7%
NVIDIA GeForce RTX 3060 Ti FE
NVIDIA GeForce RTX 3060 Ti, R9 5950X
56 fps
Nvidia GeForce RTX 2080 Super
NVIDIA GeForce RTX 2080 Super (Desktop), R7 2700X
49 fps -12%
Media NVIDIA GeForce RTX 2080 Super (Desktop)
  (49 - 49, n=2)
49 fps -12%
Media NVIDIA GeForce RTX 2070 Super (Desktop)
  (43 - 47.9, n=5)
45.5 fps -19%
Nvidia GeForce RTX 2070 Super
NVIDIA GeForce RTX 2070 Super (Desktop), R7 2700X
43 fps -23%
Media NVIDIA GeForce RTX 2060 Super (Desktop)
  (36 - 40.2, n=4)
38.2 fps -32%
AMD Radeon RX 5700 XT
AMD Radeon RX 5700 XT (Desktop), R7 2700X
38 fps -32%
Nvidia GeForce RTX 2060 Super
NVIDIA GeForce RTX 2060 Super (Desktop), R7 2700X
36 fps -36%
KFA 2 GeForce GTX 1660 Super
NVIDIA GeForce GTX 1660 Super (Desktop), R9 3900X
26 fps -54%
KFA2 GeForce GTX 1650 Super EX One Click OC
NVIDIA GeForce GTX 1650 Super (Desktop), R9 5900X
19 fps -66%
2560x1440 Highest Preset AA:T
Media NVIDIA GeForce RTX 3090
  (137 - 172.3, n=12)
165.6 fps +61%
MSI GeForce RTX 3090 Suprim X
NVIDIA GeForce RTX 3090, R9 5900X
162 fps +57%
MSI GeForce RTX 3080 Gaming X Trio
NVIDIA GeForce RTX 3080, R9 5900X
152 fps +48%
Media NVIDIA GeForce RTX 3080
  (147 - 152, n=2)
149.5 fps +45%
AMD Radeon RX 6800 XT
AMD Radeon RX 6800 XT, R9 5950X
148 fps +44%
AMD Ryzen 9 5900X
NVIDIA Titan RTX, R9 5900X
120 fps +17%
Zotac Gaming GeForce RTX 3070 Twin Edge
NVIDIA GeForce RTX 3070, R9 5950X
114 fps +11%
Media NVIDIA GeForce RTX 3070
  (108 - 116, n=4)
113.2 fps +10%
KFA2 GeForce RTX 2080 Ti EX
NVIDIA GeForce RTX 2080 Ti (Desktop), R9 3900X
108 fps +5%
NVIDIA GeForce RTX 3060 Ti FE
NVIDIA GeForce RTX 3060 Ti, R9 5950X
103 fps
Media NVIDIA GeForce RTX 2080 Super (Desktop)
  (91 - 92, n=2)
91.5 fps -11%
Nvidia GeForce RTX 2080 Super
NVIDIA GeForce RTX 2080 Super (Desktop), R7 2700X
91 fps -12%
Media NVIDIA GeForce RTX 2070 Super (Desktop)
  (81 - 89.6, n=5)
85.4 fps -17%
Nvidia GeForce RTX 2070 Super
NVIDIA GeForce RTX 2070 Super (Desktop), R7 2700X
81 fps -21%
AMD Radeon RX 5700 XT
AMD Radeon RX 5700 XT (Desktop), R7 2700X
76 fps -26%
Media NVIDIA GeForce RTX 2060 Super (Desktop)
  (69 - 75.7, n=4)
72.3 fps -30%
Nvidia GeForce RTX 2060 Super
NVIDIA GeForce RTX 2060 Super (Desktop), R7 2700X
69 fps -33%
KFA 2 GeForce GTX 1660 Super
NVIDIA GeForce GTX 1660 Super (Desktop), R9 3900X
53 fps -49%
KFA2 GeForce GTX 1650 Super EX One Click OC
NVIDIA GeForce GTX 1650 Super (Desktop), R9 5900X
40 fps -61%
1920x1080 Highest Preset AA:T
Media NVIDIA GeForce RTX 3090
  (145 - 240, n=14)
204 fps +41%
AMD Radeon RX 6800 XT
AMD Radeon RX 6800 XT, R9 5950X
194 fps +34%
MSI GeForce RTX 3090 Suprim X
NVIDIA GeForce RTX 3090, R9 5900X
188 fps +30%
Media NVIDIA GeForce RTX 3080
  (177 - 185, n=2)
181 fps +25%
MSI GeForce RTX 3080 Gaming X Trio
NVIDIA GeForce RTX 3080, R9 5900X
177 fps +22%
AMD Ryzen 9 5900X
NVIDIA Titan RTX, R9 5900X
166 fps +14%
Media NVIDIA GeForce RTX 3070
  (138 - 160, n=4)
151.3 fps +4%
Zotac Gaming GeForce RTX 3070 Twin Edge
NVIDIA GeForce RTX 3070, R9 5950X
150 fps +3%
NVIDIA GeForce RTX 3060 Ti FE
NVIDIA GeForce RTX 3060 Ti, R9 5950X
145 fps
KFA2 GeForce RTX 2080 Ti EX
NVIDIA GeForce RTX 2080 Ti (Desktop), R9 3900X
130 fps -10%
Media NVIDIA GeForce RTX 2070 Super (Desktop)
  (104 - 131.1, n=5)
119.7 fps -17%
Media NVIDIA GeForce RTX 2080 Super (Desktop)
  (110 - 118, n=2)
114 fps -21%
Nvidia GeForce RTX 2080 Super
NVIDIA GeForce RTX 2080 Super (Desktop), R7 2700X
110 fps -24%
AMD Radeon RX 5700 XT
AMD Radeon RX 5700 XT (Desktop), R7 2700X
110 fps -24%
Media NVIDIA GeForce RTX 2060 Super (Desktop)
  (96 - 111.4, n=4)
105.2 fps -27%
Nvidia GeForce RTX 2070 Super
NVIDIA GeForce RTX 2070 Super (Desktop), R7 2700X
104 fps -28%
Nvidia GeForce RTX 2060 Super
NVIDIA GeForce RTX 2060 Super (Desktop), R7 2700X
96 fps -34%
KFA 2 GeForce GTX 1660 Super
NVIDIA GeForce GTX 1660 Super (Desktop), R9 3900X
80 fps -45%
KFA2 GeForce GTX 1650 Super EX One Click OC
NVIDIA GeForce GTX 1650 Super (Desktop), R9 5900X
63 fps -57%
Borderlands 3
3840x2160 Badass Overall Quality (DX11)
MSI GeForce RTX 3090 Suprim X
NVIDIA GeForce RTX 3090, R9 5900X
73.4 fps +91%
Media NVIDIA GeForce RTX 3090
  (68 - 75.3, n=13)
72.8 fps +90%
MSI GeForce RTX 3080 Gaming X Trio
NVIDIA GeForce RTX 3080, R9 5900X
61.9 fps +61%
Media NVIDIA GeForce RTX 3080
  (61.5 - 61.9, n=2)
61.7 fps +61%
AMD Radeon RX 6800 XT
AMD Radeon RX 6800 XT, R9 5950X
53.6 fps +40%
AMD Ryzen 9 5900X
NVIDIA Titan RTX, R9 5900X
46.7 fps +22%
Zotac Gaming GeForce RTX 3070 Twin Edge
NVIDIA GeForce RTX 3070, R9 5950X
44.5 fps +16%
Media NVIDIA GeForce RTX 3070
  (42.7 - 46.3, n=5)
44.3 fps +15%
KFA2 GeForce RTX 2080 Ti EX
NVIDIA GeForce RTX 2080 Ti (Desktop), R9 3900X
43.6 fps +14%
NVIDIA GeForce RTX 3060 Ti FE
NVIDIA GeForce RTX 3060 Ti, R9 5950X
38.4 fps
Media NVIDIA GeForce RTX 2080 Super (Desktop)
  ()
35.9 fps -7%
Media NVIDIA GeForce RTX 2070 Super (Desktop)
  (29.5 - 32.7, n=5)
31.3 fps -18%
Media NVIDIA GeForce RTX 2060 Super (Desktop)
  (26.3 - 27.8, n=4)
27.3 fps -29%
KFA 2 GeForce GTX 1660 Super
NVIDIA GeForce GTX 1660 Super (Desktop), R9 3900X
12 fps -69%
KFA2 GeForce GTX 1650 Super EX One Click OC
NVIDIA GeForce GTX 1650 Super (Desktop), R9 5900X
7.87 fps -80%
2560x1440 Badass Overall Quality (DX11)
Media NVIDIA GeForce RTX 3090
  (105 - 131.6, n=13)
123.8 fps +76%
MSI GeForce RTX 3090 Suprim X
NVIDIA GeForce RTX 3090, R9 5900X
117 fps +67%
Media NVIDIA GeForce RTX 3080
  (95.7 - 103, n=2)
99.4 fps +42%
MSI GeForce RTX 3080 Gaming X Trio
NVIDIA GeForce RTX 3080, R9 5900X
95.7 fps +36%
AMD Radeon RX 6800 XT
AMD Radeon RX 6800 XT, R9 5950X
93.6 fps +33%
AMD Ryzen 9 5900X
NVIDIA Titan RTX, R9 5900X
84.7 fps +21%
Zotac Gaming GeForce RTX 3070 Twin Edge
NVIDIA GeForce RTX 3070, R9 5950X
79 fps +13%
KFA2 GeForce RTX 2080 Ti EX
NVIDIA GeForce RTX 2080 Ti (Desktop), R9 3900X
78 fps +11%
Media NVIDIA GeForce RTX 3070
  (75.1 - 82.9, n=5)
77.7 fps +11%
NVIDIA GeForce RTX 3060 Ti FE
NVIDIA GeForce RTX 3060 Ti, R9 5950X
70.2 fps
Media NVIDIA GeForce RTX 2080 Super (Desktop)
  ()
65.5 fps -7%
Media NVIDIA GeForce RTX 2070 Super (Desktop)
  (53.7 - 60.3, n=5)
57.3 fps -18%
Media NVIDIA GeForce RTX 2060 Super (Desktop)
  (48.8 - 51.7, n=4)
50.2 fps -28%
KFA 2 GeForce GTX 1660 Super
NVIDIA GeForce GTX 1660 Super (Desktop), R9 3900X
33 fps -53%
KFA2 GeForce GTX 1650 Super EX One Click OC
NVIDIA GeForce GTX 1650 Super (Desktop), R9 5900X
23.3 fps -67%
1920x1080 Badass Overall Quality (DX11)
Media NVIDIA GeForce RTX 3090
  (117 - 170.1, n=13)
150.7 fps +57%
MSI GeForce RTX 3090 Suprim X
NVIDIA GeForce RTX 3090, R9 5900X
135 fps +41%
Media NVIDIA GeForce RTX 3080
  (117 - 128, n=2)
122.5 fps +28%
AMD Radeon RX 6800 XT
AMD Radeon RX 6800 XT, R9 5950X
120 fps +25%
AMD Ryzen 9 5900X
NVIDIA Titan RTX, R9 5900X
118 fps +23%
MSI GeForce RTX 3080 Gaming X Trio
NVIDIA GeForce RTX 3080, R9 5900X
117 fps +22%
Zotac Gaming GeForce RTX 3070 Twin Edge
NVIDIA GeForce RTX 3070, R9 5950X
104 fps +8%
KFA2 GeForce RTX 2080 Ti EX
NVIDIA GeForce RTX 2080 Ti (Desktop), R9 3900X
101.3 fps +6%
Media NVIDIA GeForce RTX 3070
  (95.3 - 108.9, n=5)
100.6 fps +5%
NVIDIA GeForce RTX 3060 Ti FE
NVIDIA GeForce RTX 3060 Ti, R9 5950X
96 fps
Media NVIDIA GeForce RTX 2080 Super (Desktop)
  ()
91 fps -5%
Media NVIDIA GeForce RTX 2070 Super (Desktop)
  (74.3 - 86, n=5)
80.9 fps -16%
Media NVIDIA GeForce RTX 2060 Super (Desktop)
  (68.6 - 74.1, n=4)
71.2 fps -26%
KFA 2 GeForce GTX 1660 Super
NVIDIA GeForce GTX 1660 Super (Desktop), R9 3900X
50 fps -48%
KFA2 GeForce GTX 1650 Super EX One Click OC
NVIDIA GeForce GTX 1650 Super (Desktop), R9 5900X
39.8 fps -59%
Call of Duty Black Ops Cold War
1920x1080 Highest Settings + Ultra Ray Tracing
AMD Ryzen 9 5900X
NVIDIA Titan RTX, R9 5900X
119 fps +79%
Media NVIDIA GeForce RTX 3090
  (88.3 - 89, n=2)
88.7 fps +33%
MSI GeForce RTX 3090 Suprim X
NVIDIA GeForce RTX 3090, R9 5900X
88.3 (22.4min, 29.5P0.1, 44.8P1 - 267max) fps +33%
MSI GeForce RTX 3080 Gaming X Trio
NVIDIA GeForce RTX 3080, R9 5900X
81.9 (17.3min, 30.1P0.1, 42.6P1 - 248max) fps +23%
Media NVIDIA GeForce RTX 3080
  ()
81.9 fps +23%
Zotac Gaming GeForce RTX 3070 Twin Edge
NVIDIA GeForce RTX 3070, R9 5950X
70.1 (23.8min, 27.5P0.1, 42.6P1 - 217max) fps +5%
NVIDIA GeForce RTX 3060 Ti FE
NVIDIA GeForce RTX 3060 Ti, R9 5950X
66.5 (32.4min, 39.6P0.1, 45.3P1 - 224max) fps
Media NVIDIA GeForce RTX 3070
  (49.8 - 70.1, n=3)
62.8 fps -6%
Media NVIDIA GeForce RTX 2080 Super (Desktop)
  ()
59 fps -11%
Media NVIDIA GeForce RTX 2070 Super (Desktop)
  ()
55.6 fps -16%
Media NVIDIA GeForce RTX 2060 Super (Desktop)
  ()
44.7 fps -33%
AMD Radeon RX 6800 XT
AMD Radeon RX 6800 XT, R9 5950X
21.8 (8.8min, 9.61P0.1, 16.2P1 - 49.5max) fps -67%
3840x2160 Highest Settings
MSI GeForce RTX 3090 Suprim X
NVIDIA GeForce RTX 3090, R9 5900X
76.1 (42.1min, 58.7P0.1, 61.9P1 - 221max) fps +69%
Media NVIDIA GeForce RTX 3090
  (74.6 - 76.1, n=2)
75.4 fps +68%
MSI GeForce RTX 3080 Gaming X Trio
NVIDIA GeForce RTX 3080, R9 5900X
65.6 (13.8min, 17.5P0.1, 51.4P1 - 229max) fps +46%
Media NVIDIA GeForce RTX 3080
  ()
65.6 fps +46%
AMD Radeon RX 6800 XT
AMD Radeon RX 6800 XT, R9 5950X
64 (10.8min, 11.6P0.1, 50.8P1 - 159max) fps +43%
Media NVIDIA GeForce RTX 3070
  (43.8 - 74, n=3)
56 fps +25%
AMD Ryzen 9 5900X
NVIDIA Titan RTX, R9 5900X
52.9 fps +18%
NVIDIA GeForce RTX 3060 Ti FE
NVIDIA GeForce RTX 3060 Ti, R9 5950X
44.9 (17.1min, 19.2P0.1, 34.5P1 - 84.4max) fps
Zotac Gaming GeForce RTX 3070 Twin Edge
NVIDIA GeForce RTX 3070, R9 5950X
43.8 (16.7min, 17.4P0.1, 33.8P1 - 80.3max) fps -2%
Media NVIDIA GeForce RTX 2080 Super (Desktop)
  (38 - 44.5, n=2)
41.3 fps -8%
Media NVIDIA GeForce RTX 2070 Super (Desktop)
  ()
37.6 fps -16%
Media NVIDIA GeForce RTX 2060 Super (Desktop)
  ()
17.3 fps -61%
KFA2 GeForce GTX 1650 Super EX One Click OC
NVIDIA GeForce GTX 1650 Super (Desktop), R9 5900X
2 fps -96%
2560x1440 Highest Settings
Media NVIDIA GeForce RTX 3090
  (122 - 124.7, n=2)
123.4 fps +50%
MSI GeForce RTX 3090 Suprim X
NVIDIA GeForce RTX 3090, R9 5900X
122 (54.5min, 84.4P0.1, 93.9P1 - 258max) fps +49%
MSI GeForce RTX 3080 Gaming X Trio
NVIDIA GeForce RTX 3080, R9 5900X
104 (19.1min, 20.4P0.1, 77.7P1 - 258max) fps +27%
Media NVIDIA GeForce RTX 3080
  ()
104 fps +27%
Media NVIDIA GeForce RTX 3070
  (83 - 107, n=3)
93.2 fps +14%
Zotac Gaming GeForce RTX 3070 Twin Edge
NVIDIA GeForce RTX 3070, R9 5950X
89.5 (40.5min, 65.1P0.1, 70.3P1 - 219max) fps +9%
AMD Ryzen 9 5900X
NVIDIA Titan RTX, R9 5900X
87.6 fps +7%
NVIDIA GeForce RTX 3060 Ti FE
NVIDIA GeForce RTX 3060 Ti, R9 5950X
82.1 (38.4min, 57P0.1, 63.5P1 - 233max) fps
AMD Radeon RX 6800 XT
AMD Radeon RX 6800 XT, R9 5950X
80.4 (16.5min, 31.8P0.1, 64.3P1 - 285max) fps -2%
Media NVIDIA GeForce RTX 2070 Super (Desktop)
  ()
67.7 fps -18%
Media NVIDIA GeForce RTX 2080 Super (Desktop)
  (51 - 77.6, n=2)
64.3 fps -22%
Media NVIDIA GeForce RTX 2060 Super (Desktop)
  ()
53.2 fps -35%
KFA2 GeForce GTX 1650 Super EX One Click OC
NVIDIA GeForce GTX 1650 Super (Desktop), R9 5900X
26 fps -68%
1920x1080 Highest Settings
Media NVIDIA GeForce RTX 3090
  (161 - 161.1, n=2)
161.1 fps +46%
MSI GeForce RTX 3090 Suprim X
NVIDIA GeForce RTX 3090, R9 5900X
161 (59.8min, 96.1P0.1, 111P1 - 312max) fps +46%
AMD Ryzen 9 5900X
NVIDIA Titan RTX, R9 5900X
144 fps +31%
AMD Radeon RX 6800 XT
AMD Radeon RX 6800 XT, R9 5950X
144 (58.7min, 90.7P0.1, 105P1 - 365max) fps +31%
MSI GeForce RTX 3080 Gaming X Trio
NVIDIA GeForce RTX 3080, R9 5900X
127 (21.9min, 24.4P0.1, 83.5P1 - 285max) fps +15%
Media NVIDIA GeForce RTX 3080
  ()
127 fps +15%
Zotac Gaming GeForce RTX 3070 Twin Edge
NVIDIA GeForce RTX 3070, R9 5950X
120 (49.7min, 76.4P0.1, 85.7P1 - 245max) fps +9%
Media NVIDIA GeForce RTX 3070
  (95.7 - 122, n=3)
112.6 fps +2%
NVIDIA GeForce RTX 3060 Ti FE
NVIDIA GeForce RTX 3060 Ti, R9 5950X
110 (46.1min, 67.8P0.1, 79.3P1 - 288max) fps
Media NVIDIA GeForce RTX 2070 Super (Desktop)
  ()
92.7 fps -16%
Media NVIDIA GeForce RTX 2080 Super (Desktop)
  (59 - 106, n=2)
82.5 fps -25%
Media NVIDIA GeForce RTX 2060 Super (Desktop)
  ()
73 fps -34%
KFA2 GeForce GTX 1650 Super EX One Click OC
NVIDIA GeForce GTX 1650 Super (Desktop), R9 5900X
37 fps -66%
Watch Dogs Legion
1920x1080 Ultra Preset + Ultra Ray Tracing (DX12)
Media NVIDIA GeForce RTX 3090
  (75.7 - 110, n=3)
88 fps +82%
MSI GeForce RTX 3090 Suprim X
NVIDIA GeForce RTX 3090, R9 5900X
78.2 (53.58min, 63.39P1 - 115.63max) fps +62%
AMD Radeon RX 6800 XT
AMD Radeon RX 6800 XT, R9 5950X
71.4 (47.71min, 55.63P1 - 113.42max) fps +48%
MSI GeForce RTX 3080 Gaming X Trio
NVIDIA GeForce RTX 3080, R9 5900X
71.3 (24.22min, 56.02P1 - 112.08max) fps +48%
Media NVIDIA GeForce RTX 3080
  (70.9 - 71.3, n=2)
71.1 fps +47%
Media NVIDIA GeForce RTX 3070
  (51.7 - 61, n=4)
55.1 fps +14%
Zotac Gaming GeForce RTX 3070 Twin Edge
NVIDIA GeForce RTX 3070, R9 5950X
51.7 (15.03min, 25.28P1 - 71.97max) fps +7%
NVIDIA GeForce RTX 3060 Ti FE
NVIDIA GeForce RTX 3060 Ti, R9 5950X
48.3 (26.43min, 38.03P1 - 84.29max) fps
Media NVIDIA GeForce RTX 2080 Super (Desktop)
  ()
45.4 fps -6%
Media NVIDIA GeForce RTX 2070 Super (Desktop)
  ()
39.2 fps -19%
Media NVIDIA GeForce RTX 2060 Super (Desktop)
  ()
33.7 fps -30%
KFA 2 GeForce GTX 1660 Super
NVIDIA GeForce GTX 1660 Super (Desktop), R9 3900X
11.7 (7.26min, 8.31P1 - 16.29max) fps -76%
3840x2160 Ultra Preset (DX12)
Media NVIDIA GeForce RTX 3090
  (57.6 - 64, n=3)
60.6 fps +84%
MSI GeForce RTX 3090 Suprim X
NVIDIA GeForce RTX 3090, R9 5900X
60.3 (34.68min, 51.05P1 - 78.14max) fps +83%
Media NVIDIA GeForce RTX 3080
  (53.5 - 54.1, n=2)
53.8 fps +63%
MSI GeForce RTX 3080 Gaming X Trio
NVIDIA GeForce RTX 3080, R9 5900X
53.5 (33.98min, 42.85P1 - 79.6max) fps +62%
AMD Radeon RX 6800 XT
AMD Radeon RX 6800 XT, R9 5950X
49.3 (32.85min, 41.54P1 - 76.12max) fps +49%
Zotac Gaming GeForce RTX 3070 Twin Edge
NVIDIA GeForce RTX 3070, R9 5950X
38.9 (22.74min, 31.31P1 - 54.01max) fps +18%
Media NVIDIA GeForce RTX 3070
  (37 - 39.2, n=4)
38 fps +15%
Media NVIDIA GeForce RTX 2080 Super (Desktop)
  ()
34.4 fps +4%
NVIDIA GeForce RTX 3060 Ti FE
NVIDIA GeForce RTX 3060 Ti, R9 5950X
33 (17.58min, 22.09P1 - 51.23max) fps
Media NVIDIA GeForce RTX 2070 Super (Desktop)
  ()
29.2 fps -12%
Media NVIDIA GeForce RTX 2060 Super (Desktop)
  ()
24.7 fps -25%
KFA 2 GeForce GTX 1660 Super
NVIDIA GeForce GTX 1660 Super (Desktop), R9 3900X
12.3 (6.74min, 8.44P1 - 72.77max) fps -63%
KFA2 GeForce GTX 1650 Super EX One Click OC
NVIDIA GeForce GTX 1650 Super (Desktop), R9 5900X
8.09 (4.22min, 5.13P1 - 78.77max) fps -75%
2560x1440 Ultra Preset (DX12)
Media NVIDIA GeForce RTX 3090
  (88.3 - 103, n=3)
93.7 fps +59%
MSI GeForce RTX 3090 Suprim X
NVIDIA GeForce RTX 3090, R9 5900X
89.7 (59.87min, 73.02P1 - 132.92max) fps +52%
AMD Radeon RX 6800 XT
AMD Radeon RX 6800 XT, R9 5950X
84.5 (58.88min, 69.45P1 - 137.16max) fps +43%
Media NVIDIA GeForce RTX 3080
  (81.1 - 81.6, n=2)
81.4 fps +38%
MSI GeForce RTX 3080 Gaming X Trio
NVIDIA GeForce RTX 3080, R9 5900X
81.1 (46.24min, 61.45P1 - 140.66max) fps +37%
Media NVIDIA GeForce RTX 3070
  (65.3 - 67, n=4)
66.1 fps +12%
Zotac Gaming GeForce RTX 3070 Twin Edge
NVIDIA GeForce RTX 3070, R9 5950X
65.3 (41.29min, 53.17P1 - 88.97max) fps +10%
NVIDIA GeForce RTX 3060 Ti FE
NVIDIA GeForce RTX 3060 Ti, R9 5950X
59.1 (34.72min, 48.11P1 - 97.67max) fps
Media NVIDIA GeForce RTX 2080 Super (Desktop)
  ()
57.3 fps -3%
Media NVIDIA GeForce RTX 2070 Super (Desktop)
  ()
51.4 fps -13%
Media NVIDIA GeForce RTX 2060 Super (Desktop)
  ()
43.7 fps -26%
KFA 2 GeForce GTX 1660 Super
NVIDIA GeForce GTX 1660 Super (Desktop), R9 3900X
23.5 (14.14min, 15.64P1 - 42max) fps -60%
KFA2 GeForce GTX 1650 Super EX One Click OC
NVIDIA GeForce GTX 1650 Super (Desktop), R9 5900X
14.3 (6.88min, 8.73P1 - 63.4max) fps -76%
1920x1080 Ultra Preset (DX12)
Media NVIDIA GeForce RTX 3090
  (103 - 134, n=3)
114.7 fps +50%
AMD Radeon RX 6800 XT
AMD Radeon RX 6800 XT, R9 5950X
112 (75.12min, 87.97P1 - 181.69max) fps +46%
MSI GeForce RTX 3090 Suprim X
NVIDIA GeForce RTX 3090, R9 5900X
103 (30.26min, 75.96P1 - 155.81max) fps +34%
Media NVIDIA GeForce RTX 3080
  (99.3 - 103, n=2)
101.2 fps +32%
MSI GeForce RTX 3080 Gaming X Trio
NVIDIA GeForce RTX 3080, R9 5900X
99.3 (13.98min, 73.29P1 - 167.32max) fps +30%
Zotac Gaming GeForce RTX 3070 Twin Edge
NVIDIA GeForce RTX 3070, R9 5950X
84.9 (55.86min, 67.74P1 - 127.49max) fps +11%
Media NVIDIA GeForce RTX 3070
  (79 - 89, n=4)
84.7 fps +11%
NVIDIA GeForce RTX 3060 Ti FE
NVIDIA GeForce RTX 3060 Ti, R9 5950X
76.6 (48.47min, 62.15P1 - 115.84max) fps
Media NVIDIA GeForce RTX 2080 Super (Desktop)
  ()
75.4 fps -2%
Media NVIDIA GeForce RTX 2070 Super (Desktop)
  ()
68.3 fps -11%
Media NVIDIA GeForce RTX 2060 Super (Desktop)
  ()
59.1 fps -23%
KFA 2 GeForce GTX 1660 Super
NVIDIA GeForce GTX 1660 Super (Desktop), R9 3900X
31.4 (16.64min, 21.23P1 - 82max) fps -59%
KFA2 GeForce GTX 1650 Super EX One Click OC
NVIDIA GeForce GTX 1650 Super (Desktop), R9 5900X
20.9 (10.71min, 12.73P1 - 75.52max) fps -73%
Metro Exodus
1920x1080 Ultra Quality DXR AF:16x
MSI GeForce RTX 3090 Suprim X
NVIDIA GeForce RTX 3090, R9 5900X
116 (59.68min - 166.06max) fps +64%
Media NVIDIA GeForce RTX 3090
  (68.6 - 122.2, n=12)
111.4 fps +57%
MSI GeForce RTX 3080 Gaming X Trio
NVIDIA GeForce RTX 3080, R9 5900X
102 (54.36min - 150.53max) fps +44%
Media NVIDIA GeForce RTX 3080
  (91.5 - 102, n=2)
96.8 fps +37%
AMD Ryzen 9 5900X
NVIDIA Titan RTX, R9 5900X
87.9 (49.32min - 136.76max) fps +24%
AMD Radeon RX 6800 XT
AMD Radeon RX 6800 XT, R9 5950X
85.5 (52.71min - 120.38max) fps +21%
Zotac Gaming GeForce RTX 3070 Twin Edge
NVIDIA GeForce RTX 3070, R9 5950X
82.1 (47.4min - 134.03max) fps +16%
Media NVIDIA GeForce RTX 3070
  (80.4 - 83, n=5)
81.6 fps +15%
KFA2 GeForce RTX 2080 Ti EX
NVIDIA GeForce RTX 2080 Ti (Desktop), R9 3900X
78.6 (43min - 115max) fps +11%
NVIDIA GeForce RTX 3060 Ti FE
NVIDIA GeForce RTX 3060 Ti, R9 5950X
70.8 (38.7min - 118.79max) fps
Nvidia GeForce RTX 2080 Super
NVIDIA GeForce RTX 2080 Super (Desktop), R7 2700X
65 (37.62min - 97.62max) fps -8%
Media NVIDIA GeForce RTX 2080 Super (Desktop)
  ()
65 fps -8%
Media NVIDIA GeForce RTX 2070 Super (Desktop)
  (56.3 - 62.1, n=4)
58.5 fps -17%
Nvidia GeForce RTX 2070 Super
NVIDIA GeForce RTX 2070 Super (Desktop), R7 2700X
57.5 (34min - 85max) fps -19%
Media NVIDIA GeForce RTX 2060 Super (Desktop)
  (50 - 53.3, n=3)
51.1 fps -28%
Nvidia GeForce RTX 2060 Super
NVIDIA GeForce RTX 2060 Super (Desktop), R7 2700X
50.1 (30min - 72max) fps -29%
3840x2160 Ultra Quality AF:16x
MSI GeForce RTX 3090 Suprim X
NVIDIA GeForce RTX 3090, R9 5900X
76.3 (45.25min - 131.44max) fps +79%
Media NVIDIA GeForce RTX 3090
  (70.6 - 77.3, n=12)
75 fps +76%
MSI GeForce RTX 3080 Gaming X Trio
NVIDIA GeForce RTX 3080, R9 5900X
65.9 (38.48min - 122.03max) fps +54%
Media NVIDIA GeForce RTX 3080
  (64.1 - 65.9, n=2)
65 fps +52%
AMD Radeon RX 6800 XT
AMD Radeon RX 6800 XT, R9 5950X
56.3 (40.14min - 64.28max) fps +32%
AMD Ryzen 9 5900X
NVIDIA Titan RTX, R9 5900X
54.9 (34.88min - 89.73max) fps +29%
Media NVIDIA GeForce RTX 3070
  (48.3 - 49.7, n=5)
48.9 fps +15%
Zotac Gaming GeForce RTX 3070 Twin Edge
NVIDIA GeForce RTX 3070, R9 5950X
48.3 (29.65min - 105.2max) fps +13%
KFA2 GeForce RTX 2080 Ti EX
NVIDIA GeForce RTX 2080 Ti (Desktop), R9 3900X
47.5 (31min - 69max) fps +11%
NVIDIA GeForce RTX 3060 Ti FE
NVIDIA GeForce RTX 3060 Ti, R9 5950X
42.7 (25.98min - 91.32max) fps
Media NVIDIA GeForce RTX 2080 Super (Desktop)
  (40 - 40.4, n=2)
40.2 fps -6%
Nvidia GeForce RTX 2080 Super
NVIDIA GeForce RTX 2080 Super (Desktop), R7 2700X
40 (25.84min - 59.35max) fps -6%
Media NVIDIA GeForce RTX 2070 Super (Desktop)
  (35 - 38.1, n=5)
36.8 fps -14%
Nvidia GeForce RTX 2070 Super
NVIDIA GeForce RTX 2070 Super (Desktop), R7 2700X
35 (23min - 51max) fps -18%
Media NVIDIA GeForce RTX 2060 Super (Desktop)
  (29.7 - 32.2, n=4)
30.9 fps -28%
Nvidia GeForce RTX 2060 Super
NVIDIA GeForce RTX 2060 Super (Desktop), R7 2700X
29.7 (20min - 42max) fps -30%
AMD Radeon RX 5700 XT
AMD Radeon RX 5700 XT (Desktop), R7 2700X
29.6 (20.7min - 36.64max) fps -31%
KFA 2 GeForce GTX 1660 Super
NVIDIA GeForce GTX 1660 Super (Desktop), R9 3900X
21 (13min - 29max) fps -51%
KFA2 GeForce GTX 1650 Super EX One Click OC
NVIDIA GeForce GTX 1650 Super (Desktop), R9 5900X
16.1 (9.6min - 26.07max) fps -62%
2560x1440 Ultra Quality AF:16x
Media NVIDIA GeForce RTX 3090
  (102 - 118.2, n=12)
113.2 fps +71%
MSI GeForce RTX 3090 Suprim X
NVIDIA GeForce RTX 3090, R9 5900X
112 (58.69min - 182.42max) fps +69%
MSI GeForce RTX 3080 Gaming X Trio
NVIDIA GeForce RTX 3080, R9 5900X
97.4 (51.56min - 162.47max) fps +47%
Media NVIDIA GeForce RTX 3080
  (92.2 - 97.4, n=2)
94.8 fps +43%
AMD Radeon RX 6800 XT
AMD Radeon RX 6800 XT, R9 5950X
94.6 (55.44min - 143.68max) fps +43%
AMD Ryzen 9 5900X
NVIDIA Titan RTX, R9 5900X
84.9 (46.03min - 152.65max) fps +28%
Media NVIDIA GeForce RTX 3070
  (74.4 - 78.3, n=5)
75.8 fps +15%
Zotac Gaming GeForce RTX 3070 Twin Edge
NVIDIA GeForce RTX 3070, R9 5950X
75.4 (39.91min - 127.26max) fps +14%
KFA2 GeForce RTX 2080 Ti EX
NVIDIA GeForce RTX 2080 Ti (Desktop), R9 3900X
71.9 (40min - 108max) fps +9%
NVIDIA GeForce RTX 3060 Ti FE
NVIDIA GeForce RTX 3060 Ti, R9 5950X
66.2 (36.92min - 129.84max) fps
Media NVIDIA GeForce RTX 2080 Super (Desktop)
  (61 - 65, n=2)
63 fps -5%
Nvidia GeForce RTX 2080 Super
NVIDIA GeForce RTX 2080 Super (Desktop), R7 2700X
61 (35.51min - 95.82max) fps -8%
Media NVIDIA GeForce RTX 2070 Super (Desktop)
  (54.3 - 61.9, n=5)
57.6 fps -13%
AMD Radeon RX 5700 XT
AMD Radeon RX 5700 XT (Desktop), R7 2700X
54.5 (31.85min - 78.06max) fps -18%
Nvidia GeForce RTX 2070 Super
NVIDIA GeForce RTX 2070 Super (Desktop), R7 2700X
54.3 (32min - 83max) fps -18%
Media NVIDIA GeForce RTX 2060 Super (Desktop)
  (46 - 52.2, n=4)
49 fps -26%
Nvidia GeForce RTX 2060 Super
NVIDIA GeForce RTX 2060 Super (Desktop), R7 2700X
46.5 (28min - 69max) fps -30%
KFA 2 GeForce GTX 1660 Super
NVIDIA GeForce GTX 1660 Super (Desktop), R9 3900X
32 (19min - 47max) fps -52%
KFA2 GeForce GTX 1650 Super EX One Click OC
NVIDIA GeForce GTX 1650 Super (Desktop), R9 5900X
28.5 (16.88min - 51.46max) fps -57%
1920x1080 Ultra Quality AF:16x
Media NVIDIA GeForce RTX 3090
  (108 - 145, n=12)
135.3 fps +59%
MSI GeForce RTX 3090 Suprim X
NVIDIA GeForce RTX 3090, R9 5900X
132 (72.24min - 199.88max) fps +55%
MSI GeForce RTX 3080 Gaming X Trio
NVIDIA GeForce RTX 3080, R9 5900X
116 (56.76min - 185.19max) fps +37%
AMD Radeon RX 6800 XT
AMD Radeon RX 6800 XT, R9 5950X
115 (64.52min - 181.92max) fps +35%
Media NVIDIA GeForce RTX 3080
  (111 - 116, n=2)
113.5 fps +34%
AMD Ryzen 9 5900X
NVIDIA Titan RTX, R9 5900X
106 (52.66min - 176.55max) fps +25%
Media NVIDIA GeForce RTX 3070
  (91.3 - 97.7, n=5)
93.9 fps +11%
Zotac Gaming GeForce RTX 3070 Twin Edge
NVIDIA GeForce RTX 3070, R9 5950X
93.6 (45.01min - 161.08max) fps +10%
KFA2 GeForce RTX 2080 Ti EX
NVIDIA GeForce RTX 2080 Ti (Desktop), R9 3900X
89.7 (46min - 140max) fps +6%
NVIDIA GeForce RTX 3060 Ti FE
NVIDIA GeForce RTX 3060 Ti, R9 5950X
84.9 (43.89min - 144.89max) fps
Media NVIDIA GeForce RTX 2080 Super (Desktop)
  (76 - 82, n=2)
79 fps -7%
Nvidia GeForce RTX 2080 Super
NVIDIA GeForce RTX 2080 Super (Desktop), R7 2700X
76 (38.54min - 122.4max) fps -10%
Media NVIDIA GeForce RTX 2070 Super (Desktop)
  (67.8 - 79.1, n=5)
72.3 fps -15%
Nvidia GeForce RTX 2070 Super
NVIDIA GeForce RTX 2070 Super (Desktop), R7 2700X
67.8 (36min - 110max) fps -20%
Media NVIDIA GeForce RTX 2060 Super (Desktop)
  (58 - 67.4, n=4)
62.3 fps -27%
AMD Radeon RX 5700 XT
AMD Radeon RX 5700 XT (Desktop), R7 2700X
61 (36.09min - 86.1max) fps -28%
Nvidia GeForce RTX 2060 Super
NVIDIA GeForce RTX 2060 Super (Desktop), R7 2700X
58.9 (32min - 92max) fps -31%
KFA 2 GeForce GTX 1660 Super
NVIDIA GeForce GTX 1660 Super (Desktop), R9 3900X
41 (23min - 61max) fps -52%
KFA2 GeForce GTX 1650 Super EX One Click OC
NVIDIA GeForce GTX 1650 Super (Desktop), R9 5900X
36.6 (20.42min - 76.72max) fps -57%
Cyberpunk 2077 1.0
1920x1080 Ray Tracing Ultra Preset (DLSS off)
Media NVIDIA GeForce RTX 3090
  (59.6 - 65.4, n=2)
62.5 fps +73%
MSI GeForce RTX 3080 Gaming X Trio
NVIDIA GeForce RTX 3080, R9 5900X
56.6 (20.9min, 44.1P0.1, 48.3P1 - 98.2max) fps +56%
Media NVIDIA GeForce RTX 3080
  ()
56.6 fps +56%
Media NVIDIA GeForce RTX 3070
  (41.9 - 42.3, n=2)
42.1 fps +16%
Zotac Gaming GeForce RTX 3070 Twin Edge
NVIDIA GeForce RTX 3070, R9 5950X
41.9 (20.3min, 32.1P0.1, 35.3P1 - 74max) fps +16%
AMD Ryzen 9 5900X
NVIDIA Titan RTX, R9 5900X
40.4 fps +12%
NVIDIA GeForce RTX 3060 Ti FE
NVIDIA GeForce RTX 3060 Ti, R9 5950X
36.2 (20.3min, 29.8P0.1, 31.6P1 - 68.1max) fps
Media NVIDIA GeForce RTX 2080 Super (Desktop)
  ()
33 fps -9%
Media NVIDIA GeForce RTX 2070 Super (Desktop)
  ()
28.9 fps -20%
Media NVIDIA GeForce RTX 2060 Super (Desktop)
  ()
21.3 fps -41%
3840x2160 Ultra Preset
Media NVIDIA GeForce RTX 3090
  (41.5 - 45.3, n=2)
43.4 fps +80%
MSI GeForce RTX 3080 Gaming X Trio
NVIDIA GeForce RTX 3080, R9 5900X
38.9 (20.9min, 31.3P0.1, 34.3P1 - 86.6max) fps +61%
Media NVIDIA GeForce RTX 3080
  ()
38.9 fps +61%
AMD Ryzen 9 5900X
NVIDIA Titan RTX, R9 5900X
30.9 fps +28%
Media NVIDIA GeForce RTX 3070
  (26.6 - 27.9, n=2)
27.3 fps +13%
Zotac Gaming GeForce RTX 3070 Twin Edge
NVIDIA GeForce RTX 3070, R9 5950X
26.6 (19min, 20.8P0.1, 23.4P1 - 46.6max) fps +10%
NVIDIA GeForce RTX 3060 Ti FE
NVIDIA GeForce RTX 3060 Ti, R9 5950X
24.1 (16.8min, 19.8P0.1, 21.8P1 - 27.1max) fps
Media NVIDIA GeForce RTX 2080 Super (Desktop)
  ()
24.1 fps 0%
Media NVIDIA GeForce RTX 2070 Super (Desktop)
  ()
21.5 fps -11%
Media NVIDIA GeForce RTX 2060 Super (Desktop)
  (17.3 - 17.5, n=2)
17.4 fps -28%
KFA2 GeForce GTX 1650 Super EX One Click OC
NVIDIA GeForce GTX 1650 Super (Desktop), R9 5900X
7 fps -71%
2560x1440 Ultra Preset
Media NVIDIA GeForce RTX 3090
  (78.1 - 85.3, n=2)
81.7 fps +70%
MSI GeForce RTX 3080 Gaming X Trio
NVIDIA GeForce RTX 3080, R9 5900X
72.5 (22.2min, 46.6P0.1, 57.1P1 - 159max) fps +51%
Media NVIDIA GeForce RTX 3080
  ()
72.5 fps +51%
AMD Ryzen 9 5900X
NVIDIA Titan RTX, R9 5900X
58.4 fps +22%
Media NVIDIA GeForce RTX 3070
  (53.7 - 54.8, n=2)
54.3 fps +13%
Zotac Gaming GeForce RTX 3070 Twin Edge
NVIDIA GeForce RTX 3070, R9 5950X
53.7 (20min, 39.9P0.1, 45.2P1 - 102max) fps +12%
Media NVIDIA GeForce RTX 2080 Super (Desktop)
  ()
49.1 fps +2%
NVIDIA GeForce RTX 3060 Ti FE
NVIDIA GeForce RTX 3060 Ti, R9 5950X
48 (21.3min, 34.3P0.1, 41.9P1 - 94.6max) fps
Media NVIDIA GeForce RTX 2070 Super (Desktop)
  ()
43.7 fps -9%
Media NVIDIA GeForce RTX 2060 Super (Desktop)
  (35.3 - 35.7, n=2)
35.5 fps -26%
KFA2 GeForce GTX 1650 Super EX One Click OC
NVIDIA GeForce GTX 1650 Super (Desktop), R9 5900X
18 fps -62%
1920x1080 Ultra Preset
Media NVIDIA GeForce RTX 3090
  (108 - 109.7, n=2)
108.9 fps +48%
MSI GeForce RTX 3080 Gaming X Trio
NVIDIA GeForce RTX 3080, R9 5900X
103 (23.3min, 60.3P0.1, 75.7P1 - 176max) fps +40%
Media NVIDIA GeForce RTX 3080
  ()
103 fps +40%
AMD Ryzen 9 5900X
NVIDIA Titan RTX, R9 5900X
82.3 fps +12%
Media NVIDIA GeForce RTX 3070
  (80.6 - 81, n=2)
80.8 fps +10%
Zotac Gaming GeForce RTX 3070 Twin Edge
NVIDIA GeForce RTX 3070, R9 5950X
80.6 (19.6min, 58.2P0.1, 65.3P1 - 111max) fps +10%
NVIDIA GeForce RTX 3060 Ti FE
NVIDIA GeForce RTX 3060 Ti, R9 5950X
73.6 (21.2min, 53.8P0.1, 61.6P1 - 102max) fps
Media NVIDIA GeForce RTX 2080 Super (Desktop)
  ()
72.1 fps -2%
Media NVIDIA GeForce RTX 2070 Super (Desktop)
  ()
65.4 fps -11%
Media NVIDIA GeForce RTX 2060 Super (Desktop)
  (52.1 - 54.2, n=2)
53.2 fps -28%
KFA2 GeForce GTX 1650 Super EX One Click OC
NVIDIA GeForce GTX 1650 Super (Desktop), R9 5900X
30 fps -59%
basso medio alto ultraQHD4K
The Witcher 3 (2015) 479 342 218 109 81.3
Shadow of the Tomb Raider (2018) 185 157 153 145 103 56
Forza Horizon 4 (2018) 246 200 196 173 150 103
Assassin´s Creed Odyssey (2018) 142 121 104 75 65 45
Battlefield V (2018) 181 145 124 114 97.9 64.9
Far Cry New Dawn (2019) 123 111 108 99 94 65
Metro Exodus (2019) 193 139 105 84.9 66.2 42.7
The Division 2 (2019) 225 172 142 109 77.3 43.7
Anno 1800 (2019) 134 135 94.1 54.2 40.6 34.4
Total War: Three Kingdoms (2019) 367.4 195.6 127.3 92.8 59 28.8
Control (2019) 240 147 110 71.9 36.1
Borderlands 3 (2019) 172 149 118 96 70.2 38.4
Red Dead Redemption 2 (2019) 170 154 108 69.9 57.3 37.5
Doom Eternal (2020) 508 320 283 274 219 122
Gears Tactics (2020) 332.3 208.8 162.4 128.9 91.9 49.4
F1 2020 (2020) 369 252 174 135 80
Horizon Zero Dawn (2020) 181 139 122 109 92 53
Mafia Definitive Edition (2020) 159 130 124 90.1 49.7
FIFA 21 (2020) 242 247 230
Watch Dogs Legion (2020) 124 122 109 76.6 59.1 33
Assassin´s Creed Valhalla (2020) 126 95 81 74 60 40
Call of Duty Black Ops Cold War (2020) 243 133 123 110 82.1 44.9
Immortals Fenyx Rising (2020) 166 119 110 101 84 57
Cyberpunk 2077 1.0 (2020) 122 101 85.2 73.6 48 24.1

Emissioni

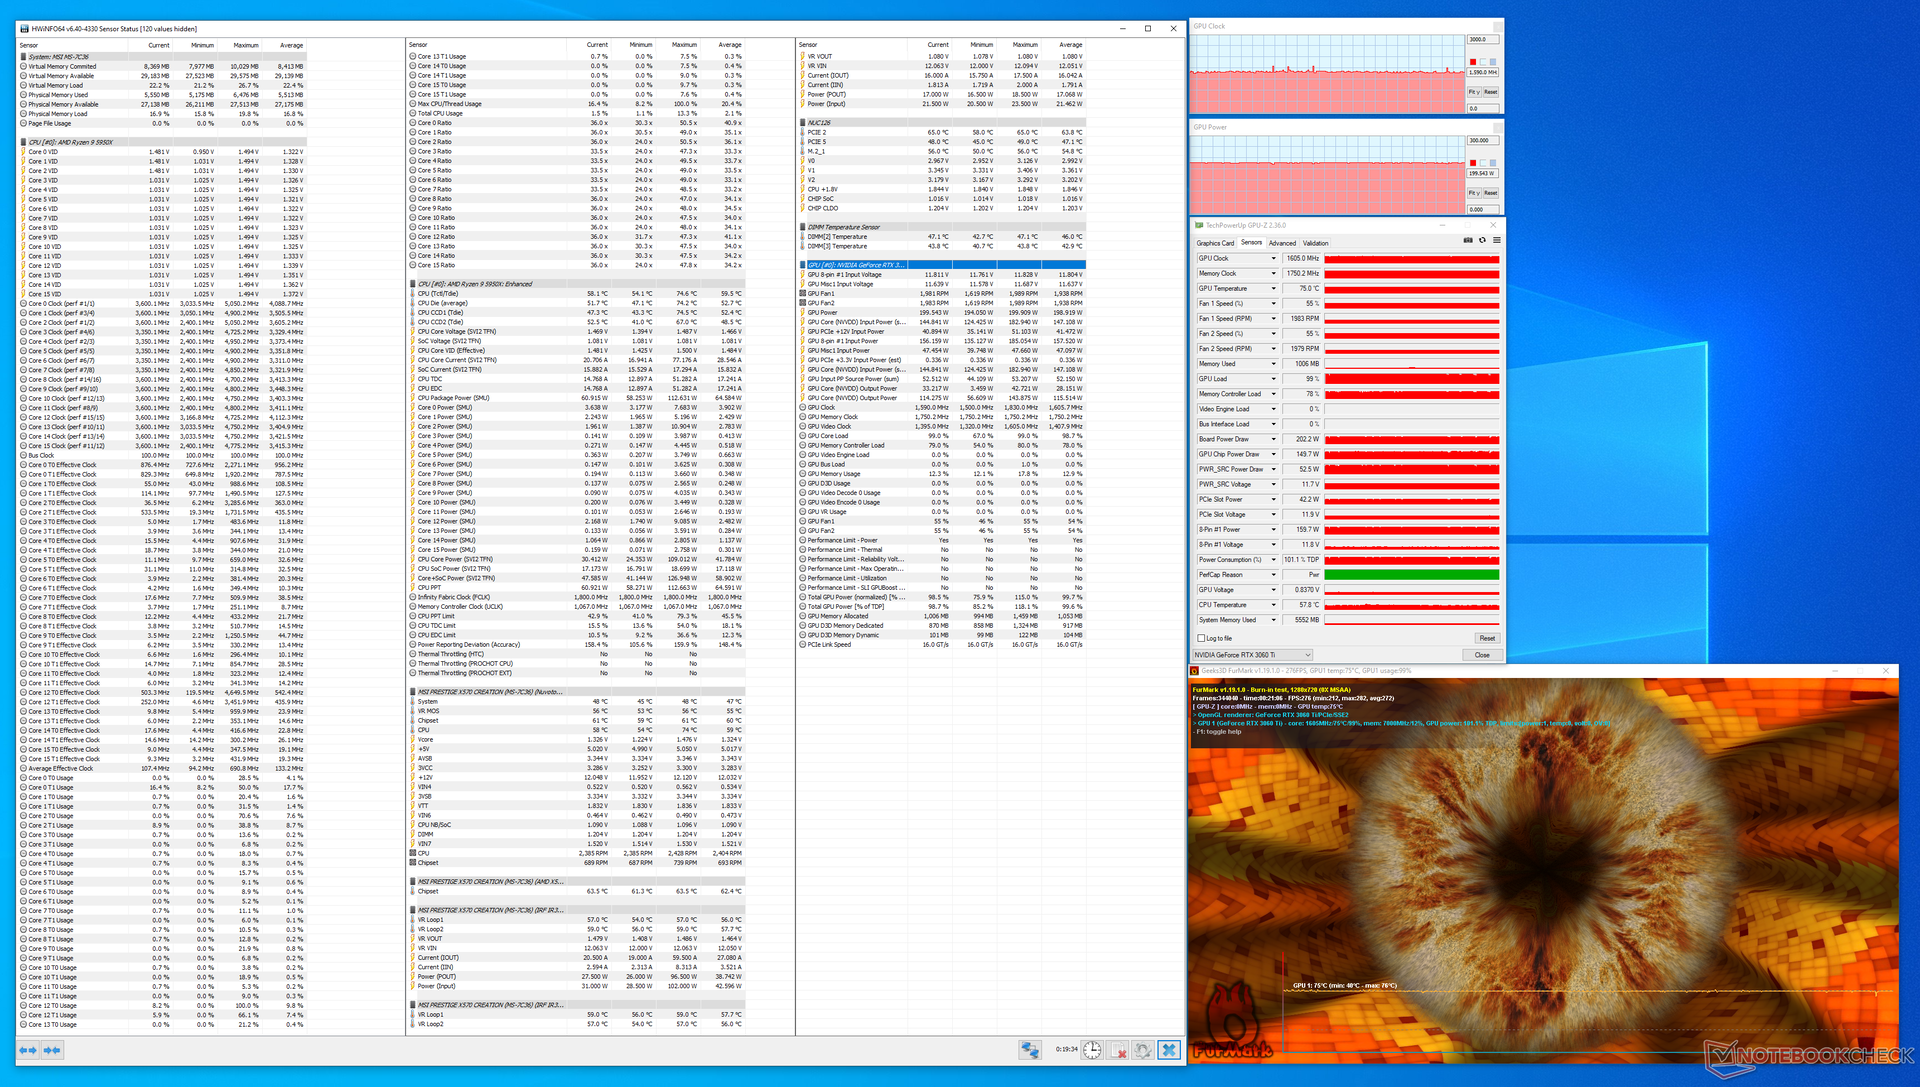
Grazie al design migliorato del radiatore di NVIDIA, la RTX 3060 Ti FE si comporta abilmente sotto stress. Durante lo stress test FurMark, abbiamo osservato che il core della GPU ha mantenuto una temperatura costante di 75 °C e l'assorbimento della scheda è stato al TGP nominale di 200 W.

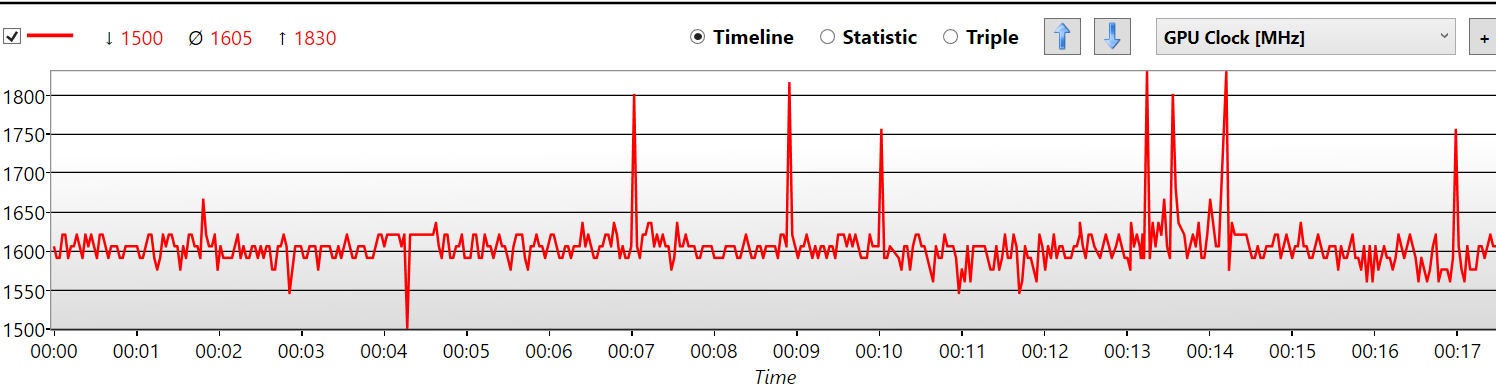
Per la maggior parte dello stress test, la RTX 3060 Ti FE opera vicino al suo boost clock nominale di 1.665 MHz anche se osserviamo occasionali picchi fino a 1.830 MHz.

Abbiamo usato FurMark stress per determinare i livelli di temperatura e rumore. Il consumo totale di energia del sistema è stato determinato durante lo stress con FurMark e The Witcher 3 al preset 1080p Ultra.

FurMark stress
FurMark stress
GPU boost durante lo stress di FurMark

Temperature

Mappa di calore NVIDIA RTX 3060 Ti FE

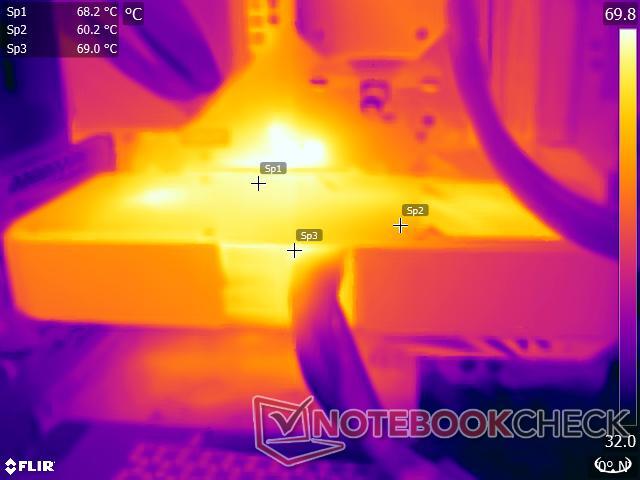
Mentre il nuovo sistema di raffreddamento di NVIDIA offre prestazioni adeguate per evitare il throttling, la scheda stessa tende a diventare significativamente calda sotto carico. Durante lo stress test FurMark, abbiamo notato che le temperature di superficie vicino alla GPU e alle aree di alimentazione erano vicine ai 70 °C.

Questo è prevedibile, dato che il core della GPU stessa può raggiungere i 75 °C sotto carico e la costruzione metallica serve solo a trasmettere gran parte di questo calore alla superficie.

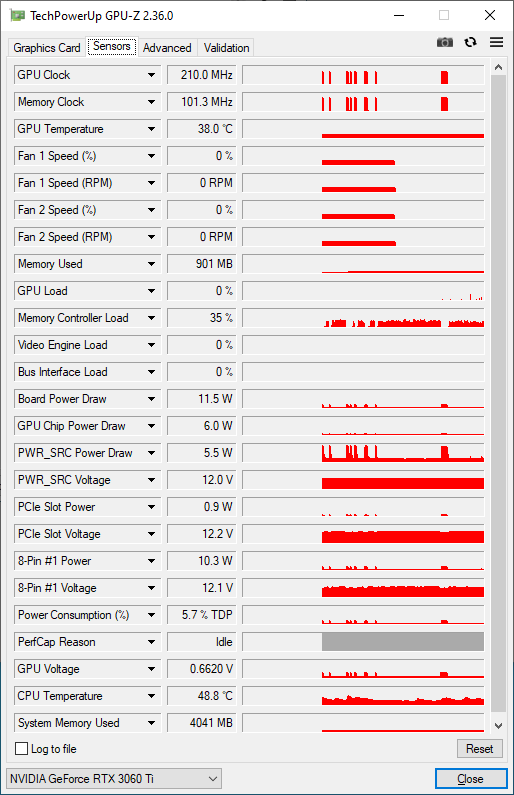
L'area vicino allo scarico della ventola posteriore è anche abbastanza calda a 60 °C come si può vedere dalla mappa di calore. Detto questo, la GPU gira al minimo tra i 38 °C e i 42 °C durante i quali le ventole si fermano completamente.

Consumo energetico

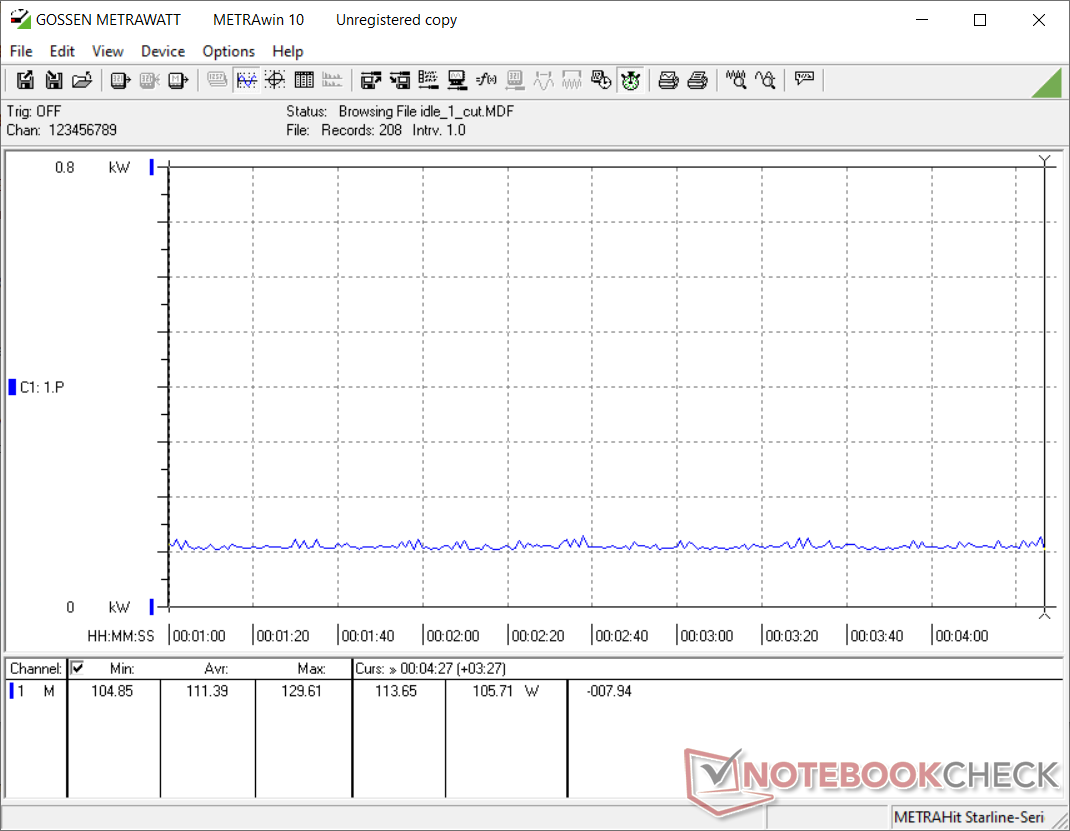
Il nostro sistema di test consuma circa 111 W in idle con tutta l'illuminazione RGB spenta e un totale di cinque ventole (tre Corsair SP 120 mm per il case e due Corsair ML 120 mm per il radiatore) e la pompa Elite Capellix AIO in funziona in un profilo bilanciato.

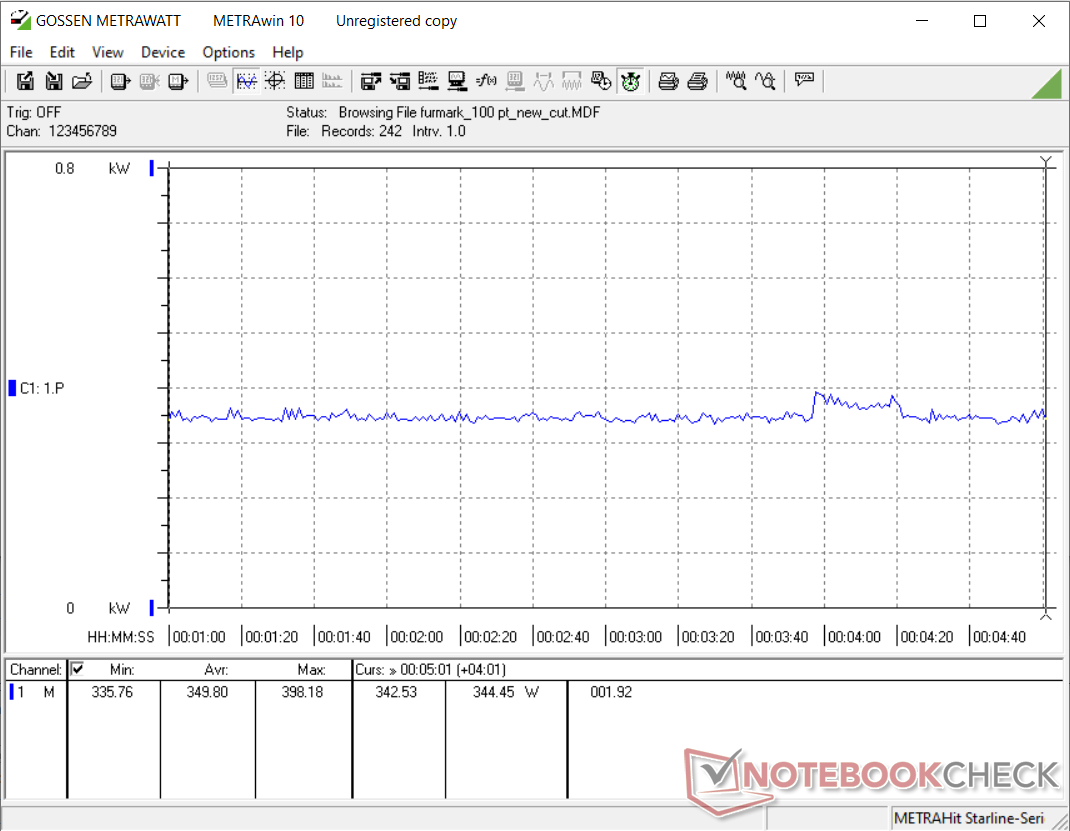
Abbiamo notato un consumo energetico totale medio del sistema di 350 W e 379 W durante lo stress FurMark e The Witcher 3 Ultra, rispettivamente.

Come si vede nei grafici del consumo di energia qui sotto, un leggero aumento del consumo di energia si osserva vicino al limite dei 4 minuti. Questo potrebbe essere dovuto al momentaneo aumento del boost clock che abbiamo descritto prima.

Nel complesso, la RTX 3060 Ti FE è più o meno parsimoniosa rispetto alla media della RTX 2080 Super in termini di consumo energetico.

Consumo di energia del sistema - Idle
Consumo energetico del sistema - stress FurMark
Consumo energetico del sistema - Il preset Witcher 3 1080p Ultra
Power Consumption
1280x720 FurMark 1.19 GPU Stress Test (external Monitor)
MSI GeForce RTX 3090 Suprim X
NVIDIA GeForce RTX 3090, R9 5900X (Idle: 105.9 W)
551 (521min - 582max) Watt * -57%
Media NVIDIA GeForce RTX 3080
  (Idle: 492 - 505, n=2 W)
499 Watt * -43%
MSI GeForce RTX 3080 Gaming X Trio
NVIDIA GeForce RTX 3080, R9 5900X (Idle: 103 W)
492 (485min - 514max) Watt * -41%
Media NVIDIA GeForce RTX 3090
  (Idle: 281 - 551, n=8 W)
469 Watt * -34%
AMD Radeon RX 6800 XT
AMD Radeon RX 6800 XT, R9 5950X (Idle: 99.5 W)
447.9 (413min - 484max) Watt * -28%
KFA2 GeForce RTX 2080 Ti EX
NVIDIA GeForce RTX 2080 Ti (Desktop), R9 3900X (Idle: 100.5 W)
400.8 (354min - 432max) Watt * -15%
Zotac Gaming GeForce RTX 3070 Twin Edge
NVIDIA GeForce RTX 3070, R9 5950X (Idle: 114.96 W)
393 (384min, 385P1 - 406max) Watt * -12%
Zotac Gaming GeForce RTX 3070 Twin Edge
NVIDIA GeForce RTX 3070, R9 5950X (Idle: 114.96 W)
375 (365min, 366P1 - 421max) Watt * -7%
Nvidia GeForce RTX 2080 Super
NVIDIA GeForce RTX 2080 Super (Desktop), R7 2700X (Idle: 78.87 W)
376.8 (331min - 409max) Watt * -8%
Media NVIDIA GeForce RTX 2080 Super (Desktop)
  (Idle: 328 - 414, n=4 W)
362 Watt * -3%
NVIDIA GeForce RTX 3060 Ti FE
NVIDIA GeForce RTX 3060 Ti, R9 5950X (Idle: 111.39 W)
350 (336min, 336P1 - 398max) Watt *
Media NVIDIA GeForce RTX 3070
  (Idle: 281 - 393, n=6 W)
348 Watt * +1%
Media NVIDIA GeForce RTX 2070 Super (Desktop)
  (Idle: 280 - 358, n=6 W)
329 Watt * +6%
AMD Radeon RX 5700 XT
AMD Radeon RX 5700 XT (Desktop), R7 2700X (239 fps, Idle: 69.8 W)
326.6 (313min - 351max) Watt * +7%
Nvidia GeForce RTX 2070 Super
NVIDIA GeForce RTX 2070 Super (Desktop), R7 2700X (283 fps, Idle: 80.5 W)
326 (315min - 348max) Watt * +7%
Media NVIDIA GeForce RTX 2060 Super (Desktop)
  (Idle: 235 - 315, n=5 W)
290 Watt * +17%
Nvidia GeForce RTX 2060 Super
NVIDIA GeForce RTX 2060 Super (Desktop), R7 2700X (237 fps, Idle: 77.12 W)
281.4 (275min - 321max) Watt * +20%
KFA 2 GeForce GTX 1660 Super
NVIDIA GeForce GTX 1660 Super (Desktop), R9 3900X (Idle: 84.76 W)
247.6 (241min - 322max) Watt * +29%
KFA2 GeForce GTX 1650 Super EX One Click OC
NVIDIA GeForce GTX 1650 Super (Desktop), R9 5900X (Idle: 86.5 W)
228.7 (223min - 271max) Watt * +35%
1920x1080 The Witcher 3 ultra (external Monitor)
MSI GeForce RTX 3090 Suprim X
NVIDIA GeForce RTX 3090, R9 5900X (Idle: 105.9 W)
597 (577min - 618max) Watt * -58%
Media NVIDIA GeForce RTX 3090
  (Idle: 464 - 597, n=17 W)
524 Watt * -38%
AMD Radeon RX 6800 XT
AMD Radeon RX 6800 XT, R9 5950X (Idle: 99.5 W)
505 (389min - 543max) Watt * -33%
Media NVIDIA GeForce RTX 3080
  (Idle: 498 - 505, n=2 W)
502 Watt * -32%
MSI GeForce RTX 3080 Gaming X Trio
NVIDIA GeForce RTX 3080, R9 5900X (Idle: 103 W)
498.3 (487min - 523max) Watt * -31%
AMD Ryzen 9 5900X
NVIDIA Titan RTX, R9 5900X (Idle: 78.1 W)
439.6 (419min - 497max) Watt * -16%
KFA2 GeForce RTX 2080 Ti EX
NVIDIA GeForce RTX 2080 Ti (Desktop), R9 3900X (Idle: 100.5 W)
438.8 (431min - 463max) Watt * -16%
Zotac Gaming GeForce RTX 3070 Twin Edge
NVIDIA GeForce RTX 3070, R9 5950X (Idle: 114.96 W)
406 (397min, 399P1 - 421max) Watt * -7%
Media NVIDIA GeForce RTX 3070
  (Idle: 317 - 550, n=5 W)
401 Watt * -6%
Nvidia GeForce RTX 2080 Super
NVIDIA GeForce RTX 2080 Super (Desktop), R7 2700X (Idle: 78.87 W)
382.8 (360min - 410max) Watt * -1%
NVIDIA GeForce RTX 3060 Ti FE
NVIDIA GeForce RTX 3060 Ti, R9 5950X (Idle: 111.39 W)
379 (270min, 364P1 - 409max) Watt *
Media NVIDIA GeForce RTX 2080 Super (Desktop)
  (Idle: 336 - 416, n=5 W)
363 Watt * +4%
AMD Radeon RX 5700 XT
AMD Radeon RX 5700 XT (Desktop), R7 2700X (Idle: 69.8 W)
348.7 (341min - 359max) Watt * +8%
Nvidia GeForce RTX 2070 Super
NVIDIA GeForce RTX 2070 Super (Desktop), R7 2700X (96.8 fps, Idle: 80.5 W)
344.7 (335min - 370max) Watt * +9%
Media NVIDIA GeForce RTX 2070 Super (Desktop)
  (Idle: 296 - 377, n=6 W)
342 Watt * +10%
Media NVIDIA GeForce RTX 2060 Super (Desktop)
  (Idle: 246 - 331, n=5 W)
304 Watt * +20%
Nvidia GeForce RTX 2060 Super
NVIDIA GeForce RTX 2060 Super (Desktop), R7 2700X (82.7 fps, Idle: 77.12 W)
298.2 (293min - 322max) Watt * +21%
KFA 2 GeForce GTX 1660 Super
NVIDIA GeForce GTX 1660 Super (Desktop), R9 3900X (Idle: 84.76 W)
260.4 (255min - 277max) Watt * +31%
KFA2 GeForce GTX 1650 Super EX One Click OC
NVIDIA GeForce GTX 1650 Super (Desktop), R9 5900X (Idle: 86.5 W)
240.7 (237min - 247max) Watt * +36%

* ... Meglio usare valori piccoli
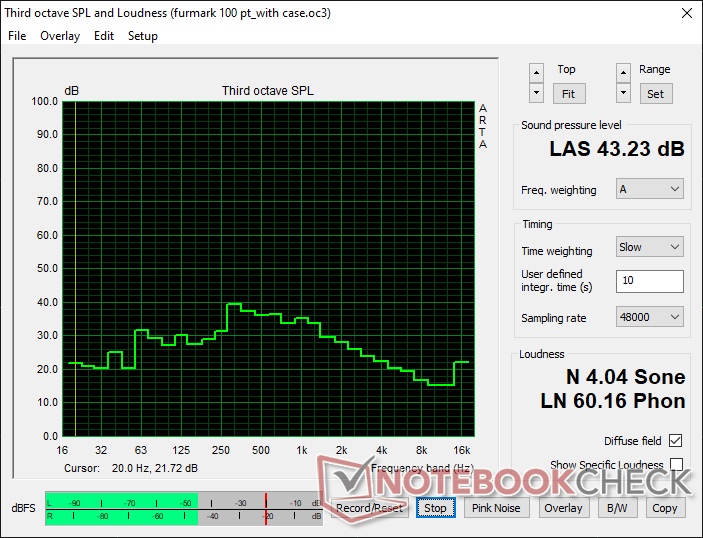
Rumorosità

Uno dei vantaggi del nuovo meccanismo di raffreddamento di NVIDIA è che i livelli di rumore delle ventole sono tenuti ben sotto controllo.

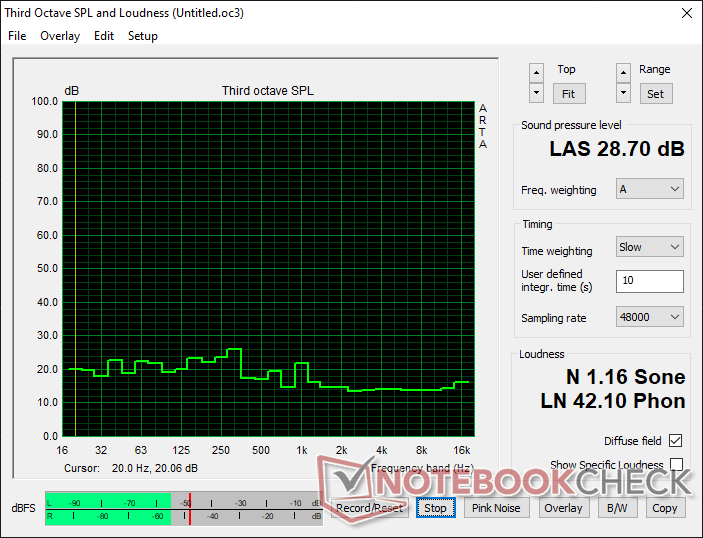
Poiché NVIDIA ha implementato una modalità di arresto completo della ventola con le schede Ampere FE, il livello di rumorosità (SPL) in idle è più o meno lo stesso del valore ambientale di 28,70 db(A) a una distanza di 20 cm dal case chiuso.

L'SPL è salito a 43.23 db(A) durante lo stress test FurMark, che è molto tollerabile soprattutto quando il case è chiuso. Un'ulteriore regolazione della curva della ventola può essere possibile utilizzando utility di terze parti come MSI Afterburner.

Livelli di rumore - al minimo con le ventole del case spente
Livelli di rumore - FurMark stress con le ventole del case spente

Pro

+ Robusta costruzione in metallo
+ Aspetto premium
+ Piastra posteriore in metallo
+ Prestazioni alla pari o leggermente superiori alla RTX 2080 Super
+ Supporto per Ray Tracing e DLSS 2.0 nei giochi compatibili
+ Prestazioni decenti nei programmi 3D professionali
+ Minimi cali di frame in condizioni di stress a lungo termine
+ Arresto completo della ventola in idle
+ Livelli di rumore decenti sotto stress

Contro

- Il connettore a 12 pin sembra ridondante
- Spazio limitato per l'overclocking
- Solo 8 GB di VRAM
- Temperature di superficie più alte sotto carico
- Consumo energetico solo marginalmente migliore rispetto alla RTX 2080 Super
- Scorte molto limitate

Valutazione Complessiva della NVIDIA GeForce RTX 3060 Ti Founders Edition

NVIDIA GeForce RTX 3060 Ti Founders Edition. Unità di test gentilmente fornita da NVIDIA India.

La NVIDIA GeForce RTX 3060 Ti Founders Edition fa molti passi giusti. La scheda ha un aspetto premium, è ben costruita e occupa un ingombro relativamente compatto di 2 slots. L'unico problema è il connettore di alimentazione a 12 pin posizionato centralmente, che non aggiunge alcuna funzionalità ma rende la gestione dei cavi ingombrante.

Il nuovo meccanismo di raffreddamento di NVIDIA offre un chiaro vantaggio e con l'arresto completo delle ventole, la Founders Edition può potenzialmente essere un affare migliore rispetto alle varianti add-in board (AiB). Abbiamo notato un consumo energetico ridotto (anche se solo marginale) rispetto alla RTX 2080 Super insieme a livelli di rumore gestibili sotto carico, che sono sviluppi benvenuti.

La NVIDIA GeForce RTX 3060 Ti Founders Edition offre le prestazioni della RTX 2080 Super per 399,99 dollari (₹35.900) e con una potenza inferiore di 50 W. Ha il potenziale per essere una delle GPU più popolari di questa generazione, ma i limiti di scorte continuano a smorzare le prospettive di acquistarne una al prezzo corretto.

La RTX 3060 Ti FE dovrebbe essere la vostra scheda preferita se giocate principalmente a risoluzioni 1080p Ultra e QHD Ultra. Un gioco 4K fluido è sicuramente possibile con alcune modifiche visive. I miglioramenti delle prestazioni del Ray Tracing (RT) rispetto alla RTX 2080 Super non sono molto significativi. Detto questo, DLSS 2.0 dovrebbe essere in grado di offrire uno scatto nei titoli supportati per ottenere frames giocabili con RT abilitato.

La scheda è anche capace di prestazioni di calcolo e di modellazione 3D decenti, ma non è davvero adatta per i flussi di lavoro professionali CAD/CAM, medici, automobilistici o energetici.

NVIDIA è riuscita a offrire prestazioni RTX 2080 Super e un po' di più per 300 dollari in meno e con un TGP inferiore di 50 W. Chi viene da una GTX 1070 troverà che la RTX 3060 Ti FE offre il miglior affare al prezzo MSRP. Tuttavia, gli acquirenti che possono estendere il loro budget un po' potrebbero anche voler dare un'occhiata alla RTX 3070 FE se può essere acquistata per 499 dollari.

Prezzo e disponibilità

La disponibilità della NVIDIA GeForce RTX 3060 Ti Founders Edition, comprese quelle delle schede partner, è incerta al momento di questa recensione. Attualmente, solo Best Buy offre questa scheda al prezzo di 399,99 dollari. Non sorprende che sia completamente esaurita al momento della pubblicazione. Raccomandiamo comunque di tenere d'occhio il link indicato, in quanto si prevede che le scorte vengano rifornite periodicamente.

Pricecompare

Please share our article, every link counts!
> Recensioni e prove di notebook, tablets e smartphones > Recensioni e prove > Recensioni e prove > Recensione della scheda grafica NVIDIA GeForce RTX 3060 Ti Founders Edition: Flagship 1440p Ultra e gaming 4K per 400 dollari
Vaidyanathan Subramaniam, 2021-02- 7 (Update: 2021-02- 7)