Recensione dell'Acer ConceptD 9 Pro: una Workstation convertibile per professionisti della creatitività

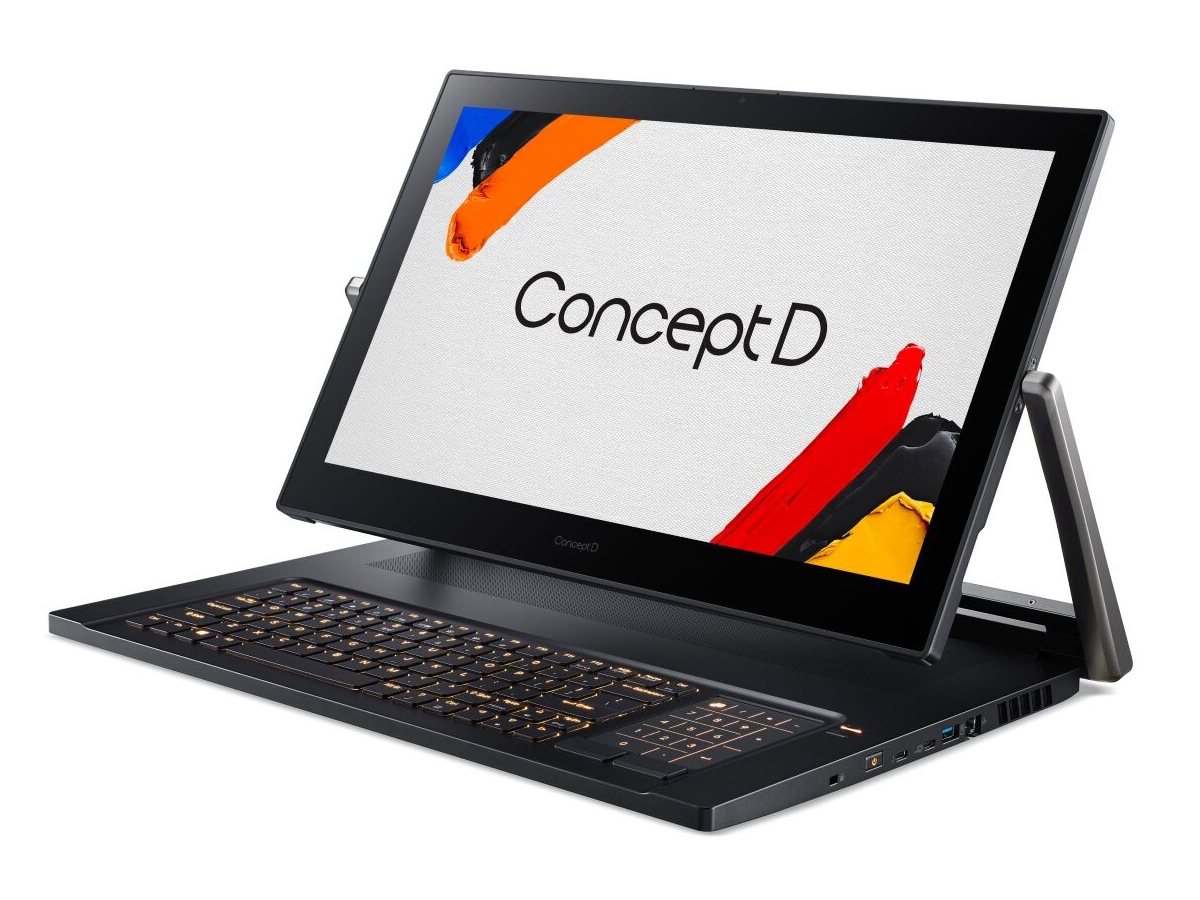
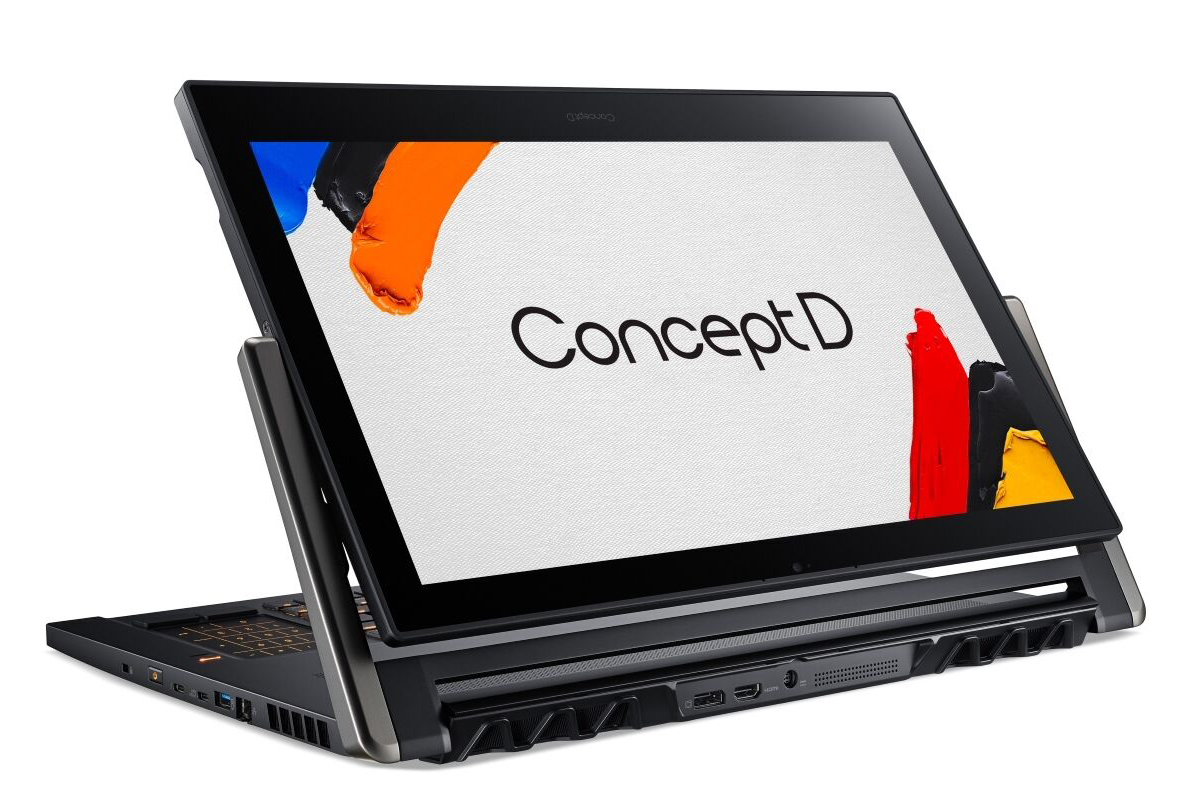
L'Acer ConceptD 9 Pro non è una normale workstation da 17,3". Il display rotante può essere utilizzato anche come tavoletta grafica. Gli schizzi possono essere creati con l'aiuto della penna digitale Wacom (inclusa). Il dispositivo è alimentato da una CPU Core i9-9980HK e da una GPU GeForce RTX 5000. Non ci sono concorrenti diretti nel nostro database. Pertanto, useremo le normali workstation da 17,3" per il confronto. Ci sono dispositivi come il Lenovo Thinkpad P73, MSI WE75 9TK, Dell Precision 7730, Eurocom Tornado F7W ed il Fujitsu Celsius H980.
Punteggio | Data | Modello | Peso | Altezza | Dimensione | Risoluzione | Prezzo |
|---|---|---|---|---|---|---|---|
| 86.2 % v7 (old) | 03/2020 | Acer ConceptD 9 Pro i9-9980HK, Quadro RTX 5000 (Laptop) | 4.5 kg | 26.5 mm | 17.30" | 3840x2160 | |
| 86.6 % v7 (old) | 12/2019 | Lenovo ThinkPad P73-20QR002DGE i7-9850H, Quadro RTX 3000 (Laptop) | 3.5 kg | 31 mm | 17.30" | 1920x1080 | |
| 84.8 % v7 (old) | 11/2019 | MSI WE75 9TK i7-9750H, Quadro RTX 3000 (Laptop) | 2.6 kg | 27.5 mm | 17.30" | 1920x1080 | |
| 85.7 % v7 (old) | 05/2019 | Dell Precision 7730 i7-8850H, Quadro P3200 | 3.3 kg | 30 mm | 17.30" | 1920x1080 | |
| 86.3 % v6 (old) | 12/2018 | Eurocom Tornado F7W i9-9900K, Quadro P5200 | 4.2 kg | 51 mm | 17.30" | 3840x2160 | |
| 84.6 % v7 (old) | 03/2019 | Fujitsu Celsius H980 i7-8750H, Quadro P3200 | 3.5 kg | 30 mm | 17.30" | 1920x1080 |
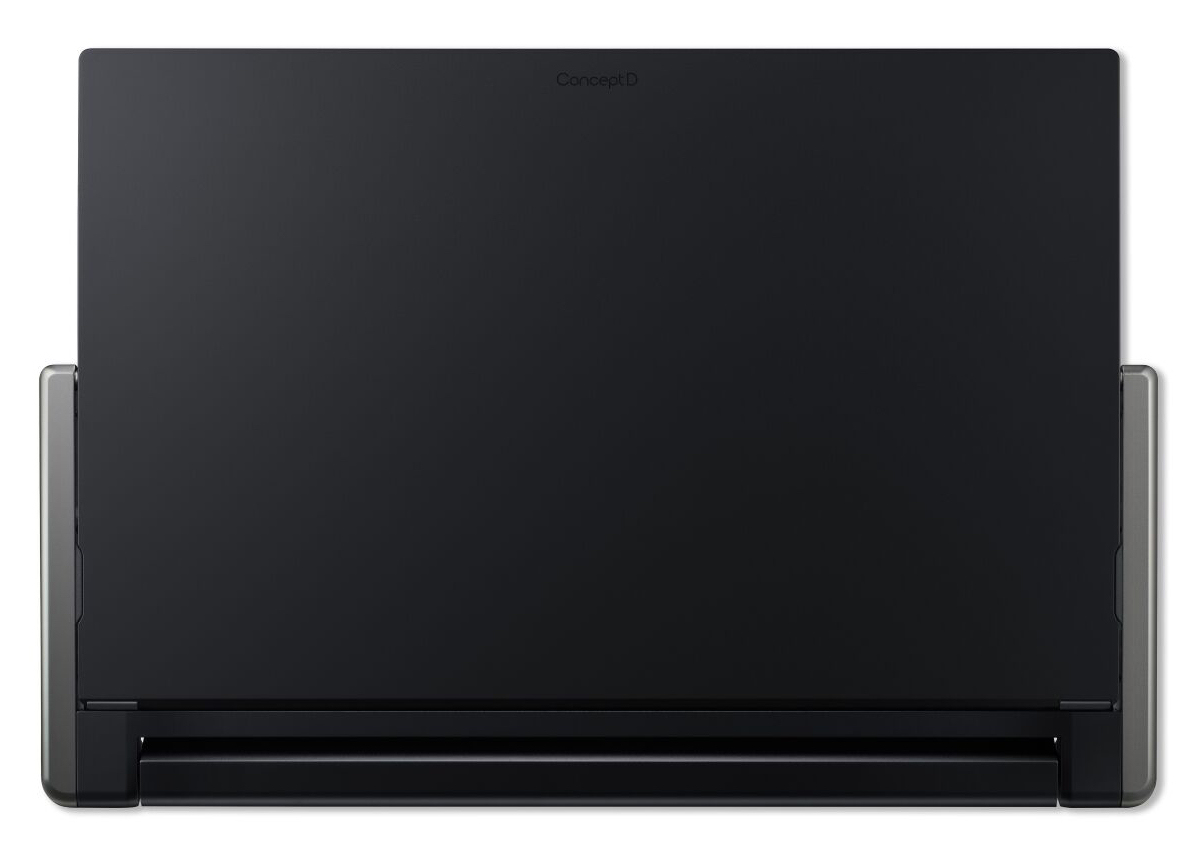
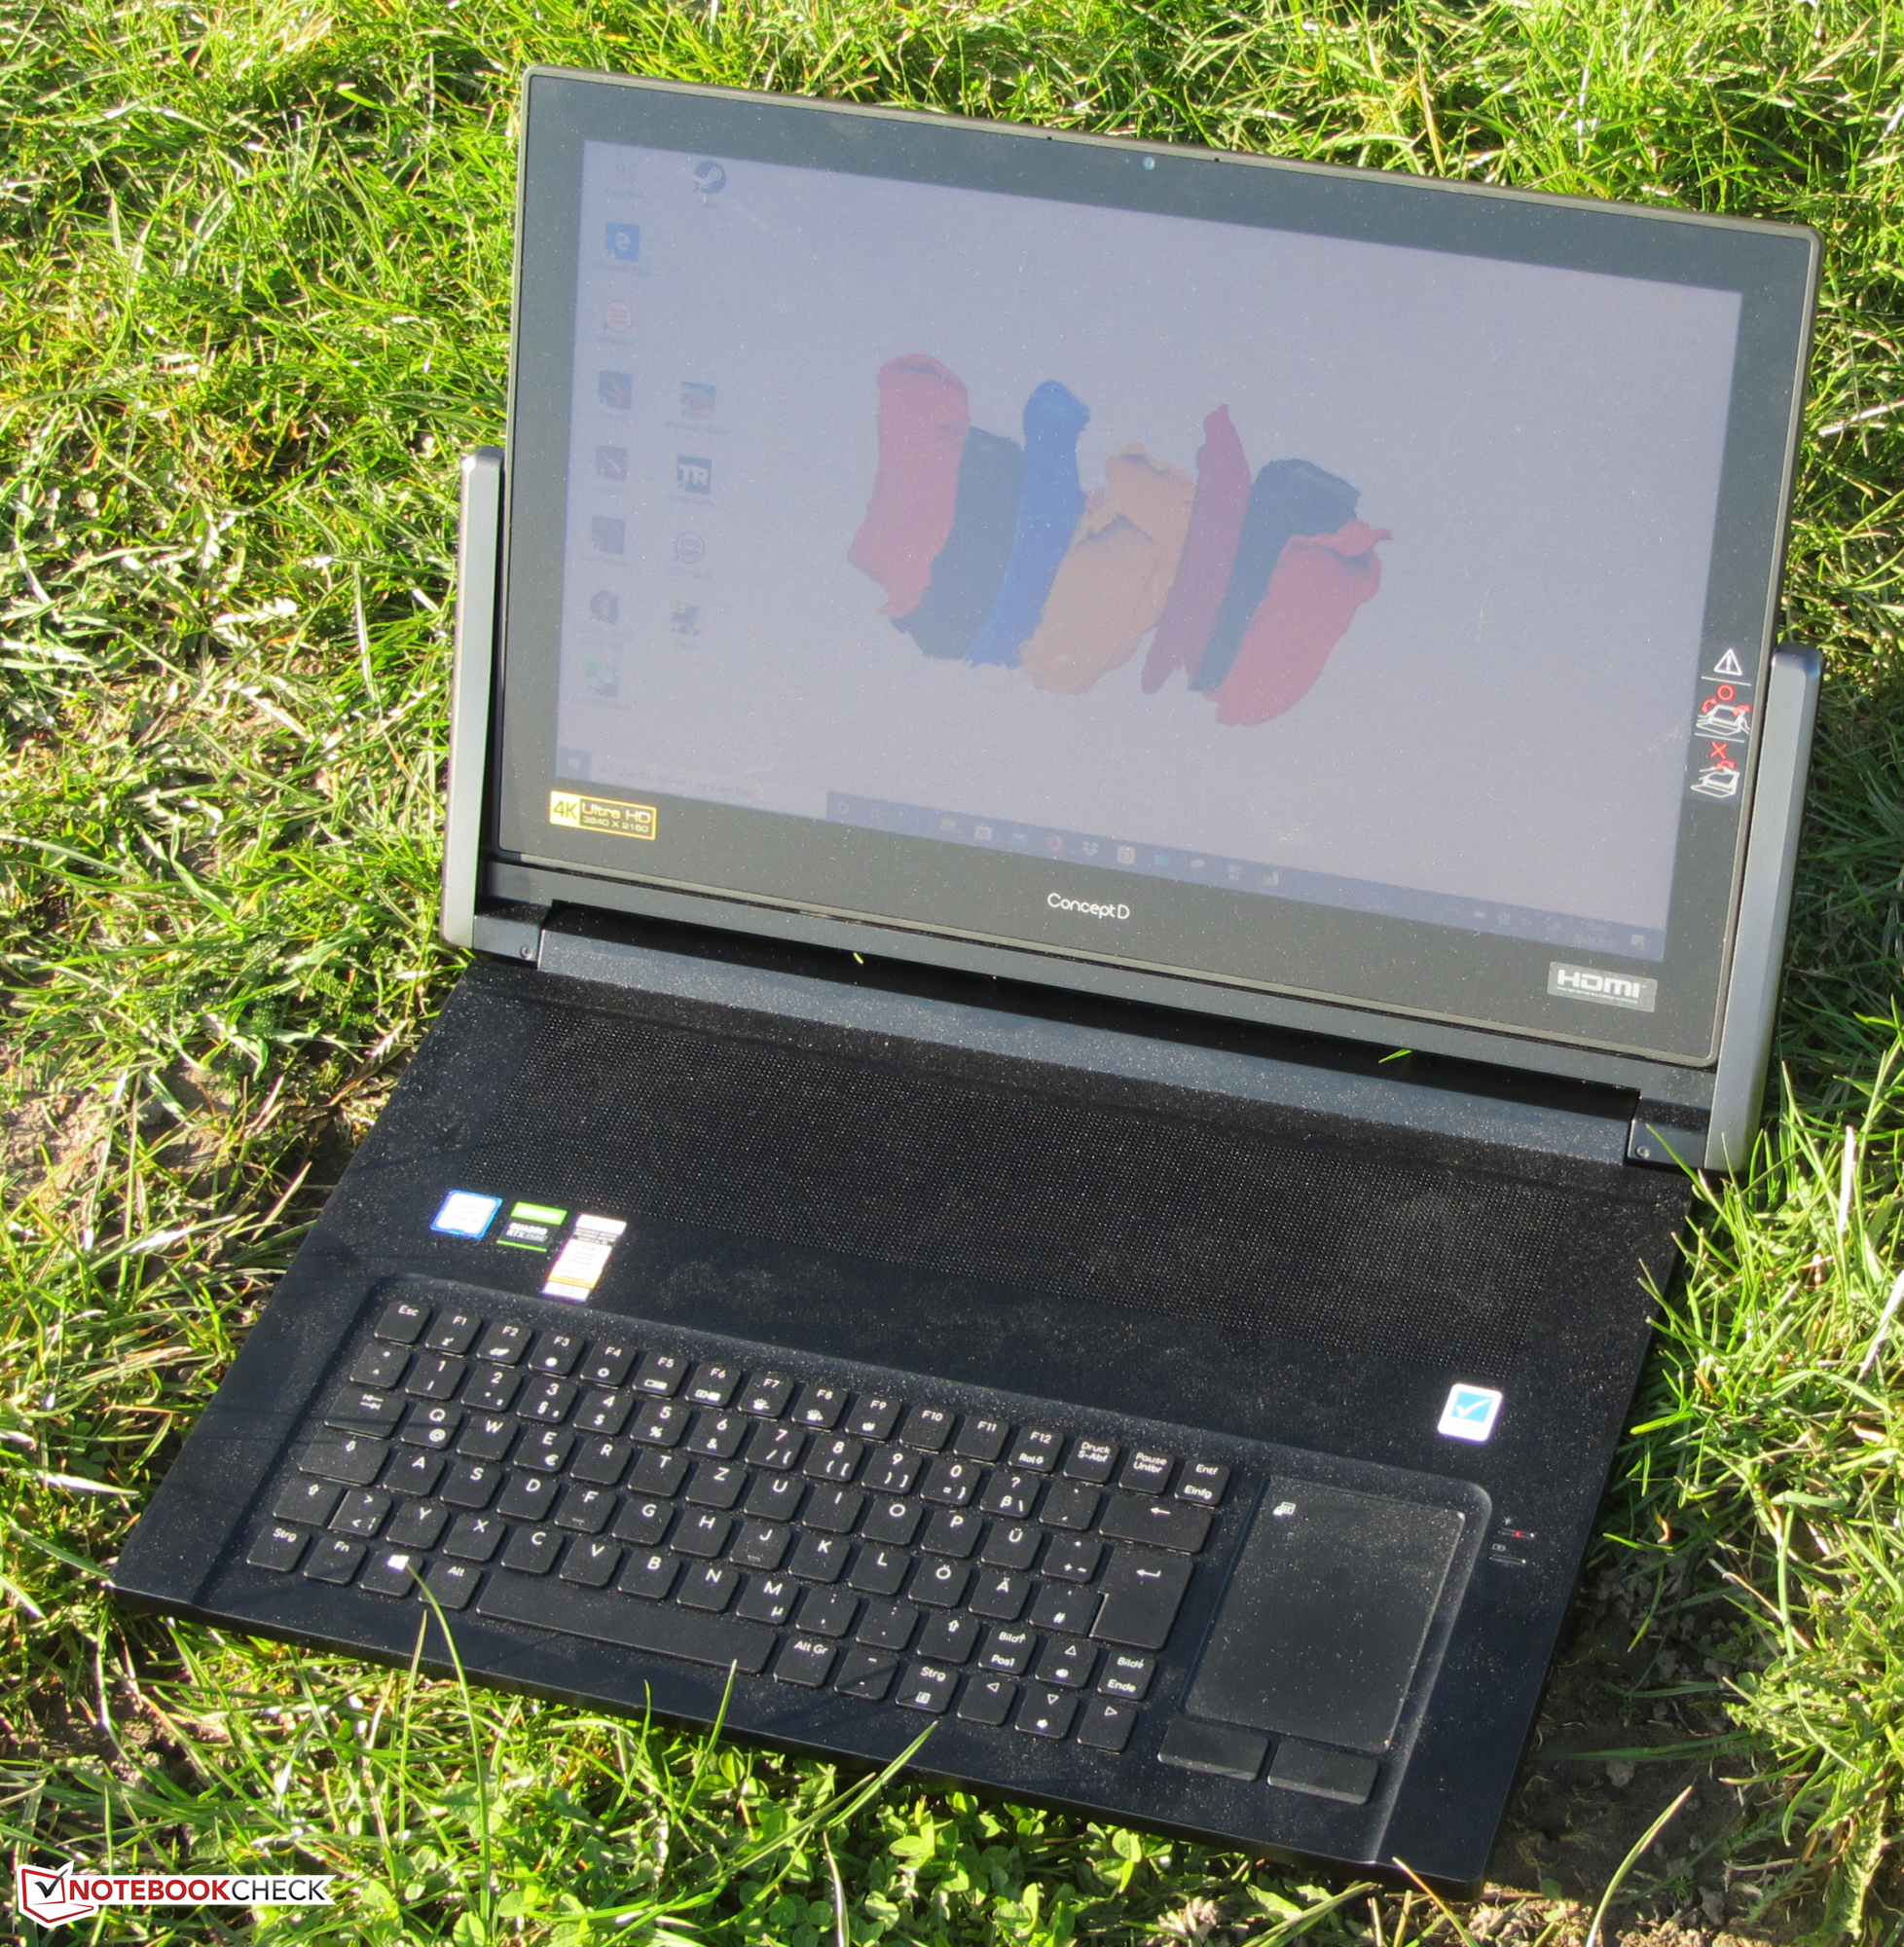
Telaio - una Workstation pesante
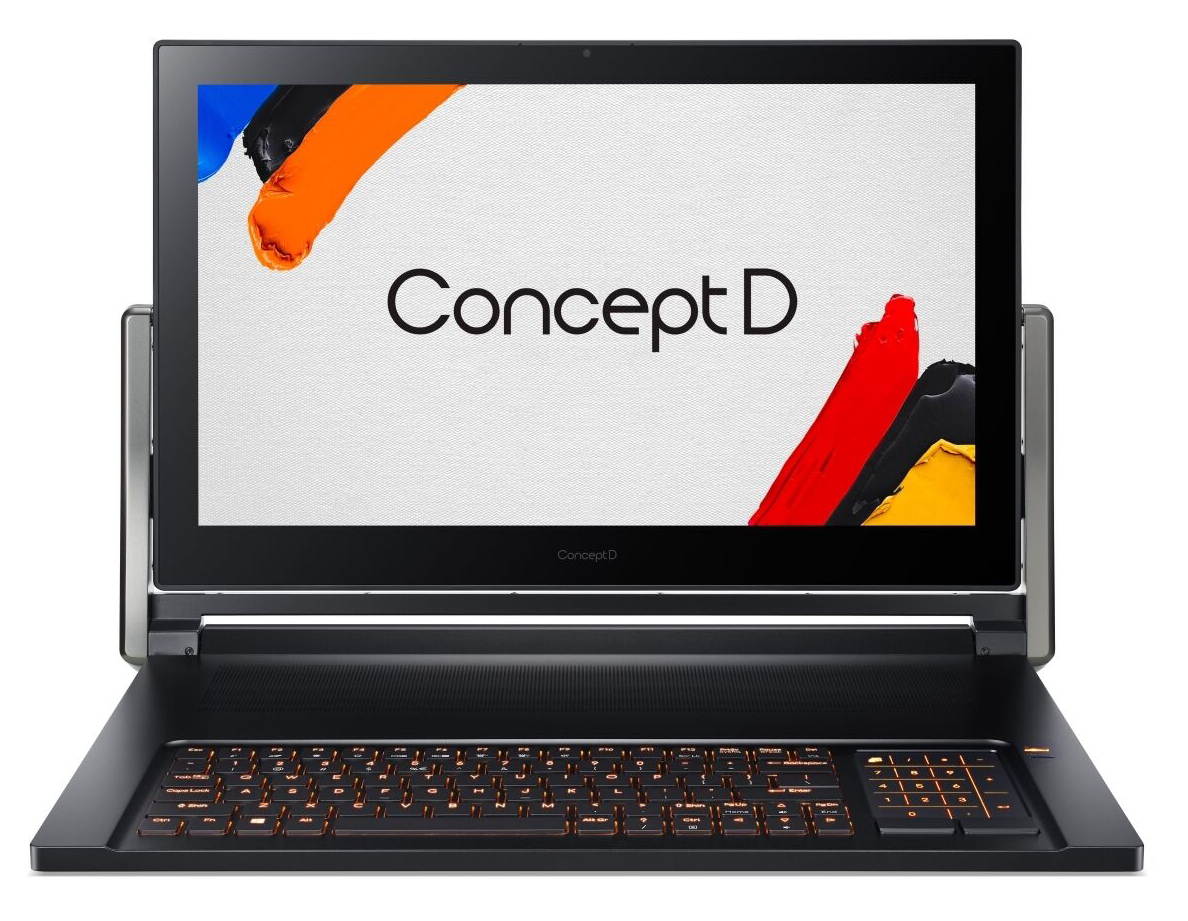
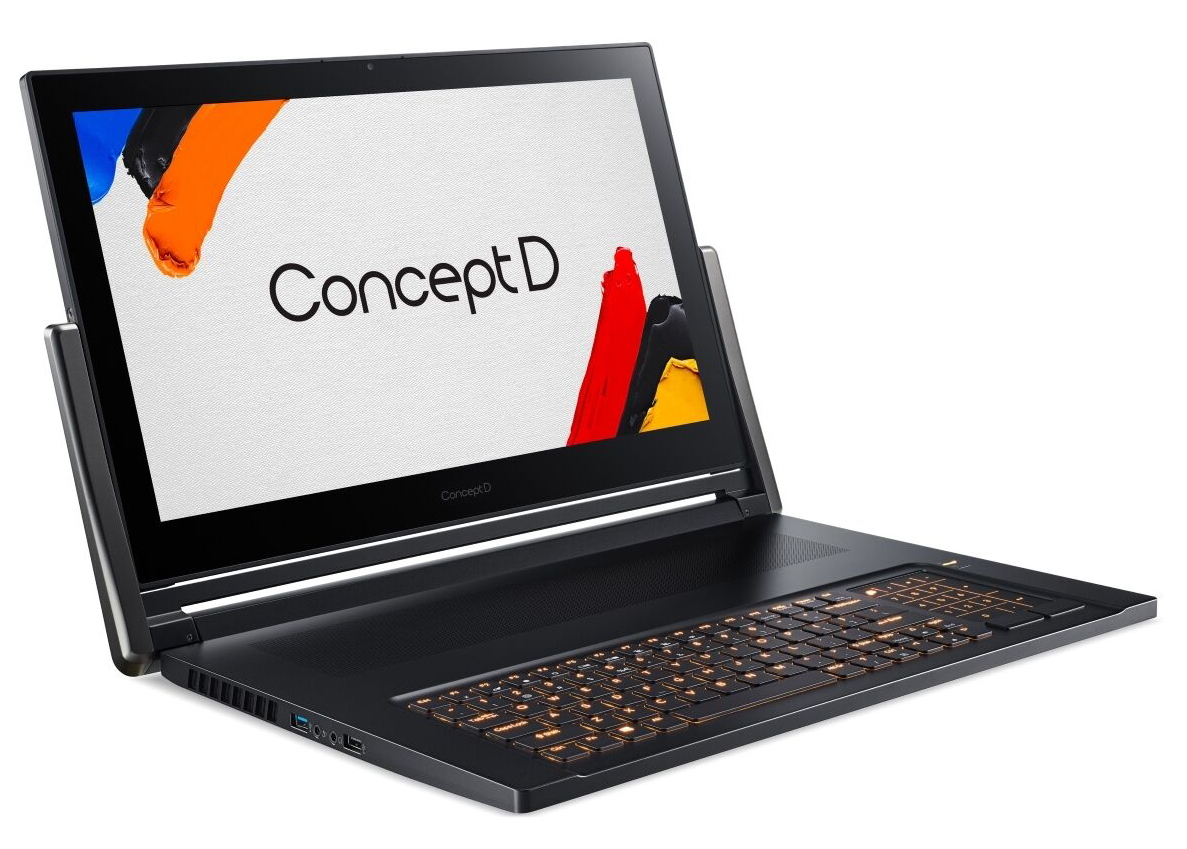
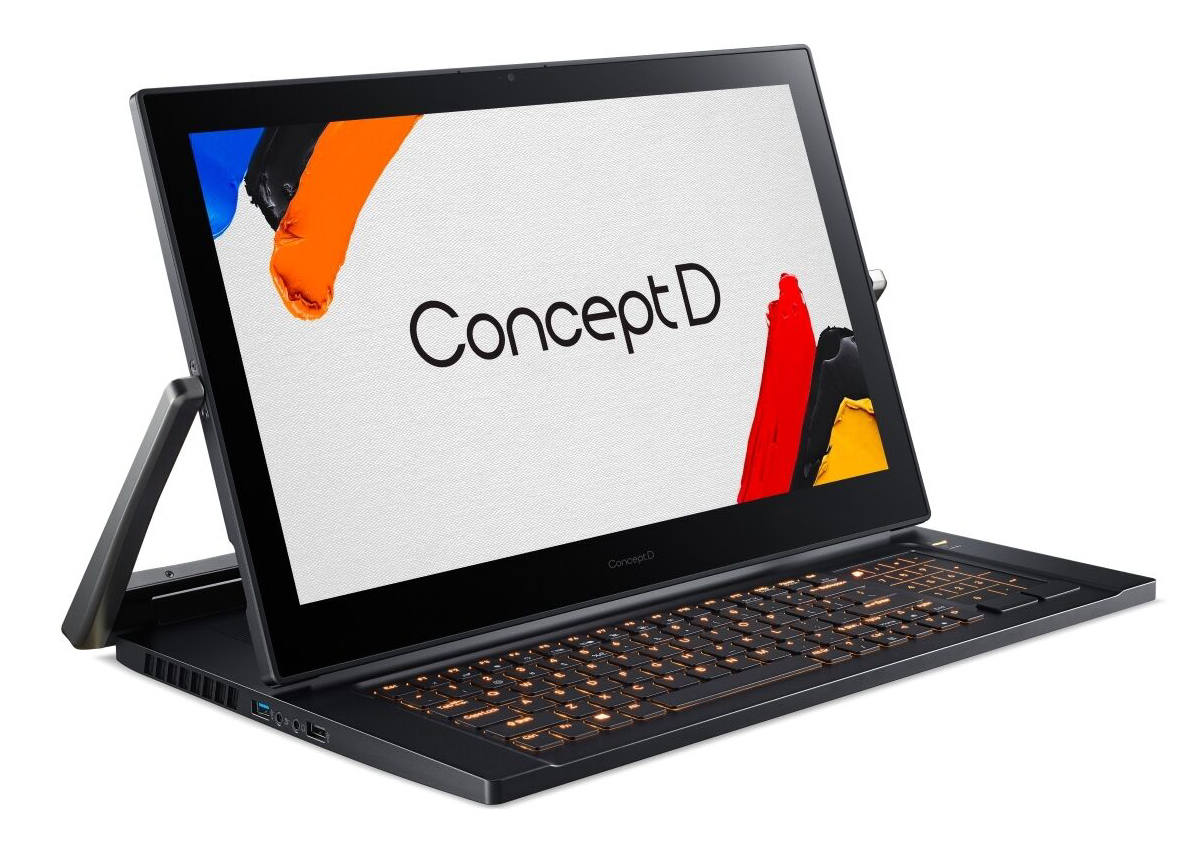
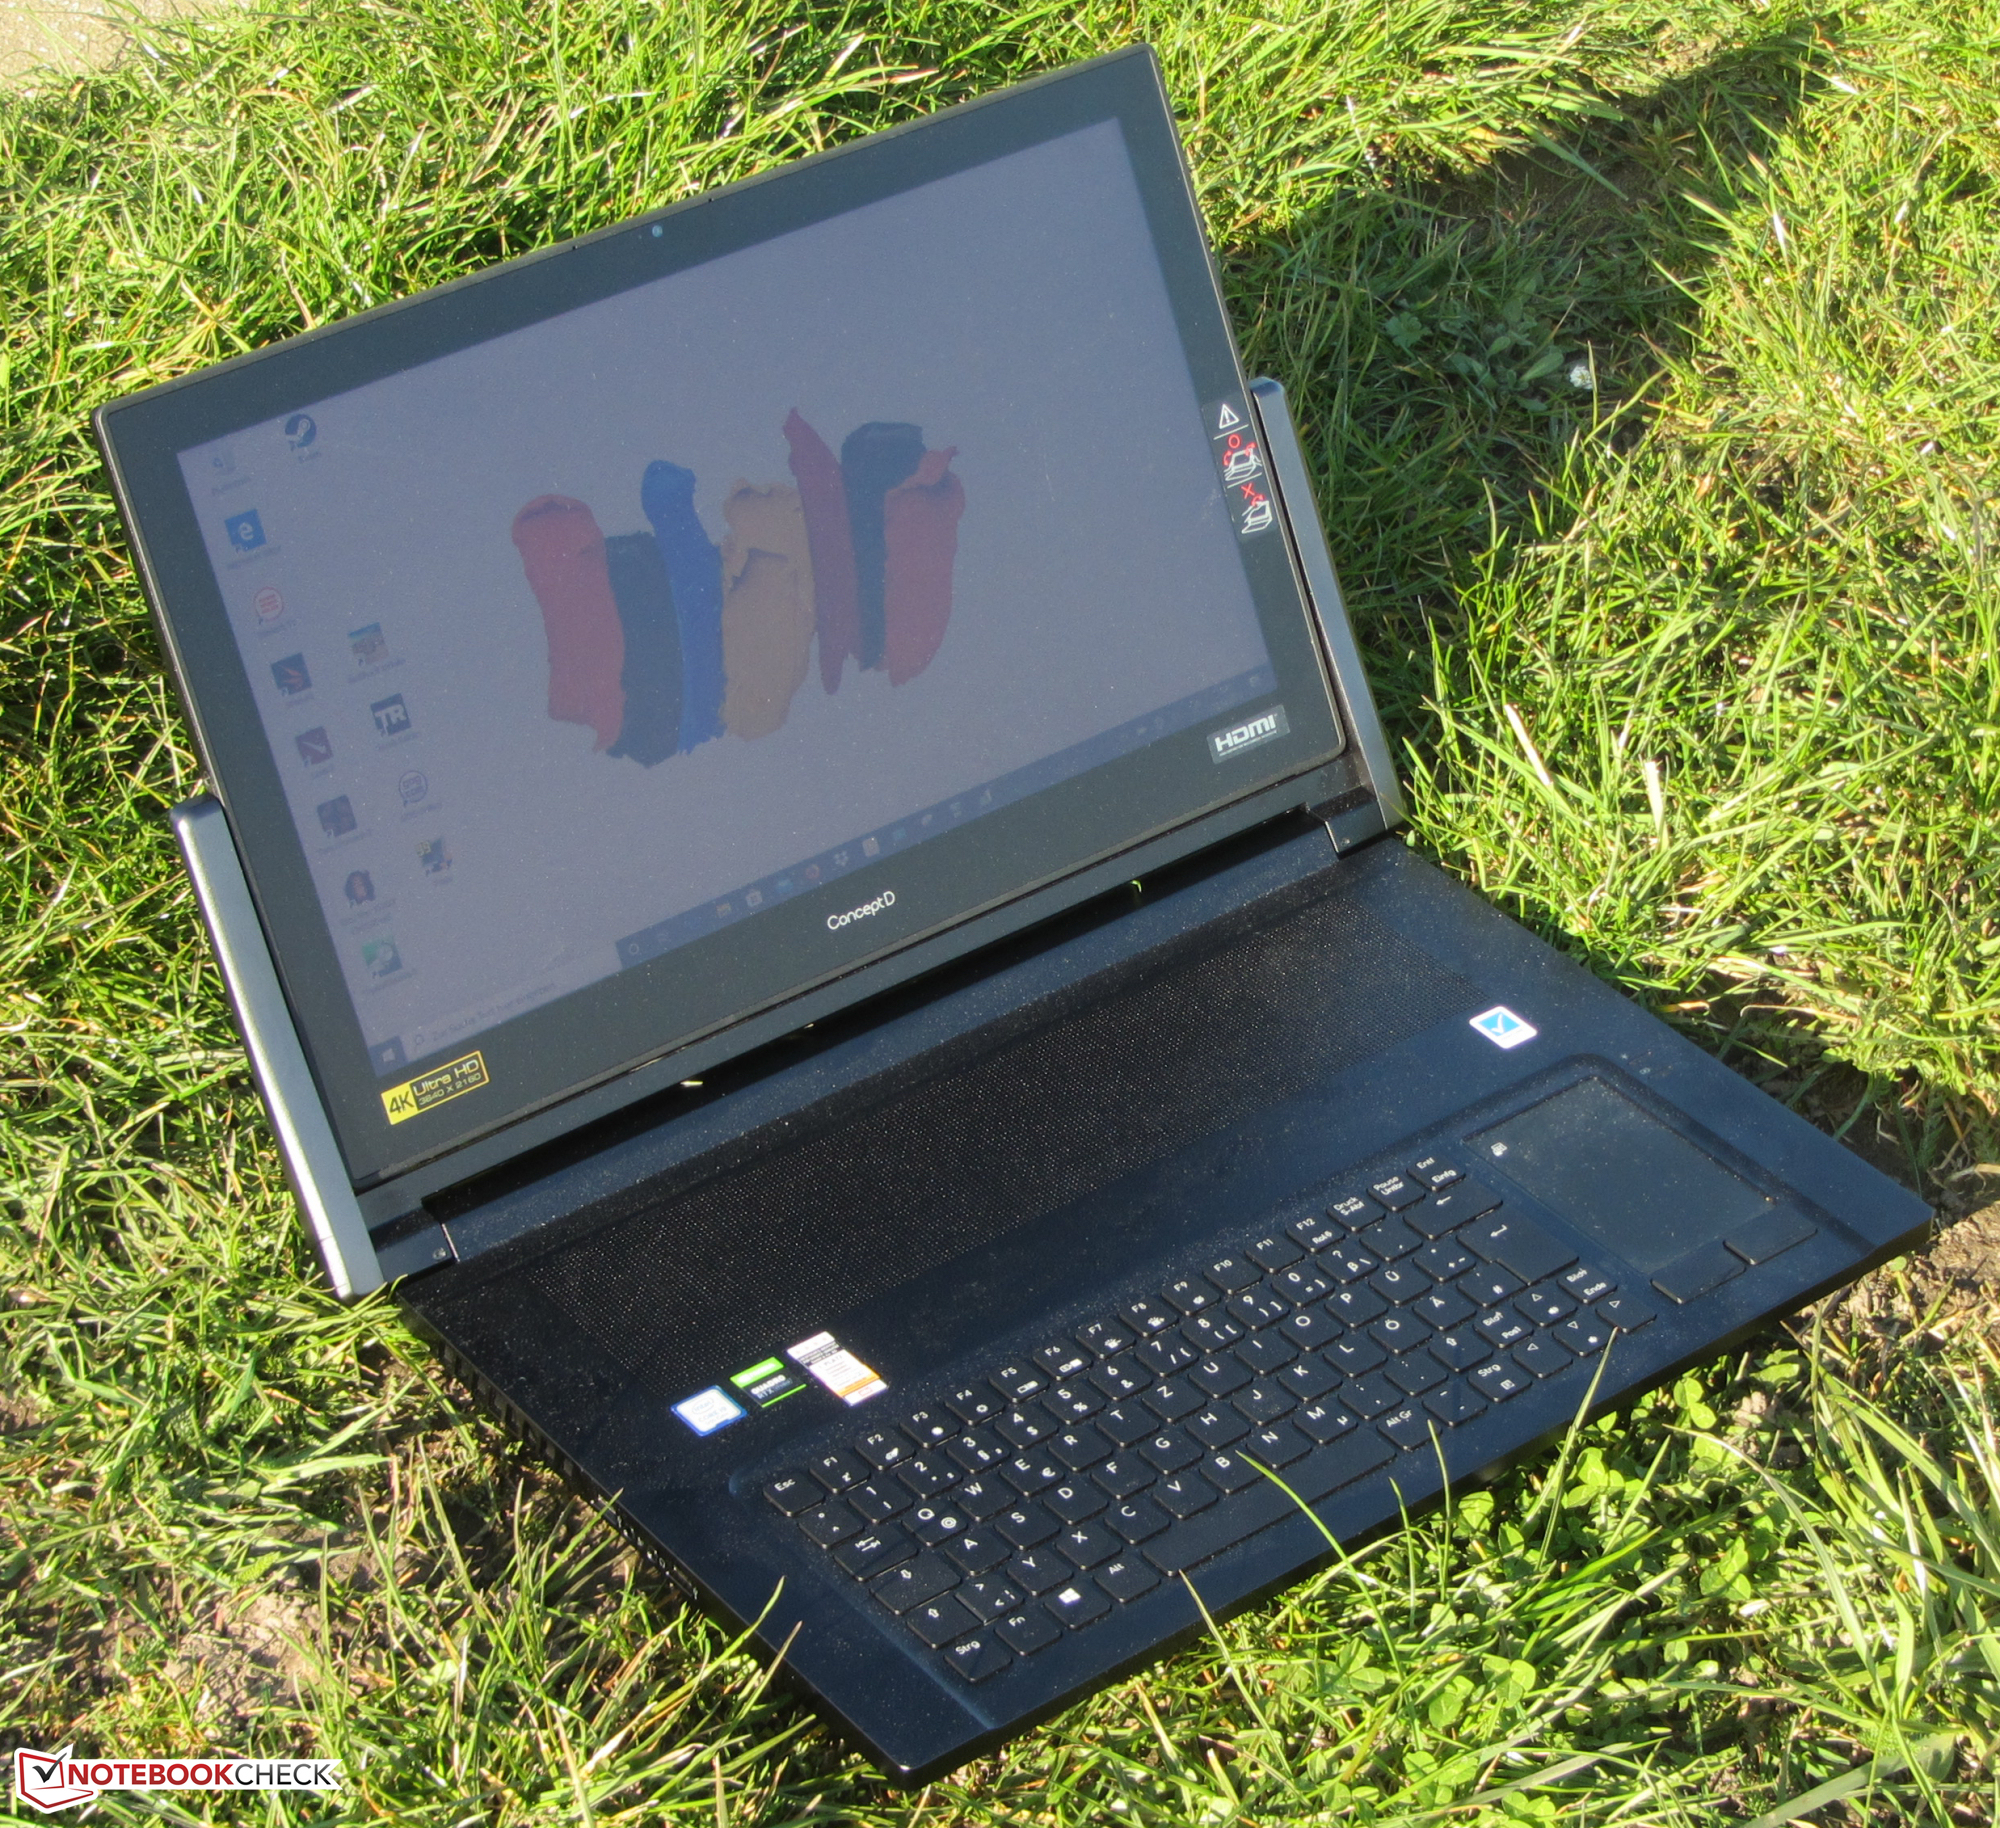
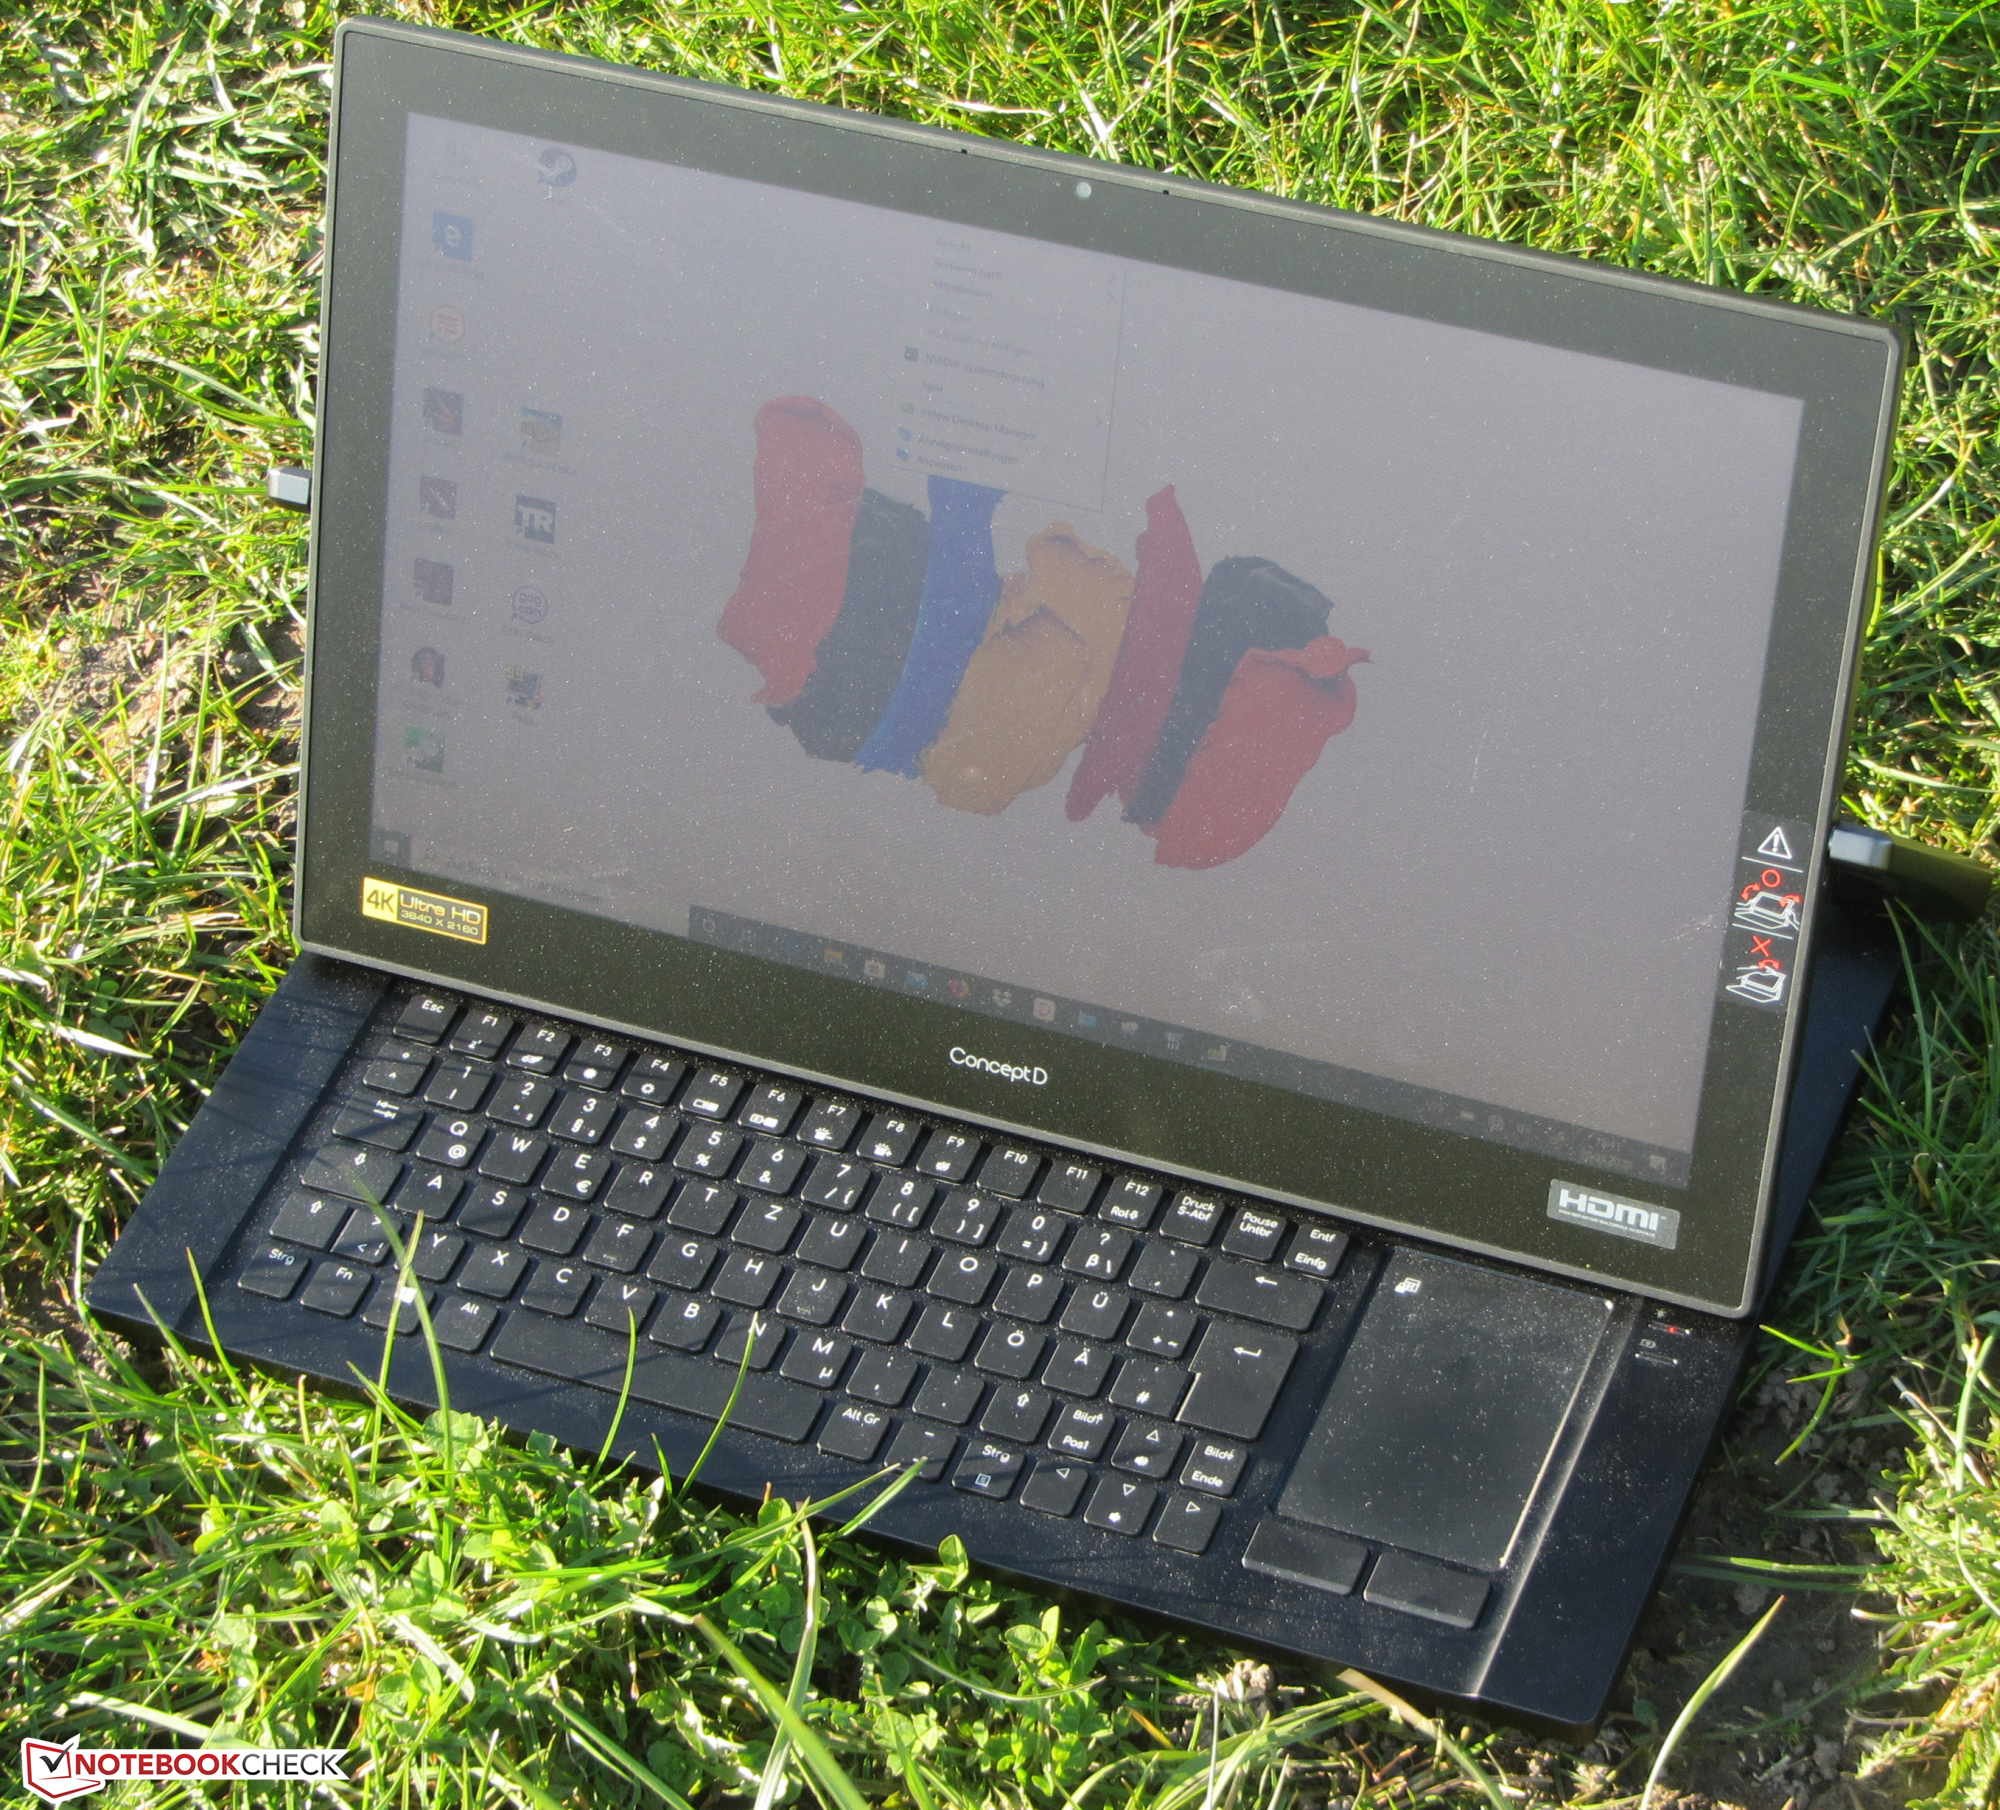
Acer ha scelto un telaio in metallo nero opaco senza fronzoli per il Concept 9 Pro. La tastiera è stata spostata nella parte anteriore dell'unità base, per fare spazio a varie posizioni del display. Il touchpad si trova a destra della tastiera. Sopra la tastiera è presente un'area perforata che facilita il flusso d'aria verso l'interno del case.
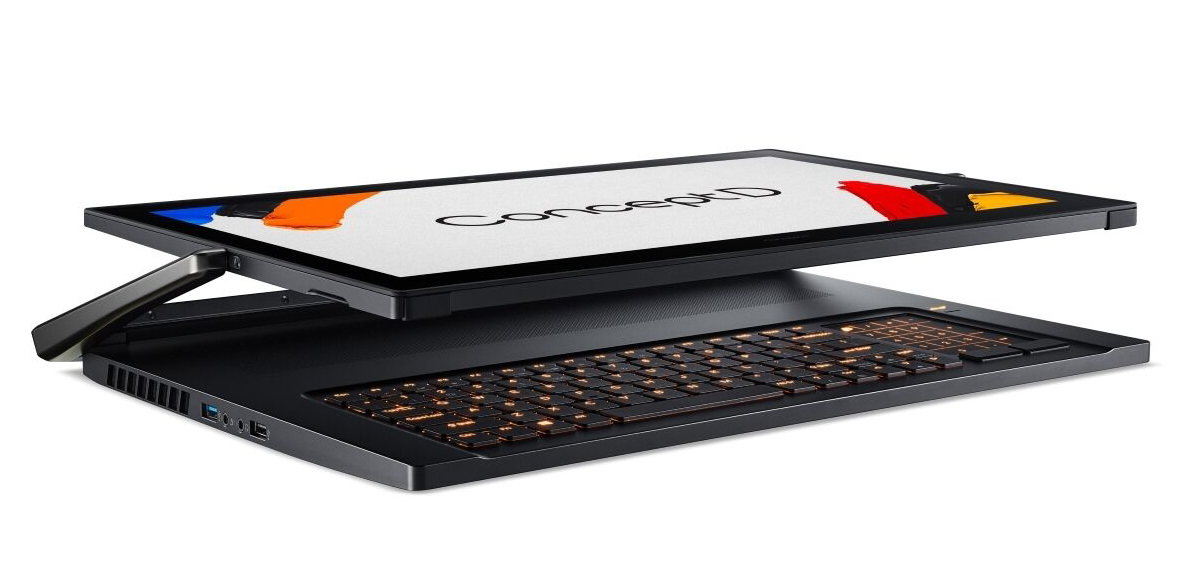
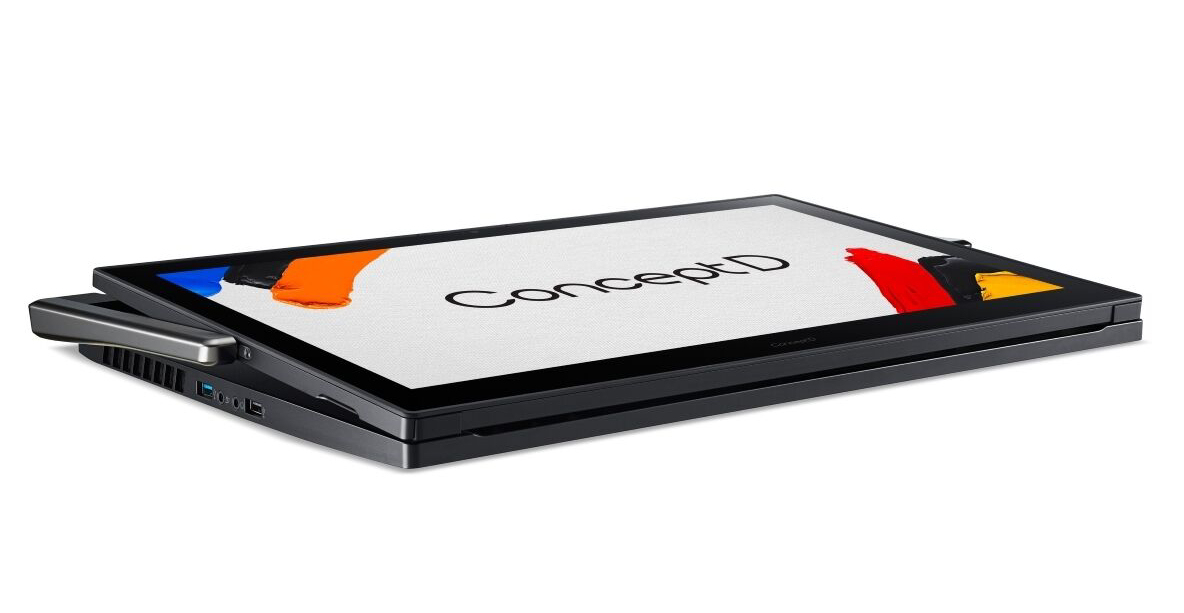
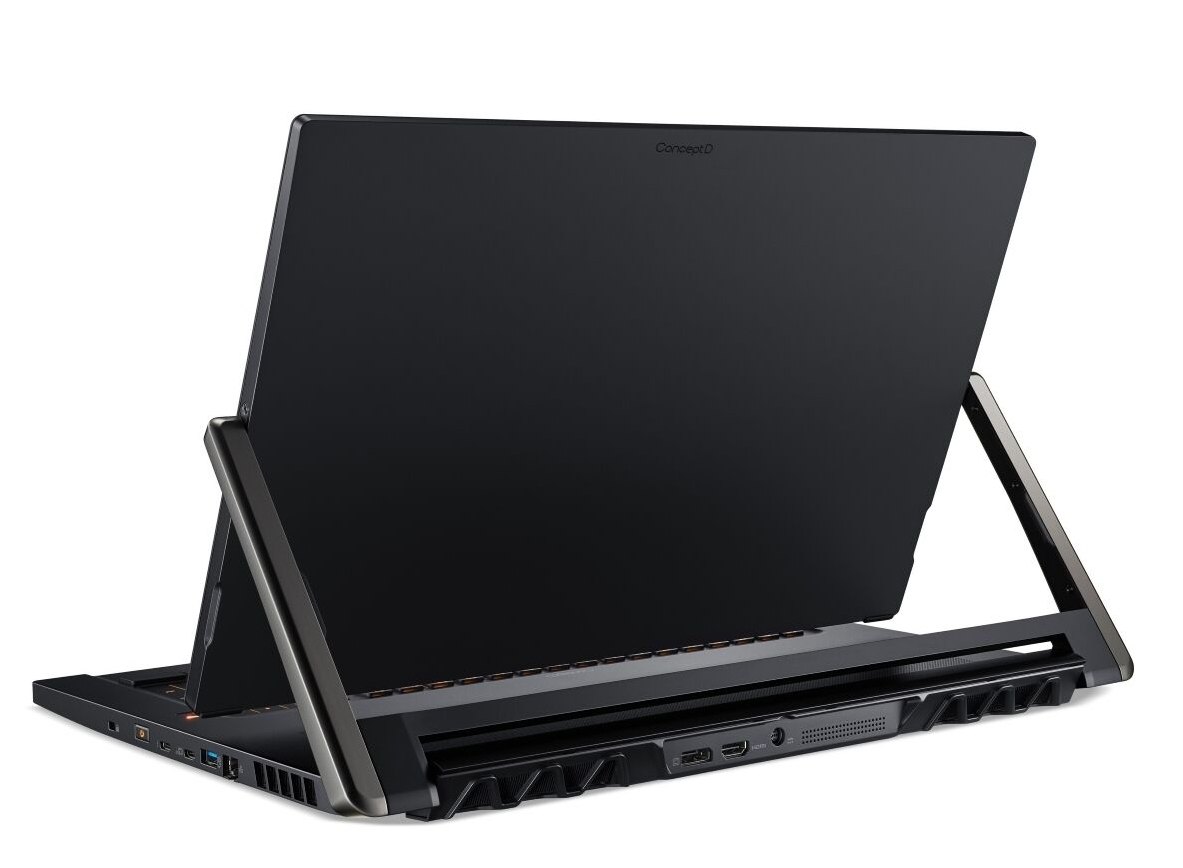
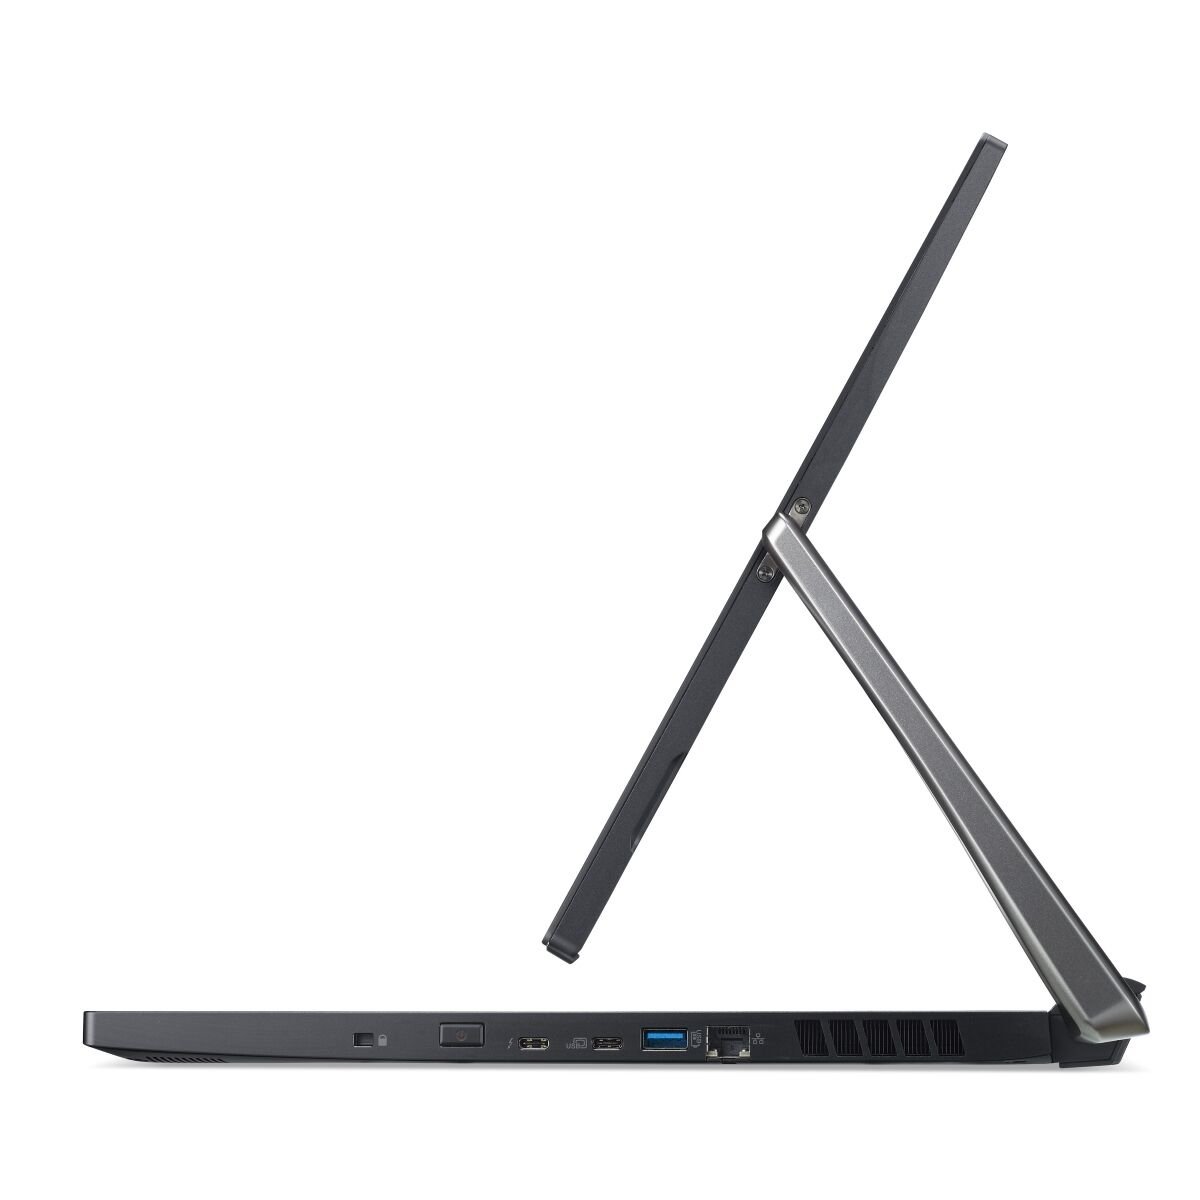
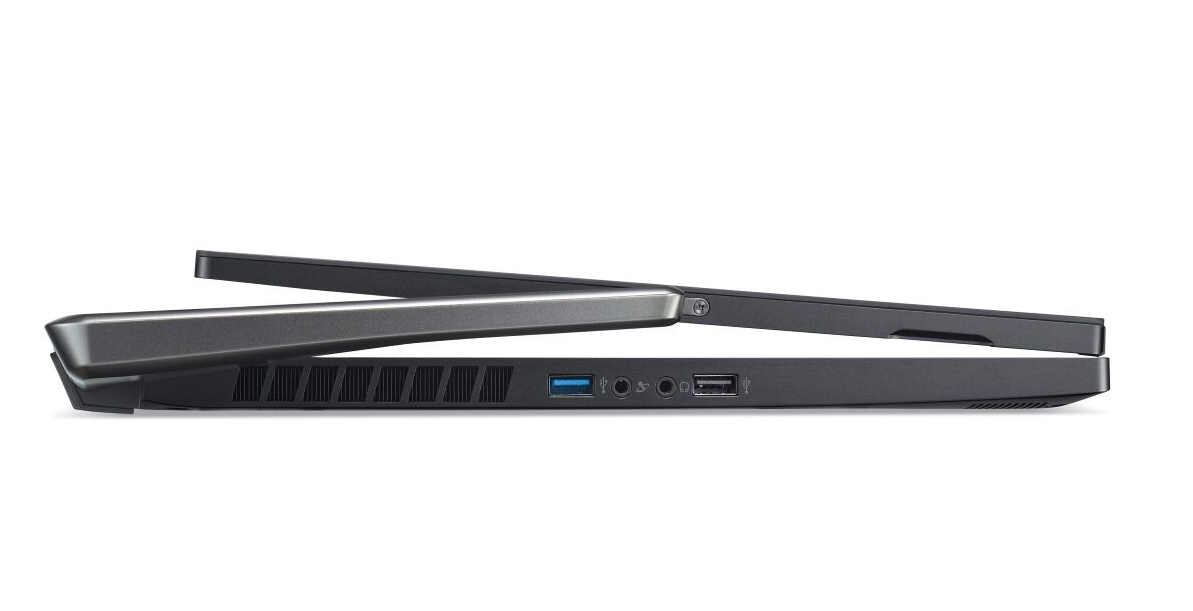
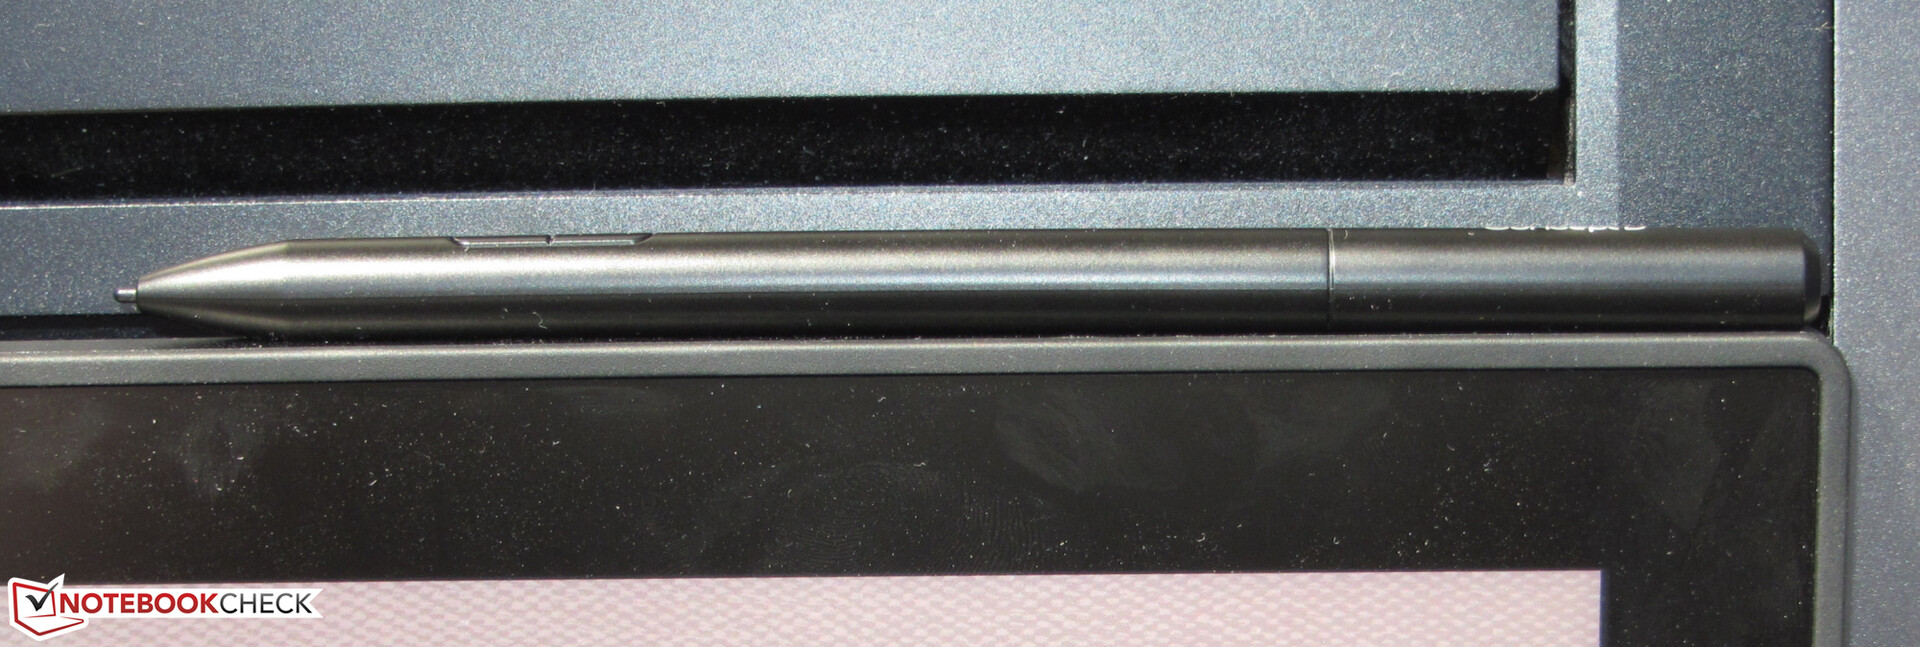
Le cerniere massicce dell'apparecchio sono piuttosto impressionanti. Esse tengono il display saldamente in posizione indipendentemente dalla sua modalità di utilizzo per consentire comodi input con la penna. La cover può essere aperta con un'angolazione massima di 110-120 gradi. Il display può anche essere ruotato di 170 gradi. In modalità tablet, non poggia in modo piatto sull'unità di base. Al contrario, è leggermente inclinato verso l'utente. La cover può essere aperto con una sola mano (quando è chiusa).
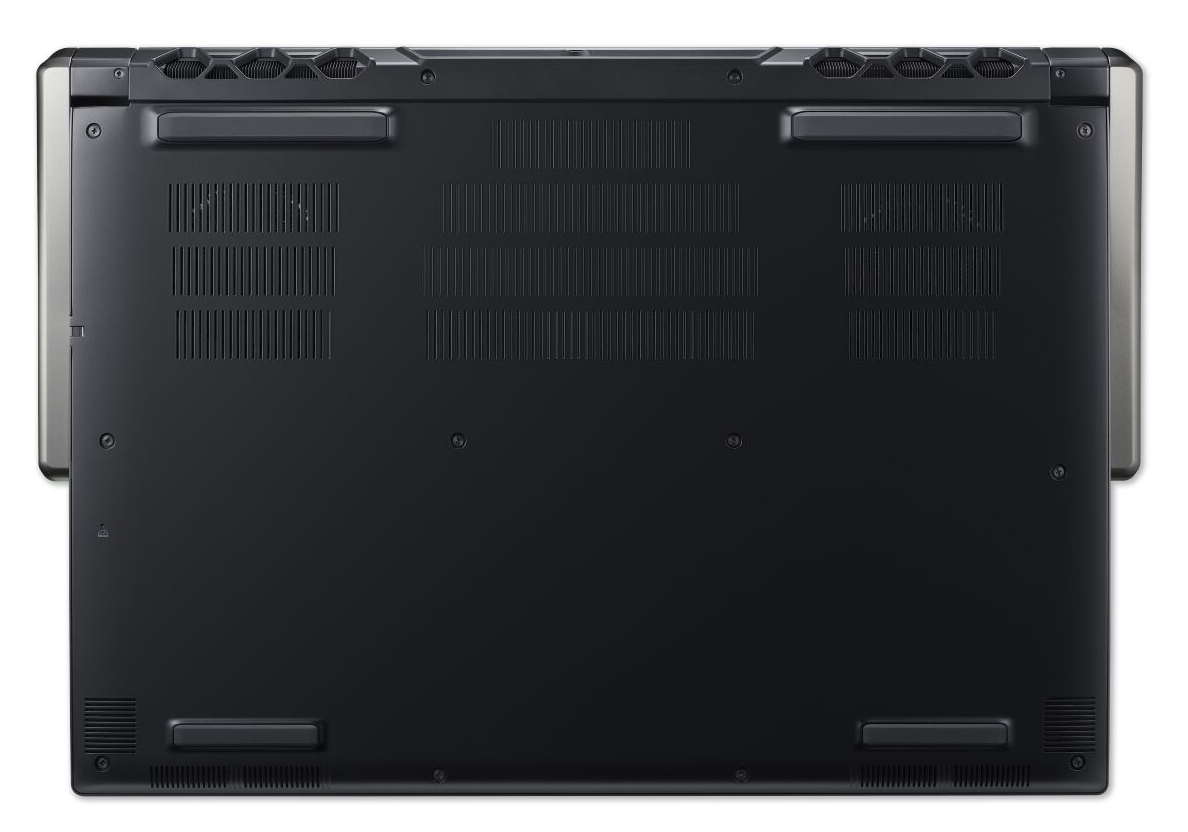
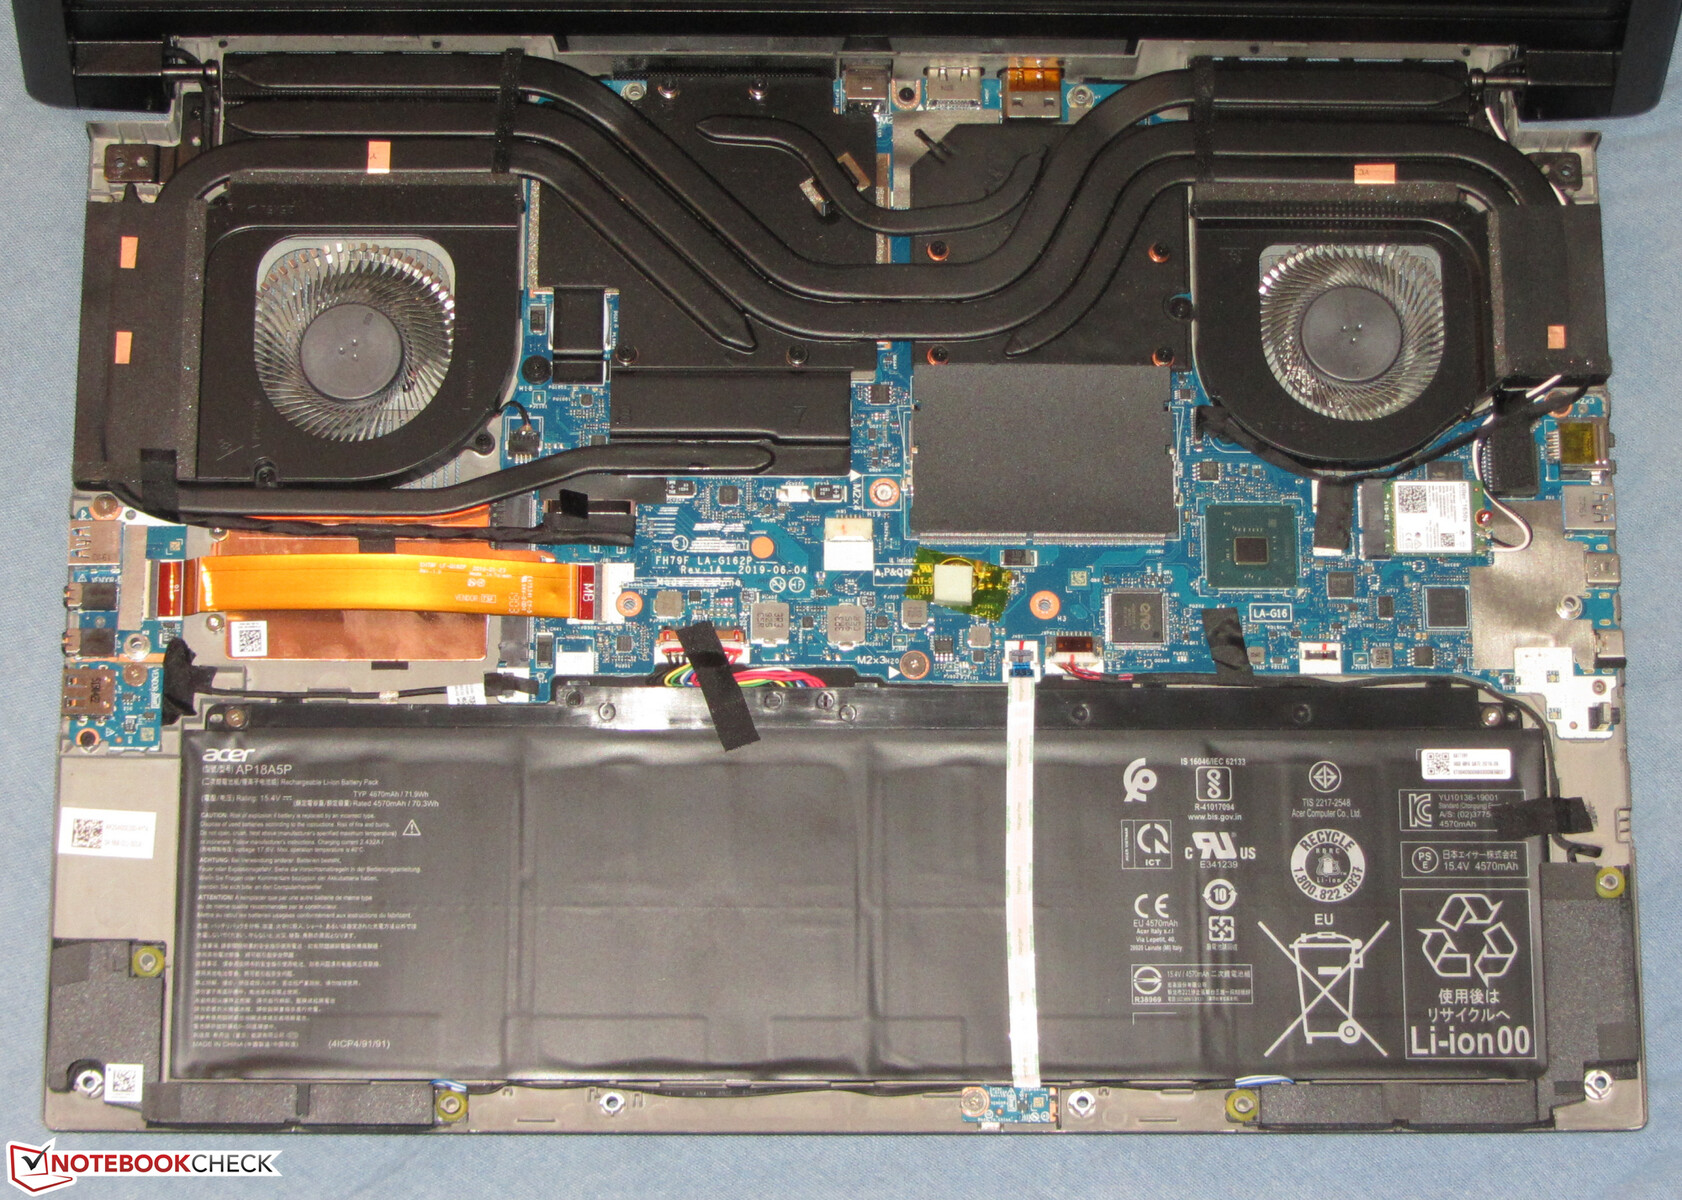
La qualità costruttiva del portatile è buona. Le intercapedini sono adeguate e non ci sono materiali superflui. Non ci sono nemmeno difetti in termini di stabilità. Nel peggiore dei casi, l'unità base e la cover possono essere solo leggermente piegati. La rigidità dell'unità base è particolarmente buona. L'applicazione di pressione sul retro dello schermo non distorce l'immagine. La batteria è fissa. Non c'è un portello di manutenzione. Per arrivare all'interno, è necessario aprire il case. Di seguito troverete ulteriori informazioni.
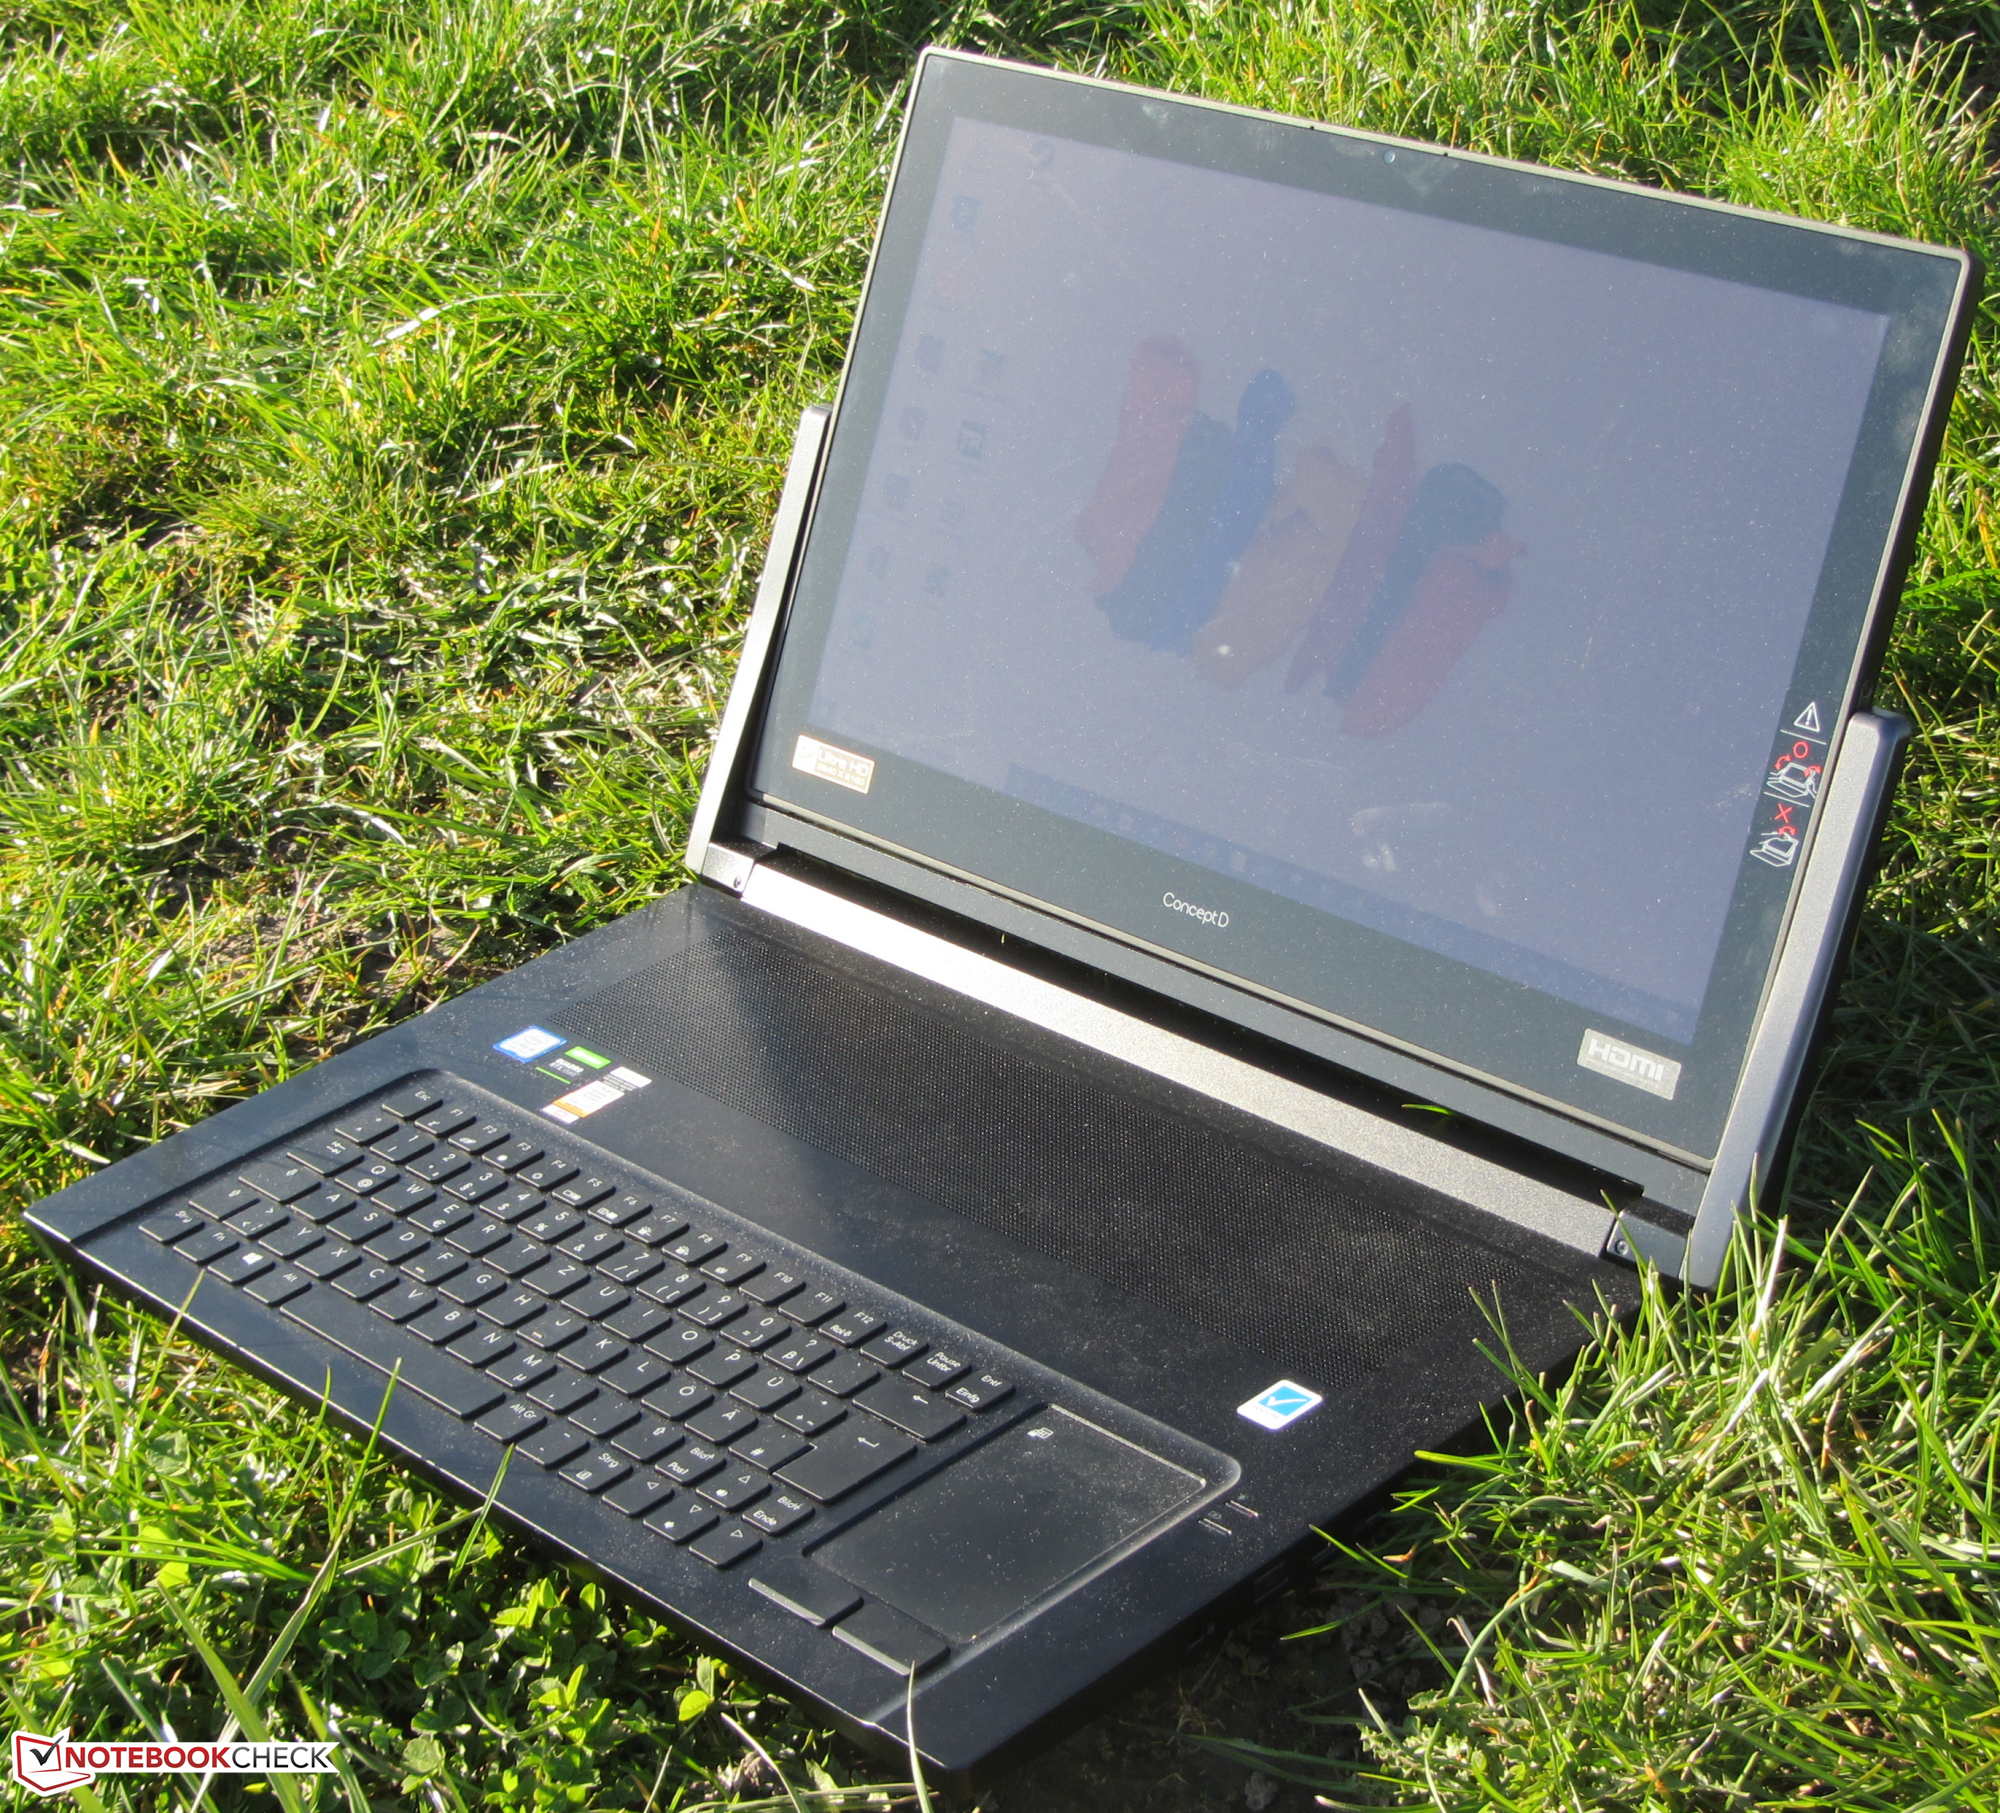
Con un peso 4,5 kg, questa workstation Acer non è esattamente un dispositivo leggero. La maggior parte dei concorrenti che abbiamo selezionato pesano circa 1 o 2 kg in meno. L'Eurocom Tornado F7W è l'unico altro dispositivo che supera i 4 kg. Inoltre non dovrebbe sorprendere che le dimensioni del ConceptD siano più grandi di quelle della maggior parte dei concorrenti. Il Tornado F7W ha il case più spesso e meno compatto in termini di superficie occupata.
Funzioni - ConceptD con Thunderbolt 3
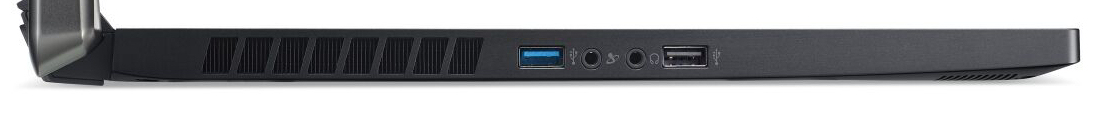
Il portatile Acer offre una selezione di porte ben assortita. Ci sono tre porte USB Type-A (2x USB 3.2 Gen 1, 1x USB 2.0) e due porte USB Type-C (1x USB 3.2 Gen 1, 1x Thunderbolt 3) disponibili sulla workstation. Entrambe le porte USB Type-C supportano la funzione DisplayPort via USB-C (sebbene ciò richieda un adattatore). In combinazione con la DisplayPort dedicata e la porta HDMI, questo porta la workstation ad un totale di quattro uscite video. Inoltre, due prese audio (uscita cuffie, ingresso microfono), una porta Gigabit Ethernet e uno slot di blocco completano il pacchetto. Nel frattempo, manca un lettore di schede.
Le porte sono distribuite sul lato destro e sinistro e sul retro. Le porte sui lati sono centrate. Di conseguenza, è improbabile che i cavi si mettano in mezzo quando si usa un mouse esterno.


Comunicazioni
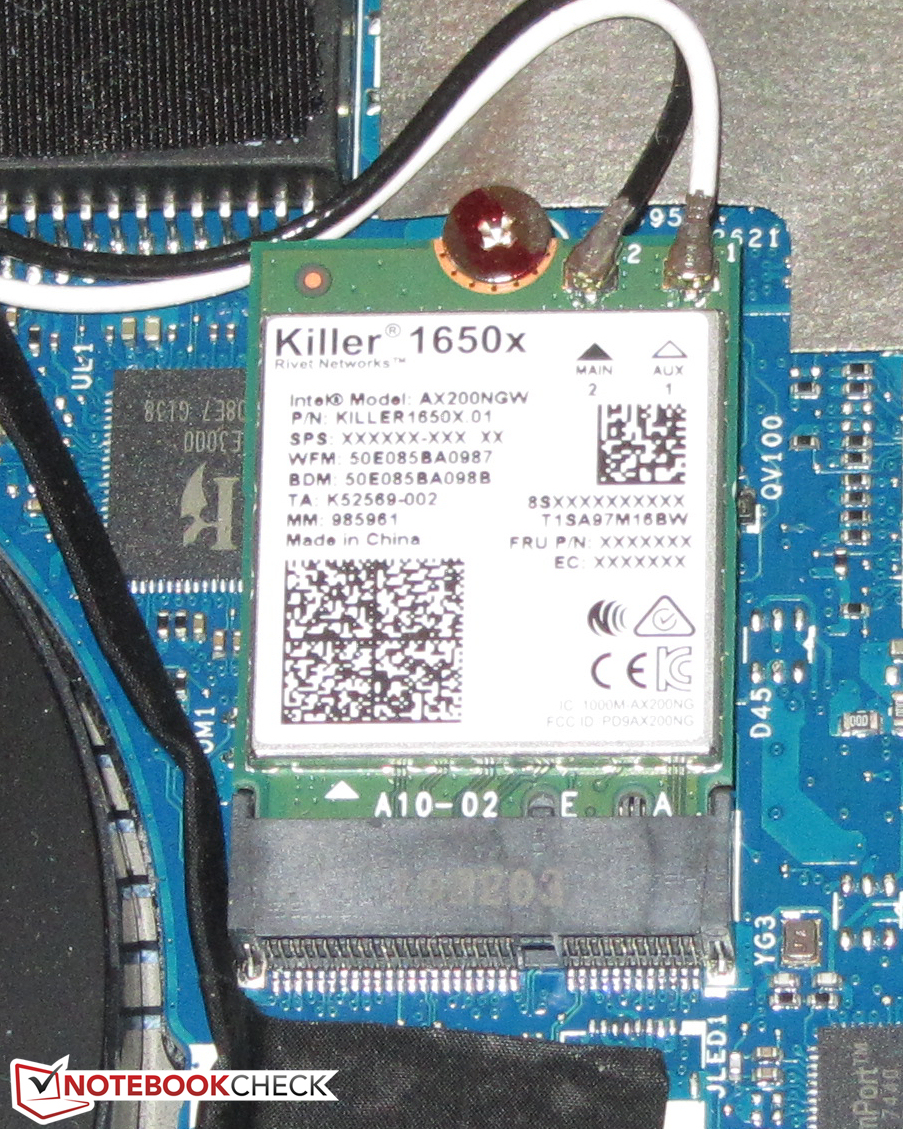
Oltre agli standard Wi-Fi 802.11a/b/g/n/ac, il modulo Wi-Fi Killer supporta anche lo standard più veloce ax. In condizioni ottimali (nessun altro dispositivo Wi-Fi in prossimità, breve distanza tra il laptop e il server), abbiamo registrato un'ottima velocità di trasferimento. Un controller Killer E3000 Gigabit Ethernet è responsabile del collegamento in rete cablato. Non ci sono stati problemi durante i nostri test.
Webcam
La webcam 2.1-MP integrata può scattare foto con una risoluzione massima di 1920x1080 pixel. I risultati sono discreti. Tuttavia, la precisione del colore lascia a desiderare. La sua deviazione di 33,6 è significativamente al di sopra della gamma ideale (DeltaE inferiore a tre).

, i9-9980HK, WDC PC SN720 SDAQNTW-1T00")
, i9-9980HK, WDC PC SN720 SDAQNTW-1T00")
Accessori
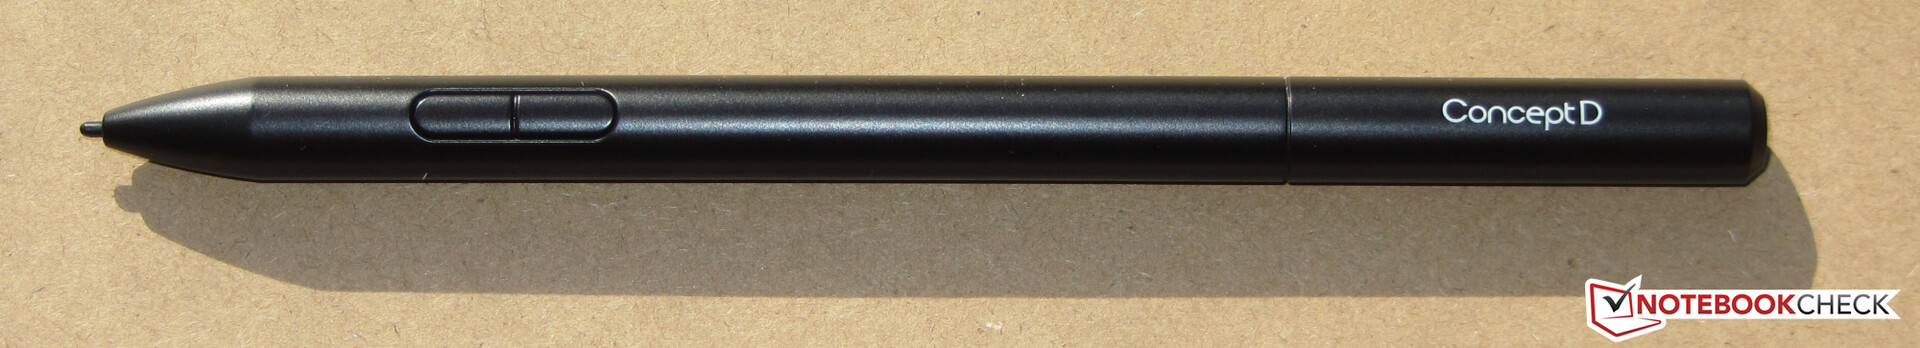
Oltre ai consueti accessori (informazioni sulla garanzia, guida rapida), il ConceptD include anche una penna digitale Wacom.
Manutenzione
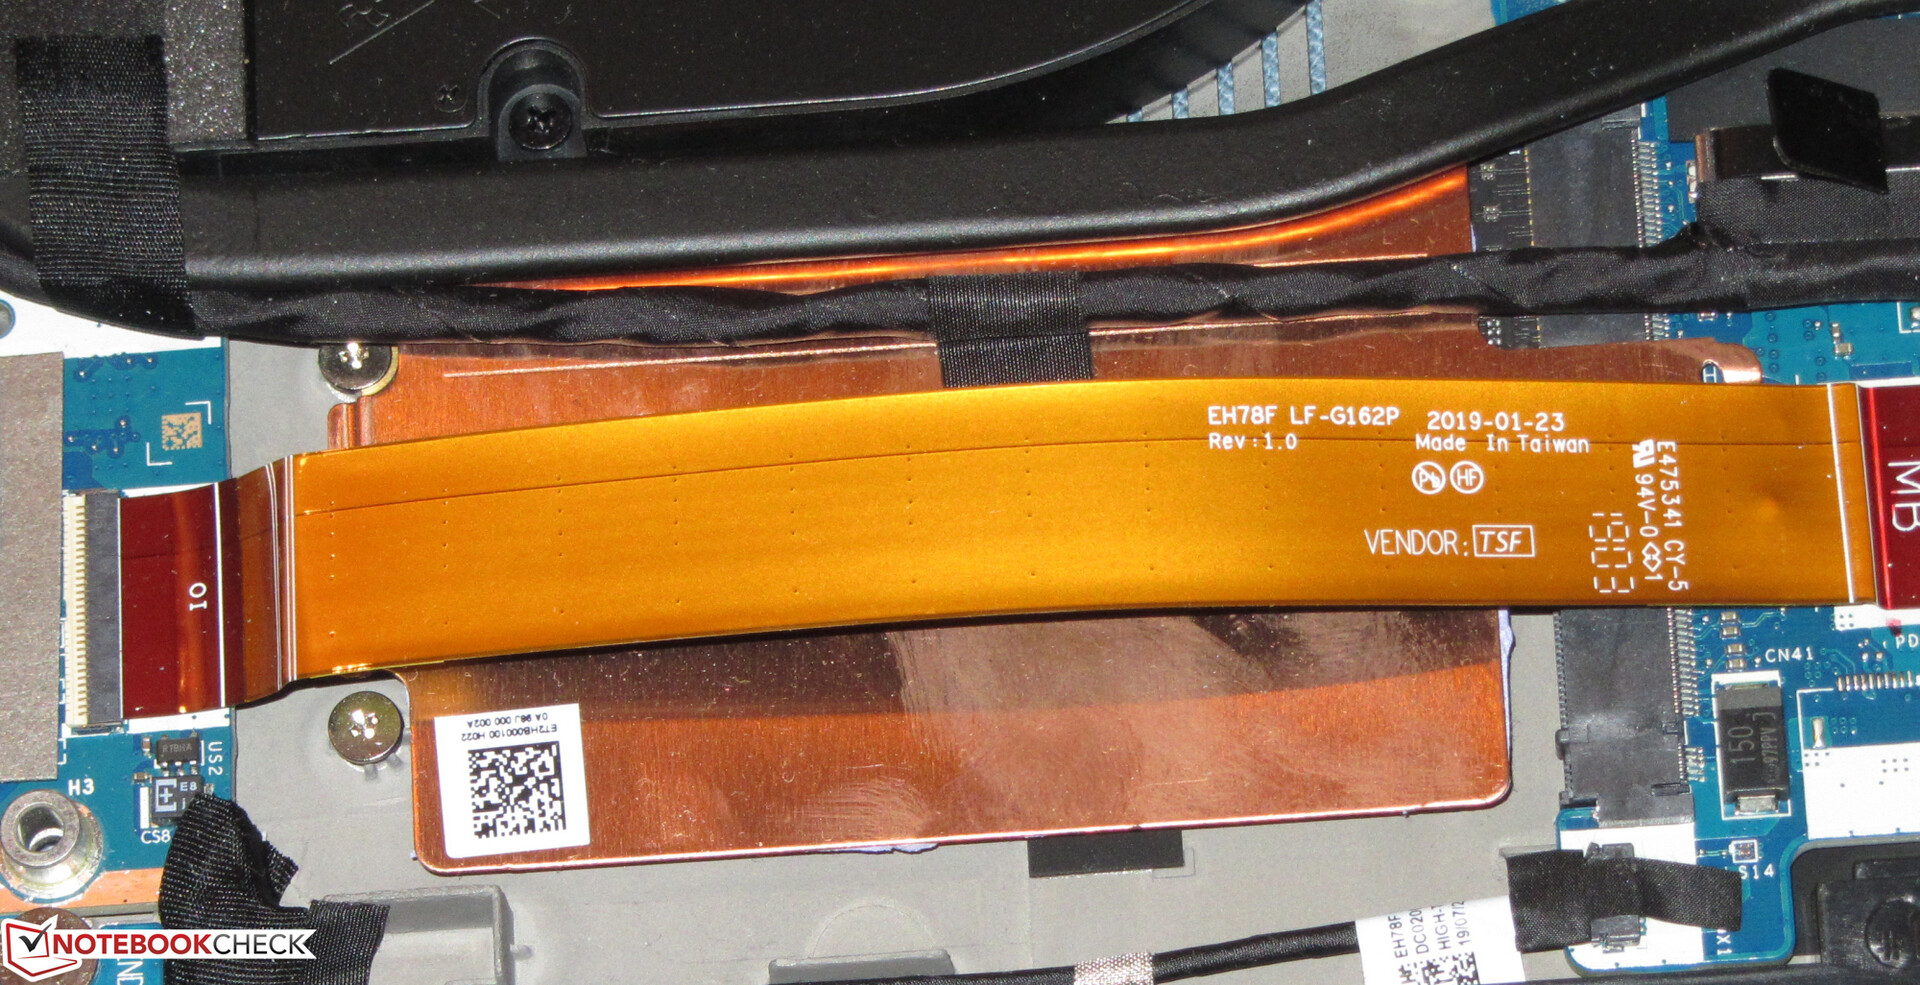
Non c'è un portello di manutenzione disponibile su questa workstation. Per raggiungere i componenti, il pannello superiore deve essere rimosso. Questo può essere fatto allentando tutte le viti sul fondo del dispositivo e successivamente rimettendo il dispositivo sui suoi piedini. Anche se il pannello superiore può essere sollevato in questo punto, non può ancora essere staccato completamente, poiché è ancora trattenuto da clip di plastica sopra le bocchette di scarico sul retro. Le clip possono essere rimosse spostando con attenzione la parte superiore avanti e indietro. Attenzione: La parte superiore del telaio sarà ancora collegata alla scheda madre attraverso due cavi in questo punto. Essi devono essere scollegati prima che il telaio possa essere aperto completamente.
Garanzia
Acer offre agli acquirenti del ConceptD una garanzia di due anni - incluso il servizio di ritiro e consegna. La garanzia include anche il servizio Predator Premium Service. Con questo servizio, Acer promette di controllare e riparare un dispositivo difettoso entro 72 ore.
Dispositivi di Input - Penna Digitale Wacom inclusa nel CN917-71P
Tastiera
Acer ha dotato quest dispositivo di una tastiera chiclet retroilluminata. La "retroilluminazione calda e ambrata" (citazione da un comunicato stampa di Acer) può essere controllata tramite due tasti funzione. I tasti della tastiera sono piatti, lisci e offrono una corsa poco profonda con un punto di azionamento distinto che non solo può essere percepito, ma anche sentito abbastanza chiaramente. I singoli tasti hanno un feedback di clic. Di conseguenza, la tastiera non è adatta per l'uso in ambienti silenziosi.
La tastiera non ha una disposizione standard. Non tutti i tasti si trovano nella posizione abituale. Alcuni dei tasti che di solito formano la fila superiore del numpad, sono stati integrati nell'area principale della tastiera. Inoltre, la dimensione dei tasti shift è piuttosto piccola. Di conseguenza, ci siamo spesso trovati a cercarli sulla tastiera. Poiché la tastiera si trova vicino al bordo anteriore dell'unità base, non ci sono poggiapolsi. Quindi, la digitazione non è mai un'esperienza veramente comoda.
Touchpad
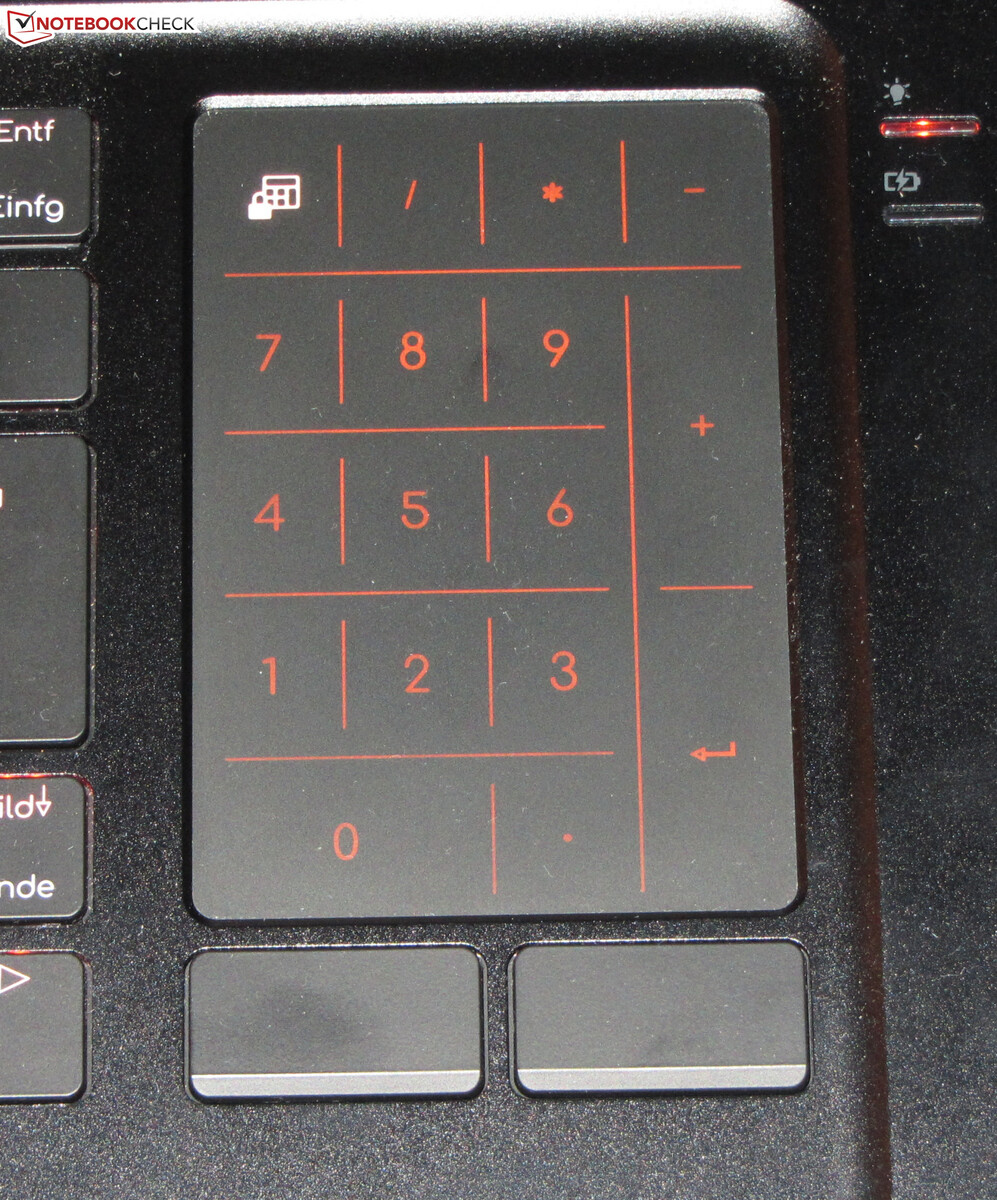
Il touchpad multi-touch si estende su un'area di circa 6,2x9 cm (~2,44x3,54 in). La superficie liscia non ostruisce le dita quando vi si scivola sopra. Il touchpad risponde con precisione agli input fino agli angoli. Sotto il touchpad, ci sono due pulsanti del mouse dedicati che offrono una corsa media e un feedback distinto. Infine, sul touchpad può essere visualizzato un tastierino numerico.

Touchscreen
Il touchscreen supporta 10 punti multi-touch e risponde prontamente agli input. Non abbiamo riscontrato alcun problema durante la nostra recensione. Lo schermo può essere utilizzato sia con un dito che con la penna digitale Wacom inclusa. La penna digitale pesa 13 grammi e rileva 4096 livelli di pressione.
Display - 4K IPS
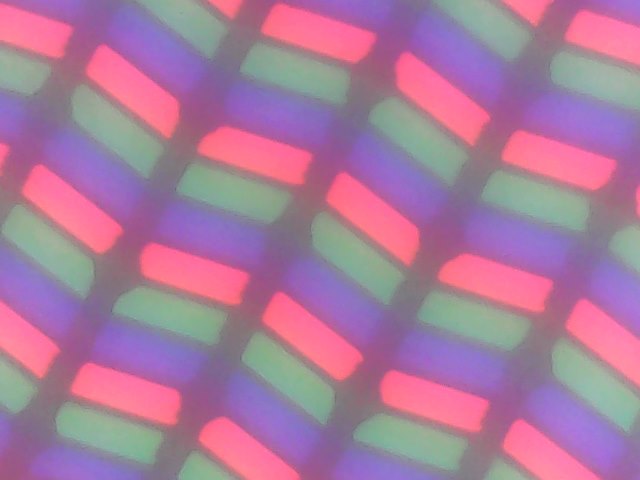
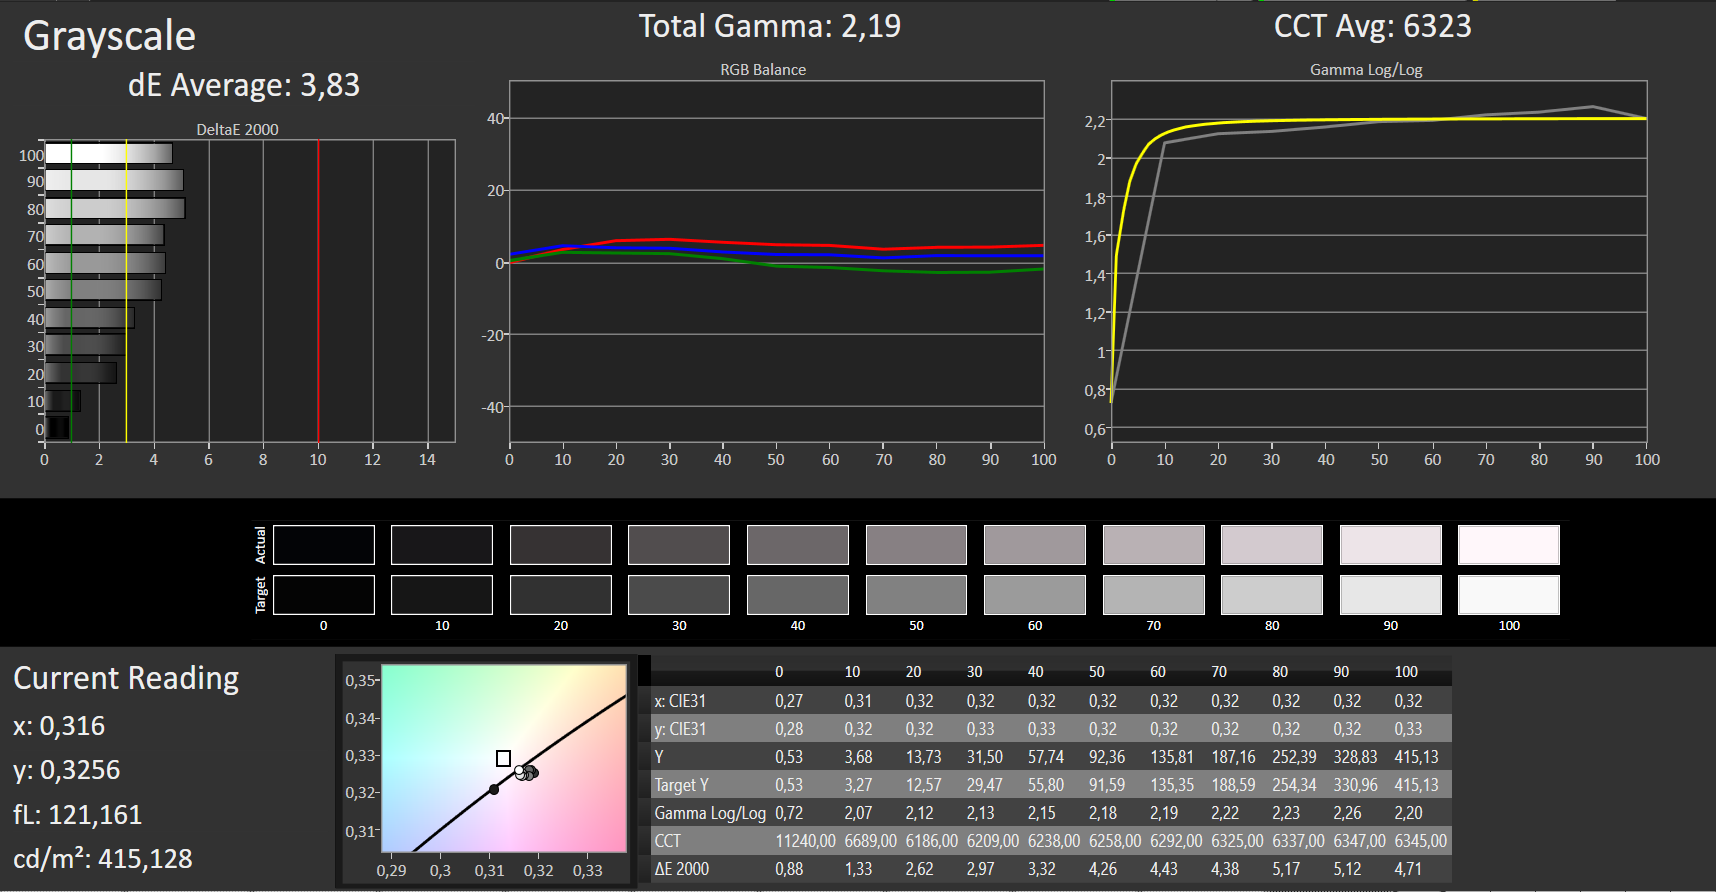
Il display touchscreen opaco da 17,3" ha una risoluzione nativa di 3840x2160 pixel. Il rapporto di contrasto (1019:1) e la luminosità (367,1 cd/m²) sono buoni. Positivo: Il display non presenta sfarfallio PWM.
| |||||||||||||||||||||||||
Distribuzione della luminosità: 83 %
Al centro con la batteria: 381 cd/m²
Contrasto: 1019:1 (Nero: 0.37 cd/m²)
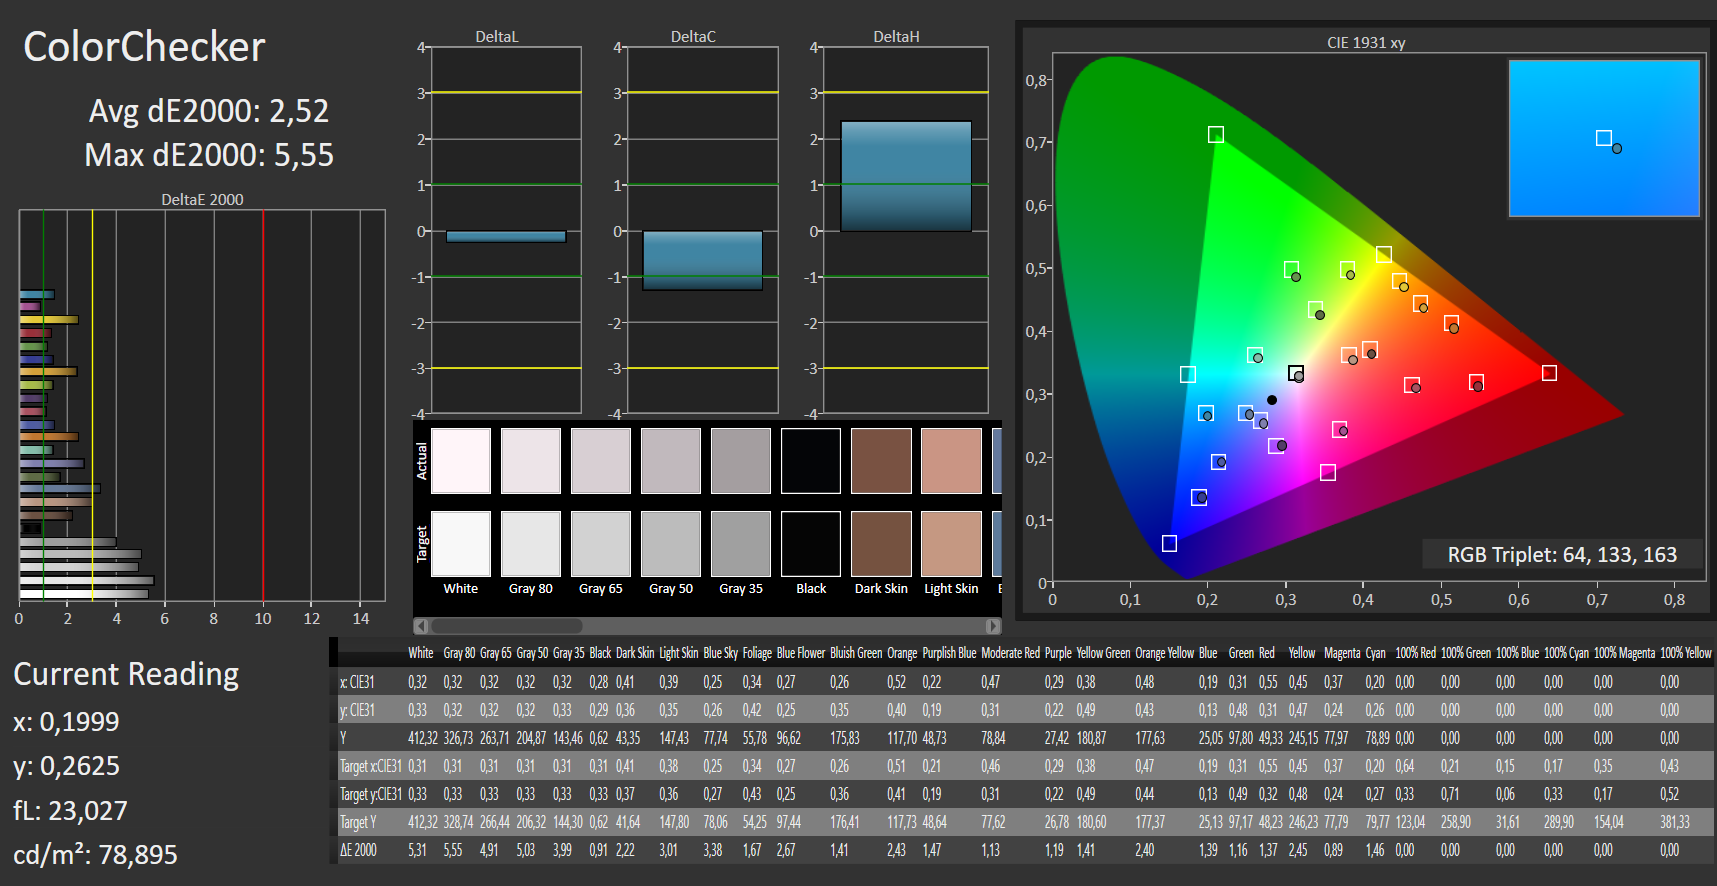
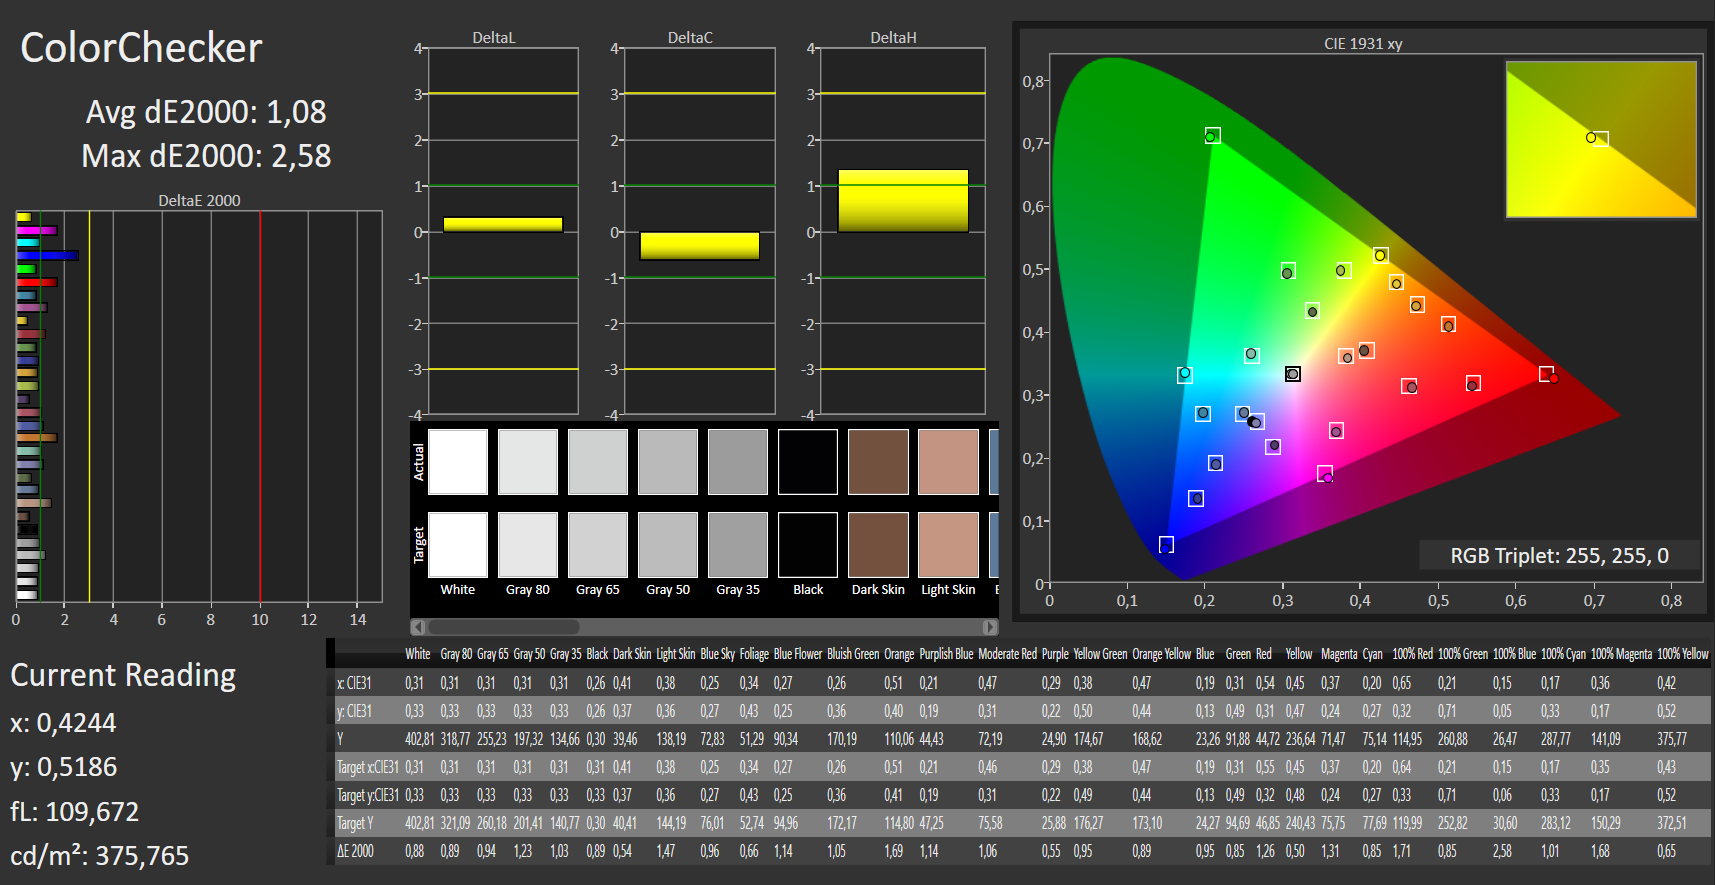
ΔE ColorChecker Calman: 2.52 | ∀{0.5-29.43 Ø4.71}
calibrated: 1.08
ΔE Greyscale Calman: 3.83 | ∀{0.09-98 Ø4.96}
98% sRGB (Argyll 1.6.3 3D)
84% AdobeRGB 1998 (Argyll 1.6.3 3D)
95.1% AdobeRGB 1998 (Argyll 3D)
97.9% sRGB (Argyll 3D)
80.9% Display P3 (Argyll 3D)
Gamma: 2.19
CCT: 6323 K
| Acer ConceptD 9 Pro IPS, 3840x2160, 17.3" | Lenovo ThinkPad P73-20QR002DGE IPS LED, 1920x1080, 17.3" | MSI WE75 9TK IPS, 1920x1080, 17.3" | Dell Precision 7730 IPS LED, 1920x1080, 17.3" | Eurocom Tornado F7W IPS, 3840x2160, 17.3" | Fujitsu Celsius H980 IPS, 1920x1080, 17.3" | |
|---|---|---|---|---|---|---|
| Display | -17% | -21% | -18% | 4% | -22% | |
| Display P3 Coverage (%) | 80.9 | 67.5 -17% | 63.2 -22% | 65 -20% | 85.9 6% | 67.3 -17% |
| sRGB Coverage (%) | 97.9 | 94.2 -4% | 89.9 -8% | 93.4 -5% | 100 2% | 85 -13% |
| AdobeRGB 1998 Coverage (%) | 95.1 | 67.8 -29% | 64.3 -32% | 66.3 -30% | 98.3 3% | 62.2 -35% |
| Response Times | 25% | 29% | 10% | 20% | 33% | |
| Response Time Grey 50% / Grey 80% * (ms) | 53 ? | 40 ? 25% | 30.8 ? 42% | 48.8 ? 8% | 40 ? 25% | 38 ? 28% |
| Response Time Black / White * (ms) | 37 ? | 28 ? 24% | 31.2 ? 16% | 32.8 ? 11% | 31.6 ? 15% | 23.2 ? 37% |
| PWM Frequency (Hz) | 25000 ? | 120500 ? | ||||
| Screen | -28% | -19% | 2% | -54% | -51% | |
| Brightness middle (cd/m²) | 377 | 333 -12% | 287.3 -24% | 322 -15% | 328.2 -13% | 400 6% |
| Brightness (cd/m²) | 368 | 310 -16% | 280 -24% | 316 -14% | 310 -16% | 394 7% |
| Brightness Distribution (%) | 83 | 83 0% | 89 7% | 84 1% | 92 11% | 92 11% |
| Black Level * (cd/m²) | 0.37 | 0.39 -5% | 0.26 30% | 0.24 35% | 0.37 -0% | 0.51 -38% |
| Contrast (:1) | 1019 | 854 -16% | 1105 8% | 1342 32% | 887 -13% | 784 -23% |
| Colorchecker dE 2000 * | 2.52 | 4.4 -75% | 2.98 -18% | 2.2 13% | 6.62 -163% | 5.3 -110% |
| Colorchecker dE 2000 max. * | 5.55 | 7.5 -35% | 5.08 8% | 4.6 17% | 9.49 -71% | 9.3 -68% |
| Colorchecker dE 2000 calibrated * | 1.08 | 2 -85% | 3.06 -183% | 1.9 -76% | 3.93 -264% | 3.8 -252% |
| Greyscale dE 2000 * | 3.83 | 5.1 -33% | 3 22% | 1.6 58% | 6.7 -75% | 5.5 -44% |
| Gamma | 2.19 100% | 2.39 92% | 2.28 96% | 2.19 100% | 2.44 90% | 2.17 101% |
| CCT | 6323 103% | 7061 92% | 6993 93% | 6621 98% | 6462 101% | 6686 97% |
| Color Space (Percent of AdobeRGB 1998) (%) | 84 | 61.1 -27% | 58.1 -31% | 60.4 -28% | 87.9 5% | 55.8 -34% |
| Color Space (Percent of sRGB) (%) | 98 | 94 -4% | 89.5 -9% | 93.3 -5% | 100 2% | 84.9 -13% |
| Media totale (Programma / Settaggio) | -7% /
-19% | -4% /
-14% | -2% /
-1% | -10% /
-34% | -13% /
-35% |
* ... Meglio usare valori piccoli
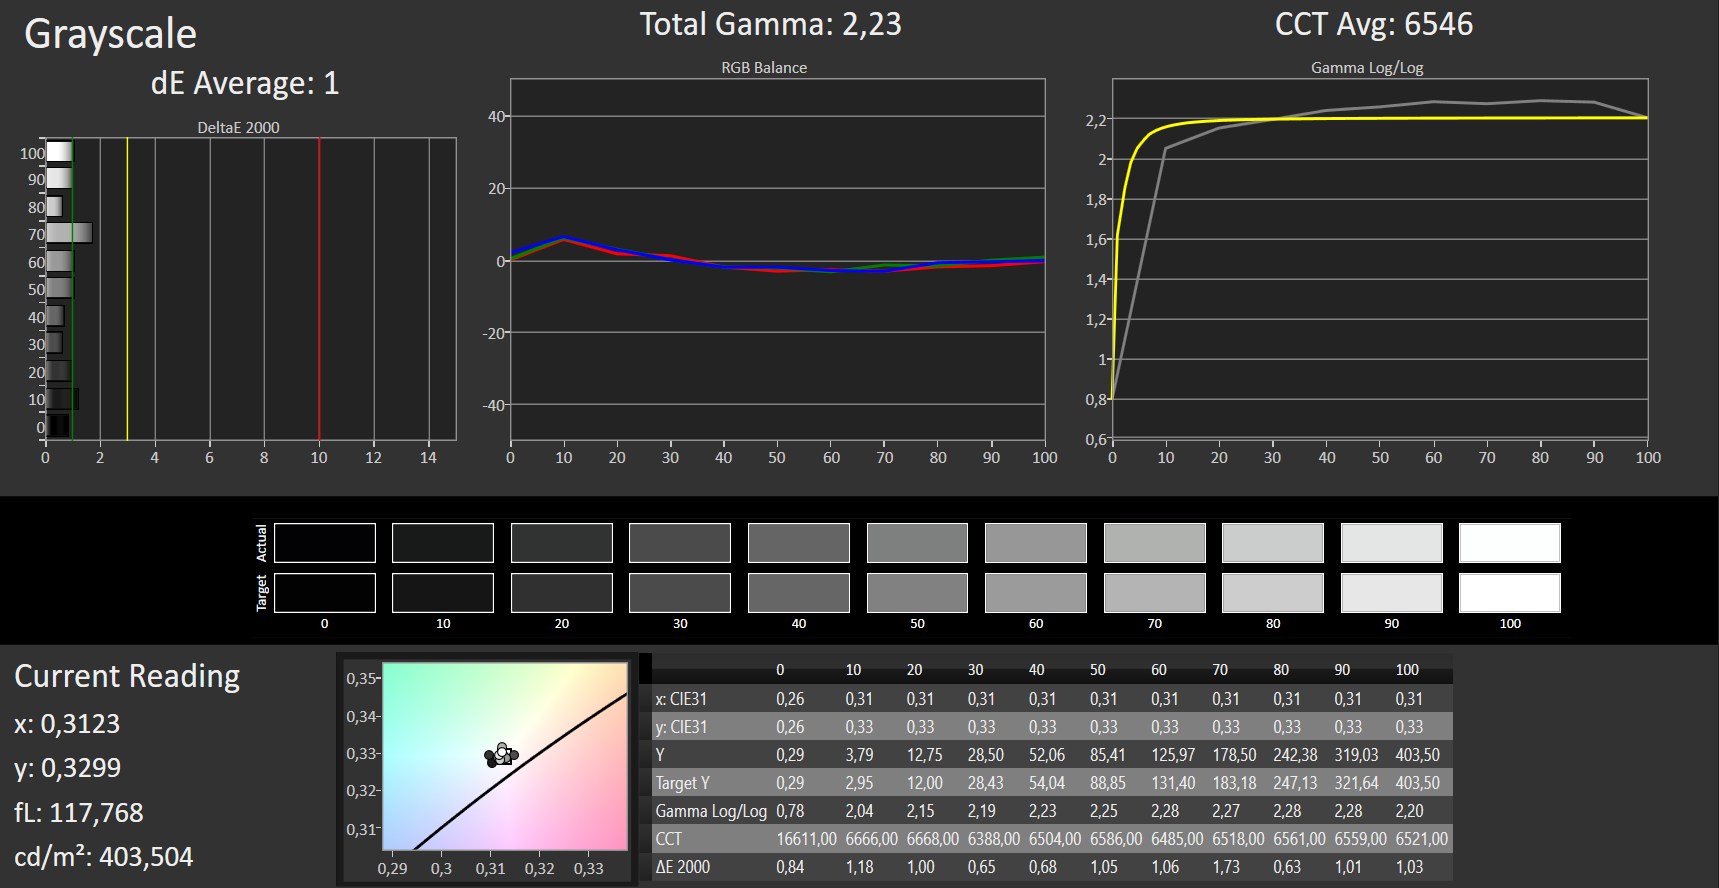
Il display può riprodurre un ampio spettro di colori ex-fabbrica. Con una deviazione di colore DeltaE-2000 di circa 2,5, rimane all'interno del range ideale (DeltaE inferiore a tre). Il display non soffre di una sfumatura blu. Eseguendo una calibrazione, siamo stati in grado di migliorare ulteriormente il display di un margine significativo. Questo ha fatto sì che la scala di grigi e il colore DeltaE scendessero a 1. Al primo avvio, il valore DeltaE in scala di grigi era 3,8.
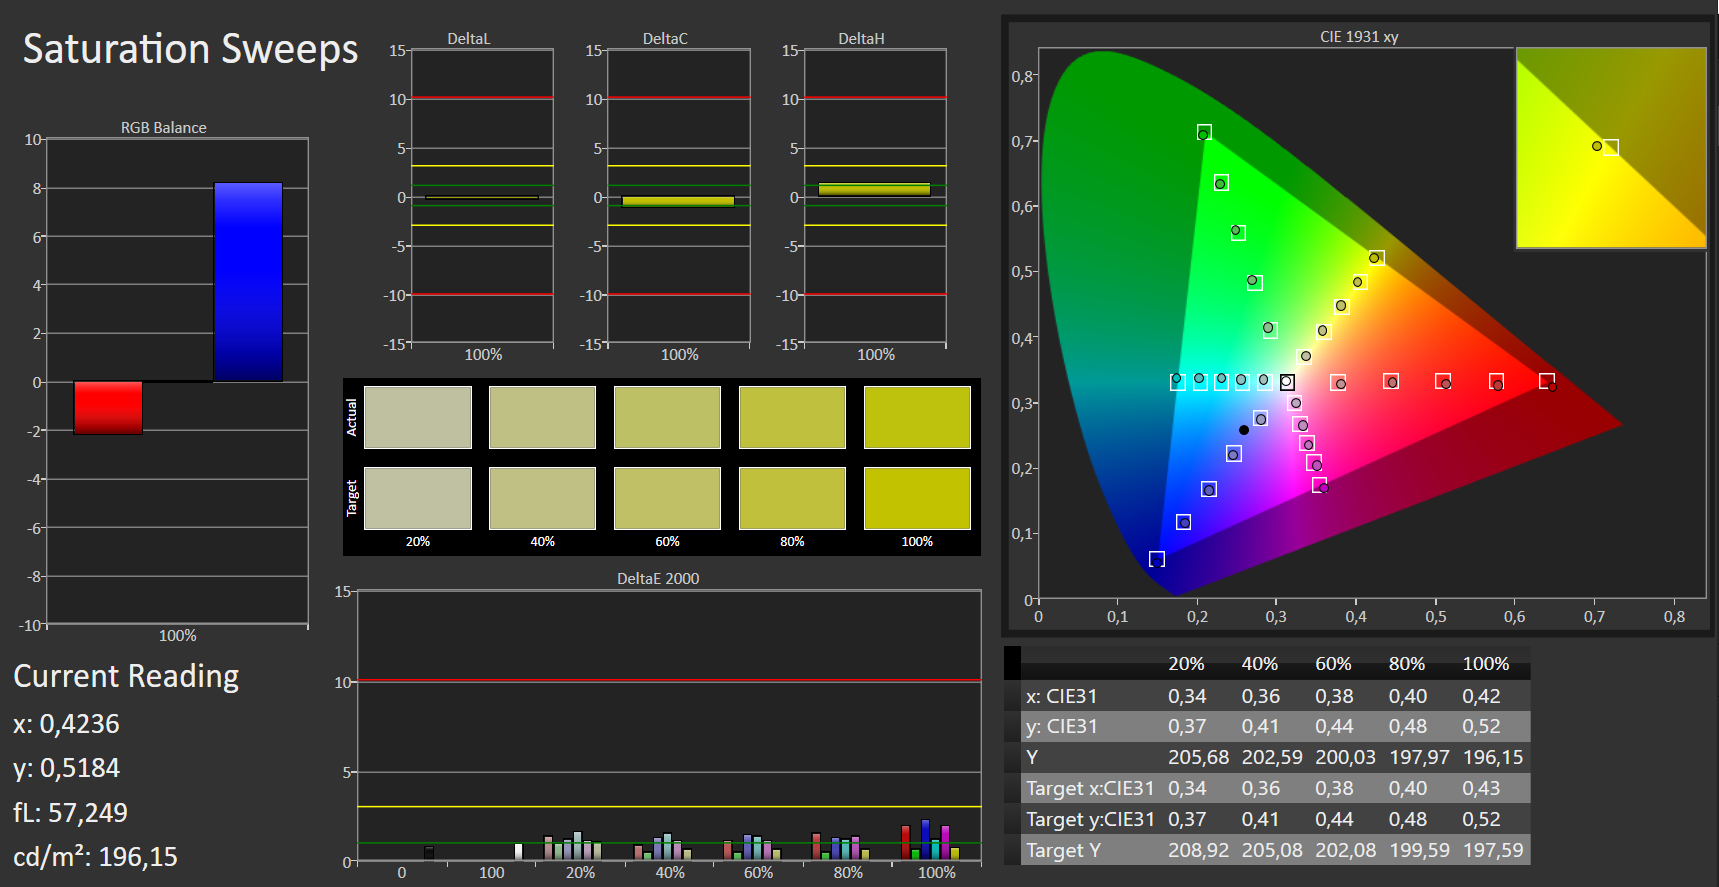
Se è necessaria un'esatta rappresentazione del colore, vale la pena di effettuare una calibrazione. Il nostro profilo di colore calibrato si trova nel riquadro qui sopra. Il display ottiene un ottimo risultato in termini di copertura dello spazio colore. Esso copre l'84% (AdobeRGB) e il 98% (sRGB) dei rispettivi spazi di colore.
Tempi di risposta del Display
| ↔ Tempi di risposta dal Nero al Bianco | ||
|---|---|---|
| 37 ms ... aumenta ↗ e diminuisce ↘ combinato | ↗ 21 ms Incremento | 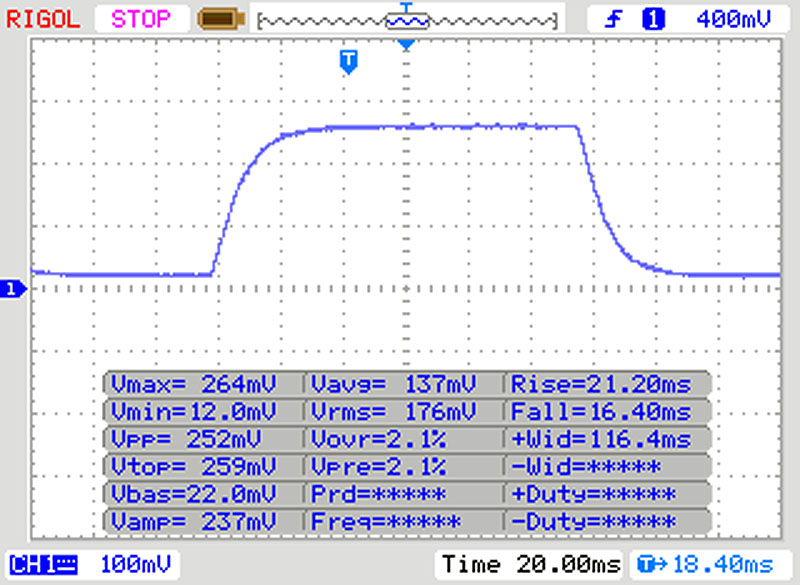 |
| ↘ 16 ms Calo | ||
| Lo schermo mostra tempi di risposta lenti nei nostri tests e sarà insoddisfacente per i gamers. In confronto, tutti i dispositivi di test variano da 0.1 (minimo) a 240 (massimo) ms. » 95 % di tutti i dispositivi è migliore. Questo significa che i tempi di risposta rilevati sono peggiori rispetto alla media di tutti i dispositivi testati (19.8 ms). | ||
| ↔ Tempo di risposta dal 50% Grigio all'80% Grigio | ||
| 53 ms ... aumenta ↗ e diminuisce ↘ combinato | ↗ 27 ms Incremento | 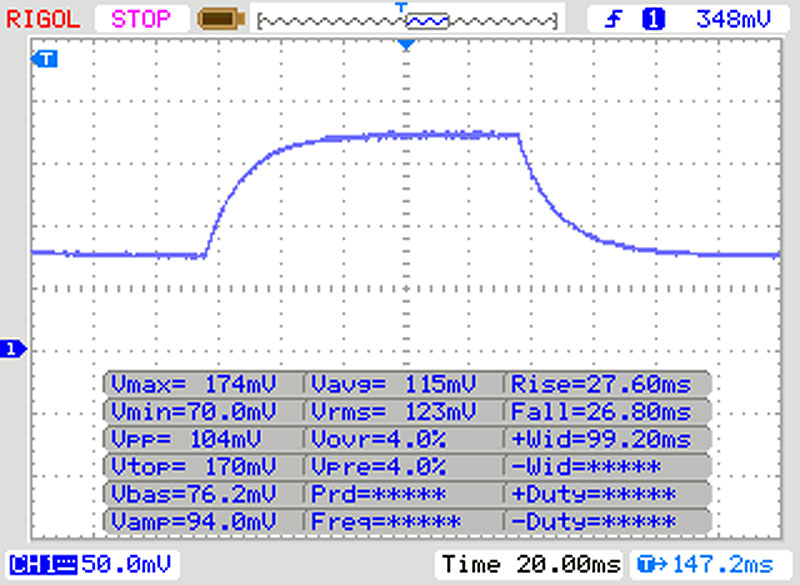 |
| ↘ 26 ms Calo | ||
| Lo schermo mostra tempi di risposta lenti nei nostri tests e sarà insoddisfacente per i gamers. In confronto, tutti i dispositivi di test variano da 0.165 (minimo) a 636 (massimo) ms. » 90 % di tutti i dispositivi è migliore. Questo significa che i tempi di risposta rilevati sono peggiori rispetto alla media di tutti i dispositivi testati (31 ms). | ||
Sfarfallio dello schermo / PWM (Pulse-Width Modulation)
| flickering dello schermo / PWM non rilevato | 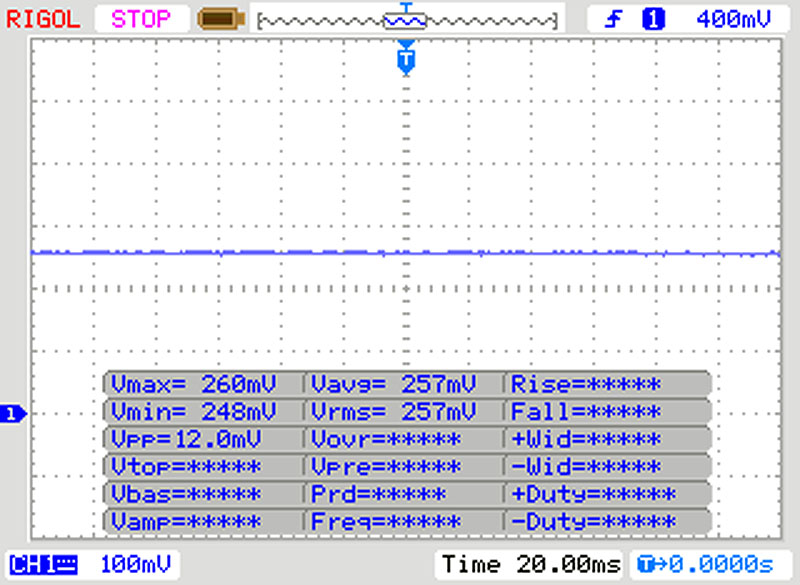 | ||
In confronto: 52 % di tutti i dispositivi testati non utilizza PWM per ridurre la luminosita' del display. Se è rilevato PWM, una media di 7754 (minimo: 5 - massimo: 343500) Hz è stata rilevata. | |||
Acer ha dotato il ConceptD 9 di un pannello IPS con ampi angoli di visione. Di conseguenza, lo schermo può essere letto da qualsiasi posizione. A condizione che il sole non splenda troppo, questo è possibile anche all'aperto.

Prestazioni - Computer Acer con Hardware High-End
Con il ConceptD 9 Pro CN917-71P, Acer mette a disposizine una workstation da 17,3 pollici con una potenza di elaborazione più che sufficiente per tutti i casi di uso comune. La nostra configurazione del dispositivo può essere acquistata a partire da circa 5500 Euro (~$6073). Sono disponibili anche altre configurazioni.
Processore
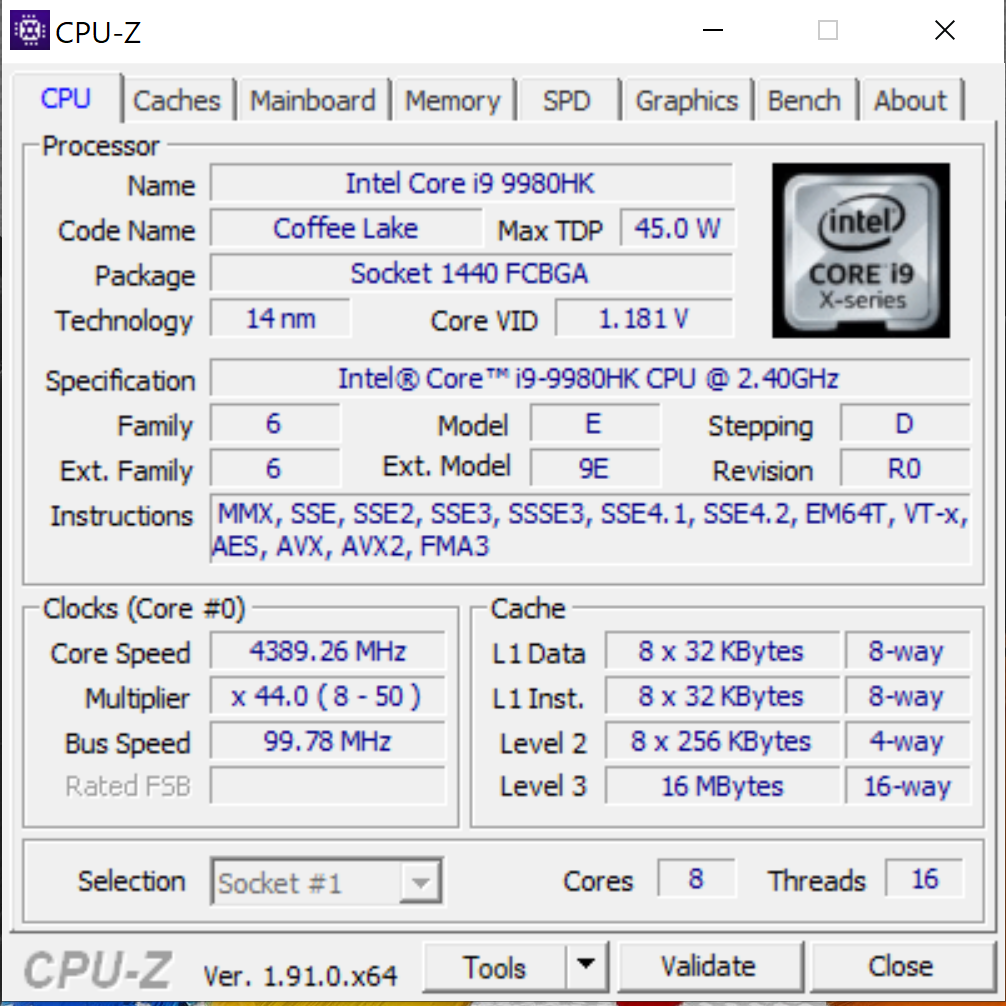
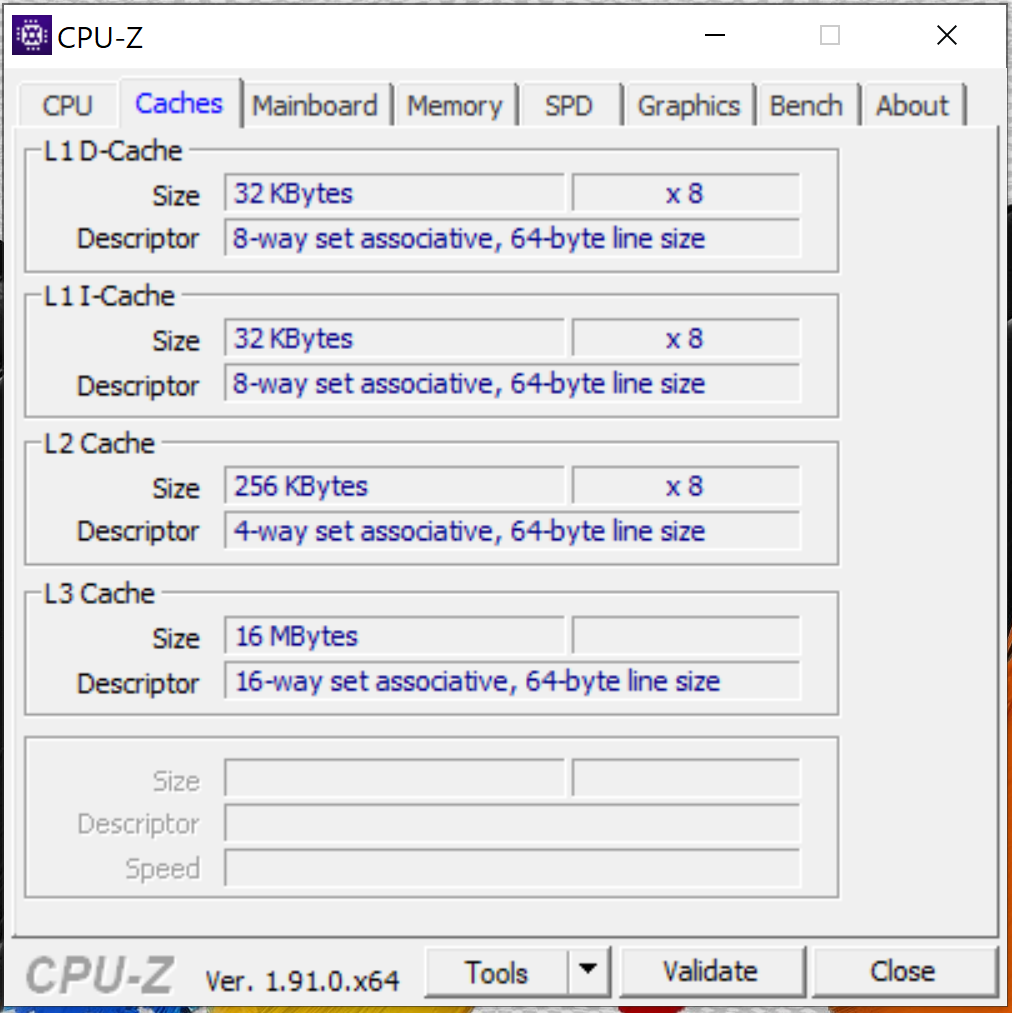
Il ConceptD è alimentato da un processore Core i9-9980HK (Coffee Lake) a otto cores. La CPU ha un clock di base di 2,4 GHz. Tramite Turbo Boost, la velocità di clock può essere aumentata a 4,2 GHz (otto cores), 4,5 GHz (sei cores), 4,7 GHz (quattro cores), 4,9 GHz (due cores) o 5 GHz (single core). Inoltre, è supportato l'Hyper-Threading (due threads per core). Grazie al moltiplicatore sbloccato, l'overclocking del processore è un compito molto semplice.
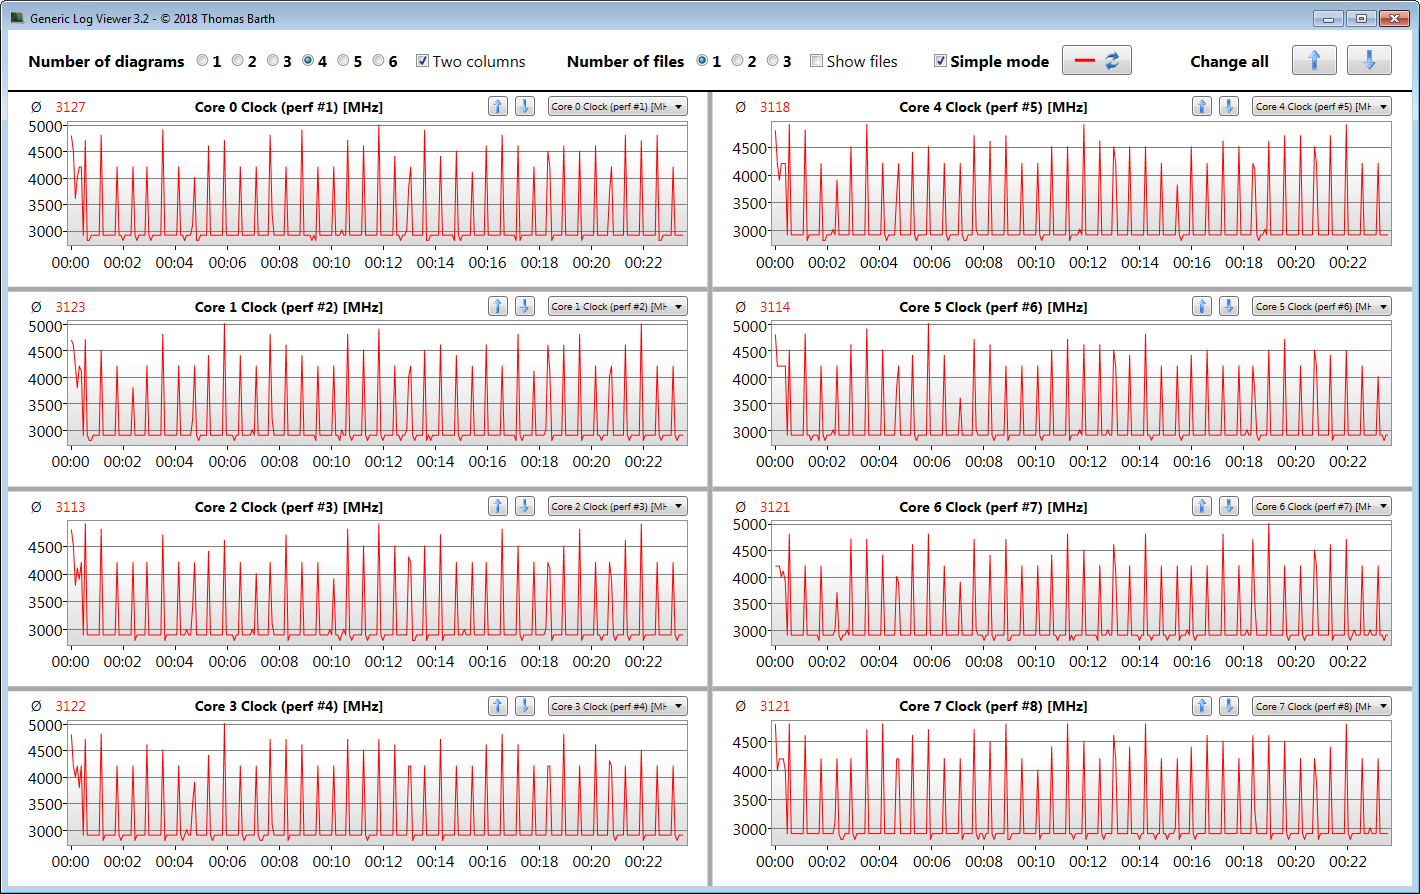
Durante il test multithreading di Cinebench R15, il processore funziona temporaneamente a 4,1 - 4,2 GHz. Successivamente, la frequenza di clock scende a 2,8 - 2,9 GHz. Durante il test single-thread, la velocità di clock va da 4,1 a 5 GHz. In modalità batteria, possiamo osservare una velocità di clock di 2,4 GHz (multi-thread) e da 2,1 a 2,8 GHz (single-thread).
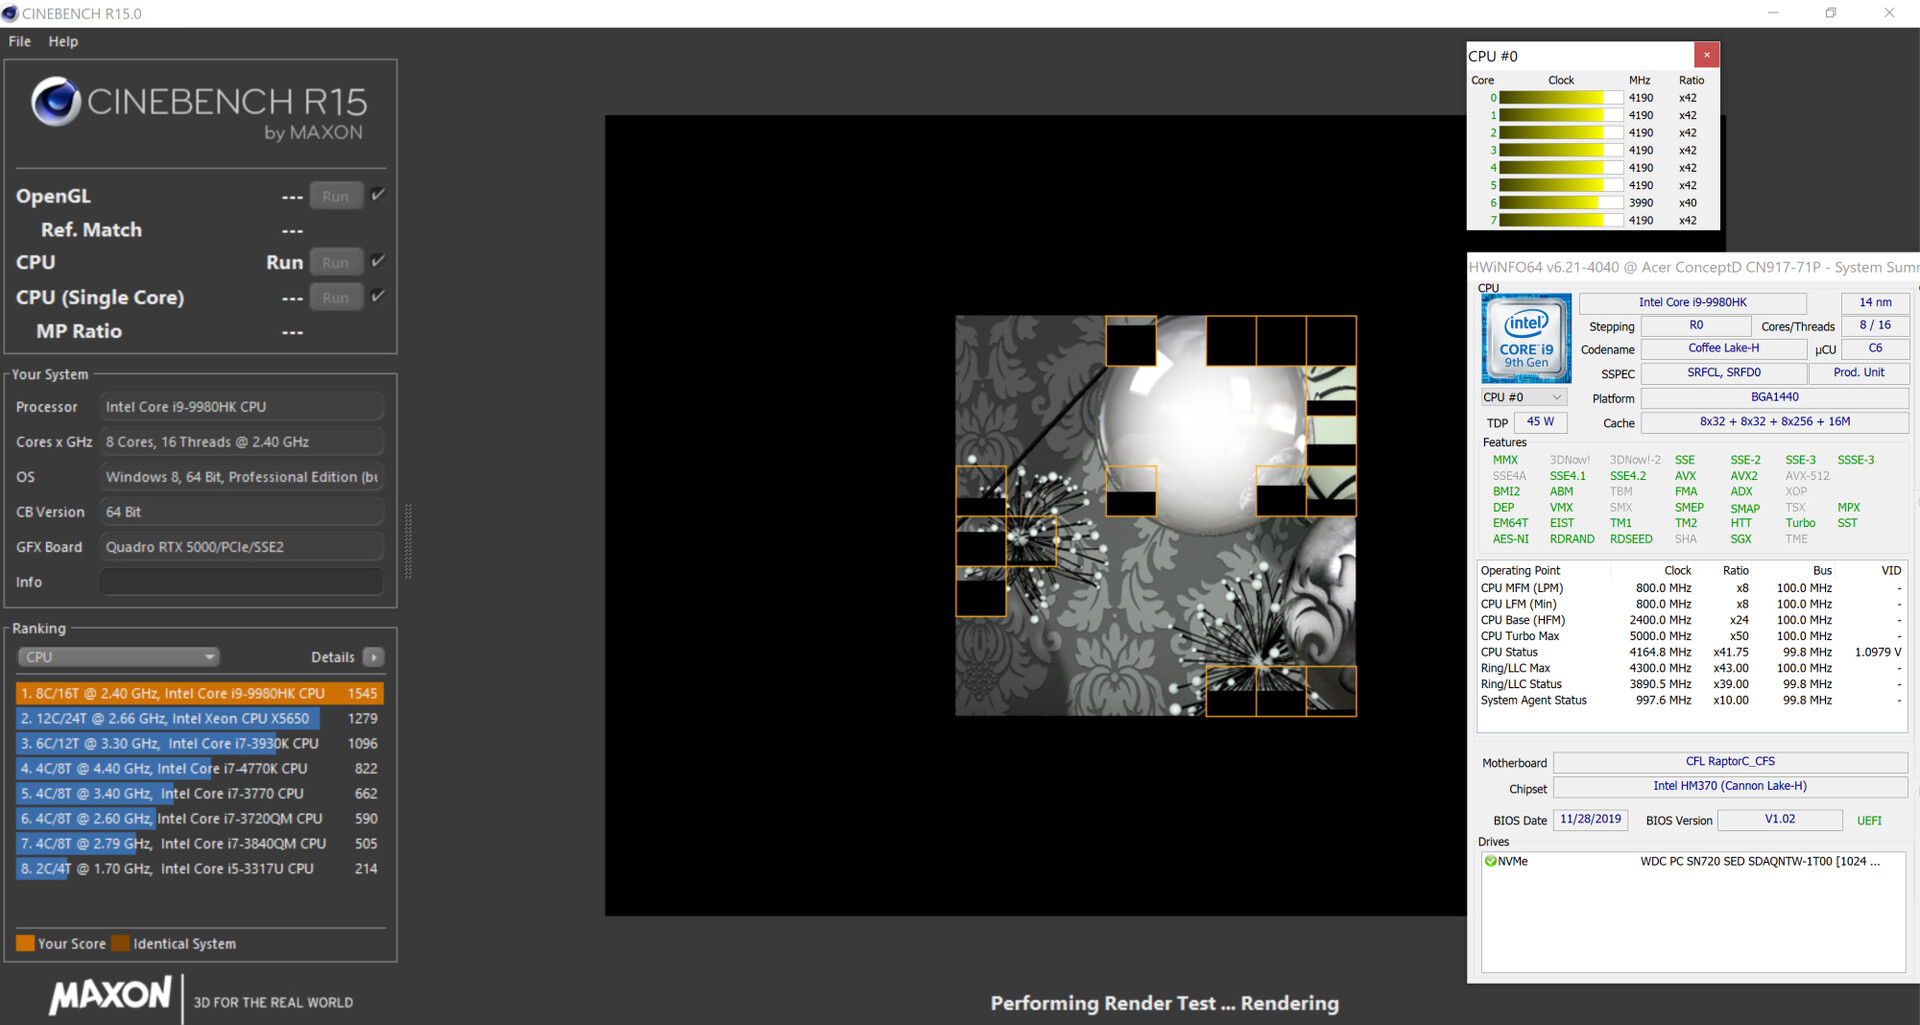

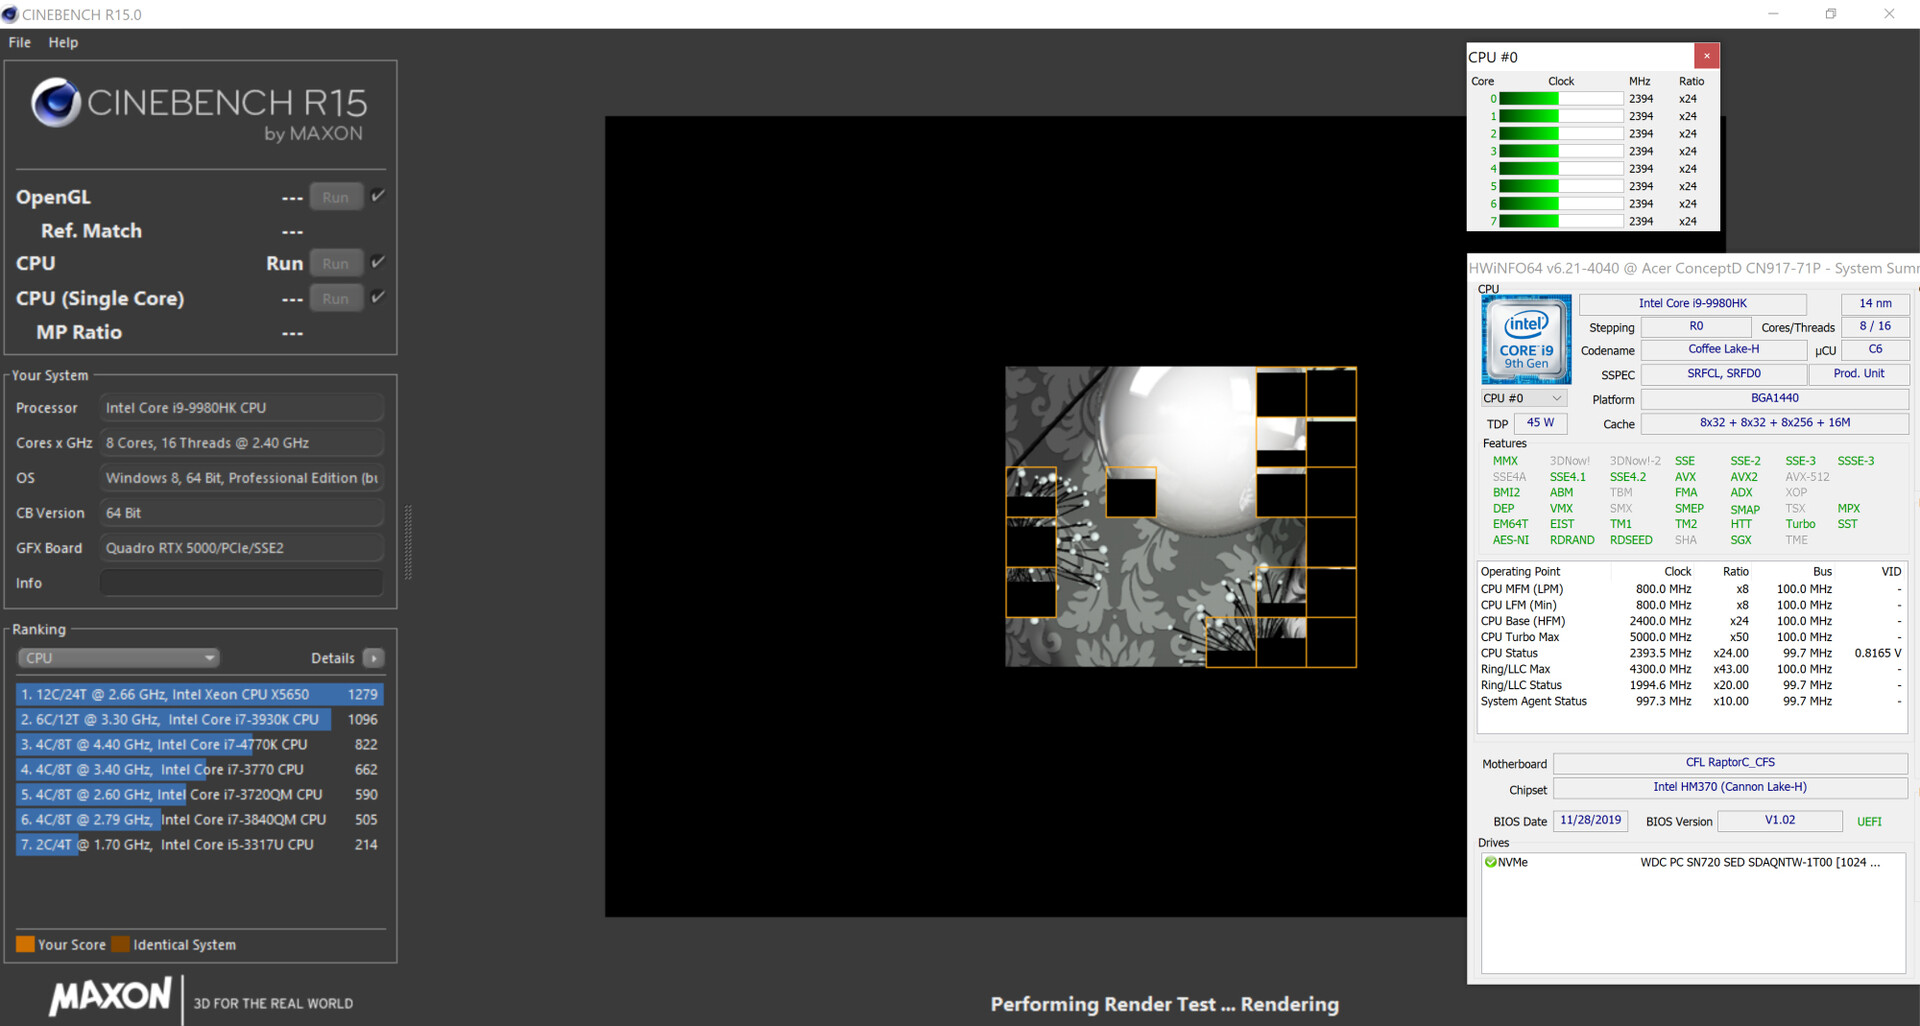

Eseguendo il test multithread di Cinebench R15 in loop per almeno 30 minuti, determiniamo se il Turbo Boost della CPU è permanentemente attivo mentre il portatile è collegato a una presa di corrente. I punteggi scendono in modo significativo al secondo loop e si stabilizzano successivamente su un livello abbastanza costante. Durante questo periodo, il Turbo Boost aumenta leggermente la velocità di clock.
| Cinebench R10 | |
| Rendering Single 32Bit | |
| Media della classe Workstation (n=1ultimi 2 anni) | |
| Media Intel Core i9-9980HK (7709 - 9734, n=4) | |
| Eurocom Tornado F7W | |
| Acer ConceptD 9 Pro | |
| Fujitsu Celsius H980 | |
| Rendering Multiple CPUs 32Bit | |
| Media della classe Workstation (n=1ultimi 2 anni) | |
| Media Intel Core i9-9980HK (39440 - 50439, n=4) | |
| Acer ConceptD 9 Pro | |
| Eurocom Tornado F7W | |
| Fujitsu Celsius H980 | |
| Geekbench 3 | |
| 32 Bit Multi-Core Score | |
| Acer ConceptD 9 Pro | |
| Media Intel Core i9-9980HK (n=1) | |
| 32 Bit Single-Core Score | |
| Acer ConceptD 9 Pro | |
| Media Intel Core i9-9980HK (n=1) | |
| Mozilla Kraken 1.1 - Total | |
| Fujitsu Celsius H980 (EDGE: 42.17134.1.0) | |
| Dell Precision 7730 (Edge) | |
| MSI WE75 9TK (Edge 44.17763.831.0) | |
| MSI WE75 9TK | |
| Lenovo ThinkPad P73-20QR002DGE (Edge) | |
| Acer ConceptD 9 Pro (Edge 44) | |
| Media Intel Core i9-9980HK (705 - 999, n=9) | |
| Media della classe Workstation (411 - 538, n=23, ultimi 2 anni) | |
| Octane V2 - Total Score | |
| Media della classe Workstation (112382 - 129420, n=3, ultimi 2 anni) | |
| Media Intel Core i9-9980HK (40364 - 46473, n=8) | |
| Acer ConceptD 9 Pro (Edge 44) | |
| Lenovo ThinkPad P73-20QR002DGE (Edge) | |
| MSI WE75 9TK (Edge 44.17763.831.0) | |
| Dell Precision 7730 (Edge) | |
| Fujitsu Celsius H980 (EDGE: 42.17134.1.0) | |
| JetStream 1.1 - 1.1 Total | |
| Eurocom Tornado F7W (Edge 42.17134.1.0) | |
| Acer ConceptD 9 Pro (Edge 44) | |
| Media Intel Core i9-9980HK (257 - 318, n=8) | |
| MSI WE75 9TK (Edge 44.17763.831.0) | |
| Fujitsu Celsius H980 (EDGE: 42.17134.1.0) | |
* ... Meglio usare valori piccoli
Prestazioni di sistema
Questo portatile da 17,3" non manca di prestazioni del sistema. Un potente processore a otto cores, una RAM in modalità dual-channel mode e un veloce SSD NVMe rendono il sistema fluido e reattivo. Inoltre, la workstation è dotata di una GPU di fascia alta. I risultati del benchmark PCMark sono eccellenti, il che sottolinea ancora una volta il fatto che il laptop è abbastanza veloce per tutti i casi di uso comune.
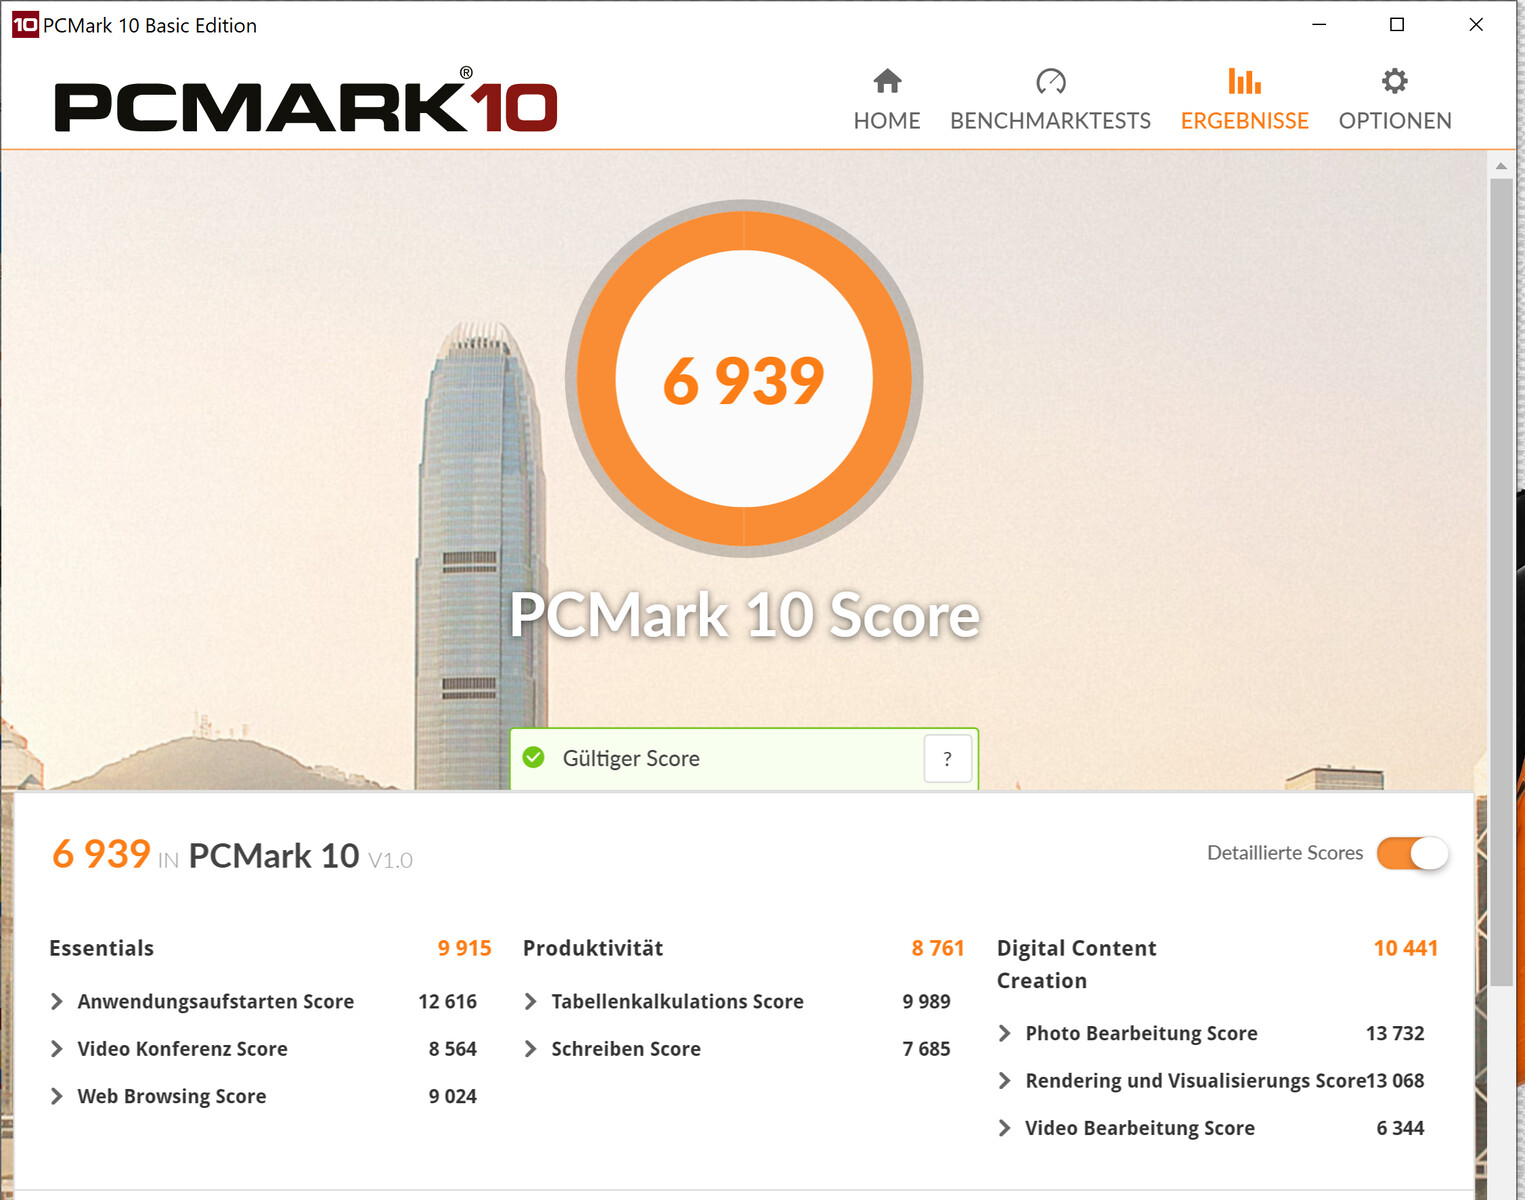
| PCMark 8 Home Score Accelerated v2 | 4487 punti | |
| PCMark 8 Creative Score Accelerated v2 | 6412 punti | |
| PCMark 8 Work Score Accelerated v2 | 4884 punti | |
| PCMark 10 Score | 6939 punti | |
Aiuto | ||
Dispositivi di archiviazione
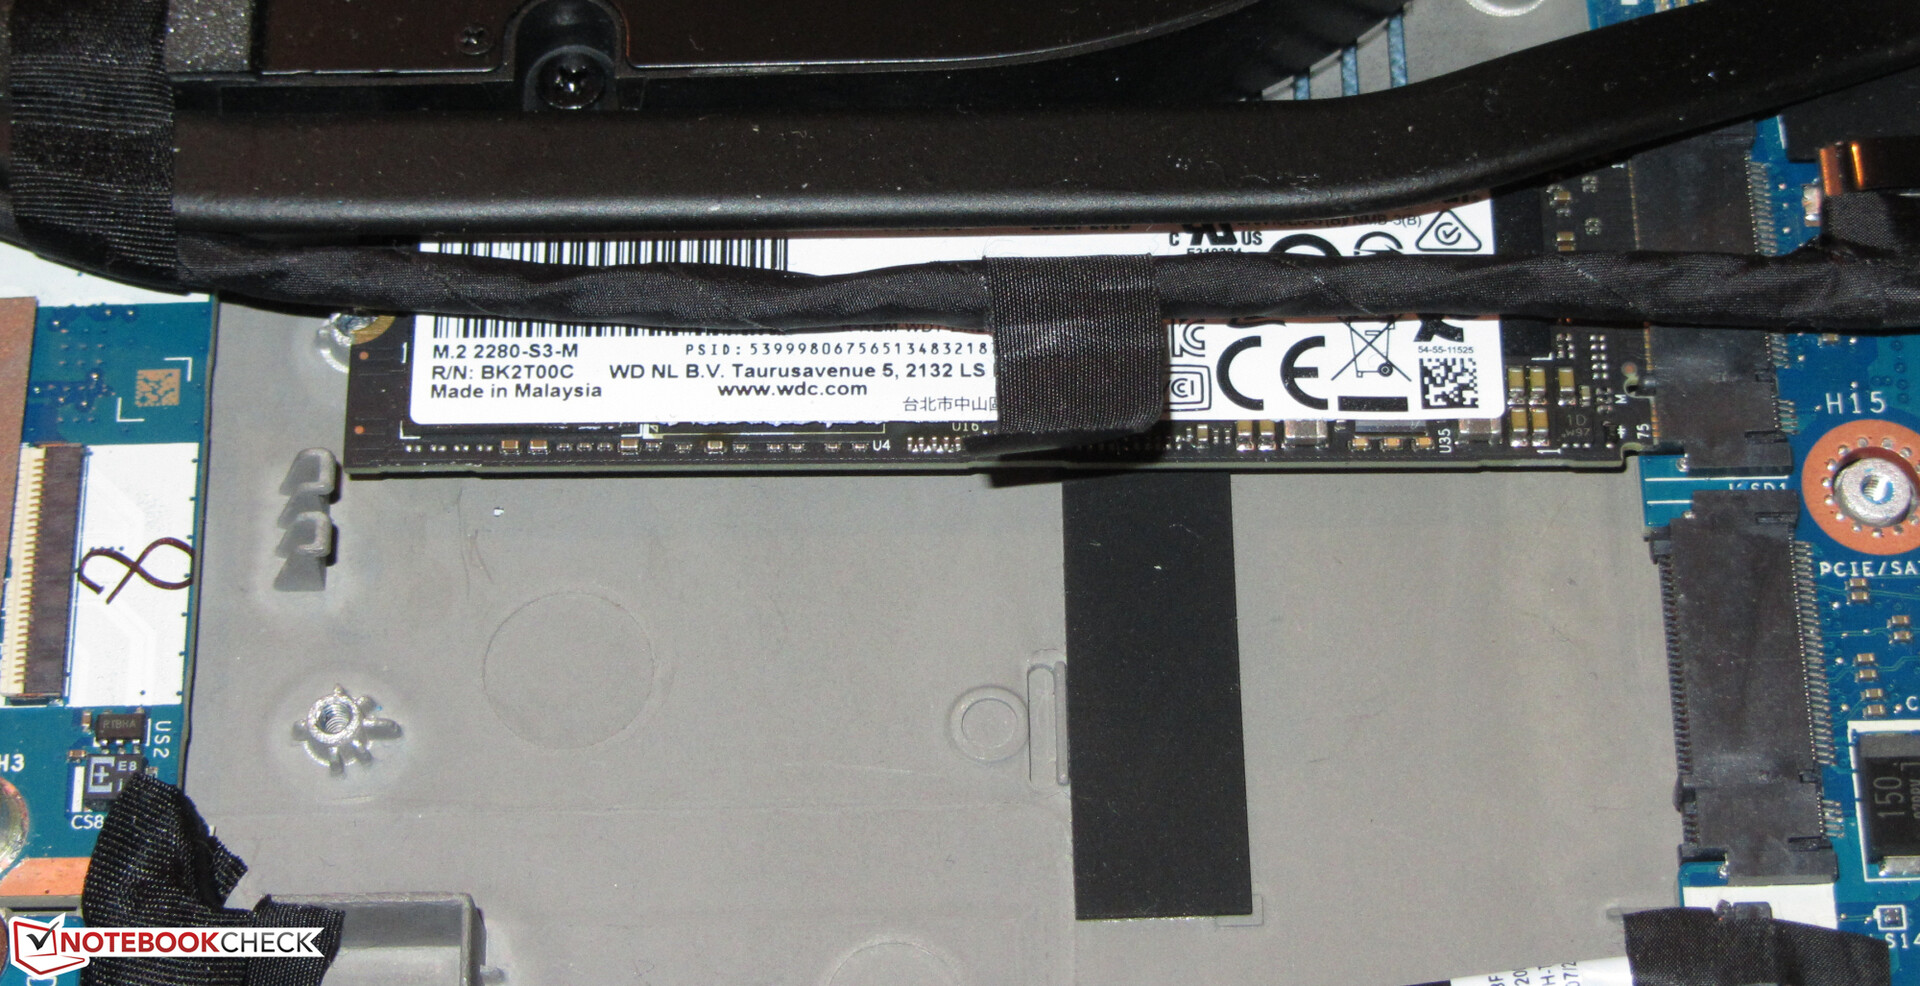
Un SSD NVMe di Western Digital funge da unità di sistema. In questo caso si tratta di un modello nel fattore di forma M.2 2280 con 1 TB di spazio di memoria. Al primo avvi circa 887 GB sono a disposizione degli utenti. Lo spazio rimanente è occupato dalla partizione di ripristino e dal sistema windows. Le velocità di trasferimento sono buone. All'interno della postazione di lavoro è disponibile un ulteriore slot M.2 2280. Se sono installati due drive, possono operare in RAID 0.

| Acer ConceptD 9 Pro WDC PC SN720 SDAQNTW-1T00 | Lenovo ThinkPad P73-20QR002DGE Intel SSD Pro 7600p SSDPEKKF512G8L | MSI WE75 9TK Samsung SSD PM981 MZVLB512HAJQ | Dell Precision 7730 Samsung SSD PM981 MZVLB512HAJQ | Eurocom Tornado F7W 3x Samsung SSD 970 Pro 512GB (RAID 0) | Fujitsu Celsius H980 Samsung SSD PM981 MZVLB512HAJQ | Media WDC PC SN720 SDAQNTW-1T00 | |
|---|---|---|---|---|---|---|---|
| CrystalDiskMark 5.2 / 6 | -6% | -3% | -24% | 2% | -30% | -3% | |
| Write 4K (MB/s) | 176 | 154.3 -12% | 135.4 -23% | 103.2 -41% | 116.3 -34% | 111.8 -36% | 168.6 ? -4% |
| Read 4K (MB/s) | 48.06 | 66.4 38% | 56.6 18% | 41.39 -14% | 52.7 10% | 32.02 -33% | 47.6 ? -1% |
| Write Seq (MB/s) | 2736 | 1561 -43% | 1972 -28% | 1880 -31% | 2539 -7% | 1539 -44% | 2602 ? -5% |
| Read Seq (MB/s) | 2381 | 2460 3% | 2101 -12% | 2350 -1% | 2972 25% | 1252 -47% | 2084 ? -12% |
| Write 4K Q32T1 (MB/s) | 418.6 | 438 5% | 527 26% | 282.3 -33% | 454.6 9% | 355.4 -15% | 391 ? -7% |
| Read 4K Q32T1 (MB/s) | 460.8 | 568 23% | 578 25% | 314.3 -32% | 515 12% | 408.7 -11% | 481 ? 4% |
| Write Seq Q32T1 (MB/s) | 2791 | 1581 -43% | 1985 -29% | 1881 -33% | 3101 11% | 1913 -31% | 2792 ? 0% |
| Read Seq Q32T1 (MB/s) | 3430 | 2724 -21% | 3358 -2% | 3216 -6% | 3078 -10% | 2530 -26% | 3377 ? -2% |
Prestazioni GPU
Il portatile Acer è dotato di una GPU Quadro RTX 5000. Questa GPU è basata sull'architettura Turing di Nvidia e rappresenta la versione professionale della GPU GeForce RTX 2080. Tuttavia, la RTX 5000 ha più unità shader (3072 invece di 2944). Ha anche accesso alla veloce memoria GDDR6 (16.384 GB).
Ci sono due varianti della GPU mobile RTX 5000, che si differenziano per il loro TGP (150 watt contro 110 watt) e quindi per le loro prestazioni. La variante più potente è installata nel ConceptD. Inoltre, Nvidia offre anche tre versioni Max-Q di RTX 5000.
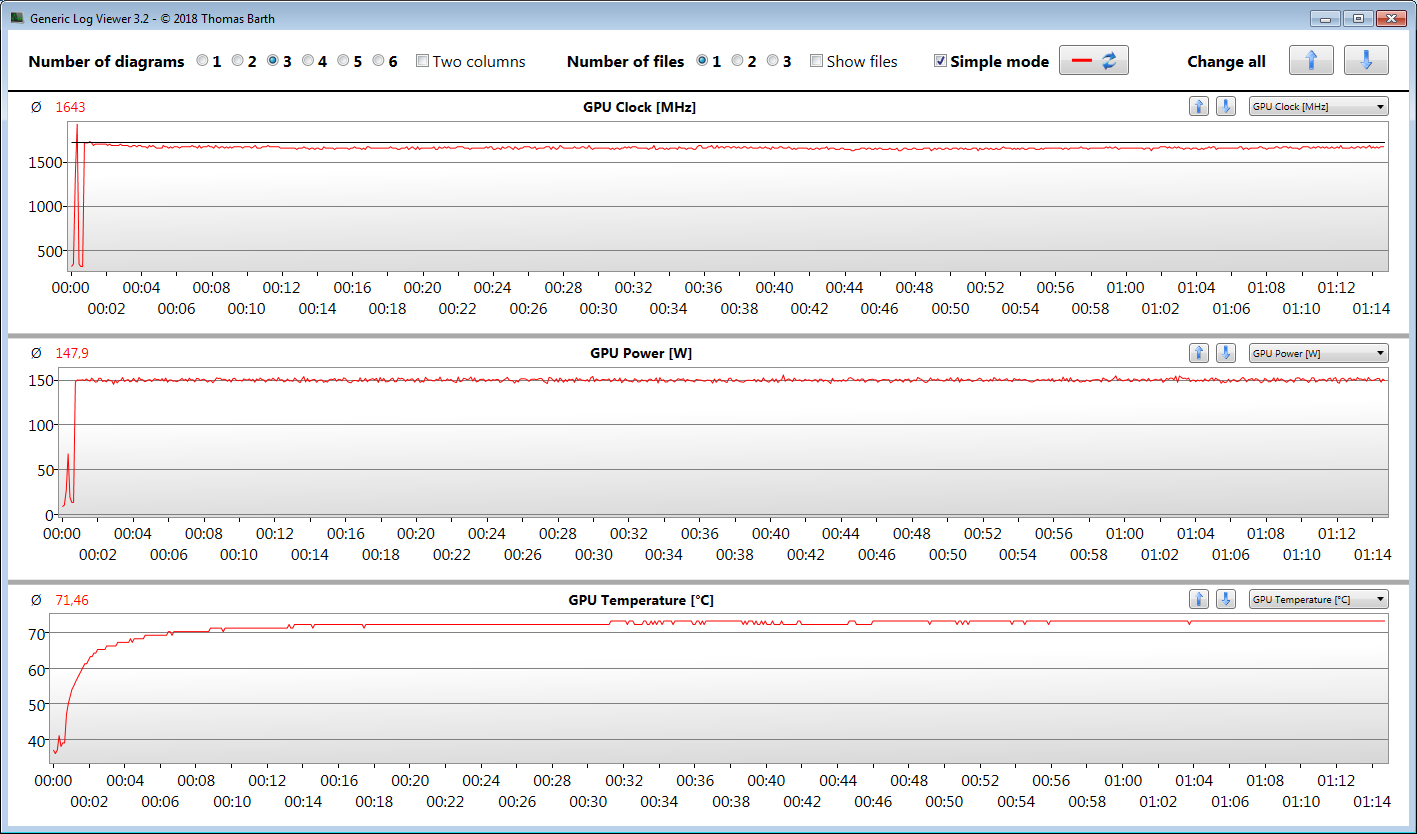
La RTX 5000 funziona ad una velocità di clock di base di 1350 MHz. Tramite boost, questa può essere aumentata a 1770 MHz. A condizione che la GPU non superi una certa soglia predefinita di temperatura e/o di consumo energetico, sono possibili frequenze ancora più elevate. Abbiamo registrato un clock di picco del core clock di 1927 MHz. Nel nostro test di The Witcher 3, la GPU funziona a una velocità media di clock di 1643 MHz.
I risultati di 3DMark corrispondono alle nostre aspettative. La GPU integrata UHD Graphics 630 è disabilitata e il laptop non utilizza la tecnologia di switching grafico Optimus di Nvidia.

| 3DMark 06 Standard Score | 45180 punti | |
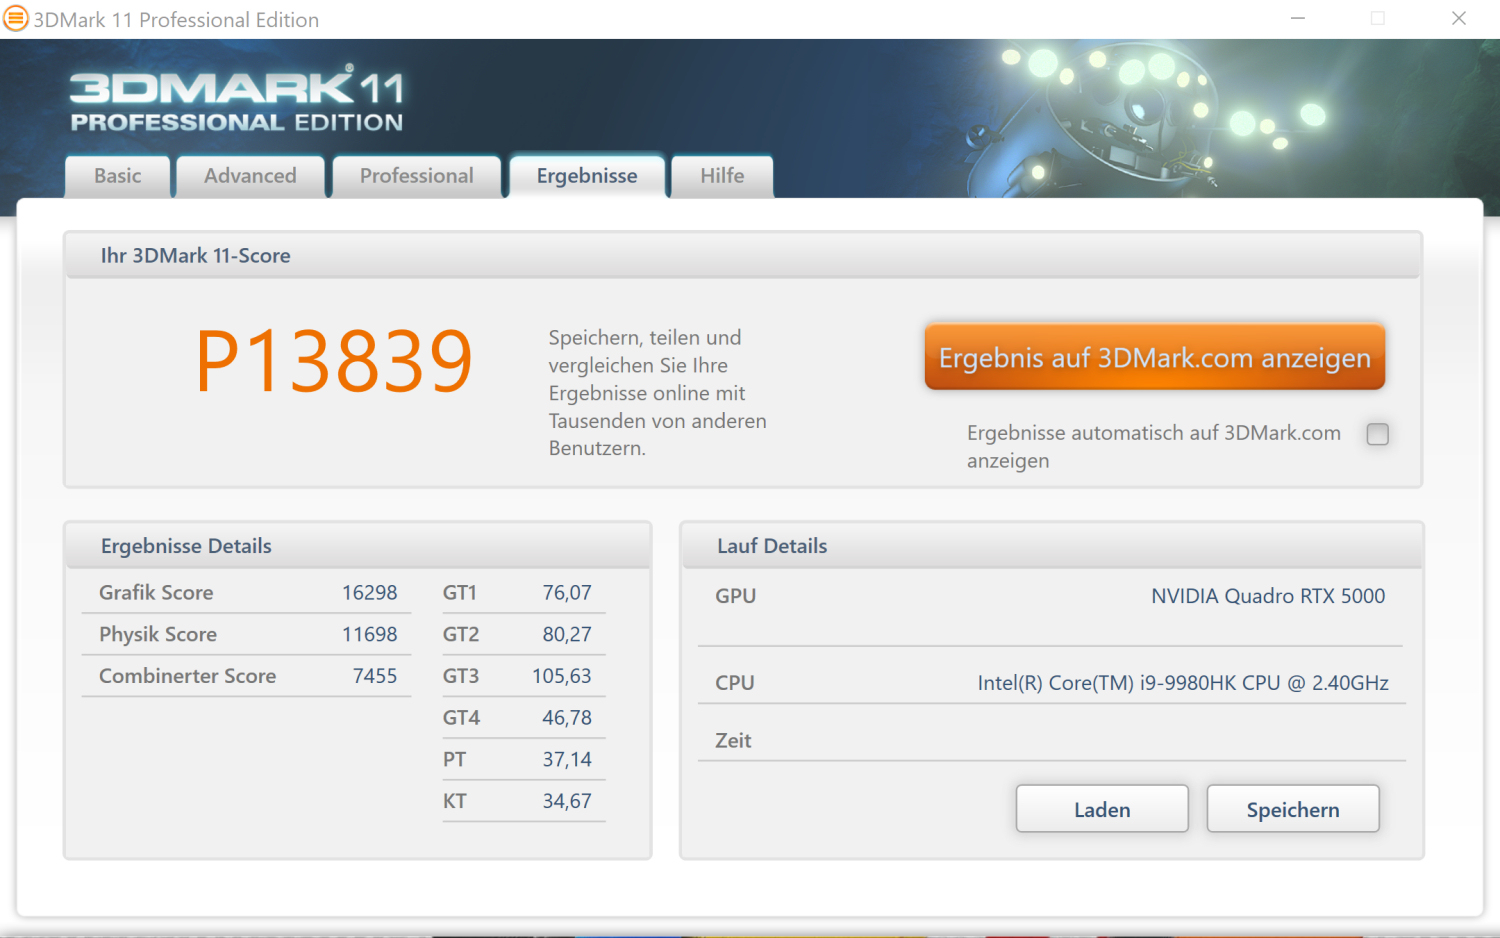
| 3DMark 11 Performance | 26416 punti | |
| 3DMark Ice Storm Standard Score | 184872 punti | |
| 3DMark Cloud Gate Standard Score | 44296 punti | |
| 3DMark Fire Strike Score | 20374 punti | |
| 3DMark Time Spy Score | 9779 punti | |
Aiuto | ||
| Geekbench 5.5 | |
| Vulkan Score 5.1 | |
| Acer ConceptD 9 Pro | |
| Media NVIDIA Quadro RTX 5000 (Laptop) (n=1) | |
| OpenCL Score 5.1 | |
| Acer ConceptD 9 Pro | |
| Media NVIDIA Quadro RTX 5000 (Laptop) (n=1) | |
| VRMark | |
| Cyan Room | |
| Acer ConceptD 9 Pro | |
| Media NVIDIA Quadro RTX 5000 (Laptop) (n=1) | |
| Blue Room | |
| Acer ConceptD 9 Pro | |
| Media NVIDIA Quadro RTX 5000 (Laptop) (n=1) | |
| Orange Room | |
| Acer ConceptD 9 Pro | |
| Media NVIDIA Quadro RTX 5000 (Laptop) (n=1) | |
| Basemark GPU 1.2 | |
| 1920x1080 OpenGL Medium Offscreen | |
| Acer ConceptD 9 Pro | |
| Media NVIDIA Quadro RTX 5000 (Laptop) (n=1) | |
| 3840x2160 Vulkan High Offscreen | |
| Acer ConceptD 9 Pro | |
| Media NVIDIA Quadro RTX 5000 (Laptop) (n=1) | |
| Media della classe Workstation (3.64 - 3.64, n=10, ultimi 2 anni) | |
| 1920x1080 Vulkan Medium Offscreen | |
| Acer ConceptD 9 Pro | |
| Media NVIDIA Quadro RTX 5000 (Laptop) (n=1) | |
| Media della classe Workstation (104.6 - 2585, n=21, ultimi 2 anni) | |
Prestazioni Gaming
Anche se il CN917-71P non è tecnicamente un portatile gaming, può gestire tutti i giochi del nostro database con risoluzione Full HD e con impostazioni di massima qualità e visualizzarli senza problemi sul suo schermo opaco. Anche le risoluzioni superiori al Full HD non sono una grande sfida per questa GPU.
| The Witcher 3 - 1920x1080 Ultra Graphics & Postprocessing (HBAO+) | |
| Acer ConceptD 9 Pro | |
| Media NVIDIA Quadro RTX 5000 (Laptop) (90.4 - 109.9, n=2) | |
| Media della classe Workstation (n=1ultimi 2 anni) | |
| Razer Blade 15 Studio Edition | |
| Lenovo ThinkPad P53-20QN000YGE | |
| Eurocom Tornado F7W | |
| MSI WE75 9TK | |
| Lenovo ThinkPad P73-20QR002DGE | |
| Dell Precision 7730 | |
| BioShock Infinite - 1920x1080 Ultra Preset, DX11 (DDOF) | |
| Acer ConceptD 9 Pro | |
| Media NVIDIA Quadro RTX 5000 (Laptop) (n=1) | |
| Razer Blade 15 Studio Edition | |
| MSI WE75 9TK | |
| Lenovo ThinkPad P73-20QR002DGE | |
| Dell Precision 7730 | |
| Fujitsu Celsius H980 | |
| Far Cry 5 - 1920x1080 Ultra Preset AA:T | |
| Acer ConceptD 9 Pro | |
| Media NVIDIA Quadro RTX 5000 (Laptop) (n=1) | |
| Media della classe Workstation (37 - 128, n=9, ultimi 2 anni) | |
| Fujitsu Celsius H980 | |
| Shadow of the Tomb Raider - 1920x1080 Highest Preset AA:T | |
| Acer ConceptD 9 Pro | |
| Media NVIDIA Quadro RTX 5000 (Laptop) (73.1 - 118, n=2) | |
| Lenovo ThinkPad P53-20QN000YGE | |
| MSI WE75 9TK | |
| Eurocom Tornado F7W | |
| Borderlands 3 - 1920x1080 Badass Overall Quality (DX11) | |
| Acer ConceptD 9 Pro | |
| Media NVIDIA Quadro RTX 5000 (Laptop) (n=1) | |
| Razer Blade 15 Studio Edition | |
Per determinare se i frame rate rimangono costanti per un periodo di tempo prolungato, eseguiamo The Witcher 3 per circa 60 minuti con risoluzione Full HD e impostazioni di qualità massima. Durante tutto il tempo, il personaggio ritratto dal giocatore non viene mosso. I nostri risultati mostrano che i frame rate rimangono su un livello giocabile per tutta la durata. Non abbiamo osservato alcun calo di prestazioni.
| basso | medio | alto | ultra | QHD | 4K | |
|---|---|---|---|---|---|---|
| Tomb Raider (2013) | 757 | 681 | 625 | 319.6 | ||
| BioShock Infinite (2013) | 458 | 396.9 | 367.9 | 216.3 | ||
| The Witcher 3 (2015) | 375.3 | 308.5 | 198.6 | 109.9 | 71 | |
| Rainbow Six Siege (2015) | 350.2 | 296.1 | 279.6 | 266.2 | 138 | |
| For Honor (2017) | 329.3 | 216.9 | 206.8 | 160.4 | 68.4 | |
| Far Cry 5 (2018) | 150 | 128 | 123 | 115 | 102 | 56 |
| Shadow of the Tomb Raider (2018) | 147 | 130 | 126 | 118 | 87 | 47 |
| Assassin´s Creed Odyssey (2018) | 113 | 104 | 94 | 73 | 63 | 40 |
| Battlefield V (2018) | 187 | 164.6 | 161.7 | 151.9 | 123.9 | 72.7 |
| Apex Legends (2019) | 144 | 144 | 144 | 143.9 | 135 | 76.3 |
| Metro Exodus (2019) | 161 | 124.4 | 95.2 | 77 | 59.3 | 36.7 |
| Dirt Rally 2.0 (2019) | 289.3 | 208.4 | 200.1 | 115.5 | 84.3 | 51.2 |
| The Division 2 (2019) | 178 | 156 | 131 | 55 | 55 | 38 |
| Anno 1800 (2019) | 119.2 | 118.8 | 93.1 | 51.1 | 46.9 | 30.3 |
| Rage 2 (2019) | 303.8 | 160.4 | 137.1 | 133.8 | 85.8 | 42.2 |
| Total War: Three Kingdoms (2019) | 271.6 | 154.6 | 113.7 | 83.6 | 53.3 | 25.9 |
| F1 2019 (2019) | 243 | 210 | 182 | 144 | 146 | 78 |
| Control (2019) | 239 | 123.7 | 93.3 | 60.5 | 30.1 | |
| Borderlands 3 (2019) | 153.8 | 130.2 | 104.5 | 85.5 | 59.8 | 31.5 |
| Ghost Recon Breakpoint (2019) | 152 | 125 | 118 | 88 | 66 | 38 |
| GRID 2019 (2019) | 186.6 | 144.5 | 142.5 | 100.7 | 80.7 | 54.9 |
| Call of Duty Modern Warfare 2019 (2019) | 232.6 | 156.2 | 144.9 | 119.3 | 86.6 | 48.8 |
| Need for Speed Heat (2019) | 109.9 | 104.9 | 98.7 | 95.9 | 89 | 52.7 |
| Star Wars Jedi Fallen Order (2019) | 112.8 | 112.1 | 107.5 | 89.6 | 50.2 | |
| Red Dead Redemption 2 (2019) | 145.6 | 125.9 | 87.4 | 54.1 | 43.7 | 28.1 |
| Escape from Tarkov (2020) | 121 | 121 | 120.3 | 110.6 | 106.6 | 53.8 |
| Hunt Showdown (2020) | 231.1 | 163.8 | 130.4 | 87.8 | 77.1 | |
| Doom Eternal (2020) | 234.5 | 200.2 | 183.7 | 180.8 | 128.5 | 68.6 |
Emissioni - ConceptD 9 Pro con rumore e temperature limitati
Rumorosità di sistema
Le ventole del ConceptD Pro girano in modo permanente a basse velocità durante il periodo di inattività. In questa modalità sono appena udibili. Sotto carico, girano in modo evidente. Durante il nostro stress test abbiamo registrato un livello di rumore delle ventole di 44,1 dB(A). Durante il nostro test The Witcher 3, questo valore è leggermente più alto.
Sfortunatamente, c'è un rumore elettronico frequente e notevole che proviene dall'interno del case. Si verifica quando si spostano grandi quantità di dati - per esempio quando si inizia una partita.
Rumorosità
| Idle |
| 31.6 / 31.6 / 31.9 dB(A) |
| Sotto carico |
| 41.2 / 44.1 dB(A) |
 | ||
30 dB silenzioso 40 dB(A) udibile 50 dB(A) rumoroso |
||
min: | ||
| Acer ConceptD 9 Pro i9-9980HK, Quadro RTX 5000 (Laptop) | Lenovo ThinkPad P73-20QR002DGE i7-9850H, Quadro RTX 3000 (Laptop) | MSI WE75 9TK i7-9750H, Quadro RTX 3000 (Laptop) | Dell Precision 7730 i7-8850H, Quadro P3200 | Eurocom Tornado F7W i9-9900K, Quadro P5200 | Fujitsu Celsius H980 i7-8750H, Quadro P3200 | Media NVIDIA Quadro RTX 5000 (Laptop) | Media della classe Workstation | |
|---|---|---|---|---|---|---|---|---|
| Noise | 16% | 3% | 9% | -12% | 2% | 4% | 12% | |
| off /ambiente * (dB) | 30.8 | 29.3 5% | 28.5 7% | 29.7 4% | 28.2 8% | 29.6 4% | 30.1 ? 2% | 24.1 ? 22% |
| Idle Minimum * (dB) | 31.6 | 29.3 7% | 29 8% | 29.7 6% | 33.2 -5% | 29.6 6% | 30.5 ? 3% | 24.8 ? 22% |
| Idle Average * (dB) | 31.6 | 29.3 7% | 29 8% | 29.7 6% | 33.2 -5% | 32.5 -3% | 30.5 ? 3% | 25.5 ? 19% |
| Idle Maximum * (dB) | 31.9 | 29.3 8% | 31.5 1% | 29.7 7% | 33.2 -4% | 32.5 -2% | 31.2 ? 2% | 26.7 ? 16% |
| Load Average * (dB) | 41.2 | 30.2 27% | 32 22% | 31.4 24% | 47 -14% | 34.9 15% | 36.9 ? 10% | 39.2 ? 5% |
| Witcher 3 ultra * (dB) | 44.6 | 30.7 31% | 44.7 -0% | 37.9 15% | 52.2 -17% | |||
| Load Maximum * (dB) | 44.1 | 33.1 25% | 56.5 -28% | 44.2 -0% | 64 -45% | 49.1 -11% | 41.6 ? 6% | 50.7 ? -15% |
* ... Meglio usare valori piccoli
Temperature
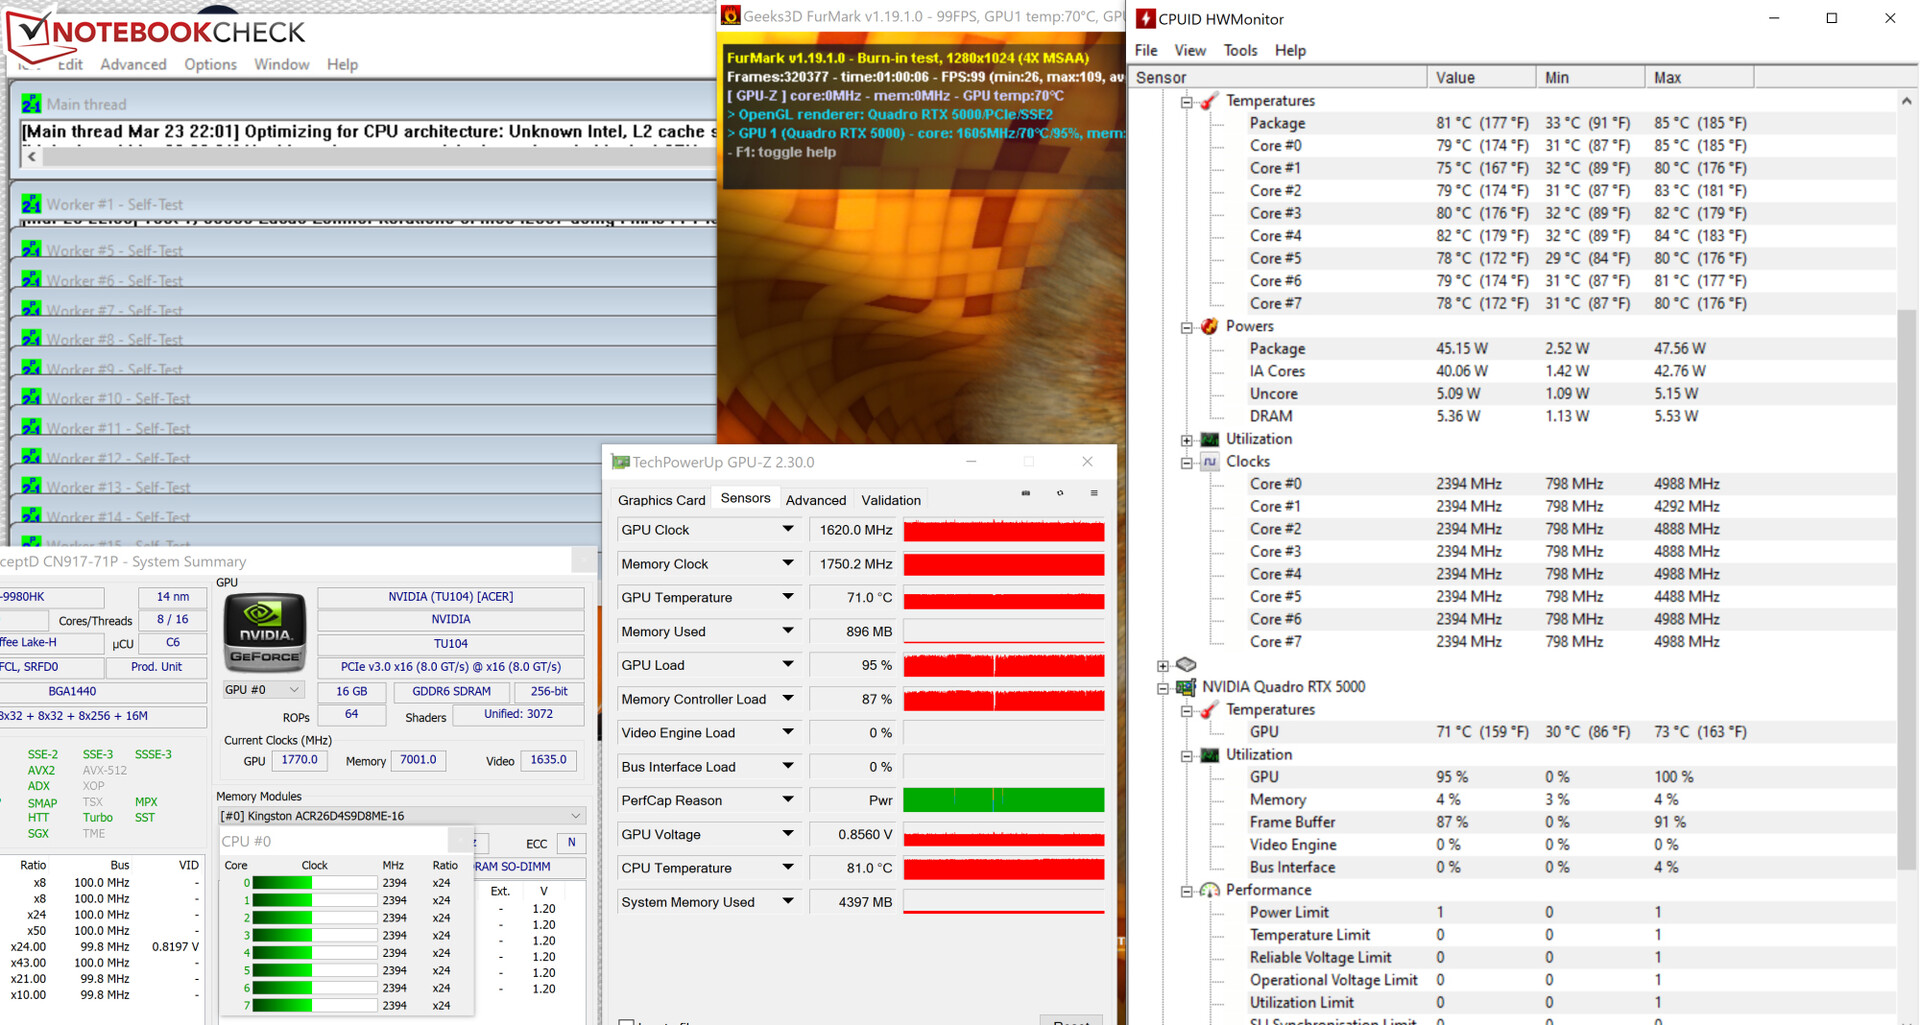
Durante il nostro stress test (con Prime95 e FurMark per almeno un'ora), la CPU e la GPU funzionano rispettivamente a 2,3-2,6 GHz e da 1600 a 1700 MHz, mentre sono alimentate. In modalità batteria, questi valori scendono a 800 MHz (CPU) e 300 MHz (GPU). Il test di stress rappresenta un caso estremo che non si verifica durante l'uso quotidiano. Utilizziamo questo test per determinare se il sistema è stabile anche quando è sotto carico massimo.
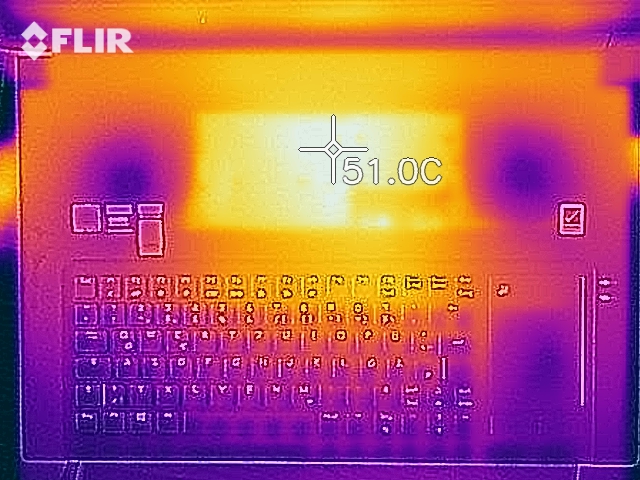
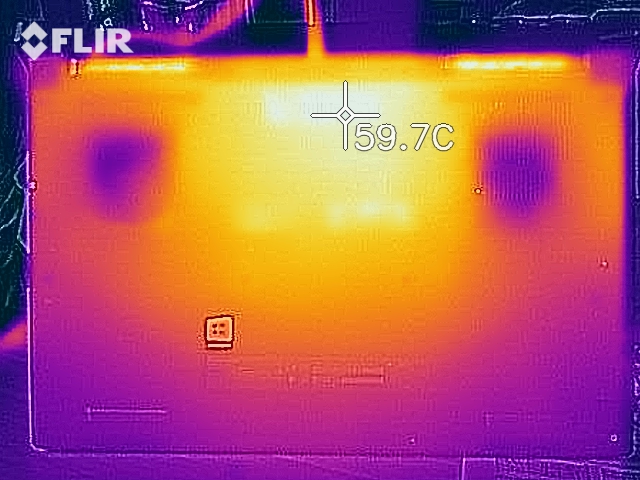
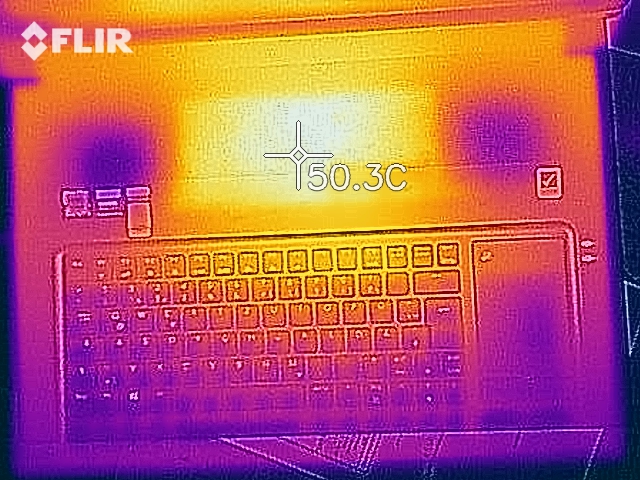
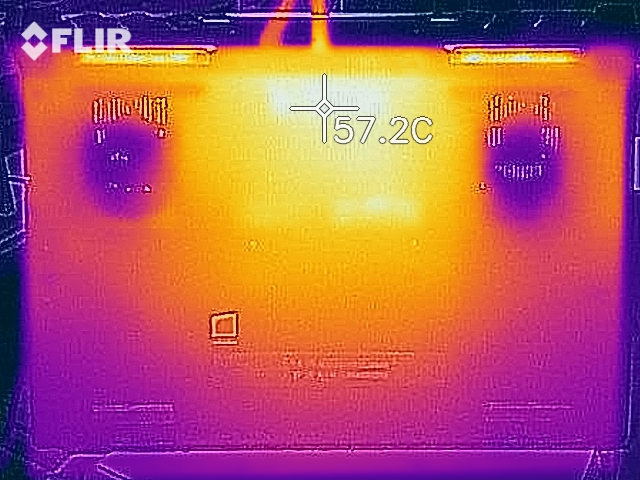
Nonostante il potente hardware, lo sviluppo di calore del laptop è moderato. Durante l'esecuzione del nostro stress test, misuriamo solo una temperatura superiore a 50 °C in un punto. Durante il nostro test The Witcher 3, le temperature salgono a livelli più alti. Gli utenti non dovranno preoccuparsi delle temperature durante l'uso quotidiano.
(±) La temperatura massima sul lato superiore è di 43 °C / 109 F, rispetto alla media di 38.2 °C / 101 F, che varia da 22.2 a 69.8 °C per questa classe Workstation.
(-) Il lato inferiore si riscalda fino ad un massimo di 53 °C / 127 F, rispetto alla media di 41.1 °C / 106 F
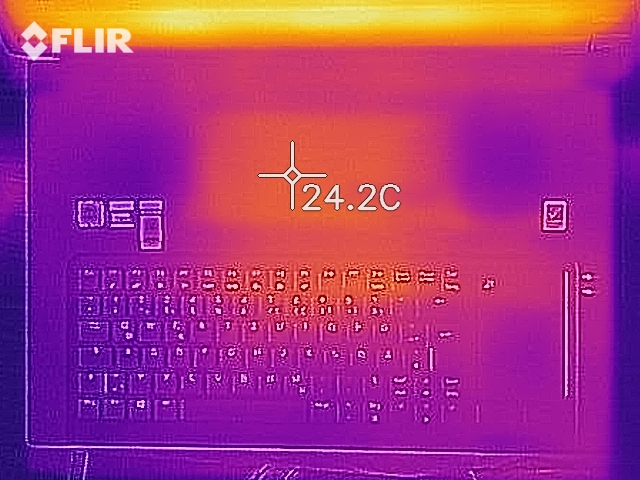
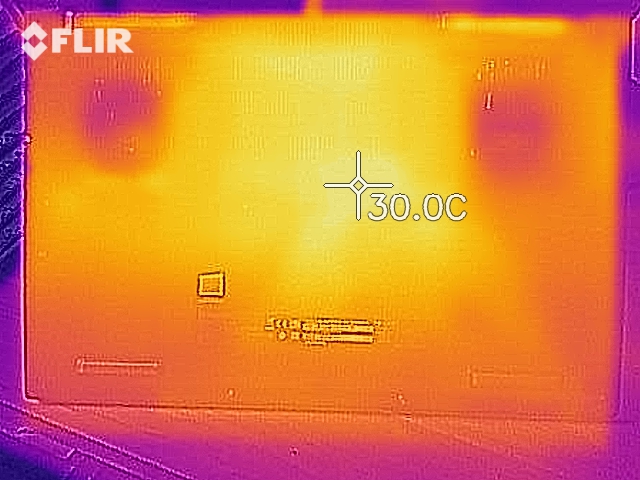
(+) In idle, la temperatura media del lato superiore è di 23.9 °C / 75 F, rispetto alla media deld ispositivo di 32 °C / 90 F.
(±) Riproducendo The Witcher 3, la temperatura media per il lato superiore e' di 34.8 °C / 95 F, rispetto alla media del dispositivo di 32 °C / 90 F.
(+) I poggiapolsi e il touchpad raggiungono la temperatura massima della pelle (32.2 °C / 90 F) e quindi non sono caldi.
(-) La temperatura media della zona del palmo della mano di dispositivi simili e'stata di 27.8 °C / 82 F (-4.4 °C / -8 F).
| Acer ConceptD 9 Pro i9-9980HK, Quadro RTX 5000 (Laptop) | Lenovo ThinkPad P73-20QR002DGE i7-9850H, Quadro RTX 3000 (Laptop) | MSI WE75 9TK i7-9750H, Quadro RTX 3000 (Laptop) | Dell Precision 7730 i7-8850H, Quadro P3200 | Eurocom Tornado F7W i9-9900K, Quadro P5200 | Fujitsu Celsius H980 i7-8750H, Quadro P3200 | Media NVIDIA Quadro RTX 5000 (Laptop) | Media della classe Workstation | |
|---|---|---|---|---|---|---|---|---|
| Heat | -7% | -7% | -16% | 12% | 2% | -1% | -8% | |
| Maximum Upper Side * (°C) | 43 | 52.2 -21% | 40.6 6% | 50 -16% | 34 21% | 41.8 3% | 43.5 ? -1% | 44 ? -2% |
| Maximum Bottom * (°C) | 53 | 47.8 10% | 46 13% | 59.8 -13% | 47.6 10% | 46.2 13% | 54.3 ? -2% | 45 ? 15% |
| Idle Upper Side * (°C) | 24.8 | 26.9 -8% | 29.2 -18% | 27.9 -13% | 23 7% | 25.6 -3% | 25.1 ? -1% | 30.6 ? -23% |
| Idle Bottom * (°C) | 25.6 | 28 -9% | 32.4 -27% | 31.4 -23% | 23.4 9% | 26.6 -4% | 25.8 ? -1% | 31.6 ? -23% |
* ... Meglio usare valori piccoli
Altoparlanti
I quattro altoparlanti della postazione di lavoro Acer si trovano sul fondo, vicino alla parte anteriore dell'apparecchio. Producono un suono più che adeguato, anche se non ci sono quasi più bassi. Inoltre, il livello massimo del volume potrebbe essere leggermente più alto.
Acer ConceptD 9 Pro analisi audio
(-) | altoparlanti non molto potenti (69.9 dB)
Bassi 100 - 315 Hz
(-) | quasi nessun basso - in media 22.1% inferiori alla media
(±) | la linearità dei bassi è media (11.8% delta rispetto alla precedente frequenza)
Medi 400 - 2000 Hz
(+) | medi bilanciati - solo only 3.4% rispetto alla media
(±) | linearità dei medi adeguata (7.2% delta rispetto alla precedente frequenza)
Alti 2 - 16 kHz
(+) | Alti bilanciati - appena 3.3% dalla media
(±) | la linearità degli alti è media (10.1% delta rispetto alla precedente frequenza)
Nel complesso 100 - 16.000 Hz
(±) | la linearità complessiva del suono è media (20.8% di differenza rispetto alla media
Rispetto alla stessa classe
» 75% di tutti i dispositivi testati in questa classe è stato migliore, 6% simile, 18% peggiore
» Il migliore ha avuto un delta di 7%, medio di 17%, peggiore di 35%
Rispetto a tutti i dispositivi testati
» 56% di tutti i dispositivi testati in questa classe è stato migliore, 8% similare, 36% peggiore
» Il migliore ha avuto un delta di 4%, medio di 23%, peggiore di 134%
Gestione Energetica - Consumo elevato, autonomia breve
Consumo Energetico
Non deve sorprendere che il CN917 consumi una discreta quantità di energia mentre è al minimo. La GPU dedicata RTX 5000 funziona a tempo pieno dopo tutto. Durante lo stress test, il consumo di energia sale fino a un picco di 241 watt. Durante il gioco (The Witcher 3 test), abbiamo registrato un consumo medio di 221 watt (da 216 a 229 watt). L'alimentatore è da 330 watt.
| Off / Standby | |
| Idle | |
| Sotto carico |
|
Leggenda:
min: | |
| Acer ConceptD 9 Pro i9-9980HK, Quadro RTX 5000 (Laptop) | Lenovo ThinkPad P73-20QR002DGE i7-9850H, Quadro RTX 3000 (Laptop) | MSI WE75 9TK i7-9750H, Quadro RTX 3000 (Laptop) | Dell Precision 7730 i7-8850H, Quadro P3200 | Eurocom Tornado F7W i9-9900K, Quadro P5200 | Fujitsu Celsius H980 i7-8750H, Quadro P3200 | Media NVIDIA Quadro RTX 5000 (Laptop) | Media della classe Workstation | |
|---|---|---|---|---|---|---|---|---|
| Power Consumption | 36% | 29% | 31% | -31% | 19% | 6% | 36% | |
| Idle Minimum * (Watt) | 18.8 | 8.9 53% | 12.1 36% | 10.1 46% | 28.5 -52% | 14.8 21% | 16.6 ? 12% | 9.11 ? 52% |
| Idle Average * (Watt) | 25 | 12.8 49% | 18.4 26% | 18 28% | 36.7 -47% | 20.4 18% | 22.1 ? 12% | 13.8 ? 45% |
| Idle Maximum * (Watt) | 30 | 16.4 45% | 18.8 37% | 19.7 34% | 37.8 -26% | 21.5 28% | 27.3 ? 9% | 17.9 ? 40% |
| Load Average * (Watt) | 116 | 108.4 7% | 95.1 18% | 89.6 23% | 144.6 -25% | 98.4 15% | 124.5 ? -7% | 96 ? 17% |
| Witcher 3 ultra * (Watt) | 221 | 153 31% | 135.5 39% | 134 39% | 218.9 1% | |||
| Load Maximum * (Watt) | 241 | 166 31% | 203.7 15% | 204 15% | 336 -39% | 213.5 11% | 232 ? 4% | 180.3 ? 25% |
* ... Meglio usare valori piccoli
Autonomia della batteria
Nel nostro test pratico con Wi-Fi, il ConceptD 9 raggiunge una autonomia di 3:38 h. In questo caso, simuliamo un carico di navigazione sul web con l'aiuto di uno script. Per questo test abbiamo selezionato il profilo "bilanciato" e impostato la luminosità del display a circa 150 cd/m². Nel nostro test video, questa workstation da 17,3 pollici dura 3:32 h. Questo test consiste nel riprodurre il cortometraggio Big Buck Bunny (codec H.264, 1920x1080 pixel) in un loop continuo. Prima del test, abbiamo selezionato il profilo "power saver" e ridotto la luminosità del display a 150 cd/m².
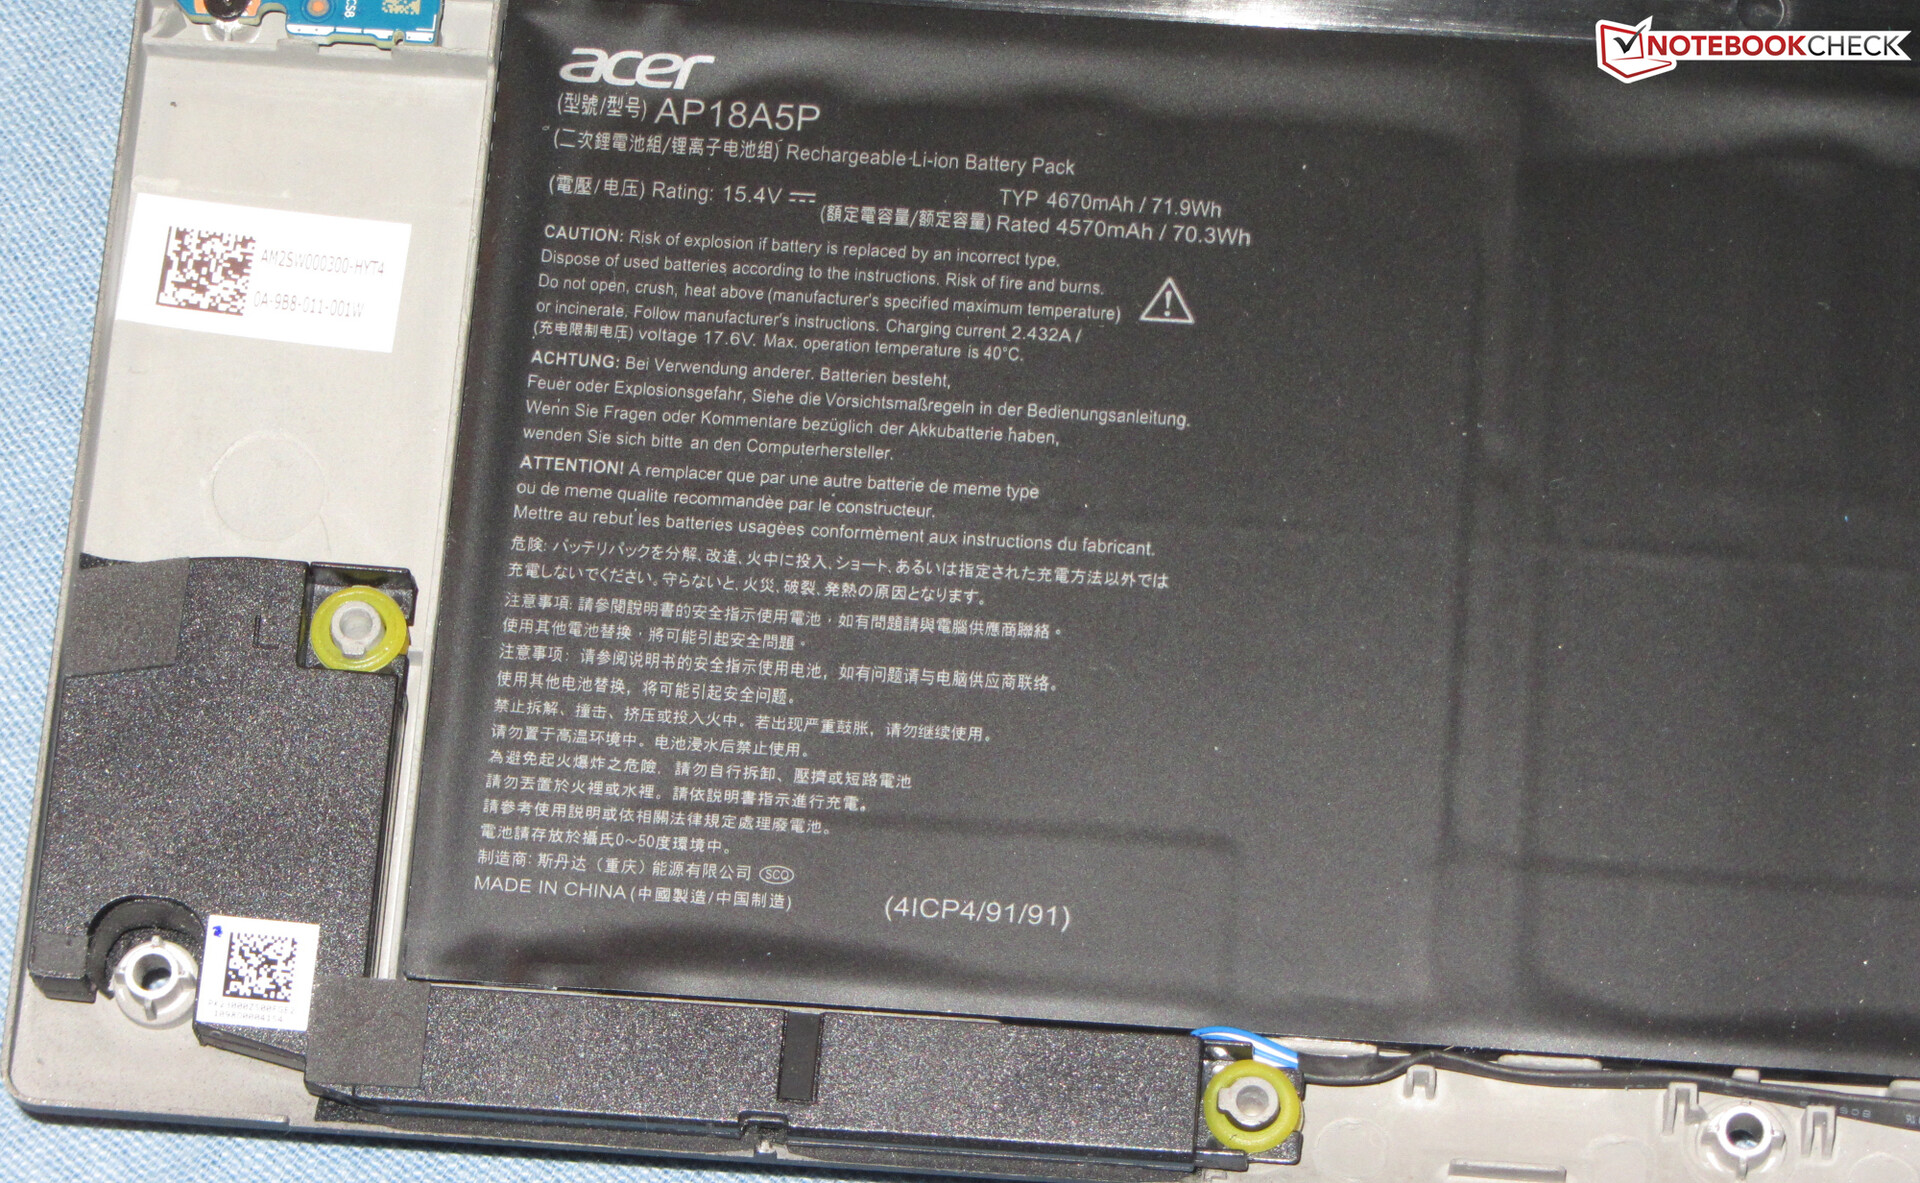
| Acer ConceptD 9 Pro i9-9980HK, Quadro RTX 5000 (Laptop), 71.9 Wh | Lenovo ThinkPad P73-20QR002DGE i7-9850H, Quadro RTX 3000 (Laptop), 99 Wh | MSI WE75 9TK i7-9750H, Quadro RTX 3000 (Laptop), 65 Wh | Dell Precision 7730 i7-8850H, Quadro P3200, 92 Wh | Eurocom Tornado F7W i9-9900K, Quadro P5200, 90 Wh | Fujitsu Celsius H980 i7-8750H, Quadro P3200, 96 Wh | Media della classe Workstation | |
|---|---|---|---|---|---|---|---|
| Autonomia della batteria | 148% | 53% | 63% | -17% | 104% | 197% | |
| Reader / Idle (h) | 5.2 | 11 112% | 13.5 160% | 26.1 ? 402% | |||
| H.264 (h) | 3.5 | 9.8 180% | 5.8 66% | 5.9 69% | 10.1 ? 189% | ||
| WiFi v1.3 (h) | 3.6 | 11.1 208% | 4.9 36% | 5.6 56% | 3 -17% | 8.3 131% | 8.55 ? 138% |
| Load (h) | 0.9 | 1.4 56% | 1 11% | 1.5 67% | 1.4 56% | 1.441 ? 60% |
Pro
Contro
Giudizio Complessivo
Con il ConceptD 9 Pro CN917-71P, Acer ha realizzato una workstation mobile convertibile nel formato da 17,3 pollici. In questo caso, il termine "mobile" dovrebbe essere usato solo in modo limitato, poiché il dispositivo pesa quasi 4,5 kg e offre una breve durata della batteria. Detto questo, spostarlo da una scrivania all'altra non è un problema.
Il ConceptD 9 Pro è uno strumento per utenti creativi che fa una buona impressione nel complesso.
Il processore Core i9-9980HK e la GPU GeForce RTX 5000 all'interno del laptop sono alcuni dei componenti più recenti. Mentre la CPU deve ridurre la sua velocità di clock dopo un breve periodo di stress, la scheda grafica è in grado di funzionare a velocità turbo costantemente elevate. Attraverso la porta Thunderbolt 3 è possibile collegare una GPU esterna ancora più potente.
Un telaio di metallo solido, elegante e ben costruito, ospita l'hardware del ConceptD. Le massicce cerniere del dispositivo sono una caratteristica fisica impressionante. Queste tengono il display saldamente in posizione, indipendentemente dalla sua angolazione, per consentire comodi input con la penna digitale.
L'impressionante display touchscreen IPS 4K ha un buon rapporto di contrasto, buoni angoli di visualizzazione, buona luminosità e - grazie alla validazione Pantone - ottimi colori. Tuttavia, non siamo stati in grado di confermare la copertura completa dello spazio colore AdobeRGB pubblicizzato dal produttore. Secondo le nostre misurazioni, solo l'84% è coperto (98% di sRGB).
Nel frattempo, l'SSD NVMe installato non solo offre buone velocità di trasferimento, ma anche molto spazio di archiviazione (1 TB). C'è anche uno slot per un SSD M.2 2280 secondario. Se sono installate due unità, possono essere utilizzate in RAID 0.
Acer ConceptD 9 Pro
- 03/30/2020 v7 (old)
Sascha Mölck
Price comparison
