Recensione del Razer Blade 15 Studio Edition: Solida Workstation con prestazioni elevate

Abbiamo dimestichezza con la workstation Razer. Il modello di prova di oggi è identico nella costruzione al Blade 15 Advanced Model. L'edizione Studio è equipaggiata con il processore Core i7-9750H e la GPU Quadro RTX 5000 Max-Q per essere in grado di fornire le prestazioni richieste. I concorrenti includono altre workstation come Lenovo ThinkPad P53, Dell Precision 5540, Fujitsu Celsius H780 e l'HP ZBook Studio G5.
Punteggio | Data | Modello | Peso | Altezza | Dimensione | Risoluzione | Prezzo |
|---|---|---|---|---|---|---|---|
| 86.6 % v7 (old) | 12/2019 | Razer Blade 15 Studio Edition i7-9750H, Quadro RTX 5000 Max-Q | 2.2 kg | 17.8 mm | 15.60" | 3840x2160 | |
| 88.8 % v6 (old) | 05/2019 | Razer Blade 15 RTX 2080 Max-Q i7-9750H, GeForce RTX 2080 Max-Q | 2.2 kg | 17.8 mm | 15.60" | 1920x1080 | |
| 89.8 % v7 (old) | 11/2019 | Lenovo ThinkPad P53-20QN000YGE i7-9850H, Quadro RTX 5000 Max-Q | 2.7 kg | 29.4 mm | 15.60" | 1920x1080 | |
| 85 % v7 (old) | 06/2019 | MSI P65 Creator 9SF-657 i9-9880H, GeForce RTX 2070 Max-Q | 1.9 kg | 18 mm | 15.60" | 3840x2160 | |
| 86.9 % v7 (old) | 11/2019 | Dell Precision 5540 i9-9980HK, Quadro T2000 Max-Q | 2 kg | 17 mm | 15.60" | 3840x2160 | |
| 85.6 % v6 (old) | 04/2019 | Fujitsu Celsius H780 i7-8850H, Quadro P2000 | 2.8 kg | 31.9 mm | 15.60" | 1920x1080 | |
| 84.4 % v7 (old) | 12/2018 | HP ZBook Studio G5-4QH10EA i7-8750H, Quadro P1000 | 2.1 kg | 18.9 mm | 15.60" | 3840x2160 |
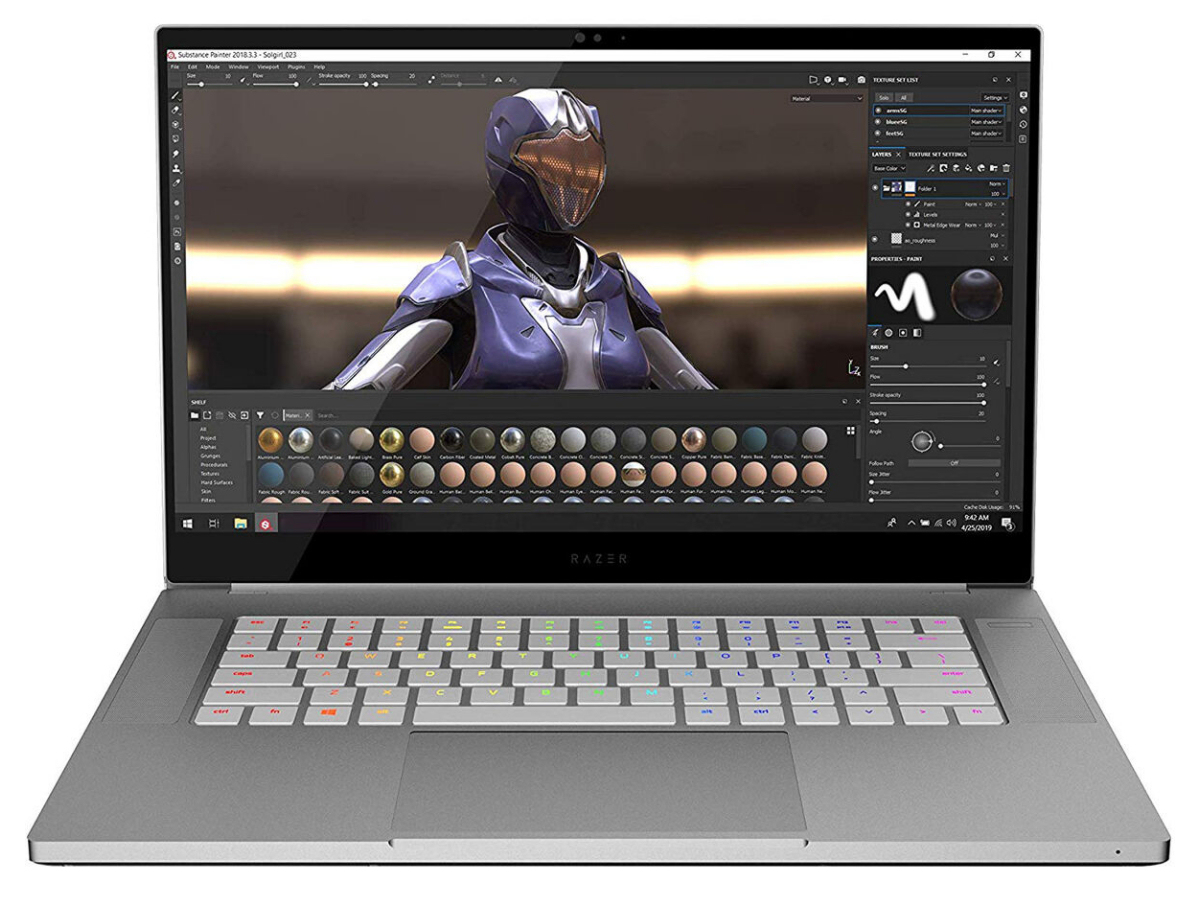
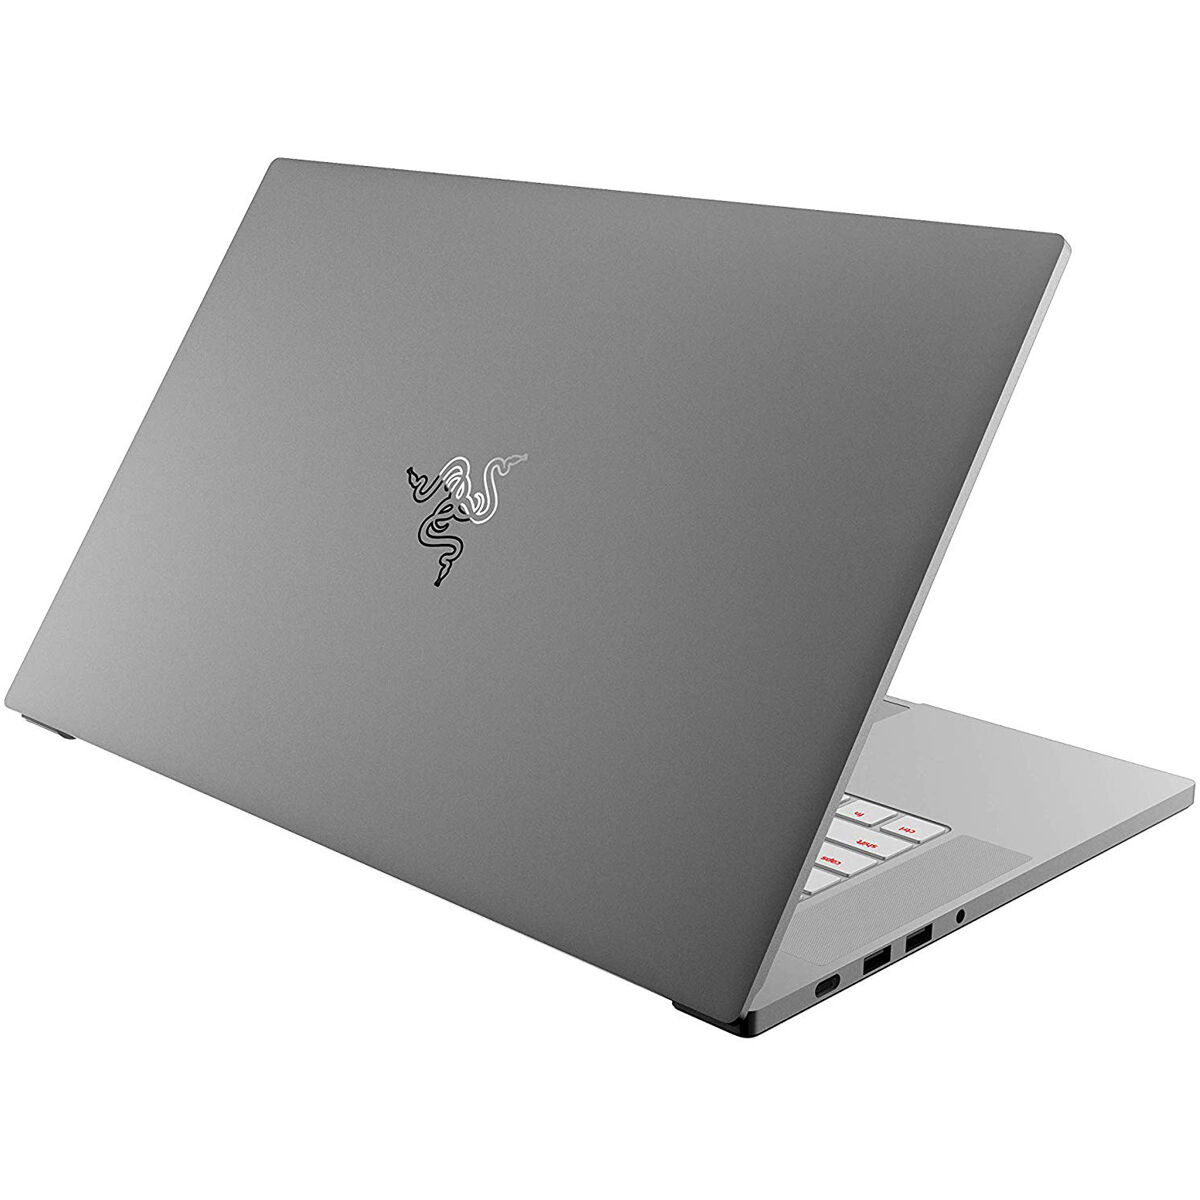
Case - Razer Blade 15 Studio Edition con acse robustoRobust Chassis
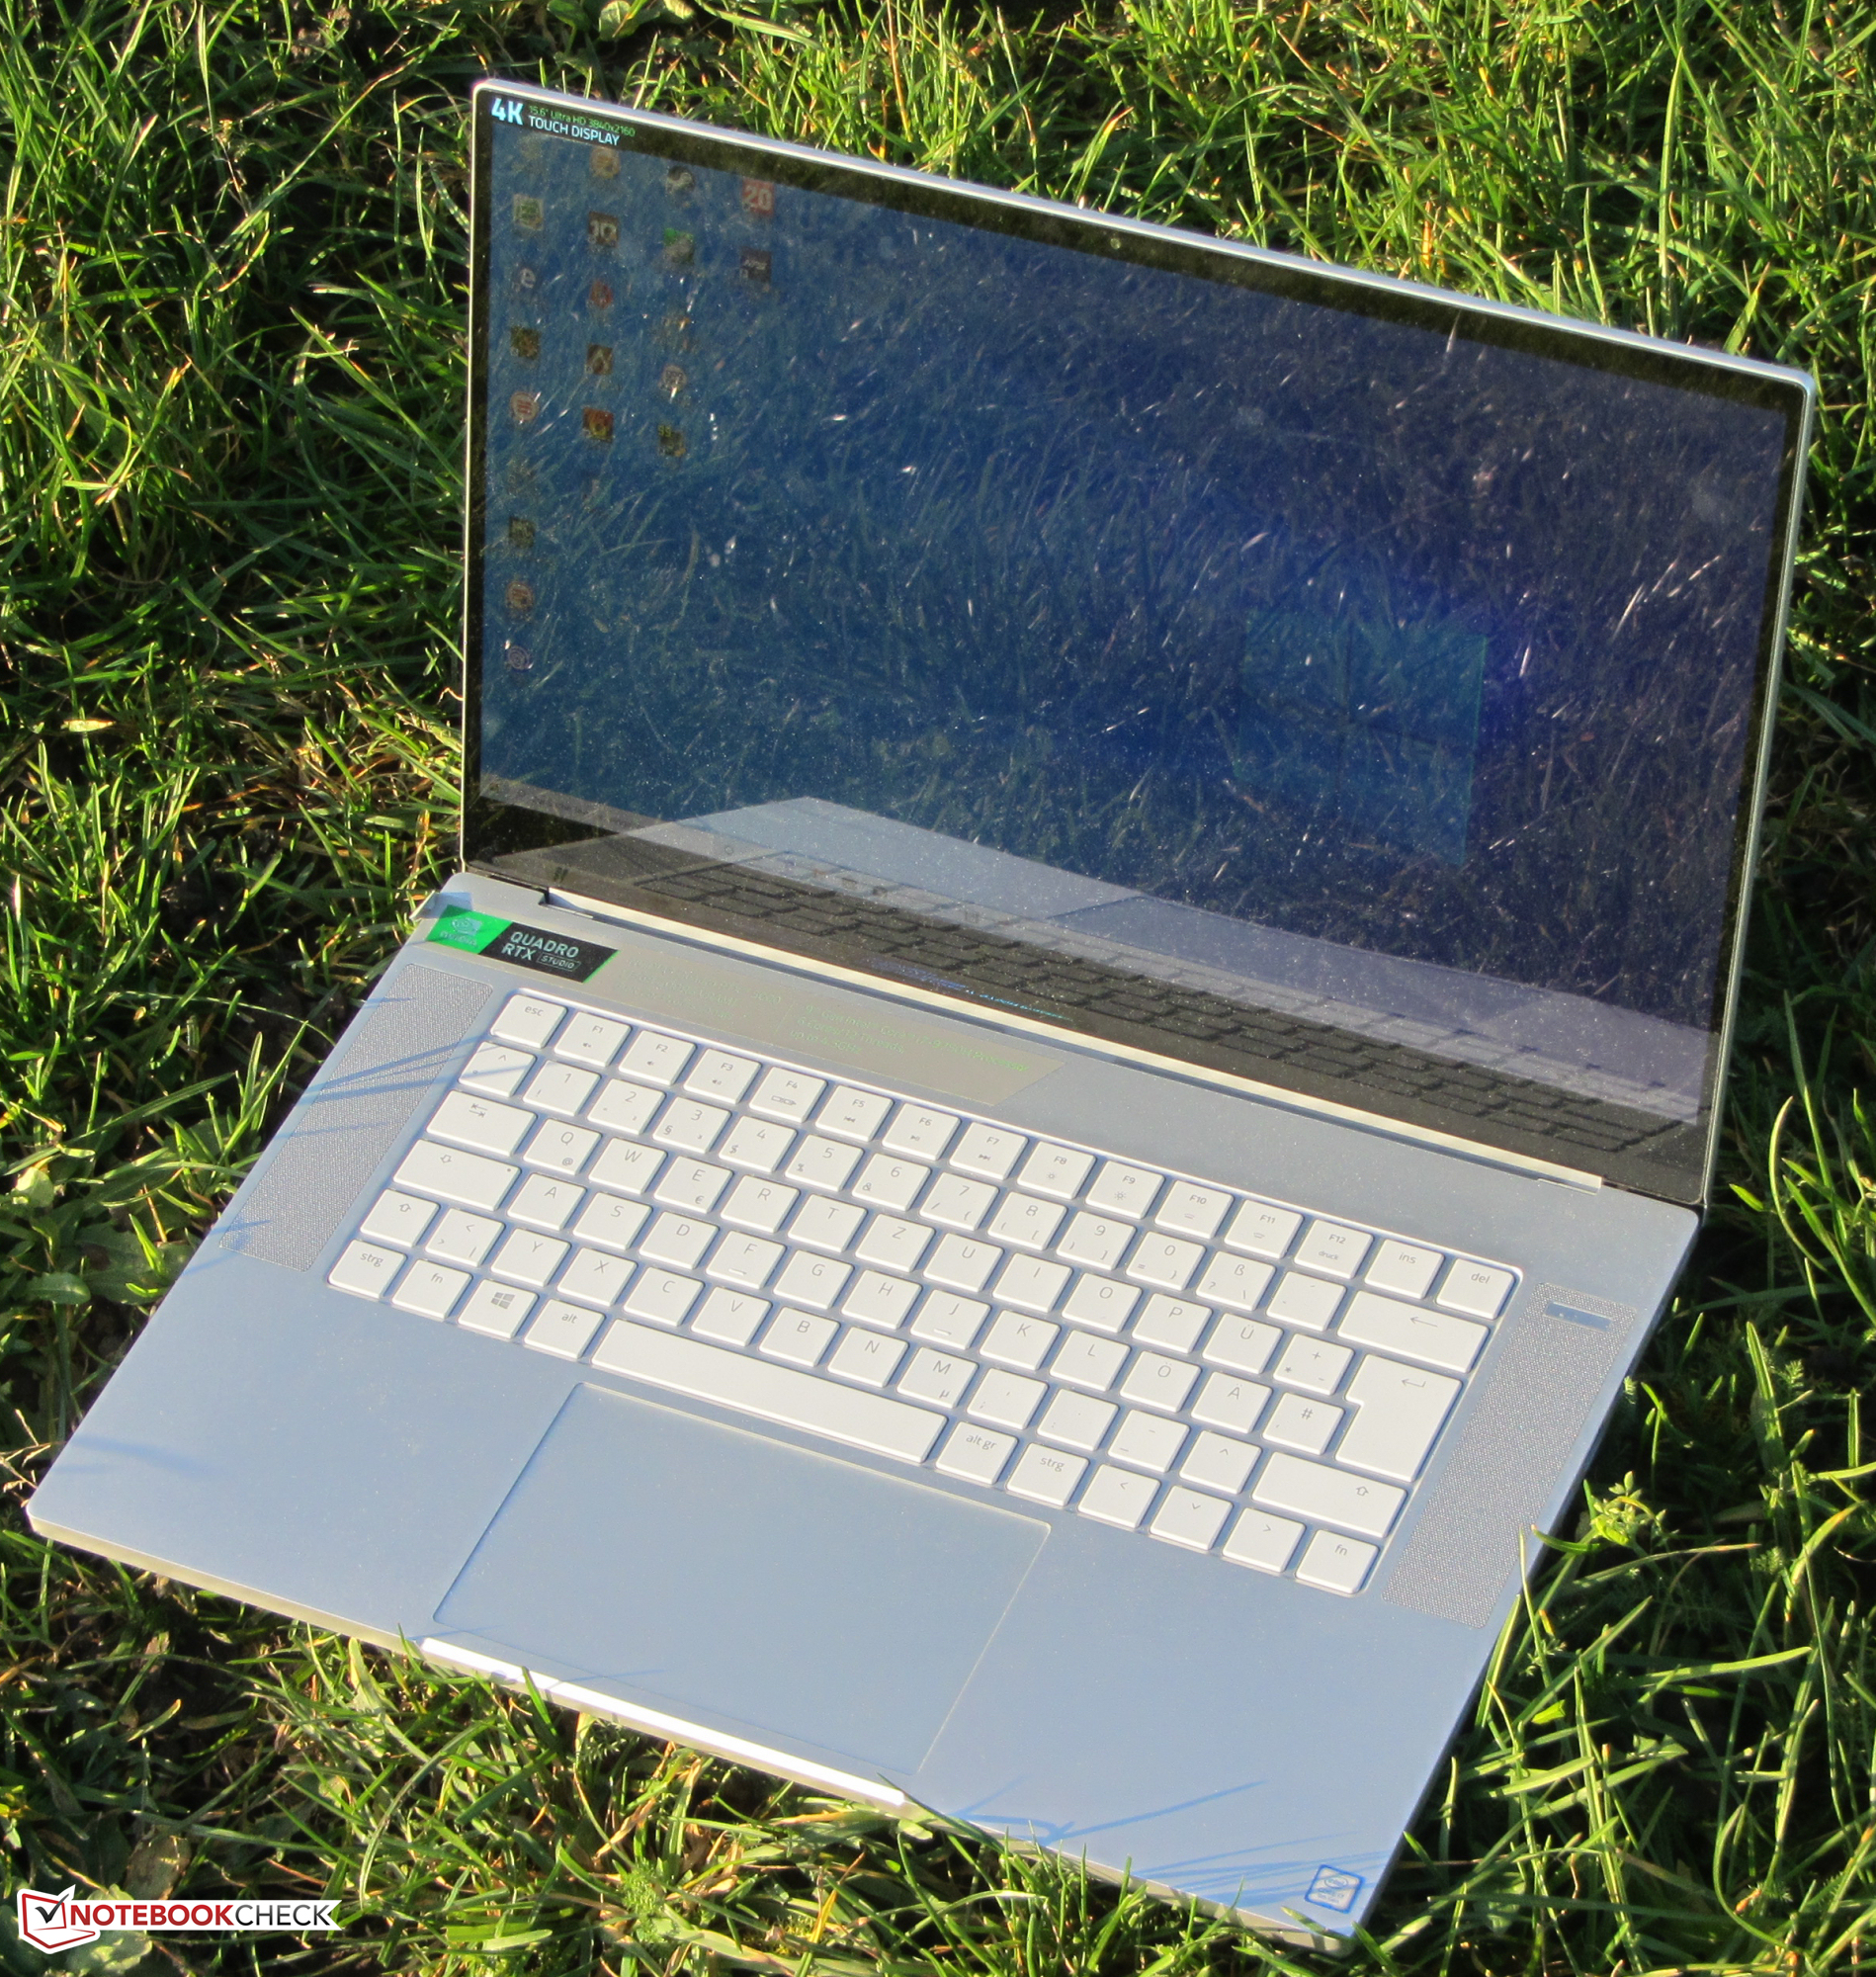
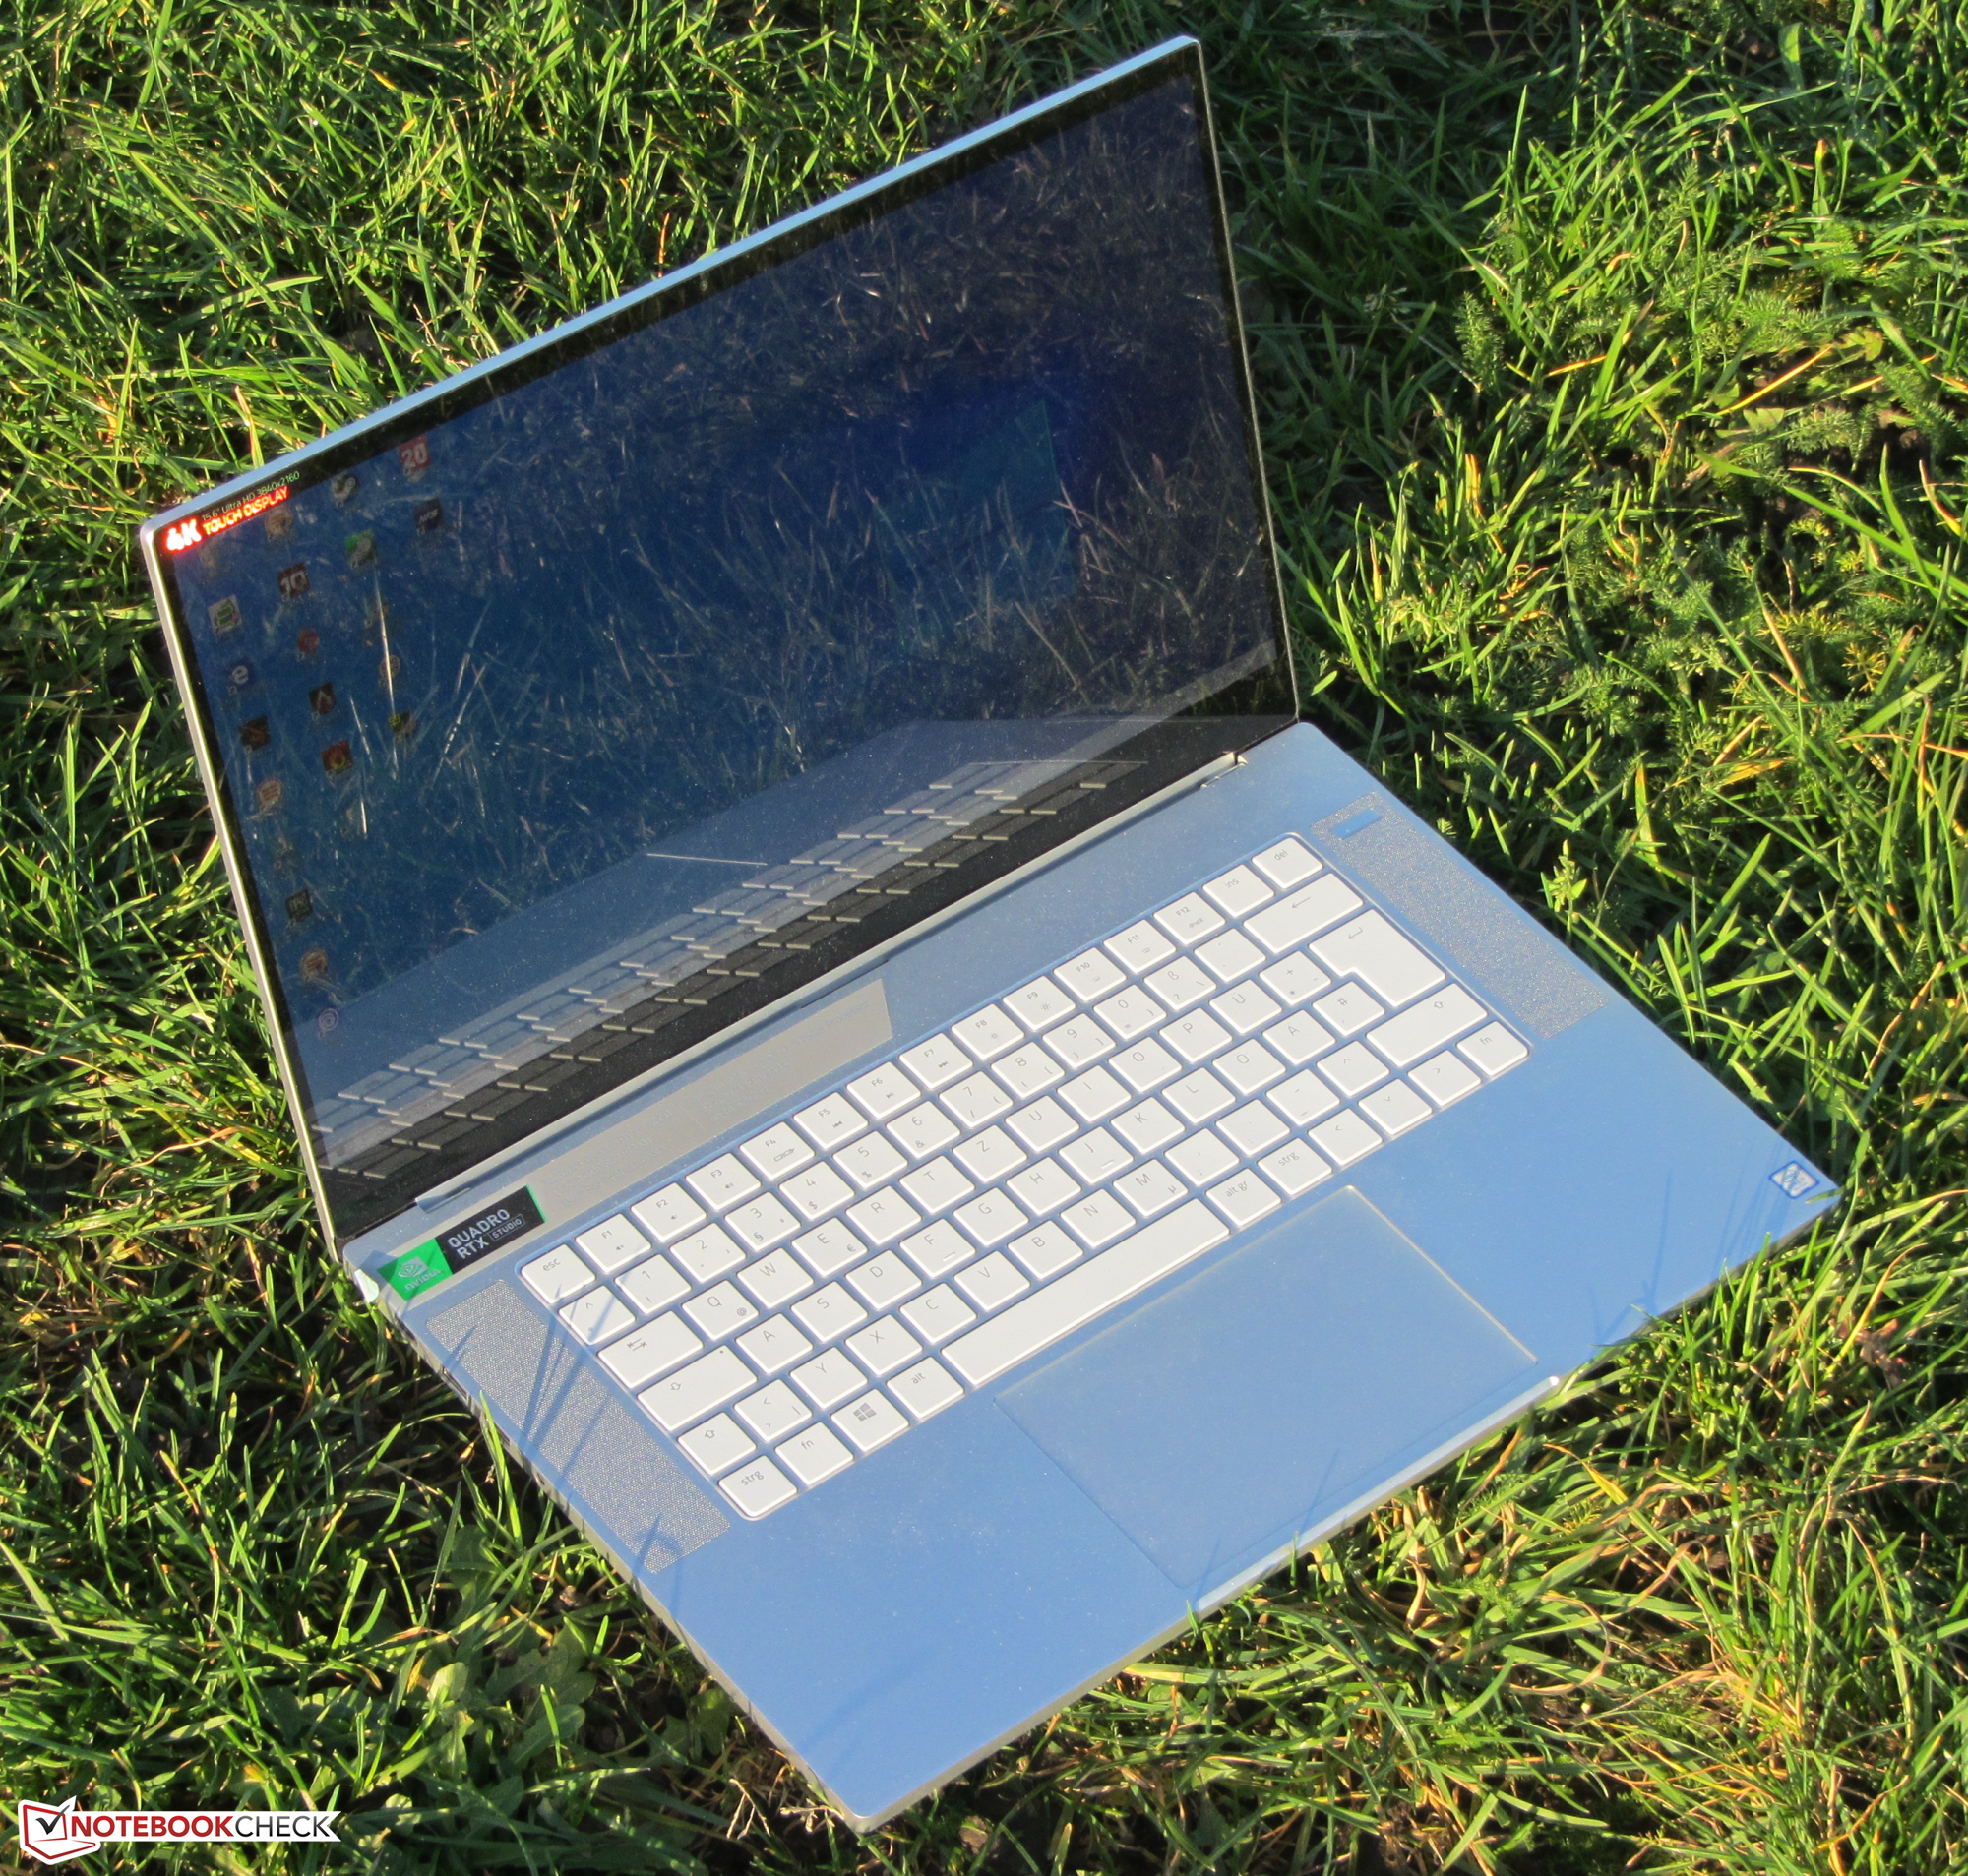
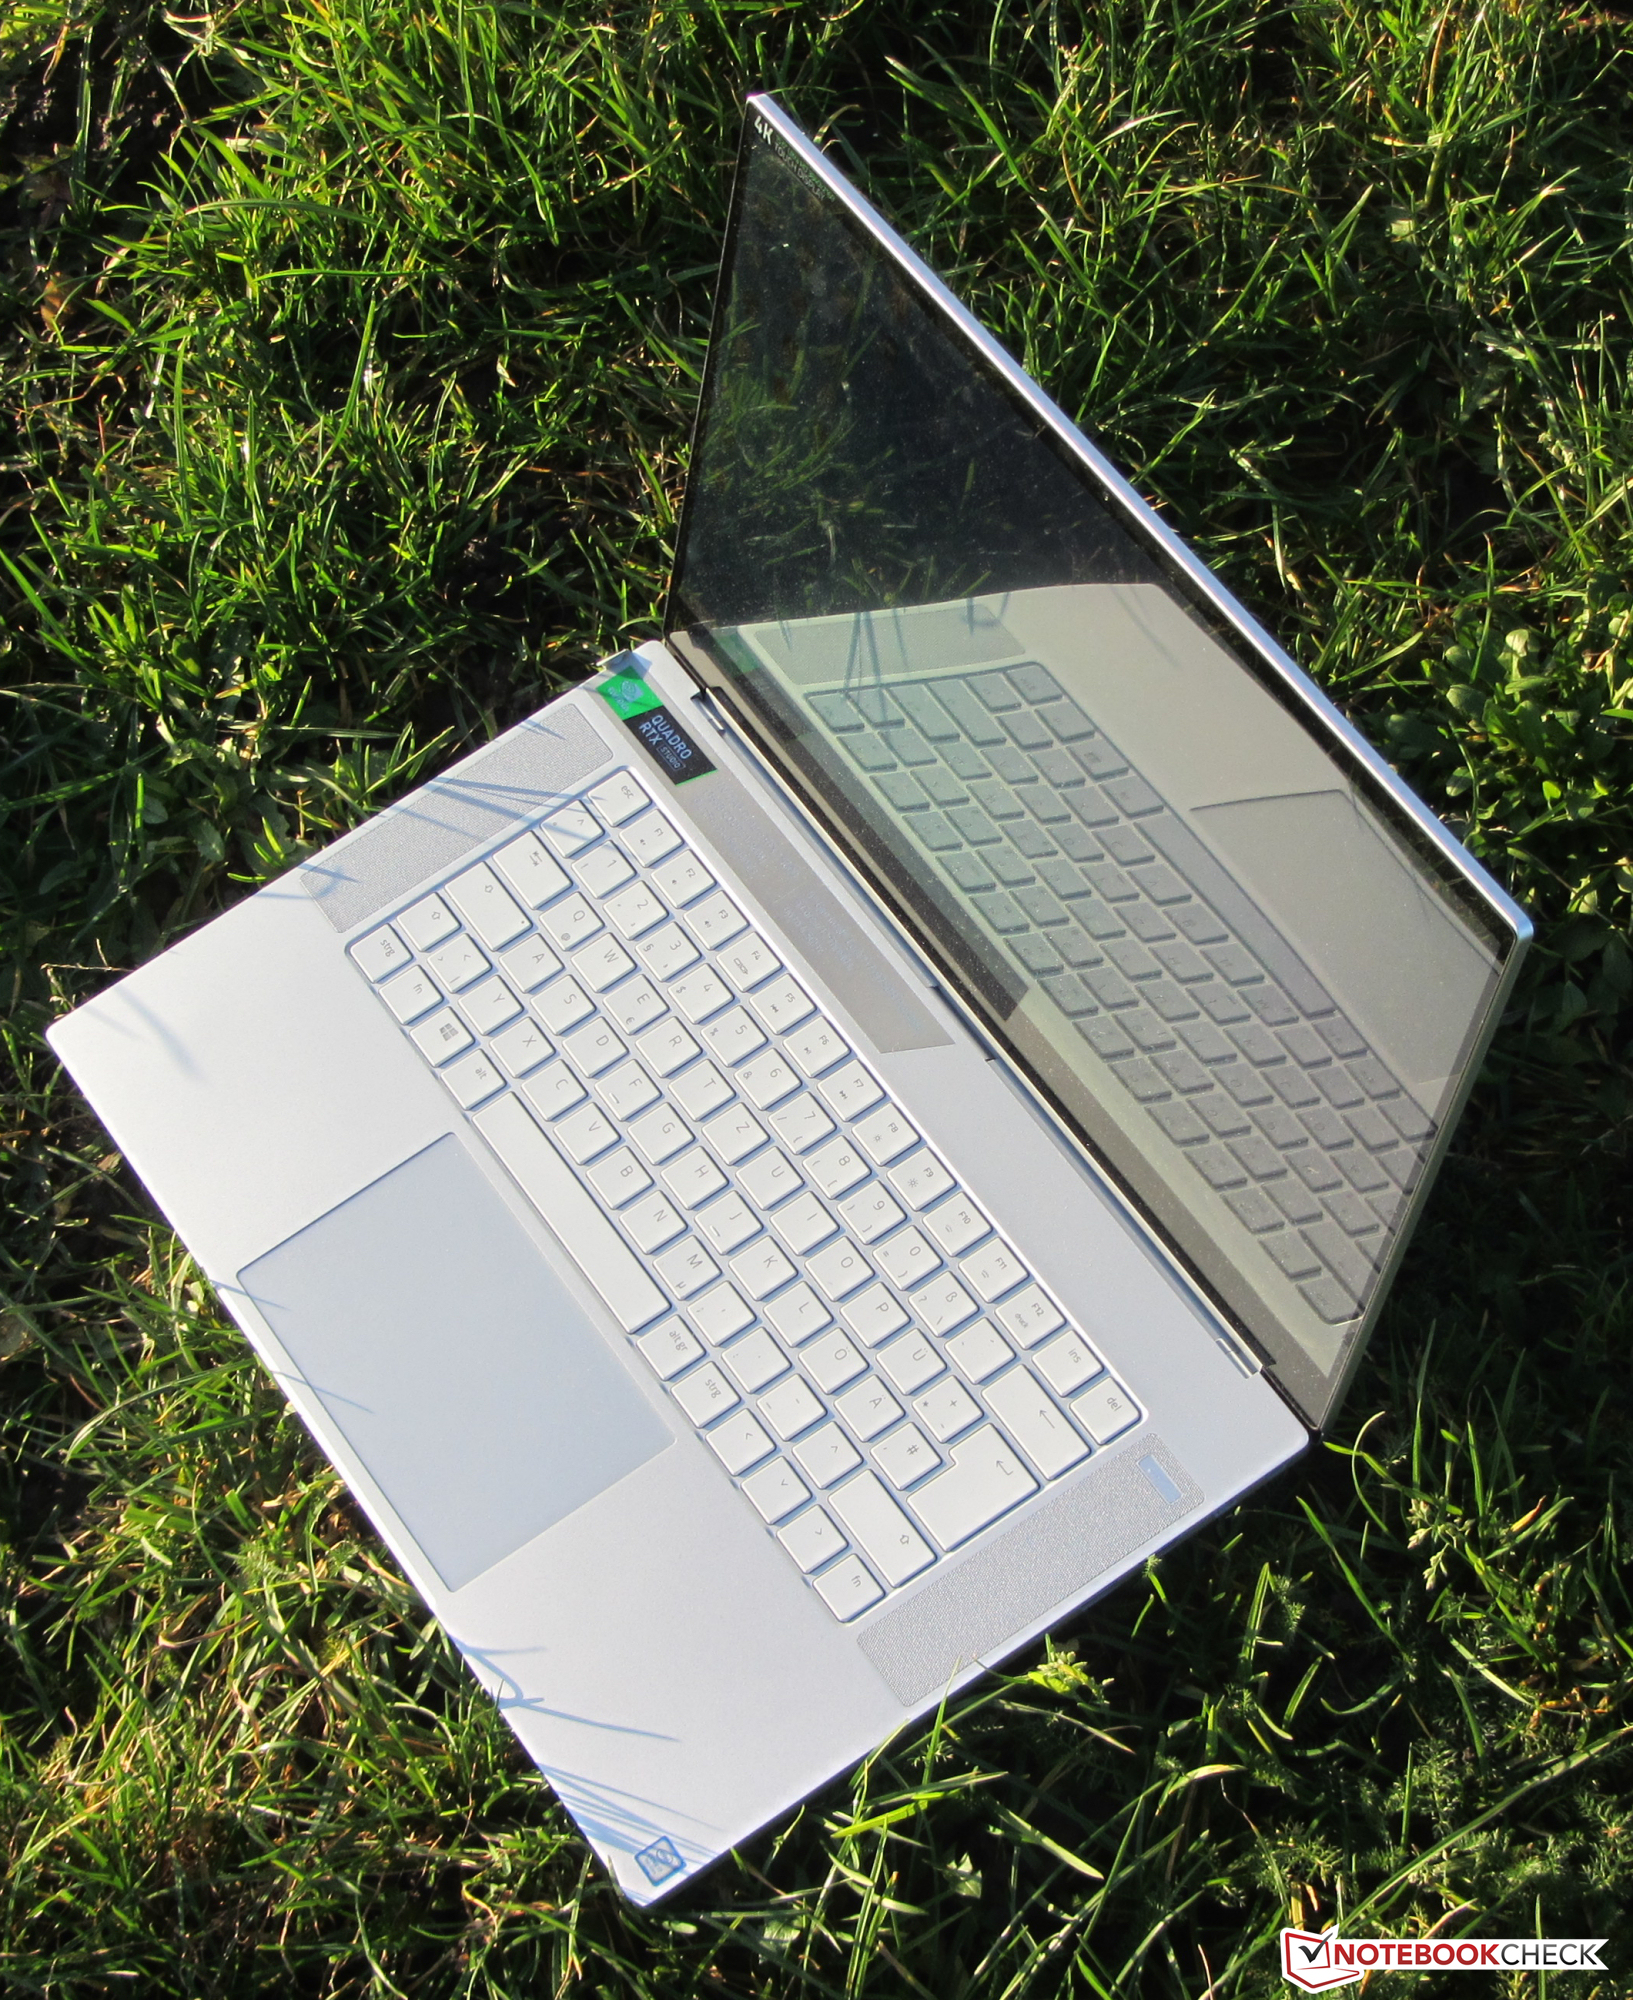
Il Razer Studio Edition of the Blade 15 si basa su un telaio metallico identico a quello dell'Advanced Model. Il telaio abbastanza angolare è dotato di angoli arrotondati. Il design minimalista non include molti orpelli. La variazione di colore si chiama Mercury White - una leggera tonalità grigio-argento. Non esiste un lettore ottico - non c'è la possibilità di inserirlo. Per arrivare all'interno, la piastra inferiore deve essere rimossa. Per saperne di più su questo leggete di seguito. La batteria non è rimovibile.
Il telaio non presenta difetti in termini di qualità costruttiva. Le distanze sono uniformi e non ci sono spigoli vivi. Inoltre, il case è molto robusto. Sia la cover che la base hanno un'elevata rigidità. La torsione dell'unità è molto difficile. La deformazione delle superfici dell'unità base richiederebbe una grande quantità di forza. Inoltre, l'applicazione di pressione sul retro della cover non provoca distorsioni dell'immagine. Le cerniere tengono la cover saldamente in posizione con una oscillazione minima. Il display può essere aperto fino ad un angolo massimo di circa 130 gradi. La cover può essere aperta con una sola mano.
Il Blade 15 è la workstation da 15,6 pollici più compatta nel nostro confronto. La maggior parte dei dispositivi concorrenti hanno un ingombro maggiore. In termini di peso, il Blade si colloca al centro.
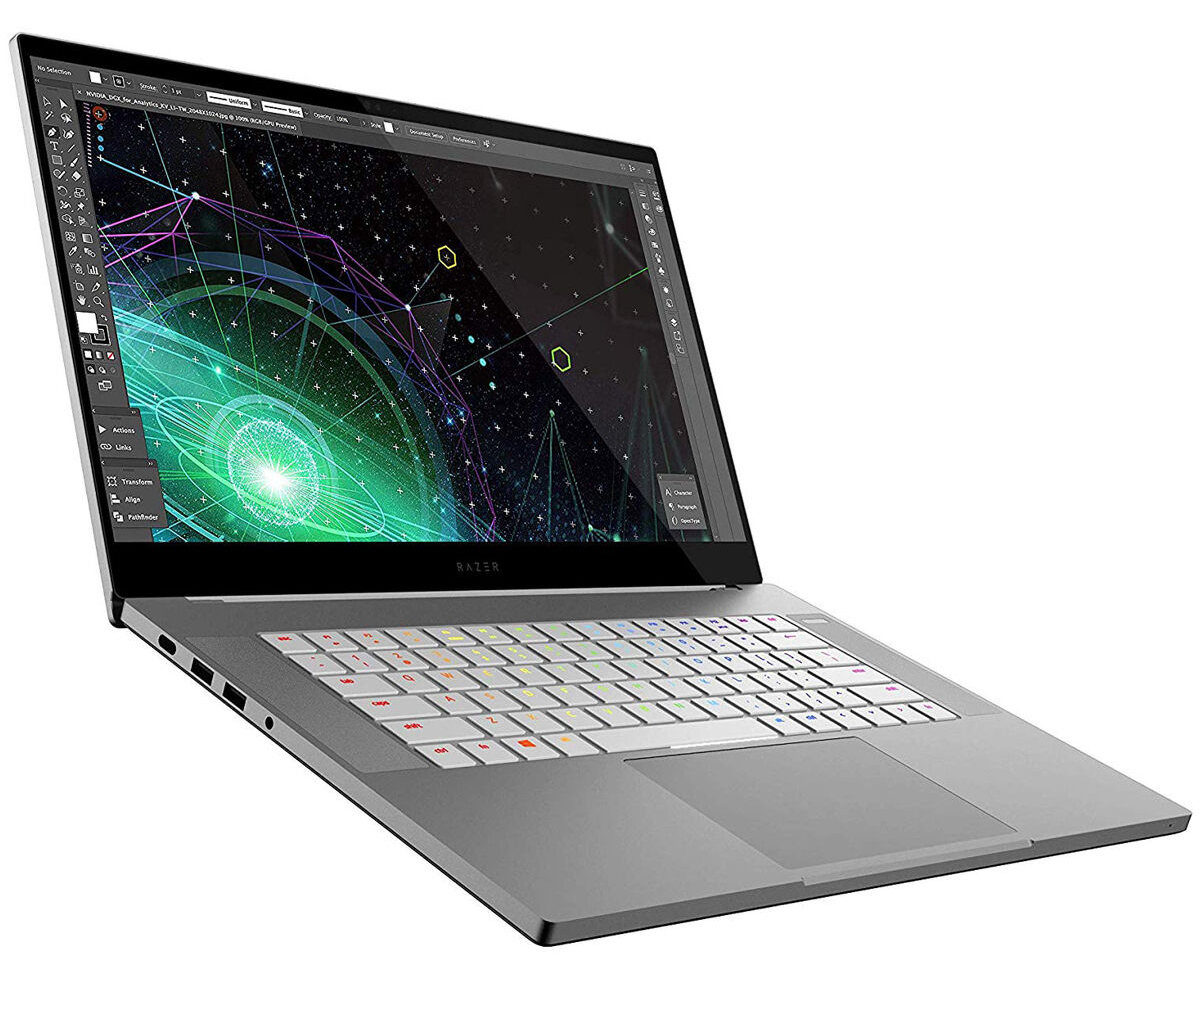
Connessioni - Portatile Razer con Thunderbolt 3
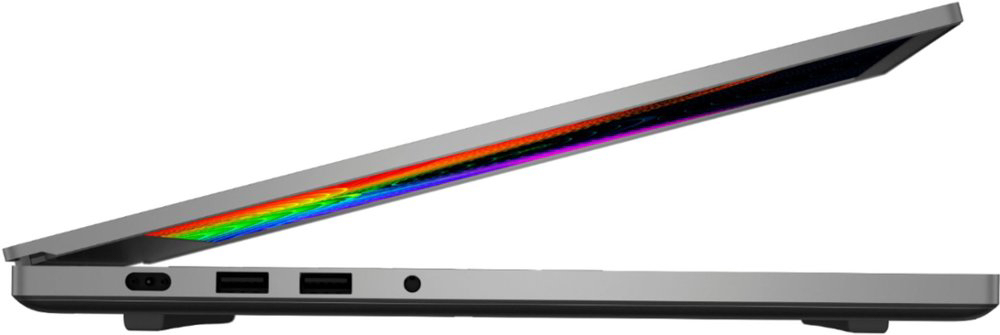
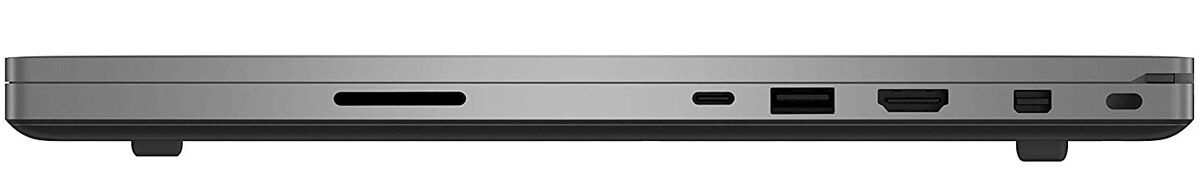
Questa workstation Razer offre una selezione completa delle porte. Le tre porte USB Type-A aderiscono allo standard USB 3.2 Gen 1. Inoltre, ci sono due uscite video (HDMI, Mini-DisplayPort). Una terza uscita video è disponibile sotto forma di porta Thunderbolt 3 (DisplayPort tramite USB Type-C). Quest'ultima consente inoltre agli utenti di collegare docking station o una GPU esterna. Tuttavia, il laptop non può essere alimentato tramite USB Type-C. La Thunderbolt 3 può fornire fino a 100 watt. Sotto carico, il consumo del Blade è molto più elevato.
Lettore schede SD
A differenza del'Advanced Model, l'edizione Studio del Blade 15 ha un lettore di schede integrato. È stata in grado di trasferire 250 file immagine jpg (circa 5 MB ciascuno) alla velocità di 78,3 MB/s. Quindi, questo lettore di schede è uno dei modelli più veloci. Detto questo, i lettori di schede dei dispositivi concorrenti raggiungono velocità di trasferimento ancora più elevate. Testiamo tutti i lettori di schede con la nostra scheda di riferimento (Toshiba Exceria Pro SDXC 64 GB UHS-II).
| SD Card Reader | |
| average JPG Copy Test (av. of 3 runs) | |
| Lenovo ThinkPad P53-20QN000YGE (Toshiba Exceria Pro SDXC 64 GB UHS-II) | |
| HP ZBook Studio G5-4QH10EA (Toshiba Exceria Pro SDXC 64 GB UHS-II) | |
| Dell Precision 5540 (Toshiba Exceria Pro SDXC 64 GB UHS-II) | |
| Media della classe Workstation (49.6 - 681, n=13, ultimi 2 anni) | |
| Fujitsu Celsius H780 (Toshiba Exceria Pro SDXC 64 GB UHS-II) | |
| Razer Blade 15 Studio Edition (Toshiba Exceria Pro SDXC 64 GB UHS-II) | |
| maximum AS SSD Seq Read Test (1GB) | |
| Media della classe Workstation (87.6 - 1455, n=13, ultimi 2 anni) | |
| HP ZBook Studio G5-4QH10EA (Toshiba Exceria Pro SDXC 64 GB UHS-II) | |
| Lenovo ThinkPad P53-20QN000YGE (Toshiba Exceria Pro SDXC 64 GB UHS-II) | |
| Dell Precision 5540 (Toshiba Exceria Pro SDXC 64 GB UHS-II) | |
| Fujitsu Celsius H780 (Toshiba Exceria Pro SDXC 64 GB UHS-II) | |
Comunicazioni
Il modulo Wi-Fi di Blade 15 deriva da Intel (Wi-Fi 6 AX200). Non solo supporta gli standard Wi-Fi 802.11a/b/g/n/ac ma anche il nuovo standard ax (= Wi-Fi 6). I risultati dei test che abbiamo raccolto in condizioni ottimali (nessun altro dispositivo Wi-Fi in prossimità, breve distanza tra il laptop e il server) sono stati eccellenti. Questa workstation non dispone di una porta Ethernet. Gli utenti che necessitano di questa particolare interfaccia dovranno affidarsi ad un adattatore USB appropriato.
| Networking | |
| iperf3 transmit AX12 | |
| Razer Blade 15 Studio Edition (iperf 3.1.3) | |
| Lenovo ThinkPad P53-20QN000YGE (Intel X550-T2) | |
| Lenovo ThinkPad P53-20QN000YGE (Killer E2500) | |
| Razer Blade 15 RTX 2080 Max-Q | |
| Fujitsu Celsius H780 (iperf 3.1.3) | |
| MSI P65 Creator 9SF-657 | |
| HP ZBook Studio G5-4QH10EA (iperf 3.1.3) | |
| Dell Precision 5540 (Killer E2500) | |
| iperf3 receive AX12 | |
| Lenovo ThinkPad P53-20QN000YGE (Intel X550-T2) | |
| Lenovo ThinkPad P53-20QN000YGE (Killer E2500) | |
| Razer Blade 15 Studio Edition (iperf 3.1.3) | |
| Razer Blade 15 RTX 2080 Max-Q | |
| HP ZBook Studio G5-4QH10EA (iperf 3.1.3) | |
| Fujitsu Celsius H780 (iperf 3.1.3) | |
| Dell Precision 5540 (Killer E2500) | |
| MSI P65 Creator 9SF-657 (iperf 3.1.3) | |
Webcam
La webcam installata può catturare immagini con una risoluzione massima di 1280x720 pixel. I risultati sono un po' sbiaditi e carenti in termini di nitidezza.
Accessori
Oltre alle consuete documentazioni (guida rapida, informazioni sulla garanzia), gli accessori includono anche un panno per la pulizia.
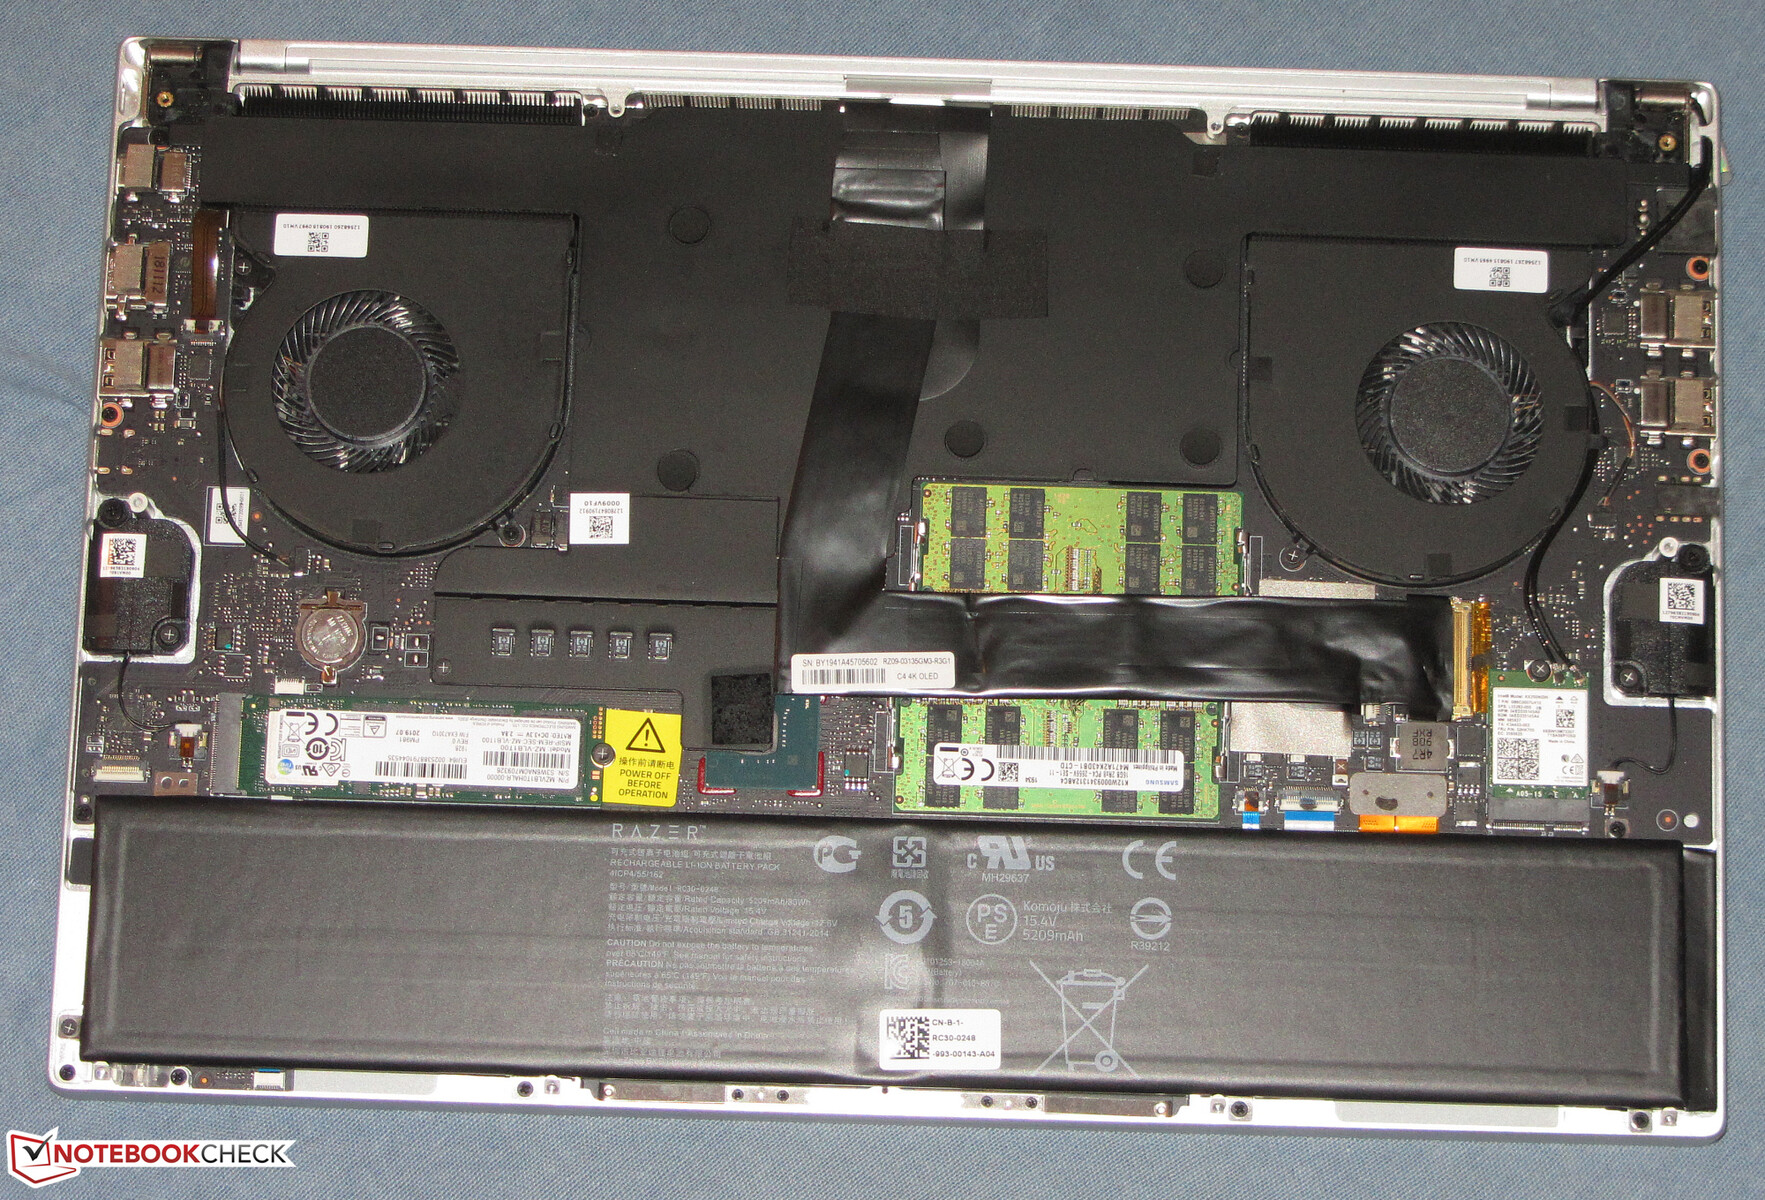
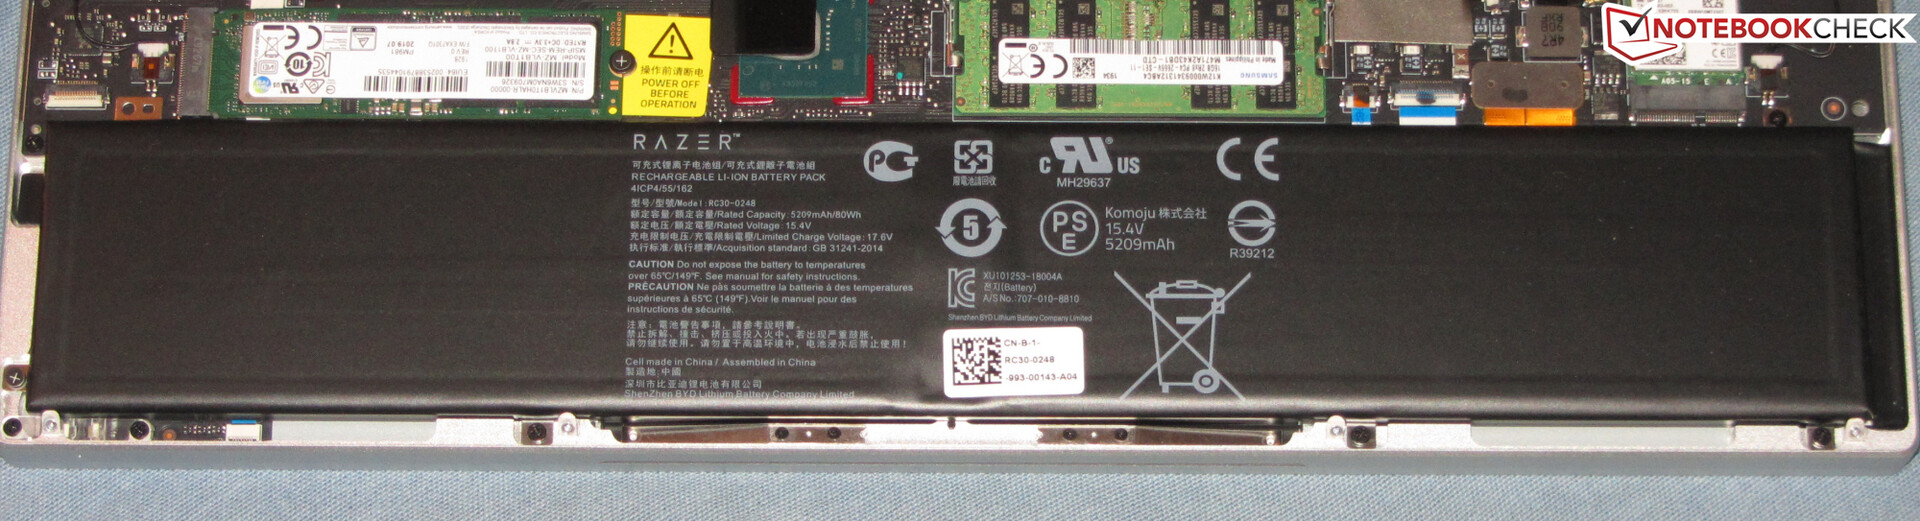
Manutenzione
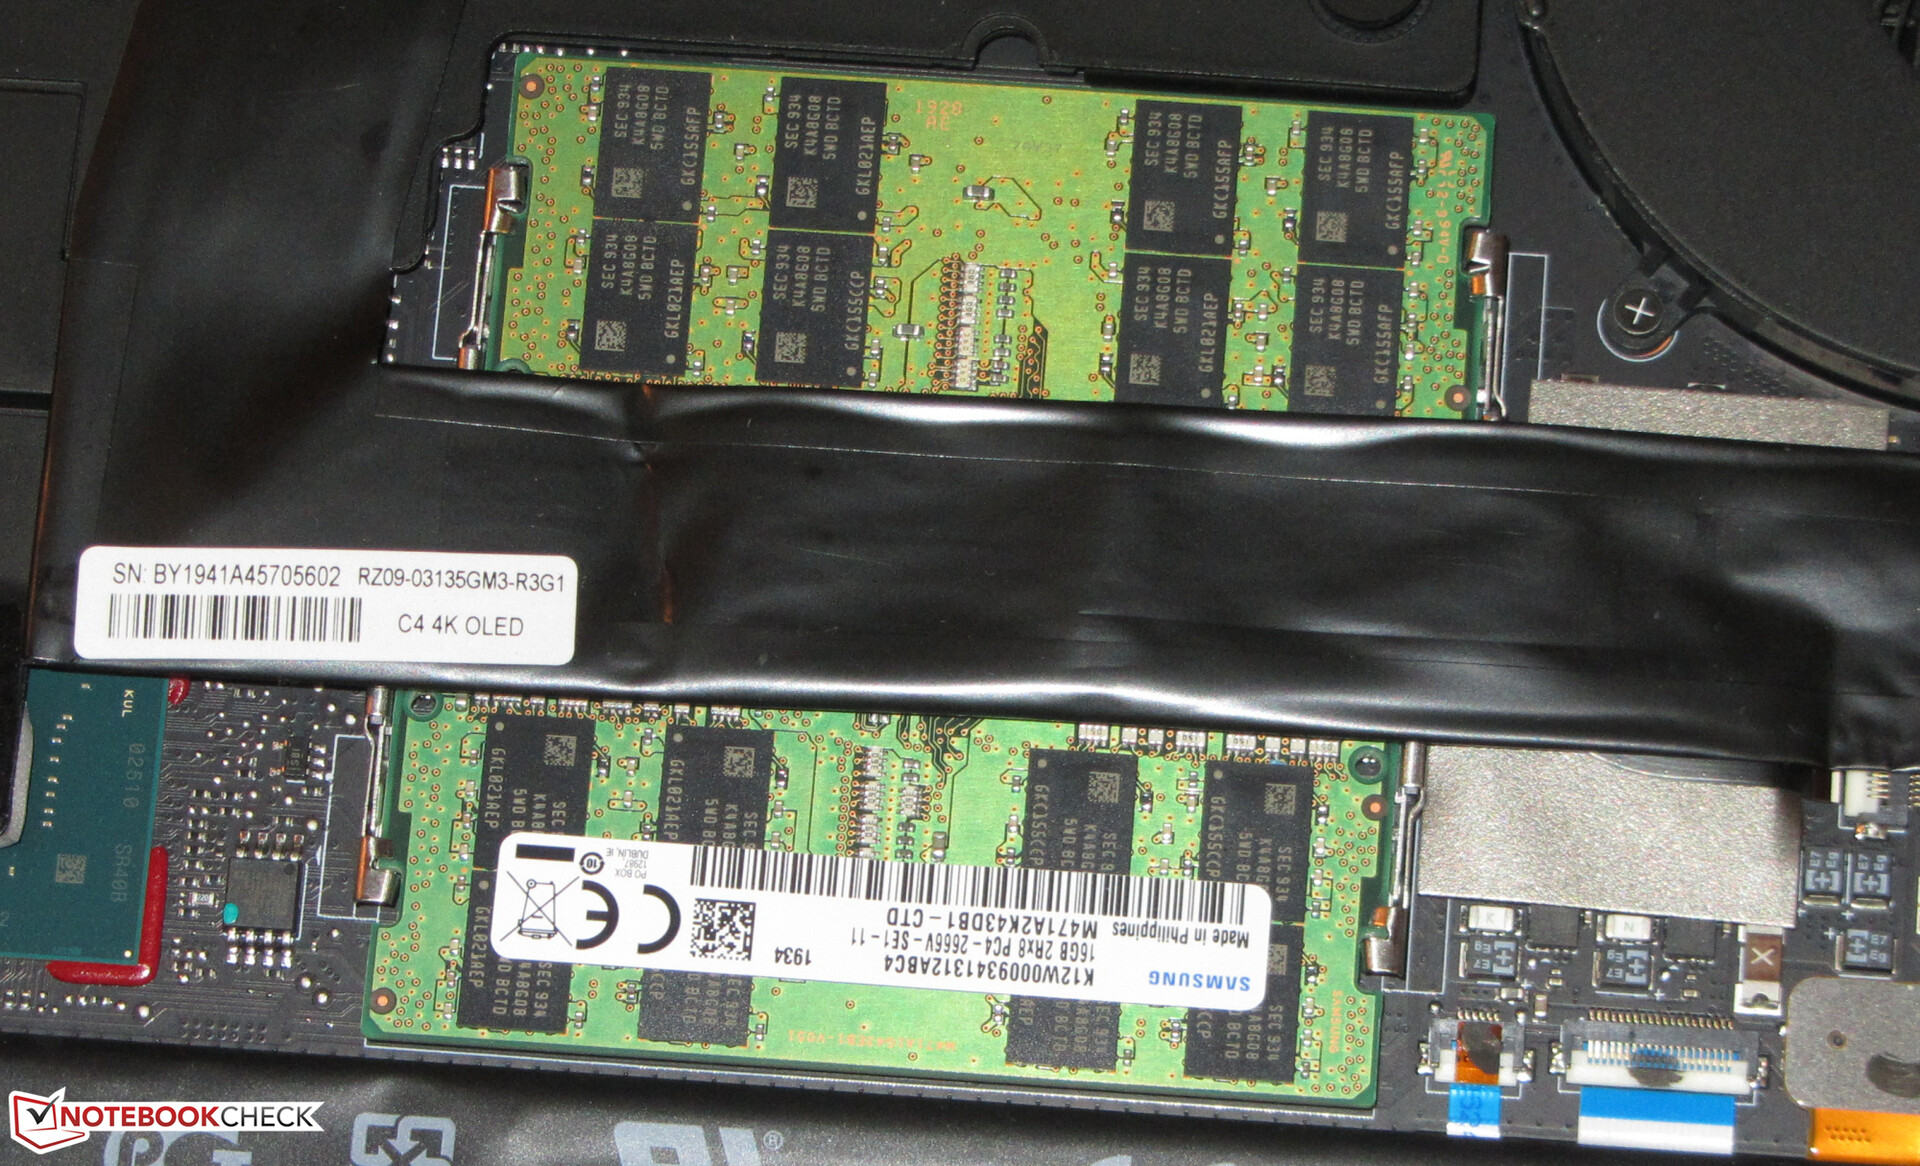
Non c'è uno sportello di manutenzione su questo portatile. Per raggiungere i componenti, il pannello inferiore deve essere rimosso, ma non richiede molto sforzo. Dopo aver allentato tutte le viti Torx sul fondo, il pannello inferiore può essere facilmente rimosso. Gli utenti hanno accesso alla RAM, all'SSD, alla batteria, alle ventole e al modulo Wi-Fi.
Garanzia
Il portatile viene fornito con una garanzia di 12 mesi. È possibile estendere questo periodo di tempo a tre anni (inclusa la protezione da danni accidentali; RazerCare Elite) per 300 euro (~$333).
Dispositivi di Input - La tastiera della Workstation potrebbe essere migliore
Tastiera
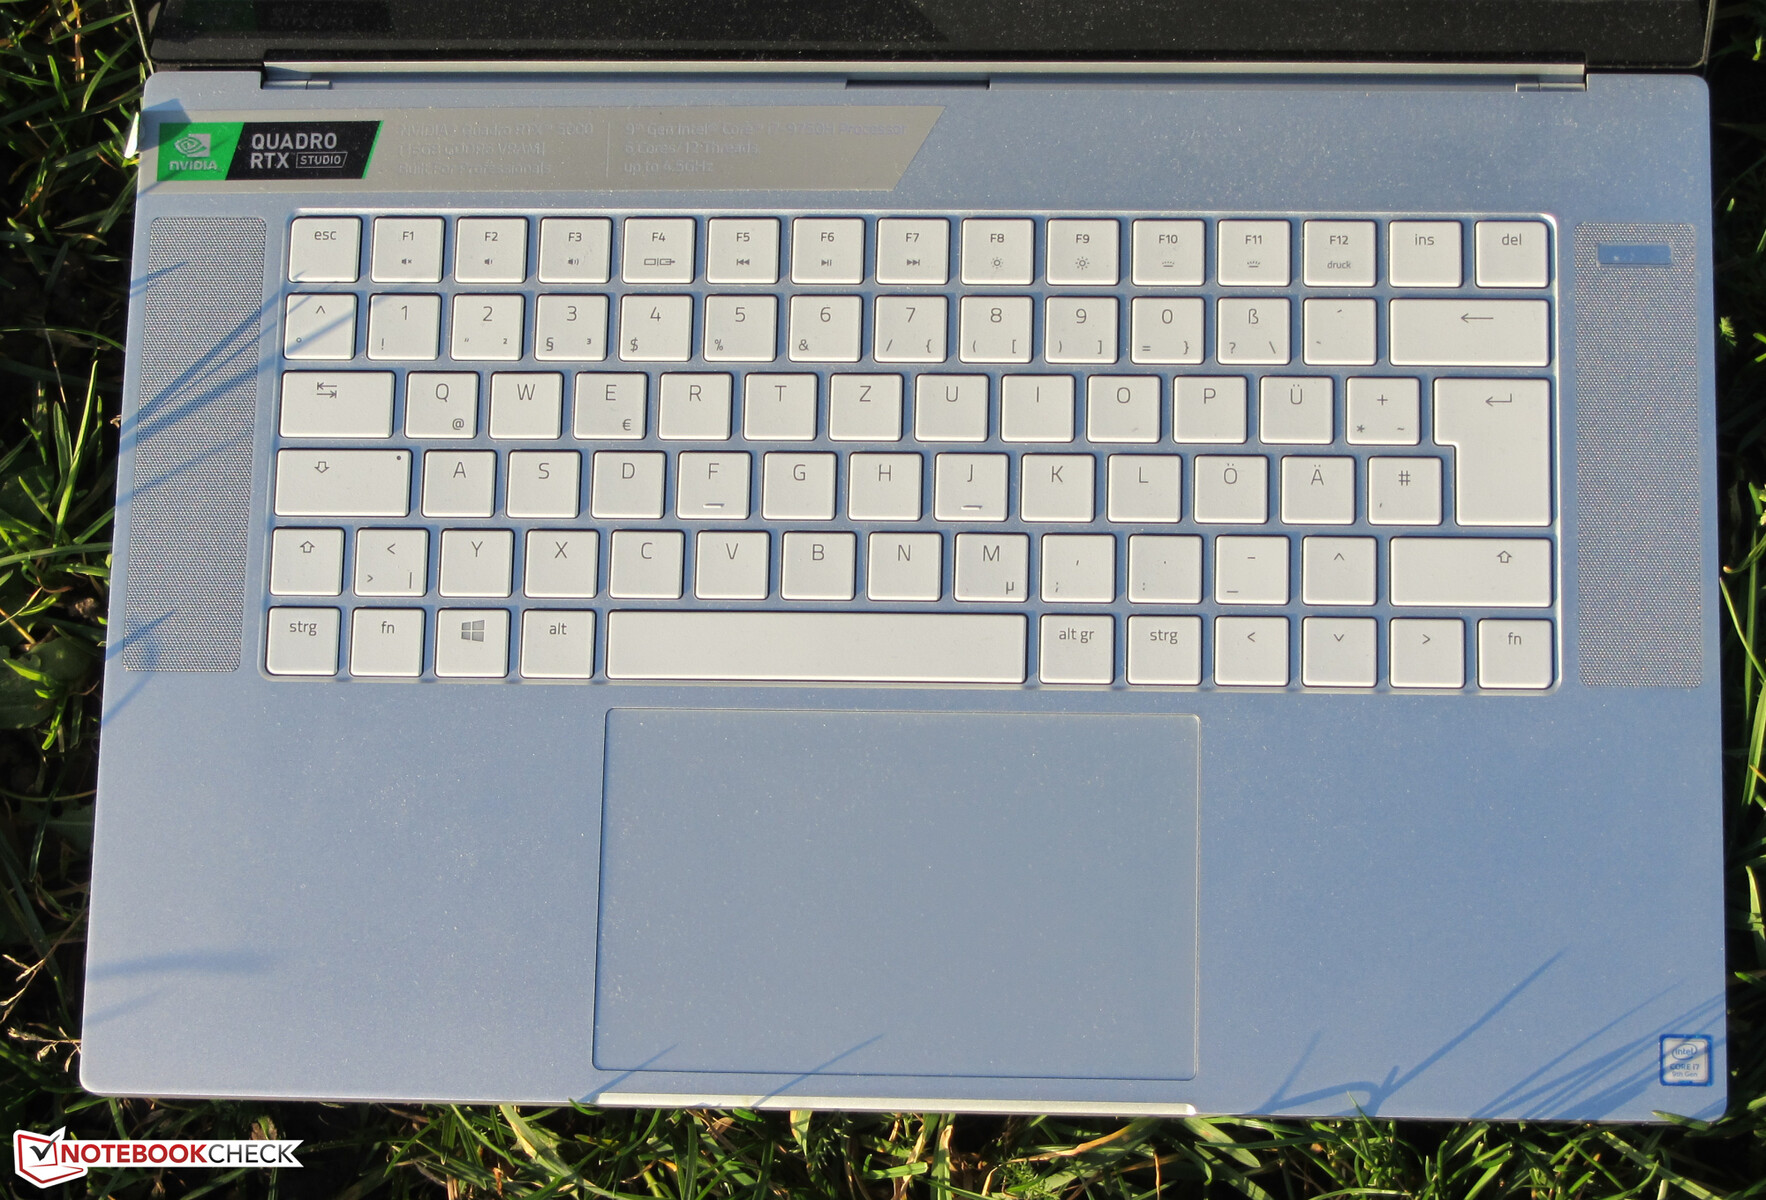
Razer equipaggia il Blade 15 con una tastiera chiclet illuminata. I tasti piatti e leggermente ruvidi offrono una corsa poco profonda e un feedback nitido. Tuttavia, la resistenza dei tasti è leggermente meno pronunciata di quanto vorremmo. Due tasti funzione sono usati per controllare la retroilluminazione, che ha livelli di intensità multipli. Nel complesso, Razer fornisce una tastiera adatta all'uso quotidiano. Detto questo, la tastiera non è adatta a sessioni di digitazione intense.
Touchpad
Il ClickPad abilitato all'input multi-touch occupa una superficie di circa 13 x 8 cm. In questo modo, c'è molto spazio per i controlli dei gesti. Il touchpad ha anche buone proprietà di scorrevolezza e una superficie che è reattiva fino ai bordi. Il touchpad offre una corsa breve e un feedback nitido.
Touchscreen
Il touchscreen del Blade supporta 10 punti multi-touch e reagisce rapidamente agli input. Non abbiamo riscontrato alcun problema durante i nostri test.
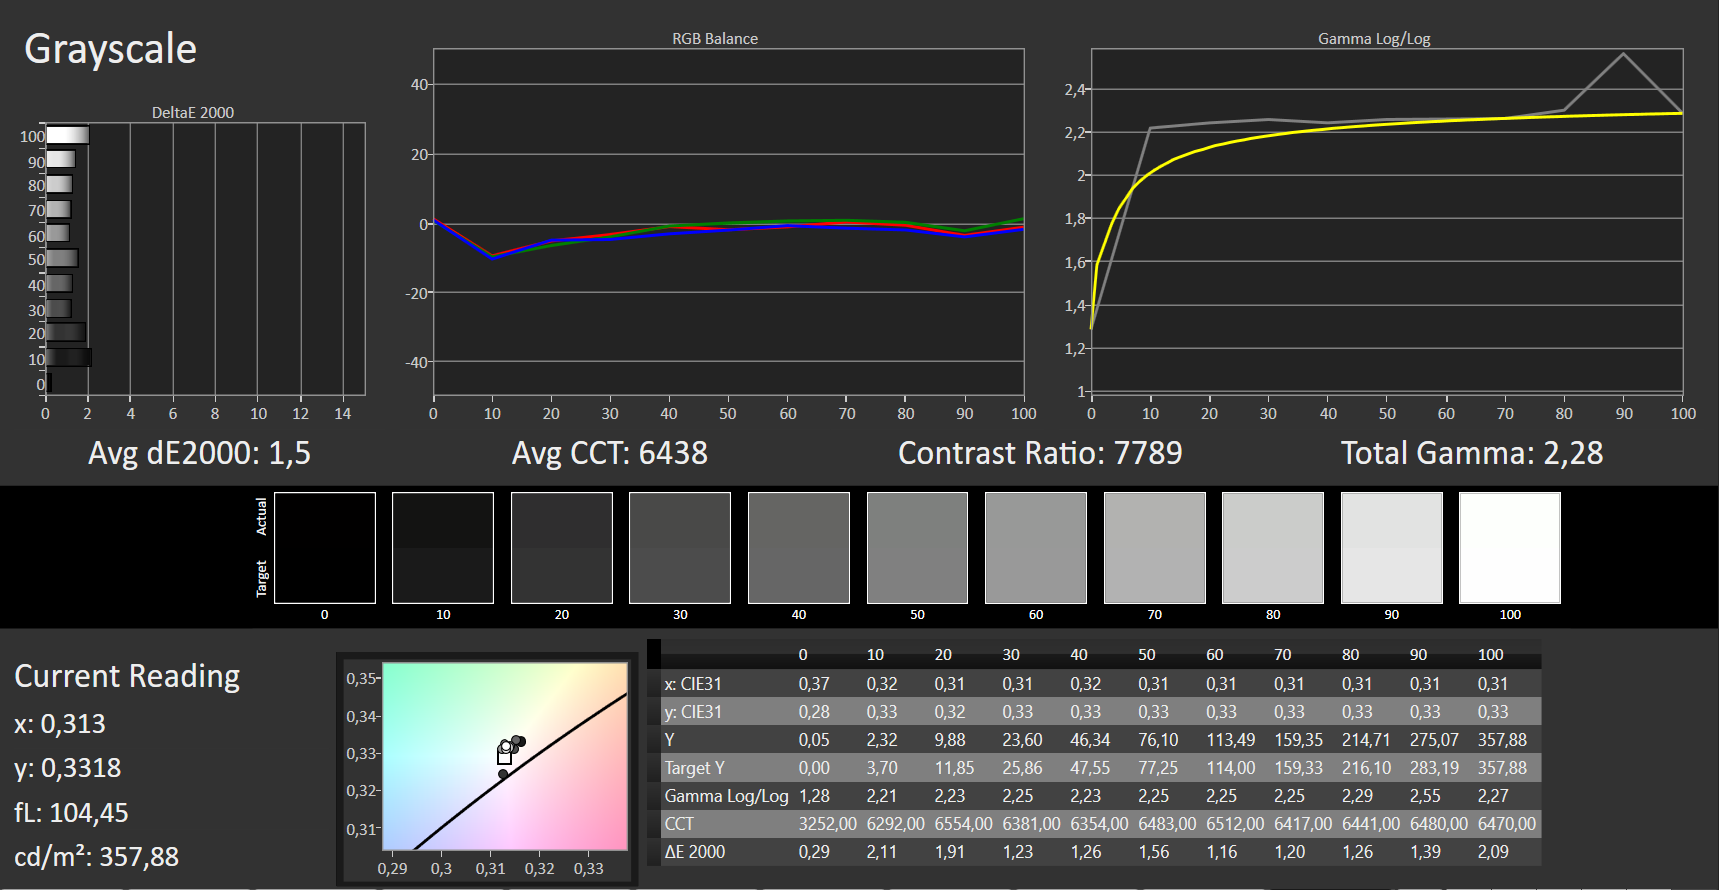
Display - Neri profondi grazie all'OLED
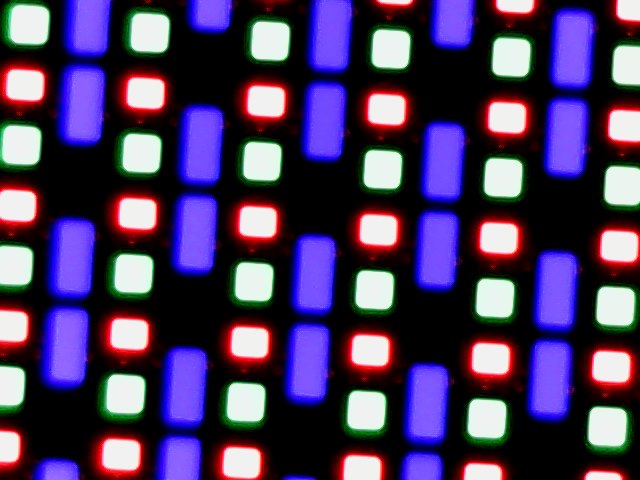
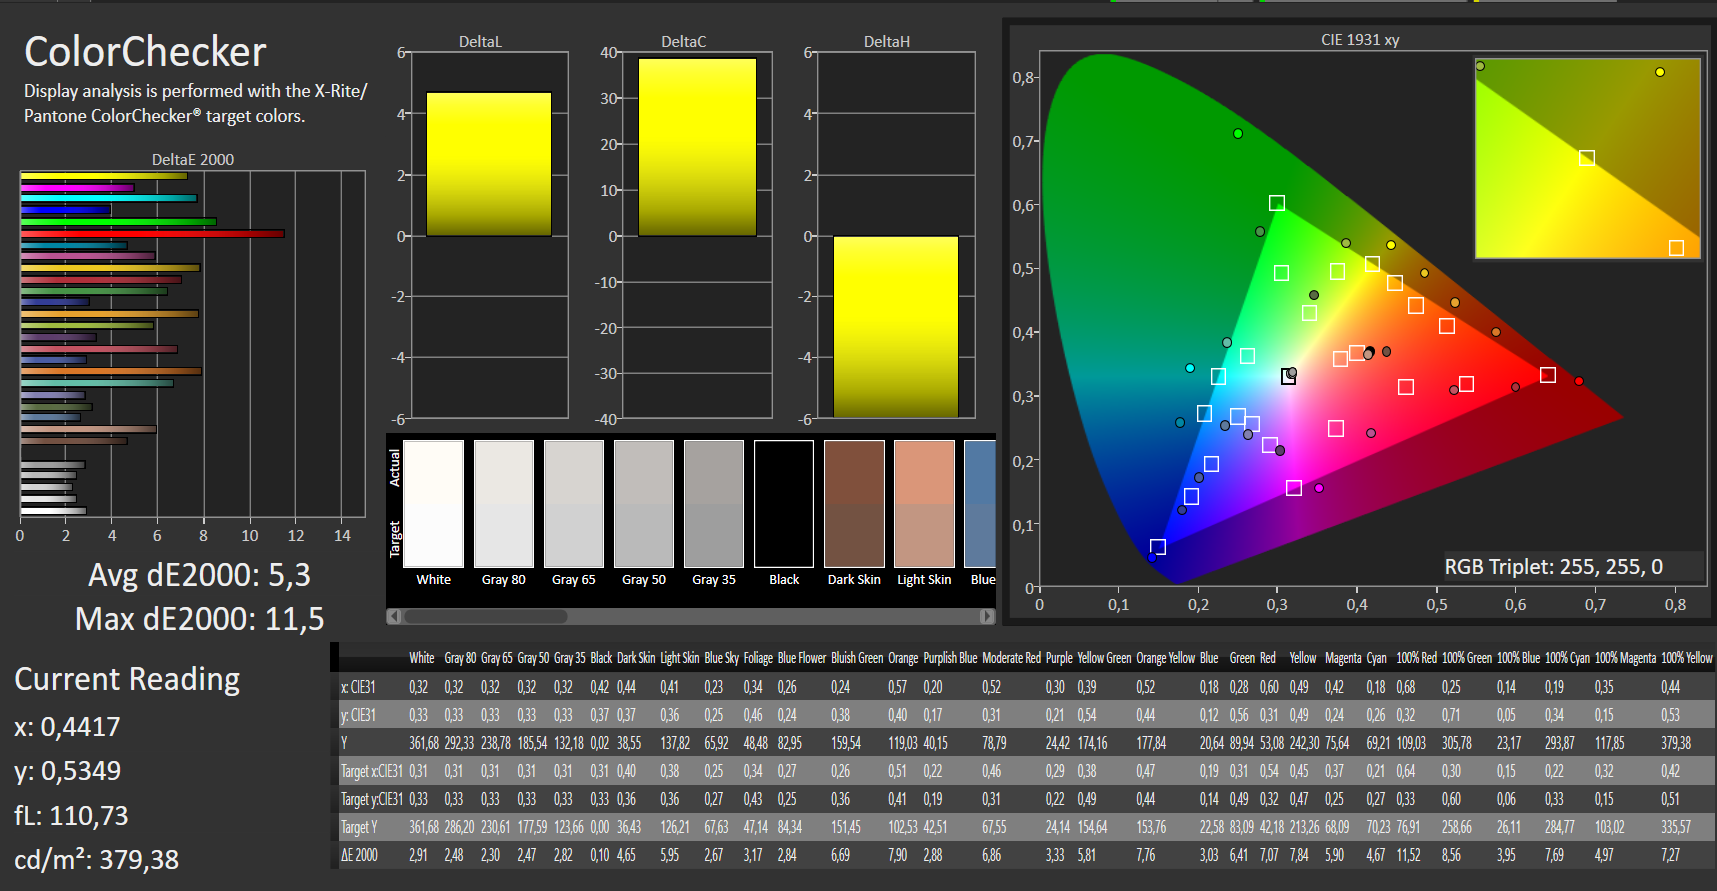
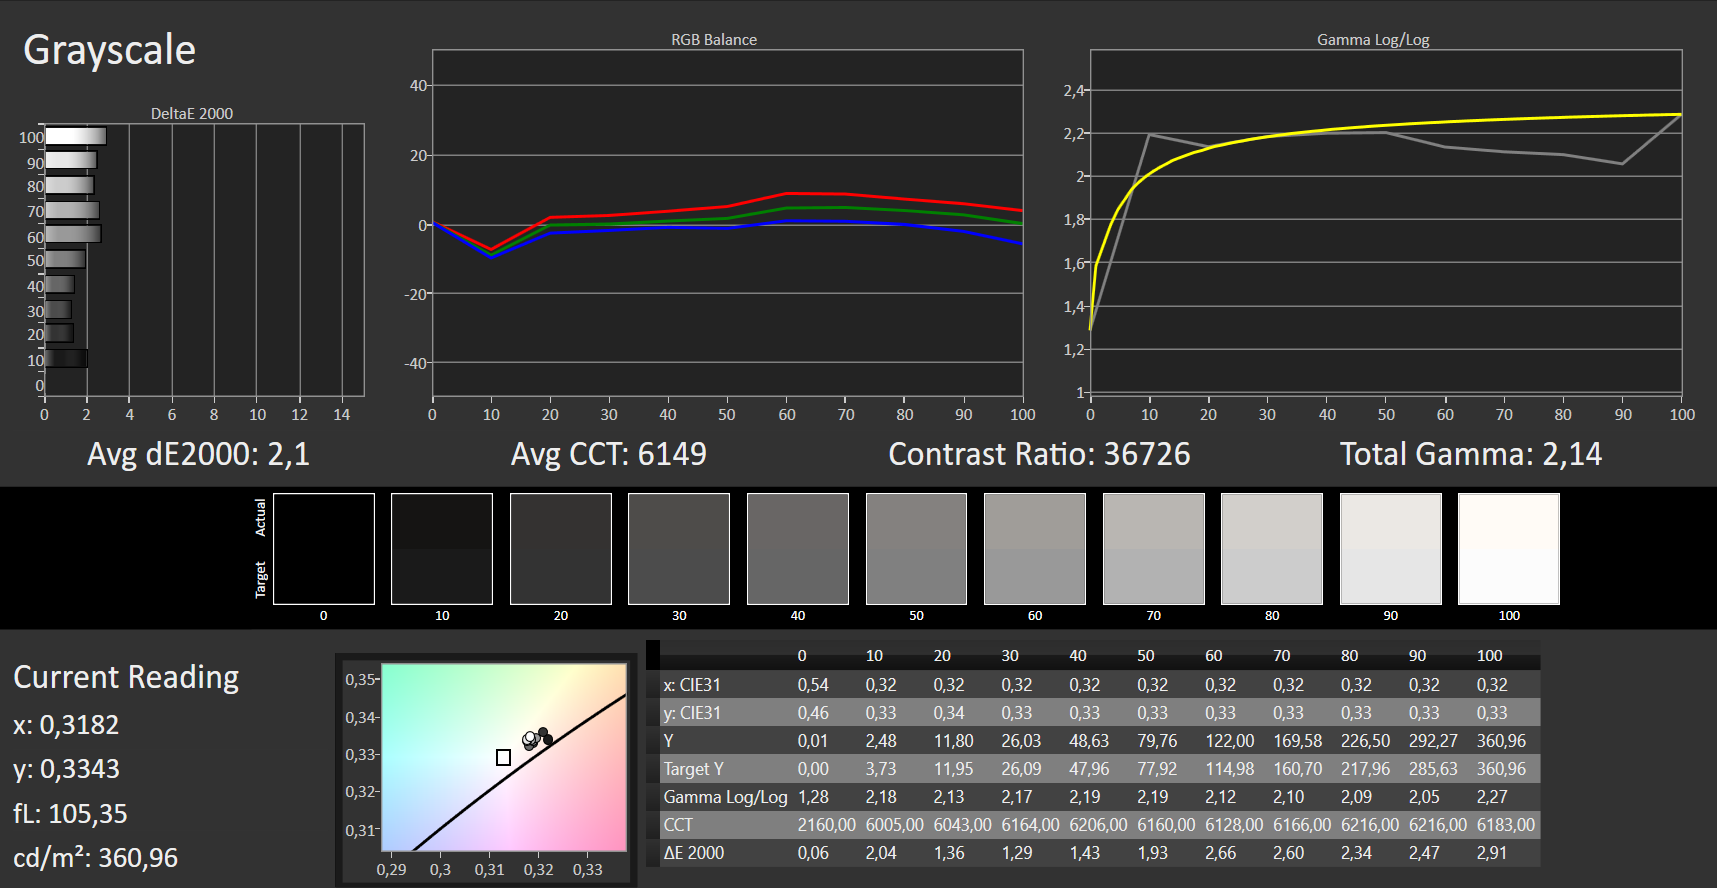
Il display touchscreen OLED da 15,6 pollici del Blade 15 ha una risoluzione nativa di 3840x2160 pixel. Lo schermo brilla con un eccellente rapporto di contrasto (24,067:1), valore del nero (0,015) e un buon livello di luminosità (356,7 cd/m²). Inoltre, i tempi di risposta sono rapidi. Positivo: Il display non mostra sfarfallii PWM.
| |||||||||||||||||||||||||
Distribuzione della luminosità: 89 %
Al centro con la batteria: 361 cd/m²
Contrasto: 24067:1 (Nero: 0.015 cd/m²)
ΔE ColorChecker Calman: 5.3 | ∀{0.5-29.43 Ø4.71}
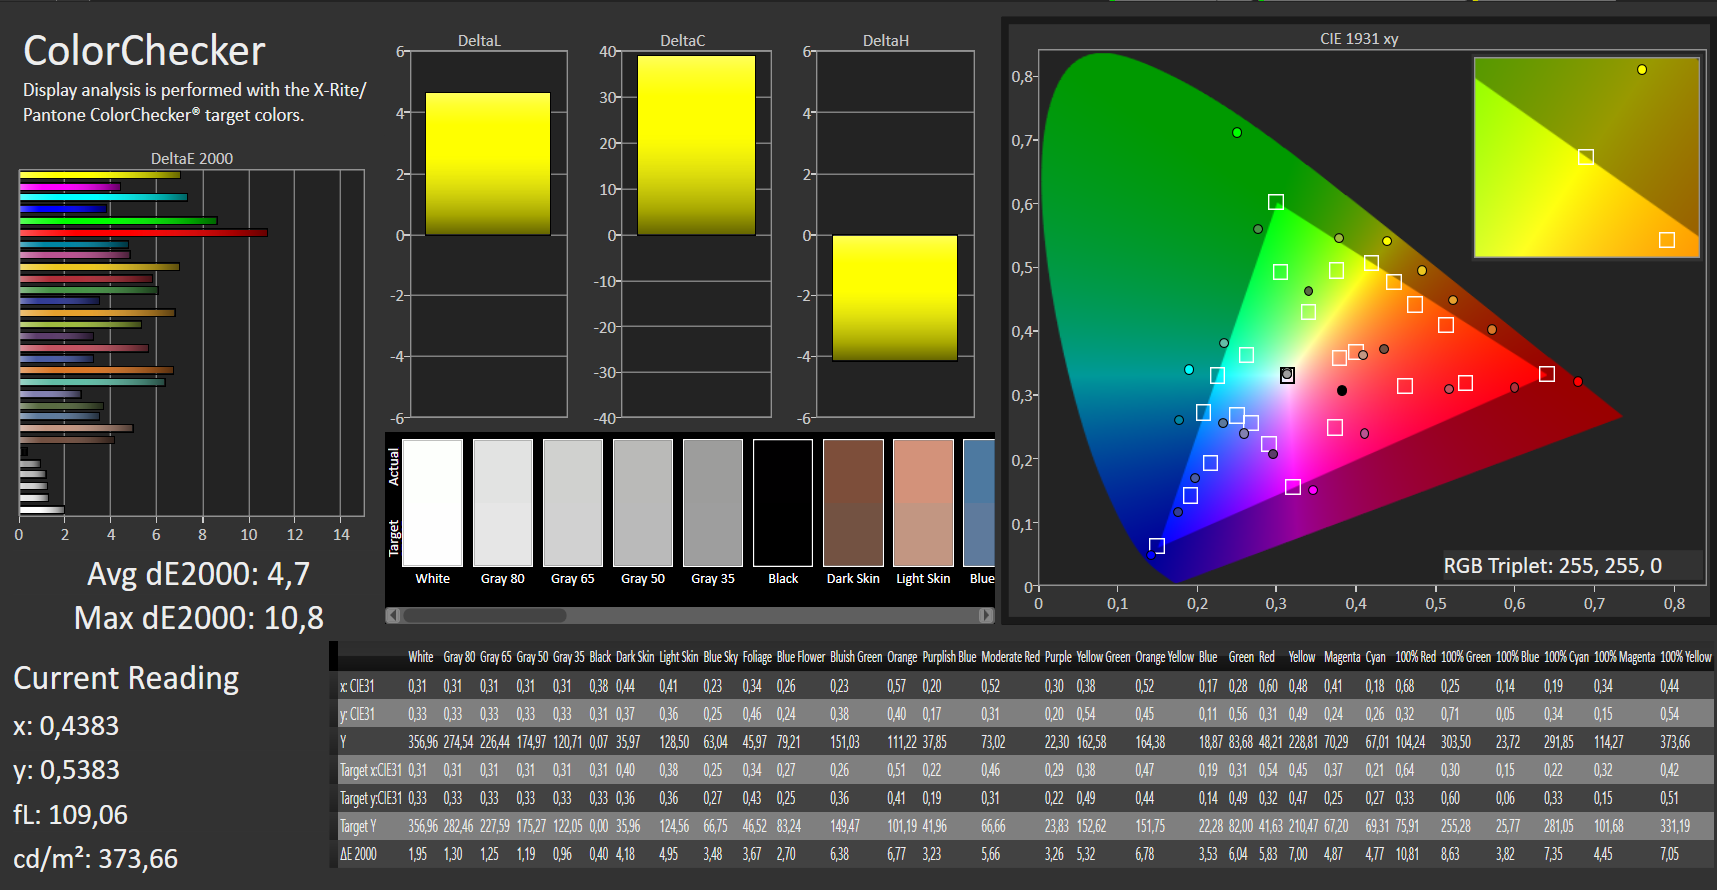
calibrated: 4.7
ΔE Greyscale Calman: 2.1 | ∀{0.09-98 Ø4.96}
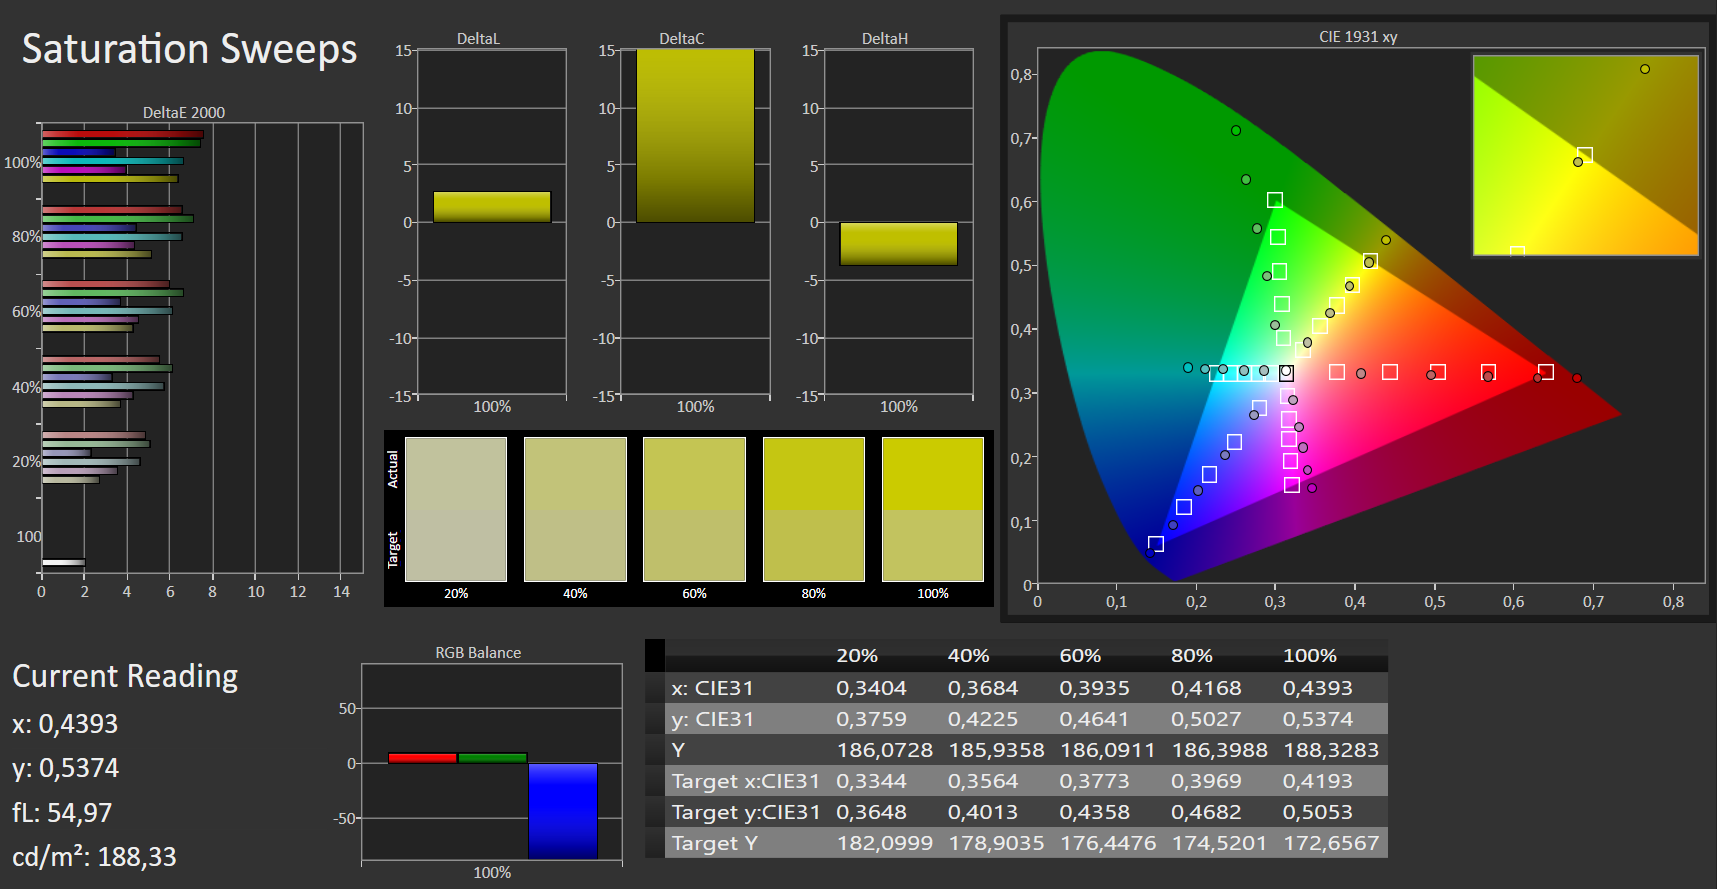
100% sRGB (Argyll 1.6.3 3D)
86% AdobeRGB 1998 (Argyll 1.6.3 3D)
96.4% AdobeRGB 1998 (Argyll 3D)
100% sRGB (Argyll 3D)
99.9% Display P3 (Argyll 3D)
Gamma: 2.14
CCT: 6149 K
| Razer Blade 15 Studio Edition OLED, 3840x2160, 15.6" | Razer Blade 15 RTX 2080 Max-Q IPS, 1920x1080, 15.6" | Lenovo ThinkPad P53-20QN000YGE IPS, 1920x1080, 15.6" | MSI P65 Creator 9SF-657 IPS, 3840x2160, 15.6" | Dell Precision 5540 OLED, 3840x2160, 15.6" | Fujitsu Celsius H780 IPS LED, 1920x1080, 15.6" | HP ZBook Studio G5-4QH10EA IPS LED, 3840x2160, 15.6" | |
|---|---|---|---|---|---|---|---|
| Display | -21% | -26% | -5% | 0% | -28% | -22% | |
| Display P3 Coverage (%) | 99.9 | 66.9 -33% | 63.2 -37% | 84.4 -16% | 99.9 0% | 66.3 -34% | 68.2 -32% |
| sRGB Coverage (%) | 100 | 98.1 -2% | 92.9 -7% | 100 0% | 100 0% | 85.9 -14% | 96.2 -4% |
| AdobeRGB 1998 Coverage (%) | 96.4 | 68.5 -29% | 64.3 -33% | 98.5 2% | 97.3 1% | 62.8 -35% | 68.8 -29% |
| Response Times | -244% | -855% | -1138% | 14% | -869% | -1324% | |
| Response Time Grey 50% / Grey 80% * (ms) | 3 ? | 12.8 ? -327% | 38.4 ? -1180% | 51 ? -1600% | 2.8 ? 7% | 38 ? -1167% | 60.8 ? -1927% |
| Response Time Black / White * (ms) | 4 ? | 10.4 ? -160% | 25.2 ? -530% | 31 ? -675% | 3.2 ? 20% | 26.8 ? -570% | 32.8 ? -720% |
| PWM Frequency (Hz) | 23810 ? | 26040 ? | 240.9 ? | 20830 ? | |||
| Screen | -164% | -203% | -336% | 17% | -180% | -177% | |
| Brightness middle (cd/m²) | 361 | 293 -19% | 510 41% | 445 23% | 427 18% | 271 -25% | 417 16% |
| Brightness (cd/m²) | 357 | 270 -24% | 468 31% | 462 29% | 411 15% | 260 -27% | 412 15% |
| Brightness Distribution (%) | 89 | 87 -2% | 89 0% | 83 -7% | 89 0% | 86 -3% | 85 -4% |
| Black Level * (cd/m²) | 0.015 | 0.29 -1833% | 0.36 -2300% | 0.5 -3233% | 0.29 -1833% | 0.29 -1833% | |
| Contrast (:1) | 24067 | 1010 -96% | 1417 -94% | 890 -96% | 934 -96% | 1438 -94% | |
| Colorchecker dE 2000 * | 5.3 | 1.69 68% | 2.3 57% | 4.75 10% | 3.2 40% | 3.9 26% | 4.4 17% |
| Colorchecker dE 2000 max. * | 11.5 | 3.37 71% | 5.5 52% | 7.79 32% | 8.4 27% | 10.2 11% | 6.7 42% |
| Colorchecker dE 2000 calibrated * | 4.7 | 1.24 74% | 1.2 74% | 2.8 40% | 2.9 38% | 1.9 60% | |
| Greyscale dE 2000 * | 2.1 | 2.3 -10% | 3.2 -52% | 4.49 -114% | 1.8 14% | 2.6 -24% | 5 -138% |
| Gamma | 2.14 103% | 2.3 96% | 2.34 94% | 2.49 88% | 2.15 102% | 2.29 96% | 2.28 96% |
| CCT | 6149 106% | 6758 96% | 7036 92% | 7374 88% | 6176 105% | 6517 100% | 7575 86% |
| Color Space (Percent of AdobeRGB 1998) (%) | 86 | 63 -27% | 59.4 -31% | 87 1% | 86.8 1% | 56.1 -35% | 62.3 -28% |
| Color Space (Percent of sRGB) (%) | 100 | 98.5 -1% | 93.1 -7% | 100 0% | 100 0% | 85.8 -14% | 96 -4% |
| Media totale (Programma / Settaggio) | -143% /
-147% | -361% /
-251% | -493% /
-376% | 10% /
13% | -359% /
-238% | -508% /
-291% |
* ... Meglio usare valori piccoli
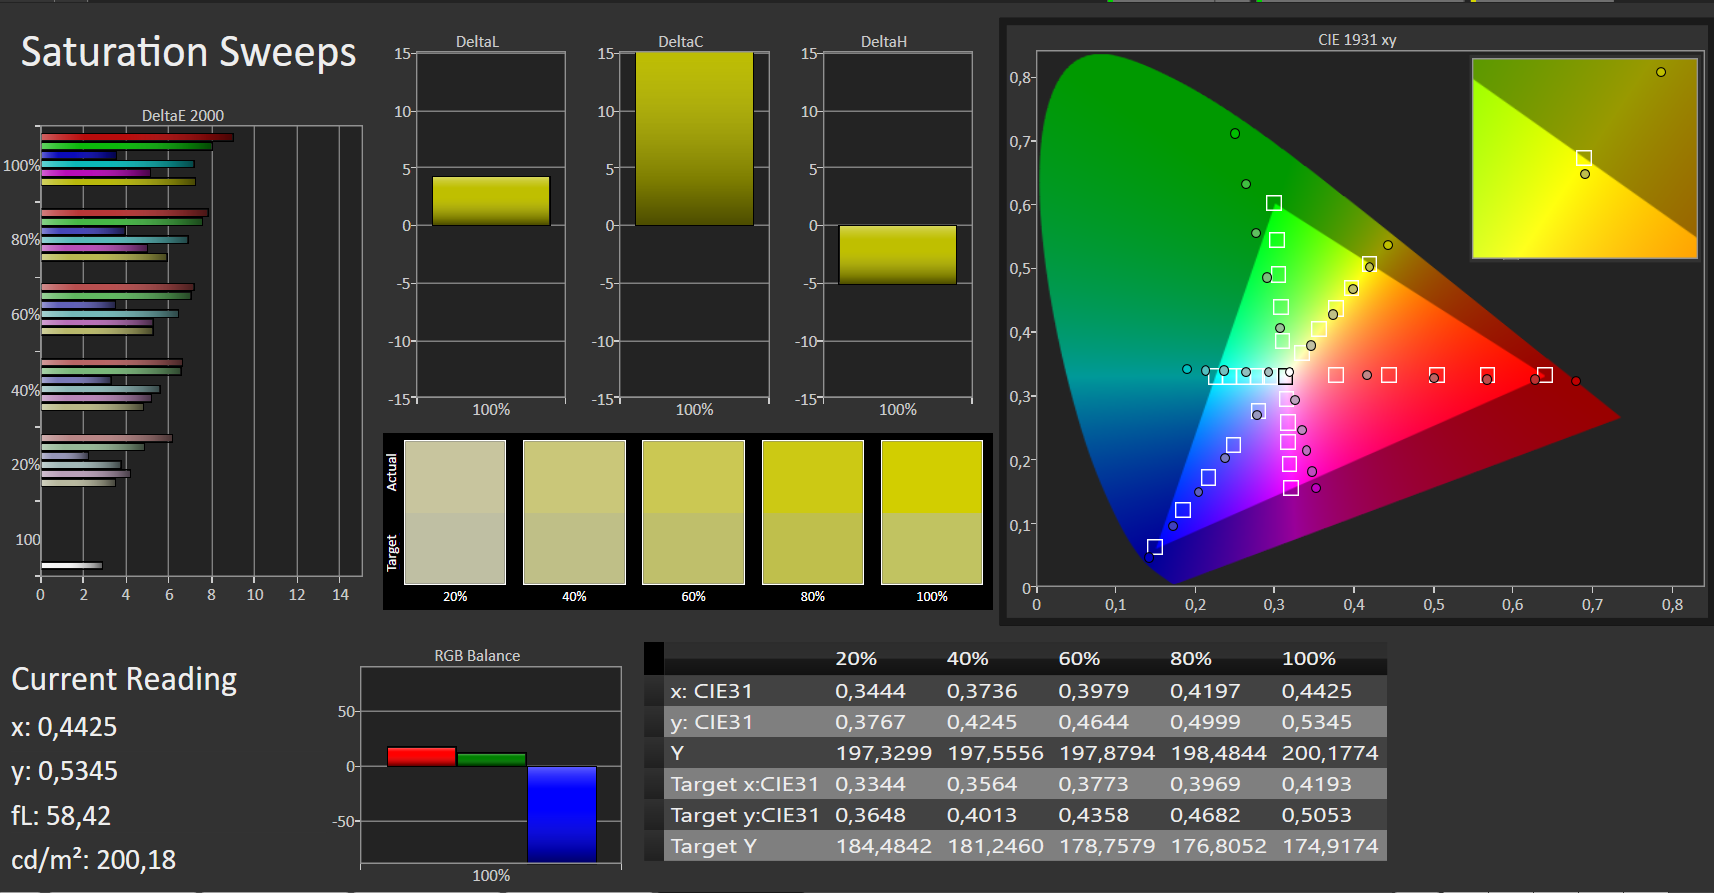
Lo schermo mostra una buona precisione del colore. Con una deviazione cromatica DeltaE-2000 di 5,3, tuttavia, non raggiunge il valore ideale (DeltaE inferiore a 3). Il display non sfumature blu. La nostra calibrazione ha migliorato solo marginalmente la precisione del display. In questo caso, la deviazione del colore è scesa a 4,7 e la scala di grigi è stata rappresentata in modo leggermente più equilibrato. In termini di copertura dello spazio colore, il display ottiene buoni risultati. In particolare, raggiunge una copertura dello spazio colore rispettivamente dell'86% (AdobeRGB) e del 100% (sRGB).
Tempi di risposta del Display
| ↔ Tempi di risposta dal Nero al Bianco | ||
|---|---|---|
| 4 ms ... aumenta ↗ e diminuisce ↘ combinato | ↗ 2 ms Incremento | 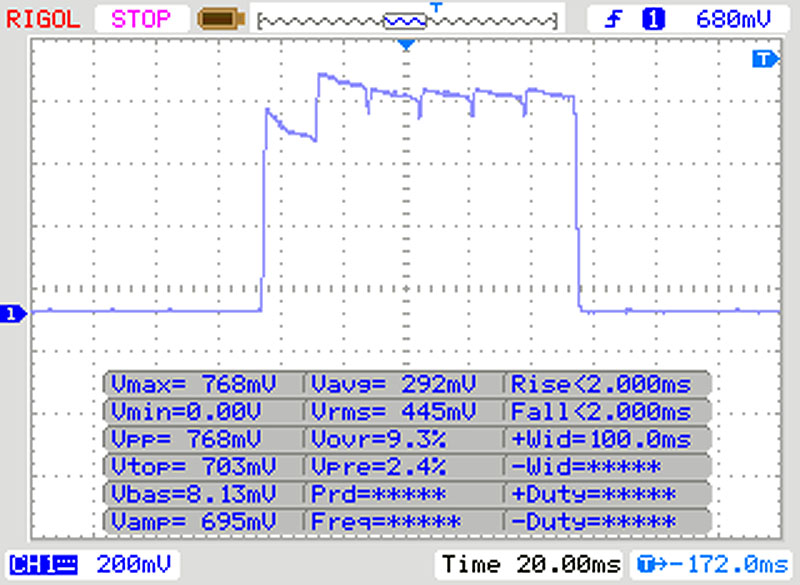 |
| ↘ 2 ms Calo | ||
| Lo schermo ha mostrato valori di risposta molto veloci nei nostri tests ed è molto adatto per i gaming veloce. In confronto, tutti i dispositivi di test variano da 0.1 (minimo) a 240 (massimo) ms. » 16 % di tutti i dispositivi è migliore. Questo significa che i tempi di risposta rilevati sono migliori rispettto alla media di tutti i dispositivi testati (19.8 ms). | ||
| ↔ Tempo di risposta dal 50% Grigio all'80% Grigio | ||
| 3 ms ... aumenta ↗ e diminuisce ↘ combinato | ↗ 1 ms Incremento | 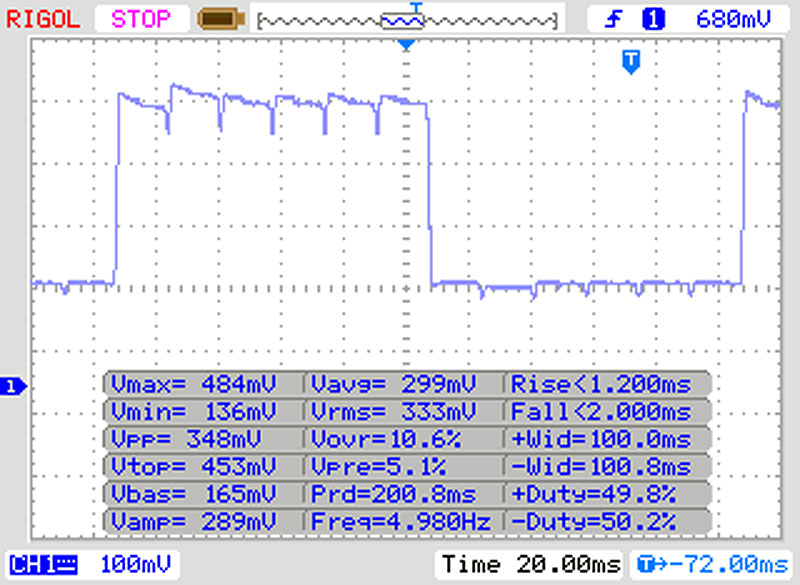 |
| ↘ 2 ms Calo | ||
| Lo schermo ha mostrato valori di risposta molto veloci nei nostri tests ed è molto adatto per i gaming veloce. In confronto, tutti i dispositivi di test variano da 0.165 (minimo) a 636 (massimo) ms. » 13 % di tutti i dispositivi è migliore. Questo significa che i tempi di risposta rilevati sono migliori rispettto alla media di tutti i dispositivi testati (30.9 ms). | ||
Sfarfallio dello schermo / PWM (Pulse-Width Modulation)
| flickering dello schermo / PWM non rilevato | 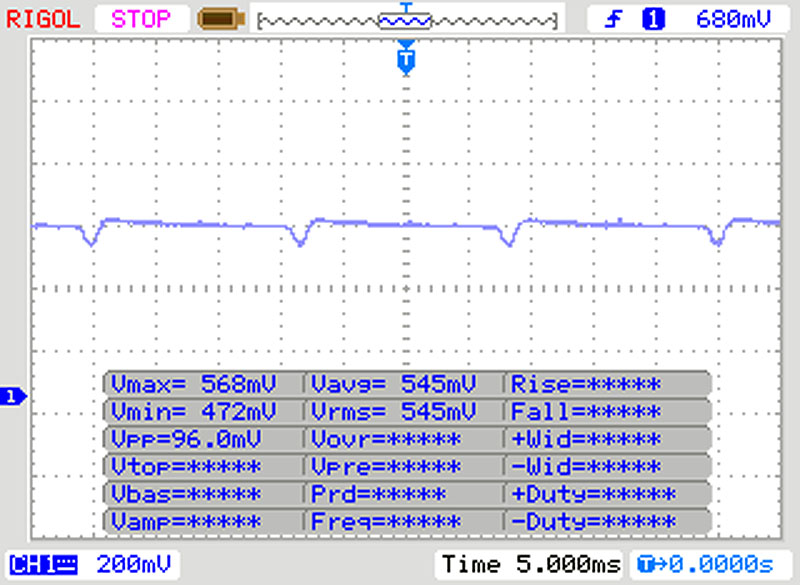 | ||
In confronto: 52 % di tutti i dispositivi testati non utilizza PWM per ridurre la luminosita' del display. Se è rilevato PWM, una media di 7741 (minimo: 5 - massimo: 343500) Hz è stata rilevata. | |||
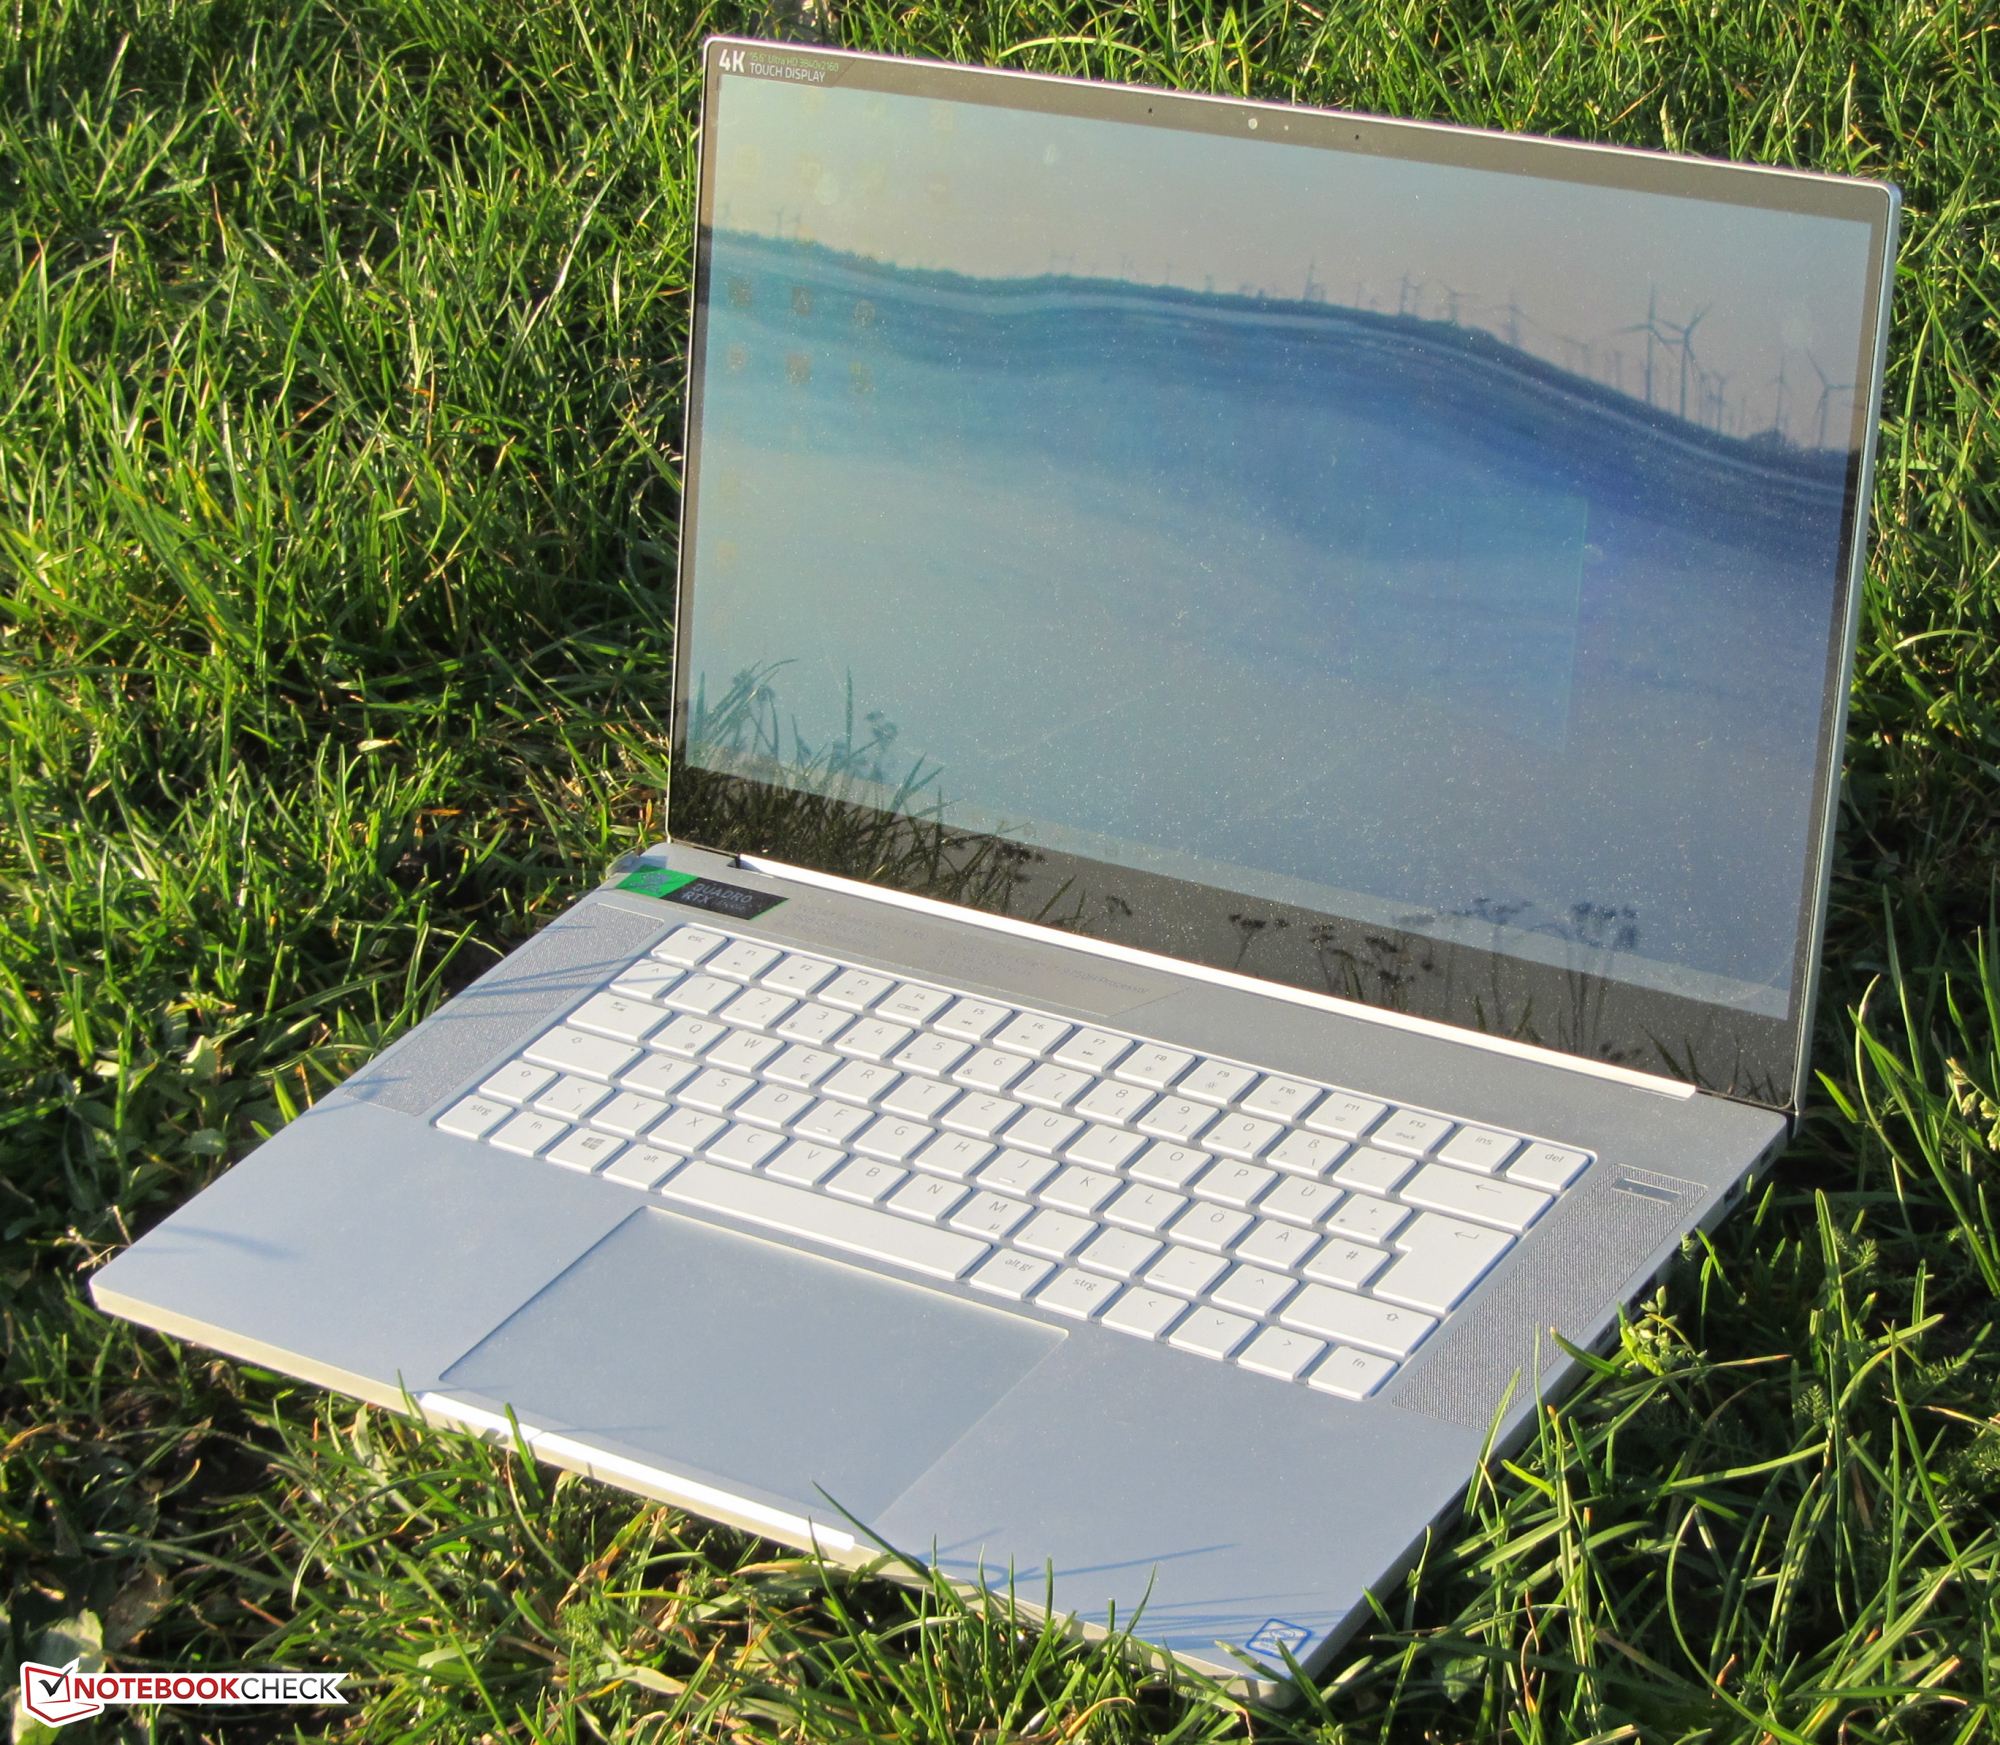
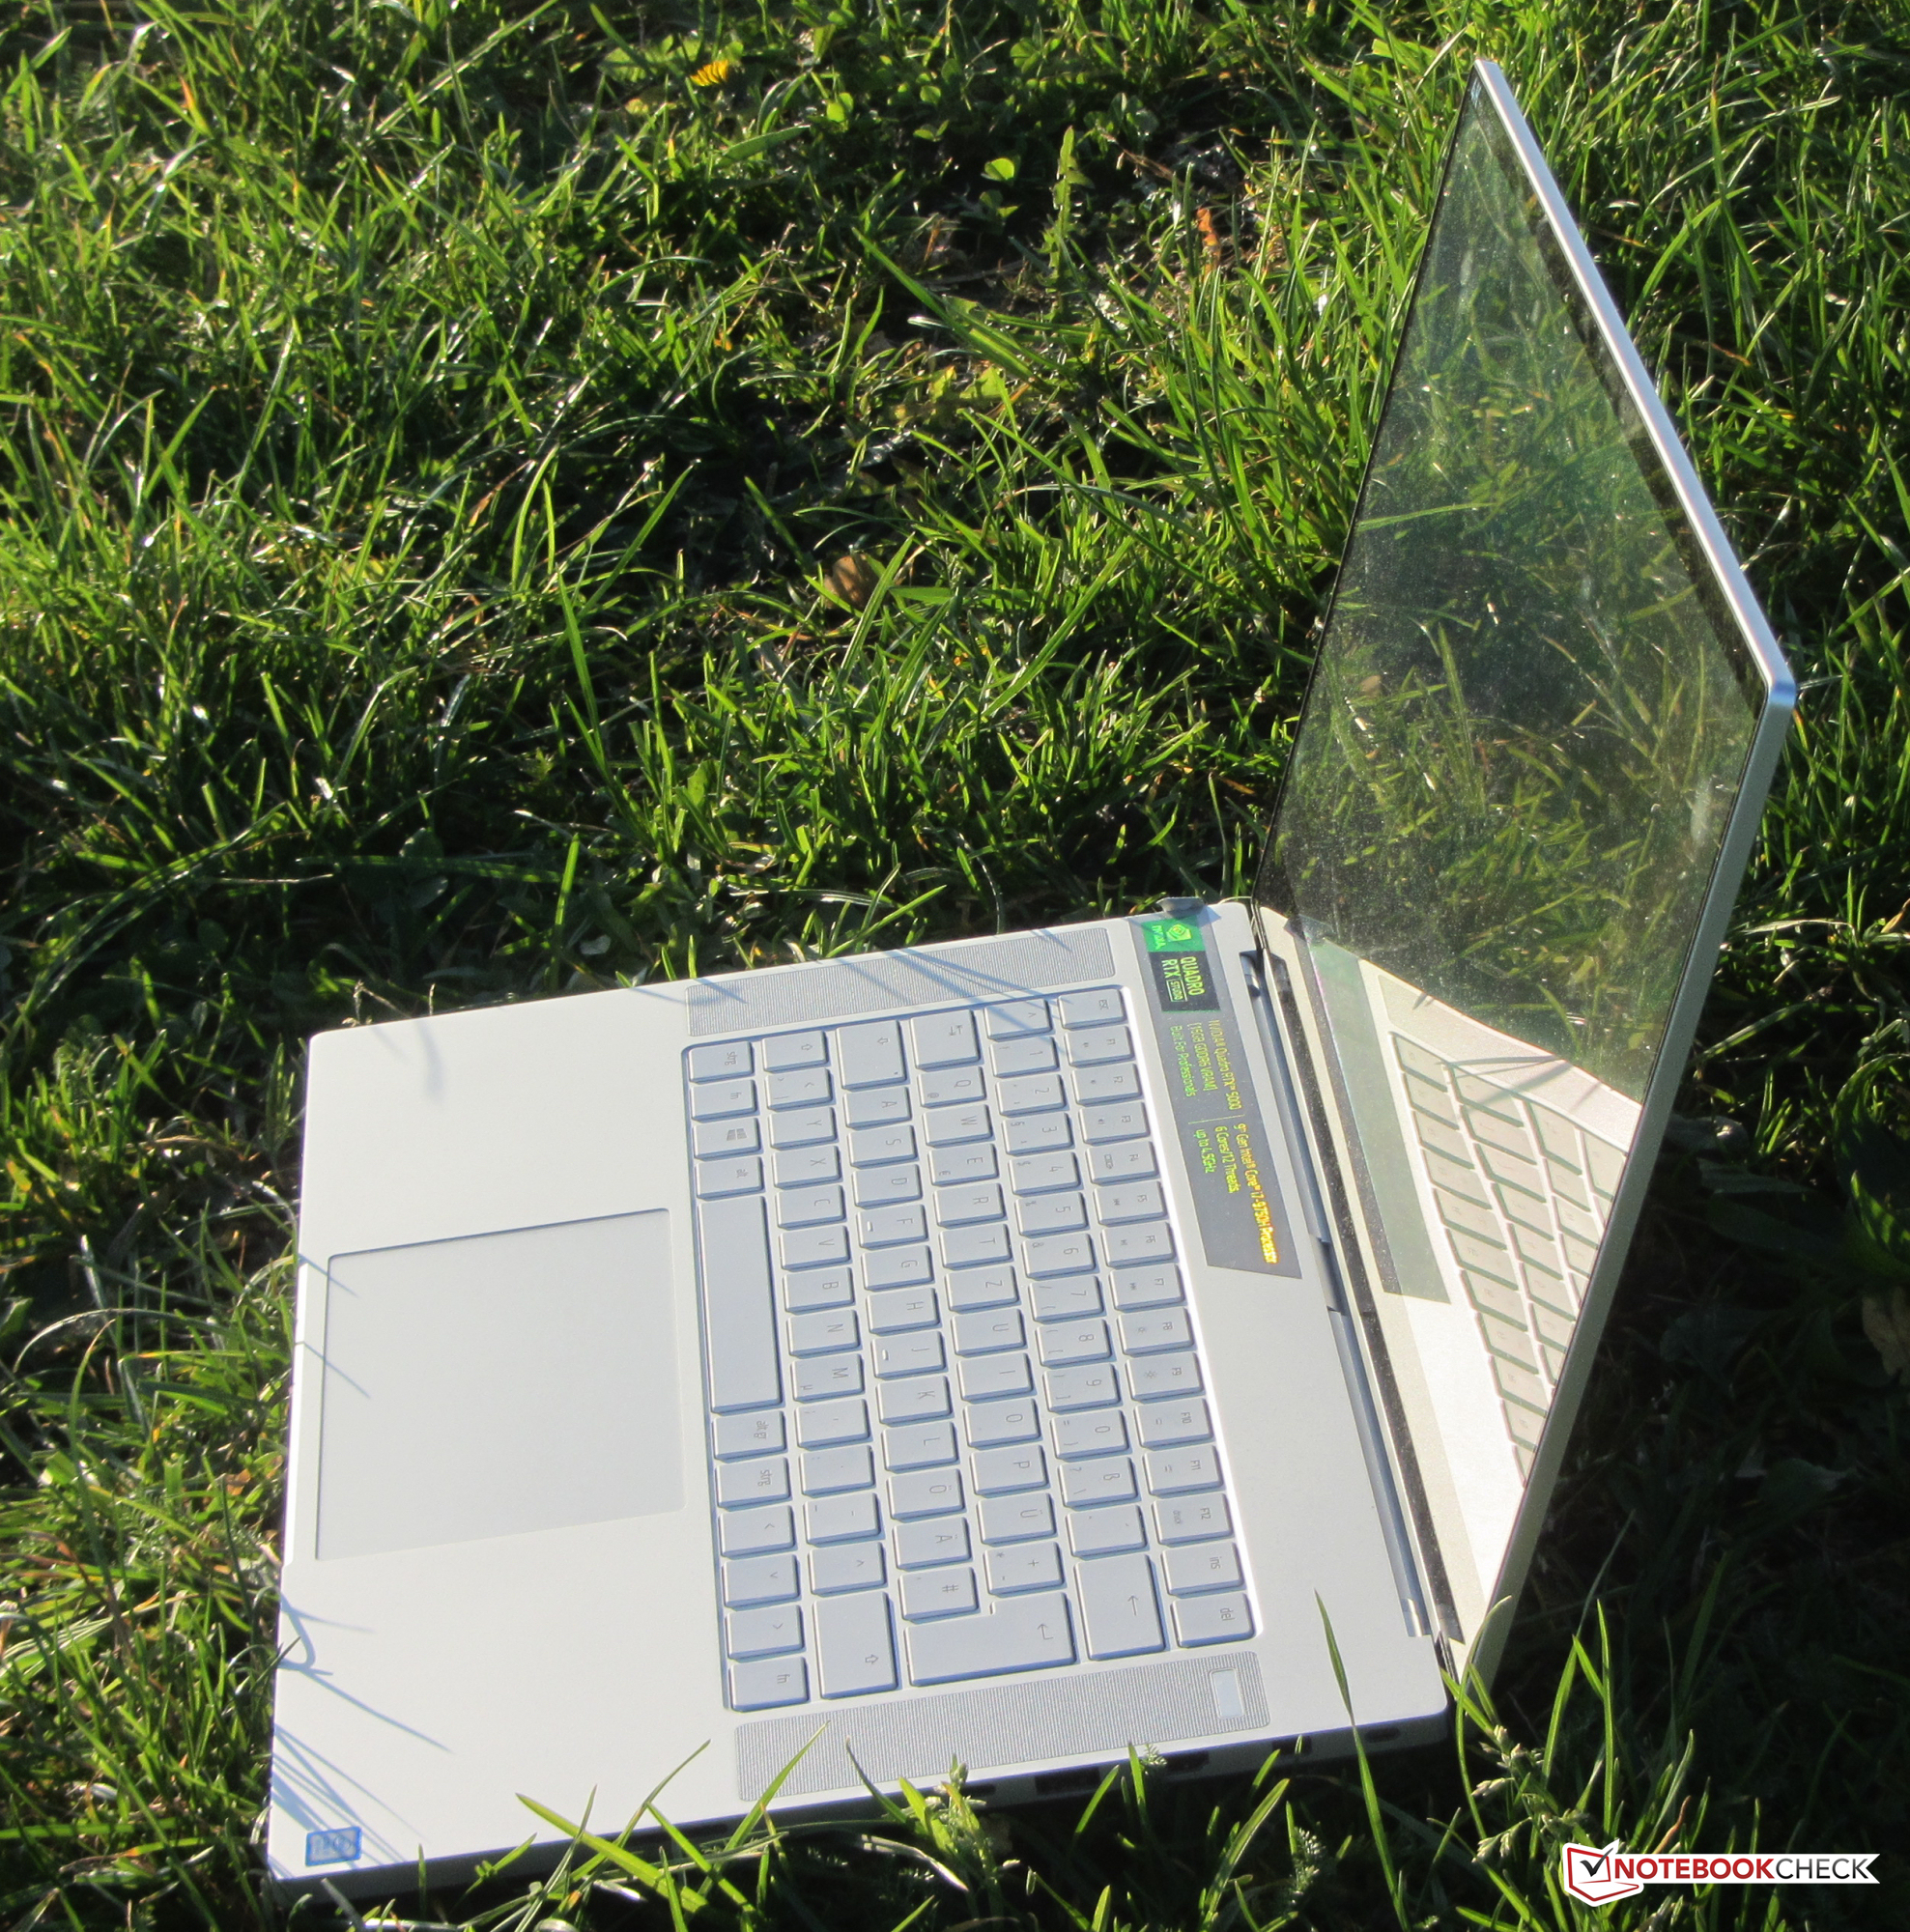
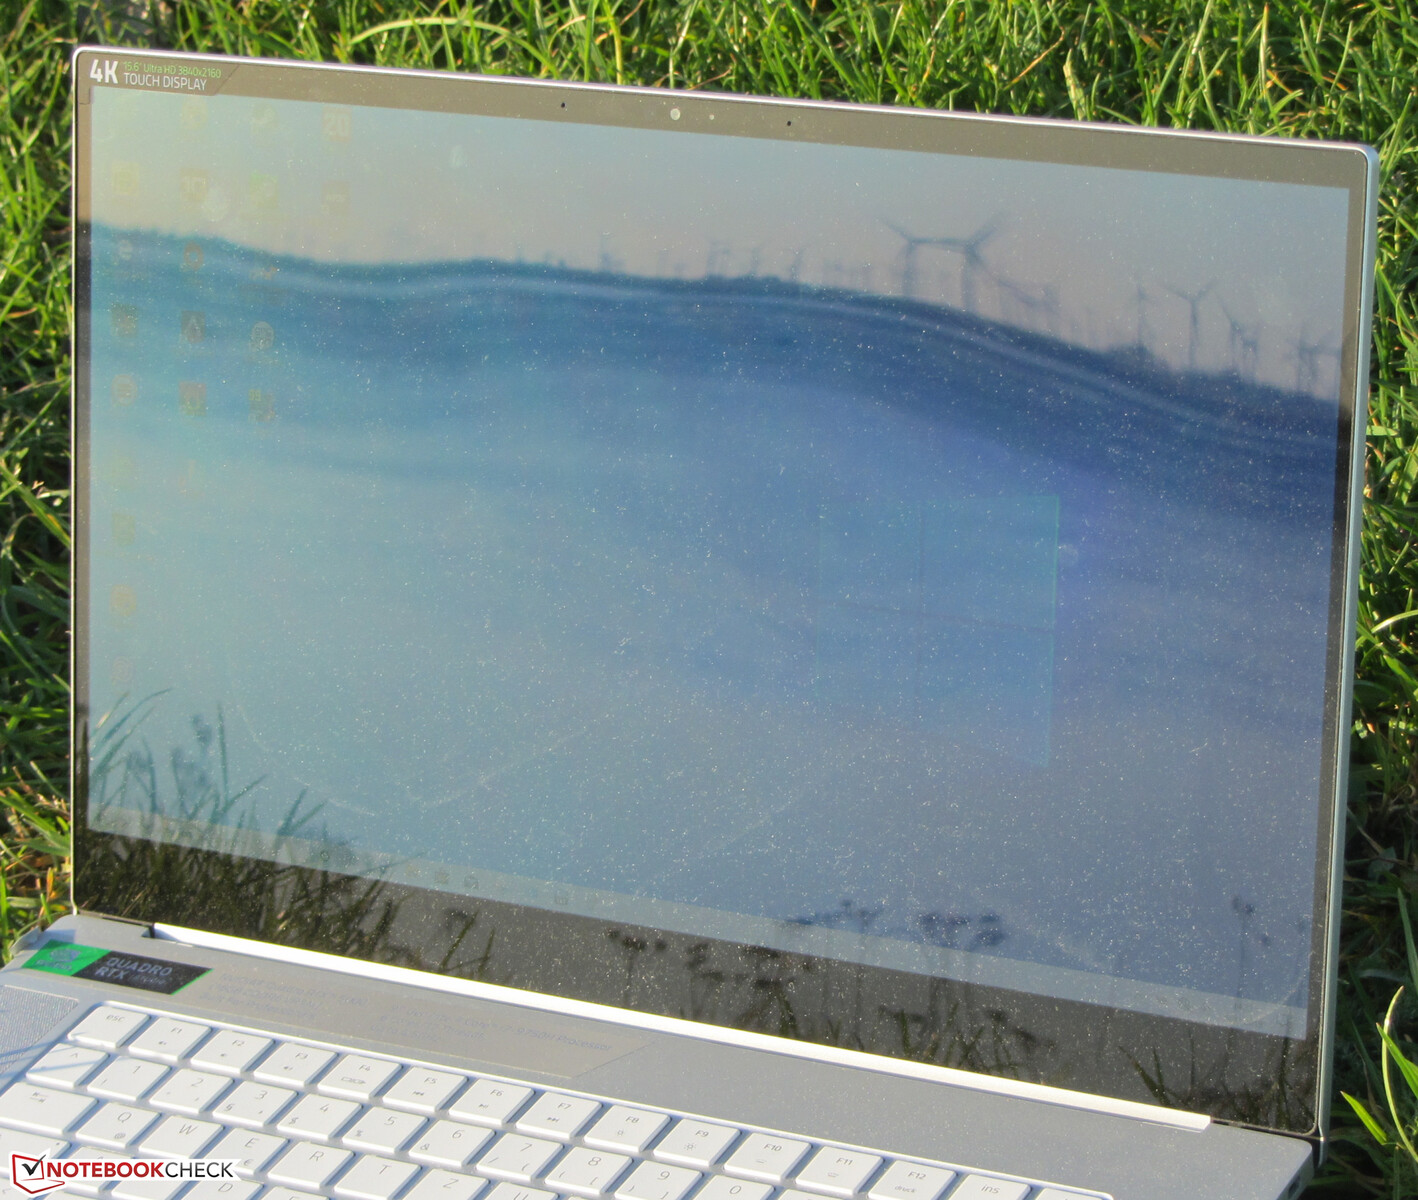
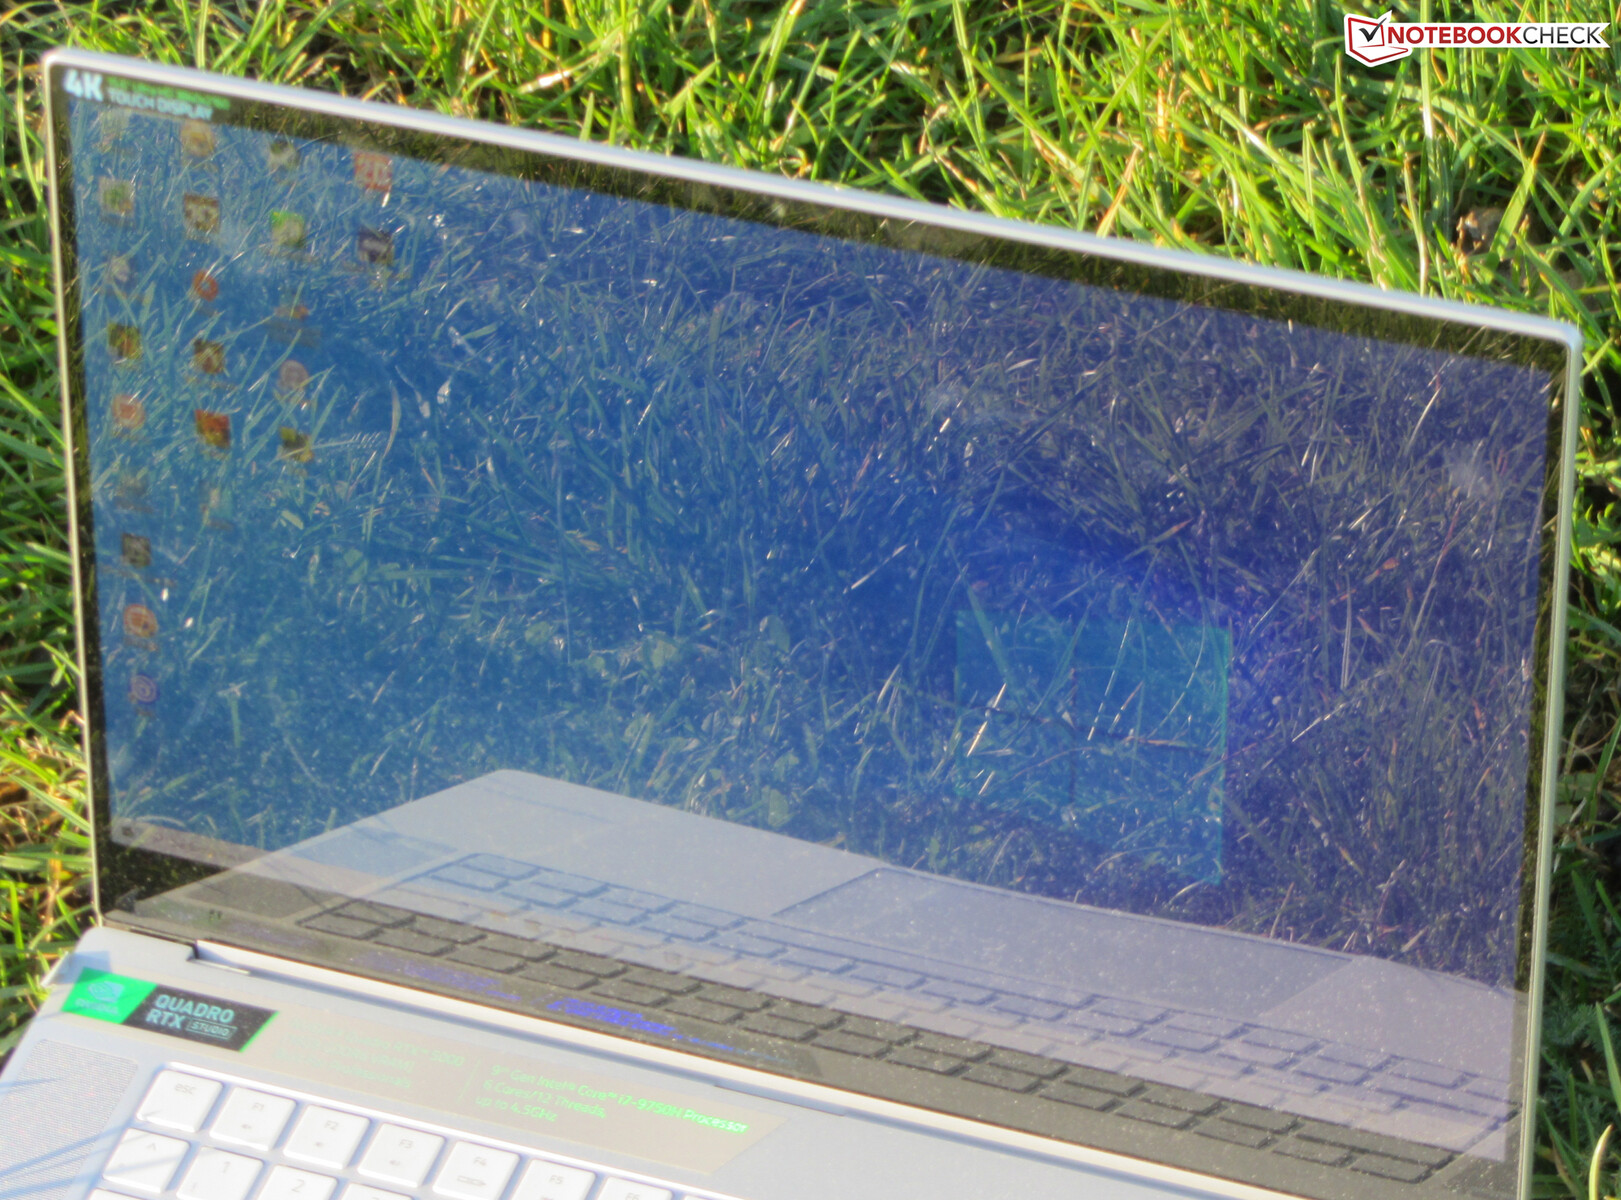
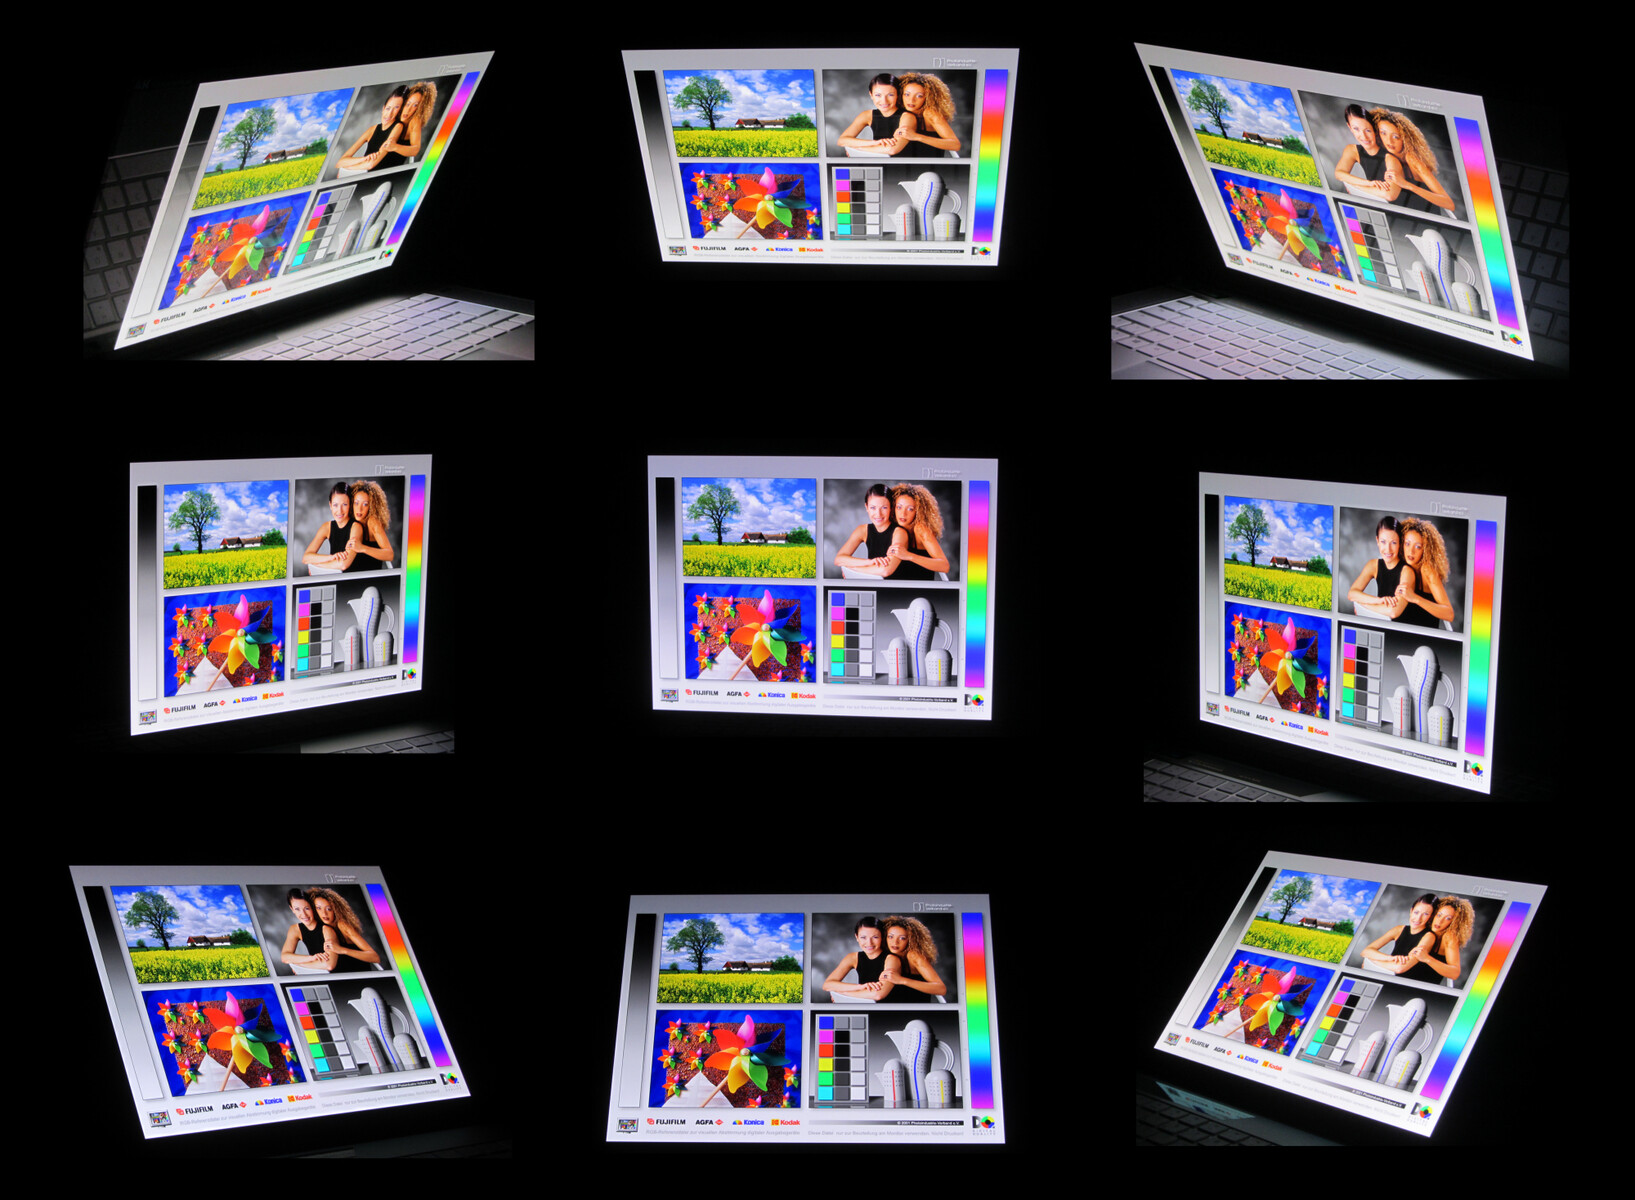
Razer utilizza un pannello OLED con buoni angoli di visualizzazione in questa versione del Blade. Il contenuto del display è riconoscibile da qualsiasi posizione. Questo vale anche per l'uso all'aperto, a condizione che il sole non splenda troppo. In caso contrario, il display lucido influisce negativamente sull'esperienza visiva.
Performance - Sufficienti per tutti i casi di utilizzo
Con Blade 15 Studio Edition, Razer ha creato una workstation da 15,6 pollici con prestazioni più che sufficienti per tutti gli scenari di utilizzo comune. La nostra configurazione di prova può essere acquistata per circa 4.400 euro (~$4.878). Non ci sono altre configurazioni disponibili al momento.
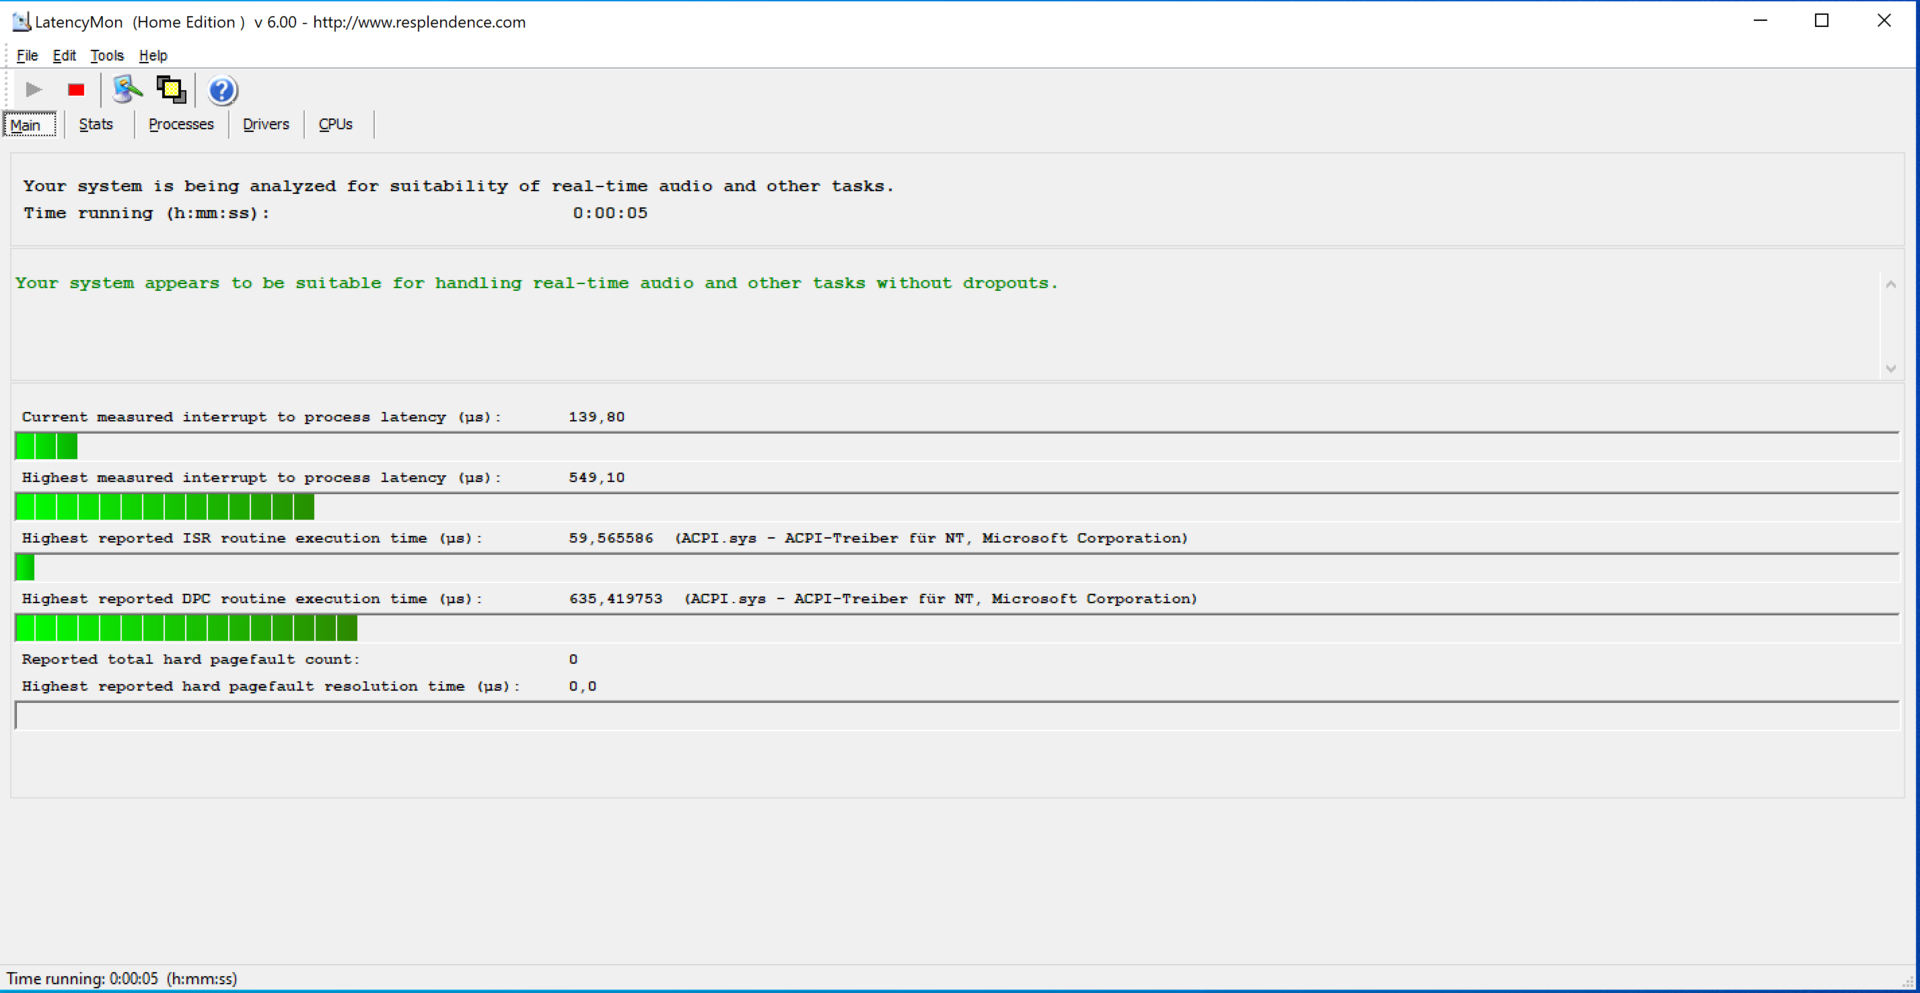
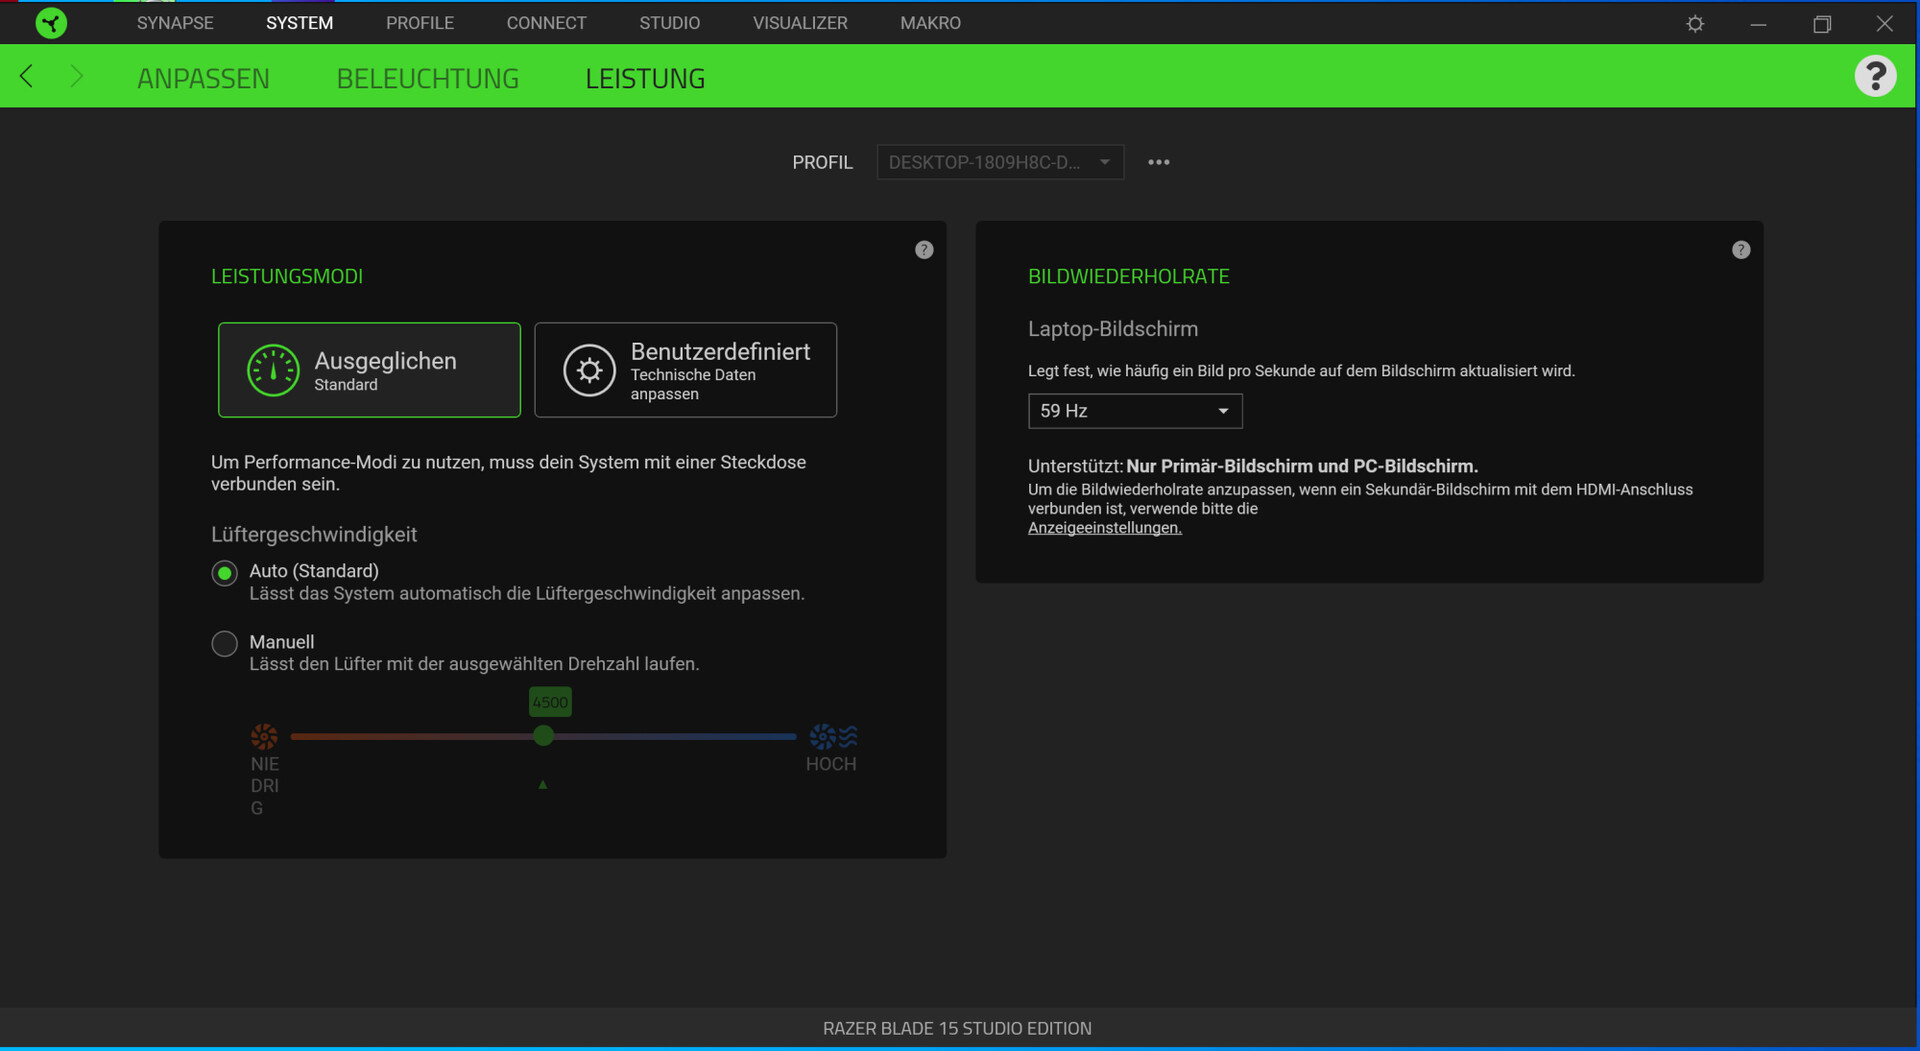
Condizioni di test
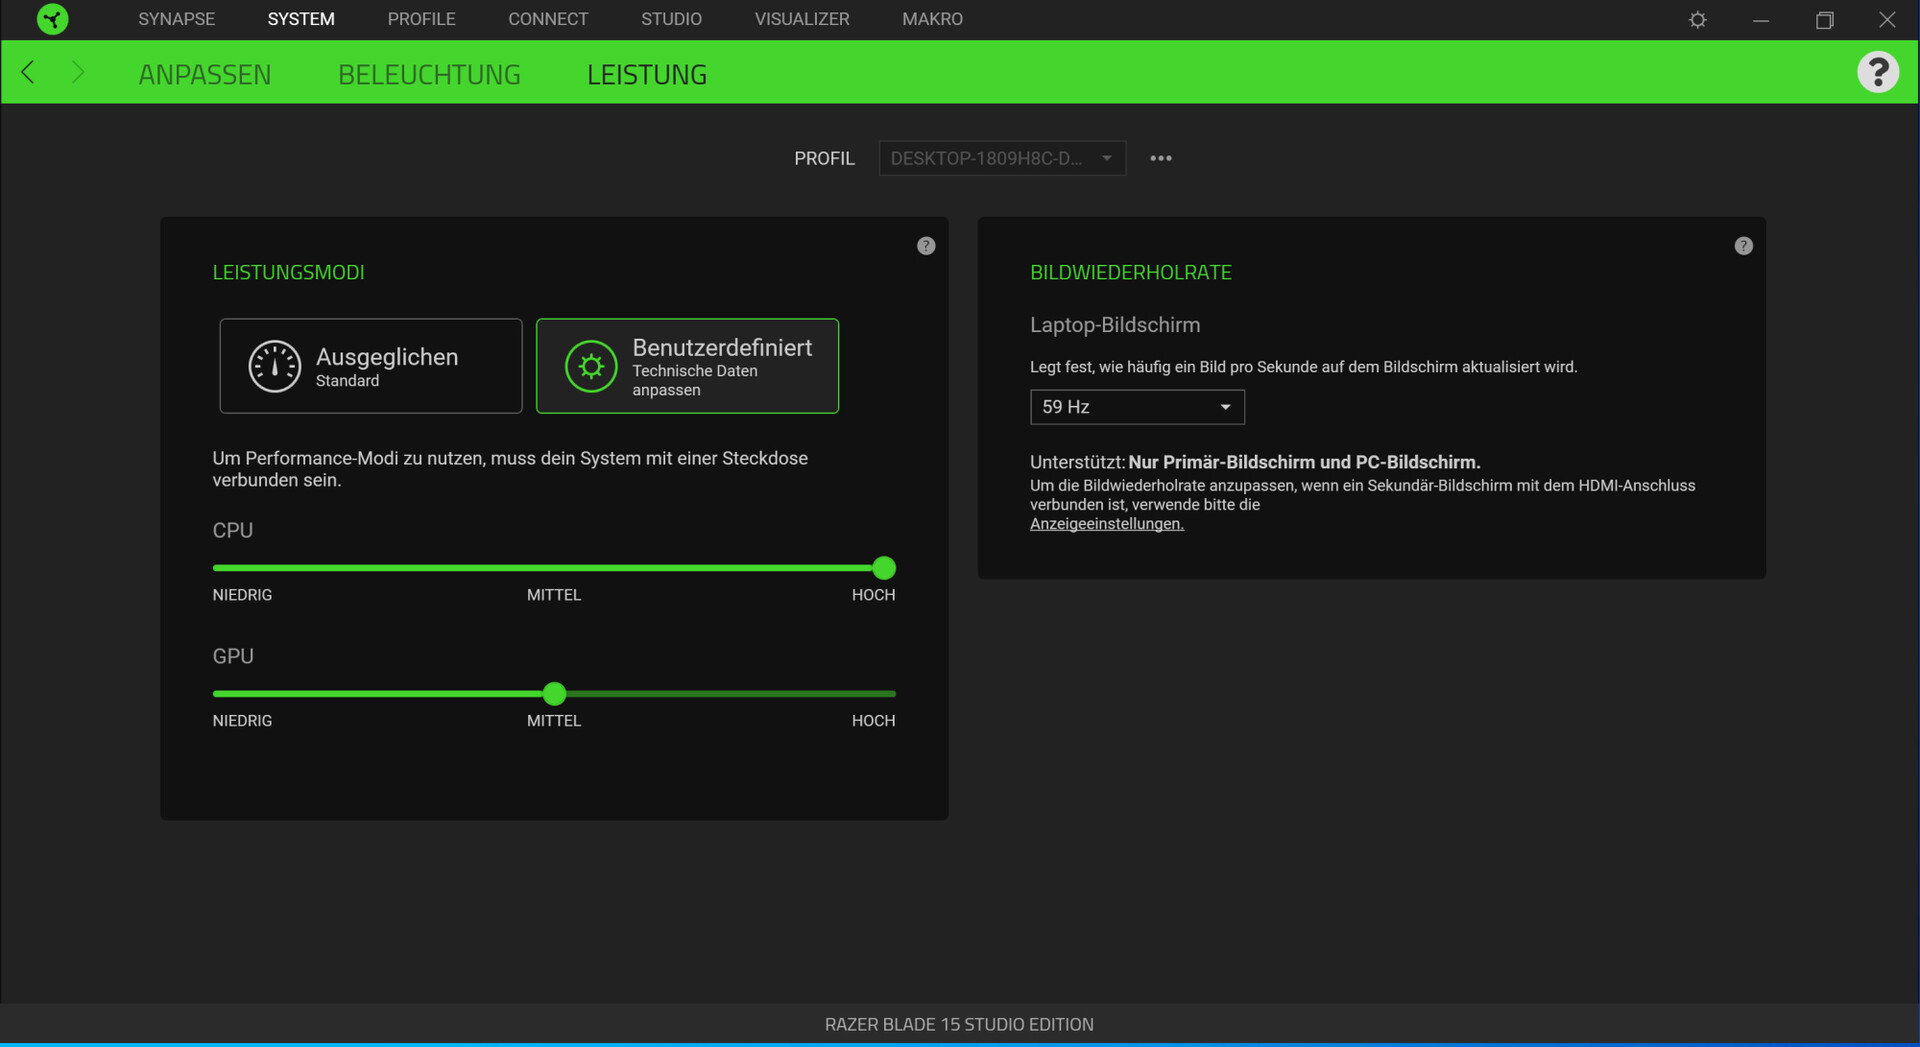
Il software preinstallato Razer Synapse Software offre agli utenti il controllo delle velocità delle ventole e delle prestazioni della CPU e della GPU. Tutti i nostri test sono stati eseguiti usando il controllo automatico delle ventole e il profilo di potenza "Balanced". Abbiamo anche eseguito alcuni benchmarks con le prestazioni della CPU e della GPU impostate ai massimi livelli. I risultati possono essere trovati nelle tabelle di confronto e, se del caso, indicheremo le impostazioni non predefinite.
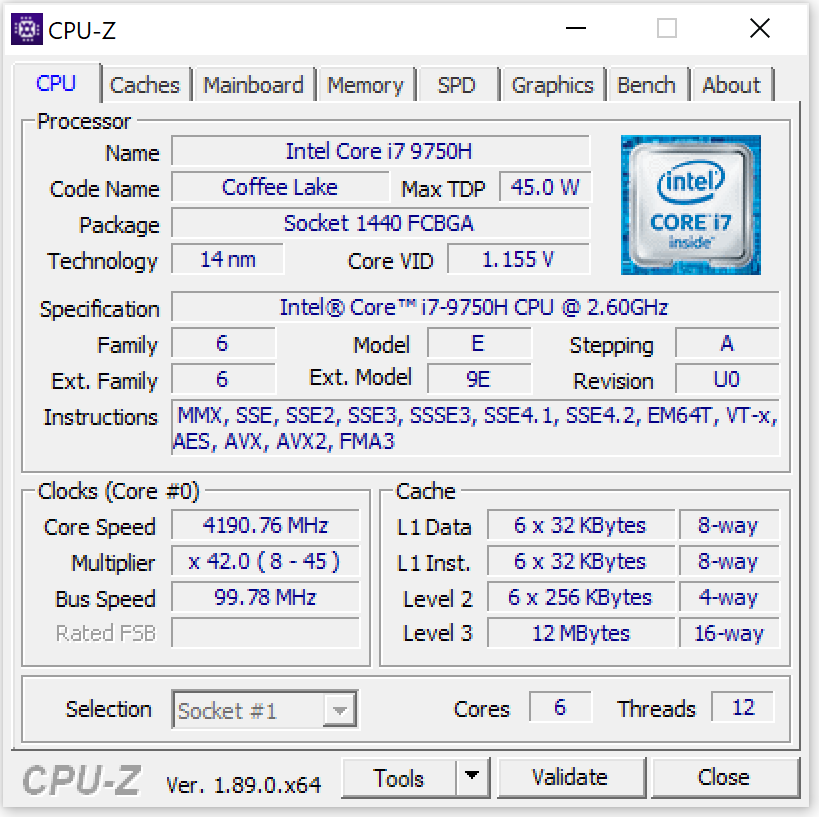
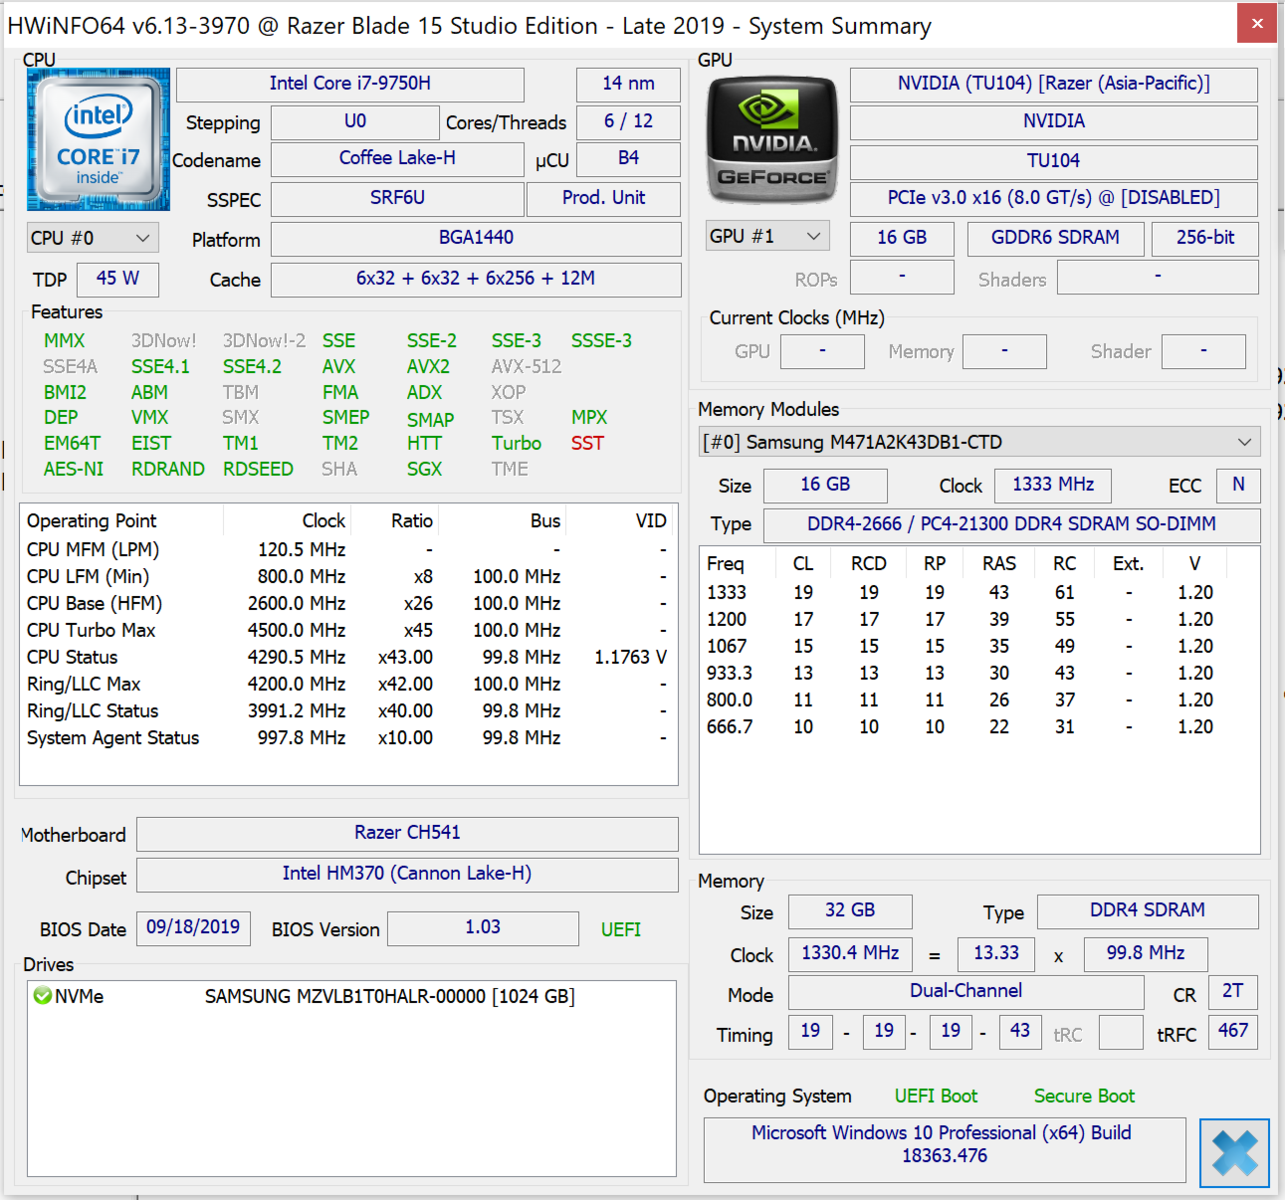
Processore
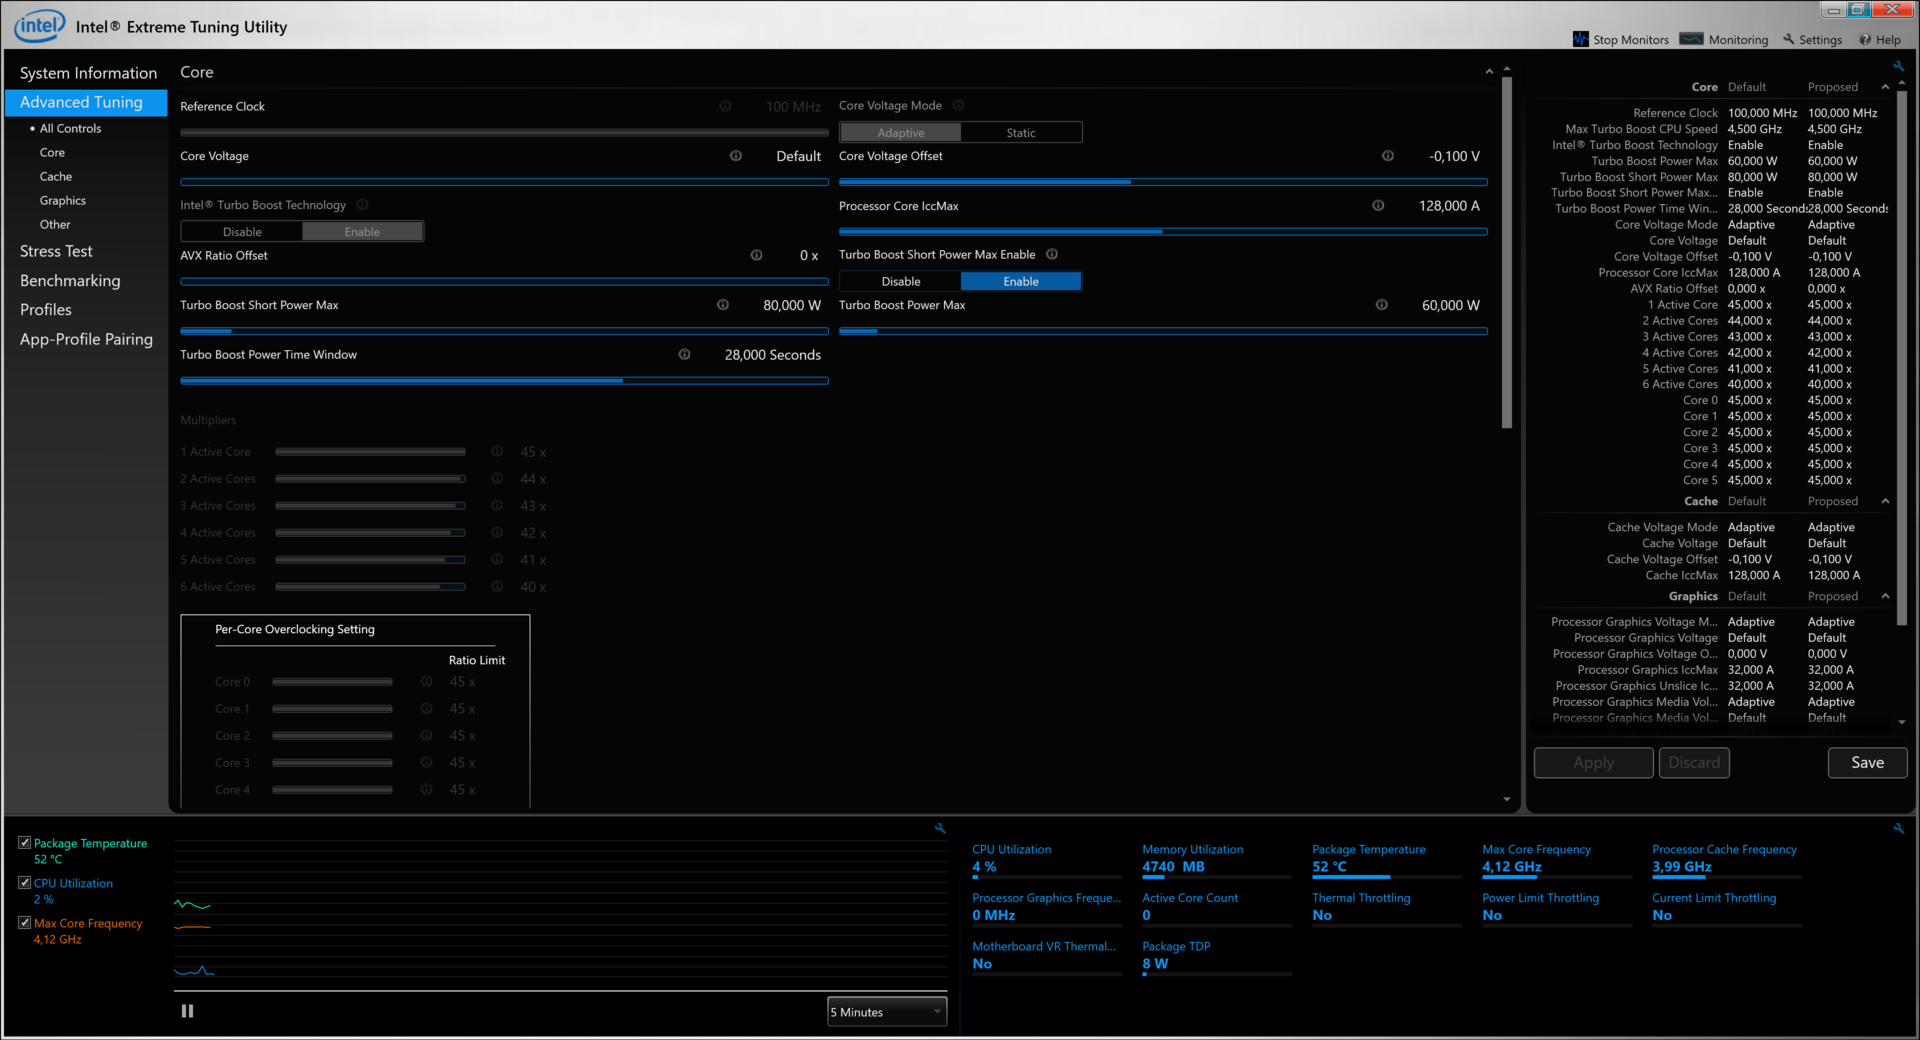
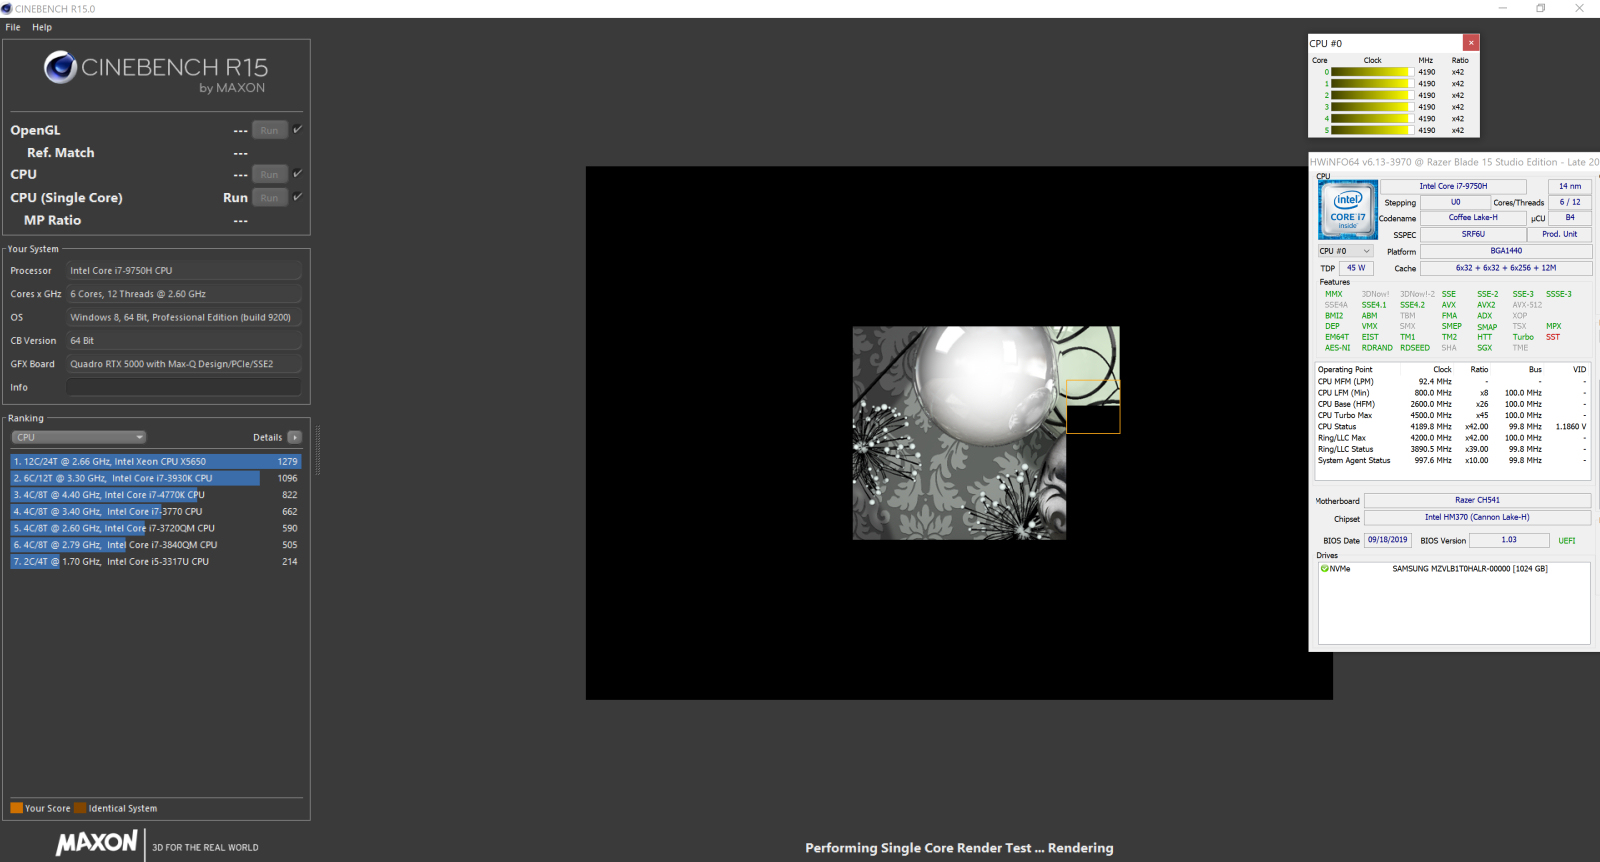
Il Blade 15 è alimentato da un Core-i7-9750H (Coffee Lake refresh). La CPU funziona a un clock di base di 2.6 GHz. Le frequenze massime del Turbo Boost sono 4 GHz (su tutti i sei cores), 4,1 GHz (cinque cores), 4,2 (quattro cores), 4,3 GHz (tre cores) o 4,5 GHz (un core).
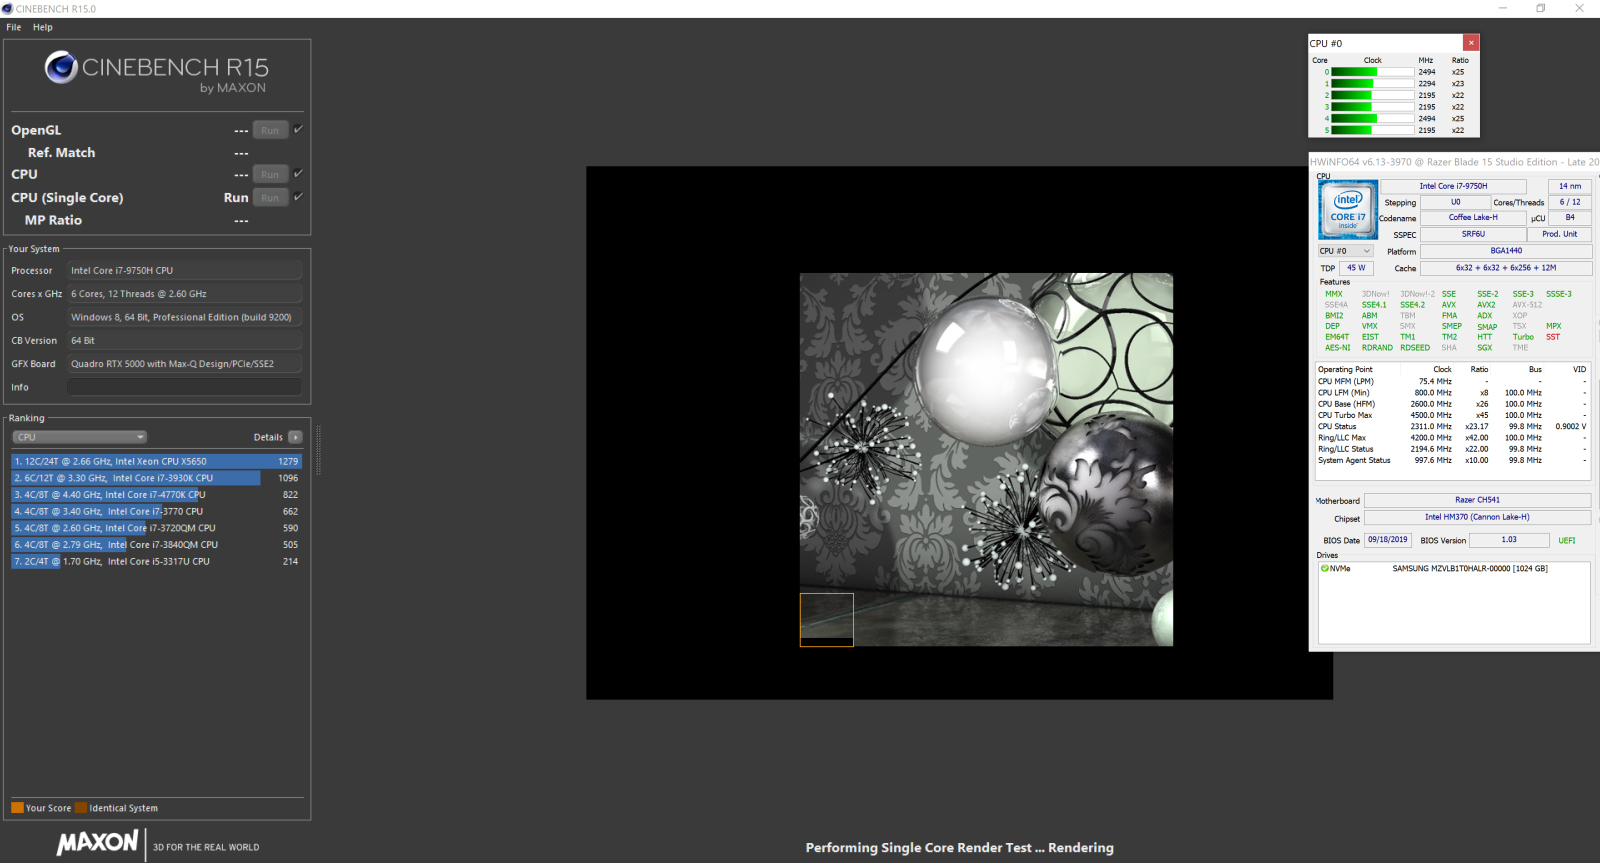
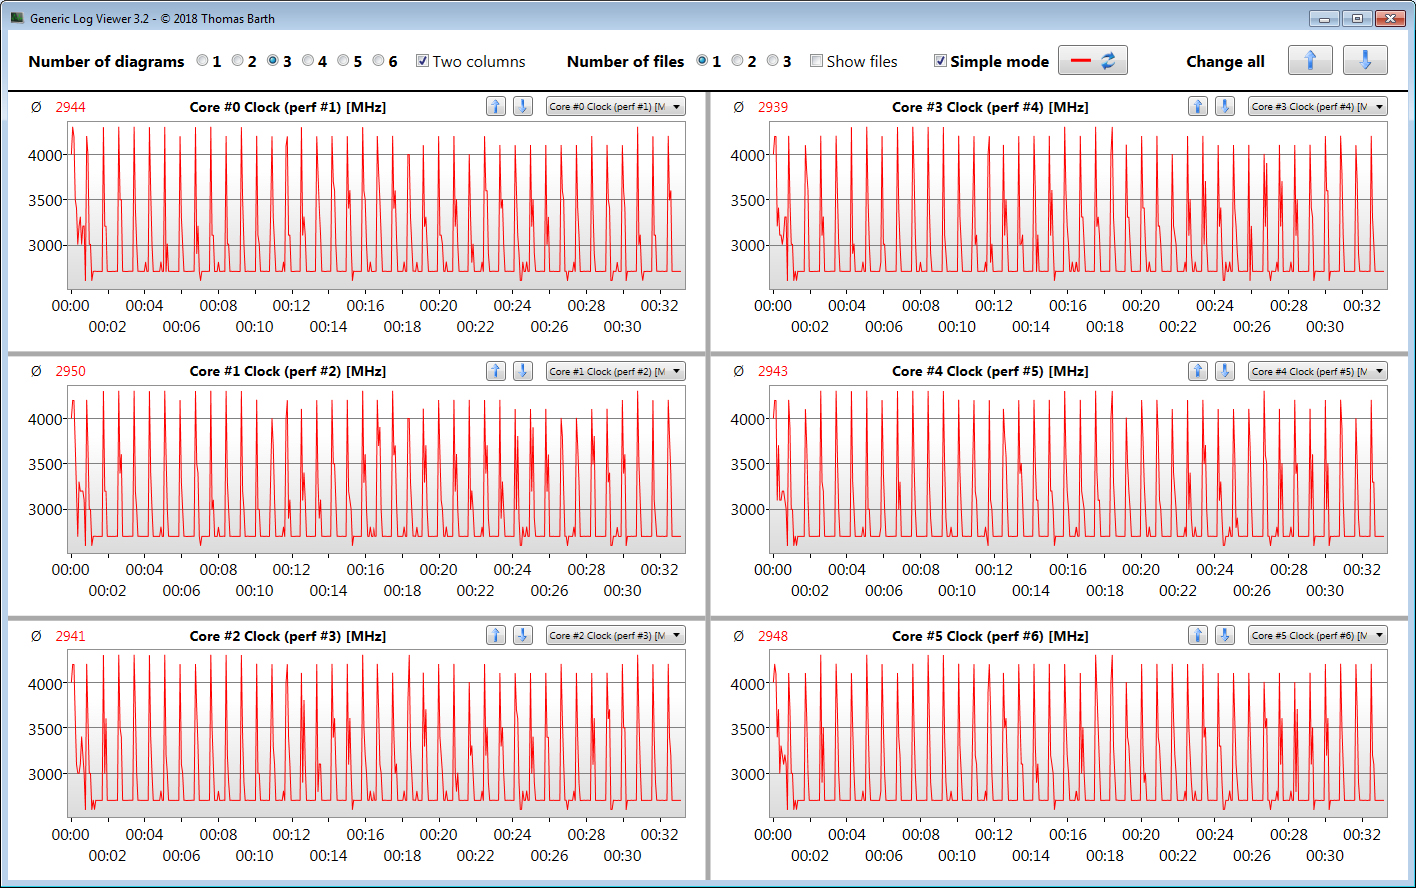
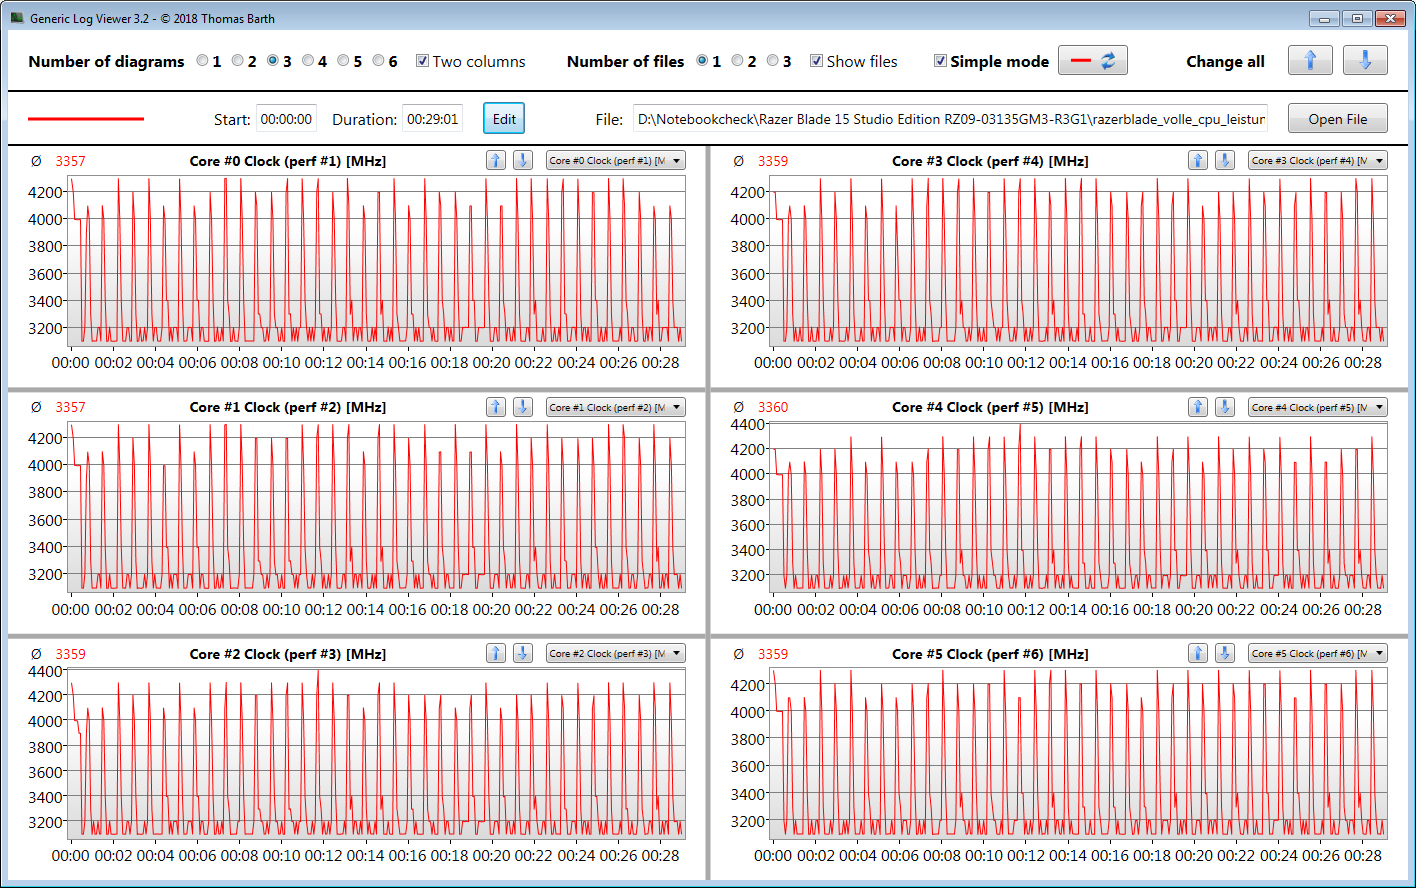
Durante il test Cinebench R15 multithread abbiamo registrato velocità di clock comprese tra 2,9 e 3,4 GHz. Successivamente, la frequenza di clock scende a 2,7 GHz. Durante il test single-thread, il processore gira a 4 - 4,3 GHz. In modalità batteria, questi valori sono ridotti a 2,5-2,6 GHz (multithread) o 2,1-2,9 GHz (single-thread).
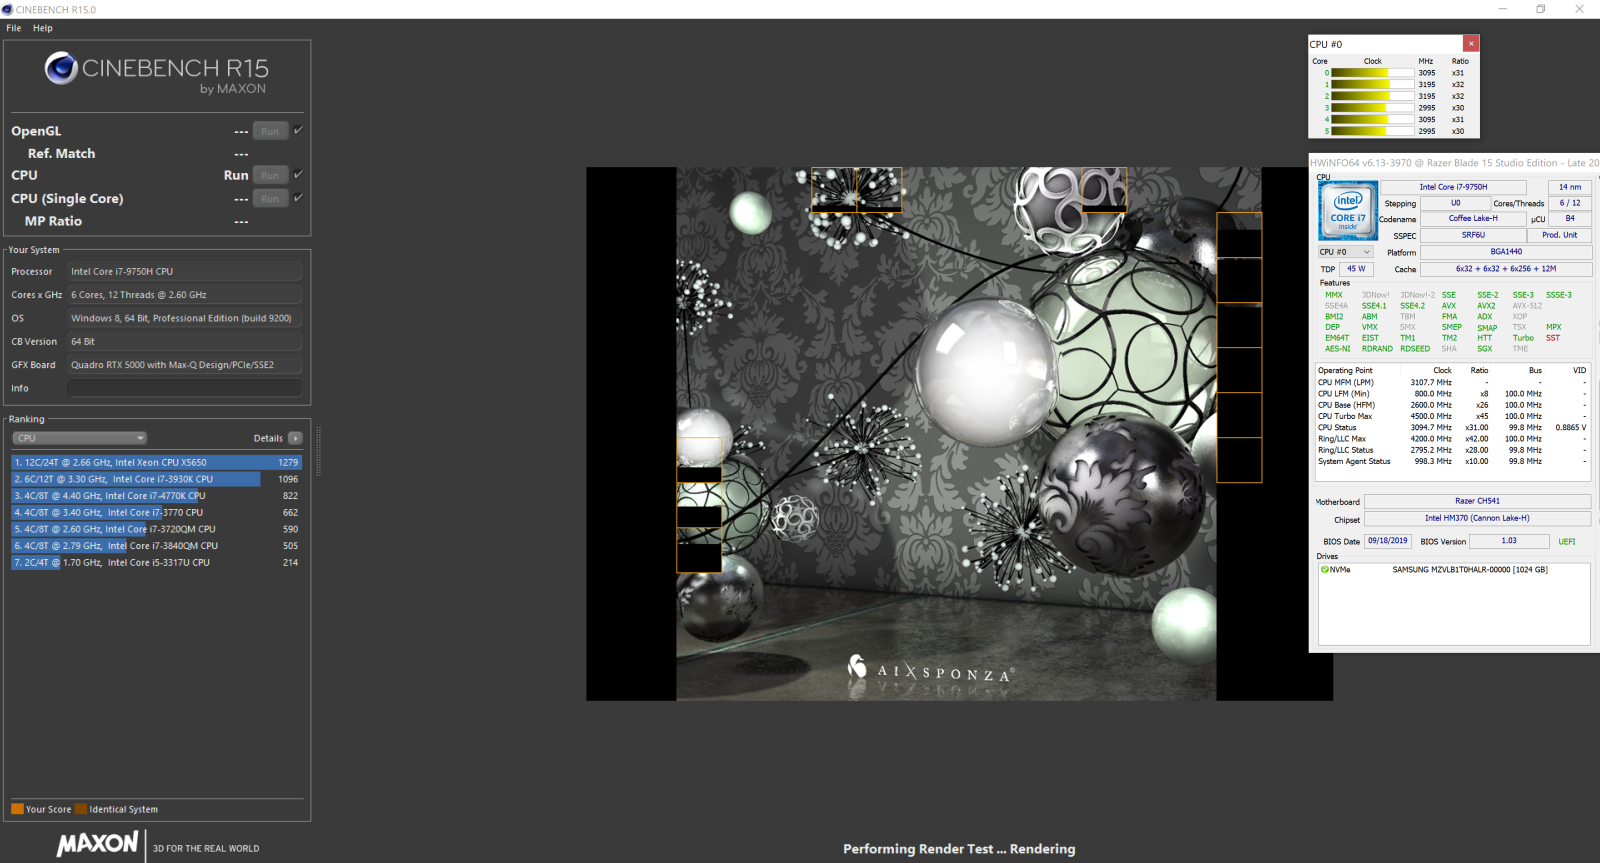
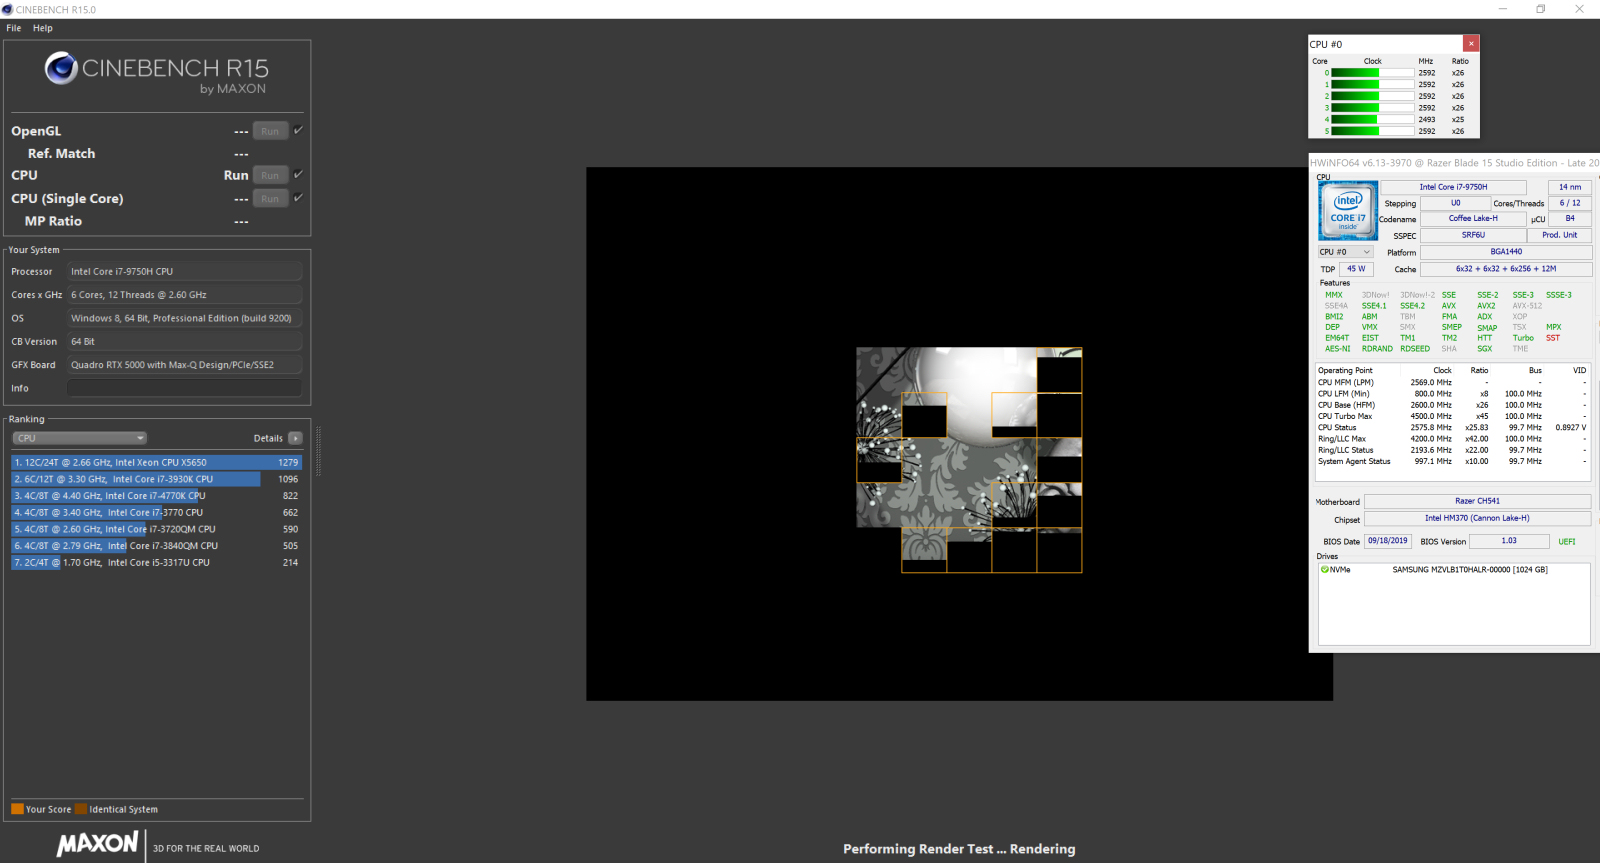
Eseguendo il Cinebench R15 multithread benchmark in un loop per almeno 30 minuti, testiamo la capacità della CPU di mantenere il Turbo Boost a tempo indeterminato. I risultati iniziano a scendere al terzo ciclo e poi si stabilizzano ad un livello relativamente costante. Durante questa fase, viene mantenuta una frequenza leggermente al di sopra del clock di base.
I risultati del Cinebench R15 loop sono deludenti. In questo caso, il processore non esaurisce le sue capacità. Tuttavia, questo può essere risolto. Dopo aver impostato le prestazioni della CPU al massimo nel software Synapse di Razer, lo Studio Edition del Blade 15 raggiunge punteggi quasi identici a quelli dell'Advanced Model, che è dotato della stessa CPU.
| Cinebench R15 | |
| CPU Single 64Bit | |
| Media della classe Workstation (191.4 - 328, n=22, ultimi 2 anni) | |
| Lenovo ThinkPad P53-20QN000YGE | |
| MSI P65 Creator 9SF-657 | |
| Dell Precision 5540 | |
| Fujitsu Celsius H780 | |
| Media Intel Core i7-9750H (170 - 194, n=82) | |
| Razer Blade 15 Studio Edition (Max. CPU-Leistung) | |
| Razer Blade 15 Studio Edition | |
| HP ZBook Studio G5-4QH10EA | |
| Razer Blade 15 RTX 2080 Max-Q | |
| CPU Multi 64Bit | |
| Media della classe Workstation (2489 - 5810, n=22, ultimi 2 anni) | |
| MSI P65 Creator 9SF-657 | |
| Dell Precision 5540 | |
| Lenovo ThinkPad P53-20QN000YGE | |
| Media Intel Core i7-9750H (952 - 1306, n=85) | |
| Razer Blade 15 RTX 2080 Max-Q | |
| Razer Blade 15 Studio Edition (Max. CPU-Leistung) | |
| HP ZBook Studio G5-4QH10EA | |
| Fujitsu Celsius H780 | |
| Razer Blade 15 Studio Edition | |
| Cinebench R10 | |
| Rendering Single 32Bit | |
| Dell Precision 5540 | |
| Media della classe Workstation (n=1ultimi 2 anni) | |
| Media Intel Core i7-9750H (6659 - 7214, n=13) | |
| Razer Blade 15 Studio Edition | |
| Rendering Multiple CPUs 32Bit | |
| Media della classe Workstation (n=1ultimi 2 anni) | |
| Dell Precision 5540 | |
| Media Intel Core i7-9750H (28251 - 36304, n=13) | |
| Razer Blade 15 Studio Edition | |
| Cinebench R20 | |
| CPU (Single Core) | |
| Media della classe Workstation (671 - 857, n=22, ultimi 2 anni) | |
| Media Intel Core i7-9750H (416 - 486, n=55) | |
| Razer Blade 15 Studio Edition (Max. CPU-Leistung) | |
| Razer Blade 15 Studio Edition | |
| CPU (Multi Core) | |
| Media della classe Workstation (5760 - 15043, n=22, ultimi 2 anni) | |
| Media Intel Core i7-9750H (2017 - 3133, n=55) | |
| Razer Blade 15 Studio Edition (Max. CPU-Leistung) | |
| Razer Blade 15 Studio Edition | |
| Geekbench 3 | |
| 32 Bit Multi-Core Score | |
| Media Intel Core i7-9750H (21185 - 23587, n=8) | |
| Razer Blade 15 Studio Edition | |
| 32 Bit Single-Core Score | |
| Razer Blade 15 Studio Edition | |
| Media Intel Core i7-9750H (4137 - 4428, n=8) | |
| Mozilla Kraken 1.1 - Total | |
| HP ZBook Studio G5-4QH10EA (Edge) | |
| Razer Blade 15 RTX 2080 Max-Q (Edge 44.17763.1.0) | |
| Razer Blade 15 Studio Edition (Edge 44) | |
| Media Intel Core i7-9750H (845 - 1713, n=54) | |
| Lenovo ThinkPad P53-20QN000YGE (Edge 44.18362.387.0) | |
| Dell Precision 5540 | |
| Media della classe Workstation (411 - 538, n=22, ultimi 2 anni) | |
| Octane V2 - Total Score | |
| Media della classe Workstation (112382 - 129420, n=3, ultimi 2 anni) | |
| Dell Precision 5540 | |
| Lenovo ThinkPad P53-20QN000YGE (Edge 44.18362.387.0) | |
| Razer Blade 15 RTX 2080 Max-Q (Edge 44.17763.1.0) | |
| Media Intel Core i7-9750H (22874 - 39708, n=47) | |
| Razer Blade 15 Studio Edition (Edge 44) | |
| HP ZBook Studio G5-4QH10EA (Edge) | |
| JetStream 1.1 - 1.1 Total | |
| Lenovo ThinkPad P53-20QN000YGE (Edge 44.18362.387.0) | |
| Razer Blade 15 RTX 2080 Max-Q (Edge 44.17763.1.0) | |
| Fujitsu Celsius H780 (Edge) | |
| Media Intel Core i7-9750H (212 - 280, n=47) | |
| Dell Precision 5540 | |
| Razer Blade 15 Studio Edition (Edge 44) | |
| HP ZBook Studio G5-4QH10EA (Edge) | |
* ... Meglio usare valori piccoli
Prestazioni di sistema
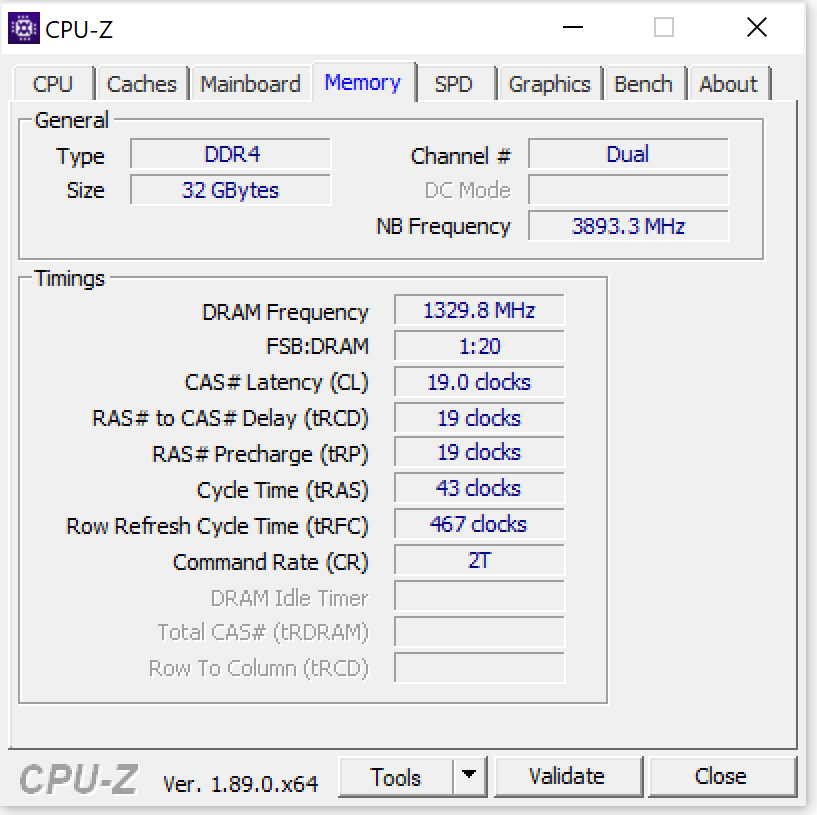
Questo dispositivo da 15,6 pollici ha buone prestazioni. Un potente processore a sei cores, una memoria dual-channel e una veloce SSD NVMe garantiscono un funzionamento del sistema fluido e reattivo. Inoltre, il laptop contiene una GPU di fascia alta. Come dimostrano gli ottimi punteggi del benchmark PCMark, le prestazioni del laptop sono abbastanza elevate per tutti i casi di uso comune.
| PCMark 8 Home Score Accelerated v2 | 3551 punti | |
| PCMark 8 Creative Score Accelerated v2 | 3820 punti | |
| PCMark 8 Work Score Accelerated v2 | 4454 punti | |
| PCMark 10 Score | 5317 punti | |
Aiuto | ||
Dispositivi di archiviazione
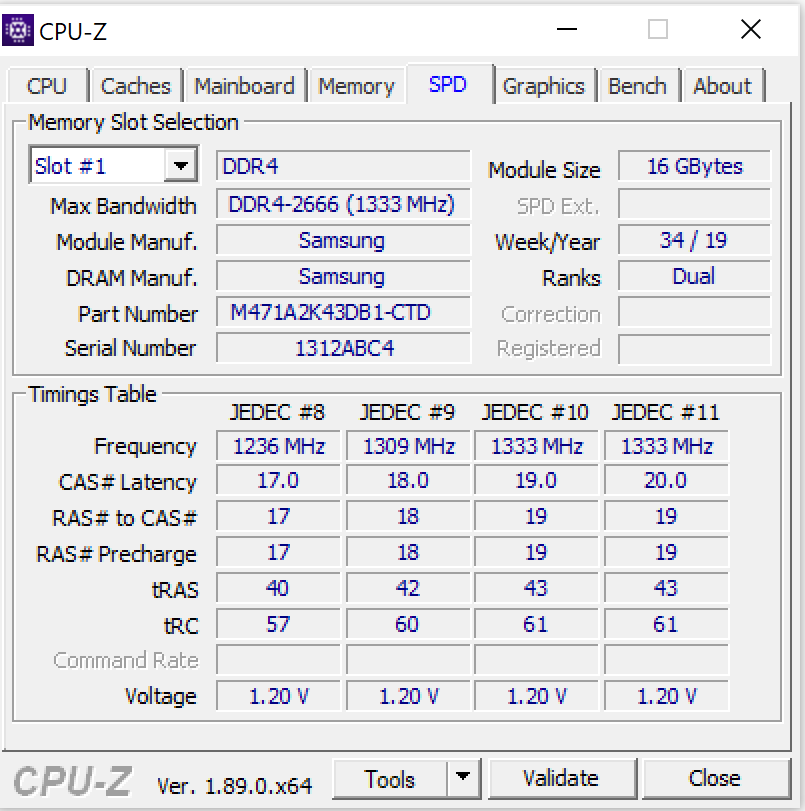
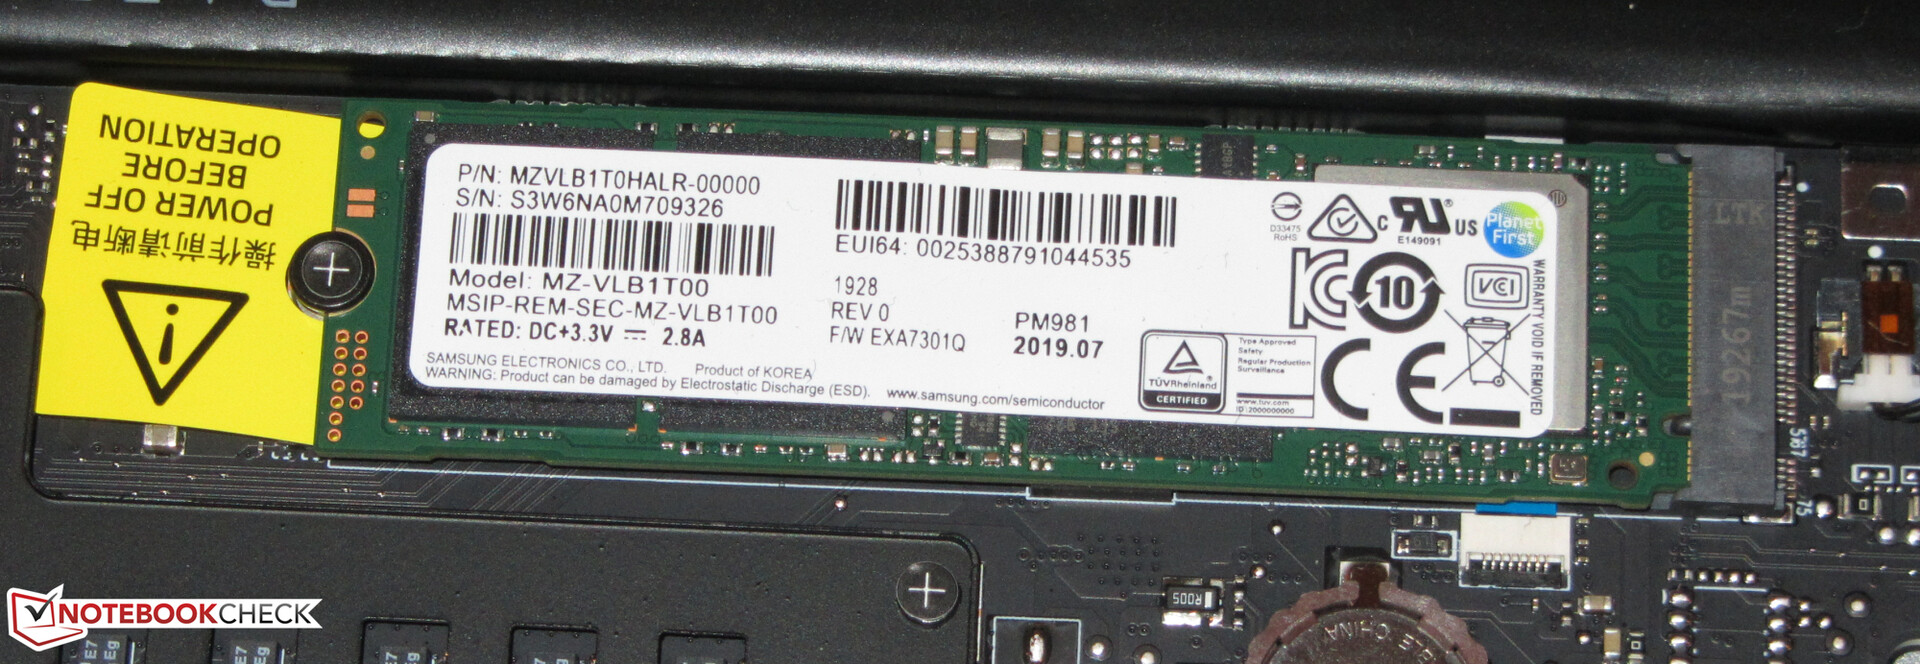
Un'unità SSD Samsung NVMe serve come unità di sistema. Questo particolare modello è disponibile nel formato M.2-2280 e offre 1 TB di spazio di archiviazione. Circa 887 GB sono disponibili per gli utenti al primo avvio. Lo spazio di archiviazione rimanente è occupato dalla partizione di recupero e dai file di Windows. Grazie all'interfaccia PCI Express, l'SSD raggiunge velocità di trasferimento dati eccezionali.

| Razer Blade 15 Studio Edition Samsung SSD PM981 MZVLB1T0HALR | Razer Blade 15 RTX 2080 Max-Q Samsung SSD PM981 MZVLB512HAJQ | Lenovo ThinkPad P53-20QN000YGE Samsung PM981a MZVLB1T0HBLR | MSI P65 Creator 9SF-657 2x Samsung SSD PM981 MZVLB512HAJQ (RAID 0) | Dell Precision 5540 SK hynix PC400 512 GB | Fujitsu Celsius H780 Samsung SSD PM981 MZVLB512HAJQ | HP ZBook Studio G5-4QH10EA Samsung SSD PM981 MZVLB512HAJQ | Media Samsung SSD PM981 MZVLB1T0HALR | |
|---|---|---|---|---|---|---|---|---|
| CrystalDiskMark 5.2 / 6 | 16% | 26% | 56% | -4% | -2% | -4% | 25% | |
| Write 4K (MB/s) | 100.4 | 137.2 37% | 147 46% | 105.6 5% | 98 -2% | 98.3 -2% | 102.7 2% | 165.7 ? 65% |
| Read 4K (MB/s) | 42.03 | 46.82 11% | 48.3 15% | 46.32 10% | 41.25 -2% | 40.18 -4% | 38.32 -9% | 44.6 ? 6% |
| Write Seq (MB/s) | 1185 | 1221 3% | 1402 18% | 2910 146% | 1295 9% | 1777 50% | 1417 20% | 1982 ? 67% |
| Read Seq (MB/s) | 1132 | 1217 8% | 1503 33% | 2820 149% | 1441 27% | 1247 10% | 1289 14% | 1764 ? 56% |
| Write 4K Q32T1 (MB/s) | 371.4 | 527 42% | 475.2 28% | 545 47% | 429.2 16% | 344.7 -7% | 278.9 -25% | 395 ? 6% |
| Read 4K Q32T1 (MB/s) | 422.6 | 614 45% | 581 37% | 632 50% | 400.1 -5% | 383.1 -9% | 348.8 -17% | 434 ? 3% |
| Write Seq Q32T1 (MB/s) | 2379 | 1986 -17% | 2936 23% | 3349 41% | 1366 -43% | 2019 -15% | 1895 -20% | 2351 ? -1% |
| Read Seq Q32T1 (MB/s) | 3222 | 3234 0% | 3539 10% | 3333 3% | 2201 -32% | 2076 -36% | 3352 4% | 3234 ? 0% |
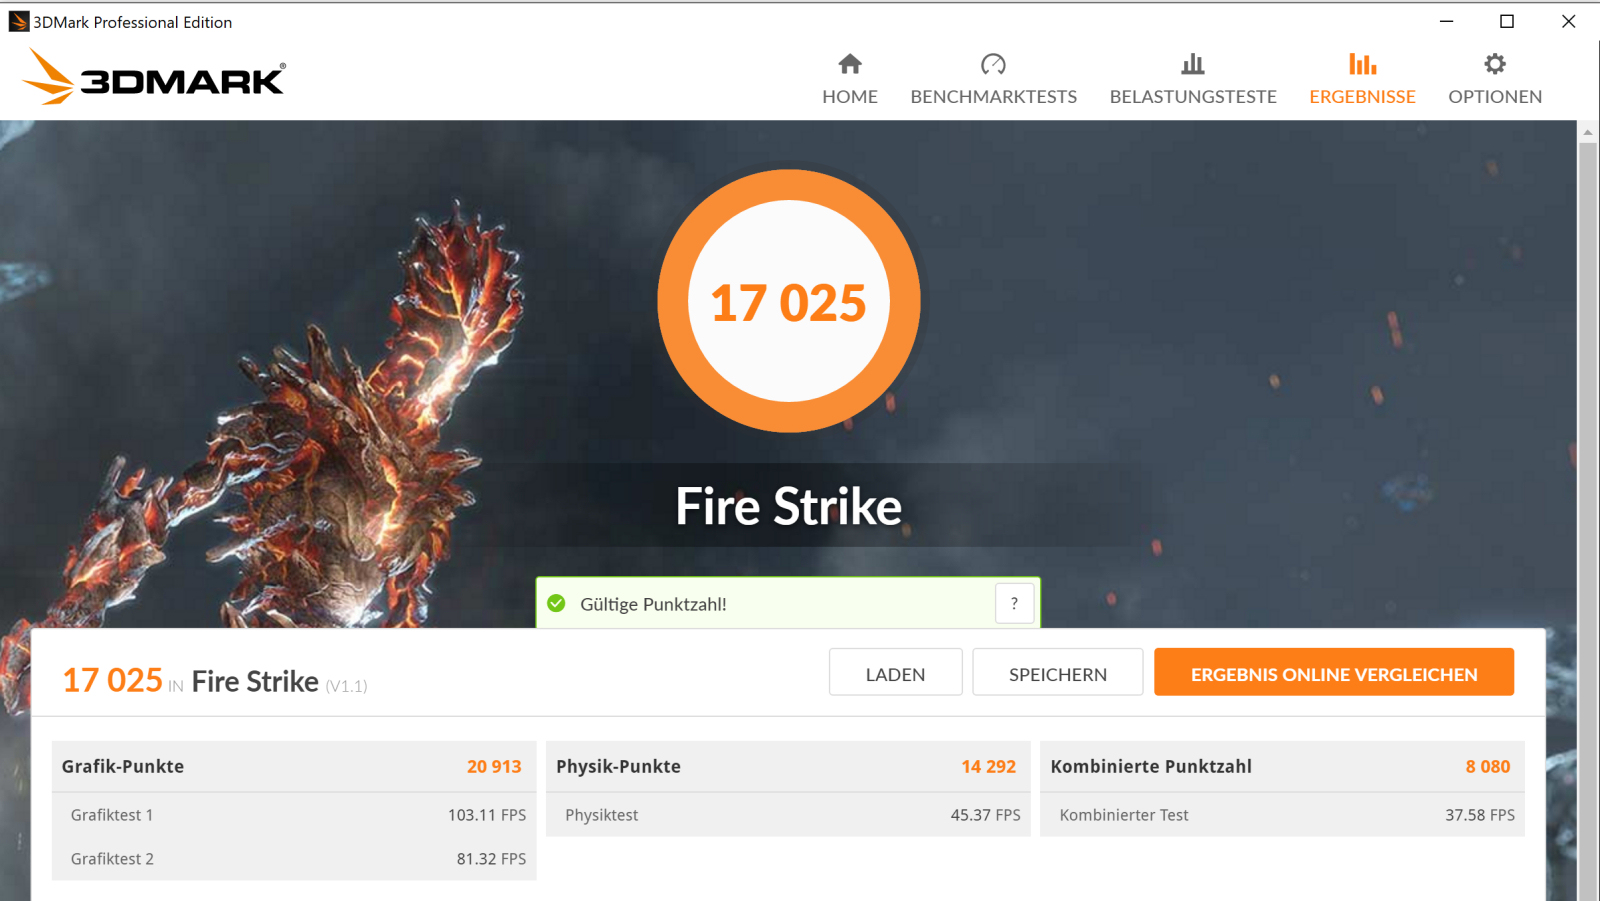
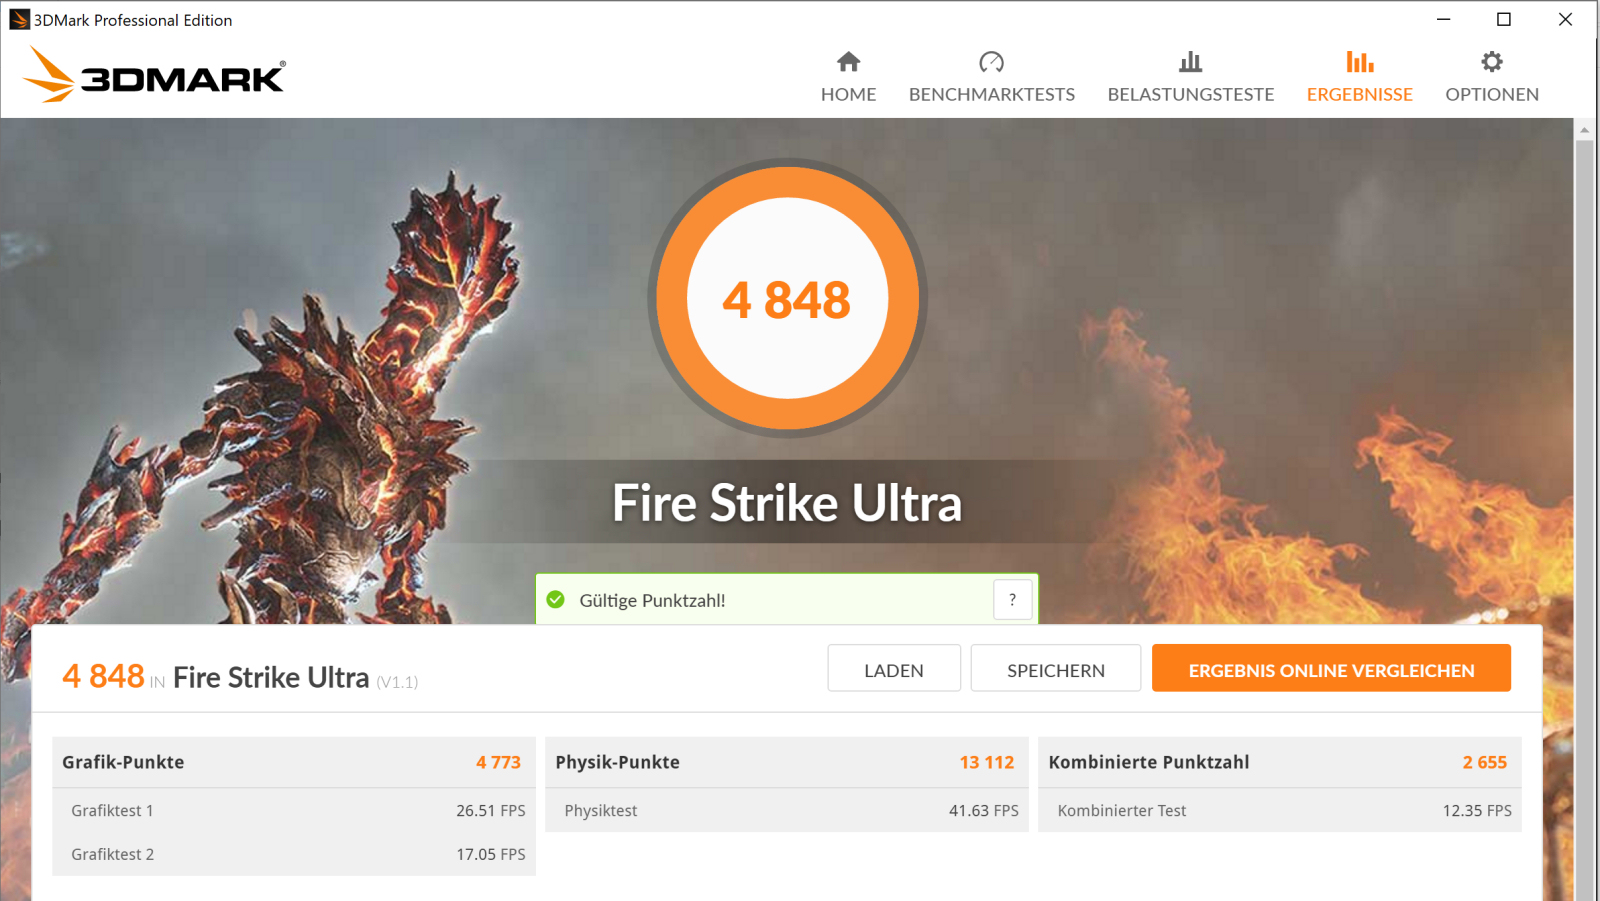
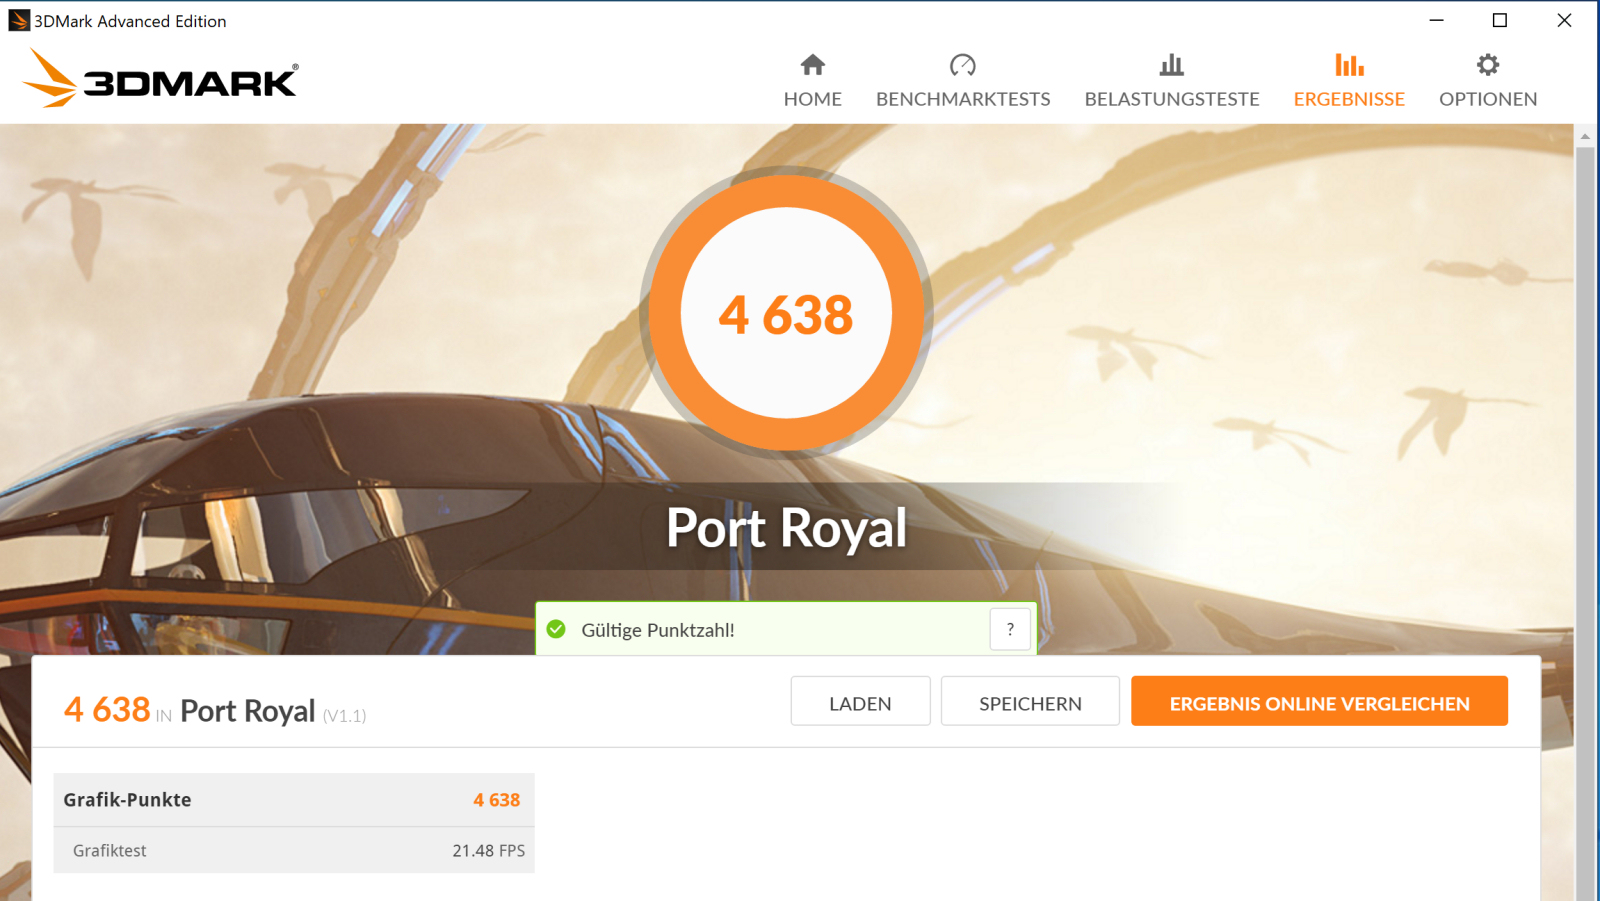
Prestazioni GPU
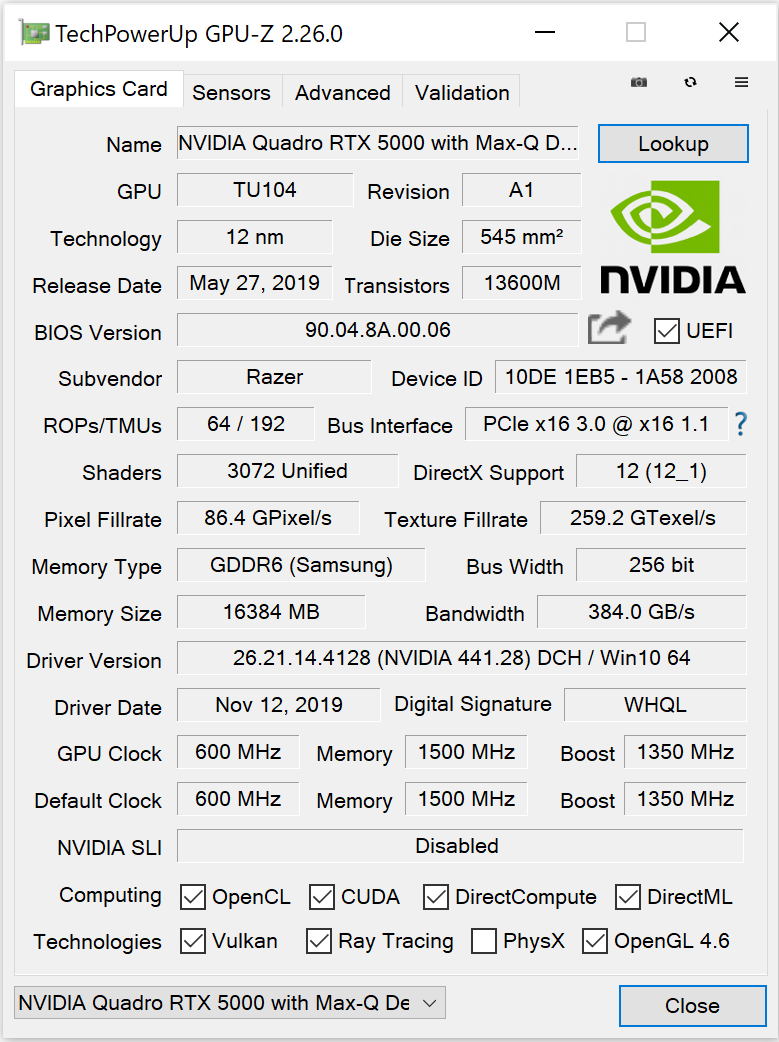
Il Blade è dotato di una GPU Quadro RTX 5000 Max-Q di Nvidia. Questa versione della normale RTX 5000 è stata ottimizzata per l'efficienza, il che la rende particolarmente adatta per computer portatili sottili e leggeri. La GPU è basata sull'architettura Turing ed è la controparte professionale della GPU GeForce RTX 2080 Max-Q. Ha accesso alla veloce memoria GDDR6 (16.384 GB).
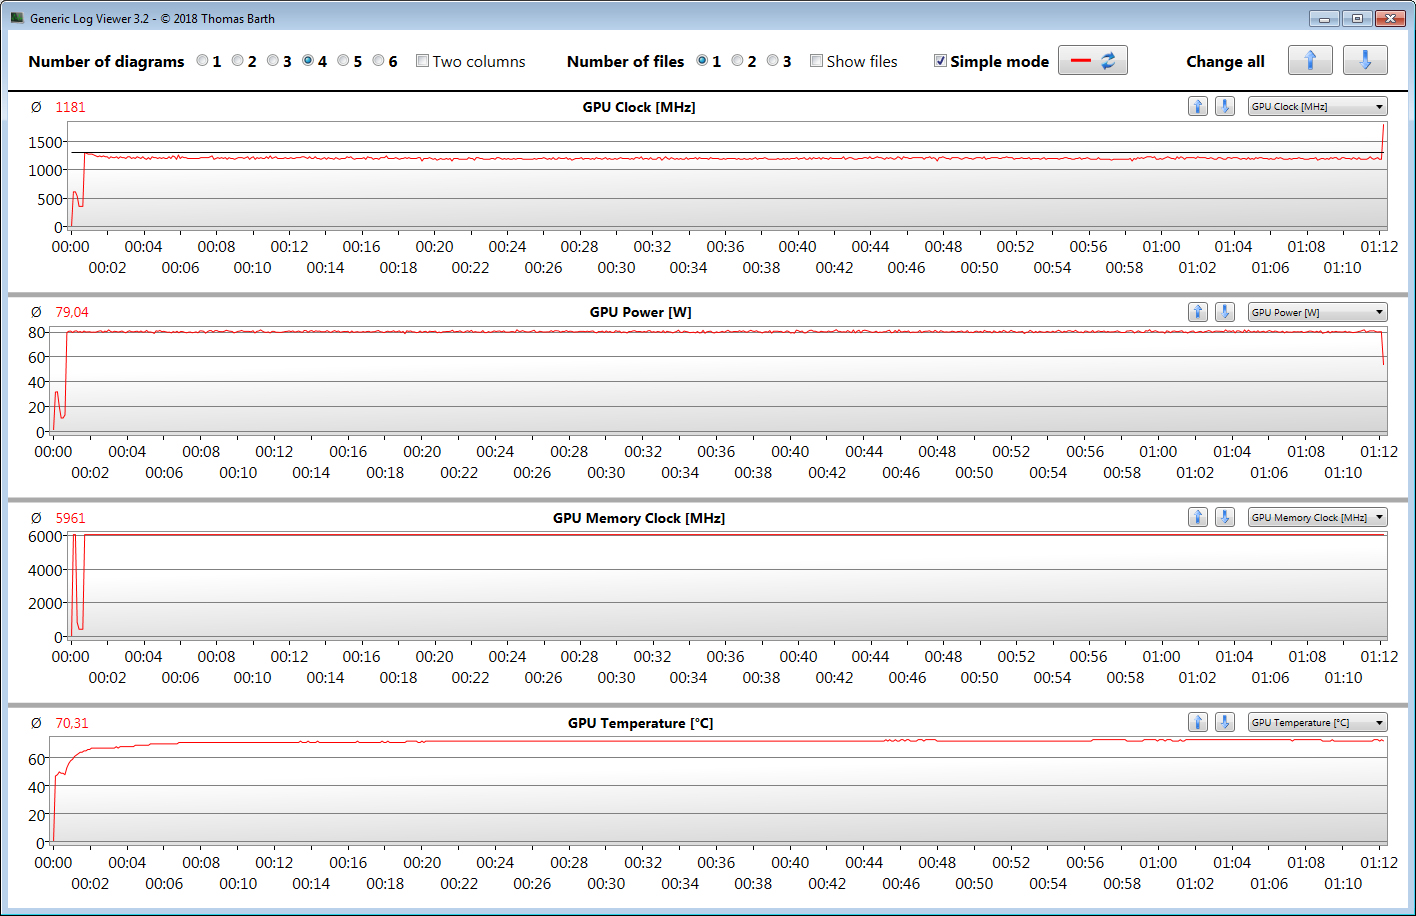
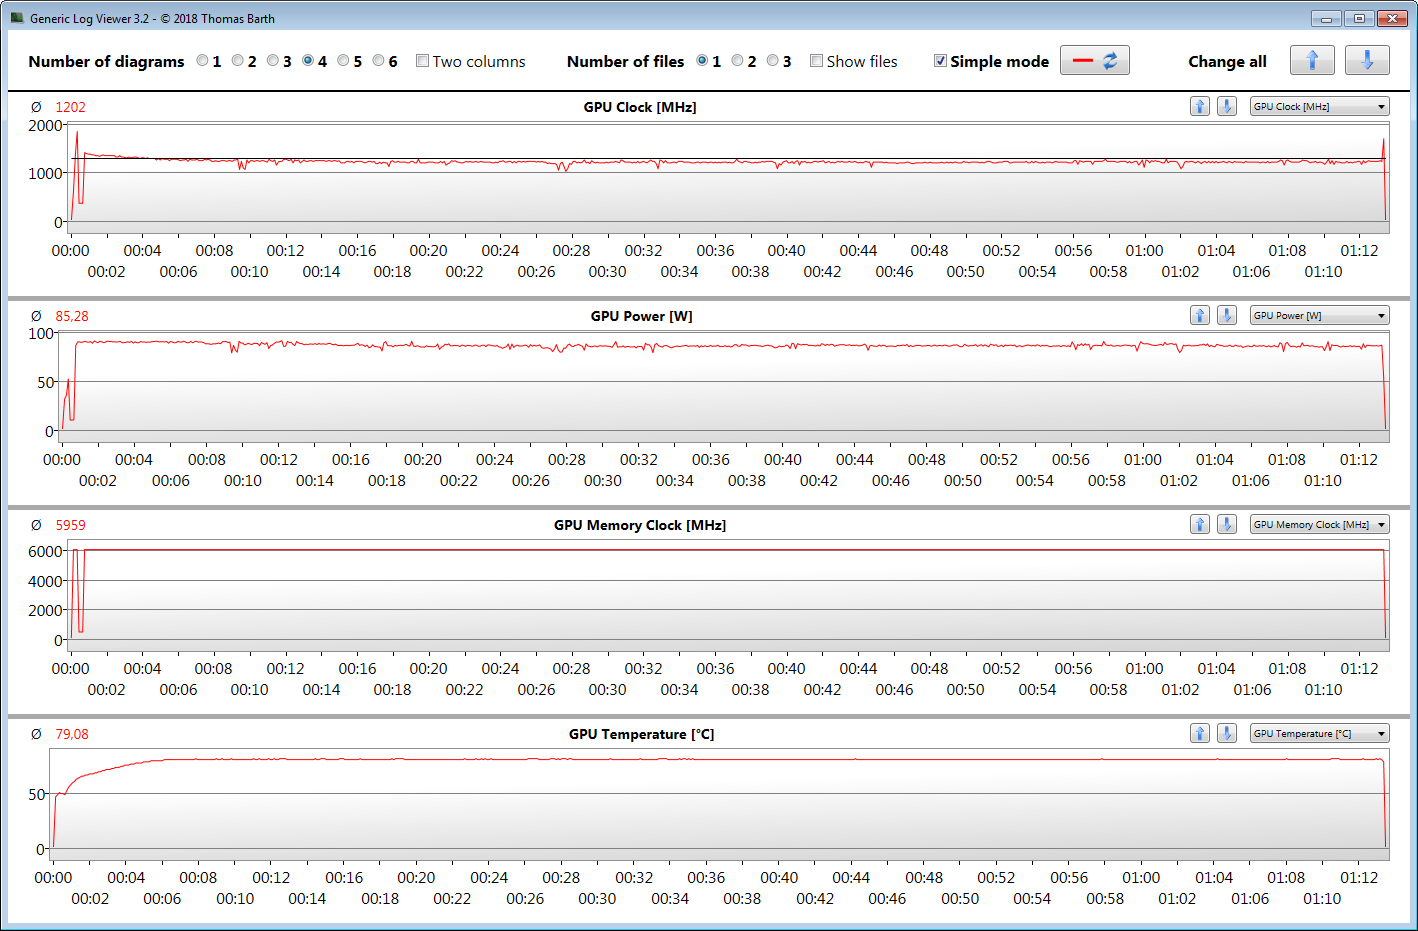
L'RTX 5000 Max-Q ha un clock di base di 600 MHz. Questa frequenza di clock può essere aumentata fino a 1.350 MHz tramite Turbo Boost. Anche se la GPU rimane al di sotto di una soglia di temperatura o di energia predefinita, sono possibili anche frequenze più elevate. Abbiamo misurato una velocità massima di clock di 1.815 MHz. La GPU funziona con una velocità media di clock di 1.180 MHz durante il nostro test The Witcher 3.
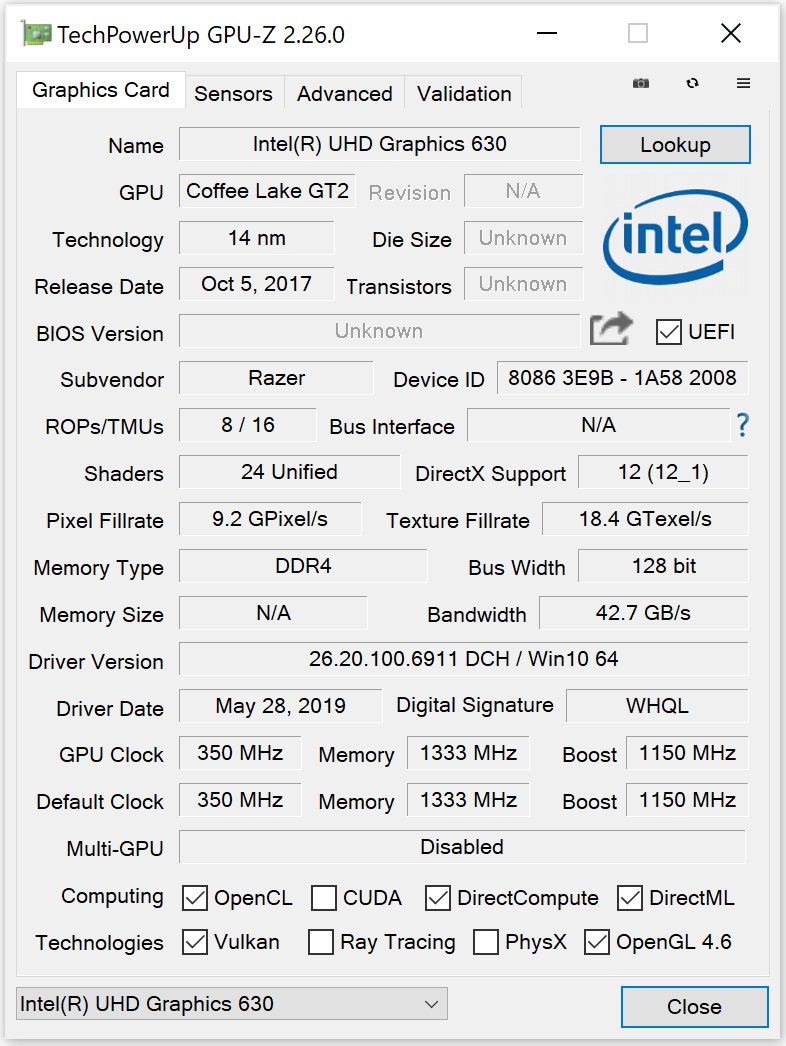
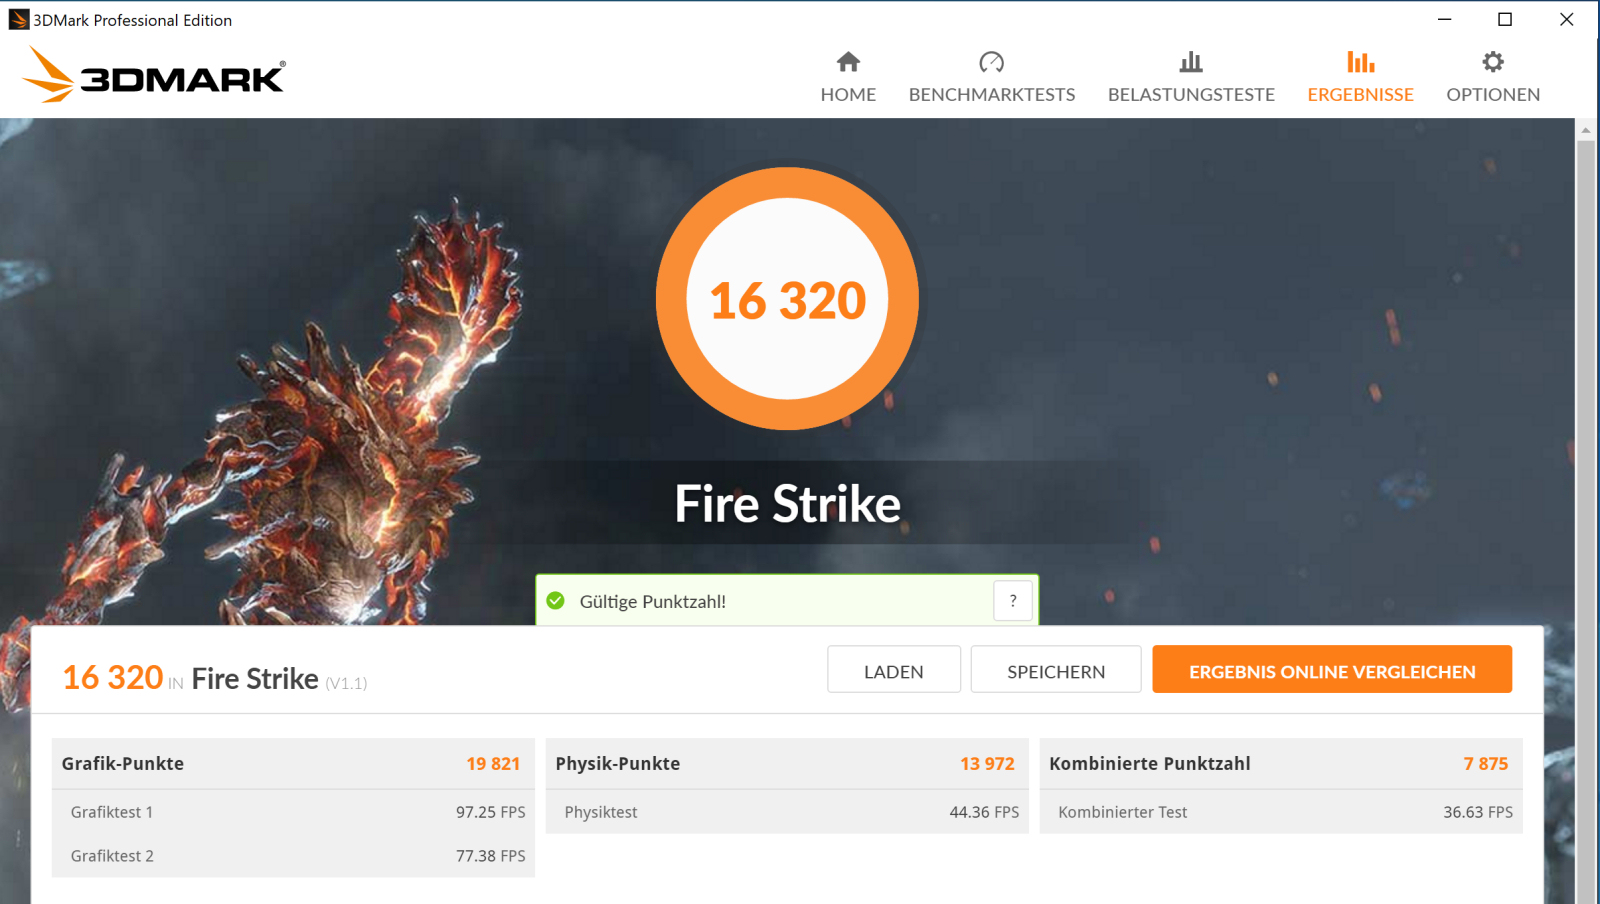
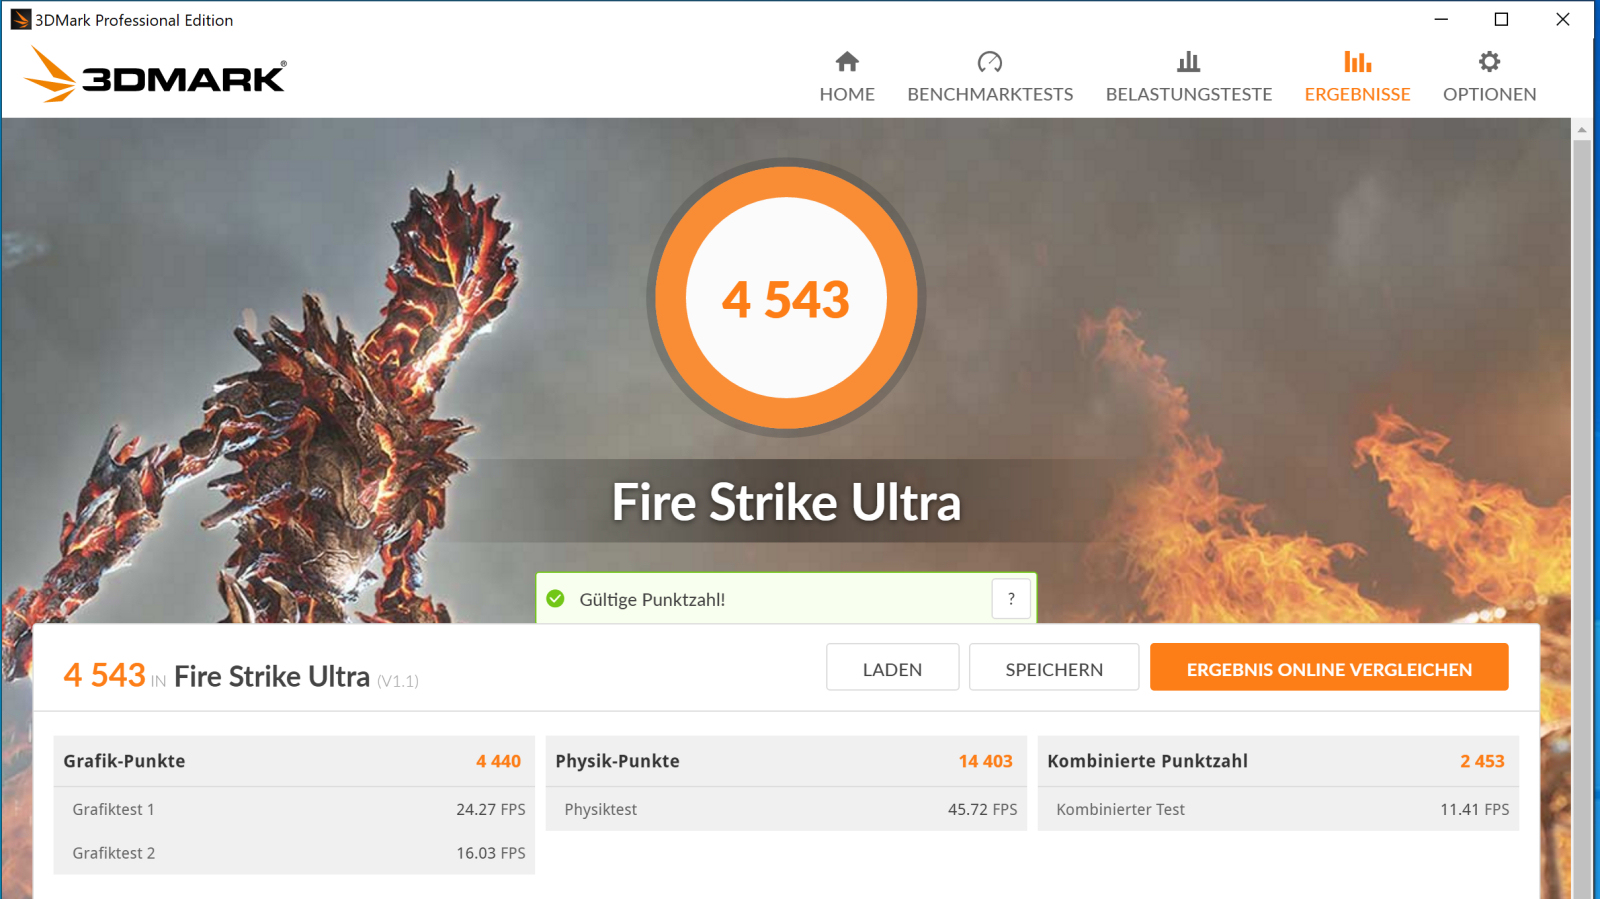
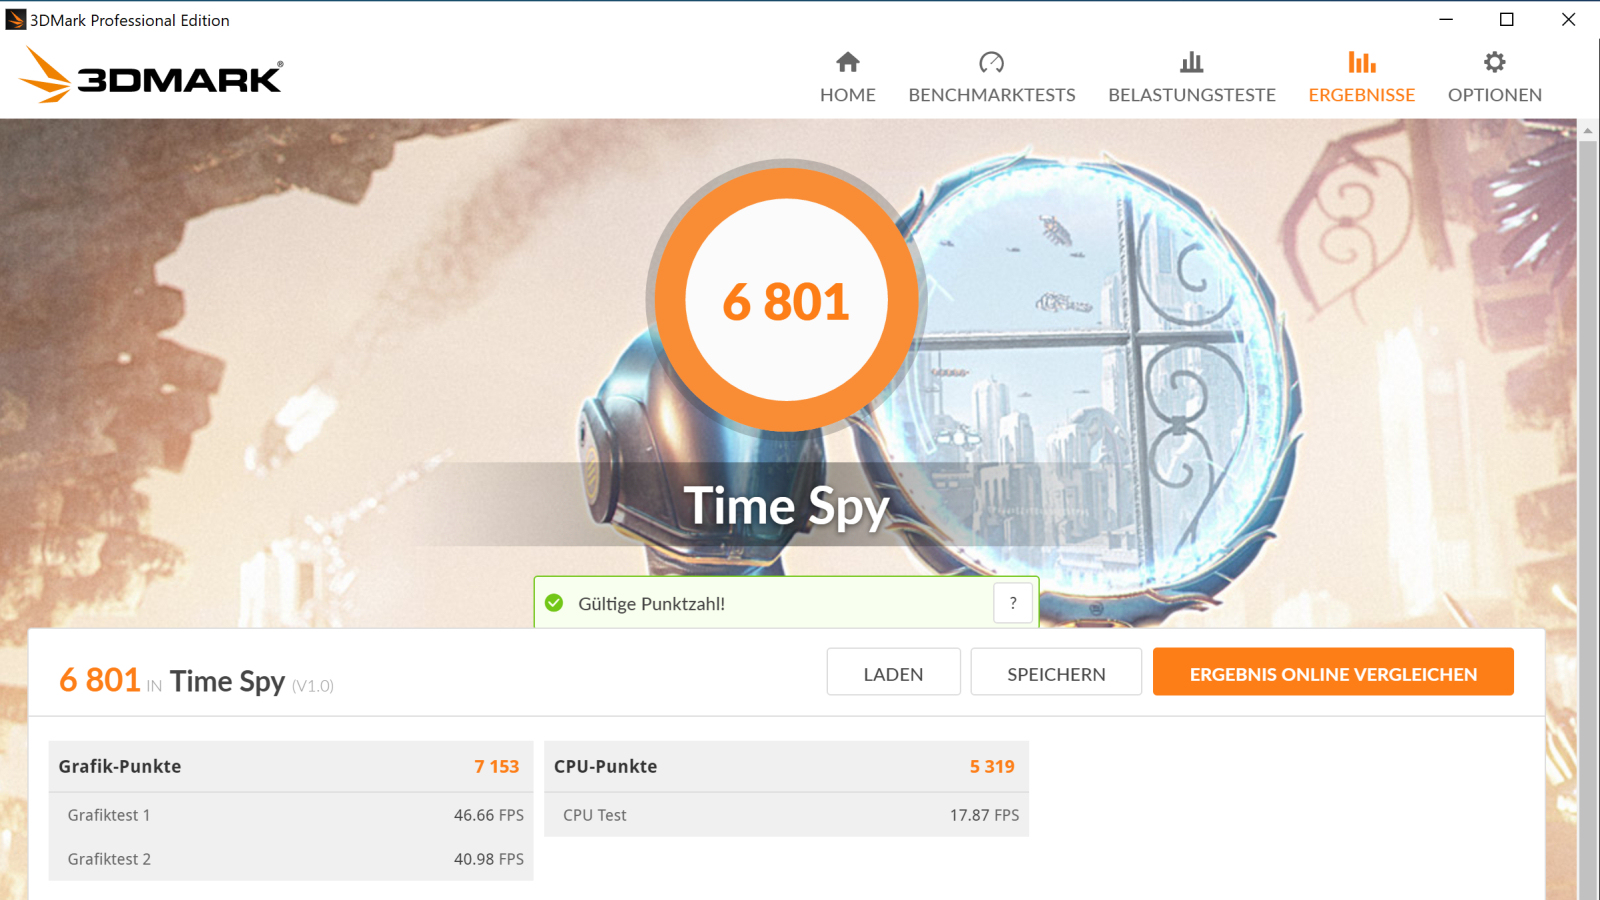
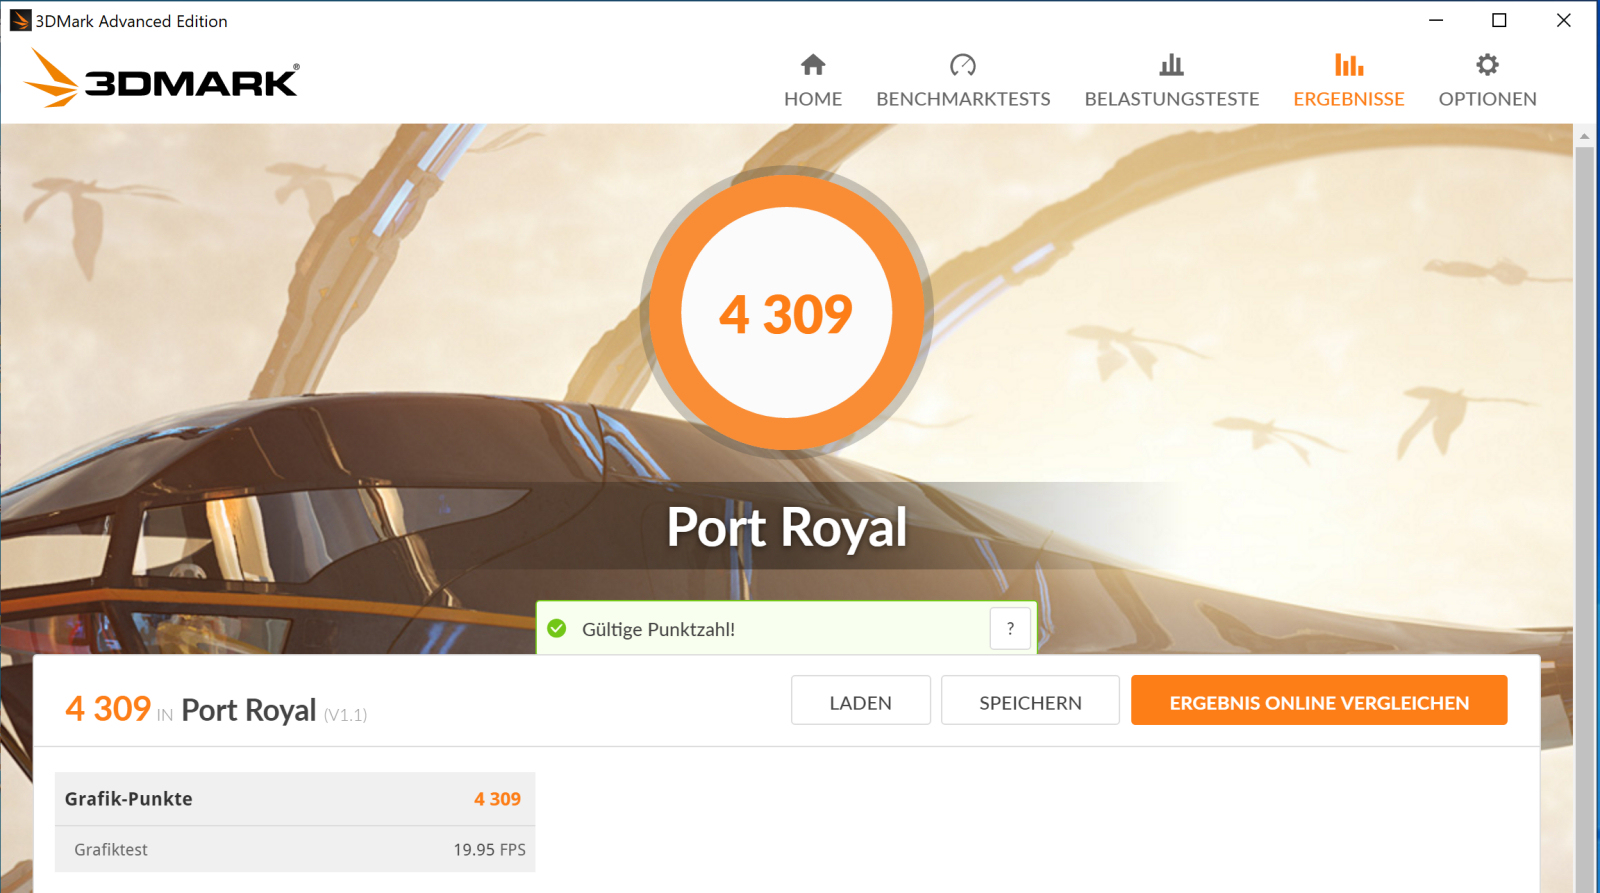
I risultati di 3DMark corrispondono alle nostre aspettative. La GPU UHD Graphics 630 integrata nel processore è attiva e il laptop utilizza la tecnologia di switching grafico di Nvidia, Optimus.
Ci sono tre varianti della RTX 5000 Max-Q GPU con TGP di 80, 85 e 90 watt. Il nostro dispositivo di prova è equipaggiato con il modello da 80 watt. Se all'interno del software Razer Synapse vengono selezionate le massime prestazioni della GPU, il TGP viene aumentato a 85 watt. Come risultato, le prestazioni sono leggermente aumentate e i punteggi di riferimento sono leggermente migliorati. Il nostro test The Witcher 3 qui sotto lo dimostra.

| 3DMark Vantage P Result | 52289 punti | |
| 3DMark 11 Performance | 19787 punti | |
| 3DMark Ice Storm Standard Score | 66054 punti | |
| 3DMark Cloud Gate Standard Score | 25769 punti | |
| 3DMark Fire Strike Score | 16320 punti | |
| 3DMark Time Spy Score | 6801 punti | |
Aiuto | ||
Prestazioni Gaming
Questo portatile Razer è in grado di riprodurre tutti i giochi del nostro database senza problemi. Di solito, le impostazioni di alta qualità possono essere scelte con risoluzione Full HD. La GPU può anche gestire risoluzioni superiori a Full HD. Tuttavia, potrebbe essere necessario ridurre le impostazioni di qualità, in particolare a 4K.
| The Witcher 3 - 1920x1080 Ultra Graphics & Postprocessing (HBAO+) | |
| Media della classe Workstation (n=1ultimi 2 anni) | |
| Razer Blade 15 Studio Edition (Max. CPU, max. GPU) | |
| Razer Blade 15 Studio Edition | |
| Media NVIDIA Quadro RTX 5000 Max-Q (71 - 88.5, n=10) | |
| MSI P65 Creator 9SF-657 | |
| Razer Blade 15 RTX 2080 Max-Q | |
| Lenovo ThinkPad P53-20QN000YGE | |
| Dell Precision 5540 | |
| Fujitsu Celsius H780 | |
| HP ZBook Studio G5-4QH10EA | |
| BioShock Infinite - 1920x1080 Ultra Preset, DX11 (DDOF) | |
| Razer Blade 15 RTX 2080 Max-Q | |
| Media NVIDIA Quadro RTX 5000 Max-Q (167.2 - 174.3, n=3) | |
| Razer Blade 15 Studio Edition | |
| MSI P65 Creator 9SF-657 | |
| Dell Precision 5540 | |
| HP ZBook Studio G5-4QH10EA | |
| Dirt Rally 2.0 - 1920x1080 Ultra Preset AA:T AF:16x | |
| Razer Blade 15 Studio Edition | |
| Media NVIDIA Quadro RTX 5000 Max-Q (89.3 - 90.7, n=2) | |
| Lenovo ThinkPad P53-20QN000YGE | |
| Total War: Three Kingdoms - 1920x1080 Ultra (incl textures) | |
| Razer Blade 15 Studio Edition | |
| Media NVIDIA Quadro RTX 5000 Max-Q (57.5 - 64.9, n=2) | |
| The Division 2 - 1920x1080 Ultra Preset | |
| Razer Blade 15 Studio Edition | |
| Media NVIDIA Quadro RTX 5000 Max-Q (n=1) | |
| Anno 1800 - 1920x1080 Ultra Graphics Quality (DX11) | |
| Lenovo ThinkPad P53-20QN000YGE | |
| Media NVIDIA Quadro RTX 5000 Max-Q (37.4 - 38.9, n=2) | |
| Razer Blade 15 Studio Edition | |
Per verificare se il frame rate rimane costante per un periodo di tempo prolungato, abbiamo utilizzato The Witcher 3 per circa 60 minuti con impostazioni grafiche Full HD e massime. Il personaggio ritratto dal giocatore non è stato spostato per tutta la durata del test. Anche se i frame rate variavano leggermente, sono rimasti costantemente ad un livello giocabile.
| basso | medio | alto | ultra | QHD | 4K | |
|---|---|---|---|---|---|---|
| BioShock Infinite (2013) | 320.5 | 283.2 | 265 | 167.2 | ||
| GTA V (2015) | 169.1 | 163.4 | 132.3 | 72 | 89.1 | |
| The Witcher 3 (2015) | 286.9 | 229.5 | 144.8 | 83.3 | 49.2 | |
| Rainbow Six Siege (2015) | 254.8 | 226.7 | 191.8 | 183.4 | 86.9 | |
| Ashes of the Singularity (2016) | 84.4 | 77.7 | 75.4 | 42.3 | ||
| For Honor (2017) | 246.1 | 162.1 | 156 | 123.2 | 48.1 | |
| Ghost Recon Wildlands (2017) | 130.4 | 91.9 | 85.7 | 58.7 | 38.6 | |
| Middle-earth: Shadow of War (2017) | 113 | 108 | 98 | 86 | 38 | |
| Final Fantasy XV Benchmark (2018) | 87 | 82.3 | 65.8 | 30.6 | ||
| X-Plane 11.11 (2018) | 96.3 | 84.9 | 72.2 | 56.6 | ||
| World of Tanks enCore (2018) | 595 | 367.5 | 175.5 | 109.6 | 52.3 | |
| Assassin´s Creed Odyssey (2018) | 95 | 80 | 75 | 54 | 47 | 30 |
| Battlefield V (2018) | 139.4 | 130.8 | 120.4 | 112.1 | 91.6 | 53.5 |
| Apex Legends (2019) | 144 | 144 | 144 | 142.8 | 104.9 | 53.4 |
| Far Cry New Dawn (2019) | 104 | 90 | 88 | 81 | 74 | 43 |
| Metro Exodus (2019) | 115.2 | 87.8 | 66.9 | 55.4 | 25.4 | 25.2 |
| Dirt Rally 2.0 (2019) | 241.2 | 169.4 | 153 | 90.7 | 70.2 | 39.8 |
| The Division 2 (2019) | 144 | 112 | 97 | 56 | 51 | 27 |
| Anno 1800 (2019) | 95.8 | 90.9 | 69.3 | 37.4 | 34.7 | 21.2 |
| Rage 2 (2019) | 224 | 114.8 | 96.4 | 94.3 | 59.4 | 28.7 |
| Total War: Three Kingdoms (2019) | 218.6 | 120.2 | 87.3 | 64.9 | 43.5 | 21.5 |
| F1 2019 (2019) | 192 | 165 | 131 | 118 | 86 | 56 |
| Control (2019) | 223.5 | 93.2 | 66.5 | 42.7 | 19.1 | |
| Borderlands 3 (2019) | 118.8 | 99.9 | 78.4 | 62.5 | 42.9 | 22.8 |
| Ghost Recon Breakpoint (2019) | 117 | 96 | 92 | 68 | 49 | 28 |
| GRID 2019 (2019) | 131.5 | 107.8 | 96.2 | 87.2 | 62.7 | 38.6 |
| Call of Duty Modern Warfare 2019 (2019) | 185.2 | 130.6 | 103.6 | 91.8 | 65.2 | 35.2 |
| Need for Speed Heat (2019) | 92.3 | 84.4 | 77.5 | 72.1 | 65.4 | 36.9 |
| Star Wars Jedi Fallen Order (2019) | 88.5 | 83.1 | 80.4 | 64 | 33.5 |
Emissioni - Il Razer 15 Studio ha rumorosità e temperature moderate
Rumorosità
Nonostante il potente hardware all'interno, i livelli di rumore del Blade possono essere descritti come moderati. Durante il periodo di inattività, le ventole spesso si fermano e il sistema non fa alcun rumore. Nelle applicazioni meno impegnative, le ventole rimangono per lo più passive. Al contrario, sono più presenti quando il sistema è sotto carico medio e pesante. Durante la prova da sforzo, ad esempio, si registra un livello di pressione sonora di 41 dB(A). Nel benchmark 3DMark06, il livello di rumore medio è di 43 dB(A).
Rumorosità
| Idle |
| 30.6 / 30.6 / 30.6 dB(A) |
| Sotto carico |
| 43 / 41 dB(A) |
 | ||
30 dB silenzioso 40 dB(A) udibile 50 dB(A) rumoroso |
||
min: | ||
| Razer Blade 15 Studio Edition i7-9750H, Quadro RTX 5000 Max-Q | Razer Blade 15 RTX 2080 Max-Q i7-9750H, GeForce RTX 2080 Max-Q | Lenovo ThinkPad P53-20QN000YGE i7-9850H, Quadro RTX 5000 Max-Q | MSI P65 Creator 9SF-657 i9-9880H, GeForce RTX 2070 Max-Q | Dell Precision 5540 i9-9980HK, Quadro T2000 Max-Q | Fujitsu Celsius H780 i7-8850H, Quadro P2000 | HP ZBook Studio G5-4QH10EA i7-8750H, Quadro P1000 | Media NVIDIA Quadro RTX 5000 Max-Q | Media della classe Workstation | |
|---|---|---|---|---|---|---|---|---|---|
| Noise | 6% | 12% | -4% | 10% | -6% | 5% | 3% | 9% | |
| off /ambiente * (dB) | 30.6 | 28.3 8% | 28.3 8% | 30.2 1% | 28.6 7% | 29.6 3% | 28.6 7% | 27.5 ? 10% | 24.1 ? 21% |
| Idle Minimum * (dB) | 30.6 | 28.8 6% | 28.3 8% | 32.8 -7% | 28.6 7% | 29.6 3% | 28.6 7% | 28.7 ? 6% | 24.9 ? 19% |
| Idle Average * (dB) | 30.6 | 28.8 6% | 28.3 8% | 32.8 -7% | 28.6 7% | 32.2 -5% | 28.6 7% | 28.7 ? 6% | 25.6 ? 16% |
| Idle Maximum * (dB) | 30.6 | 29 5% | 28.3 8% | 33.6 -10% | 28.6 7% | 37 -21% | 30 2% | 28.7 ? 6% | 26.6 ? 13% |
| Load Average * (dB) | 43 | 33.5 22% | 29.8 31% | 40.9 5% | 33.3 23% | 40.3 6% | 38.1 11% | 41 ? 5% | 39 ? 9% |
| Load Maximum * (dB) | 41 | 45.2 -10% | 38.3 7% | 42.7 -4% | 38 7% | 49.4 -20% | 42.5 -4% | 46.7 ? -14% | 50.9 ? -24% |
| Witcher 3 ultra * (dB) | 45 | 38.3 | 34.7 | 35 |
* ... Meglio usare valori piccoli
Temperature
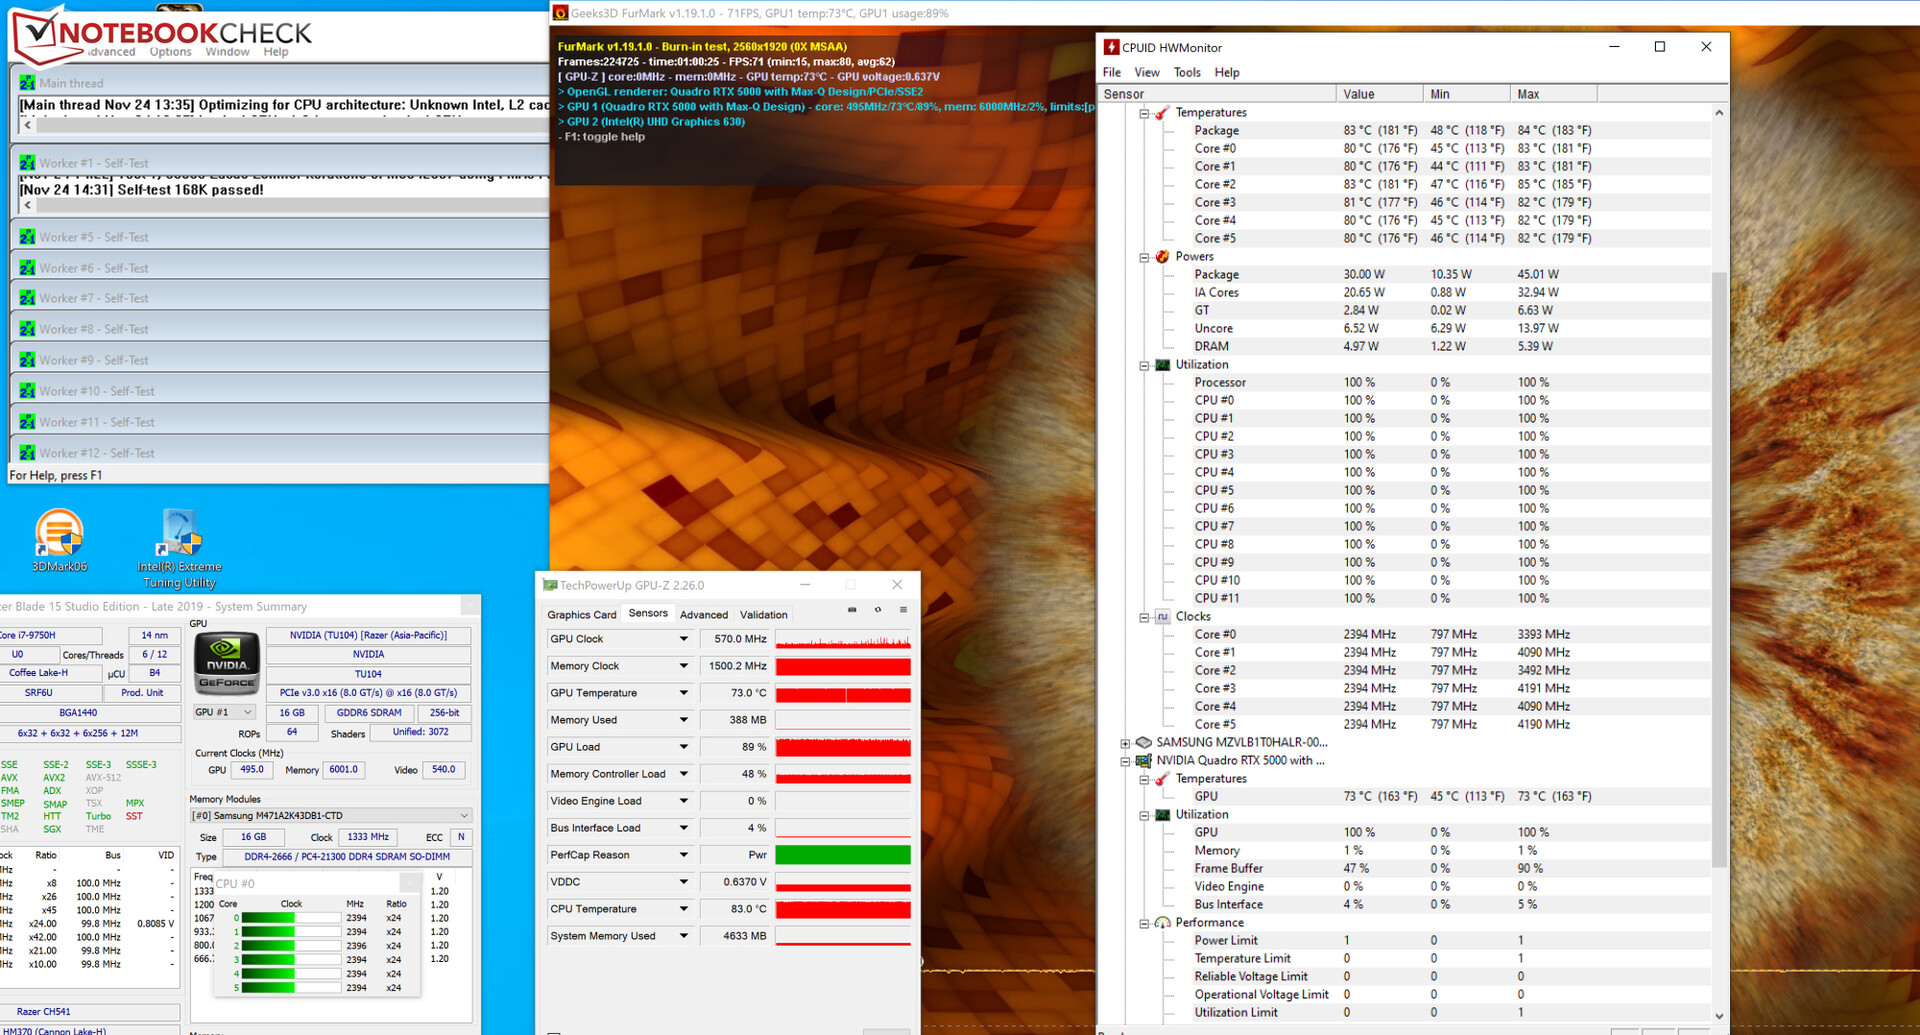
I risultati del nostro stress test (Prime95 e FurMark per almeno un'ora) variano a seconda che la workstation sia collegata ad una presa di corrente o in modalità batteria. La velocità di clock iniziale del processore da 2,5 a 2,6 GHz scende infine a 2,4 GHz, dove si stabilizza. Per la maggior parte del tempo, il chip grafico funziona a 500-600 MHz. In modalità batteria, il clock della CPU funziona solitamente a 800 MHz con un singolo core che occasionalmente raggiunge 1,9 GHz. La GPU funziona a velocità di circa 1.100 MHz. Lo stress test rappresenta uno scenario estremo che non si verifica durante l'uso quotidiano. Utilizziamo questo test per determinare se il sistema rimane stabile al 100% del carico CPU/GPU.
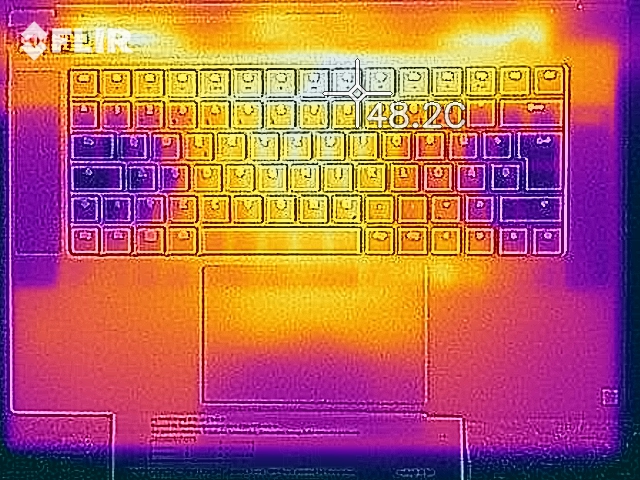
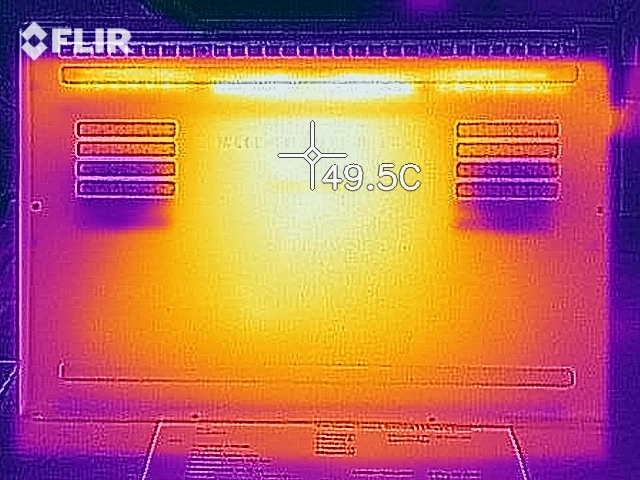
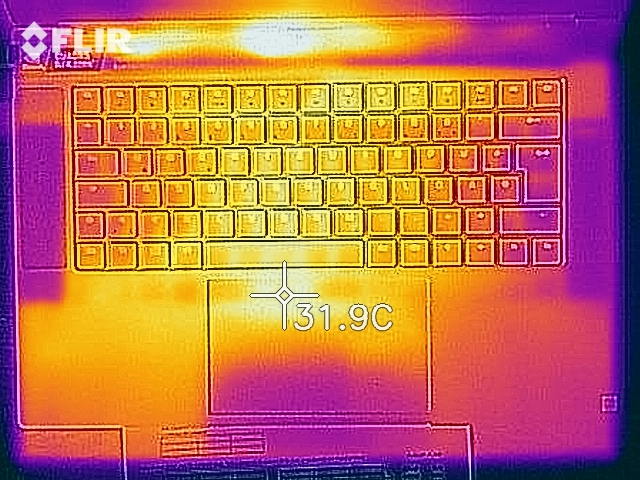
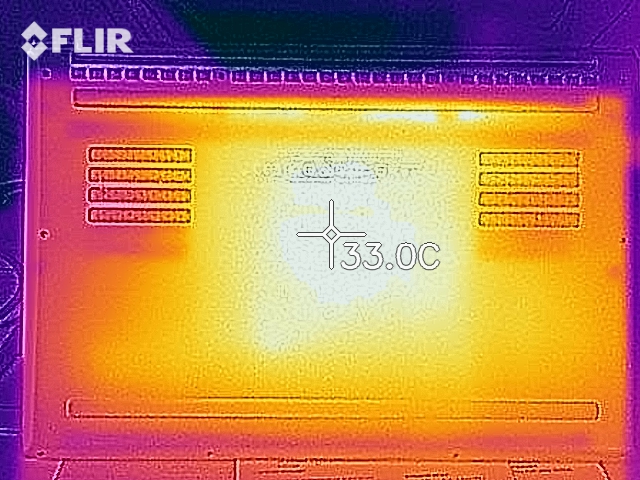
Per la maggior parte, lo sviluppo di calore rimane ragionevole. Durante la prova da sforzo, abbiamo registrato temperature massime nel limite di 45 °C (113 °F). Temperature superiori a 50 °C (122 °F) non sarebbero irragionevoli considerando l'hardware all'interno del computer portatile. Le temperature durante l'uso quotidiano sono anch'esse entro limiti ragionevoli.
(-) La temperatura massima sul lato superiore è di 46.1 °C / 115 F, rispetto alla media di 38.2 °C / 101 F, che varia da 22.2 a 69.8 °C per questa classe Workstation.
(-) Il lato inferiore si riscalda fino ad un massimo di 45.2 °C / 113 F, rispetto alla media di 41.1 °C / 106 F
(+) In idle, la temperatura media del lato superiore è di 27.9 °C / 82 F, rispetto alla media deld ispositivo di 32 °C / 90 F.
(+) I poggiapolsi e il touchpad raggiungono la temperatura massima della pelle (35.7 °C / 96.3 F) e quindi non sono caldi.
(-) La temperatura media della zona del palmo della mano di dispositivi simili e'stata di 27.8 °C / 82 F (-7.9 °C / -14.3 F).
| Razer Blade 15 Studio Edition i7-9750H, Quadro RTX 5000 Max-Q | Razer Blade 15 RTX 2080 Max-Q i7-9750H, GeForce RTX 2080 Max-Q | Lenovo ThinkPad P53-20QN000YGE i7-9850H, Quadro RTX 5000 Max-Q | MSI P65 Creator 9SF-657 i9-9880H, GeForce RTX 2070 Max-Q | Dell Precision 5540 i9-9980HK, Quadro T2000 Max-Q | Fujitsu Celsius H780 i7-8850H, Quadro P2000 | HP ZBook Studio G5-4QH10EA i7-8750H, Quadro P1000 | Media NVIDIA Quadro RTX 5000 Max-Q | Media della classe Workstation | |
|---|---|---|---|---|---|---|---|---|---|
| Heat | -4% | 13% | -10% | 3% | 8% | 12% | -7% | -1% | |
| Maximum Upper Side * (°C) | 46.1 | 47 -2% | 41.8 9% | 49.7 -8% | 46.2 -0% | 43.7 5% | 42.3 8% | 49.4 ? -7% | 44 ? 5% |
| Maximum Bottom * (°C) | 45.2 | 49.2 -9% | 46.1 -2% | 60.4 -34% | 45.7 -1% | 45.3 -0% | 43.1 5% | 53 ? -17% | 44.8 ? 1% |
| Idle Upper Side * (°C) | 28.9 | 28.6 1% | 22.2 23% | 28.4 2% | 27.4 5% | 25.2 13% | 24.2 16% | 28.6 ? 1% | 30.3 ? -5% |
| Idle Bottom * (°C) | 29.6 | 31.4 -6% | 23 22% | 29.2 1% | 27.8 6% | 25.9 13% | 24.7 17% | 30.5 ? -3% | 31.3 ? -6% |
* ... Meglio usare valori piccoli
Altoparlanti
Gli altoparlanti stereo si trovano ai lati della tastiera. Pur emettendo un suono più che accettabile e voluminoso, non hanno i bassi. Inoltre, il livello massimo di volume potrebbe essere più alto. Per una migliore esperienza audio, gli utenti dovranno affidarsi a cuffie o altoparlanti esterni.
Razer Blade 15 Studio Edition analisi audio
(-) | altoparlanti non molto potenti (67.5 dB)
Bassi 100 - 315 Hz
(-) | quasi nessun basso - in media 16.4% inferiori alla media
(±) | la linearità dei bassi è media (12.1% delta rispetto alla precedente frequenza)
Medi 400 - 2000 Hz
(±) | medi elevati - circa 5.9% superiore alla media
(+) | medi lineari (6.9% delta rispetto alla precedente frequenza)
Alti 2 - 16 kHz
(+) | Alti bilanciati - appena 1.9% dalla media
(+) | alti lineari (5.6% delta rispetto alla precedente frequenza)
Nel complesso 100 - 16.000 Hz
(±) | la linearità complessiva del suono è media (22.3% di differenza rispetto alla media
Rispetto alla stessa classe
» 82% di tutti i dispositivi testati in questa classe è stato migliore, 2% simile, 16% peggiore
» Il migliore ha avuto un delta di 7%, medio di 17%, peggiore di 35%
Rispetto a tutti i dispositivi testati
» 65% di tutti i dispositivi testati in questa classe è stato migliore, 6% similare, 29% peggiore
» Il migliore ha avuto un delta di 4%, medio di 23%, peggiore di 134%
Lenovo ThinkPad P53-20QN000YGE analisi audio
(±) | potenza degli altiparlanti media ma buona (72.8 dB)
Bassi 100 - 315 Hz
(±) | bassi ridotti - in media 11.6% inferiori alla media
(±) | la linearità dei bassi è media (13.6% delta rispetto alla precedente frequenza)
Medi 400 - 2000 Hz
(±) | medi elevati - circa 7.8% superiore alla media
(±) | linearità dei medi adeguata (7.5% delta rispetto alla precedente frequenza)
Alti 2 - 16 kHz
(+) | Alti bilanciati - appena 1.9% dalla media
(+) | alti lineari (4.8% delta rispetto alla precedente frequenza)
Nel complesso 100 - 16.000 Hz
(±) | la linearità complessiva del suono è media (23.1% di differenza rispetto alla media
Rispetto alla stessa classe
» 83% di tutti i dispositivi testati in questa classe è stato migliore, 3% simile, 14% peggiore
» Il migliore ha avuto un delta di 7%, medio di 17%, peggiore di 35%
Rispetto a tutti i dispositivi testati
» 69% di tutti i dispositivi testati in questa classe è stato migliore, 5% similare, 26% peggiore
» Il migliore ha avuto un delta di 4%, medio di 23%, peggiore di 134%
Gestione Energetica - Portatile Razer con buona autonomia
Consumo Energetico
Il consumo energetico del sistema Razer non è fuori dal comune. Durante il periodo di inattività abbiamo registrato un consumo massimo di 17,4 watt. Nel nostro stress test, questo valore è aumentato fino ad un massimo di 148 watt. Questo è dovuto al fatto che sia la CPU che la GPU funzionano a velocità relativamente basse durante il test. L'alimentatore ha una potenza nominale di 230 watt.
| Off / Standby | |
| Idle | |
| Sotto carico |
|
Leggenda:
min: | |
| Razer Blade 15 Studio Edition i7-9750H, Quadro RTX 5000 Max-Q | Razer Blade 15 RTX 2080 Max-Q i7-9750H, GeForce RTX 2080 Max-Q | Lenovo ThinkPad P53-20QN000YGE i7-9850H, Quadro RTX 5000 Max-Q | MSI P65 Creator 9SF-657 i9-9880H, GeForce RTX 2070 Max-Q | Dell Precision 5540 i9-9980HK, Quadro T2000 Max-Q | Fujitsu Celsius H780 i7-8850H, Quadro P2000 | HP ZBook Studio G5-4QH10EA i7-8750H, Quadro P1000 | Media NVIDIA Quadro RTX 5000 Max-Q | Media della classe Workstation | |
|---|---|---|---|---|---|---|---|---|---|
| Power Consumption | -10% | 8% | -10% | 20% | 13% | 25% | -12% | 4% | |
| Idle Minimum * (Watt) | 13.2 | 12.5 5% | 7.9 40% | 9.4 29% | 7.4 44% | 9.1 31% | 6.8 48% | 10.4 ? 21% | 9.13 ? 31% |
| Idle Average * (Watt) | 15 | 15.3 -2% | 11.8 21% | 17.4 -16% | 12.1 19% | 13.2 12% | 11.3 25% | 16.1 ? -7% | 13.8 ? 8% |
| Idle Maximum * (Watt) | 17.4 | 20.7 -19% | 14.9 14% | 19.6 -13% | 12.7 27% | 14.04 19% | 14.3 18% | 23.8 ? -37% | 18 ? -3% |
| Load Average * (Watt) | 99 | 90.2 9% | 96 3% | 103 -4% | 98 1% | 78.8 20% | 78 21% | 109.5 ? -11% | 94.5 ? 5% |
| Load Maximum * (Watt) | 148 | 209.3 -41% | 207.8 -40% | 216 -46% | 135.1 9% | 172.5 -17% | 126 15% | 189.5 ? -28% | 177.8 ? -20% |
| Witcher 3 ultra * (Watt) | 162 | 149 | 89.9 | 64 |
* ... Meglio usare valori piccoli
Autonomia della batteria
Nel nostro test Wi-Fi, che mira a rispecchiare le condizioni del mondo reale, questo laptop resiste 5:31 h. Nel test di cui sopra, simuliamo un carico di navigazione web con l'aiuto di uno script. Qui abbiamo selezionato il profilo "Balanced" e ridotto la luminosità del display a circa 150 cd/m². Nel nostro test video, questo dispositivo da 15,6 pollici si spegne dopo 7:38 h. Consiste nel riprodurre il cortometraggio Big Buck Bunny (codifica H.264, 1920x1080 pixel) in loop. Per questo test abbiamo selezionato il profilo "Energy Saver", abbiamo disattivato il modulo wireless e ridotto la luminosità a 150 cd/m².
Nel complesso, i tempi di autonomia di questa workstation sono più che solidi. Non sorprende che non siano così alti come sul Blade 15 Advanced Model, poiché quest'ultimo è equipaggiato solo con un display Full HD.
| Razer Blade 15 Studio Edition i7-9750H, Quadro RTX 5000 Max-Q, 80 Wh | Razer Blade 15 RTX 2080 Max-Q i7-9750H, GeForce RTX 2080 Max-Q, 80 Wh | Lenovo ThinkPad P53-20QN000YGE i7-9850H, Quadro RTX 5000 Max-Q, 90 Wh | MSI P65 Creator 9SF-657 i9-9880H, GeForce RTX 2070 Max-Q, 82 Wh | Dell Precision 5540 i9-9980HK, Quadro T2000 Max-Q, 97 Wh | Fujitsu Celsius H780 i7-8850H, Quadro P2000, 96 Wh | HP ZBook Studio G5-4QH10EA i7-8750H, Quadro P1000, 97 Wh | Media della classe Workstation | |
|---|---|---|---|---|---|---|---|---|
| Autonomia della batteria | 25% | 45% | -11% | 31% | 36% | 48% | 60% | |
| Reader / Idle (h) | 9.6 | 15.9 66% | 9.6 0% | 15 56% | 17.3 80% | 26.1 ? 172% | ||
| H.264 (h) | 7.6 | 9.8 29% | 10.6 39% | 9.1 20% | 10.1 ? 33% | |||
| WiFi v1.3 (h) | 5.5 | 6.6 20% | 11.1 102% | 6 9% | 7.7 40% | 7.5 36% | 9.7 76% | 8.63 ? 57% |
| Load (h) | 1.9 | 1.7 -11% | 2 5% | 1.1 -42% | 1.7 -11% | 2.2 16% | 1.441 ? -24% |
Pro
Contro
Giudizio Complessivo
Razer's Blade 15 Studio is a workstation with excellent features that manages to leave us with an overall good impression in our tests.
Con l'edizione Studio della Blade 15, Razer ha creato una workstation mobile da 15,6 pollici. Si basa sul modello Blade 15 Advanced Model che abbiamo già testato e con il quale condivide il suo telaio. Per questo motivo, si basa sulla stessa, robusta costruzione metallica.
In termini di hardware, il laptop è dotato del processore Core i7-9750H e della GPU GeForce RTX 5000 Max-Q. Con le impostazioni predefinite, nessuno dei due componenti sfrutta completamente le sue capacità. Tuttavia, le prestazioni complessive possono essere sbloccate tramite il software Razer Synapse. Positivo: Nonostante la potenza dell'hardware, i livelli di rumore e temperatura rimangono ragionevoli.
La Razer Blade 15 Studio è una workstation con caratteristiche eccellenti che riesce a lasciarci una buona impressione generale nei nostri test.
Un'unità SSD NVMe assicura un sistema fluido e reattivo e fornisce agli utenti molto spazio di archiviazione. Tuttavia, non c'è spazio per unità di archiviazione aggiuntive all'interno del laptop. Se è necessario più spazio di archiviazione, l'SSD installato dovrà essere sostituito.
Il display touchscreen OLED 4K è la caratteristica più importante del laptop. Il suo ottimo valore del nero, l'elevato livello di luminosità, gli angoli di visualizzazione, i tempi di risposta rapidi e la buona copertura dello spazio colore culminano in una straordinaria esperienza visiva complessiva. Solo la rappresentazione dei colori potrebbe essere leggermente migliore.
La tastiera retroilluminata ha dimostrato di essere adatta all'uso quotidiano. Tuttavia, non è adatta ai a chi scrive molto. Inoltre, la durata della batteria è abbastanza buona. Infine, la porta Thunderbolt 3 consente agli utenti di collegare docking station o una GPU esterna.
Razer Blade 15 Studio Edition
- 12/02/2019 v7 (old)
Sascha Mölck
Price comparison
