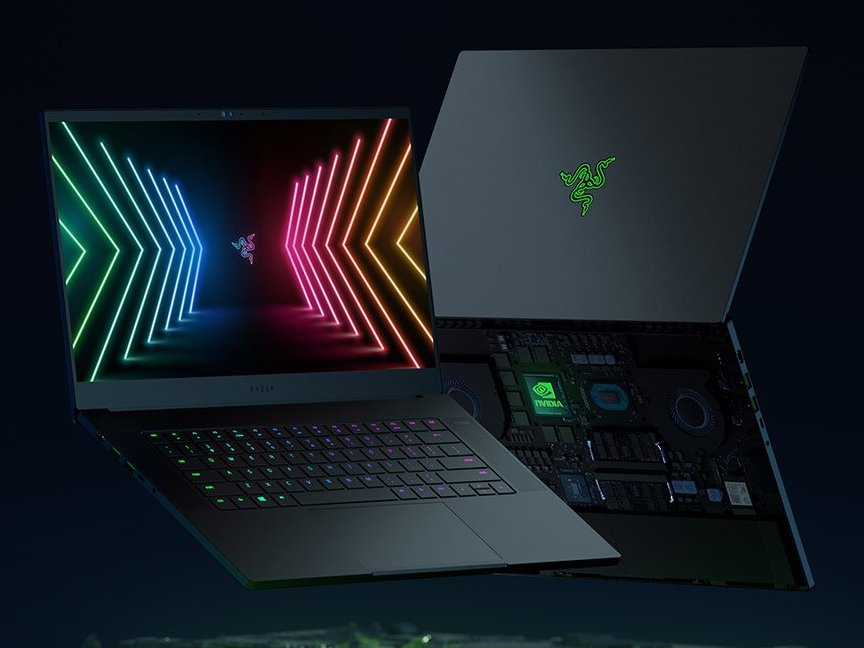
Recensione del Razer Blade 15 modello avanzato Intel 11a generazione (2021): Piccoli cambiamenti, grandi guadagni per la CPU
Confronto con i potenziali concorrenti
Punteggio | Data | Modello | Peso | Altezza | Dimensione | Risoluzione | Prezzo |
|---|---|---|---|---|---|---|---|
| 88.9 % v7 (old) | 07/2021 | Razer Blade 15 Advanced (Mid 2021) i7-11800H, GeForce RTX 3080 Laptop GPU | 2 kg | 16.99 mm | 15.60" | 1920x1080 | |
| 85.9 % v7 (old) | 06/2021 | Asus TUF Gaming F15 FX506HM i7-11800H, GeForce RTX 3060 Laptop GPU | 2.3 kg | 24.9 mm | 15.60" | 1920x1080 | |
| 84.7 % v7 (old) | 06/2021 | Alienware m15 R5 Ryzen Edition R7 5800H, GeForce RTX 3060 Laptop GPU | 2.5 kg | 22.85 mm | 15.60" | 1920x1080 | |
| 86.4 % v7 (old) | 06/2021 | Aorus 15P YD i7-11800H, GeForce RTX 3080 Laptop GPU | 2.2 kg | 27 mm | 15.60" | 1920x1080 | |
| 83.3 % v7 (old) | 02/2020 | Schenker XMG Pro 15 i7-9750H, GeForce RTX 2070 Mobile | 2.5 kg | 30 mm | 15.60" | 1920x1080 |

 GeForce RTX 3080 Laptop GPU, i7-11800H, SSSTC CA6-8D1024")
 GeForce RTX 3080 Laptop GPU, i7-11800H, SSSTC CA6-8D1024")
| |||||||||||||||||||||||||
Distribuzione della luminosità: 92 %
Al centro con la batteria: 353.4 cd/m²
Contrasto: 1140:1 (Nero: 0.31 cd/m²)
ΔE ColorChecker Calman: 2.17 | ∀{0.5-29.43 Ø4.72}
calibrated: 1.05
ΔE Greyscale Calman: 3.4 | ∀{0.09-98 Ø4.97}
69% AdobeRGB 1998 (Argyll 3D)
97.1% sRGB (Argyll 3D)
66.9% Display P3 (Argyll 3D)
Gamma: 2.2
CCT: 6830 K
| Razer Blade 15 Advanced (Mid 2021) TL156VDXP02-0, IPS, 15.6", 1920x1080 | Razer Blade 15 Advanced Model Early 2021 TL156VDXP02-0, IPS, 15.6", 1920x1080 | Razer Blade 15 RTX 2080 Super Max-Q AU Optronics B156HAN12.0, IPS, 15.6", 1920x1080 | Asus TUF Gaming F15 FX506HM Chi Mei N156HRA-EA1, IPS, 15.6", 1920x1080 | Alienware m15 R5 Ryzen Edition B156HAN, IPS, 15.6", 1920x1080 | Aorus 15P YD BOE09B9, IPS, 15.6", 1920x1080 | |
|---|---|---|---|---|---|---|
| Display | -1% | 3% | -36% | 4% | ||
| Display P3 Coverage (%) | 66.9 | 65.9 -1% | 70.2 5% | 41.9 -37% | 70.2 5% | |
| sRGB Coverage (%) | 97.1 | 96.4 -1% | 99 2% | 62.9 -35% | 98.5 1% | |
| AdobeRGB 1998 Coverage (%) | 69 | 68 -1% | 71.4 3% | 43.3 -37% | 72.4 5% | |
| Response Times | -143% | -17% | -346% | 11% | -115% | |
| Response Time Grey 50% / Grey 80% * (ms) | 4.2 ? | 16 ? -281% | 6 ? -43% | 28.4 ? -576% | 4 ? 5% | 14 ? -233% |
| Response Time Black / White * (ms) | 10 ? | 10.4 ? -4% | 9 ? 10% | 21.6 ? -116% | 8.4 ? 16% | 9.6 ? 4% |
| PWM Frequency (Hz) | ||||||
| Screen | 20% | 3% | -74% | -4% | -26% | |
| Brightness middle (cd/m²) | 353.4 | 338 -4% | 347 -2% | 268.3 -24% | 329 -7% | 337 -5% |
| Brightness (cd/m²) | 340 | 334 -2% | 328 -4% | 257 -24% | 321 -6% | 316 -7% |
| Brightness Distribution (%) | 92 | 94 2% | 89 -3% | 84 -9% | 92 0% | 85 -8% |
| Black Level * (cd/m²) | 0.31 | 0.24 23% | 0.285 8% | 0.34 -10% | 0.27 13% | 0.31 -0% |
| Contrast (:1) | 1140 | 1408 24% | 1218 7% | 789 -31% | 1219 7% | 1087 -5% |
| Colorchecker dE 2000 * | 2.17 | 1.39 36% | 2.35 -8% | 5.05 -133% | 2.78 -28% | 3.87 -78% |
| Colorchecker dE 2000 max. * | 5.69 | 3.31 42% | 4.15 27% | 15.43 -171% | 4.88 14% | 8.09 -42% |
| Colorchecker dE 2000 calibrated * | 1.05 | 0.97 8% | 1.16 -10% | 3.21 -206% | 1.63 -55% | 1.15 -10% |
| Greyscale dE 2000 * | 3.4 | 1.6 53% | 3.04 11% | 5.5 -62% | 2.5 26% | 6.1 -79% |
| Gamma | 2.2 100% | 2.291 96% | 2.35 94% | 2.35 94% | 2.106 104% | 2.132 103% |
| CCT | 6830 95% | 6626 98% | 6658 98% | 7392 88% | 6201 105% | 6891 94% |
| Color Space (Percent of AdobeRGB 1998) (%) | 68 | 65 | 76 | 72 | ||
| Color Space (Percent of sRGB) (%) | 89 | 99 | 99 | 94 | ||
| Media totale (Programma / Settaggio) | -41% /
-8% | -4% /
0% | -152% /
-105% | 4% /
-1% | -46% /
-32% |
* ... Meglio usare valori piccoli
Tempi di risposta del Display
| ↔ Tempi di risposta dal Nero al Bianco | ||
|---|---|---|
| 10 ms ... aumenta ↗ e diminuisce ↘ combinato | ↗ 5.2 ms Incremento | 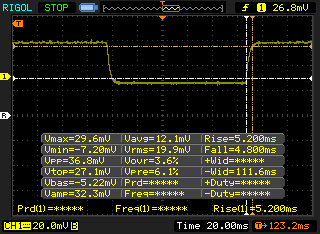 |
| ↘ 4.8 ms Calo | ||
| Lo schermo mostra buoni tempi di risposta durante i nostri tests, ma potrebbe essere troppo lento per i gamers competitivi. In confronto, tutti i dispositivi di test variano da 0.1 (minimo) a 240 (massimo) ms. » 27 % di tutti i dispositivi è migliore. Questo significa che i tempi di risposta rilevati sono migliori rispettto alla media di tutti i dispositivi testati (19.8 ms). | ||
| ↔ Tempo di risposta dal 50% Grigio all'80% Grigio | ||
| 4.2 ms ... aumenta ↗ e diminuisce ↘ combinato | ↗ 2.6 ms Incremento | 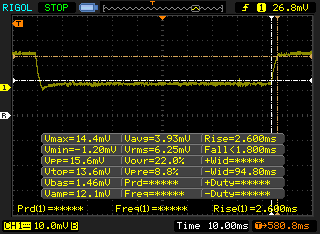 |
| ↘ 1.6 ms Calo | ||
| Lo schermo ha mostrato valori di risposta molto veloci nei nostri tests ed è molto adatto per i gaming veloce. In confronto, tutti i dispositivi di test variano da 0.165 (minimo) a 636 (massimo) ms. » 16 % di tutti i dispositivi è migliore. Questo significa che i tempi di risposta rilevati sono migliori rispettto alla media di tutti i dispositivi testati (31 ms). | ||
Sfarfallio dello schermo / PWM (Pulse-Width Modulation)
| flickering dello schermo / PWM non rilevato | 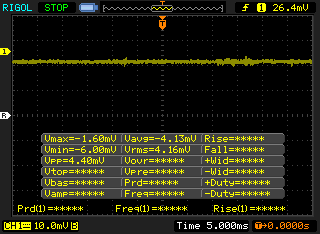 | ||
In confronto: 52 % di tutti i dispositivi testati non utilizza PWM per ridurre la luminosita' del display. Se è rilevato PWM, una media di 7772 (minimo: 5 - massimo: 343500) Hz è stata rilevata. | |||
Cinebench R15 Multi Loop
Cinebench R23: Multi Core | Single Core
Cinebench R15: CPU Multi 64Bit | CPU Single 64Bit
Blender: v2.79 BMW27 CPU
7-Zip 18.03: 7z b 4 -mmt1 | 7z b 4
Geekbench 5.5: Single-Core | Multi-Core
HWBOT x265 Benchmark v2.2: 4k Preset
LibreOffice : 20 Documents To PDF
R Benchmark 2.5: Overall mean
* ... Meglio usare valori piccoli
| PCMark 10 / Score | |
| Razer Blade 15 Advanced (Mid 2021) | |
| Aorus 15P YD | |
| Media Intel Core i7-11800H, NVIDIA GeForce RTX 3080 Laptop GPU (6673 - 7470, n=11) | |
| Asus TUF Gaming F15 FX506HM | |
| Alienware m15 R5 Ryzen Edition | |
| Razer Blade 15 Advanced Model Early 2021 | |
| Razer Blade 15 RTX 2080 Super Max-Q | |
| PCMark 10 / Essentials | |
| Razer Blade 15 Advanced (Mid 2021) | |
| Aorus 15P YD | |
| Asus TUF Gaming F15 FX506HM | |
| Media Intel Core i7-11800H, NVIDIA GeForce RTX 3080 Laptop GPU (9862 - 11064, n=11) | |
| Alienware m15 R5 Ryzen Edition | |
| Razer Blade 15 Advanced Model Early 2021 | |
| Razer Blade 15 RTX 2080 Super Max-Q | |
| PCMark 10 / Productivity | |
| Aorus 15P YD | |
| Media Intel Core i7-11800H, NVIDIA GeForce RTX 3080 Laptop GPU (8278 - 9803, n=11) | |
| Razer Blade 15 Advanced (Mid 2021) | |
| Alienware m15 R5 Ryzen Edition | |
| Asus TUF Gaming F15 FX506HM | |
| Razer Blade 15 Advanced Model Early 2021 | |
| Razer Blade 15 RTX 2080 Super Max-Q | |
| PCMark 10 / Digital Content Creation | |
| Razer Blade 15 Advanced (Mid 2021) | |
| Media Intel Core i7-11800H, NVIDIA GeForce RTX 3080 Laptop GPU (9881 - 11323, n=11) | |
| Aorus 15P YD | |
| Asus TUF Gaming F15 FX506HM | |
| Alienware m15 R5 Ryzen Edition | |
| Razer Blade 15 Advanced Model Early 2021 | |
| Razer Blade 15 RTX 2080 Super Max-Q | |
| PCMark 10 Score | 7356 punti | |
Aiuto | ||
| DPC Latencies / LatencyMon - interrupt to process latency (max), Web, Youtube, Prime95 | |
| Razer Blade 15 Advanced (Mid 2021) | |
| Asus TUF Gaming F15 FX506HM | |
| Razer Blade 15 RTX 2080 Super Max-Q | |
| Aorus 15P YD | |
| Razer Blade 15 Advanced Model Early 2021 | |
| Alienware m15 R5 Ryzen Edition | |
* ... Meglio usare valori piccoli
| Razer Blade 15 Advanced (Mid 2021) SSSTC CA6-8D1024 | Razer Blade 15 Advanced Model Early 2021 Samsung PM981a MZVLB1T0HBLR | Asus TUF Gaming F15 FX506HM SK Hynix HFM001TD3JX013N | Alienware m15 R5 Ryzen Edition Toshiba KBG40ZNS512G NVMe | Aorus 15P YD Samsung PM9A1 MZVL21T0HCLR | |
|---|---|---|---|---|---|
| AS SSD | -30% | -27% | -69% | 13% | |
| Seq Read (MB/s) | 5739 | 2112 -63% | 2873 -50% | 2082 -64% | 5376 -6% |
| Seq Write (MB/s) | 4201 | 2024 -52% | 1619 -61% | 825 -80% | 3669 -13% |
| 4K Read (MB/s) | 53.8 | 46.53 -14% | 57.5 7% | 42.41 -21% | 56.5 5% |
| 4K Write (MB/s) | 179.2 | 89.7 -50% | 149.6 -17% | 98.3 -45% | 157.7 -12% |
| 4K-64 Read (MB/s) | 2959 | 1747 -41% | 1252 -58% | 1255 -58% | 2720 -8% |
| 4K-64 Write (MB/s) | 1891 | 1962 4% | 2196 16% | 738 -61% | 3366 78% |
| Access Time Read * (ms) | 0.027 | 0.052 -93% | 0.04 -48% | 0.109 -304% | 0.04 -48% |
| Access Time Write * (ms) | 0.154 | 0.04 74% | 0.082 47% | 0.17 -10% | 0.027 82% |
| Score Read (Points) | 3587 | 2004 -44% | 1597 -55% | 1506 -58% | 3314 -8% |
| Score Write (Points) | 2490 | 2254 -9% | 2508 1% | 918 -63% | 3890 56% |
| Score Total (Points) | 7821 | 5280 -32% | 4869 -38% | 3136 -60% | 8804 13% |
| Copy ISO MB/s (MB/s) | 3027 | 2128 -30% | 1583 -48% | 1391 -54% | |
| Copy Program MB/s (MB/s) | 1177 | 707 -40% | 964 -18% | 645 -45% | |
| Copy Game MB/s (MB/s) | 2170 | 1471 -32% | 943 -57% | 1101 -49% | |
| CrystalDiskMark 5.2 / 6 | -46% | -40% | -54% | 0% | |
| Write 4K (MB/s) | 295.6 | 138 -53% | 168.1 -43% | 116.9 -60% | 230.4 -22% |
| Read 4K (MB/s) | 85.7 | 47.41 -45% | 65.1 -24% | 44.56 -48% | 91.8 7% |
| Write Seq (MB/s) | 4149 | 1922 -54% | 2124 -49% | 1552 -63% | 4301 4% |
| Read Seq (MB/s) | 4203 | 1673 -60% | 2204 -48% | 1682 -60% | 4474 6% |
| Write 4K Q32T1 (MB/s) | 715 | 445.5 -38% | 455.3 -36% | 497.8 -30% | 656 -8% |
| Read 4K Q32T1 (MB/s) | 709 | 534 -25% | 465.6 -34% | 436.8 -38% | 722 2% |
| Write Seq Q32T1 (MB/s) | 4681 | 2976 -36% | 2911 -38% | 1461 -69% | 5198 11% |
| Read Seq Q32T1 (MB/s) | 6905 | 3232 -53% | 3519 -49% | 2364 -66% | 7065 2% |
| Media totale (Programma / Settaggio) | -38% /
-36% | -34% /
-32% | -62% /
-64% | 7% /
7% |
* ... Meglio usare valori piccoli

Throttling disco: DiskSpd Read Loop, Queue Depth 8
| 3DMark 11 Performance | 29130 punti | |
| 3DMark Cloud Gate Standard Score | 55775 punti | |
| 3DMark Fire Strike Score | 21544 punti | |
| 3DMark Time Spy Score | 10365 punti | |
Aiuto | ||
Grafico The Witcher 3 FPS
| basso | medio | alto | ultra | |
|---|---|---|---|---|
| GTA V (2015) | 186 | 180 | 175 | 110 |
| The Witcher 3 (2015) | 465.4 | 317.3 | 197.3 | 102.8 |
| Dota 2 Reborn (2015) | 174 | 157 | 151 | 142 |
| Final Fantasy XV Benchmark (2018) | 199 | 130 | 97.1 | |
| X-Plane 11.11 (2018) | 138 | 123 | 97.3 | |
| Strange Brigade (2018) | 507 | 253 | 204 | 179 |
| Shadow of the Tomb Raider (2018) | 146 | 127 | 124 | 115 |
| Assassin´s Creed Valhalla (2020) | 134 | 93 | 79 | 68 |
| Razer Blade 15 Advanced (Mid 2021) GeForce RTX 3080 Laptop GPU, i7-11800H, SSSTC CA6-8D1024 | Razer Blade 15 Advanced Model Early 2021 GeForce RTX 3080 Laptop GPU, i7-10875H, Samsung PM981a MZVLB1T0HBLR | Razer Blade 15 RTX 2080 Super Max-Q GeForce RTX 2080 Super Max-Q, i7-10875H, Samsung PM981a MZVLB1T0HBLR | Asus TUF Gaming F15 FX506HM GeForce RTX 3060 Laptop GPU, i7-11800H, SK Hynix HFM001TD3JX013N | Alienware m15 R5 Ryzen Edition GeForce RTX 3060 Laptop GPU, R7 5800H, Toshiba KBG40ZNS512G NVMe | Aorus 15P YD GeForce RTX 3080 Laptop GPU, i7-11800H, Samsung PM9A1 MZVL21T0HCLR | |
|---|---|---|---|---|---|---|
| Noise | -8% | -12% | 7% | -5% | -11% | |
| off /ambiente * (dB) | 25.1 | 24 4% | 30.1 -20% | 24.8 1% | 24 4% | 25 -0% |
| Idle Minimum * (dB) | 25.3 | 26 -3% | 30.1 -19% | 24.6 3% | 24 5% | 26 -3% |
| Idle Average * (dB) | 25.3 | 28 -11% | 30.1 -19% | 24.9 2% | 25 1% | 30 -19% |
| Idle Maximum * (dB) | 25.3 | 40 -58% | 30.1 -19% | 24.9 2% | 35 -38% | 34 -34% |
| Load Average * (dB) | 42 | 45 -7% | 46.8 -11% | 27.1 35% | 44 -5% | 43 -2% |
| Witcher 3 ultra * (dB) | 45.6 | 43 6% | 48.4 -6% | 46.4 -2% | 48 -5% | 50 -10% |
| Load Maximum * (dB) | 51.6 | 45 13% | 46 11% | 49 5% | 50 3% | 57 -10% |
* ... Meglio usare valori piccoli
Rumorosità
| Idle |
| 25.3 / 25.3 / 25.3 dB(A) |
| Sotto carico |
| 42 / 51.6 dB(A) |
 | ||
30 dB silenzioso 40 dB(A) udibile 50 dB(A) rumoroso |
||
min: | ||
(-) La temperatura massima sul lato superiore è di 51 °C / 124 F, rispetto alla media di 40.4 °C / 105 F, che varia da 21.2 a 68.8 °C per questa classe Gaming.
(-) Il lato inferiore si riscalda fino ad un massimo di 52 °C / 126 F, rispetto alla media di 43.2 °C / 110 F
(+) In idle, la temperatura media del lato superiore è di 30.7 °C / 87 F, rispetto alla media deld ispositivo di 33.9 °C / 93 F.
(±) Riproducendo The Witcher 3, la temperatura media per il lato superiore e' di 36.2 °C / 97 F, rispetto alla media del dispositivo di 33.9 °C / 93 F.
(±) I poggiapolsi e il touchpad possono diventare molto caldi al tatto con un massimo di 38.6 °C / 101.5 F.
(-) La temperatura media della zona del palmo della mano di dispositivi simili e'stata di 28.8 °C / 83.8 F (-9.8 °C / -17.7 F).
Razer Blade 15 Advanced (Mid 2021) analisi audio
(+) | gli altoparlanti sono relativamente potenti (84.6 dB)
Bassi 100 - 315 Hz
(-) | quasi nessun basso - in media 20.1% inferiori alla media
(±) | la linearità dei bassi è media (12.8% delta rispetto alla precedente frequenza)
Medi 400 - 2000 Hz
(+) | medi bilanciati - solo only 3.6% rispetto alla media
(+) | medi lineari (4.1% delta rispetto alla precedente frequenza)
Alti 2 - 16 kHz
(+) | Alti bilanciati - appena 4.9% dalla media
(±) | la linearità degli alti è media (8.3% delta rispetto alla precedente frequenza)
Nel complesso 100 - 16.000 Hz
(±) | la linearità complessiva del suono è media (15.8% di differenza rispetto alla media
Rispetto alla stessa classe
» 37% di tutti i dispositivi testati in questa classe è stato migliore, 7% simile, 56% peggiore
» Il migliore ha avuto un delta di 6%, medio di 18%, peggiore di 132%
Rispetto a tutti i dispositivi testati
» 24% di tutti i dispositivi testati in questa classe è stato migliore, 5% similare, 71% peggiore
» Il migliore ha avuto un delta di 4%, medio di 24%, peggiore di 134%
Apple MacBook 12 (Early 2016) 1.1 GHz analisi audio
(+) | gli altoparlanti sono relativamente potenti (83.6 dB)
Bassi 100 - 315 Hz
(±) | bassi ridotti - in media 11.3% inferiori alla media
(±) | la linearità dei bassi è media (14.2% delta rispetto alla precedente frequenza)
Medi 400 - 2000 Hz
(+) | medi bilanciati - solo only 2.4% rispetto alla media
(+) | medi lineari (5.5% delta rispetto alla precedente frequenza)
Alti 2 - 16 kHz
(+) | Alti bilanciati - appena 2% dalla media
(+) | alti lineari (4.5% delta rispetto alla precedente frequenza)
Nel complesso 100 - 16.000 Hz
(+) | suono nel complesso lineare (10.2% differenza dalla media)
Rispetto alla stessa classe
» 7% di tutti i dispositivi testati in questa classe è stato migliore, 2% simile, 91% peggiore
» Il migliore ha avuto un delta di 5%, medio di 18%, peggiore di 53%
Rispetto a tutti i dispositivi testati
» 5% di tutti i dispositivi testati in questa classe è stato migliore, 1% similare, 94% peggiore
» Il migliore ha avuto un delta di 4%, medio di 24%, peggiore di 134%
| Off / Standby | |
| Idle | |
| Sotto carico |
|
Leggenda:
min: | |
| Razer Blade 15 Advanced (Mid 2021) i7-11800H, GeForce RTX 3080 Laptop GPU, SSSTC CA6-8D1024, IPS, 1920x1080, 15.6" | Razer Blade 15 Advanced Model Early 2021 i7-10875H, GeForce RTX 3080 Laptop GPU, Samsung PM981a MZVLB1T0HBLR, IPS, 1920x1080, 15.6" | Razer Blade 15 RTX 2080 Super Max-Q i7-10875H, GeForce RTX 2080 Super Max-Q, Samsung PM981a MZVLB1T0HBLR, IPS, 1920x1080, 15.6" | Asus TUF Gaming F15 FX506HM i7-11800H, GeForce RTX 3060 Laptop GPU, SK Hynix HFM001TD3JX013N, IPS, 1920x1080, 15.6" | Alienware m15 R5 Ryzen Edition R7 5800H, GeForce RTX 3060 Laptop GPU, Toshiba KBG40ZNS512G NVMe, IPS, 1920x1080, 15.6" | Aorus 15P YD i7-11800H, GeForce RTX 3080 Laptop GPU, Samsung PM9A1 MZVL21T0HCLR, IPS, 1920x1080, 15.6" | |
|---|---|---|---|---|---|---|
| Power Consumption | 28% | 26% | 29% | 15% | -9% | |
| Idle Minimum * (Watt) | 19.5 | 13 33% | 10.6 46% | 9.5 51% | 11 44% | 23 -18% |
| Idle Average * (Watt) | 23.3 | 15 36% | 13.1 44% | 12.1 48% | 14 40% | 25 -7% |
| Idle Maximum * (Watt) | 40.1 | 22 45% | 15.8 61% | 22.5 44% | 25 38% | 35 13% |
| Load Average * (Watt) | 98.9 | 98 1% | 131 -32% | 99.5 -1% | 123 -24% | 101 -2% |
| Witcher 3 ultra * (Watt) | 174 | 126 28% | 146 16% | 157 10% | 176 -1% | 190 -9% |
| Load Maximum * (Watt) | 214 | 165 23% | 169 21% | 173.5 19% | 226 -6% | 280 -31% |
* ... Meglio usare valori piccoli
Consumo energetico The Witcher 3
| Razer Blade 15 Advanced (Mid 2021) i7-11800H, GeForce RTX 3080 Laptop GPU, 80 Wh | Razer Blade 15 Advanced Model Early 2021 i7-10875H, GeForce RTX 3080 Laptop GPU, 80 Wh | Razer Blade 15 RTX 2080 Super Max-Q i7-10875H, GeForce RTX 2080 Super Max-Q, 80 Wh | Asus TUF Gaming F15 FX506HM i7-11800H, GeForce RTX 3060 Laptop GPU, 90 Wh | Alienware m15 R5 Ryzen Edition R7 5800H, GeForce RTX 3060 Laptop GPU, 86 Wh | Aorus 15P YD i7-11800H, GeForce RTX 3080 Laptop GPU, 99 Wh | |
|---|---|---|---|---|---|---|
| Autonomia della batteria | 53% | 3% | 34% | -14% | -10% | |
| WiFi v1.3 (h) | 5.9 | 9 53% | 6.1 3% | 7.9 34% | 5.1 -14% | 5.3 -10% |
| Reader / Idle (h) | 14.4 | 8.7 | 11 | 14.7 | 7.5 | |
| Load (h) | 2 | 1.9 | 2 | 0.9 | 2.1 | |
| Witcher 3 ultra (h) | 1.6 |
Pro
Contro
Dal momento che il Core i7-10875H nel Blade 15 di decima generazione avrebbe sottoperformato sotto stress, avevamo paura di vedere lo stesso con il Core i7-11800H nel più recente modello Blade 15 di undicesima generazione. Fortunatamente, questo non si è verificato. La CPU nel nuovo Blade 15 resta entro pochi punti percentuali del portatile medio nel nostro database equipaggiato con lo stesso i7-11800H. Gli utenti almeno avranno un aumento del 30% nelle prestazioni multi-thread grezze rispetto all'i7-10875H del vecchio Blade 15. Le prestazioni della GPU sono aumentate dal 10% al 15%, in parte a causa dell'obiettivo TGP più alto. Alcuni giochi vedranno simili incrementi di frame rates a seconda di quanto siano pesanti per la CPU.
L'ultimo 2021 Blade 15 è la versione più veloce di se stesso finora soprattutto in termini di potenza della CPU. Le sue prestazioni gaming complessive, tuttavia, sono solo un miglioramento marginale rispetto al primo modello di Blade 15 2021 che ha solo pochi mesi.
La CPU e la GPU più veloci sono al costo di temperature più elevate del core, un consumo energetico più elevato e una durata della batteria più breve rispetto al Blade 15 Intel della decima generazione. Questi inconvenienti potrebbero allontanare gli utenti che cercano di massimizzare l'efficienza energetica, ma i cacciatori di prestazioni potrebbero accettare felicemente queste battute d'arresto per i processori più veloci, la webcam ad alta risoluzione, il supporto SSD PCIe 4 NVMe e la compatibilità Thunderbolt 4.
Razer Blade 15 Advanced (Mid 2021)
- 07/07/2021 v7 (old)
Allen Ngo
Price comparison
