Recensione del Laptop Razer Blade 15 Advanced Model (2020): I miglioramenti dei dettagli danno i loro frutti

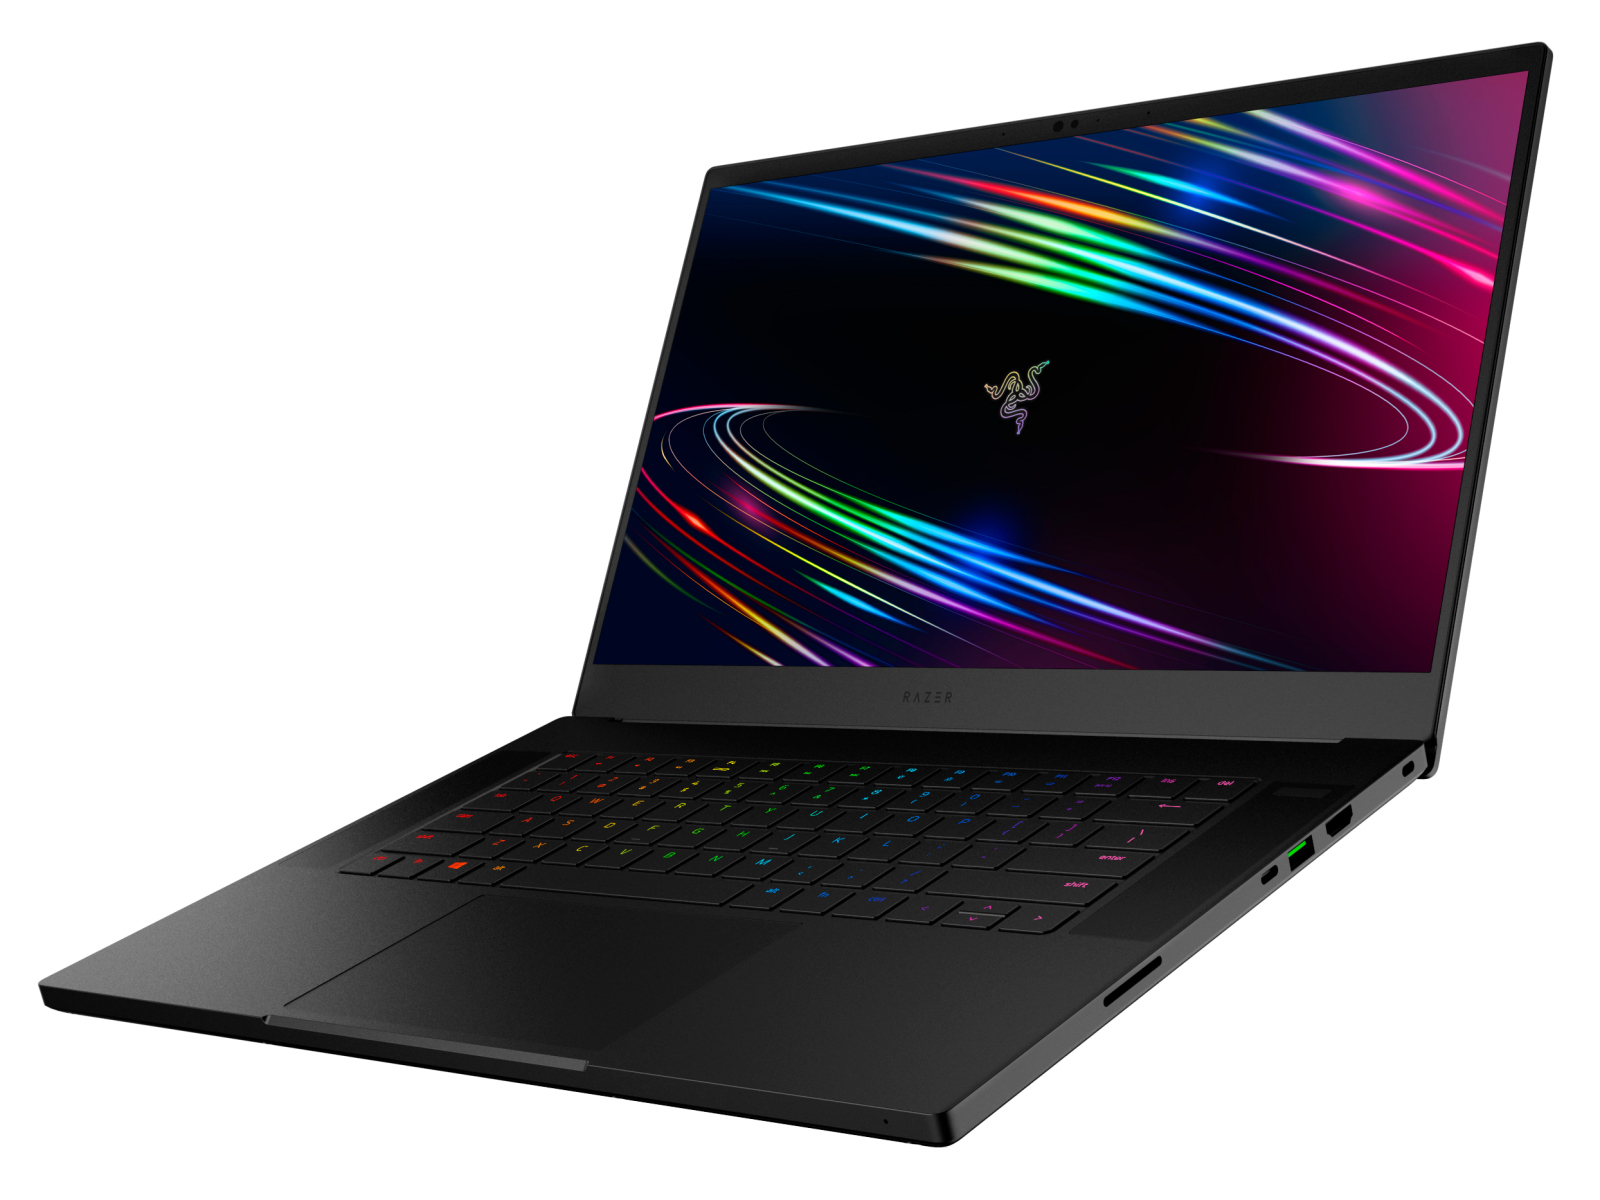
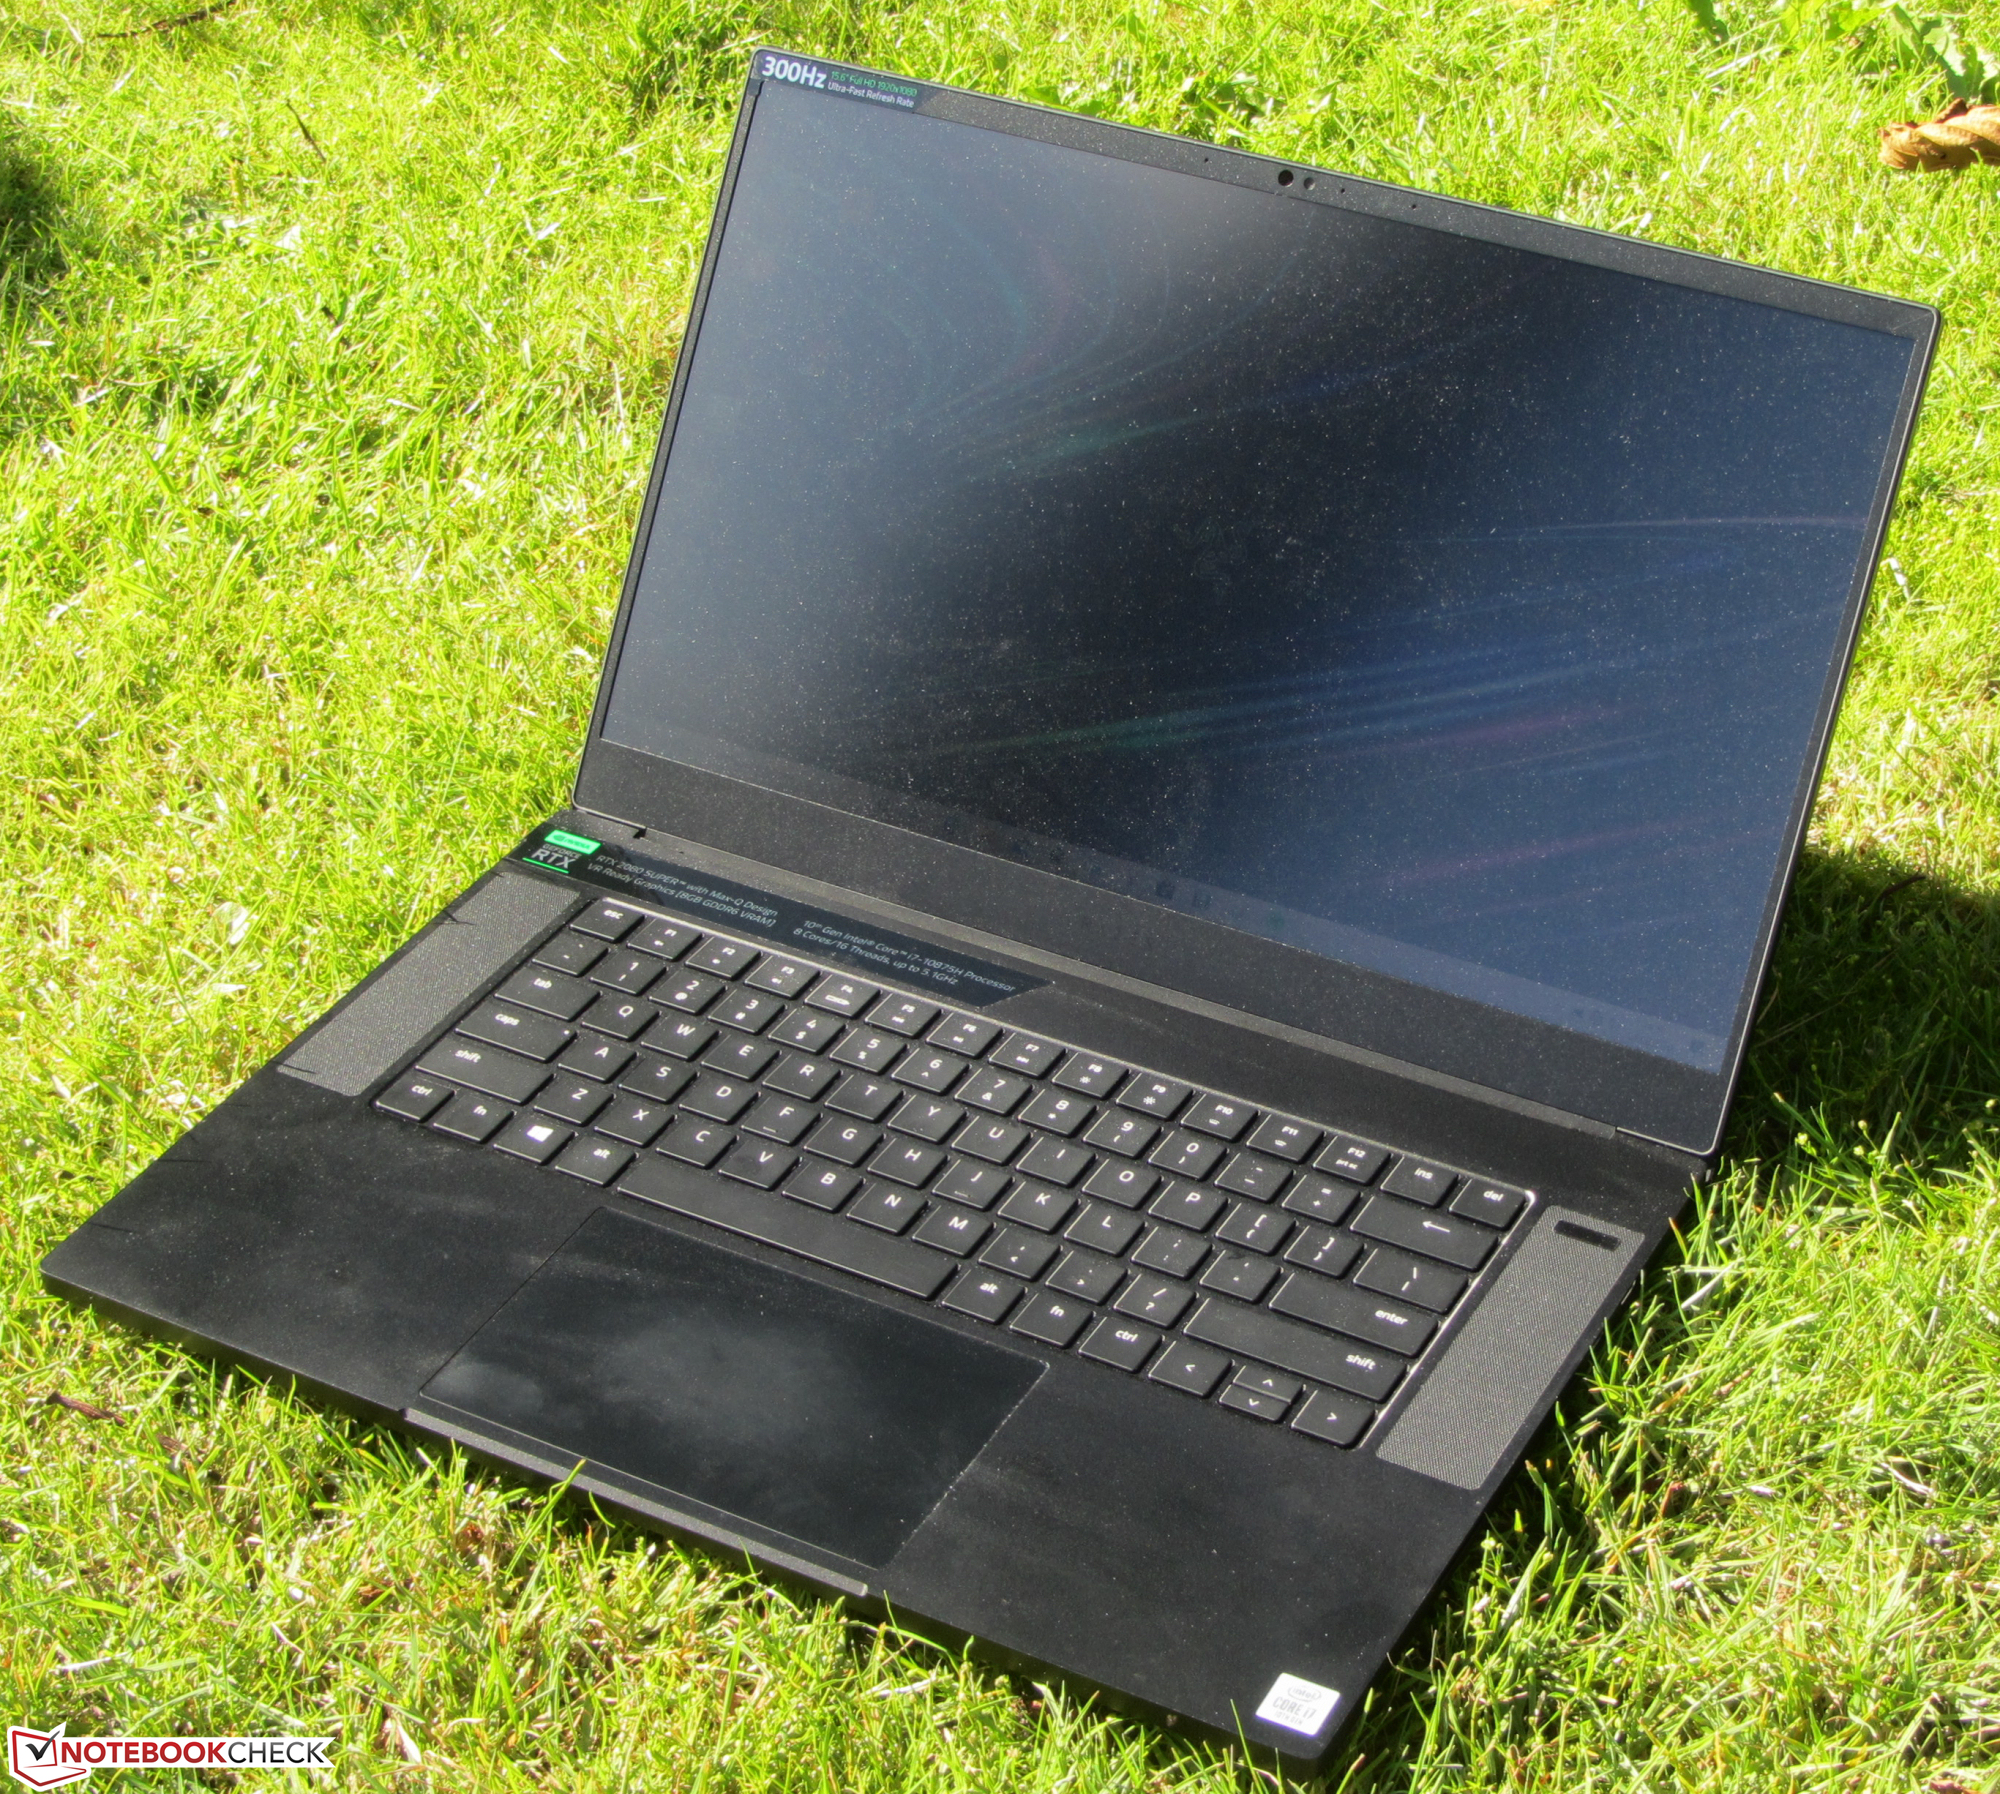
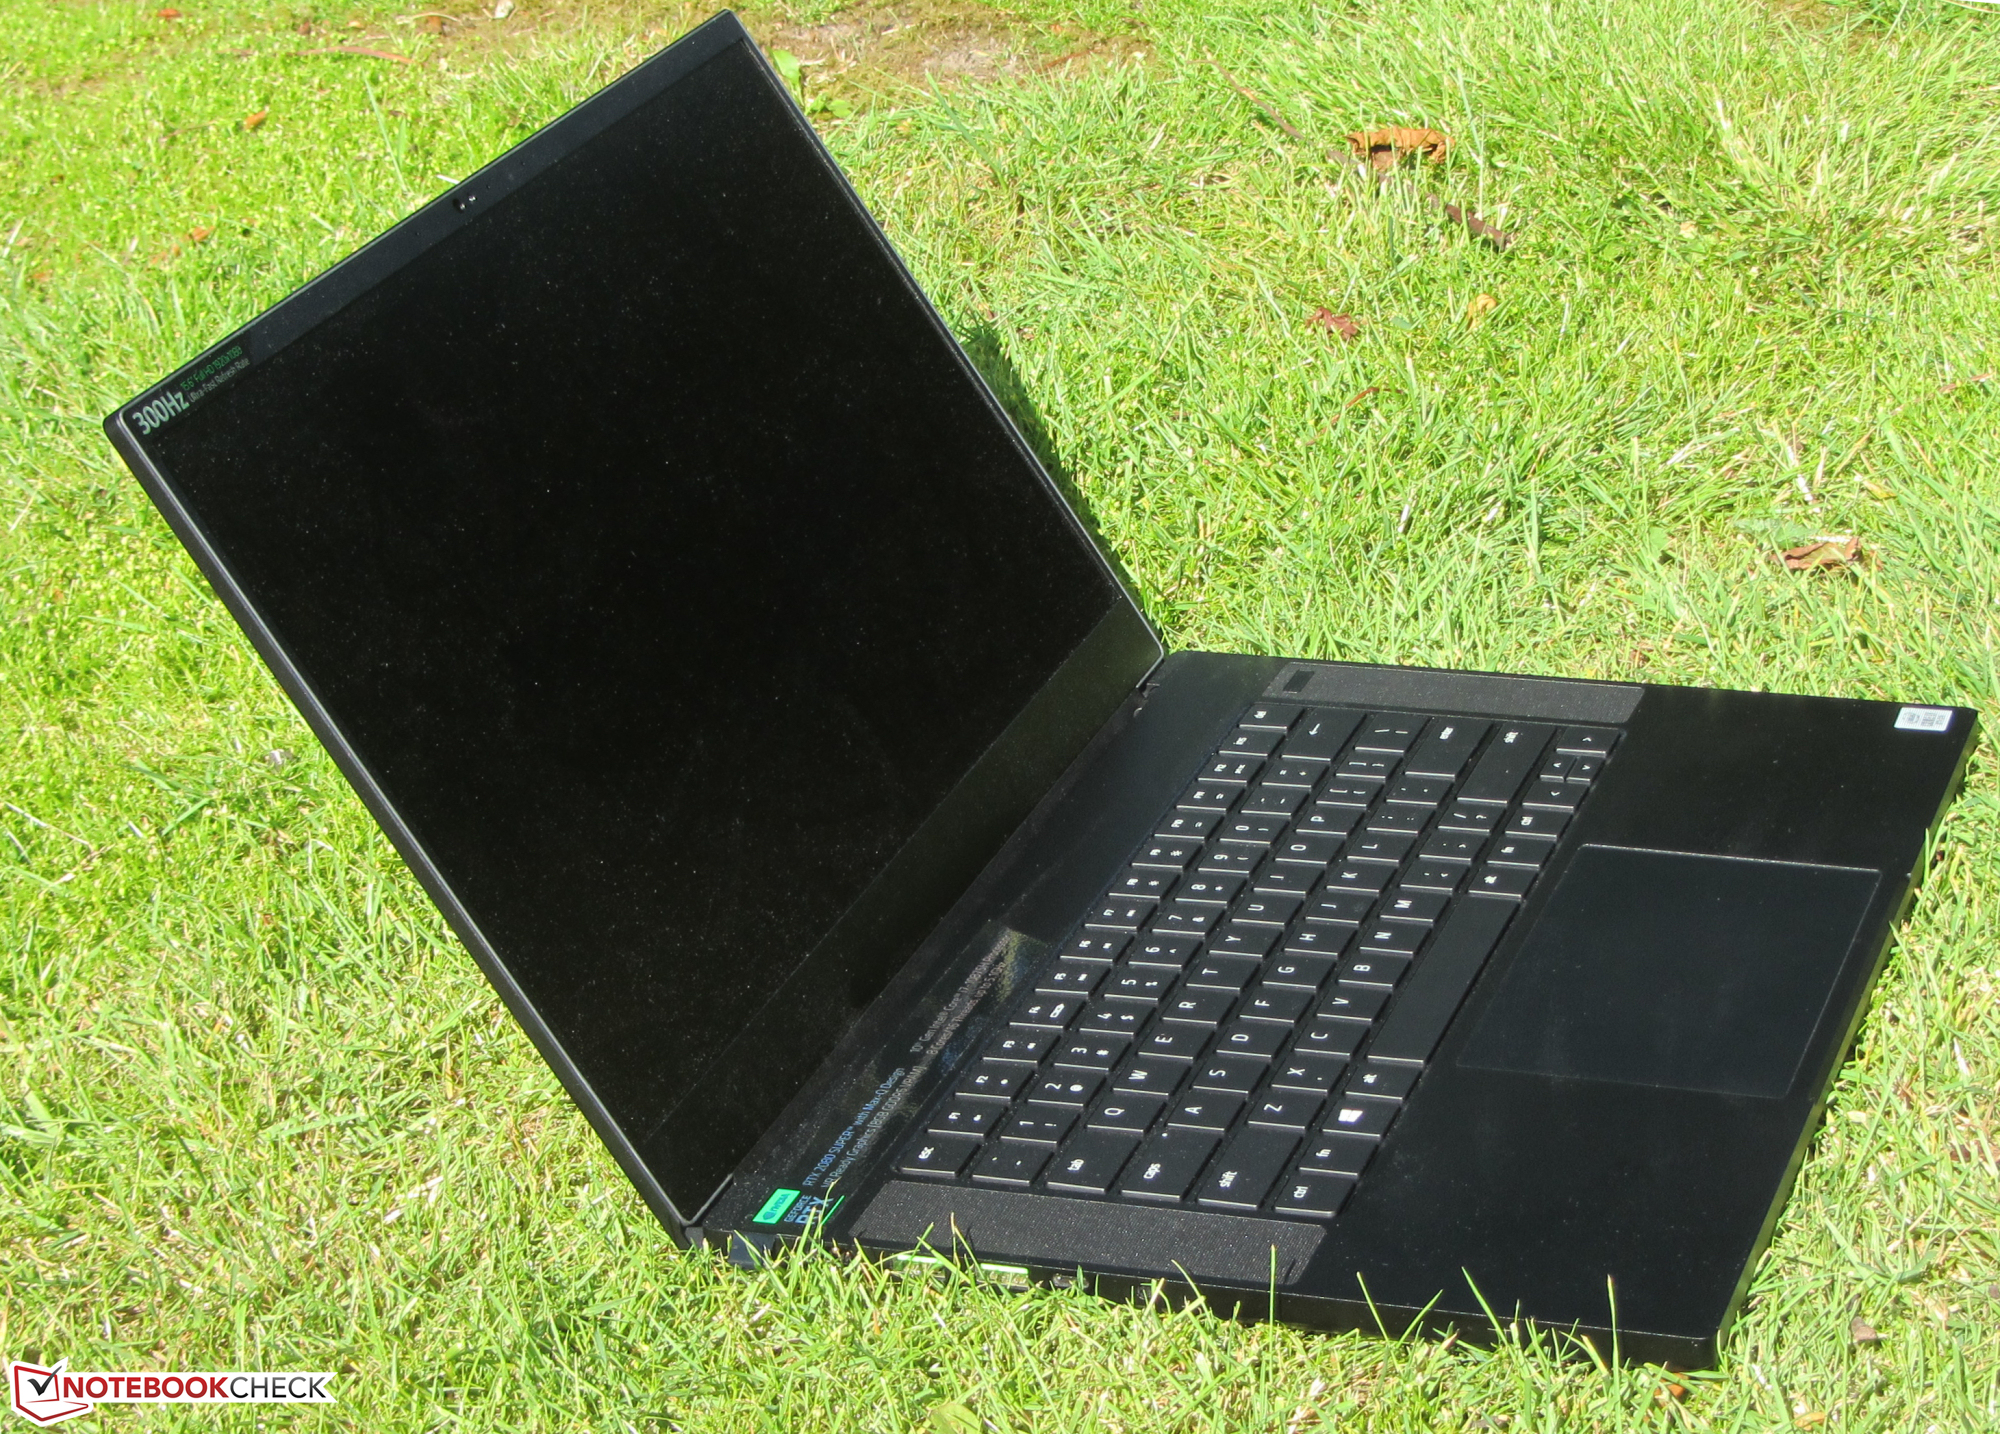
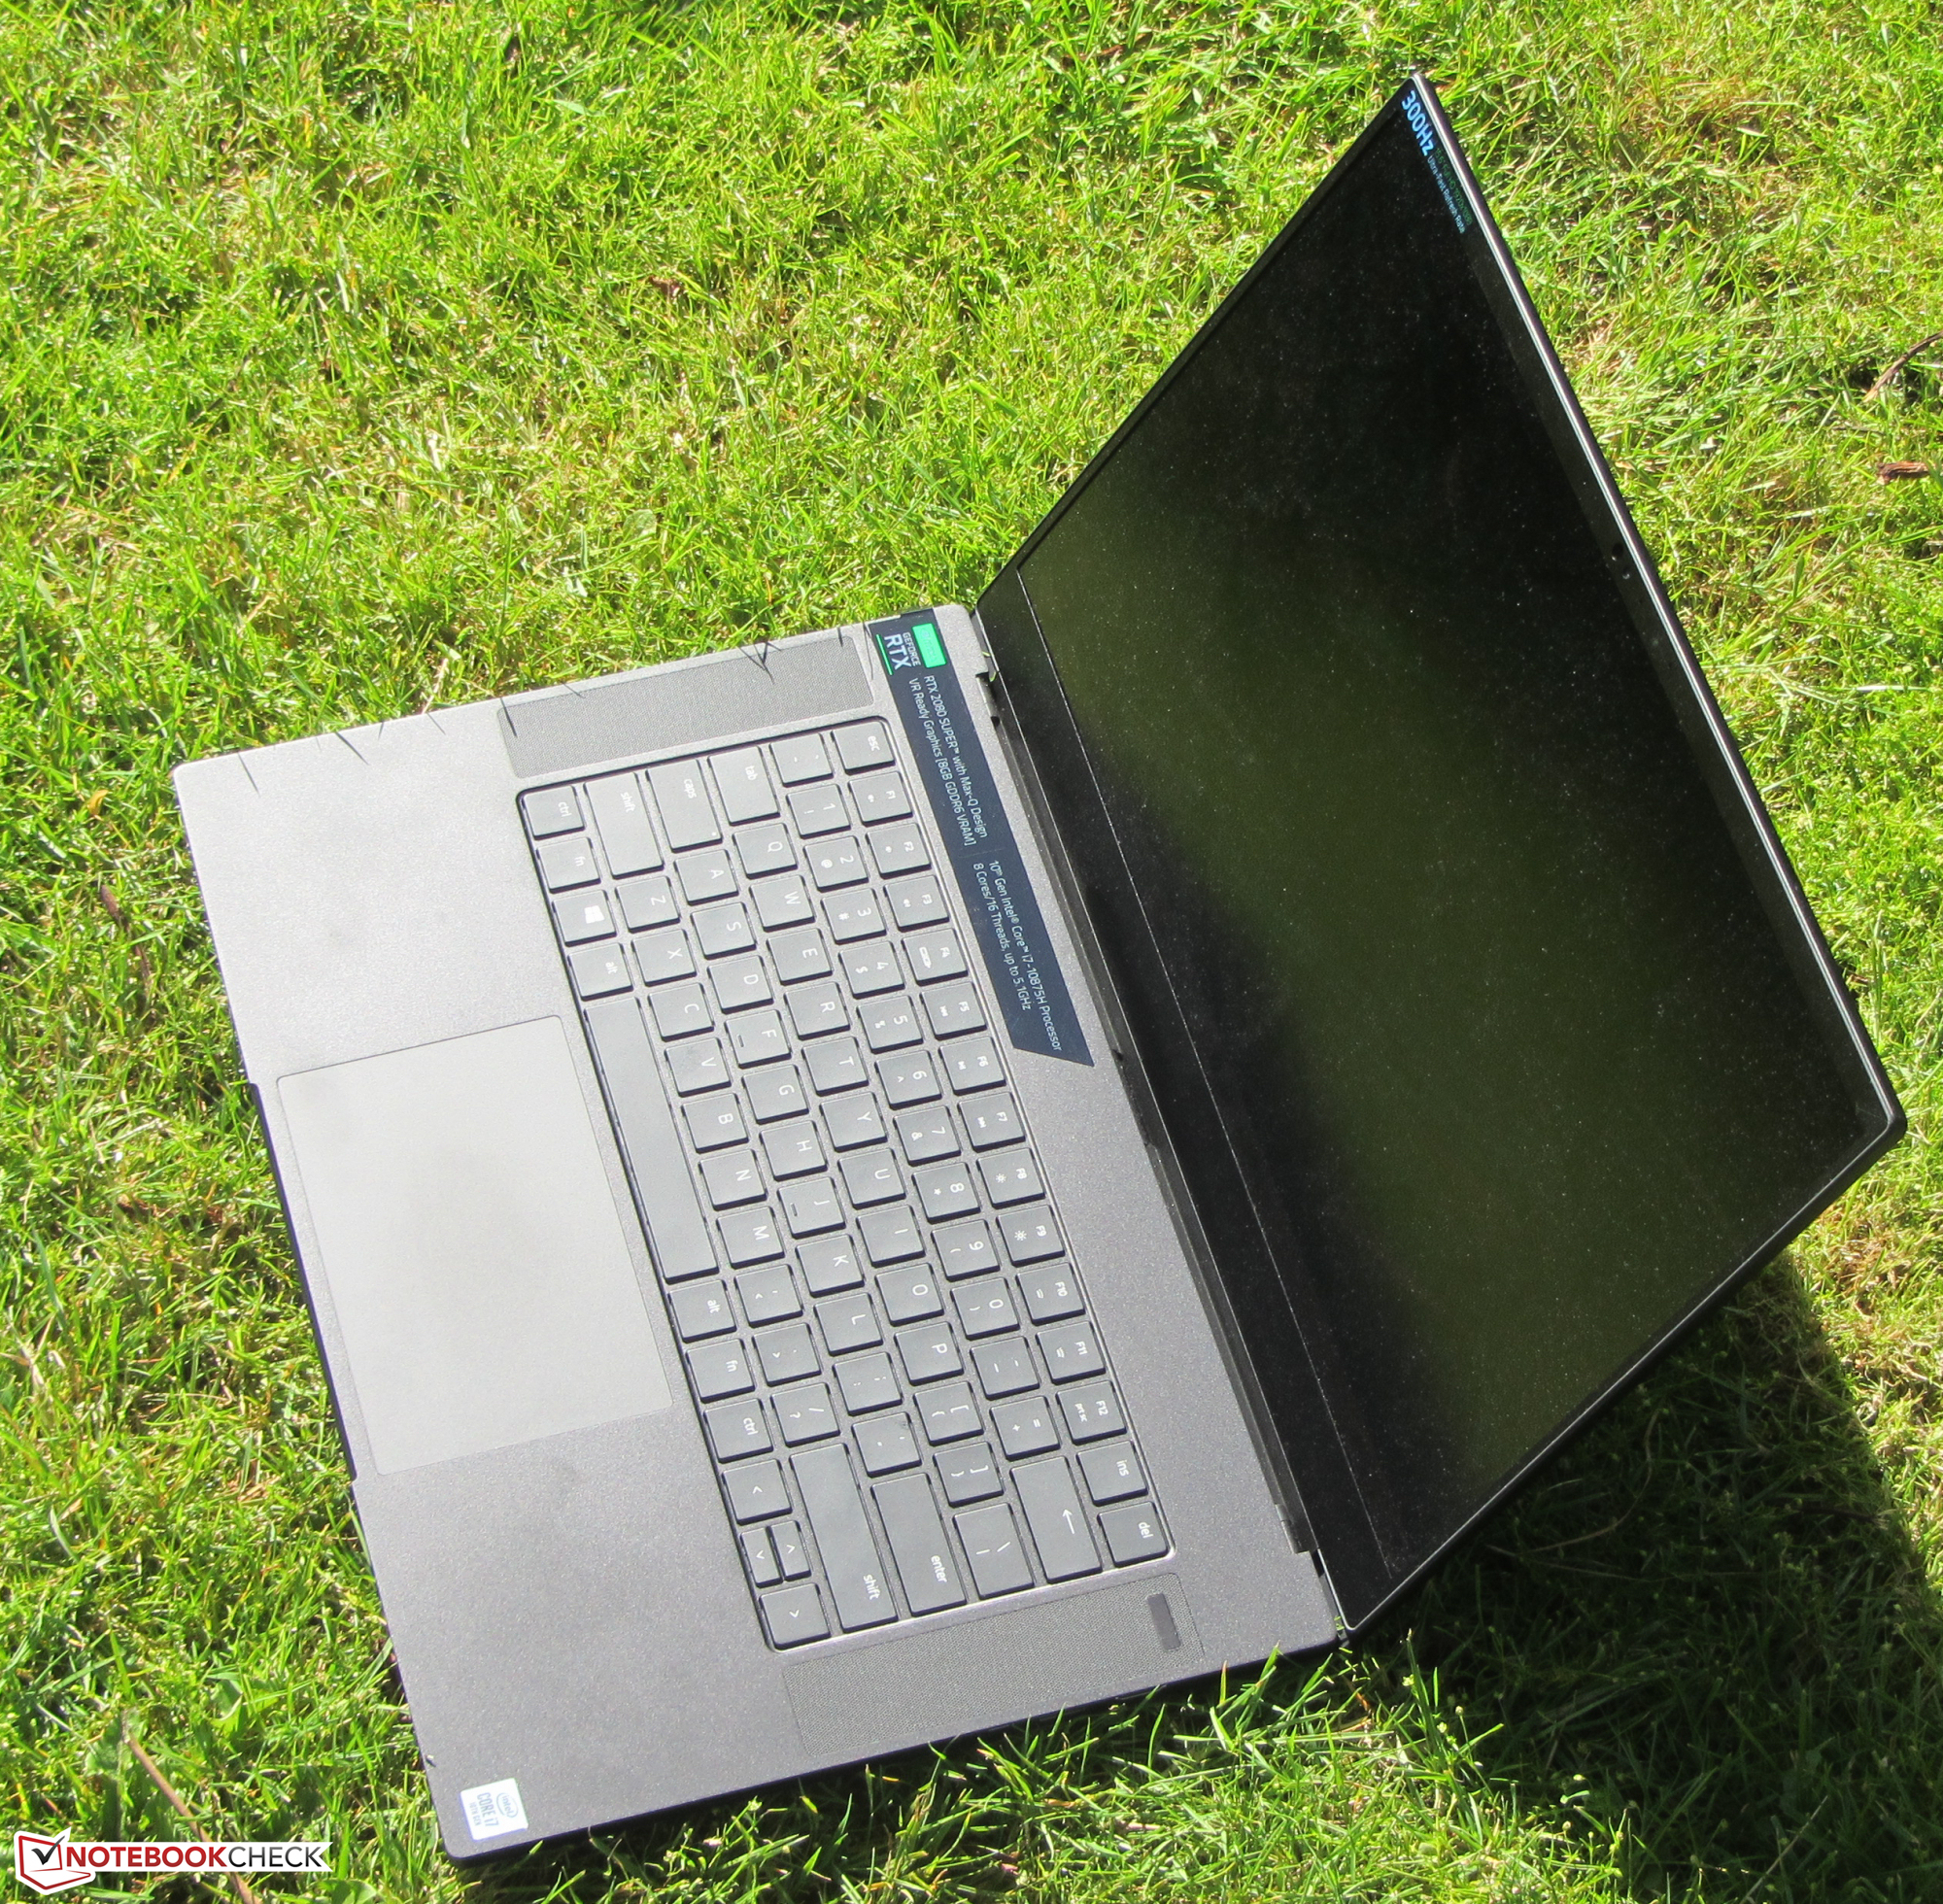
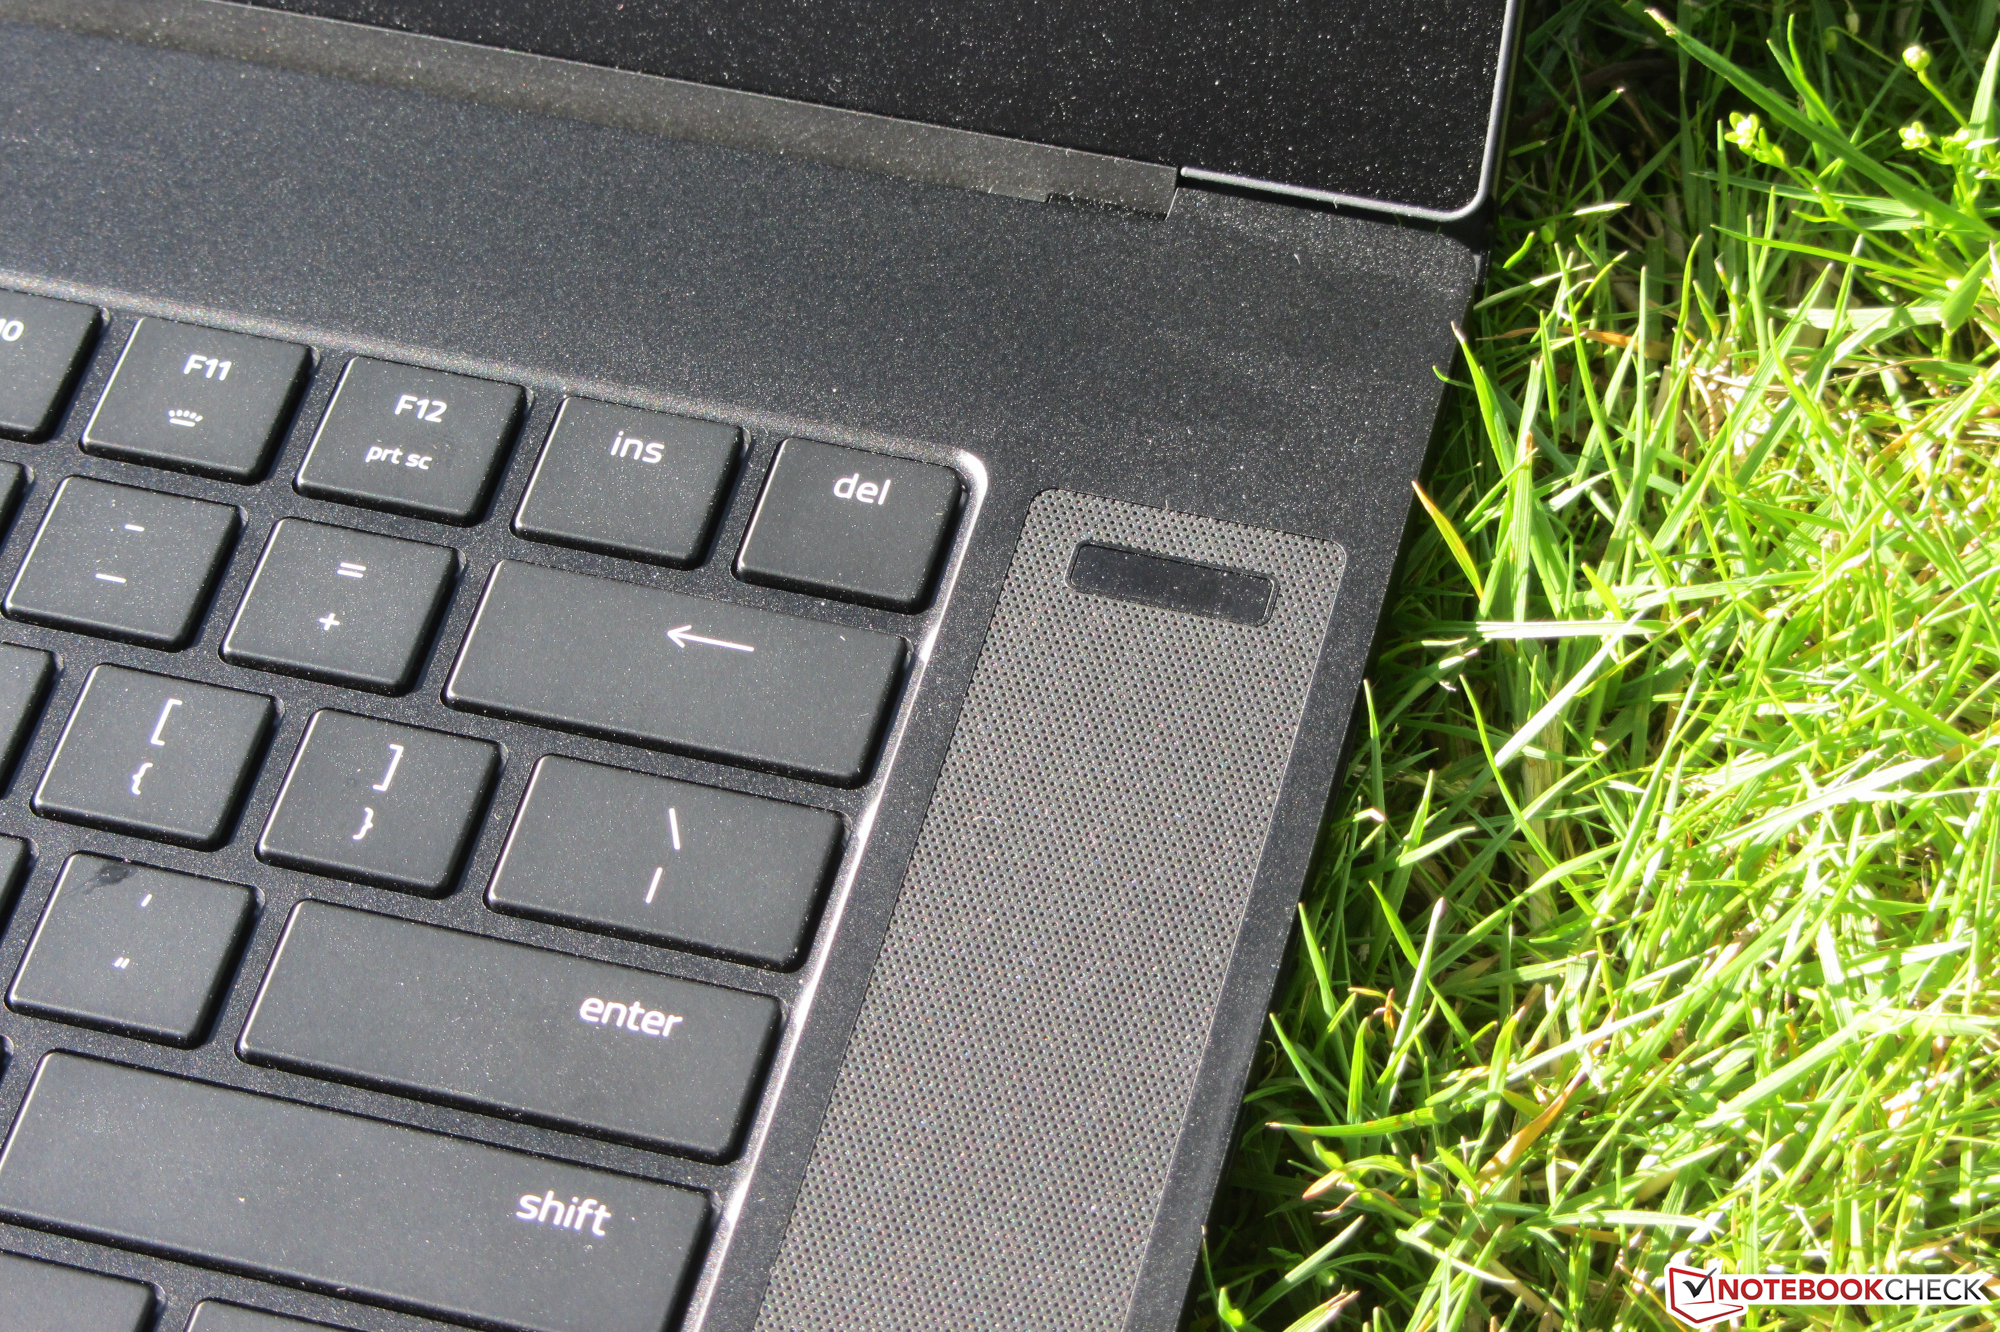
Con il Blade 15 Advanced Model (2020), Razer offre un portatile gaming sottile e di classe da 15,6" dotato di un potente hardware. Il nostro dispositivo di test è dotato di un processore Core i7-10875H octa-core e di una GPU GeForce RTX 2080 Super Max-Q. Poiché il computer è identico nella costruzione al suo predecessore, in questa recensione non ritorneremo su case, connettività, dispositivi di input e altoparlanti - a meno che non ci siano differenze. Le relative informazioni si trovano nella recensione del Blade 15 Advanced Model (2019).
I concorrenti di questo portatile sono dispositivi come l'Asus Zephyrus S GX531GX, il Gigabyte Aero 15 XB, l'MSI GE66 Raider 10SFS, e lo Schenker XMG Neo 15.
Punteggio | Data | Modello | Peso | Altezza | Dimensione | Risoluzione | Prezzo |
|---|---|---|---|---|---|---|---|
| 85.9 % v7 (old) | 08/2020 | Razer Blade 15 RTX 2080 Super Max-Q i7-10875H, GeForce RTX 2080 Super Max-Q | 2.2 kg | 17.8 mm | 15.60" | 1920x1080 | |
| 81.5 % v7 (old) | 04/2019 | Asus Zephyrus S GX531GX i7-8750H, GeForce RTX 2080 Max-Q | 2.1 kg | 15.75 mm | 15.60" | 1920x1080 | |
| 85.8 % v7 (old) | 05/2020 | Gigabyte Aero 15 OLED XB-8DE51B0SP i7-10875H, GeForce RTX 2070 Super Max-Q | 2.2 kg | 20 mm | 15.60" | 3840x2160 | |
| 84.6 % v7 (old) | 07/2020 | MSI GE66 Raider 10SFS i9-10980HK, GeForce RTX 2070 Super Mobile | 2.4 kg | 23 mm | 15.60" | 1920x1080 | |
| 82.8 % v7 (old) | 12/2019 | Schenker XMG Neo 15 XNE15M19 i7-9750H, GeForce RTX 2070 Max-Q | 2.1 kg | 22 mm | 15.60" | 1920x1080 |
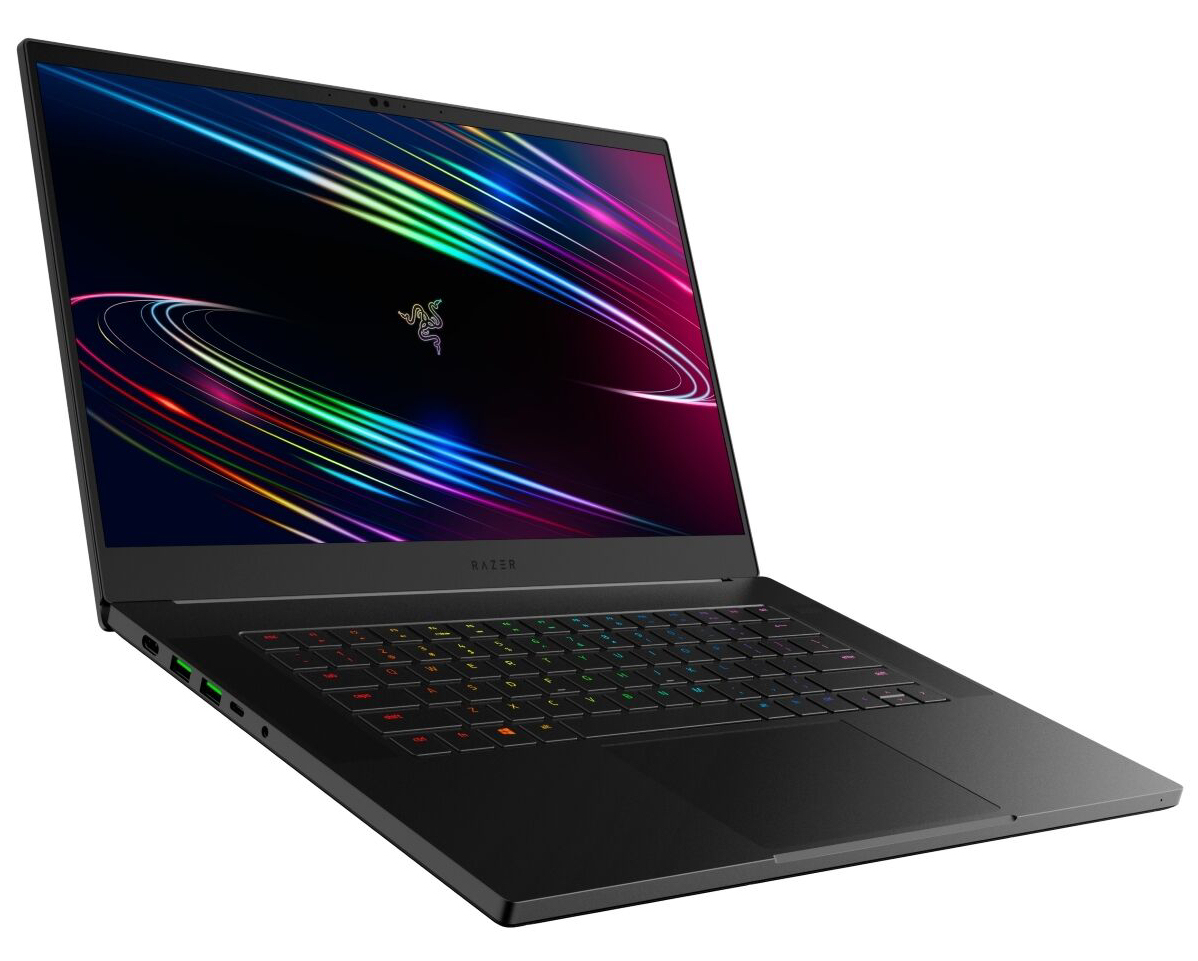

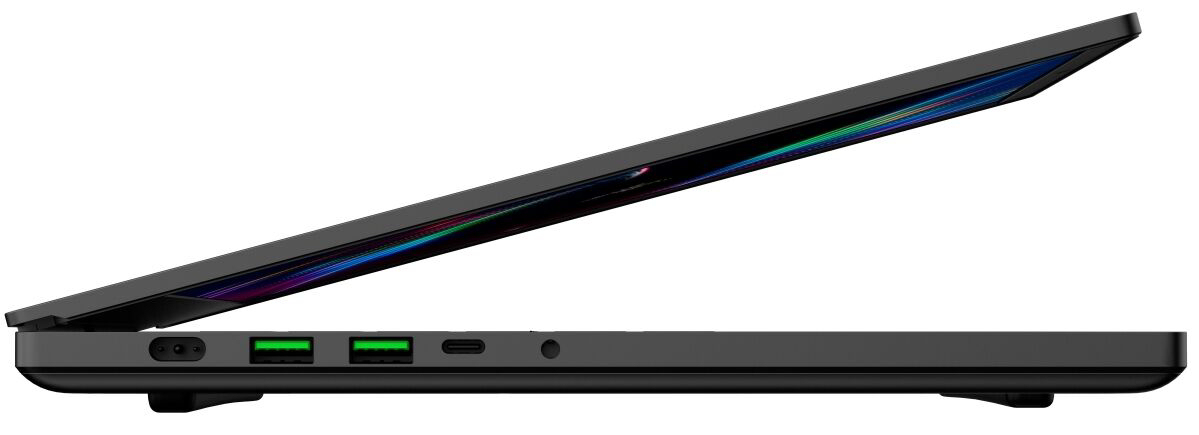
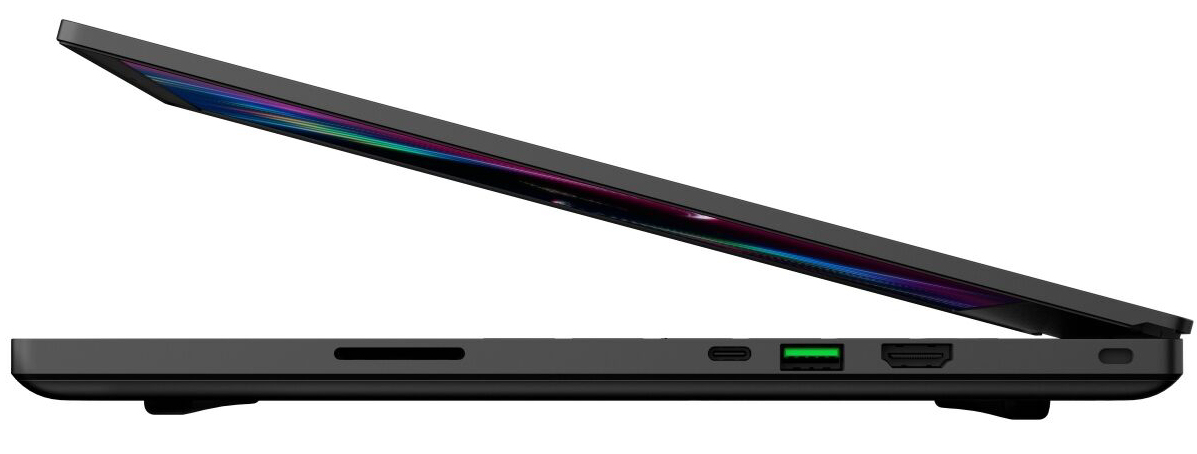
Connessioni - la USB Type-C 3.2 Gen 2 sostituisce la Mini DisplayPort
In termini di connessioni, un po' è cambiato rispetto al Blade 15 del 2019. La Mini DisplayPort è stata sostituita da una porta USB Type-C 3.2 Gen 2 (DisplayPort, Power Delivery). Le tre porte USB Type-A ora funzionano anche secondo lo standard USB 3.2 Gen 2. Il portatile ora ha anche un lettore di schede di memoria (SD).
| SD Card Reader | |
| average JPG Copy Test (av. of 3 runs) | |
| Gigabyte Aero 15 OLED XB-8DE51B0SP (Toshiba Exceria Pro SDXC 64 GB UHS-II) | |
| Razer Blade 15 RTX 2080 Super Max-Q (Toshiba Exceria Pro SDXC 64 GB UHS-II) | |
| MSI GE66 Raider 10SFS (Toshiba Exceria Pro SDXC 64 GB UHS-II) | |
| Media della classe Gaming (20.9 - 210, n=54, ultimi 2 anni) | |
| Schenker XMG Neo 15 XNE15M19 (Toshiba Exceria Pro SDXC 64 GB UHS-II) | |
| maximum AS SSD Seq Read Test (1GB) | |
| Gigabyte Aero 15 OLED XB-8DE51B0SP (Toshiba Exceria Pro SDXC 64 GB UHS-II) | |
| Razer Blade 15 RTX 2080 Super Max-Q (Toshiba Exceria Pro SDXC 64 GB UHS-II) | |
| MSI GE66 Raider 10SFS (Toshiba Exceria Pro SDXC 64 GB UHS-II) | |
| Media della classe Gaming (25.5 - 261, n=51, ultimi 2 anni) | |
| Schenker XMG Neo 15 XNE15M19 (Toshiba Exceria Pro SDXC 64 GB UHS-II) | |


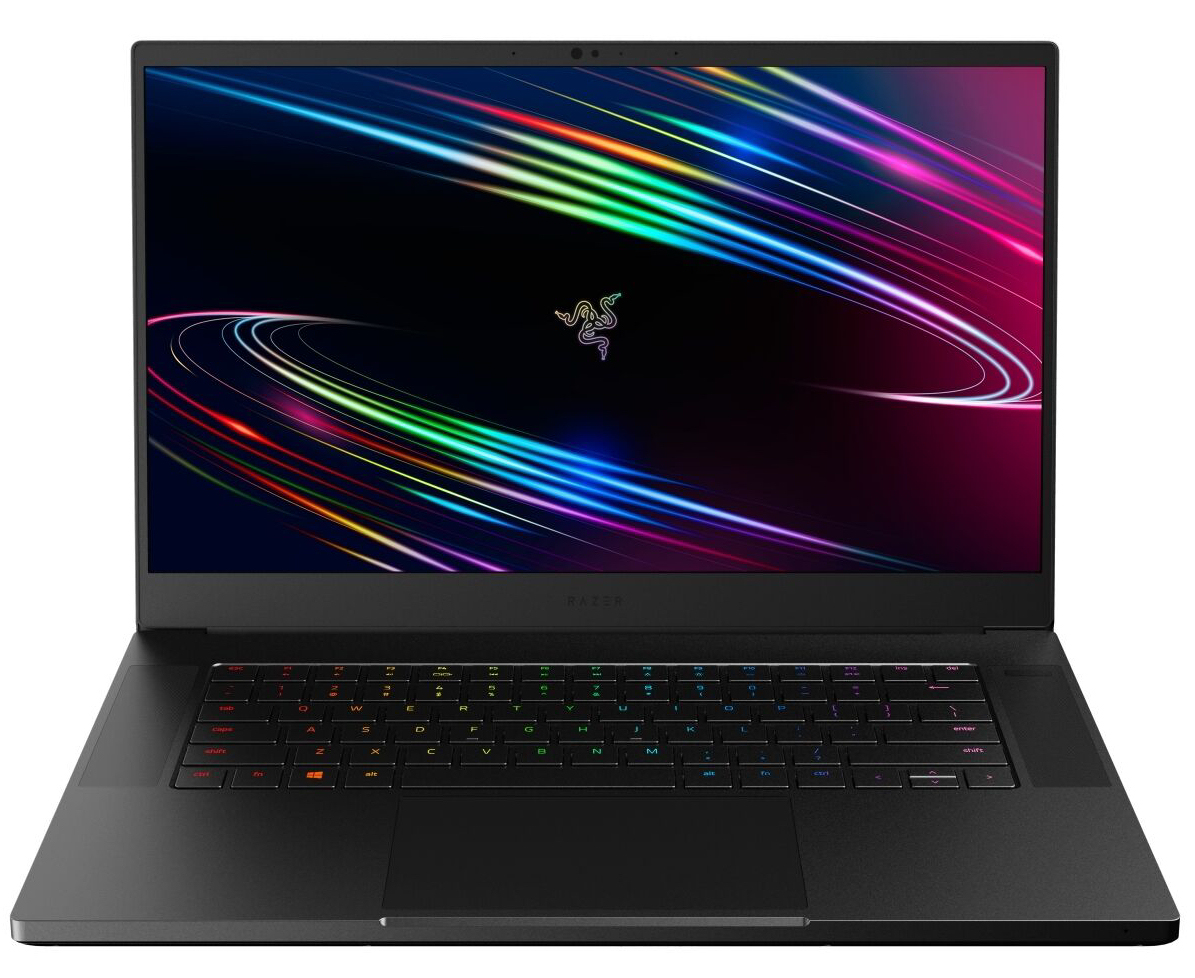
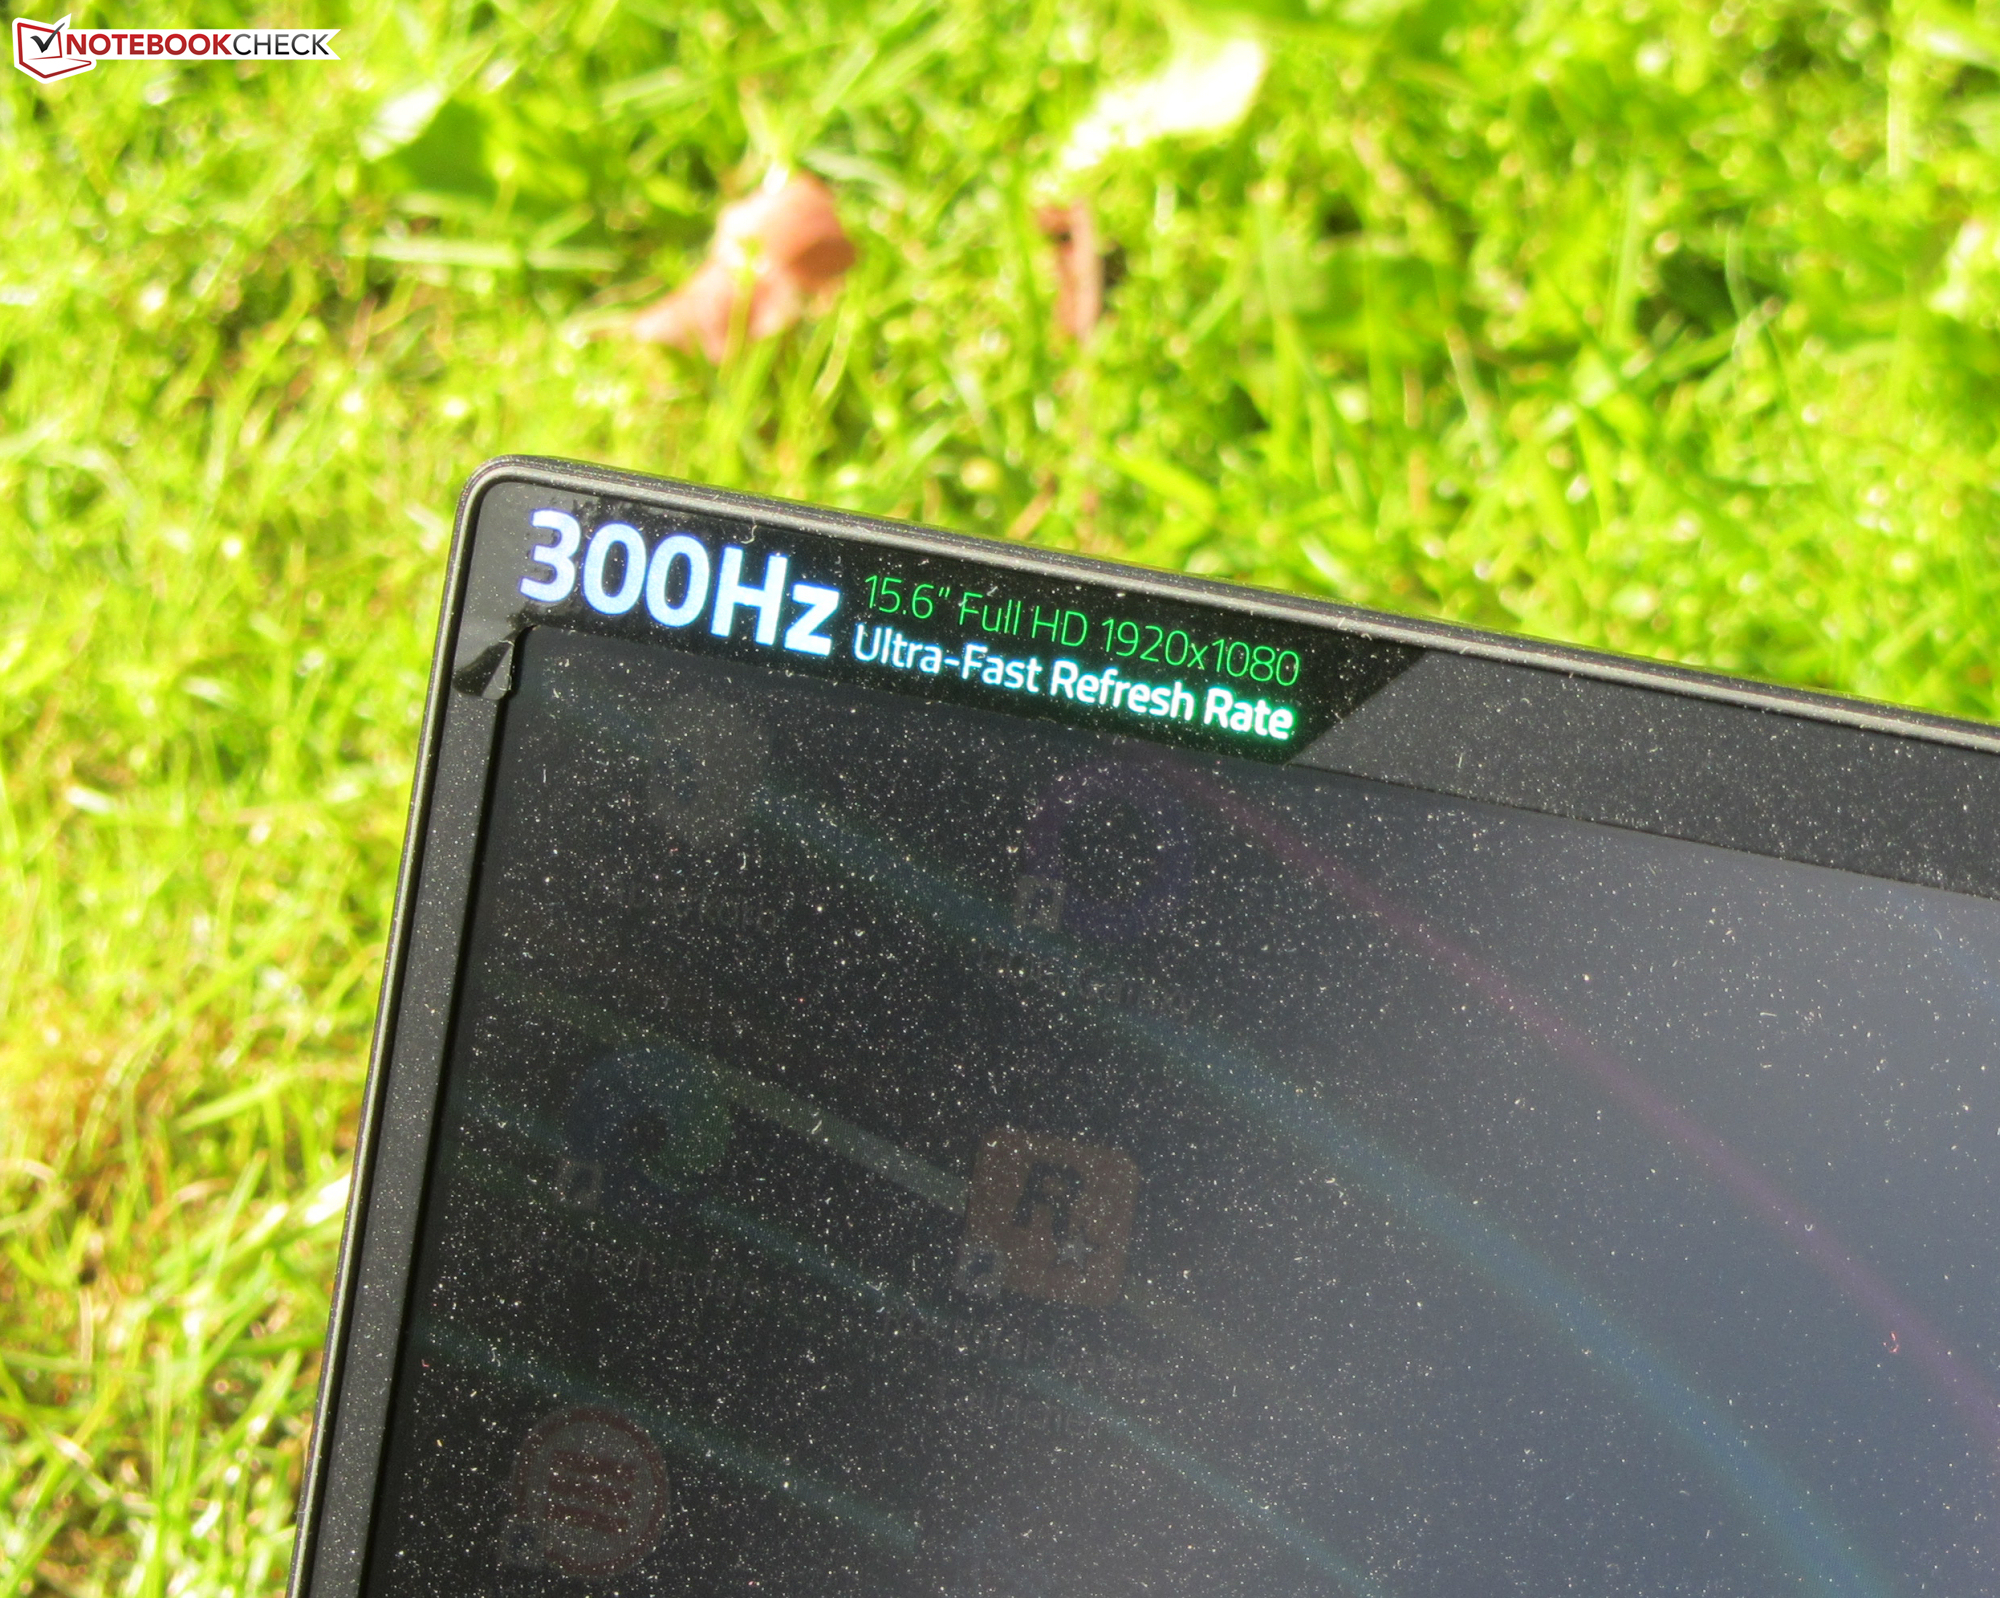
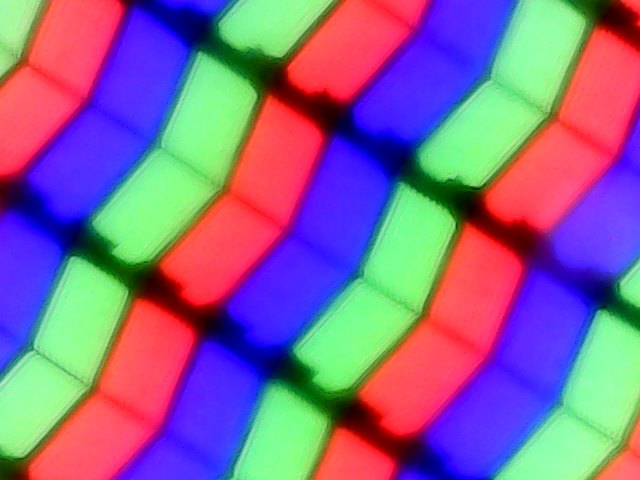
Display - 300 Hz IPS
Il display opaco da 15,6" ha una risoluzione nativa di 1920x1080 pixel. È un pannello a 300 Hz con tempi di risposta rapidi. La luminosità (327,8 cd/m²) e il contrasto (1.218:1) soddisfano gli obiettivi ideali. Positivo: Lo schermo non mostra alcun sfarfallio PWM.

| |||||||||||||||||||||||||
Distribuzione della luminosità: 89 %
Al centro con la batteria: 347 cd/m²
Contrasto: 1218:1 (Nero: 0.285 cd/m²)
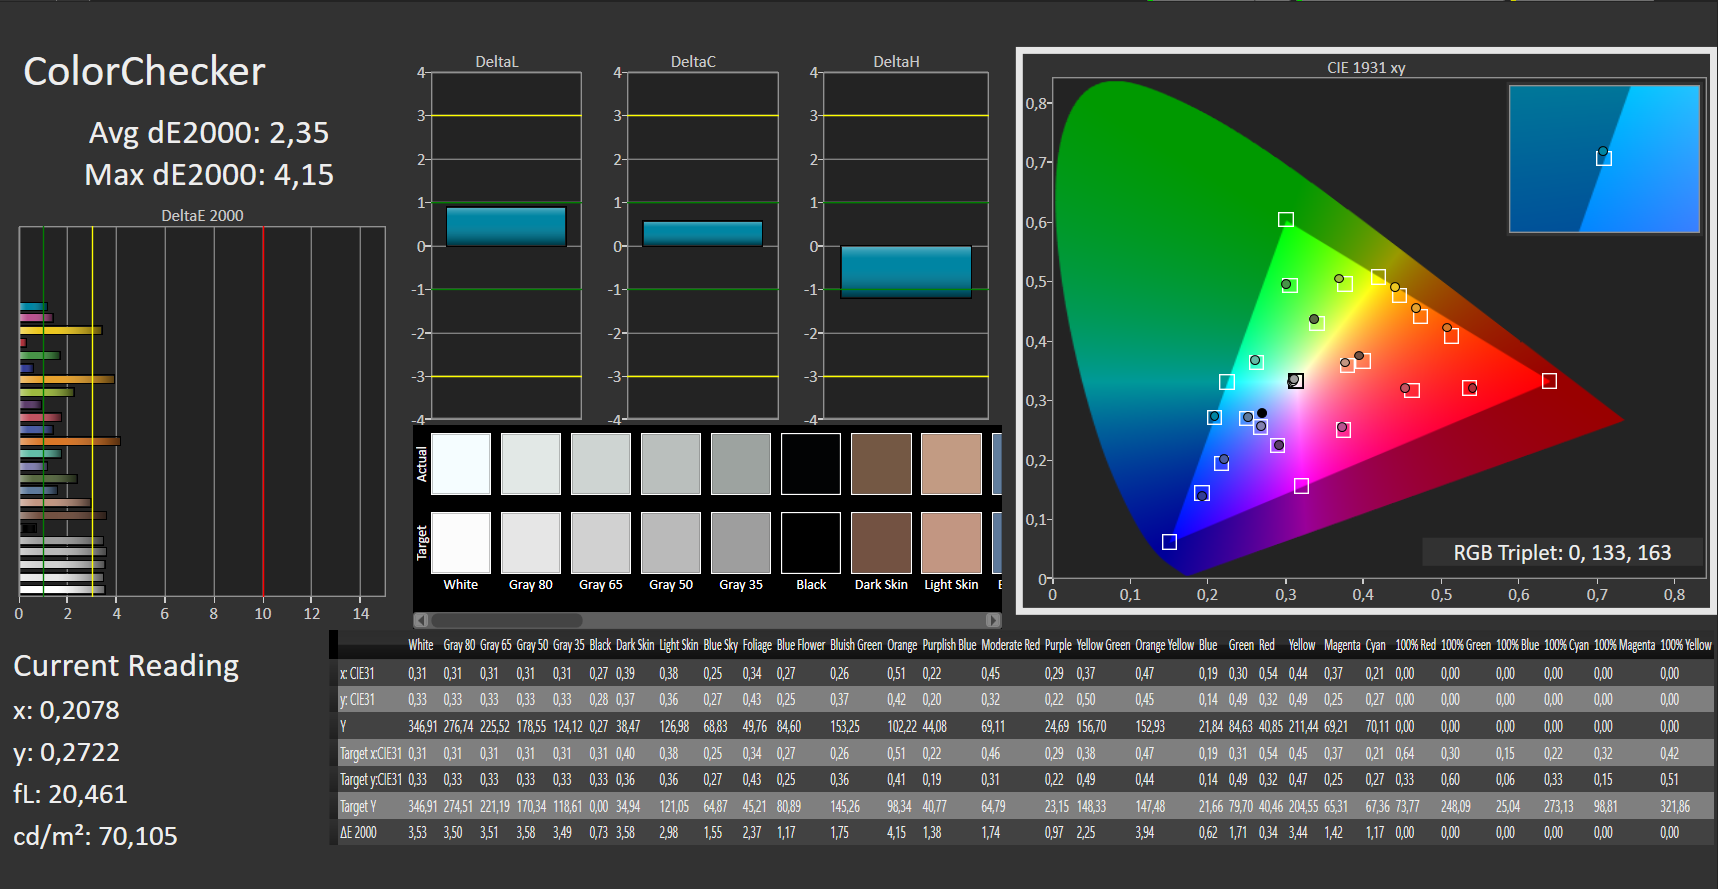
ΔE ColorChecker Calman: 2.35 | ∀{0.5-29.43 Ø4.73}
calibrated: 1.16
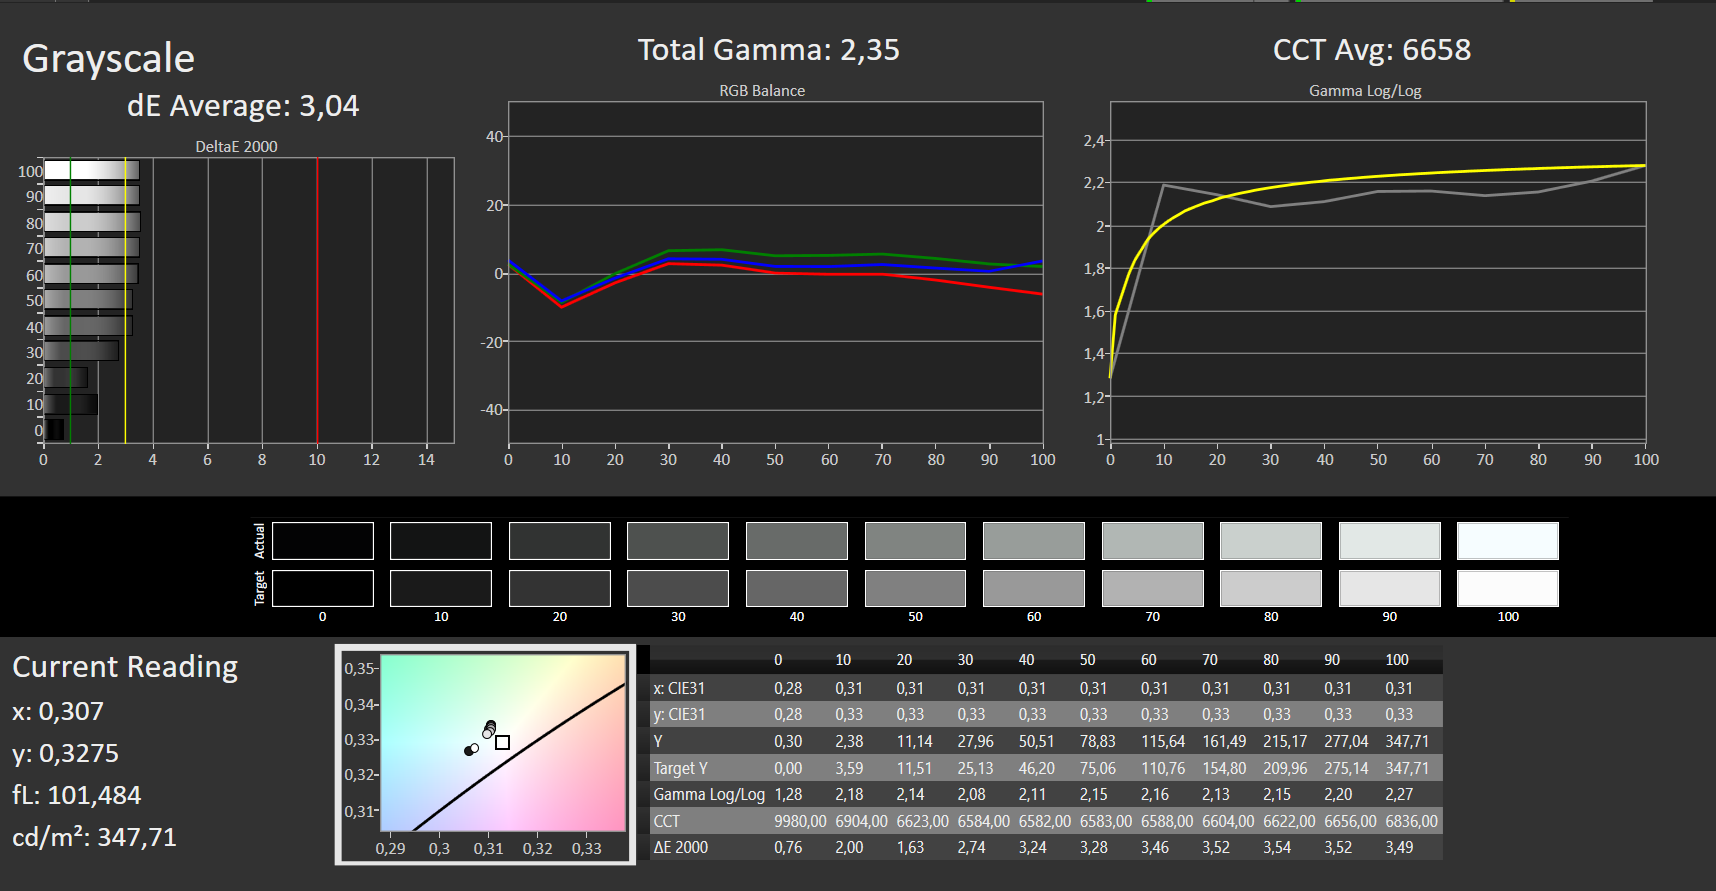
ΔE Greyscale Calman: 3.04 | ∀{0.09-98 Ø4.97}
99% sRGB (Argyll 1.6.3 3D)
65% AdobeRGB 1998 (Argyll 1.6.3 3D)
71.4% AdobeRGB 1998 (Argyll 3D)
99% sRGB (Argyll 3D)
70.2% Display P3 (Argyll 3D)
Gamma: 2.35
CCT: 6658 K
| Razer Blade 15 RTX 2080 Super Max-Q AU Optronics B156HAN12.0, IPS, 1920x1080, 15.6" | Razer Blade 15 RTX 2080 Max-Q Sharp LQ156M1JW03 (SHP14C5), IPS, 1920x1080, 15.6" | Asus Zephyrus S GX531GX AU Optronics B156HAN08.2, IPS, 1920x1080, 15.6" | Gigabyte Aero 15 OLED XB-8DE51B0SP Samsung SDCA029, OLED, 3840x2160, 15.6" | MSI GE66 Raider 10SFS Sharp LQ156M1JW03 (SHP14C5), IPS-Level, 1920x1080, 15.6" | Schenker XMG Neo 15 XNE15M19 NV156FHM-N4G (BOE084D), IPS, 1920x1080, 15.6" | |
|---|---|---|---|---|---|---|
| Display | -3% | -7% | 27% | -2% | -9% | |
| Display P3 Coverage (%) | 70.2 | 66.9 -5% | 65.6 -7% | 99.9 42% | 68 -3% | 64 -9% |
| sRGB Coverage (%) | 99 | 98.1 -1% | 92.2 -7% | 100 1% | 99 0% | 90.3 -9% |
| AdobeRGB 1998 Coverage (%) | 71.4 | 68.5 -4% | 66.9 -6% | 98.2 38% | 69.8 -2% | 65.4 -8% |
| Response Times | -65% | -12% | 72% | -95% | -47% | |
| Response Time Grey 50% / Grey 80% * (ms) | 6 ? | 12.8 ? -113% | 7 ? -17% | 2.2 ? 63% | 16.4 ? -173% | 9.6 ? -60% |
| Response Time Black / White * (ms) | 9 ? | 10.4 ? -16% | 9.6 ? -7% | 1.8 ? 80% | 10.4 ? -16% | 12 ? -33% |
| PWM Frequency (Hz) | 23810 ? | 60 ? | 23580 ? | |||
| Screen | 0% | -22% | 2% | 9% | -19% | |
| Brightness middle (cd/m²) | 347 | 293 -16% | 323.6 -7% | 385 11% | 291 -16% | 313 -10% |
| Brightness (cd/m²) | 328 | 270 -18% | 315 -4% | 390 19% | 278 -15% | 295 -10% |
| Brightness Distribution (%) | 89 | 87 -2% | 91 2% | 93 4% | 91 2% | 89 0% |
| Black Level * (cd/m²) | 0.285 | 0.29 -2% | 0.29 -2% | 0.25 12% | 0.3 -5% | |
| Contrast (:1) | 1218 | 1010 -17% | 1116 -8% | 1164 -4% | 1043 -14% | |
| Colorchecker dE 2000 * | 2.35 | 1.69 28% | 3.31 -41% | 2.46 -5% | 1.19 49% | 3.33 -42% |
| Colorchecker dE 2000 max. * | 4.15 | 3.37 19% | 5.74 -38% | 4.01 3% | 3.04 27% | 6.25 -51% |
| Colorchecker dE 2000 calibrated * | 1.16 | 1.24 -7% | 2.73 -135% | 2.6 -124% | 1.77 -53% | |
| Greyscale dE 2000 * | 3.04 | 2.3 24% | 2.9 5% | 1.39 54% | 1.9 37% | 3.1 -2% |
| Gamma | 2.35 94% | 2.3 96% | 2.29 96% | 2.31 95% | 2.216 99% | 2.51 88% |
| CCT | 6658 98% | 6758 96% | 6765 96% | 6395 102% | 7018 93% | 6930 94% |
| Color Space (Percent of AdobeRGB 1998) (%) | 65 | 63 -3% | 59.7 -8% | 98 51% | 70 8% | 59 -9% |
| Color Space (Percent of sRGB) (%) | 99 | 98.5 -1% | 91.8 -7% | 100 1% | 92 -7% | 90 -9% |
| Media totale (Programma / Settaggio) | -23% /
-8% | -14% /
-18% | 34% /
17% | -29% /
-7% | -25% /
-20% |
* ... Meglio usare valori piccoli
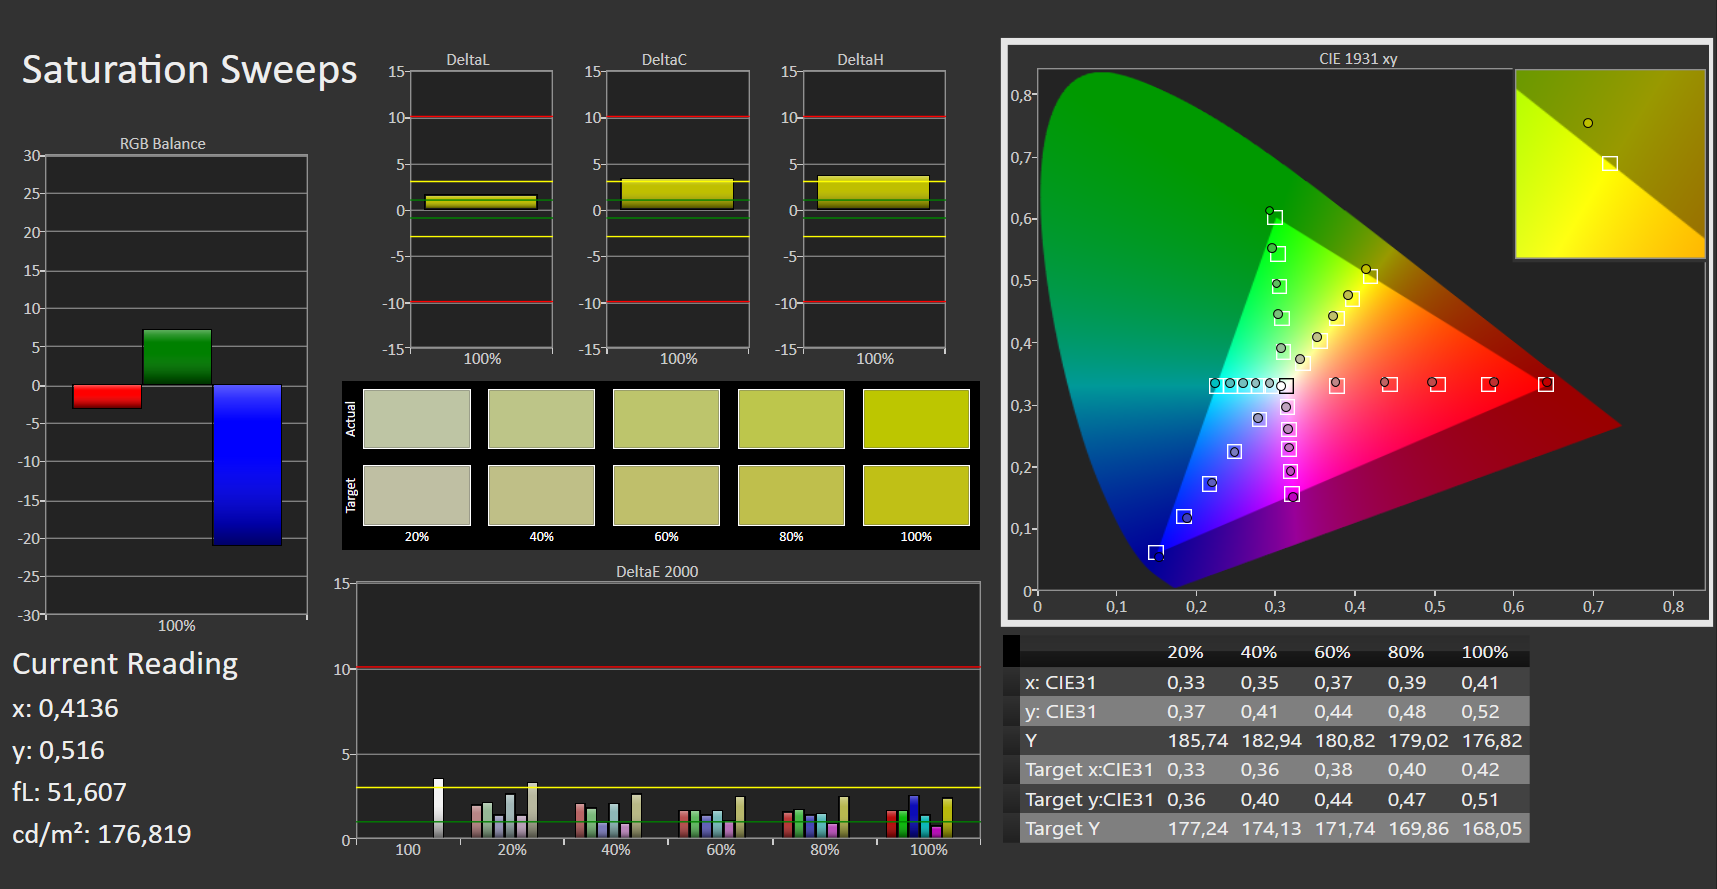
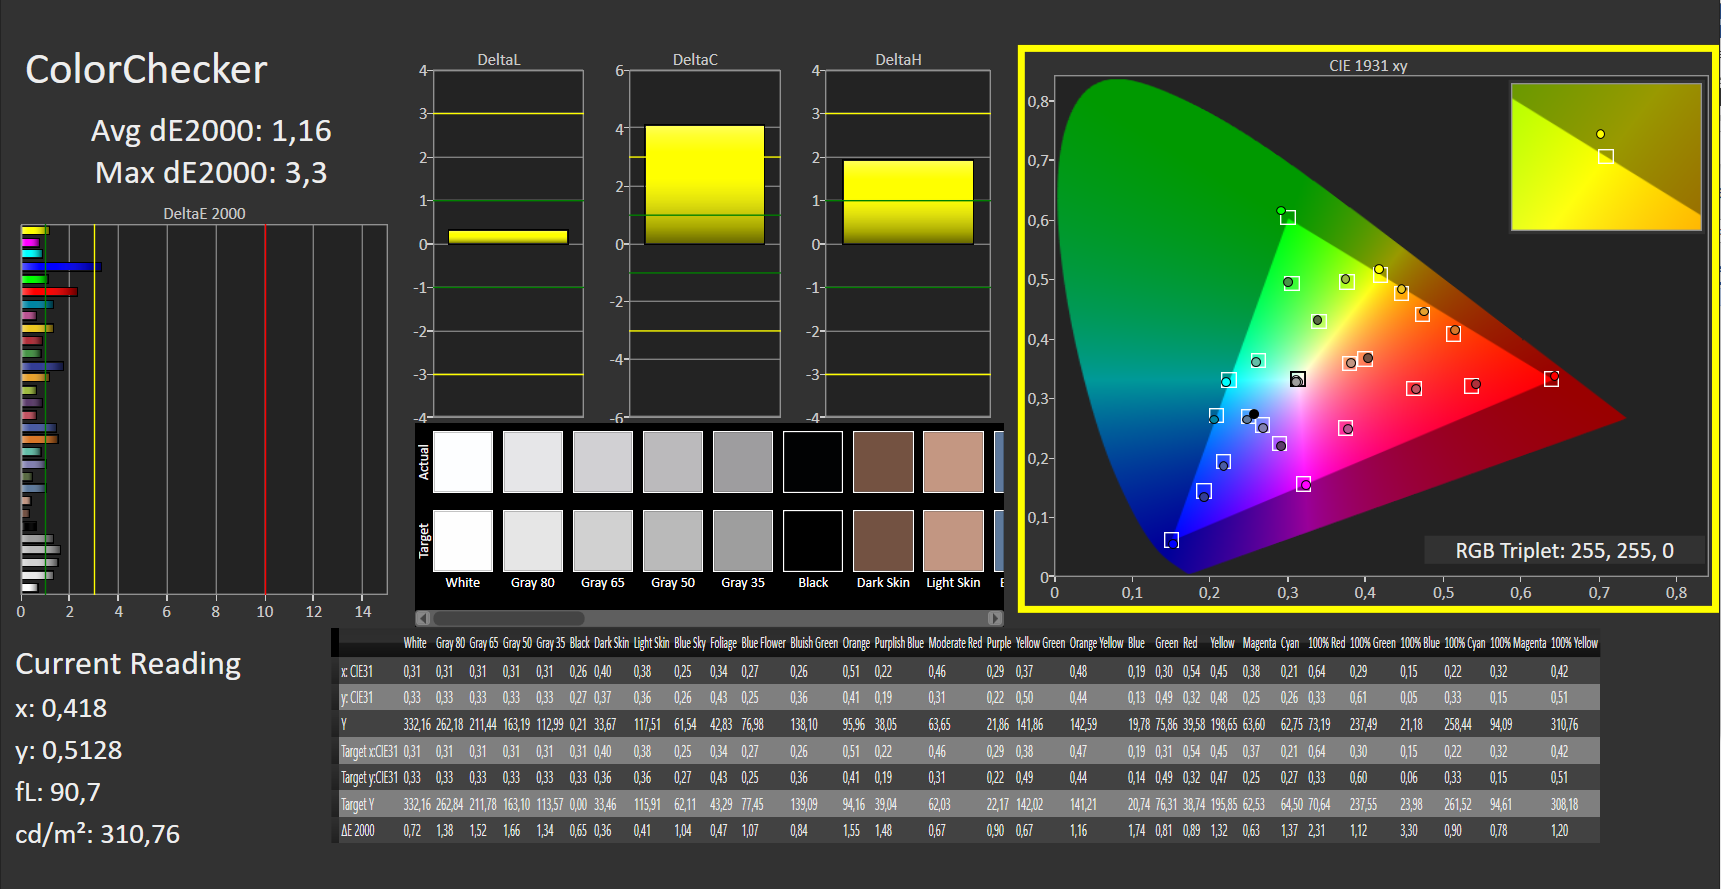
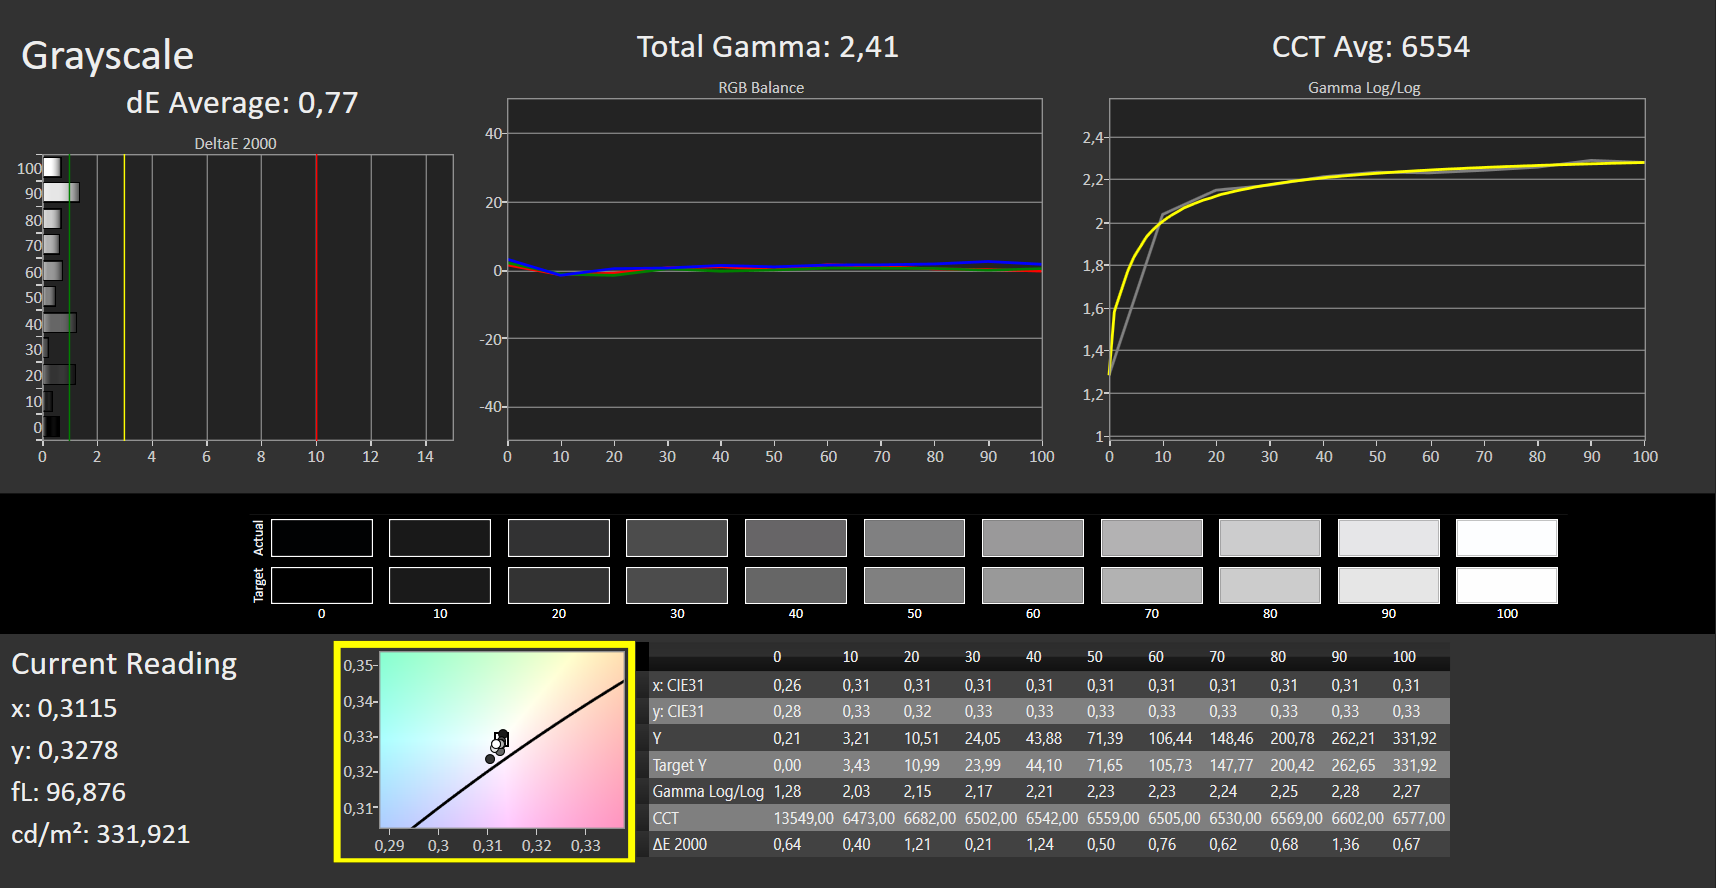
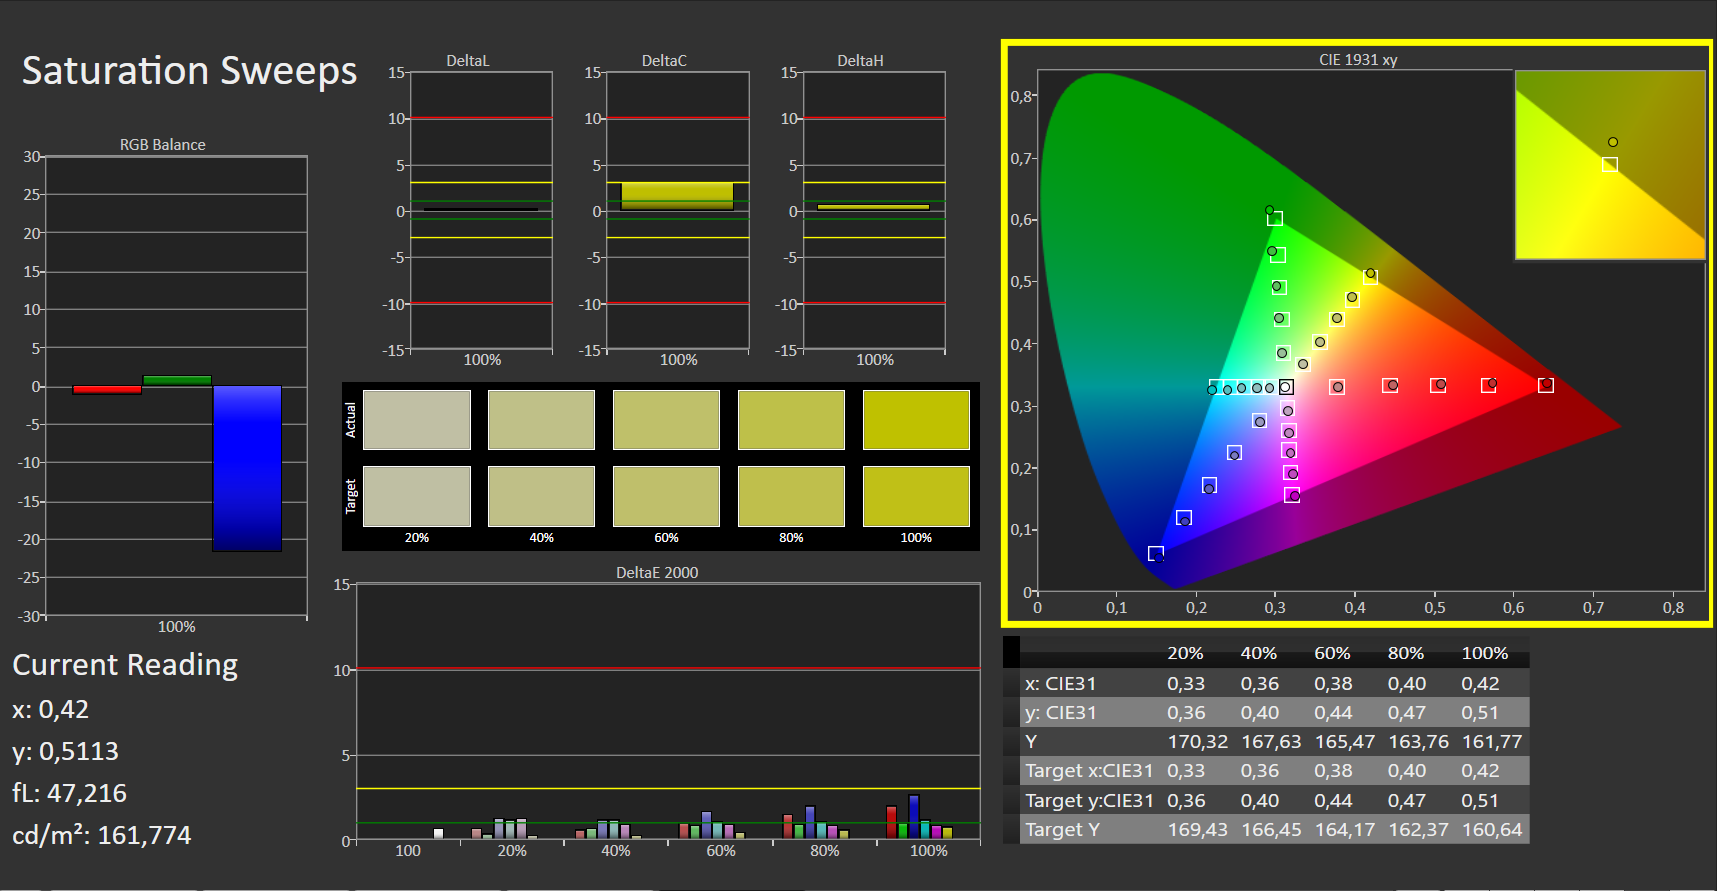
Il display mostra subito una ottima riproduzione dei colori. Con una deviazione di colore Delta E 2000 di poco inferiore a 2,4, il target (Delta E inferiore a 3) è raggiunto. Il display non soffre di una sfumatura blu. Inoltre, la calibrazione prevede miglioramenti in termini di riproduzione del colore. Di conseguenza, la deviazione del colore è ridotta a 1,16, e le scale di grigio sono riprodotte in modo più equilibrato. Lo spazio colore AdobeRGB (65%) non è completamente coperto. La situazione appare però migliore con lo spazio colore sRGB (99%).
Tempi di risposta del Display
| ↔ Tempi di risposta dal Nero al Bianco | ||
|---|---|---|
| 9 ms ... aumenta ↗ e diminuisce ↘ combinato | ↗ 5 ms Incremento | 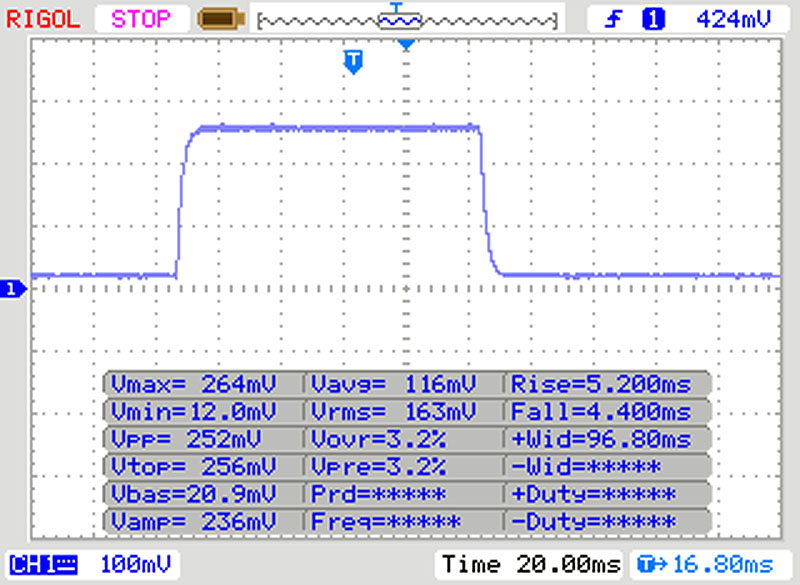 |
| ↘ 4 ms Calo | ||
| Lo schermo mostra veloci tempi di risposta durante i nostri tests e dovrebbe esere adatto al gaming In confronto, tutti i dispositivi di test variano da 0.1 (minimo) a 240 (massimo) ms. » 25 % di tutti i dispositivi è migliore. Questo significa che i tempi di risposta rilevati sono migliori rispettto alla media di tutti i dispositivi testati (19.9 ms). | ||
| ↔ Tempo di risposta dal 50% Grigio all'80% Grigio | ||
| 6 ms ... aumenta ↗ e diminuisce ↘ combinato | ↗ 3 ms Incremento | 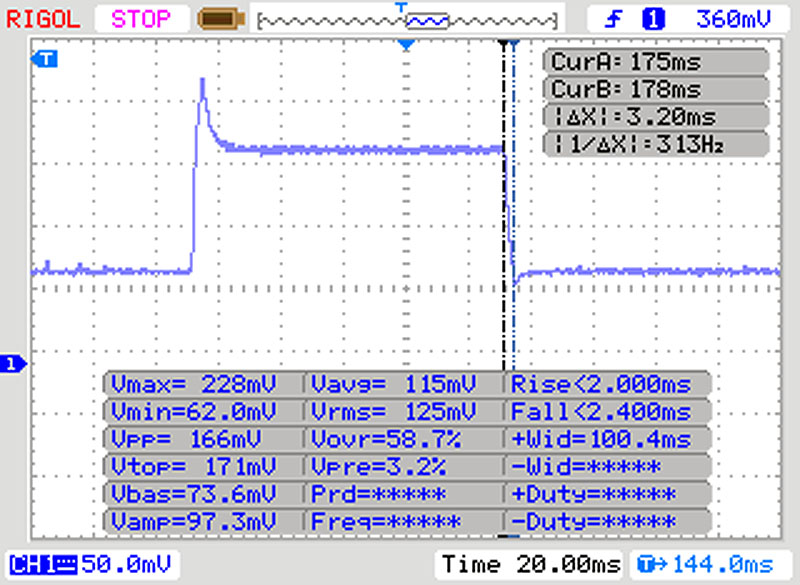 |
| ↘ 3 ms Calo | ||
| Lo schermo ha mostrato valori di risposta molto veloci nei nostri tests ed è molto adatto per i gaming veloce. In confronto, tutti i dispositivi di test variano da 0.165 (minimo) a 636 (massimo) ms. » 18 % di tutti i dispositivi è migliore. Questo significa che i tempi di risposta rilevati sono migliori rispettto alla media di tutti i dispositivi testati (31.1 ms). | ||
Sfarfallio dello schermo / PWM (Pulse-Width Modulation)
| flickering dello schermo / PWM non rilevato | 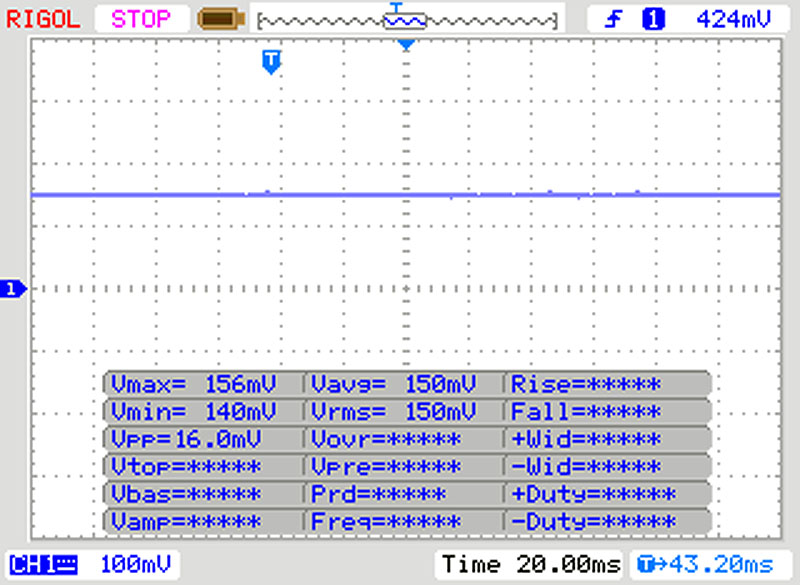 | ||
In confronto: 52 % di tutti i dispositivi testati non utilizza PWM per ridurre la luminosita' del display. Se è rilevato PWM, una media di 7794 (minimo: 5 - massimo: 343500) Hz è stata rilevata. | |||
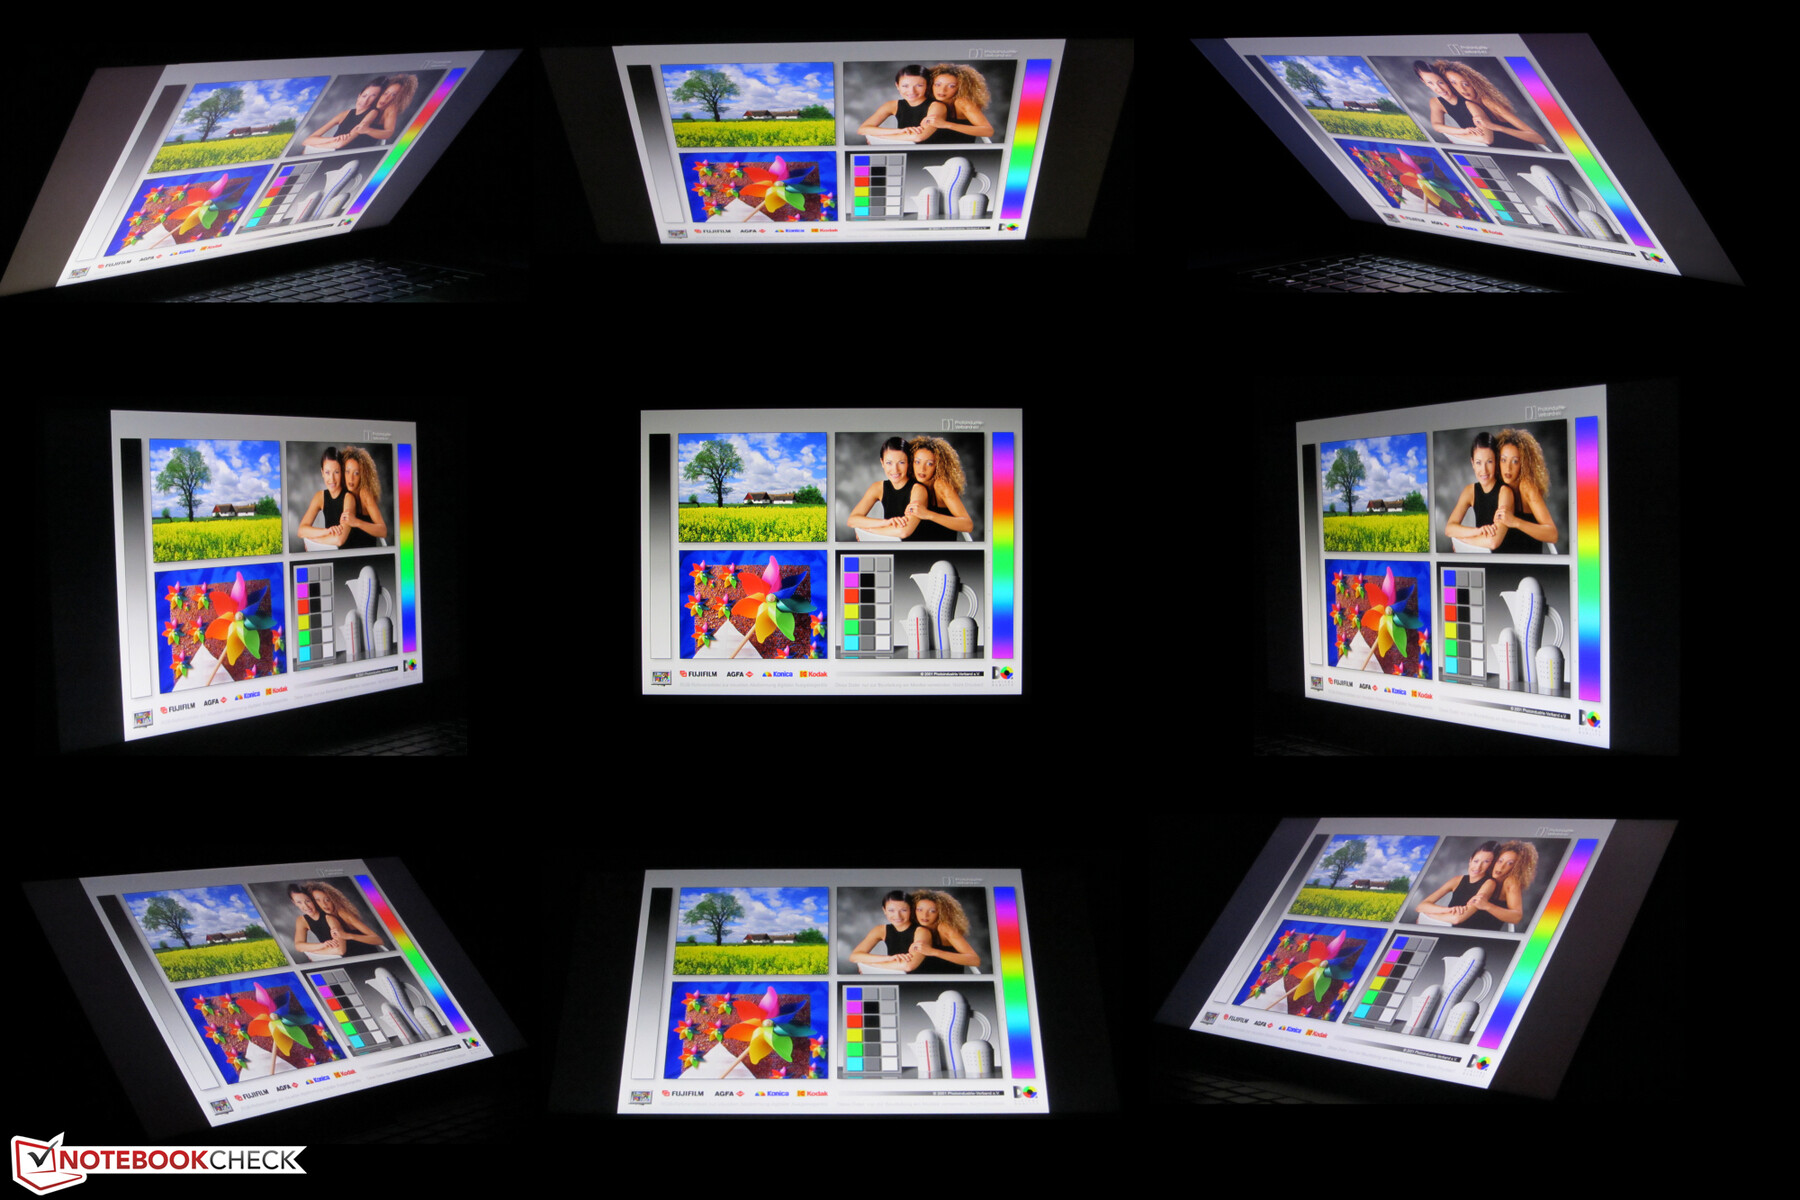
Questo computer portatile è dotato di un pannello IPS con angolo di visualizzazione stabile. Di conseguenza, lo schermo può essere letto da qualsiasi posizione. All'aperto, la lettura dello schermo è possibile quando il sole non è troppo splendente.

Prestazioni - il Blade offre nuove opzioni Boost
Con il Blade 15 Advanced Model 2020, Razer ha un laptop da 15,6 pollici gaming nella sua gamma che gestisce ogni gioco moderno senza problemi sullo schermo e fa anche una bella figura in tutte le altre aree di applicazione. Il nostro dispositivo di prova vi costerà circa 3.300 euro (~$3.876).
Condizioni di test
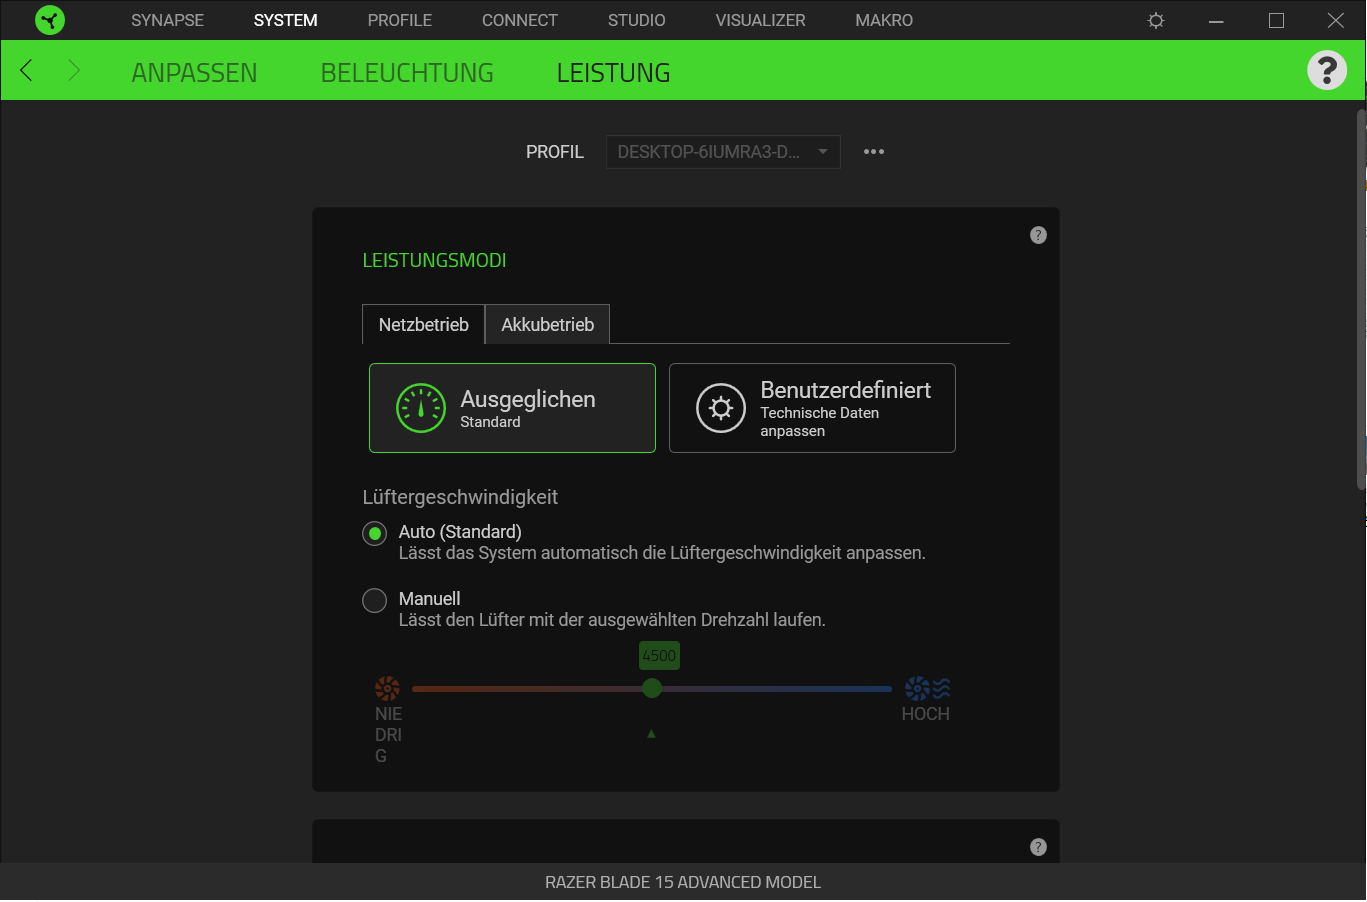
Il software Razer Synapse preinstallato fornisce opzioni per regolare il controllo della ventola e le prestazioni della CPU o della GPU. Abbiamo condotto il nostro test con il controllo automatico della ventola e la modalità di prestazione "Balanced".
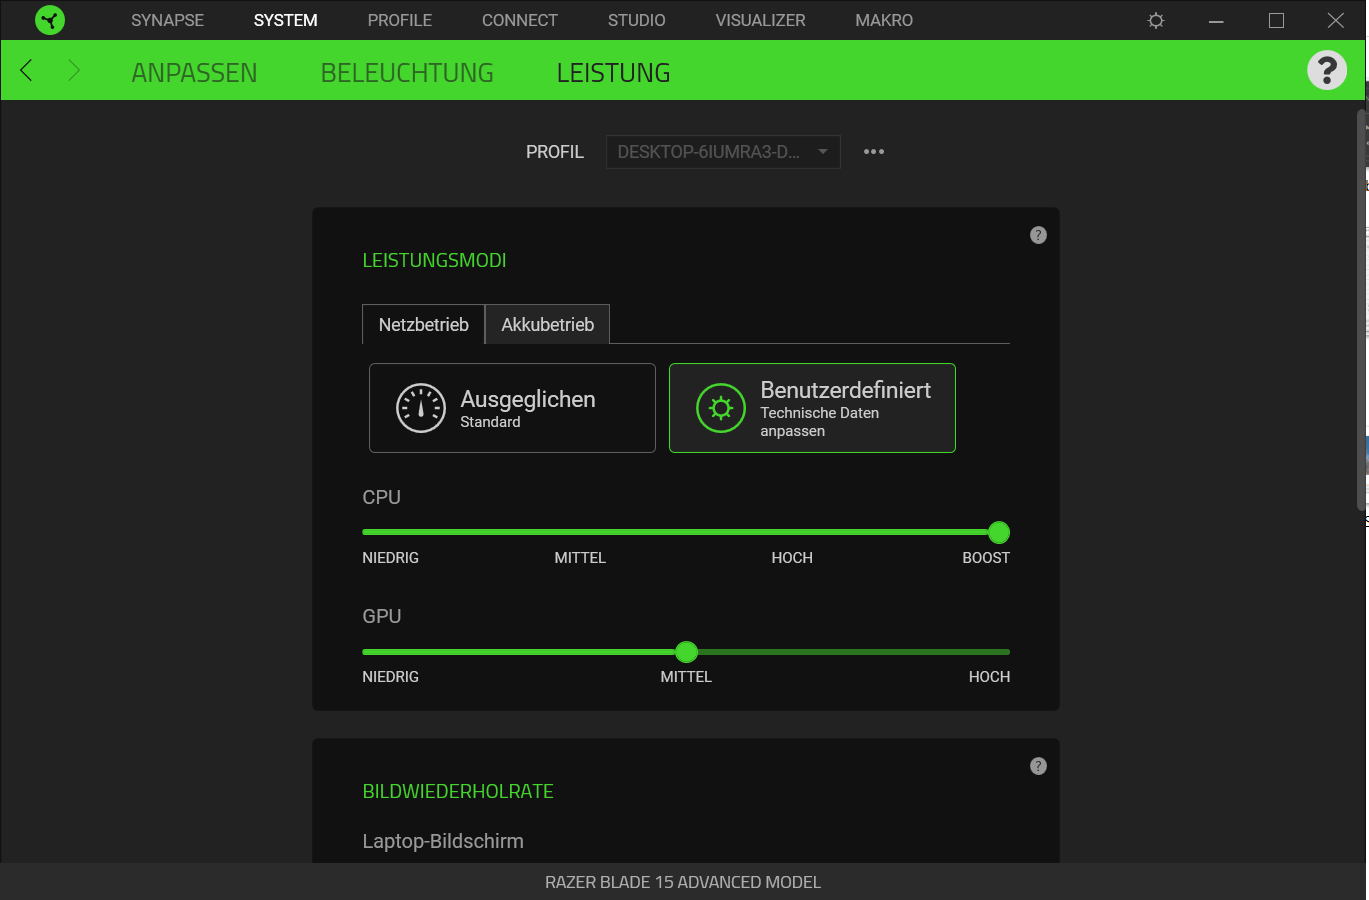
Il livello delle prestazioni della CPU o della GPU può anche essere impostato manualmente. Le opzioni "Basso", "Medio" e "Alto" sono disponibili in questo caso. La nuova versione del software Synapse rilasciata durante il nostro test introduce inoltre la modalità di prestazione della CPU "Boost".
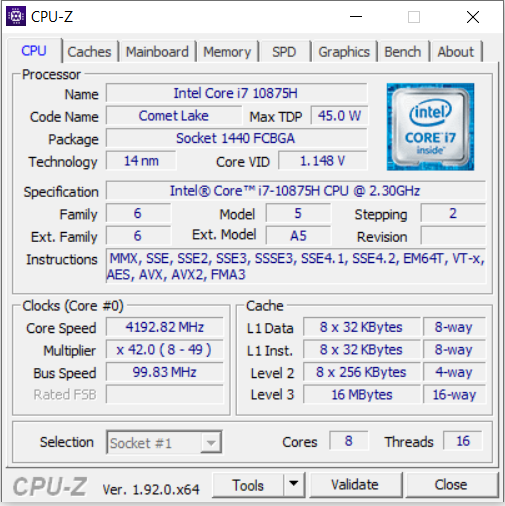
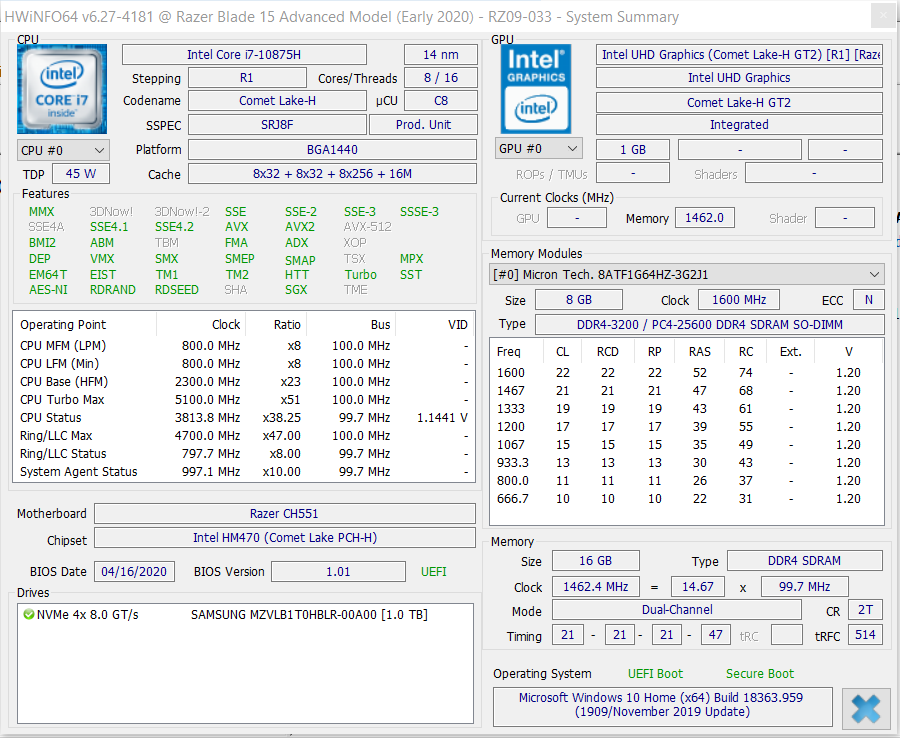
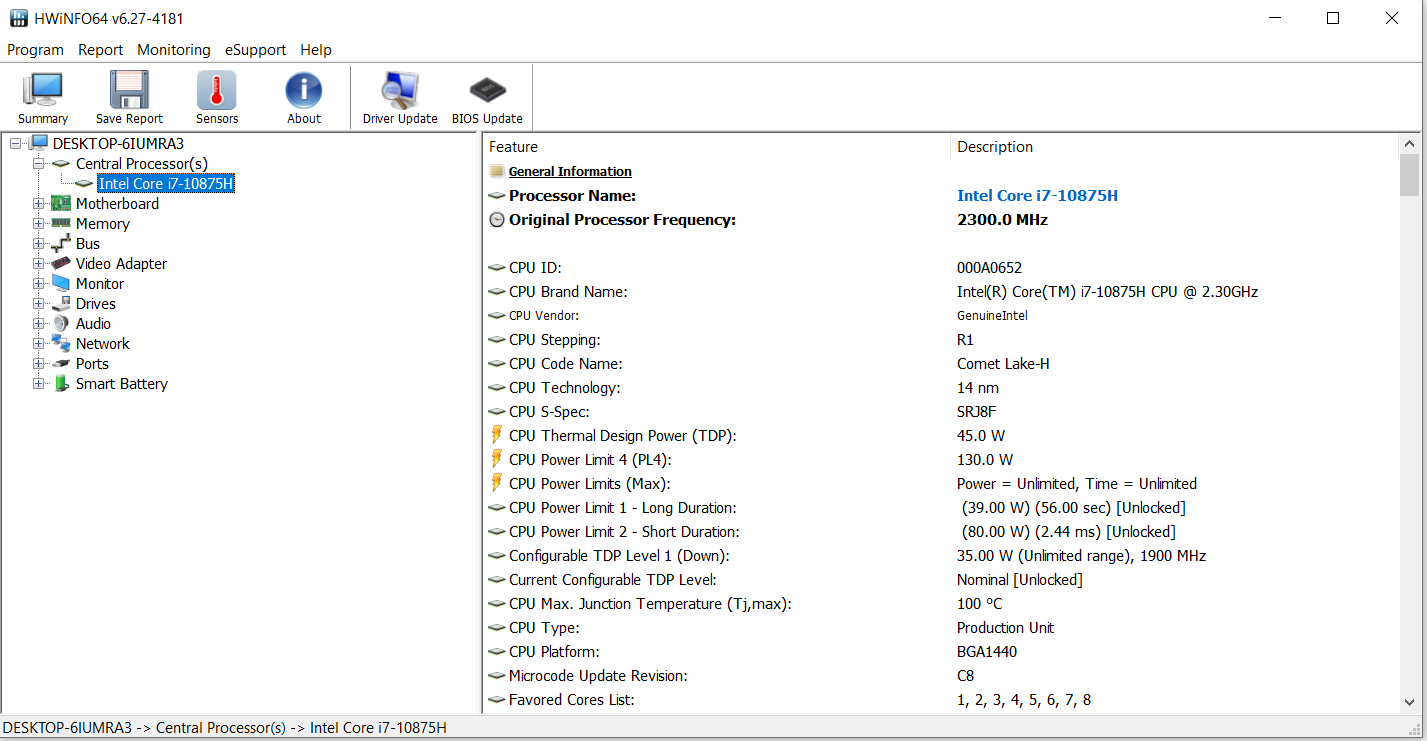
Processore
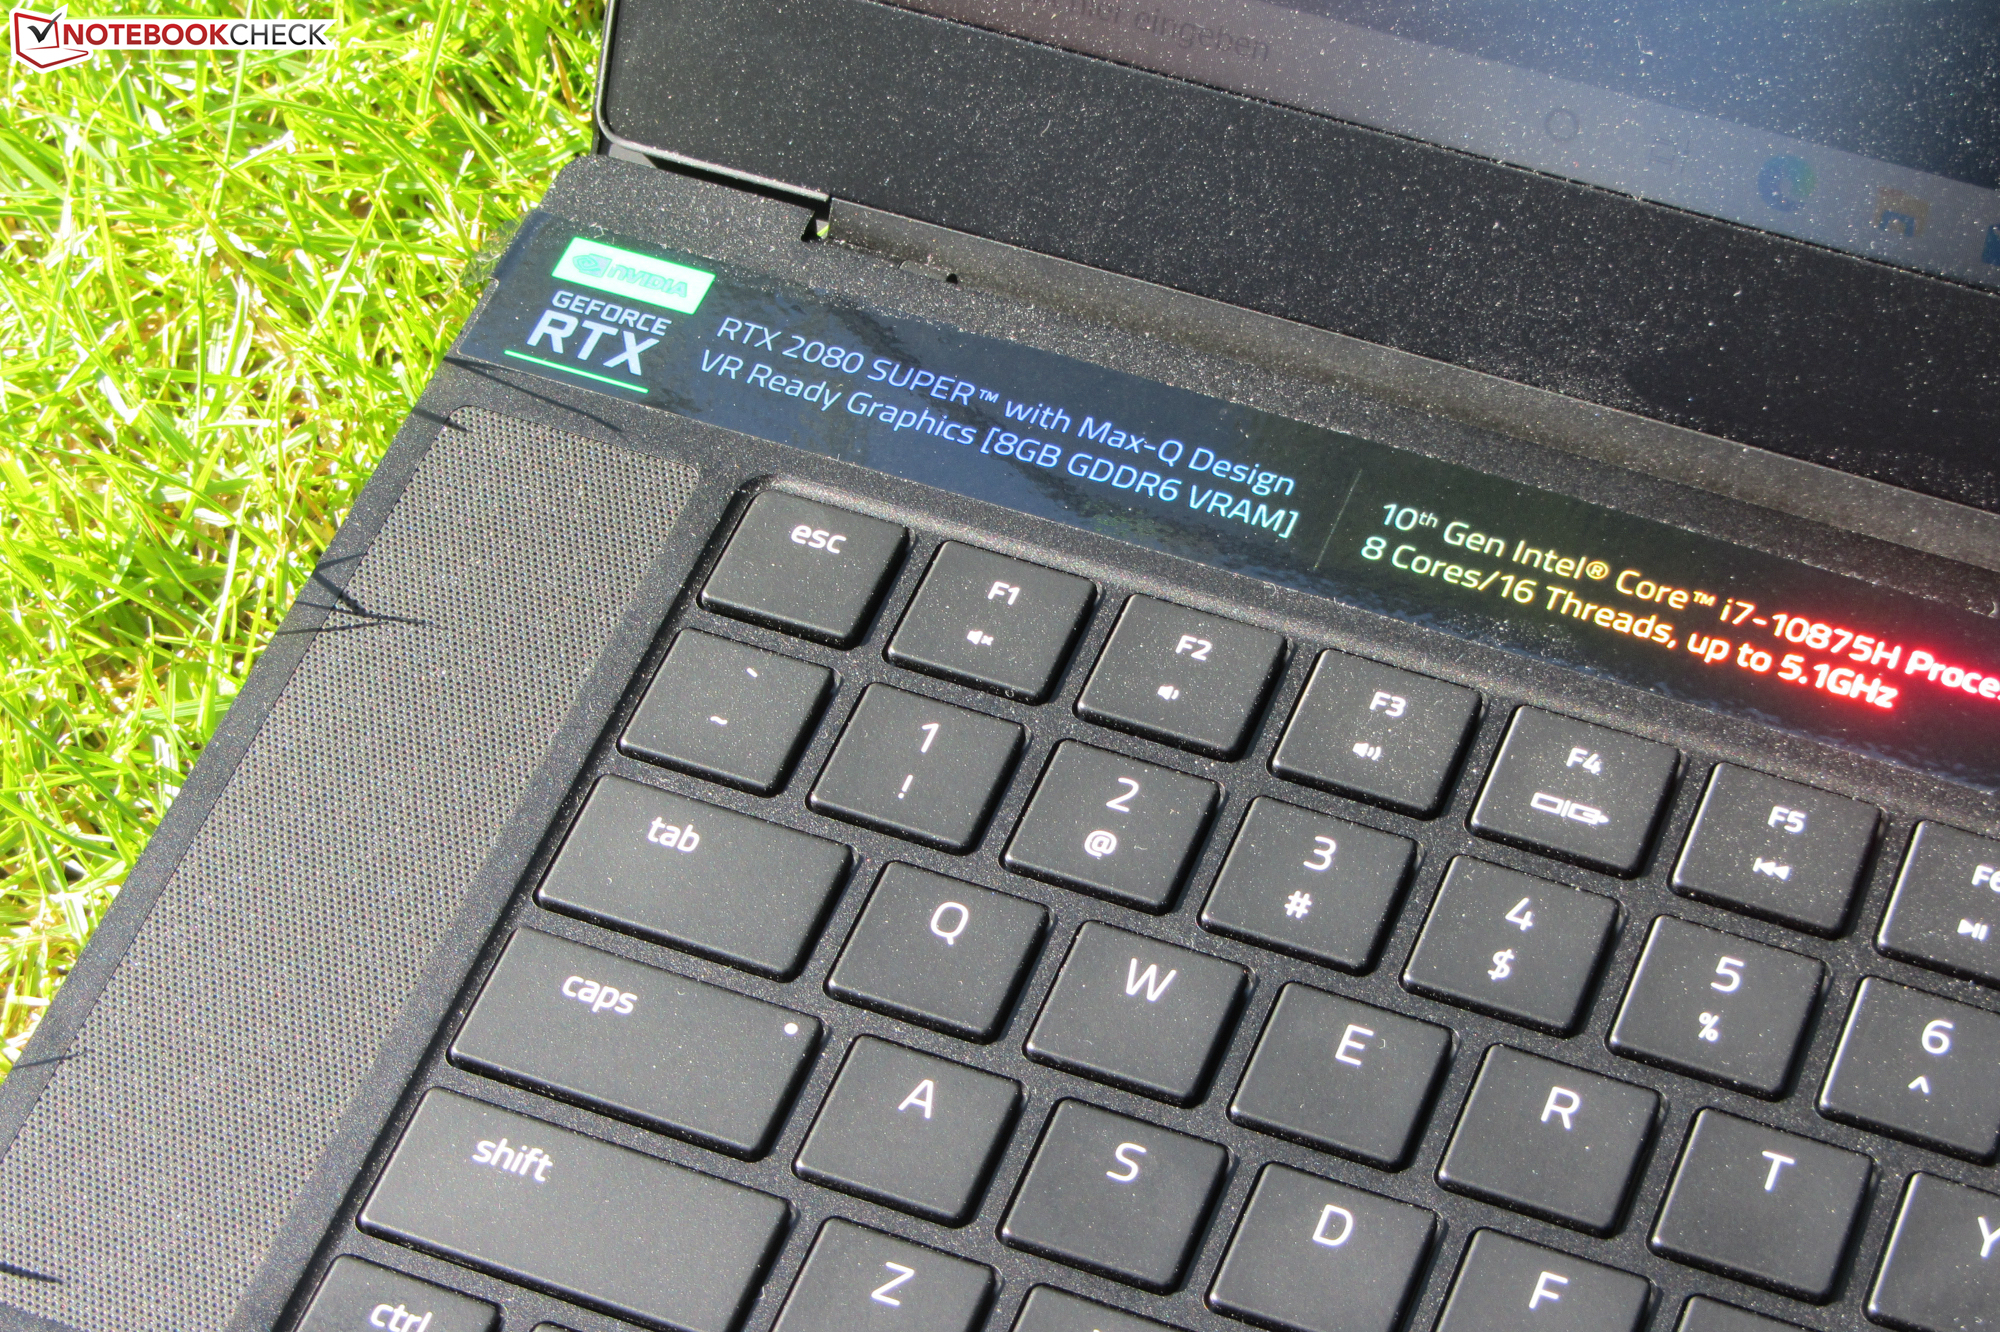
Il processore integrato Core i7-10875H octa-core è della generazione Comet Lake di Intel. La CPU funziona ad una velocità di base di 2,3 GHz. Inoltre, la velocità di clock può essere aumentata a 4,3 GHz (otto cores) o a 5,1 GHz (un core) tramite Turbo. È supportato l'Hyper-Threading (due fili per core).
Il processore esegue il test multithreading del benchmark Cinebench R15 a 2,5 - 3 GHz. Il test single-thread viene eseguito a 3,6 - 4,9 GHz. Inoltre, le velocità sono rispettivamente di 2,3 GHz (multithread) e da 2,2 a 3,6 GHz (single-thread) con alimentazione a batteria.
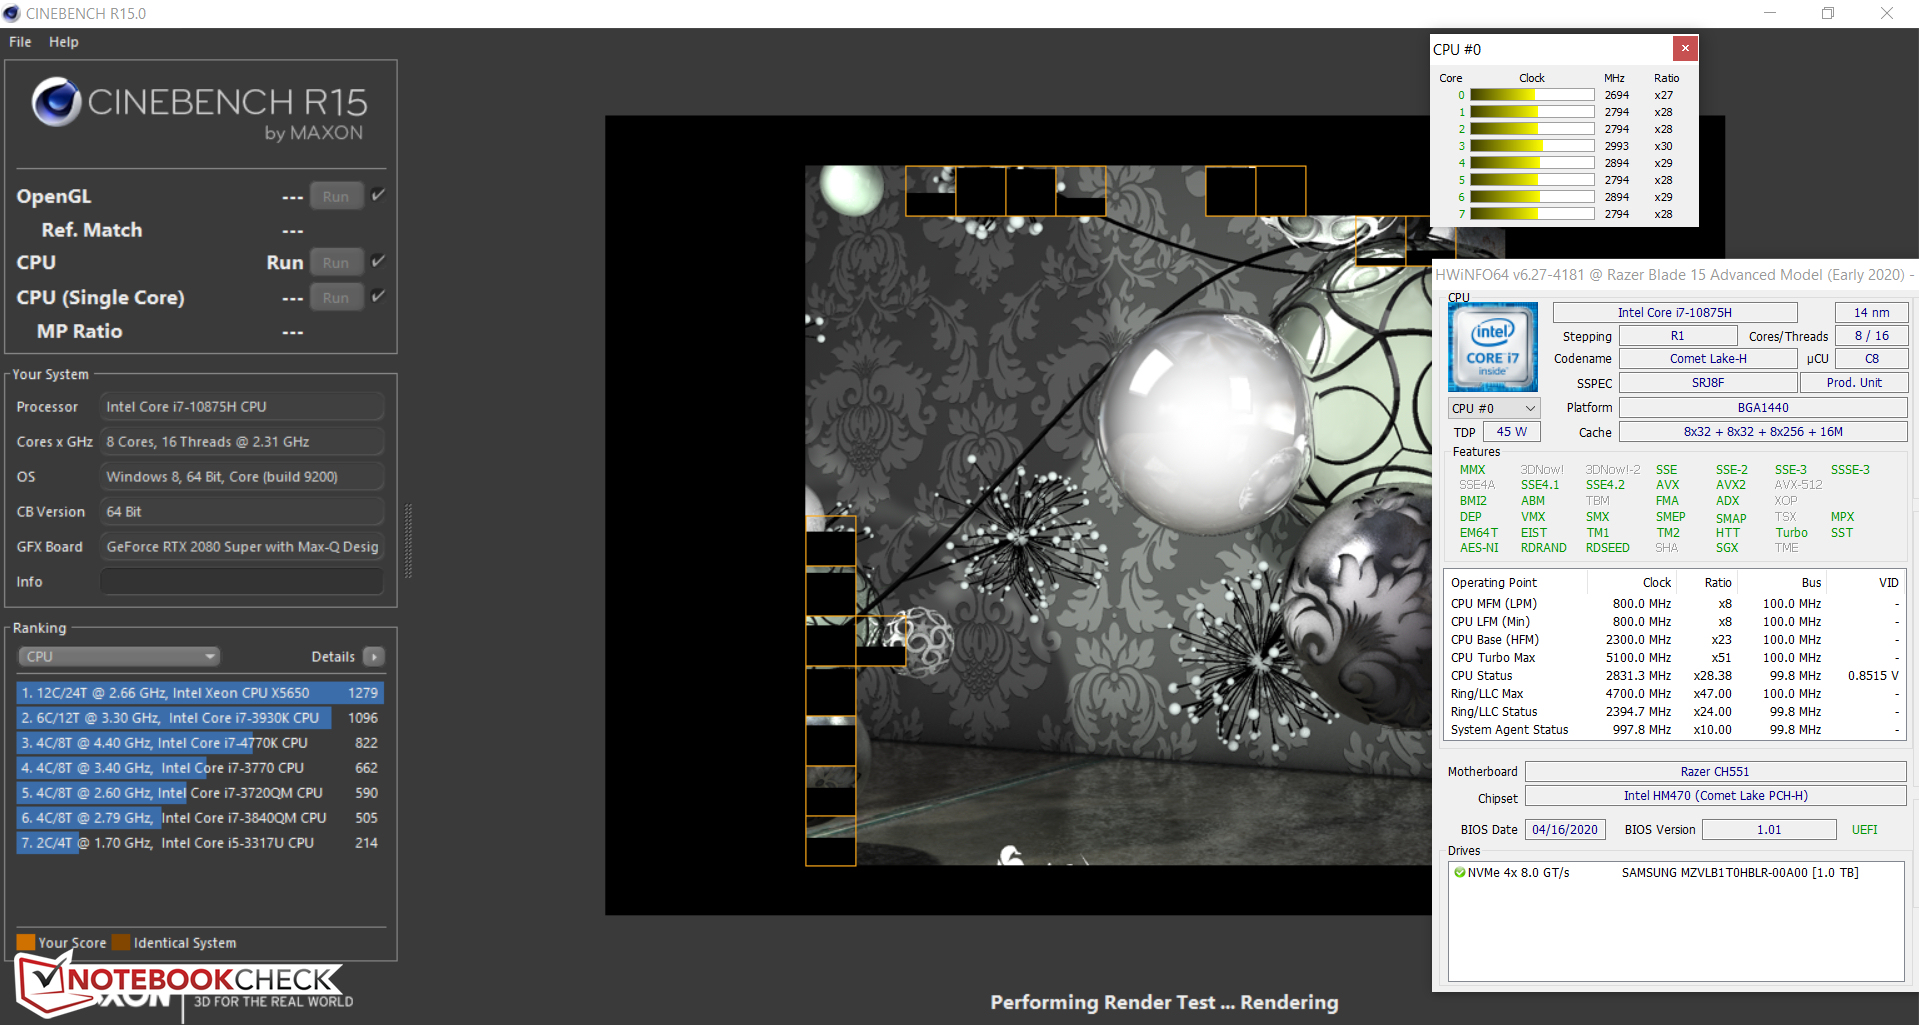

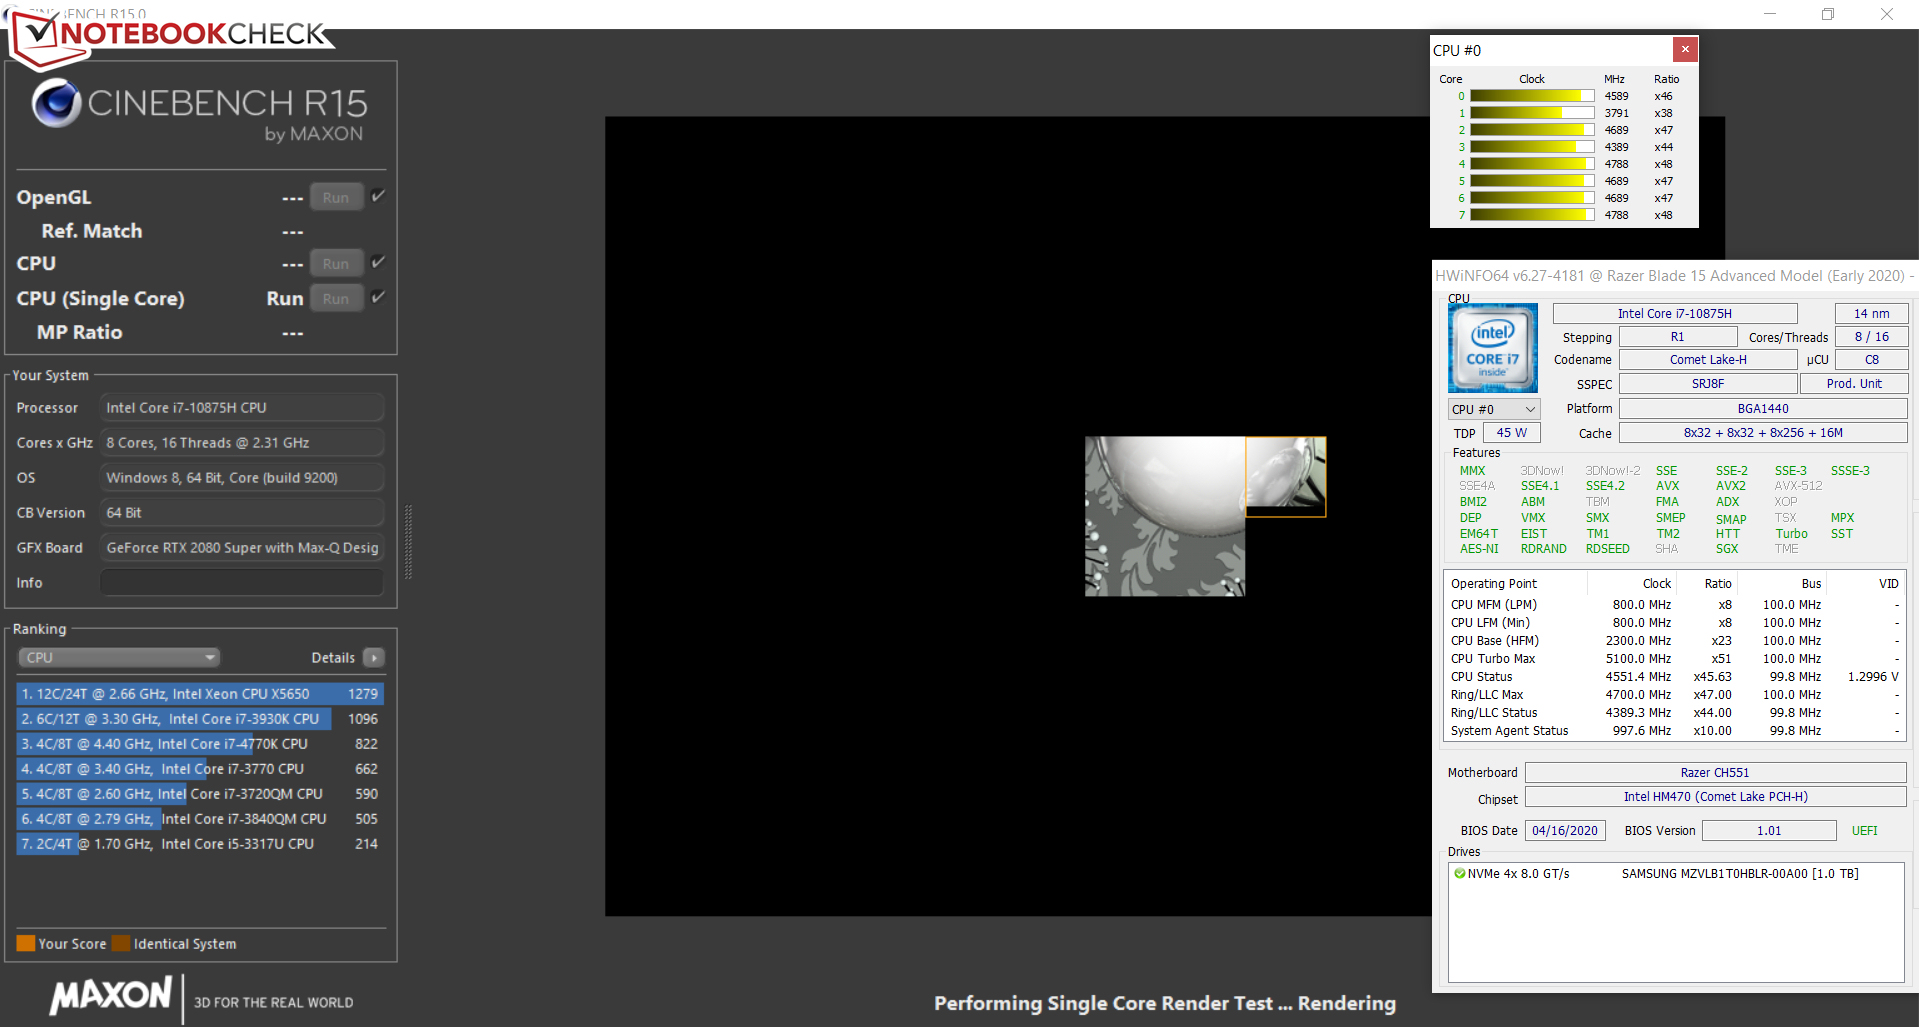
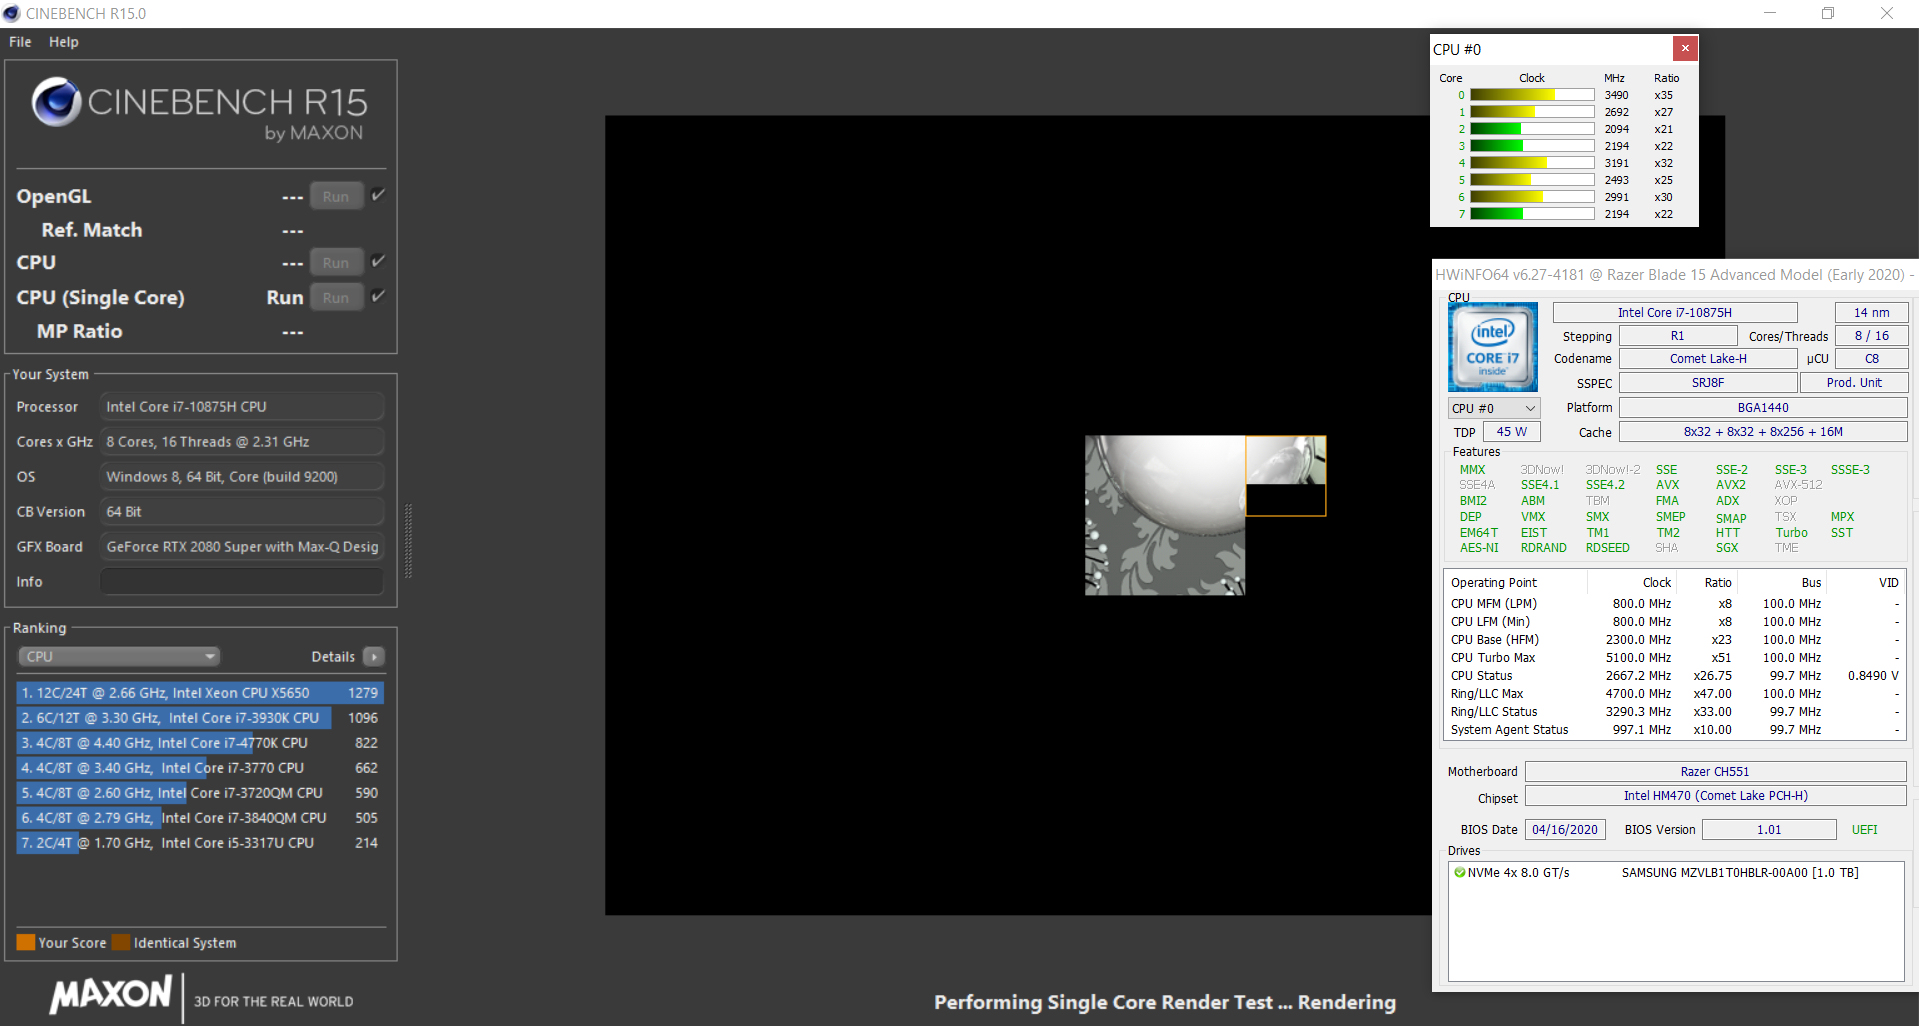
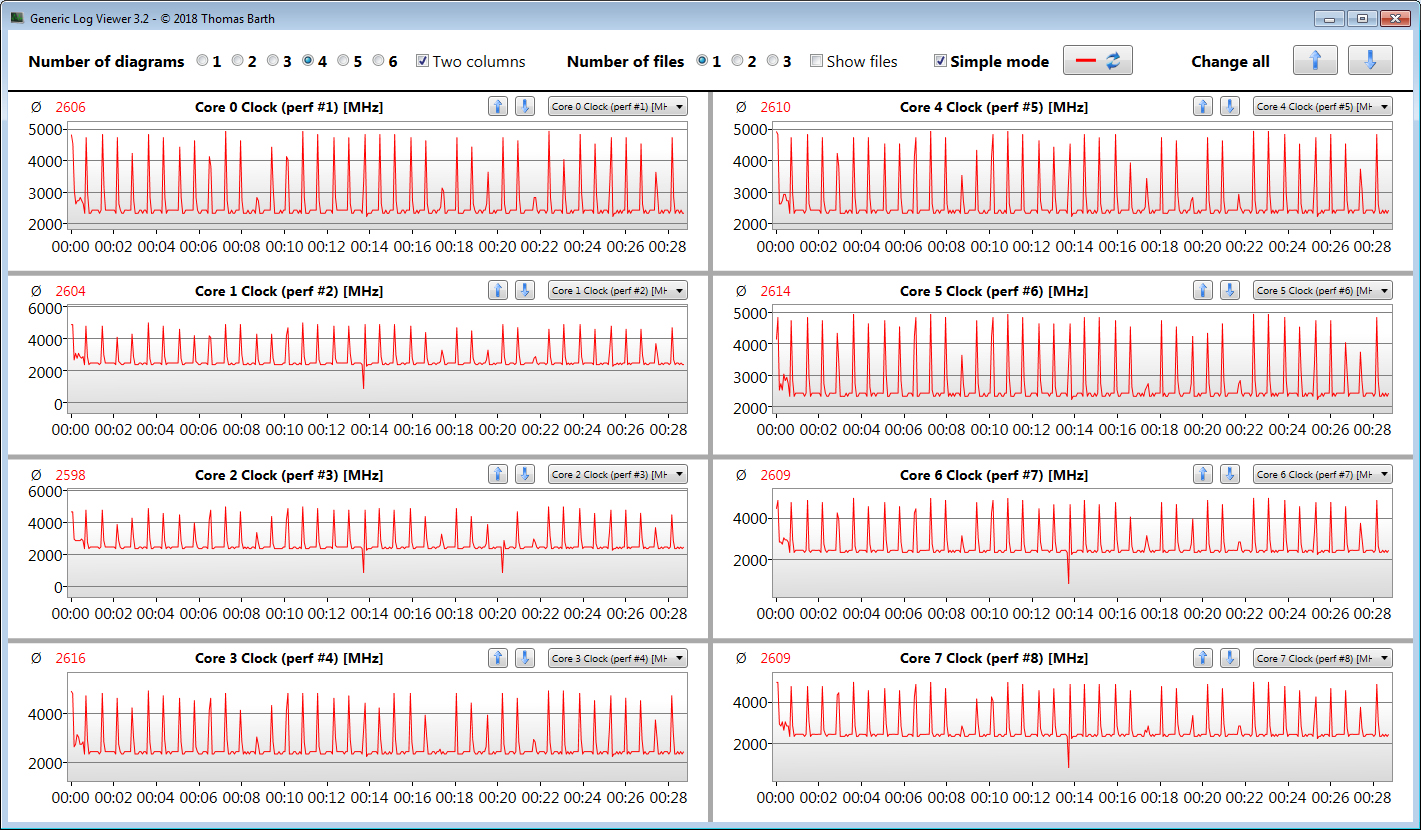
Verifichiamo se la CPU Turbo viene utilizzata in modo costante anche quando è collegata alla rete elettricca, eseguendo il test multithread del benchmark Cinebench R15 in un ciclo continuo per almeno 30 minuti. I risultati scendono verso la seconda esecuzione e poi rimangono a livello costante. Il Turbo viene utilizzato in piccola parte.
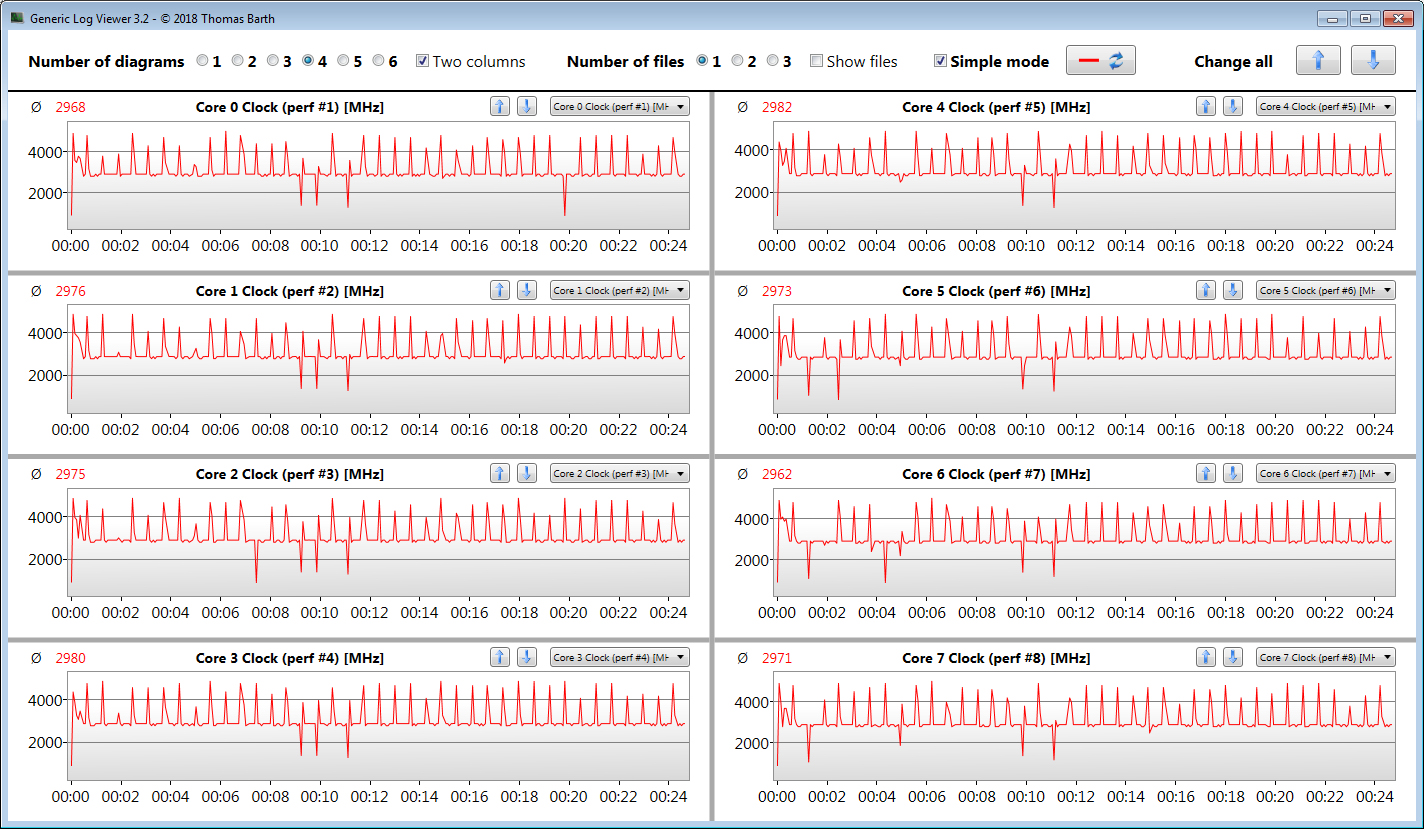
Se le modalità di prestazione della CPU "High" o "Boost" sono selezionate all'interno del software Synapse, la velocità del Turbo aumenta e di conseguenza anche i risultati. C'è una differenza tra "High" e "Boost".

| Cinebench R15 | |
| CPU Single 64Bit | |
| Media della classe Gaming (188.8 - 343, n=111, ultimi 2 anni) | |
| Gigabyte Aero 15 OLED XB-8DE51B0SP | |
| MSI GE66 Raider 10SFS | |
| Media Intel Core i7-10875H (190 - 220, n=37) | |
| Razer Blade 15 RTX 2080 Super Max-Q (Boost) | |
| Razer Blade 15 RTX 2080 Super Max-Q (Hoch) | |
| Razer Blade 15 RTX 2080 Super Max-Q | |
| Razer Blade 15 RZ09-0328 | |
| Schenker XMG Neo 15 XNE15M19 | |
| Razer Blade 15 RTX 2080 Max-Q | |
| Asus Zephyrus S GX531GX | |
| CPU Multi 64Bit | |
| Media della classe Gaming (1578 - 6271, n=111, ultimi 2 anni) | |
| Gigabyte Aero 15 OLED XB-8DE51B0SP | |
| MSI GE66 Raider 10SFS | |
| Media Intel Core i7-10875H (1003 - 1833, n=38) | |
| Razer Blade 15 RTX 2080 Super Max-Q (Boost) | |
| Razer Blade 15 RTX 2080 Super Max-Q (Hoch) | |
| Razer Blade 15 RTX 2080 Super Max-Q | |
| Schenker XMG Neo 15 XNE15M19 | |
| Razer Blade 15 RTX 2080 Max-Q | |
| Razer Blade 15 RZ09-0328 | |
| Asus Zephyrus S GX531GX | |
* ... Meglio usare valori piccoli
Prestazioni di sistema
Non c'è nulla da criticare sulle prestazioni del sistema. Il sistema funziona bene e senza problemi, e non abbiamo incontrato alcun problema. I risultati del PCMark dimostrano che il portatile ha una potenza di calcolo sufficiente per tutte le aree di applicazione più comuni.
| PCMark 8 Home Score Accelerated v2 | 4665 punti | |
| PCMark 8 Creative Score Accelerated v2 | 4352 punti | |
| PCMark 8 Work Score Accelerated v2 | 6340 punti | |
| PCMark 10 Score | 5093 punti | |
Aiuto | ||
Latenze DPC
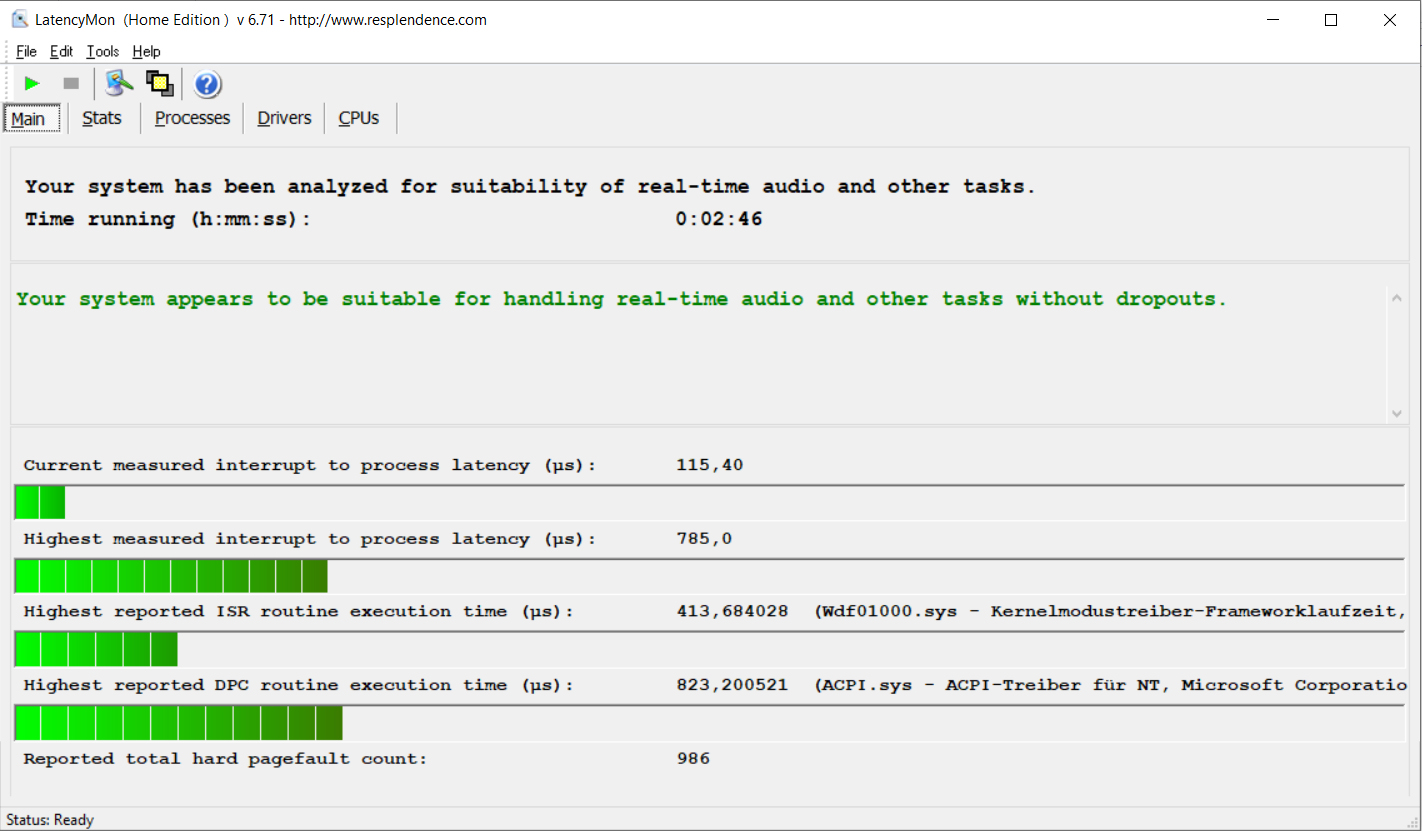
Nel nostro test standardizzato del monitor di latenza (navigazione web, rendering video 4K, Prime95 ad alto carico), non abbiamo notato alcun problema con le latenze DPC. Di conseguenza, il sistema sembra essere adatto per l'editing video e audio in tempo reale.
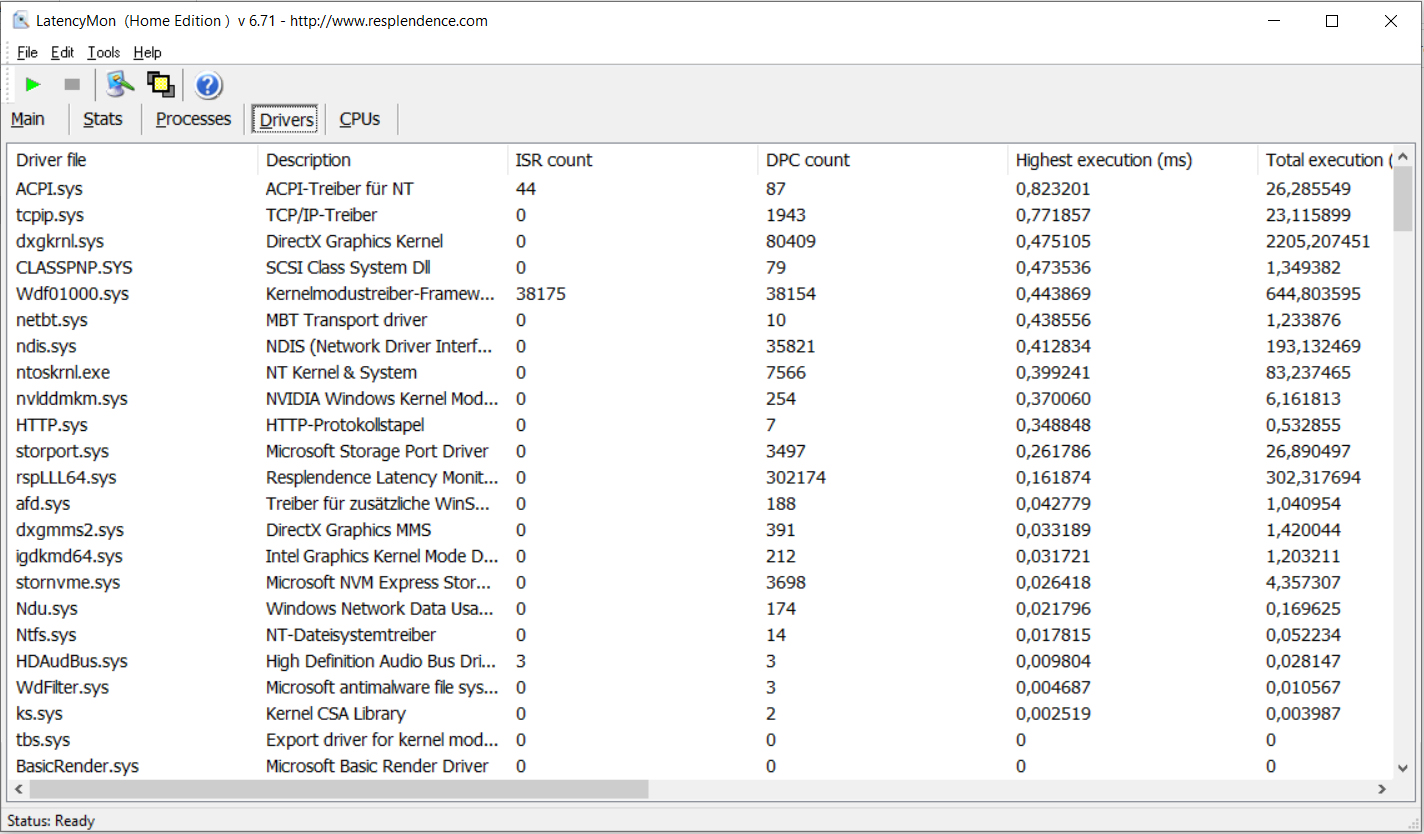
| DPC Latencies / LatencyMon - interrupt to process latency (max), Web, Youtube, Prime95 | |
| Gigabyte Aero 15 OLED XB-8DE51B0SP | |
| MSI GE66 Raider 10SFS | |
| Razer Blade 15 RZ09-0328 | |
| Razer Blade 15 RTX 2080 Super Max-Q | |
* ... Meglio usare valori piccoli
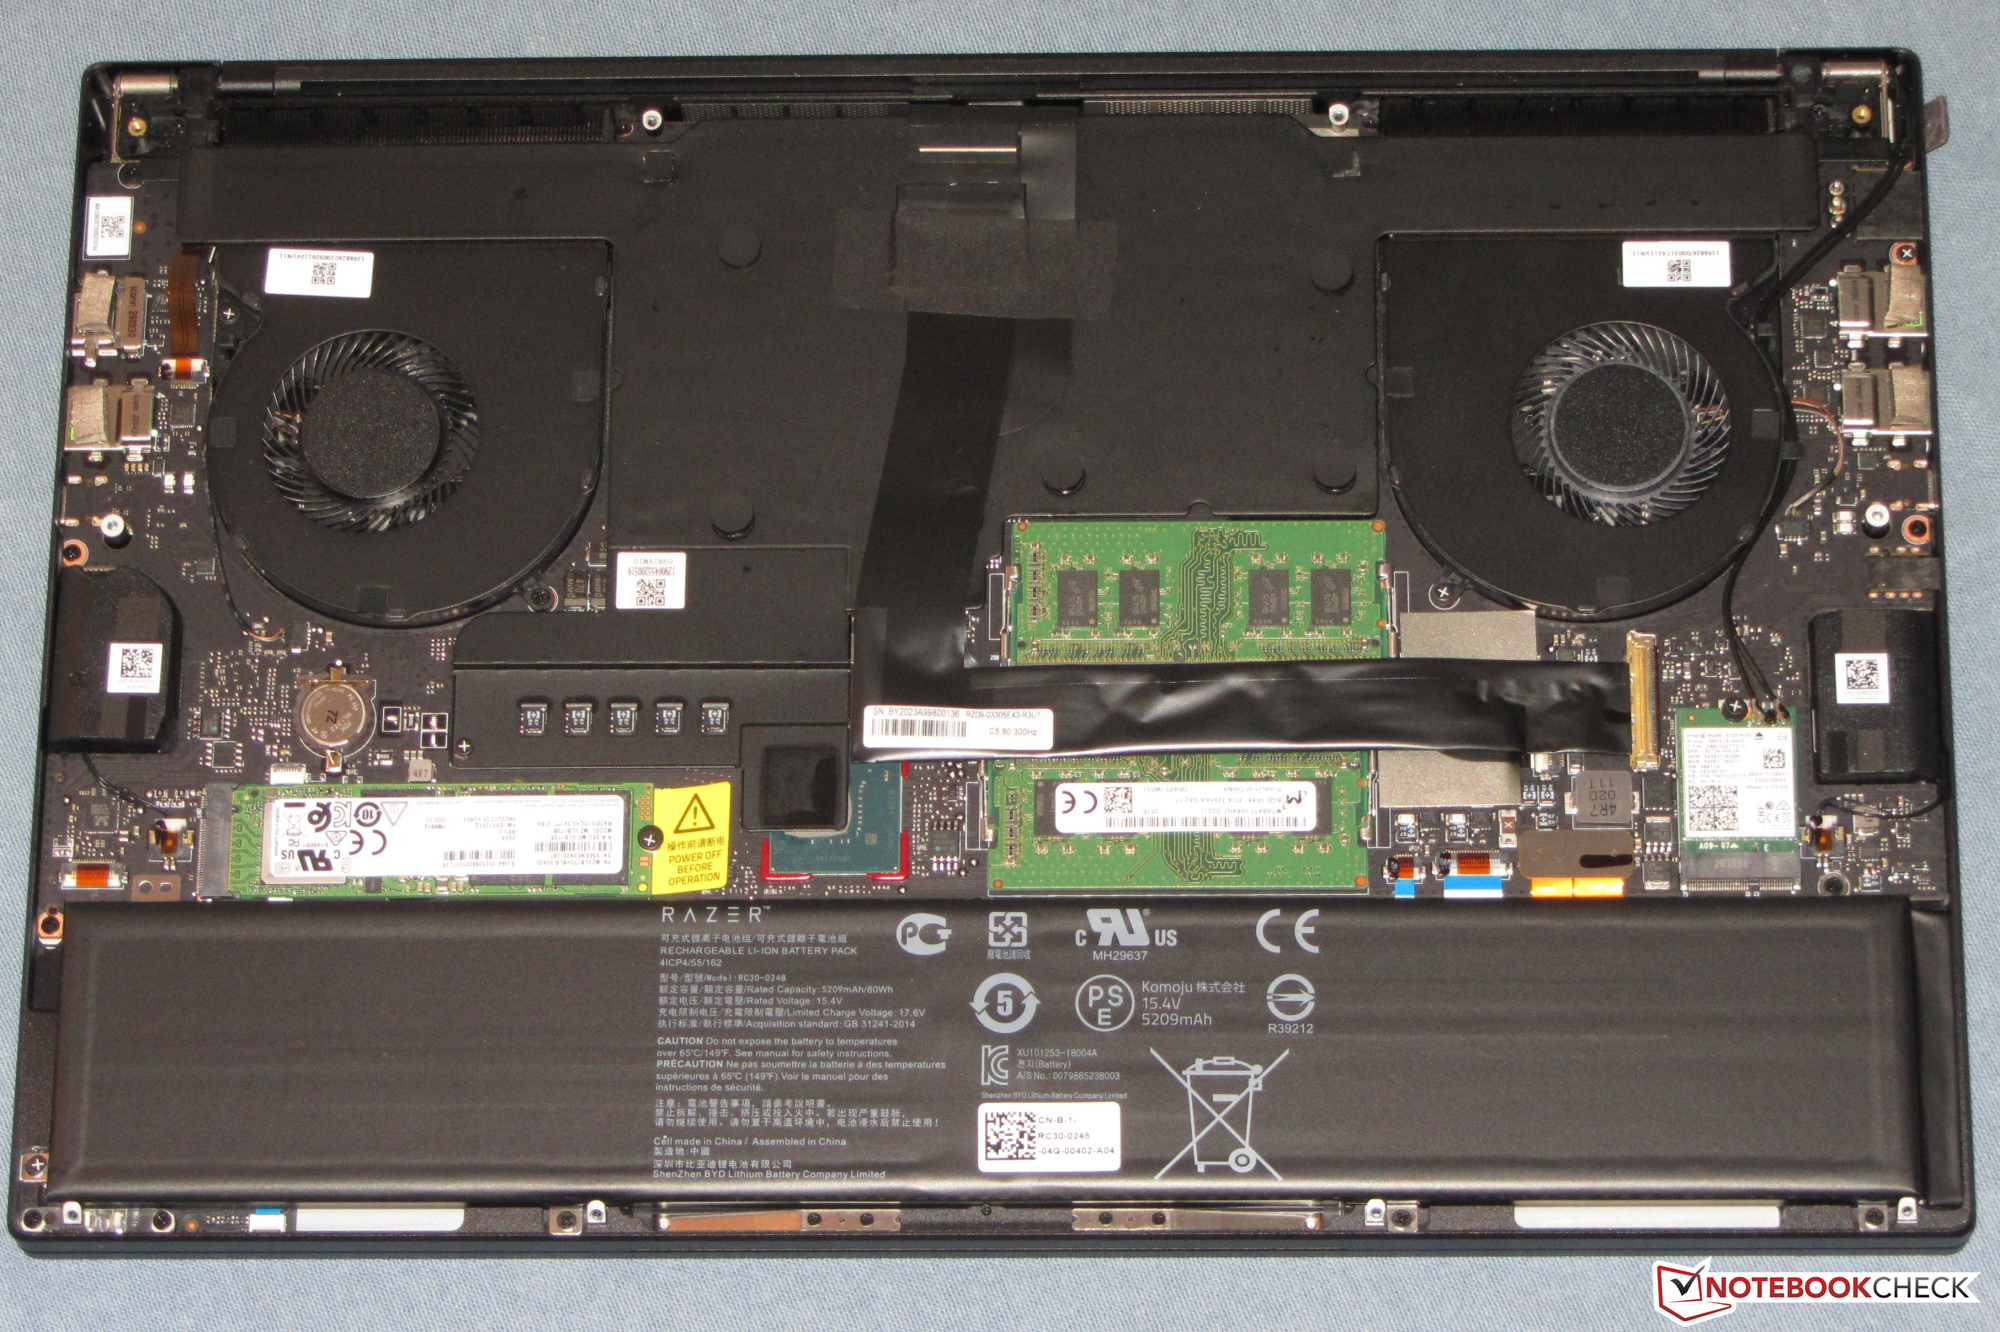
Dispositivi di archiviazione
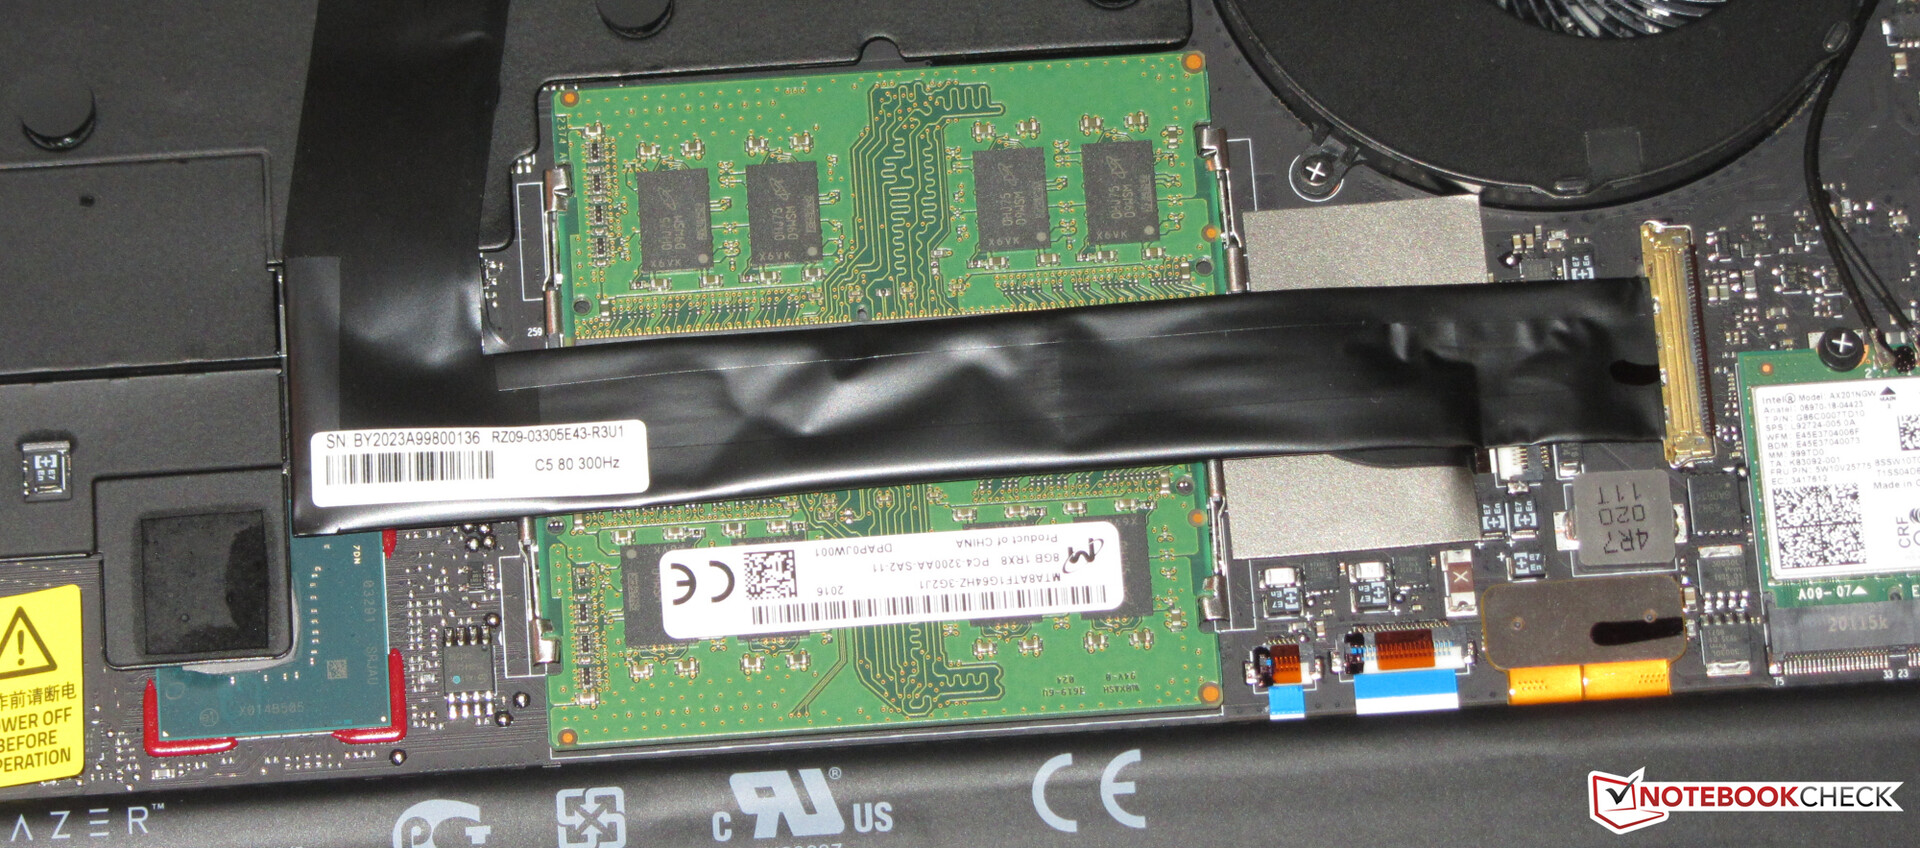
Razer ha installato un SSD NVMe (M.2 2280) di Samsung nel Blade. Il modello da 1 TB offre eccellenti velocità di trasferimento. D'altra parte, il portatile non offre spazio per ulteriori dispositivi di memorizzazione.
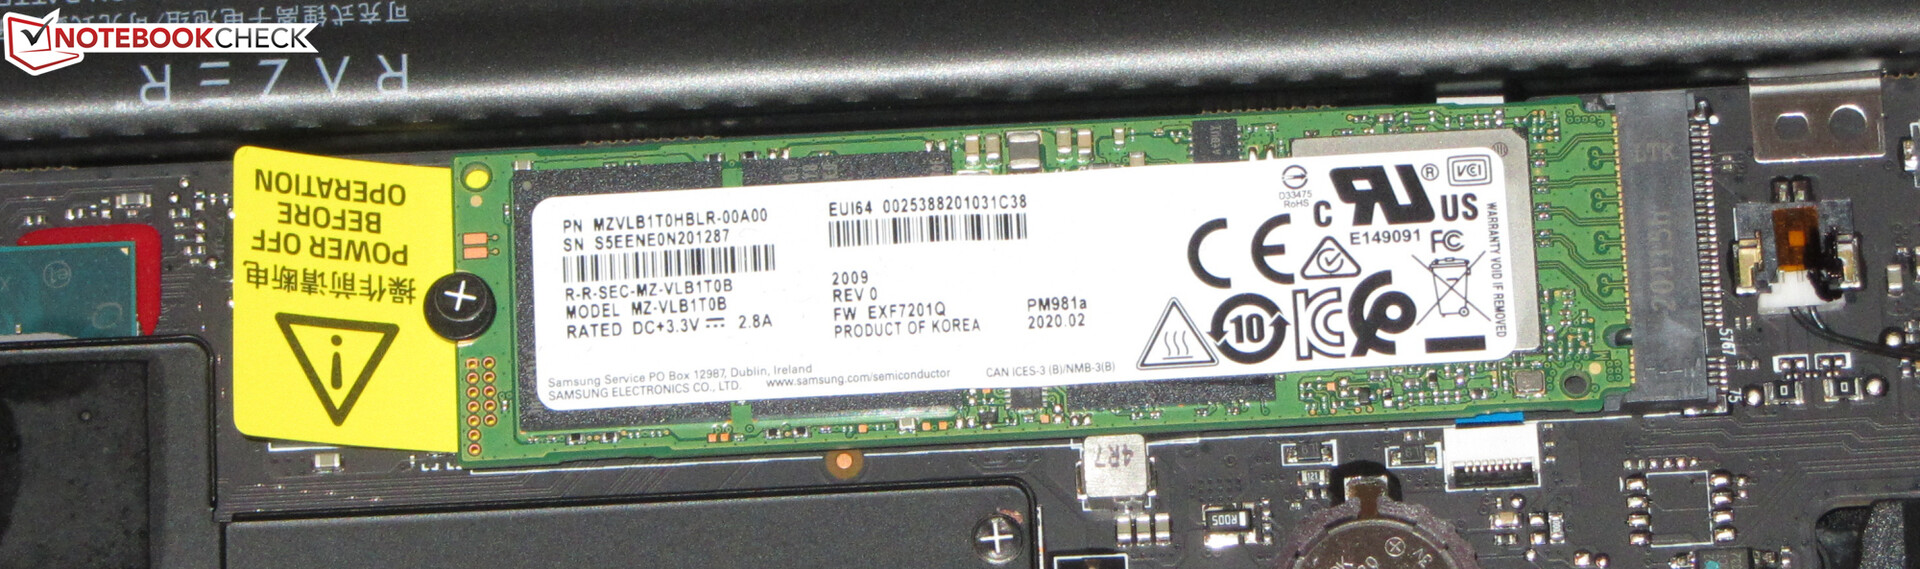

| Razer Blade 15 RTX 2080 Super Max-Q Samsung PM981a MZVLB1T0HBLR | Razer Blade 15 RTX 2080 Max-Q Samsung SSD PM981 MZVLB512HAJQ | Asus Zephyrus S GX531GX Intel SSD 660p SSDPEKNW512G8 | Gigabyte Aero 15 OLED XB-8DE51B0SP Intel Optane Memory H10 with Solid State Storage 32GB + 512GB HBRPEKNX0202A(L/H) | MSI GE66 Raider 10SFS WDC PC SN730 SDBPNTY-1T00 | Schenker XMG Neo 15 XNE15M19 Seagate FireCuda 510 SSD ZP1000GM30001 | Razer Blade 15 RZ09-0328 Lite-On CA5-8D512 | Media Samsung PM981a MZVLB1T0HBLR | |
|---|---|---|---|---|---|---|---|---|
| CrystalDiskMark 5.2 / 6 | -13% | -41% | 0% | 6% | -18% | -1% | -2% | |
| Write 4K (MB/s) | 135.7 | 137.2 1% | 93.9 -31% | 127.4 -6% | 158.2 17% | 108.7 -20% | 118.7 -13% | 139.7 ? 3% |
| Read 4K (MB/s) | 46.98 | 46.82 0% | 46.29 -1% | 147.5 214% | 50.7 8% | 41.4 -12% | 52.4 12% | 49.9 ? 6% |
| Write Seq (MB/s) | 2180 | 1221 -44% | 974 -55% | 485.9 -78% | 1790 -18% | 1083 -50% | 2247 3% | 2036 ? -7% |
| Read Seq (MB/s) | 1949 | 1217 -38% | 1425 -27% | 1352 -31% | 2469 27% | 917 -53% | 2234 15% | 2014 ? 3% |
| Write 4K Q32T1 (MB/s) | 510 | 527 3% | 259.4 -49% | 476.5 -7% | 503 -1% | 468.5 -8% | 515 1% | 461 ? -10% |
| Read 4K Q32T1 (MB/s) | 569 | 614 8% | 296.5 -48% | 531 -7% | 579 2% | 530 -7% | 584 3% | 499 ? -12% |
| Write Seq Q32T1 (MB/s) | 2984 | 1986 -33% | 977 -67% | 1061 -64% | 3102 4% | 3057 2% | 2235 -25% | 2903 ? -3% |
| Read Seq Q32T1 (MB/s) | 3238 | 3234 0% | 1666 -49% | 2552 -21% | 3413 5% | 3422 6% | 3171 -2% | 3479 ? 7% |
| AS SSD | -4% | -37% | -37% | 21% | 14% | -24% | 5% | |
| Seq Read (MB/s) | 1950 | 1832 -6% | 1239 -36% | 1200 -38% | 2979 53% | 2341 20% | 2021 4% | 2553 ? 31% |
| Seq Write (MB/s) | 2322 | 1864 -20% | 920 -60% | 836 -64% | 2581 11% | 2575 11% | 2090 -10% | 2084 ? -10% |
| 4K Read (MB/s) | 45.48 | 52.1 15% | 45.74 1% | 65.8 45% | 47.33 4% | 51 12% | 47.71 5% | 53.1 ? 17% |
| 4K Write (MB/s) | 95.4 | 108.3 14% | 95.7 0% | 103.8 9% | 140 47% | 118.6 24% | 101.1 6% | 131.2 ? 38% |
| 4K-64 Read (MB/s) | 1484 | 1159 -22% | 322 -78% | 789 -47% | 1710 15% | 1637 10% | 856 -42% | 1477 ? 0% |
| 4K-64 Write (MB/s) | 1887 | 1807 -4% | 722 -62% | 929 -51% | 2188 16% | 2442 29% | 1041 -45% | 1805 ? -4% |
| Access Time Read * (ms) | 0.051 | 0.05 2% | 0.073 -43% | 0.103 -102% | 0.05 2% | 0.066 -29% | 0.052 -2% | 0.04983 ? 2% |
| Access Time Write * (ms) | 0.038 | 0.034 11% | 0.047 -24% | 0.045 -18% | 0.026 32% | 0.028 26% | 0.111 -192% | 0.04222 ? -11% |
| Score Read (Points) | 1725 | 1394 -19% | 492 -71% | 975 -43% | 2055 19% | 1922 11% | 1105 -36% | 1786 ? 4% |
| Score Write (Points) | 2215 | 2102 -5% | 910 -59% | 1117 -50% | 2586 17% | 2818 27% | 1351 -39% | 2144 ? -3% |
| Score Total (Points) | 4843 | 4221 -13% | 1654 -66% | 2594 -46% | 5673 17% | 5738 18% | 3037 -37% | 4826 ? 0% |
| Copy ISO MB/s (MB/s) | 1903 | 2083 9% | 1236 -35% | 2474 30% | 2098 ? 10% | |||
| Copy Program MB/s (MB/s) | 505 | 496.5 -2% | 703 39% | 679 34% | 500 ? -1% | |||
| Copy Game MB/s (MB/s) | 1113 | 977 -12% | 812 -27% | 1037 -7% | 1132 ? 2% | |||
| Media totale (Programma / Settaggio) | -9% /
-7% | -39% /
-39% | -19% /
-21% | 14% /
15% | -2% /
1% | -13% /
-15% | 2% /
3% |
* ... Meglio usare valori piccoli
Carico di lettura continuo: DiskSpd Read Loop, Queue Depth 8
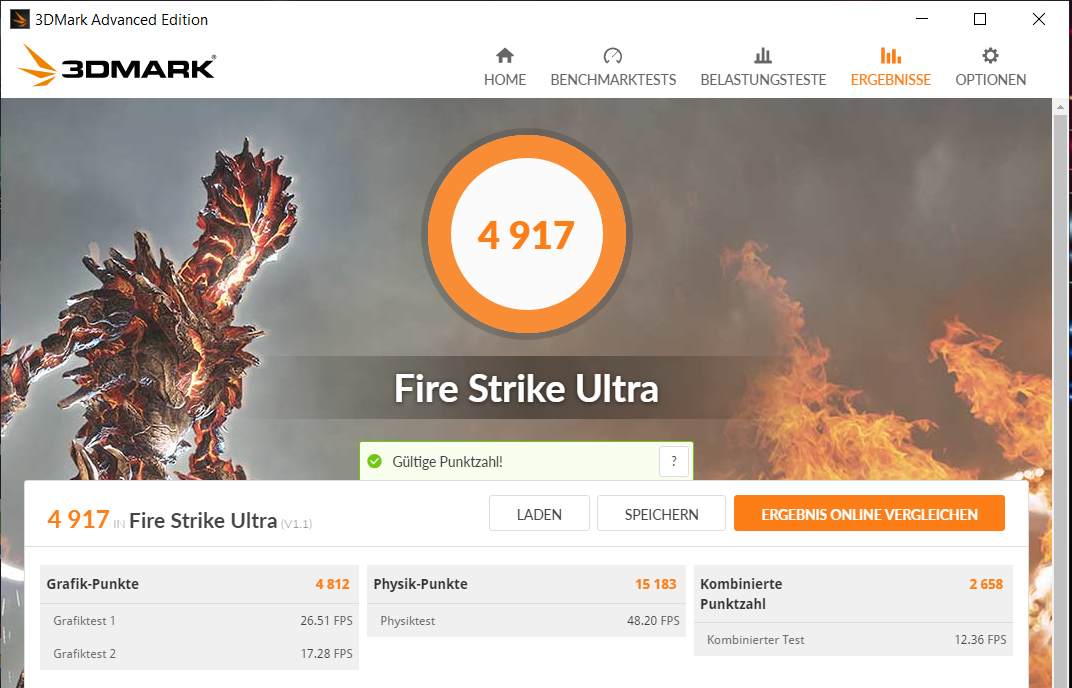
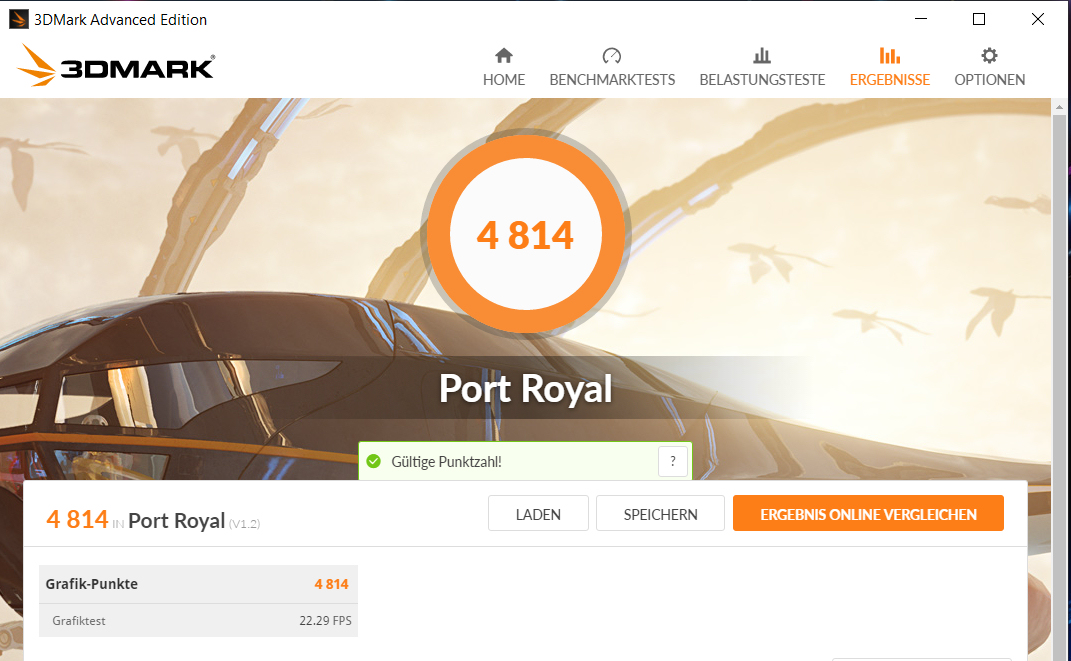
Scheda grafica
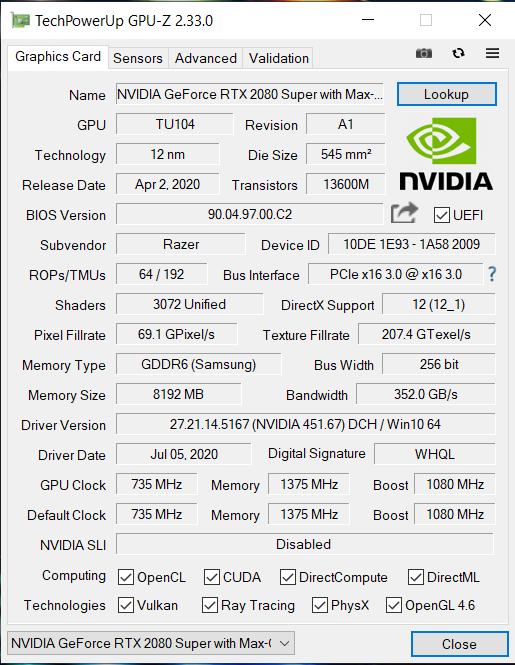
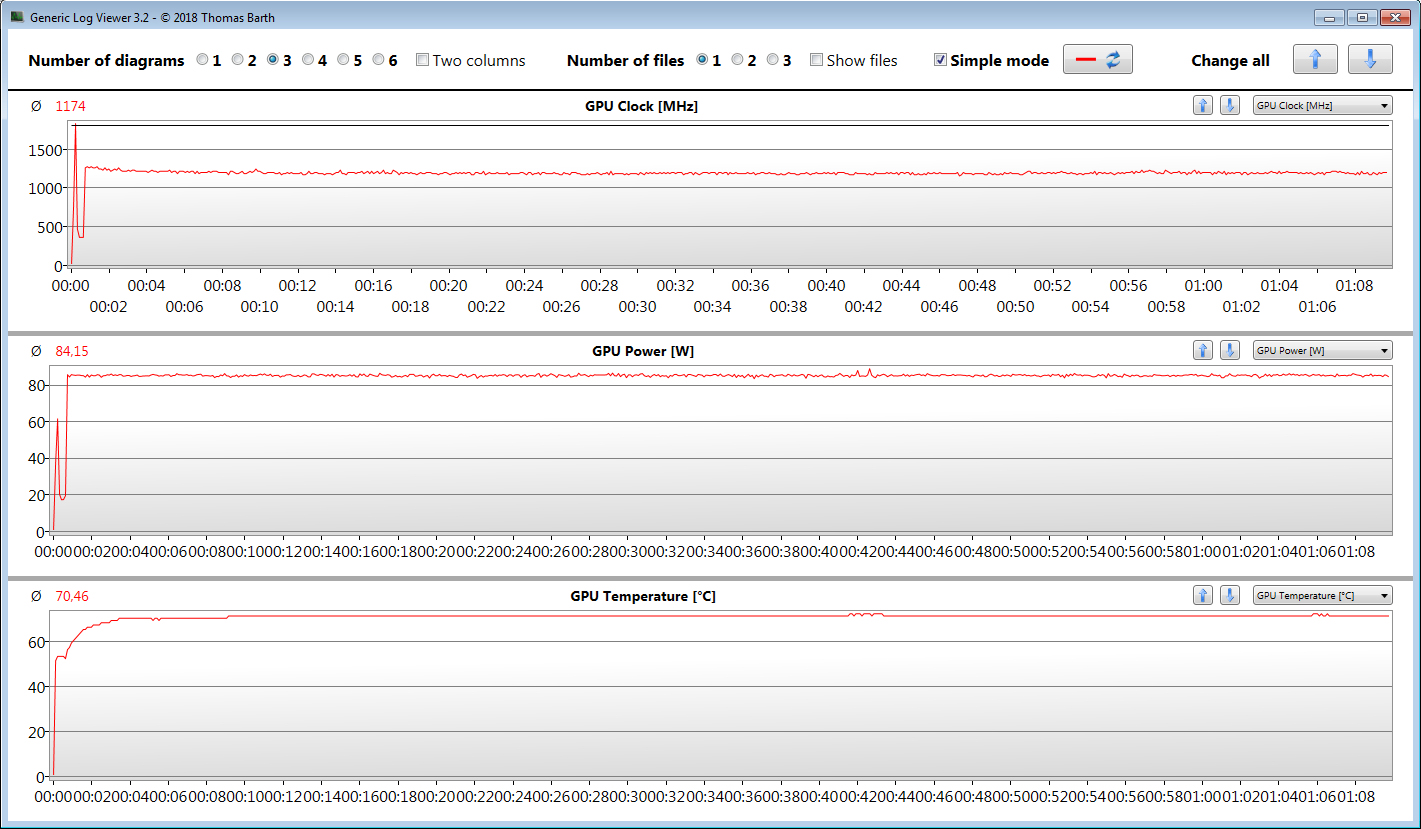
Il core grafico GeForce RTX 2080 Super Max-Q supporta DirectX 12 e funziona ad una velocità di base di 775 MHz. Un aumento fino a 1.080 MHz è possibile con il boost. Velocità più elevate sono possibili se la GPU non raggiunge una determinata soglia di temperatura e/o di energia. In questo modo, registriamo un massimo di 1.783 MHz. Il nostro test The Witcher 3 viene eseguito a una velocità media di 1.174 MHz. Inoltre, la GPU ha accesso alla memoria grafica GDDR6 veloce (8.192 MB).
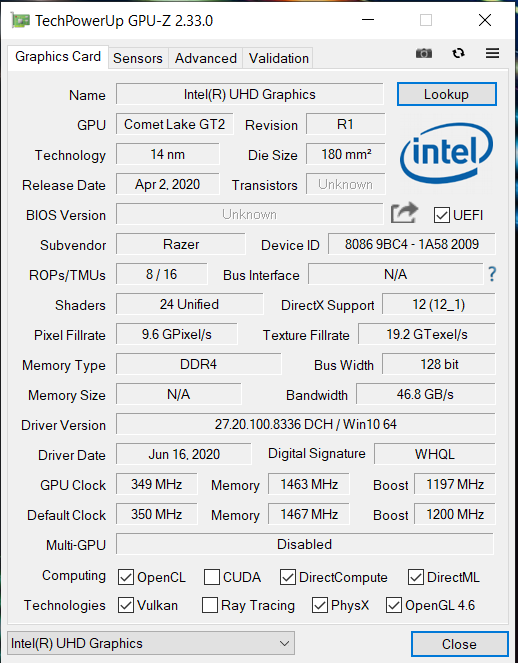
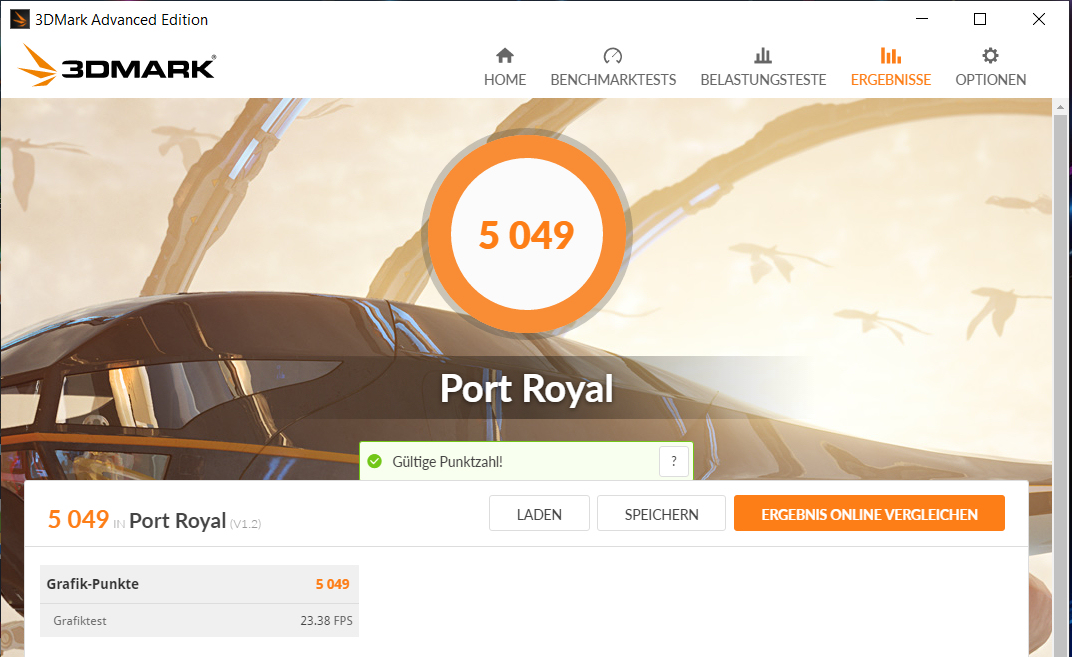
I risultati dei benchmarks 3DMark sono a un livello normale per la GPU. Un leggero aumento delle prestazioni grafiche può essere ottenuto impostando il cursore delle prestazioni grafiche all'interno del software Razer Synapse su "Alto". La GPU UHD Graphics 630 integrata nel processore è attiva, e il portatile funziona con la soluzione di switching grafico Optimus di Nvidia. Optimus può essere disattivato all'interno del software Razer Synapse, se necessario.

| 3DMark 11 Performance | 20888 punti | |
| 3DMark Cloud Gate Standard Score | 32880 punti | |
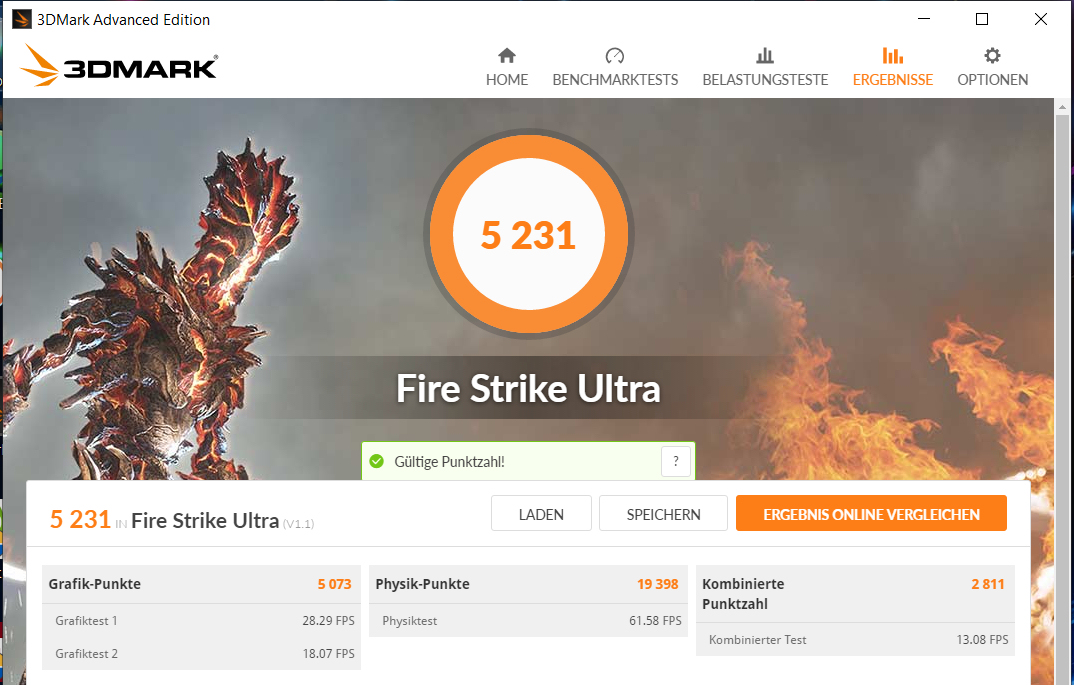
| 3DMark Fire Strike Score | 17148 punti | |
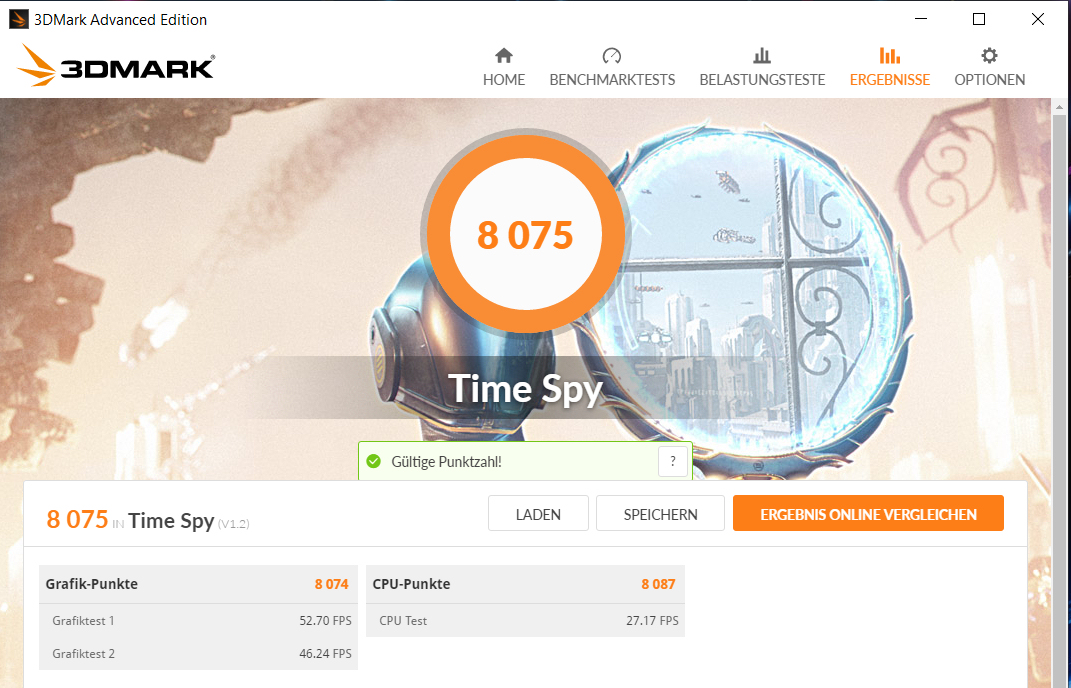
| 3DMark Time Spy Score | 7683 punti | |
Aiuto | ||
Prestazioni Gaming
Questo portatile Razer gestisce tutti i giochi più recenti senza problemi sullo schermo. Di solito è possibile selezionare la risoluzione Full HD e le impostazioni di massima qualità. Inoltre, la GPU è in grado di gestire anche risoluzioni superiori al Full HD (per questo è necessario collegare un monitor adeguato). In questo caso, tuttavia, i controlli di qualità non dovrebbero essere così elevati - soprattutto a livello di 4K.
| The Witcher 3 - 1920x1080 Ultra Graphics & Postprocessing (HBAO+) | |
| Media della classe Gaming (95 - 240, n=8, ultimi 2 anni) | |
| Razer Blade 15 RTX 2080 Super Max-Q (GPU: Hoch) | |
| Razer Blade 15 RTX 2080 Super Max-Q | |
| Media NVIDIA GeForce RTX 2080 Super Max-Q (74.3 - 96, n=11) | |
| MSI GE66 Raider 10SFS | |
| Asus Zephyrus S GX531GX | |
| Gigabyte Aero 15 OLED XB-8DE51B0SP | |
| Razer Blade 15 RTX 2080 Max-Q | |
| Razer Blade 15 RZ09-0328 | |
| Schenker XMG Neo 15 XNE15M19 | |
| BioShock Infinite - 1920x1080 Ultra Preset, DX11 (DDOF) | |
| Media NVIDIA GeForce RTX 2080 Super Max-Q (170.2 - 181.1, n=4) | |
| Razer Blade 15 RTX 2080 Super Max-Q | |
| Razer Blade 15 RTX 2080 Max-Q | |
| Asus Zephyrus S GX531GX | |
| Shadow of the Tomb Raider - 1920x1080 Highest Preset AA:T | |
| MSI GE66 Raider 10SFS | |
| Media della classe Gaming (96 - 116, n=2, ultimi 2 anni) | |
| Gigabyte Aero 15 OLED XB-8DE51B0SP | |
| Media NVIDIA GeForce RTX 2080 Super Max-Q (89 - 106, n=10) | |
| Razer Blade 15 RTX 2080 Super Max-Q | |
| Razer Blade 15 RTX 2080 Super Max-Q (GPU: Hoch) | |
| Razer Blade 15 RZ09-0328 | |
| Far Cry 5 - 1920x1080 Ultra Preset AA:T | |
| Media della classe Gaming (70 - 151, n=10, ultimi 2 anni) | |
| Media NVIDIA GeForce RTX 2080 Super Max-Q (91 - 110, n=4) | |
| Razer Blade 15 RTX 2080 Super Max-Q | |
| Battlefield V - 1920x1080 Ultra Preset | |
| MSI GE66 Raider 10SFS | |
| Gigabyte Aero 15 OLED XB-8DE51B0SP | |
| Media NVIDIA GeForce RTX 2080 Super Max-Q (109.7 - 125, n=4) | |
| Razer Blade 15 RTX 2080 Super Max-Q | |
| Borderlands 3 - 1920x1080 Badass Overall Quality (DX11) | |
| MSI GE66 Raider 10SFS | |
| Media NVIDIA GeForce RTX 2080 Super Max-Q (62.5 - 71.6, n=4) | |
| Gigabyte Aero 15 OLED XB-8DE51B0SP | |
| Razer Blade 15 RTX 2080 Super Max-Q | |
| Razer Blade 15 RZ09-0328 | |
| Schenker XMG Neo 15 XNE15M19 | |
| Red Dead Redemption 2 - 1920x1080 Maximum Settings | |
| MSI GE66 Raider 10SFS | |
| Media NVIDIA GeForce RTX 2080 Super Max-Q (40.6 - 45, n=5) | |
| Gigabyte Aero 15 OLED XB-8DE51B0SP | |
| Razer Blade 15 RTX 2080 Super Max-Q | |
| Doom Eternal - 1920x1080 Ultra Preset | |
| MSI GE66 Raider 10SFS | |
| Media NVIDIA GeForce RTX 2080 Super Max-Q (140 - 177.7, n=8) | |
| Razer Blade 15 RTX 2080 Super Max-Q | |
Per verificare se i frame rate rimangono costanti anche per un periodo di tempo prolungato, abbiamo lasciato girare il gioco The Witcher 3 per circa 60 minuti con risoluzione Full HD e impostazioni di massima qualità. Il protagonista incarnato dal giocatore non viene mosso durante tutto questo periodo. Non è stato notato alcun un calo dei frame rate.
| basso | medio | alto | ultra | |
|---|---|---|---|---|
| BioShock Infinite (2013) | 347.4 | 330.2 | 300.5 | 173 |
| The Witcher 3 (2015) | 308.4 | 239.9 | 153.2 | 87.7 |
| Dota 2 Reborn (2015) | 134.3 | 128.7 | 117.4 | 115 |
| X-Plane 11.11 (2018) | 109 | 95.8 | 80.8 | |
| Far Cry 5 (2018) | 111 | 100 | 96 | 91 |
| Shadow of the Tomb Raider (2018) | 117 | 104 | 100 | 93 |
| Battlefield V (2018) | 154.3 | 124.7 | 116.2 | 109.7 |
| Metro Exodus (2019) | 131 | 93.2 | 70.3 | 57.2 |
| Total War: Three Kingdoms (2019) | 227.8 | 123.8 | 83.8 | 61 |
| Control (2019) | 221.7 | 96.6 | 71 | |
| Borderlands 3 (2019) | 128.3 | 101.6 | 78.2 | 62.5 |
| Ghost Recon Breakpoint (2019) | 130 | 95 | 88 | 66 |
| Call of Duty Modern Warfare 2019 (2019) | 165.5 | 114.1 | 96.4 | 93.8 |
| Star Wars Jedi Fallen Order (2019) | 99.5 | 94.1 | 88.7 | |
| Red Dead Redemption 2 (2019) | 113.3 | 96.5 | 62.7 | 40.6 |
| Doom Eternal (2020) | 212.2 | 165.1 | 147.9 | 144.4 |
| Gears Tactics (2020) | 188.8 | 171.6 | 122.2 | 82.9 |
| F1 2020 (2020) | 219 | 174 | 150 | 115 |
| Death Stranding (2020) | 139.8 | 118.7 | 108.6 | 104.5 |
Emissioni - Moderato sviluppo di calore e rumore
Rumorosità di sistema
Nell'uso inattivo, le ventole sono spesso silenziose, e il silenzio prevale. Tutto questo cambia sotto carico. In questo caso, registriamo livelli massimi di pressione sonora di 46,8 dB(A) (carico medio), 46 dB(A) (stress test), e 48,4 dB(A) (The Witcher 3 test), rispettivamente. Quindi il gioco non è divertente senza le cuffie.
Rumorosità
| Idle |
| 30.1 / 30.1 / 30.1 dB(A) |
| Sotto carico |
| 46.8 / 46 dB(A) |
 | ||
30 dB silenzioso 40 dB(A) udibile 50 dB(A) rumoroso |
||
min: | ||
| Razer Blade 15 RTX 2080 Super Max-Q i7-10875H, GeForce RTX 2080 Super Max-Q | Razer Blade 15 RTX 2080 Max-Q i7-9750H, GeForce RTX 2080 Max-Q | Asus Zephyrus S GX531GX i7-8750H, GeForce RTX 2080 Max-Q | Gigabyte Aero 15 OLED XB-8DE51B0SP i7-10875H, GeForce RTX 2070 Super Max-Q | MSI GE66 Raider 10SFS i9-10980HK, GeForce RTX 2070 Super Mobile | Schenker XMG Neo 15 XNE15M19 i7-9750H, GeForce RTX 2070 Max-Q | Media NVIDIA GeForce RTX 2080 Super Max-Q | Media della classe Gaming | |
|---|---|---|---|---|---|---|---|---|
| Noise | 8% | -7% | -13% | -15% | -9% | -4% | 6% | |
| off /ambiente * (dB) | 30.1 | 28.3 6% | 28.7 5% | 30 -0% | 30 -0% | 31 -3% | 27.9 ? 7% | 24.1 ? 20% |
| Idle Minimum * (dB) | 30.1 | 28.8 4% | 29.8 1% | 34 -13% | 30 -0% | 31 -3% | 29.7 ? 1% | 25.8 ? 14% |
| Idle Average * (dB) | 30.1 | 28.8 4% | 32.4 -8% | 36 -20% | 35 -16% | 34 -13% | 30.8 ? -2% | 27.4 ? 9% |
| Idle Maximum * (dB) | 30.1 | 29 4% | 38 -26% | 41 -36% | 44 -46% | 37 -23% | 35.4 ? -18% | 30 ? -0% |
| Load Average * (dB) | 46.8 | 33.5 28% | 38.2 18% | 48 -3% | 53 -13% | 47 -0% | 47.2 ? -1% | 43 ? 8% |
| Witcher 3 ultra * (dB) | 48.4 | 45 7% | 56.6 -17% | 48 1% | 53 -10% | 50 -3% | ||
| Load Maximum * (dB) | 46 | 45.2 2% | 56.6 -23% | 54 -17% | 55 -20% | 54 -17% | 49.6 ? -8% | 54 ? -17% |
* ... Meglio usare valori piccoli
Temperature
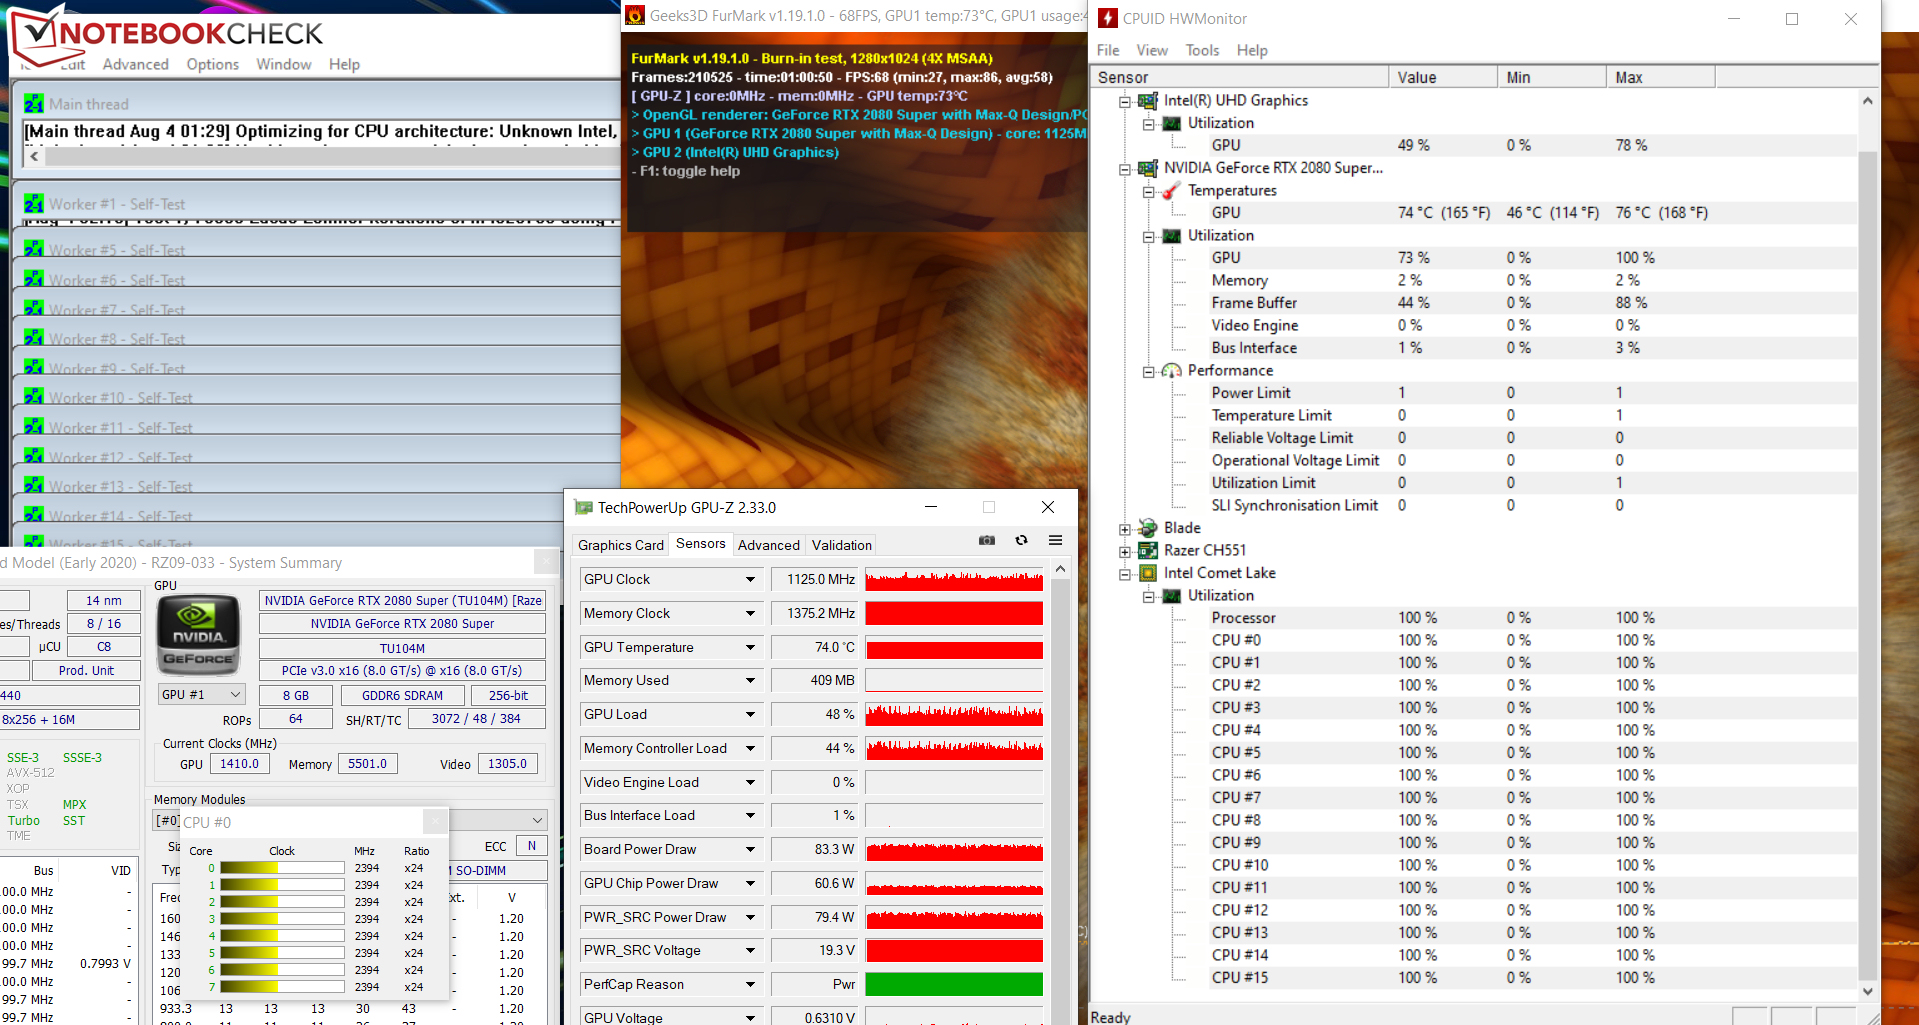
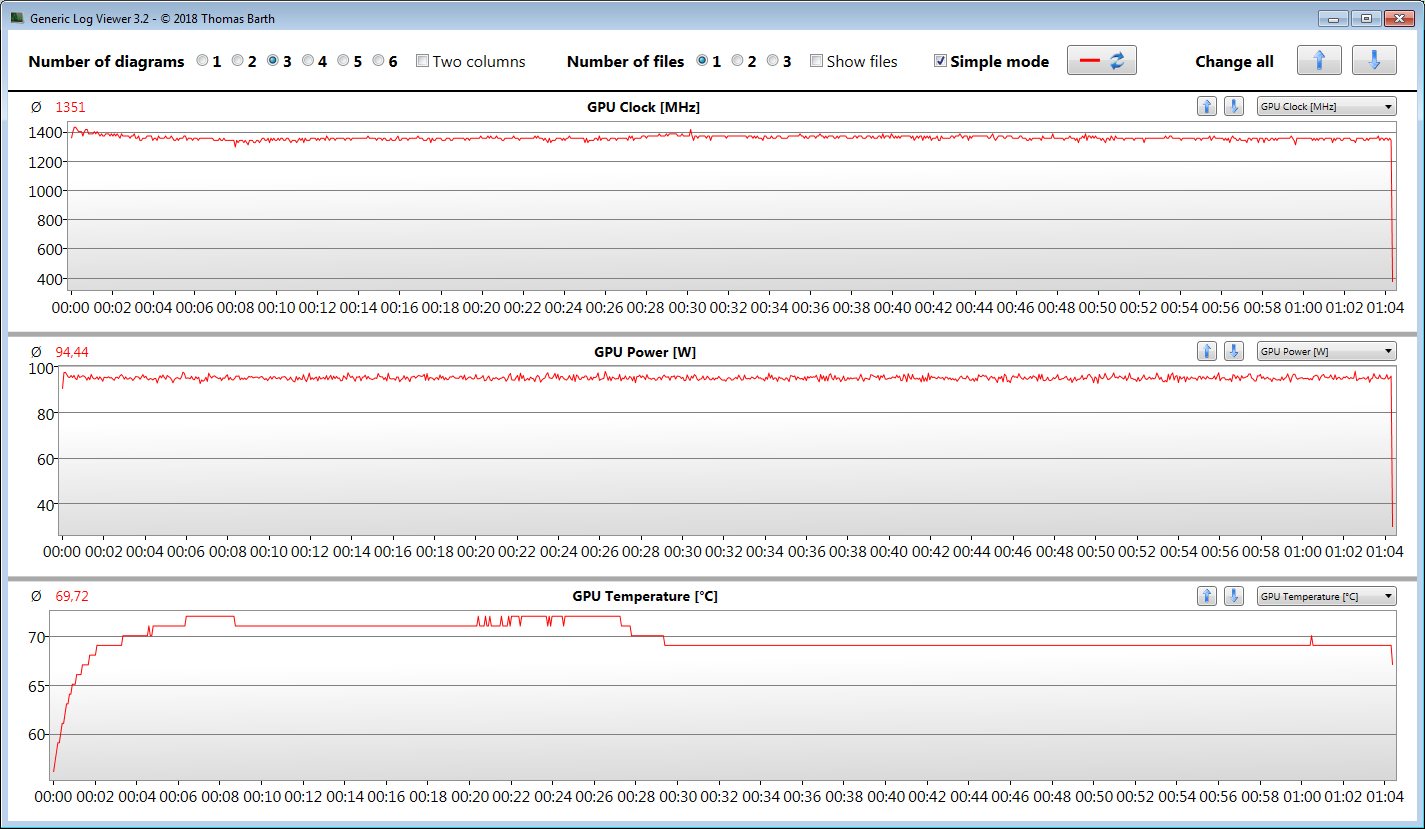
Il nostro stress test (Prime95 e FurMark funzionano per almeno un'ora) viene eseguito dalla CPU a 2,1 - 2,4 GHz. La velocità di clock della GPU scende da circa 1.500-1.700 MHz a 1.100-1.200 MHz durante il test. Inoltre, le velocità sono rispettivamente da 800 a 2.100 MHz (CPU) e 300 MHz (GPU) con alimentazione a batteria. Il test di stress rappresenta uno scenario estremo che non si verifica nella vita di tutti i giorni. Utilizziamo questo test per verificare se il sistema rimane stabile anche a pieno carico.
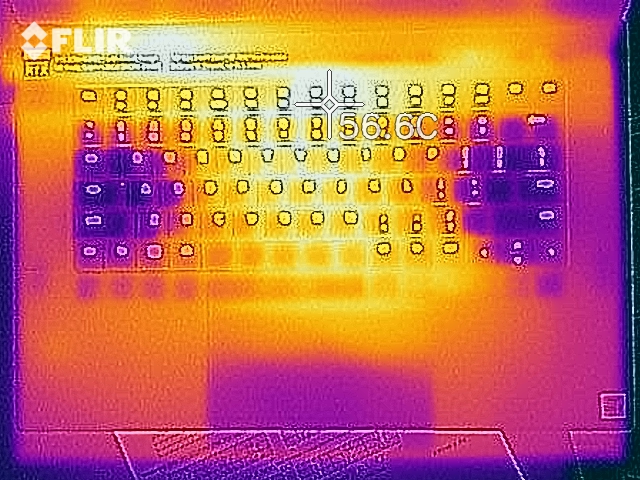
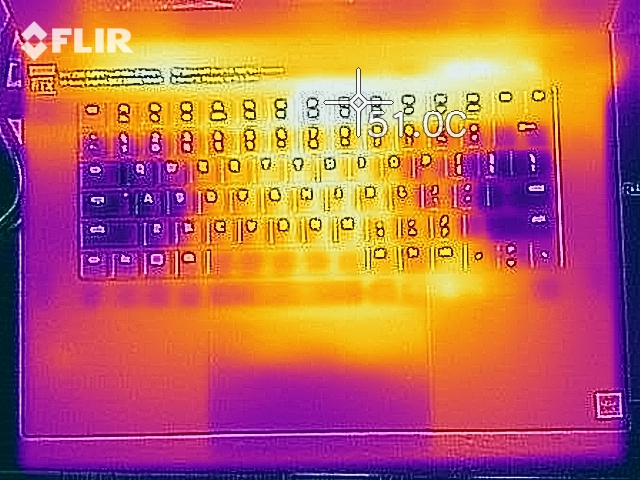
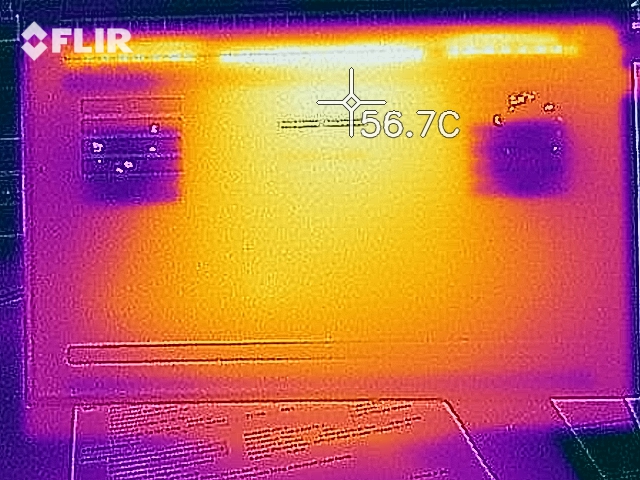
Il Blade Advanced si riscalda notevolmente ma non eccessivamente. Durante lo stress test, registriamo temperature superiori a 50 °C (~122 °F) in due punti di misura. Inoltre, lo sviluppo di calore è minore quando si esegue la nostra prova The Witcher 3. Le temperature sono nei limiti normali nell'uso quotidiano.
(-) La temperatura massima sul lato superiore è di 52 °C / 126 F, rispetto alla media di 40.4 °C / 105 F, che varia da 21.2 a 68.8 °C per questa classe Gaming.
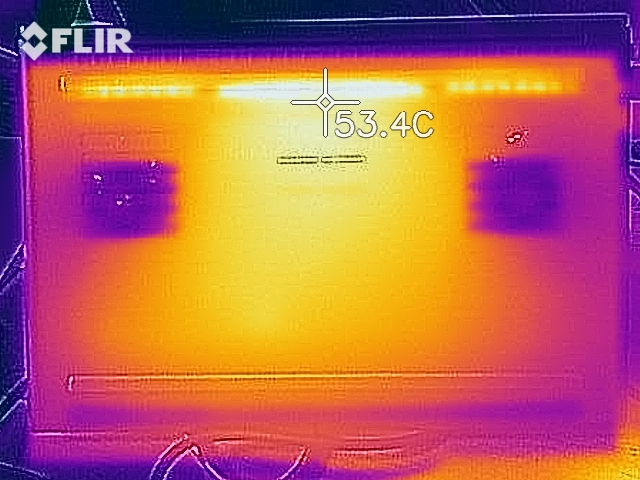
(-) Il lato inferiore si riscalda fino ad un massimo di 53 °C / 127 F, rispetto alla media di 43.2 °C / 110 F
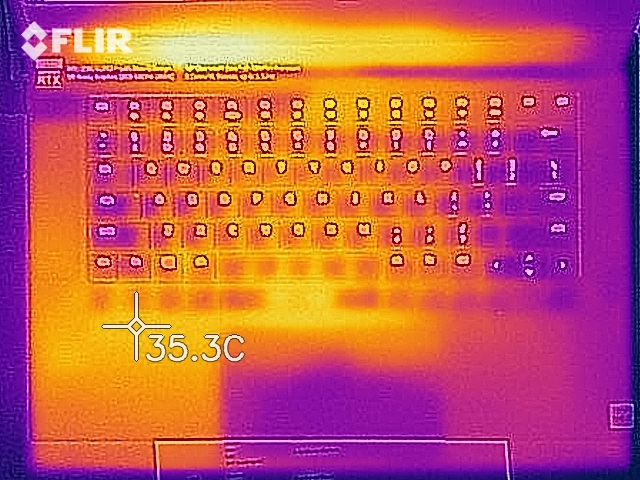
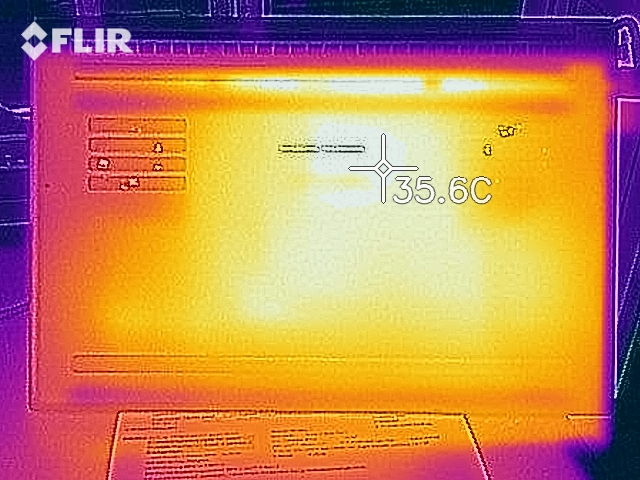
(+) In idle, la temperatura media del lato superiore è di 28.3 °C / 83 F, rispetto alla media deld ispositivo di 33.9 °C / 93 F.
(-) Riproducendo The Witcher 3, la temperatura media per il lato superiore e' di 39.9 °C / 104 F, rispetto alla media del dispositivo di 33.9 °C / 93 F.
(-) I poggiapolsi e il touchpad possono diventare molto caldi al tatto con un massimo di 41.2 °C / 106.2 F.
(-) La temperatura media della zona del palmo della mano di dispositivi simili e'stata di 28.8 °C / 83.8 F (-12.4 °C / -22.4 F).
| Razer Blade 15 RTX 2080 Super Max-Q i7-10875H, GeForce RTX 2080 Super Max-Q | Razer Blade 15 RTX 2080 Max-Q i7-9750H, GeForce RTX 2080 Max-Q | Asus Zephyrus S GX531GX i7-8750H, GeForce RTX 2080 Max-Q | Gigabyte Aero 15 OLED XB-8DE51B0SP i7-10875H, GeForce RTX 2070 Super Max-Q | MSI GE66 Raider 10SFS i9-10980HK, GeForce RTX 2070 Super Mobile | Schenker XMG Neo 15 XNE15M19 i7-9750H, GeForce RTX 2070 Max-Q | Media NVIDIA GeForce RTX 2080 Super Max-Q | Media della classe Gaming | |
|---|---|---|---|---|---|---|---|---|
| Heat | 4% | 3% | 1% | -2% | -12% | 1% | 1% | |
| Maximum Upper Side * (°C) | 52 | 47 10% | 47 10% | 49 6% | 49 6% | 60 -15% | 47.9 ? 8% | 45.2 ? 13% |
| Maximum Bottom * (°C) | 53 | 49.2 7% | 48.6 8% | 61 -15% | 52 2% | 66 -25% | 51.9 ? 2% | 48 ? 9% |
| Idle Upper Side * (°C) | 29.3 | 28.6 2% | 28.8 2% | 27 8% | 30 -2% | 30 -2% | 30 ? -2% | 31.1 ? -6% |
| Idle Bottom * (°C) | 30.2 | 31.4 -4% | 33.2 -10% | 29 4% | 34 -13% | 32 -6% | 31 ? -3% | 34.2 ? -13% |
* ... Meglio usare valori piccoli
Altoparlanti
Razer Blade 15 RTX 2080 Super Max-Q analisi audio
(±) | potenza degli altiparlanti media ma buona (74.9 dB)
Bassi 100 - 315 Hz
(-) | quasi nessun basso - in media 15.1% inferiori alla media
(±) | la linearità dei bassi è media (10.9% delta rispetto alla precedente frequenza)
Medi 400 - 2000 Hz
(±) | medi elevati - circa 7.2% superiore alla media
(+) | medi lineari (6.9% delta rispetto alla precedente frequenza)
Alti 2 - 16 kHz
(+) | Alti bilanciati - appena 2.4% dalla media
(+) | alti lineari (5.1% delta rispetto alla precedente frequenza)
Nel complesso 100 - 16.000 Hz
(±) | la linearità complessiva del suono è media (19.5% di differenza rispetto alla media
Rispetto alla stessa classe
» 67% di tutti i dispositivi testati in questa classe è stato migliore, 7% simile, 26% peggiore
» Il migliore ha avuto un delta di 6%, medio di 18%, peggiore di 132%
Rispetto a tutti i dispositivi testati
» 48% di tutti i dispositivi testati in questa classe è stato migliore, 7% similare, 44% peggiore
» Il migliore ha avuto un delta di 4%, medio di 24%, peggiore di 134%
Gestione energetica - il Blade Advanced ha una decente autonomia
Consumo energetico
Registriamo un consumo massimo di potenza di 15,8 watt in caso di utilizzo a vuoto. Lo stress test e il nostro test The Witcher 3, rispettivamente, fanno aumentare l'assorbimento fino a 169 watt e 146 watt in media (da 141 a 151 watt). La potenza nominale dell'alimentatore è di 230 watt.
| Off / Standby | |
| Idle | |
| Sotto carico |
|
Leggenda:
min: | |
| Razer Blade 15 RTX 2080 Super Max-Q i7-10875H, GeForce RTX 2080 Super Max-Q | Razer Blade 15 RTX 2080 Max-Q i7-9750H, GeForce RTX 2080 Max-Q | Asus Zephyrus S GX531GX i7-8750H, GeForce RTX 2080 Max-Q | Gigabyte Aero 15 OLED XB-8DE51B0SP i7-10875H, GeForce RTX 2070 Super Max-Q | MSI GE66 Raider 10SFS i9-10980HK, GeForce RTX 2070 Super Mobile | Schenker XMG Neo 15 XNE15M19 i7-9750H, GeForce RTX 2070 Max-Q | Media NVIDIA GeForce RTX 2080 Super Max-Q | Media della classe Gaming | |
|---|---|---|---|---|---|---|---|---|
| Power Consumption | -12% | -33% | -52% | -17% | -4% | -28% | -31% | |
| Idle Minimum * (Watt) | 10.6 | 12.5 -18% | 16.1 -52% | 18 -70% | 6 43% | 11 -4% | 12.9 ? -22% | 13.2 ? -25% |
| Idle Average * (Watt) | 13.1 | 15.3 -17% | 20.9 -60% | 21 -60% | 14 -7% | 15 -15% | 17.3 ? -32% | 18.9 ? -44% |
| Idle Maximum * (Watt) | 15.8 | 20.7 -31% | 27 -71% | 38 -141% | 25 -58% | 21 -33% | 26.9 ? -70% | 24.3 ? -54% |
| Load Average * (Watt) | 131 | 90.2 31% | 93.4 29% | 113 14% | 108 18% | 94 28% | 123.9 ? 5% | 108 ? 18% |
| Witcher 3 ultra * (Watt) | 146 | 162 -11% | 168.2 -15% | 149 -2% | 195 -34% | 143 2% | ||
| Load Maximum * (Watt) | 169 | 209.3 -24% | 215.3 -27% | 256 -51% | 280 -66% | 173 -2% | 205 ? -21% | 254 ? -50% |
* ... Meglio usare valori piccoli
Autonomia della batteria
Questo gaming laptop raggiunge una autonomia di 6:06 h nel nostro test pratico WLAN (accesso ai siti web tramite uno script). Inoltre, quetso 15,6 pollici completa il nostro test video dopo le 7:17 h. Qui lasciamo girare il cortometraggio Big Buck Bunny (codifica H.264, 1920x1080 pixel) in un ciclo continuo. Condizioni del test: Le funzioni di risparmio energetico e i moduli wireless (solo durante il test video) sono disattivati; la luminosità del display è regolata a circa 150 cd/m².
| Razer Blade 15 RTX 2080 Super Max-Q i7-10875H, GeForce RTX 2080 Super Max-Q, 80 Wh | Razer Blade 15 RTX 2080 Max-Q i7-9750H, GeForce RTX 2080 Max-Q, 80 Wh | Asus Zephyrus S GX531GX i7-8750H, GeForce RTX 2080 Max-Q, 50 Wh | Gigabyte Aero 15 OLED XB-8DE51B0SP i7-10875H, GeForce RTX 2070 Super Max-Q, 94.2 Wh | MSI GE66 Raider 10SFS i9-10980HK, GeForce RTX 2070 Super Mobile, 99.99 Wh | Schenker XMG Neo 15 XNE15M19 i7-9750H, GeForce RTX 2070 Max-Q, 62 Wh | Razer Blade 15 RZ09-0328 i7-10750H, GeForce RTX 2070 Max-Q, 65 Wh | Media della classe Gaming | |
|---|---|---|---|---|---|---|---|---|
| Autonomia della batteria | 27% | -51% | 15% | -6% | -18% | -34% | 1% | |
| Reader / Idle (h) | 8.7 | 15.9 83% | 8.6 -1% | 7.6 -13% | 7.3 -16% | 8.71 ? 0% | ||
| H.264 (h) | 7.3 | 8.26 ? 13% | ||||||
| WiFi v1.3 (h) | 6.1 | 6.6 8% | 3 -51% | 6.1 0% | 6.1 0% | 5.7 -7% | 4 -34% | 7.02 ? 15% |
| Load (h) | 1.9 | 1.7 -11% | 2.8 47% | 1.8 -5% | 1.3 -32% | 1.47 ? -23% |
Pro
Contro
Giudizio Complessivo
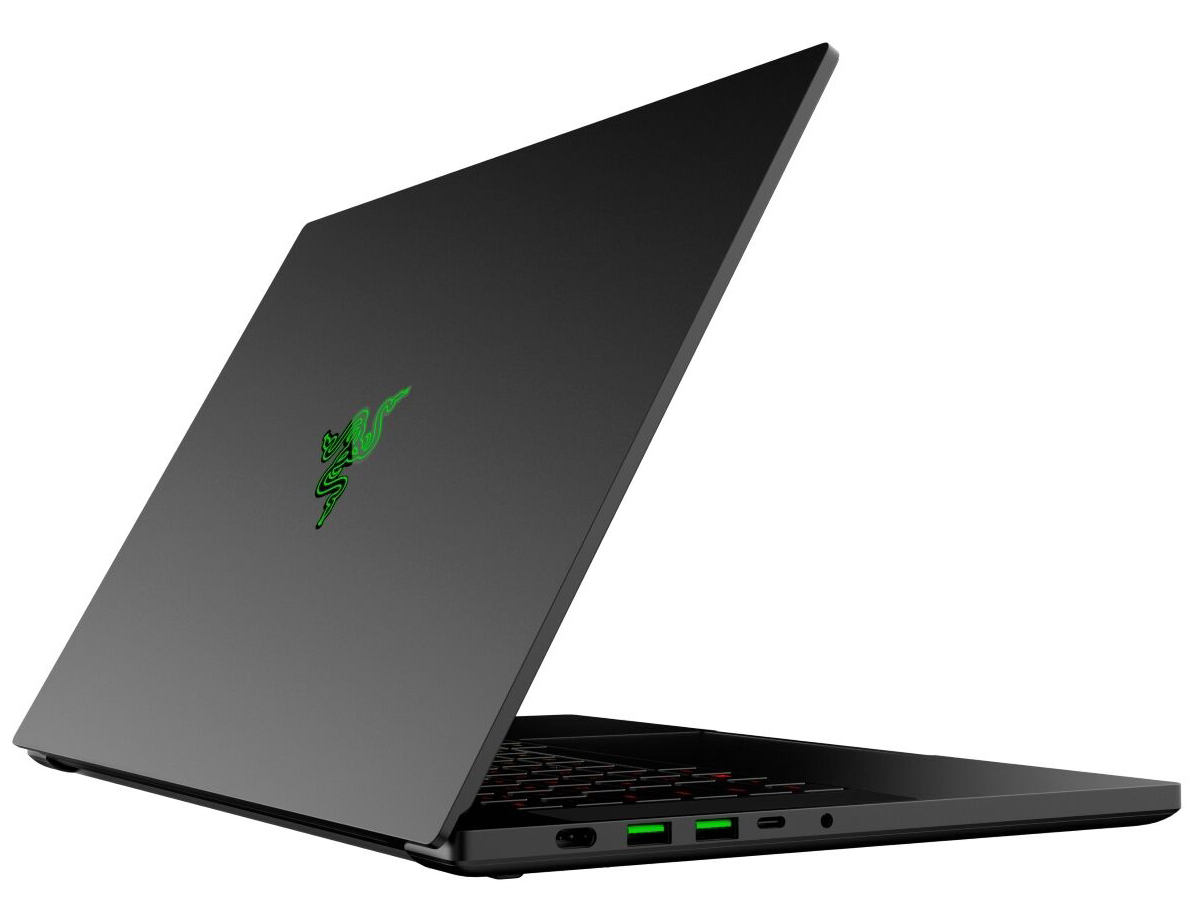
Razer racchiude molta potenza di calcolo in un elegante e sottile case metallico. Grazie al processore Core i7-10875H e alla GPU GeForce RTX 2080 Super Max-Q, questo laptop è in grado di gestire tutti i giochi più recenti. Non è necessario scendere a compromessi in termini di impostazioni di qualità. Se a un certo punto la GPU non dovesse più soddisfare le vostre esigenze, è possibile collegare una GPU esterna tramite la porta Thunderbolt 3.
Con il Blade 15 Advanced Model (2020), Razer ha scelto di realizzare miglioramenti di dettaglio che ripagano.
Il modello 2020 Blade 15 è dotato della tecnologia USB 3.2 Gen 2, e tutte le porte USB Type-A funzionano secondo questo standard. Questo vale anche per la nuova porta USB Type-C aggiunta (DisplayPort, Power Delivery). Quest'ultima ha sostituito la vecchia Mini DisplayPort. Inoltre, sia la porta Thunderbolt 3 che la porta USB Type-C 3.2 Gen 2 consentono di caricare la batteria. Siamo stati in grado di ricaricare con un alimentatore da 45 watt in ogni caso. L'utilizzo delle due porte per alimentare completamente il portatile non è possibile in quanto è possibile trasferire un massimo di 100 watt di potenza.
Anche il display IPS Full HD a 300 Hz opaco è una delle innovazioni rispetto al modello precedente. Il display si fa notare con angoli di visualizzazione stabili, luminosità sufficiente, buon contrasto, tempi di risposta rapidi e grande riproduzione dei colori. Anche la copertura dello spazio colore è piacevole.
Razer Blade 15 RTX 2080 Super Max-Q
- 08/10/2020 v7 (old)
Sascha Mölck
