Recensione del Laptop Razer Blade 15 GeForce RTX 2070 Super Max-Q: Stesso Laptop, ma più veloce
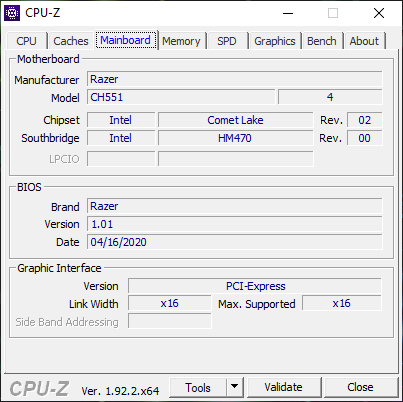
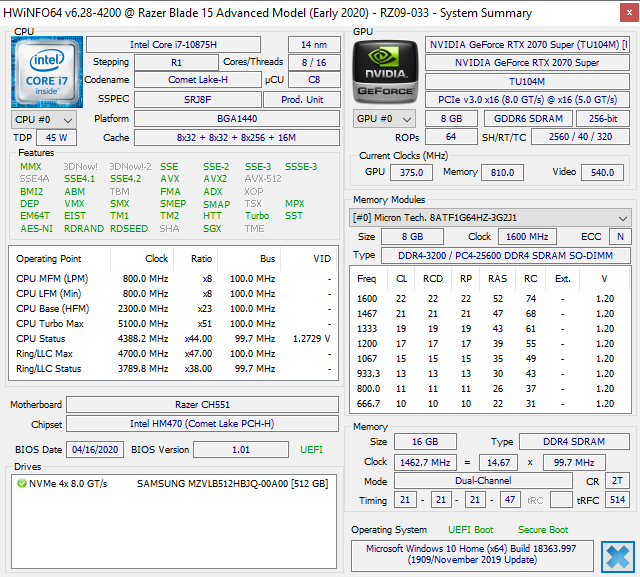
La serie 2020 Razer Blade 15 si distingue dai modelli precedenti principalmente per le sue GPU GeForce Super Max-Q e le opzioni Intel Comet Lake-H di 10° generazione. Per il resto, il modello è quasi identico esteticametne al modello 2019. Date un'occhiata alla nostra recensione sul modello dell'anno scorso per saperne di più sul telaio e sulle altre caratteristiche fisiche del Blade 15.
La nostra unità qui viene fornita con la GPU GeForce RTX 2070 Super Max-Q per contrastare la configurazione di fascia alta RTX 2080 Super Max-Q che avevamo testato all'inizio di questo mese. Confronteremo le due SKU qui sotto per vedere quali differenze possono avere a parte il loro potenziale grafico.
Altre recensioni Razer:
Punteggio | Data | Modello | Peso | Altezza | Dimensione | Risoluzione | Prezzo |
|---|---|---|---|---|---|---|---|
| 86.9 % v7 (old) | 08/2020 | Razer Blade 15 RTX 2070 Super Max-Q i7-10875H, GeForce RTX 2070 Super Max-Q | 2.1 kg | 17.8 mm | 15.60" | 1920x1080 | |
| 82.8 % v7 (old) | 05/2020 | MSI GS66 Stealth 10SFS i9-10980HK, GeForce RTX 2070 Super Max-Q | 2.2 kg | 20 mm | 15.60" | 1920x1080 | |
| 81.3 % v7 (old) | 05/2019 | Asus Zephyrus S GX502GW i7-9750H, GeForce RTX 2070 Mobile | 2.1 kg | 19 mm | 15.60" | 1920x1080 | |
| 84 % v7 (old) | 05/2019 | Gigabyte Aero 15 Classic-XA i7-9750H, GeForce RTX 2070 Max-Q | 2.1 kg | 19 mm | 15.60" | 1920x1080 | |
| 84.8 % v7 (old) | 10/2019 | Lenovo Legion Y740-15ICHg i7-9750H, GeForce RTX 2070 Max-Q | 2.3 kg | 25 mm | 15.60" | 1920x1080 | |
| 83 % v7 (old) | 08/2020 | HP Envy 15-ep0098nr i7-10750H, GeForce RTX 2060 Max-Q | 2 kg | 19 mm | 15.60" | 3840x2160 |
Case
Lettore schede SD
| SD Card Reader | |
| average JPG Copy Test (av. of 3 runs) | |
| Razer Blade 15 RTX 2070 Super Max-Q (Toshiba Exceria Pro SDXC 64 GB UHS-II) | |
| Gigabyte Aero 15 Classic-XA (Toshiba Exceria Pro SDXC 64 GB UHS-II) | |
| HP Envy 15-ep0098nr (Toshiba Exceria Pro M501 UHS-II) | |
| maximum AS SSD Seq Read Test (1GB) | |
| Gigabyte Aero 15 Classic-XA (Toshiba Exceria Pro SDXC 64 GB UHS-II) | |
| Razer Blade 15 RTX 2070 Super Max-Q (Toshiba Exceria Pro SDXC 64 GB UHS-II) | |
| HP Envy 15-ep0098nr (Toshiba Exceria Pro M501 UHS-II) | |
Comunicazioni
| Networking | |
| iperf3 transmit AX12 | |
| MSI GS66 Stealth 10SFS | |
| HP Envy 15-ep0098nr | |
| Razer Blade 15 RTX 2070 Super Max-Q | |
| iperf3 receive AX12 | |
| HP Envy 15-ep0098nr | |
| Razer Blade 15 RTX 2070 Super Max-Q | |
| MSI GS66 Stealth 10SFS | |
Webcam


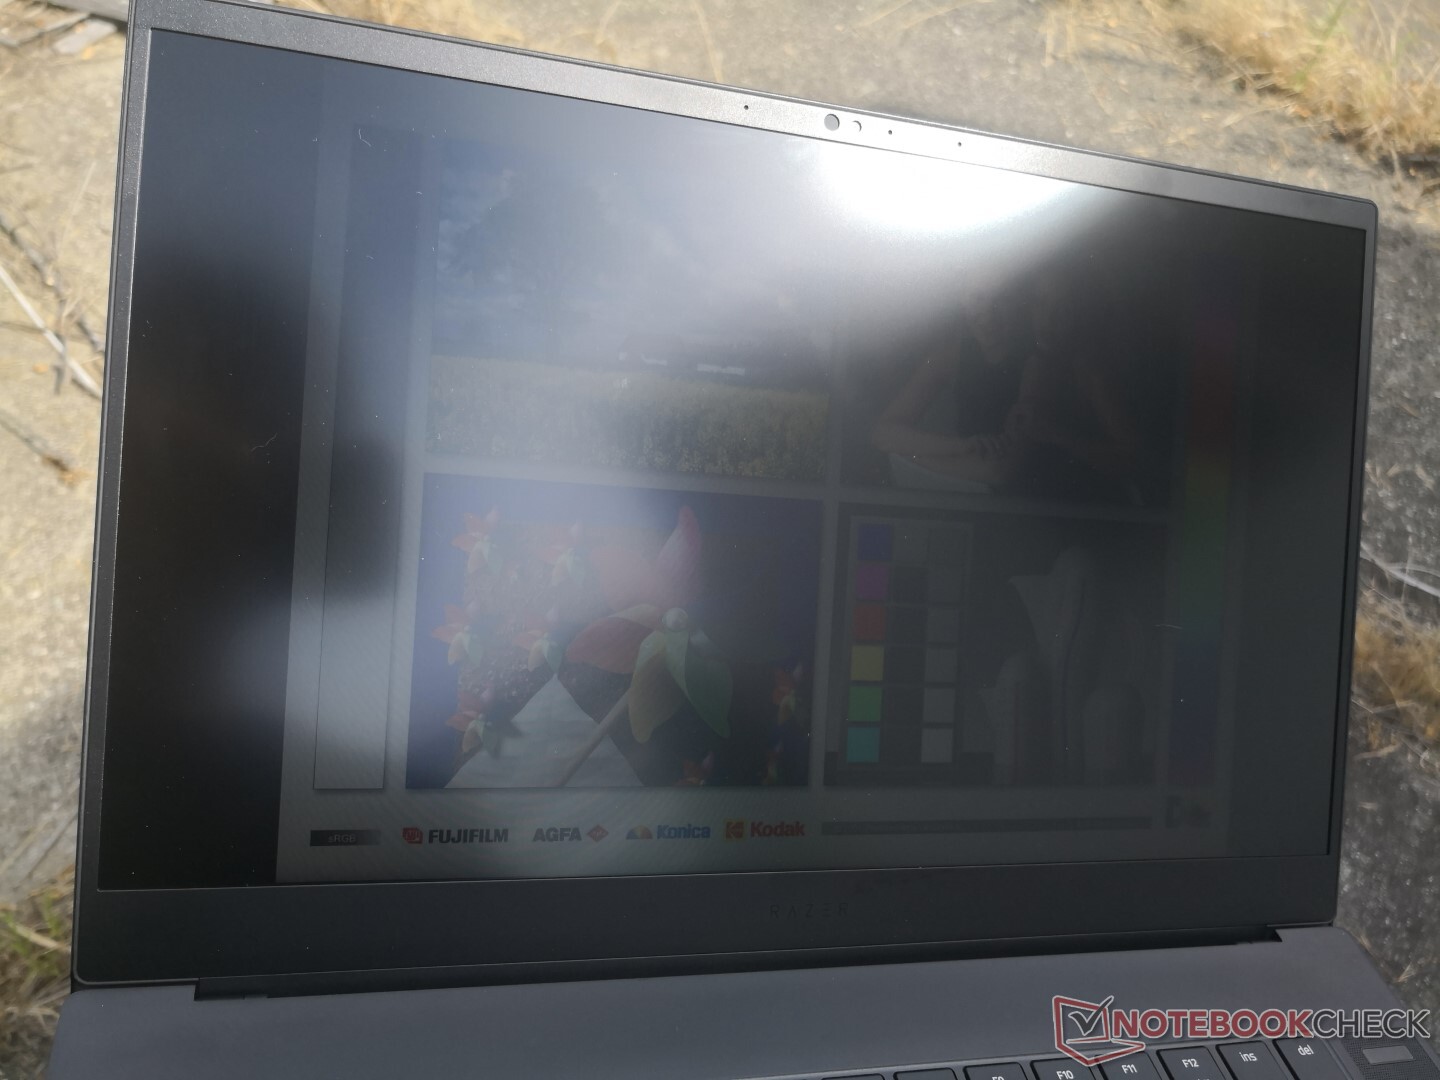
Display
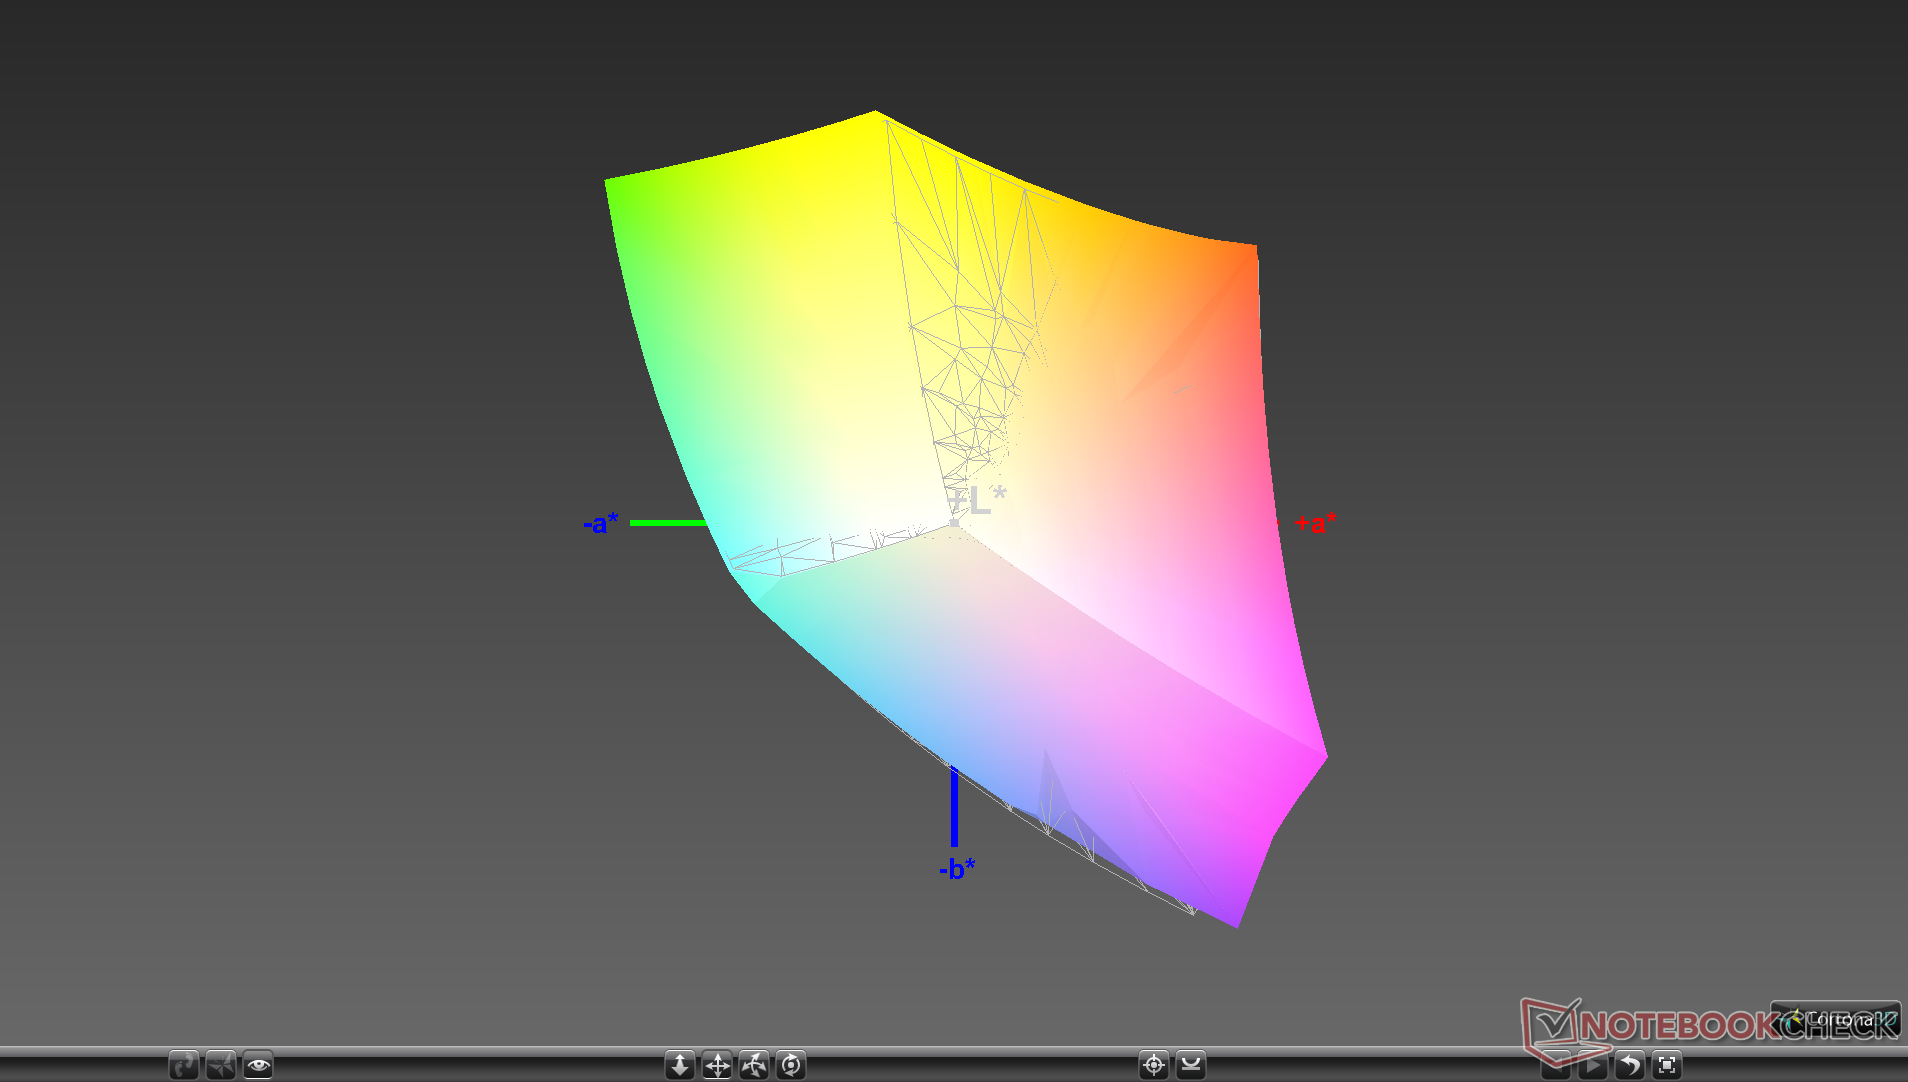
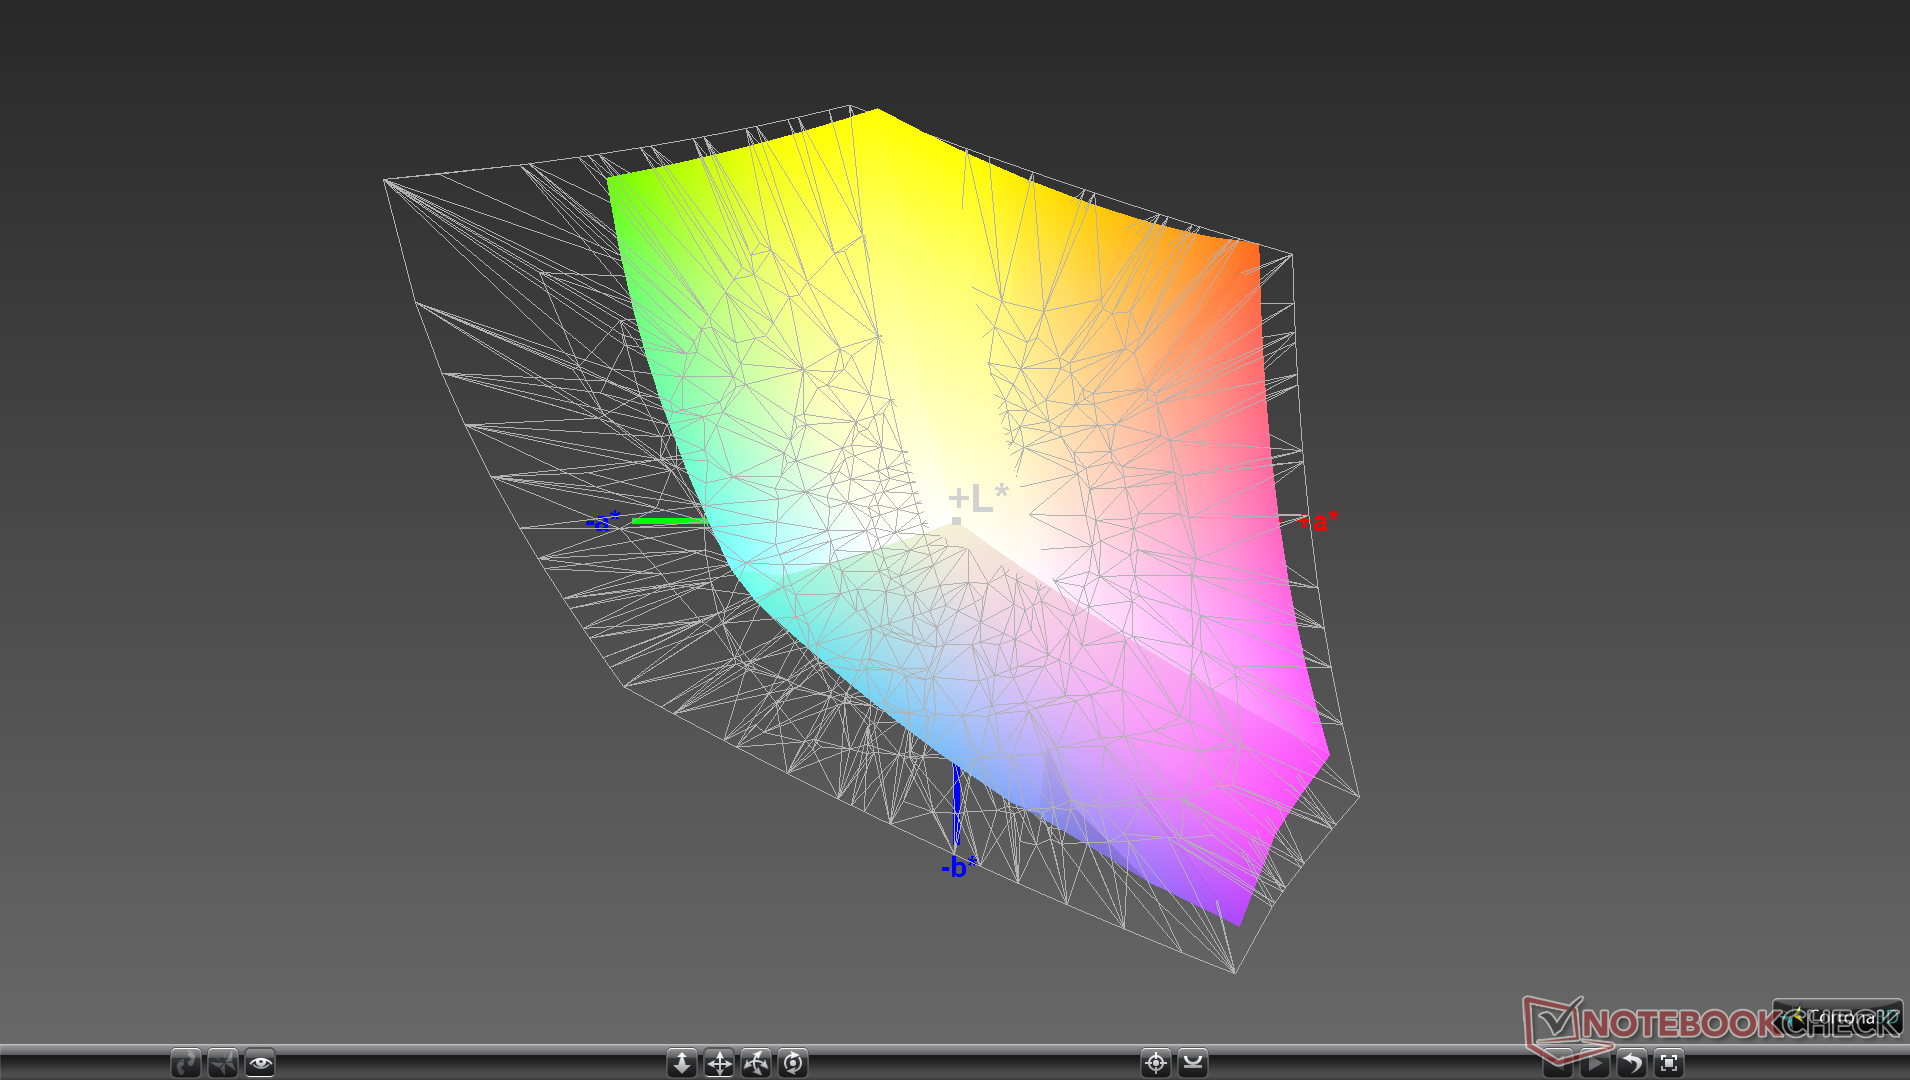
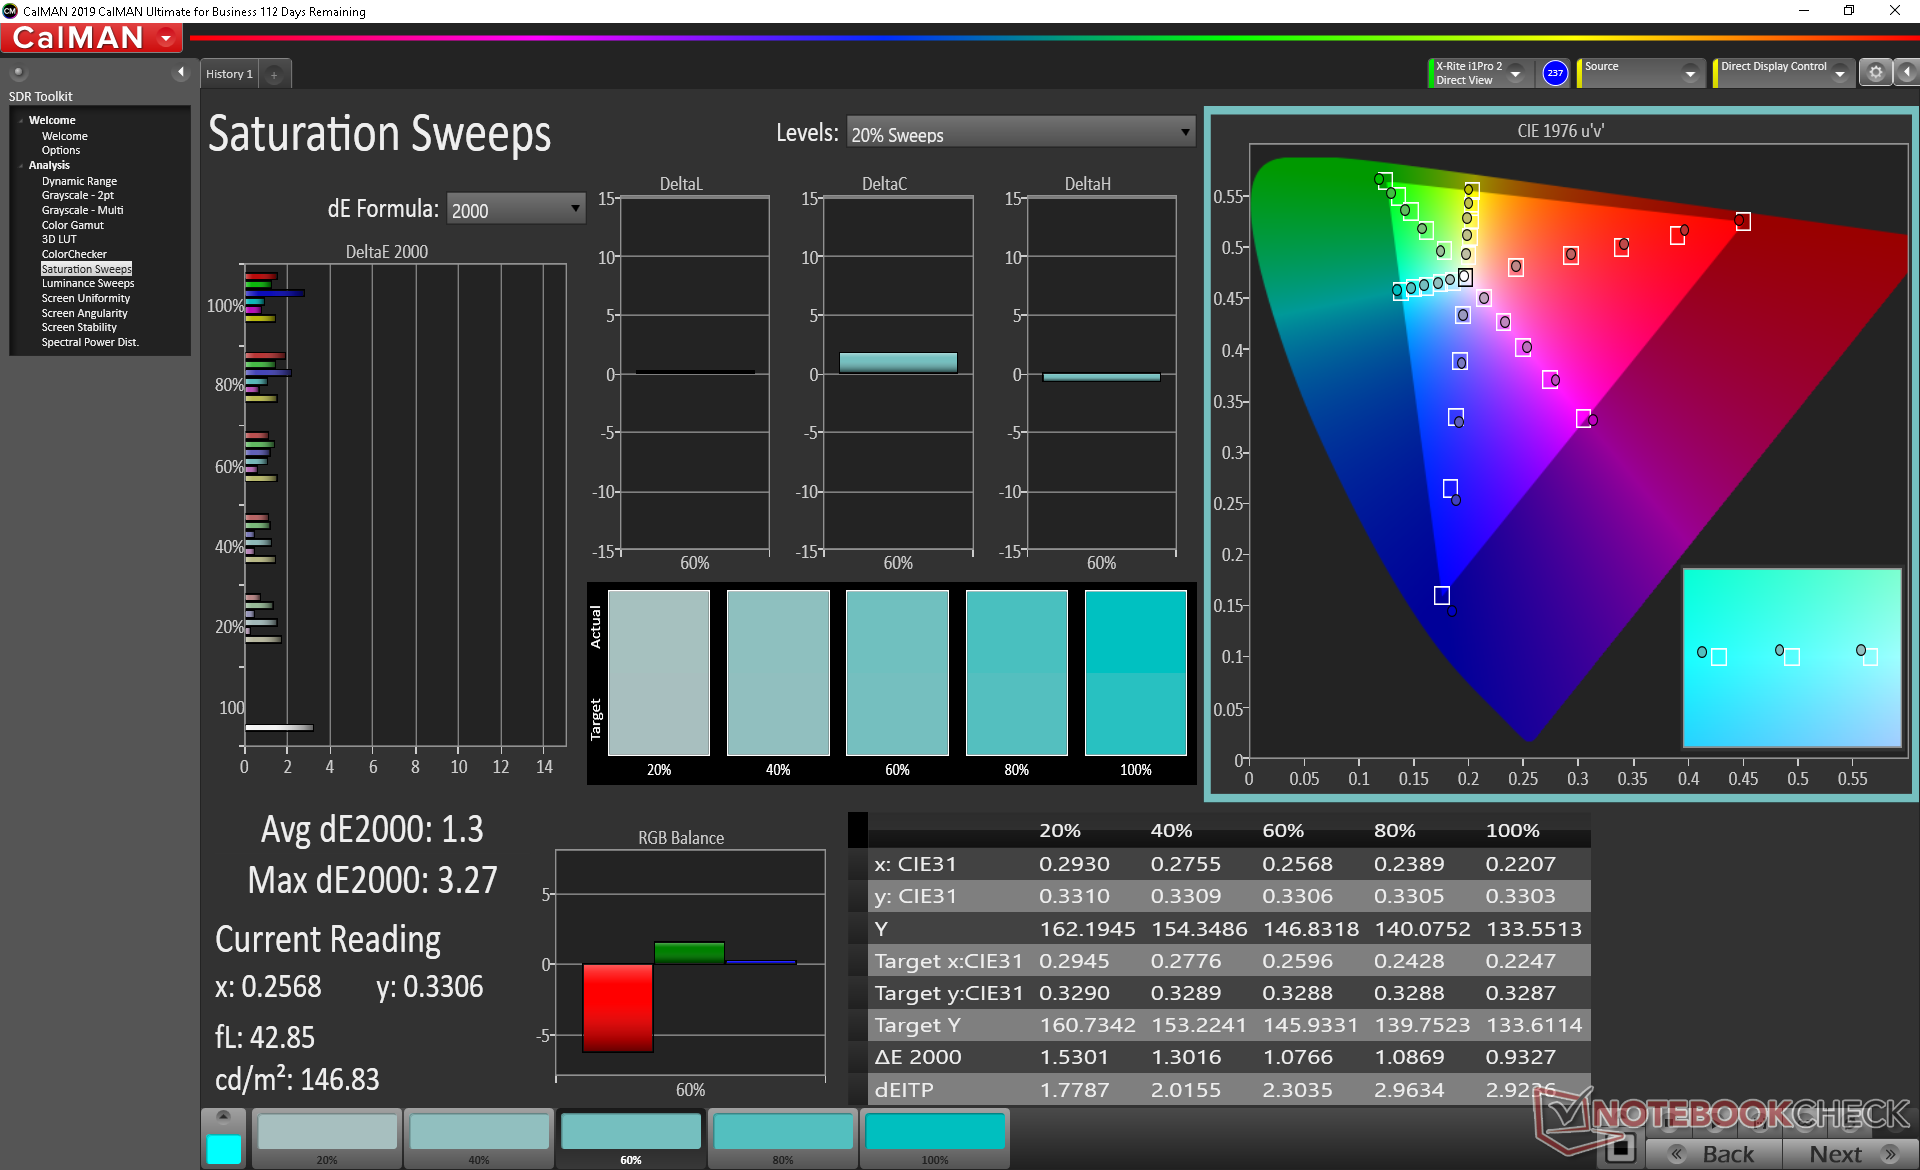
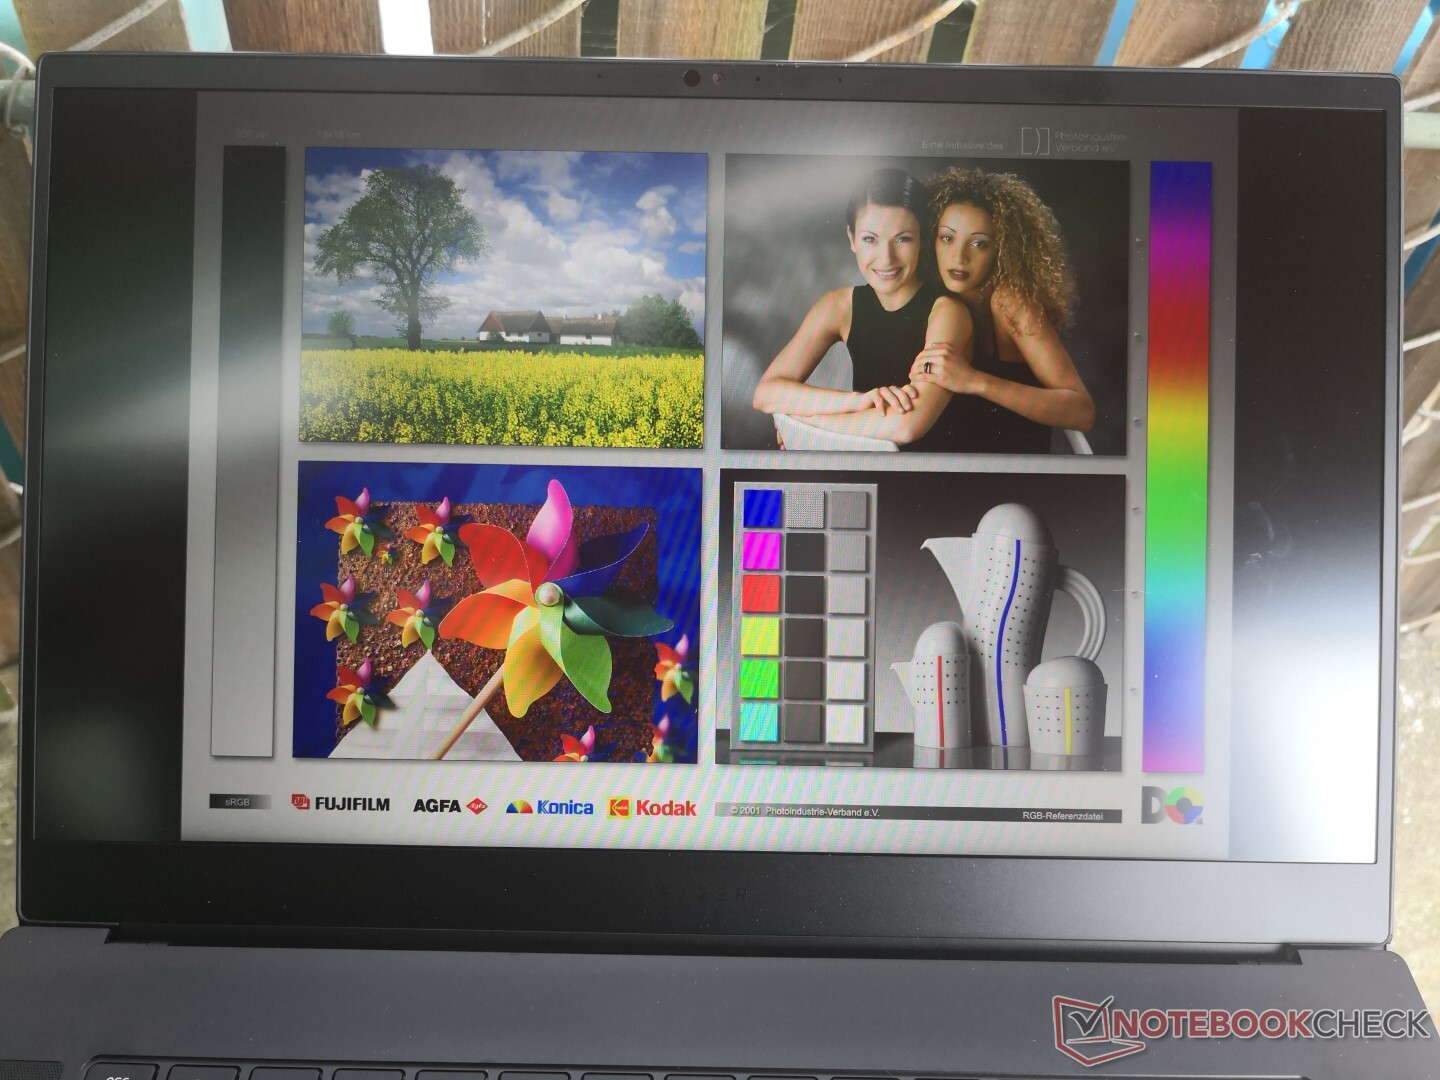
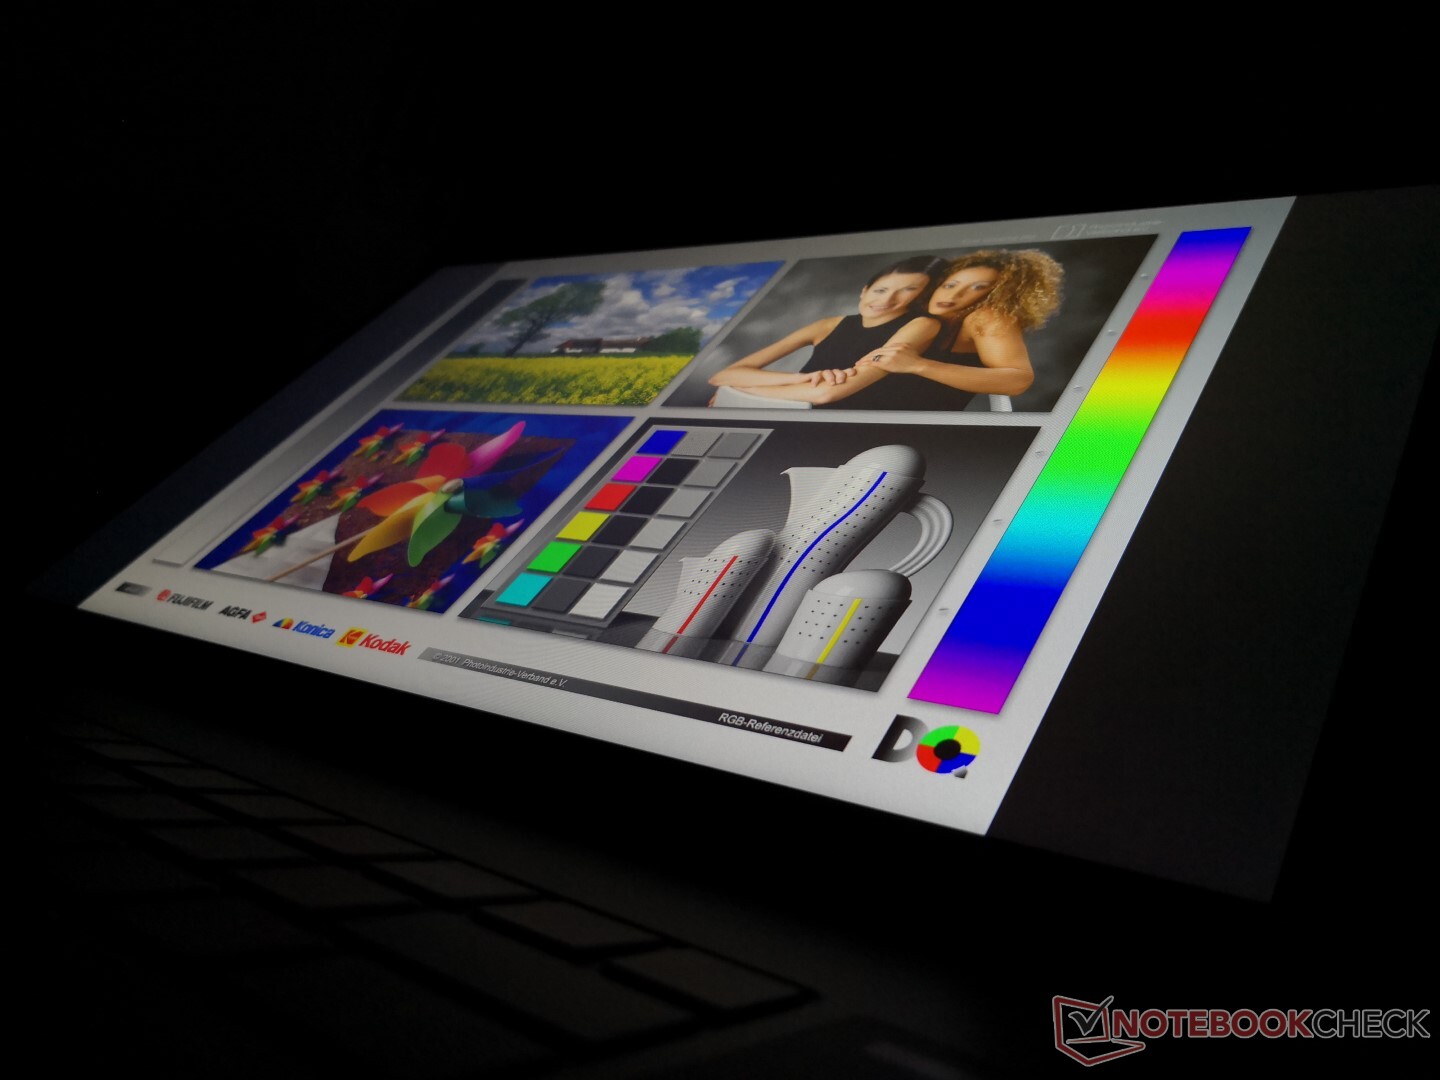
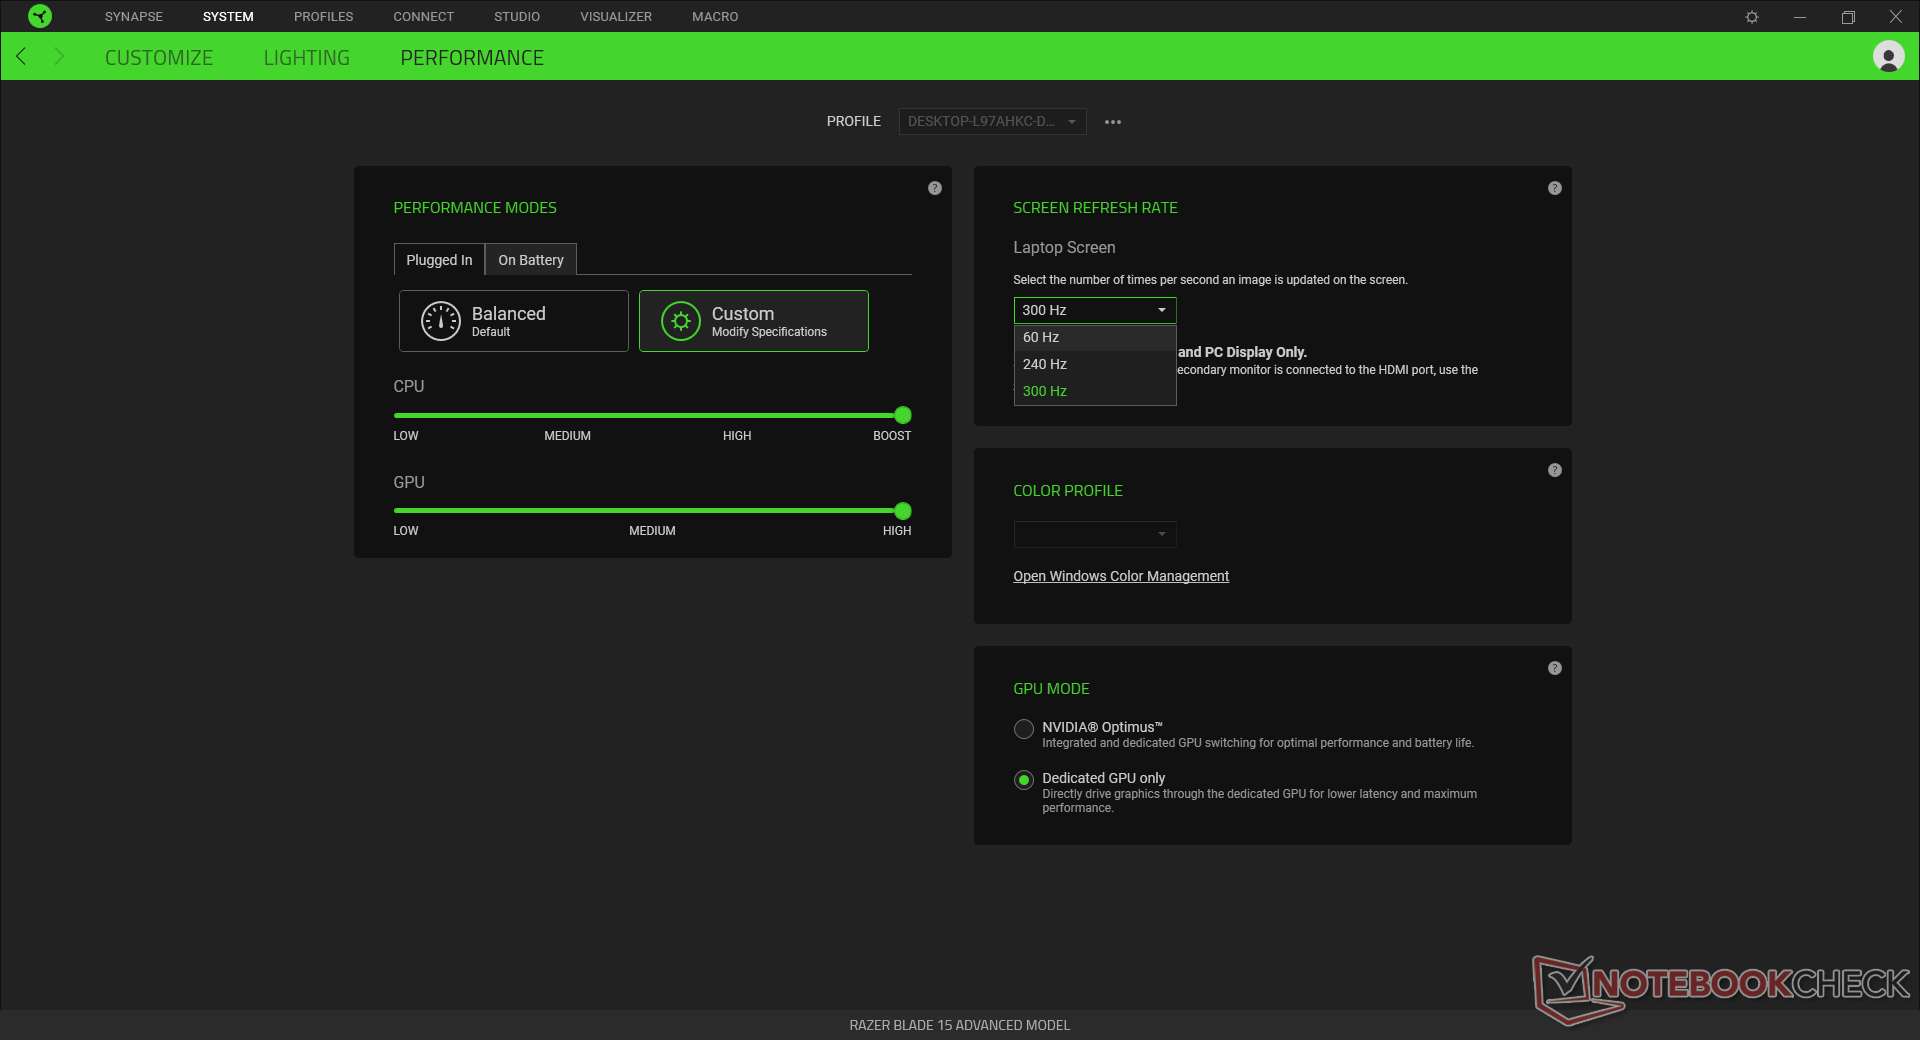
Il pannello AU Optronics B156HAN12.0 1080p 300 Hz si trova anche qui sull'Acer Predator Triton 500 e MSI GS66 per un'esperienza simile tra questi tre portatili gaming di punta. I rapidi tempi di risposta, l'elevata velocità di aggiornamento, l'elevato rapporto di contrasto e la completa copertura sRGB contribuiscono ad un pannello di fascia alta ultra-liscio. Forse l'inconveniente più notevole è il suo spazio colore più ristretto se paragonato ai pannelli IGZO AMOLED o 4K UHD Sharp IGZO che tendono a coprire completamente AdobeRGB o DCI-P3.


| |||||||||||||||||||||||||
Distribuzione della luminosità: 90 %
Al centro con la batteria: 345.4 cd/m²
Contrasto: 1016:1 (Nero: 0.34 cd/m²)
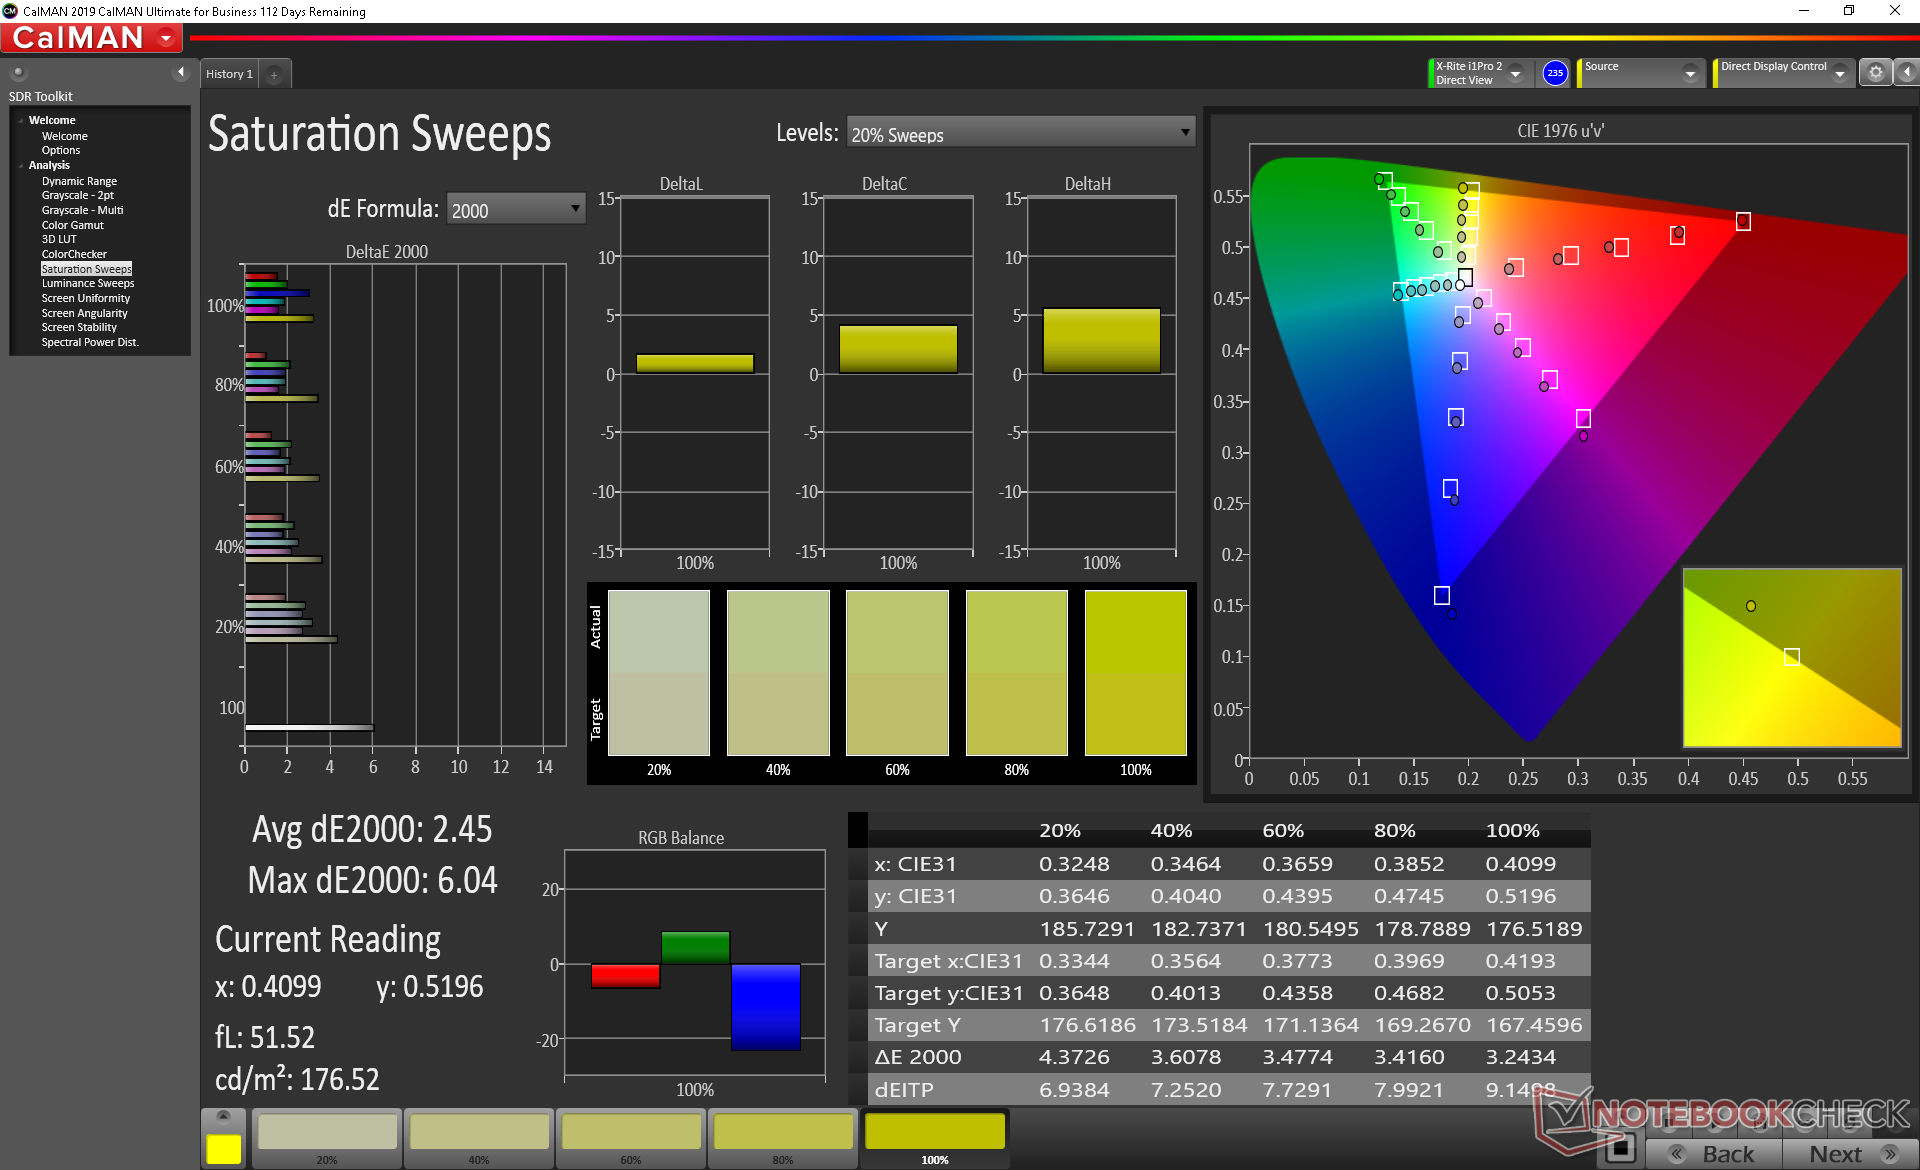
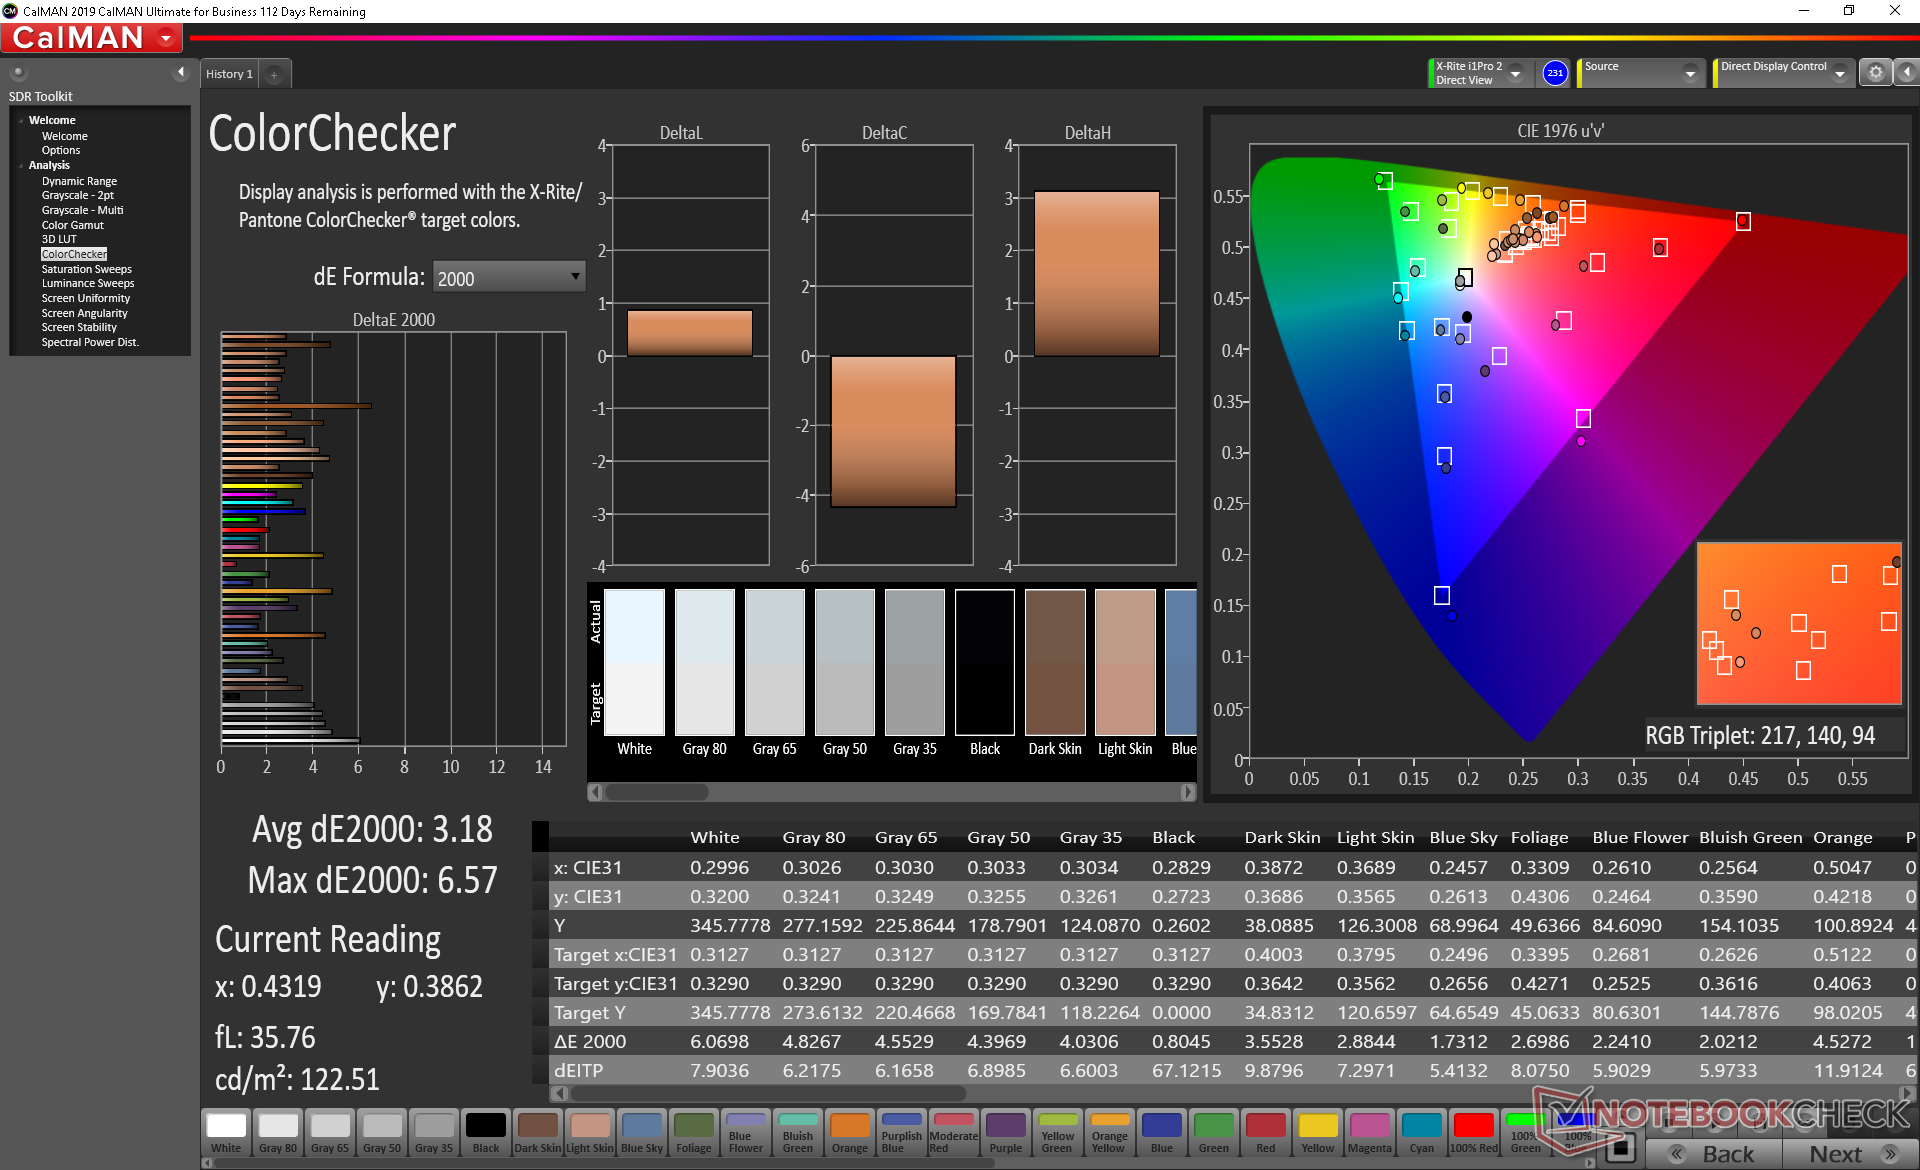
ΔE ColorChecker Calman: 3.18 | ∀{0.5-29.43 Ø4.71}
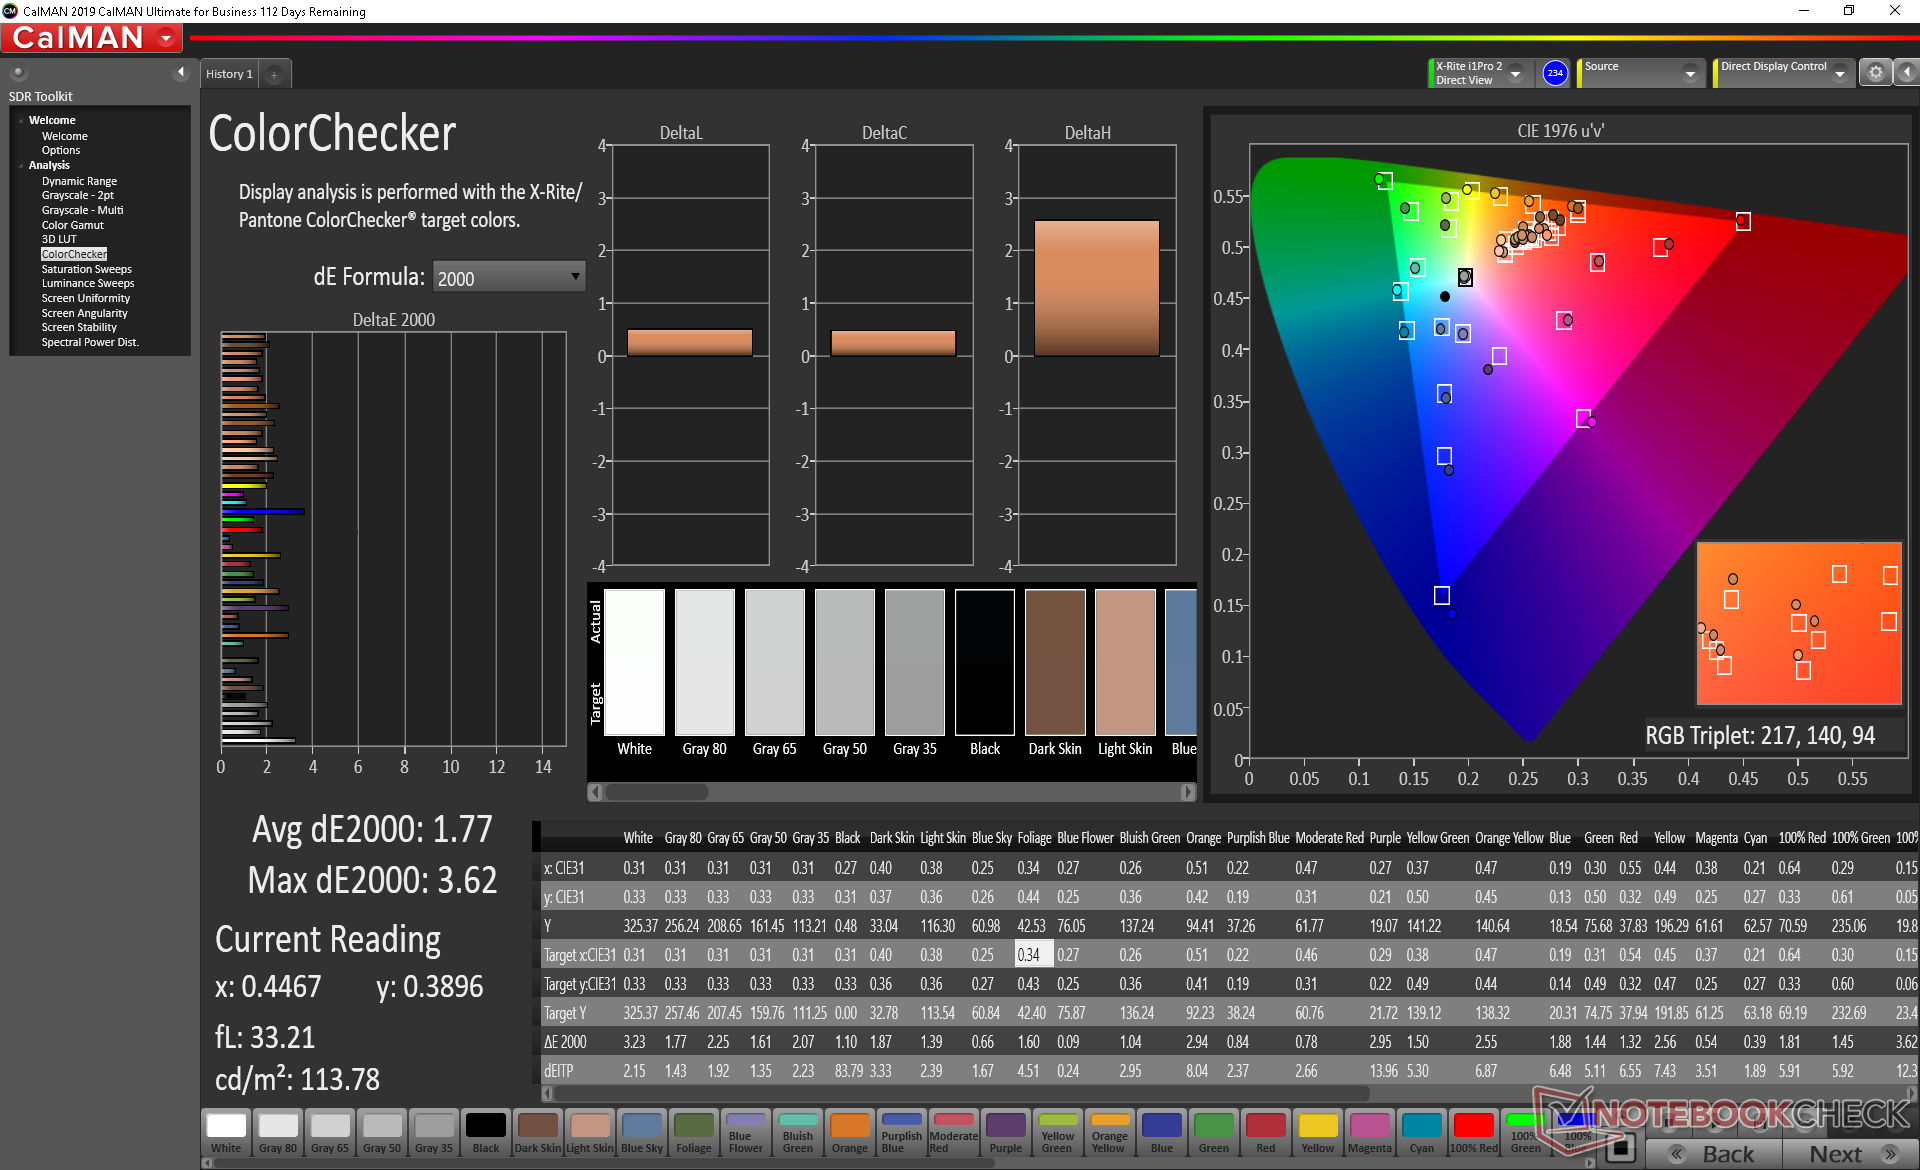
calibrated: 1.77
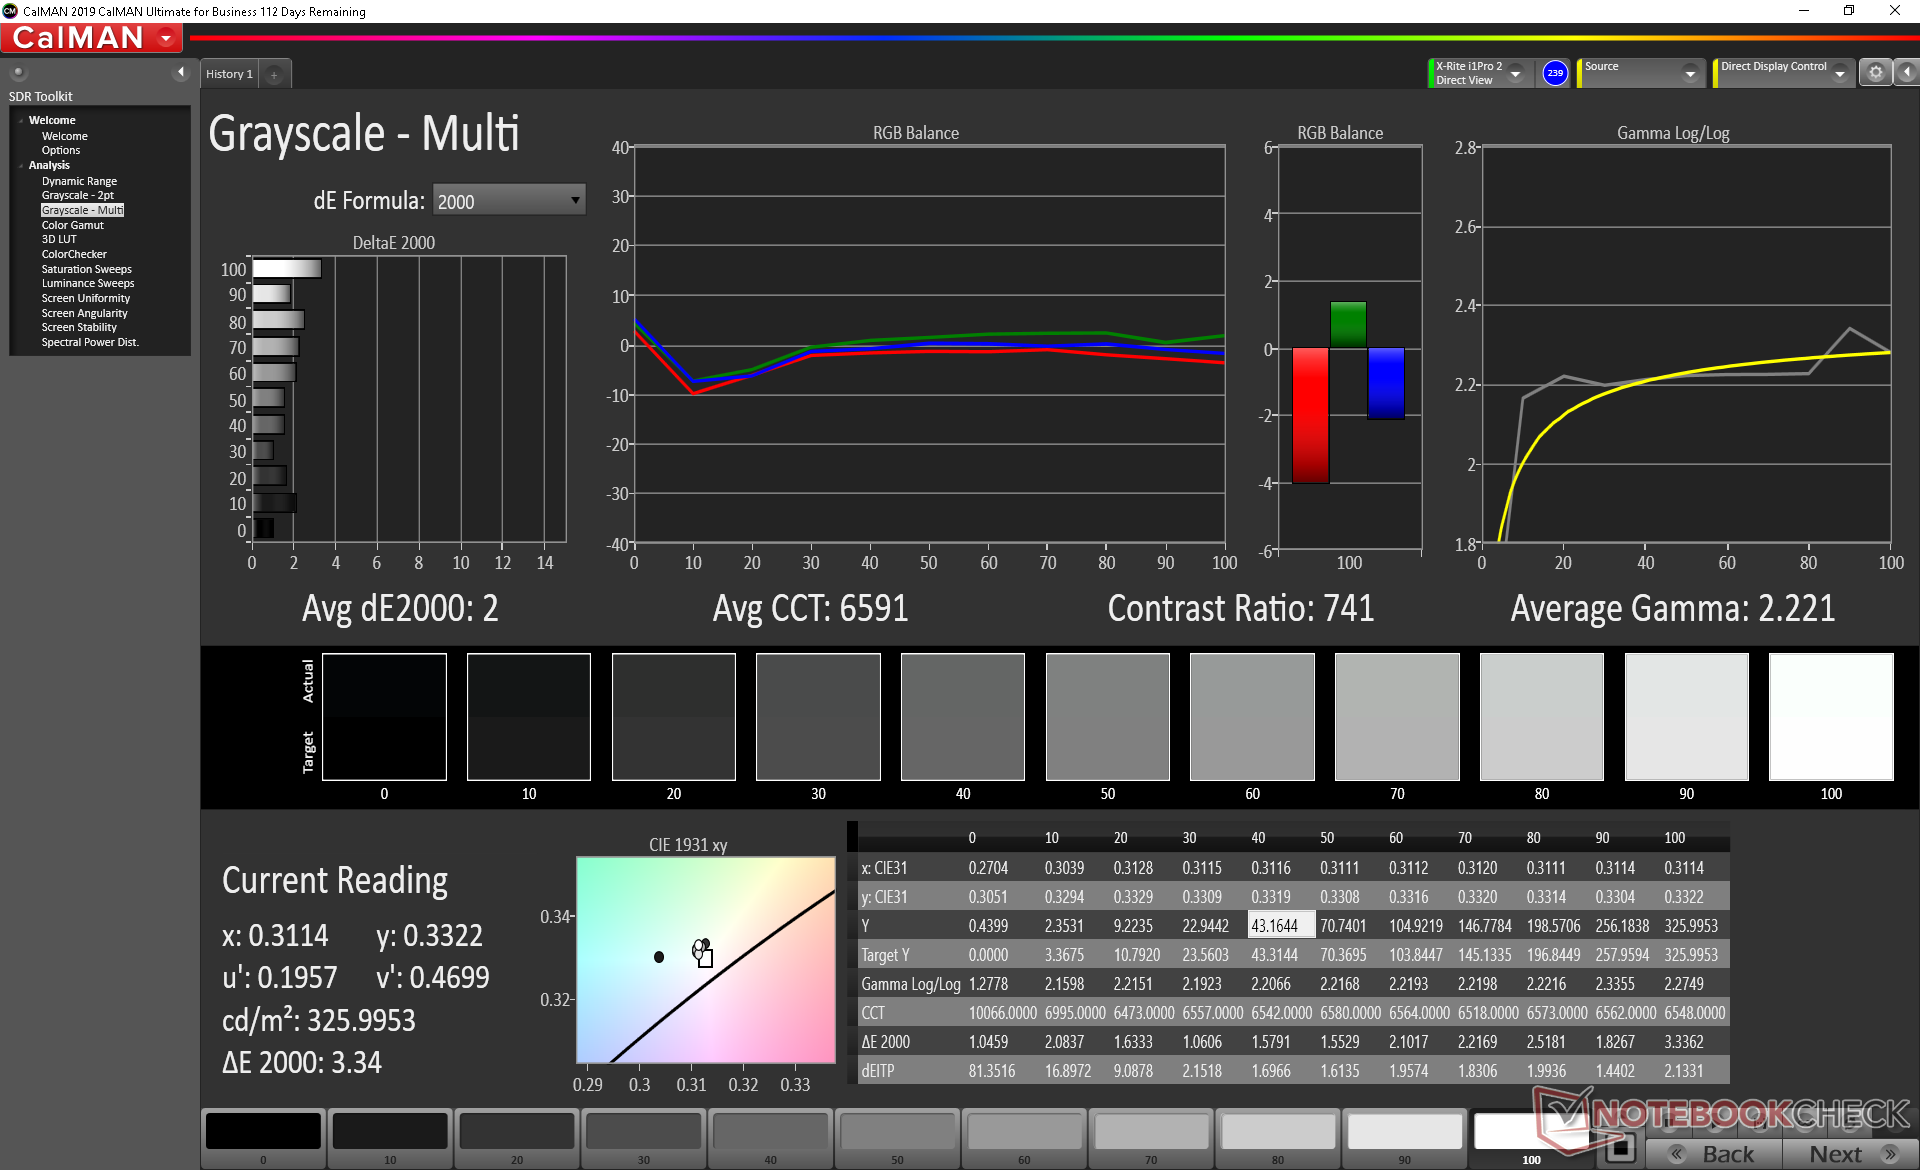
ΔE Greyscale Calman: 3.8 | ∀{0.09-98 Ø4.96}
99% sRGB (Argyll 1.6.3 3D)
64.3% AdobeRGB 1998 (Argyll 1.6.3 3D)
70.5% AdobeRGB 1998 (Argyll 3D)
98.8% sRGB (Argyll 3D)
69.4% Display P3 (Argyll 3D)
Gamma: 2.15
CCT: 7109 K
| Razer Blade 15 RTX 2070 Super Max-Q AU Optronics B156HAN12.0, IPS, 15.6", 1920x1080 | MSI GS66 Stealth 10SFS AUO B156HAN12.0 (AUO328E), IPS, 15.6", 1920x1080 | Asus Zephyrus S GX502GW AU Optronics B156HAN08.2 (AUO82ED), IPS, 15.6", 1920x1080 | Gigabyte Aero 15 Classic-XA Sharp LQ156M1JW03 (SHP14C5), IGZO, 15.6", 1920x1080 | Lenovo Legion Y740-15ICHg BOE NV156FHM-N4J, IPS, 15.6", 1920x1080 | HP Envy 15-ep0098nr Samsung SDC4145, AMOLED, 15.6", 3840x2160 | |
|---|---|---|---|---|---|---|
| Display | 0% | -7% | -5% | -5% | 24% | |
| Display P3 Coverage (%) | 69.4 | 69.5 0% | 64.9 -6% | 65.3 -6% | 67.7 -2% | 88.5 28% |
| sRGB Coverage (%) | 98.8 | 99.6 1% | 91 -8% | 95.5 -3% | 91.6 -7% | 100 1% |
| AdobeRGB 1998 Coverage (%) | 70.5 | 70.8 0% | 65.9 -7% | 66.5 -6% | 67.1 -5% | 99.9 42% |
| Response Times | -179% | -68% | -208% | -260% | 71% | |
| Response Time Grey 50% / Grey 80% * (ms) | 3.2 ? | 14 ? -338% | 7.2 ? -125% | 15.2 ? -375% | 19 ? -494% | 0.8 ? 75% |
| Response Time Black / White * (ms) | 8 ? | 9.6 ? -20% | 8.8 ? -10% | 11.2 ? -40% | 10 ? -25% | 2.7 ? 66% |
| PWM Frequency (Hz) | 23580 ? | 242.7 ? | ||||
| Screen | 9% | -1% | 1% | 17% | -18% | |
| Brightness middle (cd/m²) | 345.4 | 316 -9% | 286 -17% | 266 -23% | 477 38% | 374.3 8% |
| Brightness (cd/m²) | 342 | 311 -9% | 275 -20% | 248 -27% | 431 26% | 379 11% |
| Brightness Distribution (%) | 90 | 92 2% | 90 0% | 89 -1% | 84 -7% | 91 1% |
| Black Level * (cd/m²) | 0.34 | 0.21 38% | 0.37 -9% | 0.31 9% | 0.175 49% | |
| Contrast (:1) | 1016 | 1505 48% | 773 -24% | 858 -16% | 2726 168% | |
| Colorchecker dE 2000 * | 3.18 | 3.03 5% | 2.19 31% | 2.78 13% | 4.17 -31% | 5.47 -72% |
| Colorchecker dE 2000 max. * | 6.57 | 7.32 -11% | 4.4 33% | 5.96 9% | 6.97 -6% | 8.22 -25% |
| Colorchecker dE 2000 calibrated * | 1.77 | 1.1 38% | 2.27 -28% | 0.91 49% | 2.51 -42% | 4.61 -160% |
| Greyscale dE 2000 * | 3.8 | 3.9 -3% | 2.2 42% | 3.58 6% | 3.49 8% | 2.3 39% |
| Gamma | 2.15 102% | 2.42 91% | 2.41 91% | 2.46 89% | 2.5 88% | 2.09 105% |
| CCT | 7109 91% | 7439 87% | 6405 101% | 7186 90% | 7076 92% | 6340 103% |
| Color Space (Percent of AdobeRGB 1998) (%) | 64.3 | 65 1% | 59 -8% | 62 -4% | 60 -7% | 87.8 37% |
| Color Space (Percent of sRGB) (%) | 99 | 100 1% | 91 -8% | 96 -3% | 91 -8% | 100 1% |
| Media totale (Programma / Settaggio) | -57% /
-16% | -25% /
-10% | -71% /
-26% | -83% /
-22% | 26% /
4% |
* ... Meglio usare valori piccoli
Il display è ben calibrato con un valore medio DeltaE in scala di grigi di 3,8. Calibrarlo ulteriormente con il nostro colorimetro X-Rite migliorera sia la scala di grigi che i colori solo marginalmente.

Tempi di risposta del Display
| ↔ Tempi di risposta dal Nero al Bianco | ||
|---|---|---|
| 8 ms ... aumenta ↗ e diminuisce ↘ combinato | ↗ 4 ms Incremento | 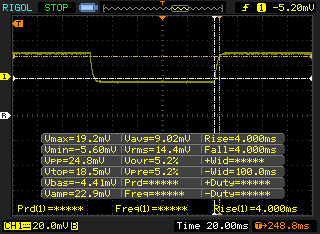 |
| ↘ 4 ms Calo | ||
| Lo schermo mostra veloci tempi di risposta durante i nostri tests e dovrebbe esere adatto al gaming In confronto, tutti i dispositivi di test variano da 0.1 (minimo) a 240 (massimo) ms. » 22 % di tutti i dispositivi è migliore. Questo significa che i tempi di risposta rilevati sono migliori rispettto alla media di tutti i dispositivi testati (19.8 ms). | ||
| ↔ Tempo di risposta dal 50% Grigio all'80% Grigio | ||
| 3.2 ms ... aumenta ↗ e diminuisce ↘ combinato | ↗ 1.4 ms Incremento | 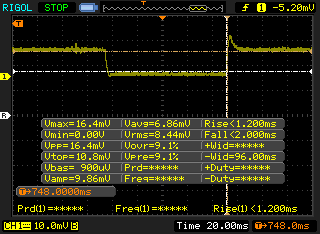 |
| ↘ 1.8 ms Calo | ||
| Lo schermo ha mostrato valori di risposta molto veloci nei nostri tests ed è molto adatto per i gaming veloce. In confronto, tutti i dispositivi di test variano da 0.165 (minimo) a 636 (massimo) ms. » 13 % di tutti i dispositivi è migliore. Questo significa che i tempi di risposta rilevati sono migliori rispettto alla media di tutti i dispositivi testati (31 ms). | ||
Sfarfallio dello schermo / PWM (Pulse-Width Modulation)
| flickering dello schermo / PWM non rilevato | 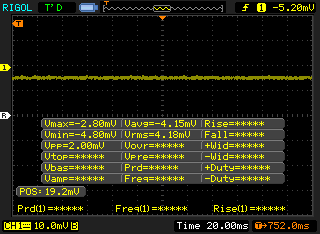 | ||
In confronto: 52 % di tutti i dispositivi testati non utilizza PWM per ridurre la luminosita' del display. Se è rilevato PWM, una media di 7747 (minimo: 5 - massimo: 343500) Hz è stata rilevata. | |||
Prestazioni
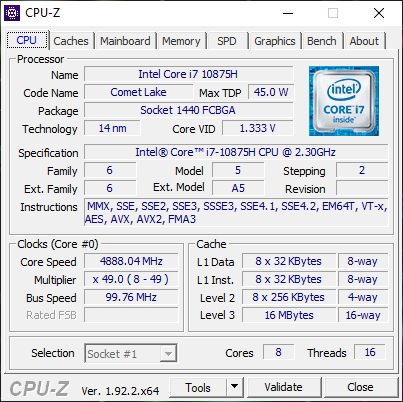
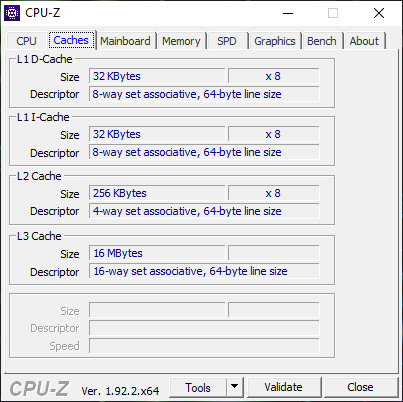
Processore
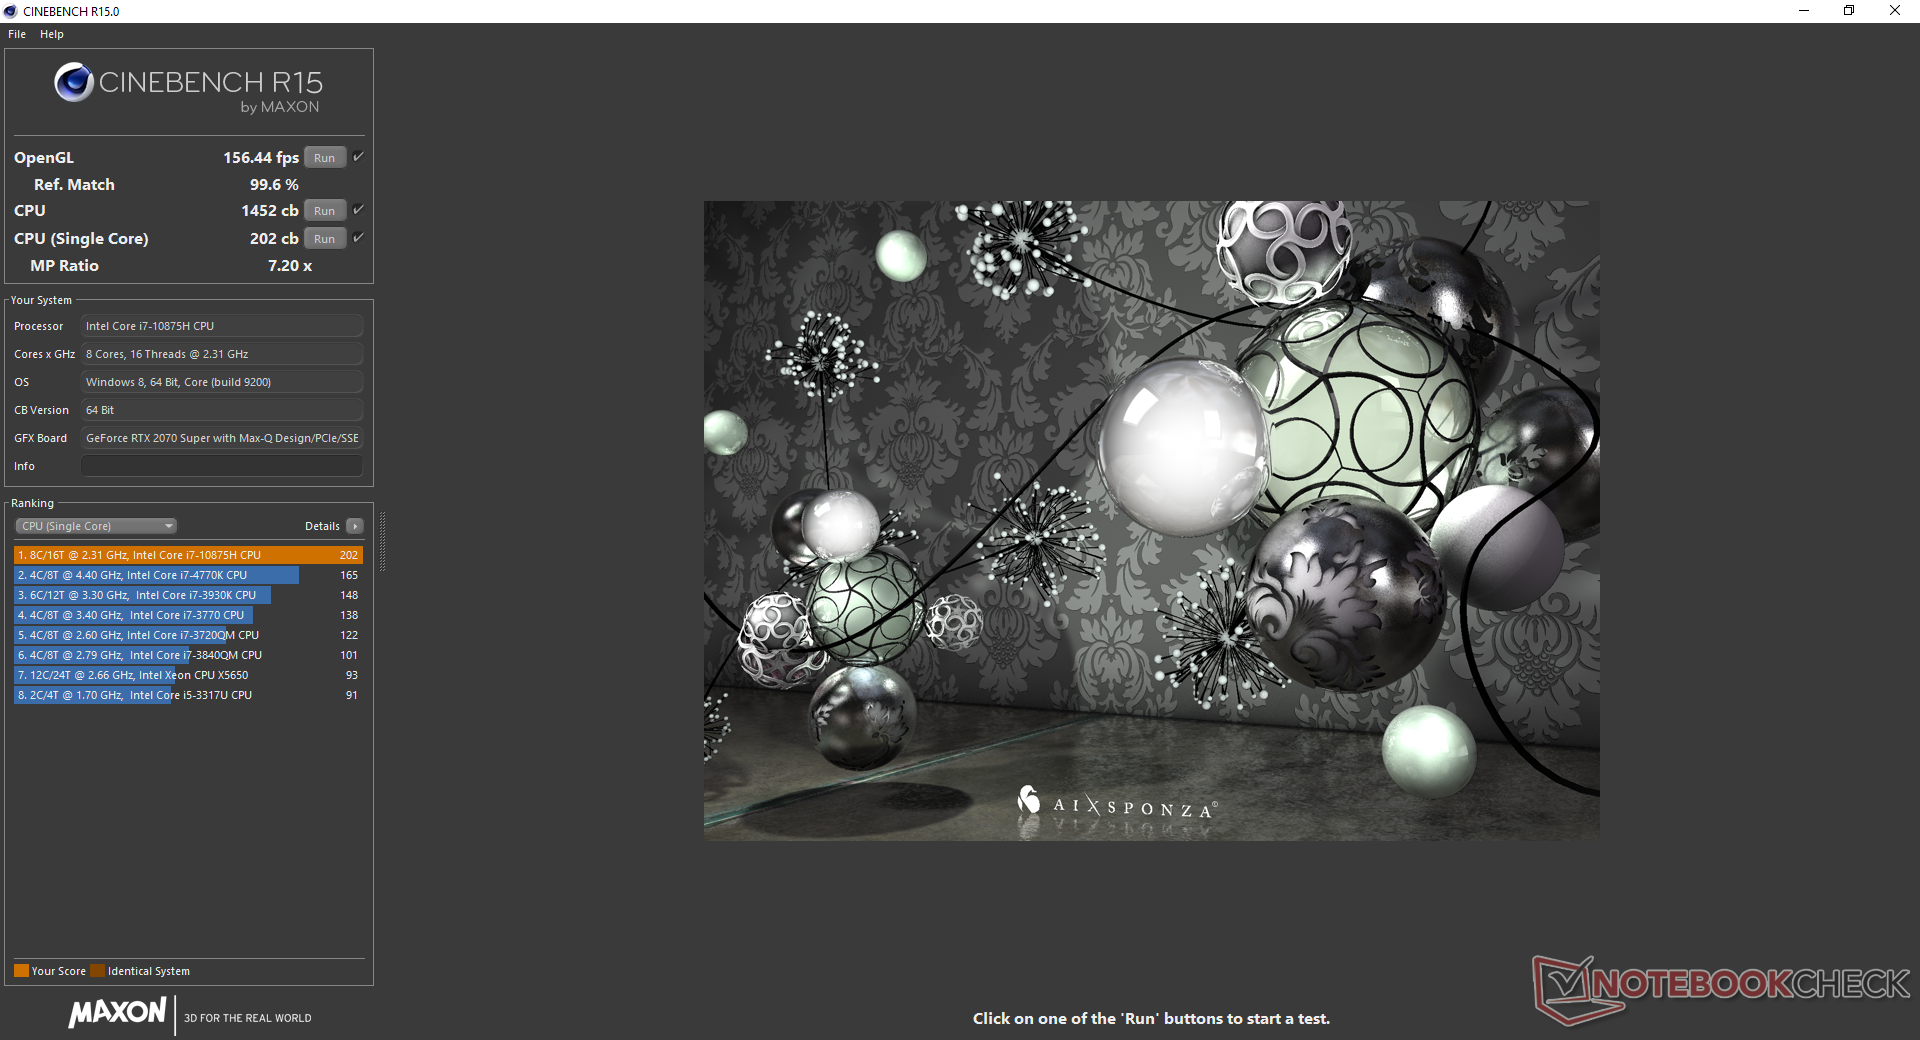
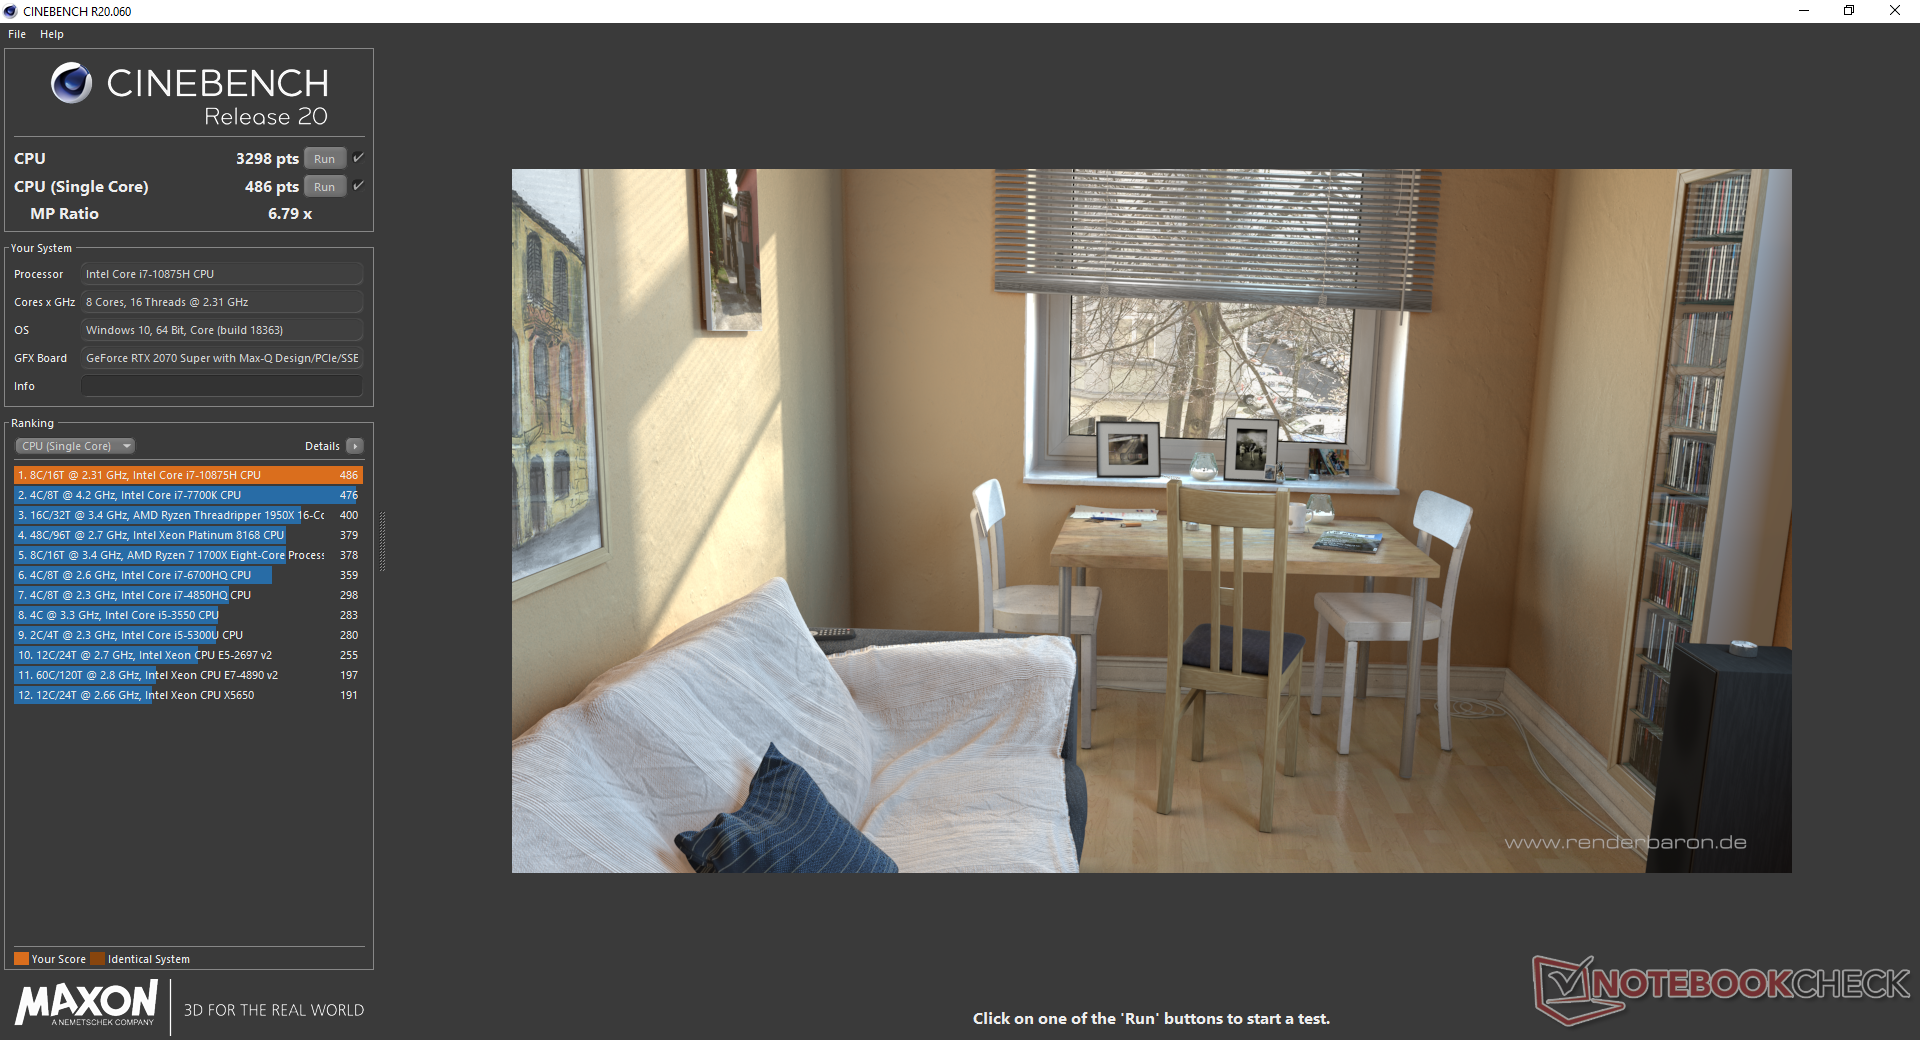
La CPU funziona molto bene fintanto che gli utenti impostano il sistema al massimo livello di prestazioni tramite Synapse. Ad esempio, le prestazioni multithread sono circa il 30% superiori rispetto alla stessa CPU del Blade 15 RTX 2080 Super Max-Q che gira sul profilo di potenza bilanciata. Tuttavia, alcuni portatili sono in grado di far funzionare il processore ancora più velocemente come il Gigabyte Aorus 15G, come dimostrano i risultati del nostro CineBench R15 xT loop test di CineBench.
Consultate la nostra pagina dedicata al Core i7-10875H per ulteriori informazioni tecniche e benchmarks.
Cinebench R15: CPU Multi 64Bit | CPU Single 64Bit
Blender: v2.79 BMW27 CPU
7-Zip 18.03: 7z b 4 -mmt1 | 7z b 4
Geekbench 5.5: Single-Core | Multi-Core
HWBOT x265 Benchmark v2.2: 4k Preset
LibreOffice : 20 Documents To PDF
R Benchmark 2.5: Overall mean
| Cinebench R20 / CPU (Multi Core) | |
| MSI Bravo 15 A4DCR | |
| Asus ROG Strix Scar 15 G532LWS | |
| Eurocom Nightsky RX15 | |
| MSI GE65 Raider 9SF-049US | |
| Media Intel Core i7-10875H (1986 - 4176, n=32) | |
| Alienware m15 R3 P87F | |
| Razer Blade 15 RTX 2070 Super Max-Q | |
| Maingear Vector 15 | |
| Dell G5 15 5590 | |
| Lenovo Legion 5 15IMH05H | |
| Cinebench R20 / CPU (Single Core) | |
| Asus ROG Strix Scar 15 G532LWS | |
| Razer Blade 15 RTX 2070 Super Max-Q | |
| Media Intel Core i7-10875H (430 - 524, n=32) | |
| Eurocom Nightsky RX15 | |
| Alienware m15 R3 P87F | |
| MSI Bravo 15 A4DCR | |
| MSI GE65 Raider 9SF-049US | |
| Lenovo Legion 5 15IMH05H | |
| Maingear Vector 15 | |
| Dell G5 15 5590 | |
| Cinebench R15 / CPU Multi 64Bit | |
| Eurocom Nightsky RX15 | |
| MSI Bravo 15 A4DCR | |
| Asus ROG Strix Scar 15 G532LWS | |
| MSI GE65 Raider 9SF-049US | |
| Media Intel Core i7-10875H (1003 - 1833, n=38) | |
| Razer Blade 15 RTX 2070 Super Max-Q | |
| Alienware m15 R3 P87F | |
| Maingear Vector 15 | |
| Dell G5 15 5590 | |
| Lenovo Legion 5 15IMH05H | |
| Cinebench R15 / CPU Single 64Bit | |
| Asus ROG Strix Scar 15 G532LWS | |
| Media Intel Core i7-10875H (190 - 220, n=37) | |
| Eurocom Nightsky RX15 | |
| Razer Blade 15 RTX 2070 Super Max-Q | |
| Alienware m15 R3 P87F | |
| MSI GE65 Raider 9SF-049US | |
| Lenovo Legion 5 15IMH05H | |
| Maingear Vector 15 | |
| MSI Bravo 15 A4DCR | |
| Dell G5 15 5590 | |
| Blender / v2.79 BMW27 CPU | |
| Eurocom Nightsky RX15 | |
| Lenovo Legion 5 15IMH05H | |
| Razer Blade 15 RTX 2070 Super Max-Q | |
| Media Intel Core i7-10875H (259 - 535, n=30) | |
| Alienware m15 R3 P87F | |
| MSI Bravo 15 A4DCR | |
| Asus ROG Strix Scar 15 G532LWS | |
| 7-Zip 18.03 / 7z b 4 -mmt1 | |
| Asus ROG Strix Scar 15 G532LWS | |
| Eurocom Nightsky RX15 | |
| Media Intel Core i7-10875H (5071 - 5780, n=31) | |
| Razer Blade 15 RTX 2070 Super Max-Q | |
| Lenovo Legion 5 15IMH05H | |
| MSI Bravo 15 A4DCR | |
| Alienware m15 R3 P87F | |
| 7-Zip 18.03 / 7z b 4 | |
| Asus ROG Strix Scar 15 G532LWS | |
| MSI Bravo 15 A4DCR | |
| Eurocom Nightsky RX15 | |
| Media Intel Core i7-10875H (29844 - 49562, n=31) | |
| Razer Blade 15 RTX 2070 Super Max-Q | |
| Alienware m15 R3 P87F | |
| Lenovo Legion 5 15IMH05H | |
| Geekbench 5.5 / Single-Core | |
| Asus ROG Strix Scar 15 G532LWS | |
| Media Intel Core i7-10875H (1233 - 1371, n=29) | |
| Razer Blade 15 RTX 2070 Super Max-Q | |
| Alienware m15 R3 P87F | |
| Lenovo Legion 5 15IMH05H | |
| MSI Bravo 15 A4DCR | |
| Geekbench 5.5 / Multi-Core | |
| Asus ROG Strix Scar 15 G532LWS | |
| Media Intel Core i7-10875H (5715 - 8620, n=29) | |
| MSI Bravo 15 A4DCR | |
| Razer Blade 15 RTX 2070 Super Max-Q | |
| Alienware m15 R3 P87F | |
| Lenovo Legion 5 15IMH05H | |
| HWBOT x265 Benchmark v2.2 / 4k Preset | |
| Asus ROG Strix Scar 15 G532LWS | |
| Eurocom Nightsky RX15 | |
| MSI Bravo 15 A4DCR | |
| Media Intel Core i7-10875H (7.27 - 14.1, n=27) | |
| Alienware m15 R3 P87F | |
| Razer Blade 15 RTX 2070 Super Max-Q | |
| Lenovo Legion 5 15IMH05H | |
| LibreOffice / 20 Documents To PDF | |
| MSI Bravo 15 A4DCR | |
| Alienware m15 R3 P87F | |
| Lenovo Legion 5 15IMH05H | |
| Media Intel Core i7-10875H (30.2 - 84.3, n=30) | |
| Asus ROG Strix Scar 15 G532LWS | |
| Razer Blade 15 RTX 2070 Super Max-Q | |
| R Benchmark 2.5 / Overall mean | |
| Alienware m15 R3 P87F | |
| Lenovo Legion 5 15IMH05H | |
| MSI Bravo 15 A4DCR | |
| Razer Blade 15 RTX 2070 Super Max-Q | |
| Media Intel Core i7-10875H (0.546 - 0.662, n=29) | |
| Asus ROG Strix Scar 15 G532LWS | |
* ... Meglio usare valori piccoli
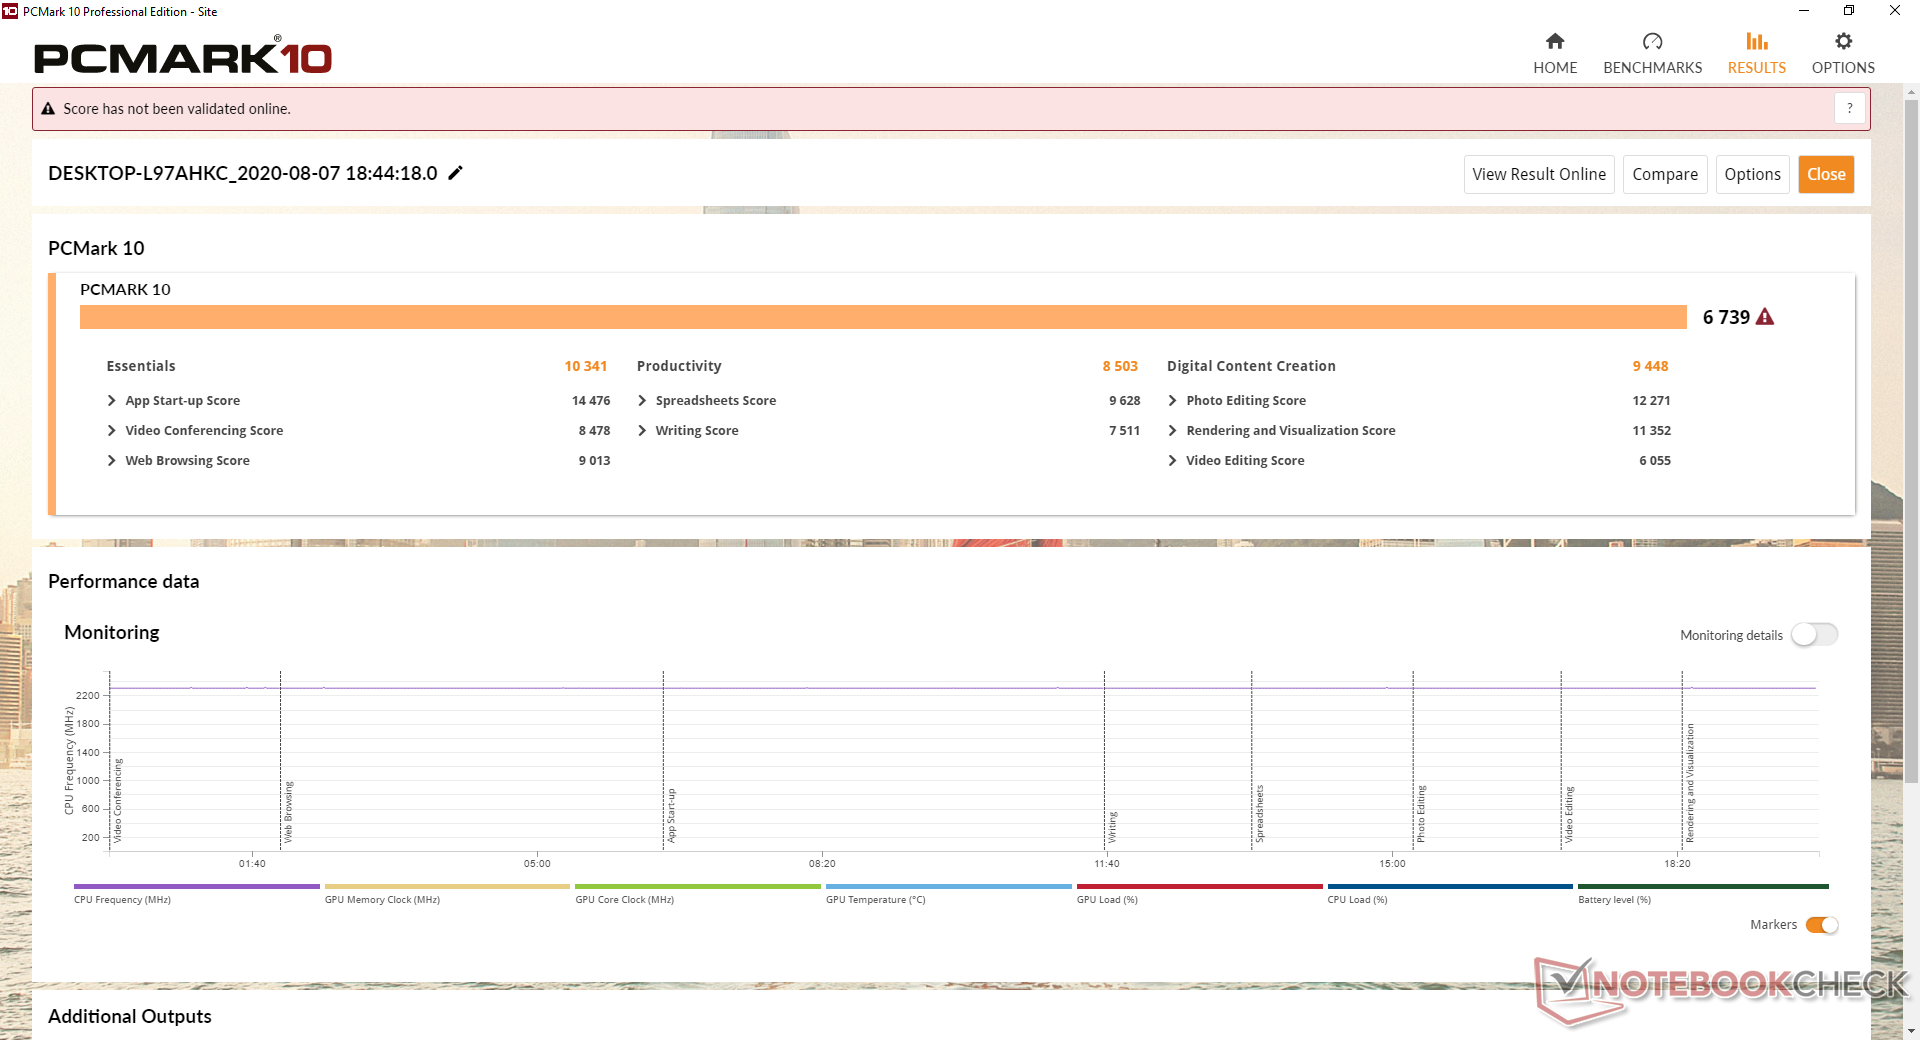
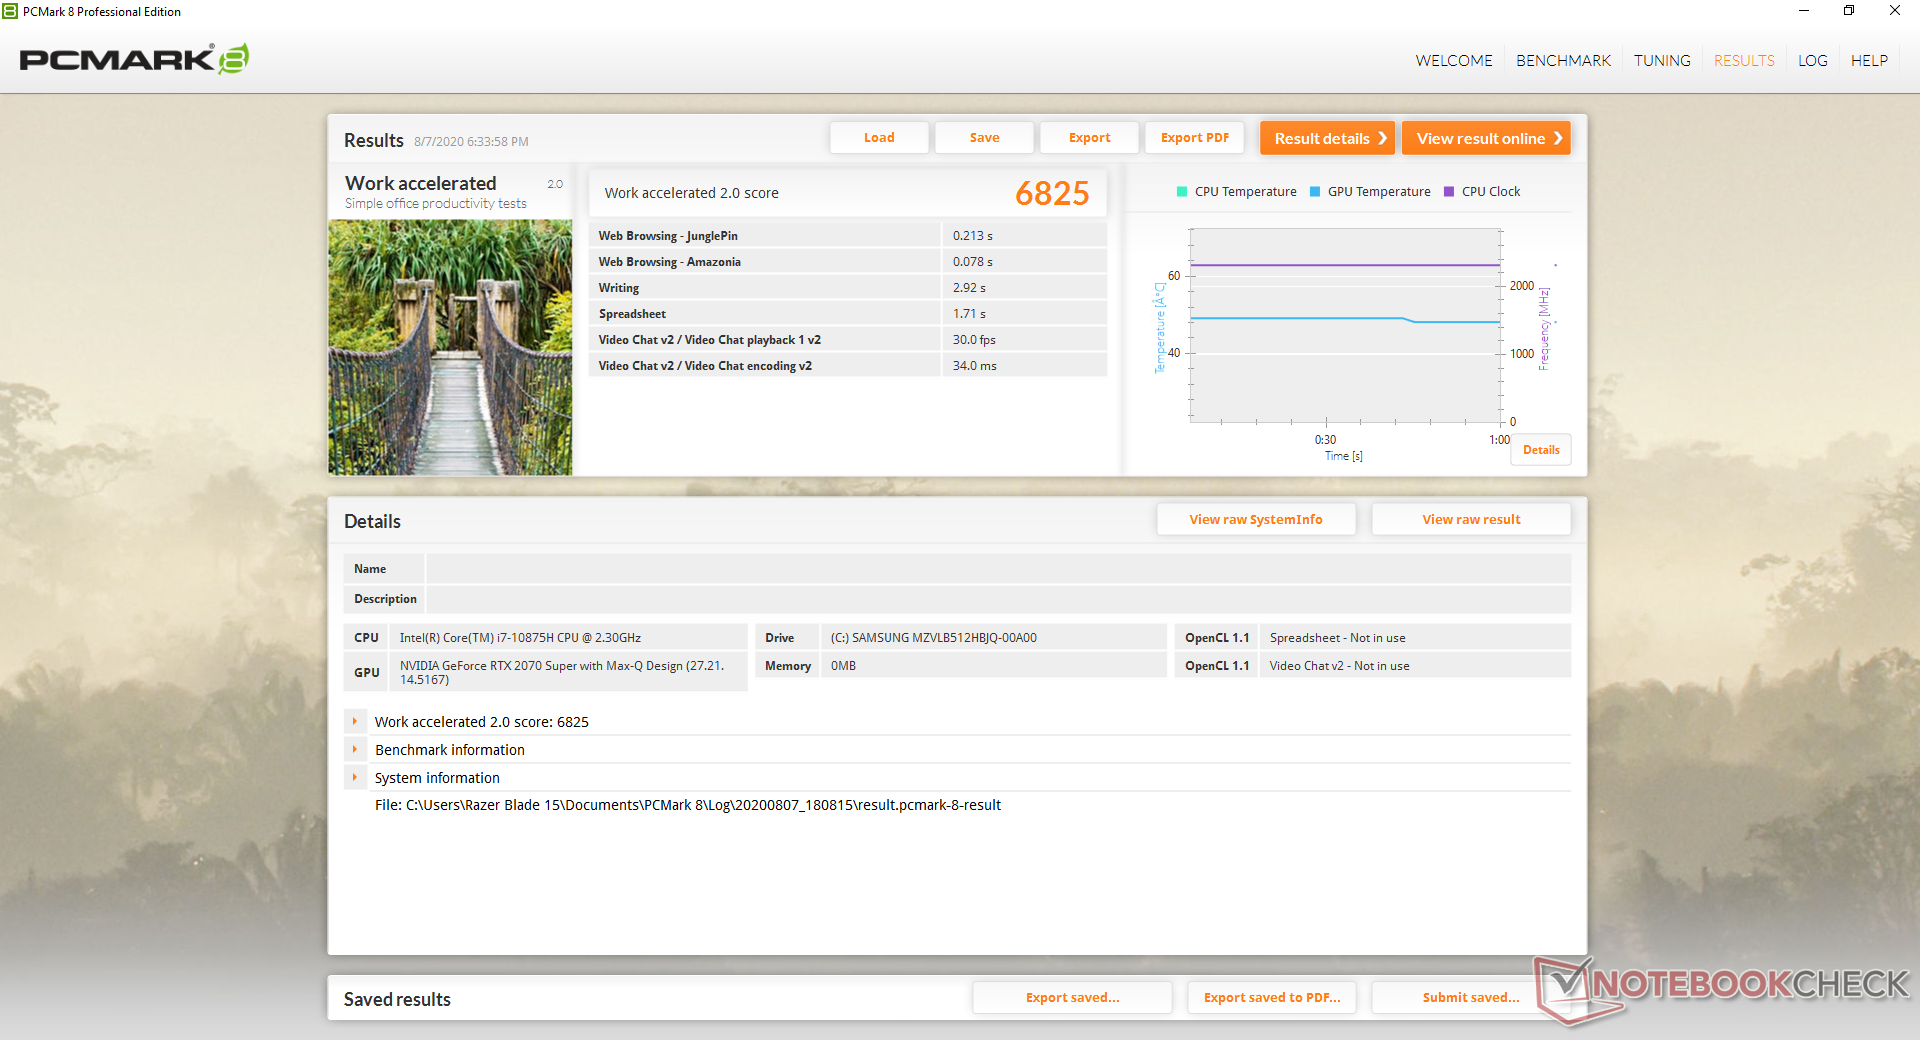
Prestazioni di sistema
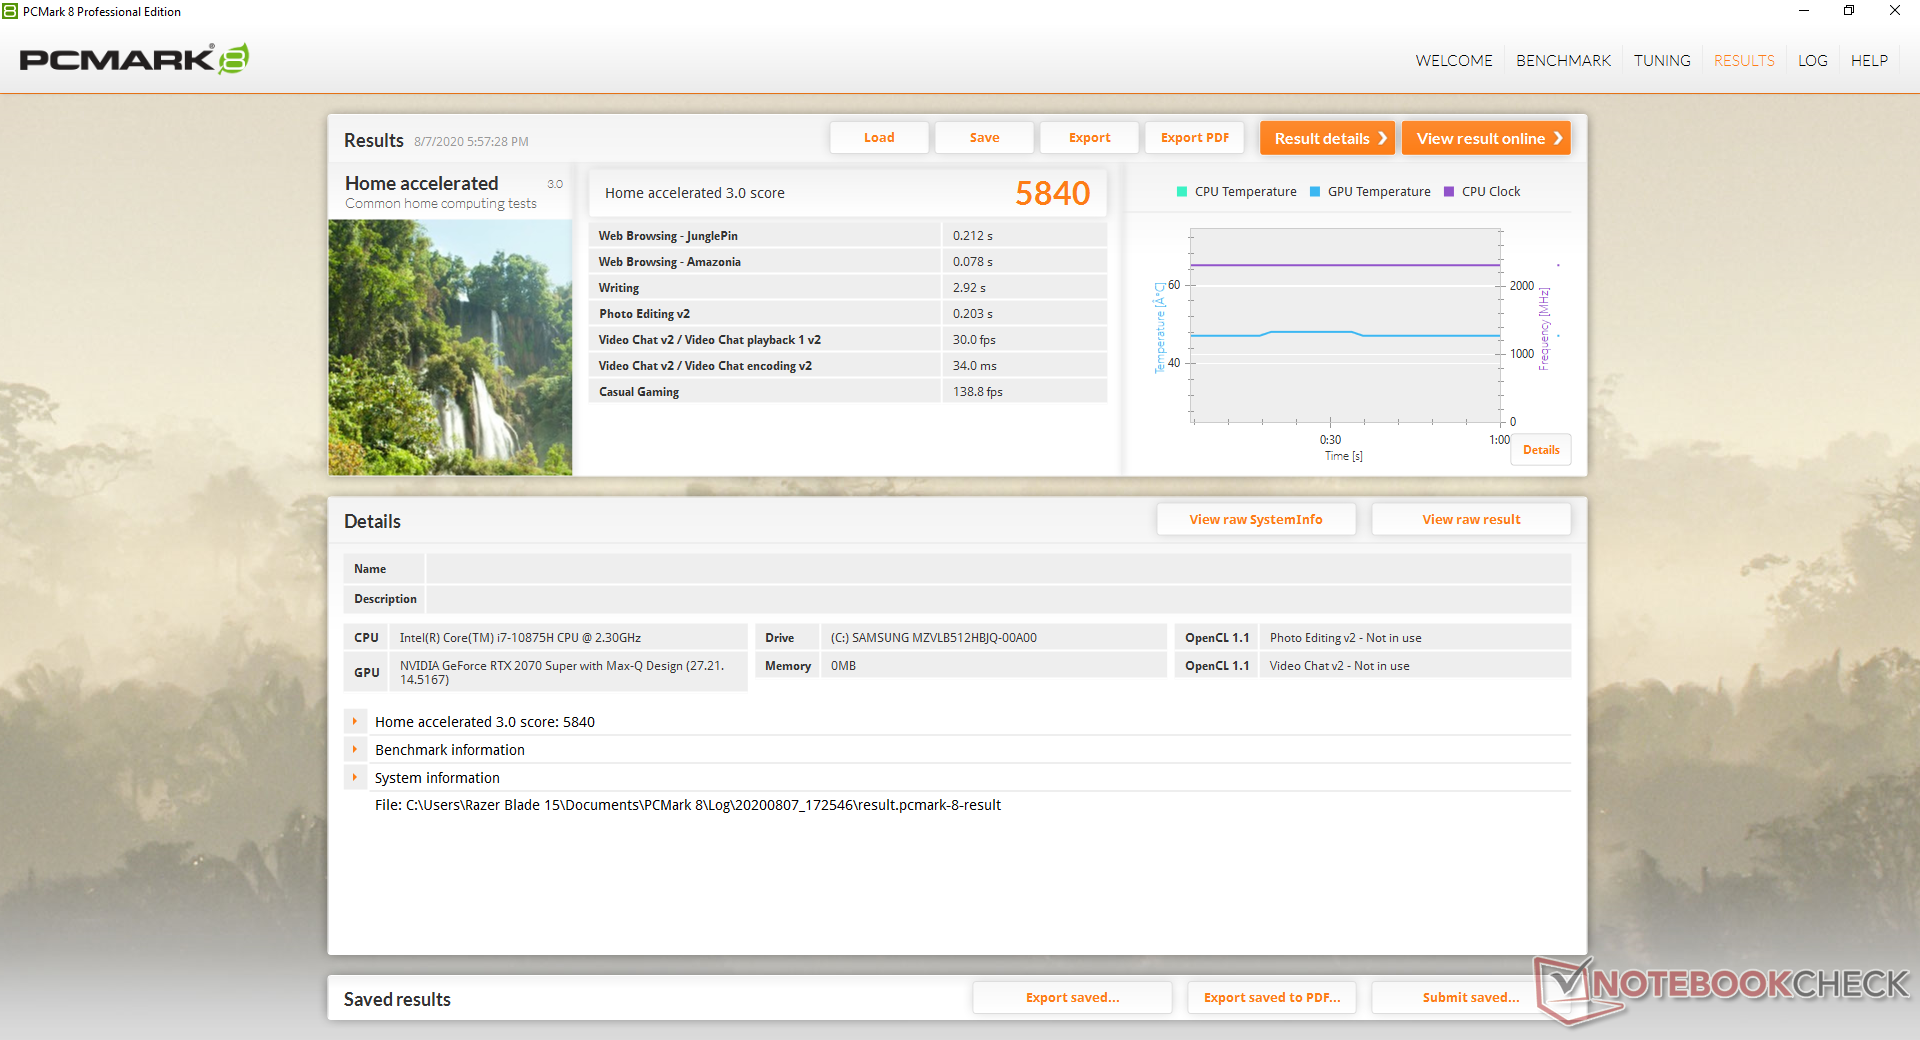
| PCMark 8 Home Score Accelerated v2 | 5840 punti | |
| PCMark 8 Work Score Accelerated v2 | 6825 punti | |
| PCMark 10 Score | 6739 punti | |
Aiuto | ||
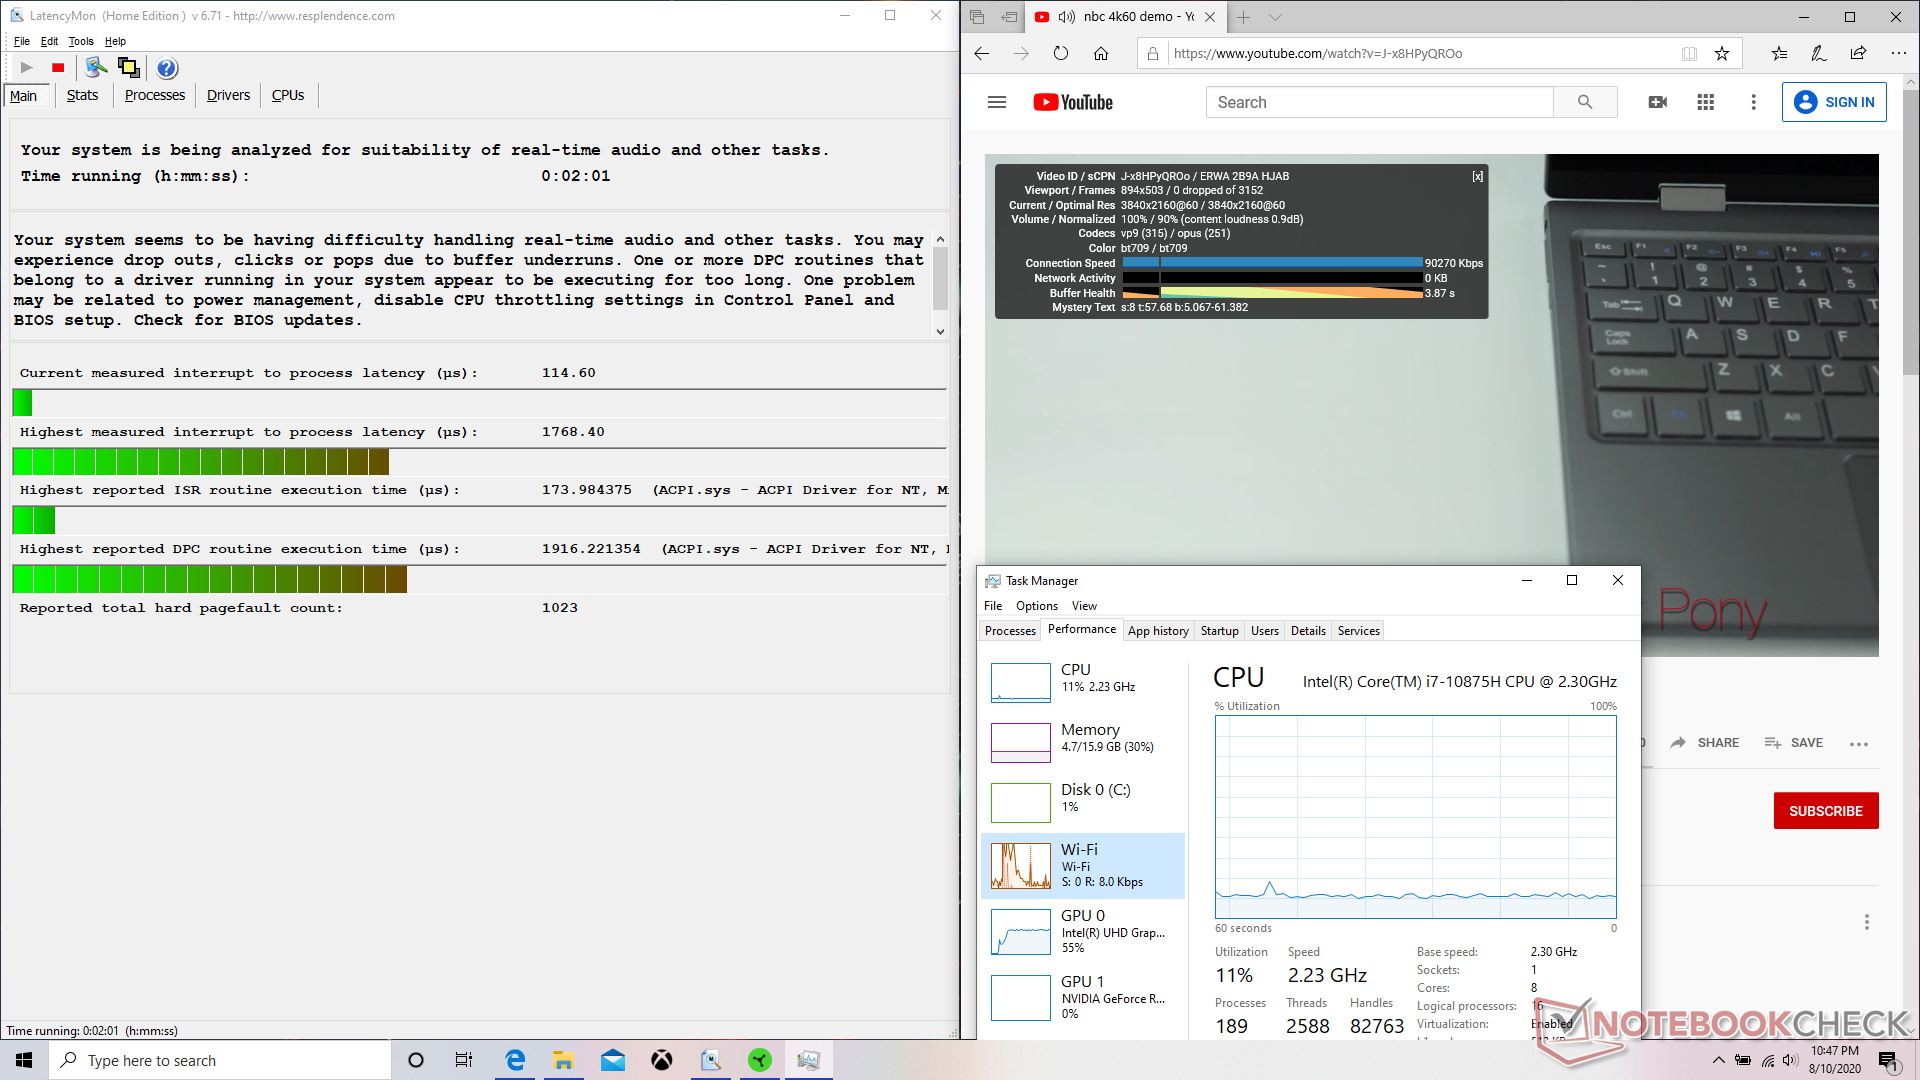
Latenza DPC
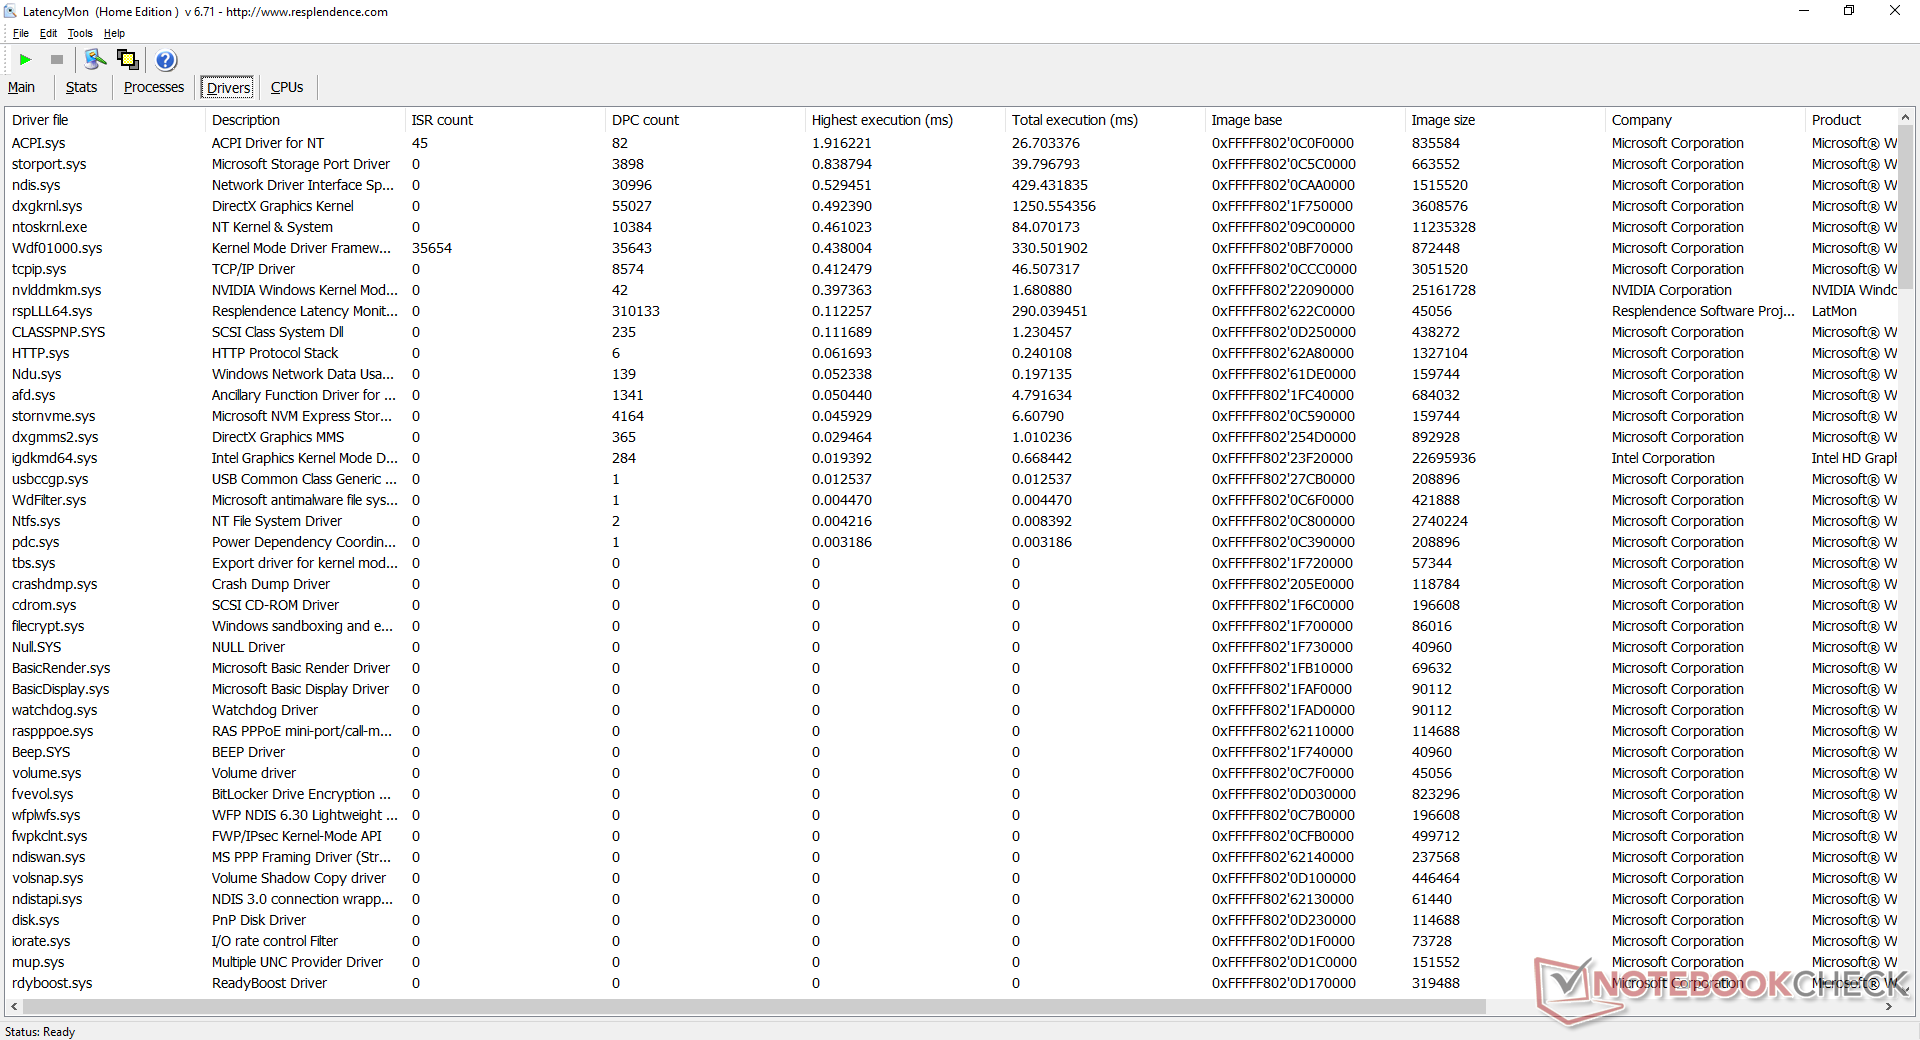
| DPC Latencies / LatencyMon - interrupt to process latency (max), Web, Youtube, Prime95 | |
| Aorus 15G XB | |
| MSI GS66 Stealth 10SFS | |
| Razer Blade 15 RTX 2070 Super Max-Q | |
| Asus ROG Strix Scar 15 G532LWS | |
| Alienware m15 R3 P87F | |
| Razer Blade 15 RTX 2080 Super Max-Q | |
| Lenovo Legion 5 15IMH05H | |
| Eluktronics RP-15 | |
* ... Meglio usare valori piccoli
Dispositivi di archiviazione
| Razer Blade 15 RTX 2070 Super Max-Q Samsung SSD PM981a MZVLB512HBJQ | MSI GS66 Stealth 10SFS Samsung SSD PM981 MZVLB1T0HALR | Asus Zephyrus S GX502GW 2x Intel SSD 660p SSDPEKNW512G8 (RAID 0) | Gigabyte Aero 15 Classic-XA Intel SSD 760p SSDPEKKW512G8 | Lenovo Legion Y740-15ICHg WDC PC SN520 SDAPMUW-128G | |
|---|---|---|---|---|---|
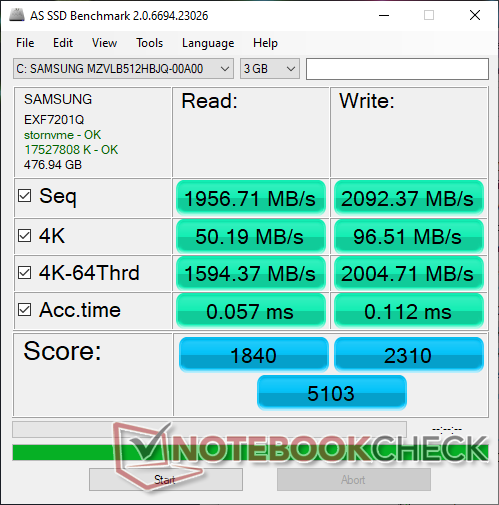
| AS SSD | 0% | -17% | -12% | -51% | |
| Seq Read (MB/s) | 1957 | 1065 -46% | 2506 28% | 2517 29% | 1372 -30% |
| Seq Write (MB/s) | 2092 | 2360 13% | 1712 -18% | 924 -56% | 746 -64% |
| 4K Read (MB/s) | 50.2 | 48.09 -4% | 48.32 -4% | 59.1 18% | 35.42 -29% |
| 4K Write (MB/s) | 96.5 | 110.7 15% | 103.6 7% | 126.5 31% | 99.9 4% |
| 4K-64 Read (MB/s) | 1594 | 1635 3% | 624 -61% | 876 -45% | 302.1 -81% |
| 4K-64 Write (MB/s) | 2005 | 1829 -9% | 1253 -38% | 922 -54% | 191.4 -90% |
| Access Time Read * (ms) | 0.057 | 0.071 -25% | 0.08 -40% | 0.042 26% | 0.132 -132% |
| Access Time Write * (ms) | 0.112 | 0.034 70% | 0.04 64% | 0.065 42% | 0.037 67% |
| Score Read (Points) | 1840 | 1790 -3% | 923 -50% | 1186 -36% | 475 -74% |
| Score Write (Points) | 2310 | 2176 -6% | 1528 -34% | 1141 -51% | 366 -84% |
| Score Total (Points) | 5103 | 4950 -3% | 2896 -43% | 2870 -44% | 1065 -79% |
| Copy ISO MB/s (MB/s) | 1793 | 2086 16% | 1062 -41% | ||
| Copy Program MB/s (MB/s) | 573 | 454.2 -21% | 426 -26% | ||
| Copy Game MB/s (MB/s) | 1418 | 1141 -20% | 650 -54% | ||
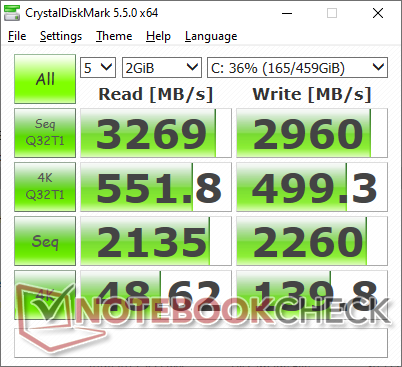
| CrystalDiskMark 5.2 / 6 | -7% | -19% | -14% | -47% | |
| Write 4K (MB/s) | 139.8 | 131.3 -6% | 97 -31% | 115.5 -17% | 134.2 -4% |
| Read 4K (MB/s) | 48.62 | 45.84 -6% | 49.58 2% | 58 19% | 37.72 -22% |
| Write Seq (MB/s) | 2260 | 2370 5% | 1838 -19% | 1555 -31% | 389.2 -83% |
| Read Seq (MB/s) | 2135 | 1509 -29% | 2421 13% | 2590 21% | 1030 -52% |
| Write 4K Q32T1 (MB/s) | 499.3 | 481.5 -4% | 326.9 -35% | 369.3 -26% | 238.9 -52% |
| Read 4K Q32T1 (MB/s) | 552 | 560 1% | 372.9 -32% | 441.7 -20% | 343.9 -38% |
| Write Seq Q32T1 (MB/s) | 2960 | 2392 -19% | 1894 -36% | 1547 -48% | 789 -73% |
| Read Seq Q32T1 (MB/s) | 3269 | 3232 -1% | 2828 -13% | 2969 -9% | 1502 -54% |
| Write 4K Q8T8 (MB/s) | 293.4 | ||||
| Read 4K Q8T8 (MB/s) | 405.8 | ||||
| Media totale (Programma / Settaggio) | -4% /
-3% | -18% /
-18% | -13% /
-13% | -49% /
-50% |
* ... Meglio usare valori piccoli

Disk Throttling: DiskSpd Read Loop, Queue Depth 8
Prestazioni GPU
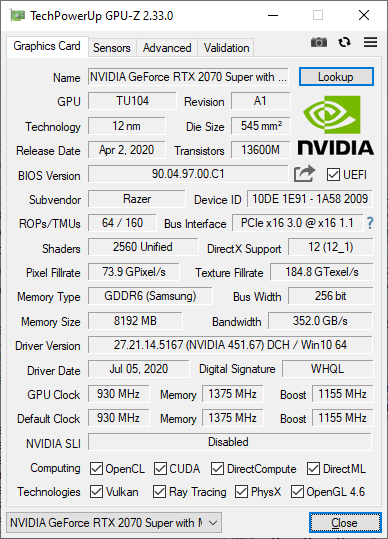
La GeForce RTX 2070 Super Max-Q è solo dal 5 al 10% più lenta della normale GeForce RTX 2070 Super mobile o circa dal 10 al 15% più lenta di una GeForce RTX 2070 desktop. Assicuratevi di usare le massime prestazioni possibili, altrimenti la GPU sarà leggermente più lenta del solito, proprio come abbiamo osservato sulla configurazione del Blade 15 RTX 2080 Super Max-Q.
Si noti che Nvidia Optimus è incluso ma solo come opzione di switching manuale tramite Synapse.
| 3DMark 11 Performance | 23678 punti | |
| 3DMark Cloud Gate Standard Score | 48815 punti | |
| 3DMark Fire Strike Score | 17915 punti | |
| 3DMark Time Spy Score | 8052 punti | |
Aiuto | ||
| basso | medio | alto | ultra | |
|---|---|---|---|---|
| The Witcher 3 (2015) | 348.3 | 235.4 | 141.4 | 74 |
| Dota 2 Reborn (2015) | 144 | 132 | 127 | 120 |
| Final Fantasy XV Benchmark (2018) | 162 | 110 | 83.7 | |
| X-Plane 11.11 (2018) | 121 | 109 | 90 |
Emissioni
Rumorosità
Le ventole sono bravissime a rimanere il più possibile silenziose quando sono impostate al livello più basso di prestazioni su Synapse. Se su profili di potenza media o superiore, invece, le ventole pulseranno più frequentemente. Il gioco in modalità High Performance induce un rumore delle ventole di 51 dB(A) che non si discosta dalla maggior parte degli altri portatili ultra-sottili da 15,6 pollici da gioco.
Non siamo in grado di notare alcun rumore elettronico provenire dalla nostra unità.
| Razer Blade 15 RTX 2070 Super Max-Q GeForce RTX 2070 Super Max-Q, i7-10875H, Samsung SSD PM981a MZVLB512HBJQ | MSI GS66 Stealth 10SFS GeForce RTX 2070 Super Max-Q, i9-10980HK, Samsung SSD PM981 MZVLB1T0HALR | Asus Zephyrus S GX502GW GeForce RTX 2070 Mobile, i7-9750H, 2x Intel SSD 660p SSDPEKNW512G8 (RAID 0) | Gigabyte Aero 15 Classic-XA GeForce RTX 2070 Max-Q, i7-9750H, Intel SSD 760p SSDPEKKW512G8 | Lenovo Legion Y740-15ICHg GeForce RTX 2070 Max-Q, i7-9750H, WDC PC SN520 SDAPMUW-128G | Razer Blade 15 RTX 2080 Super Max-Q GeForce RTX 2080 Super Max-Q, i7-10875H, Samsung PM981a MZVLB1T0HBLR | |
|---|---|---|---|---|---|---|
| Noise | -16% | -16% | -15% | -3% | -4% | |
| off /ambiente * (dB) | 27 | 30 -11% | 30 -11% | 30 -11% | 30 -11% | 30.1 -11% |
| Idle Minimum * (dB) | 27 | 32 -19% | 31 -15% | 31 -15% | 31.3 -16% | 30.1 -11% |
| Idle Average * (dB) | 27 | 34 -26% | 33 -22% | 34 -26% | 31.3 -16% | 30.1 -11% |
| Idle Maximum * (dB) | 27 | 39 -44% | 38 -41% | 39 -44% | 31.3 -16% | 30.1 -11% |
| Load Average * (dB) | 44.7 | 53 -19% | 50 -12% | 46 -3% | 42 6% | 46.8 -5% |
| Witcher 3 ultra * (dB) | 51.2 | 48 6% | 53 -4% | 53 -4% | 42.1 18% | 48.4 5% |
| Load Maximum * (dB) | 54 | 53 2% | 56 -4% | 55 -2% | 46.5 14% | 46 15% |
* ... Meglio usare valori piccoli
Rumorosità
| Idle |
| 27 / 27 / 27 dB(A) |
| Sotto carico |
| 44.7 / 54 dB(A) |
 | ||
30 dB silenzioso 40 dB(A) udibile 50 dB(A) rumoroso |
||
min: | ||
Temperature
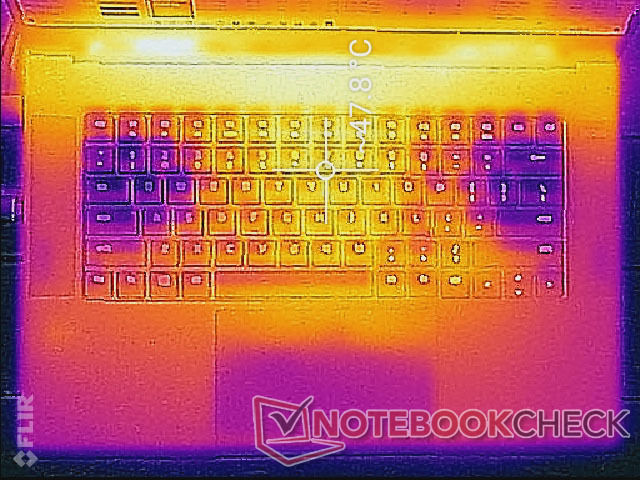
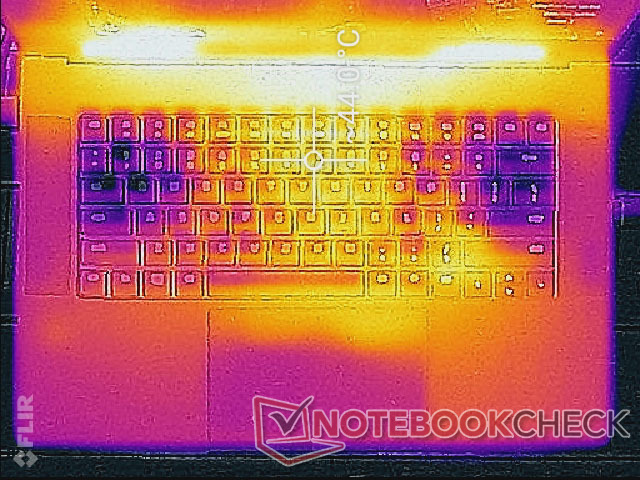
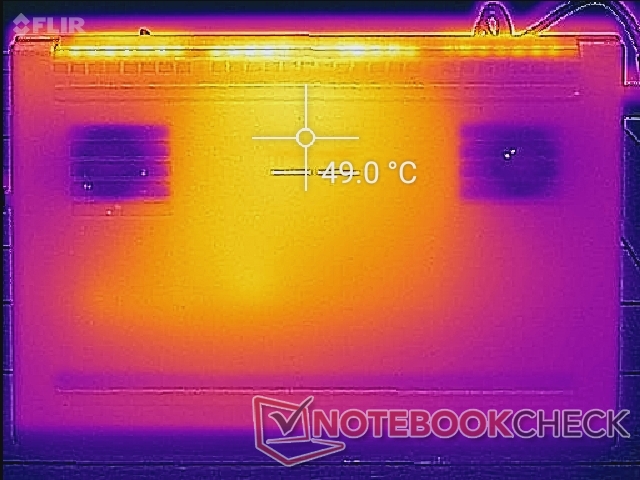
Le temperature di superficie sono simili tra le più recenti SKU del Blade 15 Turing indipendentemente dall'opzione GPU. Le due cose da tenere a mente sono i poggiapolsi più caldi della media e l'alimentatore quando si gioca.
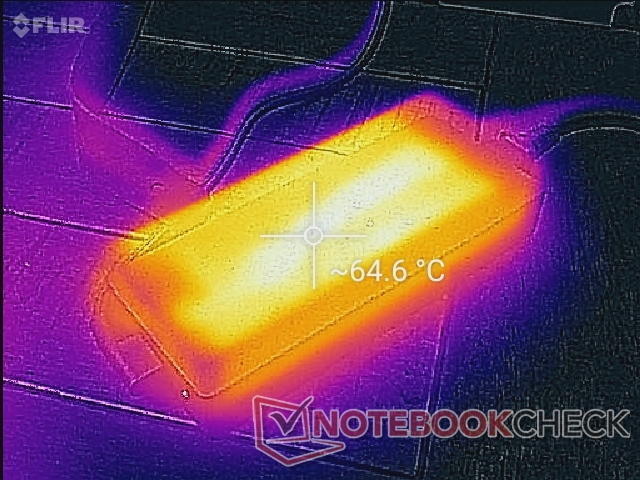
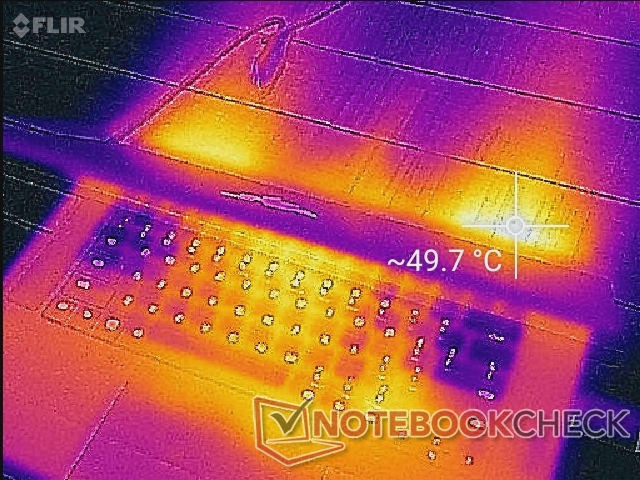
(-) La temperatura massima sul lato superiore è di 50 °C / 122 F, rispetto alla media di 40.4 °C / 105 F, che varia da 21.2 a 68.8 °C per questa classe Gaming.
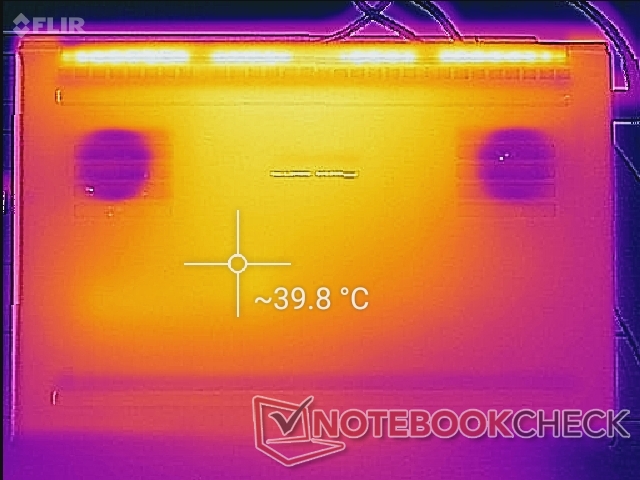
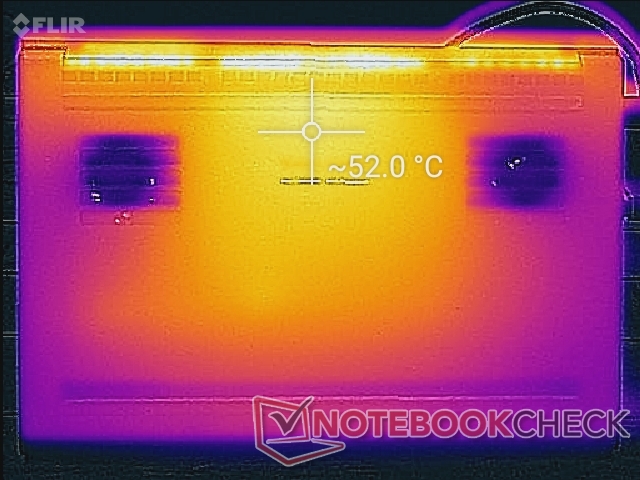
(-) Il lato inferiore si riscalda fino ad un massimo di 52.2 °C / 126 F, rispetto alla media di 43.2 °C / 110 F
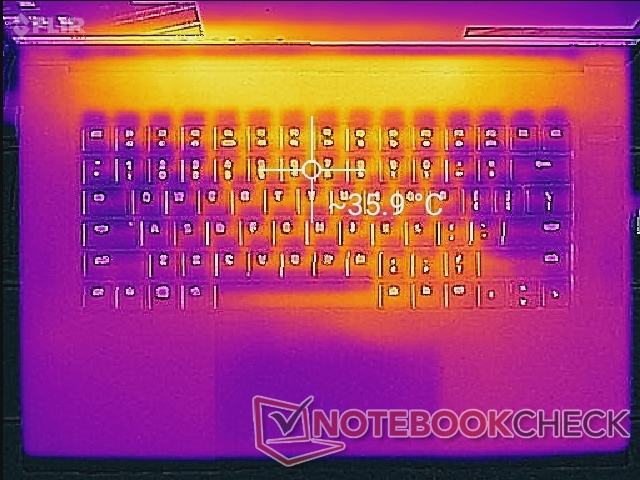
(±) In idle, la temperatura media del lato superiore è di 33.3 °C / 92 F, rispetto alla media deld ispositivo di 33.9 °C / 93 F.
(-) Riproducendo The Witcher 3, la temperatura media per il lato superiore e' di 40 °C / 104 F, rispetto alla media del dispositivo di 33.9 °C / 93 F.
(±) I poggiapolsi e il touchpad possono diventare molto caldi al tatto con un massimo di 38 °C / 100.4 F.
(-) La temperatura media della zona del palmo della mano di dispositivi simili e'stata di 28.8 °C / 83.8 F (-9.2 °C / -16.6 F).
Stress Test
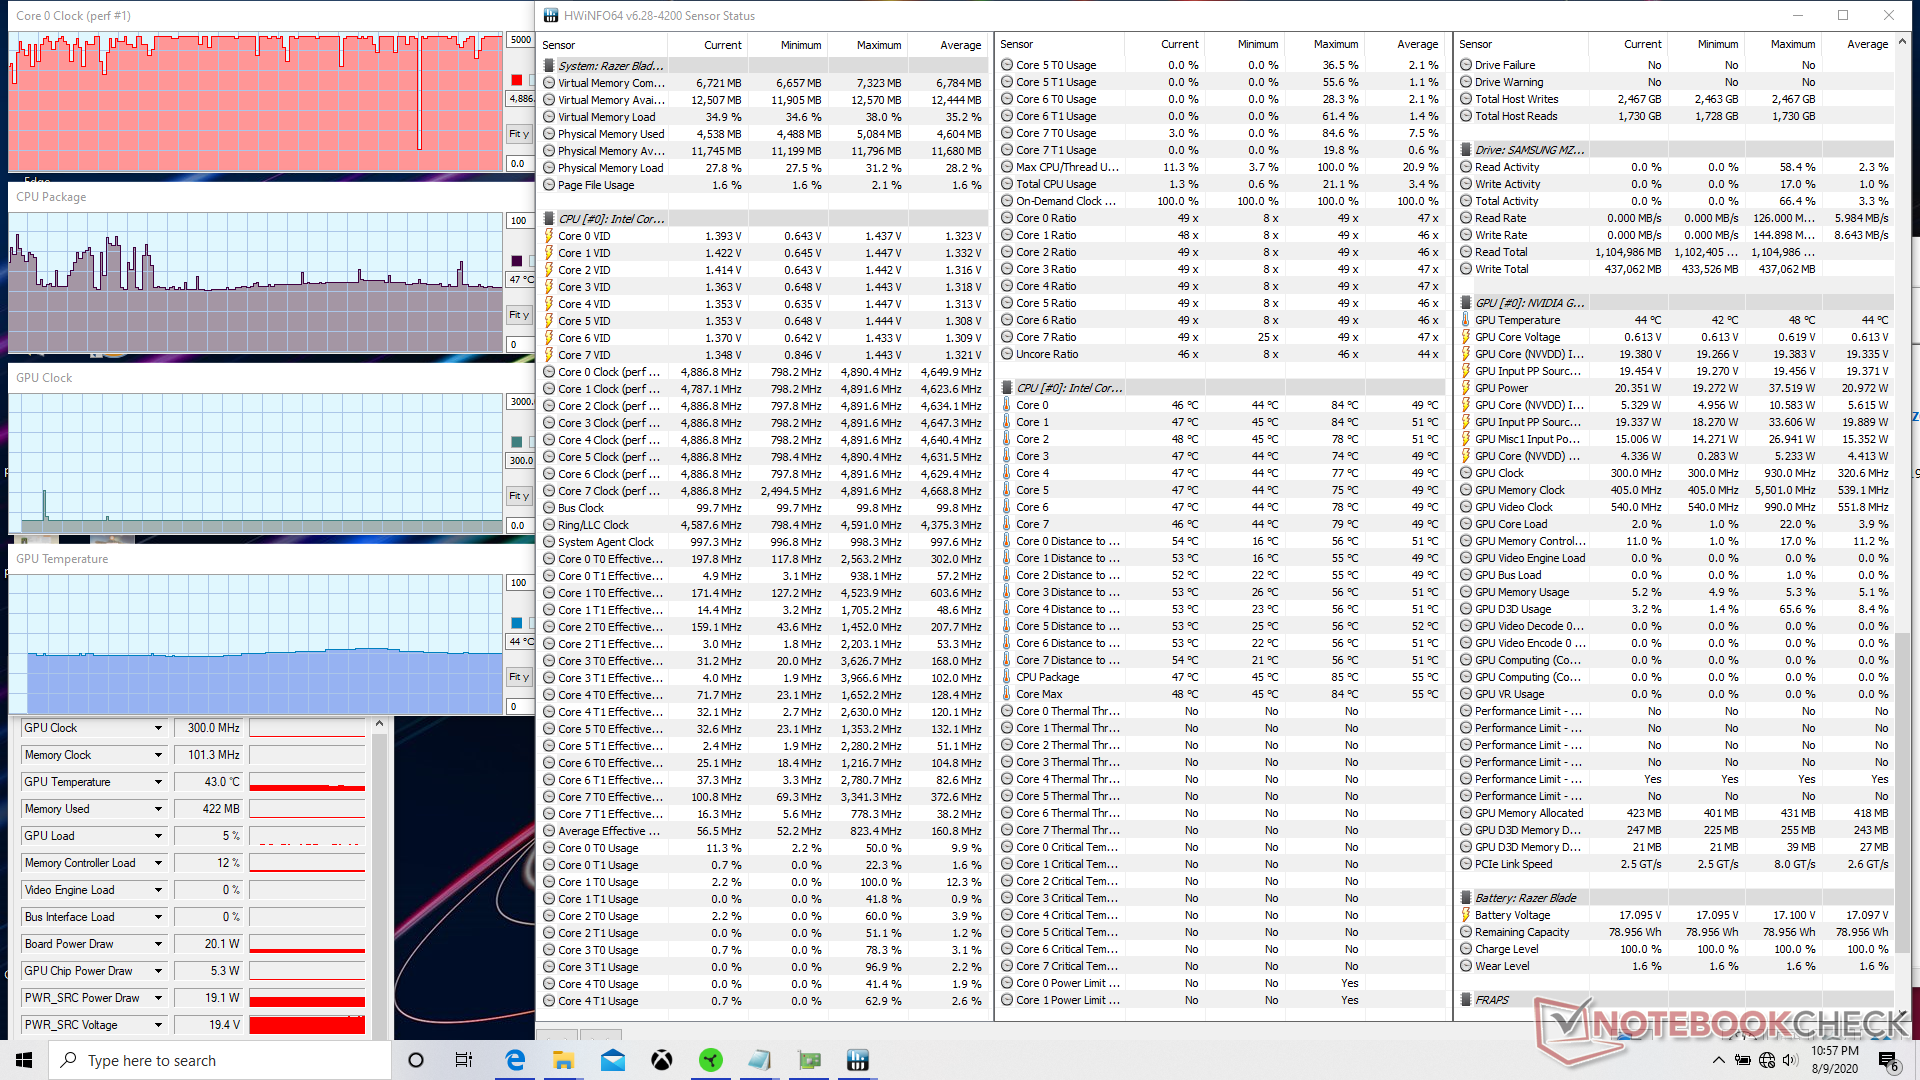
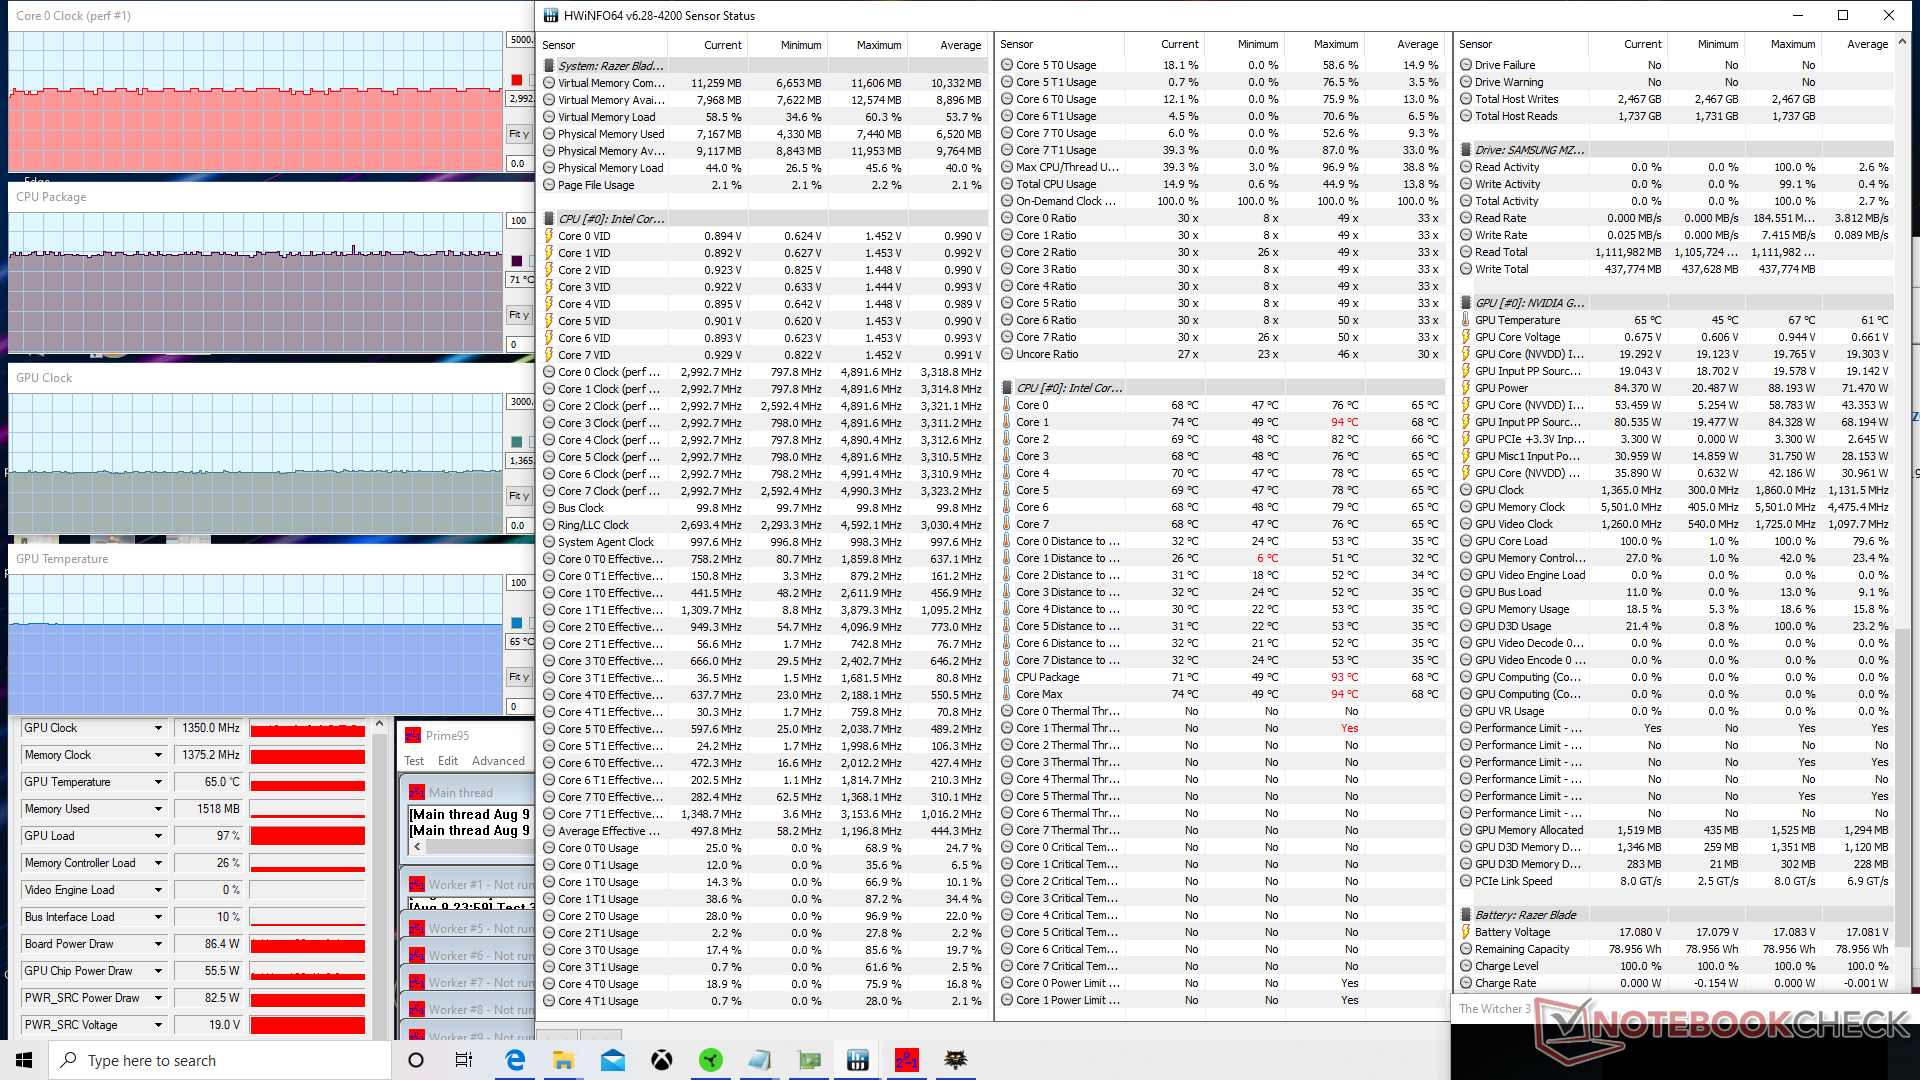
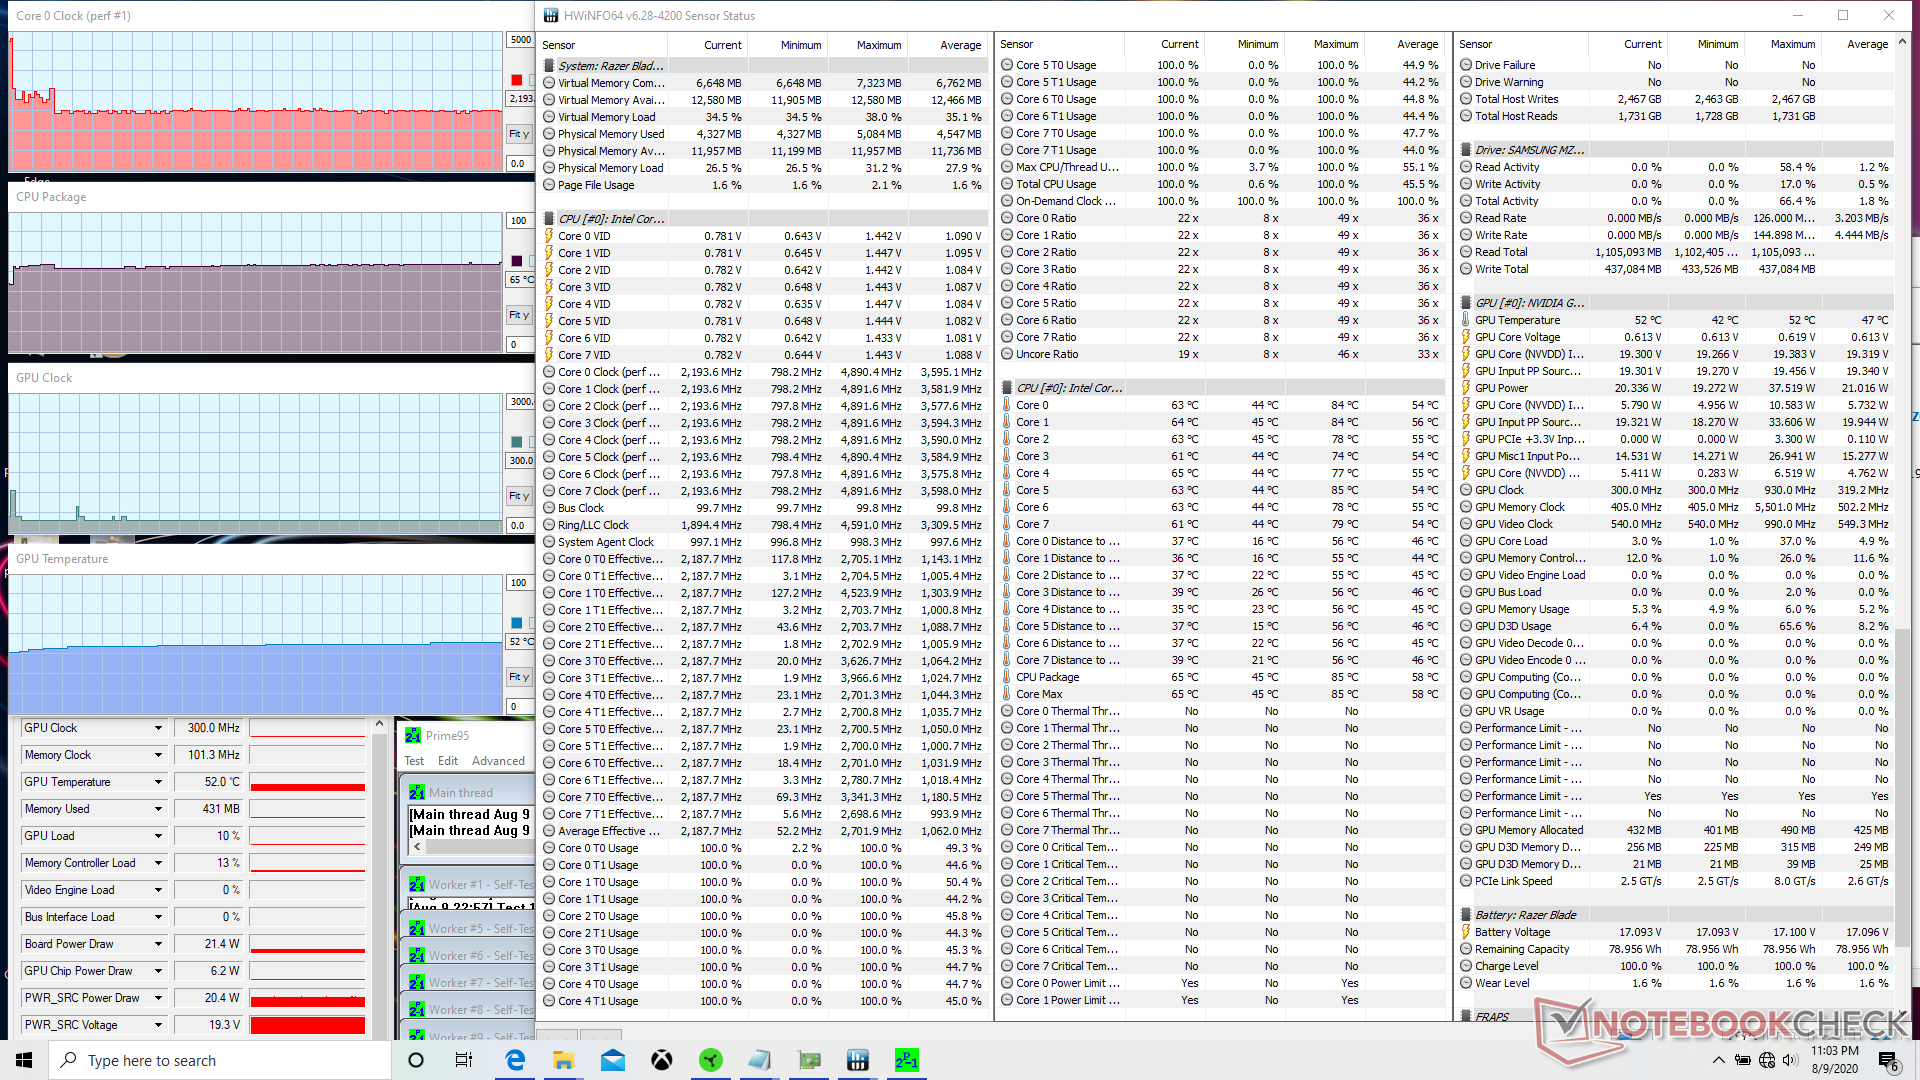
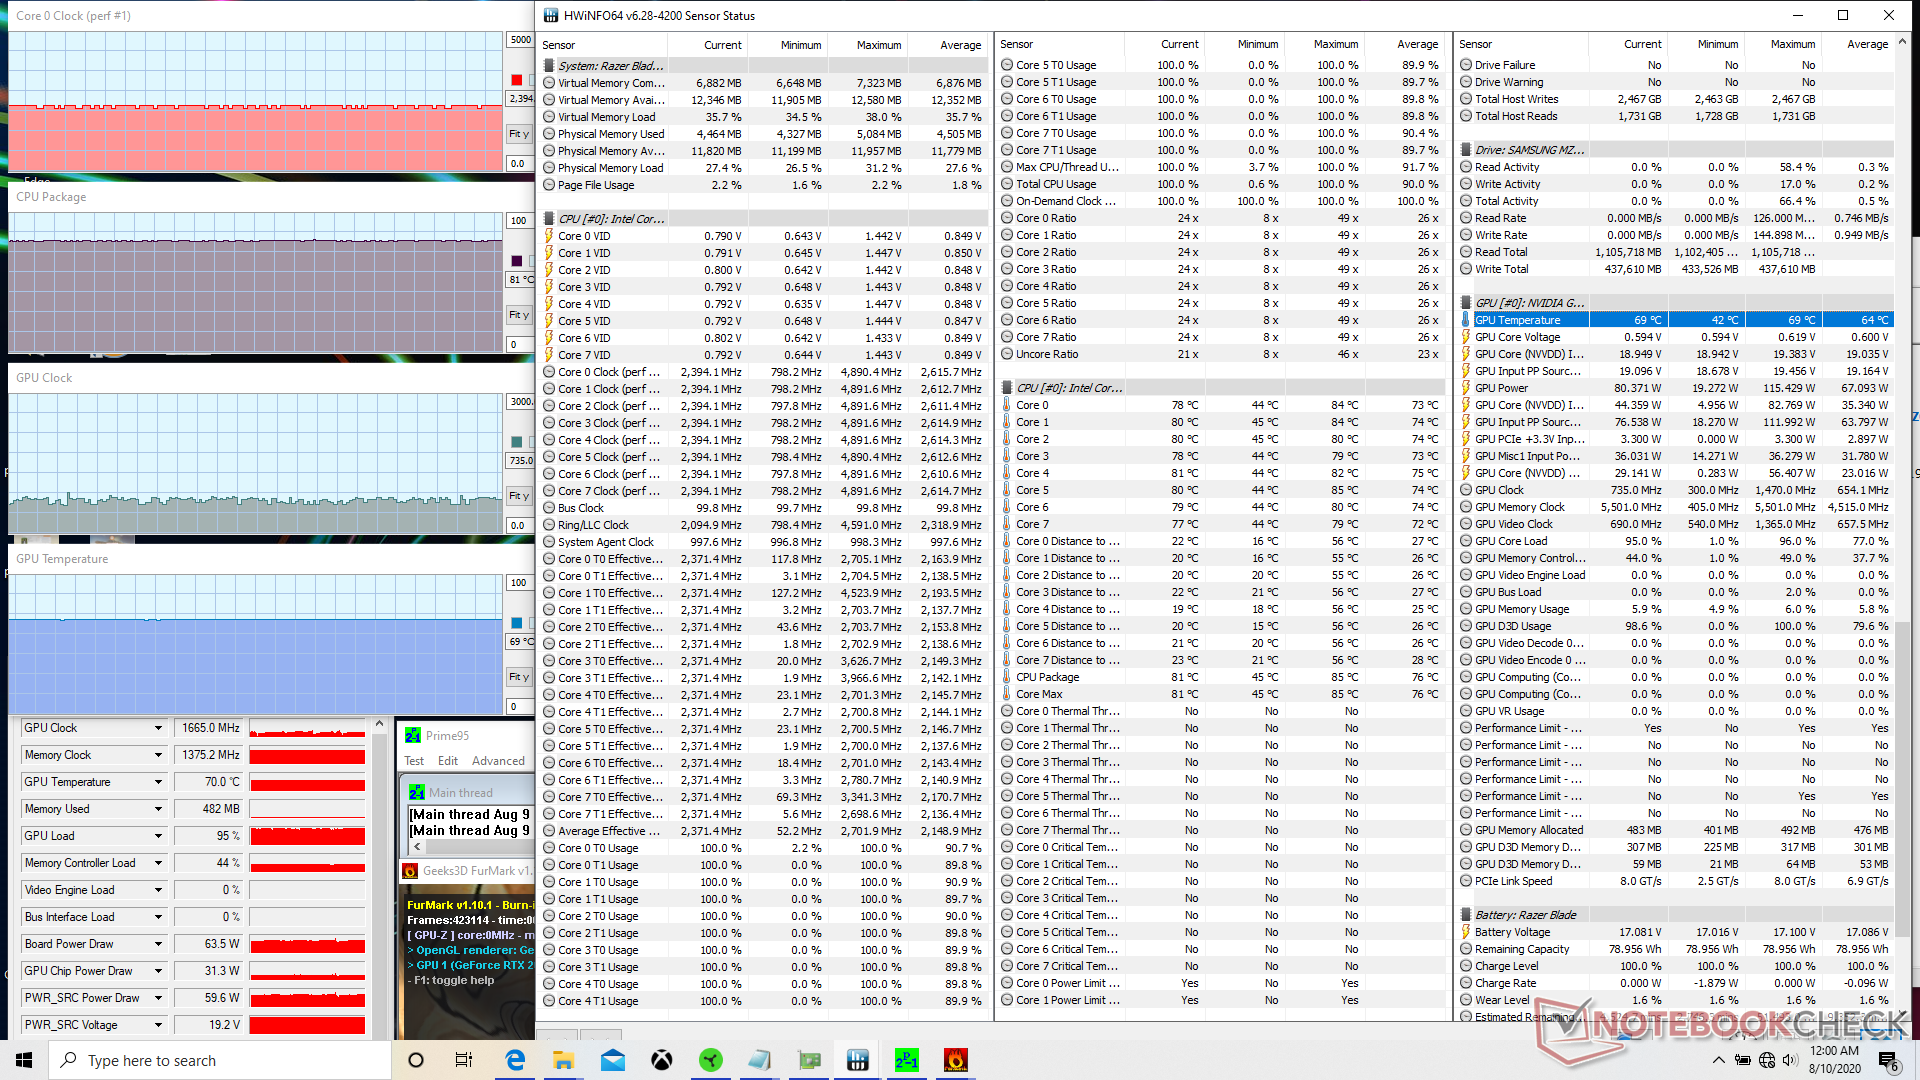
| CPU Clock (GHz) | GPU Clock (MHz) | Average CPU Temperature (°C) | Average GPU Temperature (°C) | |
| System Idle | -- | -- | 47 | 44 |
| Prime95 Stress | 2.2 | -- | 65 | 52 |
| Prime95 + FurMark Stress | 2.3 - 2.4 | 735 | 81 | 69 |
| Witcher 3 Stress | 2.8 - 3.0 | 1365 | 71 | 65 |
Altoparlanti

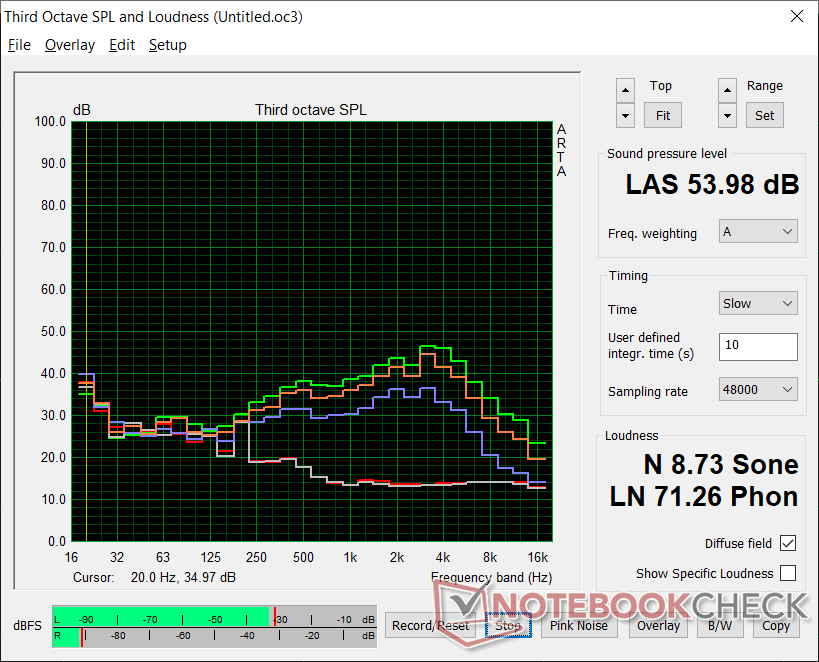
Razer Blade 15 RTX 2070 Super Max-Q analisi audio
(+) | gli altoparlanti sono relativamente potenti (87.1 dB)
Bassi 100 - 315 Hz
(-) | quasi nessun basso - in media 16.2% inferiori alla media
(±) | la linearità dei bassi è media (9.4% delta rispetto alla precedente frequenza)
Medi 400 - 2000 Hz
(±) | medi elevati - circa 5.7% superiore alla media
(+) | medi lineari (4.8% delta rispetto alla precedente frequenza)
Alti 2 - 16 kHz
(+) | Alti bilanciati - appena 3.6% dalla media
(+) | alti lineari (3.2% delta rispetto alla precedente frequenza)
Nel complesso 100 - 16.000 Hz
(±) | la linearità complessiva del suono è media (15.5% di differenza rispetto alla media
Rispetto alla stessa classe
» 35% di tutti i dispositivi testati in questa classe è stato migliore, 7% simile, 58% peggiore
» Il migliore ha avuto un delta di 6%, medio di 18%, peggiore di 132%
Rispetto a tutti i dispositivi testati
» 23% di tutti i dispositivi testati in questa classe è stato migliore, 4% similare, 73% peggiore
» Il migliore ha avuto un delta di 4%, medio di 23%, peggiore di 134%
Apple MacBook 12 (Early 2016) 1.1 GHz analisi audio
(+) | gli altoparlanti sono relativamente potenti (83.6 dB)
Bassi 100 - 315 Hz
(±) | bassi ridotti - in media 11.3% inferiori alla media
(±) | la linearità dei bassi è media (14.2% delta rispetto alla precedente frequenza)
Medi 400 - 2000 Hz
(+) | medi bilanciati - solo only 2.4% rispetto alla media
(+) | medi lineari (5.5% delta rispetto alla precedente frequenza)
Alti 2 - 16 kHz
(+) | Alti bilanciati - appena 2% dalla media
(+) | alti lineari (4.5% delta rispetto alla precedente frequenza)
Nel complesso 100 - 16.000 Hz
(+) | suono nel complesso lineare (10.2% differenza dalla media)
Rispetto alla stessa classe
» 7% di tutti i dispositivi testati in questa classe è stato migliore, 2% simile, 90% peggiore
» Il migliore ha avuto un delta di 5%, medio di 18%, peggiore di 53%
Rispetto a tutti i dispositivi testati
» 5% di tutti i dispositivi testati in questa classe è stato migliore, 1% similare, 94% peggiore
» Il migliore ha avuto un delta di 4%, medio di 23%, peggiore di 134%
Gestione Energetica
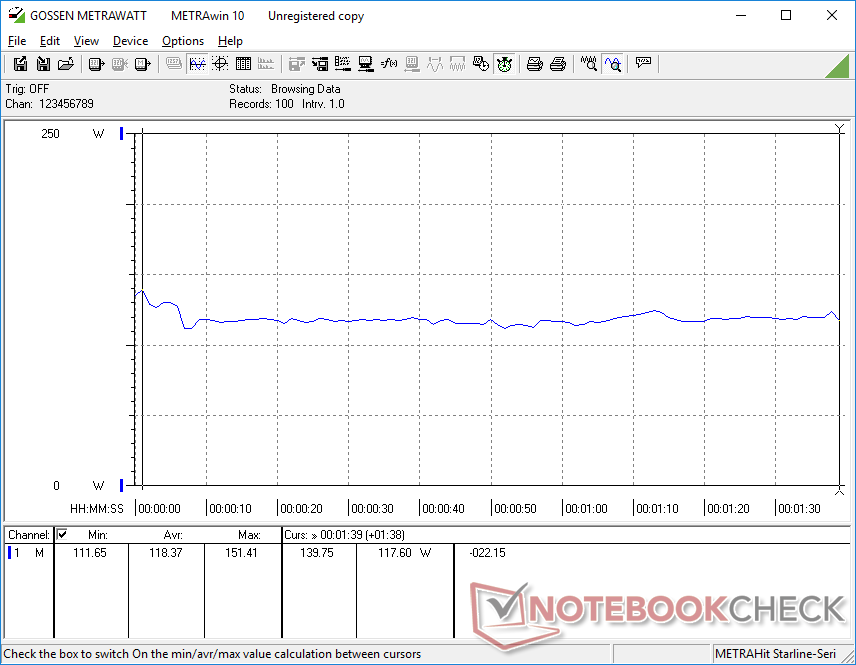
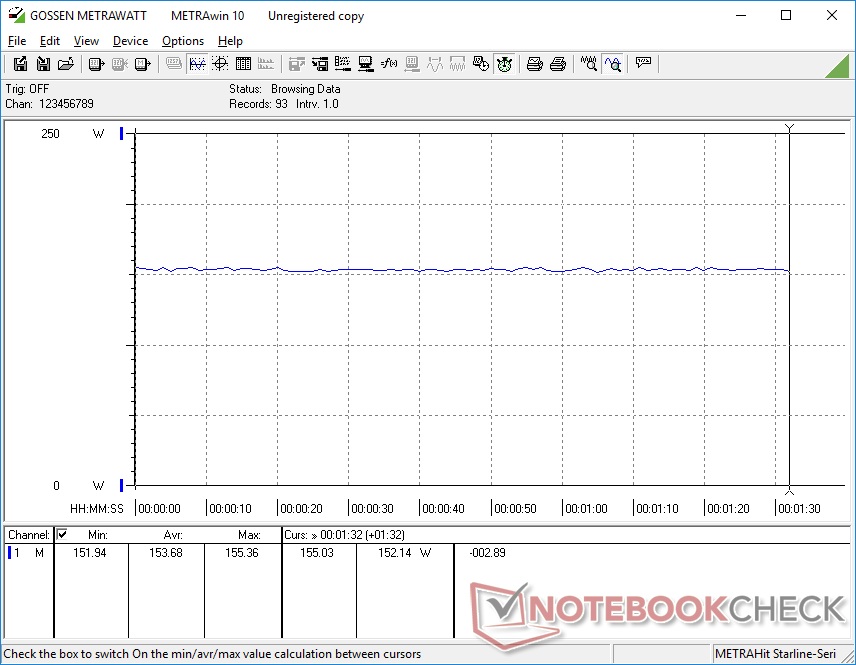
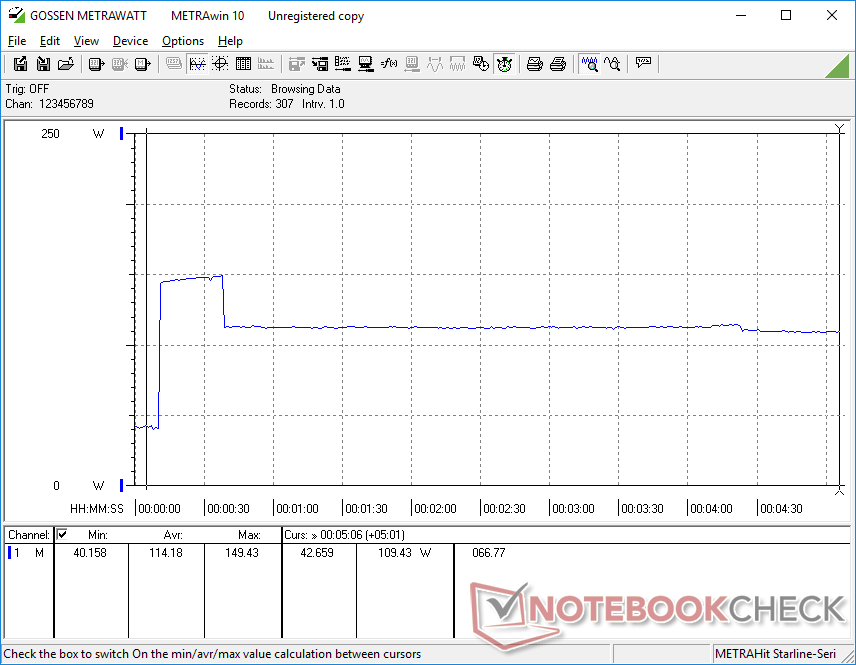
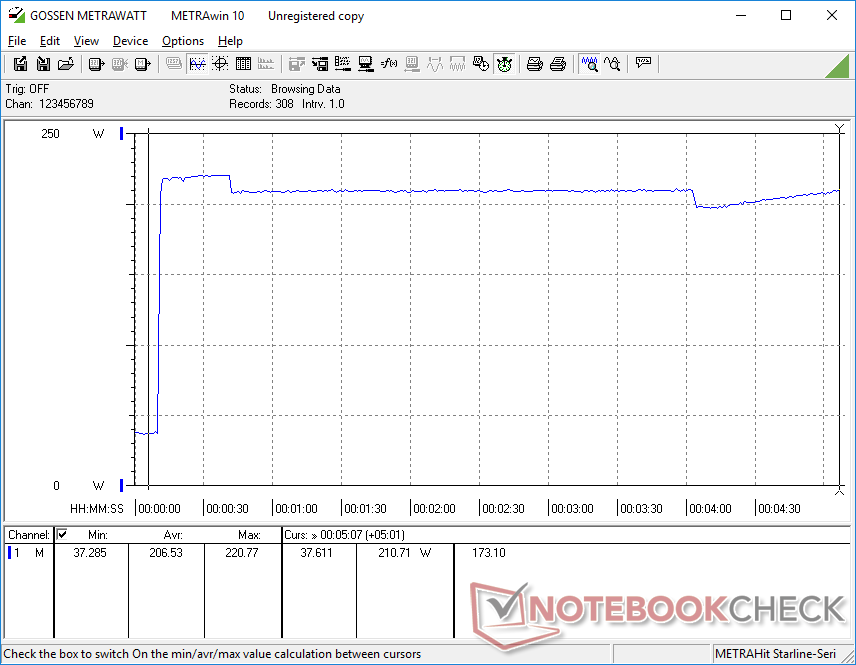
Consumo energetico
When gaming, power consumption would hover around 154 W compared to 155 W on the MSI GS66 RTX 2070 Super Max-Q or 145 W on the MSI GS66 RTX 2080 Super Max-Q. In other words, there isn't a linear increase in power consumption relative to the increase in GPU performance when jumping from the RTX 2070 Super Max-Q to the RTX 2080 Super Max-Q. This means that users can enjoy the performance benefits of the RTX 2080 Super Max-Q without necessarily needing to run louder or warmer than a lesser RTX 2070 Super Max-Q configuration.
| Off / Standby | |
| Idle | |
| Sotto carico |
|
Leggenda:
min: | |
| Razer Blade 15 RTX 2070 Super Max-Q i7-10875H, GeForce RTX 2070 Super Max-Q, Samsung SSD PM981a MZVLB512HBJQ, IPS, 1920x1080, 15.6" | MSI GS66 Stealth 10SFS i9-10980HK, GeForce RTX 2070 Super Max-Q, Samsung SSD PM981 MZVLB1T0HALR, IPS, 1920x1080, 15.6" | Asus Zephyrus S GX502GW i7-9750H, GeForce RTX 2070 Mobile, 2x Intel SSD 660p SSDPEKNW512G8 (RAID 0), IPS, 1920x1080, 15.6" | Gigabyte Aero 15 Classic-XA i7-9750H, GeForce RTX 2070 Max-Q, Intel SSD 760p SSDPEKKW512G8, IGZO, 1920x1080, 15.6" | Lenovo Legion Y740-15ICHg i7-9750H, GeForce RTX 2070 Max-Q, WDC PC SN520 SDAPMUW-128G, IPS, 1920x1080, 15.6" | Razer Blade 15 RTX 2080 Super Max-Q i7-10875H, GeForce RTX 2080 Super Max-Q, Samsung PM981a MZVLB1T0HBLR, IPS, 1920x1080, 15.6" | |
|---|---|---|---|---|---|---|
| Power Consumption | 11% | -17% | -2% | -2% | 24% | |
| Idle Minimum * (Watt) | 14.3 | 13 9% | 24 -68% | 21 -47% | 22.2 -55% | 10.6 26% |
| Idle Average * (Watt) | 22.3 | 16 28% | 27 -21% | 23 -3% | 24.9 -12% | 13.1 41% |
| Idle Maximum * (Watt) | 36.9 | 27 27% | 33 11% | 32 13% | 30.6 17% | 15.8 57% |
| Load Average * (Watt) | 118.4 | 109 8% | 129 -9% | 97 18% | 101 15% | 131 -11% |
| Witcher 3 ultra * (Watt) | 153.7 | 155 -1% | 176 -15% | 148 4% | 143 7% | 146 5% |
| Load Maximum * (Watt) | 220.8 | 236 -7% | 216 2% | 213 4% | 186 16% | 169 23% |
* ... Meglio usare valori piccoli
Autonomia della batteria
| Razer Blade 15 RTX 2070 Super Max-Q i7-10875H, GeForce RTX 2070 Super Max-Q, 80 Wh | MSI GS66 Stealth 10SFS i9-10980HK, GeForce RTX 2070 Super Max-Q, 99.99 Wh | Asus Zephyrus S GX502GW i7-9750H, GeForce RTX 2070 Mobile, 76 Wh | Gigabyte Aero 15 Classic-XA i7-9750H, GeForce RTX 2070 Max-Q, 94.24 Wh | Lenovo Legion Y740-15ICHg i7-9750H, GeForce RTX 2070 Max-Q, 57 Wh | HP Envy 15-ep0098nr i7-10750H, GeForce RTX 2060 Max-Q, 83 Wh | |
|---|---|---|---|---|---|---|
| Autonomia della batteria | -3% | -41% | 11% | -52% | -5% | |
| WiFi v1.3 (h) | 6.3 | 6.1 -3% | 3.7 -41% | 7 11% | 3 -52% | 6 -5% |
| Reader / Idle (h) | 8.4 | 5.9 | 9.1 | 15 | ||
| Load (h) | 1.7 | 1 | 3 | 1.6 |
Pro
Contro
Giudizio Complessivo
L'aggiornamento dalla configurazione GeForce RTX 2070 Super Max-Q alla configurazione GeForce RTX 2080 Super Max-Q porterà circa il 15% in più di prestazioni senza influire in modo significativo sulla durata della batteria, sul rumore della ventola, sul consumo energetico o sulla temperatura. Si tratta di una differenza di 400 dollari tra questi due SKU, tuttavia, quindi gli utenti dovrebbero decidere con attenzione se ritengono che l'aumento della grafica valga l'investimento extra rispetto alla nostra più economica opzione GeForce RTX 2070 Super Max-Q.
In fin dei conti, la GeForce RTX 2070 Super Max-Q ha prestazioni molto simili a quelle di una normale GeForce RTX 2060 desktop, ma in un attraente fattore di forma per laptop. Questo rimane uno dei migliori portatili gaming ultra-sottili che si possono ottenere al momento in termini di prestazioni e di design estetico anche dopo aver considerato gli stessi svantaggi che abbiamo visto negli anni precedenti. Se non volete spendere troppo per l'ultimo Blade 15, la GeForce RTX 2070 Super Max-Q non è poi così diversa dalle vecchie e più economiche GeForce RTX 2070 Max-Q.
Razer Blade 15 RTX 2070 Super Max-Q
- 08/19/2020 v7 (old)
Allen Ngo
Price comparison
