Recensione del Laptop Lenovo Legion Y740: solo un piccolo upgrade della CPU

| |||||||||||||||||||||||||
Distribuzione della luminosità: 84 %
Al centro con la batteria: 477 cd/m²
Contrasto: 2726:1 (Nero: 0.175 cd/m²)
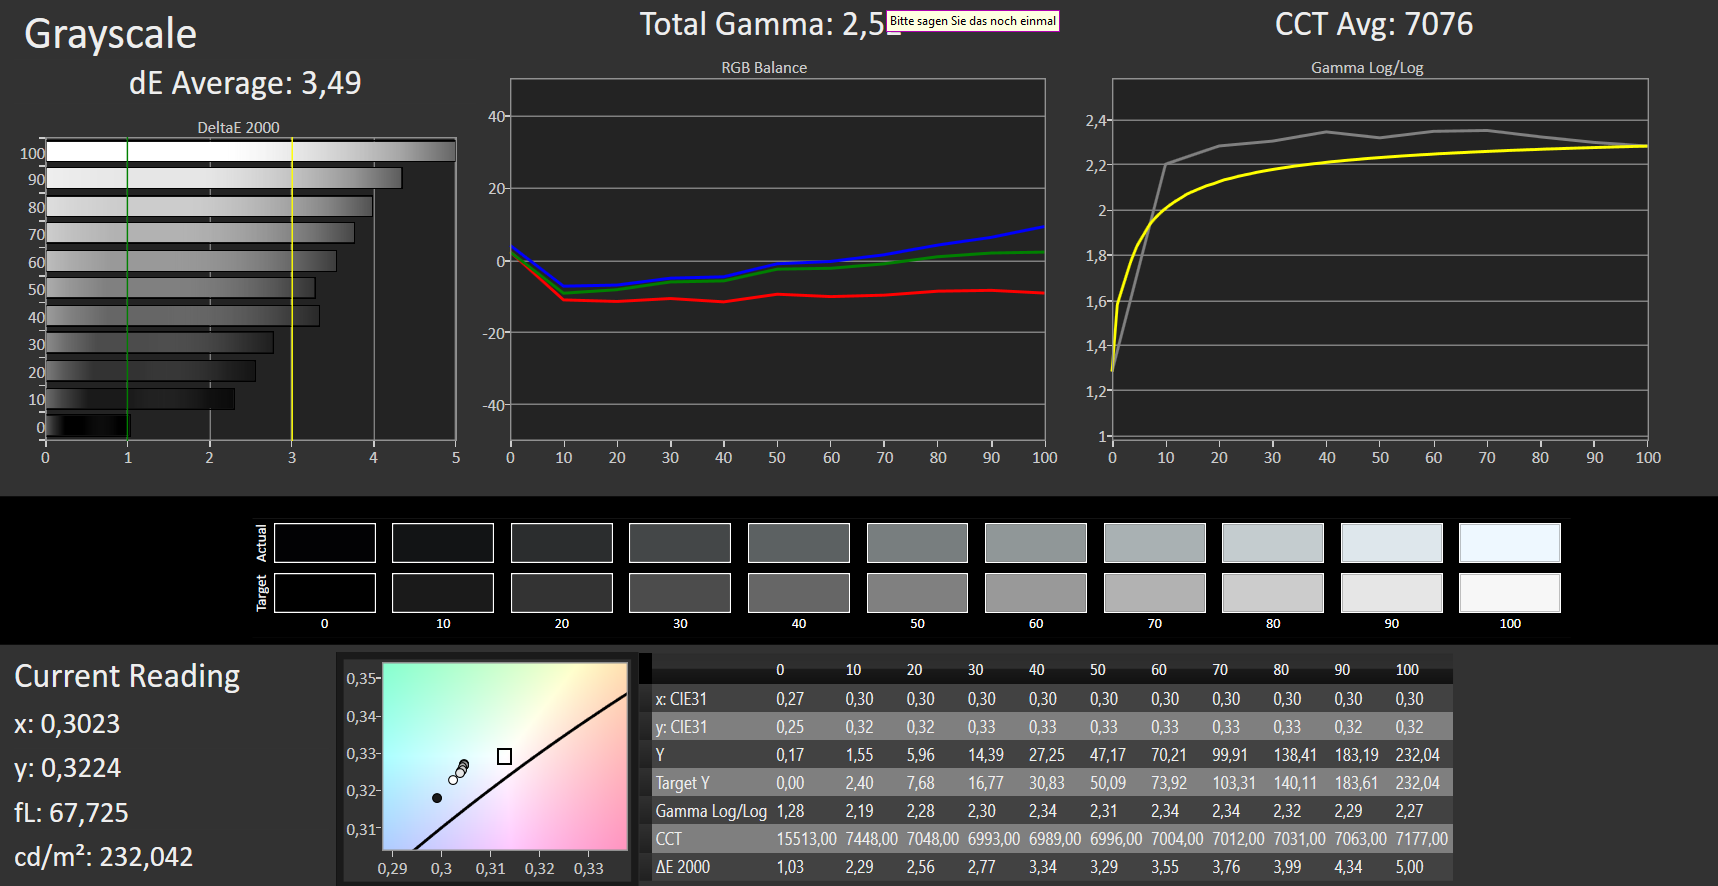
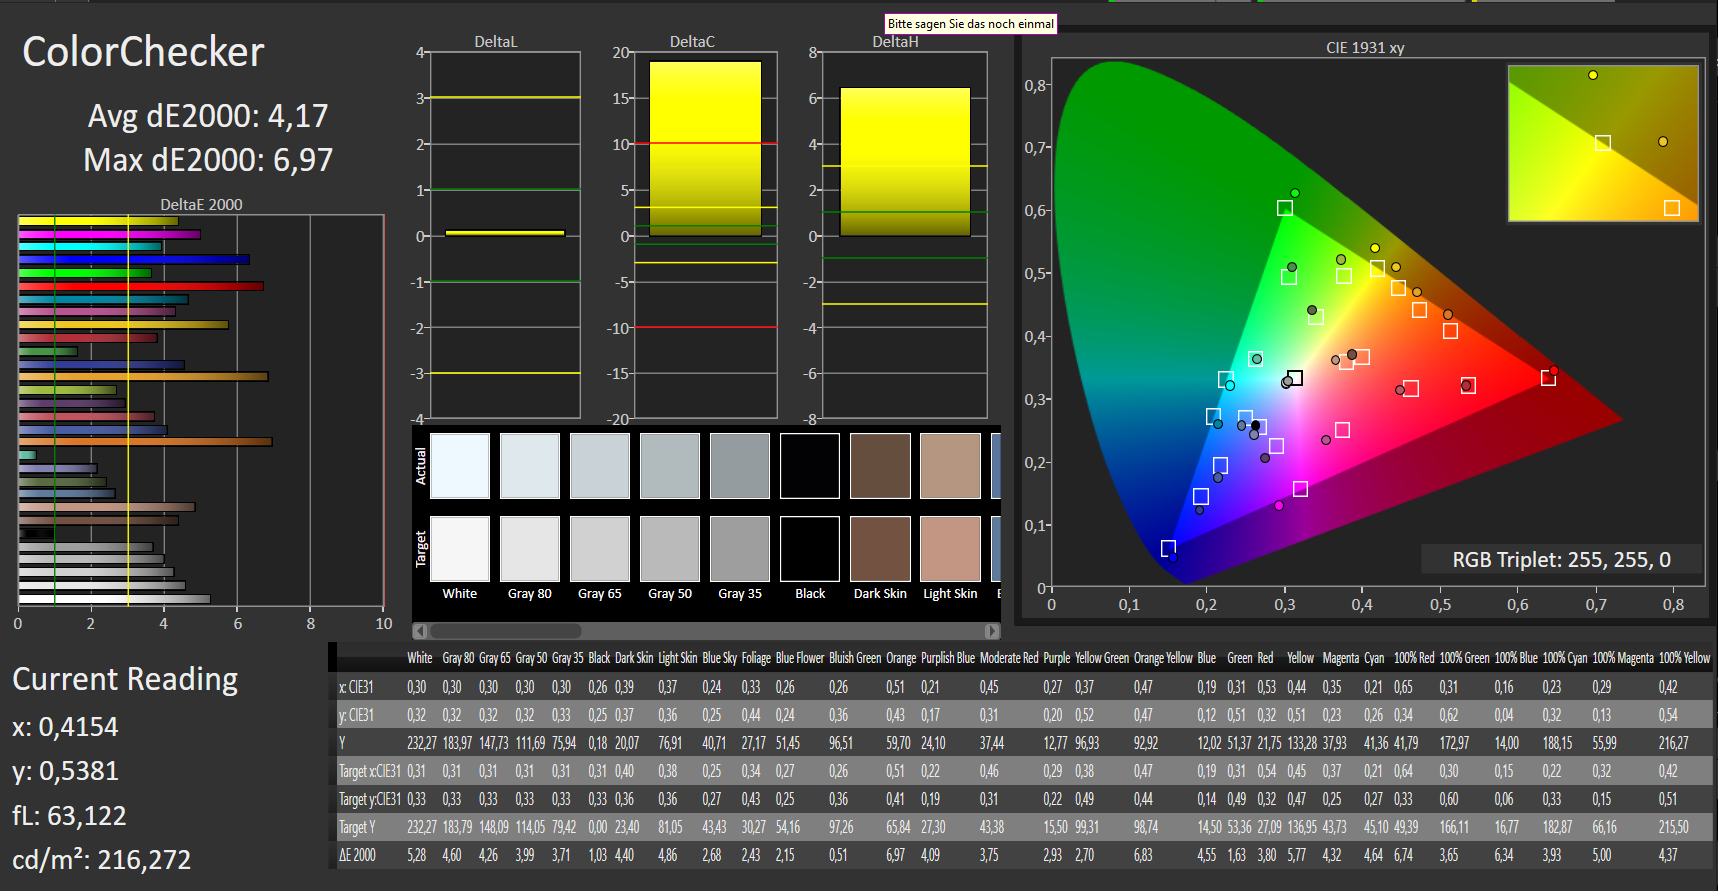
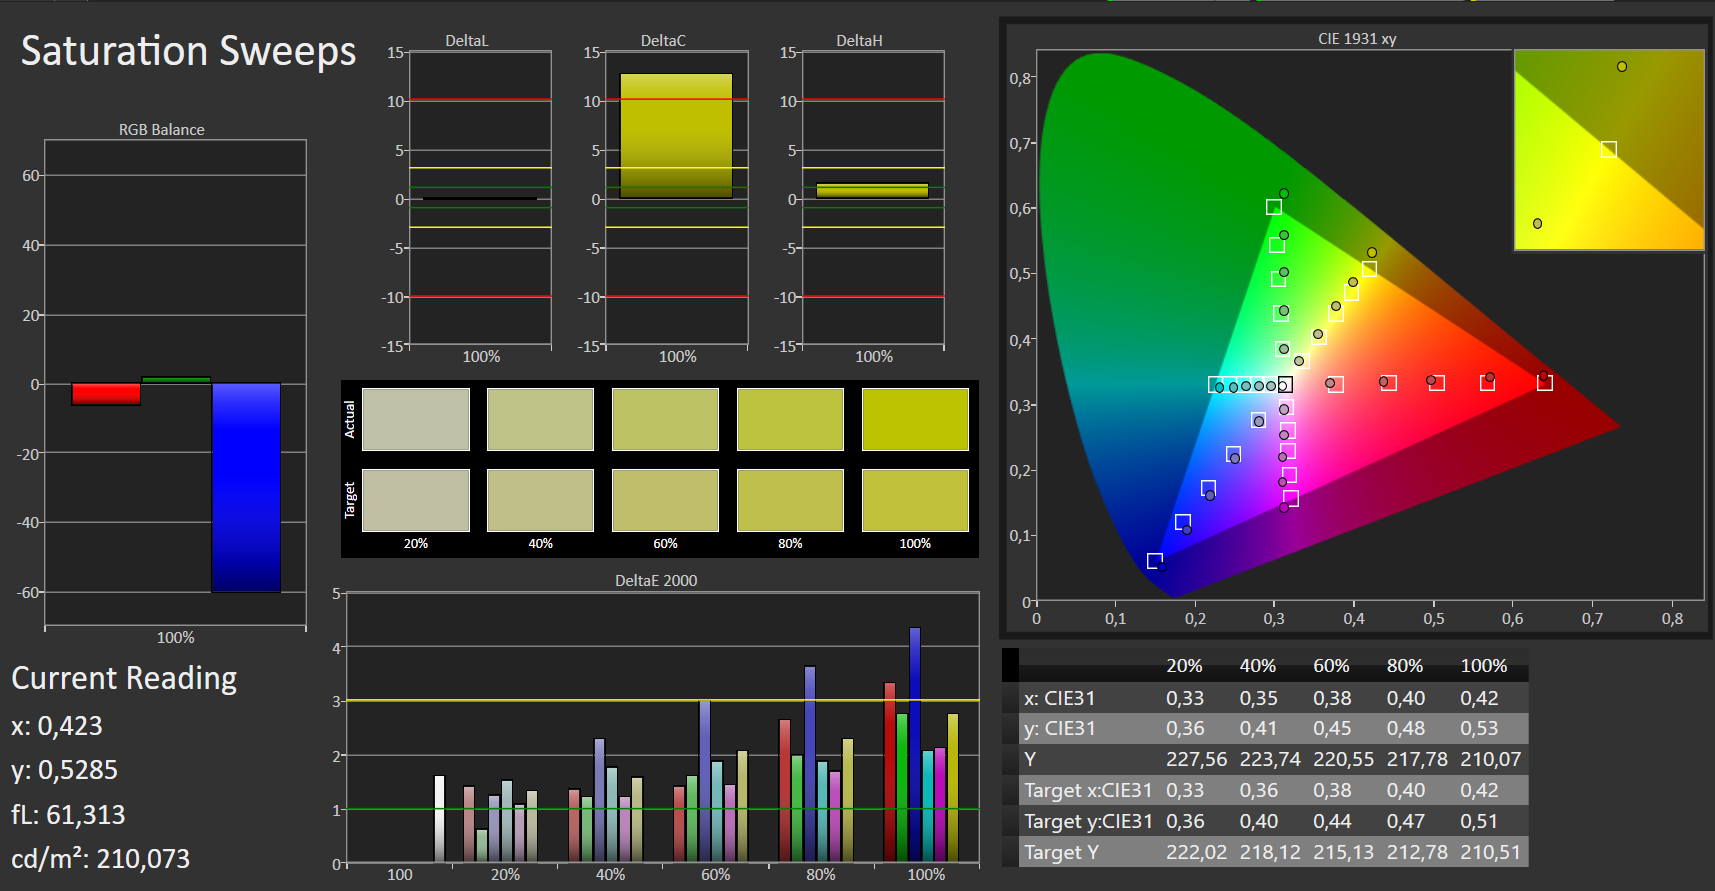
ΔE ColorChecker Calman: 4.17 | ∀{0.5-29.43 Ø4.73}
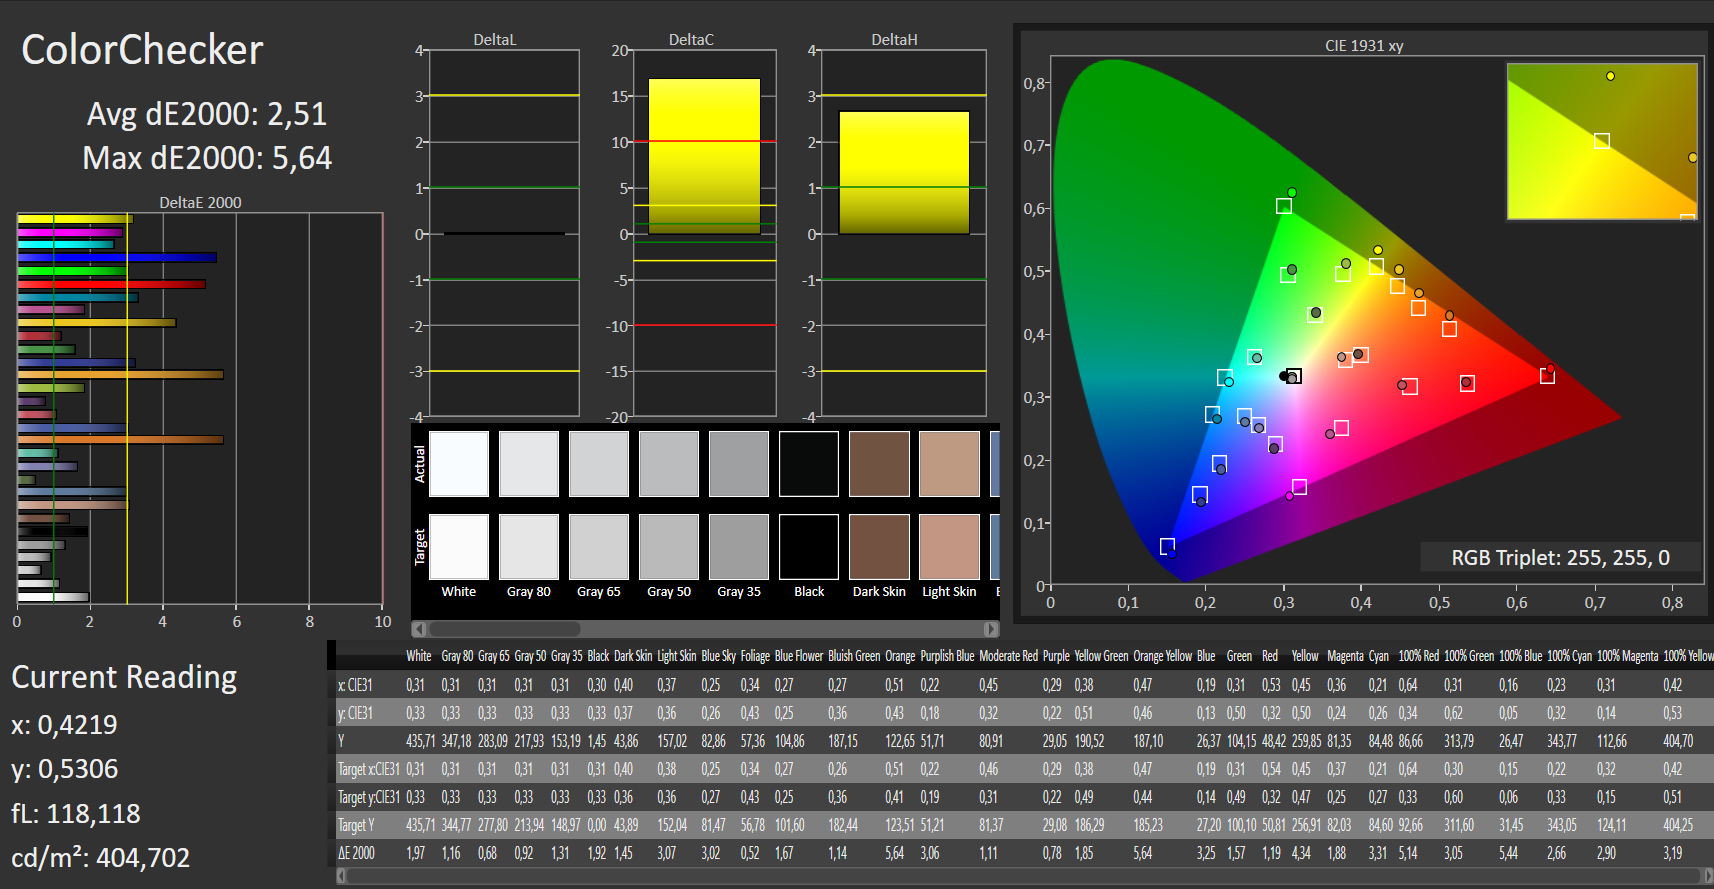
calibrated: 2.51
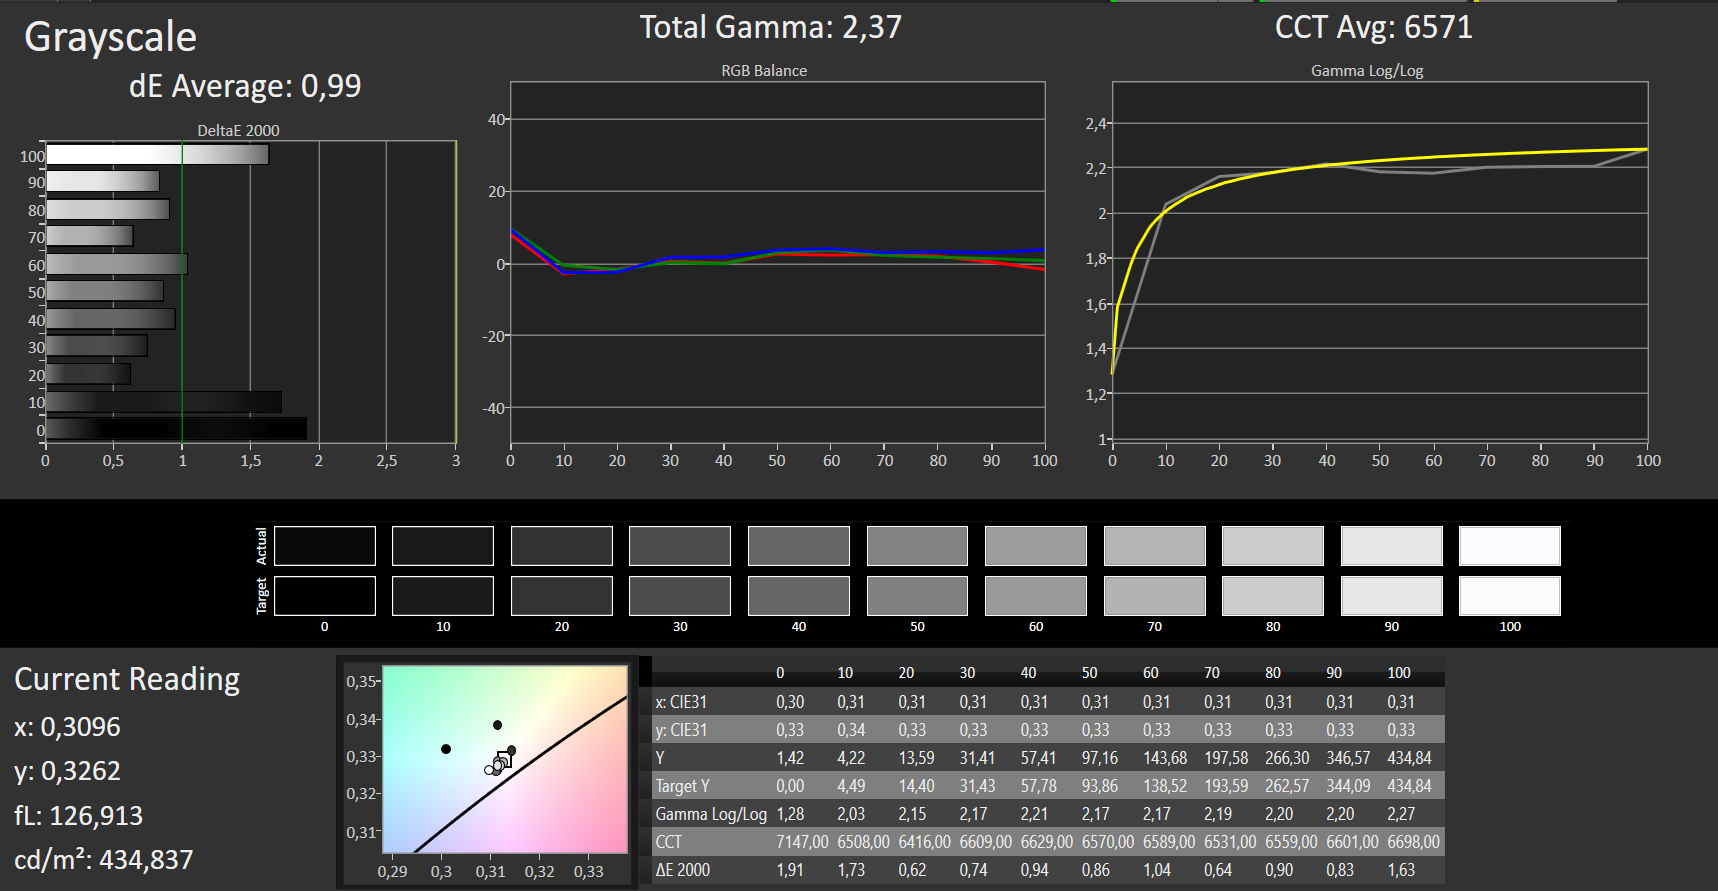
ΔE Greyscale Calman: 3.49 | ∀{0.09-98 Ø4.97}
91% sRGB (Argyll 1.6.3 3D)
60% AdobeRGB 1998 (Argyll 1.6.3 3D)
67.1% AdobeRGB 1998 (Argyll 3D)
91.6% sRGB (Argyll 3D)
67.7% Display P3 (Argyll 3D)
Gamma: 2.5
CCT: 7076 K
| Lenovo Legion Y740-15ICHg BOE NV156FHM-N4J, IPS, 1920x1080, 15.6" | Lenovo Legion Y740-15ICHg LP156WFG-SPB2, IPS, 1920x1080, 15.6" | HP Omen X 2S 15-dg0075cl AU Optronics AUO82ED, IPS, 1920x1080, 15.6" | Acer Predator Triton 500 PT515-51-71PZ NV156FHM-N4K (BOE082A), IPS, 1920x1080, 15.6" | |
|---|---|---|---|---|
| Display | -3% | -0% | -2% | |
| Display P3 Coverage (%) | 67.7 | 63.5 -6% | 66.2 -2% | 64.6 -5% |
| sRGB Coverage (%) | 91.6 | 92.4 1% | 92.3 1% | 92.6 1% |
| AdobeRGB 1998 Coverage (%) | 67.1 | 64.7 -4% | 67.2 0% | 66 -2% |
| Response Times | -16% | 6% | 31% | |
| Response Time Grey 50% / Grey 80% * (ms) | 19 ? | 18.8 ? 1% | 15.2 ? 20% | 5.2 ? 73% |
| Response Time Black / White * (ms) | 10 ? | 13.2 ? -32% | 10.8 ? -8% | 11.2 ? -12% |
| PWM Frequency (Hz) | ||||
| Screen | -21% | -25% | -7% | |
| Brightness middle (cd/m²) | 477 | 320.4 -33% | 324.8 -32% | 288 -40% |
| Brightness (cd/m²) | 431 | 298 -31% | 316 -27% | 265 -39% |
| Brightness Distribution (%) | 84 | 85 1% | 84 0% | 84 0% |
| Black Level * (cd/m²) | 0.175 | 0.42 -140% | 0.26 -49% | 0.22 -26% |
| Contrast (:1) | 2726 | 763 -72% | 1249 -54% | 1309 -52% |
| Colorchecker dE 2000 * | 4.17 | 3.21 23% | 4.96 -19% | 3.22 23% |
| Colorchecker dE 2000 max. * | 6.97 | 5.54 21% | 8.95 -28% | 6.26 10% |
| Colorchecker dE 2000 calibrated * | 2.51 | 2.36 6% | 3.23 -29% | 1.5 40% |
| Greyscale dE 2000 * | 3.49 | 3.6 -3% | 5 -43% | 3.43 2% |
| Gamma | 2.5 88% | 2.27 97% | 2.21 100% | 2.41 91% |
| CCT | 7076 92% | 6503 100% | 7742 84% | 7290 89% |
| Color Space (Percent of AdobeRGB 1998) (%) | 60 | 59 -2% | 59.8 0% | 60 0% |
| Color Space (Percent of sRGB) (%) | 91 | 92 1% | 91.8 1% | 93 2% |
| Media totale (Programma / Settaggio) | -13% /
-17% | -6% /
-17% | 7% /
-2% |
* ... Meglio usare valori piccoli
Tempi di risposta del Display
| ↔ Tempi di risposta dal Nero al Bianco | ||
|---|---|---|
| 10 ms ... aumenta ↗ e diminuisce ↘ combinato | ↗ 6 ms Incremento | 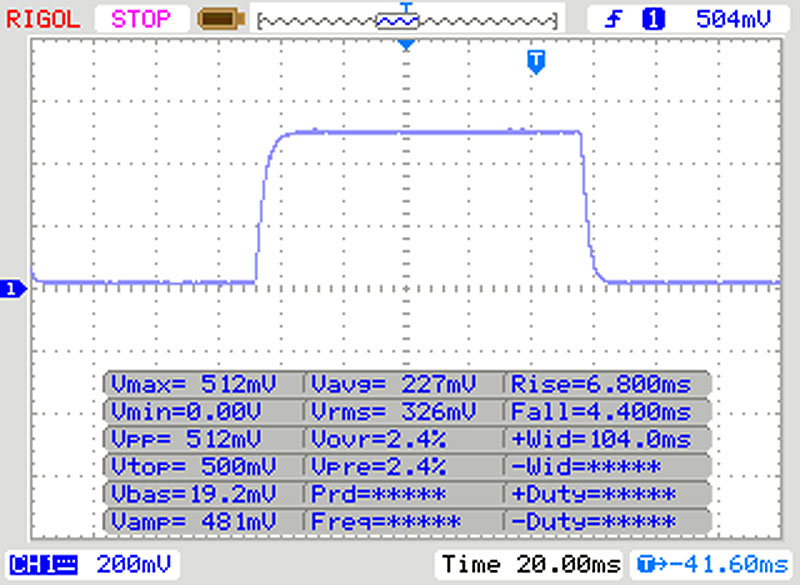 |
| ↘ 4 ms Calo | ||
| Lo schermo mostra buoni tempi di risposta durante i nostri tests, ma potrebbe essere troppo lento per i gamers competitivi. In confronto, tutti i dispositivi di test variano da 0.1 (minimo) a 240 (massimo) ms. » 27 % di tutti i dispositivi è migliore. Questo significa che i tempi di risposta rilevati sono migliori rispettto alla media di tutti i dispositivi testati (19.9 ms). | ||
| ↔ Tempo di risposta dal 50% Grigio all'80% Grigio | ||
| 19 ms ... aumenta ↗ e diminuisce ↘ combinato | ↗ 9 ms Incremento | 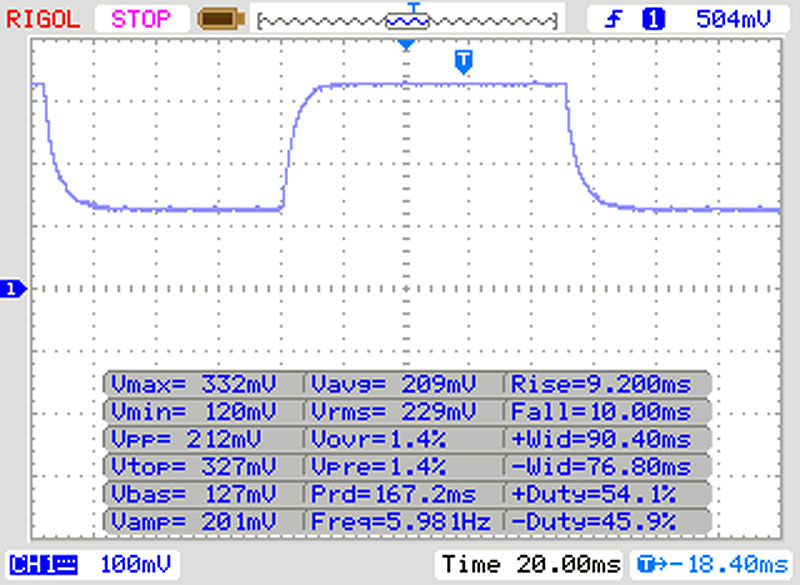 |
| ↘ 10 ms Calo | ||
| Lo schermo mostra buoni tempi di risposta durante i nostri tests, ma potrebbe essere troppo lento per i gamers competitivi. In confronto, tutti i dispositivi di test variano da 0.165 (minimo) a 636 (massimo) ms. » 32 % di tutti i dispositivi è migliore. Questo significa che i tempi di risposta rilevati sono migliori rispettto alla media di tutti i dispositivi testati (31.1 ms). | ||
Sfarfallio dello schermo / PWM (Pulse-Width Modulation)
| flickering dello schermo / PWM non rilevato | 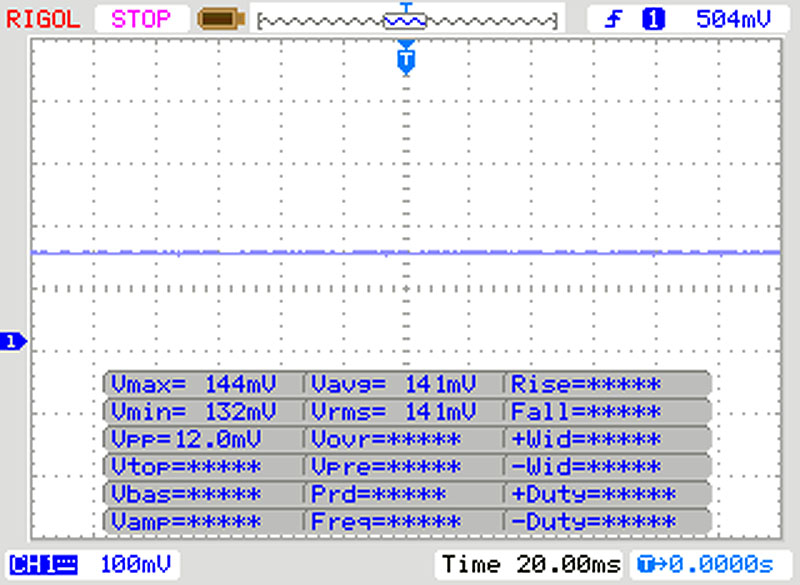 | ||
In confronto: 52 % di tutti i dispositivi testati non utilizza PWM per ridurre la luminosita' del display. Se è rilevato PWM, una media di 7798 (minimo: 5 - massimo: 343500) Hz è stata rilevata. | |||
| 3DMark 11 - 1280x720 Performance Physics | |
| HP Omen X 2S 15-dg0075cl | |
| Lenovo Legion Y740-15ICHg | |
| Acer Predator Triton 500 PT515-51-71PZ | |
| Media Intel Core i7-9750H (9704 - 14337, n=80) | |
| Lenovo Legion Y740-15ICHg | |
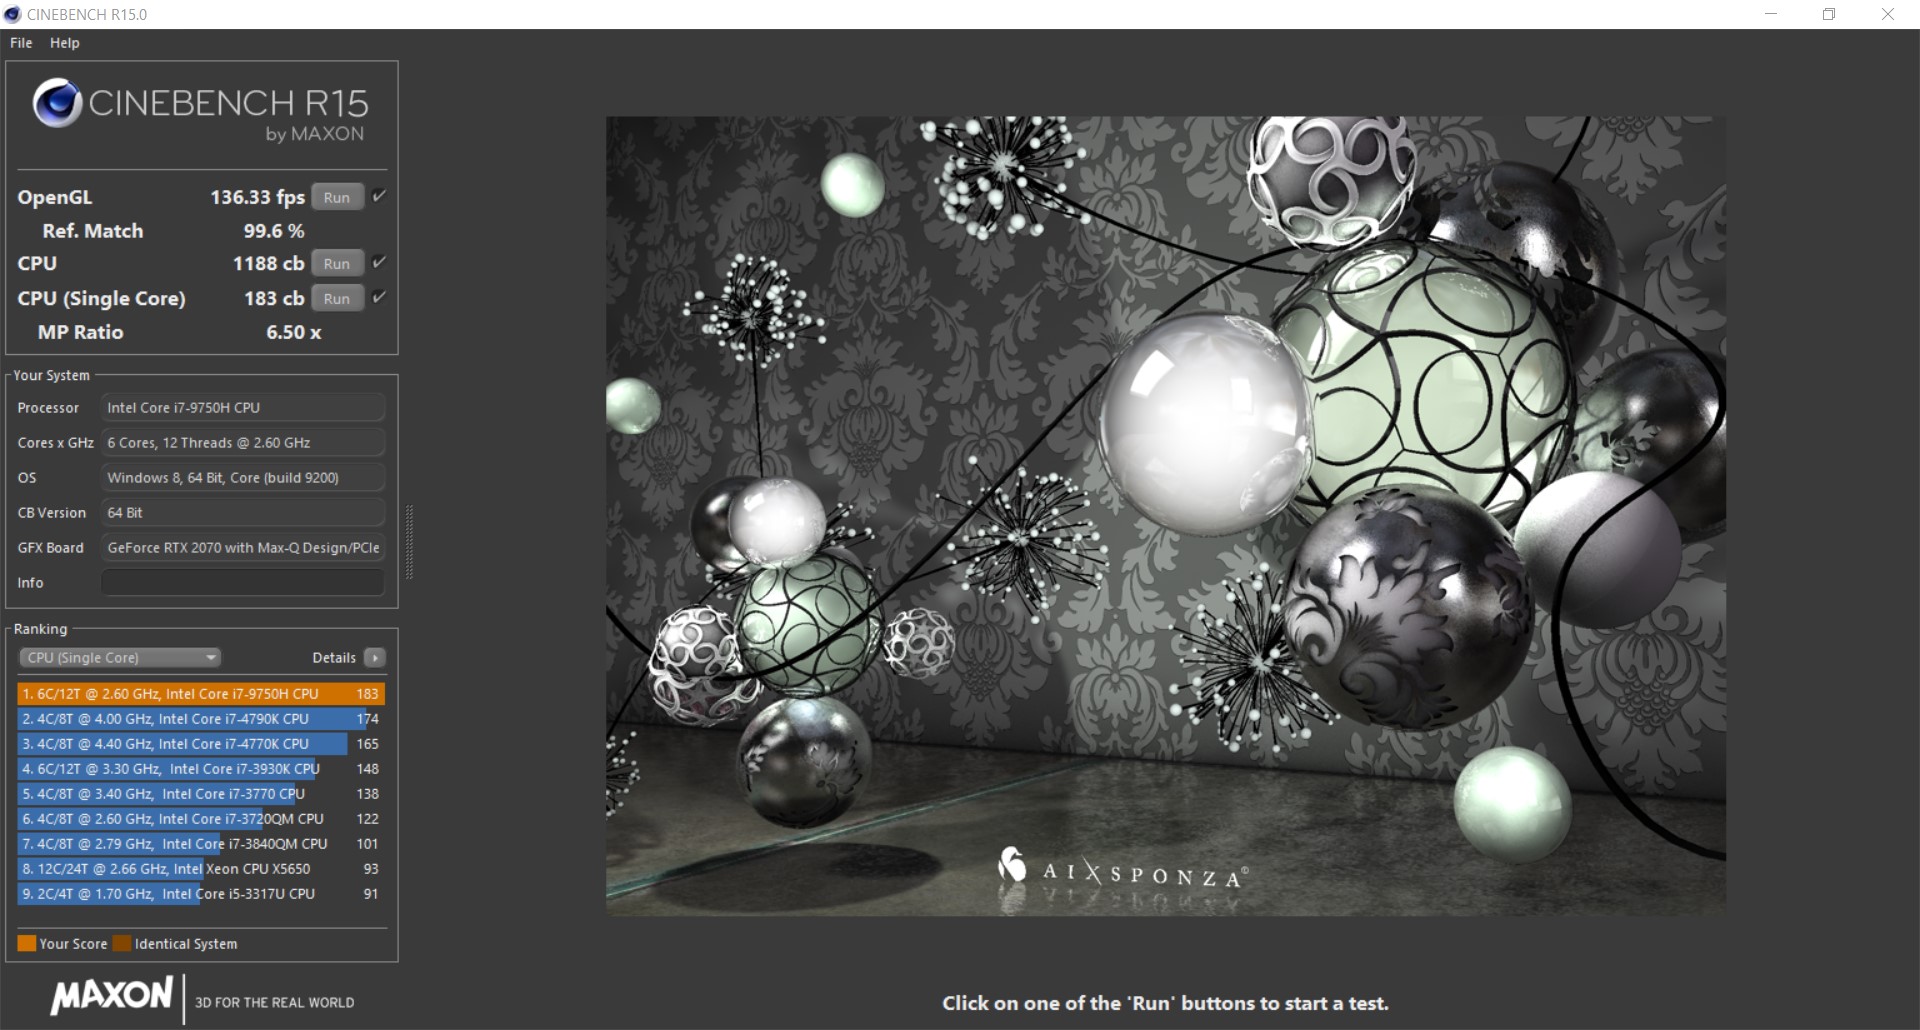
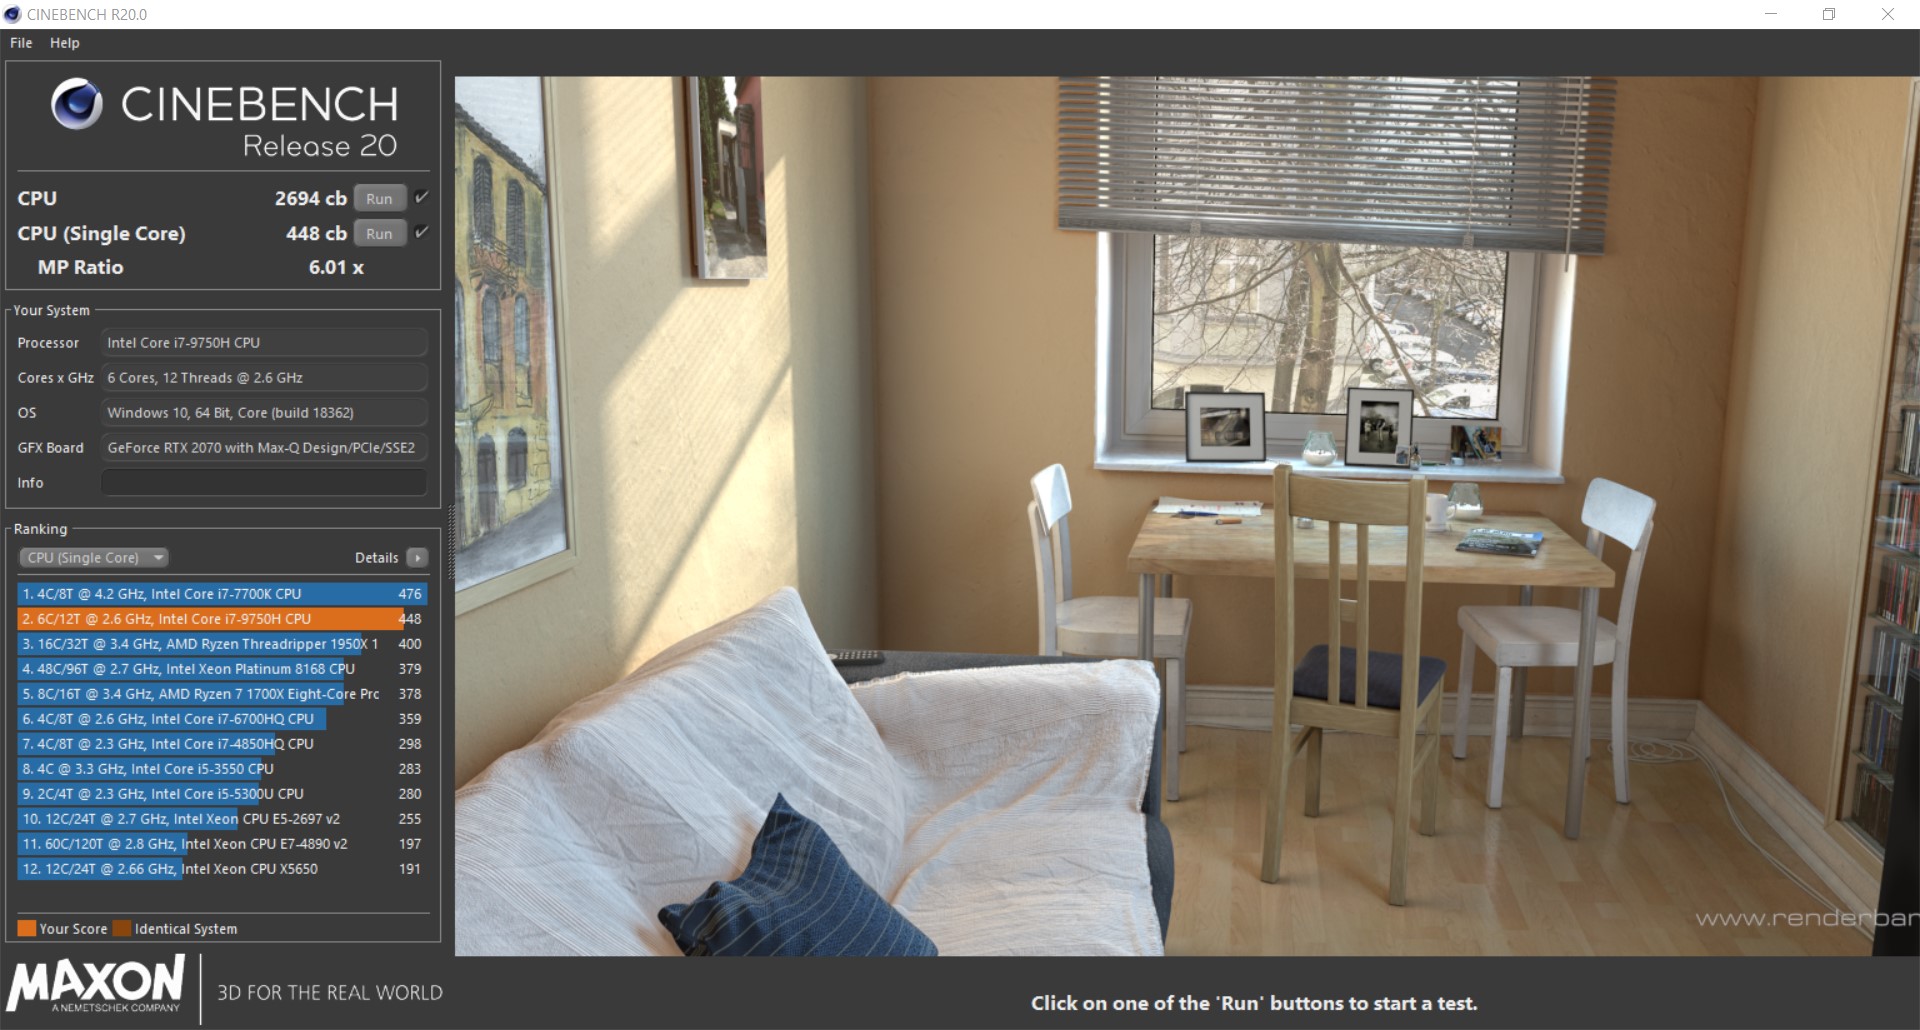
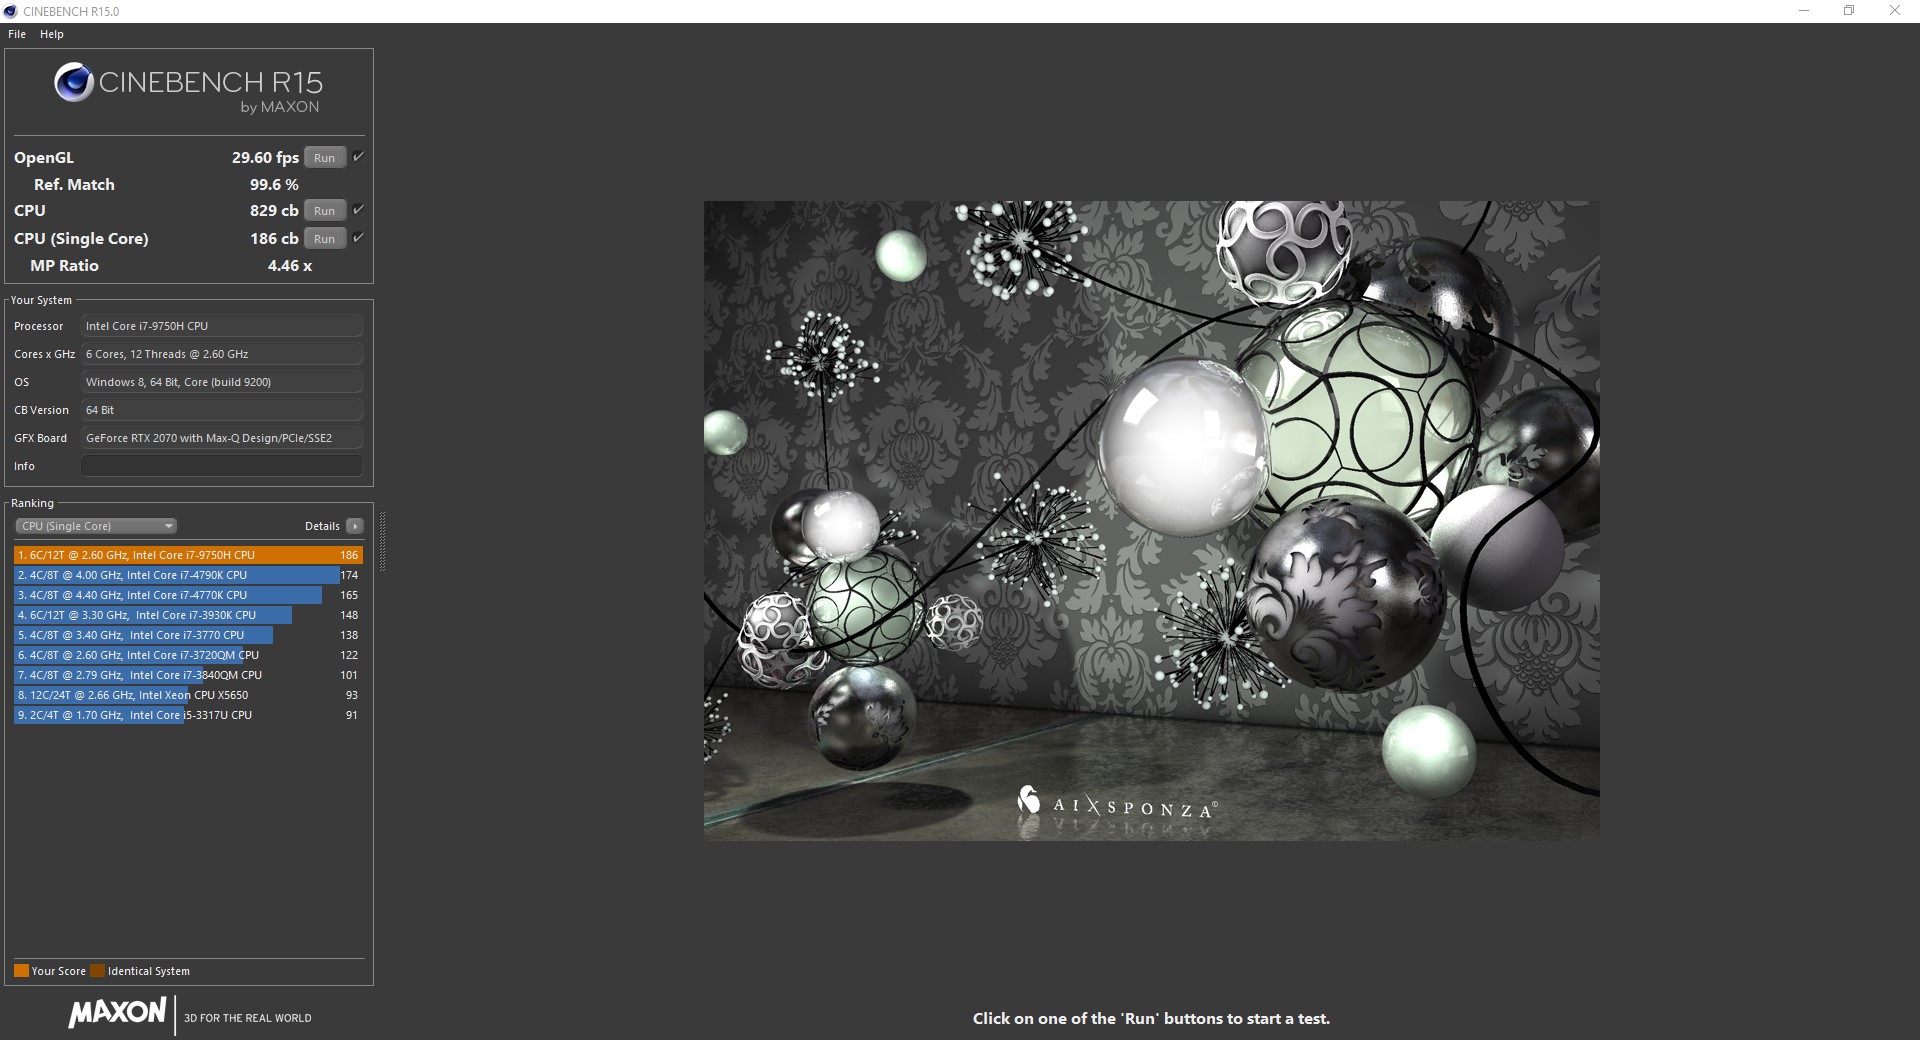
| Blender - v2.79 BMW27 CPU | |
| Media Intel Core i7-9750H (342 - 495, n=21) | |
| Lenovo Legion Y740-15ICHg | |
| Geekbench 4.4 | |
| 64 Bit Single-Core Score | |
| Lenovo Legion Y740-15ICHg | |
| Media Intel Core i7-9750H (4440 - 5511, n=27) | |
| 64 Bit Multi-Core Score | |
| Lenovo Legion Y740-15ICHg | |
| Media Intel Core i7-9750H (17054 - 25043, n=27) | |
| 7-Zip 18.03 | |
| 7z b 4 | |
| Lenovo Legion Y740-15ICHg | |
| Media Intel Core i7-9750H (28512 - 35174, n=21) | |
| 7z b 4 -mmt1 | |
| Lenovo Legion Y740-15ICHg | |
| Media Intel Core i7-9750H (4580 - 5090, n=21) | |
* ... Meglio usare valori piccoli
| PCMark 8 Home Score Accelerated v2 | 5661 punti | |
| PCMark 8 Creative Score Accelerated v2 | 8613 punti | |
| PCMark 8 Work Score Accelerated v2 | 5870 punti | |
| PCMark 10 Score | 5938 punti | |
Aiuto | ||
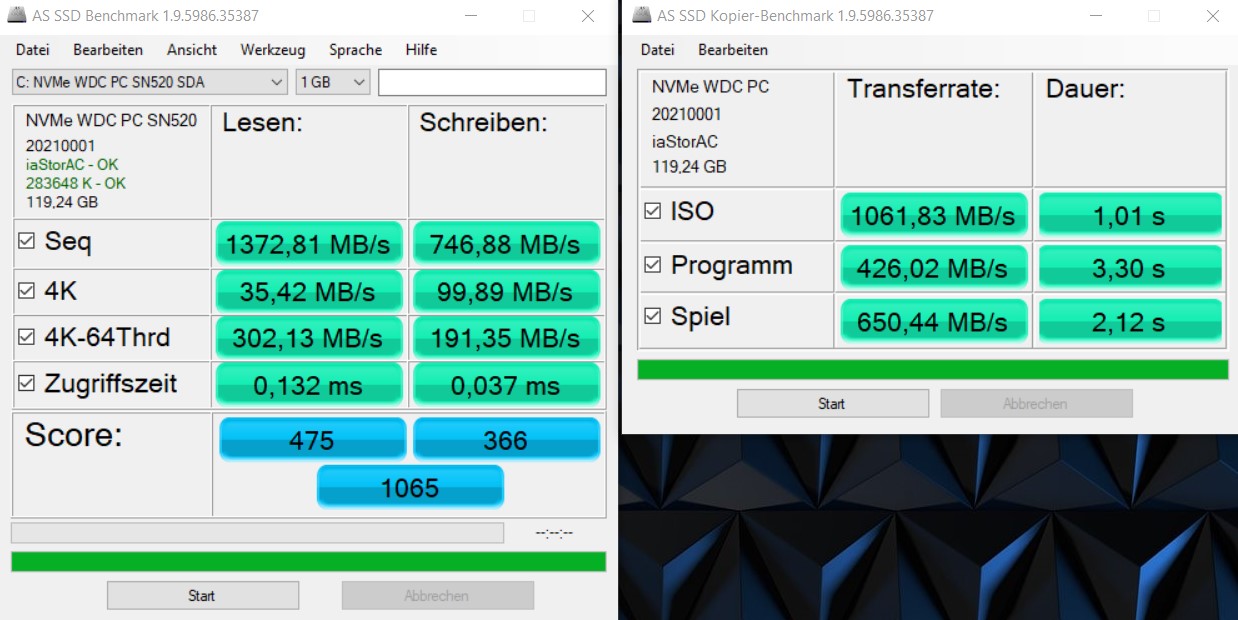
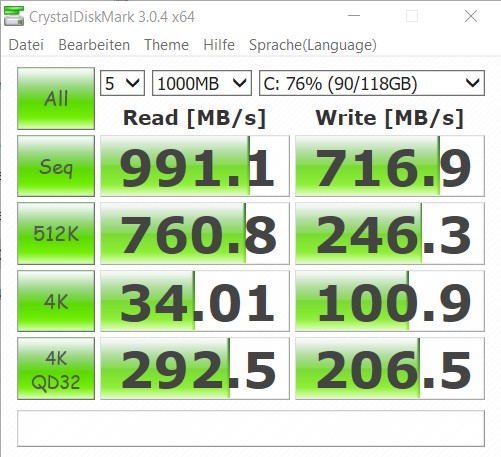
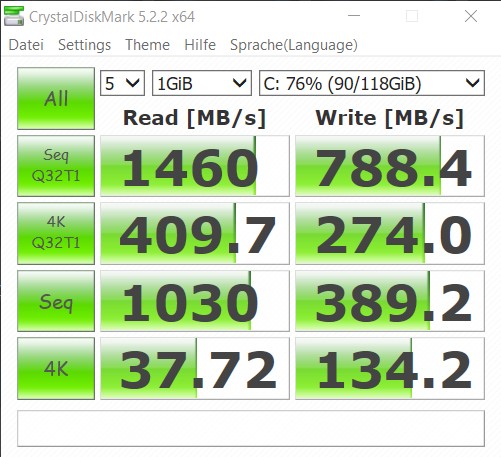
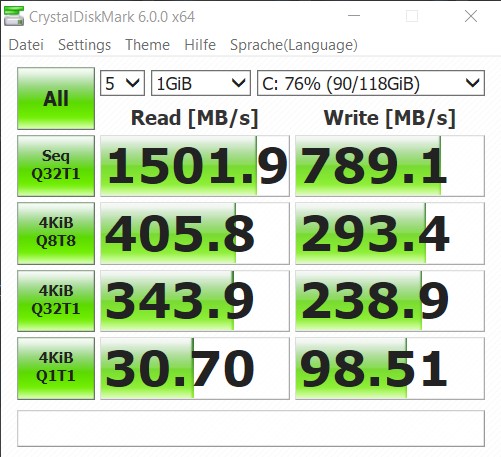
| Lenovo Legion Y740-15ICHg WDC PC SN520 SDAPMUW-128G | Lenovo Legion Y740-15ICHg Samsung SSD PM981 MZVLB256HAHQ | HP Omen X 2S 15-dg0075cl WDC PC SN720 SDAPNTW-1T00 | Acer Predator Triton 500 PT515-51-71PZ WDC PC SN720 SDAPNTW-512G | Media WDC PC SN520 SDAPMUW-128G | Media della classe Gaming | |
|---|---|---|---|---|---|---|
| AS SSD | 133% | 199% | 266% | -4% | 367% | |
| Seq Read (MB/s) | 1372 | 1953 42% | 2105 53% | 2888 110% | 1356 ? -1% | 5487 ? 300% |
| Seq Write (MB/s) | 746 | 1629 118% | 2493 234% | 2374 218% | 717 ? -4% | 3926 ? 426% |
| 4K Read (MB/s) | 35.42 | 33.2 -6% | 25.01 -29% | 42.95 21% | 29.3 ? -17% | 70.1 ? 98% |
| 4K Write (MB/s) | 99.9 | 88.1 -12% | 108.7 9% | 143.6 44% | 99.4 ? -1% | 215 ? 115% |
| 4K-64 Read (MB/s) | 302.1 | 757 151% | 1604 431% | 1272 321% | 302 ? 0% | 1647 ? 445% |
| 4K-64 Write (MB/s) | 191.4 | 1501 684% | 1593 732% | 1546 708% | 198 ? 3% | 2876 ? 1403% |
| Access Time Read * (ms) | 0.132 | 0.077 42% | 0.046 65% | 0.158 ? -20% | 0.06383 ? 52% | |
| Access Time Write * (ms) | 0.037 | 0.043 -16% | 0.102 -176% | 0.037 ? -0% | 0.03932 ? -6% | |
| Score Read (Points) | 475 | 985 107% | 1840 287% | 1604 238% | 467 ? -2% | 2266 ? 377% |
| Score Write (Points) | 366 | 1752 379% | 1951 433% | 1927 427% | 369 ? 1% | 3483 ? 852% |
| Score Total (Points) | 1065 | 3230 203% | 4743 345% | 4329 306% | 1052 ? -1% | 6838 ? 542% |
| Copy ISO MB/s (MB/s) | 1062 | 1872 76% | 2250 112% | 1025 ? -3% | 3083 ? 190% | |
| Copy Program MB/s (MB/s) | 426 | 478.2 12% | 896 110% | 377 ? -12% | 956 ? 124% | |
| Copy Game MB/s (MB/s) | 650 | 1165 79% | 1854 185% | 704 ? 8% | 2043 ? 214% |
* ... Meglio usare valori piccoli

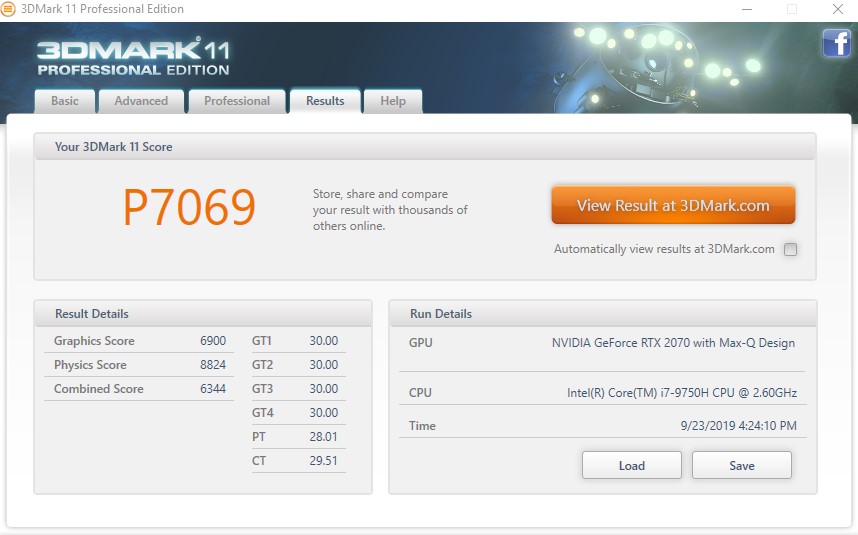
| 3DMark 11 Performance | 18733 punti | |
| 3DMark Ice Storm Standard Score | 175118 punti | |
| 3DMark Cloud Gate Standard Score | 36994 punti | |
| 3DMark Fire Strike Score | 15386 punti | |
| 3DMark Fire Strike Extreme Score | 7892 punti | |
| 3DMark Time Spy Score | 6777 punti | |
Aiuto | ||
| The Witcher 3 - 1920x1080 Ultra Graphics & Postprocessing (HBAO+) | |
| Media della classe Gaming (95 - 240, n=8, ultimi 2 anni) | |
| HP Omen X 2S 15-dg0075cl | |
| Media NVIDIA GeForce RTX 2070 Max-Q (56 - 83.8, n=31) | |
| Acer Predator Triton 500 PT515-51-71PZ | |
| Lenovo Legion Y740-15ICHg | |
| Lenovo Legion Y740-15ICHg | |
| basso | medio | alto | ultra | |
|---|---|---|---|---|
| The Witcher 3 (2015) | 300 | 213 | 123 | 60 |
| Dota 2 Reborn (2015) | 142.4 | 133.7 | 133 | 124.1 |
| X-Plane 11.11 (2018) | 110 | 99 | 83 | |
| Shadow of the Tomb Raider (2018) | 126 | 99 | 92 | 81 |
| Metro Exodus (2019) | 127.2 | 76.8 | 57.3 | 47 |
Rumorosità
| Idle |
| 31.3 / 31.3 / 31.3 dB(A) |
| HDD |
| 32 dB(A) |
| Sotto carico |
| 42 / 46.5 dB(A) |
 | ||
30 dB silenzioso 40 dB(A) udibile 50 dB(A) rumoroso |
||
min: | ||
| Lenovo Legion Y740-15ICHg GeForce RTX 2070 Max-Q, i7-9750H, WDC PC SN520 SDAPMUW-128G | Lenovo Legion Y740-15ICHg GeForce RTX 2070 Max-Q, i7-8750H, Samsung SSD PM981 MZVLB256HAHQ | HP Omen X 2S 15-dg0075cl GeForce RTX 2070 Max-Q, i7-9750H, WDC PC SN720 SDAPNTW-1T00 | Acer Predator Triton 500 PT515-51-71PZ GeForce RTX 2070 Max-Q, i7-9750H, WDC PC SN720 SDAPNTW-512G | |
|---|---|---|---|---|
| Noise | 3% | -4% | -8% | |
| off /ambiente * (dB) | 30 | 28 7% | 29 3% | 30 -0% |
| Idle Minimum * (dB) | 31.3 | 32.6 -4% | 30.5 3% | 30 4% |
| Idle Average * (dB) | 31.3 | 32.7 -4% | 31.5 -1% | 33 -5% |
| Idle Maximum * (dB) | 31.3 | 32.7 -4% | 31.5 -1% | 39 -25% |
| Load Average * (dB) | 42 | 33.3 21% | 40.6 3% | 45 -7% |
| Witcher 3 ultra * (dB) | 42.1 | 41.6 1% | 49.5 -18% | 49 -16% |
| Load Maximum * (dB) | 46.5 | 45.2 3% | 53.4 -15% | 51 -10% |
* ... Meglio usare valori piccoli
(±) La temperatura massima sul lato superiore è di 43.9 °C / 111 F, rispetto alla media di 40.4 °C / 105 F, che varia da 21.2 a 68.8 °C per questa classe Gaming.
(-) Il lato inferiore si riscalda fino ad un massimo di 47.6 °C / 118 F, rispetto alla media di 43.2 °C / 110 F
(±) In idle, la temperatura media del lato superiore è di 34.5 °C / 94 F, rispetto alla media deld ispositivo di 33.9 °C / 93 F.
(±) Riproducendo The Witcher 3, la temperatura media per il lato superiore e' di 33 °C / 91 F, rispetto alla media del dispositivo di 33.9 °C / 93 F.
(+) I poggiapolsi e il touchpad raggiungono la temperatura massima della pelle (32.5 °C / 90.5 F) e quindi non sono caldi.
(-) La temperatura media della zona del palmo della mano di dispositivi simili e'stata di 28.8 °C / 83.8 F (-3.7 °C / -6.7 F).
| Lenovo Legion Y740-15ICHg GeForce RTX 2070 Max-Q, i7-9750H, WDC PC SN520 SDAPMUW-128G | Lenovo Legion Y740-15ICHg GeForce RTX 2070 Max-Q, i7-8750H, Samsung SSD PM981 MZVLB256HAHQ | HP Omen X 2S 15-dg0075cl GeForce RTX 2070 Max-Q, i7-9750H, WDC PC SN720 SDAPNTW-1T00 | Acer Predator Triton 500 PT515-51-71PZ GeForce RTX 2070 Max-Q, i7-9750H, WDC PC SN720 SDAPNTW-512G | |
|---|---|---|---|---|
| Heat | 11% | -11% | 5% | |
| Maximum Upper Side * (°C) | 43.9 | 37.6 14% | 48.8 -11% | 49 -12% |
| Maximum Bottom * (°C) | 47.6 | 45.2 5% | 55 -16% | 59 -24% |
| Idle Upper Side * (°C) | 38.6 | 32.2 17% | 41 -6% | 28 27% |
| Idle Bottom * (°C) | 40.8 | 37.2 9% | 45.6 -12% | 29 29% |
* ... Meglio usare valori piccoli
Lenovo Legion Y740-15ICHg analisi audio
(-) | altoparlanti non molto potenti (68.1 dB)
Bassi 100 - 315 Hz
(±) | bassi ridotti - in media 14.6% inferiori alla media
(±) | la linearità dei bassi è media (12.4% delta rispetto alla precedente frequenza)
Medi 400 - 2000 Hz
(+) | medi bilanciati - solo only 4.7% rispetto alla media
(+) | medi lineari (5.9% delta rispetto alla precedente frequenza)
Alti 2 - 16 kHz
(+) | Alti bilanciati - appena 3.4% dalla media
(±) | la linearità degli alti è media (7.2% delta rispetto alla precedente frequenza)
Nel complesso 100 - 16.000 Hz
(±) | la linearità complessiva del suono è media (18.8% di differenza rispetto alla media
Rispetto alla stessa classe
» 62% di tutti i dispositivi testati in questa classe è stato migliore, 8% simile, 30% peggiore
» Il migliore ha avuto un delta di 6%, medio di 18%, peggiore di 132%
Rispetto a tutti i dispositivi testati
» 43% di tutti i dispositivi testati in questa classe è stato migliore, 8% similare, 49% peggiore
» Il migliore ha avuto un delta di 4%, medio di 24%, peggiore di 134%
Acer Predator Triton 500 PT515-51-71PZ analisi audio
(±) | potenza degli altiparlanti media ma buona (80 dB)
Bassi 100 - 315 Hz
(±) | bassi ridotti - in media 12.2% inferiori alla media
(±) | la linearità dei bassi è media (12.6% delta rispetto alla precedente frequenza)
Medi 400 - 2000 Hz
(+) | medi bilanciati - solo only 4.5% rispetto alla media
(+) | medi lineari (4.7% delta rispetto alla precedente frequenza)
Alti 2 - 16 kHz
(+) | Alti bilanciati - appena 2.2% dalla media
(+) | alti lineari (3.2% delta rispetto alla precedente frequenza)
Nel complesso 100 - 16.000 Hz
(+) | suono nel complesso lineare (14.8% differenza dalla media)
Rispetto alla stessa classe
» 29% di tutti i dispositivi testati in questa classe è stato migliore, 7% simile, 64% peggiore
» Il migliore ha avuto un delta di 6%, medio di 18%, peggiore di 132%
Rispetto a tutti i dispositivi testati
» 20% di tutti i dispositivi testati in questa classe è stato migliore, 4% similare, 76% peggiore
» Il migliore ha avuto un delta di 4%, medio di 24%, peggiore di 134%
| Off / Standby | |
| Idle | |
| Sotto carico |
|
Leggenda:
min: | |
| Lenovo Legion Y740-15ICHg i7-9750H, GeForce RTX 2070 Max-Q, WDC PC SN520 SDAPMUW-128G, IPS, 1920x1080, 15.6" | Lenovo Legion Y740-15ICHg i7-8750H, GeForce RTX 2070 Max-Q, Samsung SSD PM981 MZVLB256HAHQ, IPS, 1920x1080, 15.6" | HP Omen X 2S 15-dg0075cl i7-9750H, GeForce RTX 2070 Max-Q, WDC PC SN720 SDAPNTW-1T00, IPS, 1920x1080, 15.6" | Acer Predator Triton 500 PT515-51-71PZ i7-9750H, GeForce RTX 2070 Max-Q, WDC PC SN720 SDAPNTW-512G, IPS, 1920x1080, 15.6" | |
|---|---|---|---|---|
| Power Consumption | 5% | -64% | 28% | |
| Idle Minimum * (Watt) | 22.2 | 22.9 -3% | 46 -107% | 7 68% |
| Idle Average * (Watt) | 24.9 | 27.2 -9% | 59 -137% | 12 52% |
| Idle Maximum * (Watt) | 30.6 | 27.5 10% | 65.5 -114% | 22 28% |
| Load Average * (Watt) | 101 | 83.4 17% | 99.8 1% | 86 15% |
| Witcher 3 ultra * (Watt) | 143 | 143.6 -0% | 154.1 -8% | 144 -1% |
| Load Maximum * (Watt) | 186 | 160.5 14% | 222.7 -20% | 177 5% |
* ... Meglio usare valori piccoli
Autonomia della batteria
| Battery Runtime - WiFi Websurfing | |
| Acer Predator Triton 500 PT515-51-71PZ | |
| Media della classe Gaming (1.967 - 14.6, n=104, ultimi 2 anni) | |
| Lenovo Legion Y740-15ICHg | |
| Lenovo Legion Y740-15ICHg (240, switchable graphics enabled) | |
| HP Omen X 2S 15-dg0075cl | |
Pro
Contro
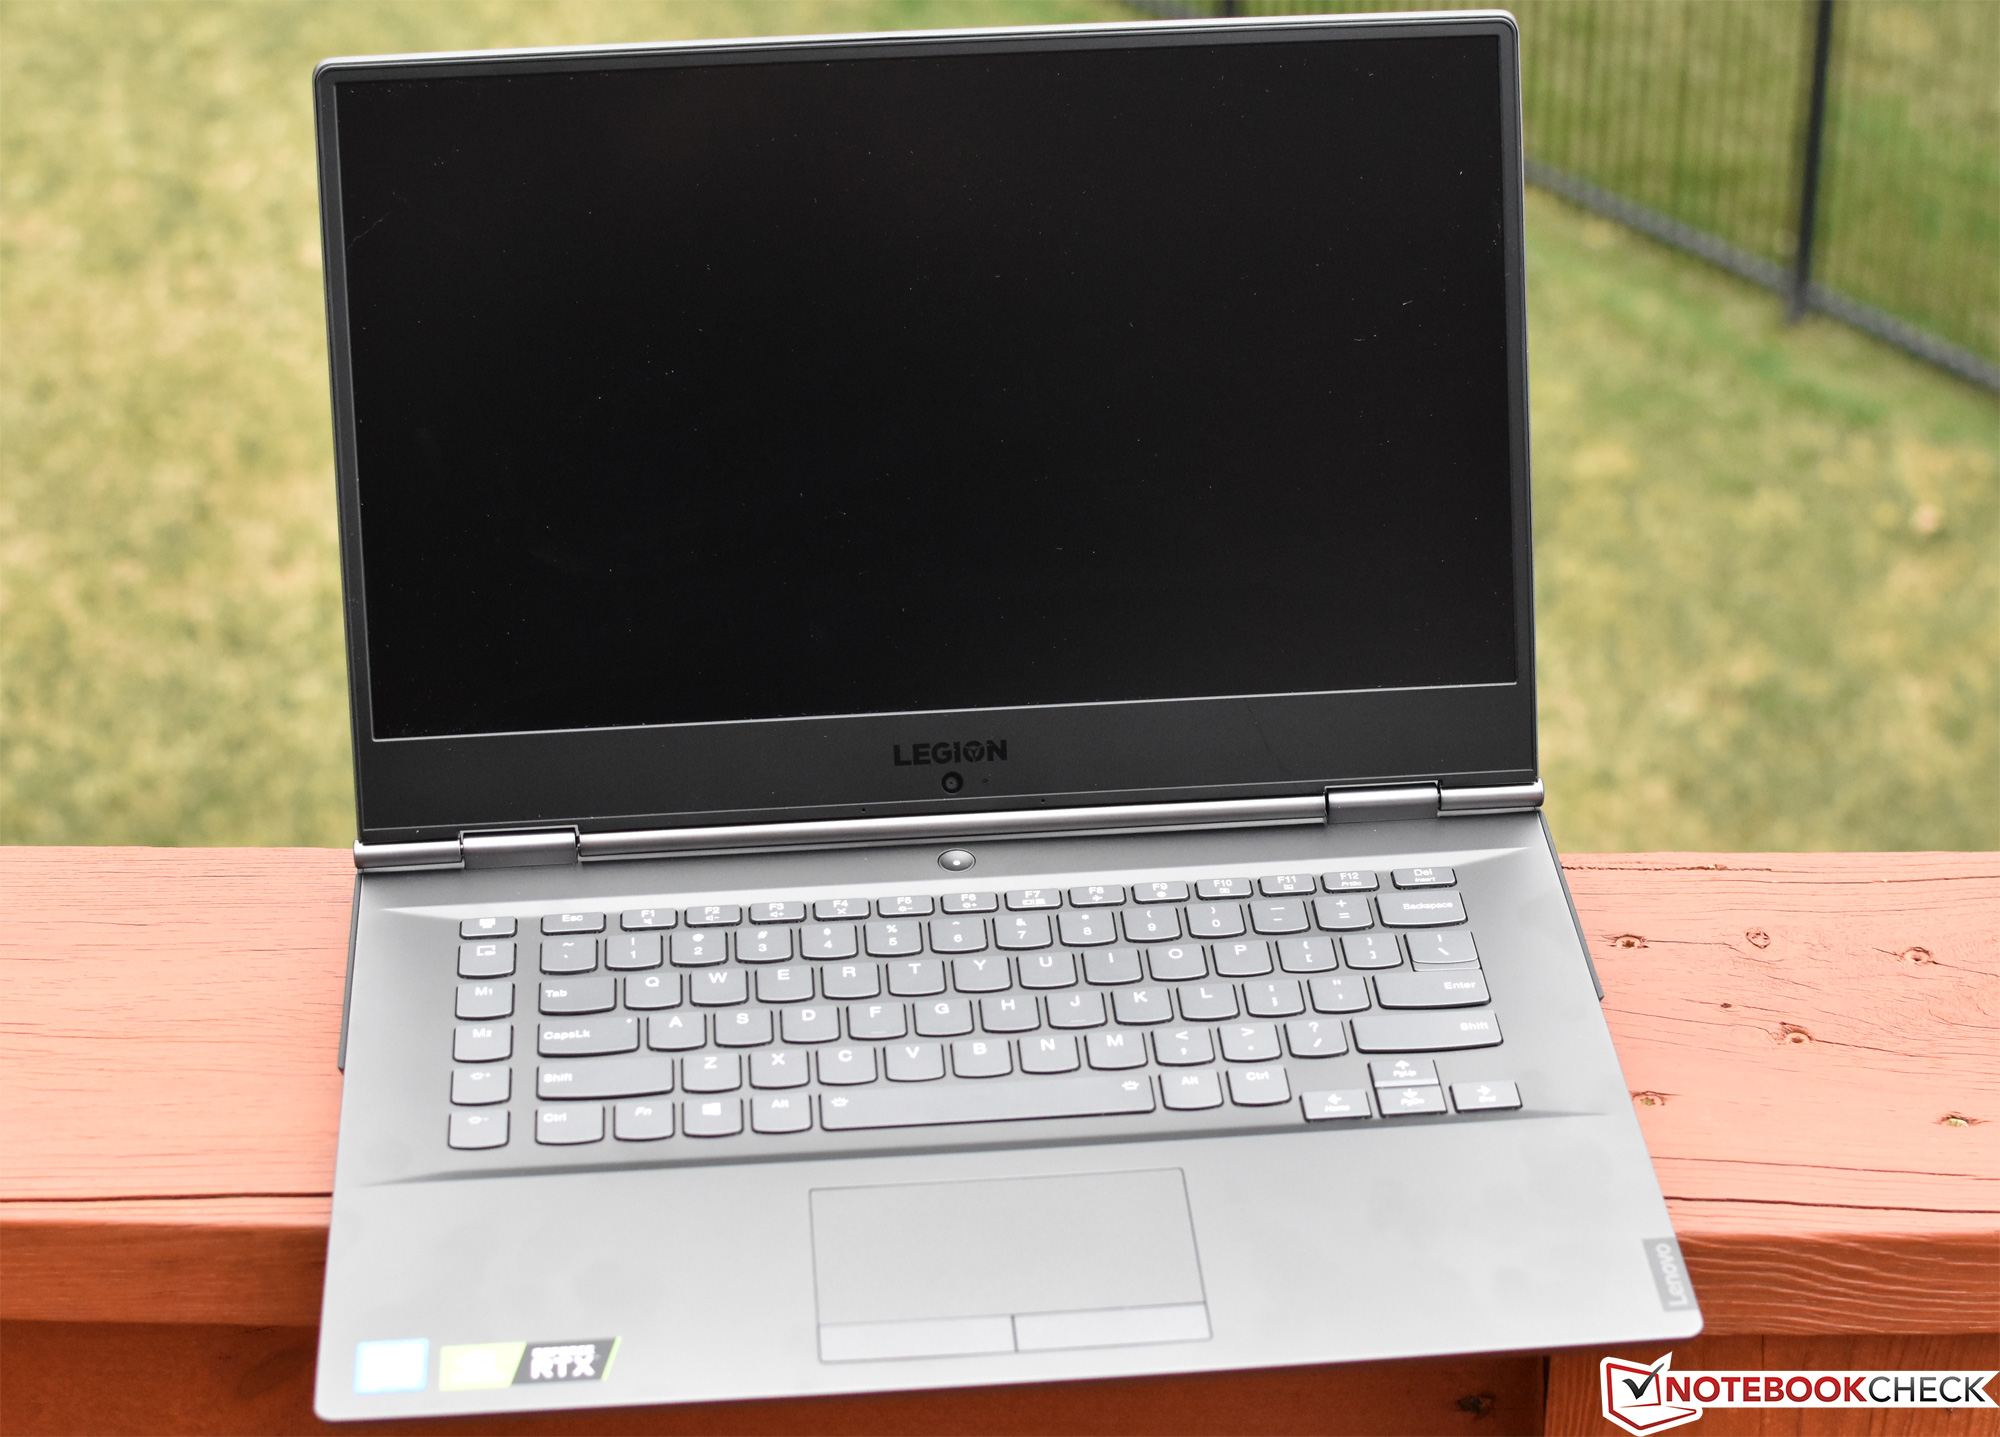
Giudizio Complessivo - Prestazioni elevate ad un prezzo contenuto
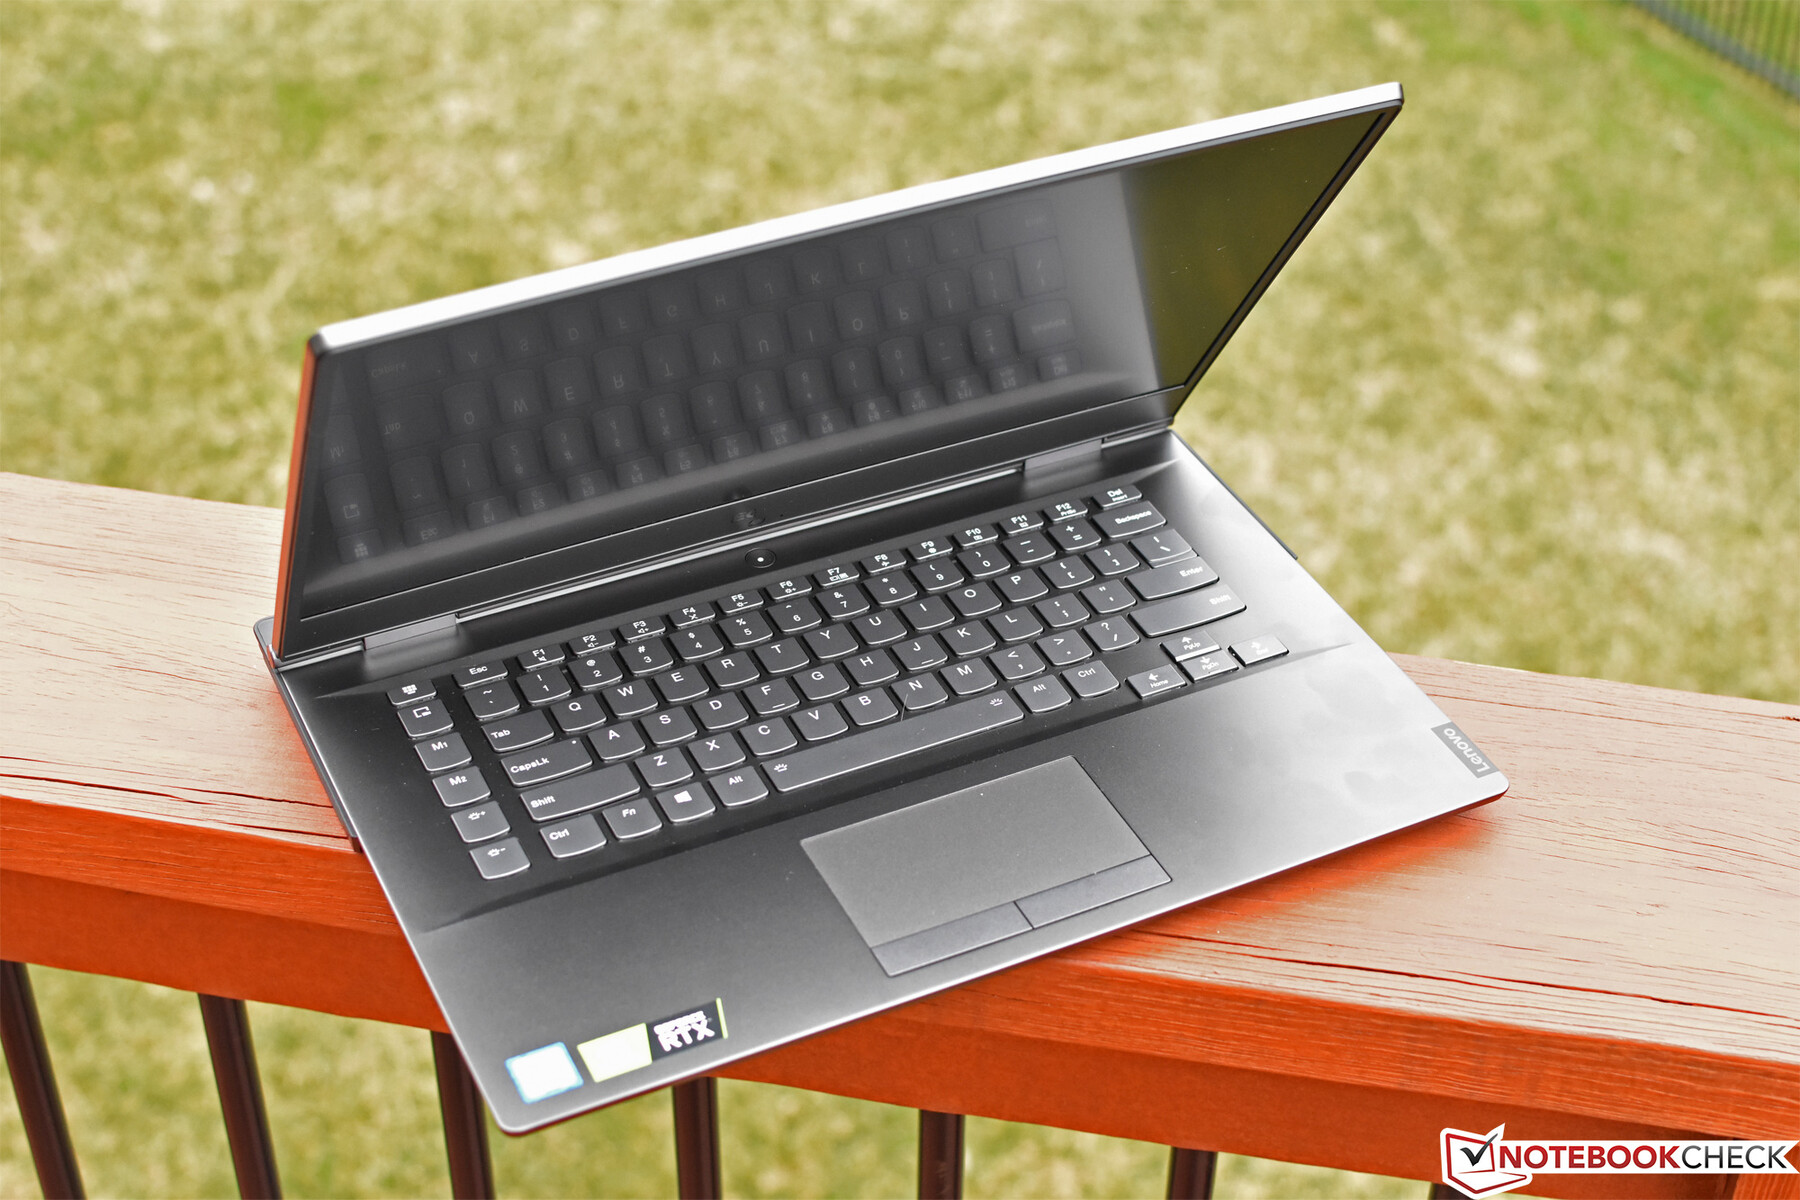
Il Lenovo Legion Y740 è un portatile costoso, ma in definitiva il prezzo è ragionevole, da 15,6 pollici gaming che può gestire tutti i moderni giochi tripla-A con facilità. Il suo potente processore hexa-core e la GPU GeForce RTX 2070 Max-Q si combinano per offrire prestazioni di sistema eccellenti.
Tuttavia, il Core i7-9750H nella nostra unità di prova ha avuto prestazioni peggiori rispetto al suo predecessore, nonostante la Intel dichiari che è in grado di raggiungere velocità di clock più elevate. Questa lacuna non ha influenzato le prestazioni di gioco, almeno durante i nostri test.
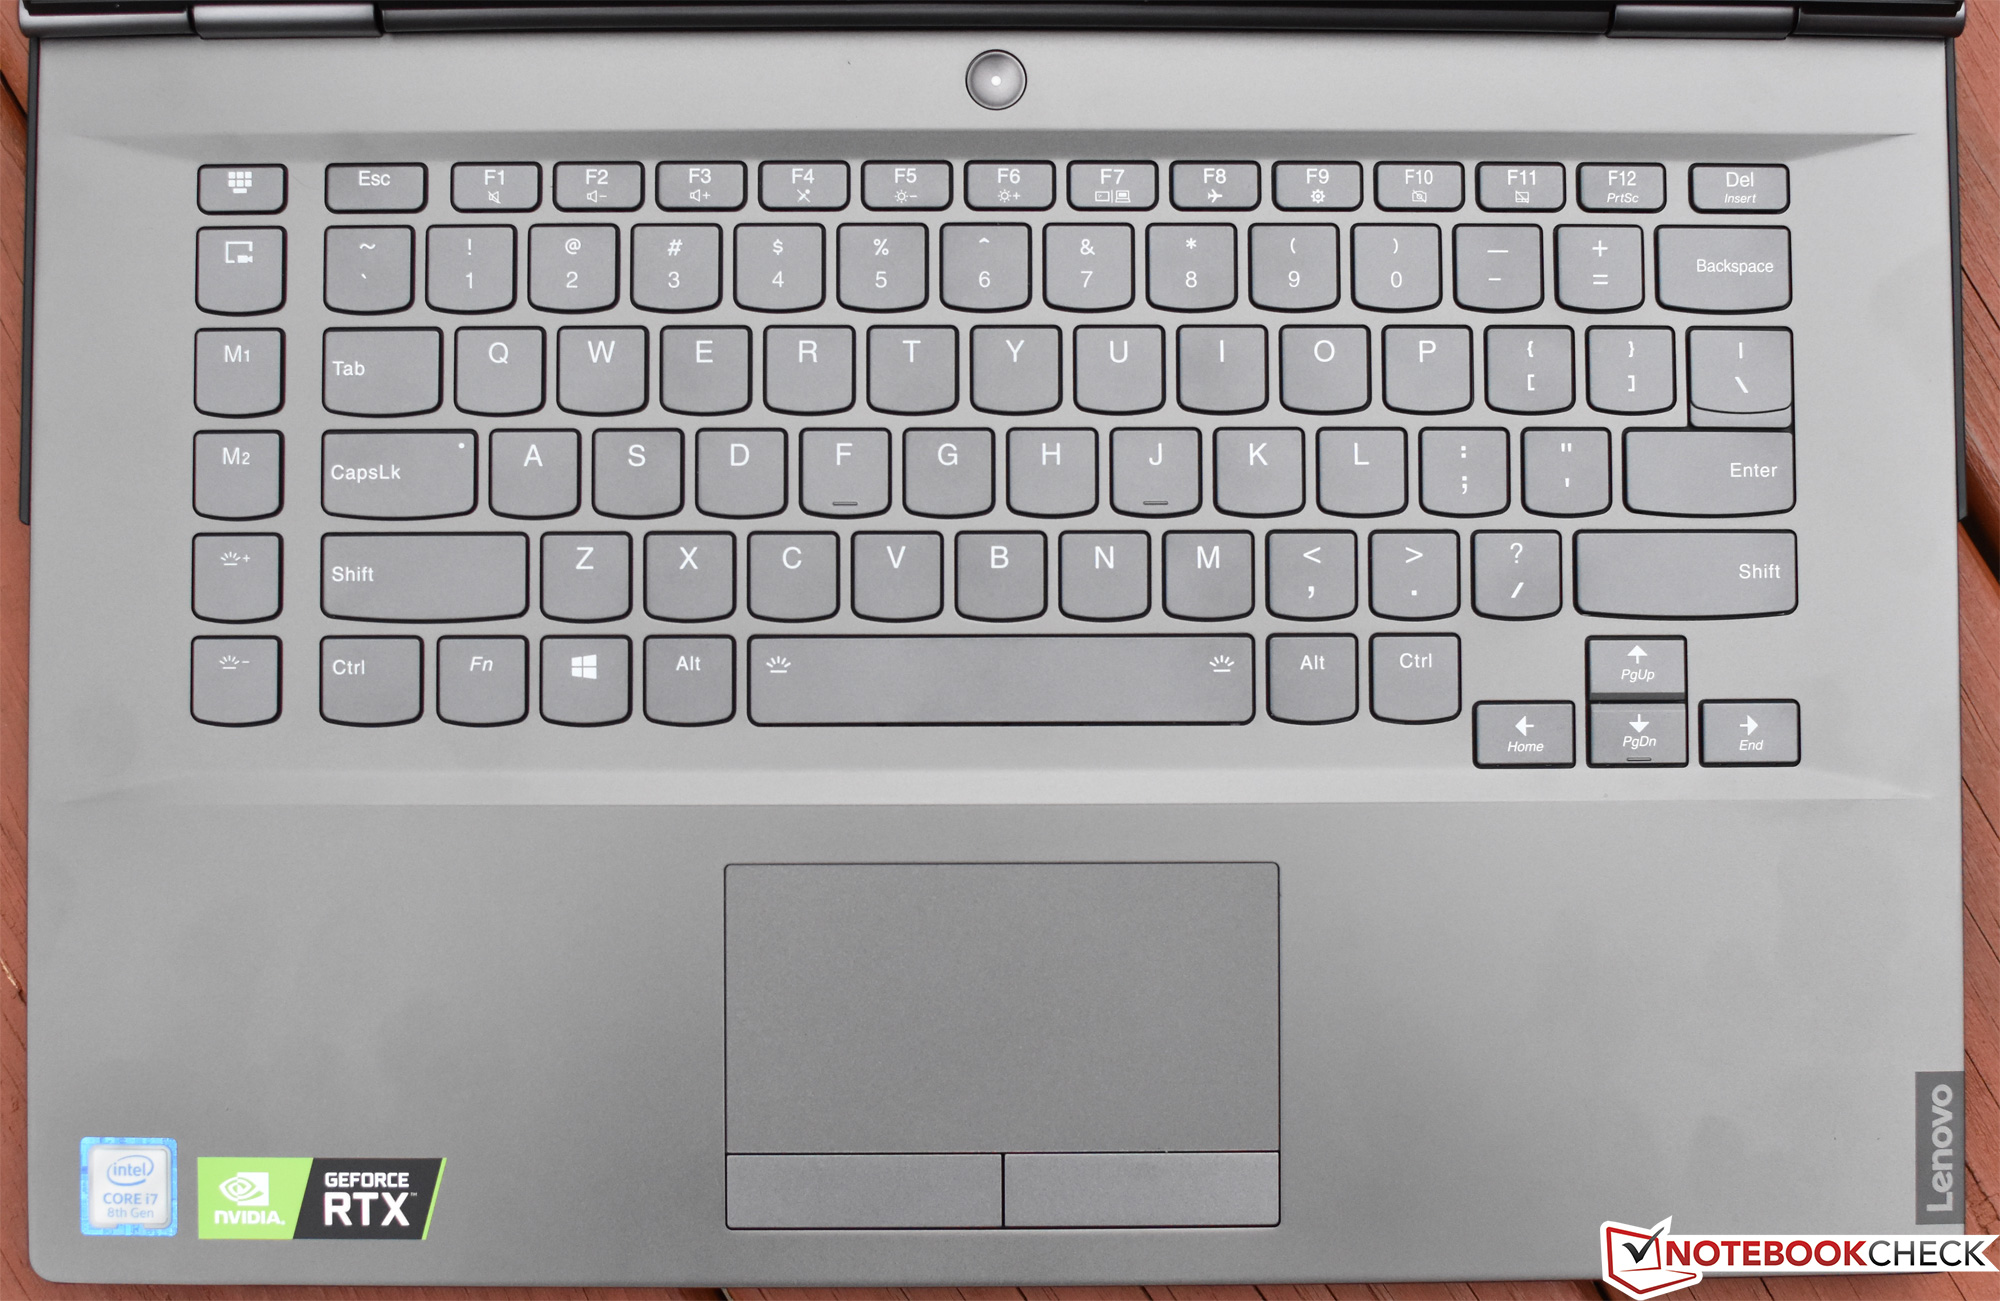
Il Lenovo Legion Y740-15ICHg ha un hardware solido ed eccelle in tutti i giochi moderni. I suoi dispositivi di input "inquinano" quello che è un portatile di gioco per il resto accettabile.
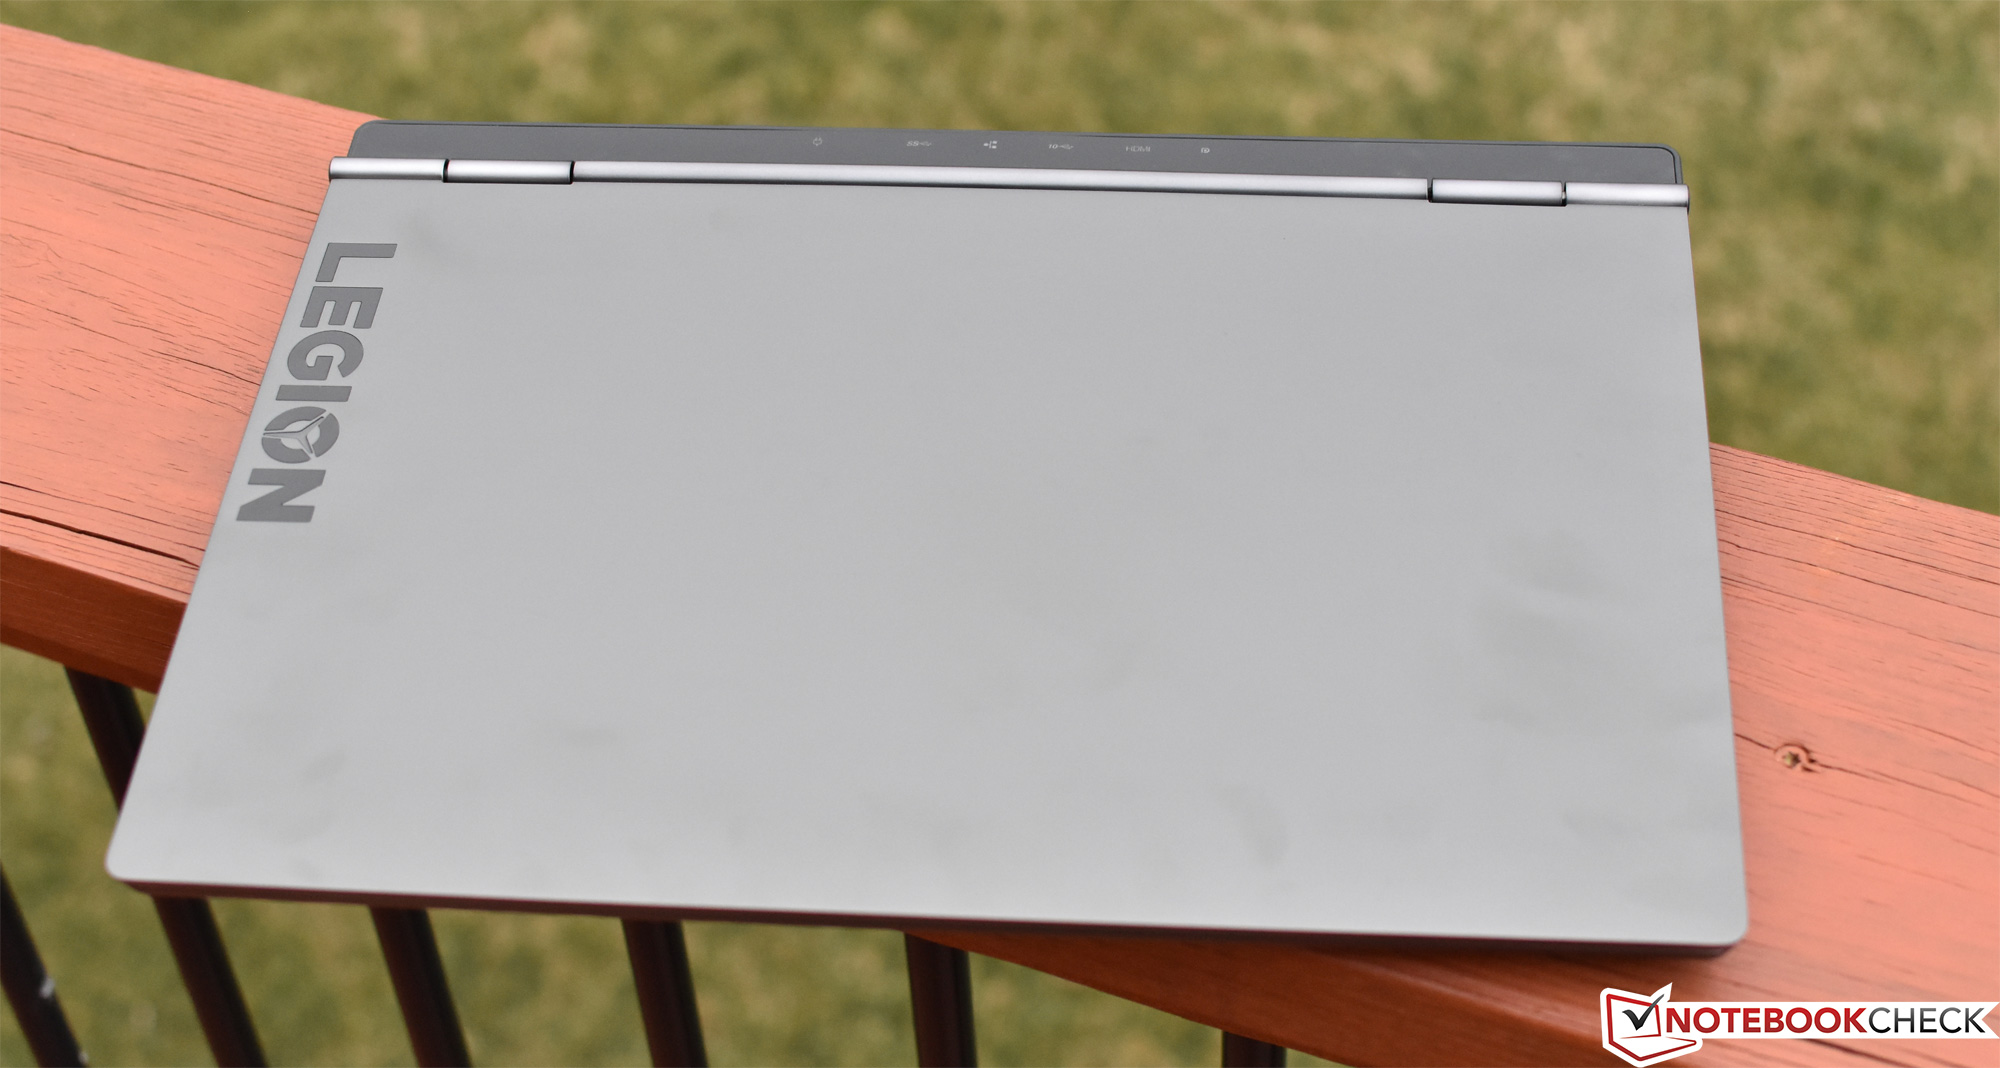
Nel complesso, il Legion Y740 è un portatile da gioco decente che ha un design semplice che Lenovo completa con un'illuminazione RGB discreta.
Il Legion Y740 è un aggiornamento valido rispetto al suo predecessore. Il Y740 non solo offre migliori prestazioni di gioco rispetto al Y730, ma ha anche un display più luminoso che dovrebbe piacere ad alcuni giocatori. Il pannello 144 Hz è certificato G-Sync e HDR400, ma i suoi tempi di risposta relativamente lenti devono essere considerati, tenendo presente che se state pensando di spendere circa €2.000 (~$2.179) per un portatile da gioco.
Lenovo Legion Y740-15ICHg
- 06/20/2020 v7 (old)
Sebastian Bade
Price comparison
