Recensione del Laptop Asus ROG Strix Scar III G531GW: ha un veloce display 240-Hz
Connessioni
| |||||||||||||||||||||||||
Distribuzione della luminosità: 88 %
Al centro con la batteria: 309 cd/m²
Contrasto: 736:1 (Nero: 0.42 cd/m²)
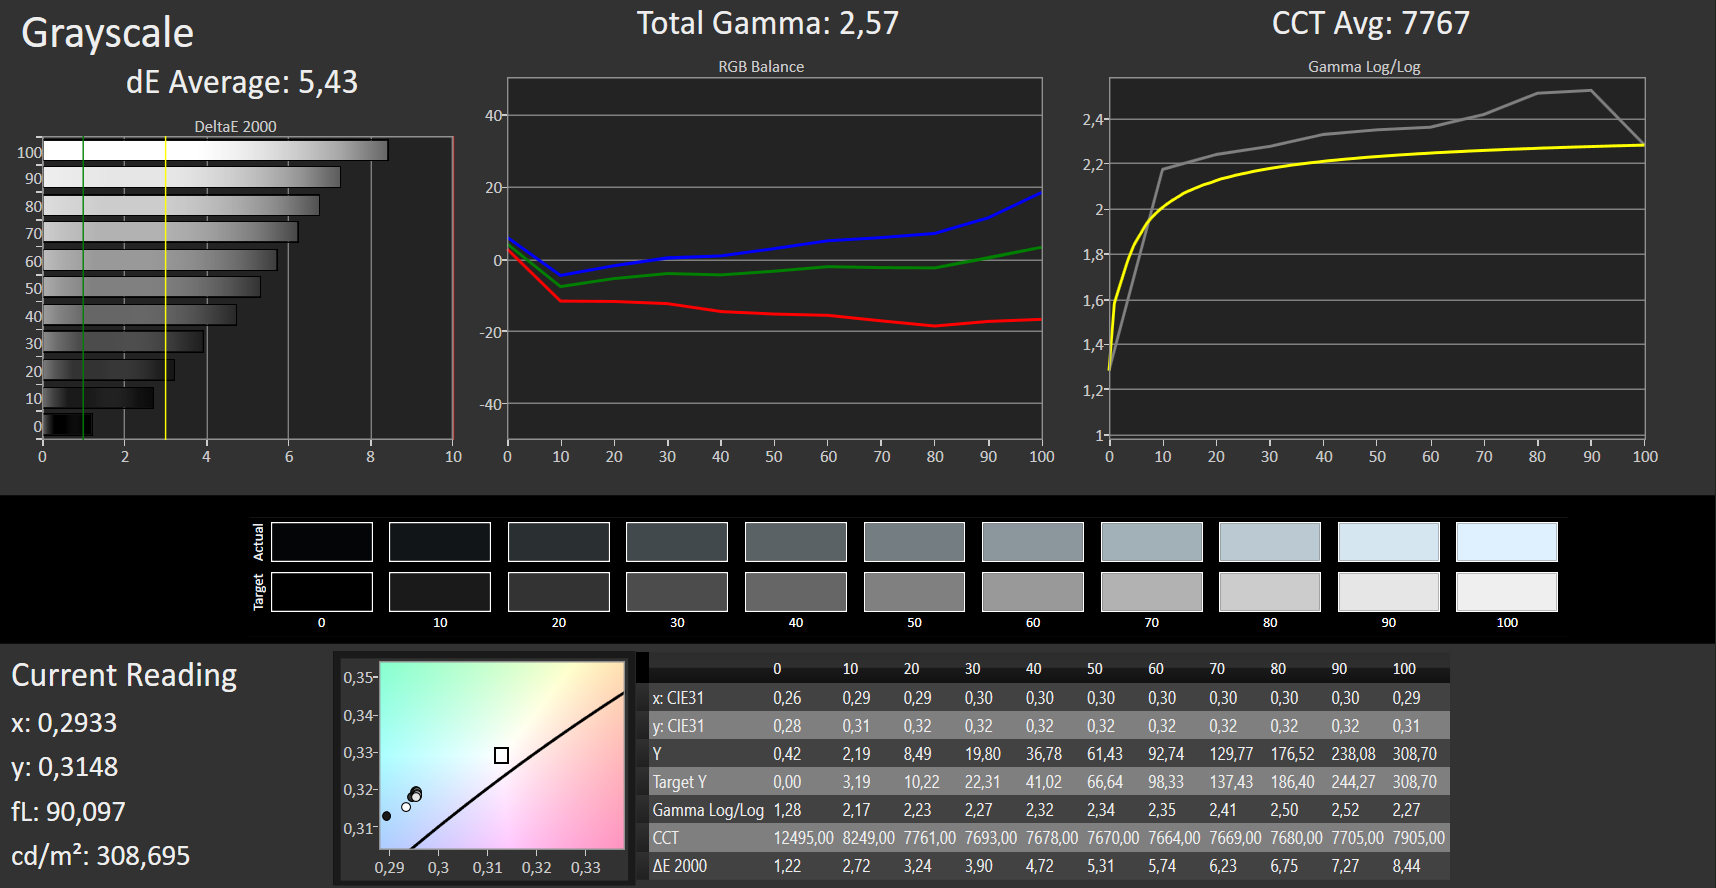
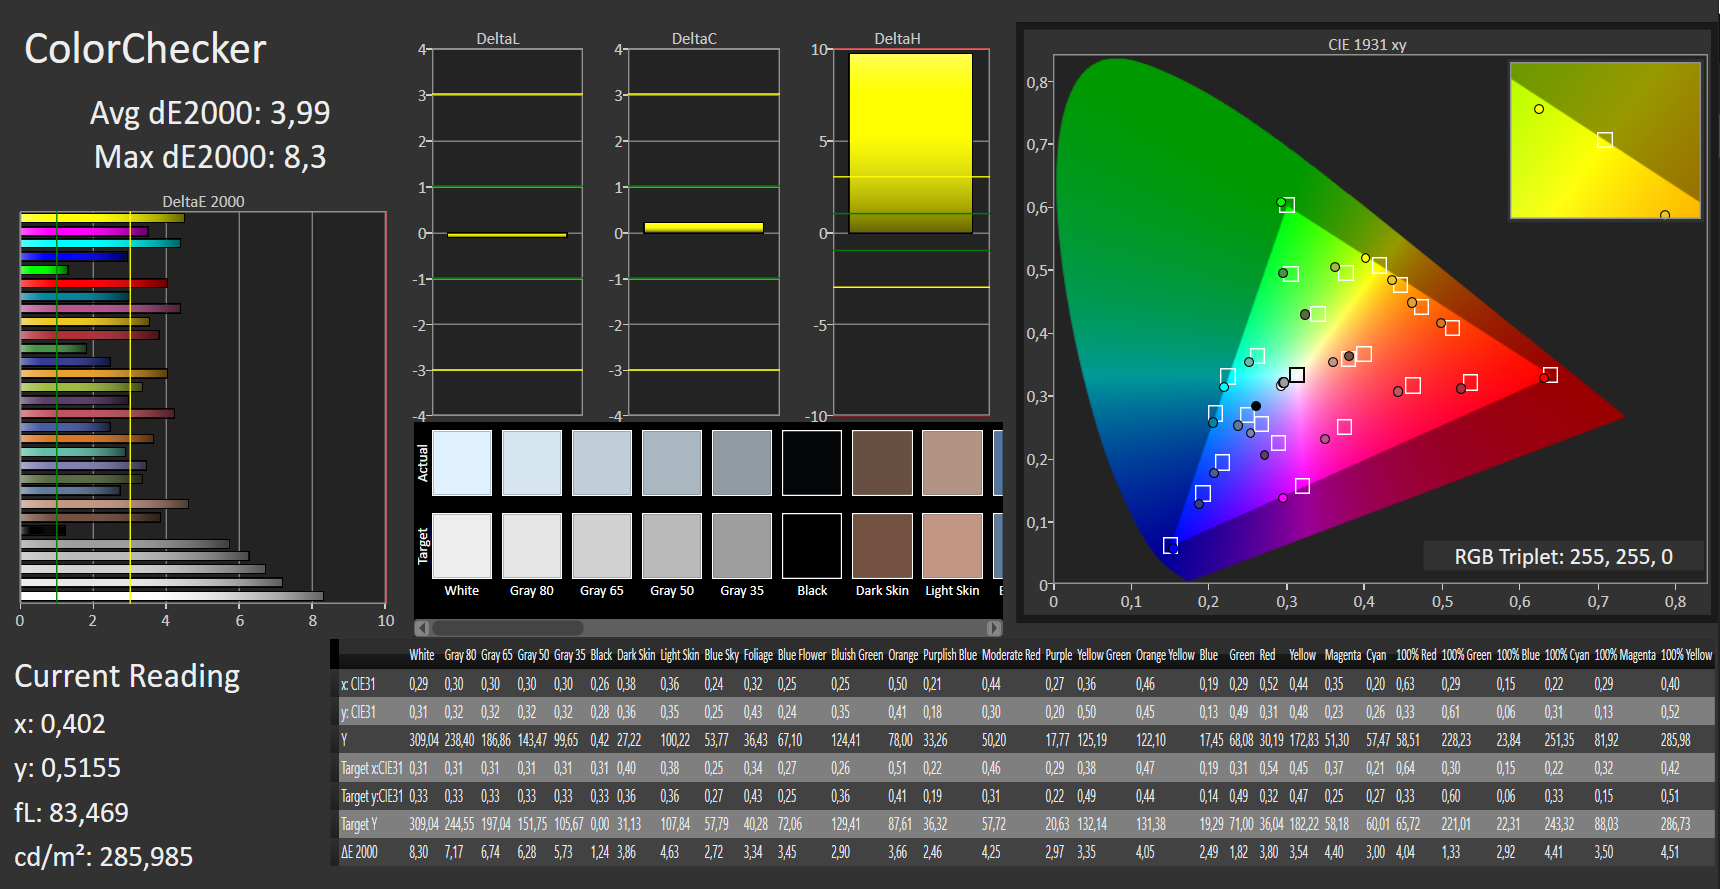
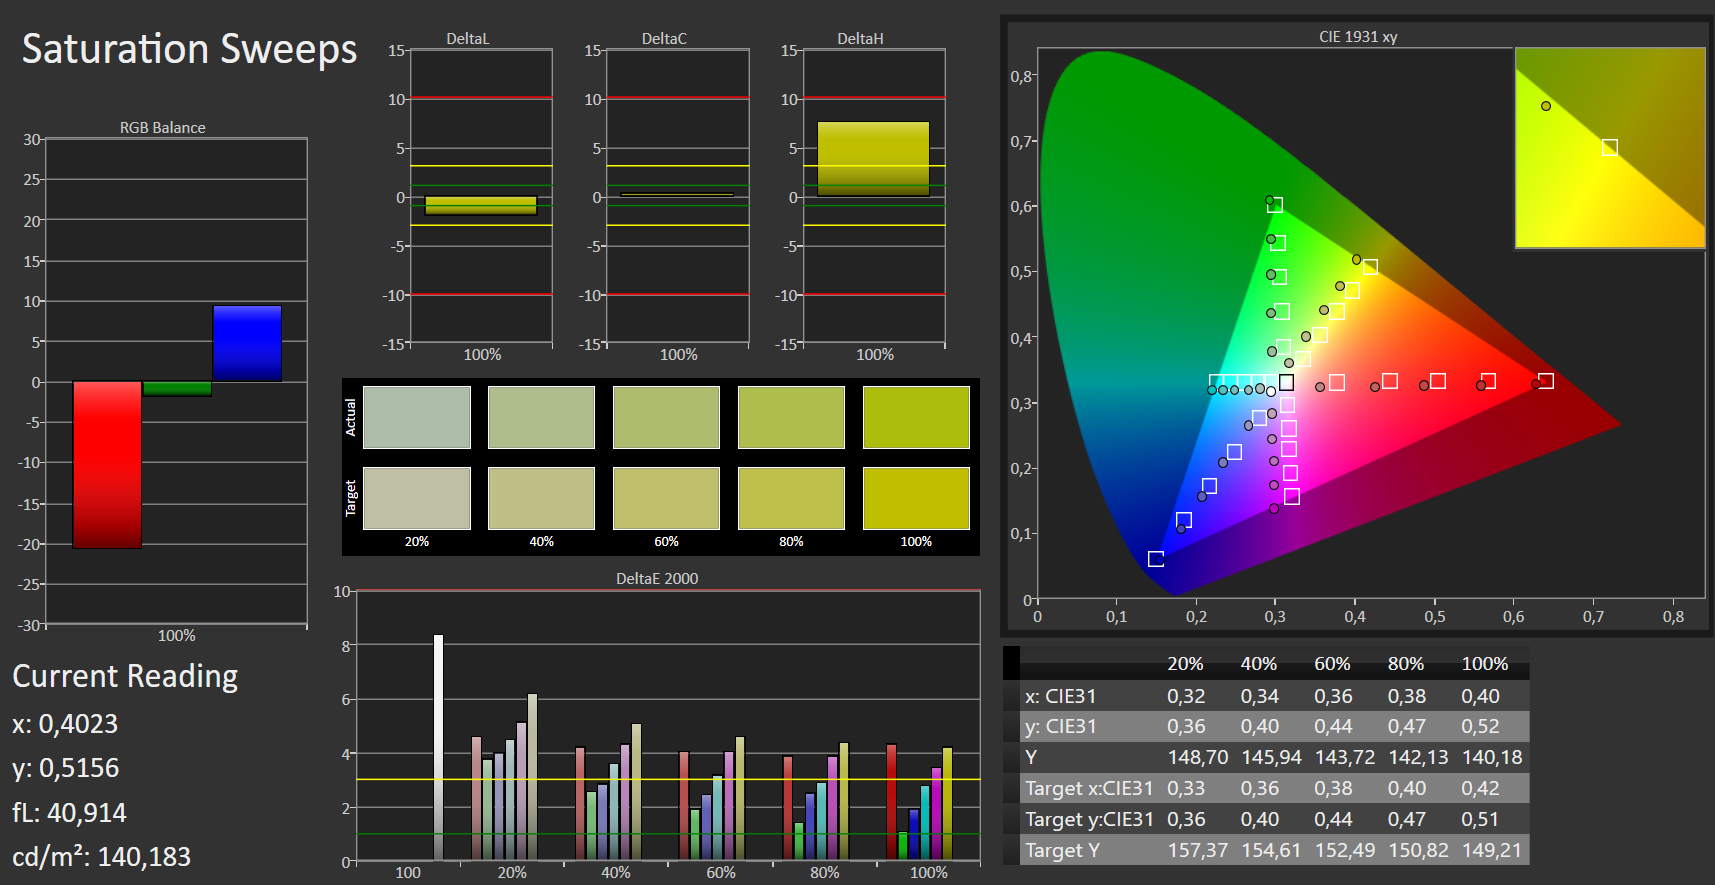
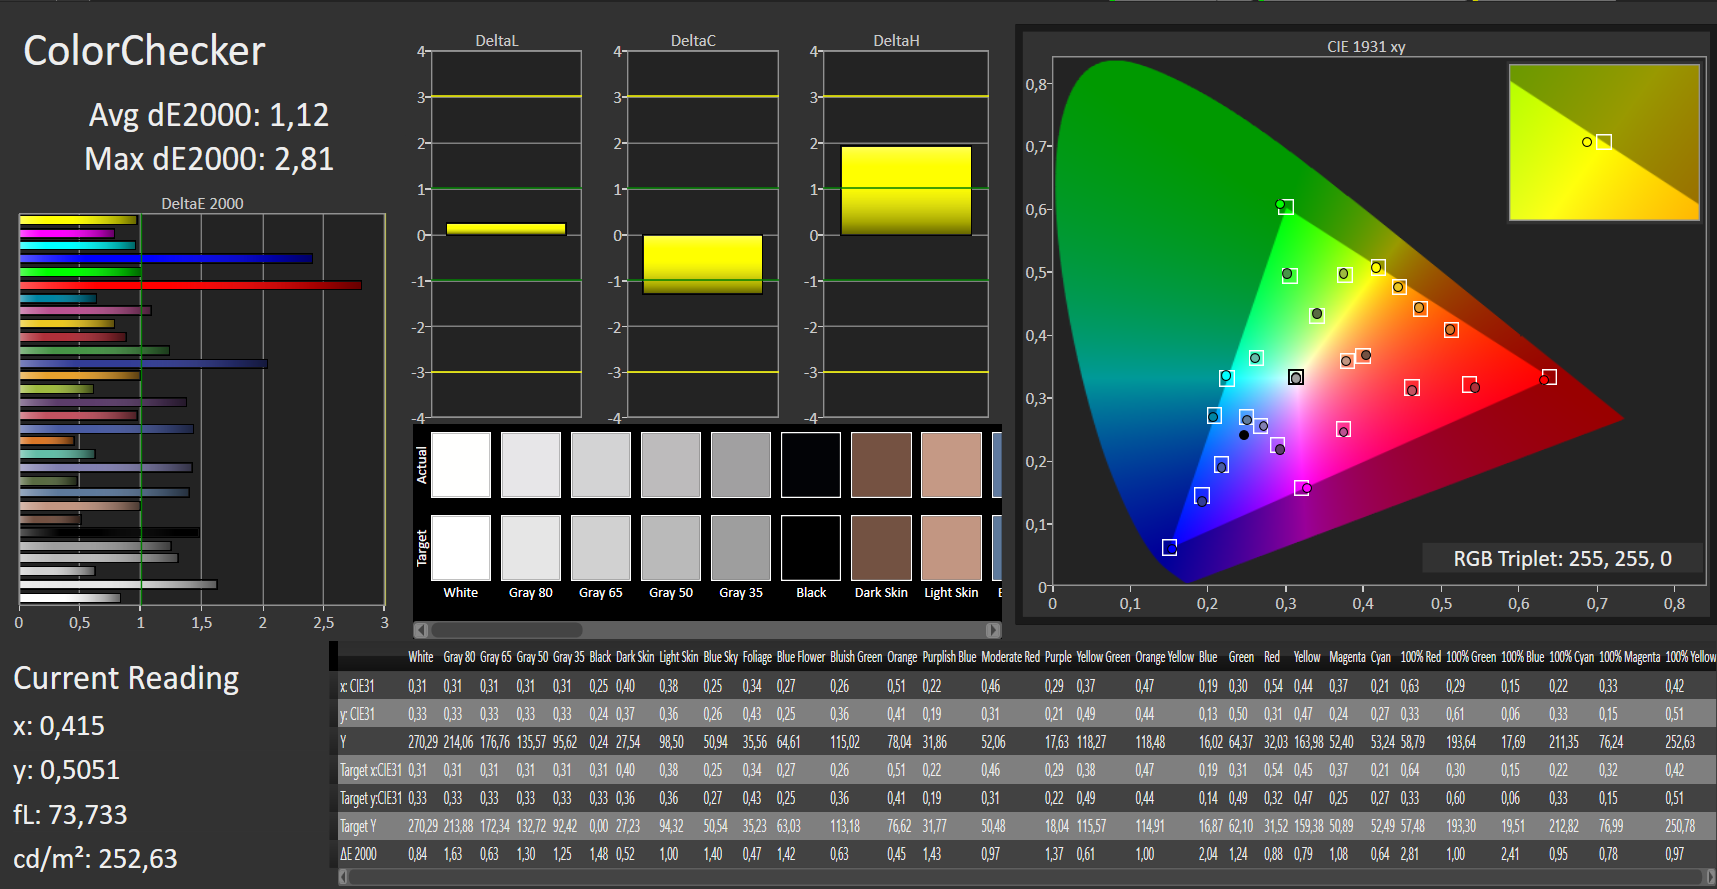
ΔE ColorChecker Calman: 3.99 | ∀{0.5-29.43 Ø4.71}
calibrated: 1.12
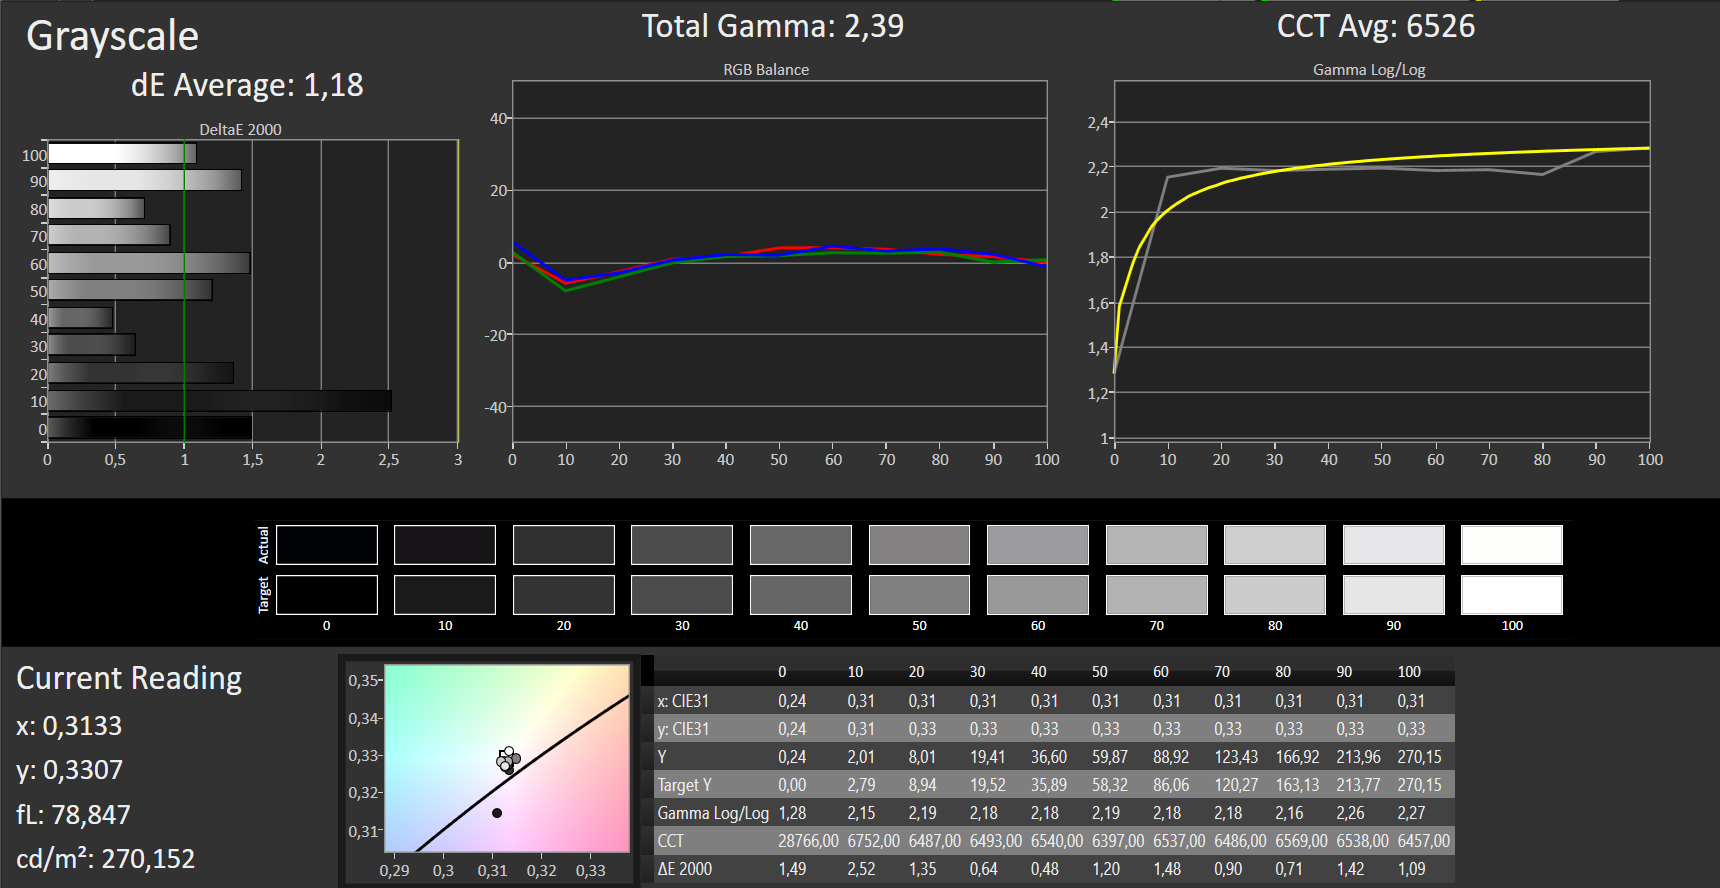
ΔE Greyscale Calman: 5.43 | ∀{0.09-98 Ø4.96}
97% sRGB (Argyll 1.6.3 3D)
63% AdobeRGB 1998 (Argyll 1.6.3 3D)
67.6% AdobeRGB 1998 (Argyll 3D)
97.1% sRGB (Argyll 3D)
66.2% Display P3 (Argyll 3D)
Gamma: 2.57
CCT: 7767 K
| Asus Strix Scar III G531GW-AZ062T Sharp LQ156M1JW09 (SHP14D3), IPS, 1920x1080, 15.6" | Asus Strix Scar III G531GW Sharp LQ156M1JW09 (SHP14D3), IPS, 1920x1080, 15.6" | Lenovo Legion Y740-15ICHg BOE NV156FHM-N4J, IPS, 1920x1080, 15.6" | Acer Predator Triton 500 PT515-51-71PZ NV156FHM-N4K (BOE082A), IPS, 1920x1080, 15.6" | Origin PC EVO16-S i7-9750H RTX 2080 Max-Q Chi Mei CMN N161HCA-GA1, IPS, 1920x1080, 16.1" | |
|---|---|---|---|---|---|
| Display | -0% | -2% | -3% | -5% | |
| Display P3 Coverage (%) | 66.2 | 66.2 0% | 67.7 2% | 64.6 -2% | 62.3 -6% |
| sRGB Coverage (%) | 97.1 | 96.5 -1% | 91.6 -6% | 92.6 -5% | 93.3 -4% |
| AdobeRGB 1998 Coverage (%) | 67.6 | 67.5 0% | 67.1 -1% | 66 -2% | 64 -5% |
| Response Times | -20% | -19% | 21% | -2% | |
| Response Time Grey 50% / Grey 80% * (ms) | 15 ? | 17.2 ? -15% | 19 ? -27% | 5.2 ? 65% | 14.4 ? 4% |
| Response Time Black / White * (ms) | 9 ? | 11.2 ? -24% | 10 ? -11% | 11.2 ? -24% | 9.6 ? -7% |
| PWM Frequency (Hz) | 250 ? | 24040 ? | 25510 ? | ||
| Screen | 20% | 31% | 13% | -1% | |
| Brightness middle (cd/m²) | 309 | 266 -14% | 477 54% | 288 -7% | 278 -10% |
| Brightness (cd/m²) | 284 | 252 -11% | 431 52% | 265 -7% | 259 -9% |
| Brightness Distribution (%) | 88 | 88 0% | 84 -5% | 84 -5% | 89 1% |
| Black Level * (cd/m²) | 0.42 | 0.27 36% | 0.175 58% | 0.22 48% | 0.41 2% |
| Contrast (:1) | 736 | 985 34% | 2726 270% | 1309 78% | 678 -8% |
| Colorchecker dE 2000 * | 3.99 | 1.81 55% | 4.17 -5% | 3.22 19% | 2.93 27% |
| Colorchecker dE 2000 max. * | 8.3 | 3.23 61% | 6.97 16% | 6.26 25% | 7.12 14% |
| Colorchecker dE 2000 calibrated * | 1.12 | 1.03 8% | 2.51 -124% | 1.5 -34% | 1.49 -33% |
| Greyscale dE 2000 * | 5.43 | 2.44 55% | 3.49 36% | 3.43 37% | 4.5 17% |
| Gamma | 2.57 86% | 2.42 91% | 2.5 88% | 2.41 91% | 2.17 101% |
| CCT | 7767 84% | 7005 93% | 7076 92% | 7290 89% | 5767 113% |
| Color Space (Percent of AdobeRGB 1998) (%) | 63 | 62 -2% | 60 -5% | 60 -5% | 59.2 -6% |
| Color Space (Percent of sRGB) (%) | 97 | 97 0% | 91 -6% | 93 -4% | 93.2 -4% |
| Media totale (Programma / Settaggio) | 0% /
11% | 3% /
19% | 10% /
11% | -3% /
-2% |
* ... Meglio usare valori piccoli
Tempi di risposta del Display
| ↔ Tempi di risposta dal Nero al Bianco | ||
|---|---|---|
| 9 ms ... aumenta ↗ e diminuisce ↘ combinato | ↗ 5 ms Incremento | 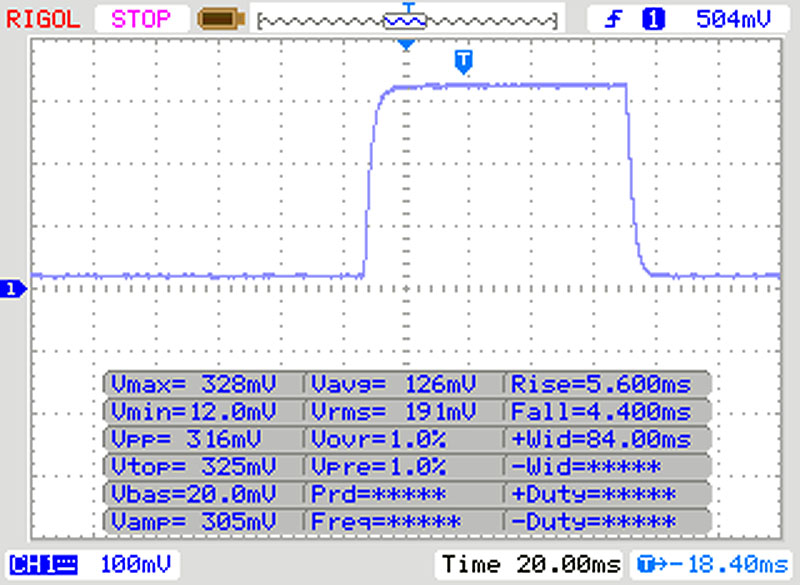 |
| ↘ 4 ms Calo | ||
| Lo schermo mostra veloci tempi di risposta durante i nostri tests e dovrebbe esere adatto al gaming In confronto, tutti i dispositivi di test variano da 0.1 (minimo) a 240 (massimo) ms. » 25 % di tutti i dispositivi è migliore. Questo significa che i tempi di risposta rilevati sono migliori rispettto alla media di tutti i dispositivi testati (19.8 ms). | ||
| ↔ Tempo di risposta dal 50% Grigio all'80% Grigio | ||
| 15 ms ... aumenta ↗ e diminuisce ↘ combinato | ↗ 8 ms Incremento | 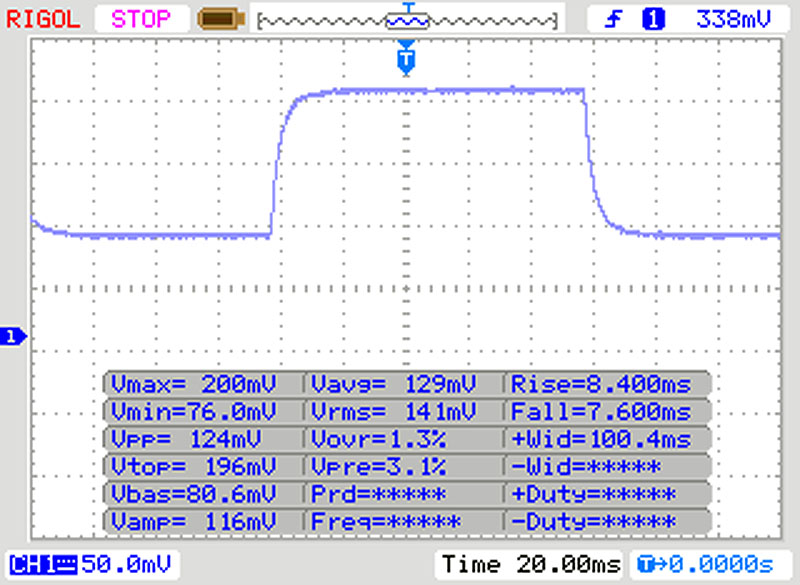 |
| ↘ 7 ms Calo | ||
| Lo schermo mostra buoni tempi di risposta durante i nostri tests, ma potrebbe essere troppo lento per i gamers competitivi. In confronto, tutti i dispositivi di test variano da 0.165 (minimo) a 636 (massimo) ms. » 29 % di tutti i dispositivi è migliore. Questo significa che i tempi di risposta rilevati sono migliori rispettto alla media di tutti i dispositivi testati (30.9 ms). | ||
Sfarfallio dello schermo / PWM (Pulse-Width Modulation)
| flickering dello schermo / PWM rilevato | 250 Hz | ≤ 20 % settaggio luminosita' | 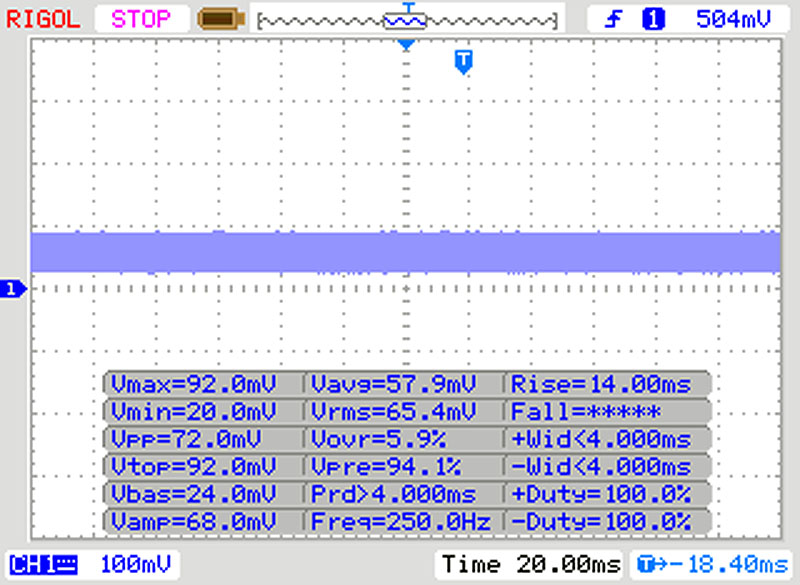 |
Il display sfarfalla a 250 Hz (Probabilmente a causa dell'uso di PWM) Flickering rilevato ad una luminosita' di 20 % o inferiore. Non dovrebbe verificarsi flickering o PWM sopra questo valore di luminosita'. La frequenza di 250 Hz è relativamente bassa, quindi gli utenti sensibili potrebbero notare il flickering ed accusare stanchezza agli occhi a questo livello di luminosità e a livelli inferiori. In confronto: 52 % di tutti i dispositivi testati non utilizza PWM per ridurre la luminosita' del display. Se è rilevato PWM, una media di 7744 (minimo: 5 - massimo: 343500) Hz è stata rilevata. | |||
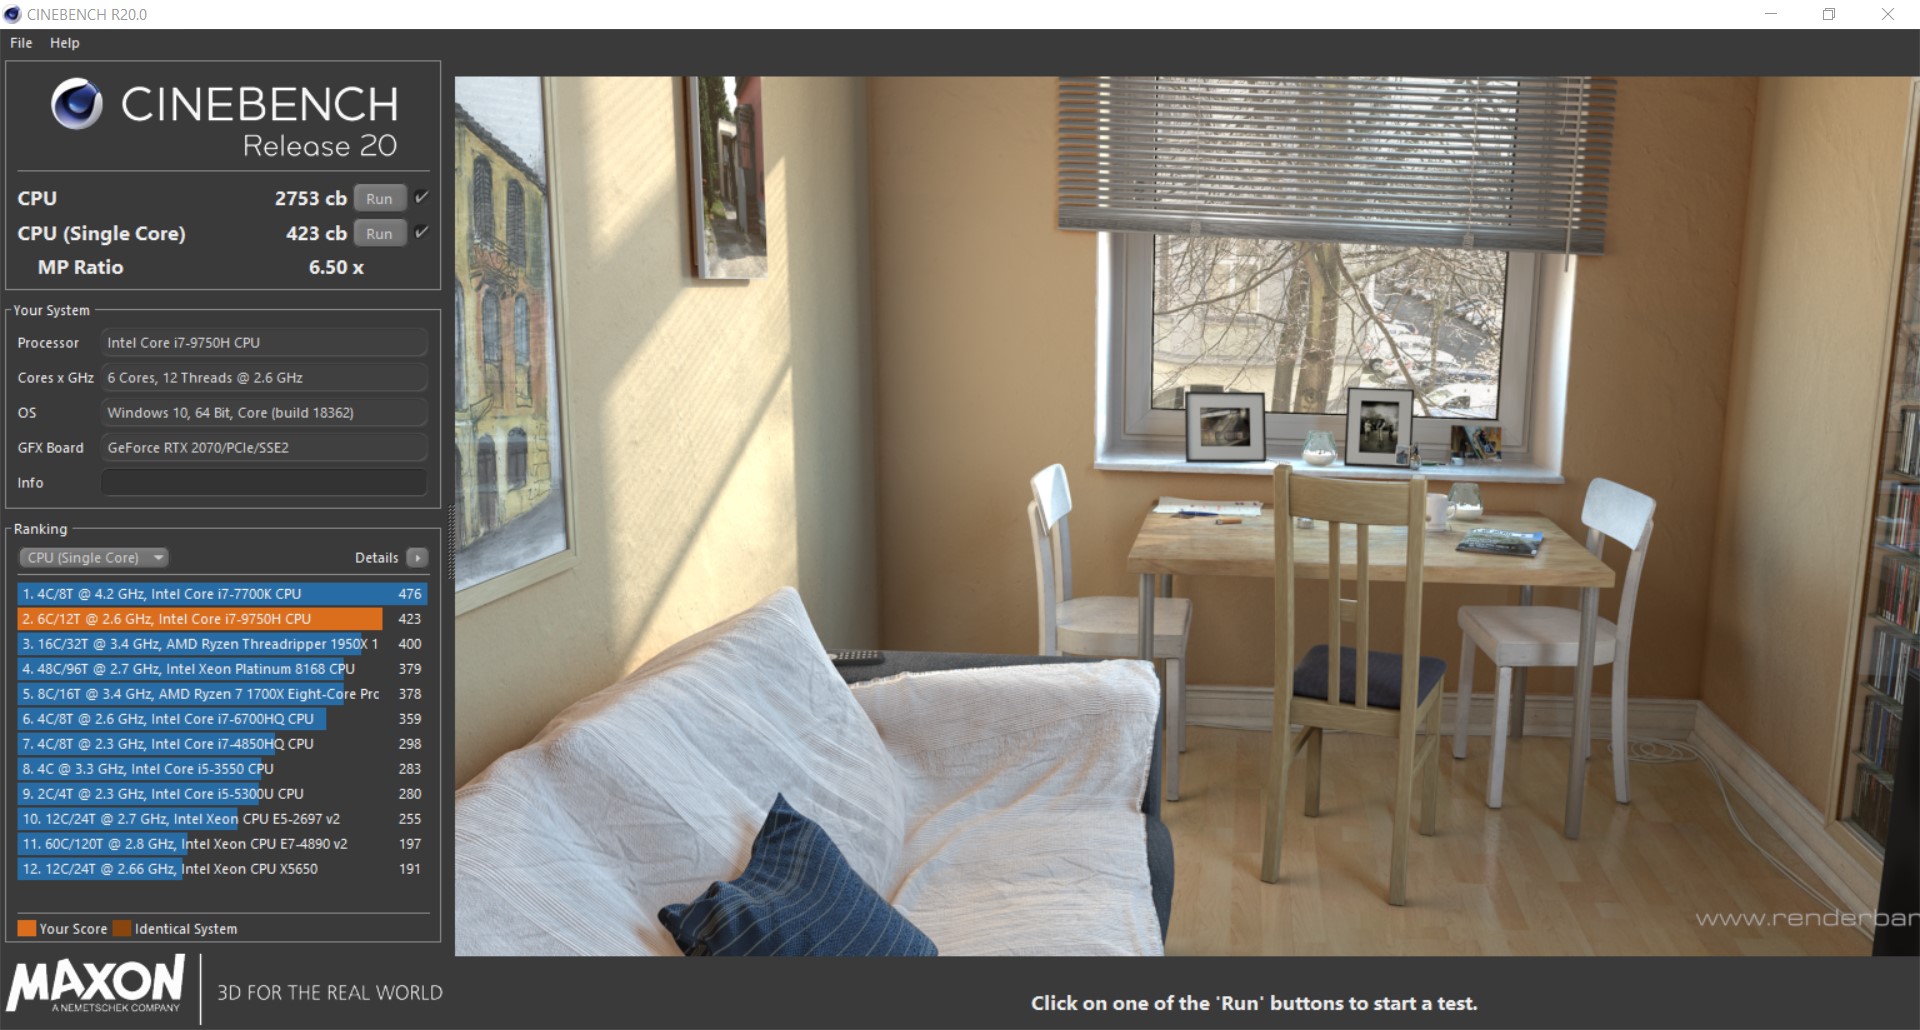
| Blender - v2.79 BMW27 CPU | |
| Media Intel Core i7-9750H (342 - 495, n=21) | |
| Asus Strix Scar III G531GW-AZ062T | |
| Lenovo Legion Y740-15ICHg | |
| Geekbench 4.4 | |
| 64 Bit Single-Core Score | |
| Asus Strix Scar III G531GW-AZ062T | |
| Lenovo Legion Y740-15ICHg | |
| Media Intel Core i7-9750H (4440 - 5511, n=27) | |
| 64 Bit Multi-Core Score | |
| Asus Strix Scar III G531GW-AZ062T | |
| Lenovo Legion Y740-15ICHg | |
| Media Intel Core i7-9750H (17054 - 25043, n=27) | |
* ... Meglio usare valori piccoli
| PCMark 8 Home Score Accelerated v2 | 4860 punti | |
| PCMark 8 Creative Score Accelerated v2 | 7937 punti | |
| PCMark 8 Work Score Accelerated v2 | 5697 punti | |
| PCMark 10 Score | 5625 punti | |
Aiuto | ||
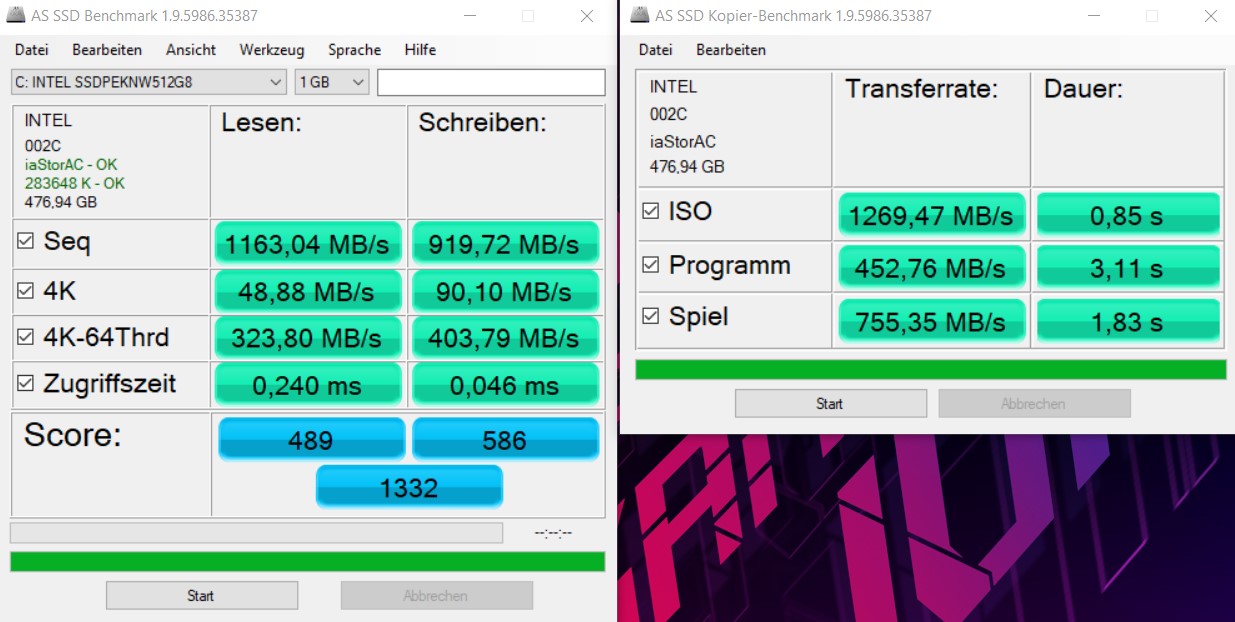
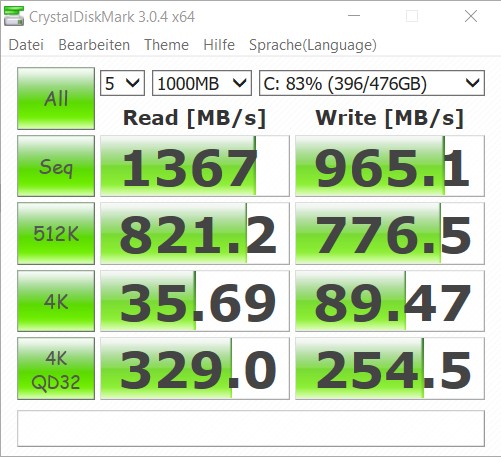
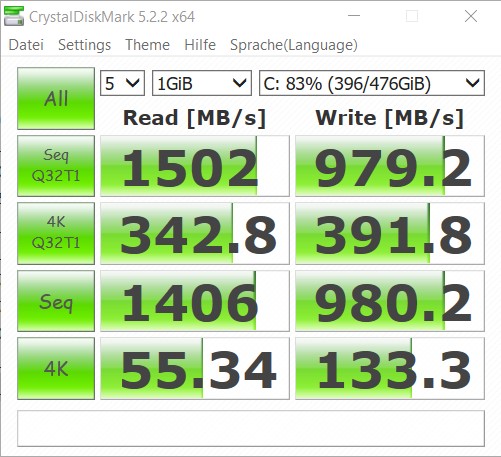
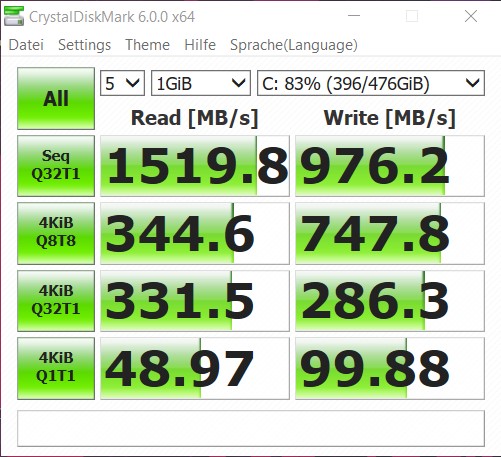
| Asus Strix Scar III G531GW-AZ062T Intel SSD 660p SSDPEKNW512G8 | Asus Strix Scar III G531GW Intel SSD 660p 1TB SSDPEKNW010T8 | Lenovo Legion Y740-15ICHg WDC PC SN520 SDAPMUW-128G | Acer Predator Triton 500 PT515-51-71PZ WDC PC SN720 SDAPNTW-512G | Origin PC EVO16-S i7-9750H RTX 2080 Max-Q Samsung SSD 970 EVO Plus 500GB | Media Intel SSD 660p SSDPEKNW512G8 | Media della classe Gaming | |
|---|---|---|---|---|---|---|---|
| AS SSD | 38% | -8% | 179% | 170% | 16% | 268% | |
| Seq Read (MB/s) | 1163 | 1574 35% | 1372 18% | 2888 148% | 2172 87% | 1423 ? 22% | 5592 ? 381% |
| Seq Write (MB/s) | 919 | 1591 73% | 746 -19% | 2374 158% | 2760 200% | 828 ? -10% | 3960 ? 331% |
| 4K Read (MB/s) | 48.88 | 26.79 -45% | 35.42 -28% | 42.95 -12% | 54.6 12% | 51.3 ? 5% | 71.1 ? 45% |
| 4K Write (MB/s) | 90.1 | 105.1 17% | 99.9 11% | 143.6 59% | 145.8 62% | 128.9 ? 43% | 215 ? 139% |
| 4K-64 Read (MB/s) | 323.8 | 583 80% | 302.1 -7% | 1272 293% | 1234 281% | 326 ? 1% | 1623 ? 401% |
| 4K-64 Write (MB/s) | 403.8 | 603 49% | 191.4 -53% | 1546 283% | 2431 502% | 721 ? 79% | 2938 ? 628% |
| Access Time Read * (ms) | 0.24 | 0.128 47% | 0.132 45% | 0.038 84% | 0.09003 ? 62% | 0.06395 ? 73% | |
| Access Time Write * (ms) | 0.046 | 0.043 7% | 0.037 20% | 0.026 43% | 0.07378 ? -60% | 0.03797 ? 17% | |
| Score Read (Points) | 489 | 768 57% | 475 -3% | 1604 228% | 1506 208% | 519 ? 6% | 2253 ? 361% |
| Score Write (Points) | 586 | 867 48% | 366 -38% | 1927 229% | 2853 387% | 932 ? 59% | 3548 ? 505% |
| Score Total (Points) | 1332 | 2033 53% | 1065 -20% | 4329 225% | 5169 288% | 1708 ? 28% | 6881 ? 417% |
| Copy ISO MB/s (MB/s) | 1269 | 1062 -16% | 2728 115% | 1109 ? -13% | 3192 ? 152% | ||
| Copy Program MB/s (MB/s) | 452.8 | 426 -6% | 570 26% | 468 ? 3% | 989 ? 118% | ||
| Copy Game MB/s (MB/s) | 755 | 650 -14% | 1434 90% | 760 ? 1% | 2134 ? 183% |
* ... Meglio usare valori piccoli

| 3DMark 11 Performance | 20072 punti | |
| 3DMark Ice Storm Standard Score | 122334 punti | |
| 3DMark Cloud Gate Standard Score | 39054 punti | |
| 3DMark Fire Strike Score | 17384 punti | |
| 3DMark Fire Strike Extreme Score | 8991 punti | |
| 3DMark Time Spy Score | 7568 punti | |
Aiuto | ||
| The Witcher 3 - 1920x1080 Ultra Graphics & Postprocessing (HBAO+) | |
| Media della classe Gaming (104.7 - 240, n=7, ultimi 2 anni) | |
| Origin PC EVO16-S i7-9750H RTX 2080 Max-Q | |
| Media NVIDIA GeForce RTX 2070 Mobile (64 - 82.1, n=21) | |
| Asus Strix Scar III G531GW-AZ062T | |
| Asus Strix Scar III G531GW | |
| Acer Predator Triton 500 PT515-51-71PZ | |
| Lenovo Legion Y740-15ICHg | |
| basso | medio | alto | ultra | |
|---|---|---|---|---|
| The Witcher 3 (2015) | 258 | 208 | 130 | 72 |
| Dota 2 Reborn (2015) | 137.3 | 127.2 | 104.1 | 98.4 |
| X-Plane 11.11 (2018) | 103 | 85 | 76 | |
| Shadow of the Tomb Raider (2018) | 111 | 92 | 90 | 80 |
| Metro Exodus (2019) | 98 | 87 | 66 | 53.3 |
| Control (2019) | 180 | 93 | 68 |
Rumorosità
| Idle |
| 30.6 / 30.6 / 37.7 dB(A) |
| Sotto carico |
| 36.5 / 48.1 dB(A) |
 | ||
30 dB silenzioso 40 dB(A) udibile 50 dB(A) rumoroso |
||
min: | ||
| Asus Strix Scar III G531GW-AZ062T GeForce RTX 2070 Mobile, i7-9750H, Intel SSD 660p SSDPEKNW512G8 | Asus Strix Scar III G531GW GeForce RTX 2070 Mobile, i9-9880H, Intel SSD 660p 1TB SSDPEKNW010T8 | Lenovo Legion Y740-15ICHg GeForce RTX 2070 Max-Q, i7-9750H, WDC PC SN520 SDAPMUW-128G | Acer Predator Triton 500 PT515-51-71PZ GeForce RTX 2070 Max-Q, i7-9750H, WDC PC SN720 SDAPNTW-512G | Origin PC EVO16-S i7-9750H RTX 2080 Max-Q GeForce RTX 2080 Max-Q, i7-9750H, Samsung SSD 970 EVO Plus 500GB | |
|---|---|---|---|---|---|
| Noise | -12% | 3% | -5% | -5% | |
| off /ambiente * (dB) | 30 | 29 3% | 30 -0% | 30 -0% | 28.5 5% |
| Idle Minimum * (dB) | 30.6 | 30 2% | 31.3 -2% | 30 2% | 30.4 1% |
| Idle Average * (dB) | 30.6 | 37 -21% | 31.3 -2% | 33 -8% | 30.4 1% |
| Idle Maximum * (dB) | 37.7 | 39 -3% | 31.3 17% | 39 -3% | 31.5 16% |
| Load Average * (dB) | 36.5 | 54 -48% | 42 -15% | 45 -23% | 50 -37% |
| Witcher 3 ultra * (dB) | 52.1 | 54 -4% | 42.1 19% | 49 6% | 55.3 -6% |
| Load Maximum * (dB) | 48.1 | 54 -12% | 46.5 3% | 51 -6% | 55.5 -15% |
* ... Meglio usare valori piccoli
(-) La temperatura massima sul lato superiore è di 45.6 °C / 114 F, rispetto alla media di 40.4 °C / 105 F, che varia da 21.2 a 68.8 °C per questa classe Gaming.
(-) Il lato inferiore si riscalda fino ad un massimo di 55.5 °C / 132 F, rispetto alla media di 43.2 °C / 110 F
(+) In idle, la temperatura media del lato superiore è di 29.8 °C / 86 F, rispetto alla media deld ispositivo di 33.9 °C / 93 F.
(±) Riproducendo The Witcher 3, la temperatura media per il lato superiore e' di 32.8 °C / 91 F, rispetto alla media del dispositivo di 33.9 °C / 93 F.
(+) I poggiapolsi e il touchpad sono piu' freddi della temperatura della pelle con un massimo di 29 °C / 84.2 F e sono quindi freddi al tatto.
(±) La temperatura media della zona del palmo della mano di dispositivi simili e'stata di 28.8 °C / 83.8 F (-0.2 °C / -0.4 F).
Asus Strix Scar III G531GW-AZ062T analisi audio
(-) | altoparlanti non molto potenti (68.3 dB)
Bassi 100 - 315 Hz
(±) | bassi ridotti - in media 9.9% inferiori alla media
(±) | la linearità dei bassi è media (13.2% delta rispetto alla precedente frequenza)
Medi 400 - 2000 Hz
(+) | medi bilanciati - solo only 2.6% rispetto alla media
(+) | medi lineari (3.5% delta rispetto alla precedente frequenza)
Alti 2 - 16 kHz
(+) | Alti bilanciati - appena 2.2% dalla media
(+) | alti lineari (4.6% delta rispetto alla precedente frequenza)
Nel complesso 100 - 16.000 Hz
(+) | suono nel complesso lineare (13.6% differenza dalla media)
Rispetto alla stessa classe
» 20% di tutti i dispositivi testati in questa classe è stato migliore, 7% simile, 73% peggiore
» Il migliore ha avuto un delta di 6%, medio di 18%, peggiore di 132%
Rispetto a tutti i dispositivi testati
» 15% di tutti i dispositivi testati in questa classe è stato migliore, 4% similare, 81% peggiore
» Il migliore ha avuto un delta di 4%, medio di 23%, peggiore di 134%
Acer Predator Triton 500 PT515-51-71PZ analisi audio
(±) | potenza degli altiparlanti media ma buona (80 dB)
Bassi 100 - 315 Hz
(±) | bassi ridotti - in media 12.2% inferiori alla media
(±) | la linearità dei bassi è media (12.6% delta rispetto alla precedente frequenza)
Medi 400 - 2000 Hz
(+) | medi bilanciati - solo only 4.5% rispetto alla media
(+) | medi lineari (4.7% delta rispetto alla precedente frequenza)
Alti 2 - 16 kHz
(+) | Alti bilanciati - appena 2.2% dalla media
(+) | alti lineari (3.2% delta rispetto alla precedente frequenza)
Nel complesso 100 - 16.000 Hz
(+) | suono nel complesso lineare (14.8% differenza dalla media)
Rispetto alla stessa classe
» 29% di tutti i dispositivi testati in questa classe è stato migliore, 7% simile, 63% peggiore
» Il migliore ha avuto un delta di 6%, medio di 18%, peggiore di 132%
Rispetto a tutti i dispositivi testati
» 20% di tutti i dispositivi testati in questa classe è stato migliore, 4% similare, 76% peggiore
» Il migliore ha avuto un delta di 4%, medio di 23%, peggiore di 134%
| Off / Standby | |
| Idle | |
| Sotto carico |
|
Leggenda:
min: | |
| Asus Strix Scar III G531GW-AZ062T i7-9750H, GeForce RTX 2070 Mobile, Intel SSD 660p SSDPEKNW512G8, IPS, 1920x1080, 15.6" | Asus Strix Scar III G531GW i9-9880H, GeForce RTX 2070 Mobile, Intel SSD 660p 1TB SSDPEKNW010T8, IPS, 1920x1080, 15.6" | Lenovo Legion Y740-15ICHg i7-9750H, GeForce RTX 2070 Max-Q, WDC PC SN520 SDAPMUW-128G, IPS, 1920x1080, 15.6" | Acer Predator Triton 500 PT515-51-71PZ i7-9750H, GeForce RTX 2070 Max-Q, WDC PC SN720 SDAPNTW-512G, IPS, 1920x1080, 15.6" | Origin PC EVO16-S i7-9750H RTX 2080 Max-Q i7-9750H, GeForce RTX 2080 Max-Q, Samsung SSD 970 EVO Plus 500GB, IPS, 1920x1080, 16.1" | |
|---|---|---|---|---|---|
| Power Consumption | -69% | -31% | 17% | 12% | |
| Idle Minimum * (Watt) | 11.4 | 29 -154% | 22.2 -95% | 7 39% | 7.5 34% |
| Idle Average * (Watt) | 13.5 | 32 -137% | 24.9 -84% | 12 11% | 11.6 14% |
| Idle Maximum * (Watt) | 21.6 | 37 -71% | 30.6 -42% | 22 -2% | 21 3% |
| Load Average * (Watt) | 106 | 157 -48% | 101 5% | 86 19% | 91.3 14% |
| Witcher 3 ultra * (Watt) | 186 | 173 7% | 143 23% | 144 23% | 165.1 11% |
| Load Maximum * (Watt) | 196 | 217 -11% | 186 5% | 177 10% | 208.9 -7% |
* ... Meglio usare valori piccoli
Pro
Contro
Giudizio Complessivo - Ci sono alcune features che rendono interessante questo dispositivo
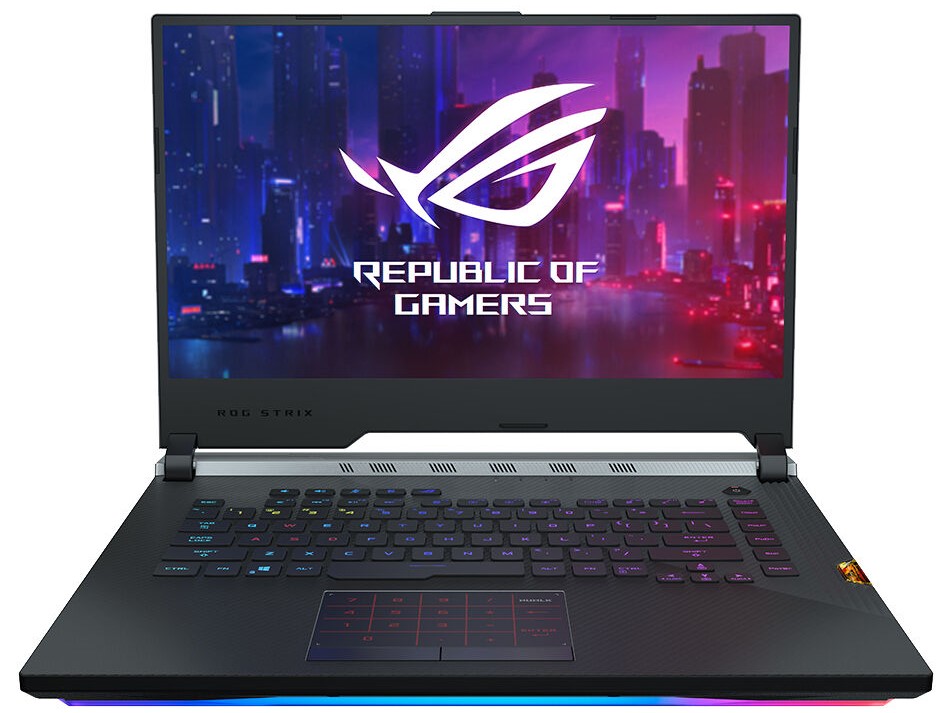
L'Asus ROG Strix Scar III è stato in grado di ottenere un risultato buono nel test. La combinazione di Intel Core i7-9750H e Nvidia GeForce RTX 2070 funziona molto bene, e tutti i giochi attuali possono essere riprodotti senza problemi. Molti giochi possono essere utilizzati anche in UHD o WQHD, ma per farlo è necessario un display esterno, dato che il ROG Strix Scar III è disponibile solo con un pannello FHD. Tuttavia, dobbiamo ricordare che questo non è un display qualsiasi, dato che a 240 Hz, lo schermo è adatto per i veloci shooters.
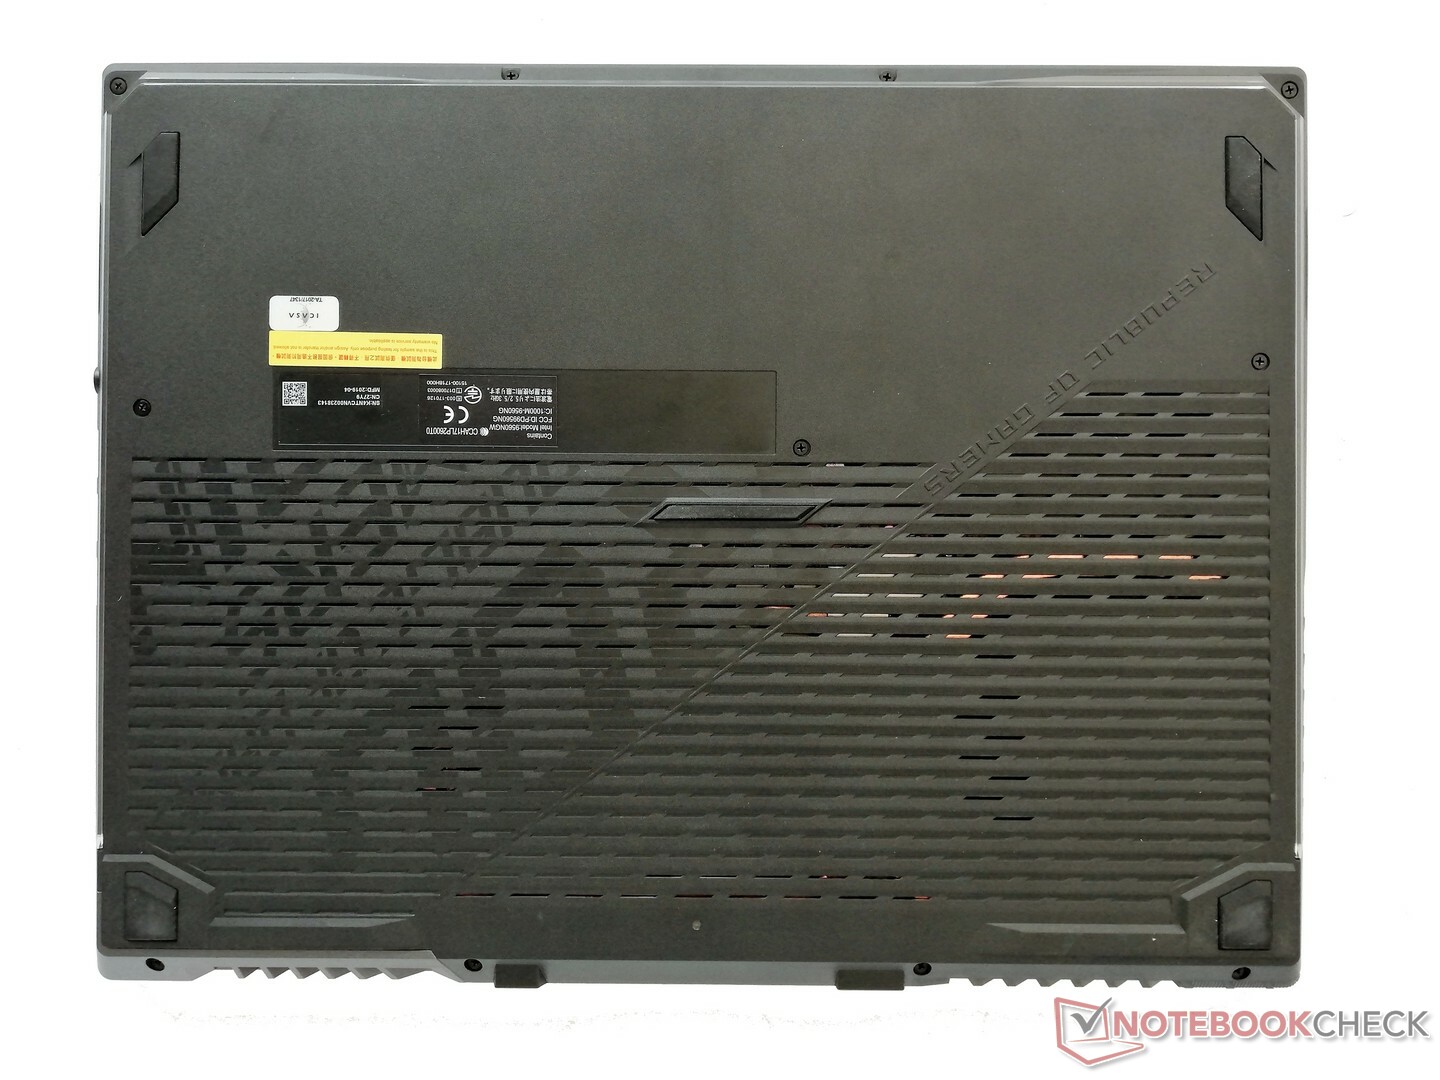
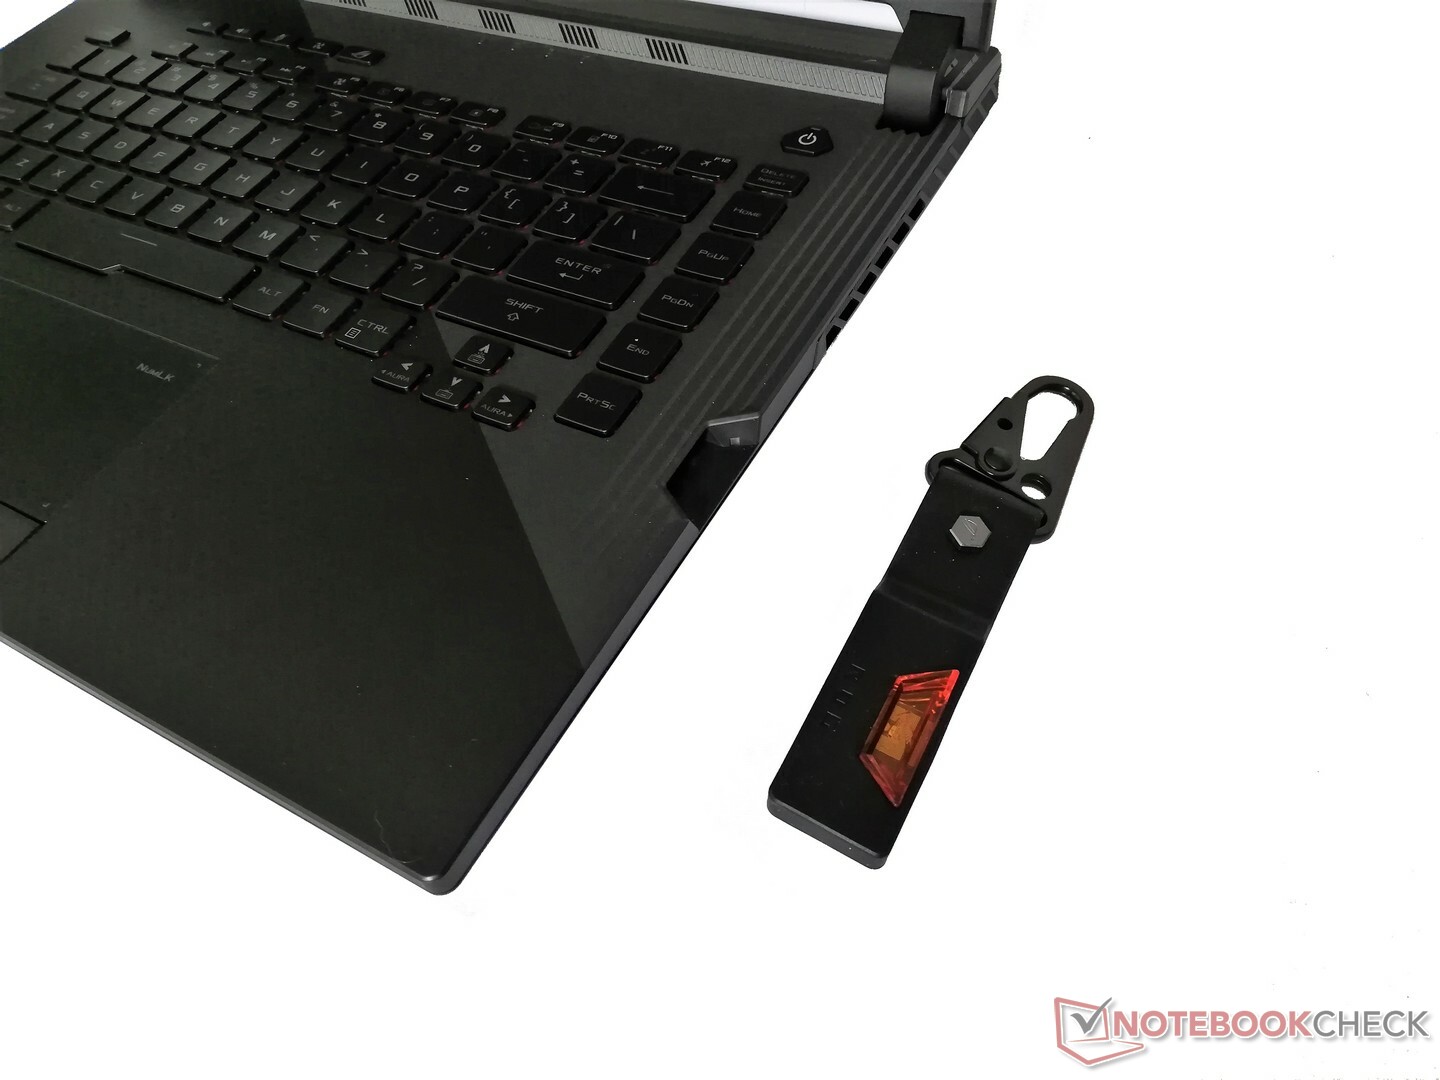
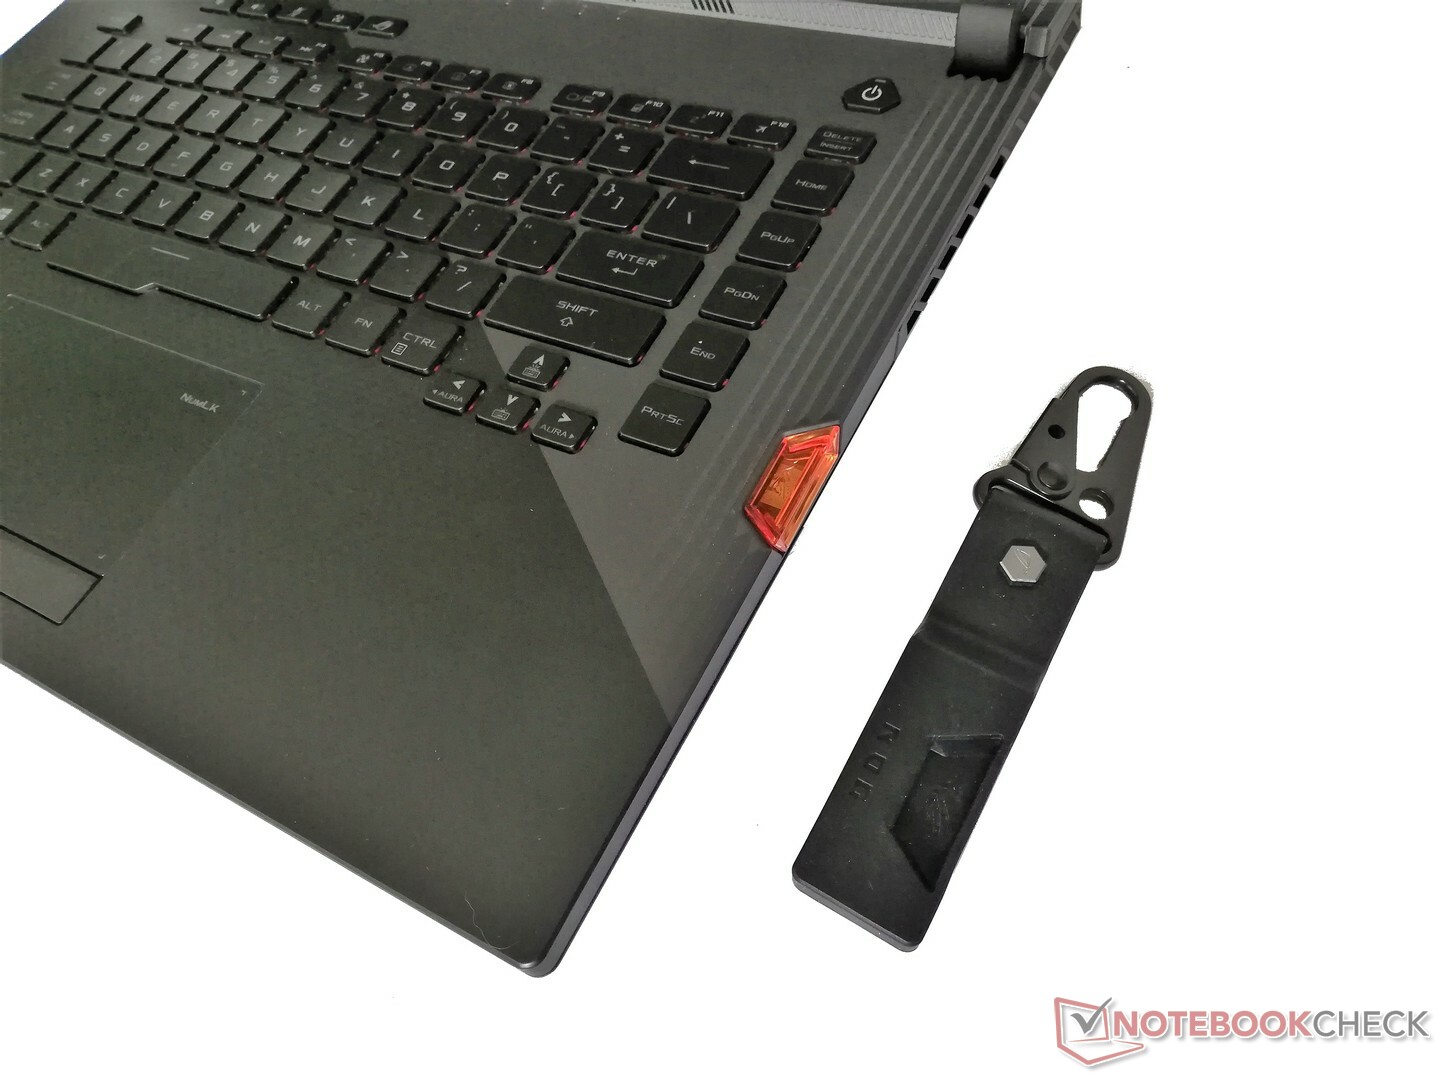
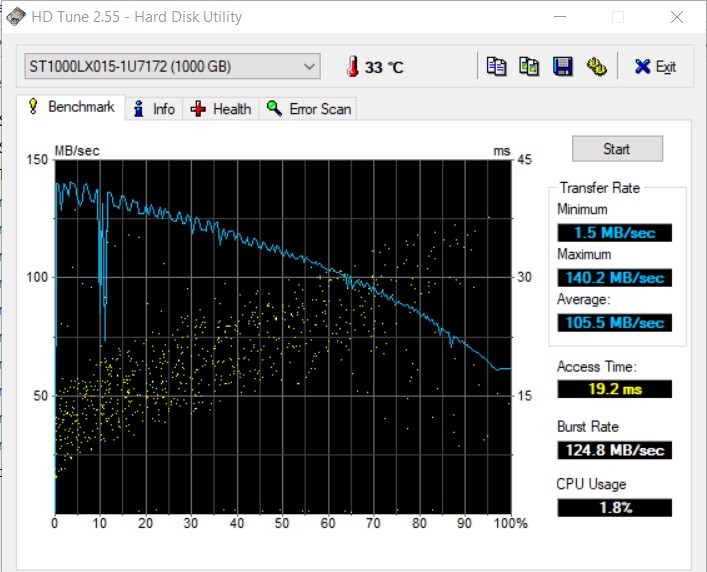
Offrendo buone opzioni di manutenzione, il dispositivo può essere facilmente aggiornato in termini di RAM, SSD o HDD. Con buone caratteristiche come Stonekey e un blocco numerico che può essere visualizzato sul touchpad, Asus ottiene alcuni risultati positivi aggiuntivi.
L'Asus ROG Strix Scar III convince con buone prestazioni e l'illuminazione RGB attira molti occhi. Tuttavia, sotto carico il dispositivo è più adatto per gli utenti che non hanno problemi di rumorosità.
Nel complesso, l'Asus ROG Strix Scar III con l'Intel Core i7 offre un risultato buono e in parte anche migliore come prestazioni rispetto al modello simile basato sul Core i9. Attualmente, molti giochi non beneficiano di 8 cores, per cui il laptop a 6 cores può essere l'alternativa migliore in alcune circostanze. Inoltre, il nostro modello di prova è leggermente più silenzioso sotto carico, anche se ancora non vince nessun premio a questo proposito. Il dispositivo è ancora molto rumoroso sotto carico.
Asus Strix Scar III G531GW-AZ062T
- 05/14/2020 v7 (old)
Sebastian Bade
Price comparison
