Recensioni Notebook con NVIDIA GeForce RTX 2070 Mobile la scheda grafica
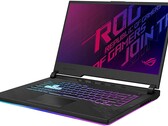
Recensione del laptop Asus ROG Strix G15 G512LW: Molto meglio del G512LI
Il sistema Asus utilizza il metallo liquido per la sua CPU rispetto alla tradizionale pasta termica. Anche se la sostenibilità del Turbo Boost è eccellente, le temperature del core rimangono a circa 80° C quando si gioca.
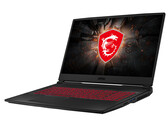
Intel Core i7-10750H, NVIDIA GeForce RTX 2070 Mobile, 15.6", 2.3 kgRecensione del Laptop MSI GL75 Leopard: portatile gaming di successo con display 144 Hz
Con il GL75 Leopard, MSI ha un potente portatile da 17,3 pollici gaming nella sua gamma che porta tutti i giochi moderni senza problemi sul reattivo display Full HD (144 Hz, IPS). Anche il resto delle dotazioni si fa notare: 16 GB di memoria (modalità dual-channel), un SSD NVMe, e un HDD da 1 TB.
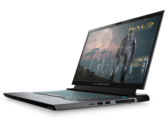
Intel Core i7-10750H, NVIDIA GeForce RTX 2070 Mobile, 17.3", 2.6 kgRecensione del Laptop Dell Alienware m15 R3: la camera di vapore è una salvezza
All'esterno può sembrare lo stesso, ma all'interno è diverso. Le temperature della CPU sono molto più basse ora per rispondere a una delle nostre maggiori preoccupazioni riguardo l'Alienware m15 R2 dell'anno scorso.
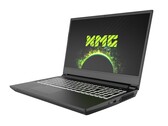
Intel Core i7-10750H, NVIDIA GeForce RTX 2070 Mobile, 15.6", 2.3 kgRecensione del laptop Schenker XMG Apex 15 (Clevo NH57AF1): estremamente veloce ma molto rumoroso
L'XMG Apex 15 di Schenker Technologies è un notebook di fascia alta molto particolare. Con quale frequenza trovate i processori AMD collegati tramite un socket nei notebook, dopo tutto? Scoprite quali sono i punti di forza e i punti deboli di questo dispositivo esotico nella nostra recensione.
AMD Ryzen 9 3900, NVIDIA GeForce RTX 2070 Mobile, 15.6", 2.7 kgRecensione del Laptop MSI GP65 10SFK: l'Intel Core i7 10th Gen lascia il segno
MSI ha battuto la maggior parte degli altri OEM sul mercato con i computer portatili dotati degli ultimi processori Comet Lake-H di Intel. Dopo aver controllato il Core i5-10300H e il Core i9-10980HK, vediamo come il Core i7-10750H si inserisce nella lineup.
Intel Core i7-10750H, NVIDIA GeForce RTX 2070 Mobile, 15.6", 2.3 kgSchenker XMG Pro 15: Intel Core i7-9750H, 15.60", 2.5 kg
recensione » Recensione del laptop Schenker XMG Pro 15 (Clevo PB51RF-G): gaming e divertimento
MSI GE65 Raider 9SF-049US: Intel Core i9-9880H, 15.60", 2.3 kg
recensione » Recensione del Laptop MSI GE65 Raider 9SF: un netto miglioramento rispetto al GE63
Asus Strix Scar III G531GW-AZ062T: Intel Core i7-9750H, 15.60", 2.4 kg
recensione » Recensione del Laptop Asus ROG Strix Scar III G531GW: ha un veloce display 240-Hz
Eurocom Nightsky RX15: Intel Core i9-9980HK, 15.60", 2.5 kg
recensione » Recensione del Laptop Eurocom Nightsky RX15 (Clevo PB51RF, Core i9, 4K OLED)
Asus ASUS ROG Strix SCAR III G731GW-XB74: Intel Core i7-9750H, 17.30", 2.9 kg
recensione » Recensione del Computer Portatile Asus ROG Strix Hero III G731GW - un portatile colorato ma con qualche compromesso
Eurocom Nightsky RX17: Intel Core i7-9750H, 17.30", 2.9 kg
recensione » Recensione del Computer portatile Eurocom Nightsky RX17 (Clevo PB71RF)
Asus Strix Scar III G531GW: Intel Core i9-9880H, 15.60", 2.3 kg
recensione » Recensione del Computer Portatile ASUS ROG Strix SCAR III G531GW (Core i9-9880H, RTX 2070)
Asus Zephyrus S GX502GW: Intel Core i7-9750H, 15.60", 2.1 kg
recensione » Recensione del Computer Portatile ASUS ROG Zephyrus S GX502GW (Core i7-9750H, RTX 2070)
Aorus 15 X9: Intel Core i7-8750H, 15.60", 2.4 kg
recensione » Recensione del Computer Portatile Aorus 15 (i7-8750H, RTX 2070)
Schenker XMG Neo 17: Intel Core i7-8750H, 17.30", 2.5 kg
recensione » Recensione del Computer Portatile Schenker XMG Neo 17 (Core i7-8750H, GeForce RTX 2070) Tongfang GK7CP7S
MSI GE75 8SF: Intel Core i7-8750H, 17.30", 2.6 kg
recensione » Recensione del Portatile MSI GE75 Raider 8SF (i7-8750H, RTX 2070)
Schenker XMG Ultra 15 Turing: Intel Core i7-9700K, 15.60", 3.5 kg
recensione » Recensione del Portatile Schenker XMG Ultra 15 (i7-9700K, RTX 2070) Clevo P751TM1-G
Asus ROG Strix Scar II GL704GW: Intel Core i7-8750H, 17.30", 2.9 kg
recensione » Recensione del Portatile ASUS ROG Strix Scar II GL704GW (Core i7-8750H, RTX 2070)
MSI GE75 Raider 10SF-286: Intel Core i7-10875H, 17.30", 2.6 kg
Recensioni esterne » MSI GE75 Raider 10SF-286
MSI GE66 Raider 10SF: Intel Core i7-10870H, 15.60", 2.4 kg
Recensioni esterne » MSI GE66 Raider 10SF
MSI GL65 Leopard 10SFK-062: Intel Core i7-10750H, 15.60", 2.3 kg
Recensioni esterne » MSI GL65 Leopard 10SFK-062
Asus Zephyrus S17 GX701LWS-EV029T: Intel Core i7-10750H, 17.30", 2.6 kg
Recensioni esterne » Asus Zephyrus S17 GX701LWS-EV029T
Asus ROG Strix G15 G512LW: Intel Core i7-10750H, 15.60", 2.3 kg
Recensioni esterne » Asus ROG Strix G15 G512LW
Dell G5 15 5500, i7-10750H RTX 2070: Intel Core i7-10750H, 15.60", 2.4 kg
Recensioni esterne » Dell G5 15 5500, i7-10750H RTX 2070
HP Omen 15-dh1020tx: Intel Core i7-10750H, 15.60", 2.4 kg
Recensioni esterne » HP Omen 15-dh1020tx
MSI GL65 Leopard 10SFR-483XES: Intel Core i7-10750H, 15.60", 2.4 kg
Recensioni esterne » MSI GL65 Leopard 10SFR-483XES
Acer Predator Triton 300 PT315-52-73S0: Intel Core i7-10750H, 15.60", 2 kg
Recensioni esterne » Acer Predator Triton 300 PT315-52-73S0
Asus ROG Strix G15 G512LW-HN069: Intel Core i7-10750H, 15.60", 2.4 kg
Recensioni esterne » Asus ROG Strix G15 G512LW-HN069
MSI GP65 Leopard 10SFK-495XES: Intel Core i7-10750H, 15.60"
Recensioni esterne » MSI GP65 Leopard 10SFK-495XES
Acer Predator Helios 300 PH317-54-77RQ: Intel Core i7-10750H, 17.30", 2.9 kg
Recensioni esterne » Acer Predator Helios 300 PH317-54-77RQ
MSI GE66 Raider 10SF-056XES: Intel Core i7-10750H, 15.60"
Recensioni esterne » MSI GE66 Raider 10SF-056XES
MSI GL75 10SFK-060XES: Intel Core i7-10750H, 17.30", 2.6 kg
Recensioni esterne » MSI GL75 10SFK-060XES
HP Omen 15-dc1016no: Intel Core i7-8750H, 15.60", 2.4 kg
Recensioni esterne » HP Omen 15-dc1016no
Alienware m15 R3 P87F: Intel Core i7-10750H, 15.60", 2.3 kg
Recensioni esterne » Alienware m15 R3 P87F
MSI GL75 10SFR-221 Leopard: Intel Core i7-10750H, 17.30", 2.6 kg
Recensioni esterne » MSI GL75 10SFR-221 Leopard
Asus Strix G17 G712LW-EV251T: Intel Core i7-10750H, 17.30", 2.9 kg
Recensioni esterne » Asus Strix G17 G712LW-EV251T
Asus Strix Scar 17 G732LW-EV050T: Intel Core i7-10875H, 17.30", 2.9 kg
Recensioni esterne » Asus Strix Scar 17 G732LW-EV050T
Asus Strix Scar 15 G532LW-AZ056T: Intel Core i7-10875H, 15.60", 2.6 kg
Recensioni esterne » Asus Strix Scar 15 G532LW-AZ056T
MSI GE65 Raider 9SF-003ES: Intel Core i7-9750H, 15.60", 2.3 kg
Recensioni esterne » MSI GE65 Raider 9SF-003ES
MSI GL75 9SFK-1248: Intel Core i7-9750H, 17.30", 2.5 kg
Recensioni esterne » MSI GL75 9SFK-1248
MSI GP65 10SFK-047US: Intel Core i7-10750H, 15.60", 2.3 kg
Recensioni esterne » MSI GP65 10SFK-047US
MSI GE63 Raider RGB 8SF-031XES: Intel Core i7-8750H, 15.60", 2.4 kg
Recensioni esterne » MSI GE63 Raider RGB 8SF-031XES
Asus ROG Zephyrus M15 GU502LW-HC130T: Intel Core i7-10750H, 15.60", 2 kg
Recensioni esterne » Asus ROG Zephyrus M GU502LW-HC130T
Origin PC Eon15-X 2020, R9 3900, RTX 2070: AMD Ryzen 9 3900, 15.60", 2.7 kg
Recensioni esterne » Origin PC Eon15-X 2020, R9 3900, RTX 2070
Schenker XMG Apex 15 Ryzen 9 3950X, RTX 2070: AMD Ryzen 9 3950X, 15.60", 2.6 kg
Recensioni esterne » Schenker XMG Apex 15 Ryzen 9 3950X, RTX 2070
Asus Strix G15 G512LW-HN038: Intel Core i7-10750H, 15.60", 2.4 kg
Recensioni esterne » Asus Strix G15 G512LW-HN038
Acer Predator Helios 300 PH317-53-750A: Intel Core i7-9750H, 17.30", 2.9 kg
Recensioni esterne » Acer Predator Helios 300 PH317-53-750A
MSI GE65 Raider 9SF-049US: Intel Core i9-9880H, 15.60", 2.3 kg
Recensioni esterne » MSI GE65 Raider 9SF-049US
Acer Predator Helios 700 PH717-71-914K: Intel Core i9-9980HK, 17.30", 4.5 kg
Recensioni esterne » Acer Predator Helios 700 PH717-71-914K
Asus ROG Strix G531GW-AL137: Intel Core i7-9750H, 15.60", 2.4 kg
Recensioni esterne » Asus ROG Strix G531GW-AL137
Asus ROG Zephyrus S GX701GWR-H6089R: Intel Core i7-9750H, 17.30", 2.7 kg
Recensioni esterne » Asus ROG Zephyrus S GX701GWR-H6089R
Asus ROG Zephyrus S GX502GW-AZ064T: Intel Core i7-9750H, 15.60", 2 kg
Recensioni esterne » Asus ROG Zephyrus S GX502GW-AZ064T
Acer Predator Helios 700 PH717-71-95MA: Intel Core i9-9980HK, 17.30", 4.9 kg
Recensioni esterne » Acer Predator Helios 700 PH717-71-95MA
Asus ROG Strix Scar III G531GW-AZ150T: Intel Core i9-9880H, 15.60", 2.6 kg
Recensioni esterne » Asus ROG Strix Scar III G531GW-AZ150T
MSI GL65 9SFK-286XES: Intel Core i7-9750H, 15.60", 2.3 kg
Recensioni esterne » MSI GL65 9SFK-286XES
HP Omen 15-dh0022nf : Intel Core i7-9750H, 15.60", 2.6 kg
Recensioni esterne » HP Omen 15-dh0022nf
Asus ROG Strix G731GW-EV010T : Intel Core i7-9750H, 17.30", 2.9 kg
Recensioni esterne » Asus ROG Strix G731GW-EV010T
MSI GE65 Raider 9SF-006: Intel Core i7-9750H, 15.60", 2.3 kg
Recensioni esterne » MSI GE65 Raider 9SF-006
HP Omen 17-cb0040nr: Intel Core i7-9750H, 17.30", 3.3 kg
Recensioni esterne » HP Omen 17-cb0040nr
Asus ROG Zephyrus S GX502GW-ES004T: Intel Core i7-9750H, 15.60", 2 kg
Recensioni esterne » Asus ROG Zephyrus S GX502GW-ES004T
MSI GE75 Raider 8SF-032ES: Intel Core i7-8750H, 17.30", 2.7 kg
Recensioni esterne » MSI GE75 Raider 8SF-032ES
Acer Predator Helios 700 PH717-71-7091: Intel Core i7-9750H, 17.30", 4.5 kg
Recensioni esterne » Acer Predator Helios 700 PH717-71-7091
HP Omen 17-cb0006ng: Intel Core i7-9750H, 17.30", 3.3 kg
Recensioni esterne » HP Omen 17-cb0006ng
MSI GT76 9SF-013: Intel Core i7-9750H, 17.30", 4.5 kg
Recensioni esterne » MSI GT76 9SF-013
MSI GP75 Leopard 9SF-1037XES: Intel Core i7-9750H, 17.30", 2.6 kg
Recensioni esterne » MSI GP75 Leopard 9SF-1037XES
Asus ASUS ROG Strix SCAR III G731GW-XB74: Intel Core i7-9750H, 17.30", 2.9 kg
Recensioni esterne » Asus ASUS ROG Strix SCAR III G731GW-XB74
MSI GE65 9SF-006: Intel Core i9-9880H, 15.60", 2.3 kg
Recensioni esterne » MSI GE65 9SF-006
Asus Zephyrus S GX701GW-EV047R: Intel Core i7-8750H, 17.30", 2.7 kg
Recensioni esterne » Asus Zephyrus S GX701GW-EV047R
Acer Predator Helios 300 PH317-53-75YB: Intel Core i7-9750H, 17.30", 2.9 kg
Recensioni esterne » Acer Predator Helios 300 PH317-53-75YB
Asus Strix Scar 3 G531GW-DB76: Intel Core i7-9750H, 15.60", 2.6 kg
Recensioni esterne » Asus Strix Scar 3 G531GW-DB76
Asus ROG Strix HERO III G531GW-ES013T: Intel Core i7-9750H, 15.60", 2.4 kg
Recensioni esterne » Asus ROG Strix HERO III G531GW-ES013T
HP Omen 15-dc1001ns: Intel Core i7-8750H, 15.60", 2.5 kg
Recensioni esterne » HP OMEN 15-dc1001ns
Asus ROG Strix Scar III G531GW-AZ015T: Intel Core i7-9750H, 15.60", 2.6 kg
Recensioni esterne » Asus ROG Strix Scar III G531GW-AZ015T
Asus ROG Strix G531GW-AL023T: Intel Core i7-9750H, 15.60", 2.6 kg
Recensioni esterne » Asus ROG Strix G531GW-AL023T
Asus ROG Zephyrus S GX502GW-ES002: Intel Core i7-9750H, 15.60", 2 kg
Recensioni esterne » Asus ROG Zephyrus S GX502GW-ES002
MSI GE75 Raider 049-HID4-US: Intel Core i7-8750H, 17.30", 2.6 kg
Recensioni esterne » MSI GE75 Raider 049-HID4-US
Schenker XMG Pro 17-M19msb: Intel Core i7-9750H, 17.30", 2.9 kg
Recensioni esterne » Schenker XMG Pro 17-M19msb
Acer Predator Helios 300 PH317-53-79S0: Intel Core i7-9750H, 17.30", 2.9 kg
Recensioni esterne » Acer Predator Helios 300 PH317-53-79S0
BTO Notebooks X-Book 15X990: Intel Core i9-9980HK, 15.60", 2.4 kg
Recensioni esterne » BTO Notebooks X-Book 15X990
Asus ROG Zephyrus S GX502GW-ES010T: Intel Core i7-9750H, 15.60", 2 kg
Recensioni esterne » Asus ROG Zephyrus S GX502GW-ES010T
Medion Erazer X17805-MD61499: Intel Core i7-9750H, 17.30", 2.6 kg
Recensioni esterne » Medion Erazer X17805-MD61499
Asus Zephyrus S GX701GWR-EV021R: Intel Core i7-8750H, 17.30", 2.7 kg
Recensioni esterne » Asus Zephyrus S GX701GWR-EV021R
Asus ROG Strix Scar III G531GW-ES081T: Intel Core i7-9750H, 15.60", 2.6 kg
Recensioni esterne » Asus ROG Strix Scar III G531GW-ES081T
MSI GE65 Raider-9SF, i7-8750H: Intel Core i7-8750H, 15.60", 2.3 kg
Recensioni esterne » MSI GE65 Raider-9SF, i7-8750H
Asus Strix Scar III G531GW: Intel Core i9-9880H, 15.60", 2.3 kg
Recensioni esterne » Asus Strix Scar III G531GW
HP Omen 17-cb0005ng: Intel Core i7-9750H, 17.30", 3.3 kg
Recensioni esterne » HP Omen 17-cb0005ng
MSI GS75 Stealth 8SF-099FR: Intel Core i7-8750H, 17.30", 2.3 kg
Recensioni esterne » MSI GS75 Stealth 8SF-099FR
BTO Notebooks X-Book 17X882: Intel Core i7-8750H, 17.30", 2.6 kg
Recensioni esterne » BTO Notebooks X-Book 17X882
Asus ROG Strix Scar II GL504GW-ES043: Intel Core i7-8750H, 15.60", 2.4 kg
Recensioni esterne » Asus ROG Strix Scar II GL504GW-ES043
MSI GS75 Stealth 8SF-099EN: Intel Core i7-8750H, 17.30", 2.3 kg
Recensioni esterne » MSI GS75 Stealth 8SF-099EN
Aorus 15 X9: Intel Core i7-8750H, 15.60", 2.4 kg
Recensioni esterne » Aorus 15 X9
Aorus 15-XA-F74CDW: Intel Core i7-9750H, 15.60", 2.4 kg
Recensioni esterne » Aorus 15-XA-F74CDW
Asus Zephyrus S GX502GW: Intel Core i7-9750H, 15.60", 2.1 kg
Recensioni esterne » Asus Zephyrus S GX502GW
Asus Strix Scar III G531GW-AZ062T: Intel Core i7-9750H, 15.60", 2.4 kg
Recensioni esterne » Asus Strix Scar III G531GW-AZ062T
Asus Zephyrus S GX502GW-ES006R: Intel Core i7-9750H, 15.60", 2 kg
Recensioni esterne » Asus Zephyrus S GX502GW-ES006R
Asus ROG Strix Scar II GL704GW: Intel Core i7-8750H, 17.30", 2.9 kg
Recensioni esterne » Asus ROG Strix Scar II GL704GW
MSI GE75 8SF: Intel Core i7-8750H, 17.30", 2.6 kg
Recensioni esterne » MSI GE75 8SF
Asus ROG Strix Scar II GL704GW-EV042T: Intel Core i7-8750H, 17.00", 2.9 kg
Recensioni esterne » Asus ROG Strix Scar II GL704GW-EV042T
MSI GE75 Raider 8SF-033XES: Intel Core i7-8750H, 17.30", 2.7 kg
Recensioni esterne » MSI GE75 Raider 8SF-033XES
Asus Zephyrus S GX735GW-EV005T: Intel Core i7-8750H, 17.30", 2.7 kg
Recensioni esterne » Asus Zephyrus S GX735GW-EV005T
Asus ROG Strix Scar II GL504GW-ES012T: Intel Core i7-8750H, 15.60", 2.4 kg
Recensioni esterne » Asus ROG Strix Scar II GL504GW-ES012T
Asus Strix GL504GW-DS74: Intel Core i7-8750H, 15.60", 2.5 kg
Recensioni esterne » Asus Strix GL504GW-DS74
Asus ROG Strix Scar II GL704GW-EV005T: Intel Core i7-8750H, 17.30", 2.9 kg
Recensioni esterne » Asus ROG Strix Scar II GL704GW-EV005T