Recensioni Notebook con AMD Radeon RX Vega 6 (Ryzen 4000/5000) la scheda grafica
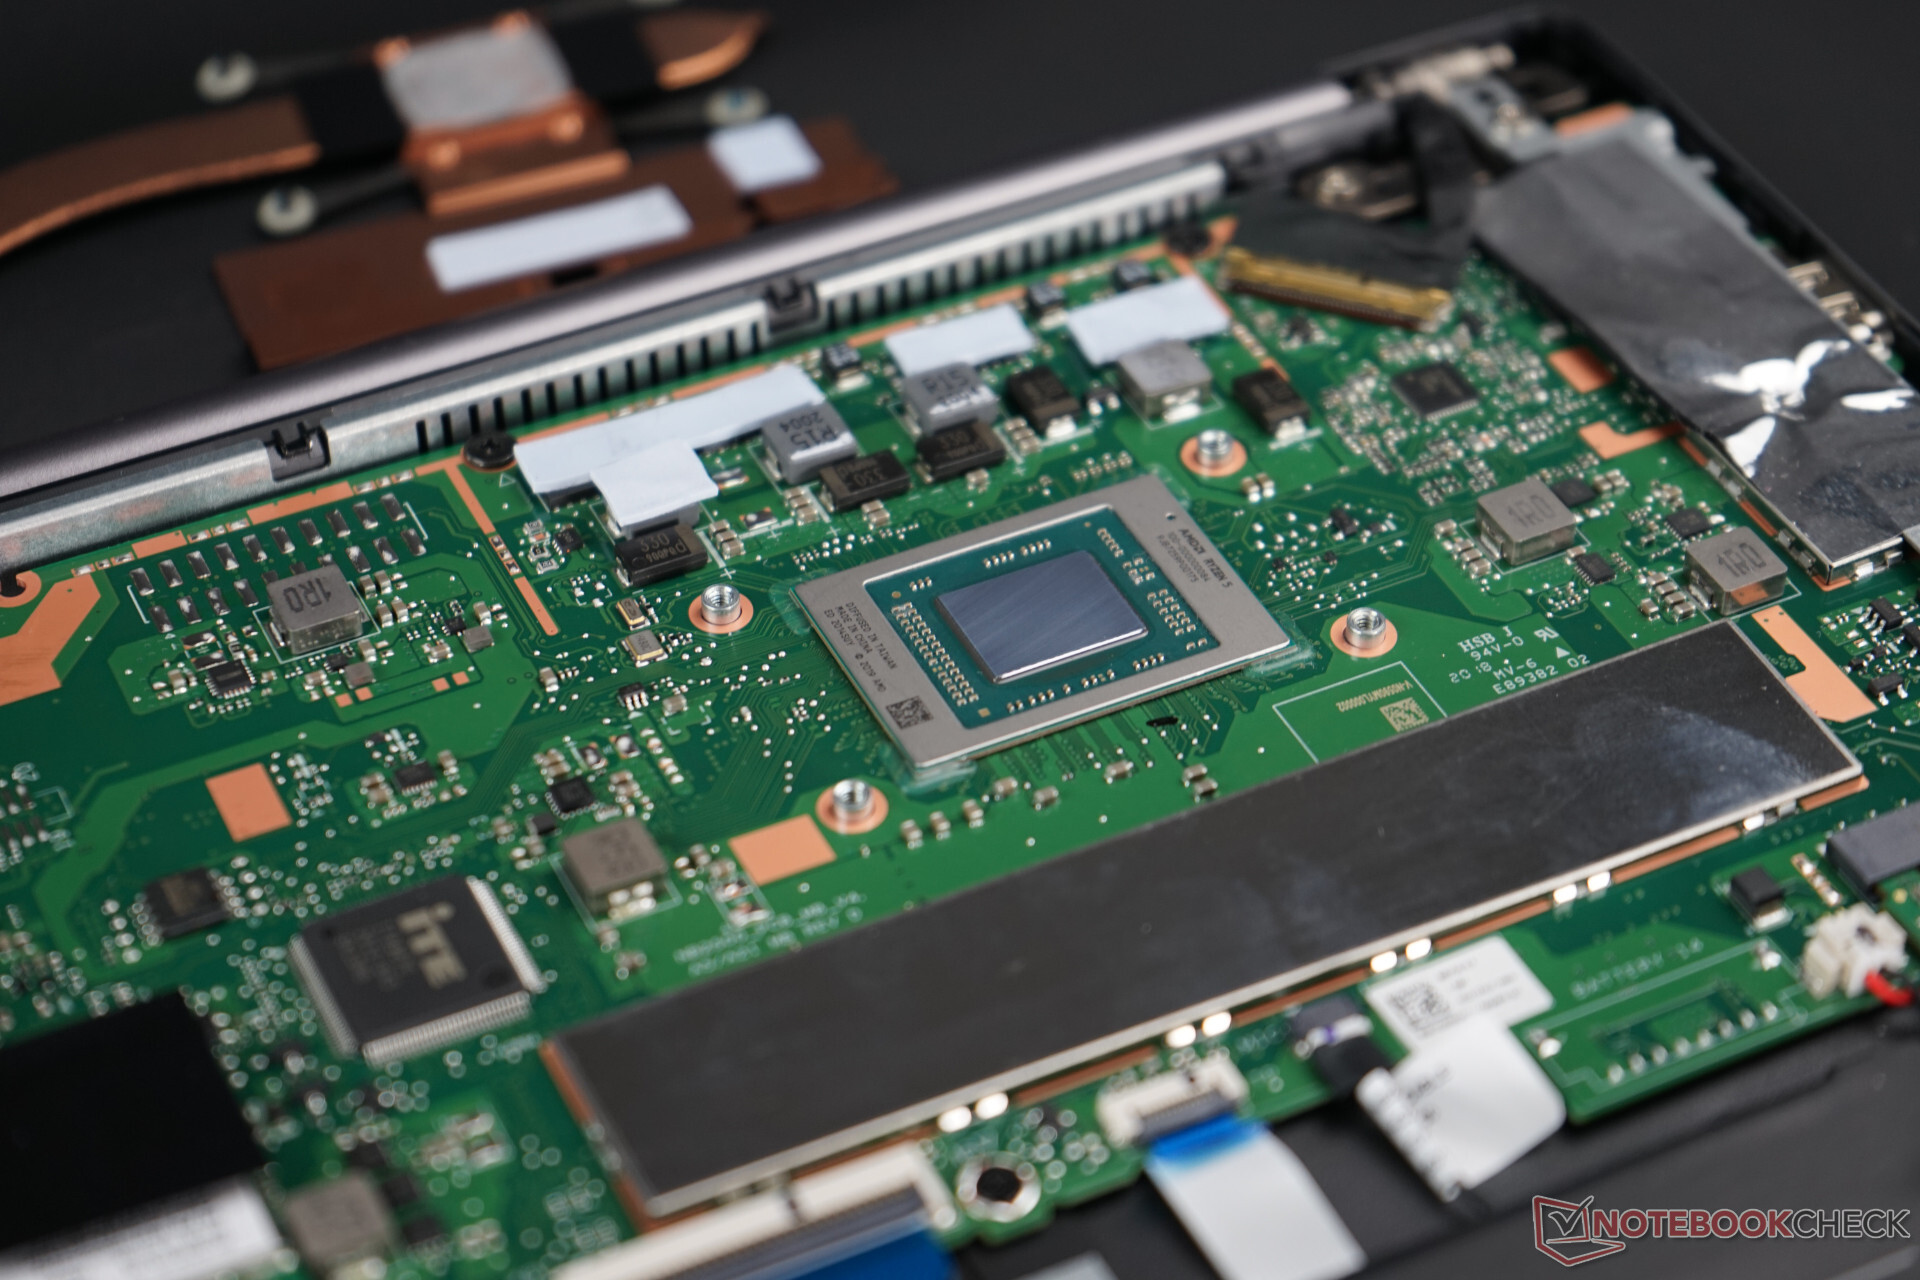
Recensione del mini PC Beelink SER5: Debutto delle prestazioni del Ryzen 5 5560U
Il Ryzen 5560U può avere un paio d'anni, ma le sue prestazioni sono così simili a quelle del nuovo Ryzen 5 7530U che la maggior parte degli utenti non sarebbe in grado di distinguere la differenza, soprattutto per scopi HTPC di base. Il SER5 è un vero affare a soli 230 dollari USA, completo di Windows 11.
AMD Ryzen 5 5560U, Vega 6, 439 grRecensione del portatile Lenovo IdeaPad 3 14 AMD: Padroneggia tutti gli aspetti fondamentali
L'efficiente Lenovo IdeaPad 3 14 AMD offre tutti gli aspetti fondamentali di un computer portatile da ufficio - un display IPS sufficientemente luminoso, un'elevata potenza della CPU, ottimi dispositivi di input e la possibilità di espandere la memoria di lavoro e di massa - a un prezzo inferiore a 500 euro. In questa recensione, verifichiamo se ci sono anche degli svantaggi reali.
AMD Ryzen 3 5300U, Vega 6, 14", 1.4 kgRecensione dell'LG Ultra PC 16 (2022) AMD: Questo non è un Gram.
Si chiama Ultra PC ed è più economico di un grammo. Questo portatile da 16 pollici ha una durata della batteria superiore a quella del già longevo LG gram basato su Intel. Inoltre, il dispositivo necessita di una batteria da 72 Wh (anziché 80 Wh) per raggiungere questo livello di autonomia. Con un peso di 400 g, l'Ultra PC non è certo un "grammo", ma è comunque un pezzo di hardware di tutto rispetto.
AMD Ryzen 3 5300U, Vega 6, 16", 1.6 kgRyzen 3 supera il Core i3: recensione del portatile Lenovo IdeaPad 3 15ALC6
L'IdeaPad 3 15 è un sistema economico che non lesina sulle prestazioni anche rispetto ad un Core i7 in certe condizioni. Anche se sembra veloce per il prezzo, lo spazio colore limitato del display e la mancanza di alcune funzionalità USB-C possono essere deludenti.
AMD Ryzen 3 5300U, Vega 6, 15.6", 1.7 kgRecensione del Huawei MateBook D 16: Molta potenza AMD e quasi nessun punto critico
Con il MateBook D 16, Huawei offre un interessante ed economico computer portatile multimediale ad un prezzo di 900 euro (~$1,088). Il dispositivo offre un display da 16,1" racchiuso in un elegante case di metallo. Riuscirà il Huawei MateBook D 16 a convincere nel test tanto quanto suggerisce la sua prima impressione?
AMD Ryzen 5 4600H, Vega 6, 16.1", 1.7 kgTuxedo Pulse 15: AMD Ryzen 5 4600H, 15.60", 1.5 kg
recensione » Recensione del portatile Tuxedo Pulse 15 - Ultrabook Linux da 15 pollici alimentato da AMD
Honor MagicBook 15 4500U: AMD Ryzen 5 4500U, 15.60", 1.5 kg
recensione » Recensione del Laptop Honor MagicBook 15: Economico e potente
Lenovo ThinkPad L14-20U50003GE: AMD Ryzen 5 4500U, 14.00", 1.7 kg
recensione » Recensione del Laptop Lenovo ThinkPad L14: AMD lo fa di nuovo
Honor MagicBook 14, Ryzen 5 4500U: AMD Ryzen 5 4500U, 14.00", 1.4 kg
recensione » Recensione dell'Honor MagicBook 14: Un portatile durevole con Ryzen 5 4500U
HP EliteBook 855 G7-23Y52EA: AMD Ryzen 5 PRO 4650U, 15.60", 1.7 kg
recensione » Recensione del laptop HP EliteBook 855 G7 - Elegante portatile da ufficio in movimento
Lenovo IdeaPad S540-13ARE-82DL000YGE: AMD Ryzen 5 4600U, 13.30", 1.3 kg
recensione » Recensione del Laptop da 13 pollici Lenovo IdeaPad S540: Ryzen ha trasformato questo piccolo portatile da ufficio in una vera e propria centrale elettrica
HP EliteBook 835 G7 23Y57EA: AMD Ryzen 5 PRO 4650U, 13.30", 1.4 kg
recensione » Recensione del portatile HP EliteBook 835 G7: AMD di classe compatta e aggiornabile
Lenovo ThinkPad T14-20UES00H00: AMD Ryzen 5 PRO 4650U, 14.00", 1.5 kg
recensione » Lenovo ThinkPad T14 AMD Review: Il miglior Business Laptop che si possa acquistare?
HP EliteBook 845 G7-23Y60EA: AMD Ryzen 5 PRO 4650U, 14.00", 1.5 kg
recensione » Recensione del laptop HP EliteBook 845 G7: portatile AMD è anche meglio con Ryzen 5 rispetto ad Intel
Honor MagicBook Pro (AMD): AMD Ryzen 5 4600H, 16.10", 1.7 kg
recensione » Recensione dell'Honor MagicBook Pro - laptop multimediale da 16" molta potenza
HP Envy x360 15-ee0257ng: AMD Ryzen 5 4500U, 15.60", 2 kg
recensione » Recensione del Laptop HP Envy x360 15 (2020): Ryzen 5 con prestazioni non sfruttate al meglio
HP ProBook x360 435 G7, Ryzen 5 4500U: AMD Ryzen 5 4500U, 13.30", 1.4 kg
recensione » Recensione del Laptop HP ProBook x360 435 G7: l'AMD Ryzen brilla anche in un convertibile business
Lenovo ThinkPad E14 Gen2-20T7S00W00: AMD Ryzen 5 4500U, 14.00", 1.6 kg
recensione » Recensione del Laptop Lenovo ThinkPad E14 Gen 2: economico e veloce grazie alla AMD Renoir
HP ProBook 445 G7 175W4EA: AMD Ryzen 5 4500U, 14.00", 1.6 kg
recensione » Recensione del Laptop HP ProBook 445 G7: Va verso Renoir
Xiaomi RedmiBook 16 R5: AMD Ryzen 5 4500U, 16.00", 1.8 kg
recensione » Recensione del Laptop Xiaomi RedmiBook 16 Ryzen 5 4500U - prezzo attraente per un guerriero asiatico
Lenovo IdeaPad 5 14ARE05: AMD Ryzen 5 4500U, 14.00", 1.4 kg
recensione » Recensione del Laptop Lenovo IdeaPad 5 14ARE05: molta potenza in un case piccolo
HP Envy x360 13-ay0010nr: AMD Ryzen 5 4500U, 13.30", 1.3 kg
recensione » Recensione del Convertibile 2-in-1 HP Envy x360 13 2020: la Ryzen 5 batte il Core i7
HP 255 G10: AMD Ryzen 3 7330U, 15.60", 1.5 kg
Recensioni esterne » HP 255 G10
Lenovo IdeaPad Slim 3 16ABR8: AMD Ryzen 3 7330U, 16.00", 1.7 kg
Recensioni esterne » Lenovo IdeaPad Slim 3 16ABR8
Lenovo ThinkBook 14 G3 ACL, Ryzen 3 5300U: AMD Ryzen 3 5300U, 14.00", 1.4 kg
Recensioni esterne » Lenovo ThinkBook 14 G3 ACL, Ryzen 3 5300U
HP 255 G8, R3 5300U: AMD Ryzen 3 5300U, 15.60", 1.7 kg
Recensioni esterne » HP 255 G8, R3 5300U
Lenovo IdeaPad 5 14ABA7, R3 5425U: AMD Ryzen 3 5425U, 14.00", 1.4 kg
Recensioni esterne » Lenovo IdeaPad 5 14ABA7, R3 5425U
Lenovo V14 G2 ALC, R3 5300U: AMD Ryzen 3 5300U, 15.60", 1.7 kg
Recensioni esterne » Lenovo V14 G2 ALC, R3 5300U
Lenovo IdeaPad 5 14 ABA7, R3 5425U: AMD Ryzen 3 5425U, 14.00", 1.4 kg
Recensioni esterne » Lenovo IdeaPad 5 14 ABA7, R3 5425U
Lenovo V15 G2 ALC, Ryzen 3 5300U: AMD Ryzen 3 5300U, 15.60", 1.7 kg
Recensioni esterne » Lenovo V15 G2 ALC, Ryzen 3 5300U
HP 15s-eq2121ns: AMD Ryzen 3 5300U, 15.60", 1.7 kg
Recensioni esterne » HP 15s-eq2121ns
HP 15s-eq2123ns: AMD Ryzen 3 5300U, 15.60", 1.7 kg
Recensioni esterne » HP 15s-eq2123ns
Lenovo IdeaPad 3 15ALC6: AMD Ryzen 3 5300U, 15.60", 1.7 kg
Recensioni esterne » Lenovo IdeaPad 3 15ALC6
HP Envy x360 15-ee0257ng: AMD Ryzen 5 4500U, 15.60", 2 kg
Recensioni esterne » HP Envy x360 15-ee0257ng
Acer Swift 3 SF314-43-R4JU: AMD Ryzen 3 5300U, 14.00", 1.2 kg
Recensioni esterne » Acer Swift 3 SF314-43-R4JU
HP 15s-eq2065ns: AMD Ryzen 3 5300U, 15.60", 1.7 kg
Recensioni esterne » HP 15s-eq2065ns
Lenovo IdeaPad 3 15ALC6-LASP: AMD Ryzen 3 5300U, 15.60", 1.7 kg
Recensioni esterne » Lenovo IdeaPad 3 15ALC6-LASP
Huawei MateBook 16 R5 5600H: AMD Ryzen 5 5600H, 16.00", 2 kg
Recensioni esterne » Huawei MateBook 16 R5 5600H
Lenovo ThinkPad E14 G3-20Y700CTGE: AMD Ryzen 3 5300U, 14.00", 1.6 kg
Recensioni esterne » Lenovo ThinkPad E14 G3-20Y700CTGE
HP 15s-eq2082ns: AMD Ryzen 3 5300U, 15.60", 1.7 kg
Recensioni esterne » HP 15s-eq2082ns
Lenovo Thinkbook 14p G2 ACH, 5600H: AMD Ryzen 5 5600H, 14.00", 1.4 kg
Recensioni esterne » Lenovo Thinkbook 14p G2 ACH, 5600H
Honor MagicBook 16: AMD Ryzen 5 5600H, 16.10", 1.8 kg
Recensioni esterne » Honor MagicBook 16
Lenovo IdeaPad 3 15ALC6-82KU00FGMH: AMD Ryzen 3 5300U, 15.60", 1.7 kg
Recensioni esterne » Lenovo IdeaPad 3 15ALC6-82KU00FGMH
HP Pavilion 14-ec0008AU: AMD Ryzen 3 5300U, 14.00", 1.4 kg
Recensioni esterne » HP Pavilion 14-ec0008AU
Lenovo IdeaPad 5 14ARE05-81YM00F7MH: AMD Ryzen 5 4600U, 14.00", 1.4 kg
Recensioni esterne » Lenovo IdeaPad 5 14ARE05-81YM00F7MH
Asus VivoBook Pro 15 M3500QA-L1149T: AMD Ryzen 5 5600H, 15.60", 1.7 kg
Recensioni esterne » Asus VivoBook Pro 15 M3500QA-L1149T
Acer Swift 3 SF314-42-R0EG: AMD Ryzen 5 4500U, 14.00", 1.2 kg
Recensioni esterne » Acer Swift 3 SF314-42-R0EG
Asus ZenBook 14X UM5401, 5600H: AMD Ryzen 5 5600H, 14.00", 1.4 kg
Recensioni esterne » Asus ZenBook 14X UM5401, 5600H
HP 15s-eq2043ns: AMD Ryzen 3 5300U, 15.60", 1.7 kg
Recensioni esterne » HP 15s-eq2043ns
Lenovo IdeaPad 5 Pro 16ACH6-82L5005TMH: AMD Ryzen 5 5600H, 16.10", 1.9 kg
Recensioni esterne » Lenovo IdeaPad 5 Pro 16ACH6-82L5005TMH
Acer Swift 3 SF314-42-R0V4: AMD Ryzen 5 4500U, 14.00", 1.2 kg
Recensioni esterne » Acer Swift 3 SF314-42-R0V4
HP ProBook 635 Aero G7-2W8S6EA: AMD Ryzen 5 4500U, 13.30", 1 kg
Recensioni esterne » HP ProBook 635 Aero G7-2W8S6EA
Lenovo IdeaPad 5 15ARE05-81YQ0030MH: AMD Ryzen 5 4500U, 15.60", 0.7 kg
Recensioni esterne » Lenovo IdeaPad 5 15ARE05-81YQ0030MH
Lenovo Yoga Slim 7 Pro 14ARH5-82MS0073SB: AMD Ryzen 5 5600H, 14.00", 1.3 kg
Recensioni esterne » Lenovo Yoga Slim 7 Pro 14ARH5-82MS0073SB
Medion Akoya E15303: AMD Ryzen 5 4500U, 15.60", 1.8 kg
Recensioni esterne » Medion Akoya E15303
MSI Modern 14 B4MW-056XES: AMD Ryzen 5 4500U, 14.00", 1.3 kg
Recensioni esterne » MSI Modern 14 B4MW-056XES
HP 15s-eq1104ns: AMD Ryzen 5 4500U, 15.60", 1.7 kg
Recensioni esterne » HP 15s-eq1104ns
HP 15s-eq1070ns: AMD Ryzen 5 4500U, 15.60", 1.7 kg
Recensioni esterne » HP 15s-eq1070ns
HP EliteBook 845 G7-23Y60EA: AMD Ryzen 5 PRO 4650U, 14.00", 1.5 kg
Recensioni esterne » HP EliteBook 845 G7-23Y60EA
HP 15s-eq1069ns: AMD Ryzen 5 4500U, 15.60", 1.7 kg
Recensioni esterne » HP 15s-eq1069ns
Lenovo IdeaPad 3 14ALC6-82KT0066GE: AMD Ryzen 3 5300U, 14.00", 1.4 kg
Recensioni esterne » Lenovo IdeaPad 3 14ALC6-82KT0066GE
Asus VivoBook 14 M413IA-HM899T: AMD Ryzen 5 4500U, 14.00", 1.4 kg
Recensioni esterne » Asus VivoBook 14 M413IA-HM899T
HP 15s-eq1101ns: AMD Ryzen 5 4500U, 15.60", 1.7 kg
Recensioni esterne » HP 15s-eq1101ns
Acer Aspire 5 A515-45-R5B9: AMD Ryzen 3 5300U, 15.60", 1.8 kg
Recensioni esterne » Acer Aspire 5 A515-45-R5B9
HP EliteBook 835 G7 23Y57EA: AMD Ryzen 5 PRO 4650U, 13.30", 1.4 kg
Recensioni esterne » HP EliteBook 835 G7 23Y57EA
HP Pavilion 15-eh0000ns: AMD Ryzen 5 4500U, 15.60", 1.8 kg
Recensioni esterne » HP Pavilion 15-eh0000ns
Lenovo Yoga 6 13ARE05-82FN000TGE: AMD Ryzen 5 4500U, 13.30", 1.4 kg
Recensioni esterne » Lenovo Yoga 6 13ARE05-82FN000TGE
Huawei MateBook D 16-53011VFJ: AMD Ryzen 5 4600H, 16.10", 1.7 kg
Recensioni esterne » Huawei MateBook D 16-53011VFJ
Lenovo IdeaPad 3 15ARE05-81W4005AMH: AMD Ryzen 5 4500U, 15.60", 1.7 kg
Recensioni esterne » Lenovo IdeaPad 3 15ARE05-81W4005AMH
Lenovo Yoga Slim 7 14ARE05-82A20073MH: AMD Ryzen 5 4500U, 14.00", 1.4 kg
Recensioni esterne » Lenovo Yoga Slim 7 14ARE05-82A20073MH
HP 15s-eq1050ns: AMD Ryzen 5 4500U, 15.60", 1.7 kg
Recensioni esterne » HP 15s-eq1050ns
HP 15s-eq1054ns: AMD Ryzen 5 4500U, 15.60", 1.7 kg
Recensioni esterne » HP 15s-eq1054ns
Honor MagicBook 15 4500U: AMD Ryzen 5 4500U, 15.60", 1.5 kg
Recensioni esterne » Honor MagicBook 15 4500U
Lenovo ThinkPad T14s-20UJ0014GE: AMD Ryzen 5 PRO 4650U, 14.00", 1.3 kg
Recensioni esterne » Lenovo ThinkPad T14s-20UJ0014GE
Asus ZenBook 14 UM425IA-AM005T: AMD Ryzen 5 4500U, 14.00", 1.3 kg
Recensioni esterne » Asus ZenBook 14 UM425IA-AM005T
Huawei MateBook 14 2020 AMD 4600H: AMD Ryzen 5 4600H, 14.00", 1.5 kg
Recensioni esterne » Huawei MateBook 14 2020, 4600H
Lenovo ThinkPad E14-20T6000RSP: AMD Ryzen 5 4500U, 14.00", 1.7 kg
Recensioni esterne » Lenovo ThinkPad E14-20T6000RSP
Acer Swift 3 SF314-42-R2MP: AMD Ryzen 5 4500U, 14.00", 1.2 kg
Recensioni esterne » Acer Swift 3 SF314-42-R2MP
Honor MagicBook 15 2020: AMD Ryzen 5 4500U, 15.60", 1.6 kg
Recensioni esterne » Honor MagicBook 15 2020
Huawei MateBook 14 2020 KLVL-WFH9: AMD Ryzen 5 4600H, 14.00", 1.5 kg
Recensioni esterne » Huawei MateBook 14 2020 KLVL-WFH9
HP ProBook 455 G7-12X20EA: AMD Ryzen 5 4500U, 15.60", 2 kg
Recensioni esterne » HP ProBook 455 G7-12X20EA
Asus ZenBook 14 UM425I: AMD Ryzen 5 4500U, 14.00", 1.2 kg
Recensioni esterne » Asus ZenBook 14 UM425I
HP ProBook 445 G7 175W4EA: AMD Ryzen 5 4500U, 14.00", 1.6 kg
Recensioni esterne » HP ProBook 445 G7 175W4EA
Huawei MateBook D 15 2020 AMD: AMD Ryzen 5 4500U, 15.60", 1.5 kg
Recensioni esterne » Huawei MateBook D 15 2020 AMD
Lenovo IdeaPad 3 15ARE05-81W4006GMB: AMD Ryzen 5 4500U, 15.60", 1.9 kg
Recensioni esterne » Lenovo IdeaPad 3 15ARE05-81W4006GMB
Lenovo ThinkPad E15 20T8000YMH: AMD Ryzen 5 4500U, 15.60"
Recensioni esterne » Lenovo ThinkPad E15 20T8000YMH
Acer Swift 3 SF314-42-R8WD: AMD Ryzen 5 4500U, 14.00", 1.2 kg
Recensioni esterne » Acer Swift 3 SF314-42-R8WD
MSI Modern 14 B4MW-048: AMD Ryzen 5 4500U, 14.00", 1.3 kg
Recensioni esterne » MSI Modern 14 B4MW-048
Acer Aspire 5 A515-44-R41B: AMD Ryzen 5 4500U, 15.60", 1.8 kg
Recensioni esterne » Acer Aspire 5 A515-44-R41B
Honor MagicBook 14, Ryzen 5 4500U: AMD Ryzen 5 4500U, 14.00", 1.4 kg
Recensioni esterne » Honor MagicBook 14, Ryzen 5 4500U
Honor MagicBook Pro (AMD): AMD Ryzen 5 4600H, 16.10", 1.7 kg
Recensioni esterne » Honor MagicBook Pro 4600H
HP Envy x360 13-ay0800no: AMD Ryzen 5 4500U, 13.30", 1.3 kg
Recensioni esterne » HP Envy x360 13-ay0800no
Lenovo IdeaPad 5 14ARE05-81YM000JCK: AMD Ryzen 5 4500U, 14.00", 1.5 kg
Recensioni esterne » Lenovo IdeaPad 5 14ARE05-81YM000JCK
Acer Swift 3 SF314-42-R4VD: AMD Ryzen 5 4500U, 14.00", 1.2 kg
Recensioni esterne » Acer Swift 3 SF314-42-R4VD
Asus ZenBook 14 UM425IA-HM067R: AMD Ryzen 5 4500U, 14.00", 1.1 kg
Recensioni esterne » Asus ZenBook 14 UM425IA-HM067R
Lenovo ThinkPad T14-20UD0010GE: AMD Ryzen 5 PRO 4650U, 14.00", 1.5 kg
Recensioni esterne » Lenovo ThinkPad T14-20UD0010GE
Asus VivoBook S15 M533IA-BQ034T: AMD Ryzen 5 4500U, 15.60", 1.8 kg
Recensioni esterne » Asus VivoBook S15 M533IA-BQ034T
HP Envy x360 13-ay0010nr: AMD Ryzen 5 4500U, 13.30", 1.3 kg
Recensioni esterne » HP Envy x360 13-ay0010nr
Lenovo IdeaPad 5 14ARE05-81YM007EMH: AMD Ryzen 5 4500U, 14.00", 1.4 kg
Recensioni esterne » Lenovo IdeaPad 5 14ARE05-81YM007EMH
Acer Swift 3 SF314-42-R8ZV: AMD Ryzen 5 4500U, 14.00", 1.2 kg
Recensioni esterne » Acer Swift 3 SF314-42-R8ZV
HP Envy x360 13-ay0001nd: AMD Ryzen 5 4500U, 13.30", 1.3 kg
Recensioni esterne » HP Envy x360 13-ay0001nd
Lenovo IdeaPad 5 14ARE05: AMD Ryzen 5 4500U, 14.00", 1.4 kg
Recensioni esterne » Lenovo IdeaPad 5 14ARE05
Lenovo Yoga Slim 7 14ARE05, Ryzen 5 4500U: AMD Ryzen 5 4500U, 14.00", 1.3 kg
Recensioni esterne » Lenovo Yoga Slim 7 14ARE05, Ryzen 5 4500U
Lenovo IdeaPad Flex 5 14ARE05-81X2006QMH: AMD Ryzen 5 4500U, 14.00"
Recensioni esterne » Lenovo IdeaPad Flex 5 14ARE05-81X2006QMH
Lenovo IdeaPad Flex 5 14ARE05-81X2003MMH: AMD Ryzen 5 4500U, 14.00", 1.5 kg
Recensioni esterne » Lenovo IdeaPad Flex 5 14ARE05-81X2003MMH
HP Envy x360 13-ay0001ns: AMD Ryzen 5 4500U, 13.30", 1.3 kg
Recensioni esterne » HP Envy x360 13-ay0001ns
Lenovo IdeaPad 5 15ARE05-81YQ002BMH: AMD Ryzen 5 4500U, 15.60", 1.6 kg
Recensioni esterne » Lenovo IdeaPad 5 15ARE05-81YQ002BMH
Lenovo ThinkPad X13 AMD, Ryzen 5 Pro 4650U: AMD Ryzen 5 PRO 4650U, 13.30", 1.3 kg
Recensioni esterne » Lenovo ThinkPad X13 AMD, Ryzen 5 Pro 4650U
Lenovo IdeaPad Flex 5 14 AMD 81X20005US: AMD Ryzen 5 4500U, 14.00", 1.7 kg
Recensioni esterne » Lenovo Flex 5 14 AMD 81X20005US
Acer Swift 3 SF314-42-R1PR: AMD Ryzen 5 4500U, 14.00", 1.2 kg
Recensioni esterne » Acer Swift 3 SF314-42-R1PR
HP ProBook x360 435 G7, Ryzen 5 4500U: AMD Ryzen 5 4500U, 13.30", 1.4 kg
Recensioni esterne » HP ProBook x360 435 G7, Ryzen 5 4500U
Lenovo IdeaPad 3 15ALC6: AMD Ryzen 3 5300U, 15.60", 1.7 kg
» AMD Ryzen 3 5300U sottoposto a benchmark: Intel Core i3 ha tutte le ragioni per preoccuparsi
Honor MagicBook 14, Ryzen 5 4500U: AMD Ryzen 5 4500U, 14.00", 1.4 kg
» Honor MagicBook 14: Ryzen 5 con prestazioni al top
Lenovo IdeaPad S540-13ARE-82DL000YGE: AMD Ryzen 5 4600U, 13.30", 1.3 kg
» Lenovo IdeaPad S540 da 13": l'AMD Ryzen assicura un'ottima valutazione nonostante i tagli
Lenovo ThinkPad T14-20UES00H00: AMD Ryzen 5 PRO 4650U, 14.00", 1.5 kg
» Anche il ThinkPad T14 di Lenovo è migliore con AMD Ryzen
HP EliteBook 845 G7-23Y60EA: AMD Ryzen 5 PRO 4650U, 14.00", 1.5 kg
» HP EliteBook 845 G7: computer portatile top ma soffre di un display troppo scuro
Honor MagicBook Pro (AMD): AMD Ryzen 5 4600H, 16.10", 1.7 kg
» Honor offre un buon portatile multimediale ad un prezzo equo con il MagicBook Pro