Ryzen 3 supera il Core i3: recensione del portatile Lenovo IdeaPad 3 15ALC6
La famiglia IdeaPad 3 è la casa dei modelli di laptop di fascia bassa che si trovano sotto le famiglie già economiche IdeaPad 5 e IdeaPad 7. Se hai un budget molto ristretto, allora i bassi prezzi di partenza di un IdeaPad 3 possono sembrare attraenti.
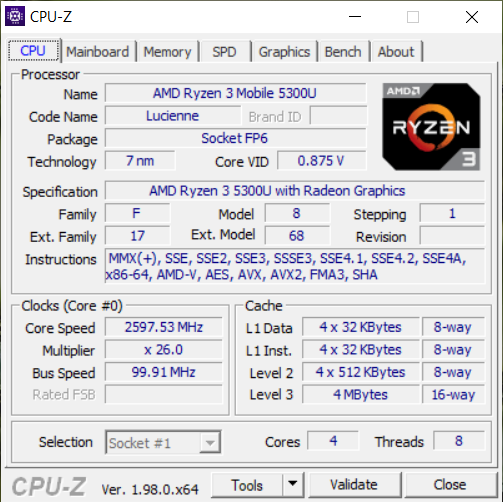
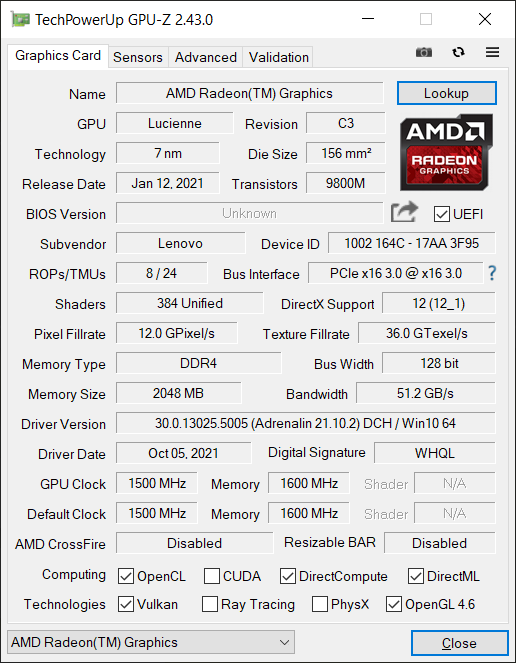
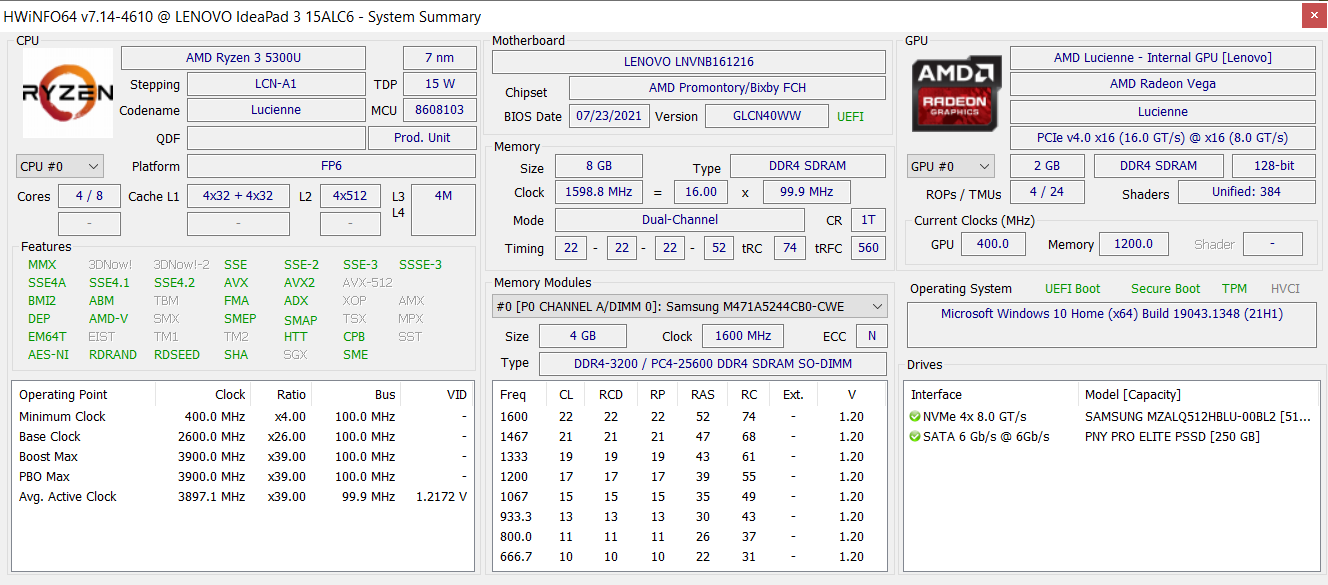
La nostra unità di test è dotata di CPU quad-core Ryzen 3 5300U Zen 2, 8 GB di RAM, display IPS 1080p e 512 GB di SSD PCIe3 NVMe per circa 539 dollari al dettaglio o anche meno se in vendita. SKU di fascia più alta possono essere disponibili con Ryzen 5 5500U o Ryzen 7 5700U e con più RAM o storage. I concorrenti dell'IdeaPad 3 includono altri portatili consumer economici come HP Pavilion 15, Asus VivoBook F series, Dell Inspiron series, o Acer Aspire 3 series.
Altre recensioni di Lenovo:
Potential Competitors in Comparison
Punteggio | Data | Modello | Peso | Altezza | Dimensione | Risoluzione | Prezzo |
|---|---|---|---|---|---|---|---|
| 80.4 % v7 (old) | 12/2021 | Lenovo IdeaPad 3 15ALC6 R3 5300U, Vega 6 | 1.7 kg | 19.9 mm | 15.60" | 1920x1080 | |
| 83 % v7 (old) | 07/2020 | Lenovo IdeaPad 5 15IIL05 i5-1035G1, GeForce MX350 | 1.7 kg | 17.9 mm | 15.60" | 1920x1080 | |
| 81.4 % v7 (old) | 01/2020 | Lenovo Ideapad S540-15IML i5-10210U, GeForce MX250 | 1.9 kg | 17 mm | 15.60" | 1920x1080 | |
| 80.5 % v7 (old) | 10/2021 | Dell Inspiron 15 3501 i7-1165G7, Iris Xe G7 96EUs | 2 kg | 19.9 mm | 15.60" | 1920x1080 | |
| 81.2 % v7 (old) | 06/2021 | HP Pavilion 15-eg i7-1165G7, GeForce MX450 | 1.7 kg | 17.9 mm | 15.60" | 1920x1080 | |
| 80.5 % v7 (old) | 11/2021 | Asus VivoBook 15 KM513UA-L503TS R5 5500U, Vega 7 | 1.8 kg | 18.6 mm | 15.60" | 1920x1080 |
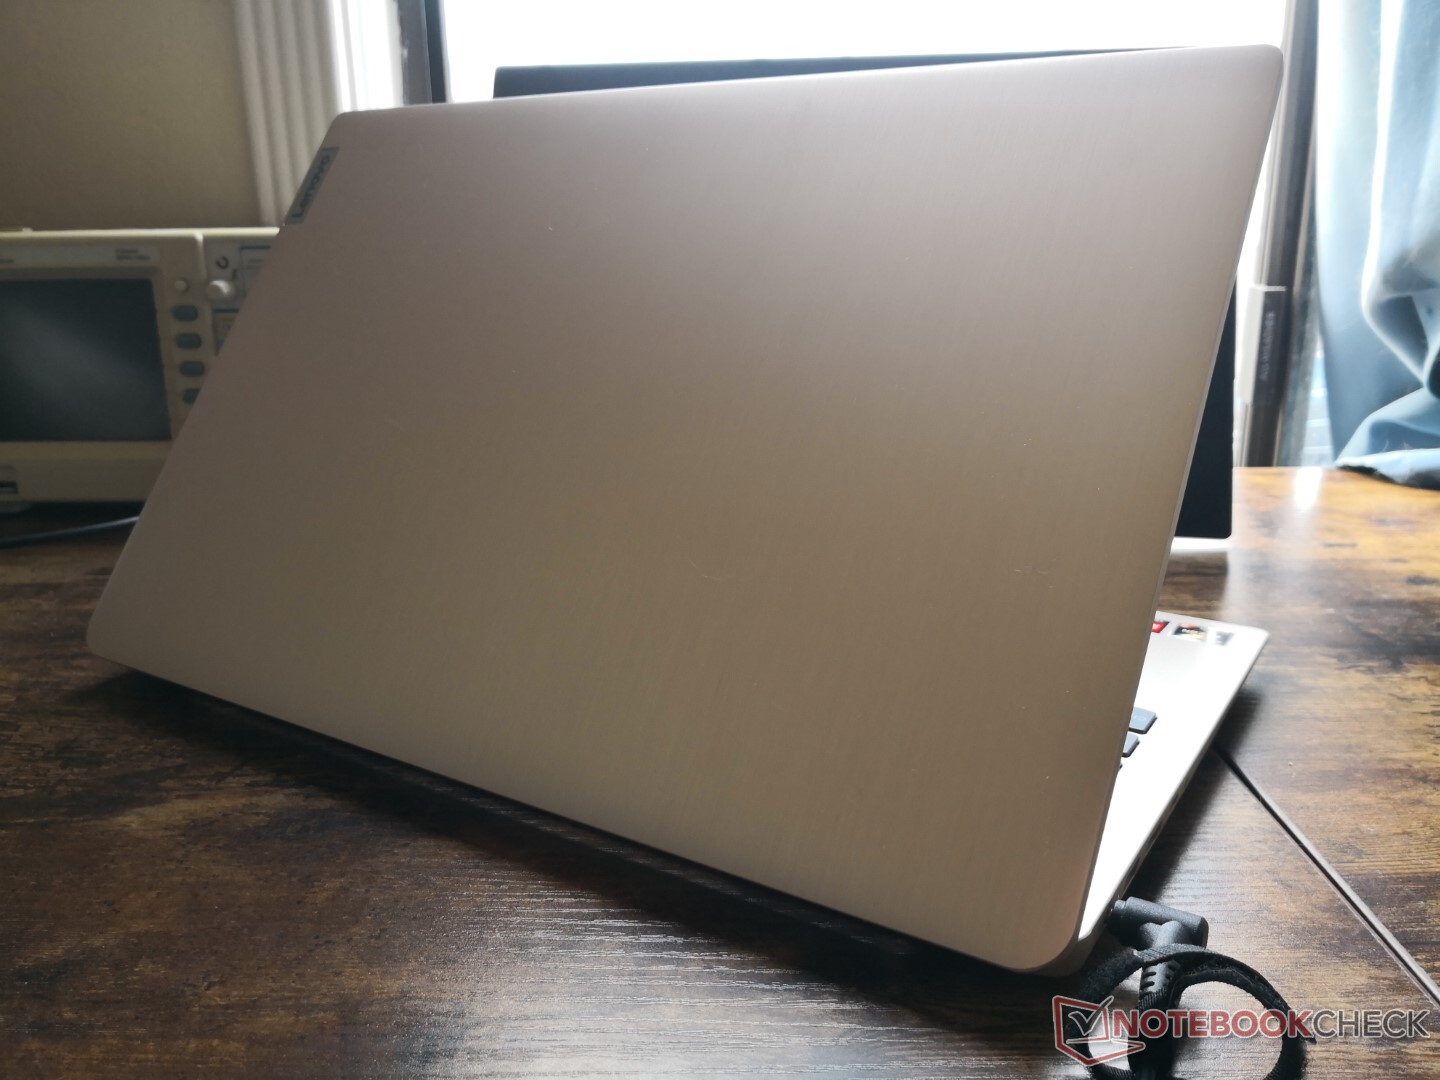
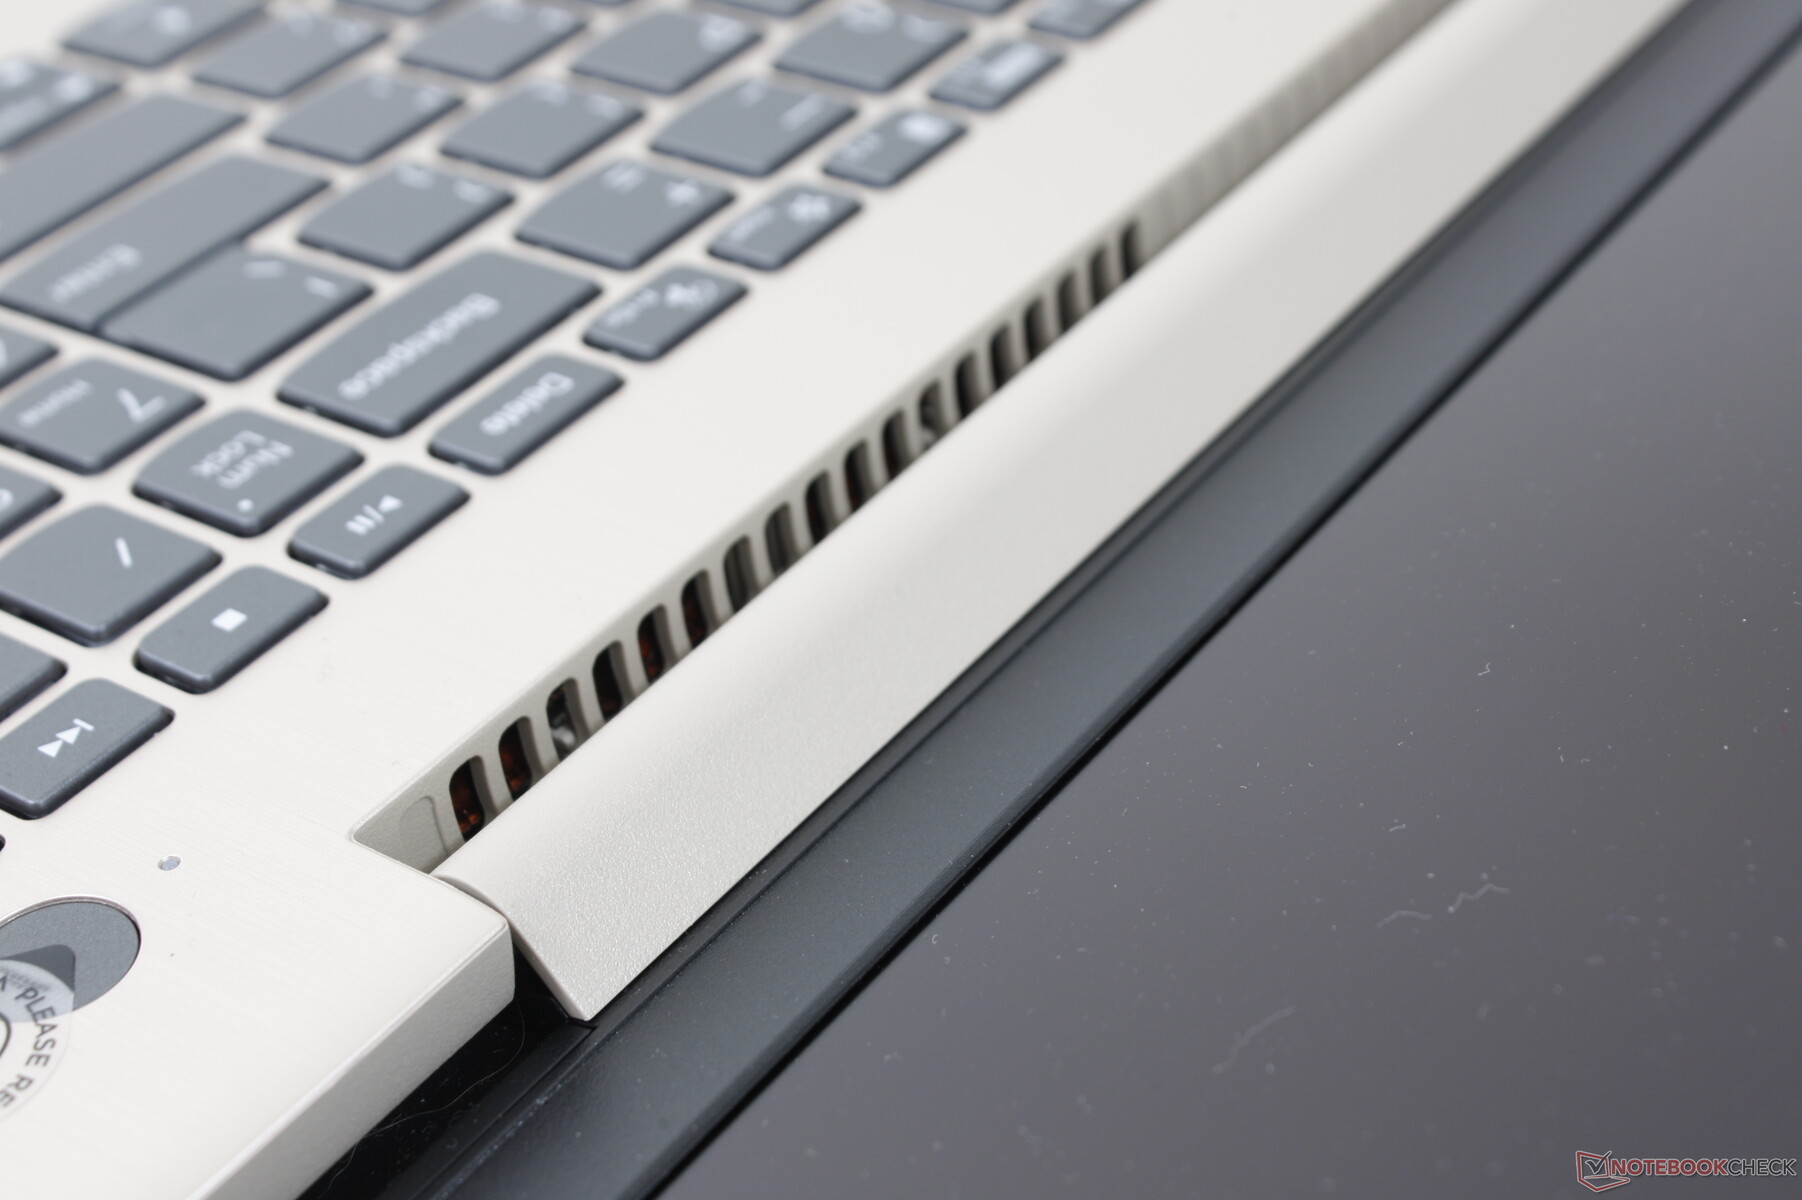
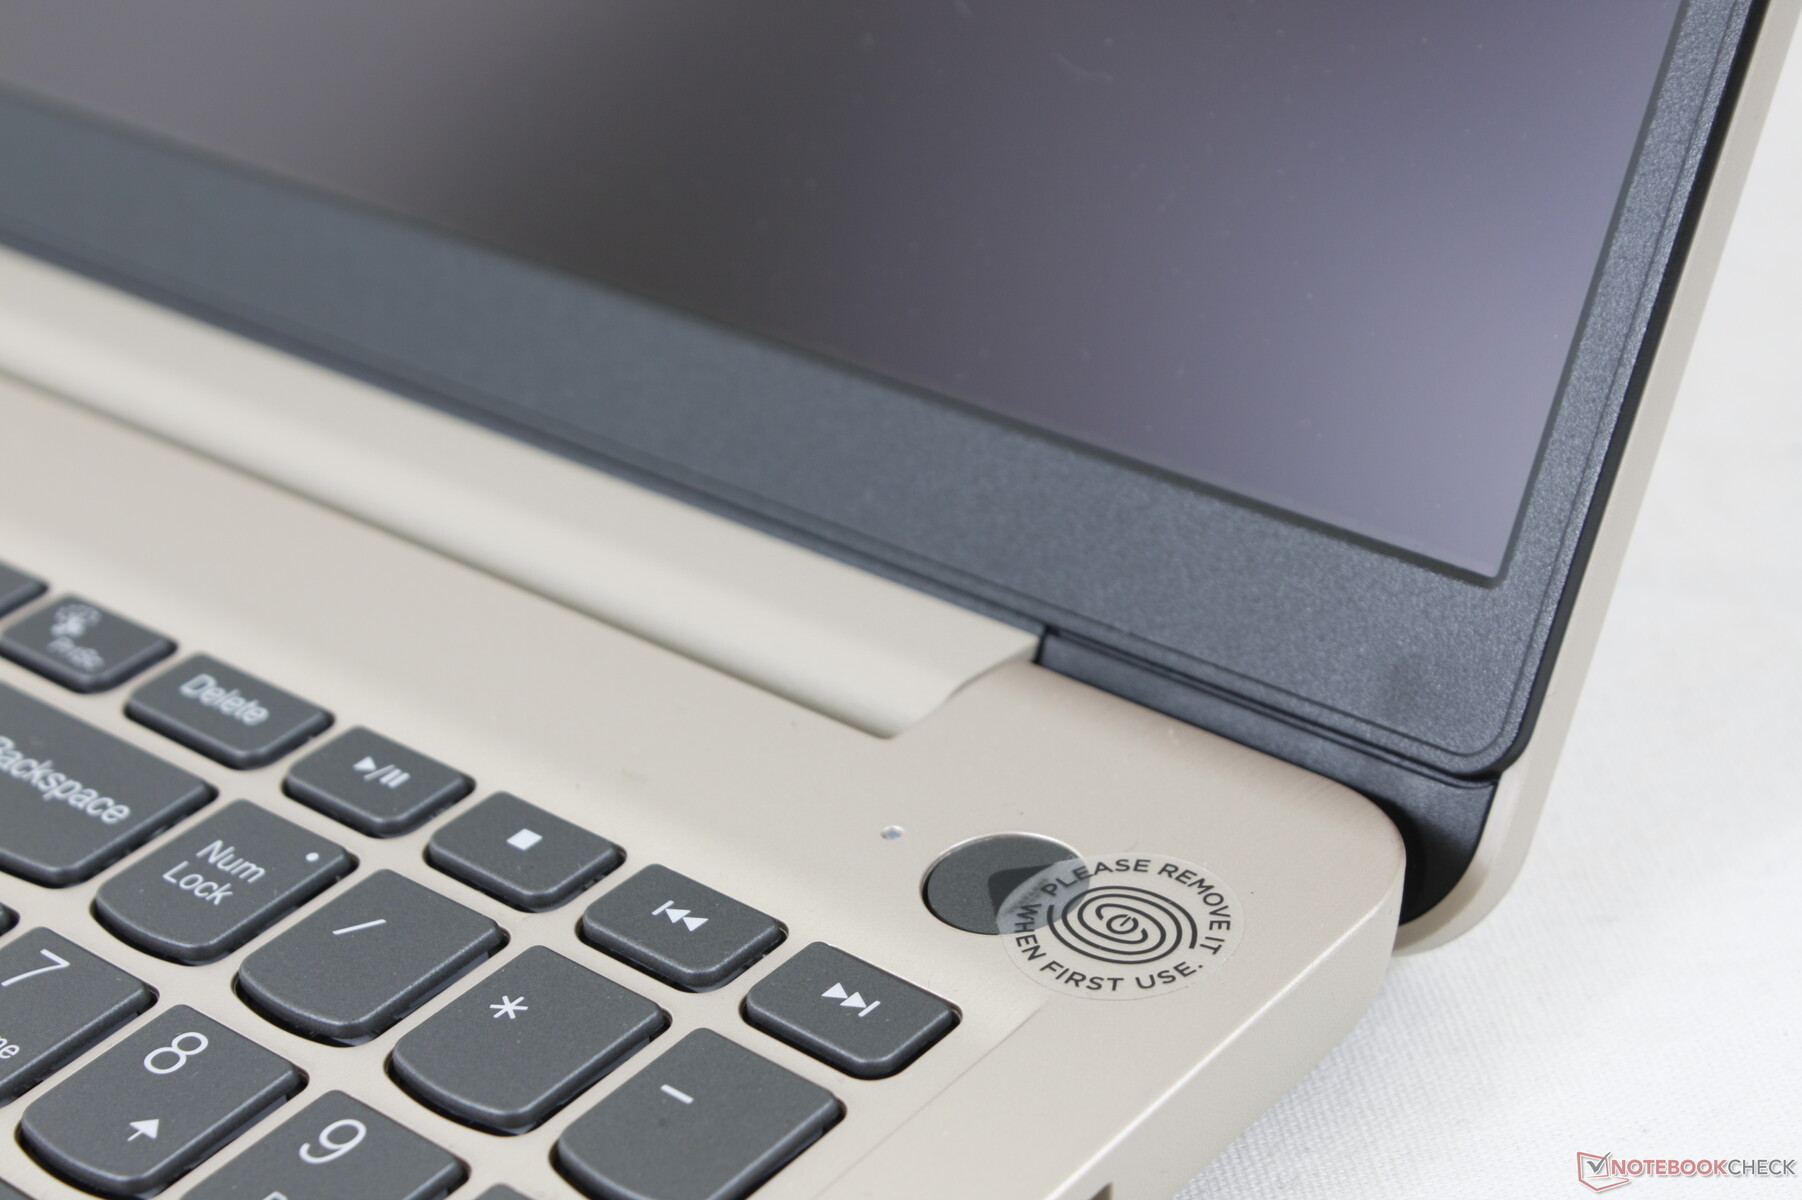
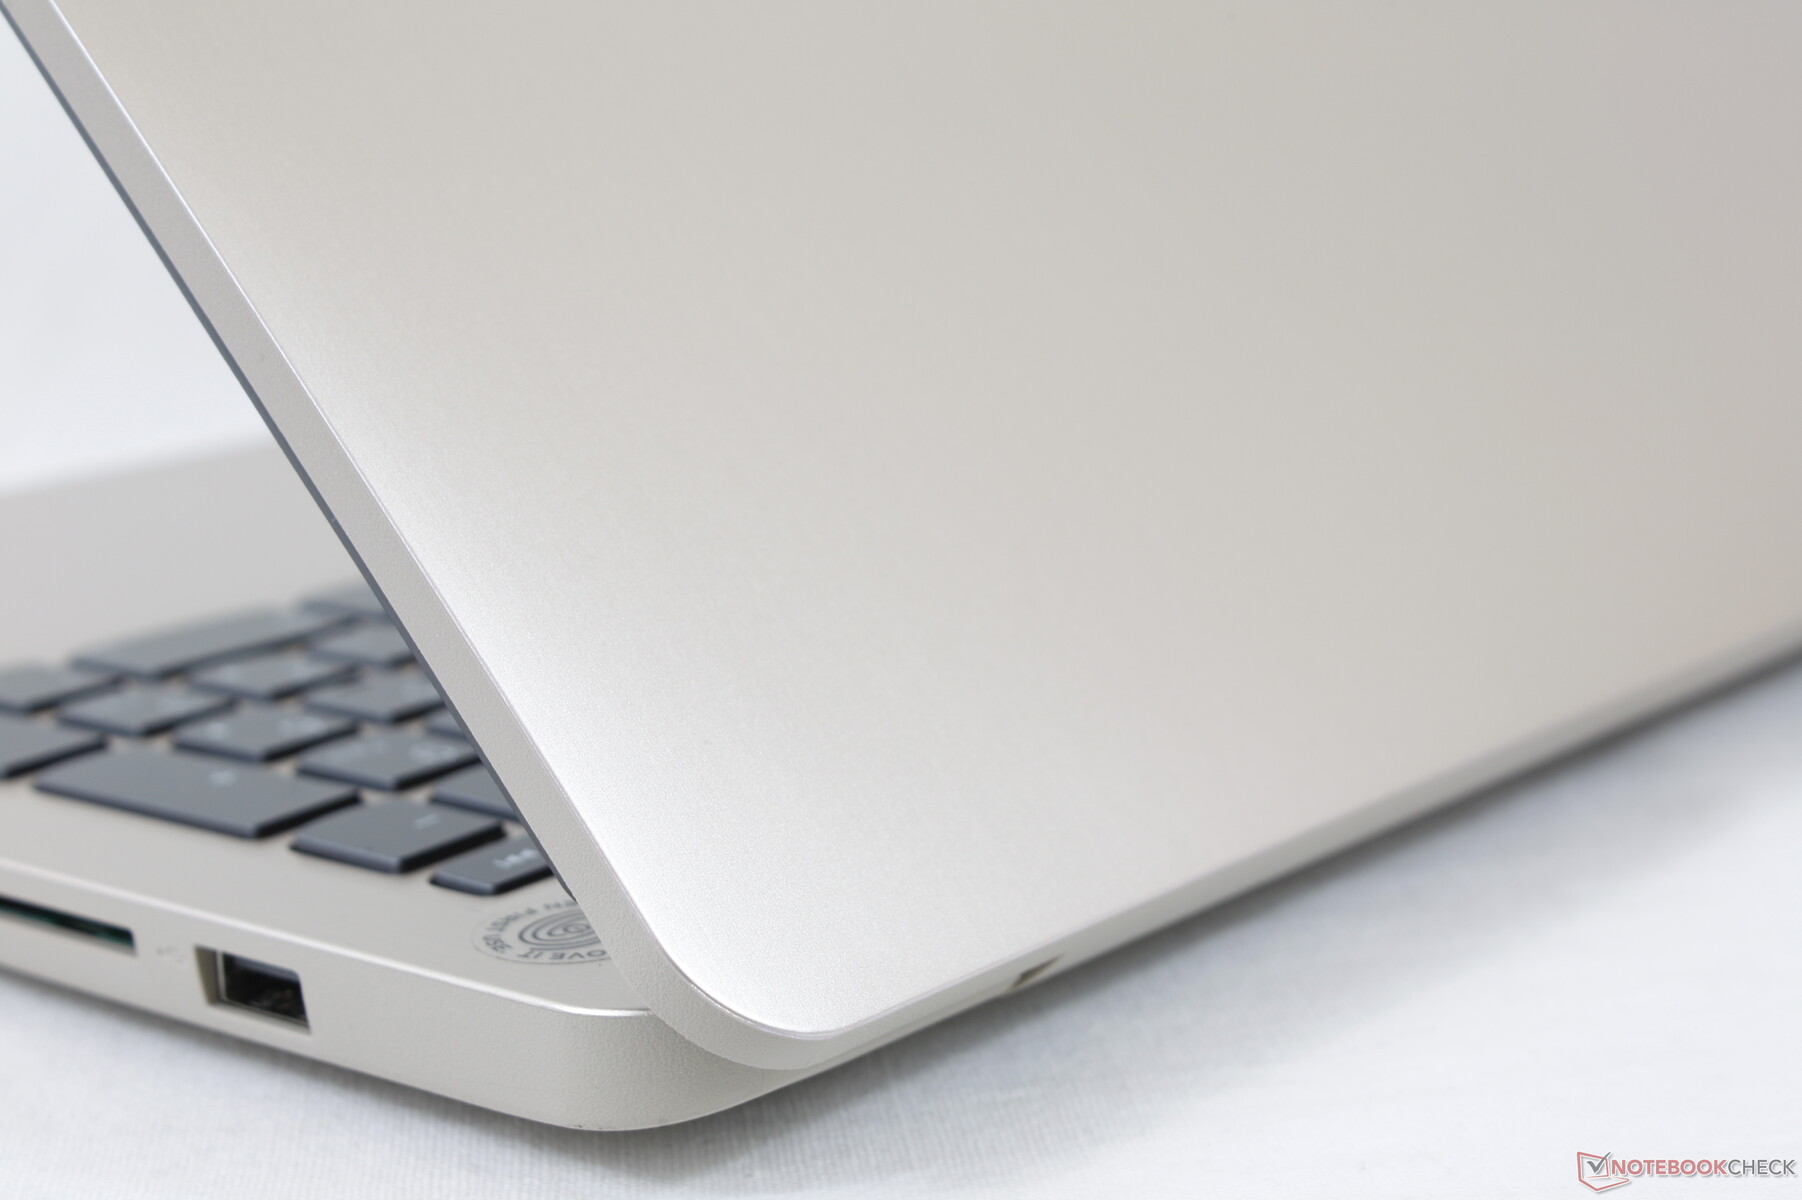
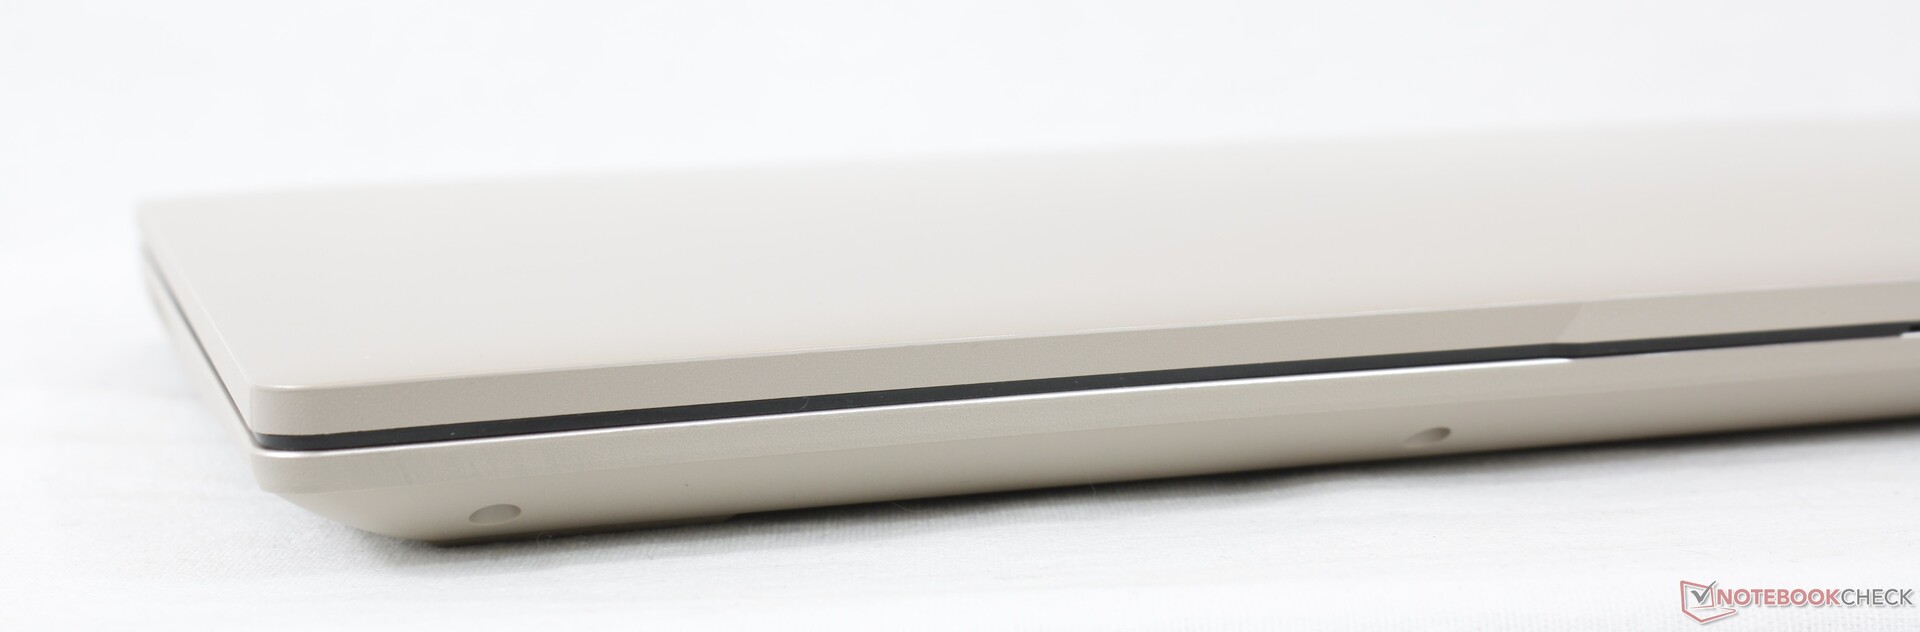
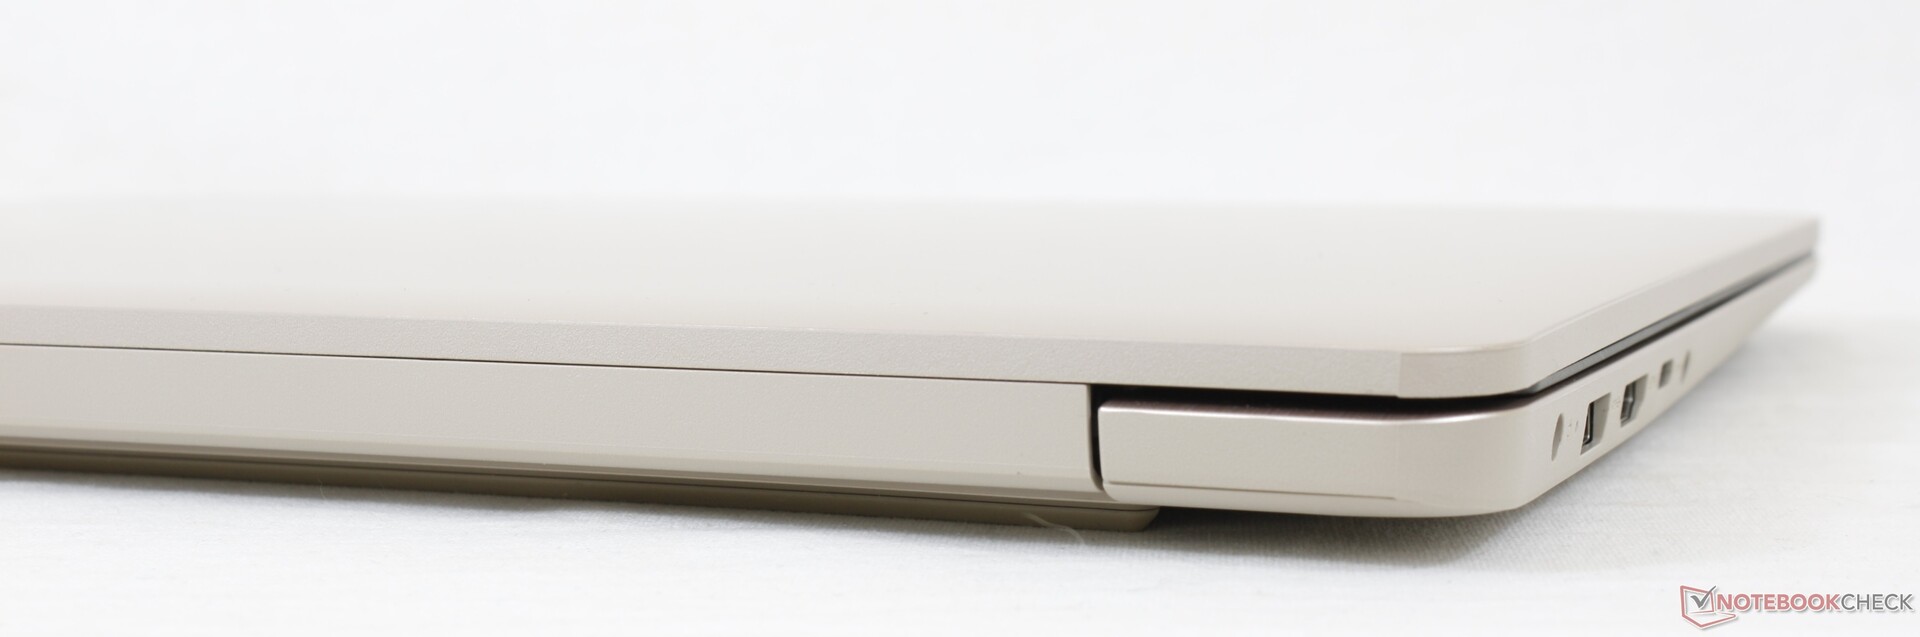
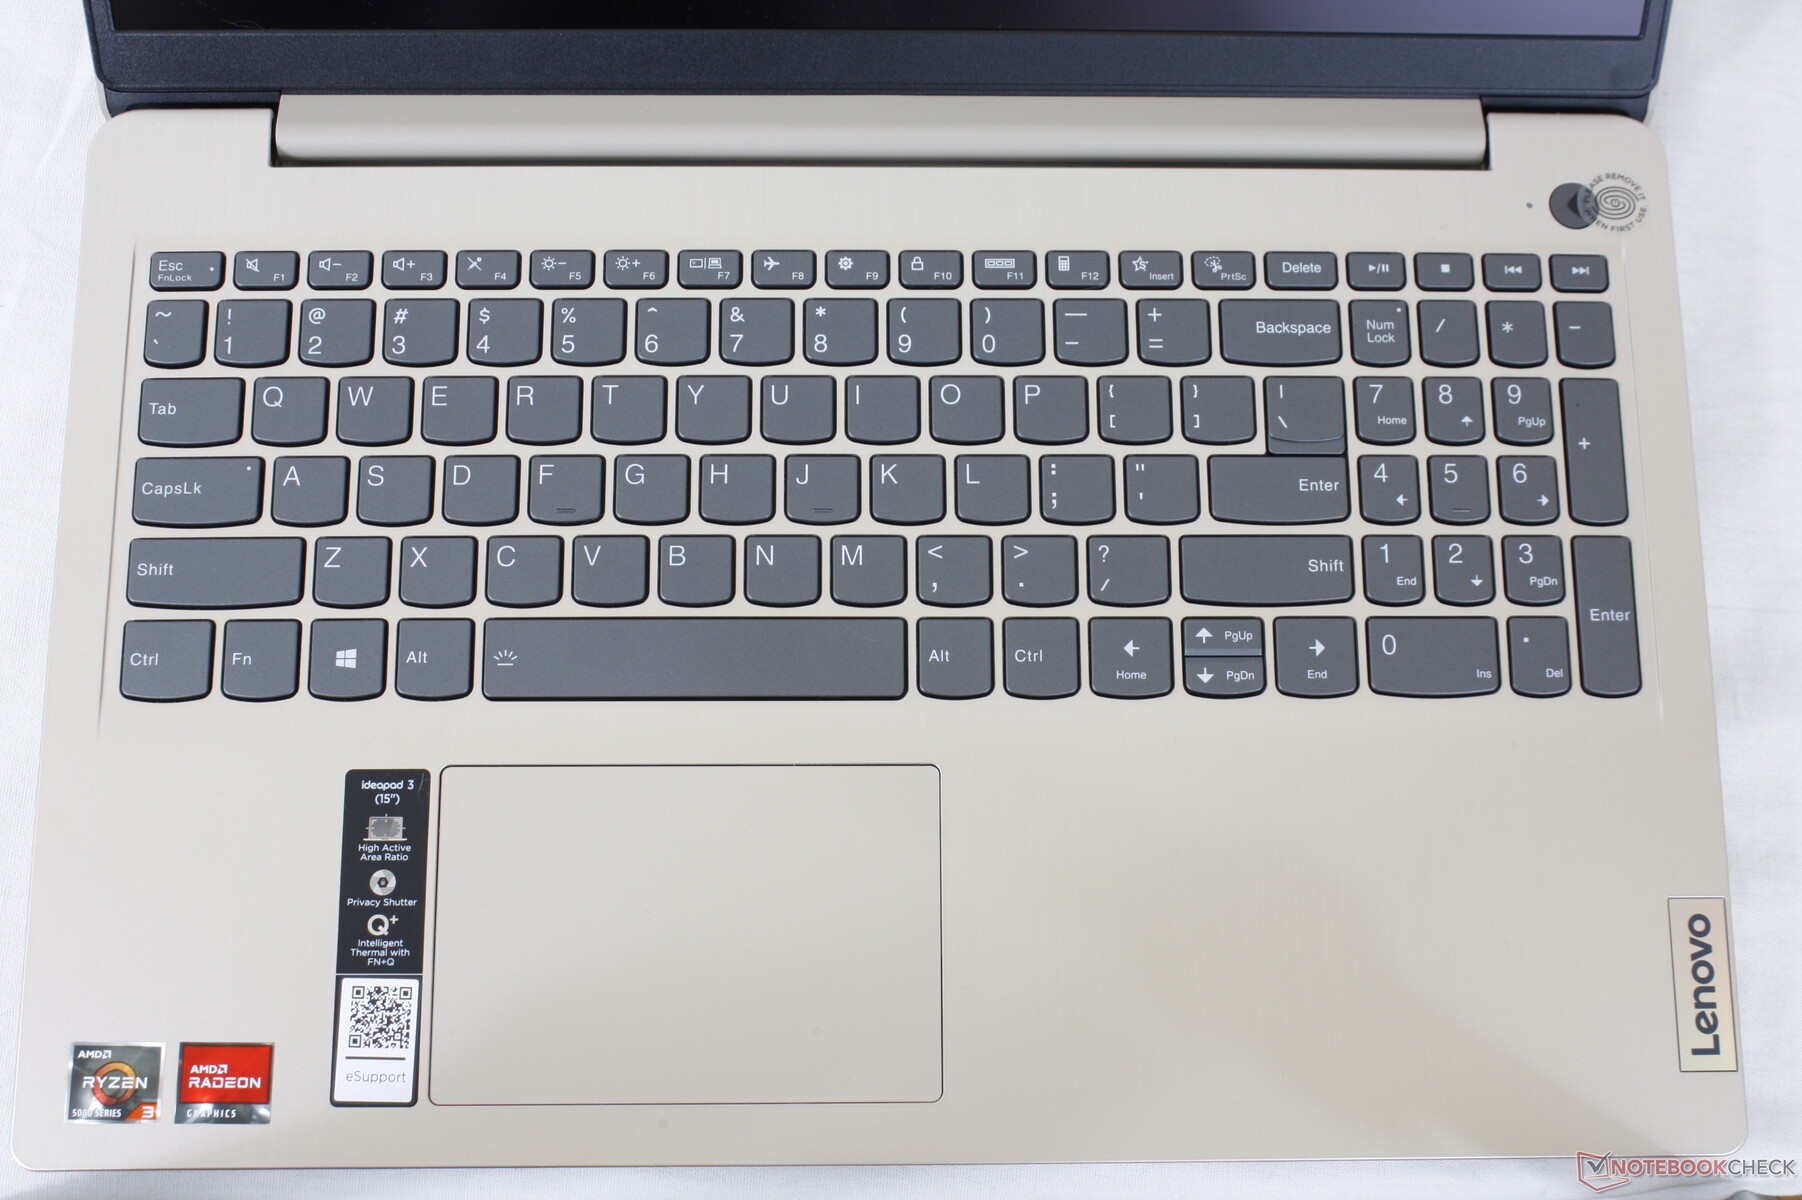
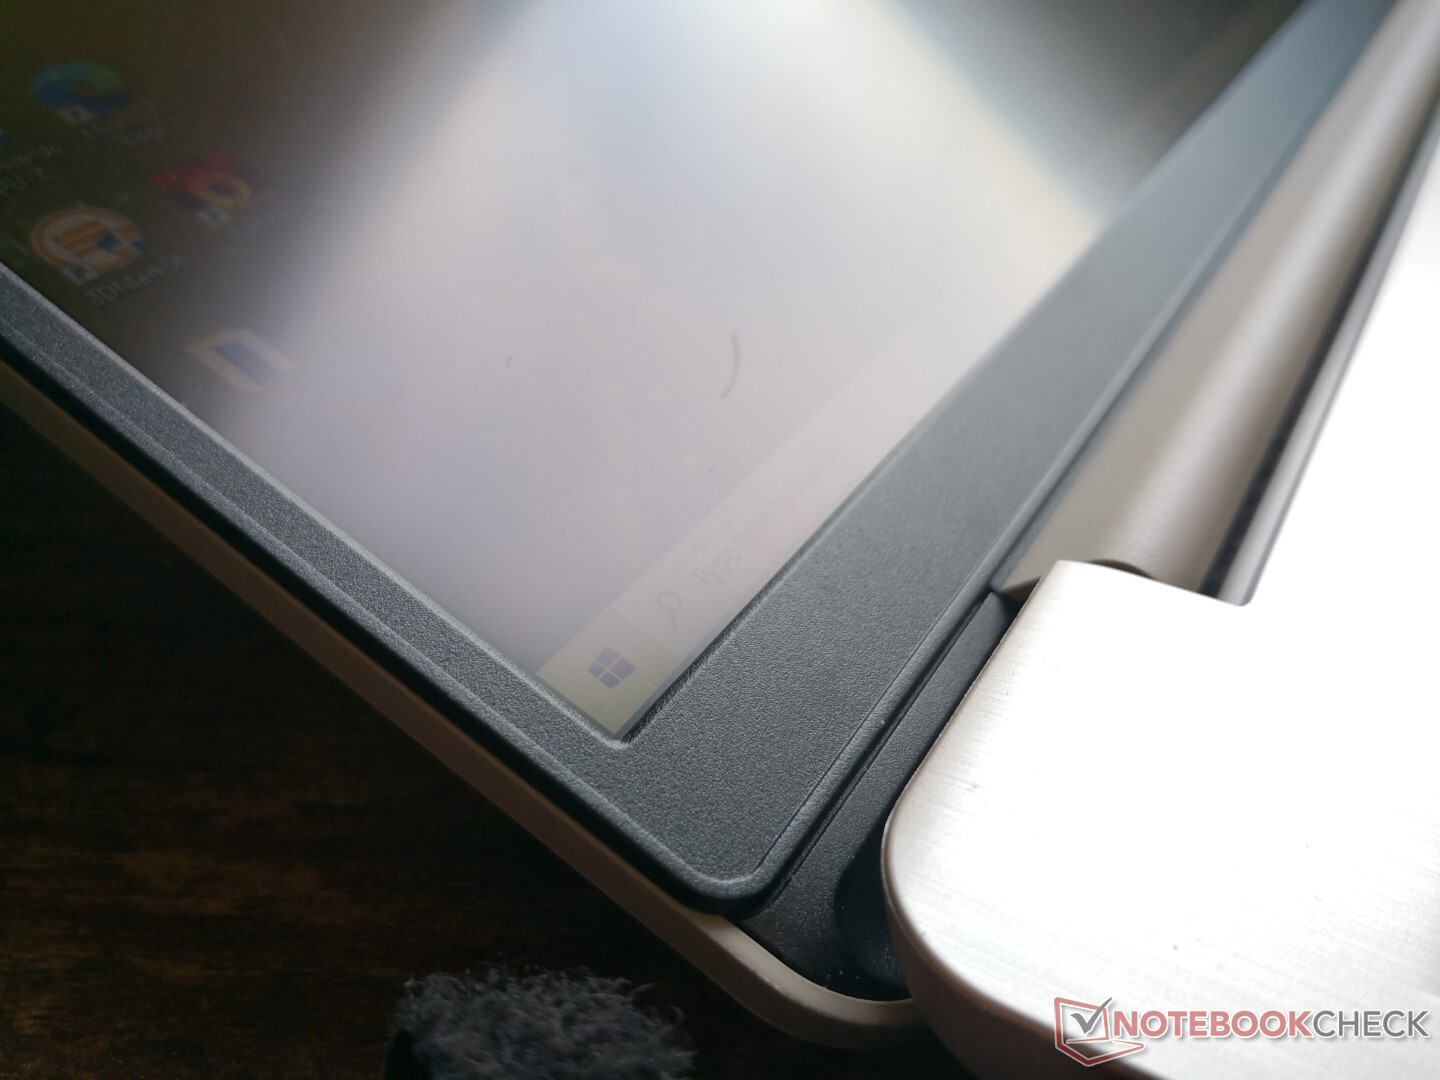
Caso - aspetto economico
Il piano della tastiera e il coperchio esterno utilizzano alluminio spazzolato per una migliore estetica. Tuttavia, il telaio mostra sia flessioni che leggeri ma udibili scricchiolii. La rigidità complessiva è leggermente peggiore rispetto ai modelli concorrenti HP Pavilion 15 o Asus VivoBook 15.
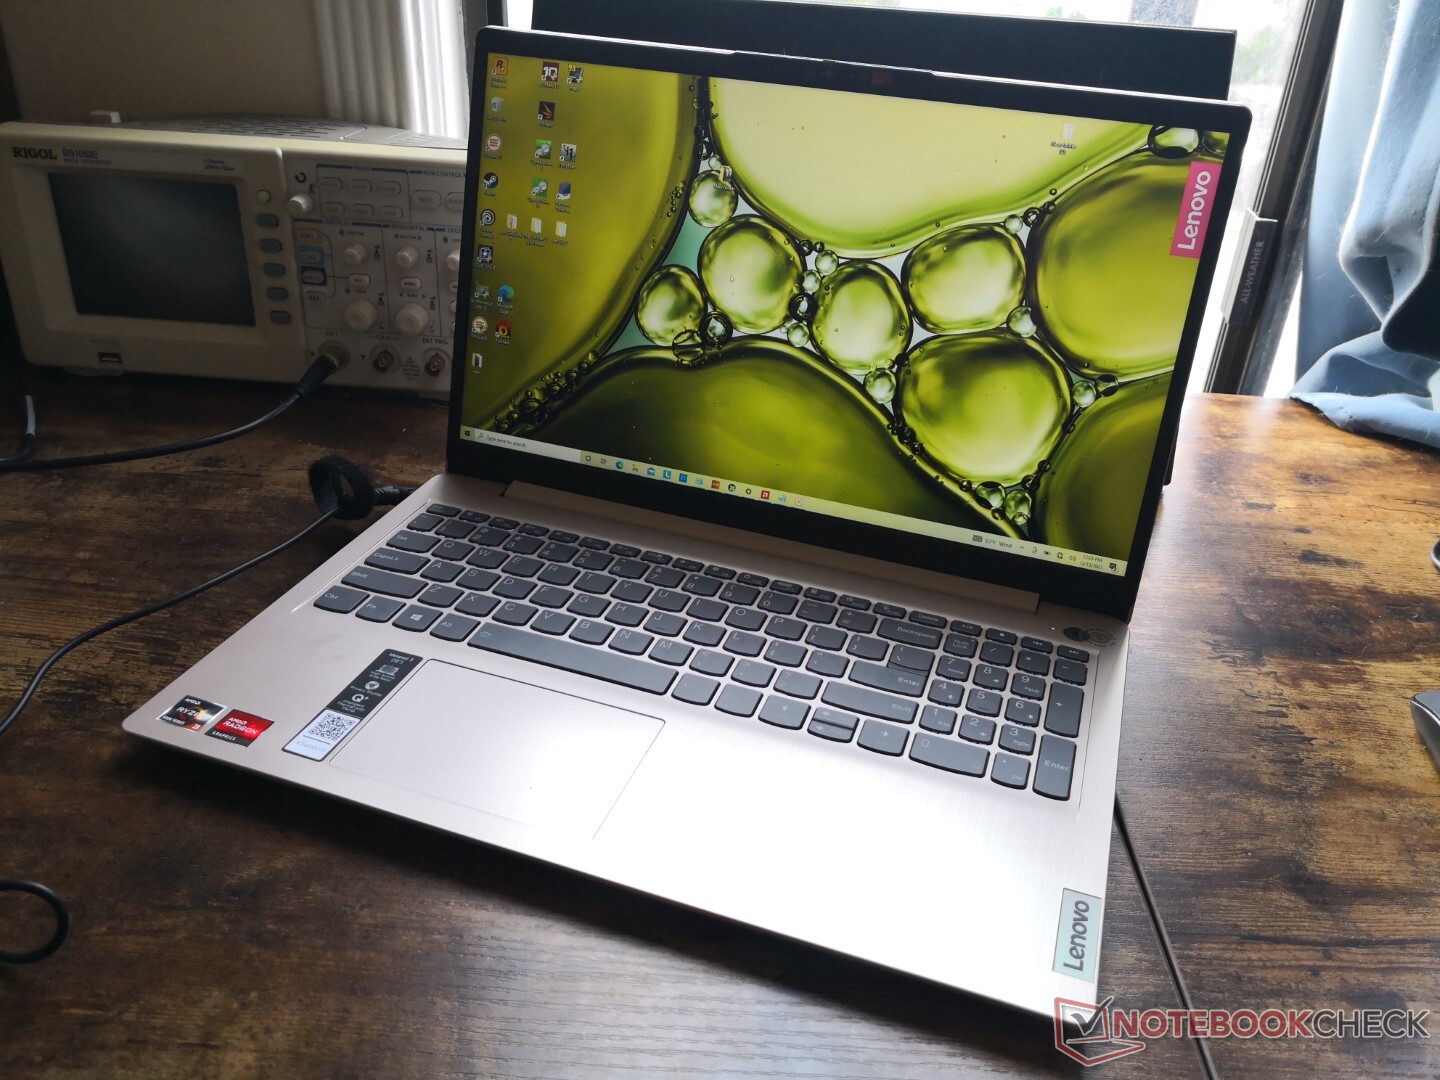
Le dimensioni del telaio sono quasi identiche sia al Pavilion 15 che al VivoBook 15, il che significa che gli utenti non otterranno alcun peso o beneficio di viaggio scegliendo il Lenovo. Il Inspiron 3501 è notevolmente più grande e più pesante di tutti e tre.
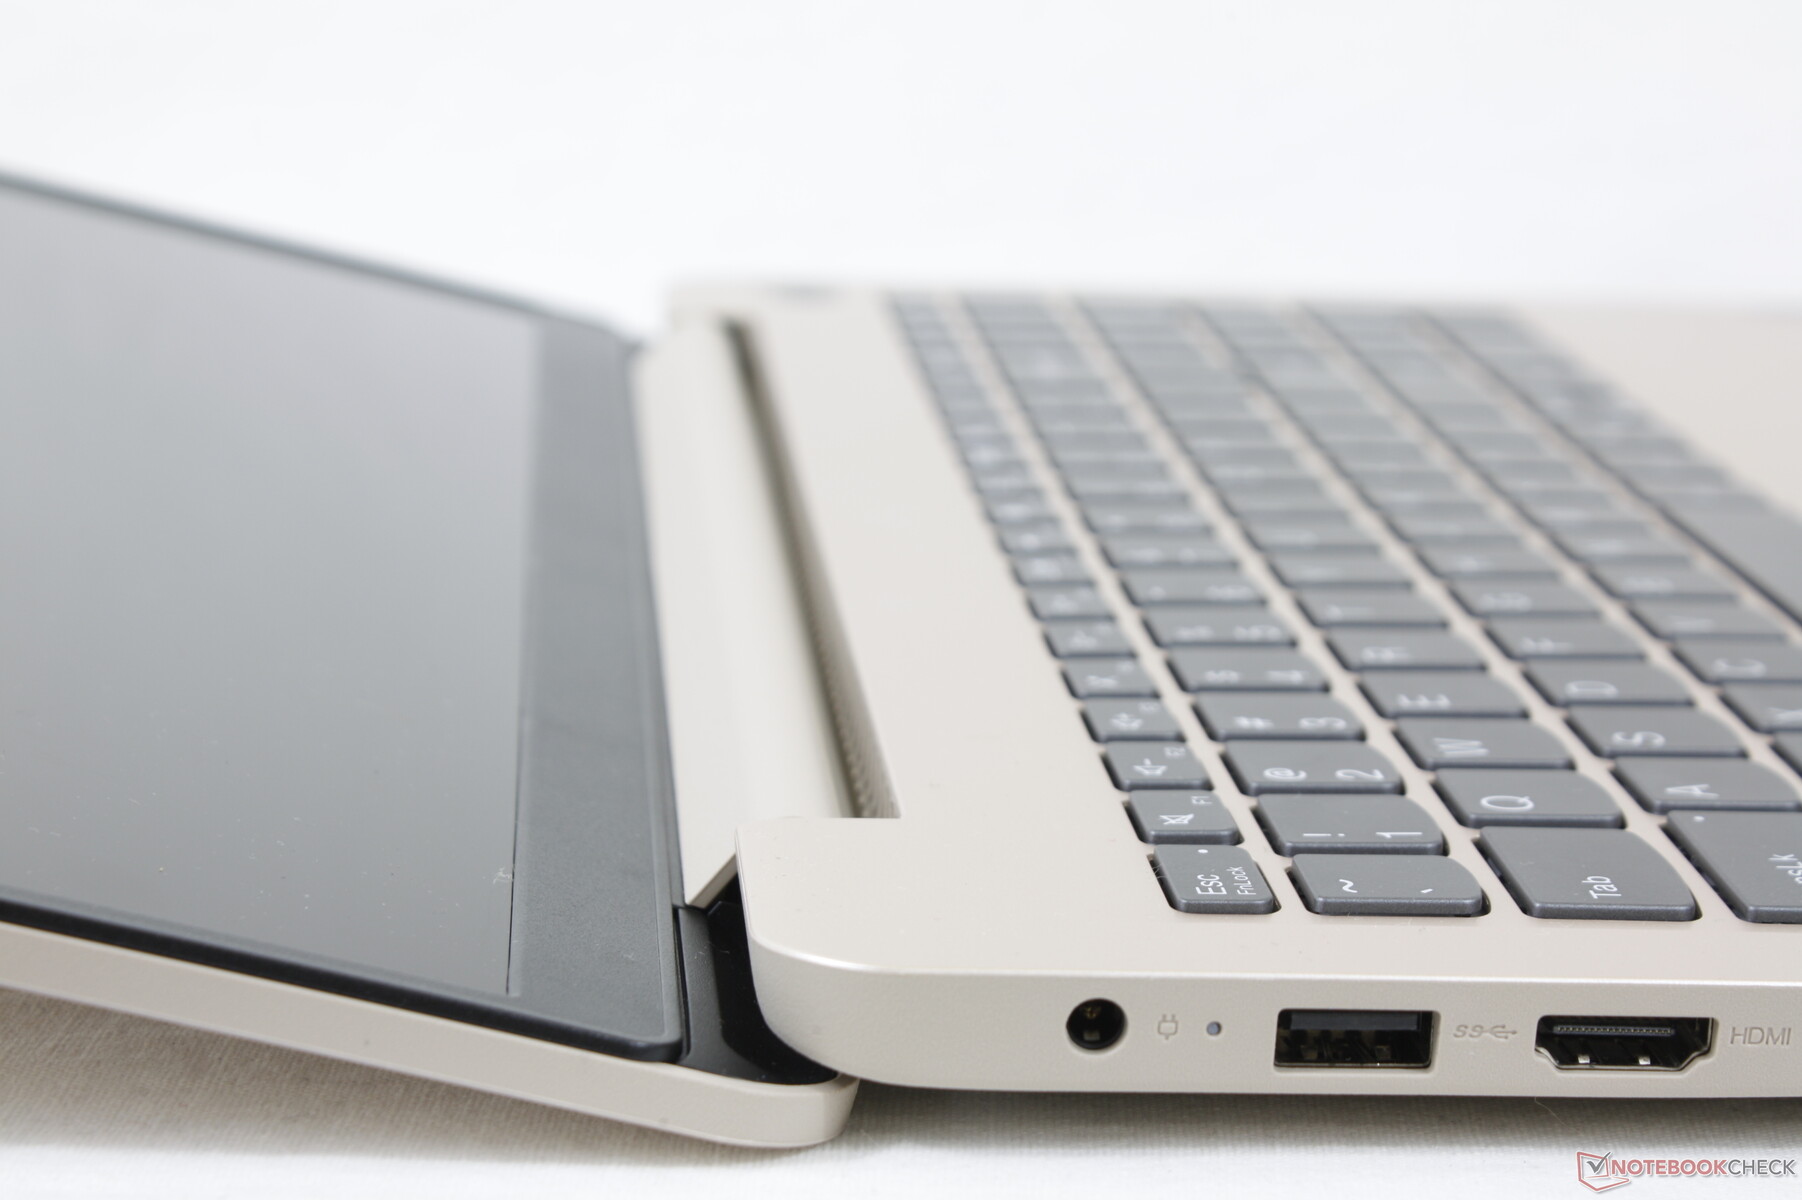
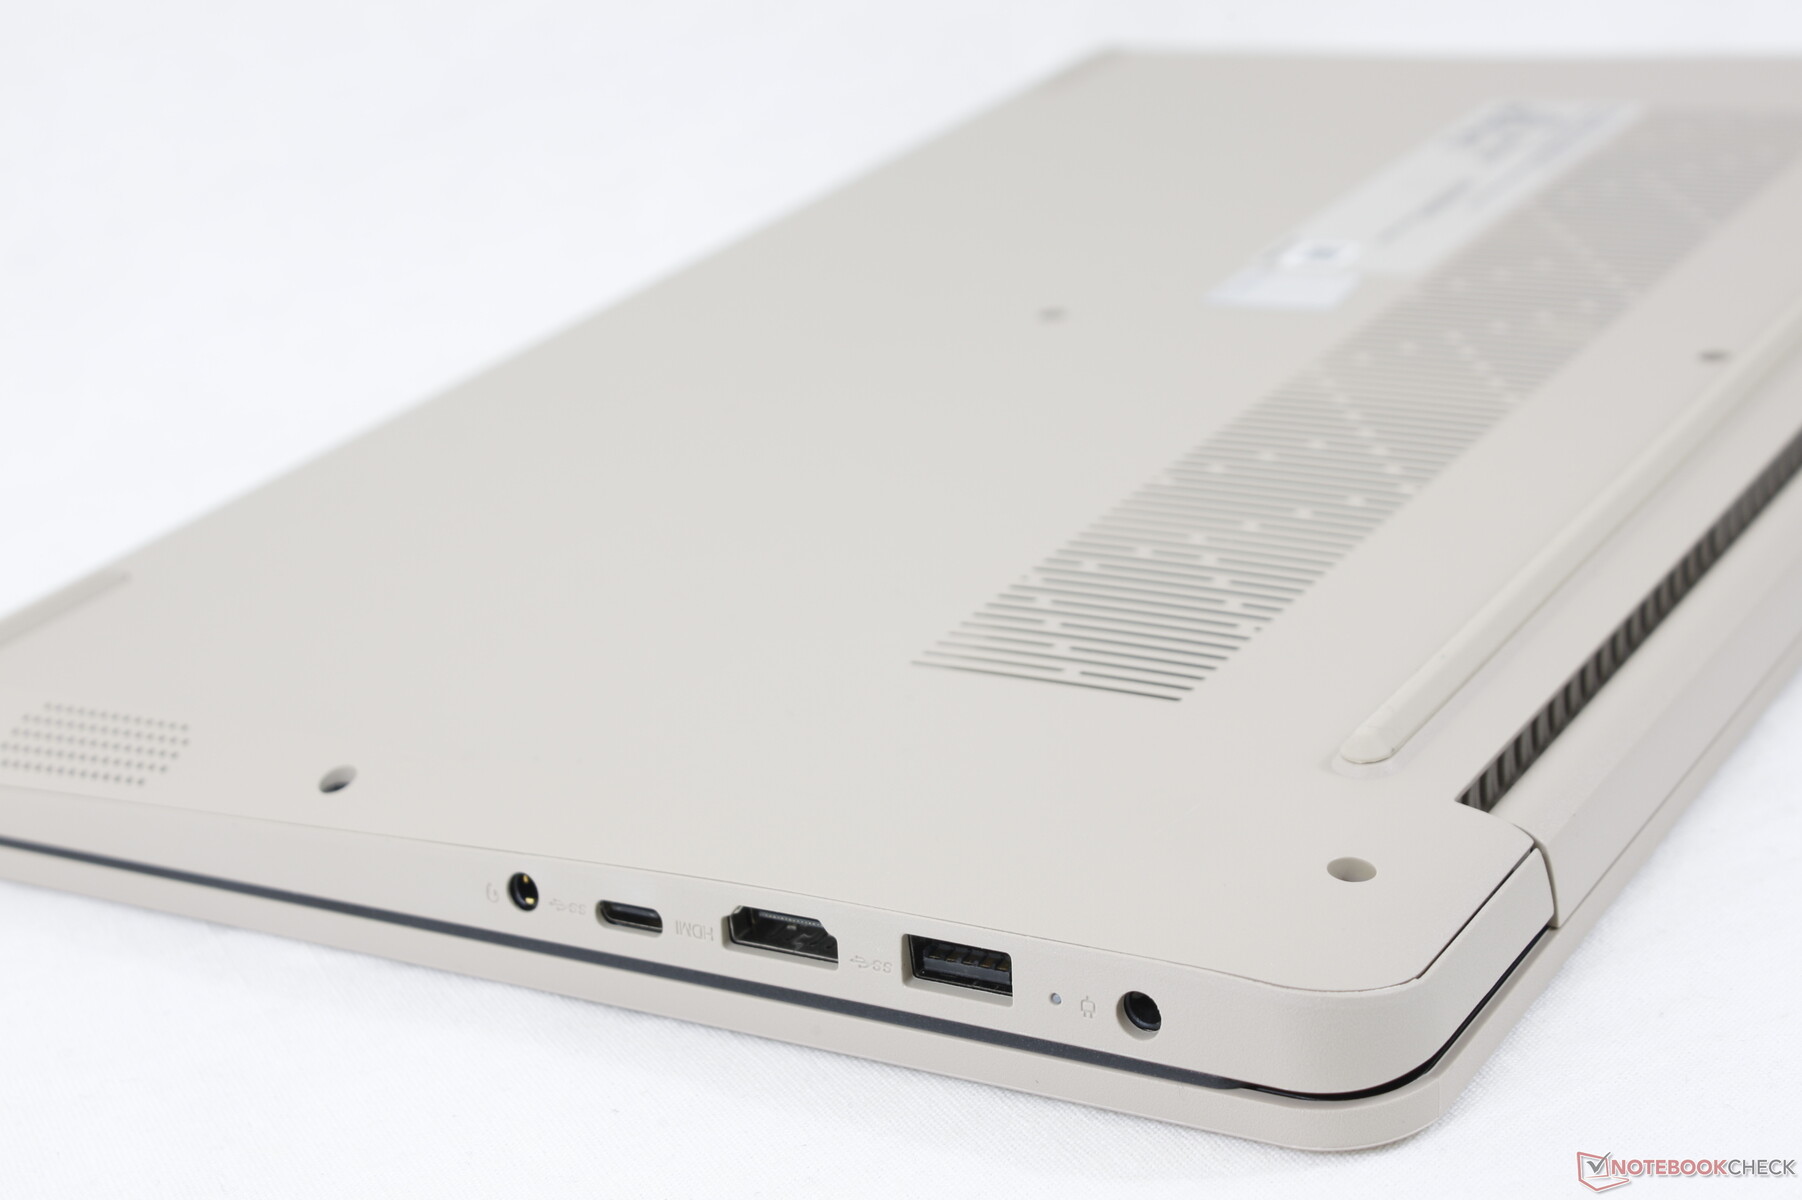
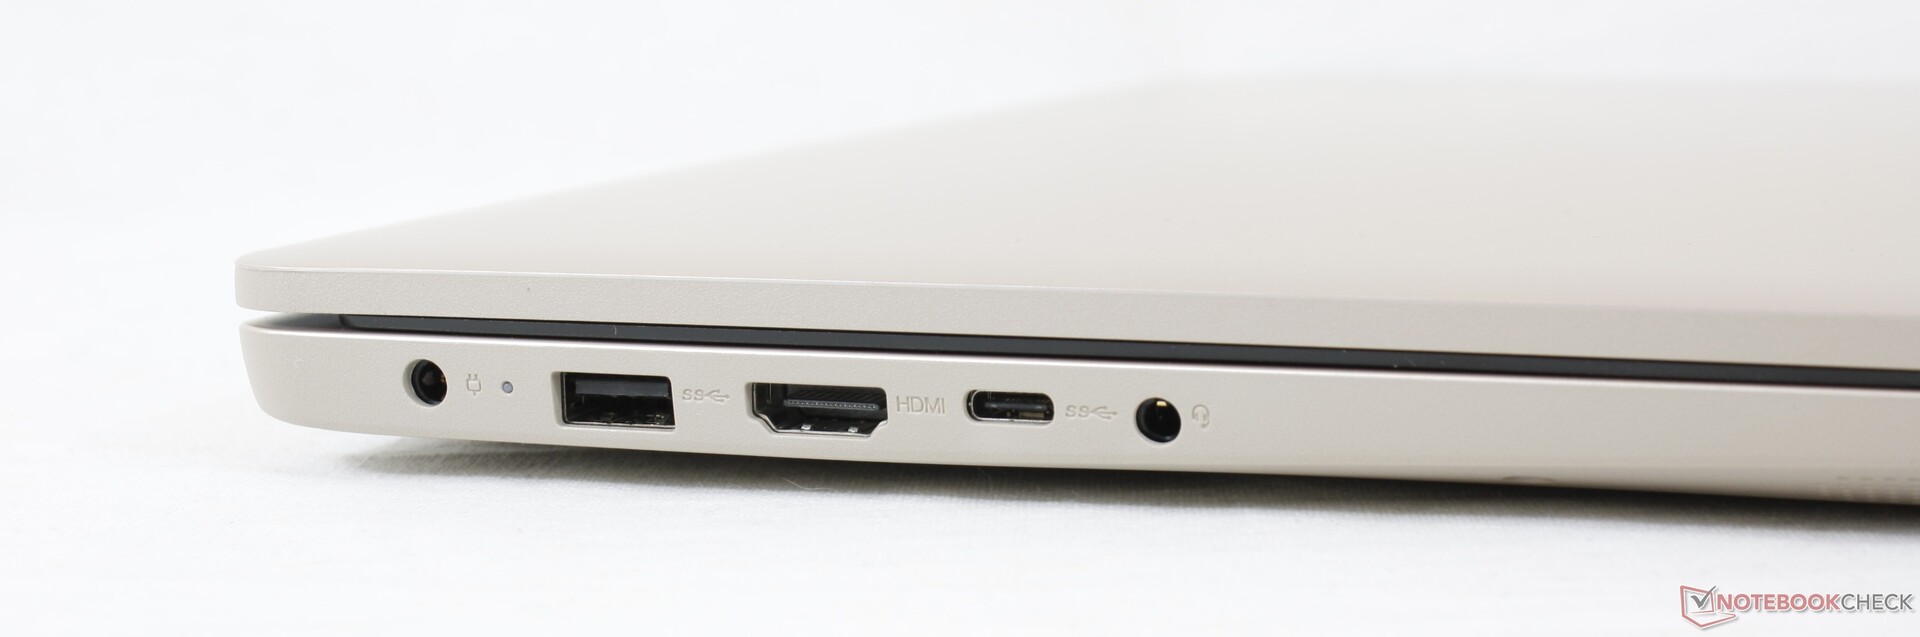
Connettività - Porta USB-C castrata
Le opzioni della porta e il posizionamento sono entrambi diversi da quelli che troverete su altri portatili IdeaPad come l IdeaPad S340, IdeaPad 3 14,IdeaPad S540, o l'IdeaPad 5 15. Forse la cosa più importante da tenere a mente è che la singola porta USB-C non supporta Power Delivery o DisplayPort a differenza delle porte USB-C sulla maggior parte dei portatili Intel. L'uscita video deve essere fatta invece tramite HDMI.
Vale la pena menzionare che abbiamo avuto problemi di alimentazione quando abbiamo tentato di collegare il nostro SSD esterno PNY Pro Elite alla porta USB-C. Non siamo sicuri se questo sia specifico della nostra unità o un problema più diffuso.
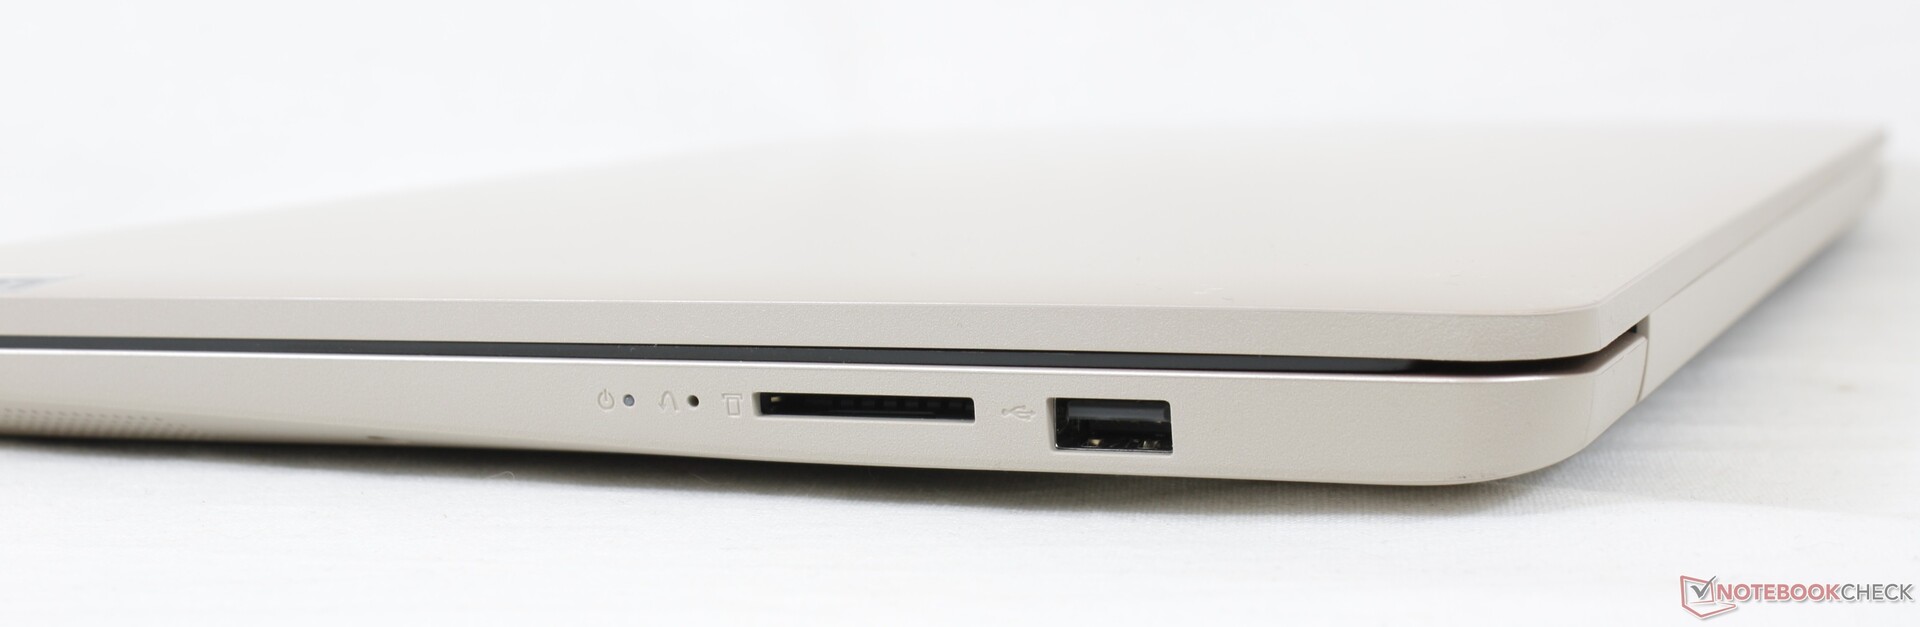
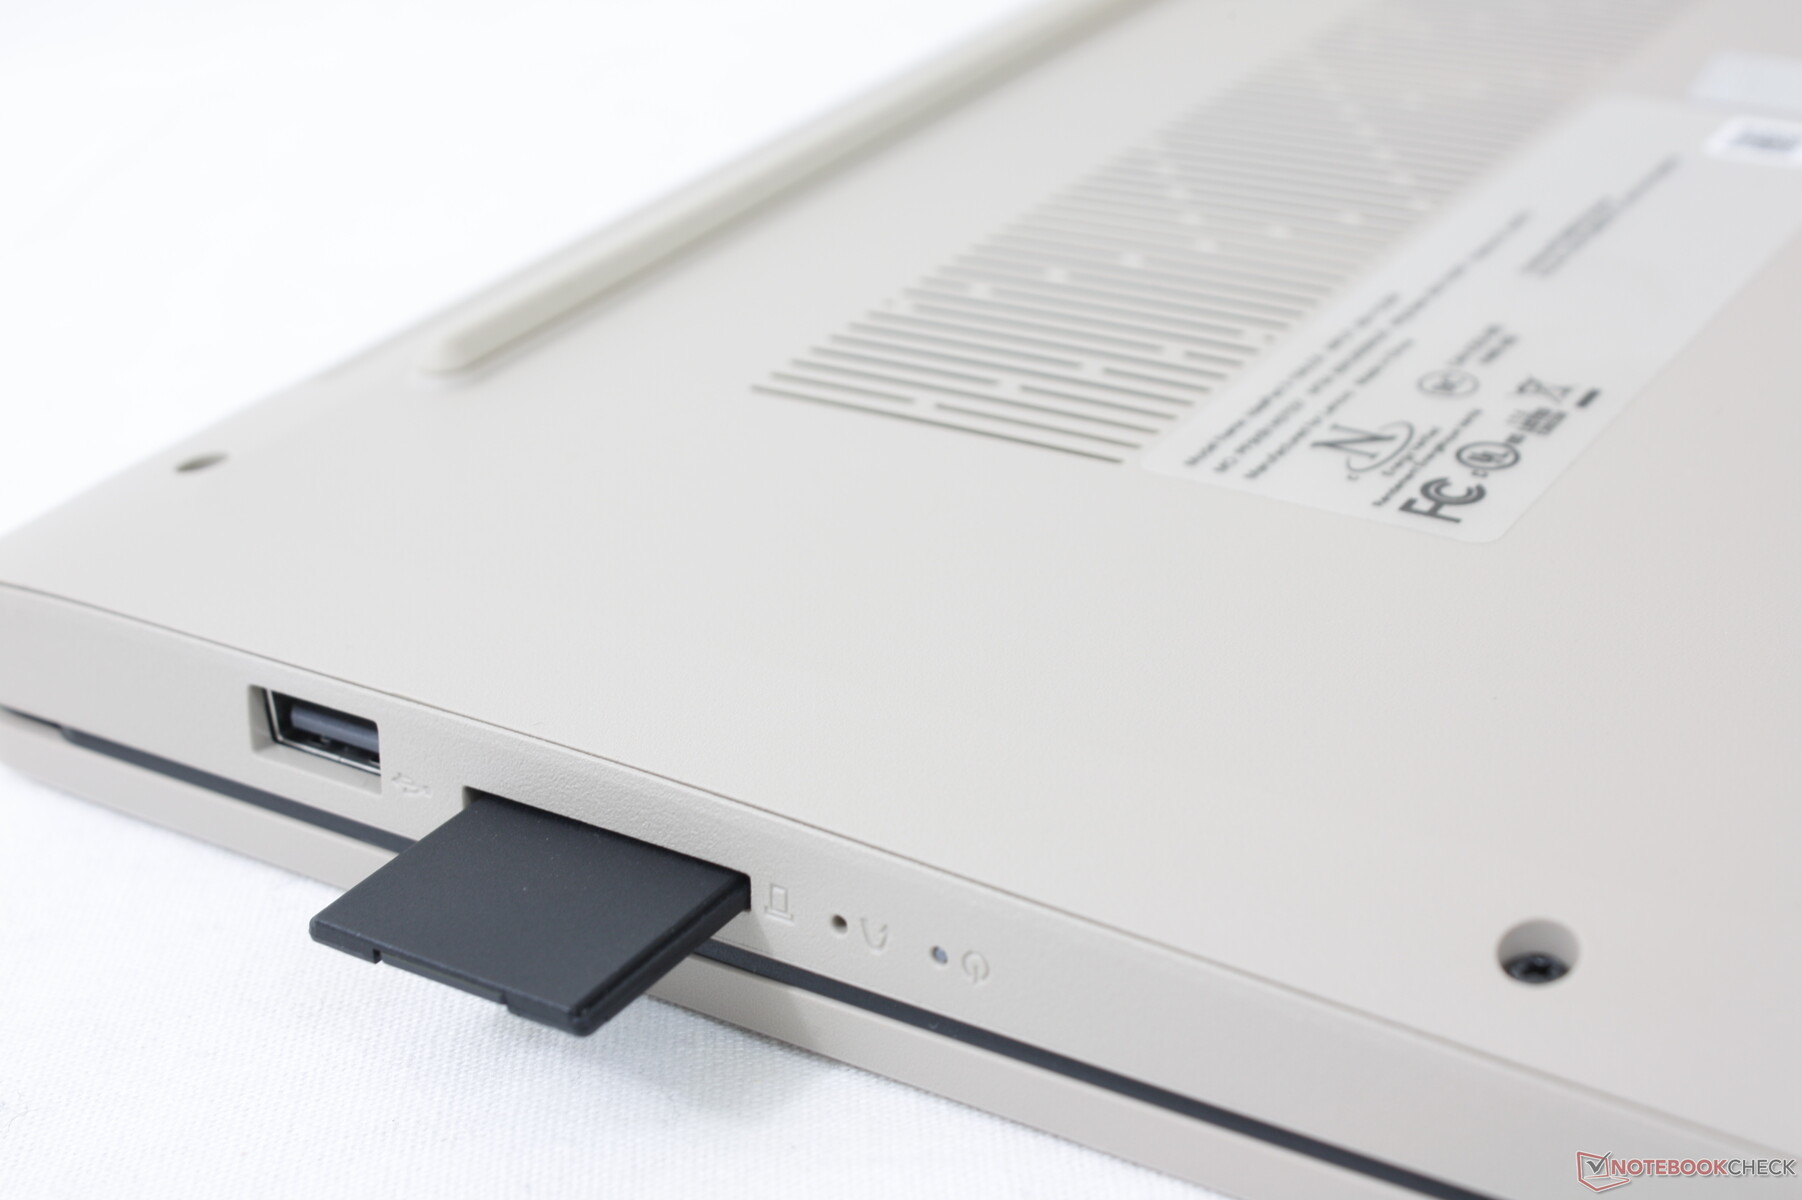
Lettore di schede SD
Il lettore di schede SD integrato è lento. Il trasferimento di 1 GB di immagini dalla nostra scheda di prova UHS-II al desktop richiede circa 36 secondi rispetto a circa la metà sul Pavilion 15. Il lettore di schede non è nemmeno caricato a molla e quindi le schede completamente inserite sporgono ancora per una manipolazione potenzialmente non sicura.
| SD Card Reader | |
| average JPG Copy Test (av. of 3 runs) | |
| Lenovo Ideapad S540-15IML (Toshiba Exceria Pro SDXC 64 GB UHS-II) | |
| HP Pavilion 15-eg (AV PRO microSD 128 GB V60) | |
| Asus VivoBook 15 KM513UA-L503TS (AV PRO microSD 128 GB V60) | |
| Lenovo IdeaPad 3 15ALC6 (AV PRO microSD 128 GB V60) | |
| Lenovo IdeaPad 5 15IIL05 (Toshiba Exceria Pro SDXC 64 GB UHS-II) | |
| Dell Inspiron 15 3501 (AV Pro SD 128 GB V60) | |
| maximum AS SSD Seq Read Test (1GB) | |
| Lenovo Ideapad S540-15IML (Toshiba Exceria Pro SDXC 64 GB UHS-II) | |
| HP Pavilion 15-eg (AV PRO microSD 128 GB V60) | |
| Lenovo IdeaPad 3 15ALC6 (AV PRO microSD 128 GB V60) | |
| Asus VivoBook 15 KM513UA-L503TS (AV PRO microSD 128 GB V60) | |
| Lenovo IdeaPad 5 15IIL05 (Toshiba Exceria Pro SDXC 64 GB UHS-II) | |
| Dell Inspiron 15 3501 (AV Pro SD microSD 128 GB V60) | |
Comunicazione
La nostra configurazione utilizza il Wi-Fi 5 invece del Wi-Fi 6 probabilmente per risparmiare sui costi. Le velocità di trasferimento sono costanti quando è accoppiato al nostro router di prova Netgear RAX200.
Webcam
La qualità della webcam è scarsa con solo 1 MP. Inoltre, non c'è un sensore IR per il supporto di Windows Hello. Un otturatore manuale per la privacy è di serie.


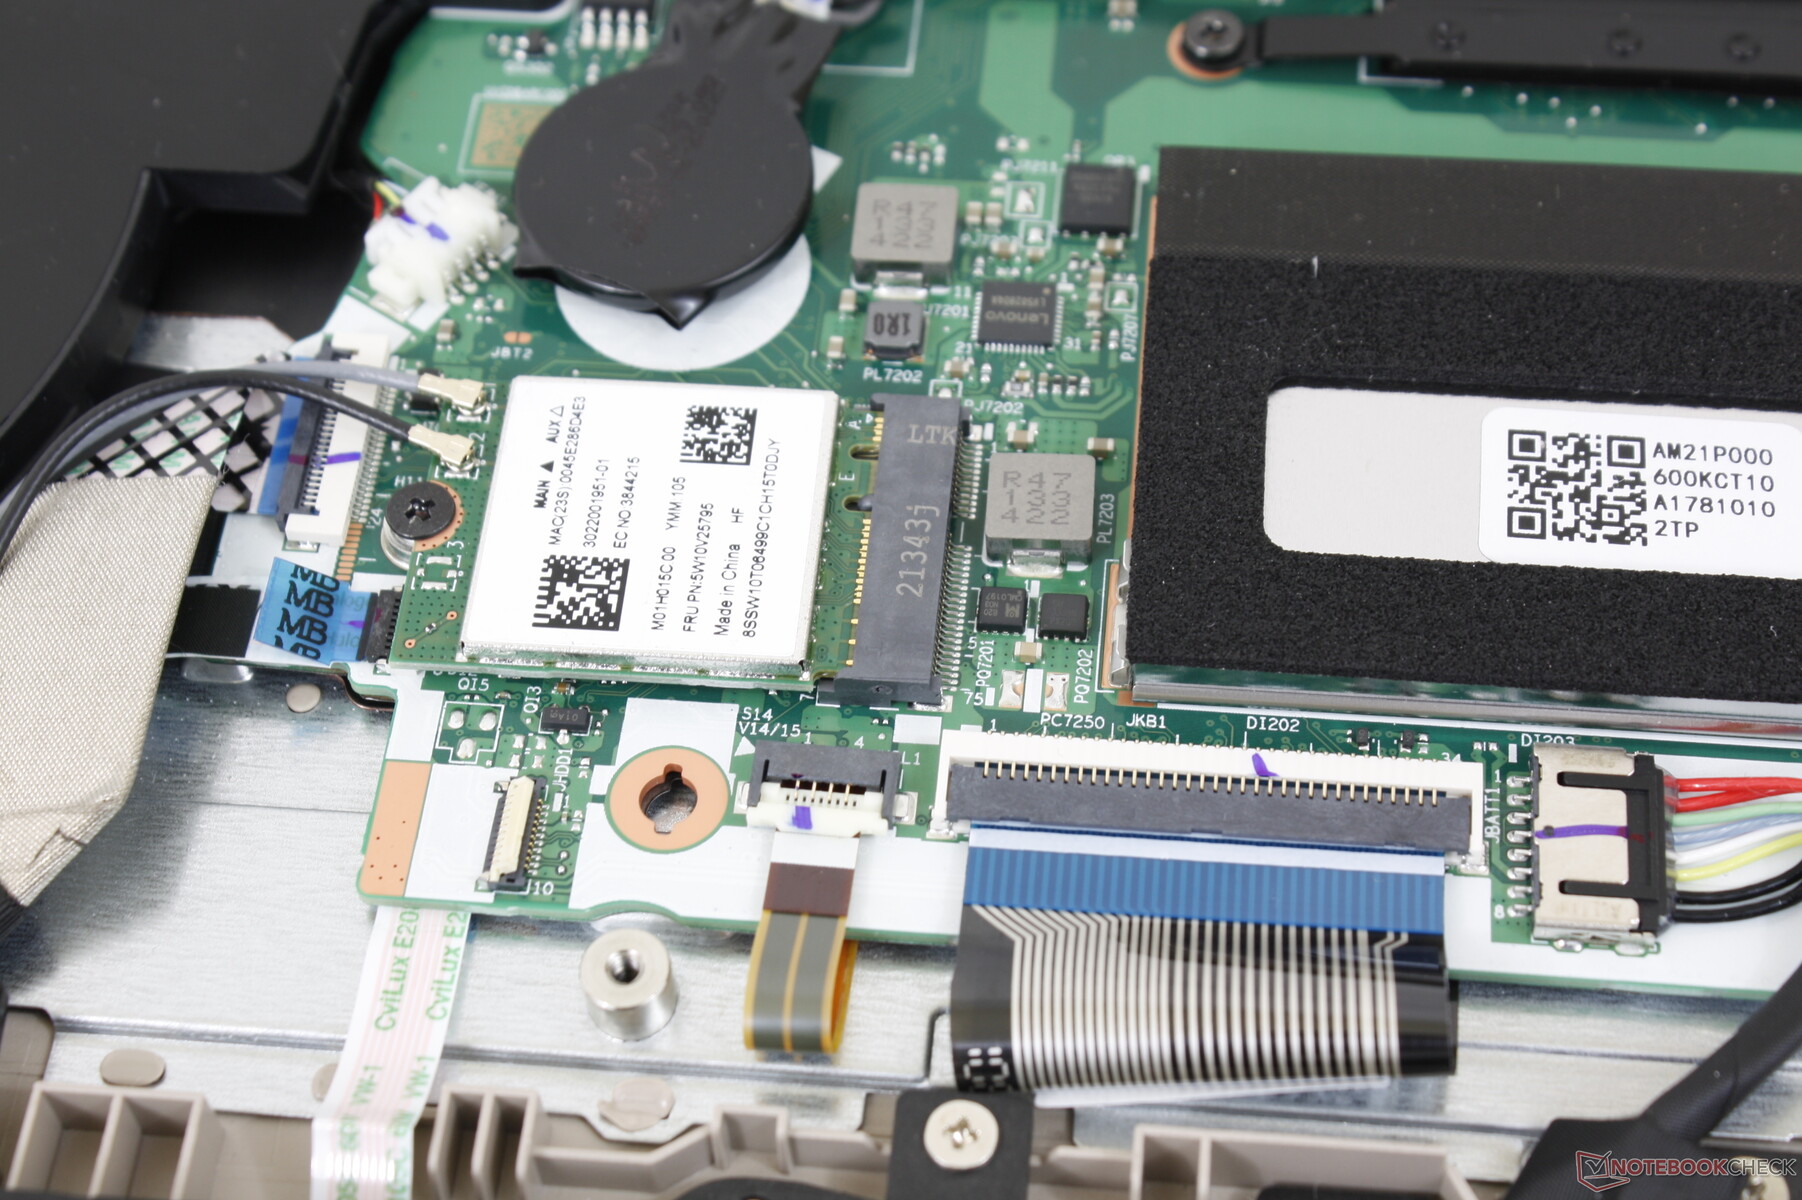
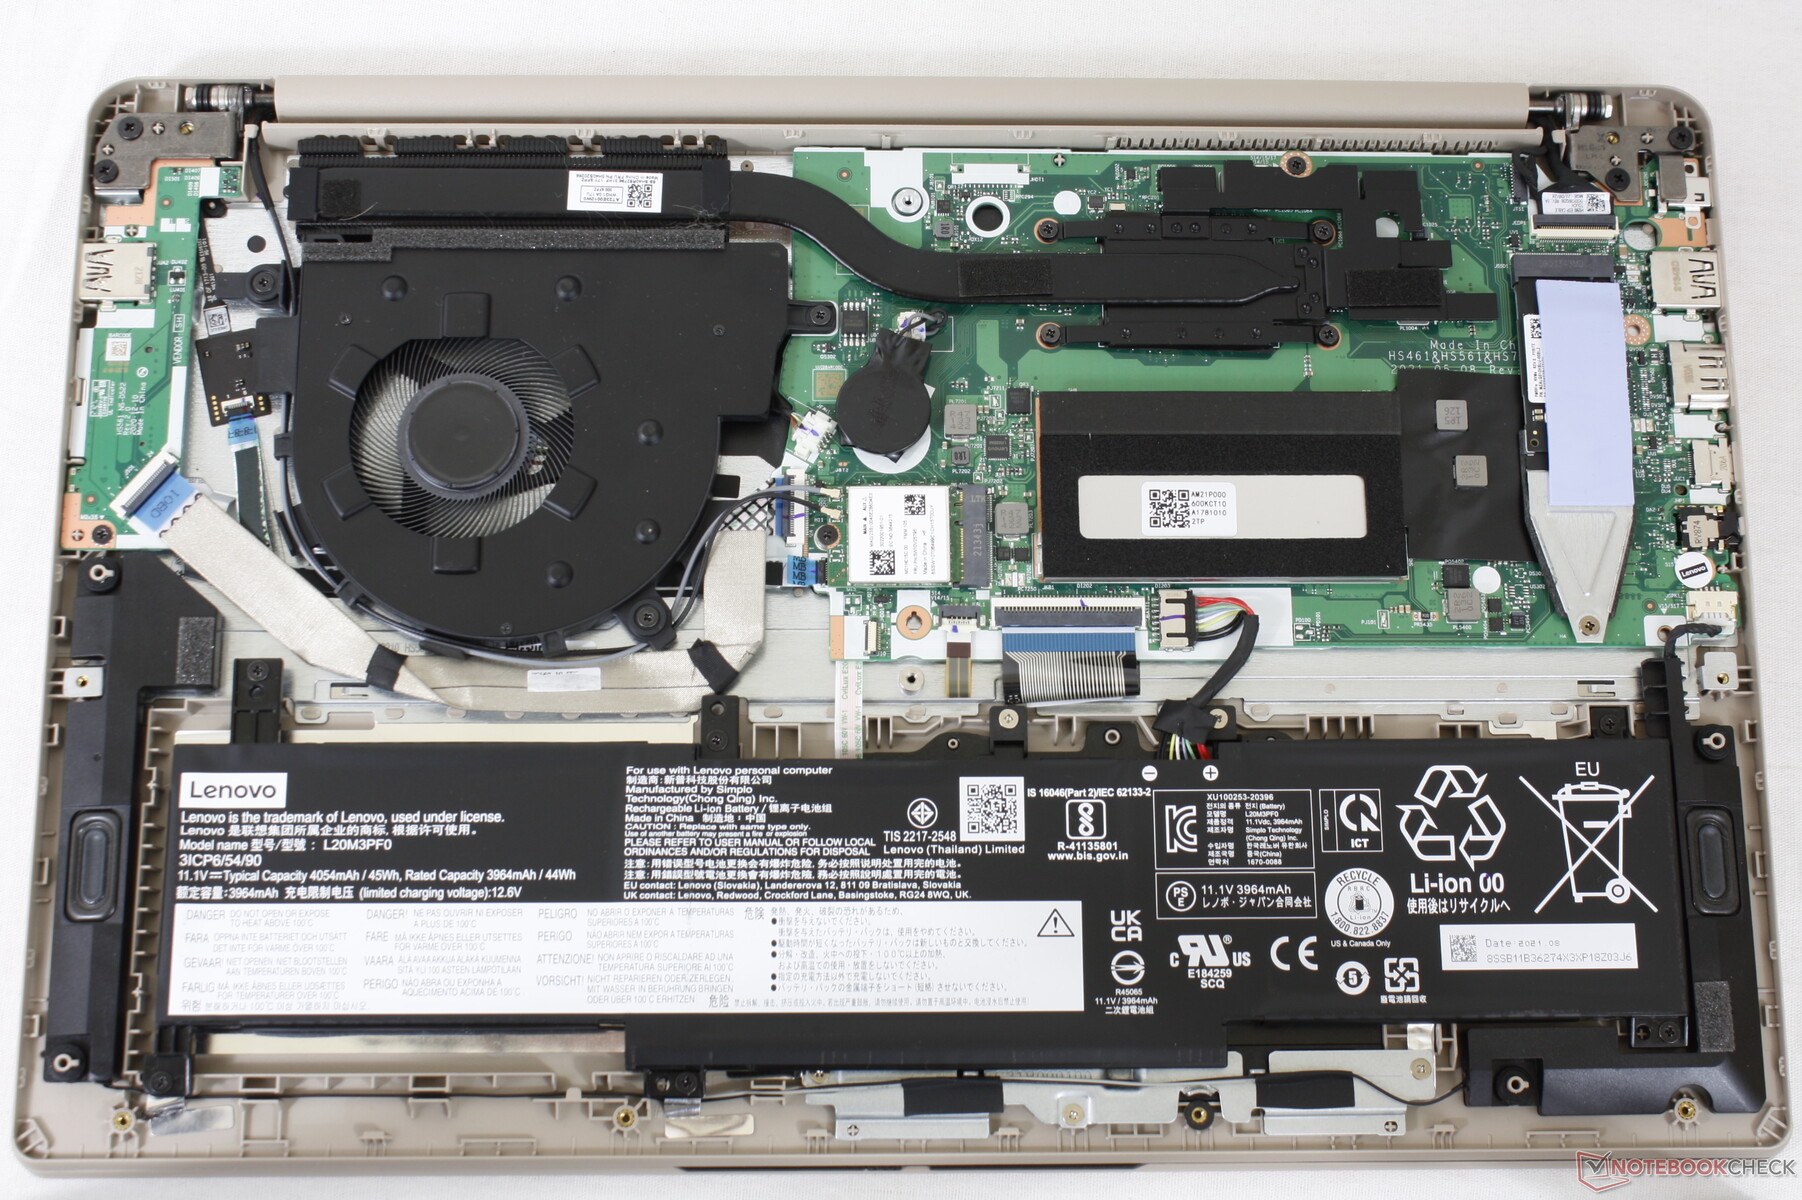
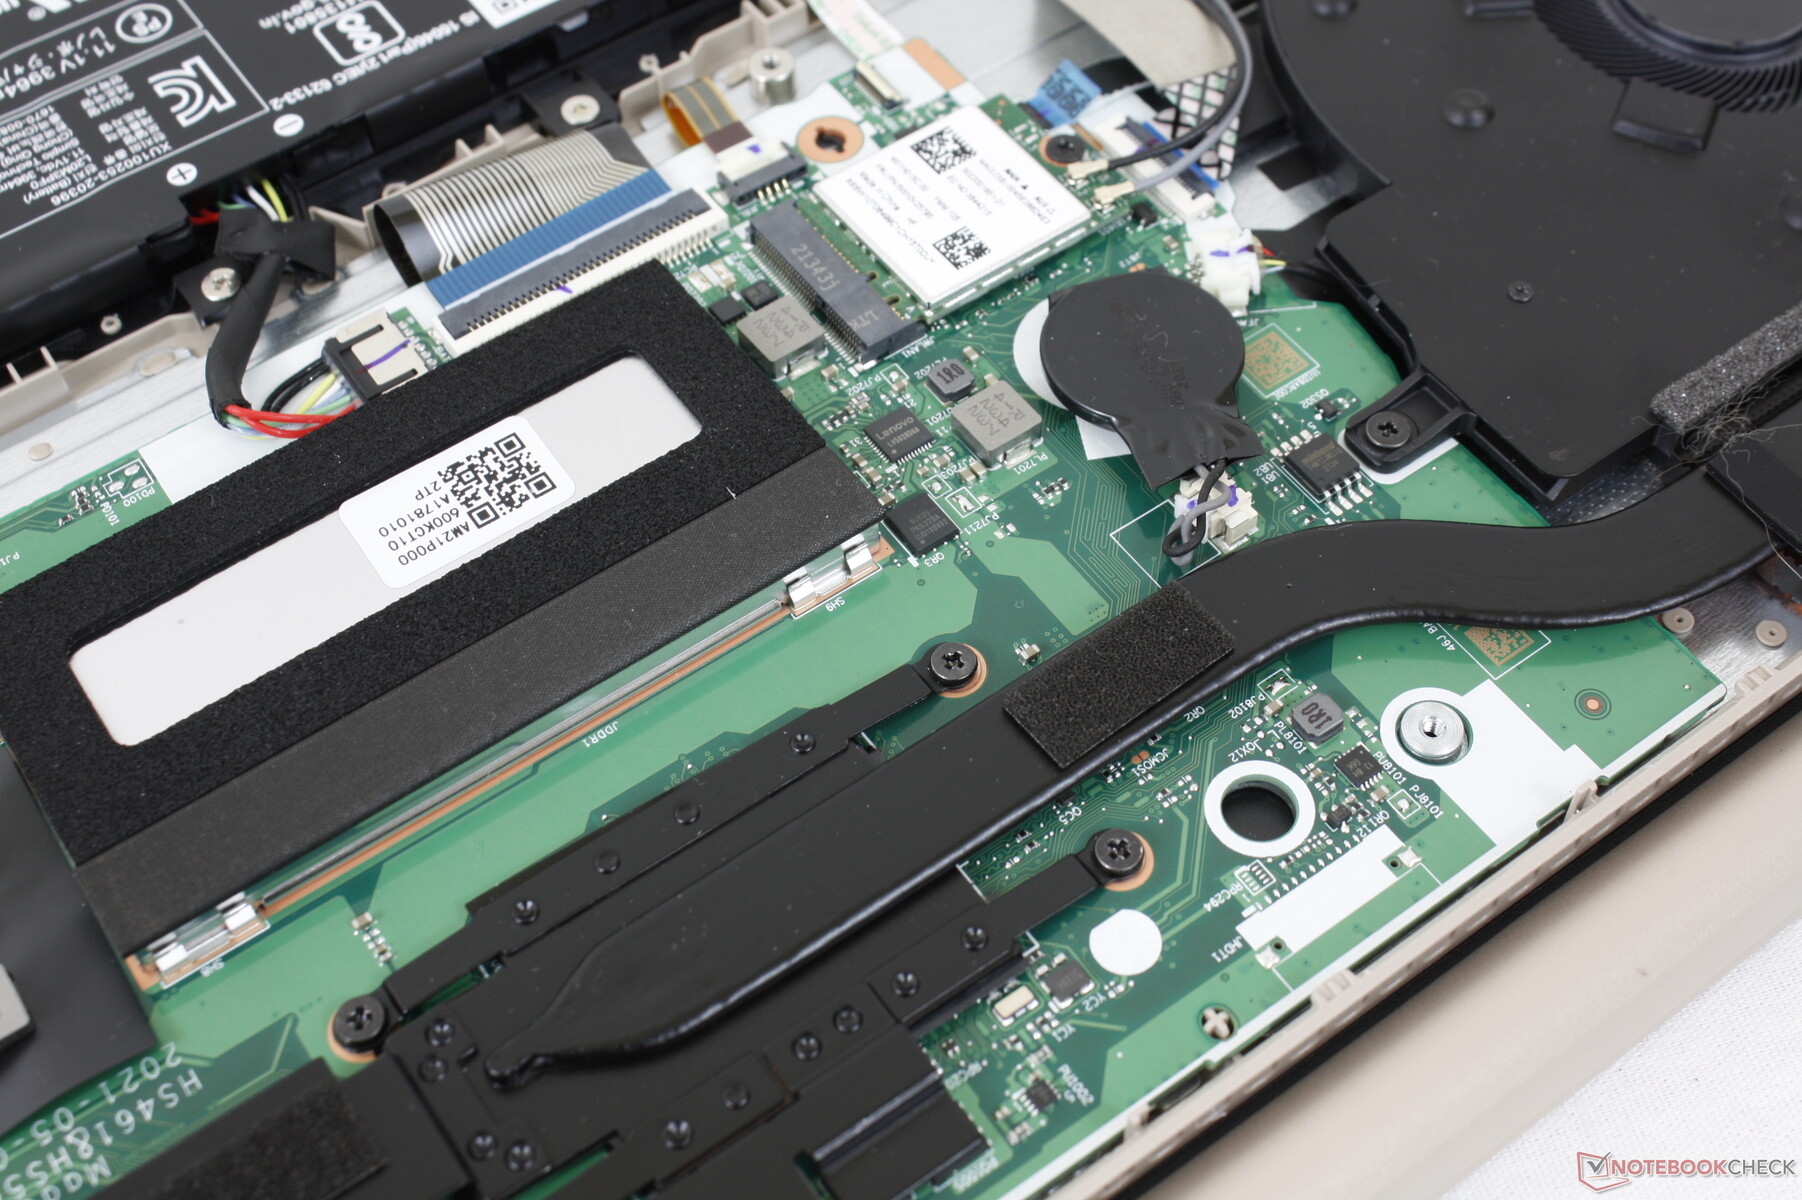
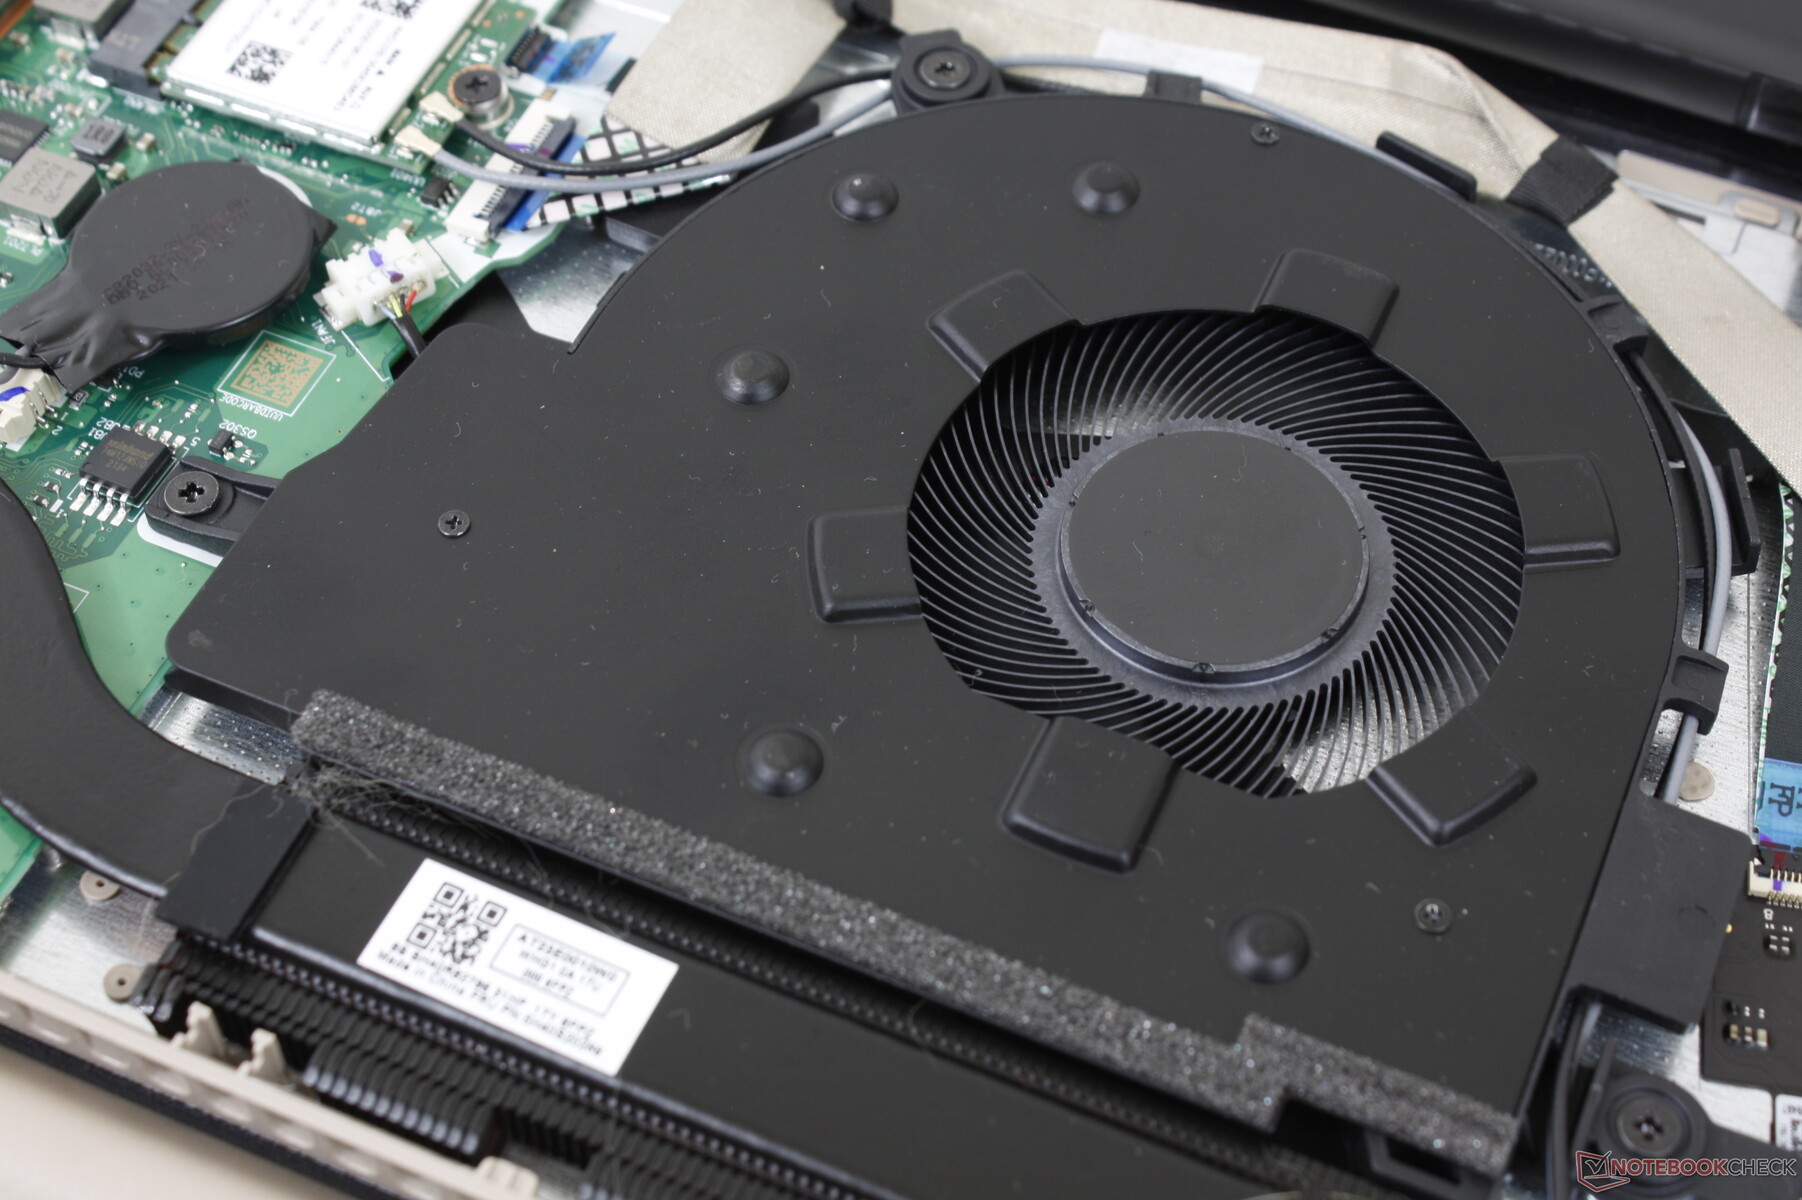
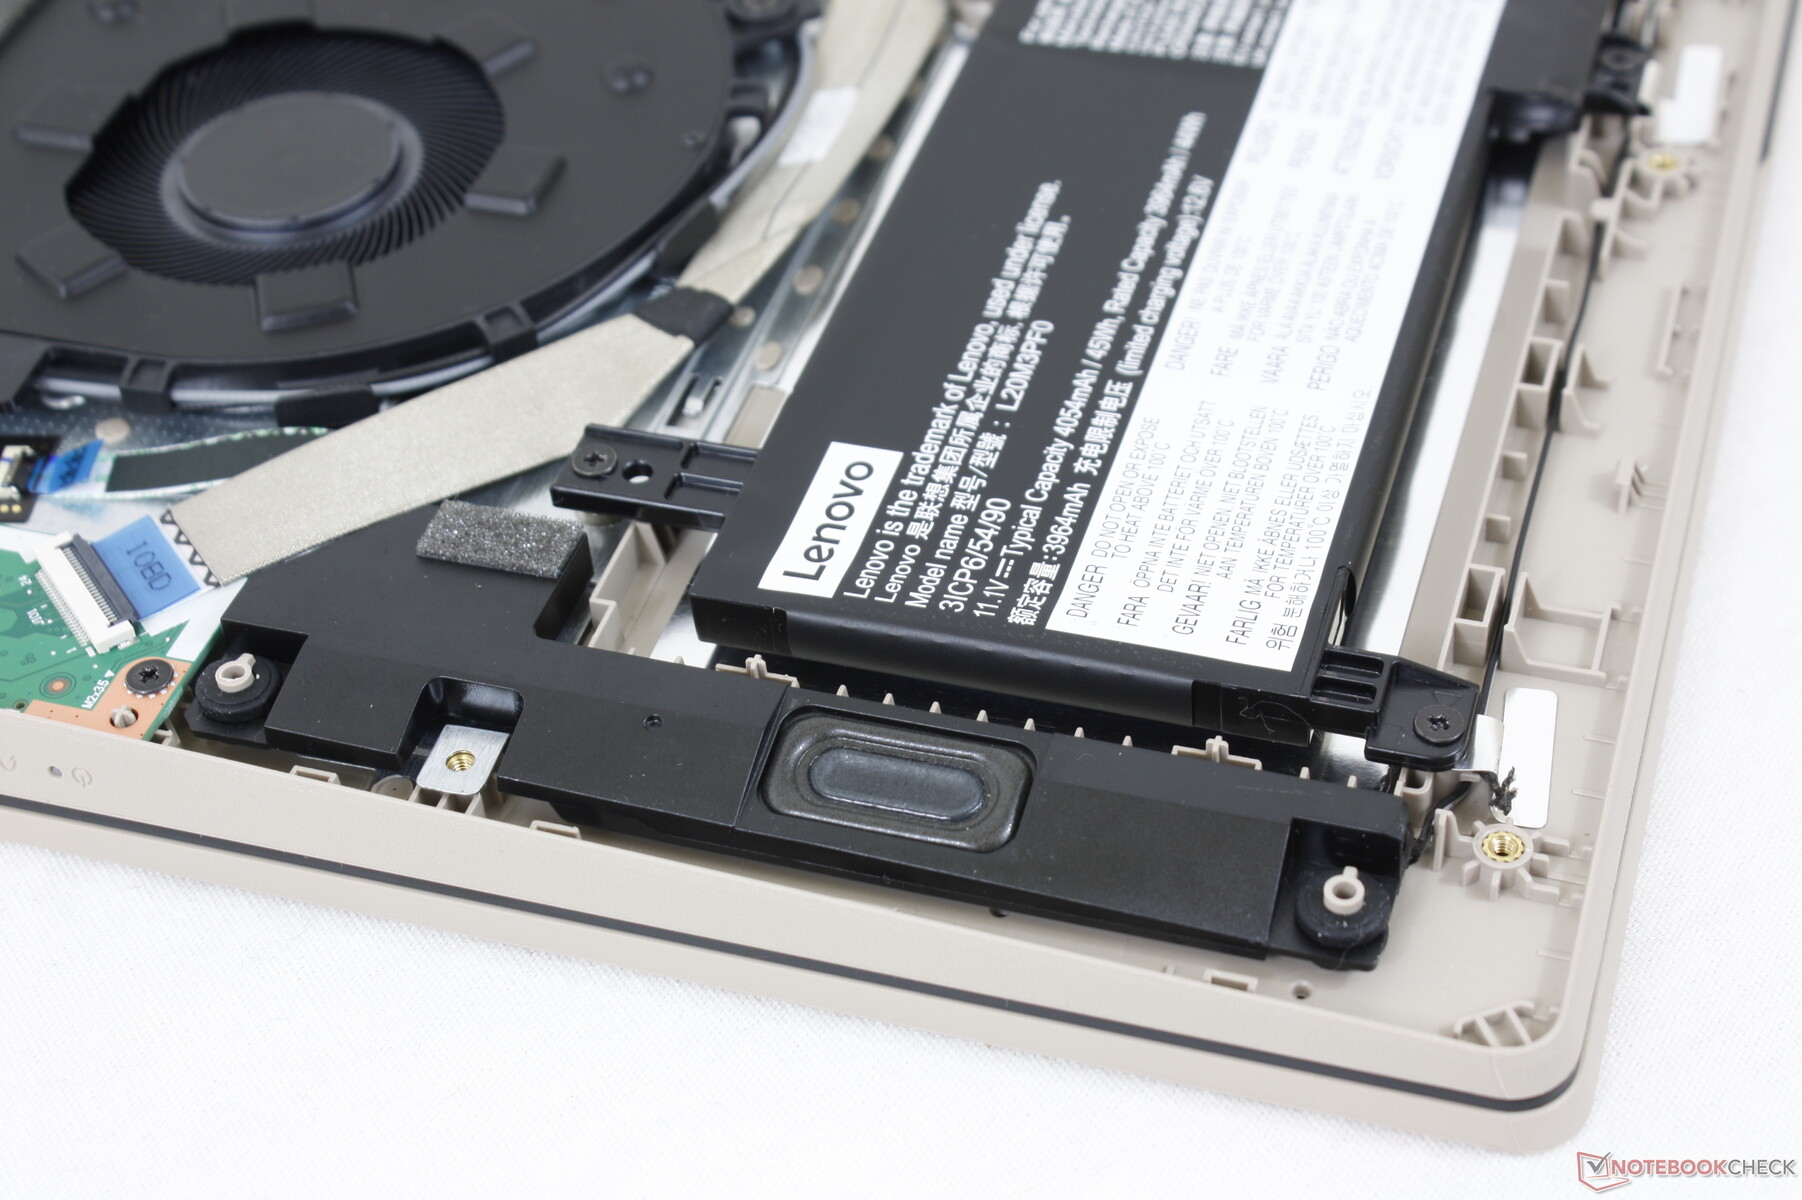
Manutenzione - Facile da aprire
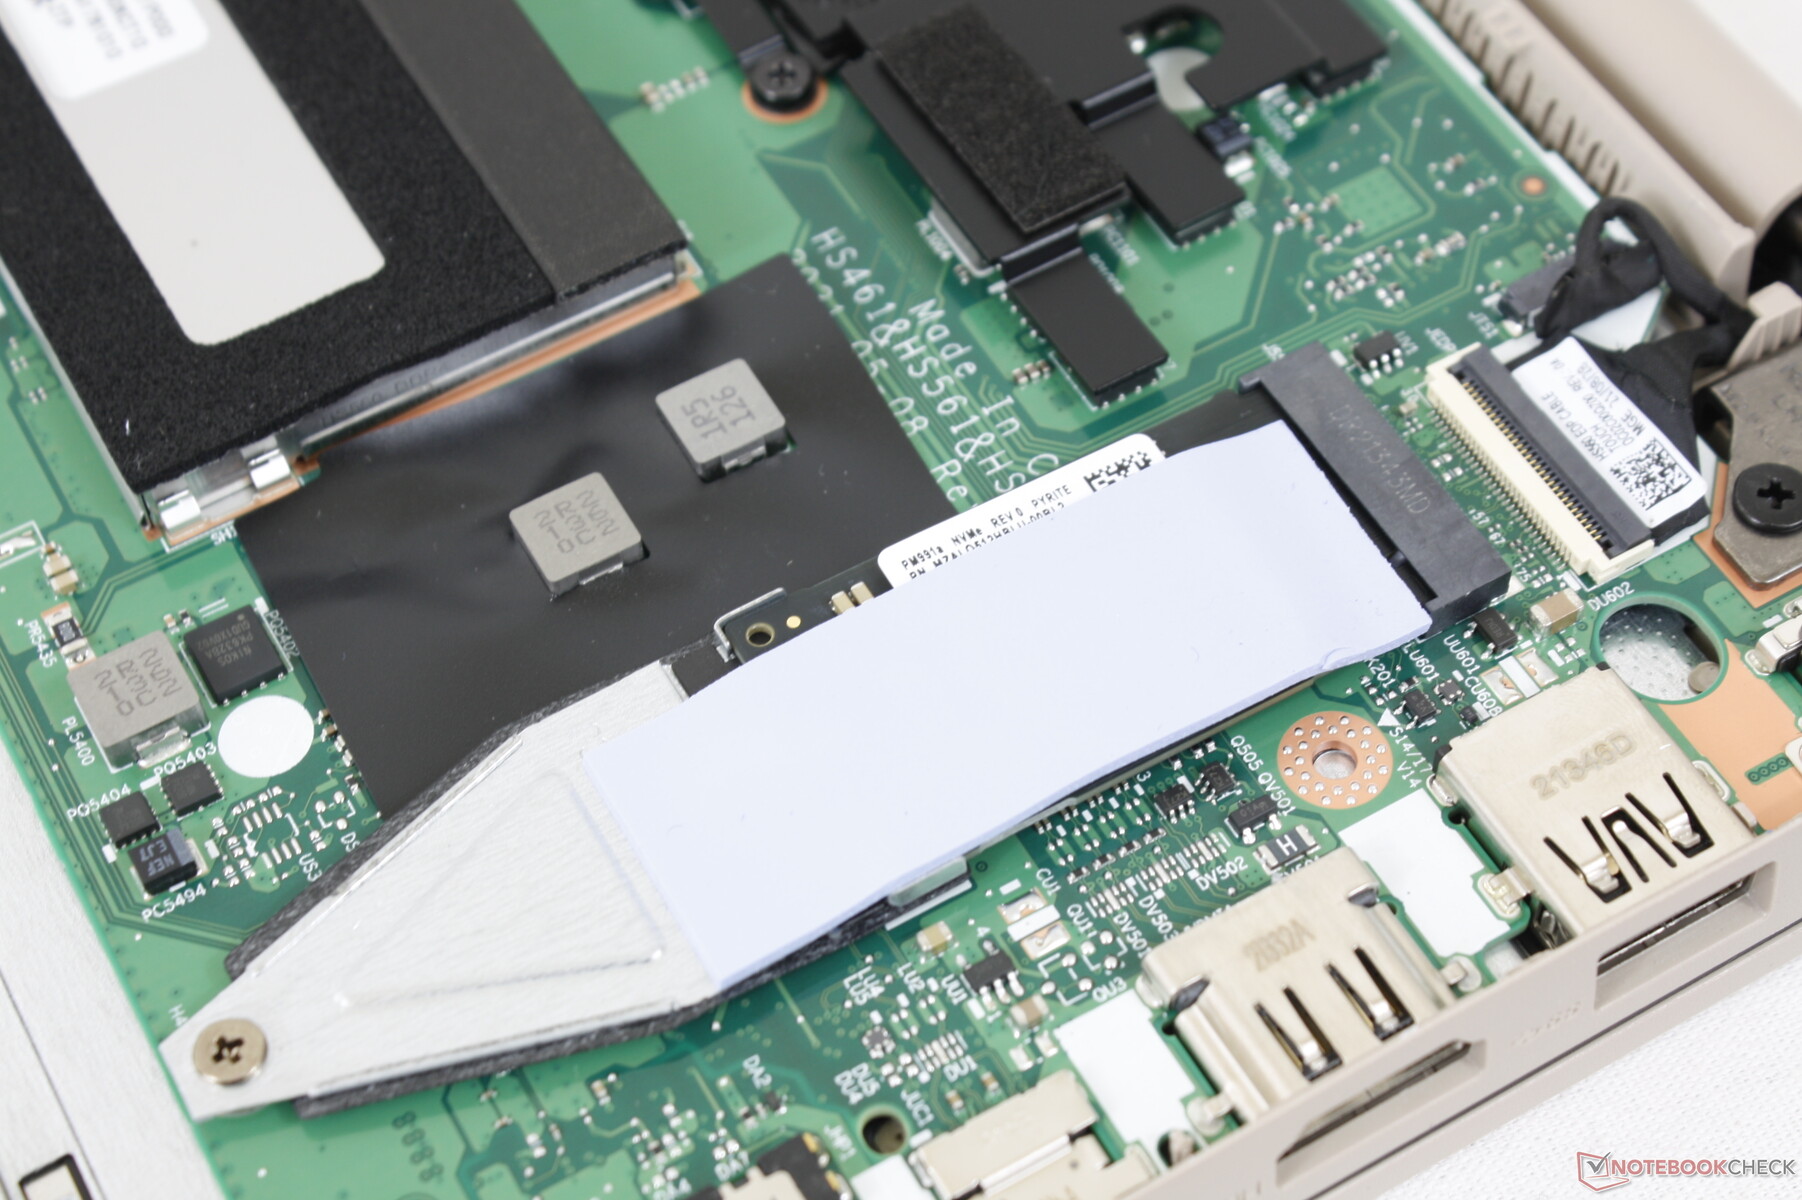
Il pannello inferiore può essere facilmente rimosso con un semplice cacciavite Philips, mentre molti altri portatili economici sono in genere più difficili da riparare. Gli utenti vedranno solo uno slot M.2 PCIe3 x4 2280 per lo storage, uno slot WLAN, e uno slot SODIMM per integrare i 4 GB di RAM saldati.
Accessori e garanzia
Non ci sono extra nella scatola, a parte l'adattatore AC e la documentazione. Si applica la solita garanzia limitata di un anno del produttore
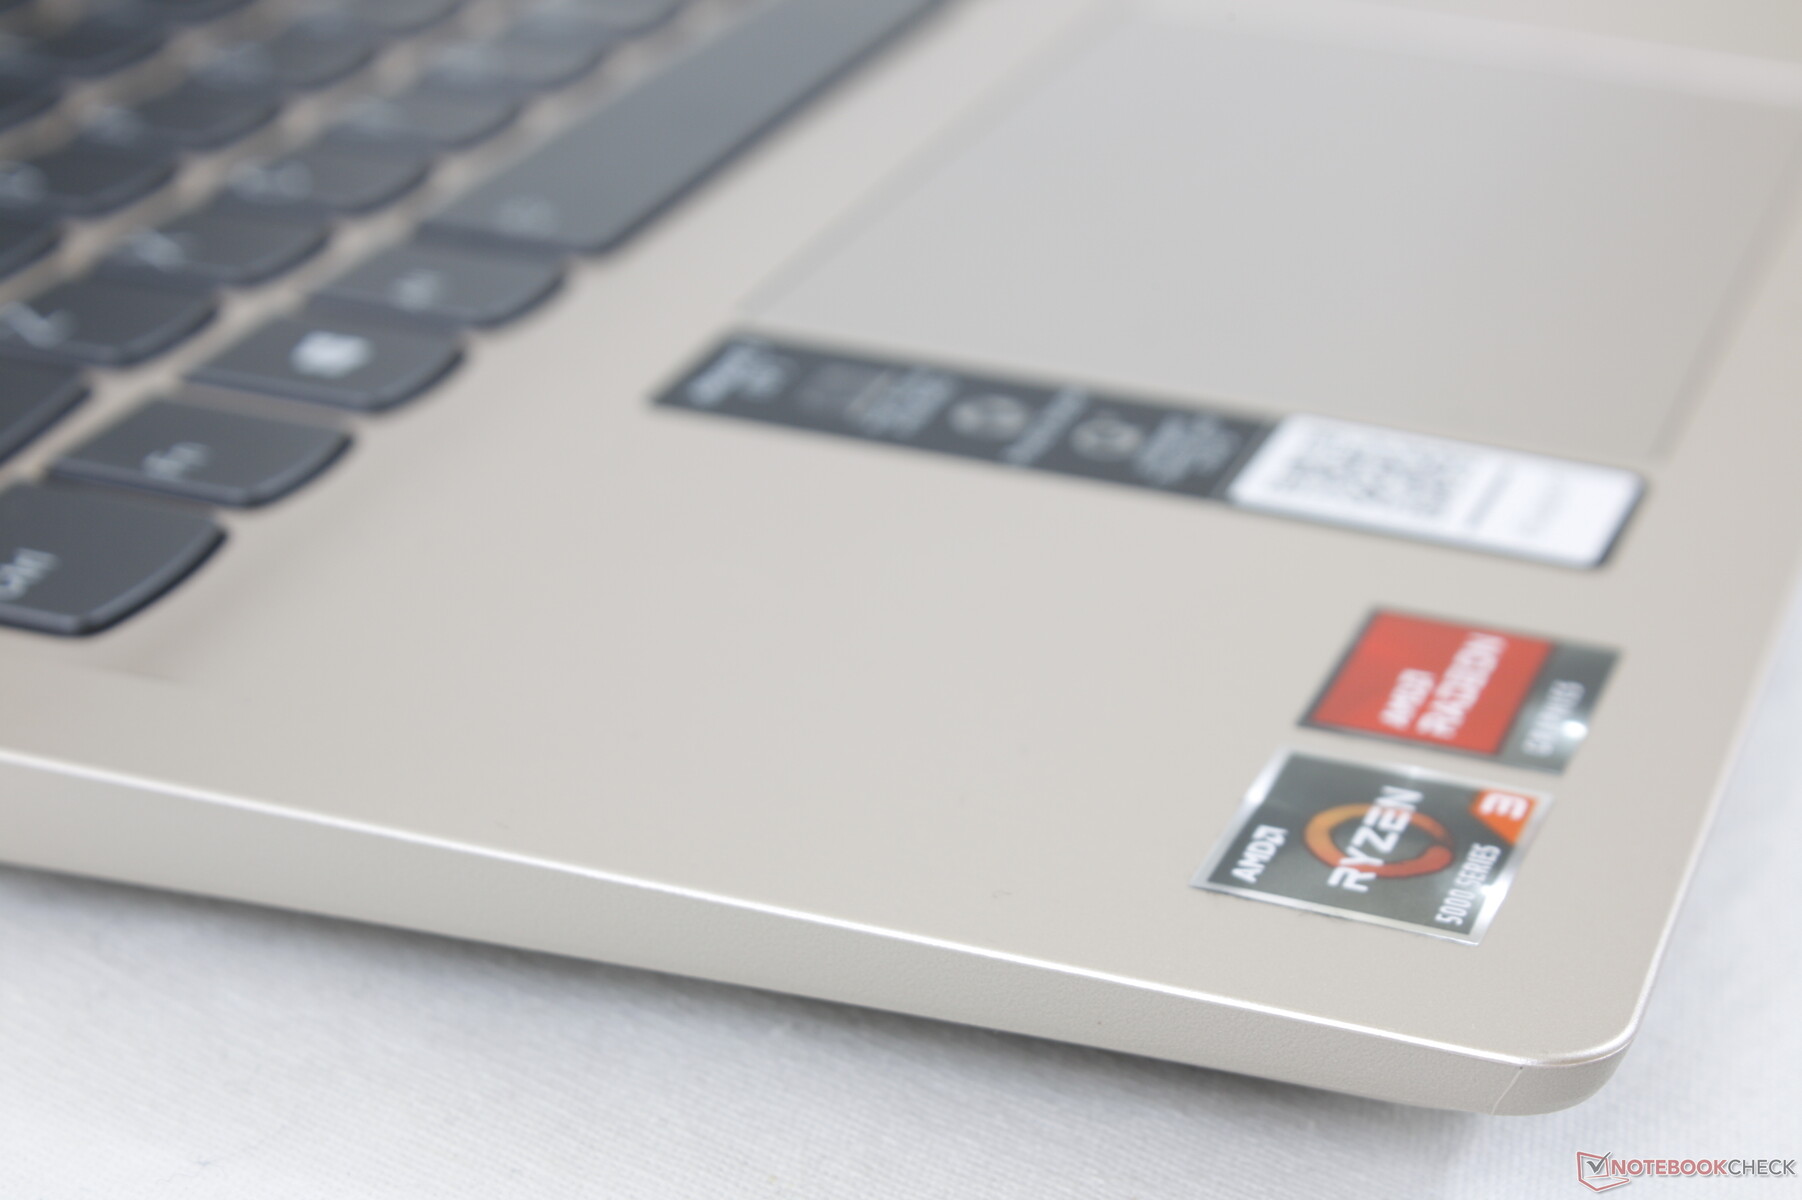
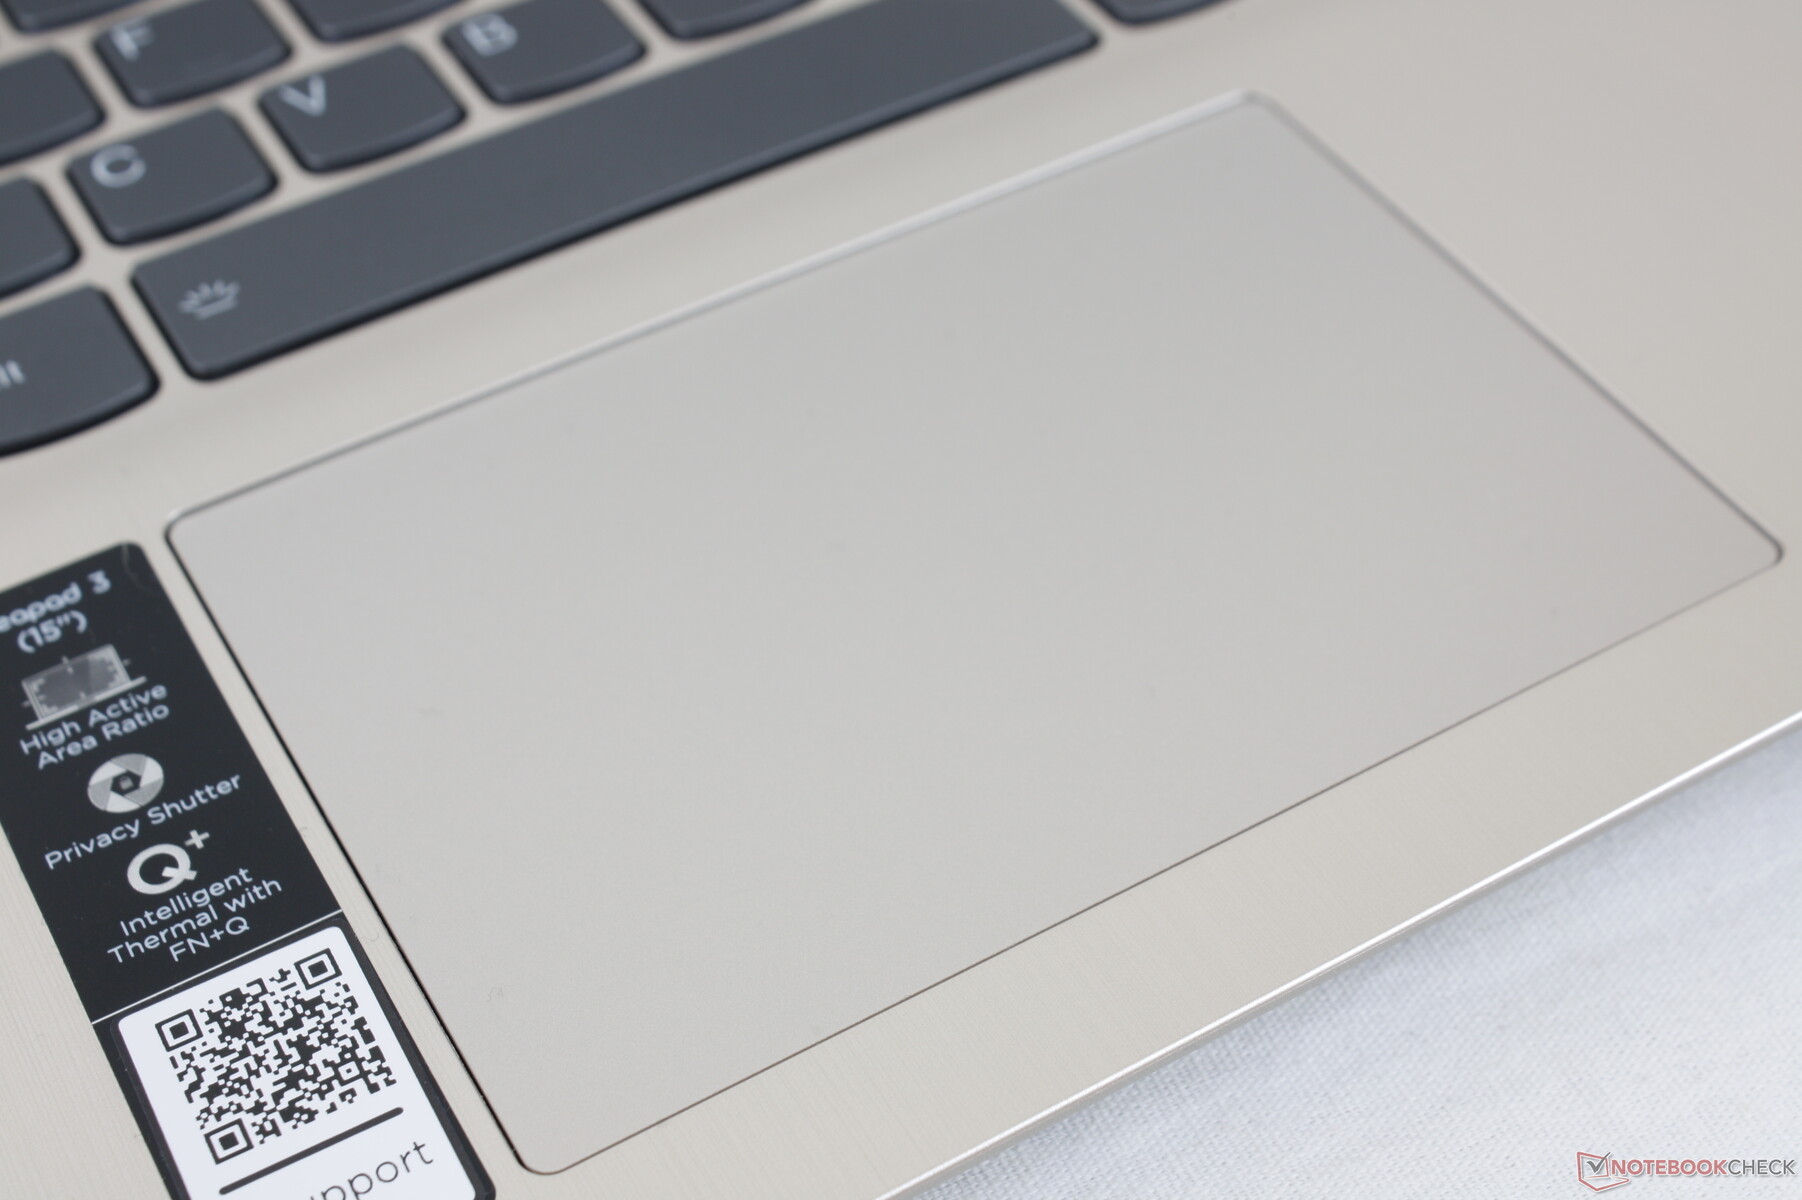
Dispositivi di input - Clickpad spugnoso
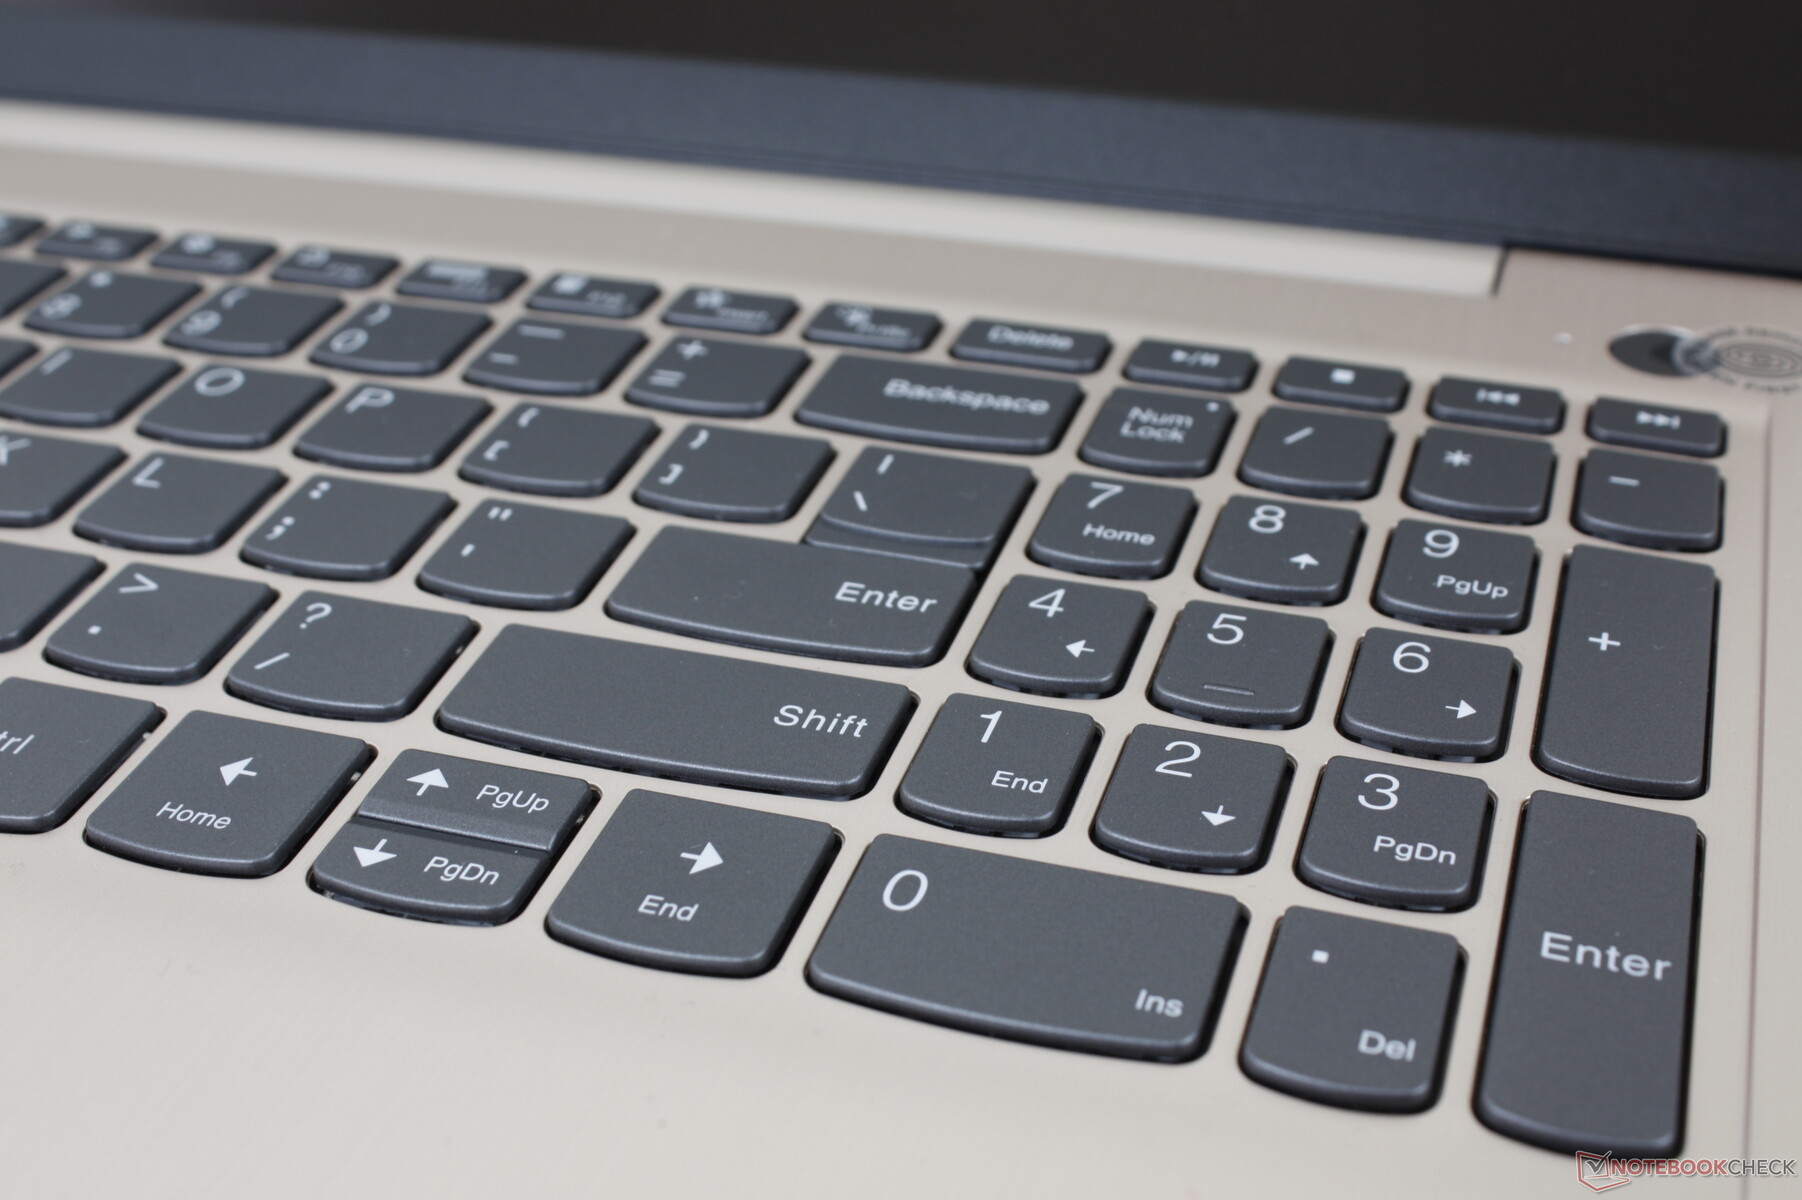
Tastiera
I tasti retroilluminati hanno una corsa breve con un feedback relativamente debole quando vengono premuti, specialmente se paragonati ai tasti di un più costoso ThinkPad o HP Spectre laptop. Il rumore dei tasti è più silenzioso del previsto a causa del feedback debole.
Touchpad
Il clickpad è leggermente più piccolo di quello del 14 pollici IdeaPad 5 Pro 14 (10 x 7 cm contro 10,5 x 7 cm). Lo scorrimento è fluido a velocità medie o superiori, mentre il dito tende ad attaccarsi a velocità più basse per un click più accurato. Sfortunatamente, cliccare sul clickpad è poco profondo e spugnoso con un feedback insoddisfacente.

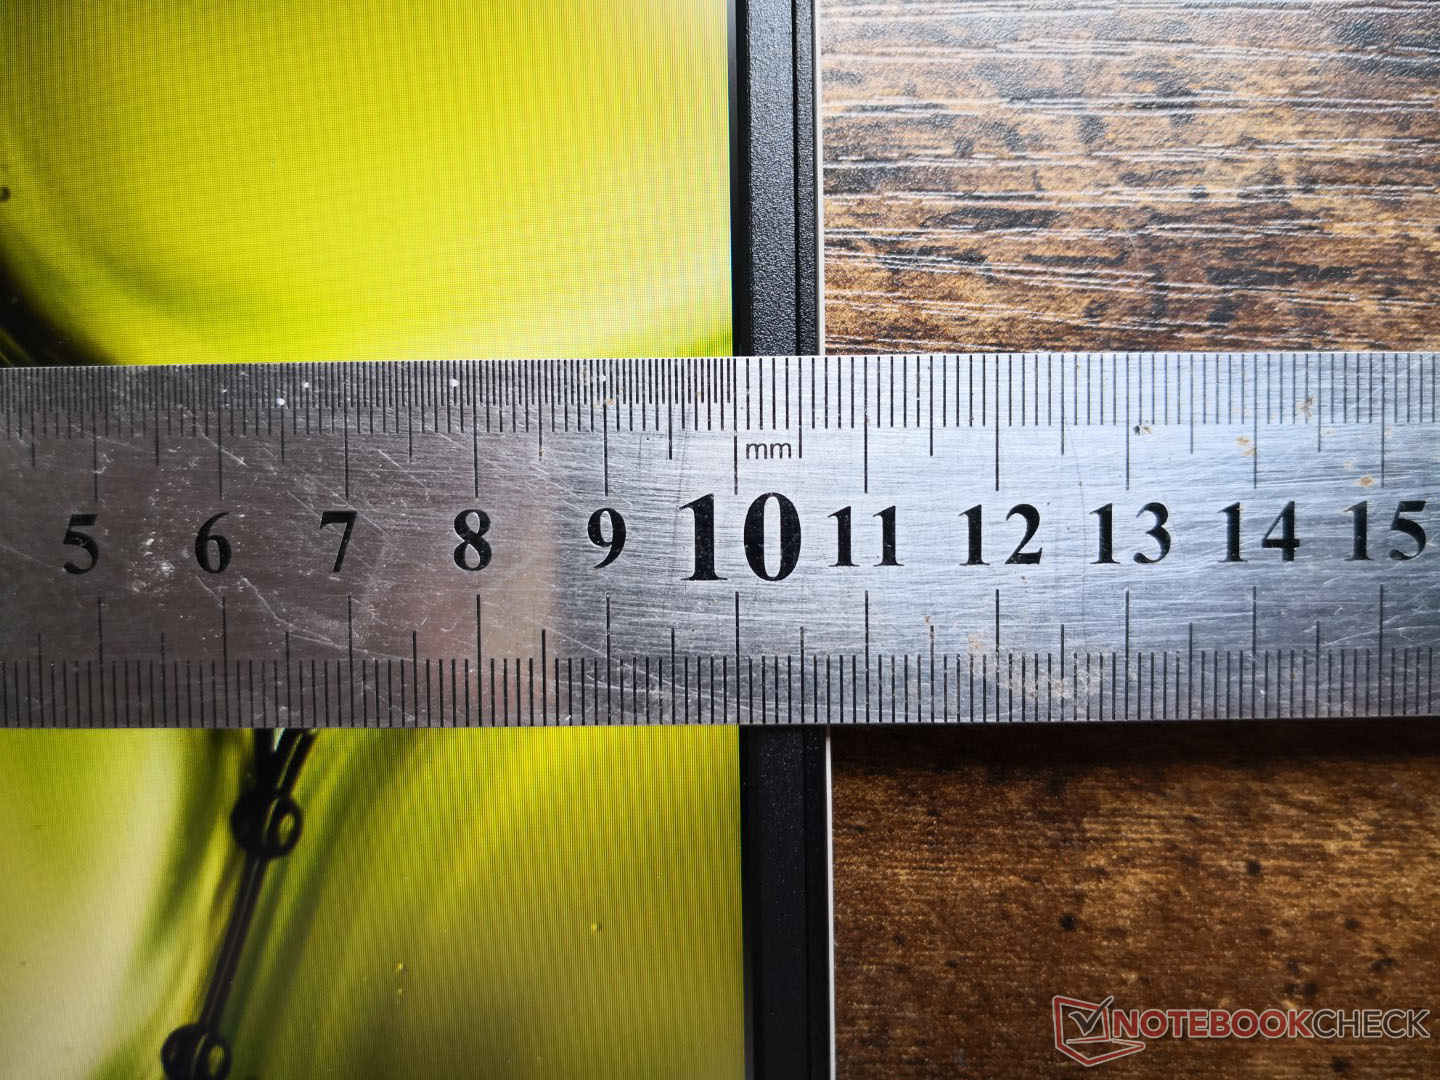
Display - FreeSync e supporto touchscreen
Il pannello IPS BOE CQ NV156FHM-T07 non si trova su nessun altro portatile nel nostro database. Mentre il suo alto rapporto di contrasto di 1400:1 e i ragionevoli tempi di risposta in bianco e nero meritano un elogio, i suoi colori sono mediocri nel migliore dei casi e neanche lontanamente vibranti come i display su un modello Yoga.
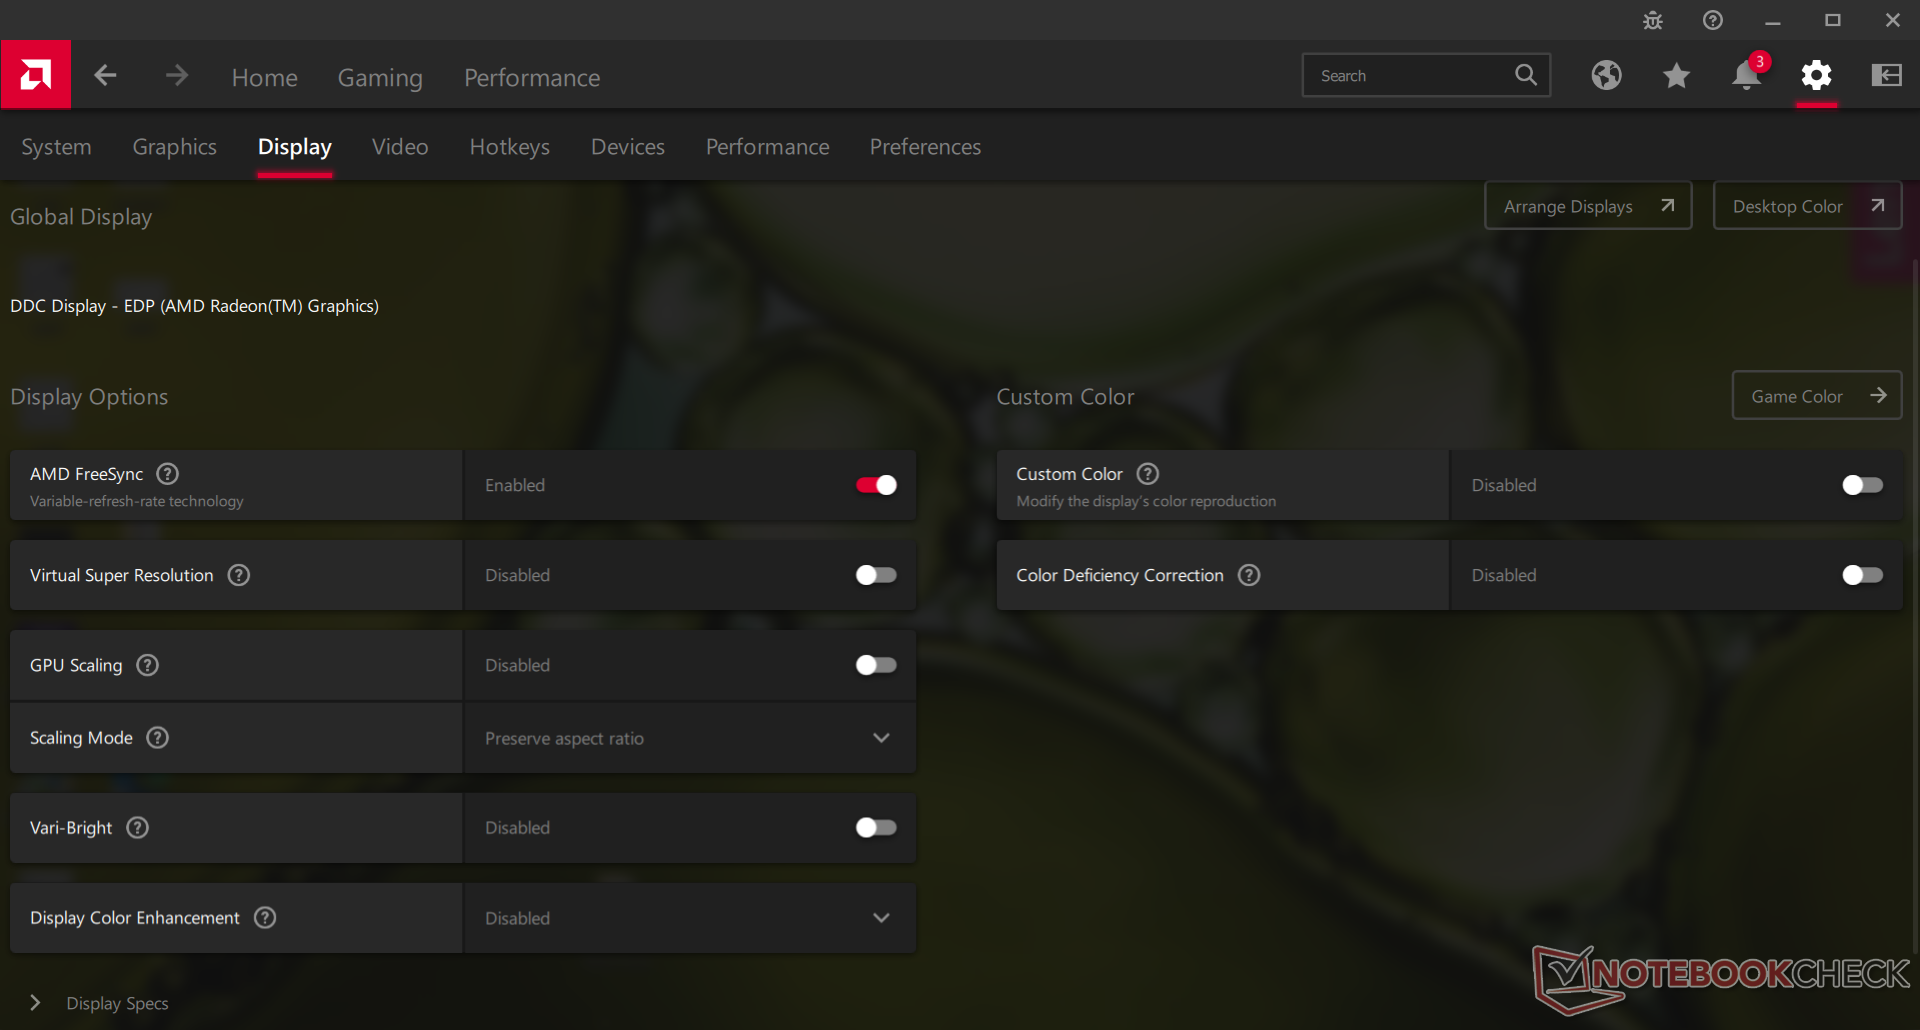
Forse l'aspetto più degno di nota del display è che è anche un touchscreen con supporto FreeSync che è quasi inaudito per un portatile sotto i 500 dollari. Tali caratteristiche probabilmente faranno appello solo a un sottoinsieme molto piccolo del pubblico di riferimento.


| |||||||||||||||||||||||||
Distribuzione della luminosità: 84 %
Al centro con la batteria: 336.4 cd/m²
Contrasto: 1402:1 (Nero: 0.24 cd/m²)
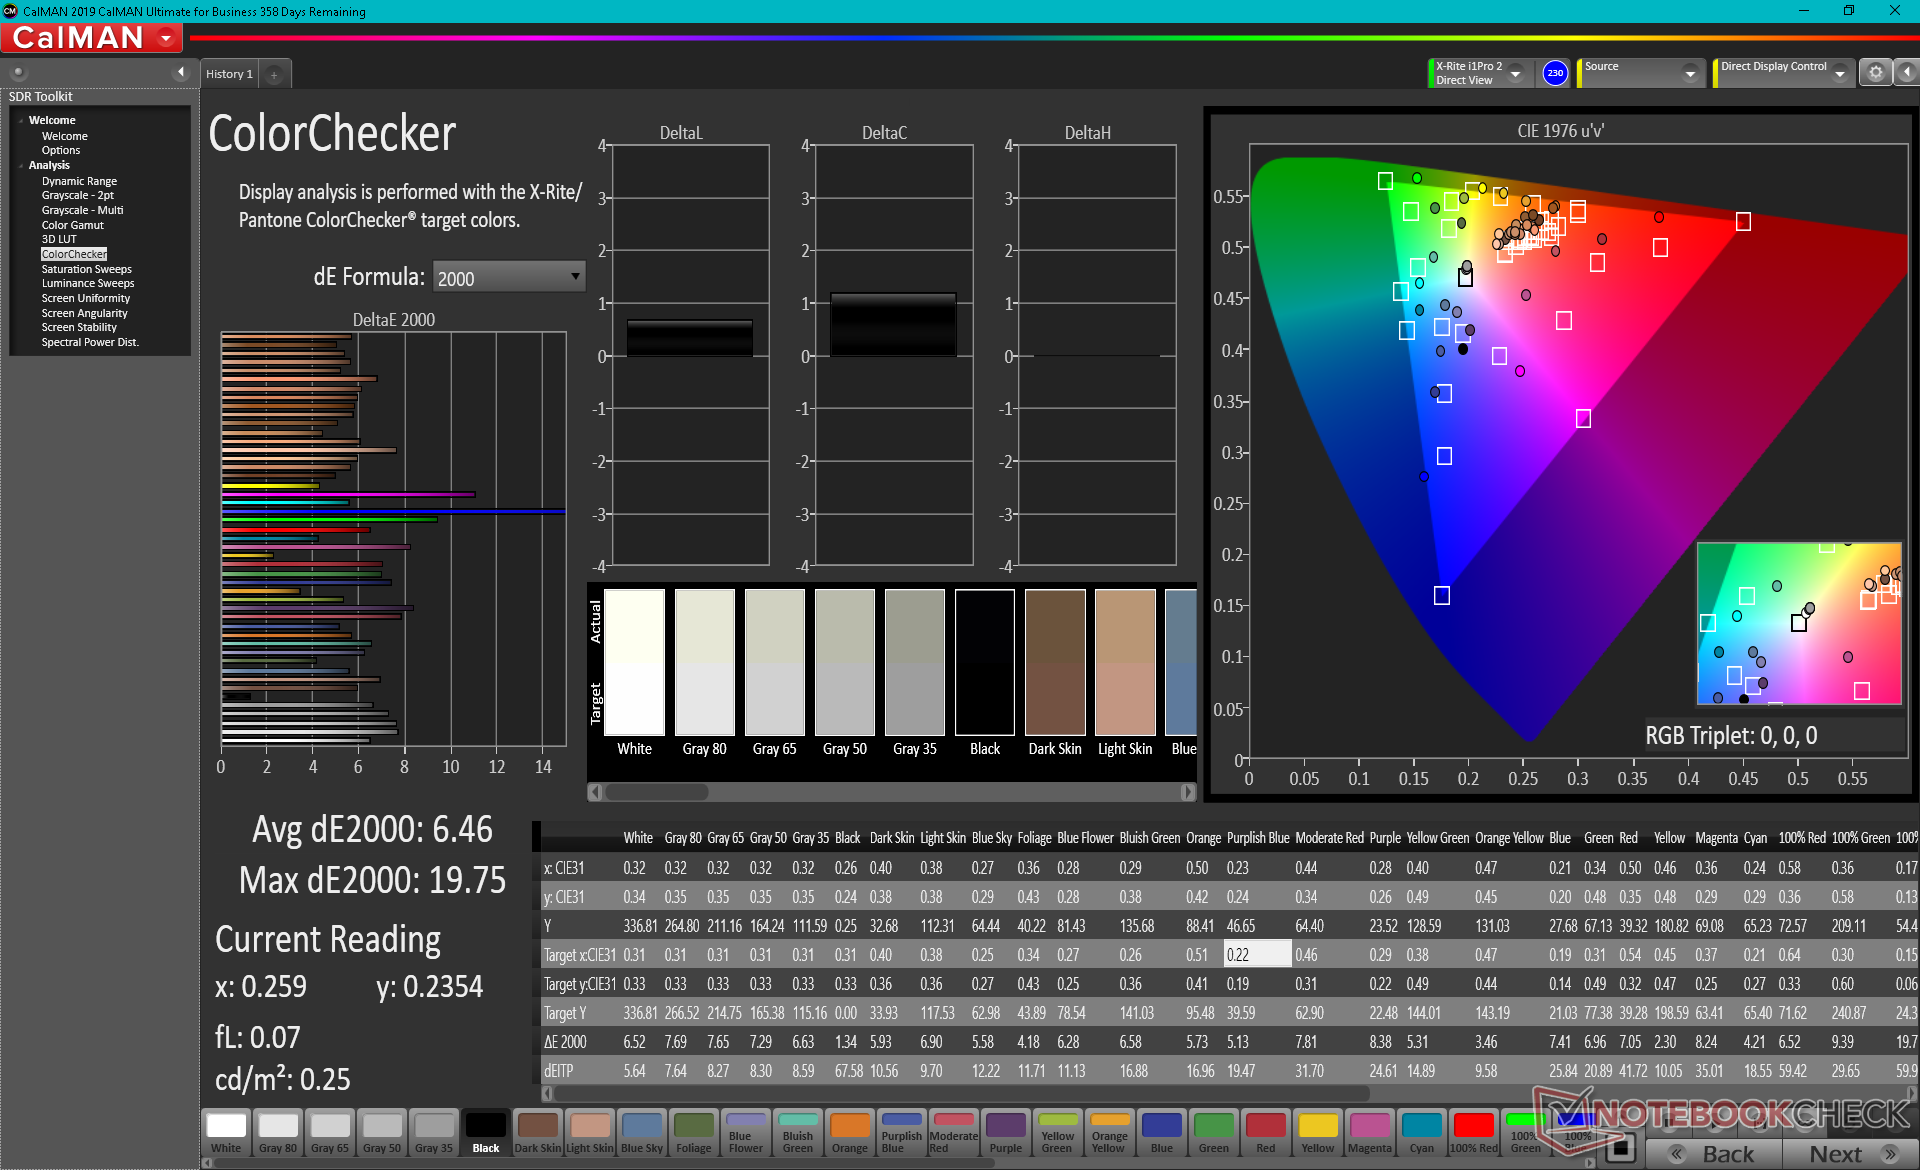
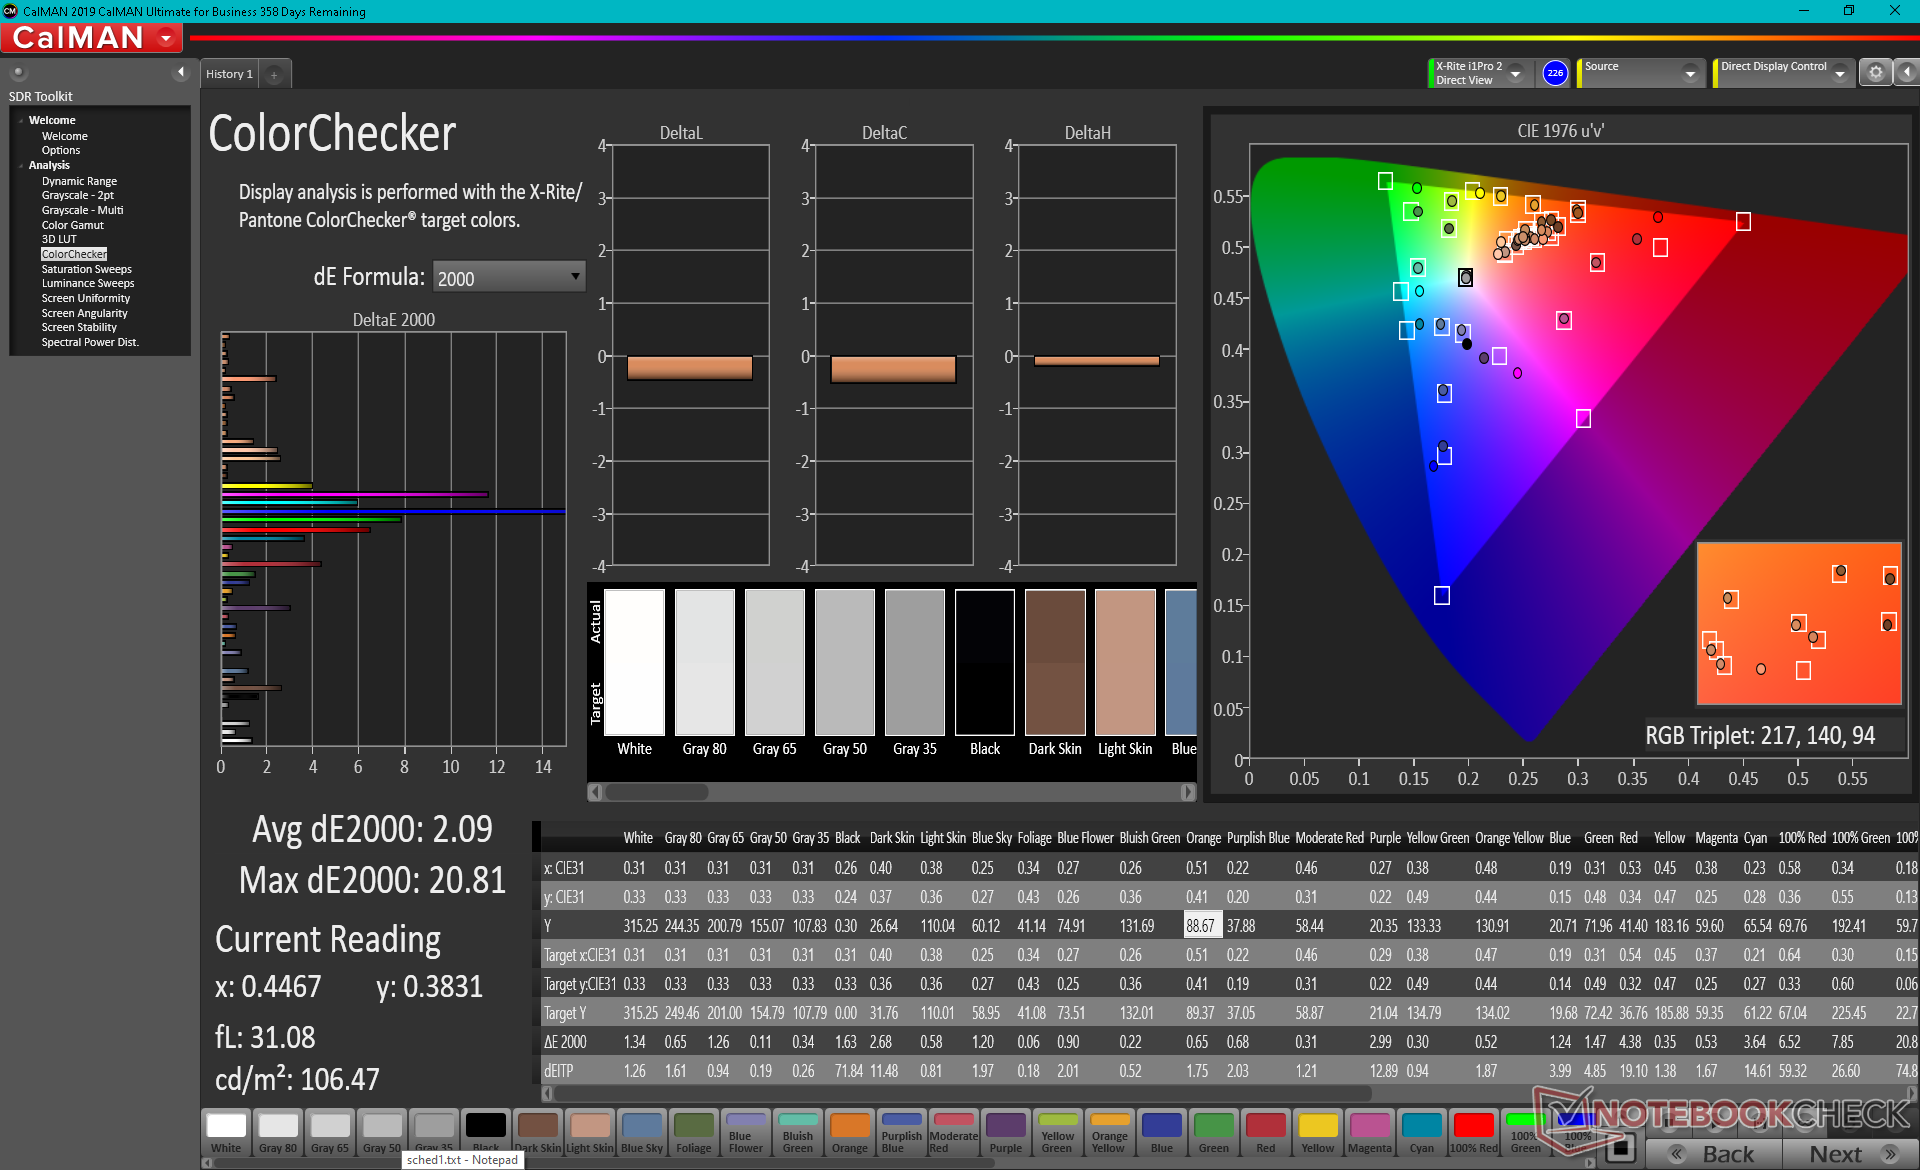
ΔE ColorChecker Calman: 6.46 | ∀{0.5-29.43 Ø4.71}
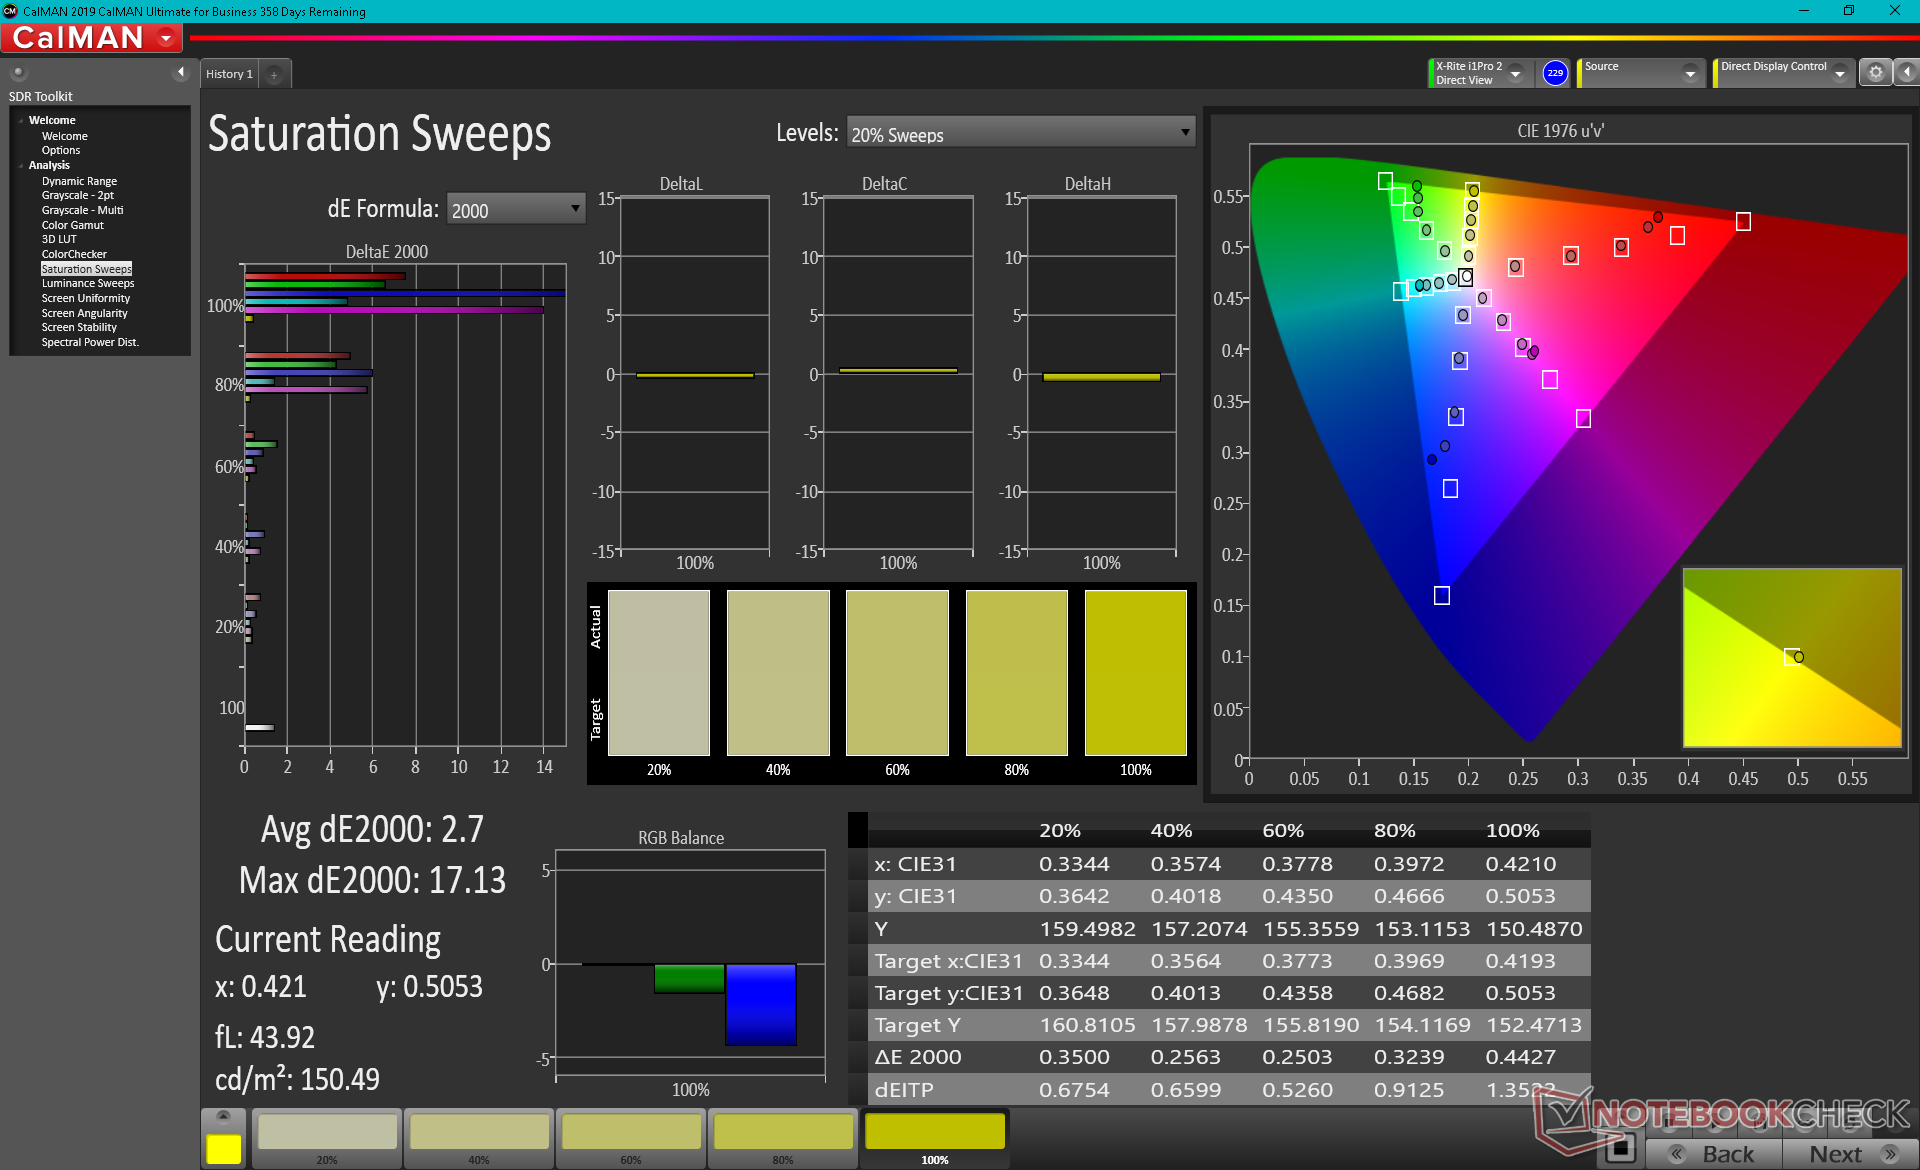
calibrated: 2.09
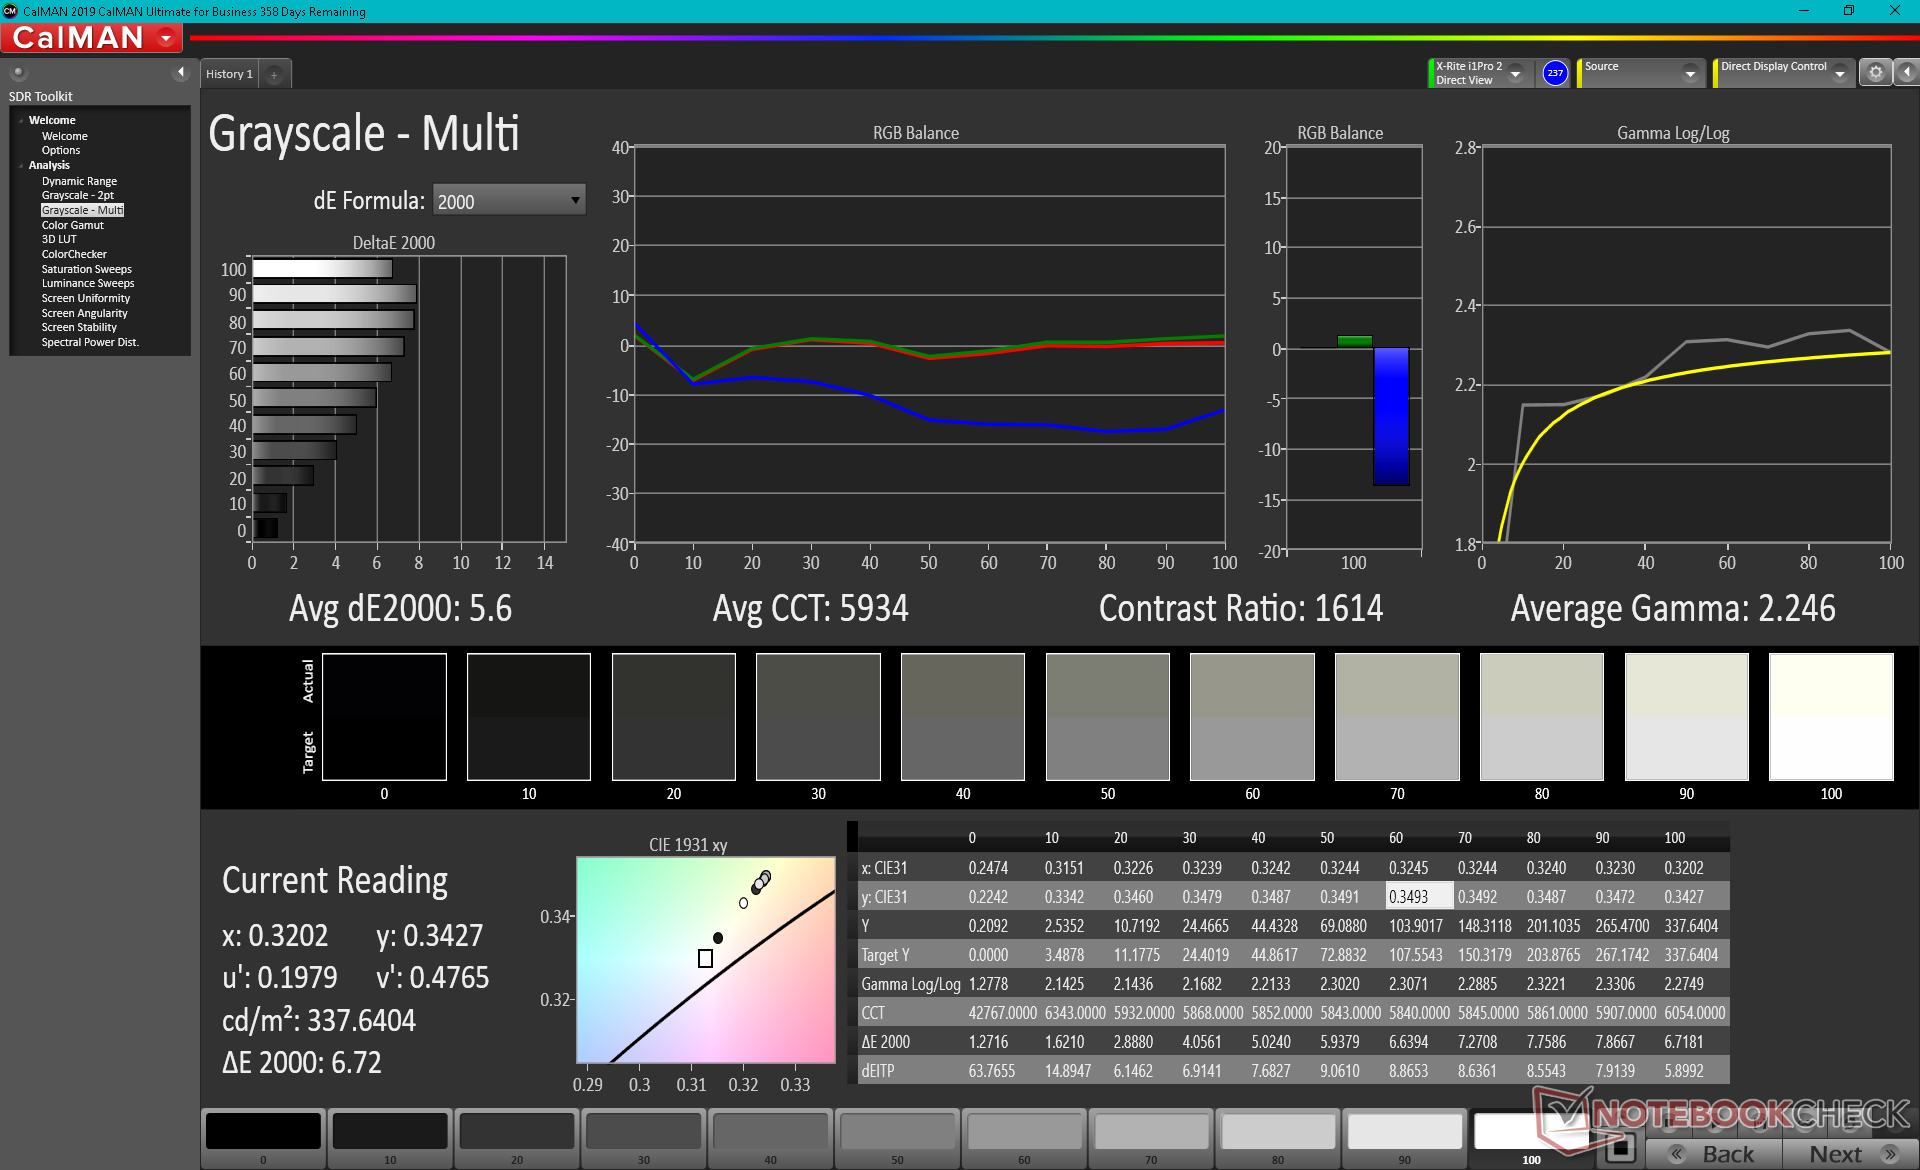
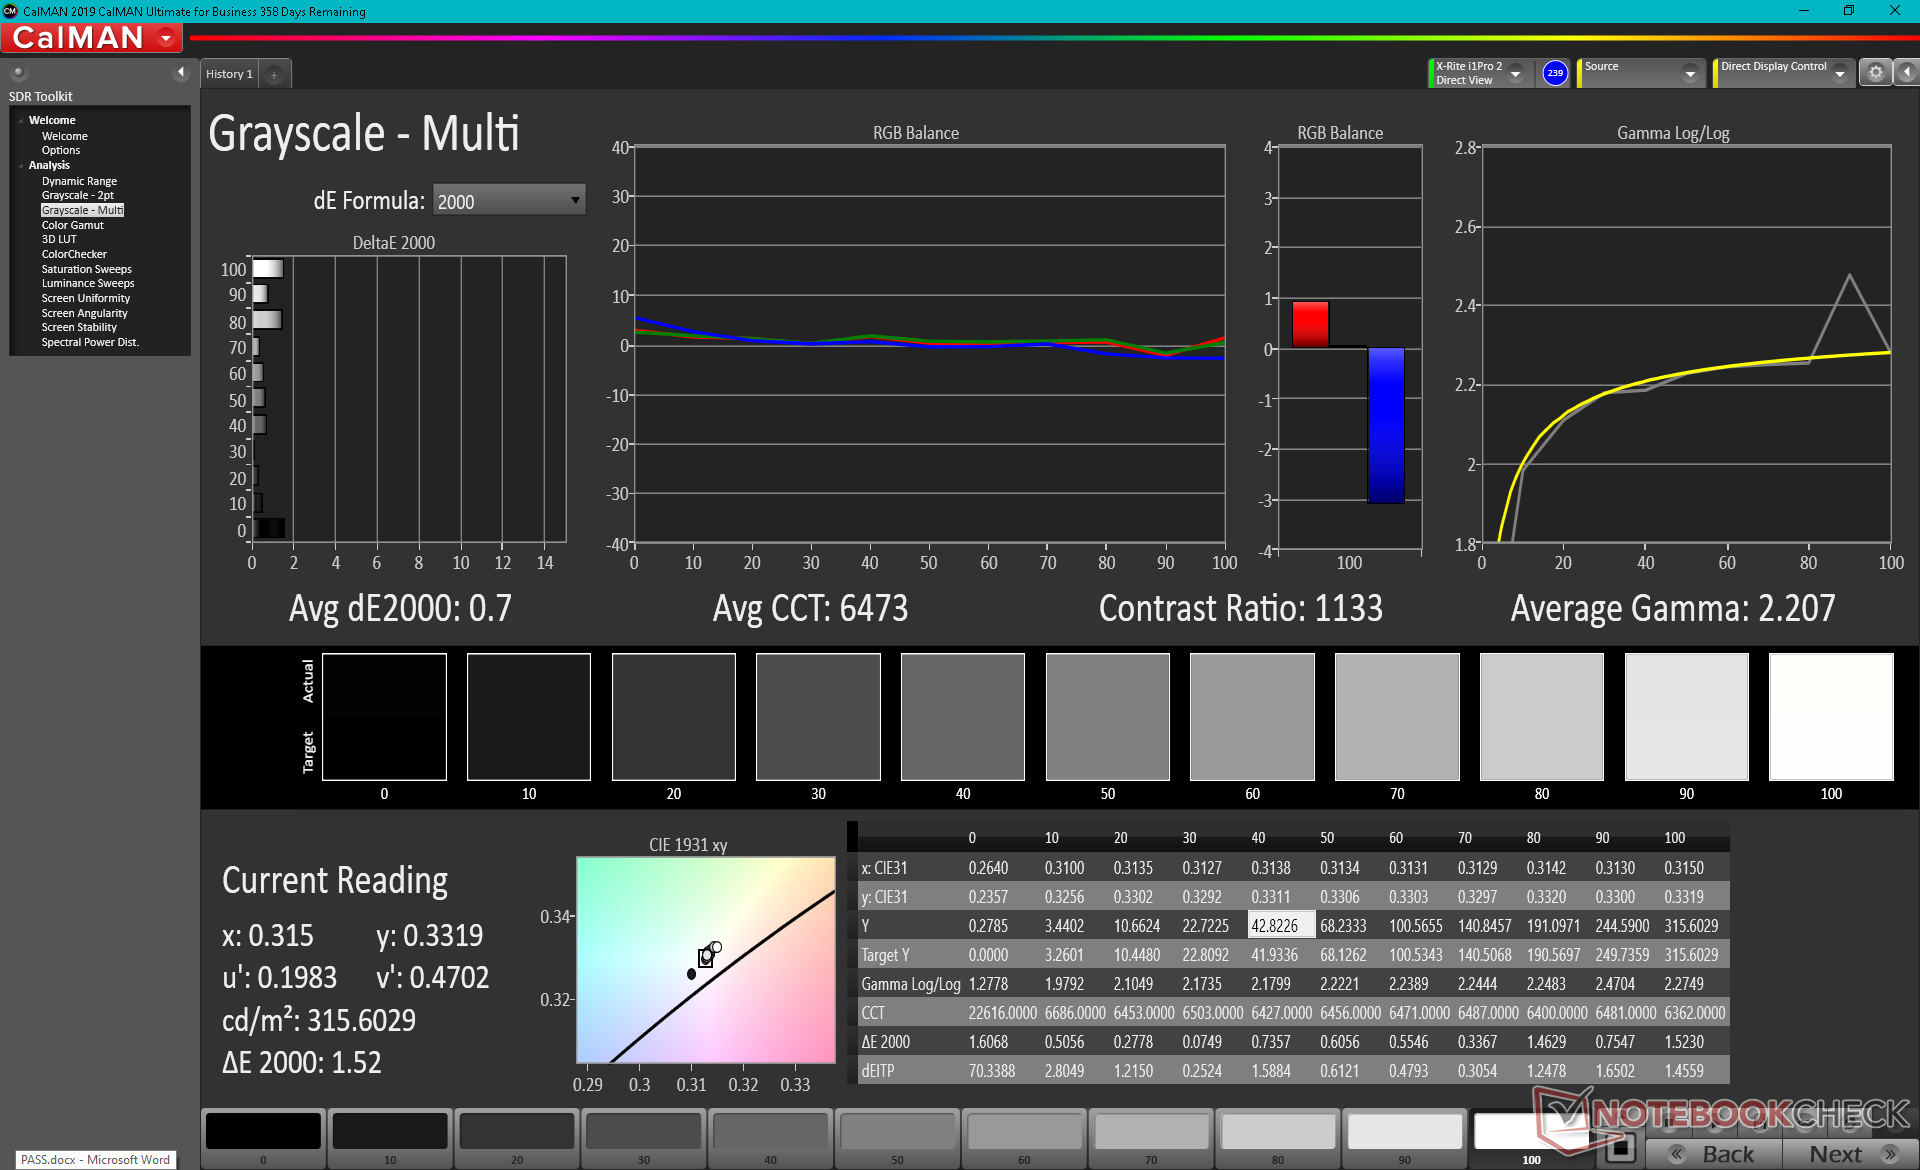
ΔE Greyscale Calman: 5.6 | ∀{0.09-98 Ø4.96}
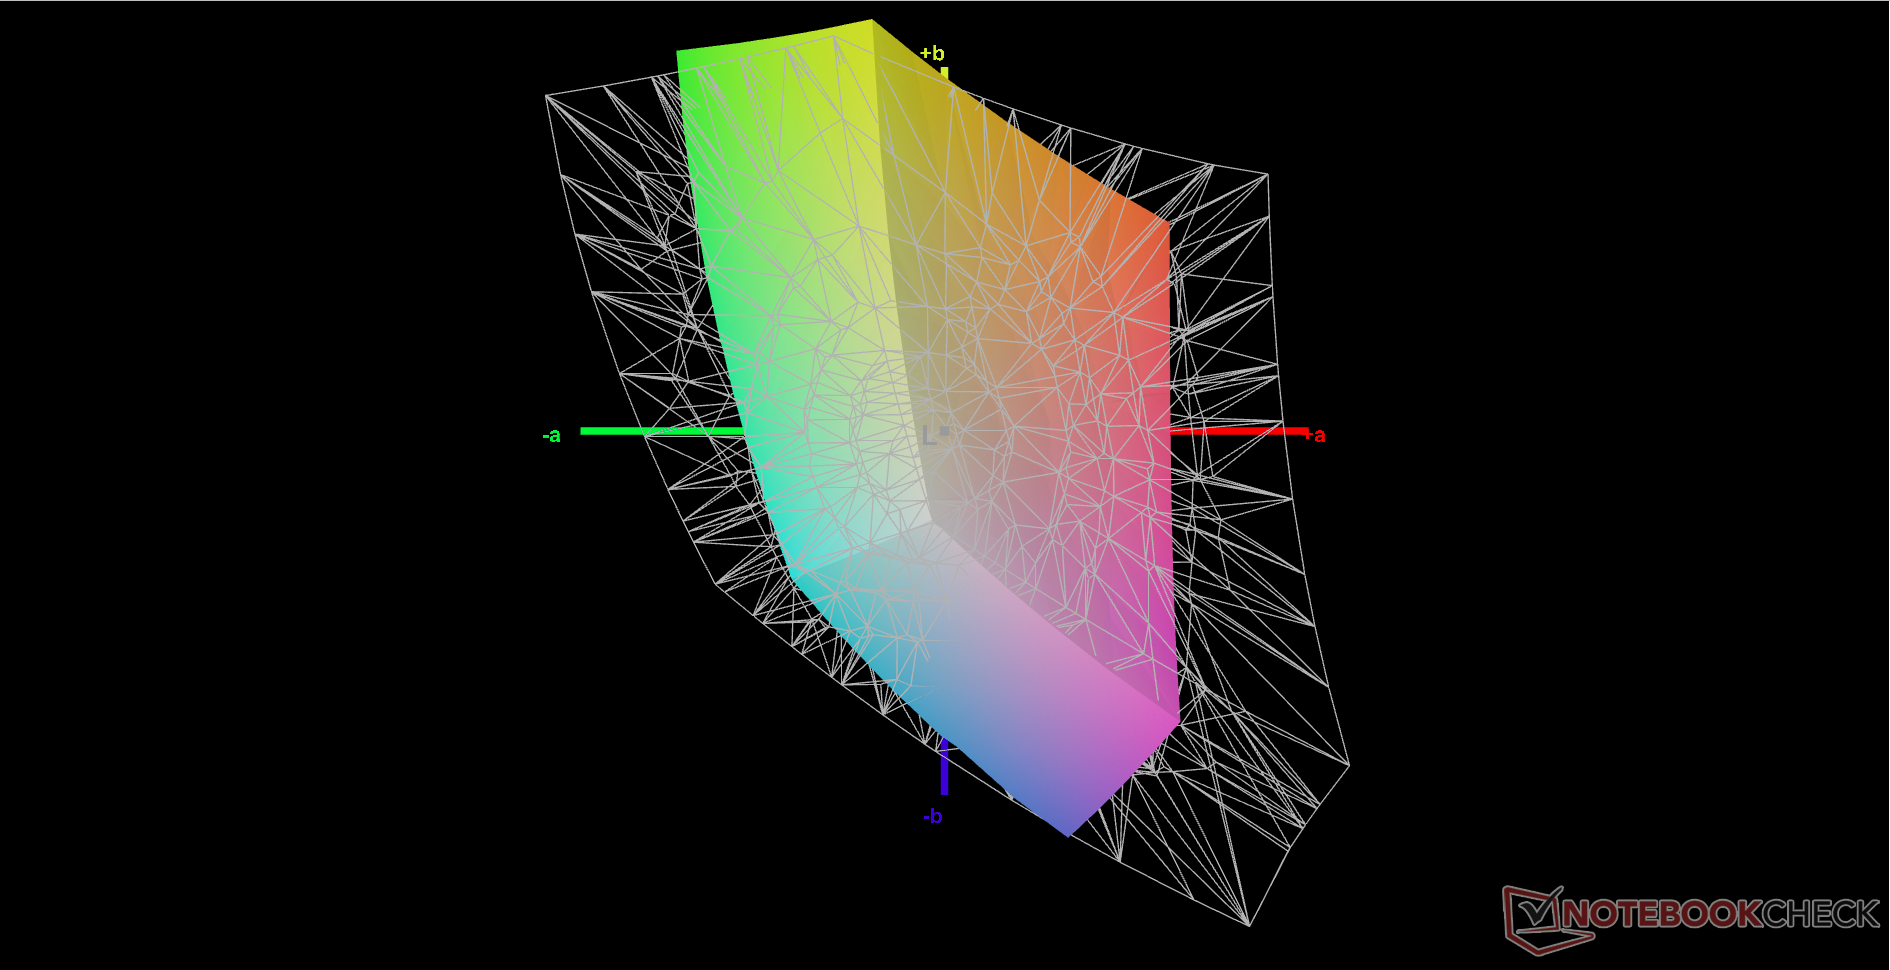
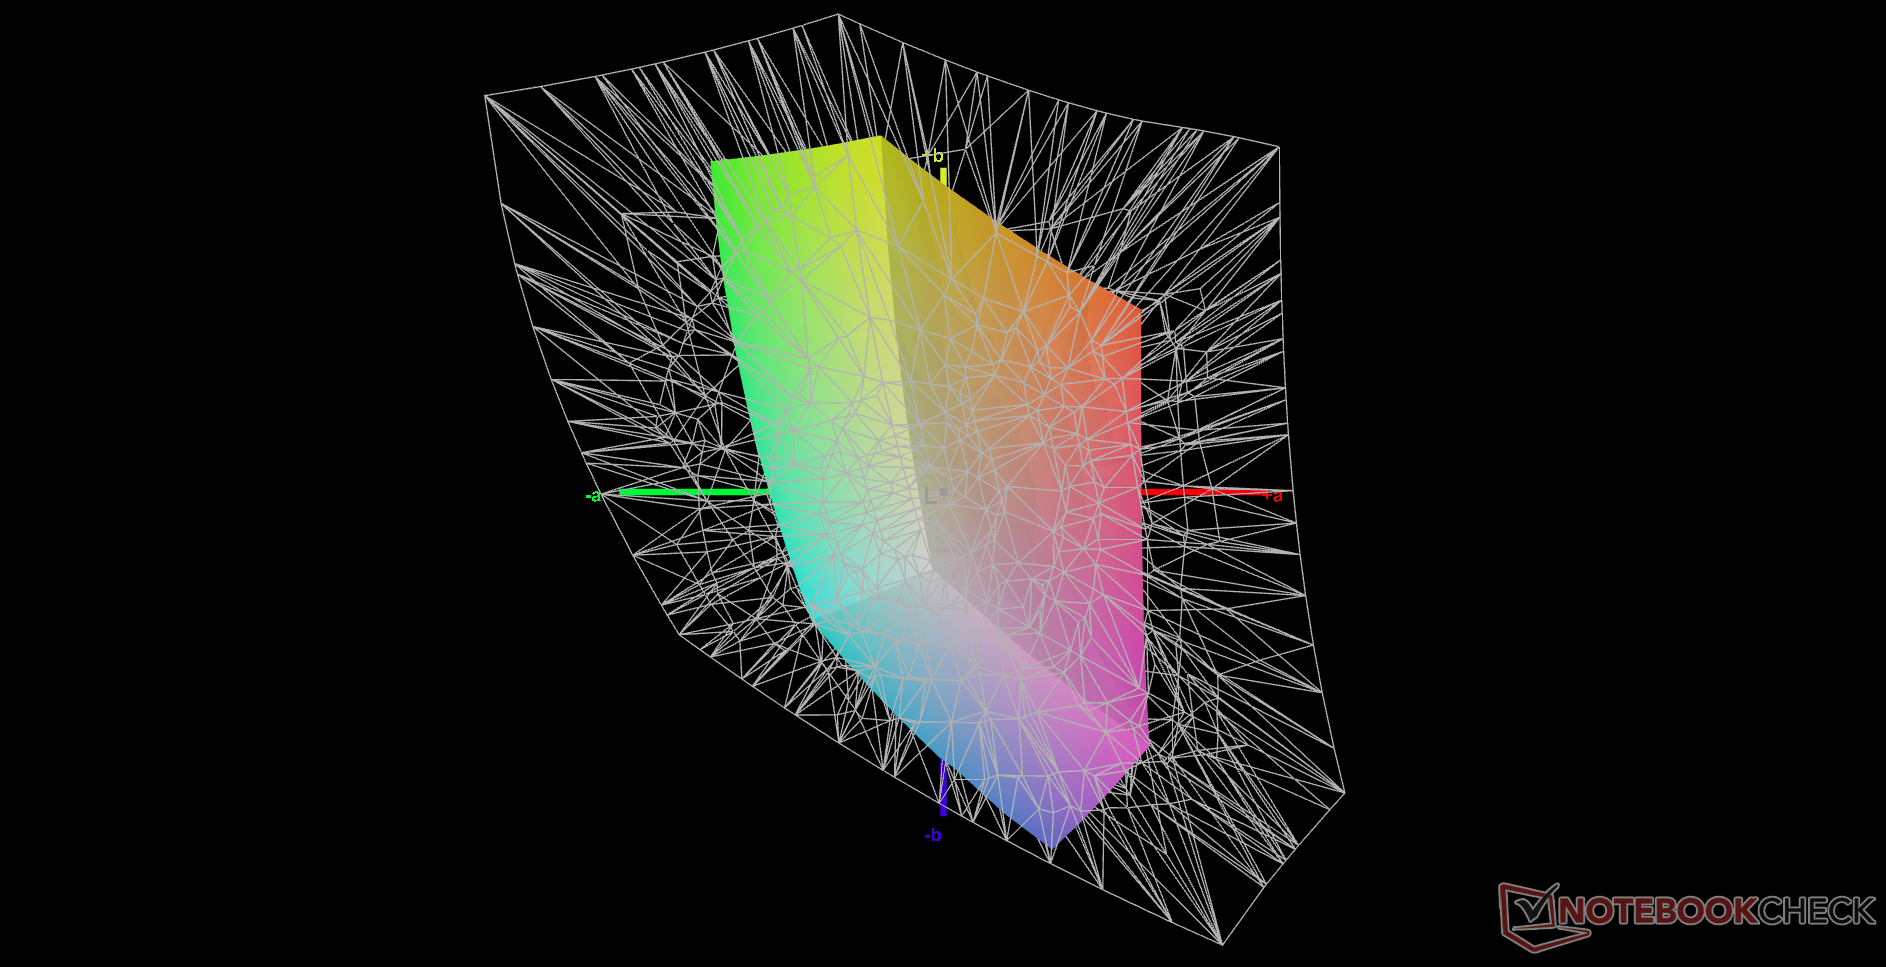
41.2% AdobeRGB 1998 (Argyll 3D)
57.7% sRGB (Argyll 3D)
40% Display P3 (Argyll 3D)
Gamma: 2.25
CCT: 5934 K
| Lenovo IdeaPad 3 15ALC6 BOE CQ NV156FHM-T07, IPS, 1920x1080, 15.6" | Lenovo IdeaPad 5 15IIL05 AU Optronics B156HAN02.1, IPS, 1920x1080, 15.6" | Lenovo Ideapad S540-15IML BOEhydis NV156FHM-N61 (BOE06FB), IPS, 1920x1080, 15.6" | Dell Inspiron 15 3501 BOE NV15N3D (Dell P/N: N39X1), IPS, 1920x1080, 15.6" | HP Pavilion 15-eg Chi Mei CMN1523, IPS, 1920x1080, 15.6" | Asus VivoBook 15 KM513UA-L503TS Samsung ATNA56YX03-0, OLED, 1920x1080, 15.6" | |
|---|---|---|---|---|---|---|
| Display | -5% | 57% | 0% | 9% | 119% | |
| Display P3 Coverage (%) | 40 | 37.63 -6% | 66.8 67% | 39.4 -1% | 42.9 7% | 99.9 150% |
| sRGB Coverage (%) | 57.7 | 56.5 -2% | 86.5 50% | 58.7 2% | 64 11% | 100 73% |
| AdobeRGB 1998 Coverage (%) | 41.2 | 38.88 -6% | 63.2 53% | 40.7 -1% | 44.4 8% | 96.7 135% |
| Response Times | -32% | -62% | -43% | 13% | 94% | |
| Response Time Grey 50% / Grey 80% * (ms) | 24.8 ? | 42 ? -69% | 49.6 ? -100% | 43 ? -73% | 22.8 ? 8% | 0.89 ? 96% |
| Response Time Black / White * (ms) | 28.4 ? | 27 ? 5% | 34.8 ? -23% | 32 ? -13% | 23.6 ? 17% | 2.31 ? 92% |
| PWM Frequency (Hz) | 202 ? | 1000 ? | 26320 ? | 60 ? | ||
| Screen | -15% | 5% | 21% | -7% | 33% | |
| Brightness middle (cd/m²) | 336.4 | 340 1% | 299 -11% | 271 -19% | 294.3 -13% | 401 19% |
| Brightness (cd/m²) | 318 | 325 2% | 278 -13% | 263 -17% | 251 -21% | 403 27% |
| Brightness Distribution (%) | 84 | 88 5% | 87 4% | 92 10% | 76 -10% | 98 17% |
| Black Level * (cd/m²) | 0.24 | 0.27 -13% | 0.25 -4% | 0.15 37% | 0.26 -8% | |
| Contrast (:1) | 1402 | 1259 -10% | 1196 -15% | 1807 29% | 1132 -19% | |
| Colorchecker dE 2000 * | 6.46 | 6.62 -2% | 4.32 33% | 4.83 25% | 4.08 37% | 3.24 50% |
| Colorchecker dE 2000 max. * | 19.75 | 21.05 -7% | 9.3 53% | 7 65% | 19.49 1% | 6.42 67% |
| Colorchecker dE 2000 calibrated * | 2.09 | 4.71 -125% | 2.58 -23% | 3.7 -77% | 2.13 -2% | |
| Greyscale dE 2000 * | 5.6 | 4.61 18% | 4.21 25% | 3.36 40% | 3 46% | 2.7 52% |
| Gamma | 2.25 98% | 2.74 80% | 2.39 92% | 2.56 86% | 2.21 100% | 2.14 103% |
| CCT | 5934 110% | 6262 104% | 6799 96% | 6764 96% | 6616 98% | 6374 102% |
| Color Space (Percent of AdobeRGB 1998) (%) | 36 | 57 | ||||
| Color Space (Percent of sRGB) (%) | 56 | 86 | ||||
| Media totale (Programma / Settaggio) | -17% /
-15% | 0% /
7% | -7% /
6% | 5% /
-1% | 82% /
65% |
* ... Meglio usare valori piccoli
Lo spazio colore è ristretto a solo il 58% di sRGB rispetto al 90% o più su Ultrabook più costosi di fascia media o superiore
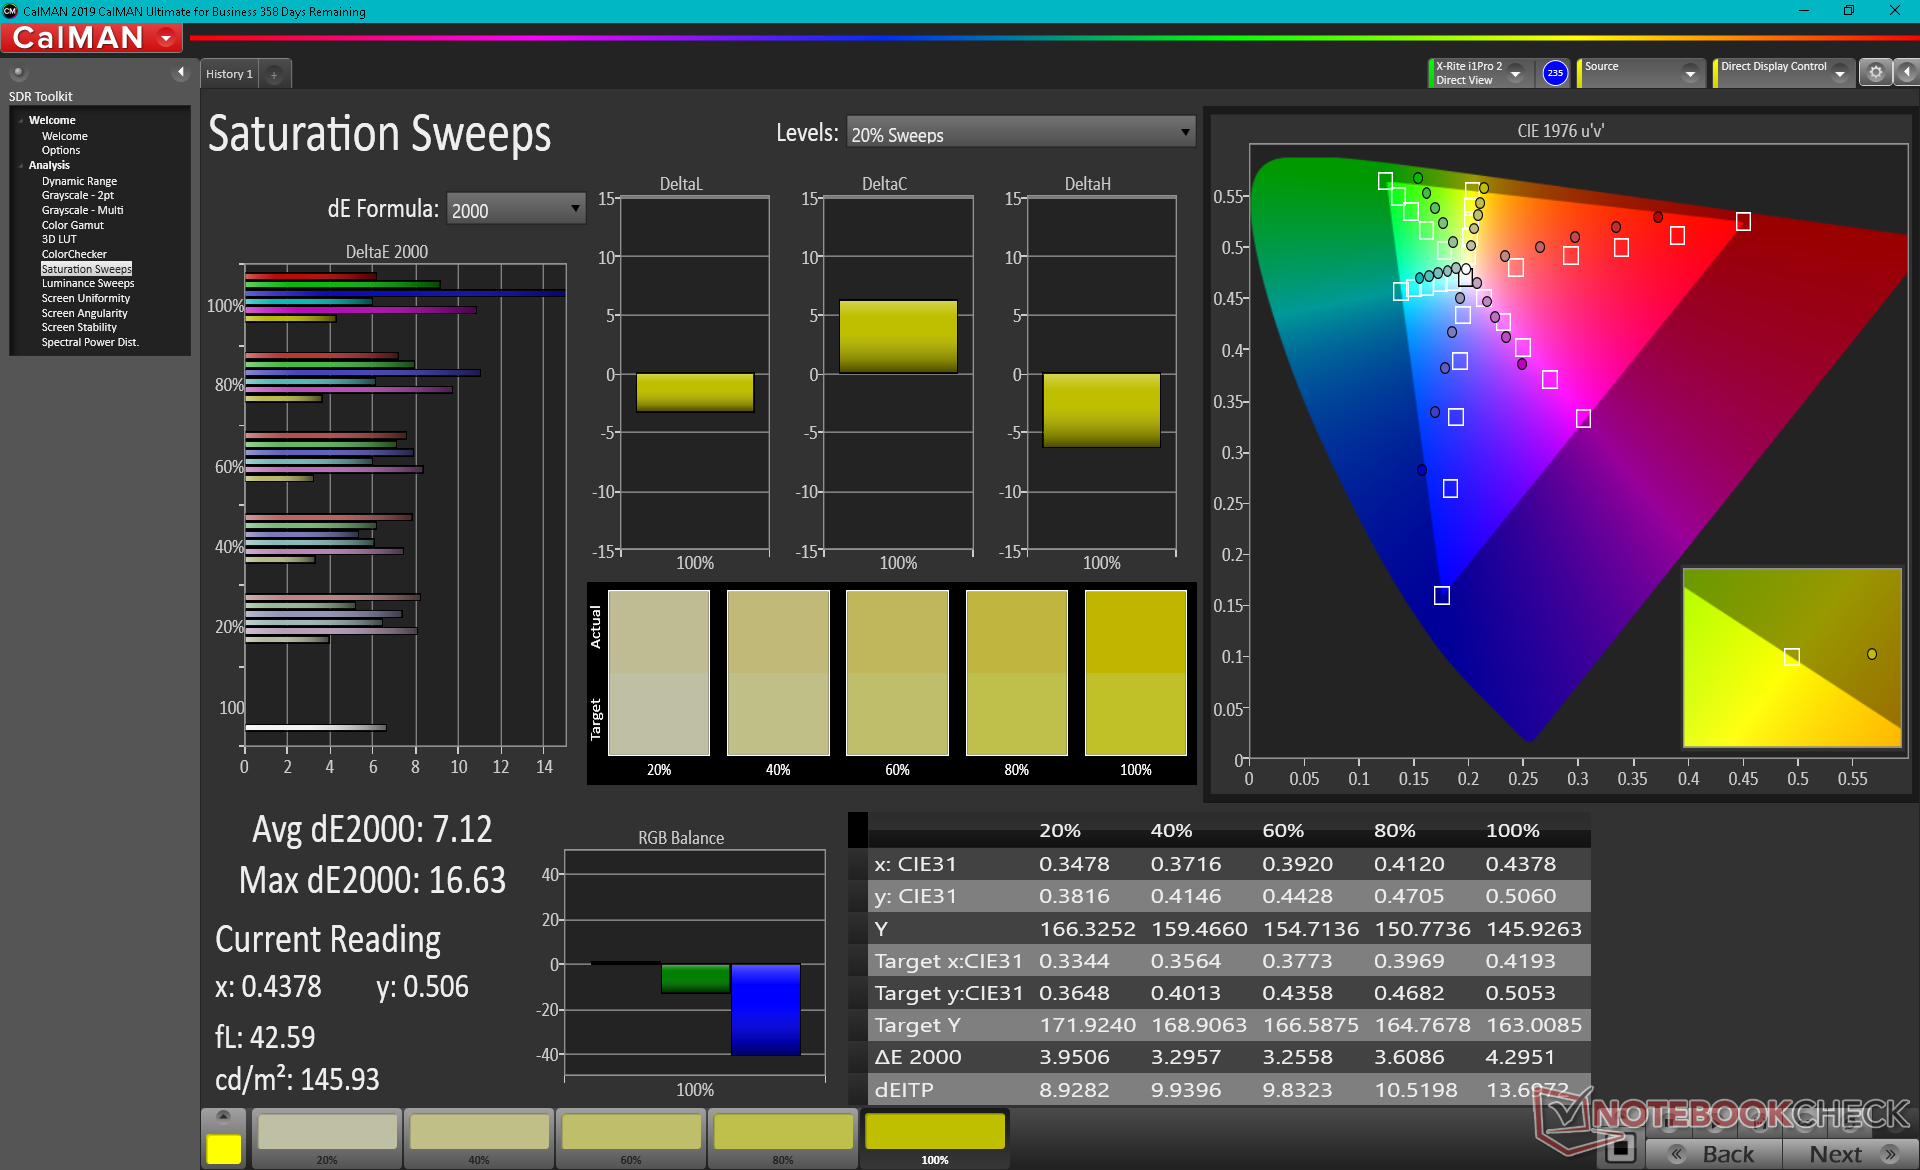
Il display non è ben calibrato fuori dalla scatola, come ci si può aspettare dalla maggior parte dei portatili economici. La temperatura del colore, per esempio, è troppo calda. Calibrando noi stessi il pannello con un colorimetro X-Rite, i valori DeltaE medi migliorerebbero significativamente, come mostrato dai nostri risultati qui sotto. Tuttavia, i colori sono ancora imprecisi ad alti livelli di saturazione a causa del limitato spazio di colore menzionato sopra, con il blu che è il colpevole più notevole
Tempi di risposta del Display
| ↔ Tempi di risposta dal Nero al Bianco | ||
|---|---|---|
| 28.4 ms ... aumenta ↗ e diminuisce ↘ combinato | ↗ 17.2 ms Incremento | 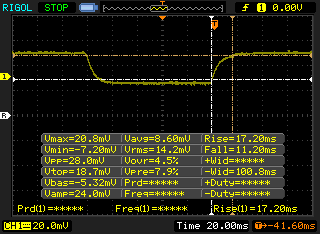 |
| ↘ 11.2 ms Calo | ||
| Lo schermo mostra tempi di risposta relativamente lenti nei nostri tests e potrebbe essere troppo lento per i gamers. In confronto, tutti i dispositivi di test variano da 0.1 (minimo) a 240 (massimo) ms. » 75 % di tutti i dispositivi è migliore. Questo significa che i tempi di risposta rilevati sono peggiori rispetto alla media di tutti i dispositivi testati (19.8 ms). | ||
| ↔ Tempo di risposta dal 50% Grigio all'80% Grigio | ||
| 24.8 ms ... aumenta ↗ e diminuisce ↘ combinato | ↗ 10.8 ms Incremento | 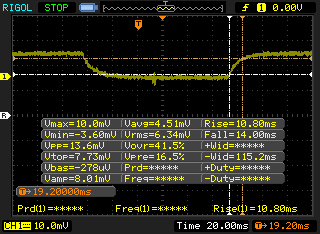 |
| ↘ 14 ms Calo | ||
| Lo schermo mostra buoni tempi di risposta durante i nostri tests, ma potrebbe essere troppo lento per i gamers competitivi. In confronto, tutti i dispositivi di test variano da 0.165 (minimo) a 636 (massimo) ms. » 35 % di tutti i dispositivi è migliore. Questo significa che i tempi di risposta rilevati sono migliori rispettto alla media di tutti i dispositivi testati (31 ms). | ||
Sfarfallio dello schermo / PWM (Pulse-Width Modulation)
| flickering dello schermo / PWM non rilevato | 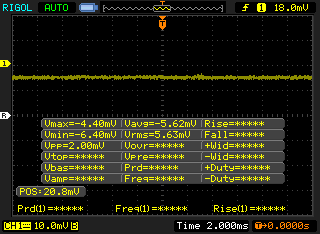 | ||
In confronto: 52 % di tutti i dispositivi testati non utilizza PWM per ridurre la luminosita' del display. Se è rilevato PWM, una media di 7757 (minimo: 5 - massimo: 343500) Hz è stata rilevata. | |||
La visibilità all'aperto è decente quando è all'ombra grazie al display ragionevolmente luminoso da 300 nit. Basta essere sicuri di disabilitare AMD Vari-Bright che è abilitato di default attraverso il software AMD, altrimenti la luminosità massima si abbasserà automaticamente quando si usa la batteria

Performance
Condizioni di test
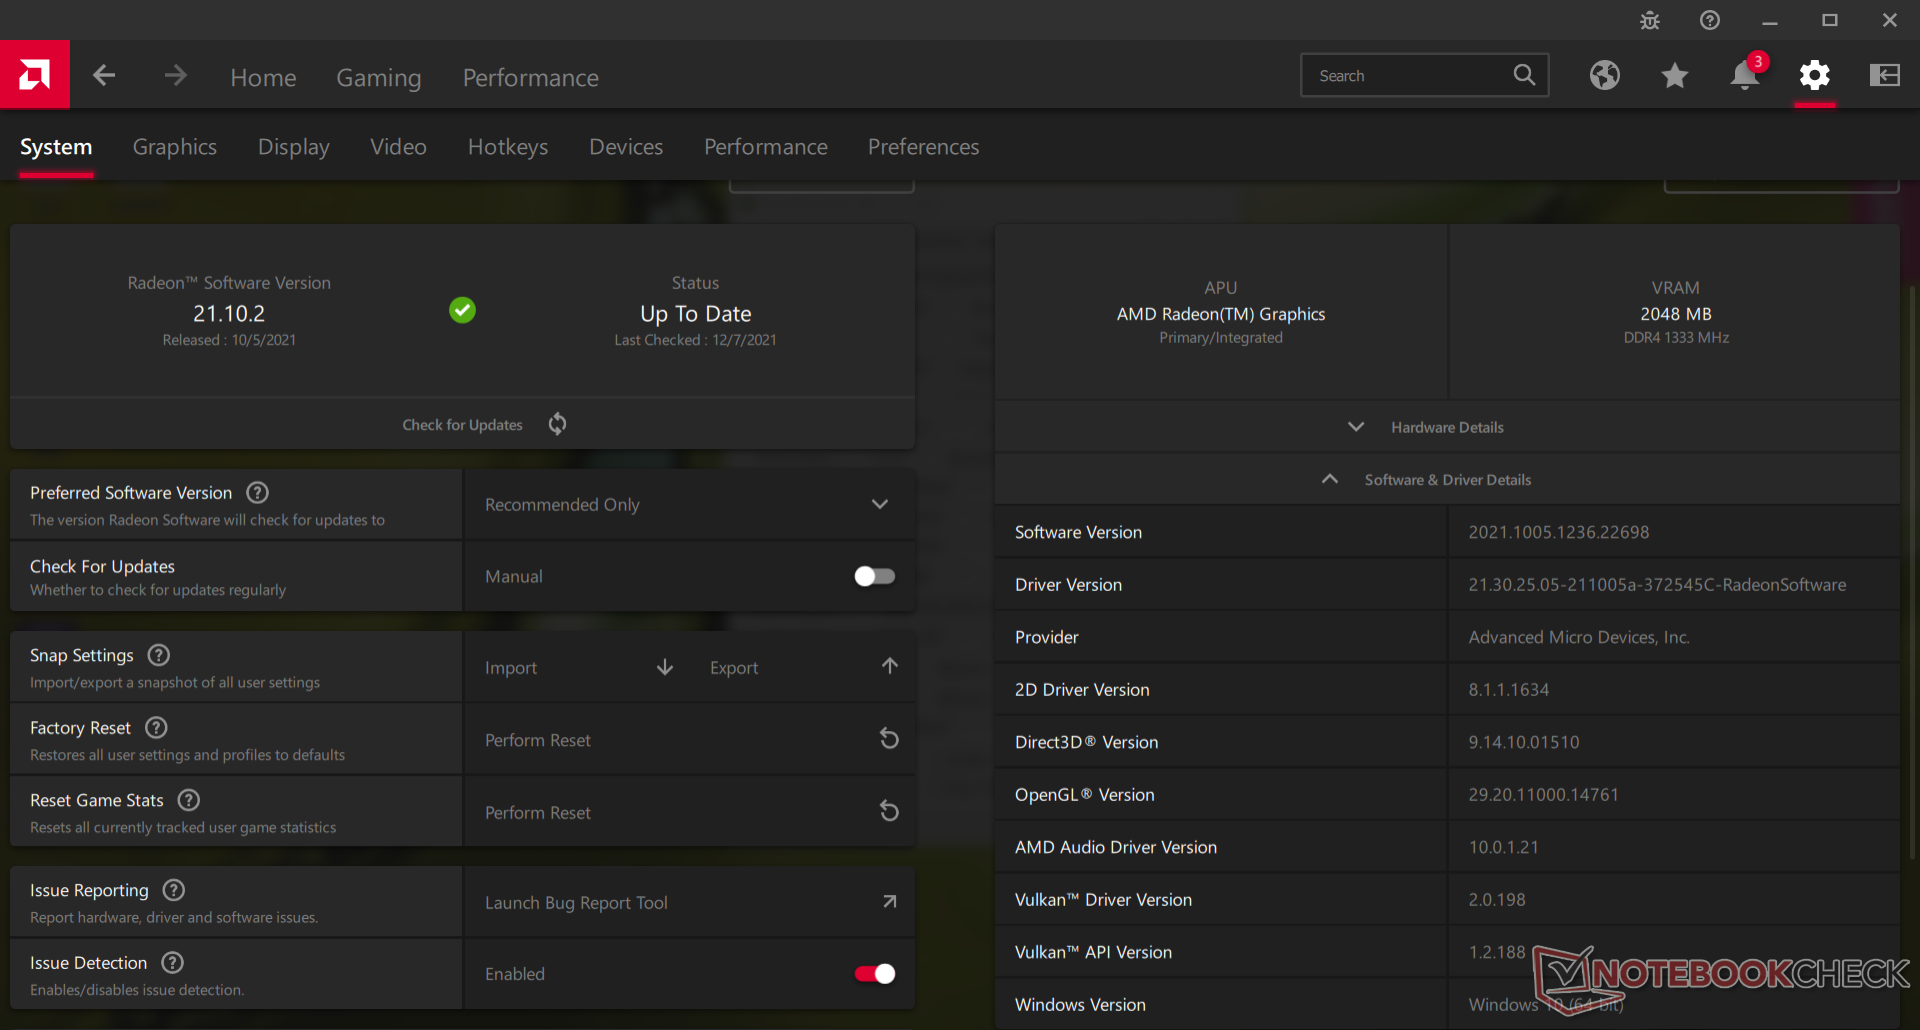
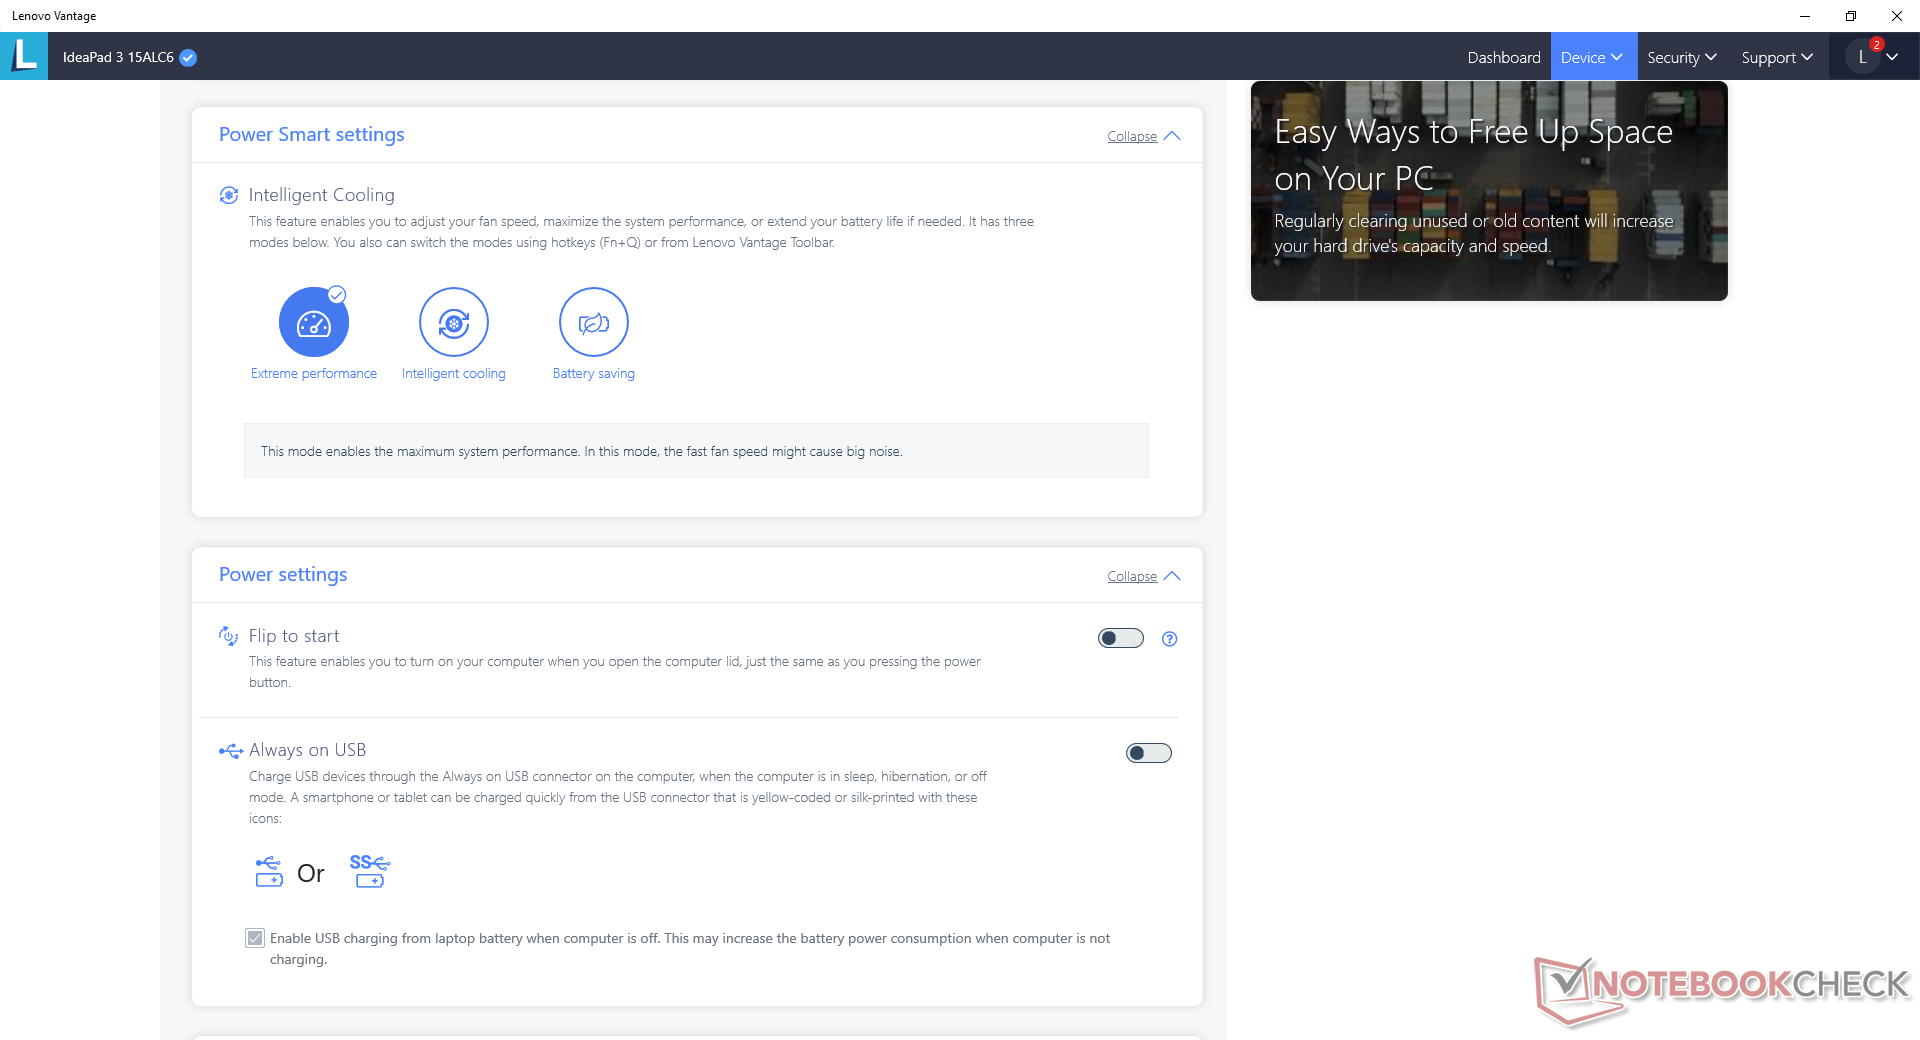
La nostra unità è stata impostata in modalità Extreme Performance tramite il software preinstallato Lenovo Vantage per ottenere i più alti punteggi di benchmark possibili. Raccomandiamo agli utenti di familiarizzare sia con Vantage che con il software AMD Radeon, dato che molte caratteristiche chiave del sistema e gli aggiornamenti sono regolati qui.
Processore - Veloce per un Ryzen 3
Le prestazioni della CPU sono eccellenti se si considera che il Ryzen 3 è posizionato come un'alternativa al Core i3. Il suo vantaggio più evidente risiede nelle sue prestazioni multi-thread che possono essere fino al 70-80% più veloci del concorrente Core i3-1115G4 dal momento che il Ryzen 3 5300U ha il doppio dei core fisici. Le prestazioni multi-thread grezze sono in realtà paragonabili alCore i7-1165G7 mentre le prestazioni single-thread sono solo circa il 25 per cento più lente.
La sostenibilità delle prestazioni è eccellente senza grandi problemi di throttling quando si esegue CineBench R15 xT in un ciclo continuo.
Cinebench R15 Multi Loop
Cinebench R23: Multi Core | Single Core
Cinebench R20: CPU (Multi Core) | CPU (Single Core)
Cinebench R15: CPU Multi 64Bit | CPU Single 64Bit
Blender: v2.79 BMW27 CPU
7-Zip 18.03: 7z b 4 | 7z b 4 -mmt1
Geekbench 5.5: Multi-Core | Single-Core
HWBOT x265 Benchmark v2.2: 4k Preset
LibreOffice : 20 Documents To PDF
R Benchmark 2.5: Overall mean
| CPU Performance rating | |
| Asus VivoBook S15 D533UA | |
| MSI Prestige 15 A10SC -10! | |
| Asus VivoBook 15 KM513UA-L503TS | |
| HP Pavilion 15-eg -2! | |
| HP Pavilion x360 15-er0155ng | |
| Lenovo IdeaPad 3 15ALC6 | |
| Lenovo IdeaPad 5 15IIL05 -2! | |
| Media AMD Ryzen 3 5300U | |
| Lenovo Ideapad S540-15IML -10! | |
| Lenovo ThinkPad L15 G2-20X4S0KU00 | |
| Teclast TBOLT F15 Pro | |
| HP 255 G7 159P1EA | |
| Beelink U59 -2! | |
Cinebench R23: Multi Core | Single Core
Cinebench R20: CPU (Multi Core) | CPU (Single Core)
Cinebench R15: CPU Multi 64Bit | CPU Single 64Bit
Blender: v2.79 BMW27 CPU
7-Zip 18.03: 7z b 4 | 7z b 4 -mmt1
Geekbench 5.5: Multi-Core | Single-Core
HWBOT x265 Benchmark v2.2: 4k Preset
LibreOffice : 20 Documents To PDF
R Benchmark 2.5: Overall mean
* ... Meglio usare valori piccoli
AIDA64: FP32 Ray-Trace | FPU Julia | CPU SHA3 | CPU Queen | FPU SinJulia | FPU Mandel | CPU AES | CPU ZLib | FP64 Ray-Trace | CPU PhotoWorxx
| Performance rating | |
| Asus VivoBook 15 KM513UA-L503TS | |
| HP Pavilion 15-eg | |
| Lenovo IdeaPad 3 15ALC6 | |
| Lenovo IdeaPad 5 15IIL05 | |
| Dell Inspiron 15 3501 | |
| Media AMD Ryzen 3 5300U | |
| AIDA64 / FP32 Ray-Trace | |
| Asus VivoBook 15 KM513UA-L503TS | |
| Lenovo IdeaPad 3 15ALC6 | |
| Lenovo IdeaPad 5 15IIL05 | |
| HP Pavilion 15-eg | |
| Dell Inspiron 15 3501 | |
| Media AMD Ryzen 3 5300U (3612 - 7053, n=3) | |
| AIDA64 / FPU Julia | |
| Asus VivoBook 15 KM513UA-L503TS | |
| Lenovo IdeaPad 3 15ALC6 | |
| Media AMD Ryzen 3 5300U (33606 - 37829, n=3) | |
| Lenovo IdeaPad 5 15IIL05 | |
| HP Pavilion 15-eg | |
| Dell Inspiron 15 3501 | |
| AIDA64 / CPU SHA3 | |
| Lenovo IdeaPad 5 15IIL05 | |
| HP Pavilion 15-eg | |
| Dell Inspiron 15 3501 | |
| Asus VivoBook 15 KM513UA-L503TS | |
| Lenovo IdeaPad 3 15ALC6 | |
| Media AMD Ryzen 3 5300U (1244 - 1248, n=2) | |
| AIDA64 / CPU Queen | |
| Asus VivoBook 15 KM513UA-L503TS | |
| Lenovo IdeaPad 3 15ALC6 | |
| Media AMD Ryzen 3 5300U (51280 - 51454, n=3) | |
| HP Pavilion 15-eg | |
| Dell Inspiron 15 3501 | |
| Lenovo IdeaPad 5 15IIL05 | |
| AIDA64 / FPU SinJulia | |
| Asus VivoBook 15 KM513UA-L503TS | |
| Lenovo IdeaPad 3 15ALC6 | |
| Media AMD Ryzen 3 5300U (6686 - 6703, n=3) | |
| HP Pavilion 15-eg | |
| Dell Inspiron 15 3501 | |
| Lenovo IdeaPad 5 15IIL05 | |
| AIDA64 / FPU Mandel | |
| Asus VivoBook 15 KM513UA-L503TS | |
| Lenovo IdeaPad 3 15ALC6 | |
| Media AMD Ryzen 3 5300U (17564 - 20109, n=3) | |
| HP Pavilion 15-eg | |
| Lenovo IdeaPad 5 15IIL05 | |
| Dell Inspiron 15 3501 | |
| AIDA64 / CPU AES | |
| HP Pavilion 15-eg | |
| Dell Inspiron 15 3501 | |
| Lenovo IdeaPad 5 15IIL05 | |
| Asus VivoBook 15 KM513UA-L503TS | |
| Lenovo IdeaPad 3 15ALC6 | |
| Media AMD Ryzen 3 5300U (19307 - 34964, n=3) | |
| AIDA64 / CPU ZLib | |
| Asus VivoBook 15 KM513UA-L503TS | |
| Lenovo IdeaPad 3 15ALC6 | |
| Media AMD Ryzen 3 5300U (374 - 396, n=3) | |
| Dell Inspiron 15 3501 | |
| Lenovo IdeaPad 5 15IIL05 | |
| HP Pavilion 15-eg | |
| AIDA64 / FP64 Ray-Trace | |
| Asus VivoBook 15 KM513UA-L503TS | |
| Lenovo IdeaPad 3 15ALC6 | |
| Media AMD Ryzen 3 5300U (3199 - 3768, n=3) | |
| Lenovo IdeaPad 5 15IIL05 | |
| Dell Inspiron 15 3501 | |
| HP Pavilion 15-eg | |
| AIDA64 / CPU PhotoWorxx | |
| HP Pavilion 15-eg | |
| Lenovo IdeaPad 5 15IIL05 | |
| Lenovo IdeaPad 3 15ALC6 | |
| Dell Inspiron 15 3501 | |
| Media AMD Ryzen 3 5300U (16799 - 17037, n=3) | |
| Asus VivoBook 15 KM513UA-L503TS | |
Prestazioni del sistema
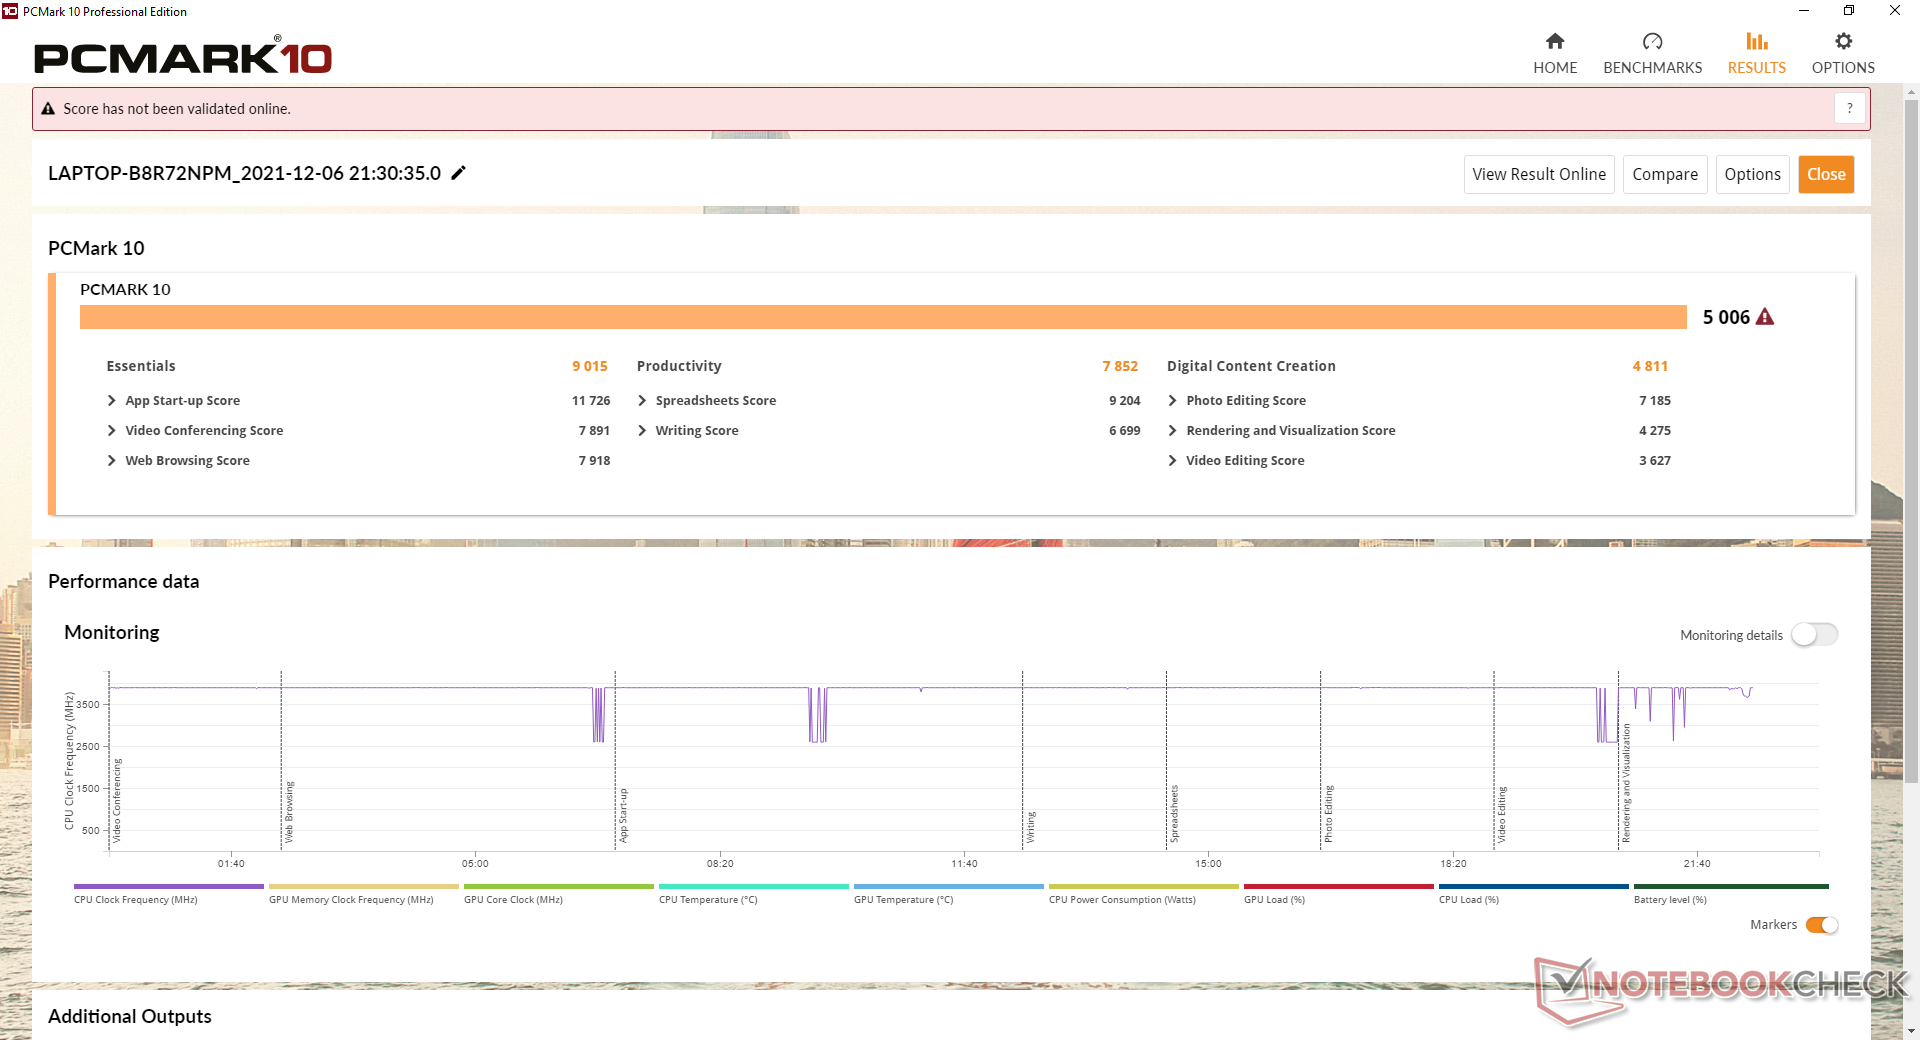
I risultati di PCMark sono paragonabili ai computer portatili che girano con il più costoso Intel Core i7-1165G7 come il Dell Inspiron 15 3501. L'esperienza UI è altrettanto fluida e burrosa nonostante "solo" l'esecuzione su una CPU Ryzen 3 economica.
| PCMark 10 / Score | |
| HP Pavilion 15-eg | |
| Asus VivoBook 15 KM513UA-L503TS | |
| Lenovo IdeaPad 3 15ALC6 | |
| Dell Inspiron 15 3501 | |
| Media AMD Ryzen 3 5300U, AMD Radeon RX Vega 6 (Ryzen 4000/5000) (4299 - 5006, n=3) | |
| Lenovo Ideapad S540-15IML | |
| Lenovo IdeaPad 5 15IIL05 | |
| PCMark 10 / Essentials | |
| HP Pavilion 15-eg | |
| Dell Inspiron 15 3501 | |
| Lenovo Ideapad S540-15IML | |
| Asus VivoBook 15 KM513UA-L503TS | |
| Lenovo IdeaPad 3 15ALC6 | |
| Media AMD Ryzen 3 5300U, AMD Radeon RX Vega 6 (Ryzen 4000/5000) (7833 - 9015, n=3) | |
| Lenovo IdeaPad 5 15IIL05 | |
| PCMark 10 / Productivity | |
| HP Pavilion 15-eg | |
| Lenovo IdeaPad 3 15ALC6 | |
| Asus VivoBook 15 KM513UA-L503TS | |
| Lenovo Ideapad S540-15IML | |
| Media AMD Ryzen 3 5300U, AMD Radeon RX Vega 6 (Ryzen 4000/5000) (6596 - 7852, n=3) | |
| Lenovo IdeaPad 5 15IIL05 | |
| Dell Inspiron 15 3501 | |
| PCMark 10 / Digital Content Creation | |
| HP Pavilion 15-eg | |
| Asus VivoBook 15 KM513UA-L503TS | |
| Dell Inspiron 15 3501 | |
| Lenovo IdeaPad 3 15ALC6 | |
| Media AMD Ryzen 3 5300U, AMD Radeon RX Vega 6 (Ryzen 4000/5000) (4136 - 4811, n=3) | |
| Lenovo IdeaPad 5 15IIL05 | |
| Lenovo Ideapad S540-15IML | |
| PCMark 10 Score | 5006 punti | |
Aiuto | ||
| AIDA64 / Memory Copy | |
| HP Pavilion 15-eg | |
| Asus VivoBook 15 KM513UA-L503TS | |
| Lenovo IdeaPad 5 15IIL05 | |
| Media AMD Ryzen 3 5300U (30710 - 36092, n=3) | |
| Lenovo IdeaPad 3 15ALC6 | |
| Dell Inspiron 15 3501 | |
| AIDA64 / Memory Read | |
| HP Pavilion 15-eg | |
| Asus VivoBook 15 KM513UA-L503TS | |
| Lenovo IdeaPad 5 15IIL05 | |
| Dell Inspiron 15 3501 | |
| Lenovo IdeaPad 3 15ALC6 | |
| Media AMD Ryzen 3 5300U (34493 - 35443, n=3) | |
| AIDA64 / Memory Write | |
| HP Pavilion 15-eg | |
| Lenovo IdeaPad 5 15IIL05 | |
| Media AMD Ryzen 3 5300U (38052 - 40554, n=3) | |
| Asus VivoBook 15 KM513UA-L503TS | |
| Lenovo IdeaPad 3 15ALC6 | |
| Dell Inspiron 15 3501 | |
| AIDA64 / Memory Latency | |
| Media AMD Ryzen 3 5300U (97.1 - 113.5, n=3) | |
| Lenovo IdeaPad 3 15ALC6 | |
| Asus VivoBook 15 KM513UA-L503TS | |
| Dell Inspiron 15 3501 | |
| Lenovo IdeaPad 5 15IIL05 | |
| HP Pavilion 15-eg | |
* ... Meglio usare valori piccoli
Latenza DPC
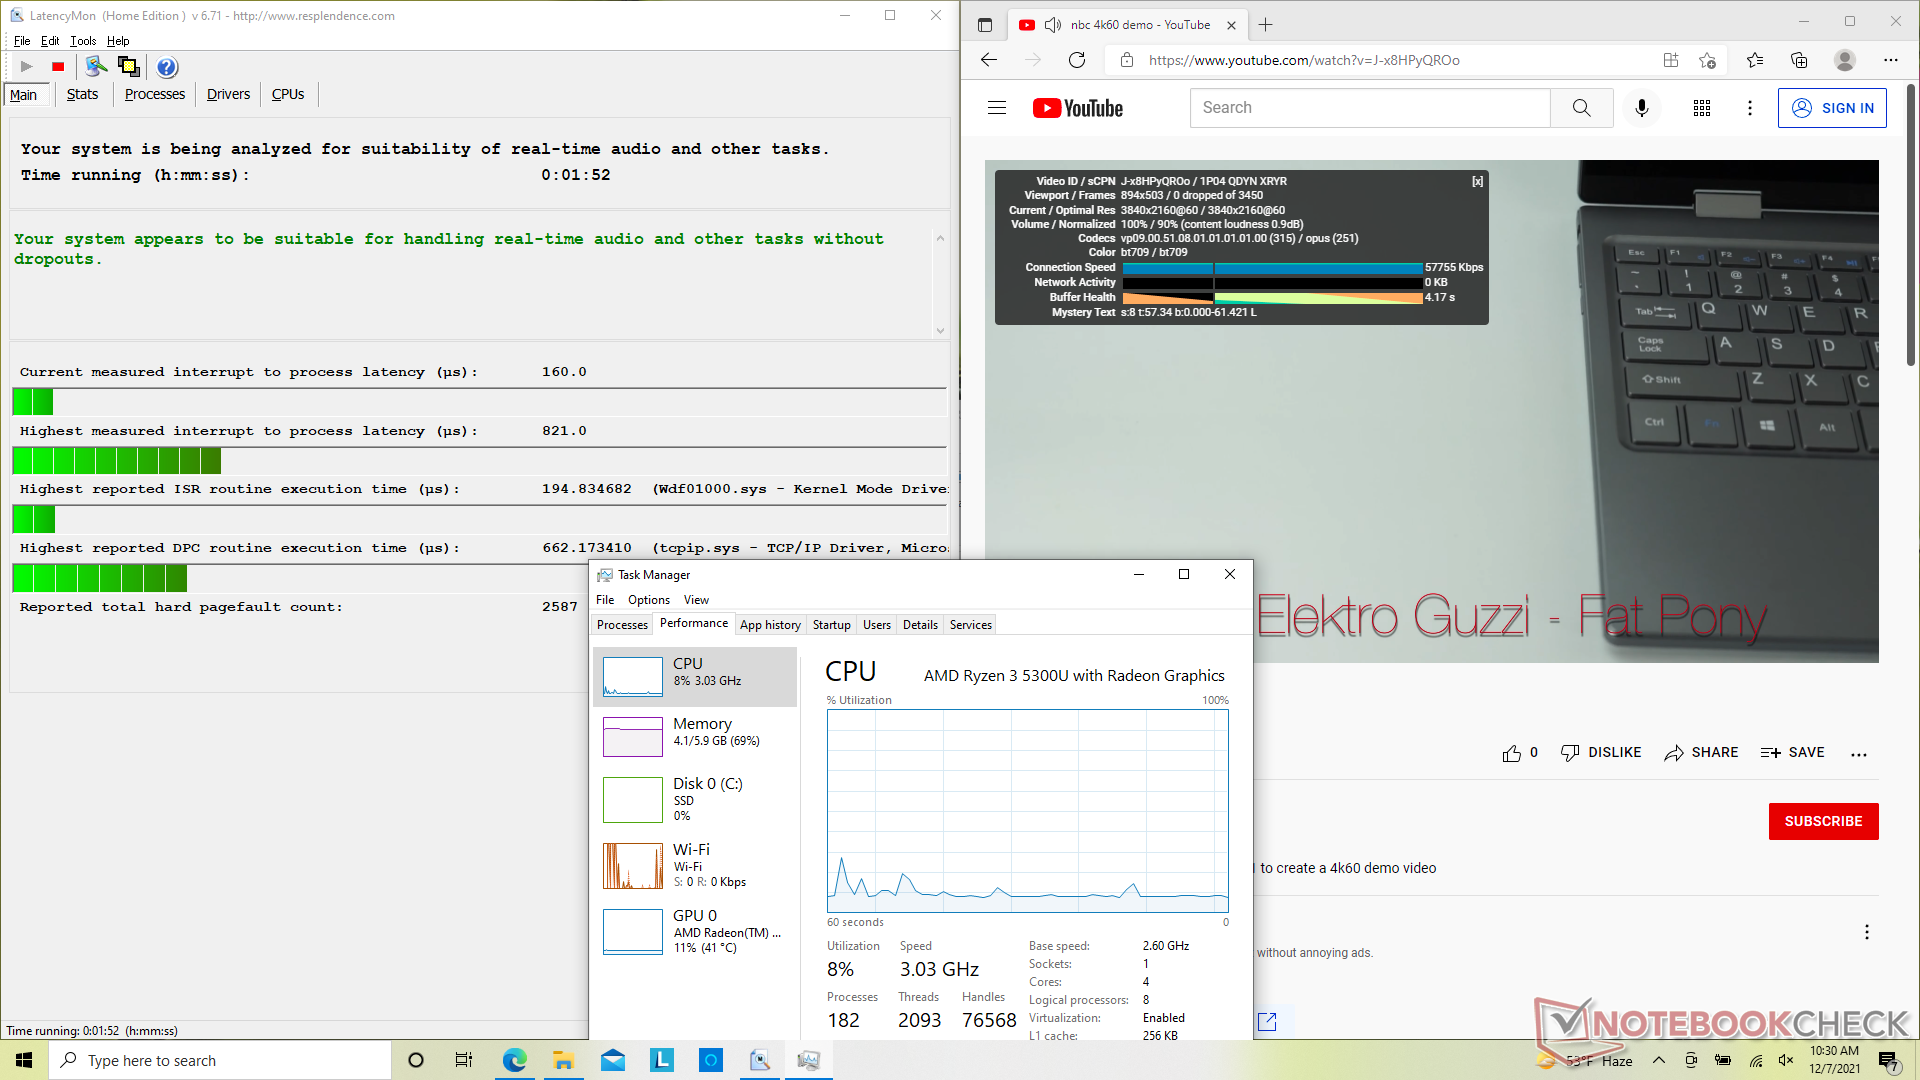
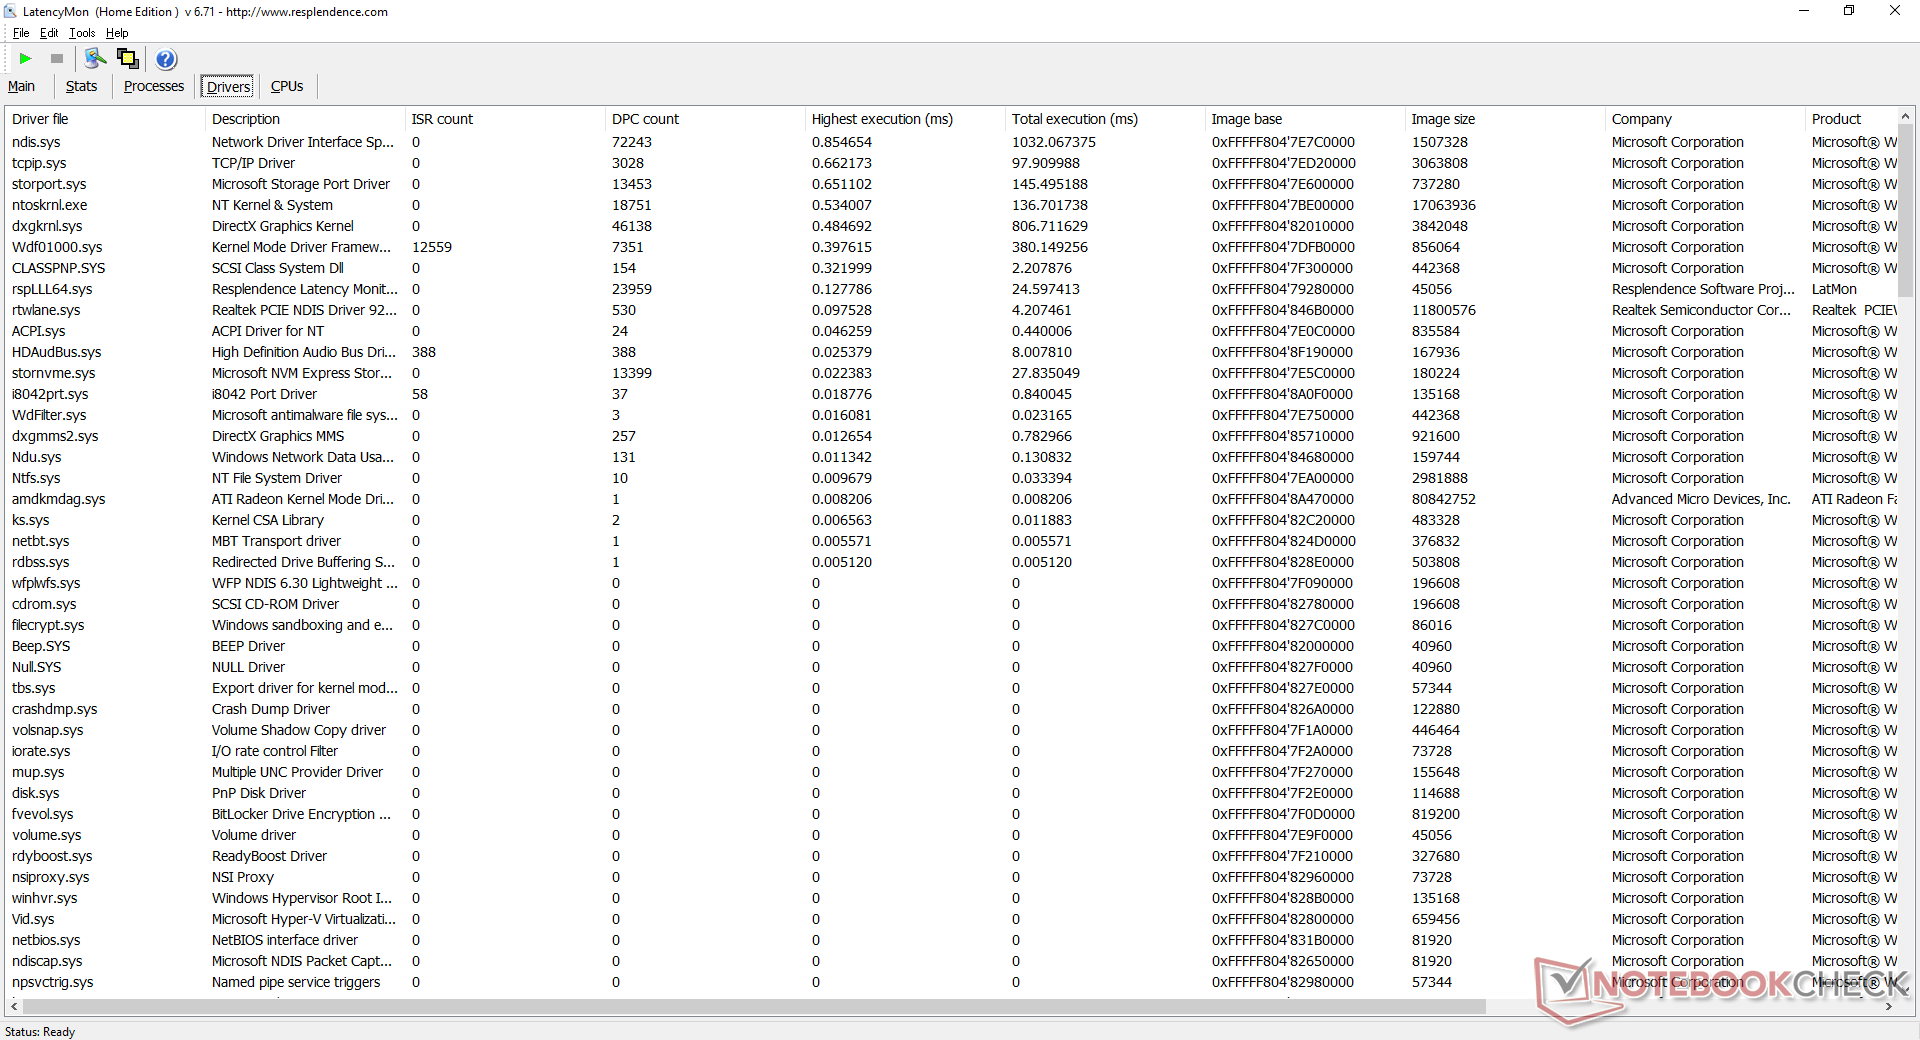
LatencyMon non mostra problemi di latenza quando si aprono più schede del browser sulla nostra homepage. La riproduzione di video 4K a 60 FPS è perfetta con un utilizzo minimo di CPU e GPU e nessun fotogramma perso.
| DPC Latencies / LatencyMon - interrupt to process latency (max), Web, Youtube, Prime95 | |
| HP Pavilion 15-eg | |
| Asus VivoBook 15 KM513UA-L503TS | |
| Dell Inspiron 15 3501 | |
| Lenovo IdeaPad 3 15ALC6 | |
| Lenovo IdeaPad 5 15IIL05 | |
* ... Meglio usare valori piccoli
Dispositivi di archiviazione - Un solo slot M.2 2280 PCIe3 x4
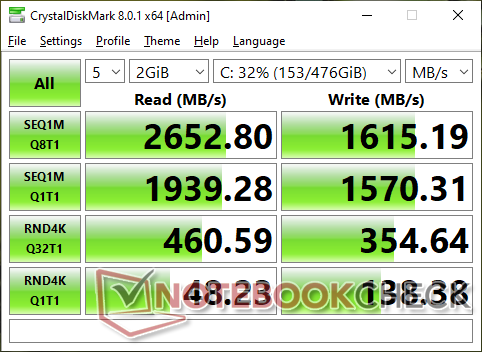
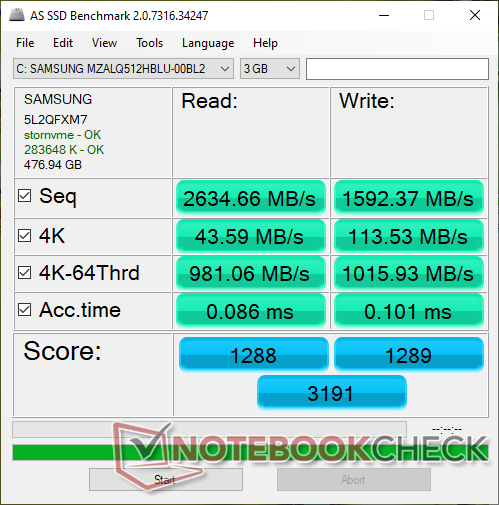
Il 512 GB Samsung PM991a è un SSD NVMe PCIe3 x4 di fascia media superiore con tassi teorici di lettura e scrittura sequenziale di 3100 MB/s e 1800 MB/s, rispettivamente, secondo le specifiche ufficiali di Samsung. Tuttavia, l'unità nel nostro Lenovo è un po' più lenta con tassi di lettura e scrittura nel mondo reale che si avvicinano solo a 2700 MB/s e 1600 MB/s, rispettivamente. Le prestazioni sembrano rallentare se sollecitate per lunghi periodi, come mostrato dal nostro test DiskSpd Read Loop qui sotto, probabilmente per ragioni termiche.

| Drive Performance rating - Percent | |
| Lenovo Ideapad S540-15IML -8! | |
| Dell Inspiron 15 3501 | |
| Lenovo IdeaPad 3 15ALC6 | |
| HP Pavilion 15-eg | |
| Lenovo IdeaPad 5 15IIL05 | |
| Asus VivoBook 15 KM513UA-L503TS | |
* ... Meglio usare valori piccoli
Disk Throttling: DiskSpd Read Loop, Queue Depth 8
Prestazioni della GPU - Molto meglio di UHD Graphics 620
Le prestazioni grafiche grezze sono dal 30 al 50 per cento più veloci delle Iris Xe G4 48 EU che si trova su molte CPU Intel Core i3 di 11a generazione o circa 2 volte più veloce del comune UHD Graphics 620. Anche se l'aumento di velocità è notevole, non è ancora sufficiente per eseguire la maggior parte dei giochi bene a risoluzioni superiori a 720p. L'aggiornamento alla SKU Ryzen 7 5700U con la sua più potenteRadeon RX Vega 8 aumenterà le prestazioni di circa il 30 per cento rispetto alla nostraRadeon RX Vega 6.
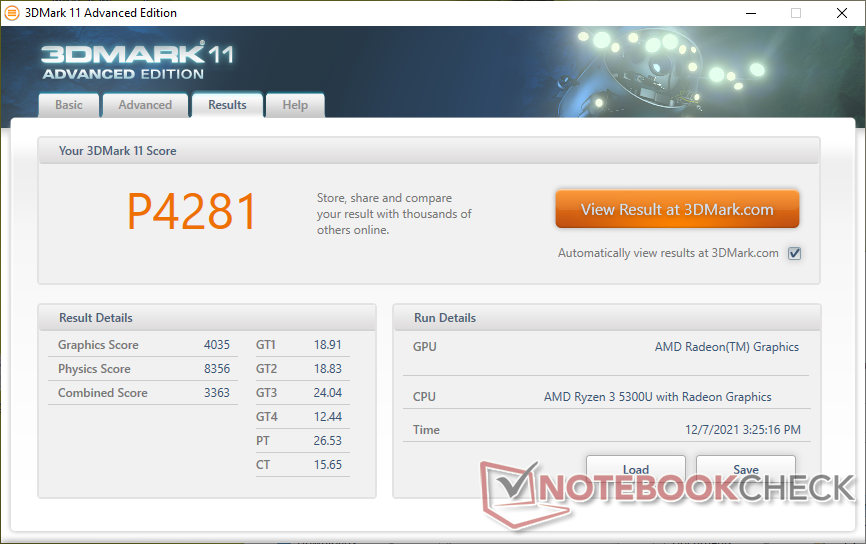
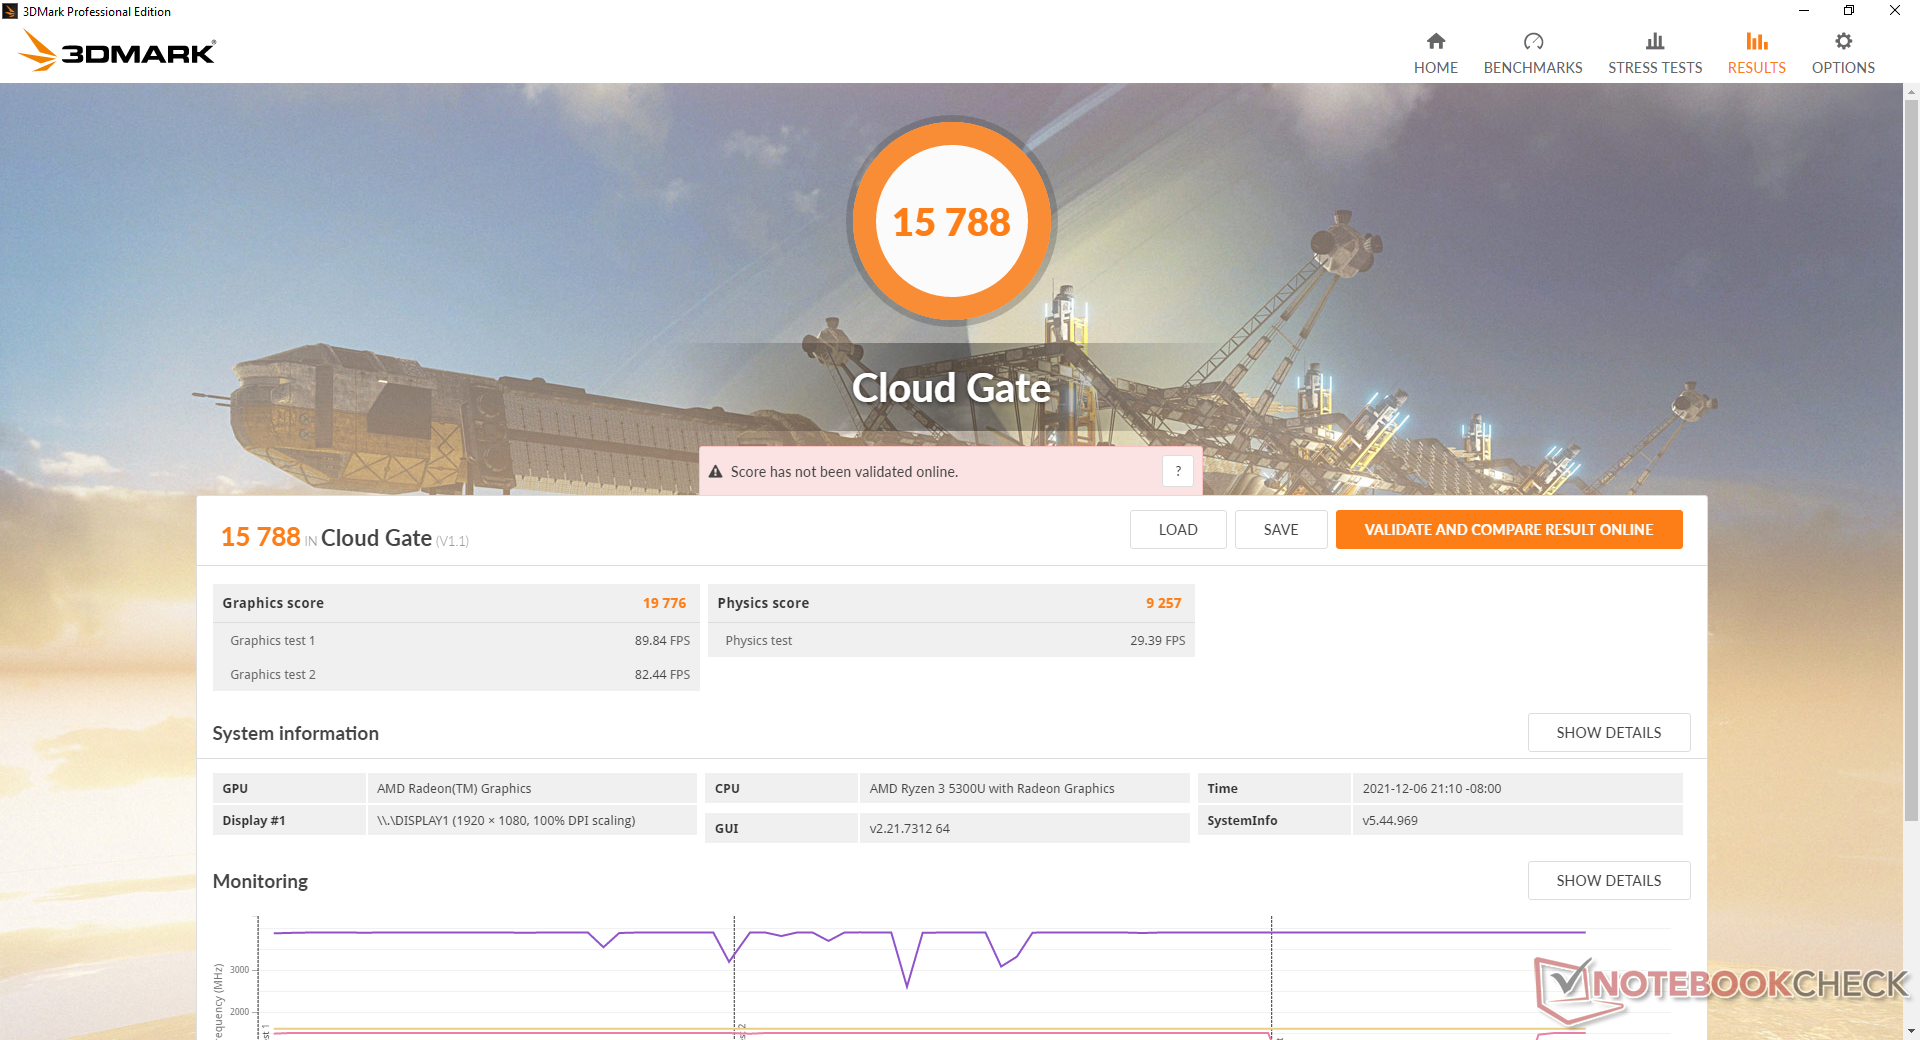
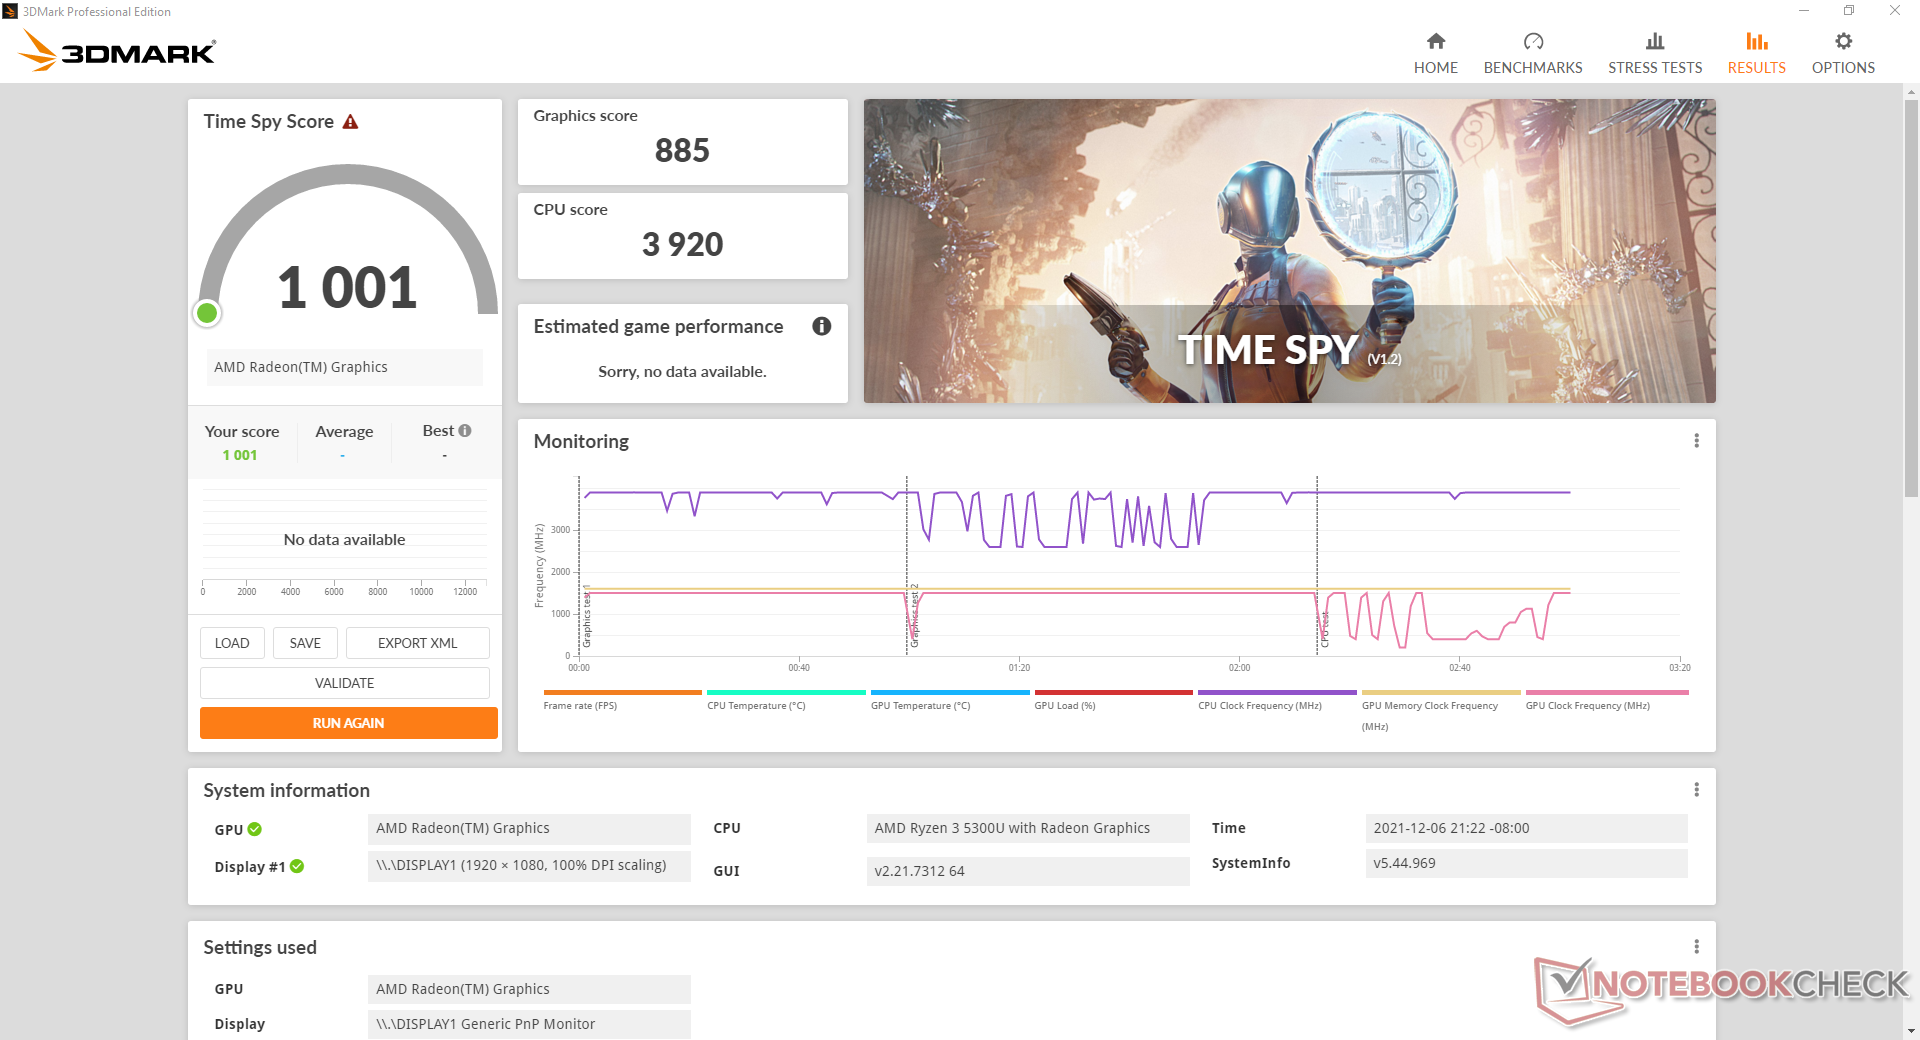
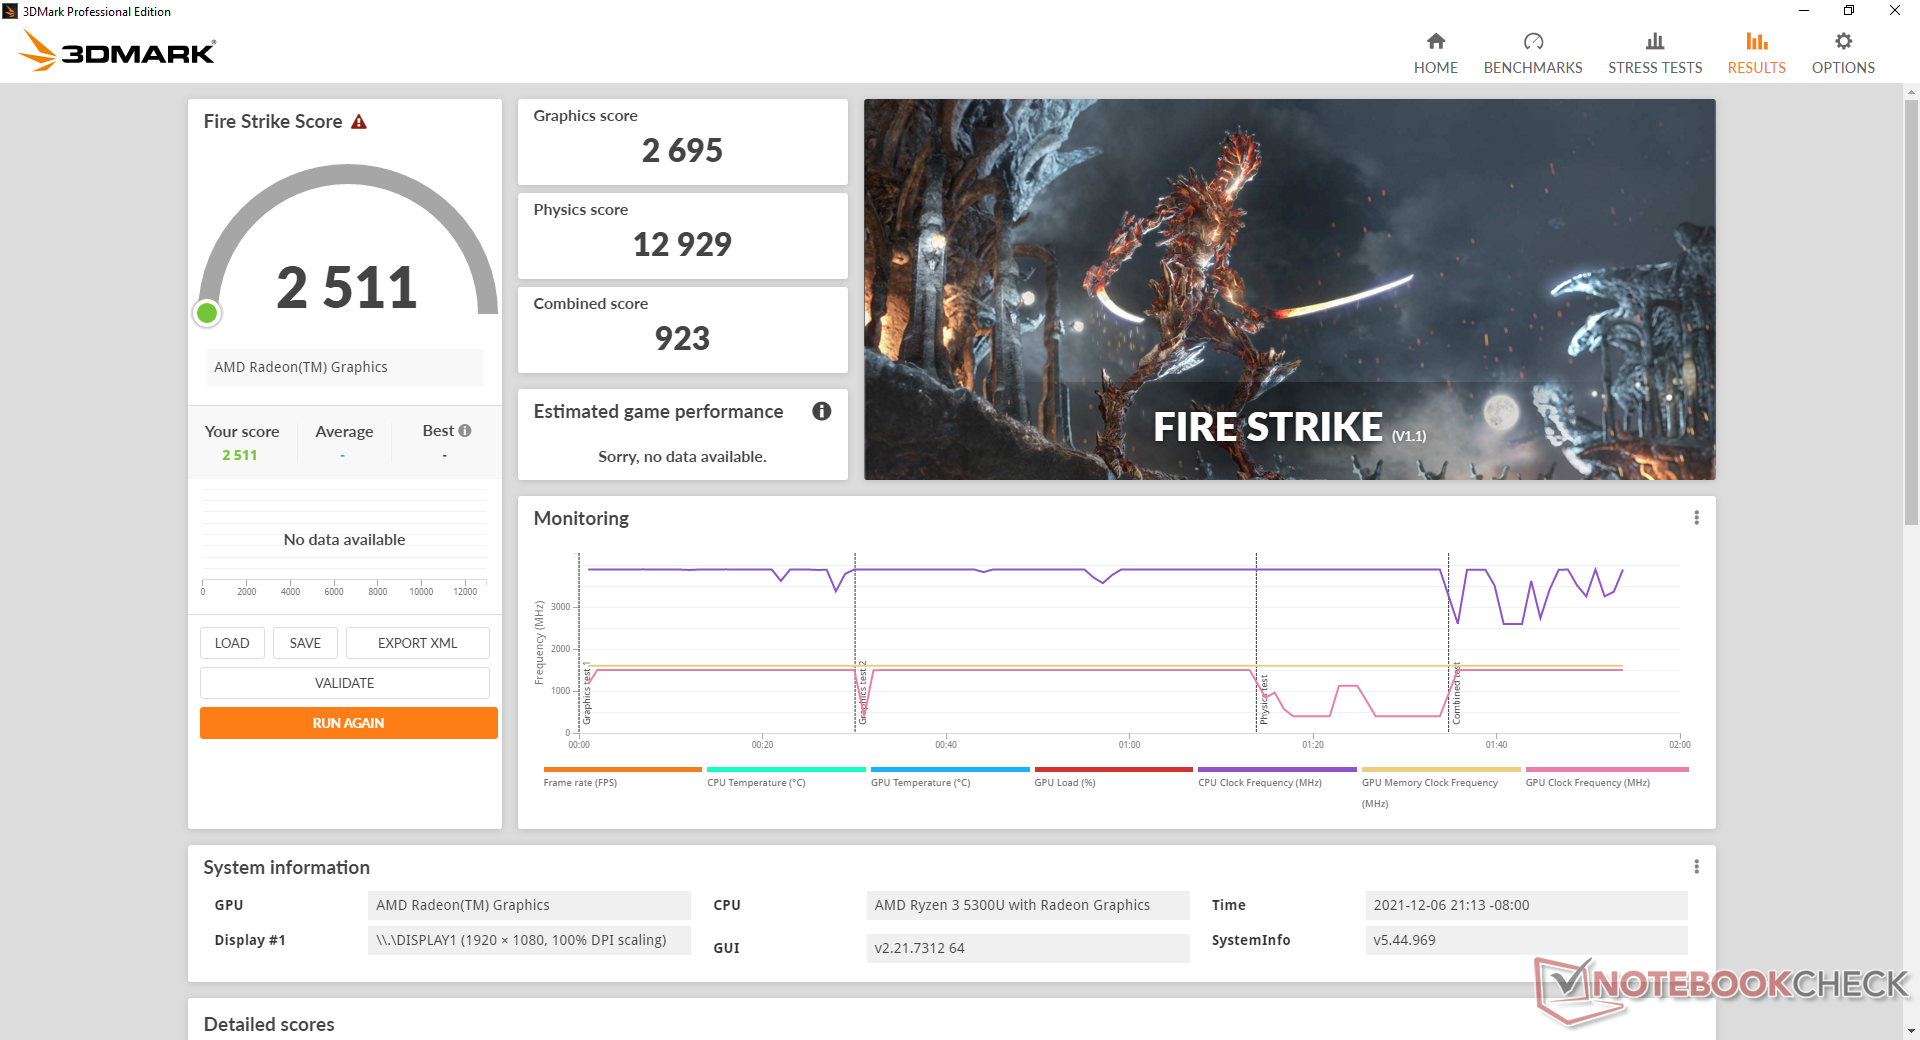
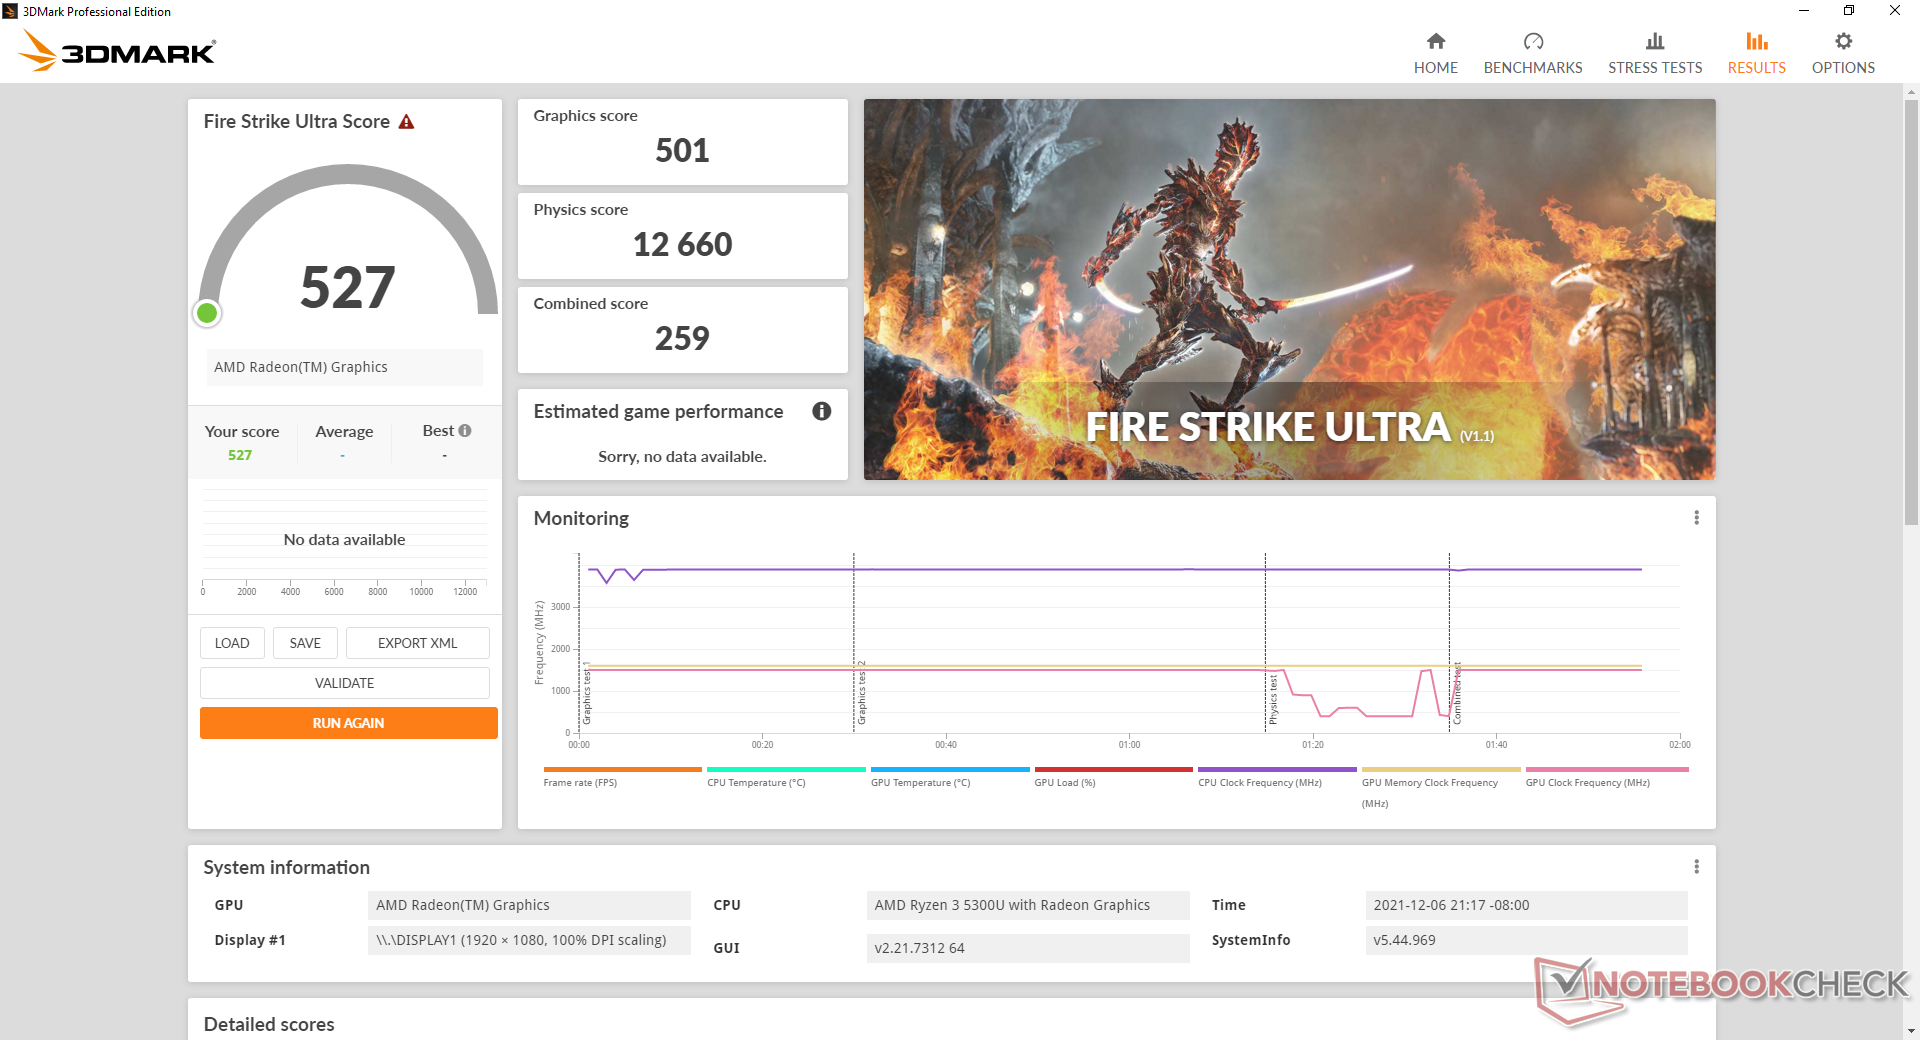
| 3DMark 11 Performance | 4281 punti | |
| 3DMark Cloud Gate Standard Score | 15788 punti | |
| 3DMark Fire Strike Score | 2511 punti | |
| 3DMark Time Spy Score | 1001 punti | |
Aiuto | ||
Witcher 3 FPS Chart
| basso | medio | alto | ultra | |
|---|---|---|---|---|
| GTA V (2015) | 81.7 | 72.5 | 20.6 | 9.41 |
| The Witcher 3 (2015) | 52.2 | 33 | 17 | 10.2 |
| Dota 2 Reborn (2015) | 95.5 | 74 | 42.4 | 40 |
| Final Fantasy XV Benchmark (2018) | 28.6 | 14.2 | 9.99 | |
| X-Plane 11.11 (2018) | 36.7 | 28 | 25.5 | |
| Far Cry 5 (2018) | 39 | 18 | 16 | 15 |
| Strange Brigade (2018) | 67.3 | 26.3 | 21.7 | 18.5 |
Emissioni
Rumore del sistema - Silenzioso nella maggior parte delle condizioni
Il sistema è più silenzioso del previsto. Eseguendo la prima scena di benchmark in 3DMark 06, per esempio, la ventola raggiunge appena 32 dB(A) rispetto ai 40 dB(A) dell'IdeaPad 5 alimentato da GeForce o HP Pavilion 15. Se la CPU viene sollecitata più pesantemente per periodi più lunghi, tuttavia, il rumore della ventola salirebbe costantemente a 44 dB(A) per essere più in linea con quello che abbiamo osservato su altri portatili multimediali economici. In breve, il nostro IdeaPad 3 impiega più tempo per raggiungere gli stessi livelli massimi di rumore della ventola di molti dei suoi colleghi.
Rumorosità
| Idle |
| 25.8 / 25.8 / 25.8 dB(A) |
| Sotto carico |
| 32.3 / 44 dB(A) |
 | ||
30 dB silenzioso 40 dB(A) udibile 50 dB(A) rumoroso |
||
min: | ||
| Lenovo IdeaPad 3 15ALC6 Vega 6, R3 5300U, Samsung PM991a MZALQ512HBLU | Lenovo IdeaPad 5 15IIL05 GeForce MX350, i5-1035G1, SK hynix BC511 HFM512GDHTNI-87A0B | Lenovo Ideapad S540-15IML GeForce MX250, i5-10210U, Samsung SSD PM981a MZVLB512HBJQ | Dell Inspiron 15 3501 Iris Xe G7 96EUs, i7-1165G7, Samsung PM991a MZ9LQ512HBLU-00BD1 | HP Pavilion 15-eg GeForce MX450, i7-1165G7, Samsung PM991 MZVLQ1T0HALB | Asus VivoBook 15 KM513UA-L503TS Vega 7, R5 5500U, WDC PC SN530 SDBPMPZ-265G | |
|---|---|---|---|---|---|---|
| Noise | -21% | -21% | 0% | -5% | -12% | |
| off /ambiente * (dB) | 25.2 | 30.7 -22% | 30 -19% | 26 -3% | 25.4 -1% | 28.28 -12% |
| Idle Minimum * (dB) | 25.8 | 30.7 -19% | 30 -16% | 26 -1% | 25.6 1% | 28.28 -10% |
| Idle Average * (dB) | 25.8 | 30.7 -19% | 32 -24% | 26 -1% | 25.6 1% | 28.28 -10% |
| Idle Maximum * (dB) | 25.8 | 30.7 -19% | 37 -43% | 26 -1% | 25.6 1% | 28.28 -10% |
| Load Average * (dB) | 32.3 | 43.4 -34% | 41 -27% | 35.9 -11% | 39.2 -21% | 35.76 -11% |
| Witcher 3 ultra * (dB) | 32 | 43.2 -35% | 39 -22% | 39.1 -22% | 42.79 -34% | |
| Load Maximum * (dB) | 44 | 43.7 1% | 42 5% | 35.8 19% | 41.5 6% | 42.67 3% |
* ... Meglio usare valori piccoli
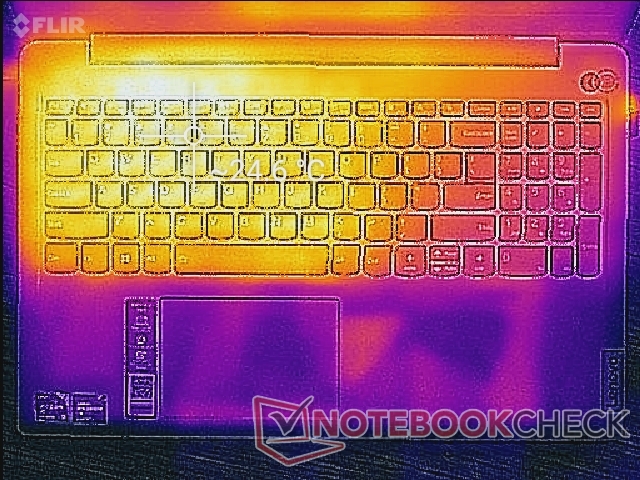
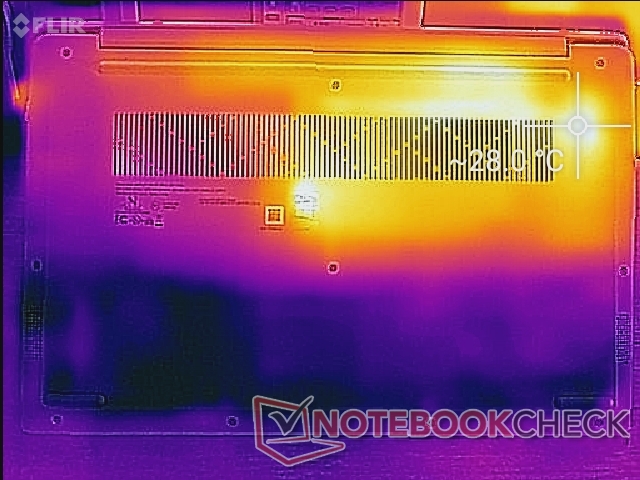
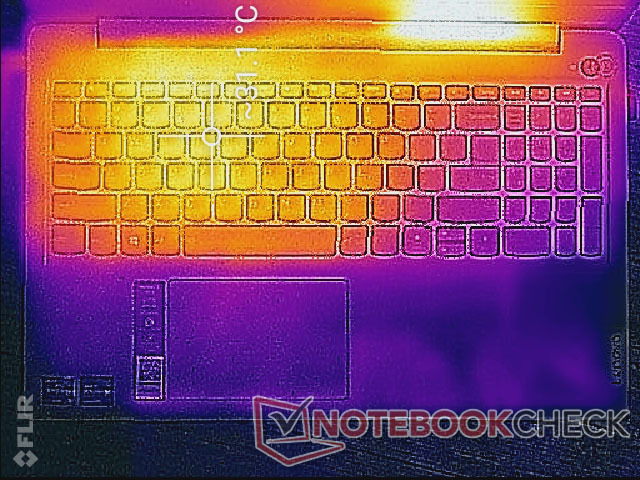
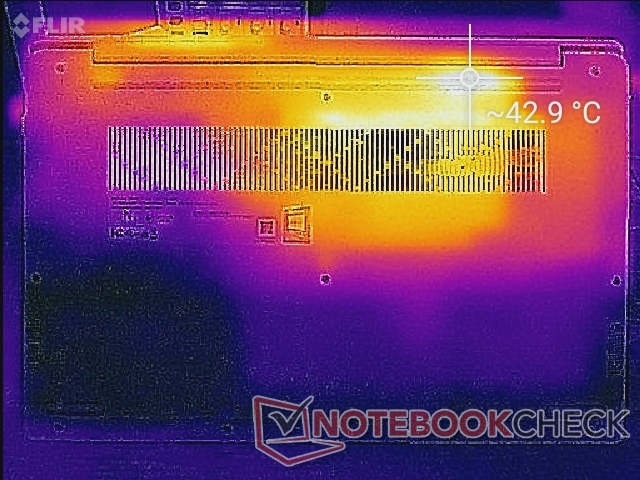
Temperatura
Le temperature della superficie non sono mai eccessivamente calde, indipendentemente dal carico, specialmente sul ponte della tastiera. I punti caldi durante il gioco sono a malapena sopra i 30 C come mostrato dalle nostre mappe di temperatura qui sotto rispetto ai 40 C delAsus VivoBook 15 KM513UA. Il fondo del nostro Lenovo può raggiungere i 43 C, ma questo è fortunatamente solo un piccolo punto verso la parte posteriore del sistema dove è improbabile che gli utenti tocchino.
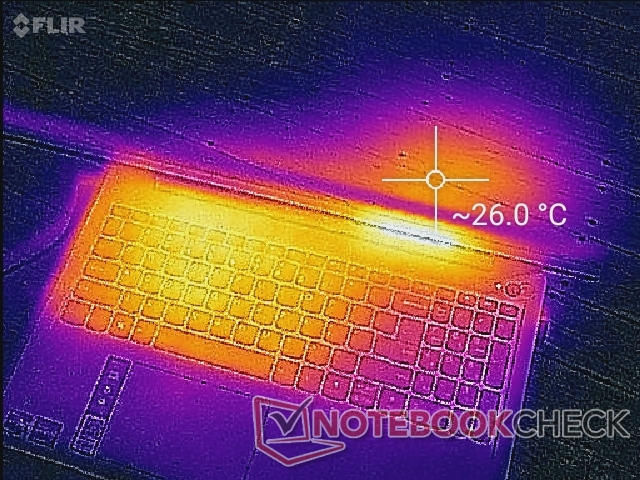
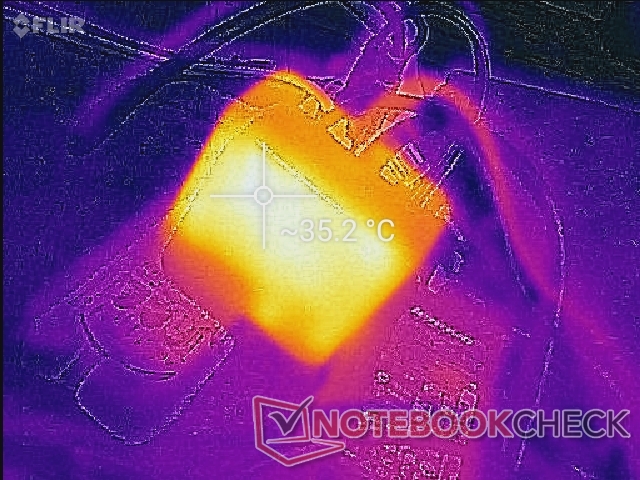
(+) La temperatura massima sul lato superiore è di 31.2 °C / 88 F, rispetto alla media di 36.8 °C / 98 F, che varia da 21 a 71 °C per questa classe Multimedia.
(±) Il lato inferiore si riscalda fino ad un massimo di 43 °C / 109 F, rispetto alla media di 39.1 °C / 102 F
(+) In idle, la temperatura media del lato superiore è di 22.8 °C / 73 F, rispetto alla media deld ispositivo di 31.3 °C / 88 F.
(+) I poggiapolsi e il touchpad sono piu' freddi della temperatura della pelle con un massimo di 21 °C / 69.8 F e sono quindi freddi al tatto.
(+) La temperatura media della zona del palmo della mano di dispositivi simili e'stata di 28.7 °C / 83.7 F (+7.7 °C / 13.9 F).
| Lenovo IdeaPad 3 15ALC6 AMD Ryzen 3 5300U, AMD Radeon RX Vega 6 (Ryzen 4000/5000) | Lenovo IdeaPad 5 15IIL05 Intel Core i5-1035G1, NVIDIA GeForce MX350 | Lenovo Ideapad S540-15IML Intel Core i5-10210U, NVIDIA GeForce MX250 | Dell Inspiron 15 3501 Intel Core i7-1165G7, Intel Iris Xe Graphics G7 96EUs | HP Pavilion 15-eg Intel Core i7-1165G7, NVIDIA GeForce MX450 | Asus VivoBook 15 KM513UA-L503TS AMD Ryzen 5 5500U, AMD Radeon RX Vega 7 | |
|---|---|---|---|---|---|---|
| Heat | -21% | -8% | -15% | -19% | -22% | |
| Maximum Upper Side * (°C) | 31.2 | 43.1 -38% | 42 -35% | 45.6 -46% | 44 -41% | 43.8 -40% |
| Maximum Bottom * (°C) | 43 | 50.9 -18% | 45 -5% | 41 5% | 53.4 -24% | 42.2 2% |
| Idle Upper Side * (°C) | 24.8 | 29 -17% | 25 -1% | 28.2 -14% | 27.4 -10% | 33.4 -35% |
| Idle Bottom * (°C) | 28.2 | 31 -10% | 26 8% | 29.1 -3% | 28.8 -2% | 32.6 -16% |
* ... Meglio usare valori piccoli
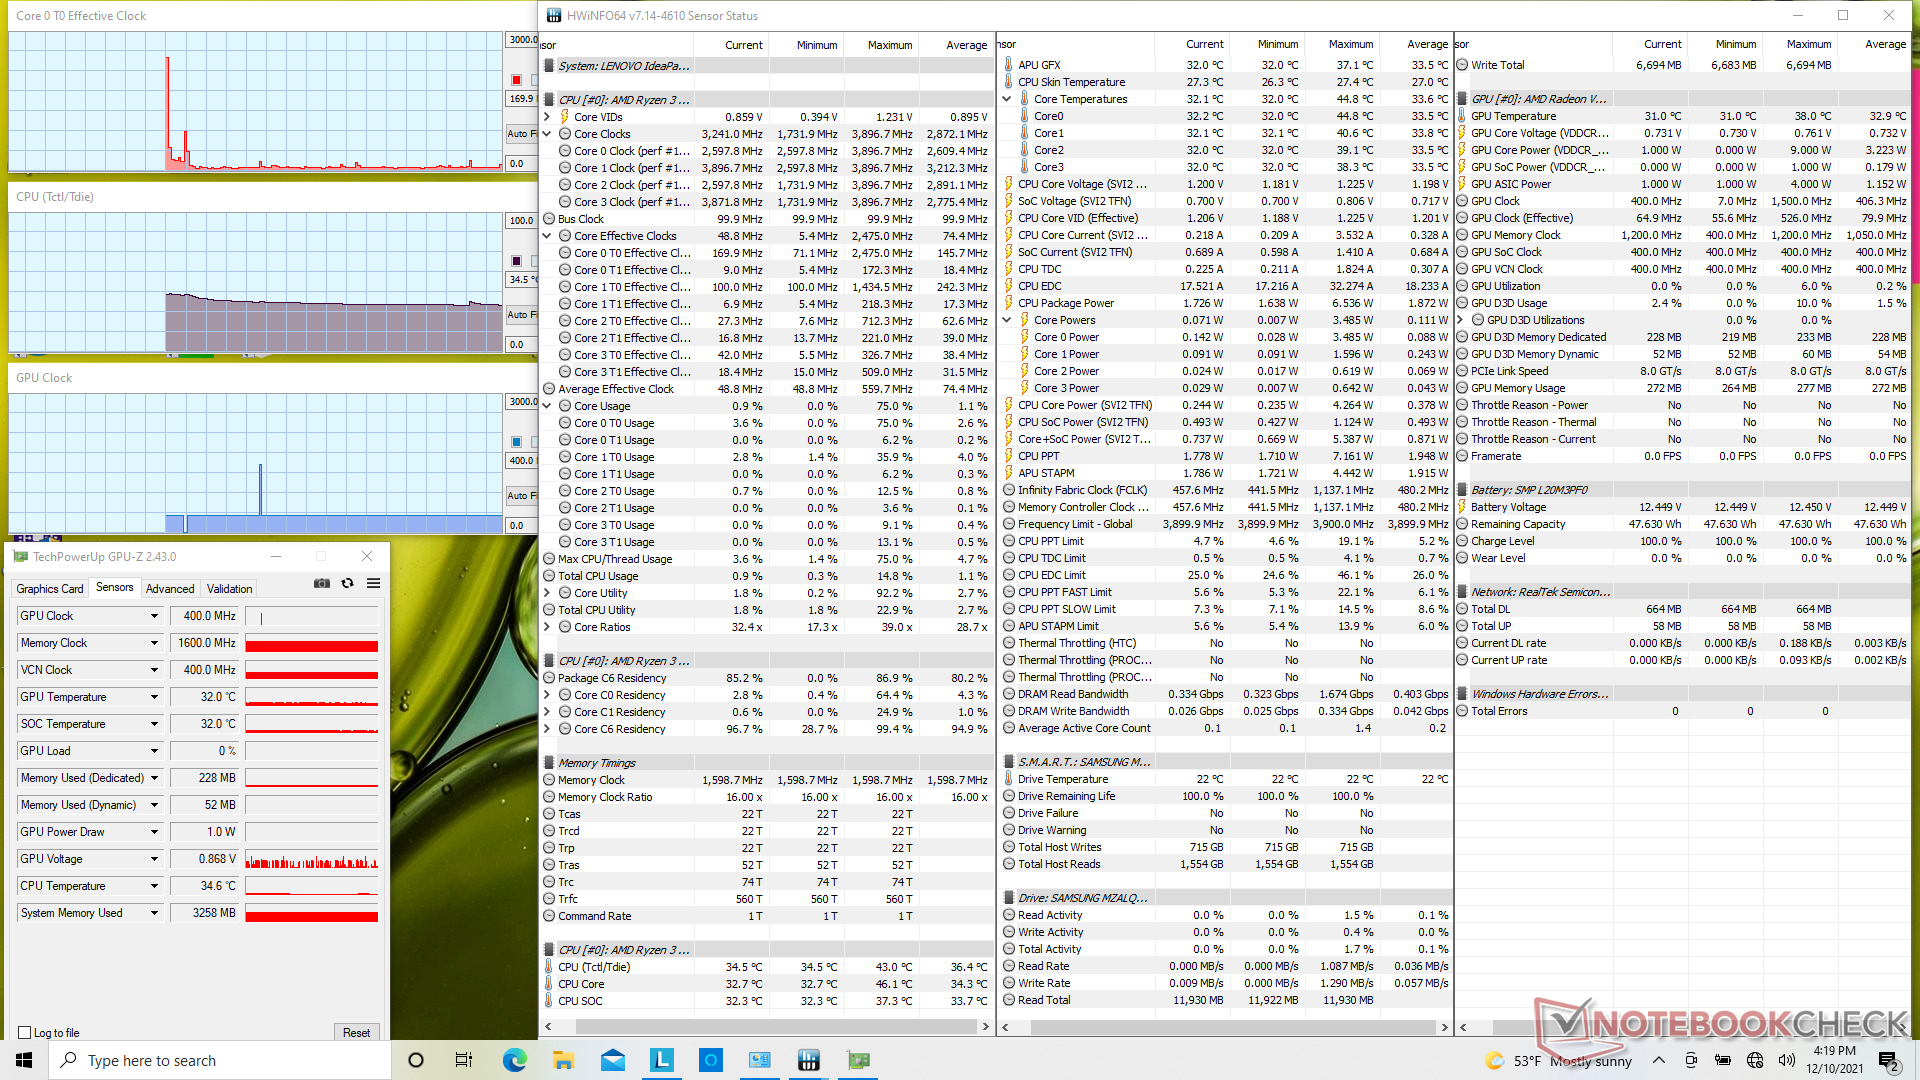
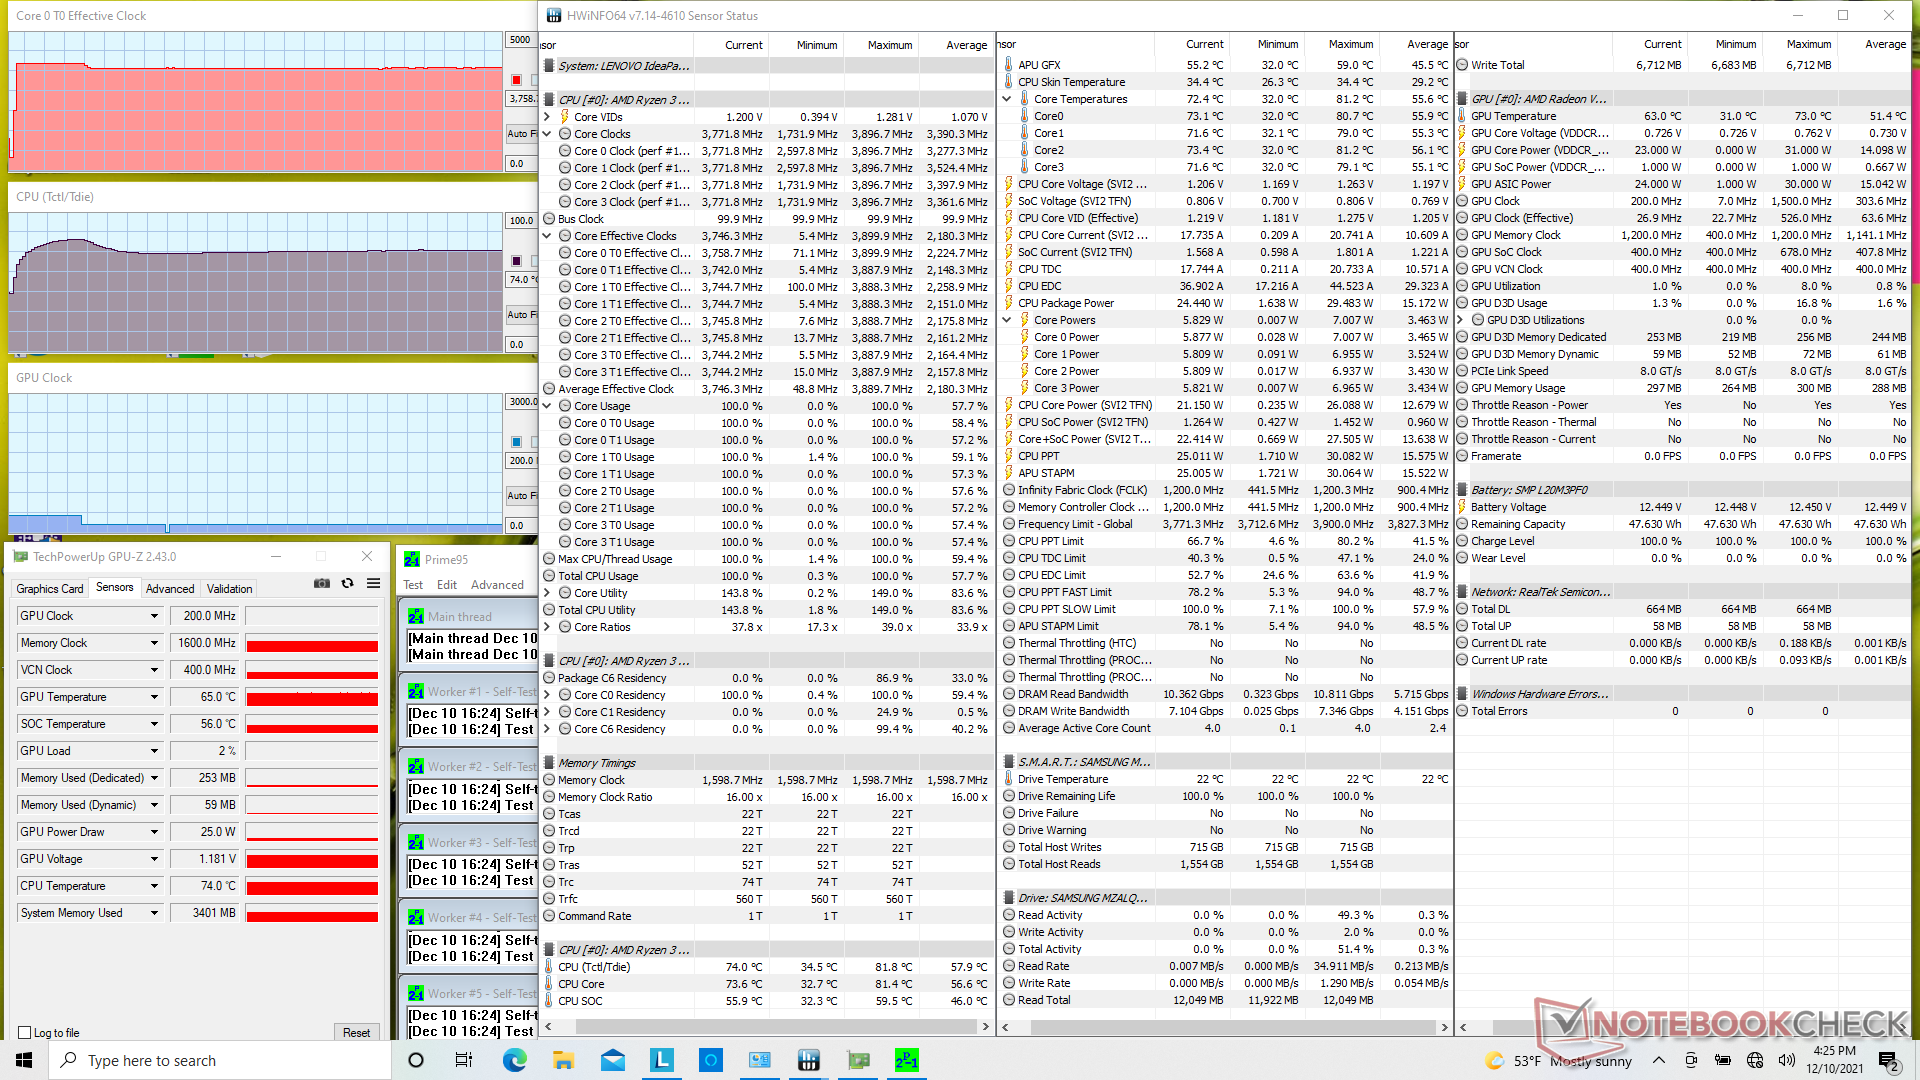
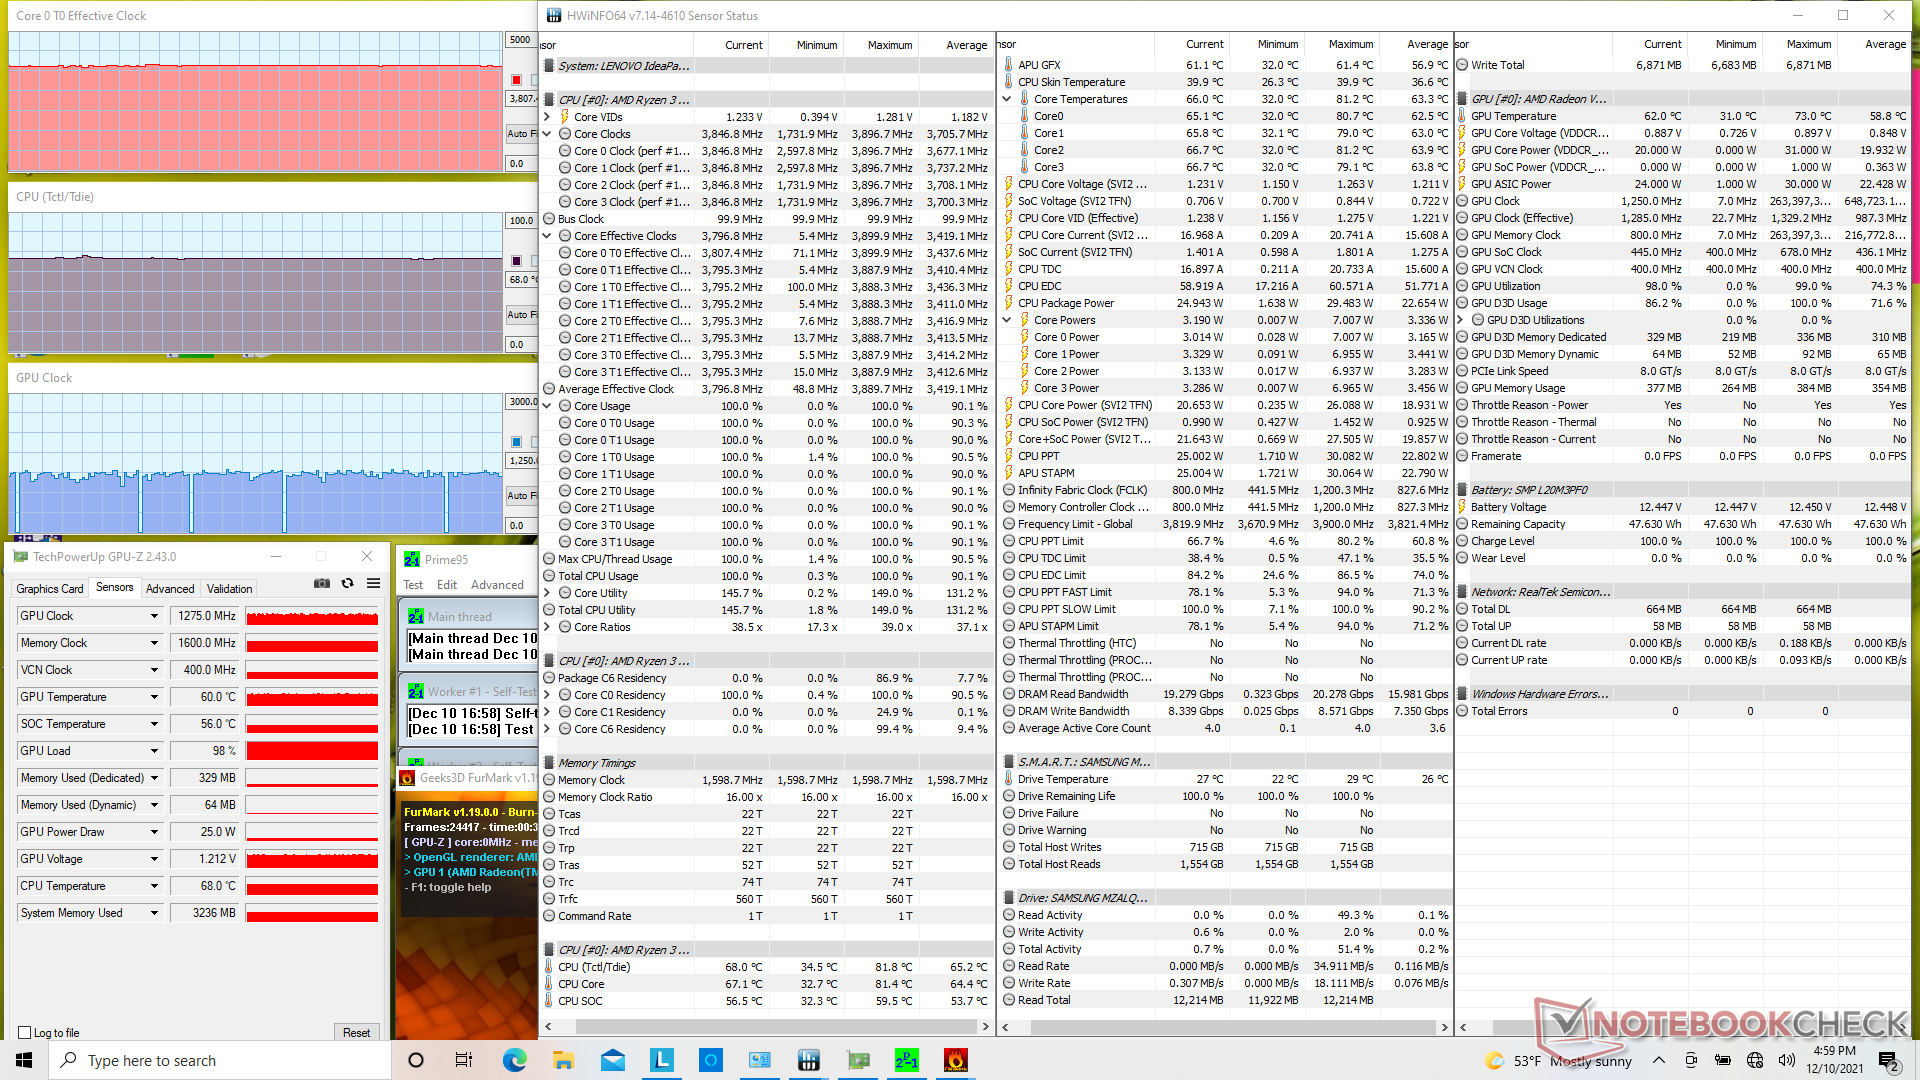
Test di stress
Quando si esegue Prime95 per stressare la CPU, le frequenze di clock aumentano fino a 3,9 GHz e ad un picco di potenza del pacchetto di 29 W prima di raggiungere una temperatura del core di 80 C circa 30 secondi dopo. In seguito, le frequenze di clock e la potenza del pacchetto scendono leggermente a 3.7 GHz e 24 W, rispettivamente, per mantenere una temperatura del core più fredda di 72 C.
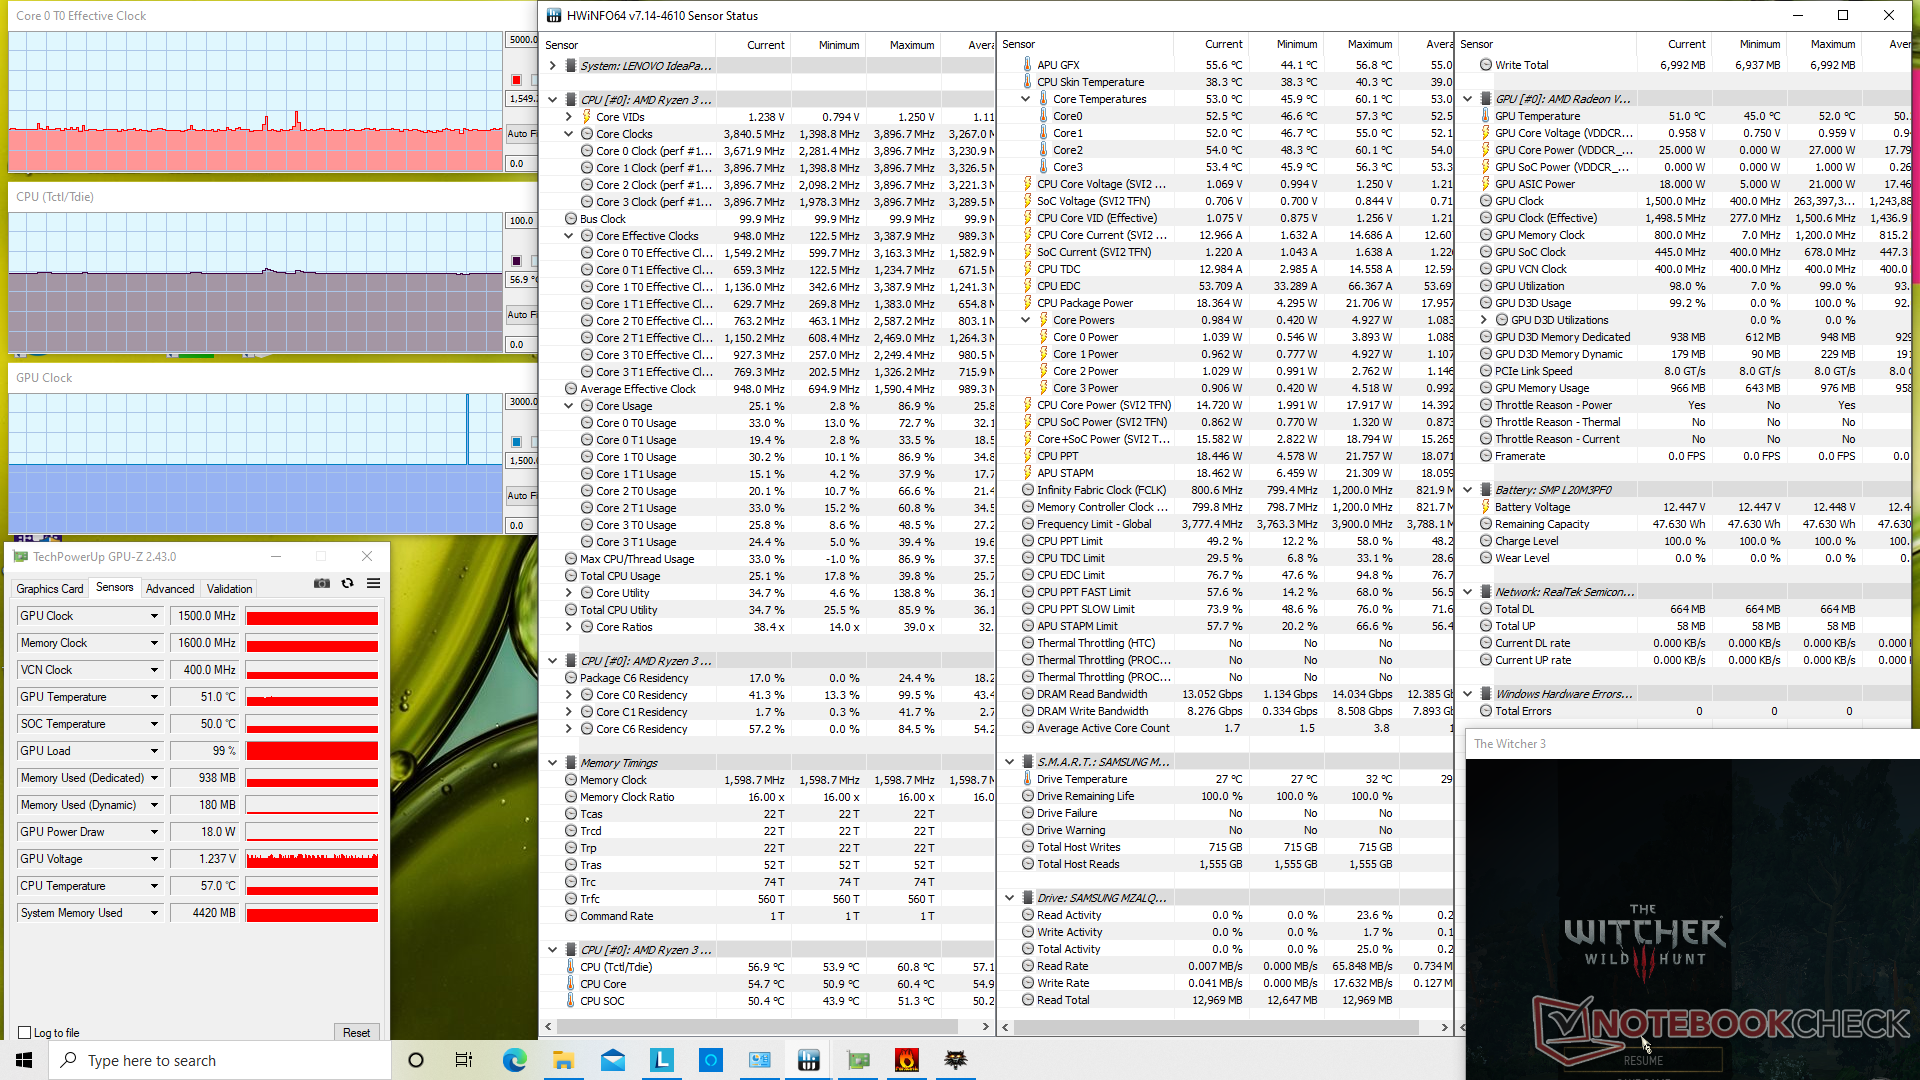
Quando si esegue Witcher 3la GPU integrata si stabilizzerebbe a 1500 MHz come pubblicizzato. La temperatura del core si stabilizzerebbe anche a soli 57 C rispetto ai 74 C del più veloce e sottile IdeaPad 5 Pro 14.
L'esecuzione con l'alimentazione a batteria avrà un impatto sulle prestazioni. Un 3DMark 11 eseguito con le batterie restituirebbe punteggi di Fisica e Grafica di 7818 e 3818 punti, rispettivamente, rispetto a 8356 e 4035 punti con l'alimentazione di rete.
| Clock della CPU (GHz)Clock della GPU(MHz)Temperaturamedia dellaCPU (°C) | |
| Sistema inattivo | -- |
| Stress Prime95 | 3.8 |
| Prime95 + FurMark Stress | 3.8 |
| Witcher 3 Stress | 1.6 |
Altoparlanti
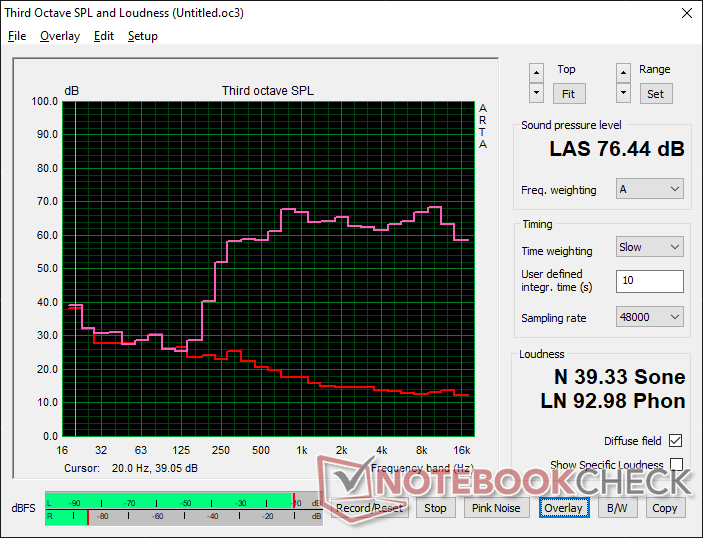
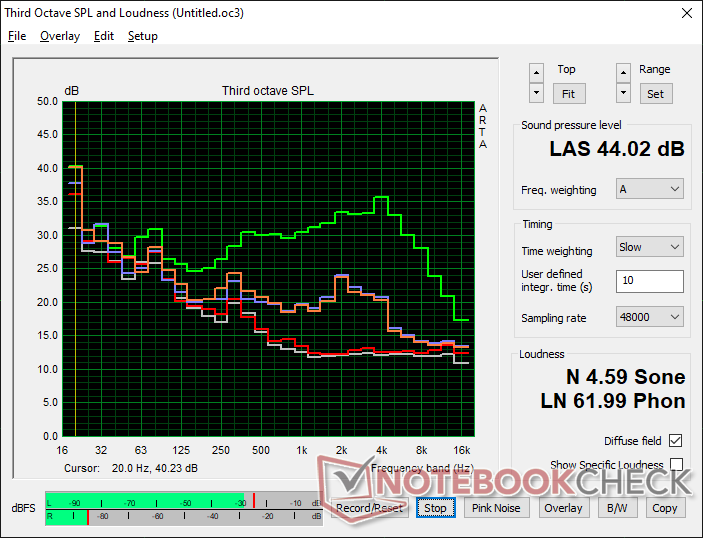
Lenovo IdeaPad 3 15ALC6 analisi audio
(±) | potenza degli altiparlanti media ma buona (76.4 dB)
Bassi 100 - 315 Hz
(-) | quasi nessun basso - in media 24% inferiori alla media
(±) | la linearità dei bassi è media (13.4% delta rispetto alla precedente frequenza)
Medi 400 - 2000 Hz
(+) | medi bilanciati - solo only 3.1% rispetto alla media
(+) | medi lineari (4.2% delta rispetto alla precedente frequenza)
Alti 2 - 16 kHz
(+) | Alti bilanciati - appena 2.1% dalla media
(+) | alti lineari (3.4% delta rispetto alla precedente frequenza)
Nel complesso 100 - 16.000 Hz
(±) | la linearità complessiva del suono è media (19.3% di differenza rispetto alla media
Rispetto alla stessa classe
» 62% di tutti i dispositivi testati in questa classe è stato migliore, 8% simile, 30% peggiore
» Il migliore ha avuto un delta di 5%, medio di 17%, peggiore di 45%
Rispetto a tutti i dispositivi testati
» 47% di tutti i dispositivi testati in questa classe è stato migliore, 8% similare, 46% peggiore
» Il migliore ha avuto un delta di 4%, medio di 23%, peggiore di 134%
Apple MacBook 12 (Early 2016) 1.1 GHz analisi audio
(+) | gli altoparlanti sono relativamente potenti (83.6 dB)
Bassi 100 - 315 Hz
(±) | bassi ridotti - in media 11.3% inferiori alla media
(±) | la linearità dei bassi è media (14.2% delta rispetto alla precedente frequenza)
Medi 400 - 2000 Hz
(+) | medi bilanciati - solo only 2.4% rispetto alla media
(+) | medi lineari (5.5% delta rispetto alla precedente frequenza)
Alti 2 - 16 kHz
(+) | Alti bilanciati - appena 2% dalla media
(+) | alti lineari (4.5% delta rispetto alla precedente frequenza)
Nel complesso 100 - 16.000 Hz
(+) | suono nel complesso lineare (10.2% differenza dalla media)
Rispetto alla stessa classe
» 7% di tutti i dispositivi testati in questa classe è stato migliore, 2% simile, 90% peggiore
» Il migliore ha avuto un delta di 5%, medio di 18%, peggiore di 53%
Rispetto a tutti i dispositivi testati
» 5% di tutti i dispositivi testati in questa classe è stato migliore, 1% similare, 94% peggiore
» Il migliore ha avuto un delta di 4%, medio di 23%, peggiore di 134%
Gestione dell'energia
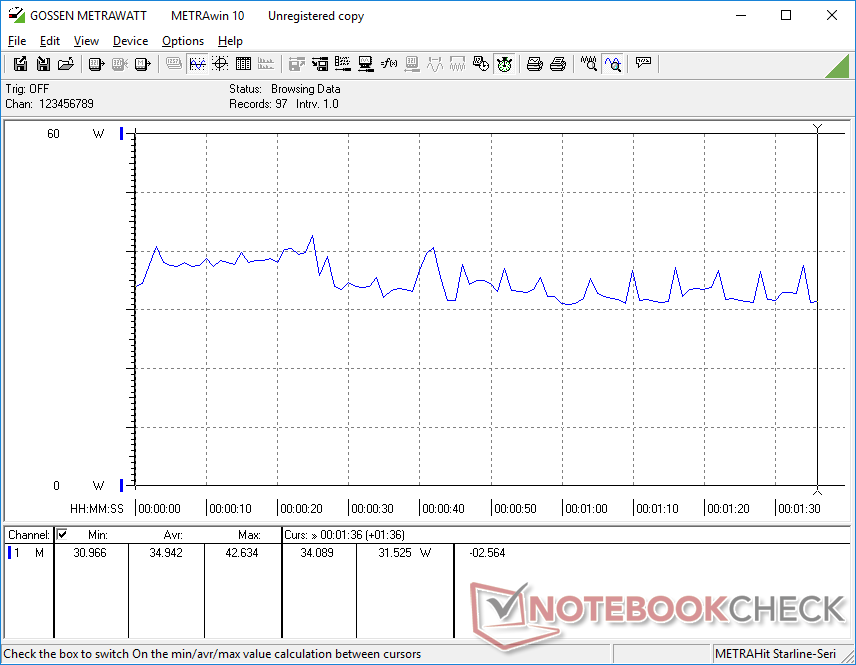
Consumo energetico - alte prestazioni della CPU per Watt
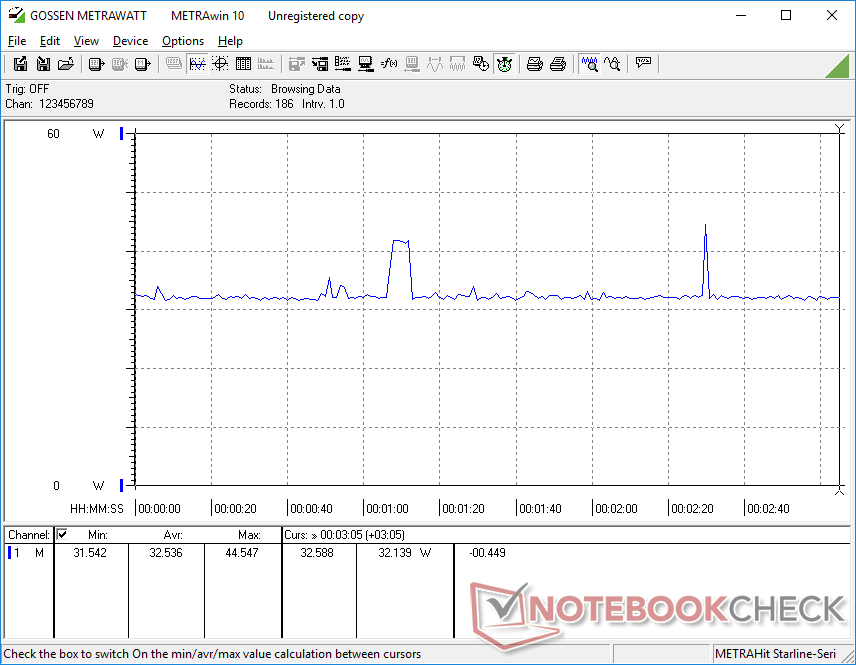
Il sistema è più esigente del Core i3-powered Lenovo ThinkPad L15 G2 quando si eseguono carichi medi o superiori. L'esecuzione di 3DMark 06, per esempio, consumerebbe quasi il 37 per cento di energia in più sul nostro IdeaPad. I vantaggi in termini di prestazioni della nostra CPU Ryzen 3 rispetto all'alternativa Core i3 possono valere l'aumento del consumo energetico per molti utenti. Qualsiasi differenza di consumo energetico quando si eseguono carichi inferiori come la navigazione web o lo streaming video è minima.
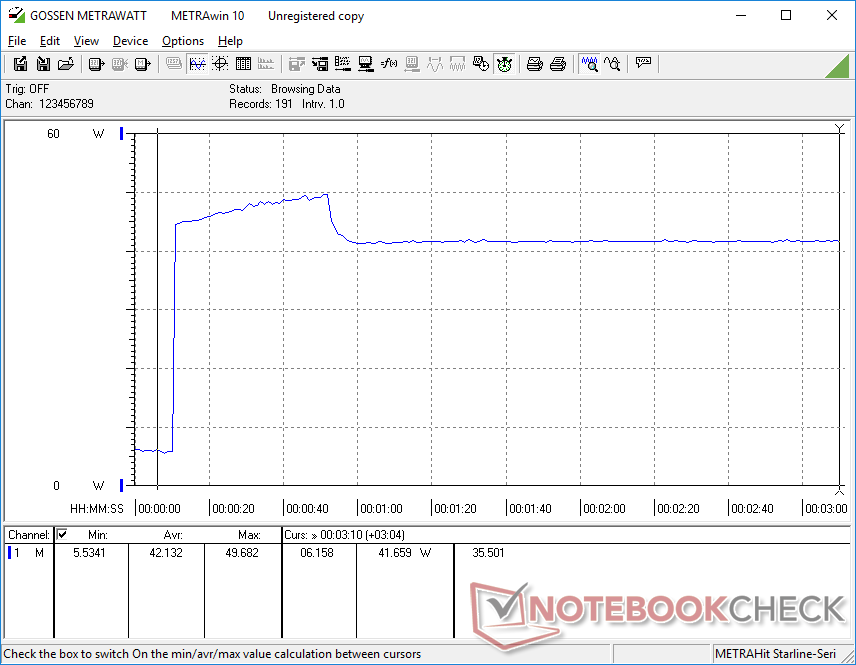
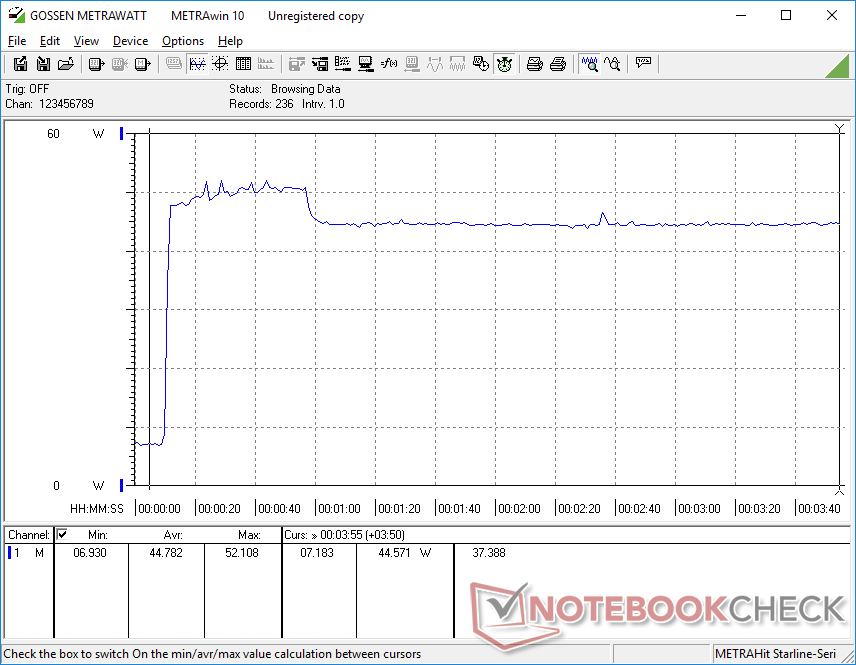
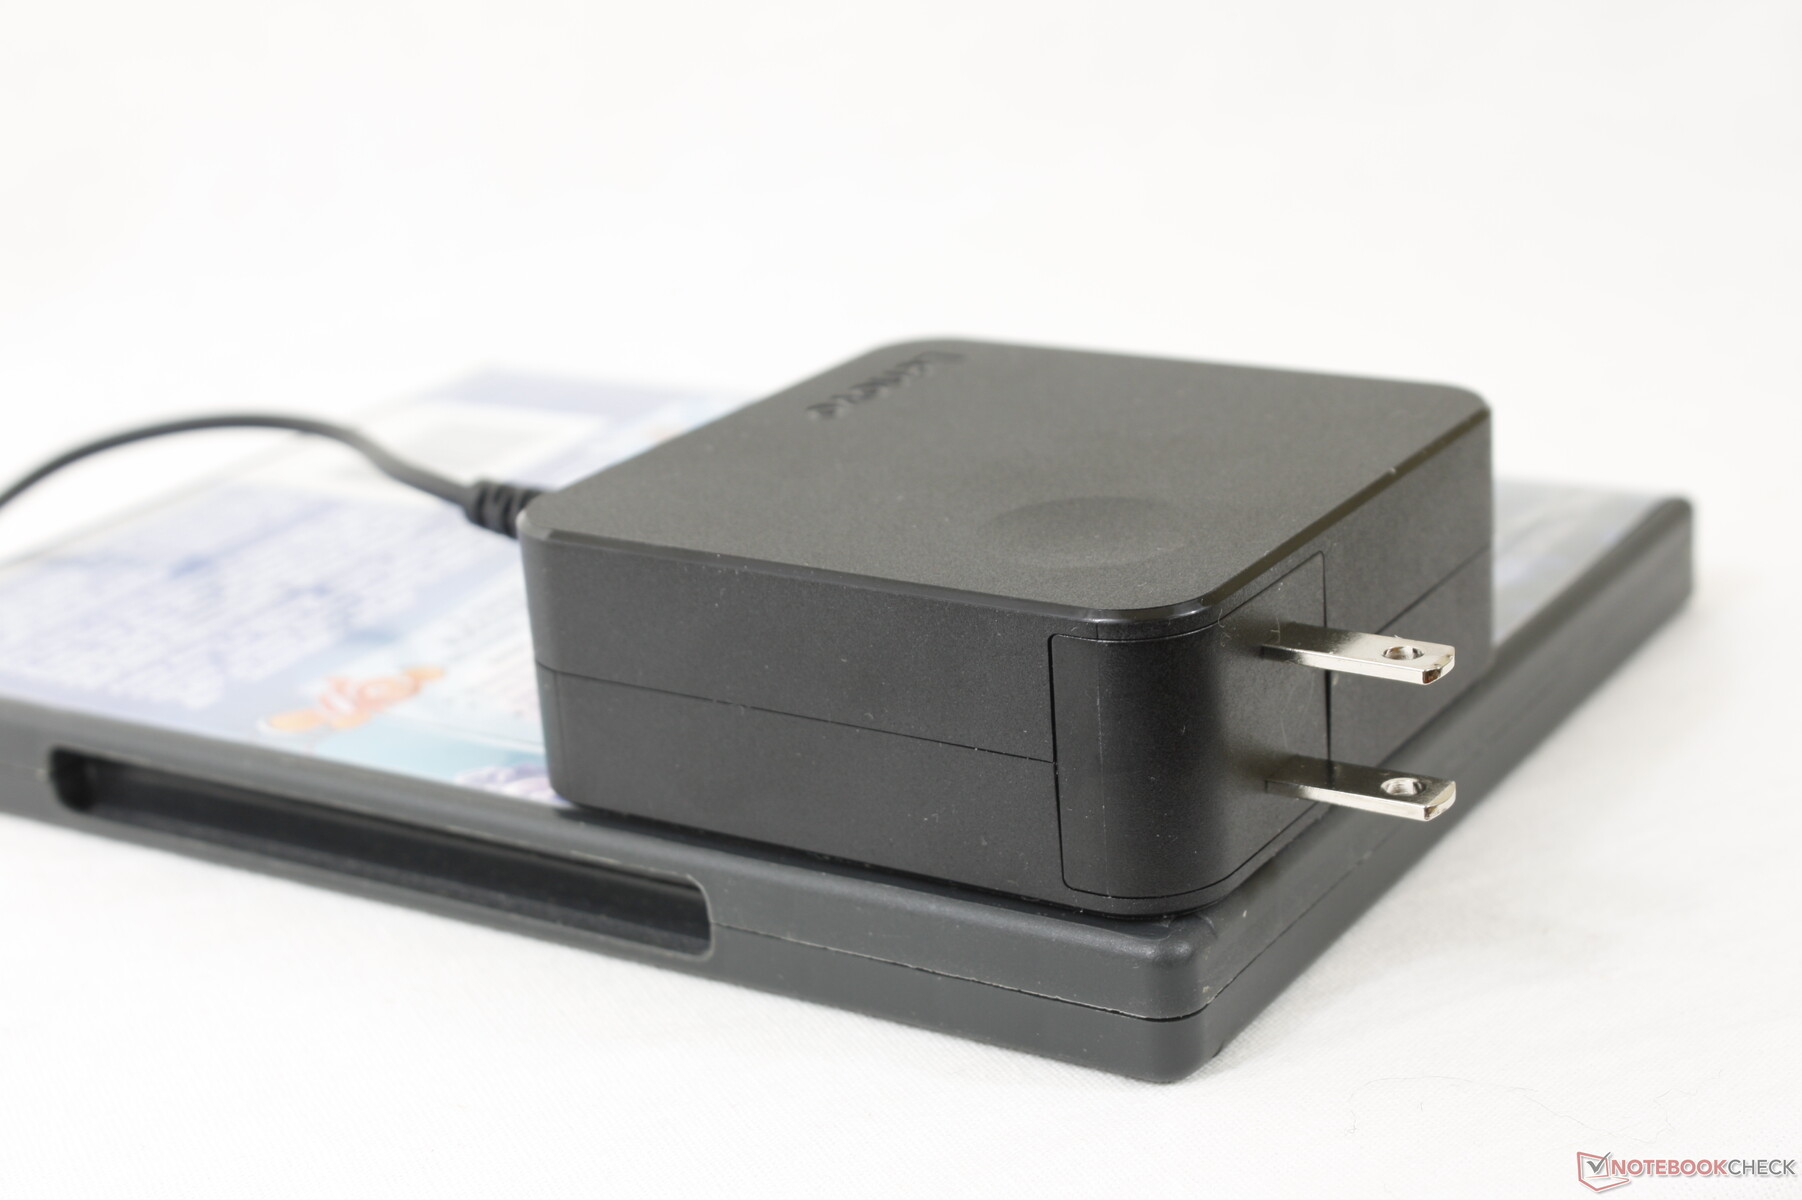
Siamo in grado di registrare un consumo massimo temporaneo di 52 W dal piccolo (~7.5 x 7.5 x 2.8 cm) adattatore AC da 65 W. I poli dell'adattatore purtroppo non sono retrattili, il che può essere un fastidio quando si viaggia.
| Off / Standby | |
| Idle | |
| Sotto carico |
|
Leggenda:
min: | |
| Lenovo IdeaPad 3 15ALC6 R3 5300U, Vega 6, Samsung PM991a MZALQ512HBLU, IPS, 1920x1080, 15.6" | Lenovo IdeaPad 5 15IIL05 i5-1035G1, GeForce MX350, SK hynix BC511 HFM512GDHTNI-87A0B, IPS, 1920x1080, 15.6" | Lenovo Ideapad S540-15IML i5-10210U, GeForce MX250, Samsung SSD PM981a MZVLB512HBJQ, IPS, 1920x1080, 15.6" | Dell Inspiron 15 3501 i7-1165G7, Iris Xe G7 96EUs, Samsung PM991a MZ9LQ512HBLU-00BD1, IPS, 1920x1080, 15.6" | Asus VivoBook 15 KM513UA-L503TS R5 5500U, Vega 7, WDC PC SN530 SDBPMPZ-265G, OLED, 1920x1080, 15.6" | Lenovo ThinkPad L15 G2-20X4S0KU00 i3-1115G4, UHD Graphics Xe G4 48EUs, Samsung SSD PM981a MZVLB256HBHQ, IPS, 1920x1080, 15.6" | |
|---|---|---|---|---|---|---|
| Power Consumption | -50% | -33% | 1% | -10% | -3% | |
| Idle Minimum * (Watt) | 5.6 | 4.9 12% | 5 11% | 3.6 36% | 4.96 11% | 4.08 27% |
| Idle Average * (Watt) | 6 | 9.1 -52% | 7 -17% | 6.4 -7% | 7.38 -23% | 8 -33% |
| Idle Maximum * (Watt) | 7 | 11.6 -66% | 10 -43% | 7.9 -13% | 7.79 -11% | 8.89 -27% |
| Load Average * (Watt) | 34.9 | 65 -86% | 64 -83% | 39 -12% | 41.77 -20% | 25.64 27% |
| Witcher 3 ultra * (Watt) | 32.5 | 59 -82% | 44 -35% | 37.6 -16% | 38.2 -18% | 31.7 2% |
| Load Maximum * (Watt) | 52.1 | 65.3 -25% | 67 -29% | 41.8 20% | 50.95 2% | 60.31 -16% |
* ... Meglio usare valori piccoli
Power Consumption Witcher 3 / Stresstest
Power Consumption external Monitor
Durata della batteria - Bassa capacità, lunga durata
La capacità della batteria è ridotta a 45 Wh, il che è da aspettarsi da un sistema economico. Tuttavia, i tempi di esecuzione sono ancora eccellenti con quasi 10,5 ore di WLAN reale per essere paragonabile al più costoso IdeaPad 5.
La ricarica da vuoto a piena capacità richiede poco meno di 2,5 ore rispetto a 1,5 ore sulla maggior parte degli altri Ultrabooks. Purtroppo, il sistema non può essere ricaricato via USB-C.
| Lenovo IdeaPad 3 15ALC6 R3 5300U, Vega 6, 45 Wh | Lenovo IdeaPad 5 15IIL05 i5-1035G1, GeForce MX350, 70 Wh | Lenovo Ideapad S540-15IML i5-10210U, GeForce MX250, 70 Wh | Dell Inspiron 15 3501 i7-1165G7, Iris Xe G7 96EUs, 42 Wh | HP Pavilion 15-eg i7-1165G7, GeForce MX450, 41 Wh | Asus VivoBook 15 KM513UA-L503TS R5 5500U, Vega 7, 42 Wh | |
|---|---|---|---|---|---|---|
| Autonomia della batteria | 23% | 17% | -35% | -29% | -41% | |
| Reader / Idle (h) | 20.1 | 23.2 15% | 30.2 50% | 15 -25% | 11.8 -41% | |
| WiFi v1.3 (h) | 10.5 | 11.4 9% | 12.1 15% | 6.8 -35% | 6.6 -37% | 6.4 -39% |
| Load (h) | 1.6 | 2.3 44% | 1.4 -13% | 1.2 -25% | 0.9 -44% | |
| H.264 (h) | 16.1 |
Pro
Contro
Verdetto - Dare al Core i3 una corsa per i suoi soldi
L'IdeaPad 3 15ALC6 ha tre caratteristiche forti che mancano a molti altri modelli nella sua fascia di prezzo: facile manutenzione, un luminoso touchscreen abilitato FreeSync e una CPU sorprendentemente veloce. Questi attributi contribuiscono alla longevità del sistema in quanto i proprietari possono facilmente aggiungere più storage o RAM lungo la linea e avere fiducia che il Ryzen 3 5300U non sarà superato troppo presto. La durata della batteria e il rumore della ventola sono lunghi e silenziosi, rispettivamente, grazie anche all'efficienza del processore.
La veloce CPU Ryzen 3 5300U spinge un portatile economico altrimenti scialbo con qualità costruttiva, colori ed estetica mediocri.
Ci sono sempre angoli tagliati associati ai portatili economici e l'IdeaPad 3 non fa eccezione. In questo caso, il sistema soffre di tasti relativamente morbidi, clickpad spugnoso, un design debole dello chassis e una riproduzione superficiale dei colori. Quest'ultimo in particolare è comune a quasi tutti i portatili economici e quindi non possiamo escludere il Lenovo per i suoi colori poveri, ma lo chassis potrebbe sicuramente usare un po' di lavoro per farlo sentire più forte e duraturo.
Prezzo e disponibilità
Lenovo IdeaPad 3 15ALC6
- 12/14/2021 v7 (old)
Allen Ngo
Price comparison

