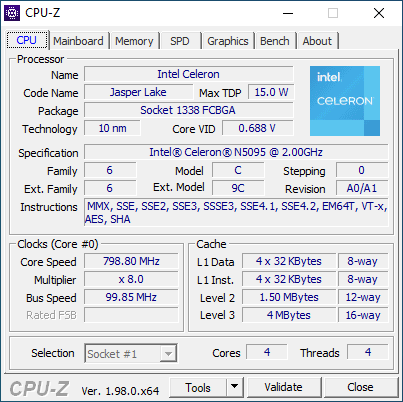
Intel Celeron N5095 Jasper Lake sottoposto a benchmark: Recensione del mini PC Beelink U59

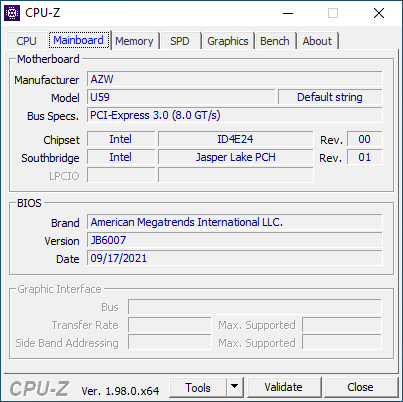
Beelink ha recentemente reso disponibile il suo mini PC U59 per succedere alla sua ultima generazione U55. Il sistema porta il nuovo quad-core Celeron N5095 di Intel per sostituire il vecchio Celeron N4500, J4125, o N4120 che si trova comunemente su altri mini PC in questa stessa fascia di prezzo di 300 dollari.
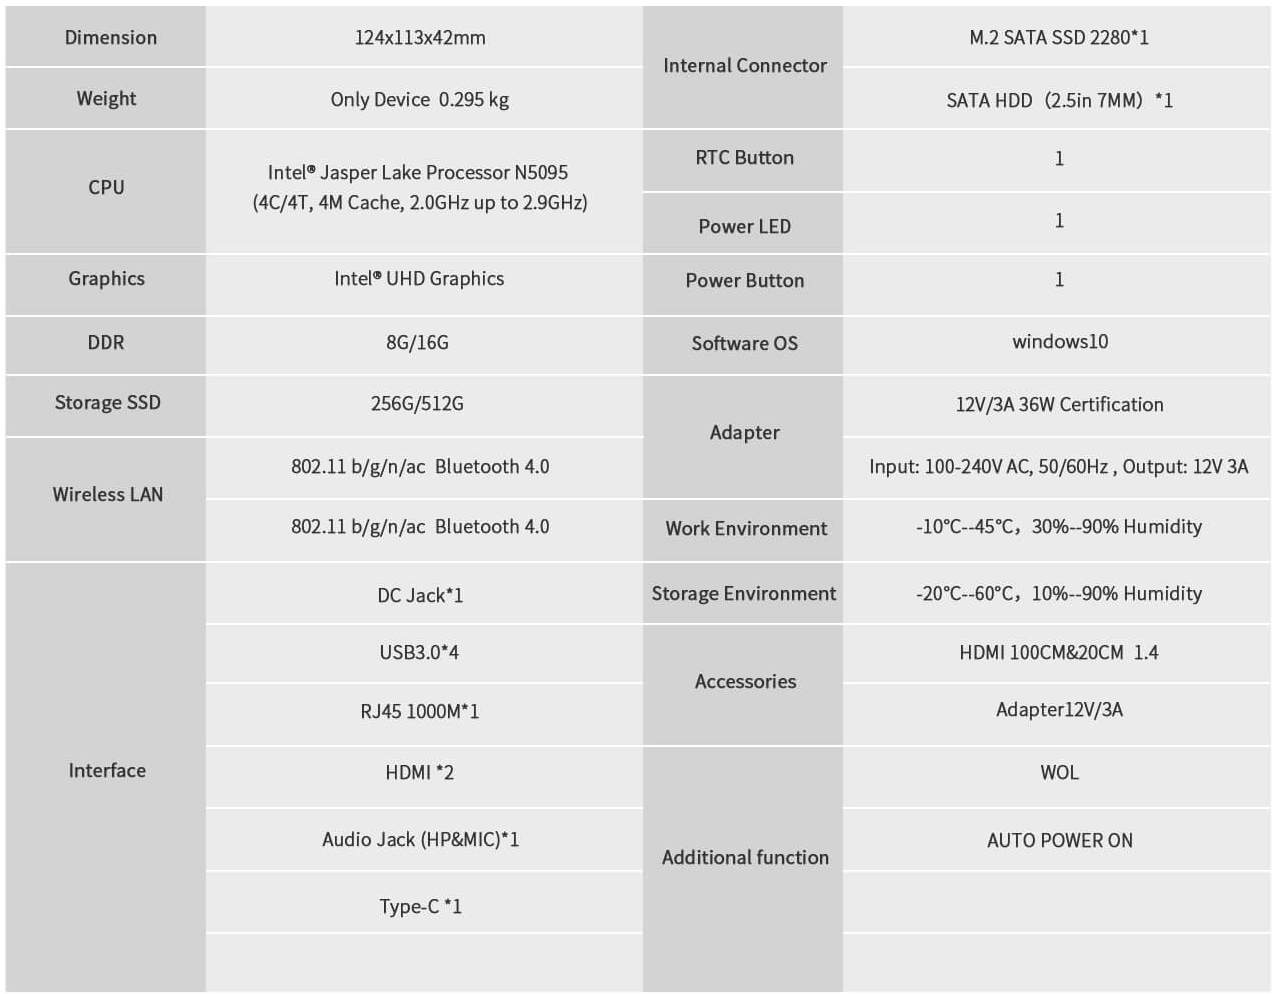
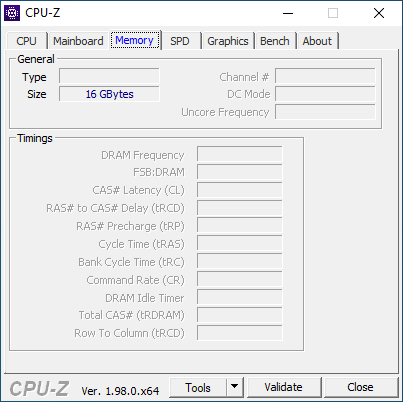
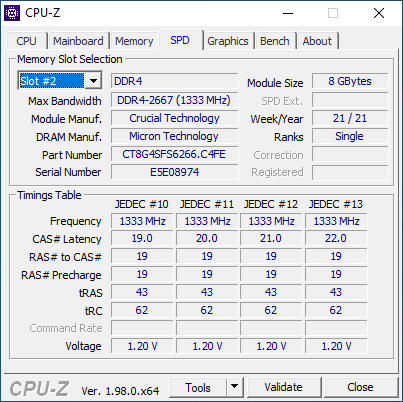
La nostra specifica configurazione di test con 16 GB di RAM dual-channel e 512 GB M.2 SSD può essere trovata online per $349 USD mentre una configurazione inferiore con metà della RAM e dello storage può essere trovata per soli $279. Ulteriori specifiche sull'U59 possono essere trovate sulla sua pagina ufficiale del prodotto qui.
Altre recensioni di Beelink:
Potential Competitors in Comparison
Punteggio | Data | Modello | Peso | Altezza | Dimensione | Risoluzione | Prezzo |
|---|---|---|---|---|---|---|---|
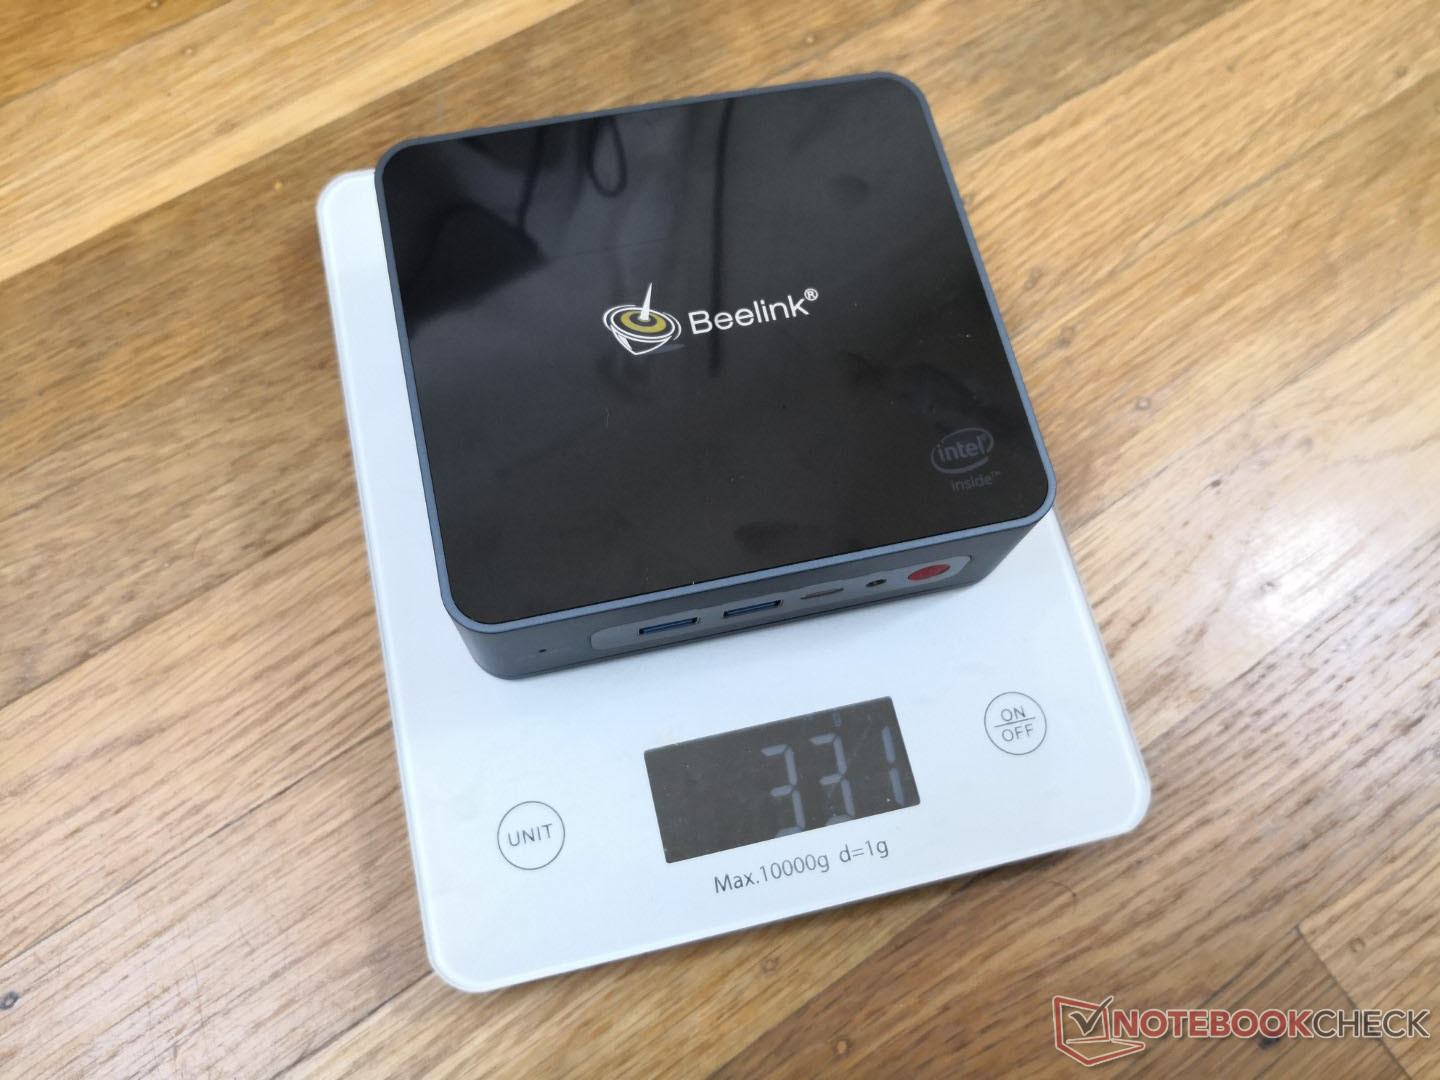
v (old) | 11/2021 | Beelink U59 Celeron N5095, UHD Graphics (Jasper Lake 16 EU) | 329 gr | 42 mm | x | ||
v (old) | 04/2021 | Intel NUC11TNKi5 i5-1135G7, Iris Xe G7 80EUs | 504 gr | 37 mm | x | ||
v (old) | 11/2018 | Intel NUC8i7BE i7-8559U, Iris Plus Graphics 655 | 683 gr | 51 mm | x | ||
v (old) | 12/2020 | Beelink SEi10 i3-1005G1, UHD Graphics G1 (Ice Lake 32 EU) | 350 gr | 41 mm | x | ||
v (old) | 10/2020 | Zotac ZBOX MI642 Nano i5-10210U, UHD Graphics 620 | 472 gr | 51 mm | x | ||
v (old) | 09/2020 | GMK NucBox K1 Celeron J4125, UHD Graphics 600 | 130 gr | 42 mm | x |
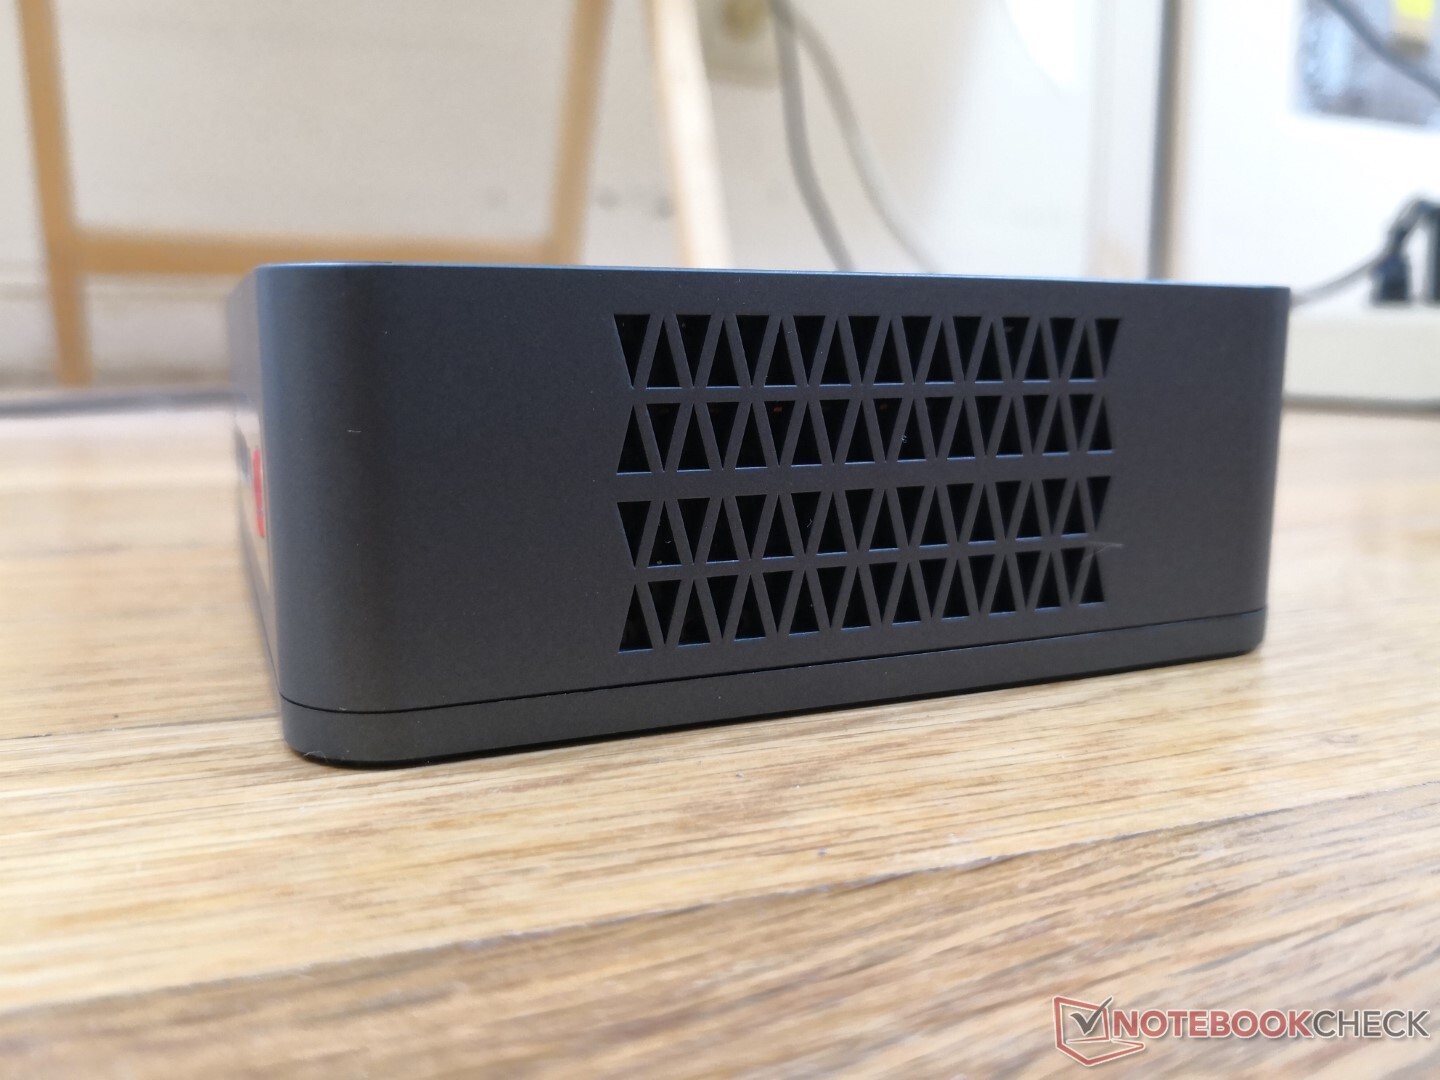
Caso
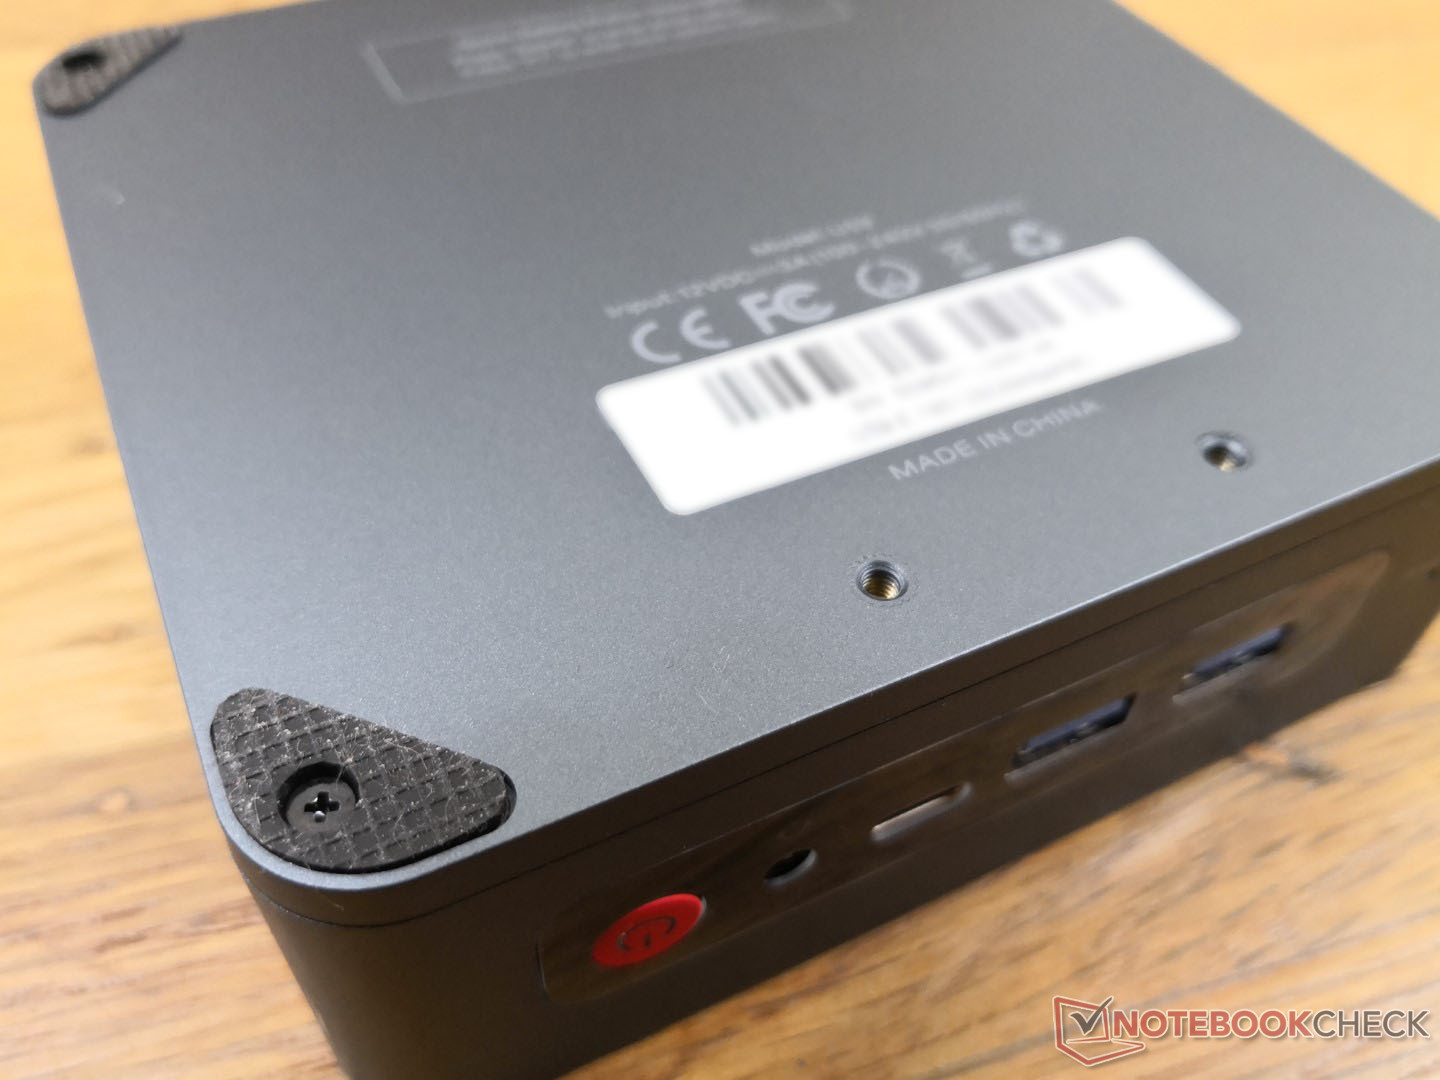
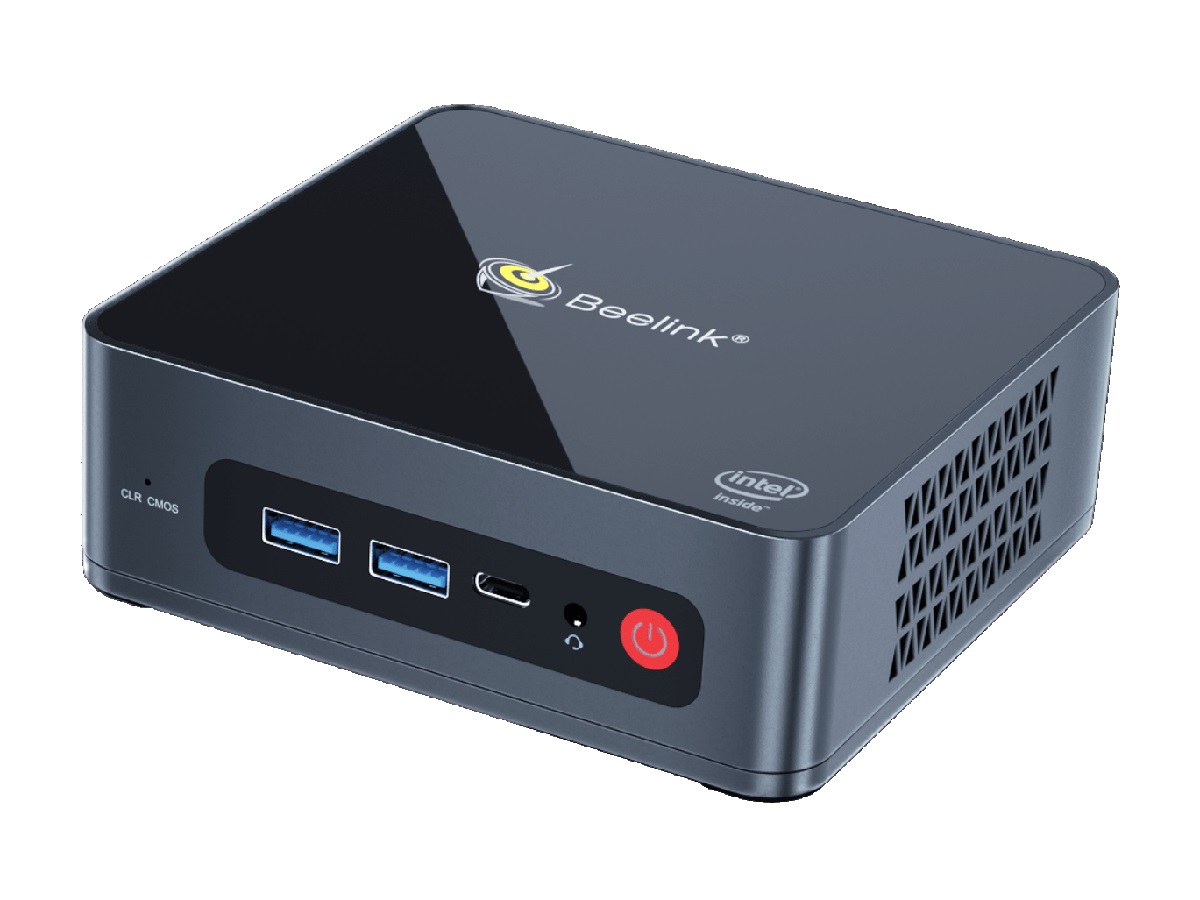
Beelink usa un design dello chassis simile tra il suo U59 e la serie SER3 mini PC basata su AMD. Sull'U59, tuttavia, la parte superiore è semplicemente di plastica lucida senza le griglie di metallo o il perimetro tagliato al cromo come si trova sul SER3 per un look più tenue. La parte superiore in plastica sembra bella all'inizio, ma anche il più debole dei graffi o delle impronte digitali sarà difficile da nascondere. Inoltre si flette più facilmente lungo il suo centro se paragonato ad altri mini PC più spessi come il GMK NucBox 2 o Intel NUC serie.
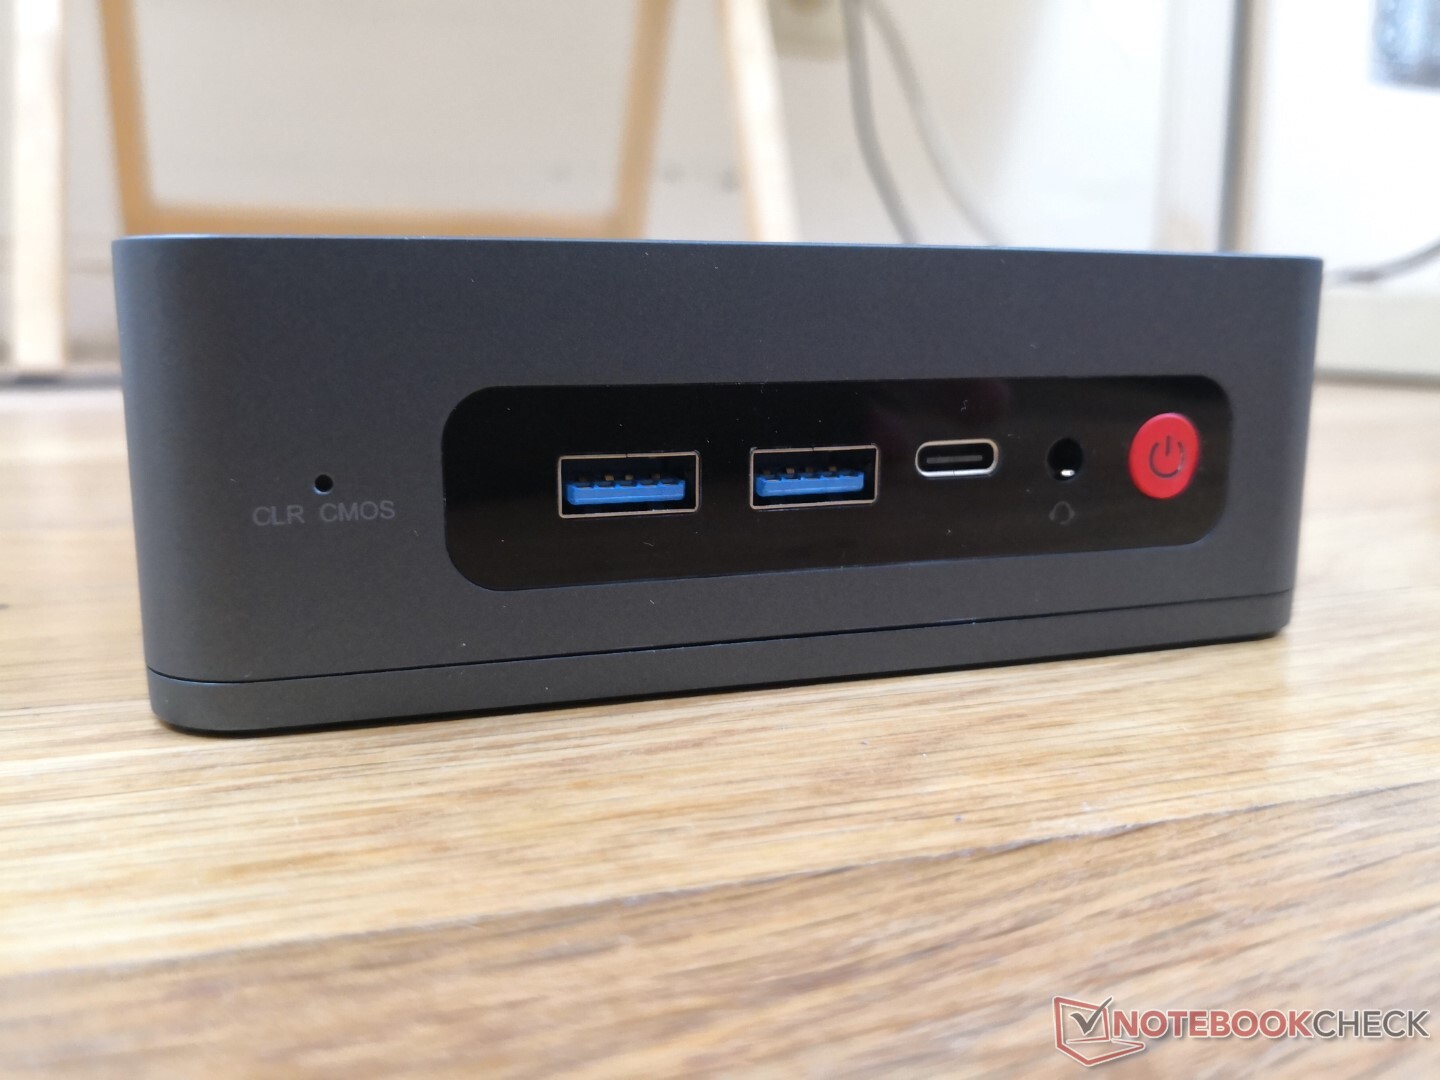
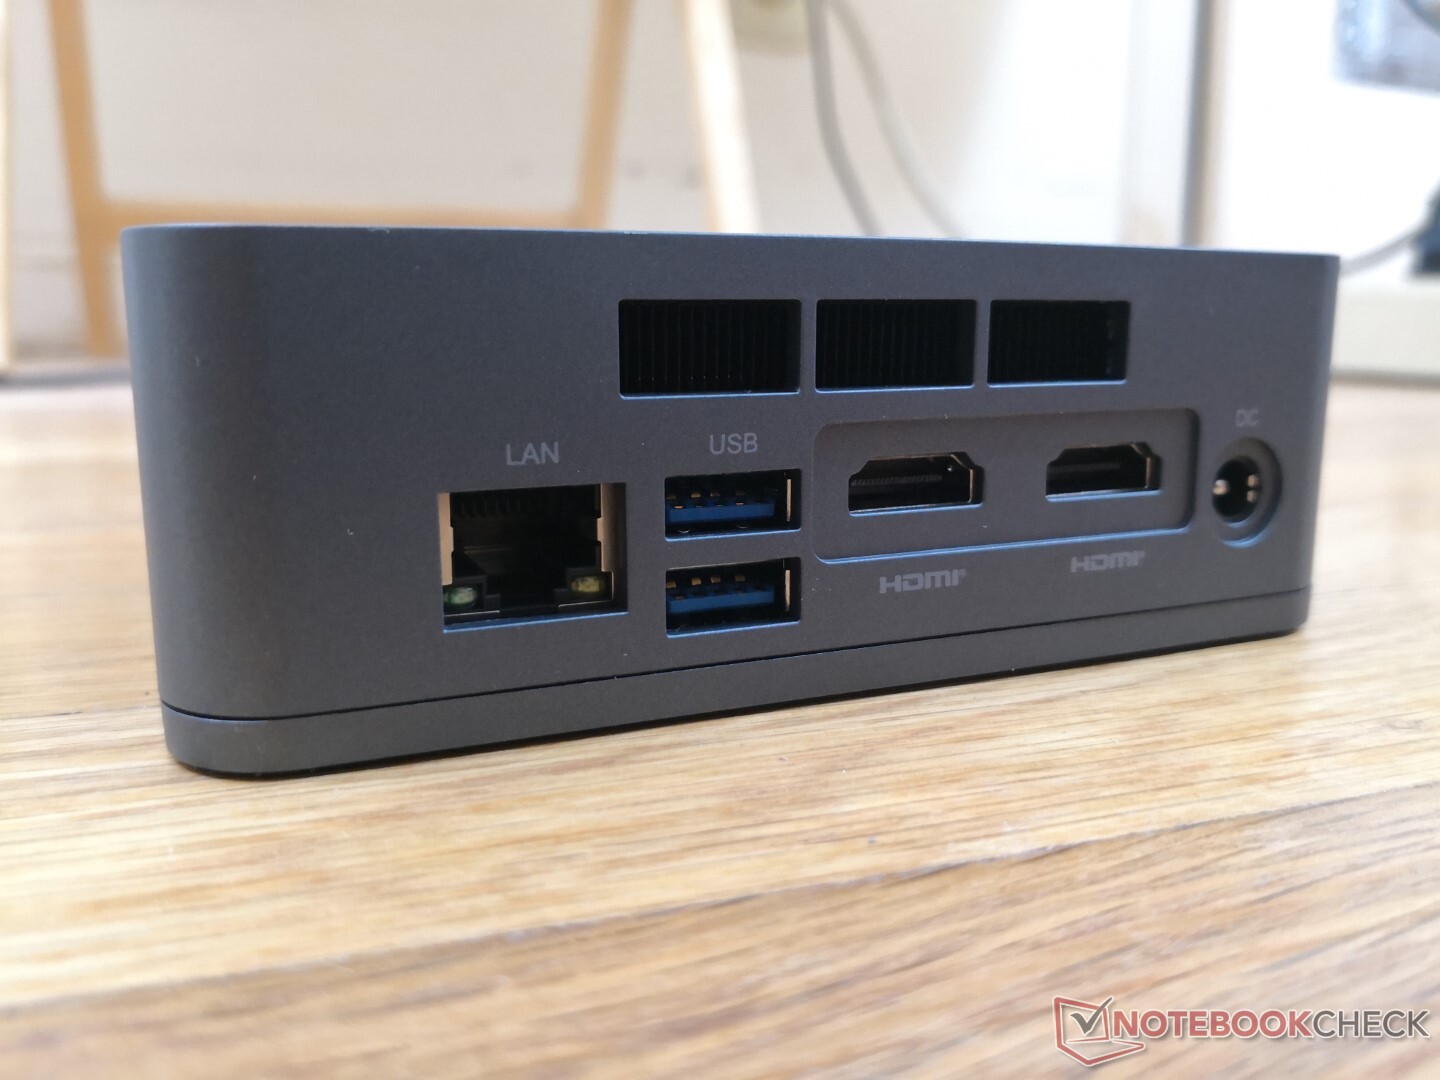
Connettività
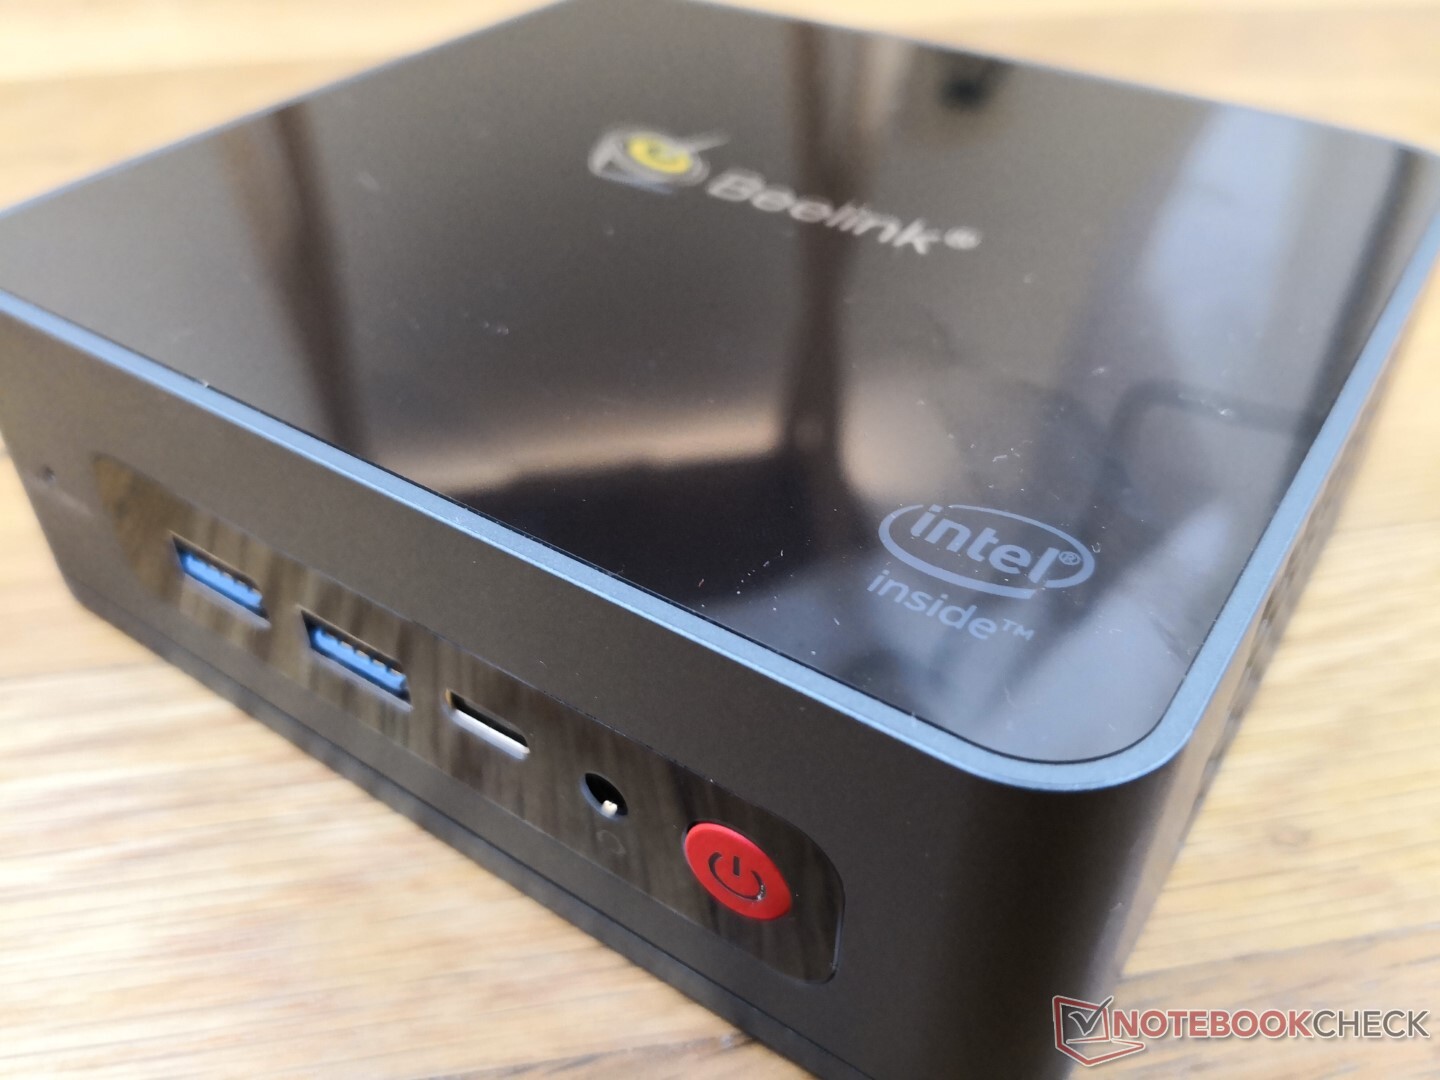
Le opzioni della porta fisica sono identiche al Beelink SEi10 ma con l'eccezione del supporto Thunderbolt. Sono supportati sia DisplayPort-over-USB-C che l'uscita 4K60.
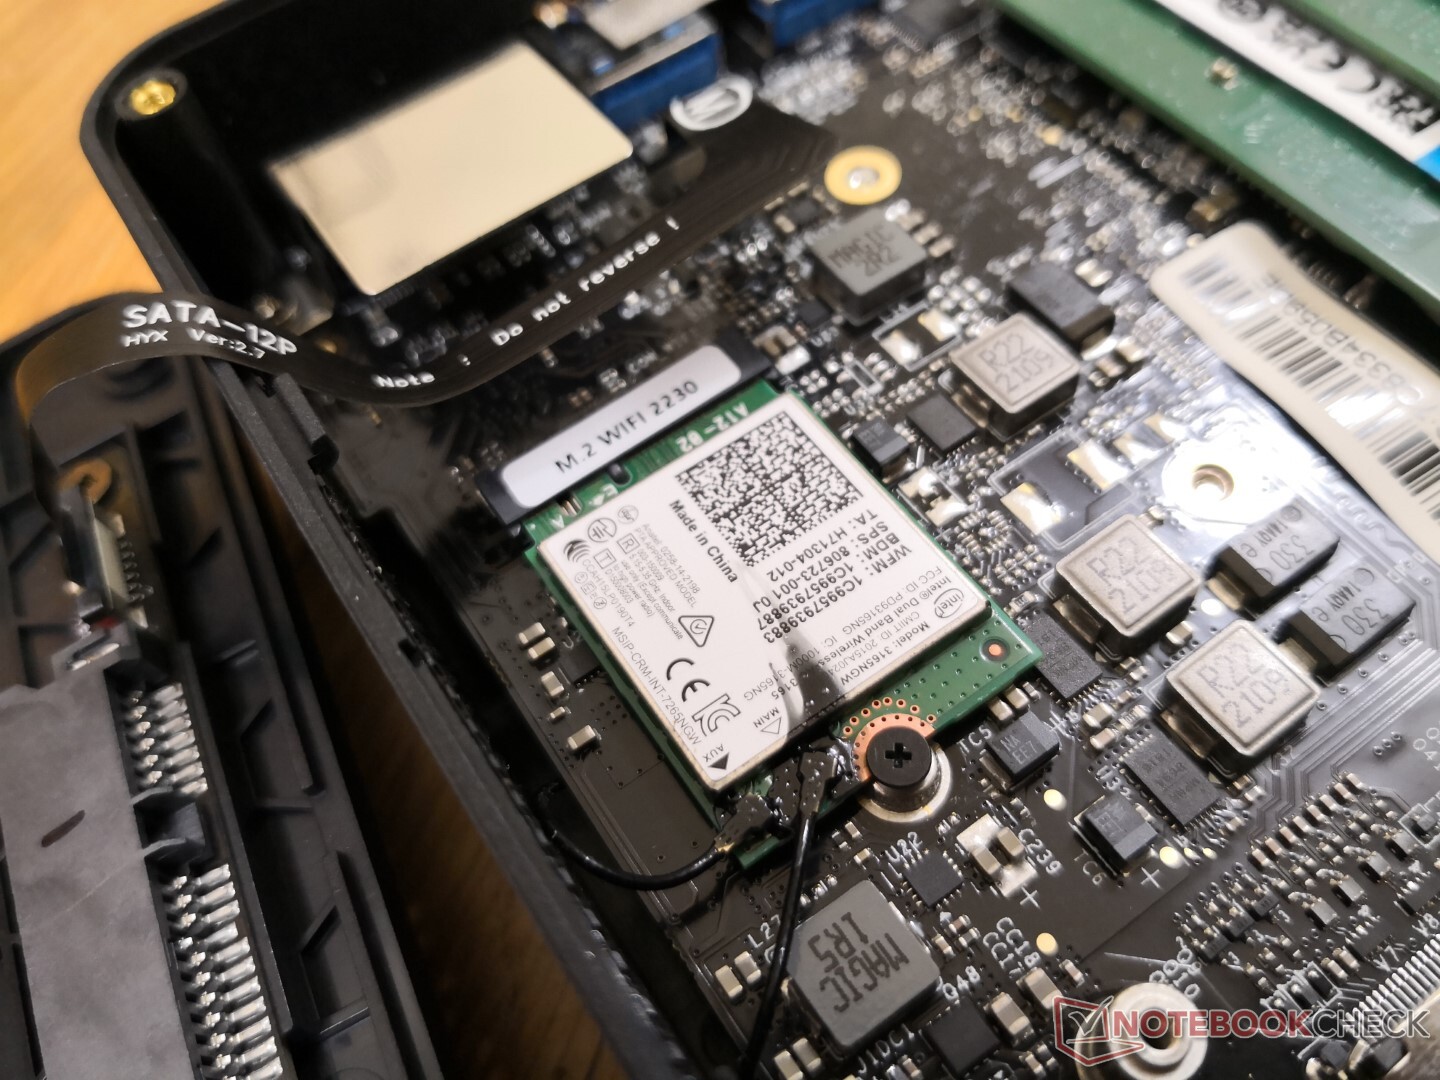
Comunicazione
L'Intel 3165, vecchio di 7 anni, è standard per la connettività Wi-Fi 5 fino a 433 Mbps teorici. Le prestazioni sono stabili anche se molto più lente dei moderni moduli Wi-Fi 6 di oltre un gigabit.
| Networking | |
| iperf3 transmit AX12 | |
| Intel NUC11TNKi5 | |
| Beelink SEi10 | |
| Intel NUC8i7BE | |
| Beelink U59 | |
| GMK NucBox K1 | |
| iperf3 receive AX12 | |
| Intel NUC11TNKi5 | |
| Beelink SEi10 | |
| Intel NUC8i7BE | |
| GMK NucBox K1 | |
| Beelink U59 | |
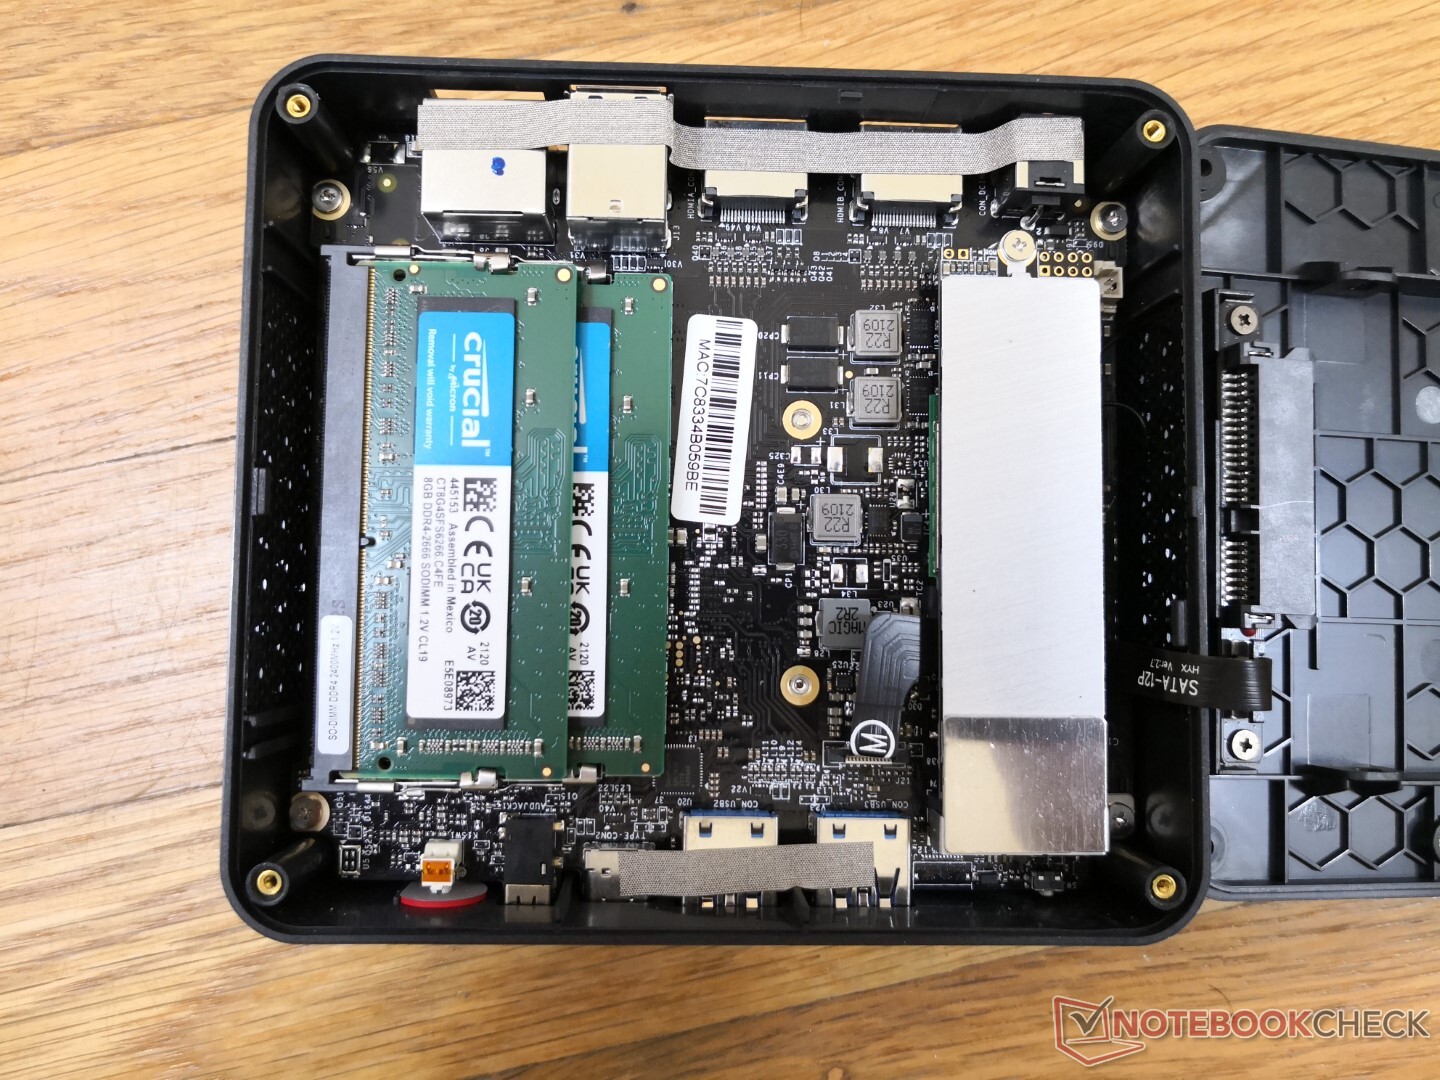
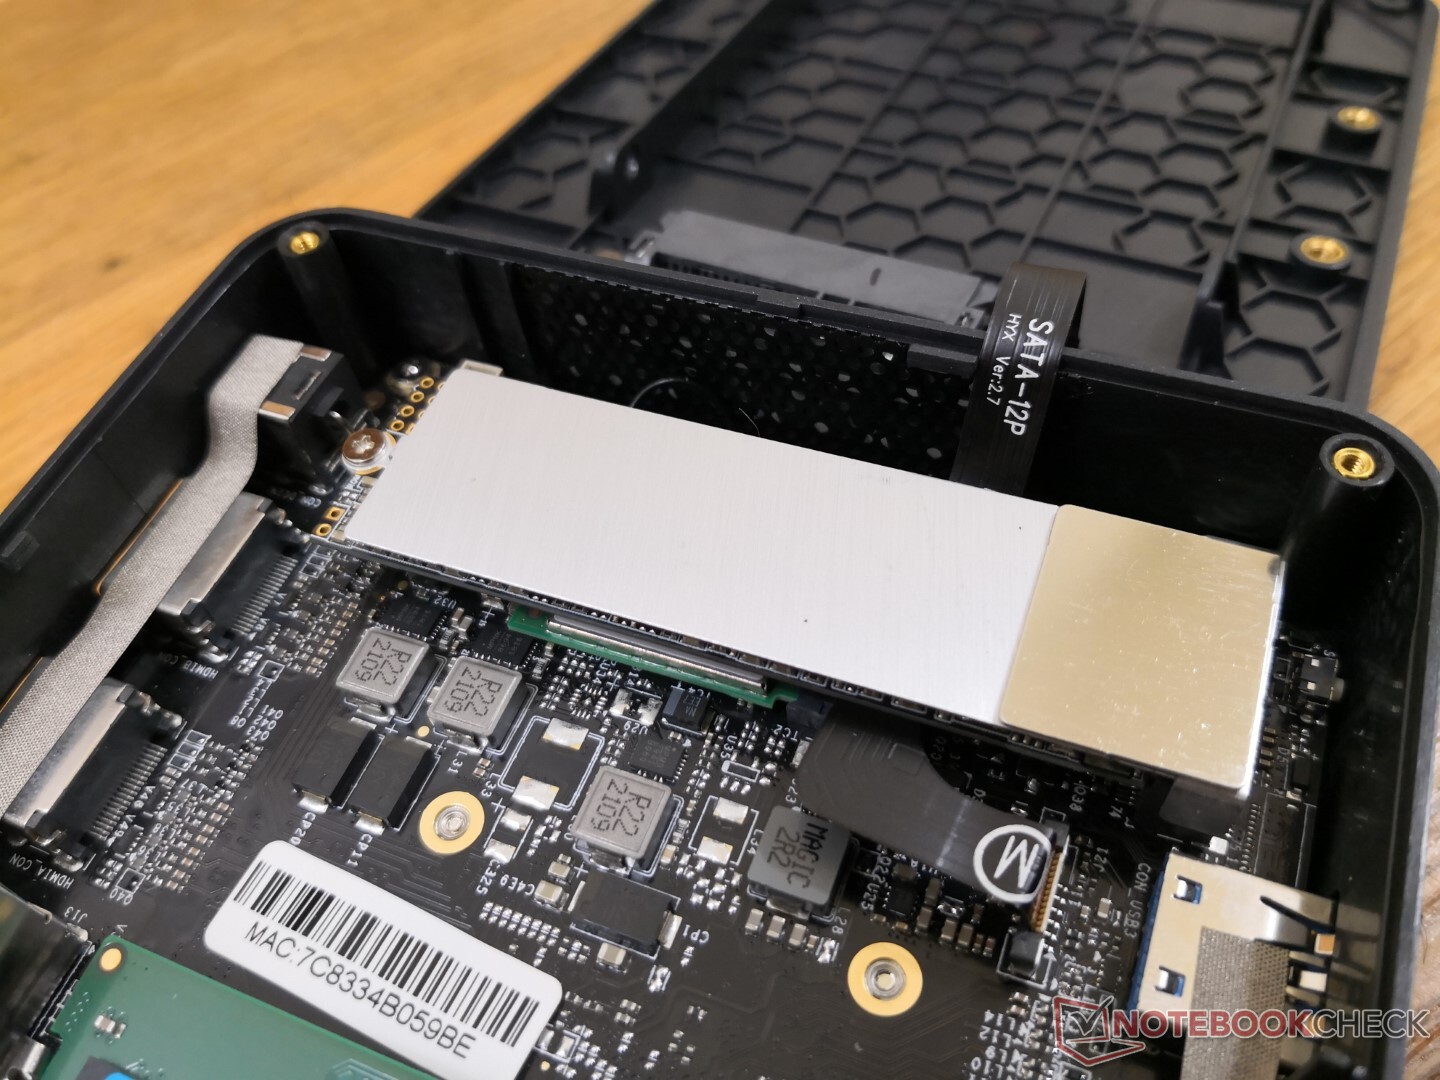
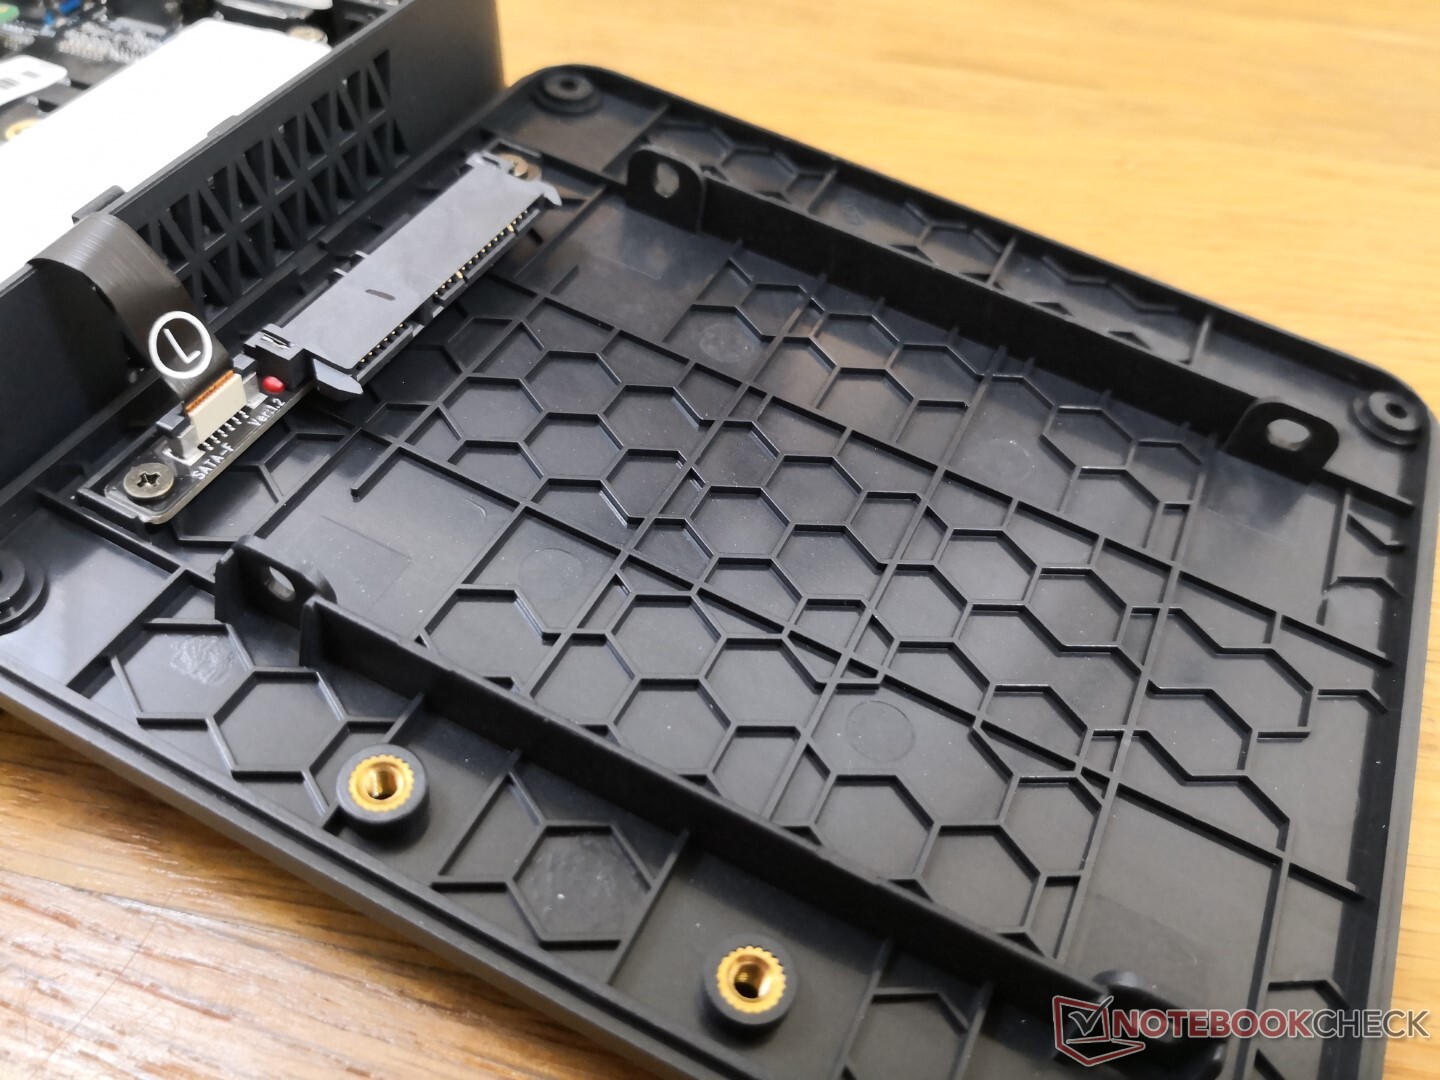
Manutenzione
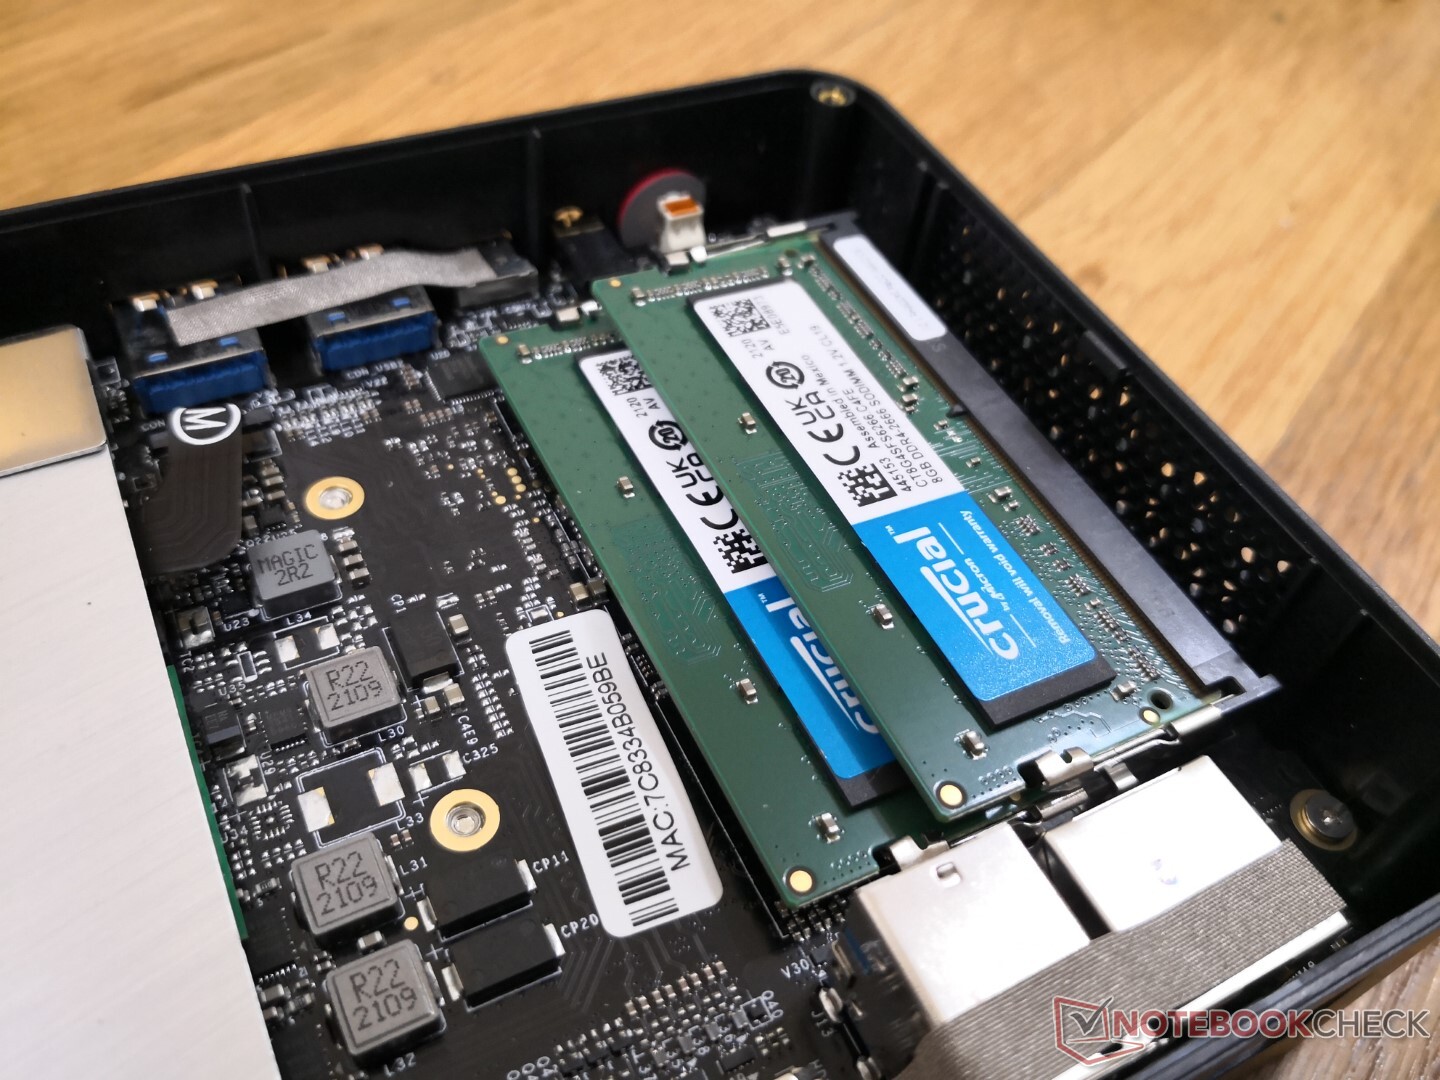
Il pannello inferiore è fissato da sole quattro viti Philips per una facile rimozione. Gli utenti hanno accesso diretto a 2x slot SODIMM, al modulo WLAN M.2 rimovibile e a due alloggiamenti di archiviazione (M.2 2280 SATA III + 2,5 pollici SATA III). Sfortunatamente, il processore e la ventola richiedono un ulteriore smontaggio poiché entrambi si trovano sull'altro lato della scheda madre.
Accessori e garanzia
La confezione al dettaglio include due cavi HDMI, l'adattatore AC, la documentazione e una staffa di montaggio VESA rimovibile. Si applica la garanzia limitata standard di un anno
Performance
Processore
Le prestazioni della CPU multi-thread sono sorprendentemente abbastanza vicine a quelle di Ice LakeCore i3-1005G1. Al contrario, le prestazioni single-thread sono molto più lente di circa il 30-40%. Il Celeron N5095 ha quattro core fisici senza Hyper-Threading mentre l'i3-1005G1 ha due core fisici con Hyper-Threading e quindi non è inaspettato vedere prestazioni single-thread più veloci sul processore con meno core. La sostenibilità delle prestazioni nel tempo è altrimenti eccellente quando si esegue CineBench R15 xT in un ciclo.
Cinebench R15 Multi Loop
Cinebench R23: Multi Core | Single Core
Cinebench R20: CPU (Multi Core) | CPU (Single Core)
Cinebench R15: CPU Multi 64Bit | CPU Single 64Bit
Blender: v2.79 BMW27 CPU
7-Zip 18.03: 7z b 4 | 7z b 4 -mmt1
Geekbench 5.5: Multi-Core | Single-Core
HWBOT x265 Benchmark v2.2: 4k Preset
LibreOffice : 20 Documents To PDF
R Benchmark 2.5: Overall mean
| CPU Performance rating | |
| Intel NUC11TNKi5 | |
| Intel NUC8i7BE -3! | |
| Zotac ZBOX MI642 Nano -2! | |
| Beelink SEi10 -2! | |
| Beelink U59 -2! | |
| Media Intel Celeron N5095 | |
| GMK NucBox K1 -2! | |
| Blackview AceBook 1 -2! | |
| Jumper Tech Ez Book X3 Air -2! | |
| Asus BR1100FKA-BP0109RA | |
| Chuwi LapBook Plus -6! | |
| Cinebench R23 / Multi Core | |
| Intel NUC11TNKi5 | |
| Beelink U59 | |
| Media Intel Celeron N5095 (2150 - 2219, n=5) | |
| Blackview AceBook 1 | |
| Asus BR1100FKA-BP0109RA | |
| Cinebench R23 / Single Core | |
| Intel NUC11TNKi5 | |
| Beelink U59 | |
| Media Intel Celeron N5095 (587 - 621, n=5) | |
| Asus BR1100FKA-BP0109RA | |
| Blackview AceBook 1 | |
| Cinebench R20 / CPU (Multi Core) | |
| Intel NUC11TNKi5 | |
| Intel NUC8i7BE | |
| Zotac ZBOX MI642 Nano | |
| Beelink SEi10 | |
| Beelink U59 | |
| Media Intel Celeron N5095 (804 - 844, n=5) | |
| Jumper Tech Ez Book X3 Air | |
| Blackview AceBook 1 | |
| Asus BR1100FKA-BP0109RA | |
| GMK NucBox K1 | |
| Chuwi LapBook Plus | |
| Cinebench R20 / CPU (Single Core) | |
| Intel NUC11TNKi5 | |
| Intel NUC8i7BE | |
| Zotac ZBOX MI642 Nano | |
| Beelink SEi10 | |
| Beelink U59 | |
| Media Intel Celeron N5095 (228 - 239, n=5) | |
| Asus BR1100FKA-BP0109RA | |
| GMK NucBox K1 | |
| Blackview AceBook 1 | |
| Jumper Tech Ez Book X3 Air | |
| Chuwi LapBook Plus | |
| Cinebench R15 / CPU Multi 64Bit | |
| Intel NUC8i7BE | |
| Intel NUC11TNKi5 | |
| Zotac ZBOX MI642 Nano | |
| Beelink SEi10 | |
| Beelink U59 | |
| Media Intel Celeron N5095 (221 - 379, n=6) | |
| GMK NucBox K1 | |
| Blackview AceBook 1 | |
| Jumper Tech Ez Book X3 Air | |
| Asus BR1100FKA-BP0109RA | |
| Chuwi LapBook Plus | |
| Cinebench R15 / CPU Single 64Bit | |
| Intel NUC11TNKi5 | |
| Intel NUC8i7BE | |
| Zotac ZBOX MI642 Nano | |
| Beelink SEi10 | |
| Beelink U59 | |
| Media Intel Celeron N5095 (95.4 - 109, n=5) | |
| Asus BR1100FKA-BP0109RA | |
| GMK NucBox K1 | |
| Blackview AceBook 1 | |
| Jumper Tech Ez Book X3 Air | |
| Chuwi LapBook Plus | |
| Blender / v2.79 BMW27 CPU | |
| Chuwi LapBook Plus | |
| Asus BR1100FKA-BP0109RA | |
| Jumper Tech Ez Book X3 Air | |
| Blackview AceBook 1 | |
| GMK NucBox K1 | |
| Media Intel Celeron N5095 (1502 - 1624, n=5) | |
| Beelink U59 | |
| Beelink SEi10 | |
| Zotac ZBOX MI642 Nano | |
| Intel NUC8i7BE | |
| Intel NUC8i7BE | |
| Intel NUC11TNKi5 | |
| 7-Zip 18.03 / 7z b 4 -mmt1 | |
| Intel NUC8i7BE | |
| Intel NUC8i7BE | |
| Intel NUC11TNKi5 | |
| Zotac ZBOX MI642 Nano | |
| Beelink SEi10 | |
| Beelink U59 | |
| Media Intel Celeron N5095 (2935 - 3124, n=5) | |
| Asus BR1100FKA-BP0109RA | |
| Blackview AceBook 1 | |
| GMK NucBox K1 | |
| Jumper Tech Ez Book X3 Air | |
| Chuwi LapBook Plus | |
| Geekbench 5.5 / Multi-Core | |
| Intel NUC11TNKi5 | |
| Zotac ZBOX MI642 Nano | |
| Intel NUC8i7BE | |
| Beelink SEi10 | |
| Media Intel Celeron N5095 (1933 - 2052, n=4) | |
| Jumper Tech Ez Book X3 Air | |
| GMK NucBox K1 | |
| Asus BR1100FKA-BP0109RA | |
| Geekbench 5.5 / Single-Core | |
| Intel NUC11TNKi5 | |
| Beelink SEi10 | |
| Zotac ZBOX MI642 Nano | |
| Intel NUC8i7BE | |
| Media Intel Celeron N5095 (637 - 659, n=4) | |
| GMK NucBox K1 | |
| Jumper Tech Ez Book X3 Air | |
| Asus BR1100FKA-BP0109RA | |
| HWBOT x265 Benchmark v2.2 / 4k Preset | |
| Intel NUC11TNKi5 | |
| Intel NUC8i7BE | |
| Intel NUC8i7BE | |
| Zotac ZBOX MI642 Nano | |
| Beelink SEi10 | |
| Beelink U59 | |
| Media Intel Celeron N5095 (1.9 - 2.05, n=5) | |
| GMK NucBox K1 | |
| Jumper Tech Ez Book X3 Air | |
| Blackview AceBook 1 | |
| Chuwi LapBook Plus | |
| Asus BR1100FKA-BP0109RA | |
| LibreOffice / 20 Documents To PDF | |
| Asus BR1100FKA-BP0109RA | |
| Blackview AceBook 1 | |
| Jumper Tech Ez Book X3 Air | |
| GMK NucBox K1 | |
| Media Intel Celeron N5095 (97 - 107.9, n=5) | |
| Beelink U59 | |
| Zotac ZBOX MI642 Nano | |
| Beelink SEi10 | |
| Intel NUC11TNKi5 | |
| R Benchmark 2.5 / Overall mean | |
| Asus BR1100FKA-BP0109RA | |
| Jumper Tech Ez Book X3 Air | |
| Blackview AceBook 1 | |
| GMK NucBox K1 | |
| Media Intel Celeron N5095 (1.16 - 1.2, n=5) | |
| Beelink U59 | |
| Beelink SEi10 | |
| Zotac ZBOX MI642 Nano | |
| Intel NUC8i7BE | |
| Intel NUC11TNKi5 | |
* ... Meglio usare valori piccoli
AIDA64: FP32 Ray-Trace | FPU Julia | CPU SHA3 | CPU Queen | FPU SinJulia | FPU Mandel | CPU AES | CPU ZLib | FP64 Ray-Trace | CPU PhotoWorxx
| Performance rating | |
| Intel NUC11TNKi5 | |
| Intel NUC8i7BE -1! | |
| Zotac ZBOX MI642 Nano | |
| Beelink U59 | |
| AIDA64 / FP32 Ray-Trace | |
| Intel NUC11TNKi5 | |
| Intel NUC8i7BE | |
| Zotac ZBOX MI642 Nano | |
| Beelink U59 | |
| AIDA64 / FPU Julia | |
| Intel NUC11TNKi5 | |
| Intel NUC8i7BE | |
| Zotac ZBOX MI642 Nano | |
| Beelink U59 | |
| AIDA64 / CPU SHA3 | |
| Intel NUC11TNKi5 | |
| Zotac ZBOX MI642 Nano | |
| Beelink U59 | |
| AIDA64 / CPU Queen | |
| Intel NUC8i7BE | |
| Zotac ZBOX MI642 Nano | |
| Intel NUC11TNKi5 | |
| Beelink U59 | |
| AIDA64 / FPU SinJulia | |
| Intel NUC8i7BE | |
| Intel NUC11TNKi5 | |
| Zotac ZBOX MI642 Nano | |
| Beelink U59 | |
| AIDA64 / FPU Mandel | |
| Intel NUC11TNKi5 | |
| Intel NUC8i7BE | |
| Zotac ZBOX MI642 Nano | |
| Beelink U59 | |
| AIDA64 / CPU AES | |
| Intel NUC11TNKi5 | |
| Beelink U59 | |
| Intel NUC8i7BE | |
| Zotac ZBOX MI642 Nano | |
| AIDA64 / CPU ZLib | |
| Intel NUC11TNKi5 | |
| Intel NUC8i7BE | |
| Zotac ZBOX MI642 Nano | |
| Beelink U59 | |
| AIDA64 / FP64 Ray-Trace | |
| Intel NUC11TNKi5 | |
| Intel NUC8i7BE | |
| Zotac ZBOX MI642 Nano | |
| Beelink U59 | |
| AIDA64 / CPU PhotoWorxx | |
| Intel NUC8i7BE | |
| Intel NUC11TNKi5 | |
| Zotac ZBOX MI642 Nano | |
| Beelink U59 | |
Prestazioni del sistema
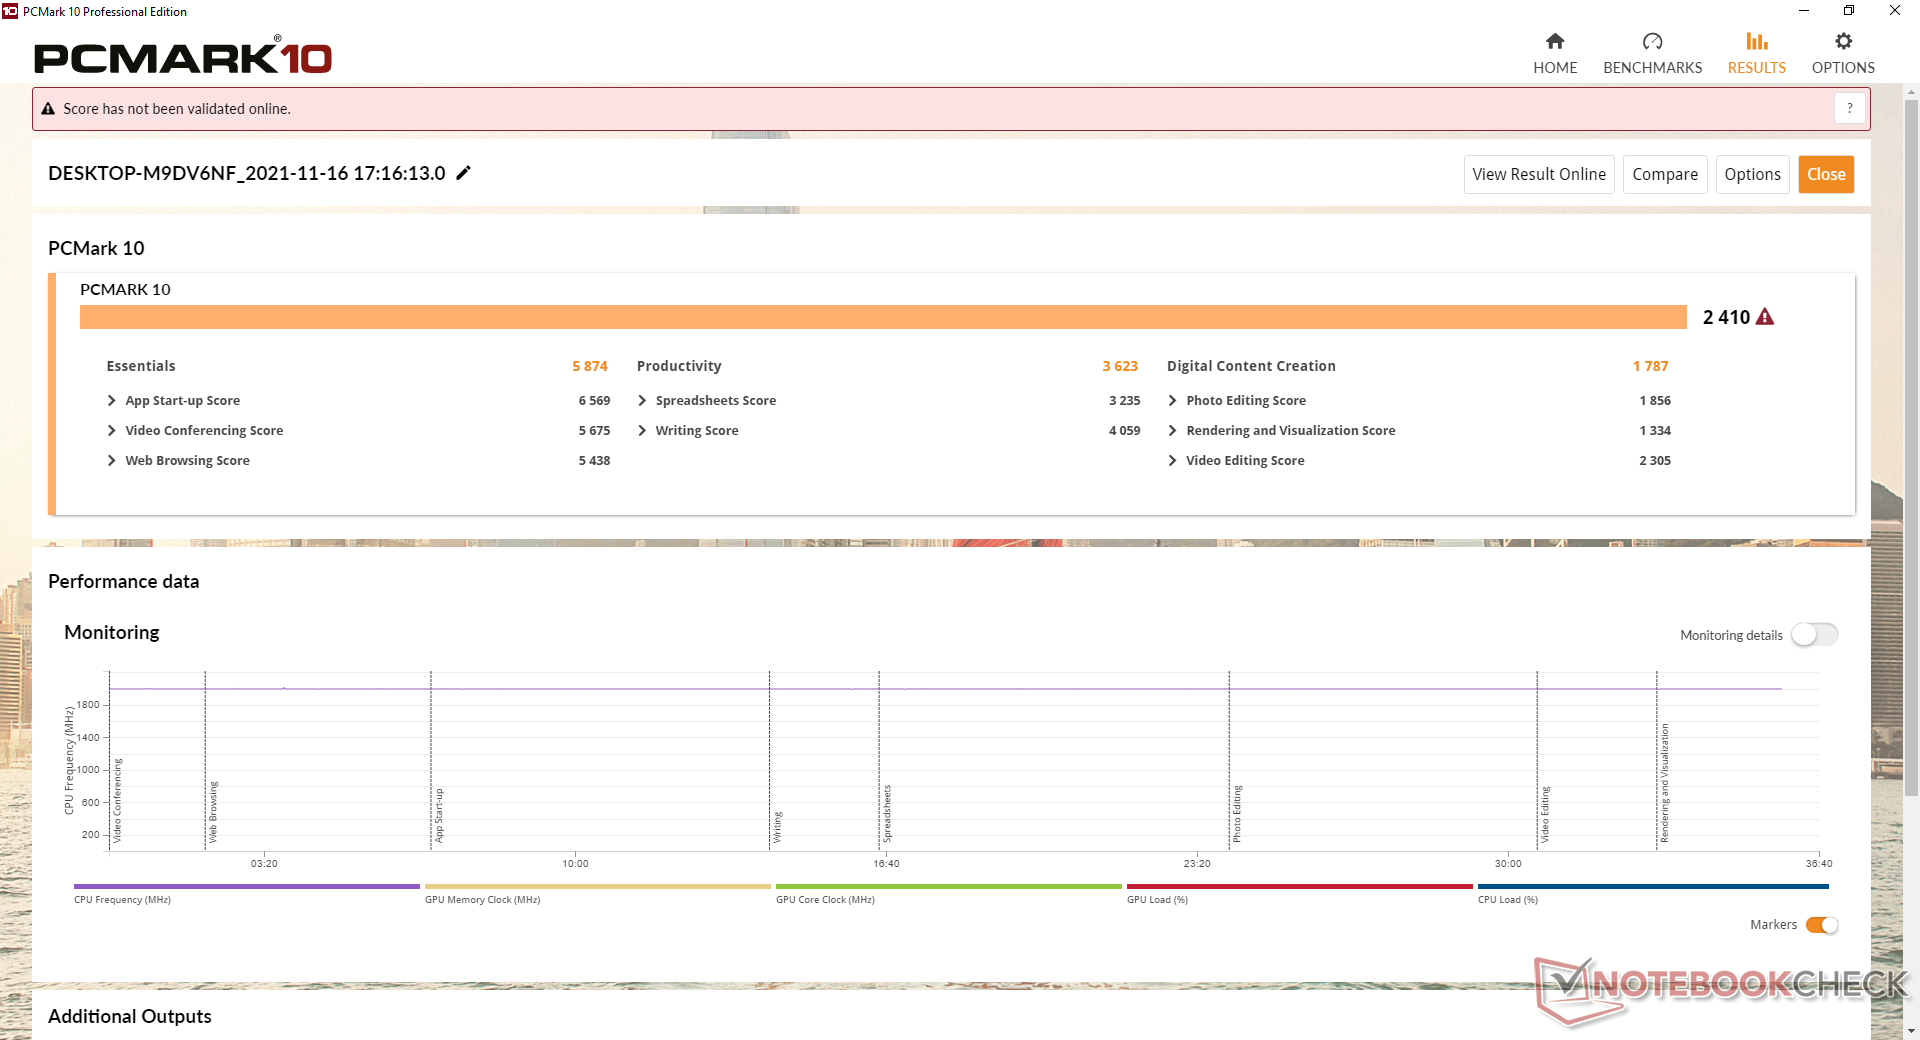
I punteggi PCMark 10 sono costantemente più alti delGMK NucBox K1 mentre sono più lenti del Core i3-powered Beelink SEi10.
| PCMark 10 / Score | |
| Intel NUC8i7BE | |
| Intel NUC11TNKi5 | |
| Zotac ZBOX MI642 Nano | |
| Beelink SEi10 | |
| Beelink U59 | |
| Media Intel Celeron N5095, Intel UHD Graphics (Jasper Lake 16 EU) (2317 - 2417, n=5) | |
| GMK NucBox K1 | |
| PCMark 10 / Essentials | |
| Intel NUC11TNKi5 | |
| Intel NUC8i7BE | |
| Zotac ZBOX MI642 Nano | |
| Beelink SEi10 | |
| Beelink U59 | |
| Media Intel Celeron N5095, Intel UHD Graphics (Jasper Lake 16 EU) (5516 - 5874, n=5) | |
| GMK NucBox K1 | |
| PCMark 10 / Productivity | |
| Intel NUC8i7BE | |
| Zotac ZBOX MI642 Nano | |
| Intel NUC11TNKi5 | |
| Beelink SEi10 | |
| Beelink U59 | |
| Media Intel Celeron N5095, Intel UHD Graphics (Jasper Lake 16 EU) (3454 - 3666, n=5) | |
| GMK NucBox K1 | |
| PCMark 10 / Digital Content Creation | |
| Intel NUC11TNKi5 | |
| Intel NUC8i7BE | |
| Zotac ZBOX MI642 Nano | |
| Beelink SEi10 | |
| Beelink U59 | |
| Media Intel Celeron N5095, Intel UHD Graphics (Jasper Lake 16 EU) (1752 - 1787, n=5) | |
| GMK NucBox K1 | |
| PCMark 10 Score | 2410 punti | |
Aiuto | ||
| AIDA64 / Memory Copy | |
| Intel NUC8i7BE | |
| Zotac ZBOX MI642 Nano | |
| Beelink U59 | |
| Intel NUC11TNKi5 | |
| AIDA64 / Memory Read | |
| Intel NUC8i7BE | |
| Zotac ZBOX MI642 Nano | |
| Intel NUC11TNKi5 | |
| Beelink U59 | |
| AIDA64 / Memory Write | |
| Intel NUC8i7BE | |
| Zotac ZBOX MI642 Nano | |
| Beelink U59 | |
| Intel NUC11TNKi5 | |
| AIDA64 / Memory Latency | |
| Zotac ZBOX MI642 Nano | |
| Intel NUC11TNKi5 | |
| Beelink U59 | |
| Intel NUC8i7BE | |
* ... Meglio usare valori piccoli
Latenza DPC
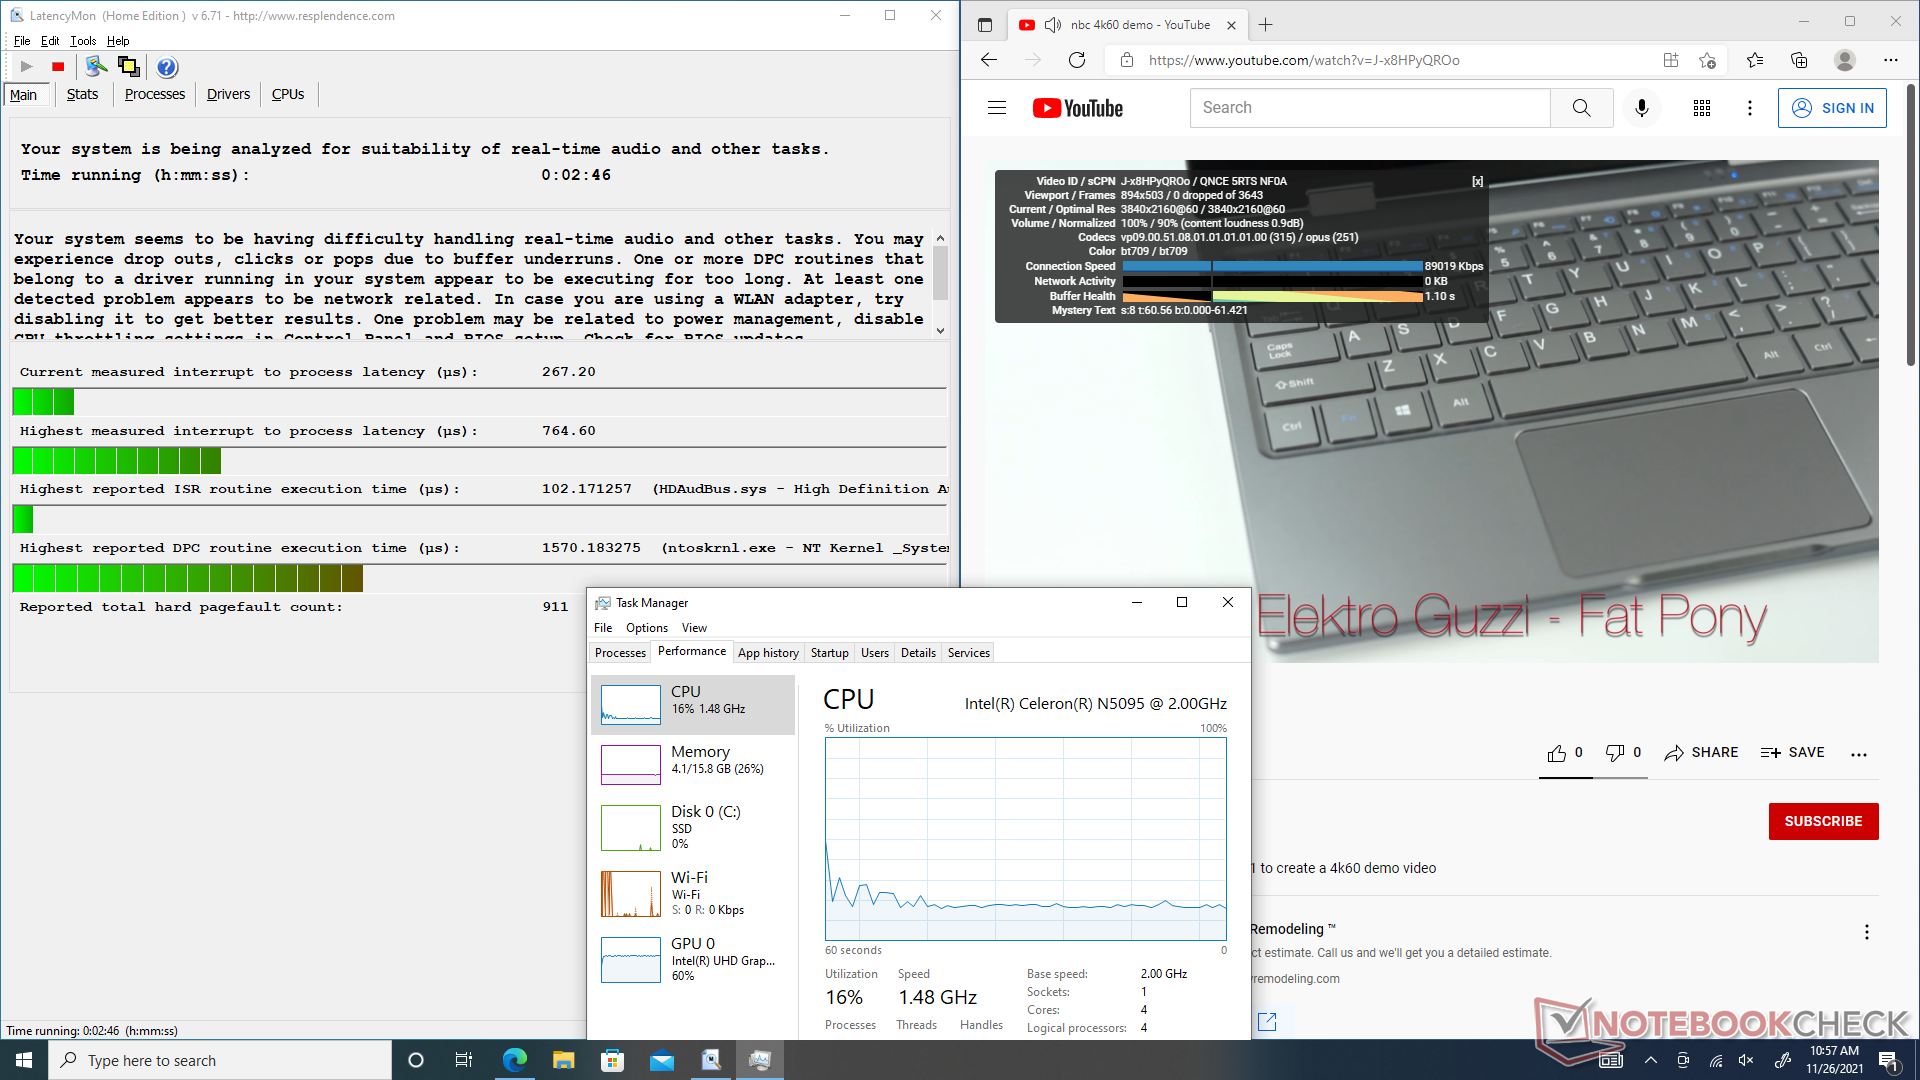
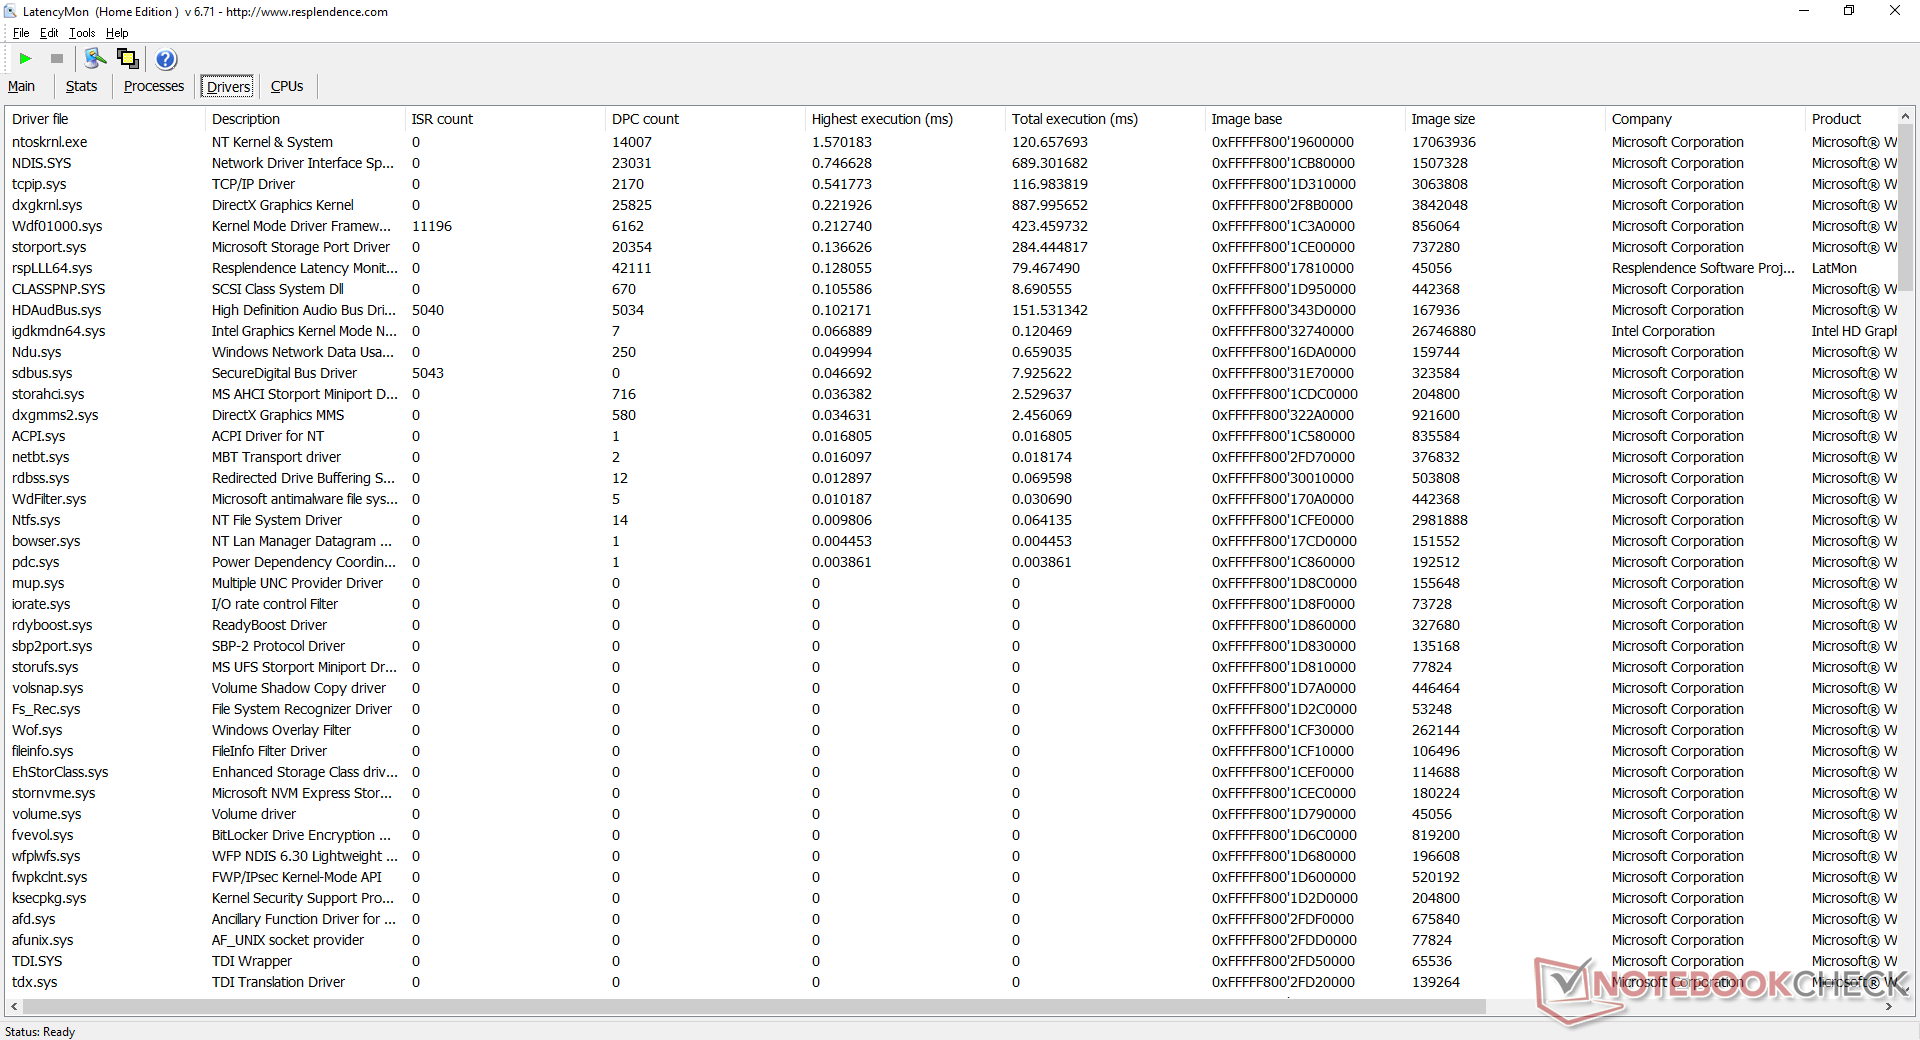
LatencyMon rivela piccoli problemi di latenza DPC quando si aprono più schede del browser sulla nostra homepage. La riproduzione di video 4K è altrimenti eccellente con nessun fotogramma caduto durante il nostro test di un minuto. L'utilizzo della GPU sarebbe relativamente alto al 60%.
| DPC Latencies / LatencyMon - interrupt to process latency (max), Web, Youtube, Prime95 | |
| GMK NucBox K1 | |
| Beelink SEi10 | |
| Beelink U59 | |
| Intel NUC11TNKi5 | |
* ... Meglio usare valori piccoli
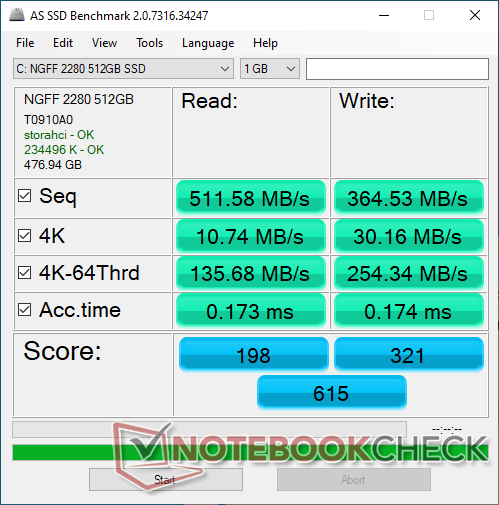
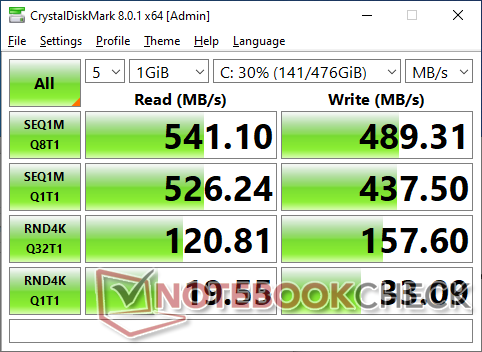
Dispositivi di archiviazione
La nostra unità di prova è dotata di un 512 GB AZW M.2 2280 SATA III SSD che è una marca relativamente sconosciuta, probabilmente per risparmiare sui costi. La maggior parte degli altri PC utilizza marche di SSD più note come Samsung, Intel, Kingston o altre. Le velocità di trasferimento sono comunque eccellenti per un'unità SATA III con velocità di lettura e scrittura sequenziale di circa 500 MB/s ciascuna.

| Drive Performance rating - Percent | |
| Beelink SEi10 | |
| Zotac ZBOX MI642 Nano | |
| Intel NUC11TNKi5 | |
| Beelink U59 | |
| GMK NucBox K1 | |
* ... Meglio usare valori piccoli
Disk Throttling: DiskSpd Read Loop, Queue Depth 8
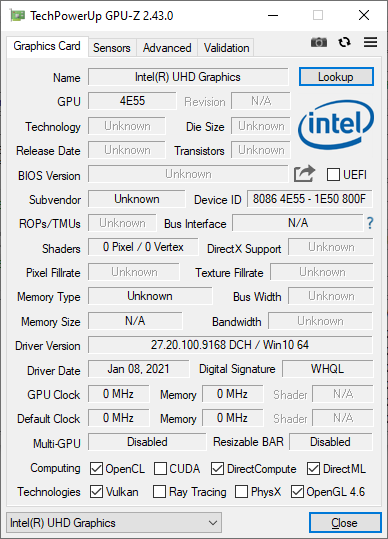
Prestazioni della GPU
Le prestazioni grafiche sono circa il 40-50% più lente del comune UHD Graphics 620 che si trovavano sui vecchi computer portatili e mini PC prima dell'avvento di Iris Xe. Anche se capace di streaming, non aspettatevi che la maggior parte dei giochi nativi girino bene.
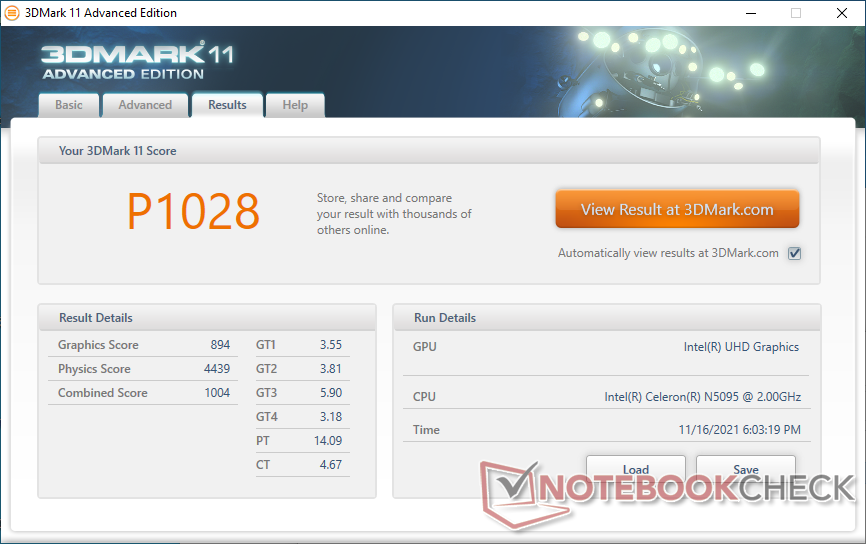
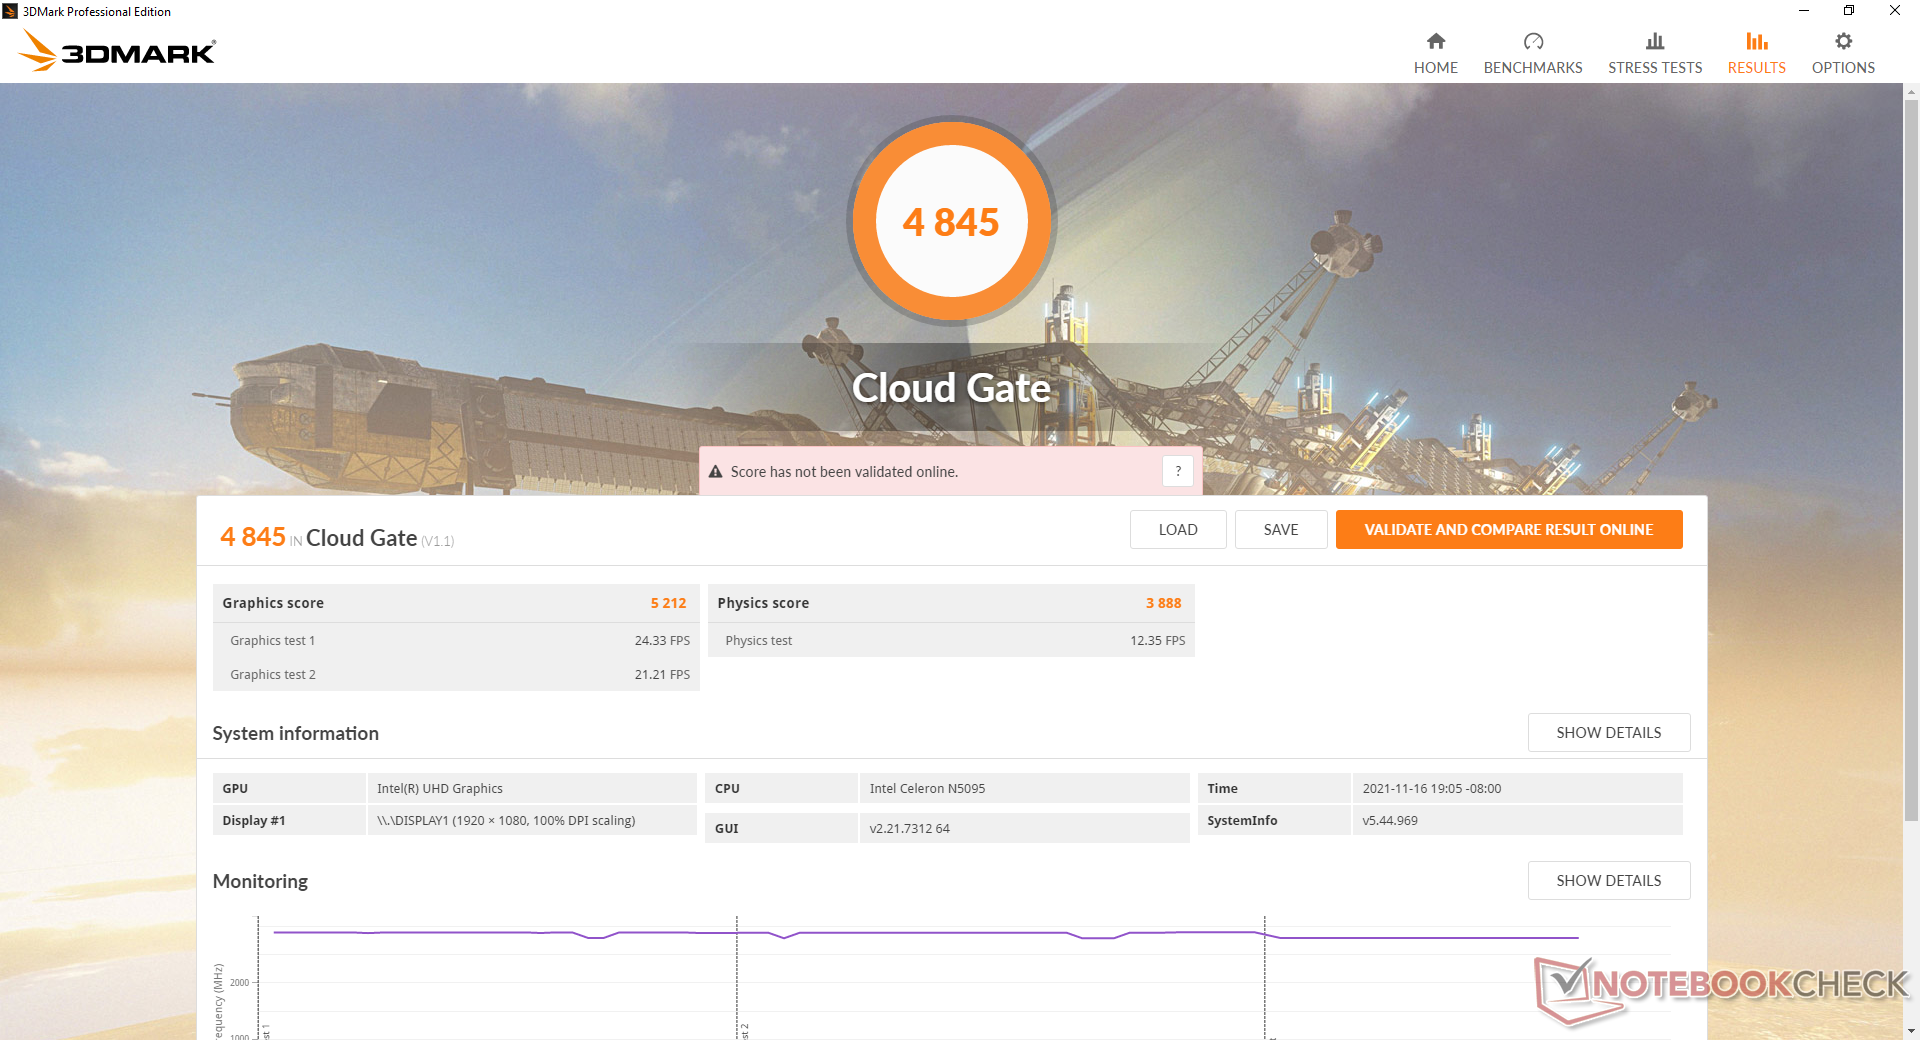
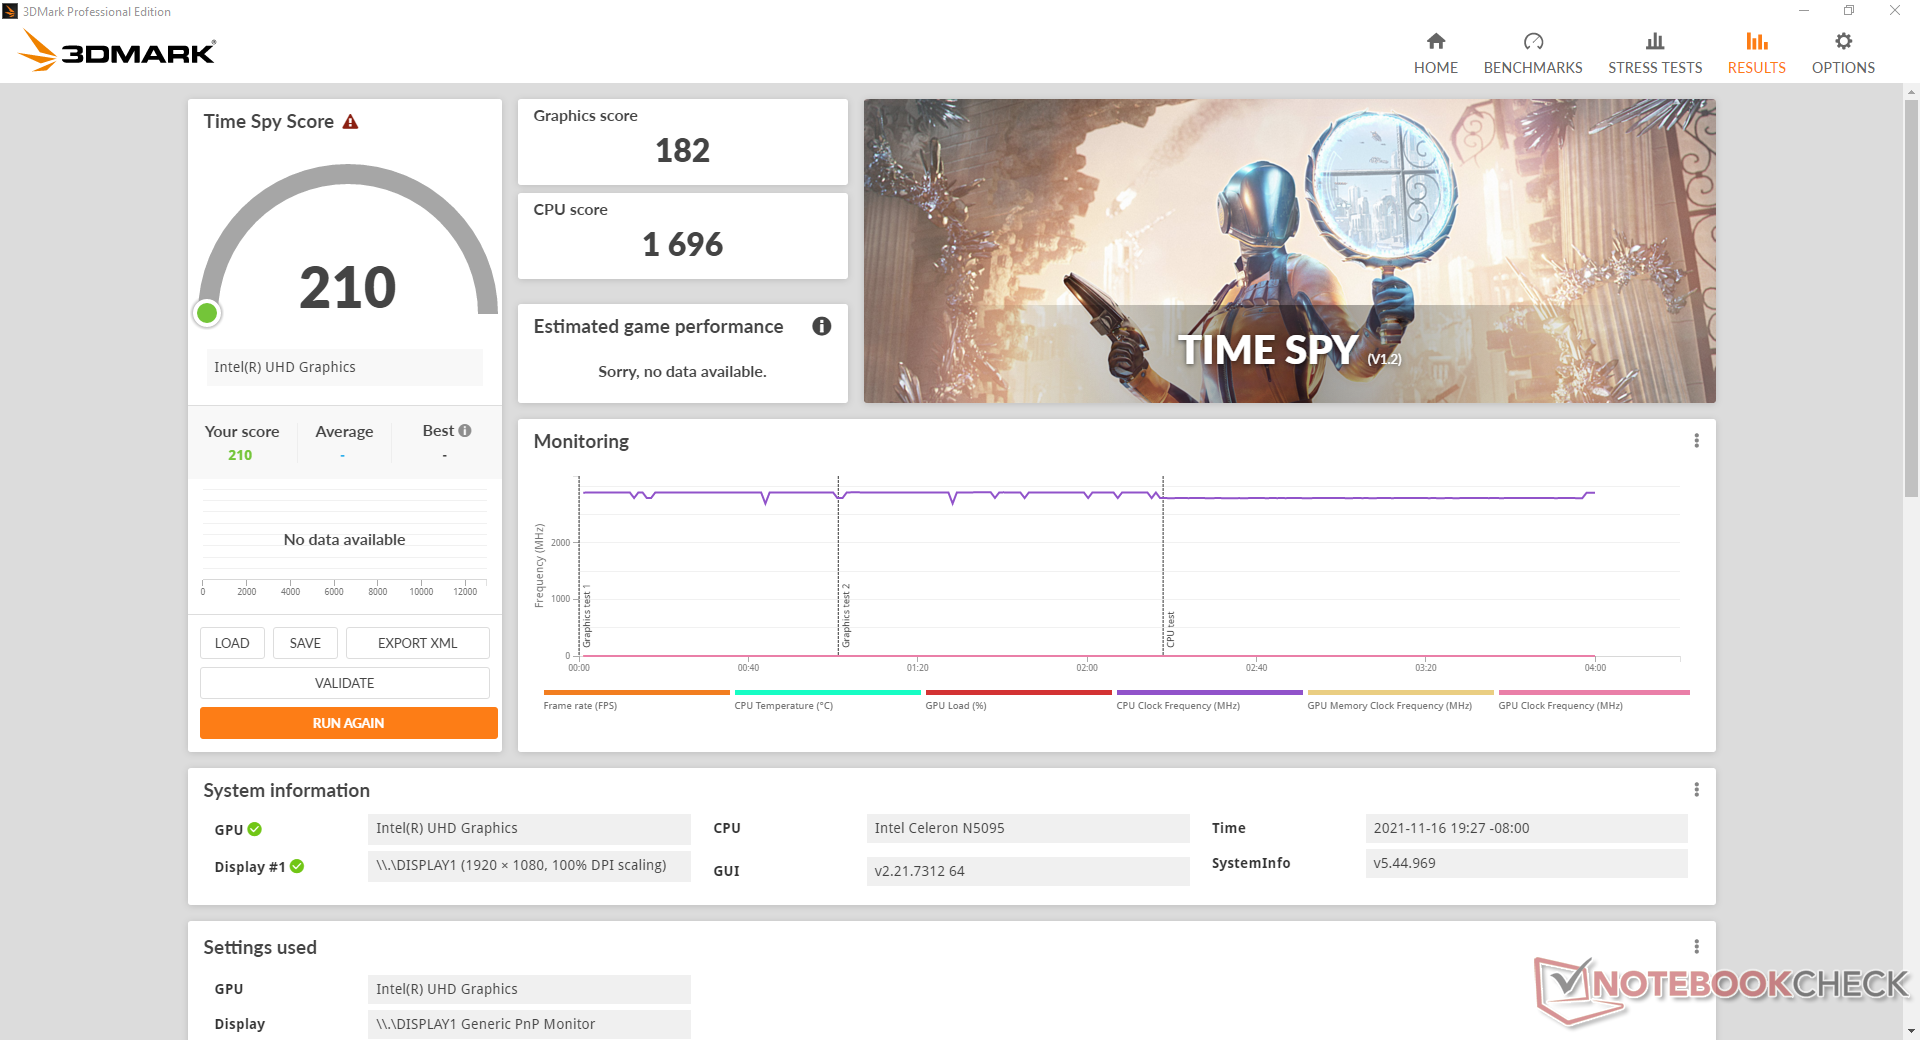
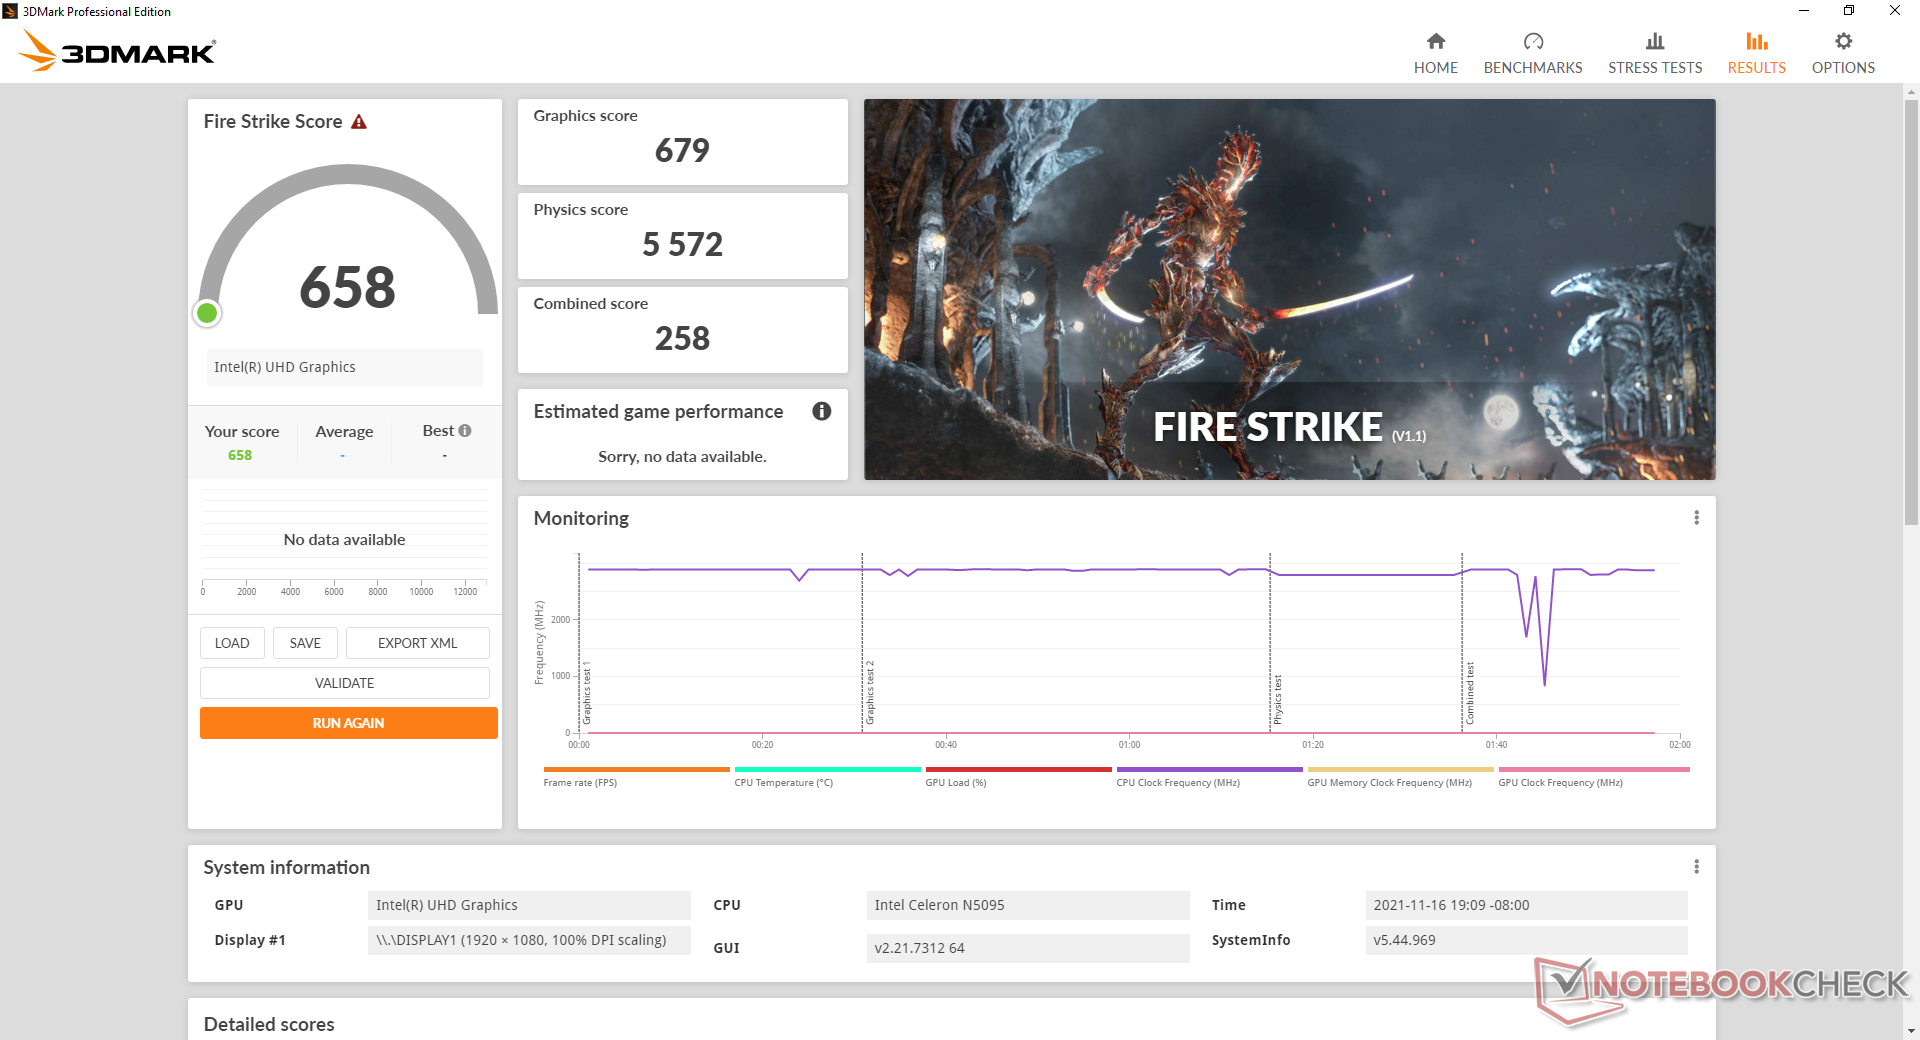
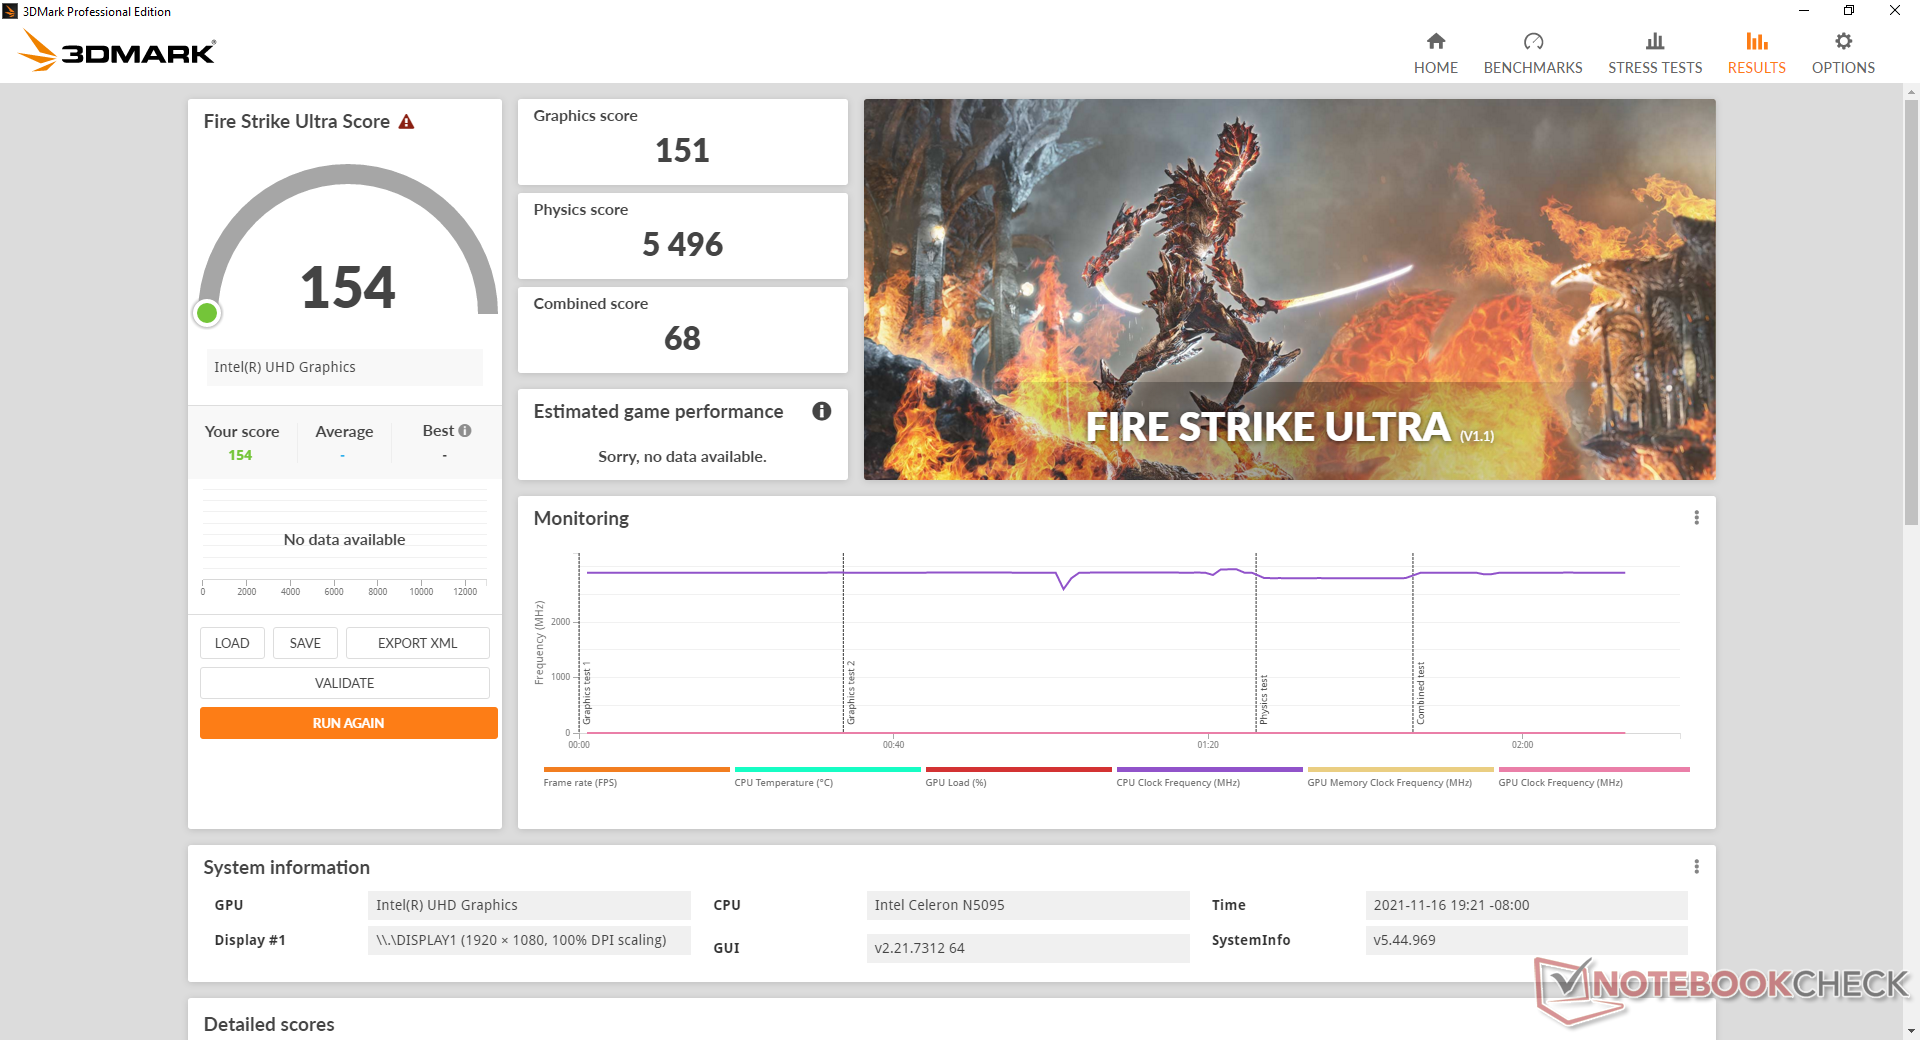
| 3DMark 11 Performance | 1028 punti | |
| 3DMark Cloud Gate Standard Score | 4845 punti | |
| 3DMark Fire Strike Score | 658 punti | |
| 3DMark Time Spy Score | 210 punti | |
Aiuto | ||
Witcher 3 FPS Chart
| basso | medio | alto | ultra | |
|---|---|---|---|---|
| The Witcher 3 (2015) | 14 | |||
| Dota 2 Reborn (2015) | 57.3 | 26.6 | 12 | 11.2 |
| Final Fantasy XV Benchmark (2018) | 7.17 | |||
| X-Plane 11.11 (2018) | 10.8 | 9.18 | 8.62 |
Emissioni
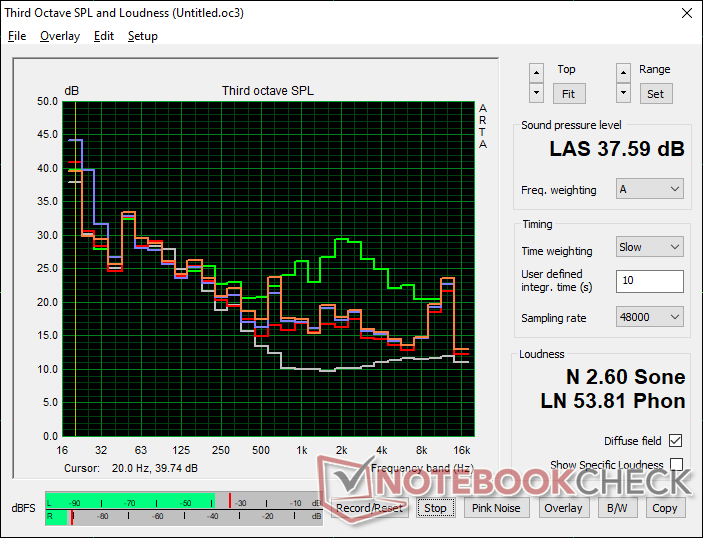
Rumore di sistema
La ventola interna è silenziosa a 24,5 dB(A) quando il sistema non sta eseguendo alcuna applicazione. Più spesso che no, tuttavia, gli utenti saranno probabilmente in video streaming o in navigazione web e quindi la ventola salterà occasionalmente a 28,6 dB(A) o 30,4 dB(A). Altri mini PC sono molto più rumorosi, compreso il SEi10 di Beelink.
L'esecuzione di Prime95 induce un rumore massimo della ventola di 37,6 dB(A) che si nota ma non distrae in un ambiente HTPC.
Rumorosità
| Idle |
| 24.5 / 24.5 / 28.6 dB(A) |
| Sotto carico |
| 29.7 / 37.6 dB(A) |
 | ||
30 dB silenzioso 40 dB(A) udibile 50 dB(A) rumoroso |
||
min: | ||
| Beelink U59 UHD Graphics (Jasper Lake 16 EU), Celeron N5095, Silicon Motion AZW 512G NV428 | Intel NUC11TNKi5 Iris Xe G7 80EUs, i5-1135G7, Transcend M.2 SSD 430S TS512GMTS430S | Intel NUC8i7BE Iris Plus Graphics 655, i7-8559U | Beelink SEi10 UHD Graphics G1 (Ice Lake 32 EU), i3-1005G1, Silicon Motion AZW 256G M.2280 NVMe 4X 200725 D | Zotac ZBOX MI642 Nano UHD Graphics 620, i5-10210U, Western Digital WD Blue 3D WDBNCE5000PNC | GMK NucBox K1 UHD Graphics 600, Celeron J4125, HIKVision C100 NGFF SSD 128GB | |
|---|---|---|---|---|---|---|
| Noise | -27% | -19% | -27% | -24% | -20% | |
| off /ambiente * (dB) | 24.5 | 24.8 -1% | 28.7 -17% | 27.5 -12% | 27.8 -13% | 27.8 -13% |
| Idle Minimum * (dB) | 24.5 | 35.6 -45% | 28.7 -17% | 30.9 -26% | 27.8 -13% | 27.8 -13% |
| Idle Average * (dB) | 24.5 | 35.6 -45% | 29.3 -20% | 33.5 -37% | 33.9 -38% | 27.8 -13% |
| Idle Maximum * (dB) | 28.6 | 35.6 -24% | 31.8 -11% | 33.5 -17% | 33.9 -19% | 27.8 3% |
| Load Average * (dB) | 29.7 | 36.2 -22% | 39 -31% | 38.5 -30% | 43.7 -47% | 46.8 -58% |
| Witcher 3 ultra * (dB) | 30.4 | 38 -25% | 39 -28% | |||
| Load Maximum * (dB) | 37.6 | 47.6 -27% | 41.4 -10% | 51.6 -37% | 43.7 -16% | 46.8 -24% |
* ... Meglio usare valori piccoli
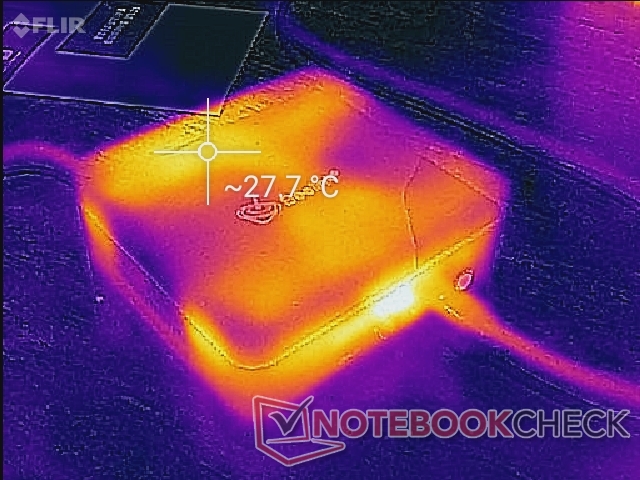
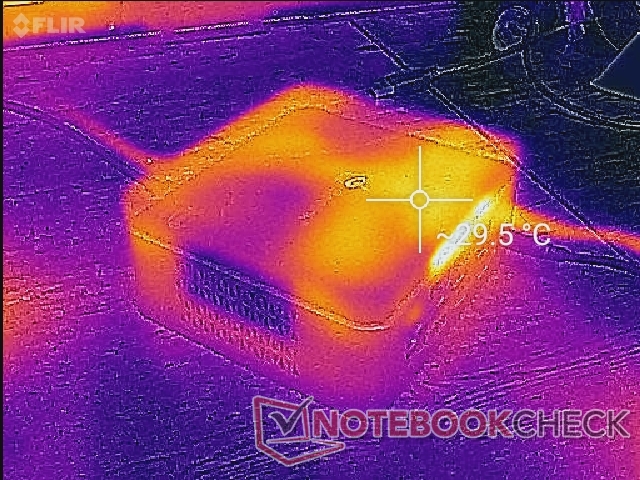
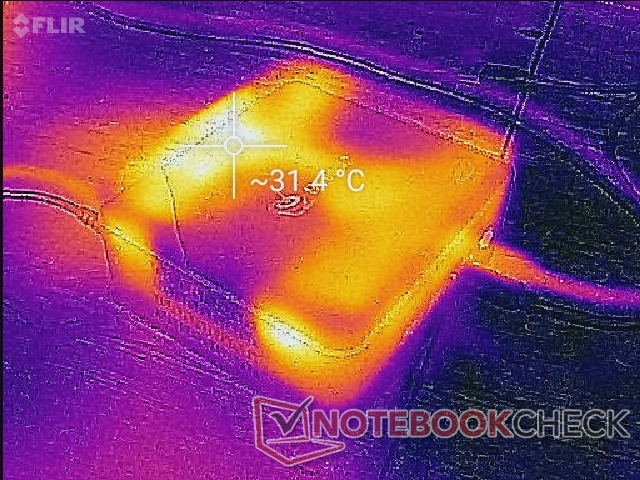
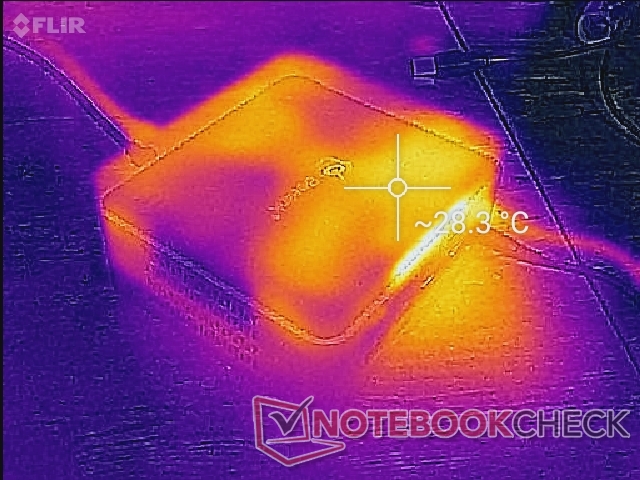
Temperatura
Le temperature non sono un problema sull'U59. I punti caldi sono a malapena più caldi anche quando il sistema è completamente stressato.
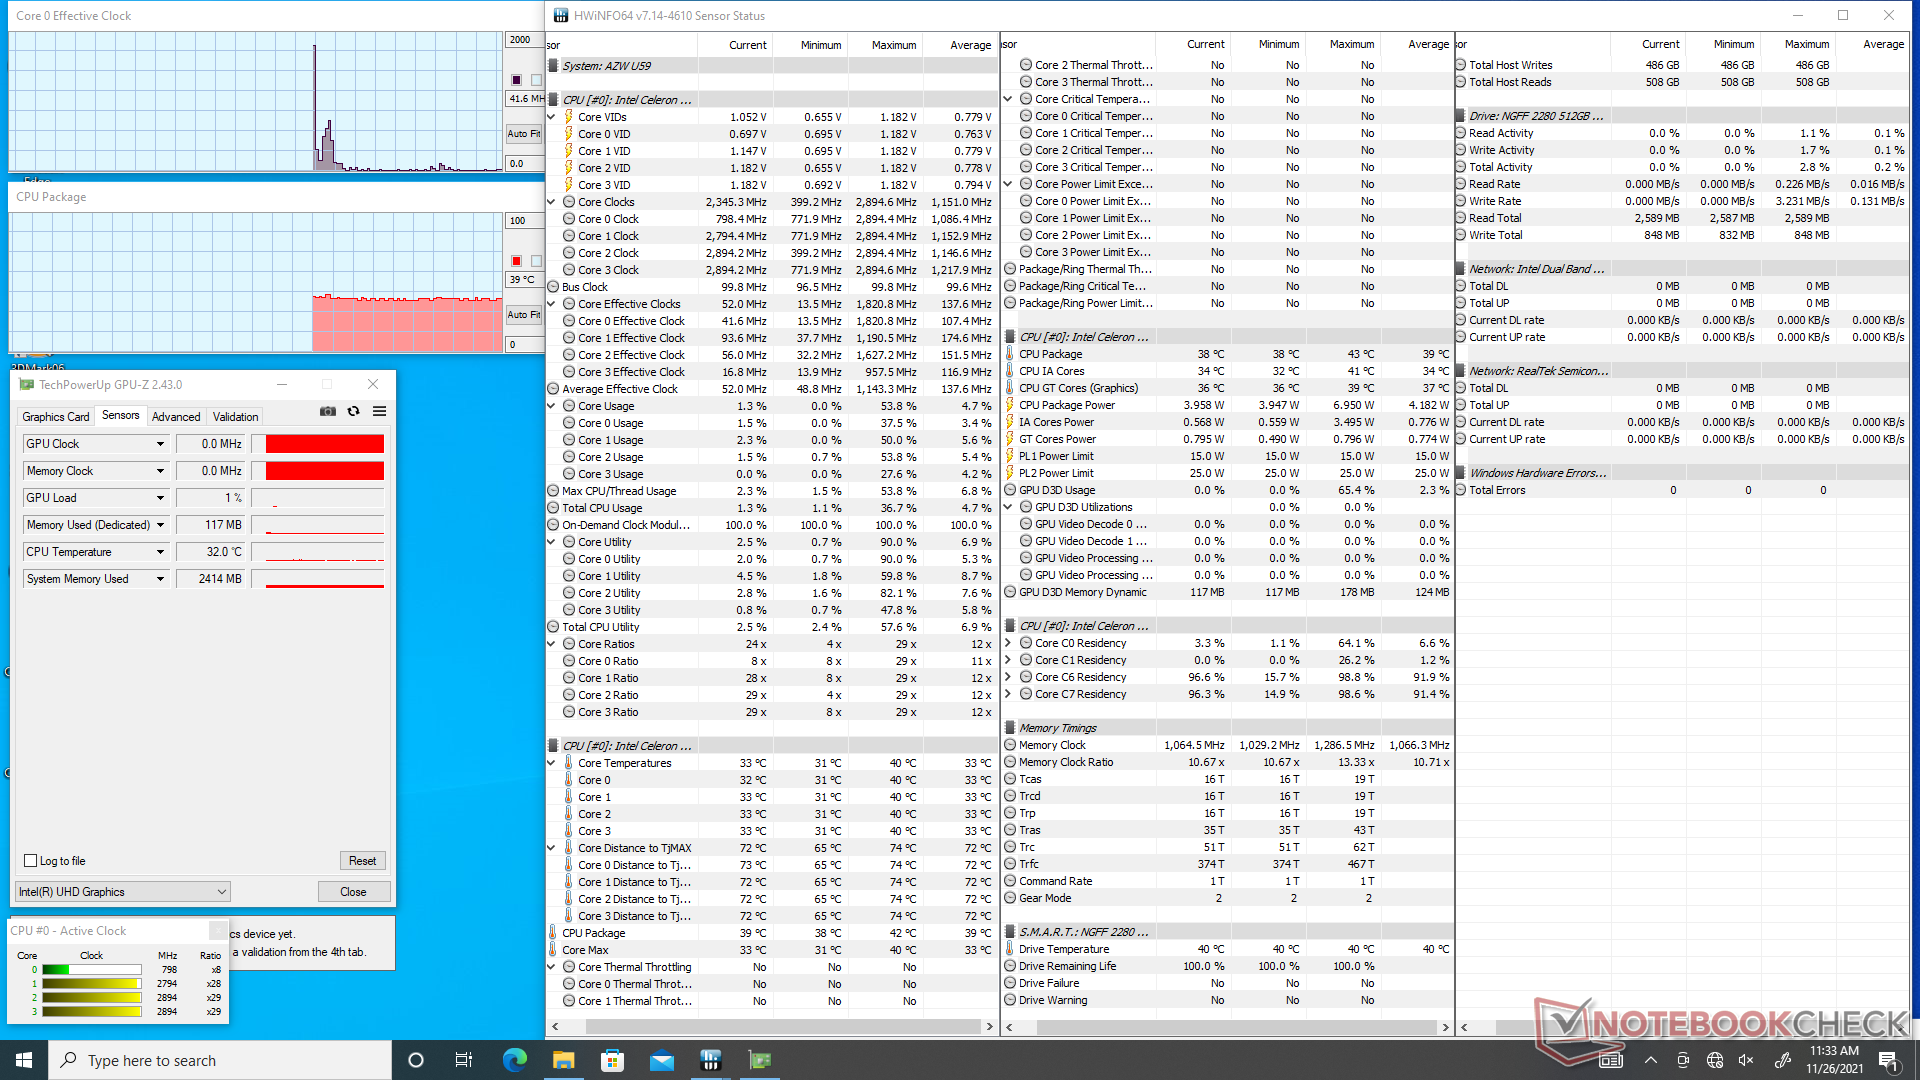
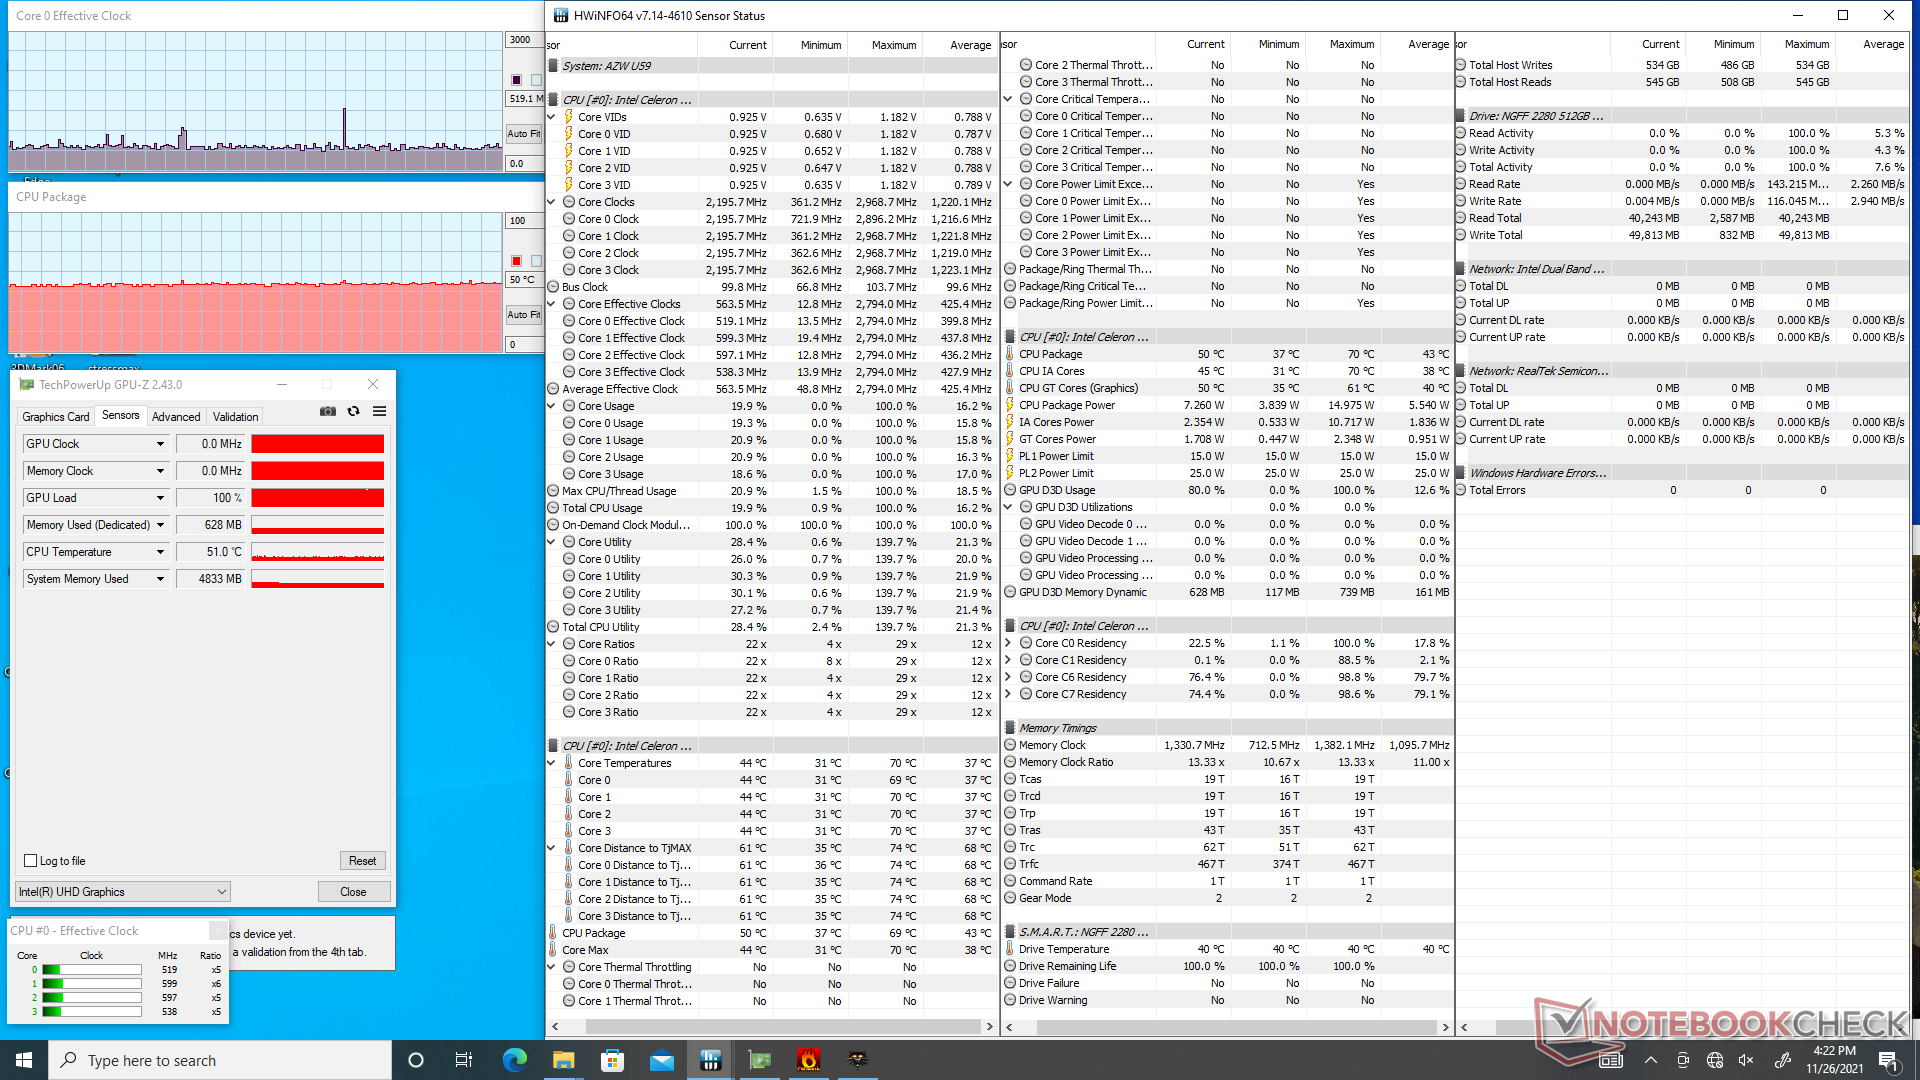
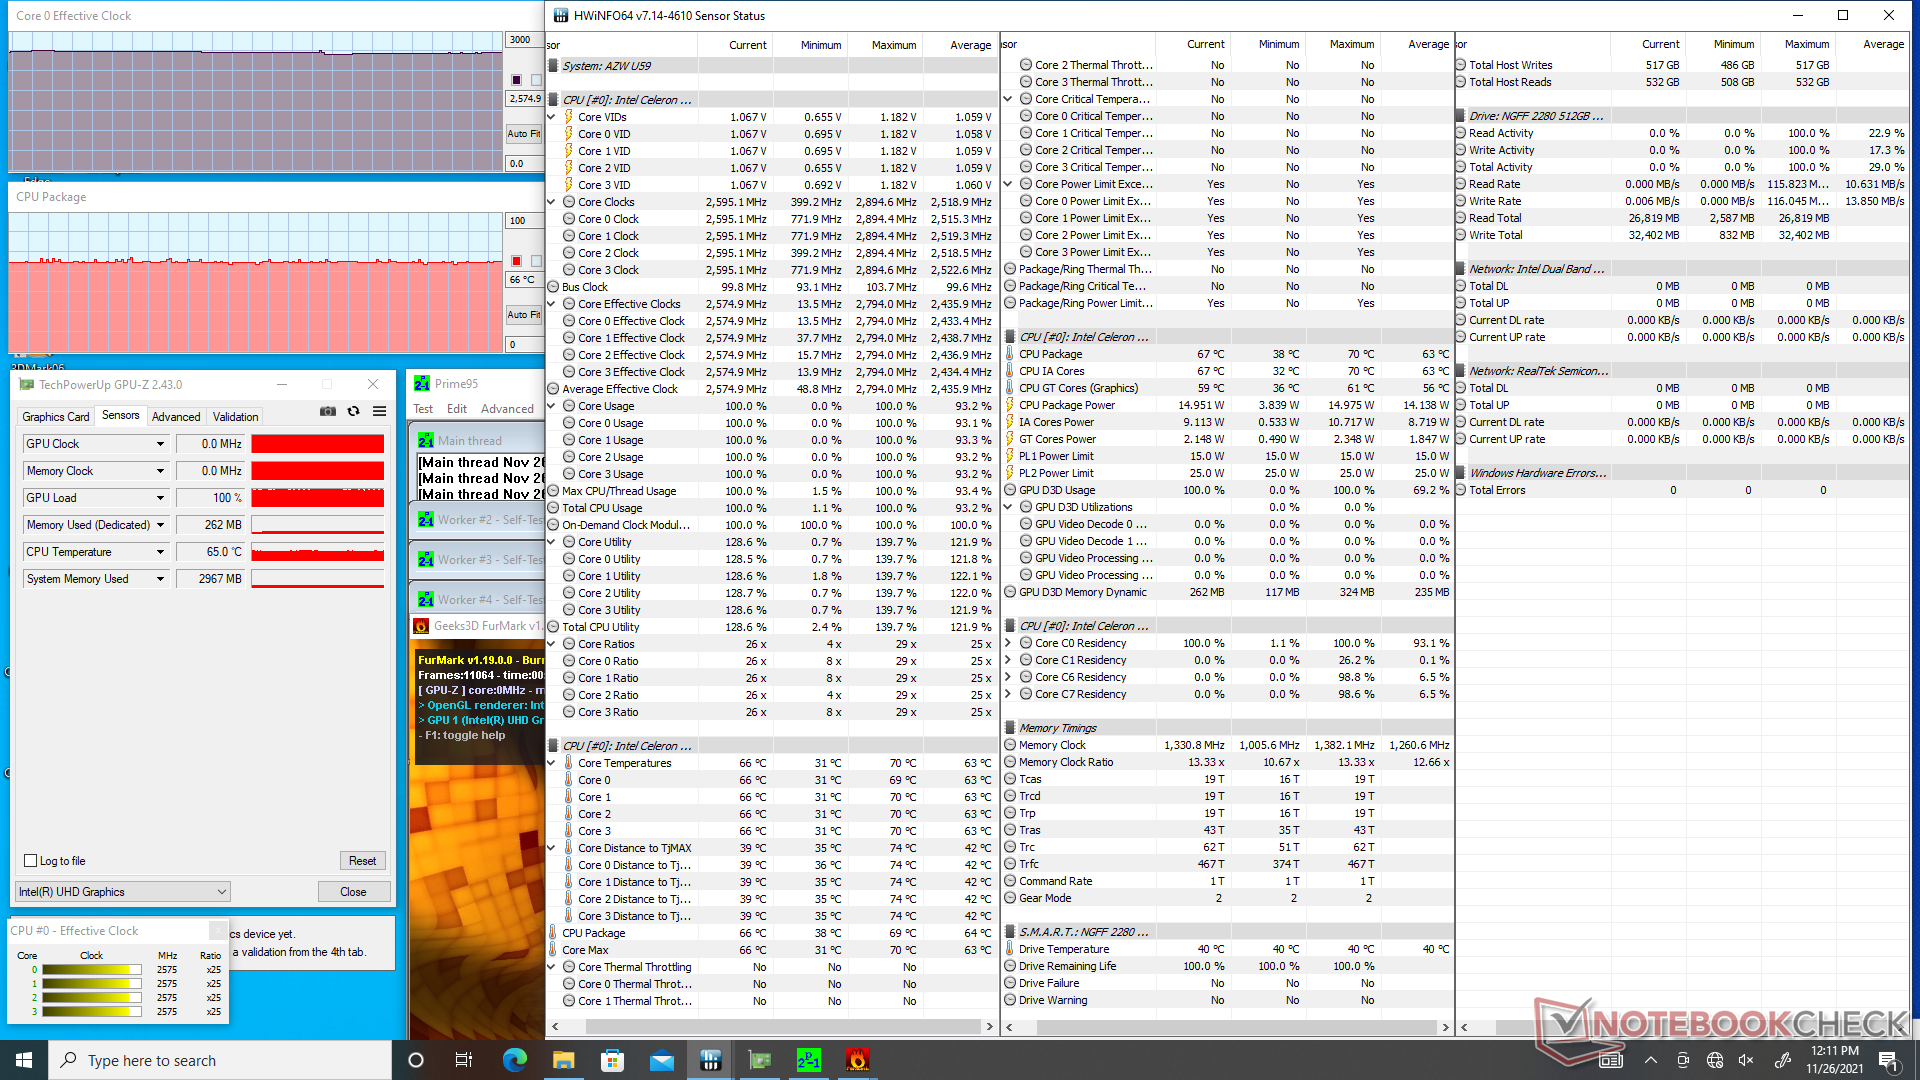
Test di stress
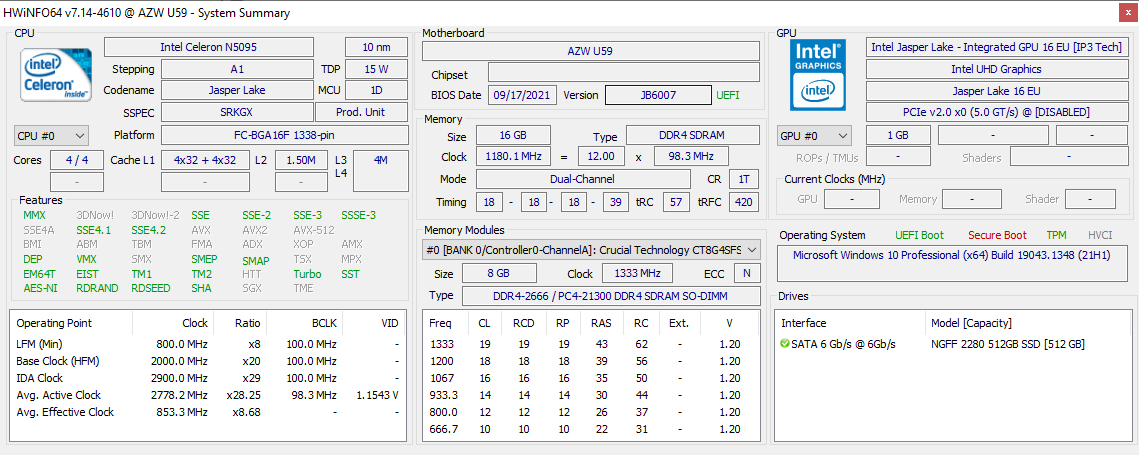
La CPU si stabilizzava a 2,8 GHz e 69 C quando sotto stress Prime95. Il fatto che il sistema utilizzi una ventola attiva per il raffreddamento è probabilmente responsabile delle temperature più basse del previsto e delle prestazioni stabili nel tempo. HWiNFO riporta livelli PL1 e PL2 di 15 W e 25 W, rispettivamente, ma siamo in grado di raggiungere solo 15 W stabili quando si eseguono carichi così estremi. Eseguendo questo stesso test sul Core i3-powered Beelink SEi10 risulterebbe in una temperatura del nucleo significativamente più calda di 90 C
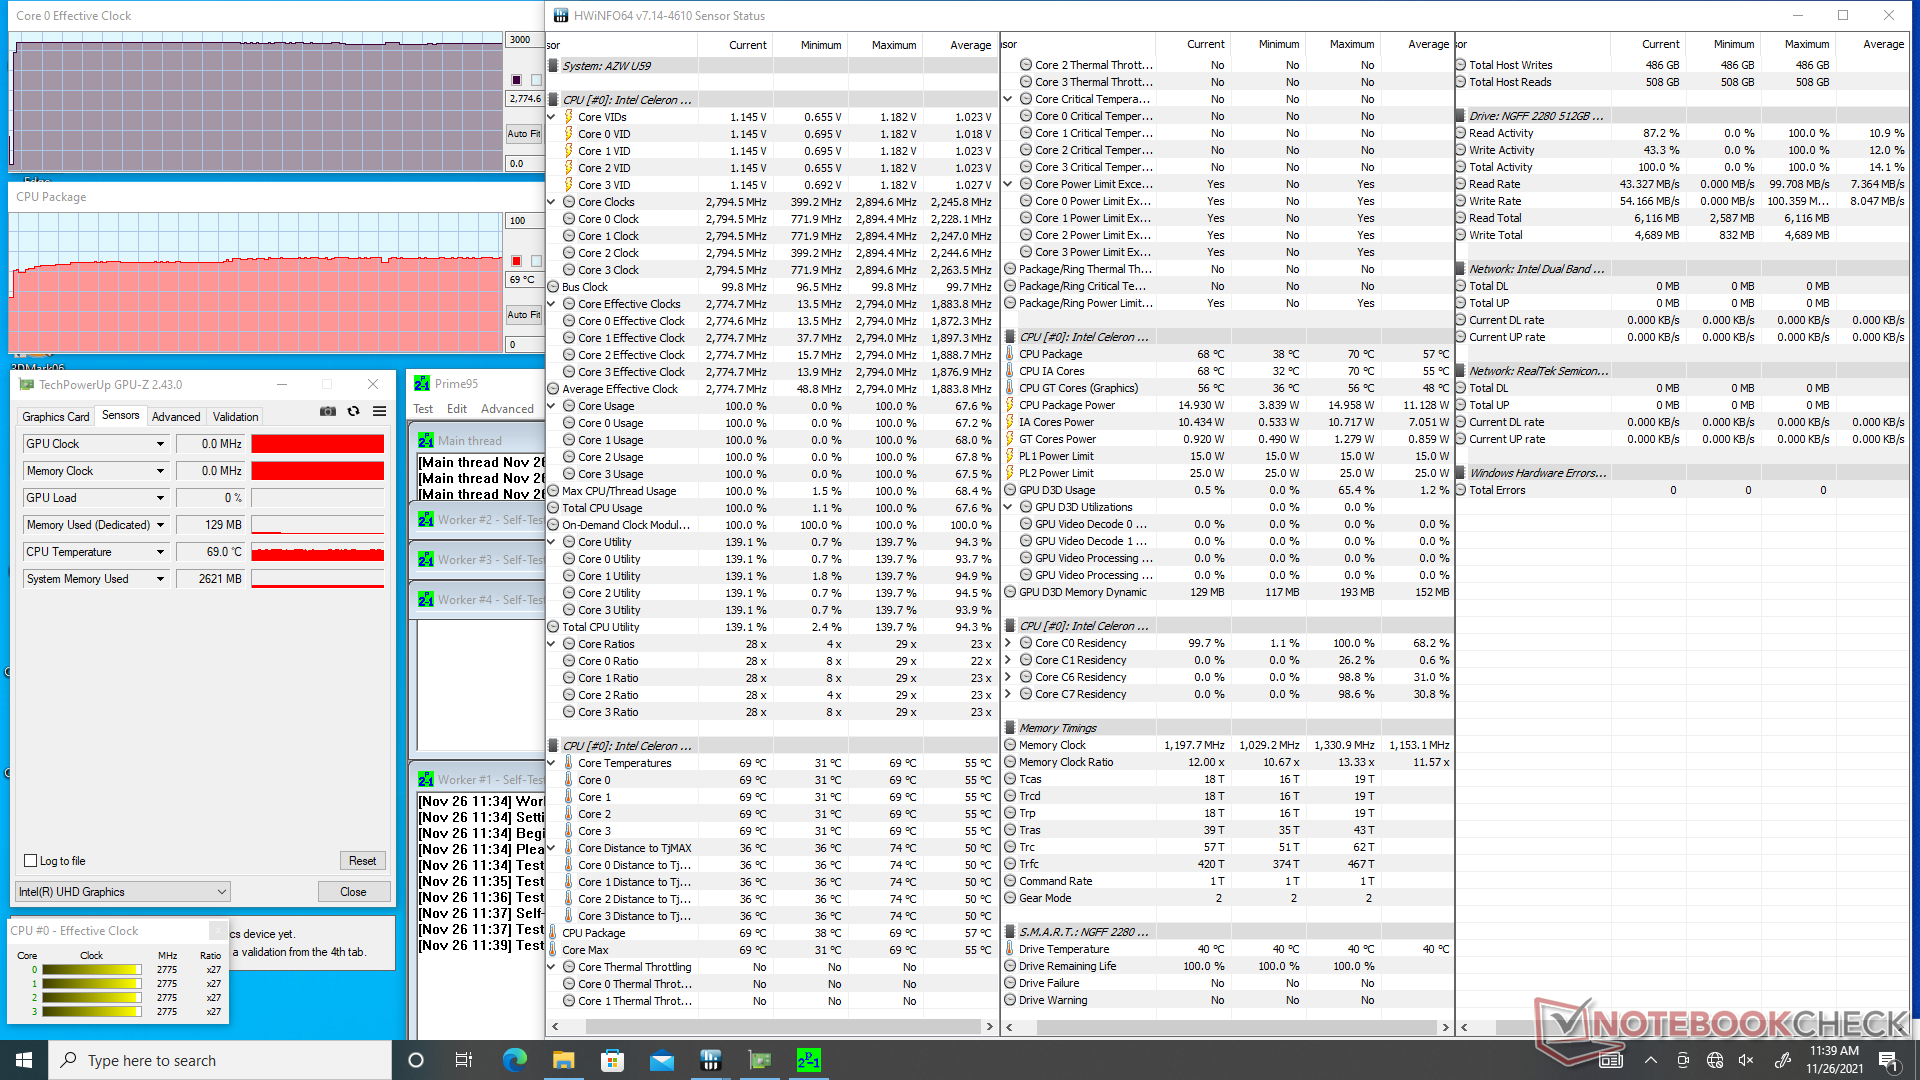
| Clock della CPU (GHz)Clock della GPU(MHz)Temperaturamedia dellaCPU (°C) | |
| Sistema inattivo | -- |
| Prime95 Stress | 2.8 |
| Prime95 + FurMark Stress | |
| Witcher 3 Stress | 0.5 |
Gestione dell'energia
Consumo di energia
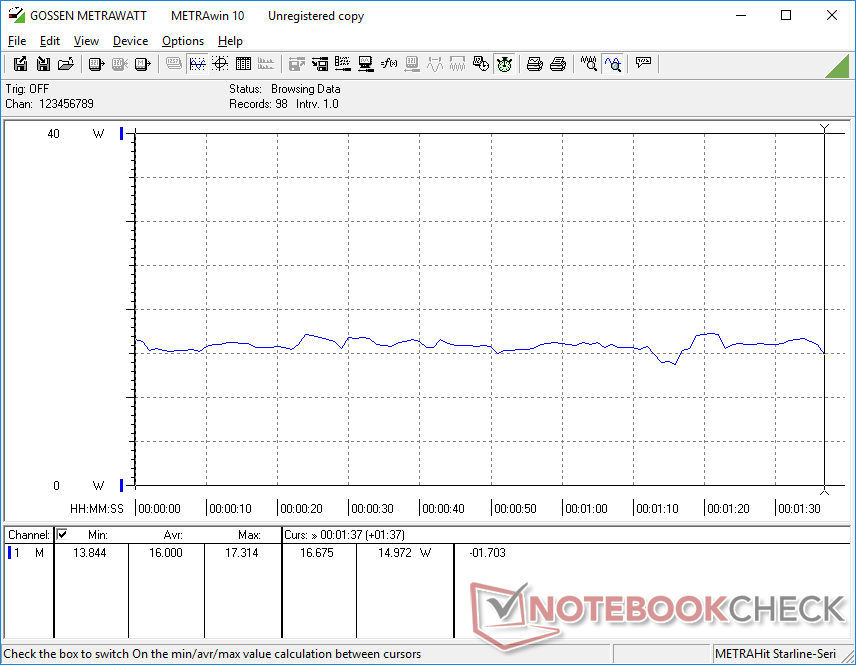
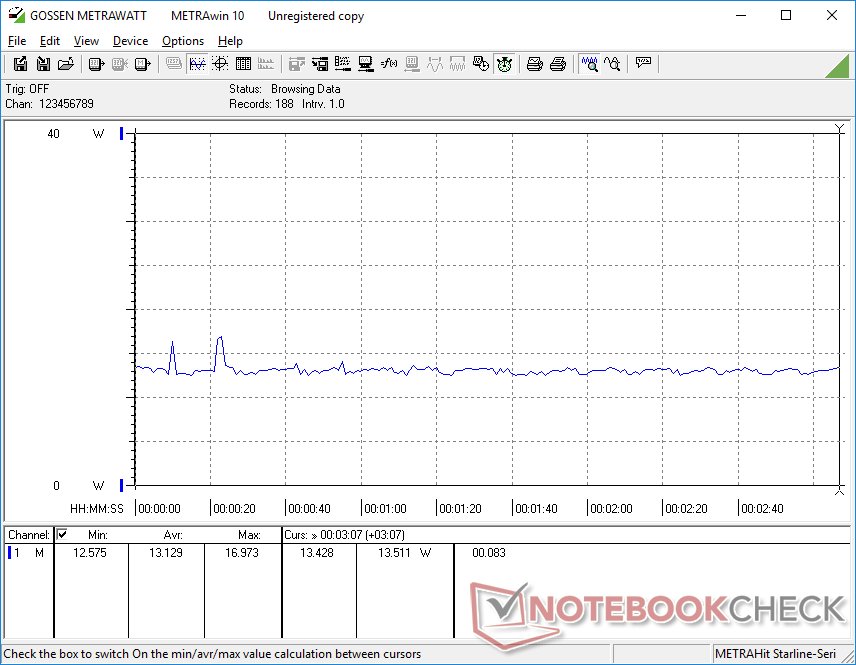
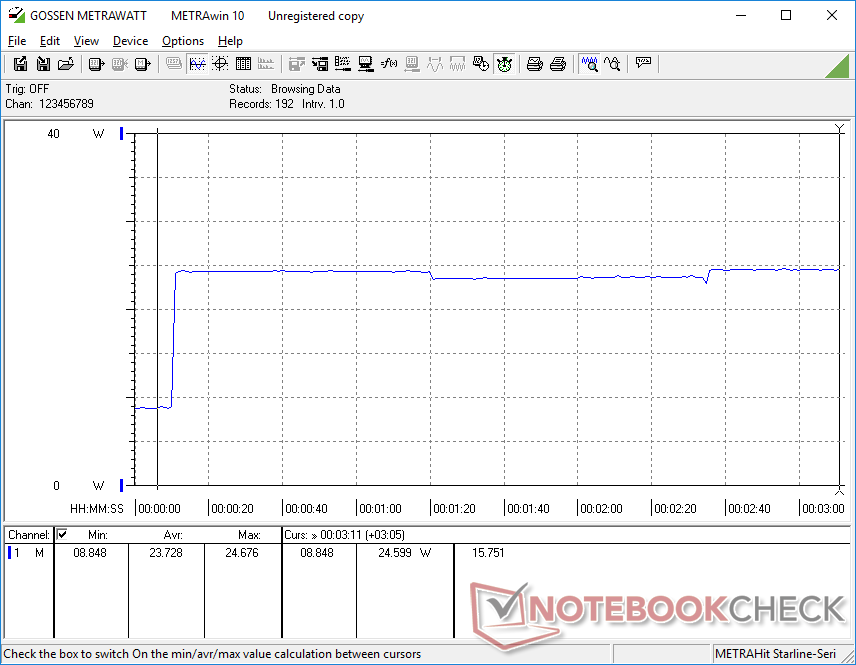
L'inattività sul desktop senza applicazioni in esecuzione consumerebbe più del previsto a circa 7 W mentre l'Intel NUC8 o il GMK NucBox K1 potrebbero disegnare fino a 3 W ciascuno. Carichi più elevati, come i giochi, consumerebbero molto meno sul nostro U59 a soli 13 W a 16 W in media rispetto a 2x o più su mini PC con più veloce UHD Graphics 620 o GPU Iris Xe.

| Off / Standby | |
| Idle | |
| Sotto carico |
|
Leggenda:
min: | |
| Beelink U59 Celeron N5095, UHD Graphics (Jasper Lake 16 EU), Silicon Motion AZW 512G NV428, , x, | Intel NUC11TNKi5 i5-1135G7, Iris Xe G7 80EUs, Transcend M.2 SSD 430S TS512GMTS430S, , x, | Intel NUC8i7BE i7-8559U, Iris Plus Graphics 655, , , x, | Beelink SEi10 i3-1005G1, UHD Graphics G1 (Ice Lake 32 EU), Silicon Motion AZW 256G M.2280 NVMe 4X 200725 D, , x, | Zotac ZBOX MI642 Nano i5-10210U, UHD Graphics 620, Western Digital WD Blue 3D WDBNCE5000PNC, , x, | GMK NucBox K1 Celeron J4125, UHD Graphics 600, HIKVision C100 NGFF SSD 128GB, , x, | |
|---|---|---|---|---|---|---|
| Power Consumption | -135% | -102% | -26% | -67% | 34% | |
| Idle Minimum * (Watt) | 6.7 | 11.5 -72% | 2.7 60% | 6.3 6% | 8.9 -33% | 3.4 49% |
| Idle Average * (Watt) | 6.7 | 12.4 -85% | 3.1 54% | 6.6 1% | 9 -34% | 3.8 43% |
| Idle Maximum * (Watt) | 7.4 | 12.9 -74% | 6.3 15% | 6.7 9% | 9.9 -34% | 3.9 47% |
| Load Average * (Watt) | 16 | 40.7 -154% | 59.7 -273% | 25.9 -62% | 33 -106% | 12.5 22% |
| Witcher 3 ultra * (Watt) | 13.1 | 43.9 -235% | 47.2 -260% | |||
| Load Maximum * (Watt) | 25.6 | 73.5 -187% | 78 -205% | 46.7 -82% | 58 -127% | 22.7 11% |
* ... Meglio usare valori piccoli
Power Consumption Witcher 3 / Stresstest
Power Consumption external Monitor
Pro
Contro
Verdetto
Il prezzo basso, da 279 a 349 dollari, completo di RAM, storage e Windows 11 Pro, è il punto di vendita più convincente del Beelink U59. Le prestazioni per dollaro sono notevolmente più alte rispetto alla precedente generazione di mini PC Celeron, anche di 2x a 2.5x in termini di prestazioni multi-thread o del 50 per cento in termini di prestazioni single-thread e grafica. Apprezziamo che entrambi gli alloggiamenti per l'archiviazione, entrambi gli slot di RAM e il modulo WLAN siano facilmente accessibili e aggiornabili, il che significa che gli acquirenti interessati non hanno bisogno di sborsare per la configurazione di fascia alta se non hanno problemi ad aggiornare tali componenti da soli.
Non è proprio un Core i3, ma il Celeron N5095 di Jasper Lake è almeno molto più vicino ad esso di qualsiasi altra CPU Celeron mobile prima di esso. Il Beelink U59 offre prestazioni notevolmente migliori rispetto alla maggior parte degli altri mini PC nella fascia di prezzo da 200 a 350 dollari.
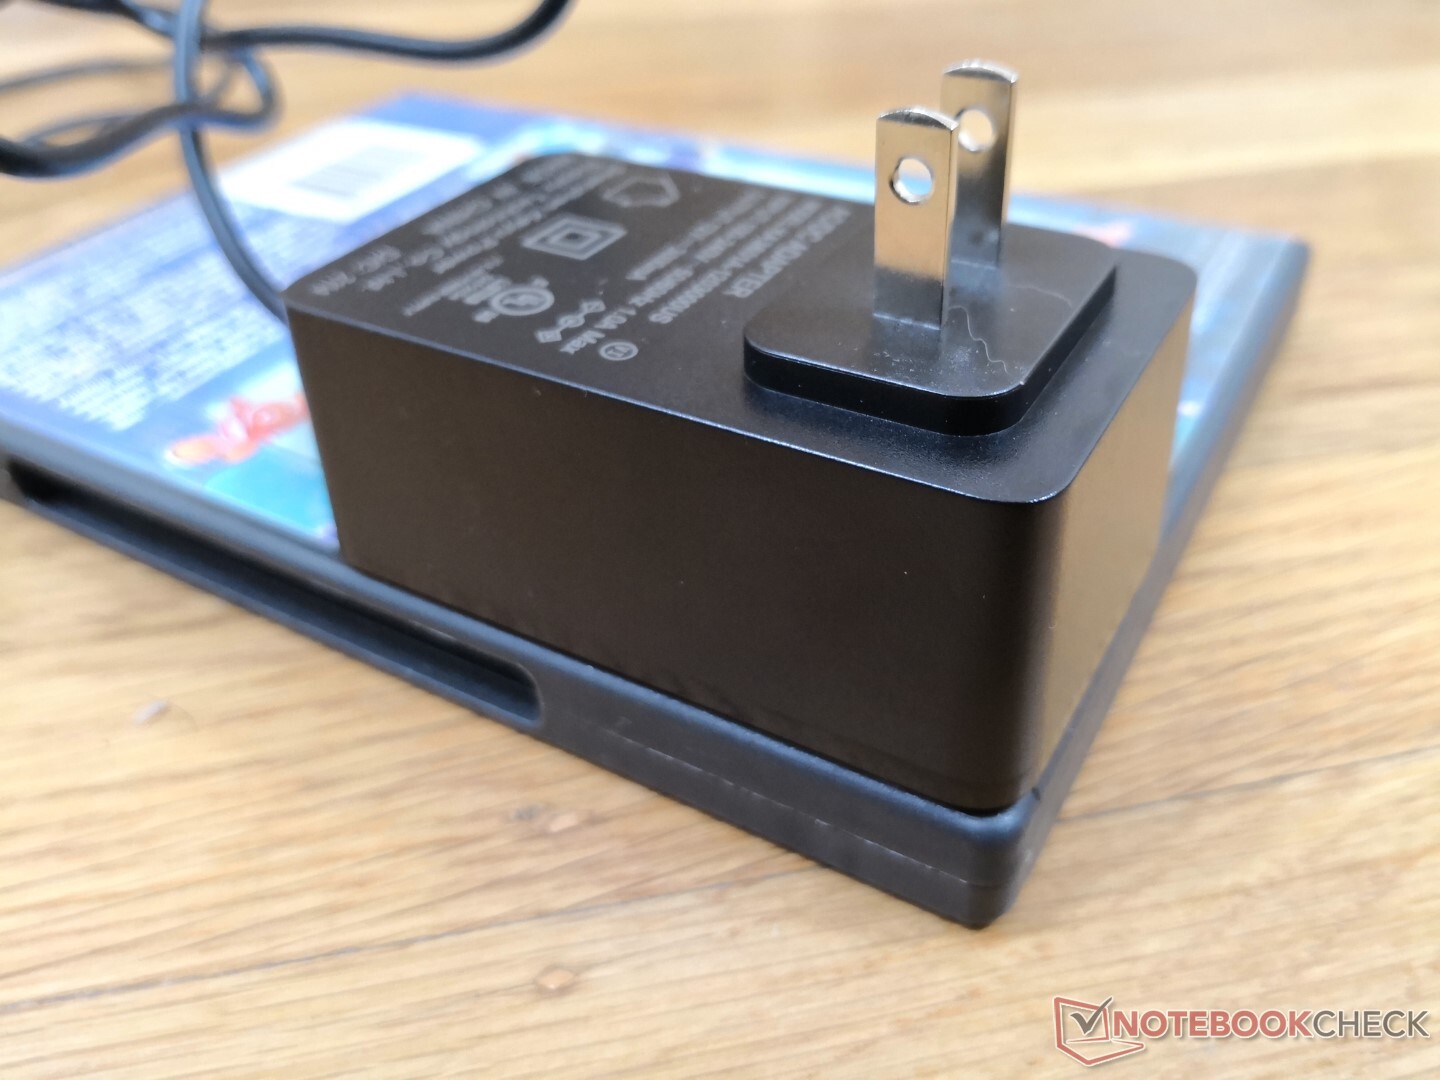
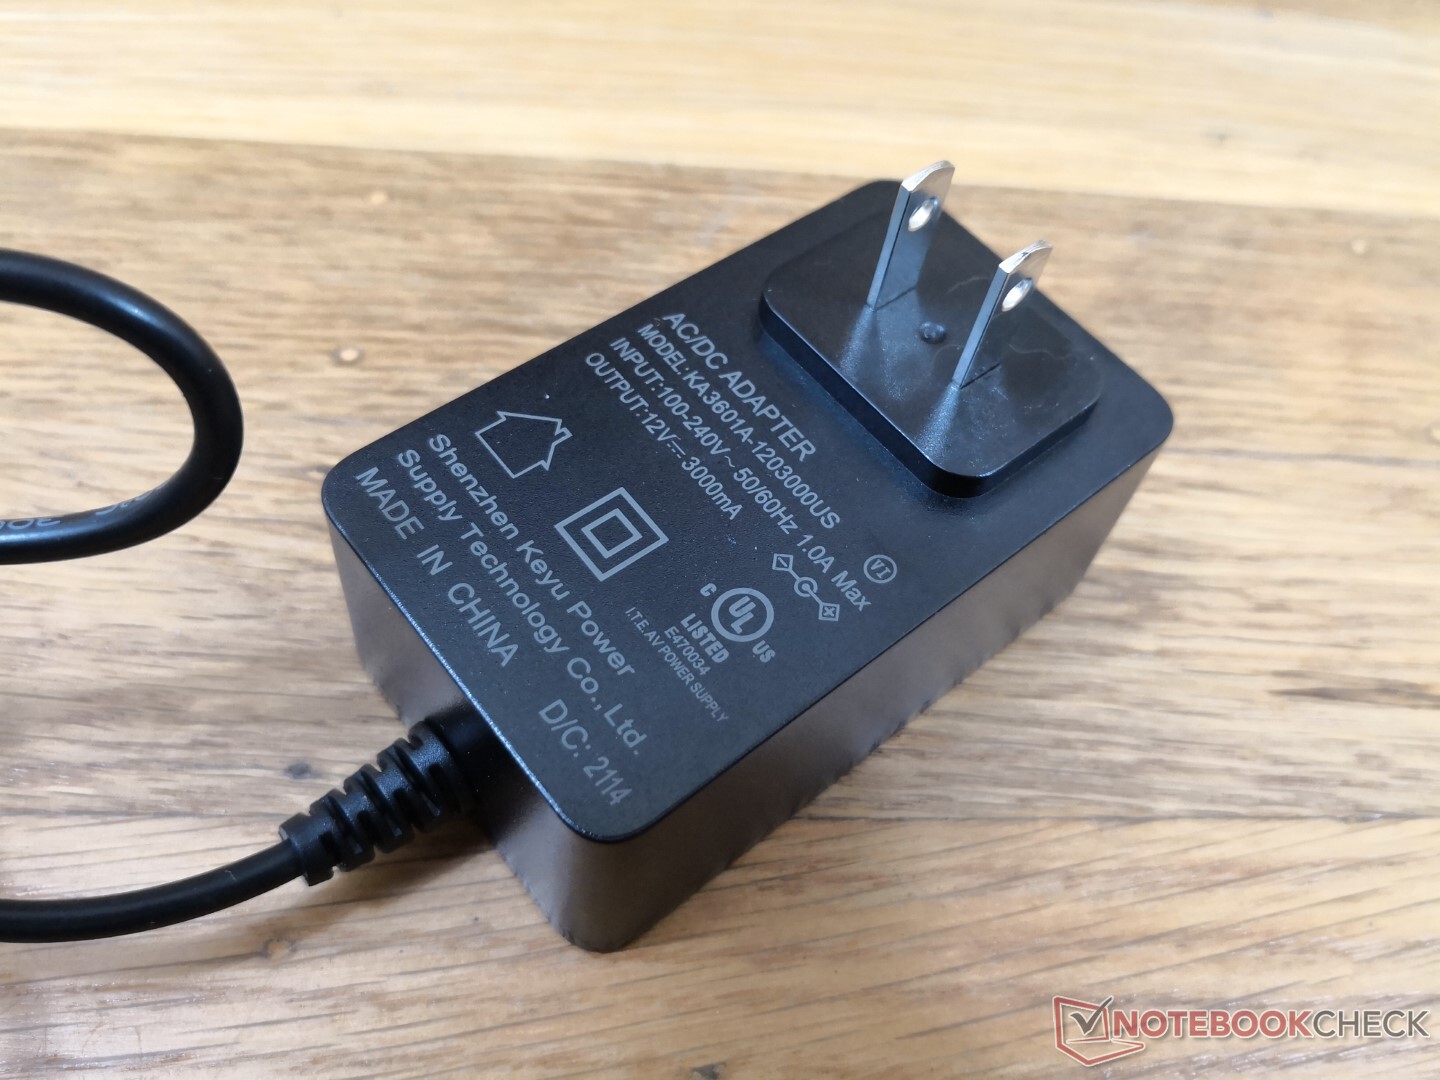
Gli svantaggi sono minori ma si sommano. Il fatto che il sistema richieda un adattatore AC proprietario è un fastidio quando invece avrebbe potuto essere alimentato dalla più universale USB-C. La ventola, anche se generalmente tranquilla, tende a pulsare frequentemente in risposta ai carichi di lavoro. La mancanza di un lettore di schede SD può irritare gli utenti che fanno affidamento su di esso, mentre la piastra di plastica superiore si sente a buon mercato e incline a graffiare. Se dovete ottenere qualsiasi mini PC Celeron, tuttavia, allora il Jasper Lake-powered Beelink U59 può essere una buona opzione semplicemente a causa dei notevoli vantaggi in termini di prestazioni rispetto ai vecchi chip Celeron come quelli nelGMK NucBox K1 o Chuwi GBox.
Prezzo e disponibilità
Amazon sta attualmente spedendo il Beelink U59 a partire da 279 dollari USA fino a 349 dollari USA a seconda della RAM e dell'opzione di archiviazione.
Price comparison

