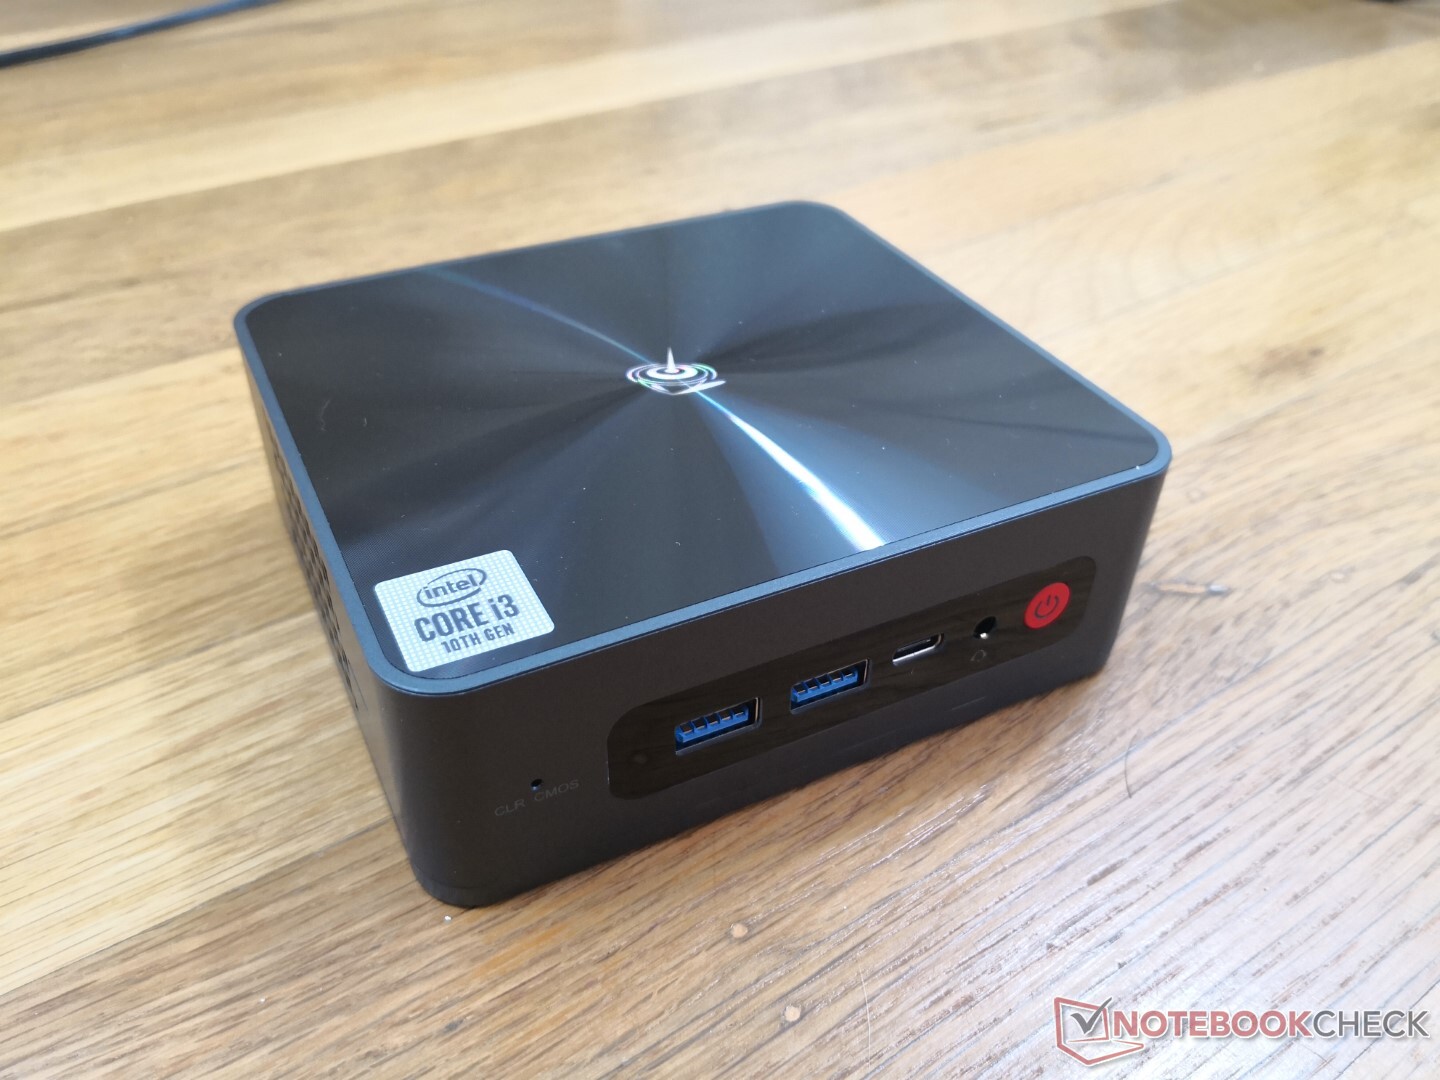
Recensione del Mini PC Beelink SEi10: Un Intel NUC più economico
Confronto con i potenziali concorrenti
Punteggio | Data | Modello | Peso | Altezza | Dimensione | Risoluzione | Prezzo |
|---|---|---|---|---|---|---|---|
v (old) | 12/2020 | Beelink SEi10 i3-1005G1, UHD Graphics G1 (Ice Lake 32 EU) | 350 gr | 41 mm | x | ||
v (old) | 08/2020 | Beelink GTR35 II-G-16512D00W64PRO-1T R5 3550H, Vega 8 | 843 gr | 39 mm | x | ||
v (old) | 07/2020 | Zotac ZBox MI643 i5-10210U, UHD Graphics 620 | 550 gr | 28.5 mm | x | ||
v (old) | 02/2020 | Intel NUC10i5FNK i5-10210U, UHD Graphics 620 | 493 gr | 36 mm | 0.00" | 0x0 | |
v (old) | 12/2019 | Lenovo ThinkCentre M90n-1 Nano i5-8265U, UHD Graphics 620 | 499 gr | 22 mm | 0.00" | x |
| SD Card Reader | |
| average JPG Copy Test (av. of 3 runs) | |
| Zotac ZBox MI643 (Toshiba Exceria Pro M501 UHS-II) | |
| Beelink SEi10 (Toshiba Exceria Pro M501 UHS-II) | |
| maximum AS SSD Seq Read Test (1GB) | |
| Zotac ZBox MI643 (Toshiba Exceria Pro M501 UHS-II) | |
| Beelink SEi10 (Toshiba Exceria Pro M501 UHS-II) | |
| Networking | |
| iperf3 transmit AX12 | |
| Beelink GTR35 II-G-16512D00W64PRO-1T | |
| Beelink SEi10 | |
| Lenovo ThinkCentre M90n-1 Nano | |
| Zotac ZBox MI643 | |
| iperf3 receive AX12 | |
| Beelink GTR35 II-G-16512D00W64PRO-1T | |
| Beelink SEi10 | |
| Lenovo ThinkCentre M90n-1 Nano | |
| Zotac ZBox MI643 | |
Cinebench R15: CPU Multi 64Bit | CPU Single 64Bit
Blender: v2.79 BMW27 CPU
7-Zip 18.03: 7z b 4 -mmt1 | 7z b 4
Geekbench 5.5: Single-Core | Multi-Core
HWBOT x265 Benchmark v2.2: 4k Preset
LibreOffice : 20 Documents To PDF
R Benchmark 2.5: Overall mean
| Cinebench R20 / CPU (Multi Core) | |
| Intel Hades Canyon NUC8i7HVK | |
| Intel NUC10i5FNK | |
| Beelink GTR35 II-G-16512D00W64PRO-1T | |
| Acer Swift 3 SF314-42-R27B | |
| Zotac ZBox MI643 | |
| Media Intel Core i3-1005G1 (820 - 1015, n=7) | |
| Beelink SEi10 | |
| Apple MacBook Air 2020 i3 | |
| HP ProBook x360 11 G4 | |
| Cinebench R20 / CPU (Single Core) | |
| Intel NUC10i5FNK | |
| Acer Swift 3 SF314-42-R27B | |
| Zotac ZBox MI643 | |
| Intel Hades Canyon NUC8i7HVK | |
| Beelink SEi10 | |
| Media Intel Core i3-1005G1 (338 - 407, n=7) | |
| Apple MacBook Air 2020 i3 | |
| Beelink GTR35 II-G-16512D00W64PRO-1T | |
| HP ProBook x360 11 G4 | |
| Blender / v2.79 BMW27 CPU | |
| Apple MacBook Air 2020 i3 | |
| Media Intel Core i3-1005G1 (1123 - 1388, n=7) | |
| Beelink SEi10 | |
| Acer Swift 3 SF314-42-R27B | |
| Zotac ZBox MI643 | |
| Beelink GTR35 II-G-16512D00W64PRO-1T | |
| Intel NUC10i5FNK | |
| Intel Hades Canyon NUC8i7HVK | |
| 7-Zip 18.03 / 7z b 4 -mmt1 | |
| Zotac ZBox MI643 | |
| Intel NUC10i5FNK | |
| Intel Hades Canyon NUC8i7HVK | |
| Beelink SEi10 | |
| Acer Swift 3 SF314-42-R27B | |
| Media Intel Core i3-1005G1 (3789 - 4057, n=8) | |
| Beelink GTR35 II-G-16512D00W64PRO-1T | |
| Apple MacBook Air 2020 i3 | |
| 7-Zip 18.03 / 7z b 4 | |
| Intel NUC10i5FNK | |
| Intel Hades Canyon NUC8i7HVK | |
| Zotac ZBox MI643 | |
| Beelink GTR35 II-G-16512D00W64PRO-1T | |
| Acer Swift 3 SF314-42-R27B | |
| Media Intel Core i3-1005G1 (9731 - 11135, n=8) | |
| Beelink SEi10 | |
| Apple MacBook Air 2020 i3 | |
| Geekbench 5.5 / Single-Core | |
| Media Intel Core i3-1005G1 (1118 - 1194, n=6) | |
| Zotac ZBox MI643 | |
| Beelink SEi10 | |
| Intel NUC10i5FNK | |
| Apple MacBook Air 2020 i3 | |
| Acer Swift 3 SF314-42-R27B | |
| Beelink GTR35 II-G-16512D00W64PRO-1T | |
| Geekbench 5.5 / Multi-Core | |
| Zotac ZBox MI643 | |
| Intel NUC10i5FNK | |
| Acer Swift 3 SF314-42-R27B | |
| Beelink GTR35 II-G-16512D00W64PRO-1T | |
| Media Intel Core i3-1005G1 (2153 - 2595, n=6) | |
| Beelink SEi10 | |
| Apple MacBook Air 2020 i3 | |
| HWBOT x265 Benchmark v2.2 / 4k Preset | |
| Intel Hades Canyon NUC8i7HVK | |
| Intel NUC10i5FNK | |
| Acer Swift 3 SF314-42-R27B | |
| Zotac ZBox MI643 | |
| Beelink GTR35 II-G-16512D00W64PRO-1T | |
| Beelink SEi10 | |
| Media Intel Core i3-1005G1 (2.42 - 3.59, n=7) | |
| Apple MacBook Air 2020 i3 | |
| LibreOffice / 20 Documents To PDF | |
| Apple MacBook Air 2020 i3 | |
| Beelink GTR35 II-G-16512D00W64PRO-1T | |
| Media Intel Core i3-1005G1 (55.8 - 81.7, n=6) | |
| Acer Swift 3 SF314-42-R27B | |
| Zotac ZBox MI643 | |
| Beelink SEi10 | |
| R Benchmark 2.5 / Overall mean | |
| Apple MacBook Air 2020 i3 | |
| Beelink SEi10 | |
| Media Intel Core i3-1005G1 (0.746 - 0.763, n=6) | |
| Beelink GTR35 II-G-16512D00W64PRO-1T | |
| Intel NUC10i5FNK | |
| Acer Swift 3 SF314-42-R27B | |
| Zotac ZBox MI643 | |
* ... Meglio usare valori piccoli
| PCMark 8 Home Score Accelerated v2 | 2900 punti | |
| PCMark 8 Work Score Accelerated v2 | 2575 punti | |
| PCMark 10 Score | 3420 punti | |
Aiuto | ||
| DPC Latencies / LatencyMon - interrupt to process latency (max), Web, Youtube, Prime95 | |
| Beelink SEi10 | |
| Acer Swift 3 SF314-42-R27B | |
| Chuwi LarkBox 4K Mini PC | |
| Zotac ZBox MI643 | |
| Beelink GTR35 II-G-16512D00W64PRO-1T | |
* ... Meglio usare valori piccoli
| Beelink SEi10 Silicon Motion AZW 256G M.2280 NVMe 4X 200725 D | Beelink GTR35 II-G-16512D00W64PRO-1T Silicon Motion AZW 512G NV428 | Intel NUC10i5FNK Kingston RBUSNS8154P3256GJ1 | Lenovo ThinkCentre M90n-1 Nano Samsung SSD PM981 MZVLB512HAJQ | |
|---|---|---|---|---|
| AS SSD | 126% | 72% | 176% | |
| Seq Read (MB/s) | 1111 | 1382 24% | 1318 19% | 1668 50% |
| Seq Write (MB/s) | 323.5 | 1413 337% | 616 90% | 1150 255% |
| 4K Read (MB/s) | 33.1 | 35.27 7% | 26.44 -20% | 48.46 46% |
| 4K Write (MB/s) | 66.2 | 98.6 49% | 61.3 -7% | 116.5 76% |
| 4K-64 Read (MB/s) | 357.3 | 696 95% | 650 82% | 726 103% |
| 4K-64 Write (MB/s) | 154.8 | 814 426% | 642 315% | 1074 594% |
| Access Time Read * (ms) | 0.066 | 0.063 5% | 0.11 -67% | 0.039 41% |
| Access Time Write * (ms) | 0.616 | 0.114 81% | 0.07 89% | 0.032 95% |
| Score Read (Points) | 501 | 869 73% | 808 61% | 942 88% |
| Score Write (Points) | 253 | 1054 317% | 765 202% | 1305 416% |
| Score Total (Points) | 983 | 2377 142% | 1955 99% | 2716 176% |
| Copy ISO MB/s (MB/s) | 1160 | 1228 6% | 576 -50% | |
| Copy Program MB/s (MB/s) | 121.1 | 261.7 116% | 328.9 172% | |
| Copy Game MB/s (MB/s) | 364.4 | 658 81% | 471.2 29% | |
| CrystalDiskMark 5.2 / 6 | -7% | -31% | 27% | |
| Write 4K (MB/s) | 203 | 161.9 -20% | 58.4 -71% | 130 -36% |
| Read 4K (MB/s) | 63.2 | 52.8 -16% | 30.24 -52% | 45.61 -28% |
| Write Seq (MB/s) | 1114 | 773 -31% | ||
| Read Seq (MB/s) | 1765 | 712 -60% | ||
| Write 4K Q32T1 (MB/s) | 423.9 | 285 -33% | 448.5 6% | 365.3 -14% |
| Read 4K Q32T1 (MB/s) | 389.2 | 324 -17% | 391.4 1% | 350.2 -10% |
| Write Seq Q32T1 (MB/s) | 1104 | 1579 43% | 914 -17% | 2986 170% |
| Read Seq Q32T1 (MB/s) | 1990 | 2018 1% | 1583 -20% | 3565 79% |
| Write 4K Q8T8 (MB/s) | 530 | 402.3 | 368.7 | |
| Read 4K Q8T8 (MB/s) | 738 | 680 | 790 | |
| Media totale (Programma / Settaggio) | 60% /
86% | 21% /
35% | 102% /
124% |
* ... Meglio usare valori piccoli

Throttling disco: DiskSpd Read Loop, Queue Depth 8
| 3DMark 11 Performance | 1791 punti | |
| 3DMark Cloud Gate Standard Score | 6363 punti | |
| 3DMark Fire Strike Score | 871 punti | |
| 3DMark Time Spy Score | 367 punti | |
Aiuto | ||
| basso | medio | alto | ultra | |
|---|---|---|---|---|
| Dota 2 Reborn (2015) | 61.2 | 25 | 15.3 | 14.2 |
| Beelink SEi10 UHD Graphics G1 (Ice Lake 32 EU), i3-1005G1, Silicon Motion AZW 256G M.2280 NVMe 4X 200725 D | Beelink GTR35 II-G-16512D00W64PRO-1T Vega 8, R5 3550H, Silicon Motion AZW 512G NV428 | Zotac ZBox MI643 UHD Graphics 620, i5-10210U, Lexar NM610 1TB | Intel Hades Canyon NUC8i7HVK Vega M GH, i7-8809G, Intel Optane 120 GB SSDPEK1W120GA | Chuwi LarkBox 4K Mini PC UHD Graphics 600, Celeron J4115, 128 GB eMMC Flash | |
|---|---|---|---|---|---|
| Noise | 1% | 16% | 6% | 3% | |
| off /ambiente * (dB) | 27.5 | 25.4 8% | 26.1 5% | 28.7 -4% | 26 5% |
| Idle Minimum * (dB) | 30.9 | 31.5 -2% | 27.5 11% | 29 6% | 26 16% |
| Idle Average * (dB) | 33.5 | 31.5 6% | 27.5 18% | 29 13% | 26 22% |
| Idle Maximum * (dB) | 33.5 | 31.5 6% | 27.5 18% | 29 13% | 43.3 -29% |
| Load Average * (dB) | 38.5 | 43.9 -14% | 28.9 25% | 36 6% | 43.3 -12% |
| Load Maximum * (dB) | 51.6 | 52 -1% | 42 19% | 49.4 4% | 43.5 16% |
| Witcher 3 ultra * (dB) | 51.9 | 42 |
* ... Meglio usare valori piccoli
Rumorosità
| Idle |
| 30.9 / 33.5 / 33.5 dB(A) |
| Sotto carico |
| 38.5 / 51.6 dB(A) |
 | ||
30 dB silenzioso 40 dB(A) udibile 50 dB(A) rumoroso |
||
min: | ||
| Off / Standby | |
| Idle | |
| Sotto carico |
|
Leggenda:
min: | |
| Beelink SEi10 i3-1005G1, UHD Graphics G1 (Ice Lake 32 EU), Silicon Motion AZW 256G M.2280 NVMe 4X 200725 D, , x, | Beelink GTR35 II-G-16512D00W64PRO-1T R5 3550H, Vega 8, Silicon Motion AZW 512G NV428, , x, | Intel NUC10i5FNK i5-10210U, UHD Graphics 620, Kingston RBUSNS8154P3256GJ1, , 0x0, 0" | Lenovo ThinkCentre M90n-1 Nano i5-8265U, UHD Graphics 620, Samsung SSD PM981 MZVLB512HAJQ, , x, 0" | Intel NUC10i7FNH i7-10710U, UHD Graphics 620, Kingston RBUSNS8154P3256GJ1, , 0x0, 0" | |
|---|---|---|---|---|---|
| Power Consumption | -55% | -82% | 16% | -56% | |
| Idle Minimum * (Watt) | 6.3 | 8.8 -40% | 4.4 30% | ||
| Idle Average * (Watt) | 6.6 | 9.1 -38% | 15.7 -138% | 4.4 33% | 8.4 -27% |
| Idle Maximum * (Watt) | 6.7 | 9.6 -43% | 4.7 30% | ||
| Load Average * (Watt) | 25.9 | 55.3 -114% | 27.7 -7% | ||
| Load Maximum * (Watt) | 46.7 | 65.6 -40% | 58.6 -25% | 49.9 -7% | 86 -84% |
| Witcher 3 ultra * (Watt) | 50.3 |
* ... Meglio usare valori piccoli
Pro
Contro
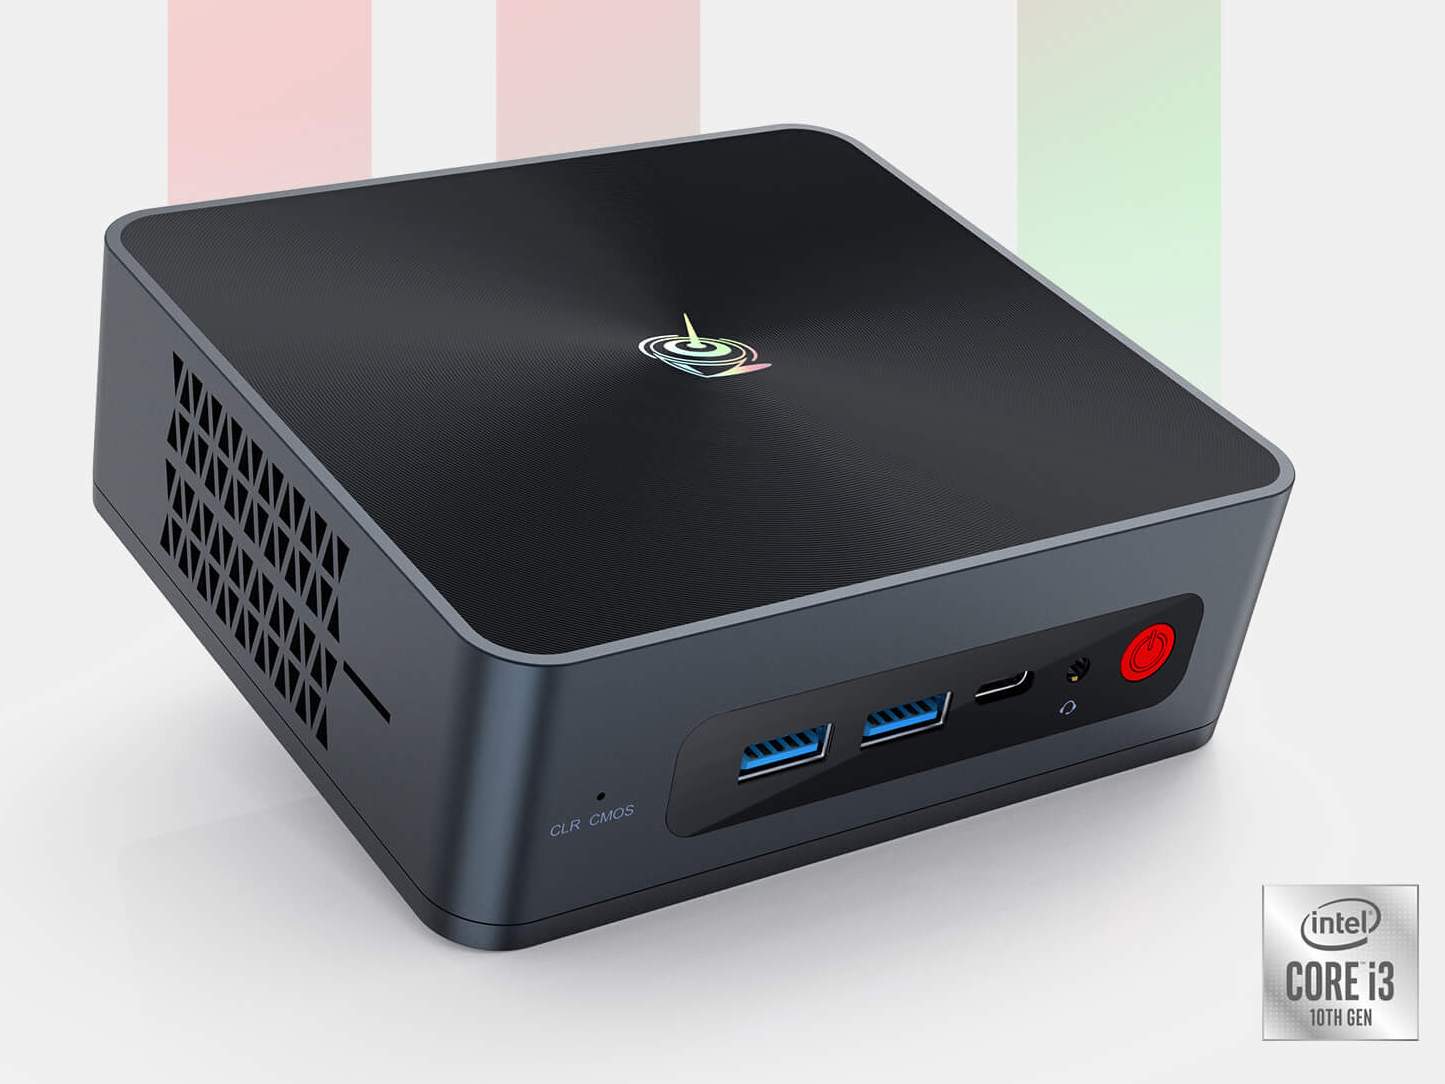
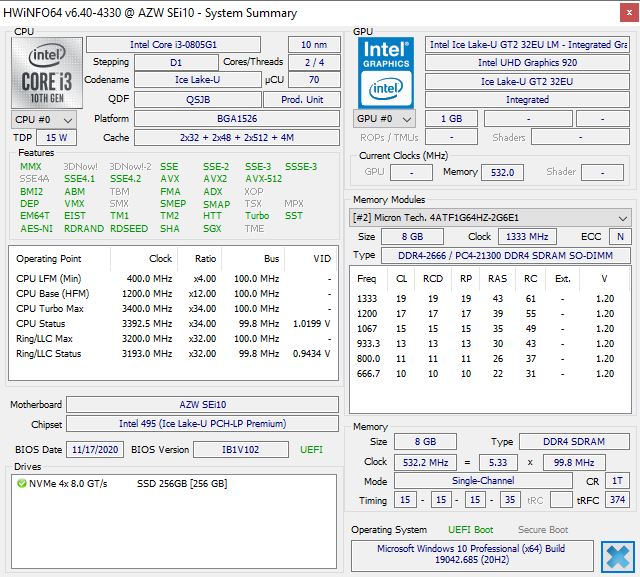
Il Beelink SEi10 eccelle nell'offrire molte caratteristiche moderne rispetto al prezzo richiesto. I proprietari ottengono lo storage M.2 NVMe, lo storage secondario SATA III, la RAM espandibile, una CPU Intel Core i3 di 10° generazione e persino il supporto di Thunderbolt 3. Questo mini PC diventa utile se si possono sfruttare queste caratteristiche per sfruttare al meglio ciò che è disponibile
Ci piacerebbe vedere le opzioni AMD Ryzen in futuro, dato che le loro CPU hanno dimostrato di essere significativamente più veloci rispetto alle Intel Ice Lake con lo stesso limite di potenza e lo stesso prezzo. Una soluzione di raffreddamento più efficiente contribuirebbe a ridurre le elevate temperature interne e il rumore della ventola in caso di elevato stress di elaborazione. Anche l'adattatore SATA da 2,5 pollici è poco elegante, e sarebbe stato meglio incorporarlo come su un Intel NUC. E infine, il l'alimentazione tramite USB avrebbe potuto essere utile nel caso in cui i proprietari perdessero l'alimentatore proprietario o preferissero utilizzare la propria fonte di alimentazione.
Un mini PC ben fatto, ben bilanciato e di buon prezzo, con una buona serie di caratteristiche. Gli utenti esigenti dovranno fare i conti con l'elevata rumorosità delle ventole e le alte temperature.
Price comparison
