|
|
Aorus Gaming Box GeForce RTX 2080 Ti
Intel Core i7-1165G7, | |
MSI RTX 2060 Gaming Z 6G
AMD Ryzen 7 2700X, NVIDIA GeForce RTX 2060 (Desktop) |
151.9 (95min - 175max) fps +17% |
Zotac ZBOX Magnus EN72070V
Intel Core i7-9750H, NVIDIA GeForce RTX 2080 Mobile | |
Asus ROG Zephyrus M15 GU502LU-BI7N4
Intel Core i7-10750H, NVIDIA GeForce GTX 1660 Ti Mobile | |
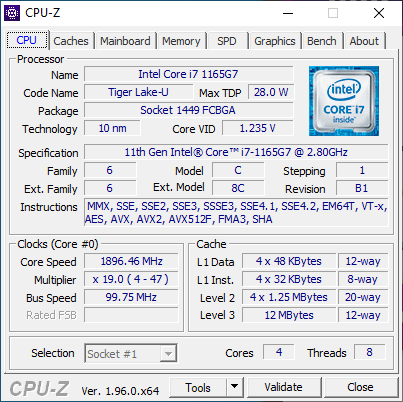
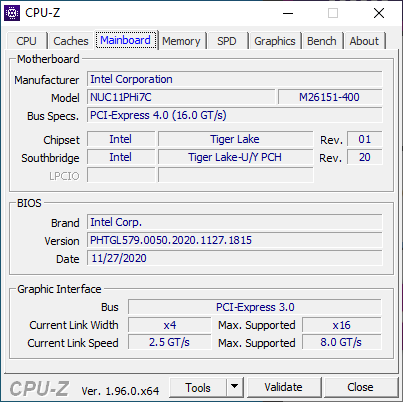
Intel NUC11PHKi7C
Intel Core i7-1165G7, NVIDIA GeForce RTX 2060 Mobile | |
MSI GF65 Thin 10UE
Intel Core i7-10750H, NVIDIA GeForce RTX 3060 Laptop GPU | |
Media NVIDIA GeForce RTX 2060 Mobile
(98.4 - 144, n=4) | |
HP Envy 14-eb0010nr
Intel Core i5-1135G7, NVIDIA GeForce GTX 1650 Ti Max-Q | |
Intel Hades Canyon NUC8i7HVK
Intel Core i7-8809G, AMD Radeon RX Vega M GH | |
Asus ZenBook 13 UM325S
AMD Ryzen 7 5800U, AMD Radeon RX Vega 8 (Ryzen 4000/5000) | |
Intel NUC11PAQi7
Intel Core i7-1165G7, Intel Iris Xe Graphics G7 96EUs | |
Intel NUC11TNKi5
Intel Core i5-1135G7, Intel Iris Xe Graphics G7 80EUs | |
Beelink GTR35 II-G-16512D00W64PRO-1T
AMD Ryzen 5 3550H, AMD Radeon RX Vega 8 (Ryzen 2000/3000) | |
Asus Zenbook S UX393JA
Intel Core i7-1065G7, Intel Iris Plus Graphics G7 (Ice Lake 64 EU) | |
|
Aorus Gaming Box GeForce RTX 2080 Ti
Intel Core i7-1165G7, | |
Zotac ZBOX Magnus EN72070V
Intel Core i7-9750H, NVIDIA GeForce RTX 2080 Mobile | |
MSI RTX 2060 Gaming Z 6G
AMD Ryzen 7 2700X, NVIDIA GeForce RTX 2060 (Desktop) |
99.6 (73min - 132max) fps +12% |
MSI GF65 Thin 10UE
Intel Core i7-10750H, NVIDIA GeForce RTX 3060 Laptop GPU | |
Intel NUC11PHKi7C
Intel Core i7-1165G7, NVIDIA GeForce RTX 2060 Mobile | |
Asus ROG Zephyrus M15 GU502LU-BI7N4
Intel Core i7-10750H, NVIDIA GeForce GTX 1660 Ti Mobile | |
Media NVIDIA GeForce RTX 2060 Mobile
(74 - 89.2, n=5) | |
HP Envy 14-eb0010nr
Intel Core i5-1135G7, NVIDIA GeForce GTX 1650 Ti Max-Q | |
Intel Hades Canyon NUC8i7HVK
Intel Core i7-8809G, AMD Radeon RX Vega M GH | |
Asus ZenBook 13 UM325S
AMD Ryzen 7 5800U, AMD Radeon RX Vega 8 (Ryzen 4000/5000) | |
Intel NUC11PAQi7
Intel Core i7-1165G7, Intel Iris Xe Graphics G7 96EUs | |
Intel NUC11TNKi5
Intel Core i5-1135G7, Intel Iris Xe Graphics G7 80EUs | |
Beelink GTR35 II-G-16512D00W64PRO-1T
AMD Ryzen 5 3550H, AMD Radeon RX Vega 8 (Ryzen 2000/3000) | |
Asus Zenbook S UX393JA
Intel Core i7-1065G7, Intel Iris Plus Graphics G7 (Ice Lake 64 EU) | |
|
Aorus Gaming Box GeForce RTX 2080 Ti
Intel Core i7-1165G7, | |
Zotac ZBOX Magnus EN72070V
Intel Core i7-9750H, NVIDIA GeForce RTX 2080 Mobile | |
MSI RTX 2060 Gaming Z 6G
AMD Ryzen 7 2700X, NVIDIA GeForce RTX 2060 (Desktop) |
72.6 (31min - 114max) fps +8% |
MSI GF65 Thin 10UE
Intel Core i7-10750H, NVIDIA GeForce RTX 3060 Laptop GPU | |
Intel NUC11PHKi7C
Intel Core i7-1165G7, NVIDIA GeForce RTX 2060 Mobile | |
Asus ROG Zephyrus M15 GU502LU-BI7N4
Intel Core i7-10750H, NVIDIA GeForce GTX 1660 Ti Mobile | |
Media NVIDIA GeForce RTX 2060 Mobile
(52 - 67.5, n=7) | |
HP Envy 14-eb0010nr
Intel Core i5-1135G7, NVIDIA GeForce GTX 1650 Ti Max-Q | |
Intel Hades Canyon NUC8i7HVK
Intel Core i7-8809G, AMD Radeon RX Vega M GH | |
Intel NUC11PAQi7
Intel Core i7-1165G7, Intel Iris Xe Graphics G7 96EUs | |
Asus ZenBook 13 UM325S
AMD Ryzen 7 5800U, AMD Radeon RX Vega 8 (Ryzen 4000/5000) | |
Intel NUC11TNKi5
Intel Core i5-1135G7, Intel Iris Xe Graphics G7 80EUs | |
Beelink GTR35 II-G-16512D00W64PRO-1T
AMD Ryzen 5 3550H, AMD Radeon RX Vega 8 (Ryzen 2000/3000) | |
Asus Zenbook S UX393JA
Intel Core i7-1065G7, Intel Iris Plus Graphics G7 (Ice Lake 64 EU) | |
|
|
Asus ROG Zephyrus M15 GU502LU-BI7N4
Intel Core i7-10750H, NVIDIA GeForce GTX 1660 Ti Mobile |
178 (3.93min, 111P1 - 272max) fps +6% |
MSI RTX 2060 Gaming Z 6G
AMD Ryzen 7 2700X, NVIDIA GeForce RTX 2060 (Desktop) | |
Aorus Gaming Box GeForce RTX 2080 Ti
Intel Core i7-1165G7, |
173 (3.7min, 111P1 - 287max) fps +3% |
Intel NUC11PHKi7C
Intel Core i7-1165G7, NVIDIA GeForce RTX 2060 Mobile |
168 (5.58min, 111P1 - 300max) fps |
Intel Hades Canyon NUC8i7HVK
Intel Core i7-8809G, AMD Radeon RX Vega M GH |
165 (1.676min, 100P1 - 336max) fps -2% |
MSI GF65 Thin 10UE
Intel Core i7-10750H, NVIDIA GeForce RTX 3060 Laptop GPU |
164 (8.06min, 100P1 - 292max) fps -2% |
Media NVIDIA GeForce RTX 2060 Mobile
(153 - 168, n=5) | |
HP Envy 14-eb0010nr
Intel Core i5-1135G7, NVIDIA GeForce GTX 1650 Ti Max-Q |
156 (4.62min, 90.9P1 - 263max) fps -7% |
Intel NUC11PAQi7
Intel Core i7-1165G7, Intel Iris Xe Graphics G7 96EUs |
67.6 (16.5min, 47.6P1 - 113max) fps -60% |
|
Asus ROG Zephyrus M15 GU502LU-BI7N4
Intel Core i7-10750H, NVIDIA GeForce GTX 1660 Ti Mobile |
175 (3.43min, 125P1 - 385max) fps +12% |
Aorus Gaming Box GeForce RTX 2080 Ti
Intel Core i7-1165G7, |
174 (3.94min, 111P1 - 323max) fps +12% |
Intel Hades Canyon NUC8i7HVK
Intel Core i7-8809G, AMD Radeon RX Vega M GH |
165 (4.25min, 111P1 - 348max) fps +6% |
MSI GF65 Thin 10UE
Intel Core i7-10750H, NVIDIA GeForce RTX 3060 Laptop GPU |
156 (6.71min, 90.9P1 - 297max) fps 0% |
Intel NUC11PHKi7C
Intel Core i7-1165G7, NVIDIA GeForce RTX 2060 Mobile |
156 (4.99min, 111P1 - 301max) fps |
Media NVIDIA GeForce RTX 2060 Mobile
(124 - 163, n=3) | |
HP Envy 14-eb0010nr
Intel Core i5-1135G7, NVIDIA GeForce GTX 1650 Ti Max-Q |
142 (5.23min, 90.9P1 - 265max) fps -9% |
Intel NUC11PAQi7
Intel Core i7-1165G7, Intel Iris Xe Graphics G7 96EUs |
40.7 (12.8min, 27.8P1 - 74.7max) fps -74% |
|
Asus ROG Zephyrus M15 GU502LU-BI7N4
Intel Core i7-10750H, NVIDIA GeForce GTX 1660 Ti Mobile |
171 (5.11min, 125P1 - 320max) fps +8% |
Aorus Gaming Box GeForce RTX 2080 Ti
Intel Core i7-1165G7, |
167 (4.73min, 90.9P1 - 316max) fps +6% |
MSI RTX 2060 Gaming Z 6G
AMD Ryzen 7 2700X, NVIDIA GeForce RTX 2060 (Desktop) | |
Intel Hades Canyon NUC8i7HVK
Intel Core i7-8809G, AMD Radeon RX Vega M GH |
158 (4.71min, 100P1 - 289max) fps 0% |
Intel NUC11PHKi7C
Intel Core i7-1165G7, NVIDIA GeForce RTX 2060 Mobile |
158 (4.65min, 90.9P1 - 266max) fps |
MSI GF65 Thin 10UE
Intel Core i7-10750H, NVIDIA GeForce RTX 3060 Laptop GPU |
152 (6.7min, 90.9P1 - 267max) fps -4% |
Media NVIDIA GeForce RTX 2060 Mobile
(133 - 159, n=5) | |
HP Envy 14-eb0010nr
Intel Core i5-1135G7, NVIDIA GeForce GTX 1650 Ti Max-Q |
145 (4.59min, 83.3P1 - 250max) fps -8% |
Intel NUC11PAQi7
Intel Core i7-1165G7, Intel Iris Xe Graphics G7 96EUs |
52.5 (13.6min, 37P1 - 88.3max) fps -67% |
|
Asus ROG Zephyrus M15 GU502LU-BI7N4
Intel Core i7-10750H, NVIDIA GeForce GTX 1660 Ti Mobile |
169 (4.81min, 111P1 - 331max) fps +15% |
Aorus Gaming Box GeForce RTX 2080 Ti
Intel Core i7-1165G7, |
168 (4.69min, 111P1 - 267max) fps +14% |
Intel Hades Canyon NUC8i7HVK
Intel Core i7-8809G, AMD Radeon RX Vega M GH |
157 (3.27min, 100P1 - 316max) fps +7% |
Intel NUC11PHKi7C
Intel Core i7-1165G7, NVIDIA GeForce RTX 2060 Mobile |
147 (4.13min, 90.9P1 - 289max) fps |
MSI GF65 Thin 10UE
Intel Core i7-10750H, NVIDIA GeForce RTX 3060 Laptop GPU |
146 (6.19min, 83.3P1 - 291max) fps -1% |
Media NVIDIA GeForce RTX 2060 Mobile
(113 - 155, n=3) | |
HP Envy 14-eb0010nr
Intel Core i5-1135G7, NVIDIA GeForce GTX 1650 Ti Max-Q |
134 (56.7min, 76.9P1 - 267max) fps -9% |
Intel NUC11PAQi7
Intel Core i7-1165G7, Intel Iris Xe Graphics G7 96EUs |
35.3 (13.8min, 23.8P1 - 111max) fps -76% |
|
MSI RTX 2060 Gaming Z 6G
AMD Ryzen 7 2700X, NVIDIA GeForce RTX 2060 (Desktop) | |
Aorus Gaming Box GeForce RTX 2080 Ti
Intel Core i7-1165G7, |
146 (4.76min, 90.9P1 - 270max) fps +23% |
Asus ROG Zephyrus M15 GU502LU-BI7N4
Intel Core i7-10750H, NVIDIA GeForce GTX 1660 Ti Mobile |
140 (3.44min, 90.9P1 - 281max) fps +18% |
MSI GF65 Thin 10UE
Intel Core i7-10750H, NVIDIA GeForce RTX 3060 Laptop GPU |
120 (9.99min, 76.9P1 - 186max) fps +1% |
Intel NUC11PHKi7C
Intel Core i7-1165G7, NVIDIA GeForce RTX 2060 Mobile |
119 (39.3min, 76.9P1 - 229max) fps |
Media NVIDIA GeForce RTX 2060 Mobile
(94.5 - 127, n=5) | |
HP Envy 14-eb0010nr
Intel Core i5-1135G7, NVIDIA GeForce GTX 1650 Ti Max-Q |
88.1 (15.1min, 62.5P1 - 150max) fps -26% |
Intel Hades Canyon NUC8i7HVK
Intel Core i7-8809G, AMD Radeon RX Vega M GH |
81.2 (1.964min, 62.5P1 - 159max) fps -32% |
Intel NUC11PAQi7
Intel Core i7-1165G7, Intel Iris Xe Graphics G7 96EUs |
12.6 (5.49min, 8.93P1 - 87max) fps -89% |
|
MSI RTX 2060 Gaming Z 6G
AMD Ryzen 7 2700X, NVIDIA GeForce RTX 2060 (Desktop) | |
Aorus Gaming Box GeForce RTX 2080 Ti
Intel Core i7-1165G7, |
81 (10.4min, 50P1 - 168max) fps +16% |
Asus ROG Zephyrus M15 GU502LU-BI7N4
Intel Core i7-10750H, NVIDIA GeForce GTX 1660 Ti Mobile |
76 (7.66min, 45.5P1 - 141max) fps +9% |
Intel NUC11PHKi7C
Intel Core i7-1165G7, NVIDIA GeForce RTX 2060 Mobile |
69.6 (19.2min, 47.6P1 - 121max) fps |
MSI GF65 Thin 10UE
Intel Core i7-10750H, NVIDIA GeForce RTX 3060 Laptop GPU |
69.2 (4.86min, 47.6P1 - 137max) fps -1% |
Media NVIDIA GeForce RTX 2060 Mobile
(60 - 70.8, n=5) | |
HP Envy 14-eb0010nr
Intel Core i5-1135G7, NVIDIA GeForce GTX 1650 Ti Max-Q |
45.3 (17.6min, 29.4P1 - 102max) fps -35% |
Intel Hades Canyon NUC8i7HVK
Intel Core i7-8809G, AMD Radeon RX Vega M GH |
39.4 (1.843min, 27P1 - 125max) fps -43% |
Intel NUC11PAQi7
Intel Core i7-1165G7, Intel Iris Xe Graphics G7 96EUs |
5.72 (2.43min, 3.77P1 - 38max) fps -92% |
|
|
Lenovo Legion C7 15IMH05 82EH0030GE
Intel Core i7-10875H, NVIDIA GeForce RTX 2070 Max-Q | |
Aorus 15P WB
Intel Core i7-10750H, NVIDIA GeForce RTX 2070 Max-Q | |
Asus ROG Zephyrus M15 GU502LU-BI7N4
Intel Core i7-10750H, NVIDIA GeForce GTX 1660 Ti Mobile | |
Zotac ZBOX Magnus EN72070V
Intel Core i7-9750H, NVIDIA GeForce RTX 2080 Mobile | |
Lenovo ThinkBook 15p Gen1 4K
Intel Core i7-10750H, NVIDIA GeForce GTX 1650 Ti Max-Q | |
Intel NUC11PHKi7C
Intel Core i7-1165G7, NVIDIA GeForce RTX 2060 Mobile | |
Media NVIDIA GeForce RTX 2060 Mobile
(103.8 - 149, n=18) | |
HP Envy 14-eb0010nr
Intel Core i5-1135G7, NVIDIA GeForce GTX 1650 Ti Max-Q | |
Intel Hades Canyon NUC8i7HVK
Intel Core i7-8809G, AMD Radeon RX Vega M GH | |
Aorus Gaming Box GeForce RTX 2080 Ti
Intel Core i7-1165G7, | |
MSI GF65 Thin 10UE
Intel Core i7-10750H, NVIDIA GeForce RTX 3060 Laptop GPU | |
Asus ZenBook 13 UM325S
AMD Ryzen 7 5800U, AMD Radeon RX Vega 8 (Ryzen 4000/5000) | |
Asus Zenbook S UX393JA
Intel Core i7-1065G7, Intel Iris Plus Graphics G7 (Ice Lake 64 EU) | |
Beelink GTR35 II-G-16512D00W64PRO-1T
AMD Ryzen 5 3550H, AMD Radeon RX Vega 8 (Ryzen 2000/3000) | |
Lenovo Yoga Slim 7i Carbon 13 ITL
Intel Core i7-1165G7, Intel Iris Xe Graphics G7 96EUs | |
Intel NUC11PAQi7
Intel Core i7-1165G7, Intel Iris Xe Graphics G7 96EUs | |
Intel NUC11TNKi5
Intel Core i5-1135G7, Intel Iris Xe Graphics G7 80EUs | |
Beelink SEi10
Intel Core i3-1005G1, Intel UHD Graphics G1 (Ice Lake 32 EU) | |
|
Lenovo Legion C7 15IMH05 82EH0030GE
Intel Core i7-10875H, NVIDIA GeForce RTX 2070 Max-Q | |
Aorus 15P WB
Intel Core i7-10750H, NVIDIA GeForce RTX 2070 Max-Q |
136.2 (119.8min) fps +11% |
Zotac ZBOX Magnus EN72070V
Intel Core i7-9750H, NVIDIA GeForce RTX 2080 Mobile |
135.5 (117.7min) fps +10% |
Asus ROG Zephyrus M15 GU502LU-BI7N4
Intel Core i7-10750H, NVIDIA GeForce GTX 1660 Ti Mobile | |
Aorus Gaming Box GeForce RTX 2080 Ti
Intel Core i7-1165G7, | |
Intel NUC11PHKi7C
Intel Core i7-1165G7, NVIDIA GeForce RTX 2060 Mobile | |
Media NVIDIA GeForce RTX 2060 Mobile
(94.7 - 135, n=18) | |
Lenovo ThinkBook 15p Gen1 4K
Intel Core i7-10750H, NVIDIA GeForce GTX 1650 Ti Max-Q | |
Intel Hades Canyon NUC8i7HVK
Intel Core i7-8809G, AMD Radeon RX Vega M GH | |
MSI GF65 Thin 10UE
Intel Core i7-10750H, NVIDIA GeForce RTX 3060 Laptop GPU | |
HP Envy 14-eb0010nr
Intel Core i5-1135G7, NVIDIA GeForce GTX 1650 Ti Max-Q | |
Asus ZenBook 13 UM325S
AMD Ryzen 7 5800U, AMD Radeon RX Vega 8 (Ryzen 4000/5000) | |
Beelink GTR35 II-G-16512D00W64PRO-1T
AMD Ryzen 5 3550H, AMD Radeon RX Vega 8 (Ryzen 2000/3000) | |
Intel NUC11PAQi7
Intel Core i7-1165G7, Intel Iris Xe Graphics G7 96EUs | |
Asus Zenbook S UX393JA
Intel Core i7-1065G7, Intel Iris Plus Graphics G7 (Ice Lake 64 EU) | |
Intel NUC11TNKi5
Intel Core i5-1135G7, Intel Iris Xe Graphics G7 80EUs | |
Lenovo Yoga Slim 7i Carbon 13 ITL
Intel Core i7-1165G7, Intel Iris Xe Graphics G7 96EUs | |
Beelink SEi10
Intel Core i3-1005G1, Intel UHD Graphics G1 (Ice Lake 32 EU) | |
|
Lenovo Legion C7 15IMH05 82EH0030GE
Intel Core i7-10875H, NVIDIA GeForce RTX 2070 Max-Q | |
Zotac ZBOX Magnus EN72070V
Intel Core i7-9750H, NVIDIA GeForce RTX 2080 Mobile |
130.5 (113.6min) fps +13% |
Aorus 15P WB
Intel Core i7-10750H, NVIDIA GeForce RTX 2070 Max-Q | |
Asus ROG Zephyrus M15 GU502LU-BI7N4
Intel Core i7-10750H, NVIDIA GeForce GTX 1660 Ti Mobile | |
Aorus Gaming Box GeForce RTX 2080 Ti
Intel Core i7-1165G7, | |
Intel NUC11PHKi7C
Intel Core i7-1165G7, NVIDIA GeForce RTX 2060 Mobile | |
Lenovo ThinkBook 15p Gen1 4K
Intel Core i7-10750H, NVIDIA GeForce GTX 1650 Ti Max-Q | |
Media NVIDIA GeForce RTX 2060 Mobile
(85.4 - 128, n=18) | |
MSI GF65 Thin 10UE
Intel Core i7-10750H, NVIDIA GeForce RTX 3060 Laptop GPU | |
HP Envy 14-eb0010nr
Intel Core i5-1135G7, NVIDIA GeForce GTX 1650 Ti Max-Q | |
Intel Hades Canyon NUC8i7HVK
Intel Core i7-8809G, AMD Radeon RX Vega M GH | |
Asus ZenBook 13 UM325S
AMD Ryzen 7 5800U, AMD Radeon RX Vega 8 (Ryzen 4000/5000) | |
Beelink GTR35 II-G-16512D00W64PRO-1T
AMD Ryzen 5 3550H, AMD Radeon RX Vega 8 (Ryzen 2000/3000) | |
Lenovo Yoga Slim 7i Carbon 13 ITL
Intel Core i7-1165G7, Intel Iris Xe Graphics G7 96EUs | |
Intel NUC11PAQi7
Intel Core i7-1165G7, Intel Iris Xe Graphics G7 96EUs | |
Asus Zenbook S UX393JA
Intel Core i7-1065G7, Intel Iris Plus Graphics G7 (Ice Lake 64 EU) | |
Intel NUC11TNKi5
Intel Core i5-1135G7, Intel Iris Xe Graphics G7 80EUs | |
Beelink SEi10
Intel Core i3-1005G1, Intel UHD Graphics G1 (Ice Lake 32 EU) | |
|
Lenovo Legion C7 15IMH05 82EH0030GE
Intel Core i7-10875H, NVIDIA GeForce RTX 2070 Max-Q | |
Zotac ZBOX Magnus EN72070V
Intel Core i7-9750H, NVIDIA GeForce RTX 2080 Mobile |
124.6 (108.1min) fps +11% |
Asus ROG Zephyrus M15 GU502LU-BI7N4
Intel Core i7-10750H, NVIDIA GeForce GTX 1660 Ti Mobile | |
Aorus Gaming Box GeForce RTX 2080 Ti
Intel Core i7-1165G7, | |
Aorus 15P WB
Intel Core i7-10750H, NVIDIA GeForce RTX 2070 Max-Q | |
Intel NUC11PHKi7C
Intel Core i7-1165G7, NVIDIA GeForce RTX 2060 Mobile | |
Lenovo ThinkBook 15p Gen1 4K
Intel Core i7-10750H, NVIDIA GeForce GTX 1650 Ti Max-Q | |
Media NVIDIA GeForce RTX 2060 Mobile
(81.3 - 124, n=18) | |
HP Envy 14-eb0010nr
Intel Core i5-1135G7, NVIDIA GeForce GTX 1650 Ti Max-Q | |
Intel Hades Canyon NUC8i7HVK
Intel Core i7-8809G, AMD Radeon RX Vega M GH | |
MSI GF65 Thin 10UE
Intel Core i7-10750H, NVIDIA GeForce RTX 3060 Laptop GPU | |
Asus ZenBook 13 UM325S
AMD Ryzen 7 5800U, AMD Radeon RX Vega 8 (Ryzen 4000/5000) | |
Beelink GTR35 II-G-16512D00W64PRO-1T
AMD Ryzen 5 3550H, AMD Radeon RX Vega 8 (Ryzen 2000/3000) | |
Lenovo Yoga Slim 7i Carbon 13 ITL
Intel Core i7-1165G7, Intel Iris Xe Graphics G7 96EUs | |
Intel NUC11PAQi7
Intel Core i7-1165G7, Intel Iris Xe Graphics G7 96EUs | |
Asus Zenbook S UX393JA
Intel Core i7-1065G7, Intel Iris Plus Graphics G7 (Ice Lake 64 EU) | |
Intel NUC11TNKi5
Intel Core i5-1135G7, Intel Iris Xe Graphics G7 80EUs | |
Beelink SEi10
Intel Core i3-1005G1, Intel UHD Graphics G1 (Ice Lake 32 EU) | |
|
|
Zotac ZBOX Magnus EN72070V
Intel Core i7-9750H, NVIDIA GeForce RTX 2080 Mobile |
338 (303min - 379max) fps +53% |
Lenovo Legion C7 15IMH05 82EH0030GE
Intel Core i7-10875H, NVIDIA GeForce RTX 2070 Max-Q |
301 (13.9min, 54.9P0.1, 167P1 - 544max) fps +36% |
MSI GF65 Thin 10UE
Intel Core i7-10750H, NVIDIA GeForce RTX 3060 Laptop GPU |
294 (260min - 323max) fps +33% |
Aorus Gaming Box GeForce RTX 2080 Ti
Intel Core i7-1165G7, |
292.2 (253min - 320max) fps +32% |
Asus ROG Zephyrus M15 GU502LU-BI7N4
Intel Core i7-10750H, NVIDIA GeForce GTX 1660 Ti Mobile |
288.3 (254min - 307max) fps +31% |
MSI RTX 2060 Gaming Z 6G
AMD Ryzen 7 2700X, NVIDIA GeForce RTX 2060 (Desktop) |
286.7 (265min - 336max) fps +30% |
Aorus 15P WB
Intel Core i7-10750H, NVIDIA GeForce RTX 2070 Max-Q | |
Media NVIDIA GeForce RTX 2060 Mobile
(188.7 - 295, n=27) | |
Intel NUC11PHKi7C
Intel Core i7-1165G7, NVIDIA GeForce RTX 2060 Mobile |
220.7 (196min - 232max) fps |
Lenovo ThinkBook 15p Gen1 4K
Intel Core i7-10750H, NVIDIA GeForce GTX 1650 Ti Max-Q | |
Intel Hades Canyon NUC8i7HVK
Intel Core i7-8809G, AMD Radeon RX Vega M GH |
165.5 (148min - 174max) fps -25% |
HP Envy 14-eb0010nr
Intel Core i5-1135G7, NVIDIA GeForce GTX 1650 Ti Max-Q |
156.8 (144min - 164max) fps -29% |
Lenovo Yoga Slim 7i Carbon 13 ITL
Intel Core i7-1165G7, Intel Iris Xe Graphics G7 96EUs |
81.9 (65min - 91max) fps -63% |
Intel NUC11PAQi7
Intel Core i7-1165G7, Intel Iris Xe Graphics G7 96EUs |
70.3 (63min - 77max) fps -68% |
Intel NUC11TNKi5
Intel Core i5-1135G7, Intel Iris Xe Graphics G7 80EUs |
59.8 (53min - 64max) fps -73% |
Asus Zenbook S UX393JA
Intel Core i7-1065G7, Intel Iris Plus Graphics G7 (Ice Lake 64 EU) |
50.5 (47min - 55max) fps -77% |
Beelink GTR35 II-G-16512D00W64PRO-1T
AMD Ryzen 5 3550H, AMD Radeon RX Vega 8 (Ryzen 2000/3000) | |
|
Zotac ZBOX Magnus EN72070V
Intel Core i7-9750H, NVIDIA GeForce RTX 2080 Mobile |
279 (250min - 300max) fps +83% |
MSI GF65 Thin 10UE
Intel Core i7-10750H, NVIDIA GeForce RTX 3060 Laptop GPU |
223.2 (209min - 231max) fps +47% |
Aorus 15P WB
Intel Core i7-10750H, NVIDIA GeForce RTX 2070 Max-Q | |
Lenovo Legion C7 15IMH05 82EH0030GE
Intel Core i7-10875H, NVIDIA GeForce RTX 2070 Max-Q |
221 (38min, 72.3P0.1, 144P1 - 433max) fps +45% |
MSI RTX 2060 Gaming Z 6G
AMD Ryzen 7 2700X, NVIDIA GeForce RTX 2060 (Desktop) |
204.5 (163min - 231max) fps +34% |
Aorus Gaming Box GeForce RTX 2080 Ti
Intel Core i7-1165G7, |
196.6 (189min - 206max) fps +29% |
Asus ROG Zephyrus M15 GU502LU-BI7N4
Intel Core i7-10750H, NVIDIA GeForce GTX 1660 Ti Mobile |
193.2 (176min - 205max) fps +27% |
Media NVIDIA GeForce RTX 2060 Mobile
(152.2 - 215, n=24) | |
Intel NUC11PHKi7C
Intel Core i7-1165G7, NVIDIA GeForce RTX 2060 Mobile |
152.2 (142min - 162max) fps |
Lenovo ThinkBook 15p Gen1 4K
Intel Core i7-10750H, NVIDIA GeForce GTX 1650 Ti Max-Q | |
Intel Hades Canyon NUC8i7HVK
Intel Core i7-8809G, AMD Radeon RX Vega M GH |
105.1 (100min - 110max) fps -31% |
HP Envy 14-eb0010nr
Intel Core i5-1135G7, NVIDIA GeForce GTX 1650 Ti Max-Q |
90 (83min - 97max) fps -41% |
Lenovo Yoga Slim 7i Carbon 13 ITL
Intel Core i7-1165G7, Intel Iris Xe Graphics G7 96EUs |
52.3 (43min - 58max) fps -66% |
Intel NUC11PAQi7
Intel Core i7-1165G7, Intel Iris Xe Graphics G7 96EUs |
43.7 (40min - 47max) fps -71% |
Asus Zenbook S UX393JA
Intel Core i7-1065G7, Intel Iris Plus Graphics G7 (Ice Lake 64 EU) |
31.4 (9min - 37max) fps -79% |
Beelink GTR35 II-G-16512D00W64PRO-1T
AMD Ryzen 5 3550H, AMD Radeon RX Vega 8 (Ryzen 2000/3000) | |
|
Zotac ZBOX Magnus EN72070V
Intel Core i7-9750H, NVIDIA GeForce RTX 2080 Mobile |
175 (162min - 193max) fps +72% |
Aorus Gaming Box GeForce RTX 2080 Ti
Intel Core i7-1165G7, |
145.1 (138min - 155max) fps +43% |
MSI RTX 2060 Gaming Z 6G
AMD Ryzen 7 2700X, NVIDIA GeForce RTX 2060 (Desktop) |
135.7 (113min - 150max) fps +34% |
MSI GF65 Thin 10UE
Intel Core i7-10750H, NVIDIA GeForce RTX 3060 Laptop GPU |
134.2 (126min - 143max) fps +32% |
Lenovo Legion C7 15IMH05 82EH0030GE
Intel Core i7-10875H, NVIDIA GeForce RTX 2070 Max-Q |
130 (43.6min, 49.6P0.1, 88.7P1 - 274max) fps +28% |
Aorus 15P WB
Intel Core i7-10750H, NVIDIA GeForce RTX 2070 Max-Q | |
Asus ROG Zephyrus M15 GU502LU-BI7N4
Intel Core i7-10750H, NVIDIA GeForce GTX 1660 Ti Mobile |
117.6 (107min - 128max) fps +16% |
Media NVIDIA GeForce RTX 2060 Mobile
(74.4 - 131, n=33) | |
Intel NUC11PHKi7C
Intel Core i7-1165G7, NVIDIA GeForce RTX 2060 Mobile |
101.5 (96min - 106max) fps |
Intel Hades Canyon NUC8i7HVK
Intel Core i7-8809G, AMD Radeon RX Vega M GH |
59.7 (56min - 64max) fps -41% |
Lenovo ThinkBook 15p Gen1 4K
Intel Core i7-10750H, NVIDIA GeForce GTX 1650 Ti Max-Q | |
HP Envy 14-eb0010nr
Intel Core i5-1135G7, NVIDIA GeForce GTX 1650 Ti Max-Q |
53.6 (50min - 58max) fps -47% |
Lenovo Yoga Slim 7i Carbon 13 ITL
Intel Core i7-1165G7, Intel Iris Xe Graphics G7 96EUs |
27.6 (22min - 31max) fps -73% |
Intel NUC11PAQi7
Intel Core i7-1165G7, Intel Iris Xe Graphics G7 96EUs |
20.7 (18min - 23max) fps -80% |
Asus Zenbook S UX393JA
Intel Core i7-1065G7, Intel Iris Plus Graphics G7 (Ice Lake 64 EU) |
18.1 (14min - 22max) fps -82% |
Beelink GTR35 II-G-16512D00W64PRO-1T
AMD Ryzen 5 3550H, AMD Radeon RX Vega 8 (Ryzen 2000/3000) | |
|
Zotac ZBOX Magnus EN72070V
Intel Core i7-9750H, NVIDIA GeForce RTX 2080 Mobile |
95.9 (87min - 106max) fps +56% |
Zotac ZBOX Magnus EK71080
Intel Core i7-7700HQ, NVIDIA GeForce GTX 1080 (Desktop) | |
Aorus Gaming Box GeForce RTX 2080 Ti
Intel Core i7-1165G7, |
80.1 (77min - 85max) fps +30% |
MSI RTX 2060 Gaming Z 6G
AMD Ryzen 7 2700X, NVIDIA GeForce RTX 2060 (Desktop) |
72.7 (61min - 82max) fps +18% |
Lenovo Legion C7 15IMH05 82EH0030GE
Intel Core i7-10875H, NVIDIA GeForce RTX 2070 Max-Q |
72.4 (35.2min, 38.5P0.1, 48.2P1 - 138max) fps +18% |
Aorus 15P WB
Intel Core i7-10750H, NVIDIA GeForce RTX 2070 Max-Q | |
MSI GF65 Thin 10UE
Intel Core i7-10750H, NVIDIA GeForce RTX 3060 Laptop GPU |
68.7 (63min - 74max) fps +12% |
Asus ROG Zephyrus M15 GU502LU-BI7N4
Intel Core i7-10750H, NVIDIA GeForce GTX 1660 Ti Mobile |
65.1 (62min - 69max) fps +6% |
Intel NUC11PHKi7C
Intel Core i7-1165G7, NVIDIA GeForce RTX 2060 Mobile | |
Media NVIDIA GeForce RTX 2060 Mobile
(50.6 - 74, n=40) | |
Lenovo ThinkBook 15p Gen1 4K
Intel Core i7-10750H, NVIDIA GeForce GTX 1650 Ti Max-Q |
34.8 (32min, 33P1 - 38max) fps -43% |
Intel Hades Canyon NUC8i7HVK
Intel Core i7-8809G, AMD Radeon RX Vega M GH |
34.3 (32min - 37max) fps -44% |
HP Envy 14-eb0010nr
Intel Core i5-1135G7, NVIDIA GeForce GTX 1650 Ti Max-Q |
31.5 (28min - 36max) fps -49% |
Intel NUC11PAQi7
Intel Core i7-1165G7, Intel Iris Xe Graphics G7 96EUs |
10.3 (9min - 12max) fps -83% |
Beelink GTR35 II-G-16512D00W64PRO-1T
AMD Ryzen 5 3550H, AMD Radeon RX Vega 8 (Ryzen 2000/3000) | |
Asus Zenbook S UX393JA
Intel Core i7-1065G7, Intel Iris Plus Graphics G7 (Ice Lake 64 EU) |
9 (6min - 13max) fps -85% |
|
|
Lenovo Legion C7 15IMH05 82EH0030GE
Intel Core i7-10875H, NVIDIA GeForce RTX 2070 Max-Q | |
Zotac ZBOX Magnus EN72070V
Intel Core i7-9750H, NVIDIA GeForce RTX 2080 Mobile | |
Aorus 15P WB
Intel Core i7-10750H, NVIDIA GeForce RTX 2070 Max-Q | |
Asus ROG Zephyrus M15 GU502LU-BI7N4
Intel Core i7-10750H, NVIDIA GeForce GTX 1660 Ti Mobile | |
Aorus Gaming Box GeForce RTX 2080 Ti
Intel Core i7-1165G7, | |
Media NVIDIA GeForce RTX 2060 Mobile
(69.9 - 108, n=18) | |
Intel NUC11PHKi7C
Intel Core i7-1165G7, NVIDIA GeForce RTX 2060 Mobile | |
HP Envy 14-eb0010nr
Intel Core i5-1135G7, NVIDIA GeForce GTX 1650 Ti Max-Q | |
Lenovo ThinkBook 15p Gen1 4K
Intel Core i7-10750H, NVIDIA GeForce GTX 1650 Ti Max-Q | |
MSI GF65 Thin 10UE
Intel Core i7-10750H, NVIDIA GeForce RTX 3060 Laptop GPU | |
Intel Hades Canyon NUC8i7HVK
Intel Core i7-8809G, AMD Radeon RX Vega M GH | |
Asus ZenBook 13 UM325S
AMD Ryzen 7 5800U, AMD Radeon RX Vega 8 (Ryzen 4000/5000) | |
Intel NUC11PAQi7
Intel Core i7-1165G7, Intel Iris Xe Graphics G7 96EUs | |
Lenovo Yoga Slim 7i Carbon 13 ITL
Intel Core i7-1165G7, Intel Iris Xe Graphics G7 96EUs | |
Asus Zenbook S UX393JA
Intel Core i7-1065G7, Intel Iris Plus Graphics G7 (Ice Lake 64 EU) | |
Intel NUC11TNKi5
Intel Core i5-1135G7, Intel Iris Xe Graphics G7 80EUs | |
Beelink GTR35 II-G-16512D00W64PRO-1T
AMD Ryzen 5 3550H, AMD Radeon RX Vega 8 (Ryzen 2000/3000) | |
|
Zotac ZBOX Magnus EN72070V
Intel Core i7-9750H, NVIDIA GeForce RTX 2080 Mobile | |
Lenovo Legion C7 15IMH05 82EH0030GE
Intel Core i7-10875H, NVIDIA GeForce RTX 2070 Max-Q | |
Aorus 15P WB
Intel Core i7-10750H, NVIDIA GeForce RTX 2070 Max-Q | |
Asus ROG Zephyrus M15 GU502LU-BI7N4
Intel Core i7-10750H, NVIDIA GeForce GTX 1660 Ti Mobile | |
Aorus Gaming Box GeForce RTX 2080 Ti
Intel Core i7-1165G7, | |
Media NVIDIA GeForce RTX 2060 Mobile
(63.5 - 95, n=18) | |
Intel NUC11PHKi7C
Intel Core i7-1165G7, NVIDIA GeForce RTX 2060 Mobile | |
Lenovo ThinkBook 15p Gen1 4K
Intel Core i7-10750H, NVIDIA GeForce GTX 1650 Ti Max-Q | |
HP Envy 14-eb0010nr
Intel Core i5-1135G7, NVIDIA GeForce GTX 1650 Ti Max-Q | |
MSI GF65 Thin 10UE
Intel Core i7-10750H, NVIDIA GeForce RTX 3060 Laptop GPU | |
Intel Hades Canyon NUC8i7HVK
Intel Core i7-8809G, AMD Radeon RX Vega M GH | |
Lenovo Yoga Slim 7i Carbon 13 ITL
Intel Core i7-1165G7, Intel Iris Xe Graphics G7 96EUs | |
Asus ZenBook 13 UM325S
AMD Ryzen 7 5800U, AMD Radeon RX Vega 8 (Ryzen 4000/5000) | |
Intel NUC11PAQi7
Intel Core i7-1165G7, Intel Iris Xe Graphics G7 96EUs | |
Intel NUC11TNKi5
Intel Core i5-1135G7, Intel Iris Xe Graphics G7 80EUs | |
Beelink GTR35 II-G-16512D00W64PRO-1T
AMD Ryzen 5 3550H, AMD Radeon RX Vega 8 (Ryzen 2000/3000) | |
Asus Zenbook S UX393JA
Intel Core i7-1065G7, Intel Iris Plus Graphics G7 (Ice Lake 64 EU) | |
|
Zotac ZBOX Magnus EN72070V
Intel Core i7-9750H, NVIDIA GeForce RTX 2080 Mobile | |
Lenovo Legion C7 15IMH05 82EH0030GE
Intel Core i7-10875H, NVIDIA GeForce RTX 2070 Max-Q | |
Aorus 15P WB
Intel Core i7-10750H, NVIDIA GeForce RTX 2070 Max-Q | |
Asus ROG Zephyrus M15 GU502LU-BI7N4
Intel Core i7-10750H, NVIDIA GeForce GTX 1660 Ti Mobile | |
Aorus Gaming Box GeForce RTX 2080 Ti
Intel Core i7-1165G7, | |
Media NVIDIA GeForce RTX 2060 Mobile
(55.6 - 79.9, n=18) | |
Intel NUC11PHKi7C
Intel Core i7-1165G7, NVIDIA GeForce RTX 2060 Mobile | |
Lenovo ThinkBook 15p Gen1 4K
Intel Core i7-10750H, NVIDIA GeForce GTX 1650 Ti Max-Q | |
HP Envy 14-eb0010nr
Intel Core i5-1135G7, NVIDIA GeForce GTX 1650 Ti Max-Q | |
MSI GF65 Thin 10UE
Intel Core i7-10750H, NVIDIA GeForce RTX 3060 Laptop GPU | |
Intel Hades Canyon NUC8i7HVK
Intel Core i7-8809G, AMD Radeon RX Vega M GH | |
Asus ZenBook 13 UM325S
AMD Ryzen 7 5800U, AMD Radeon RX Vega 8 (Ryzen 4000/5000) | |
Lenovo Yoga Slim 7i Carbon 13 ITL
Intel Core i7-1165G7, Intel Iris Xe Graphics G7 96EUs | |
Intel NUC11TNKi5
Intel Core i5-1135G7, Intel Iris Xe Graphics G7 80EUs | |
Intel NUC11PAQi7
Intel Core i7-1165G7, Intel Iris Xe Graphics G7 96EUs | |
Beelink GTR35 II-G-16512D00W64PRO-1T
AMD Ryzen 5 3550H, AMD Radeon RX Vega 8 (Ryzen 2000/3000) | |
Asus Zenbook S UX393JA
Intel Core i7-1065G7, Intel Iris Plus Graphics G7 (Ice Lake 64 EU) | |
|
|
Asus ROG Zephyrus M15 GU502LU-BI7N4
Intel Core i7-10750H, NVIDIA GeForce GTX 1660 Ti Mobile |
311 (91.4min, 250P1 - 486max) fps +8% |
Intel NUC11PHKi7C
Intel Core i7-1165G7, NVIDIA GeForce RTX 2060 Mobile |
287 (77min, 220P1 - 480max) fps |
MSI GF65 Thin 10UE
Intel Core i7-10750H, NVIDIA GeForce RTX 3060 Laptop GPU |
269 (86.1min, 212P1 - 386max) fps -6% |
Media NVIDIA GeForce RTX 2060 Mobile
(236 - 287, n=2) | |
Intel Hades Canyon NUC8i7HVK
Intel Core i7-8809G, AMD Radeon RX Vega M GH |
210 (146min, 184P1 - 270max) fps -27% |
Aorus Gaming Box GeForce RTX 2080 Ti
Intel Core i7-1165G7, |
196 (121min, 136P1 - 384max) fps -32% |
HP Envy 14-eb0010nr
Intel Core i5-1135G7, NVIDIA GeForce GTX 1650 Ti Max-Q |
188 (61.8min, 146P1 - 283max) fps -34% |
Intel NUC11PAQi7
Intel Core i7-1165G7, Intel Iris Xe Graphics G7 96EUs |
66.2 (14min, 22.8P1 - 261max) fps -77% |
Asus Zenbook S UX393JA
Intel Core i7-1065G7, Intel Iris Plus Graphics G7 (Ice Lake 64 EU) |
50.7 (10.2min, 15.3P1 - 297max) fps -82% |
|
MSI GF65 Thin 10UE
Intel Core i7-10750H, NVIDIA GeForce RTX 3060 Laptop GPU |
172 (67.8min, 142P1 - 248max) fps +16% |
Aorus Gaming Box GeForce RTX 2080 Ti
Intel Core i7-1165G7, |
155 (98.1min, 105P1 - 289max) fps +5% |
Asus ROG Zephyrus M15 GU502LU-BI7N4
Intel Core i7-10750H, NVIDIA GeForce GTX 1660 Ti Mobile |
150 (47.9min, 126P1 - 222max) fps +1% |
Media NVIDIA GeForce RTX 2060 Mobile
(148 - 149, n=2) | |
Intel NUC11PHKi7C
Intel Core i7-1165G7, NVIDIA GeForce RTX 2060 Mobile |
148 (64.5min, 124P1 - 240max) fps |
Intel Hades Canyon NUC8i7HVK
Intel Core i7-8809G, AMD Radeon RX Vega M GH |
85.3 (73.4min, 74.4P1 - 110max) fps -42% |
HP Envy 14-eb0010nr
Intel Core i5-1135G7, NVIDIA GeForce GTX 1650 Ti Max-Q |
76.5 (46.5min, 66.4P1 - 168max) fps -48% |
Intel NUC11PAQi7
Intel Core i7-1165G7, Intel Iris Xe Graphics G7 96EUs |
23.8 (5.4min, 6.17P1 - 238max) fps -84% |
Asus Zenbook S UX393JA
Intel Core i7-1065G7, Intel Iris Plus Graphics G7 (Ice Lake 64 EU) |
21.4 (6.1min, 11.6P1 - 168max) fps -86% |
|
Aorus Gaming Box GeForce RTX 2080 Ti
Intel Core i7-1165G7, |
152 (80.1min, 107P1 - 290max) fps +23% |
MSI GF65 Thin 10UE
Intel Core i7-10750H, NVIDIA GeForce RTX 3060 Laptop GPU |
138 (51.7min, 100P1 - 228max) fps +11% |
Intel NUC11PHKi7C
Intel Core i7-1165G7, NVIDIA GeForce RTX 2060 Mobile |
124 (75.3min, 98P1 - 191max) fps |
Media NVIDIA GeForce RTX 2060 Mobile
(122 - 124, n=2) | |
Asus ROG Zephyrus M15 GU502LU-BI7N4
Intel Core i7-10750H, NVIDIA GeForce GTX 1660 Ti Mobile |
122 (68.9min, 95.9P1 - 191max) fps -2% |
Intel Hades Canyon NUC8i7HVK
Intel Core i7-8809G, AMD Radeon RX Vega M GH |
68 (51.7min, 52.9P1 - 92.9max) fps -45% |
HP Envy 14-eb0010nr
Intel Core i5-1135G7, NVIDIA GeForce GTX 1650 Ti Max-Q |
62.2 (48.5min, 50P1 - 86.8max) fps -50% |
Intel NUC11PAQi7
Intel Core i7-1165G7, Intel Iris Xe Graphics G7 96EUs |
20.1 (5min, 5.19P1 - 233max) fps -84% |
Asus Zenbook S UX393JA
Intel Core i7-1065G7, Intel Iris Plus Graphics G7 (Ice Lake 64 EU) |
17.3 (5min, 7.72P1 - 155max) fps -86% |
|
Aorus Gaming Box GeForce RTX 2080 Ti
Intel Core i7-1165G7, |
151 (68.8min, 92.8P1 - 275max) fps +39% |
MSI GF65 Thin 10UE
Intel Core i7-10750H, NVIDIA GeForce RTX 3060 Laptop GPU |
121 (82.8min, 89.6P1 - 197max) fps +11% |
Intel NUC11PHKi7C
Intel Core i7-1165G7, NVIDIA GeForce RTX 2060 Mobile |
109 (68.2min, 83.9P1 - 190max) fps |
Media NVIDIA GeForce RTX 2060 Mobile
(104 - 109, n=2) | |
Asus ROG Zephyrus M15 GU502LU-BI7N4
Intel Core i7-10750H, NVIDIA GeForce GTX 1660 Ti Mobile |
104 (63.4min, 82.8P1 - 176max) fps -5% |
Intel Hades Canyon NUC8i7HVK
Intel Core i7-8809G, AMD Radeon RX Vega M GH |
56.6 (42.9min, 44.5P1 - 73.7max) fps -48% |
HP Envy 14-eb0010nr
Intel Core i5-1135G7, NVIDIA GeForce GTX 1650 Ti Max-Q |
53.6 (27min, 43P1 - 125max) fps -51% |
Intel NUC11PAQi7
Intel Core i7-1165G7, Intel Iris Xe Graphics G7 96EUs |
16.9 (5min, 5P1 - 254max) fps -84% |
Asus Zenbook S UX393JA
Intel Core i7-1065G7, Intel Iris Plus Graphics G7 (Ice Lake 64 EU) |
15.2 (5min, 5P1 - 196max) fps -86% |