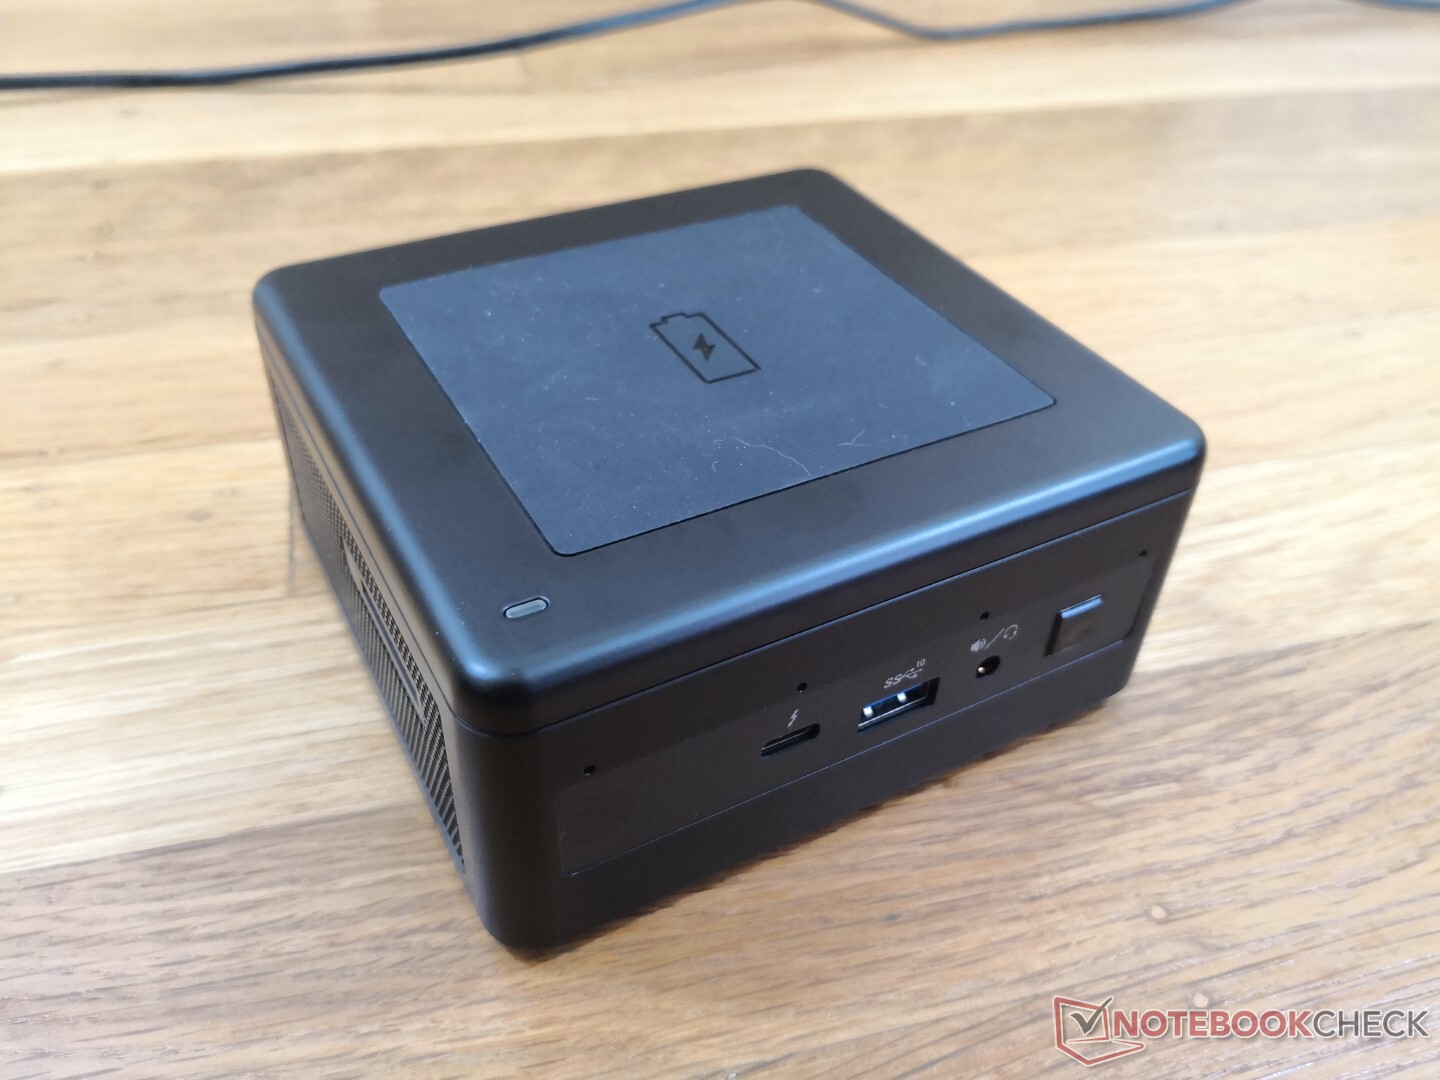
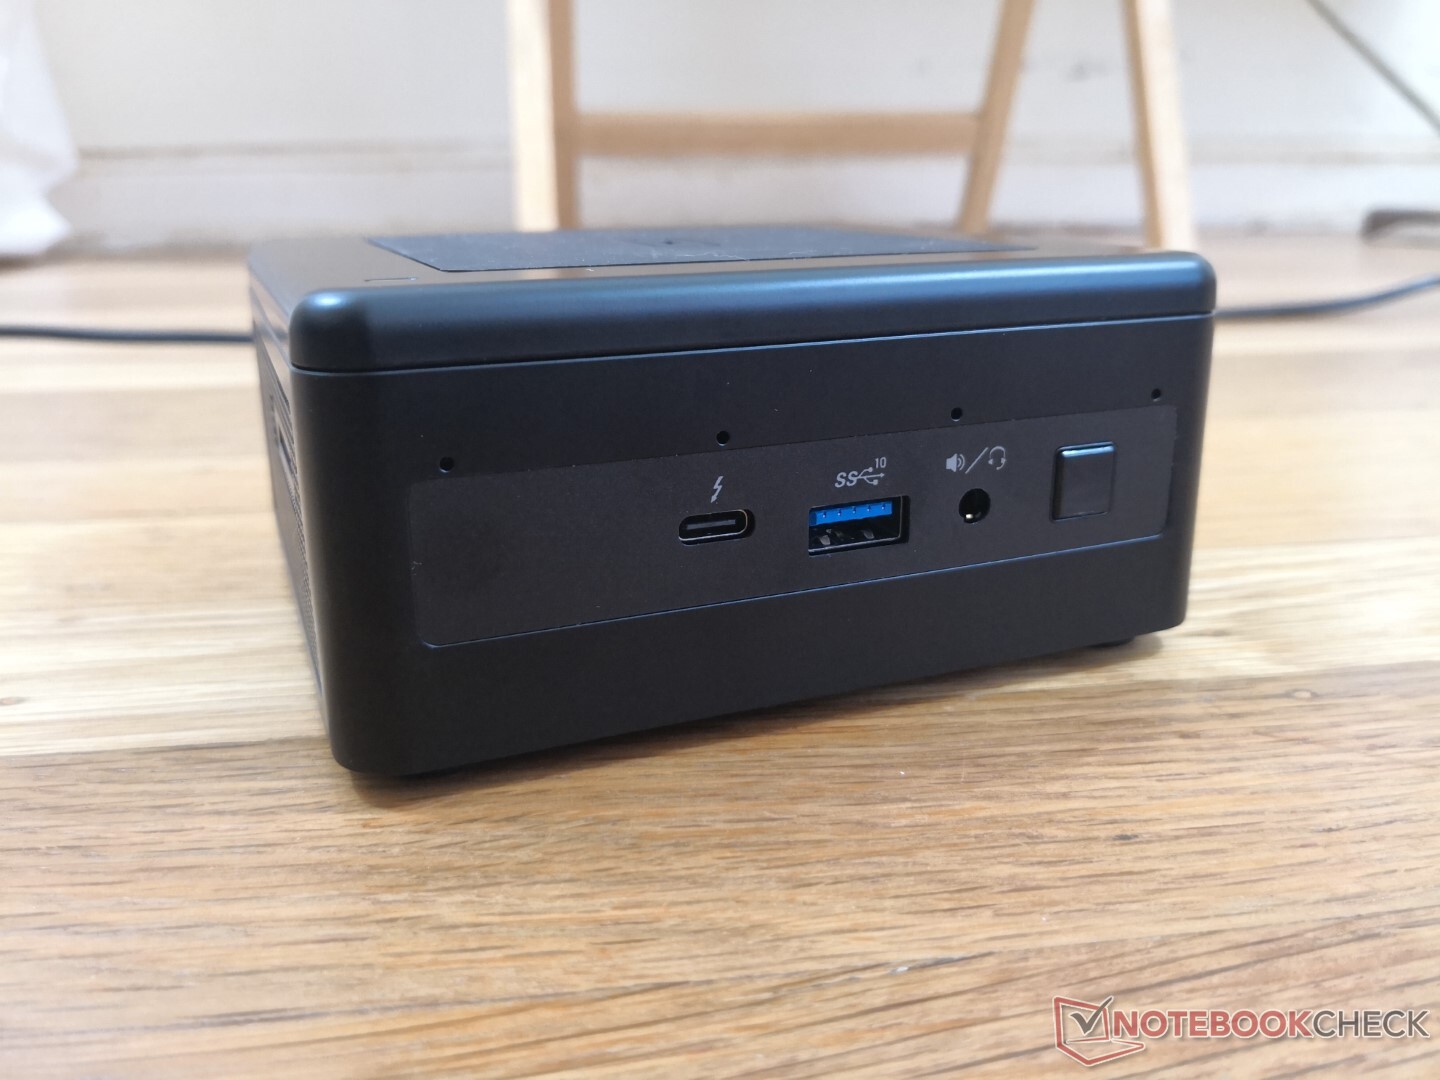
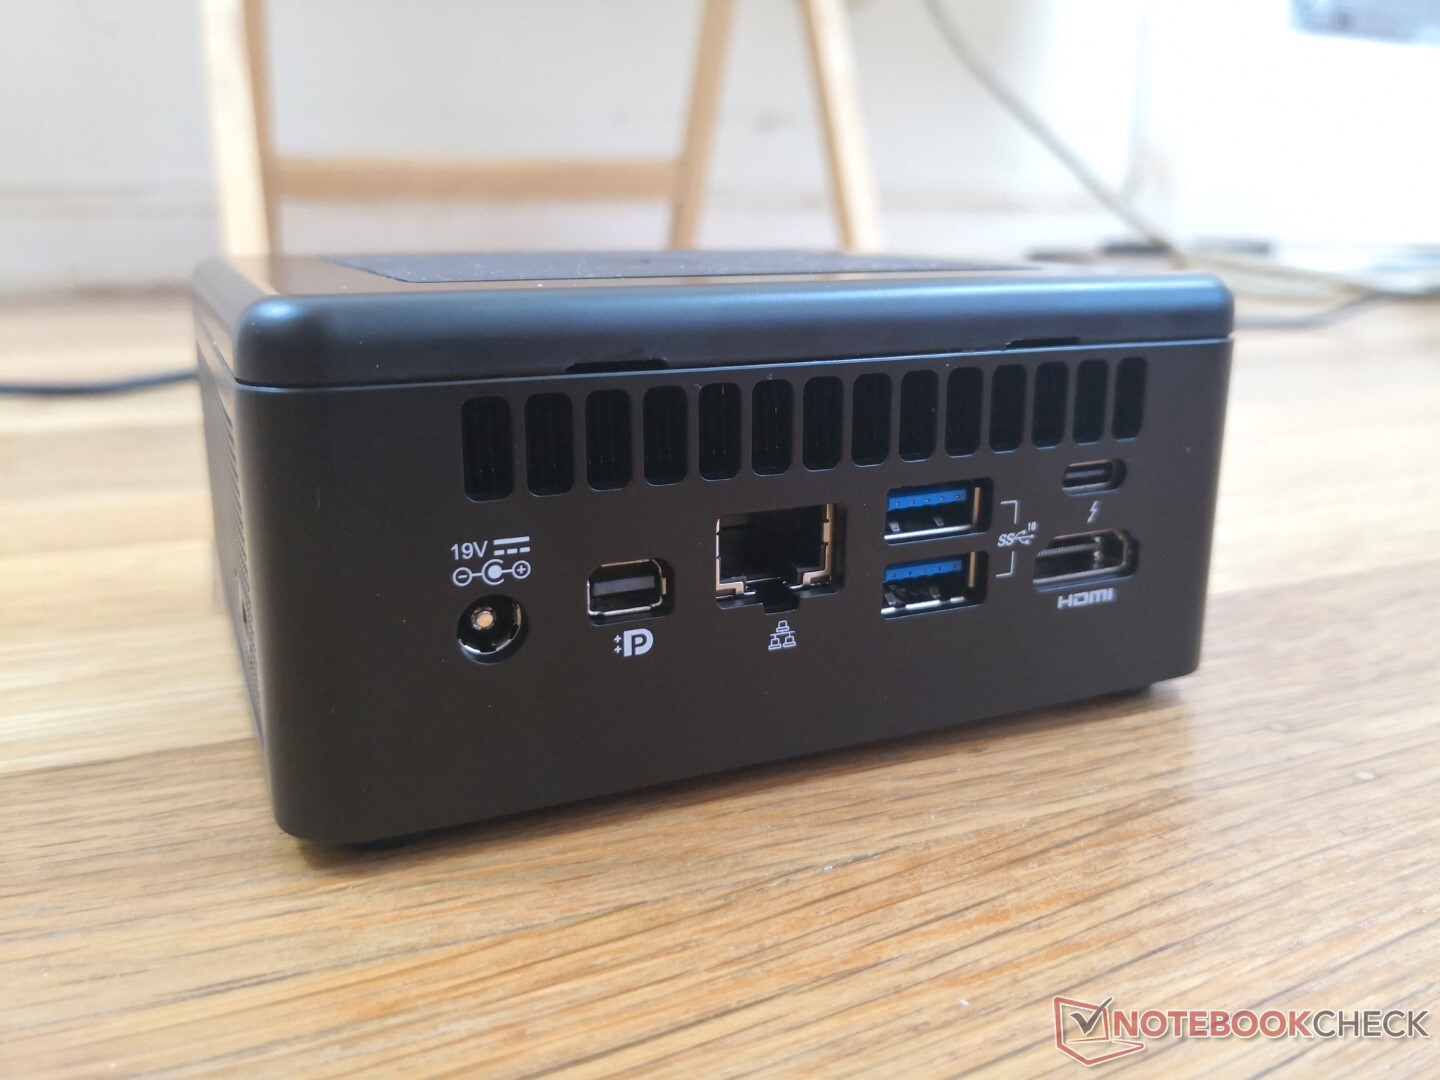
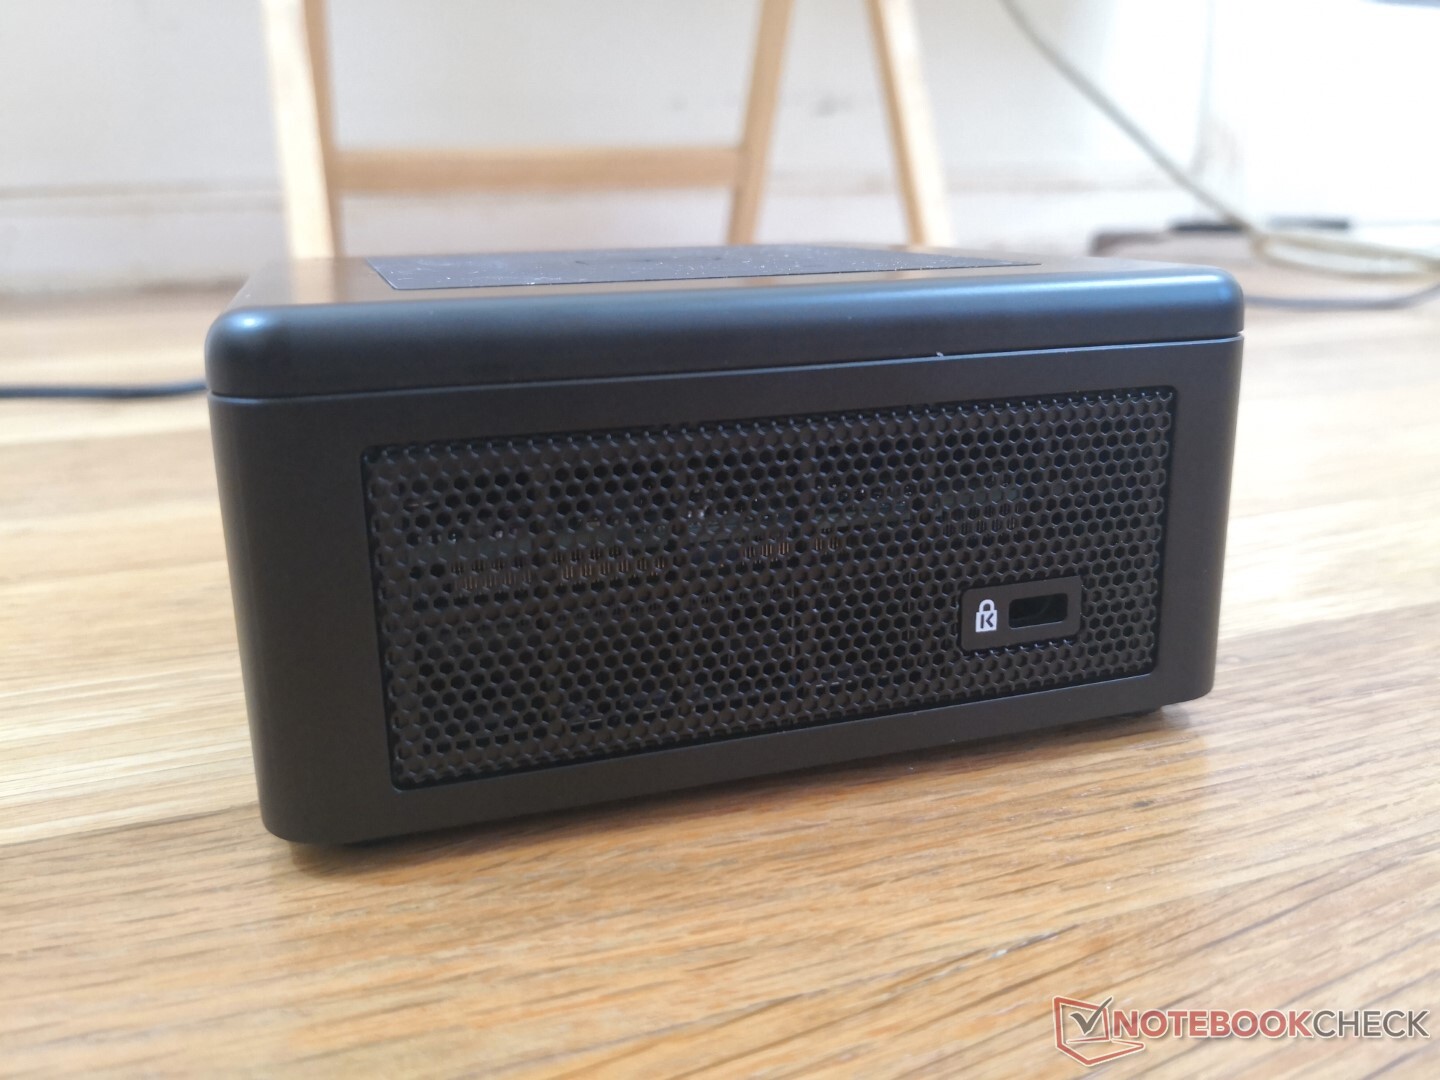
Recensione del mini PC Intel NUC11PAQi7 Panther Canyon: Tiger Lake Fatto bene
Confronto con i potenziali concorrenti
Punteggio | Data | Modello | Peso | Altezza | Dimensione | Risoluzione | Prezzo |
|---|---|---|---|---|---|---|---|
v (old) | 02/2021 | Intel NUC11PAQi7 i7-1165G7, Iris Xe G7 96EUs | 647 gr | 56 mm | x | ||
v (old) | 02/2020 | Intel NUC10i7FNH i7-10710U, UHD Graphics 620 | 697 gr | 51 mm | 0.00" | 0x0 | |
v (old) | 11/2018 | Intel NUC8i7BE i7-8559U, Iris Plus Graphics 655 | 683 gr | 51 mm | x | ||
v (old) | 04/2018 | Intel Hades Canyon NUC8i7HVK i7-8809G, Vega M GH | 1.3 kg | 39 mm | x | ||
v (old) | 12/2020 | Beelink SEi10 i3-1005G1, UHD Graphics G1 (Ice Lake 32 EU) | 350 gr | 41 mm | x | ||
v (old) | 07/2020 | Zotac ZBox MI643 i5-10210U, UHD Graphics 620 | 550 gr | 28.5 mm | x |
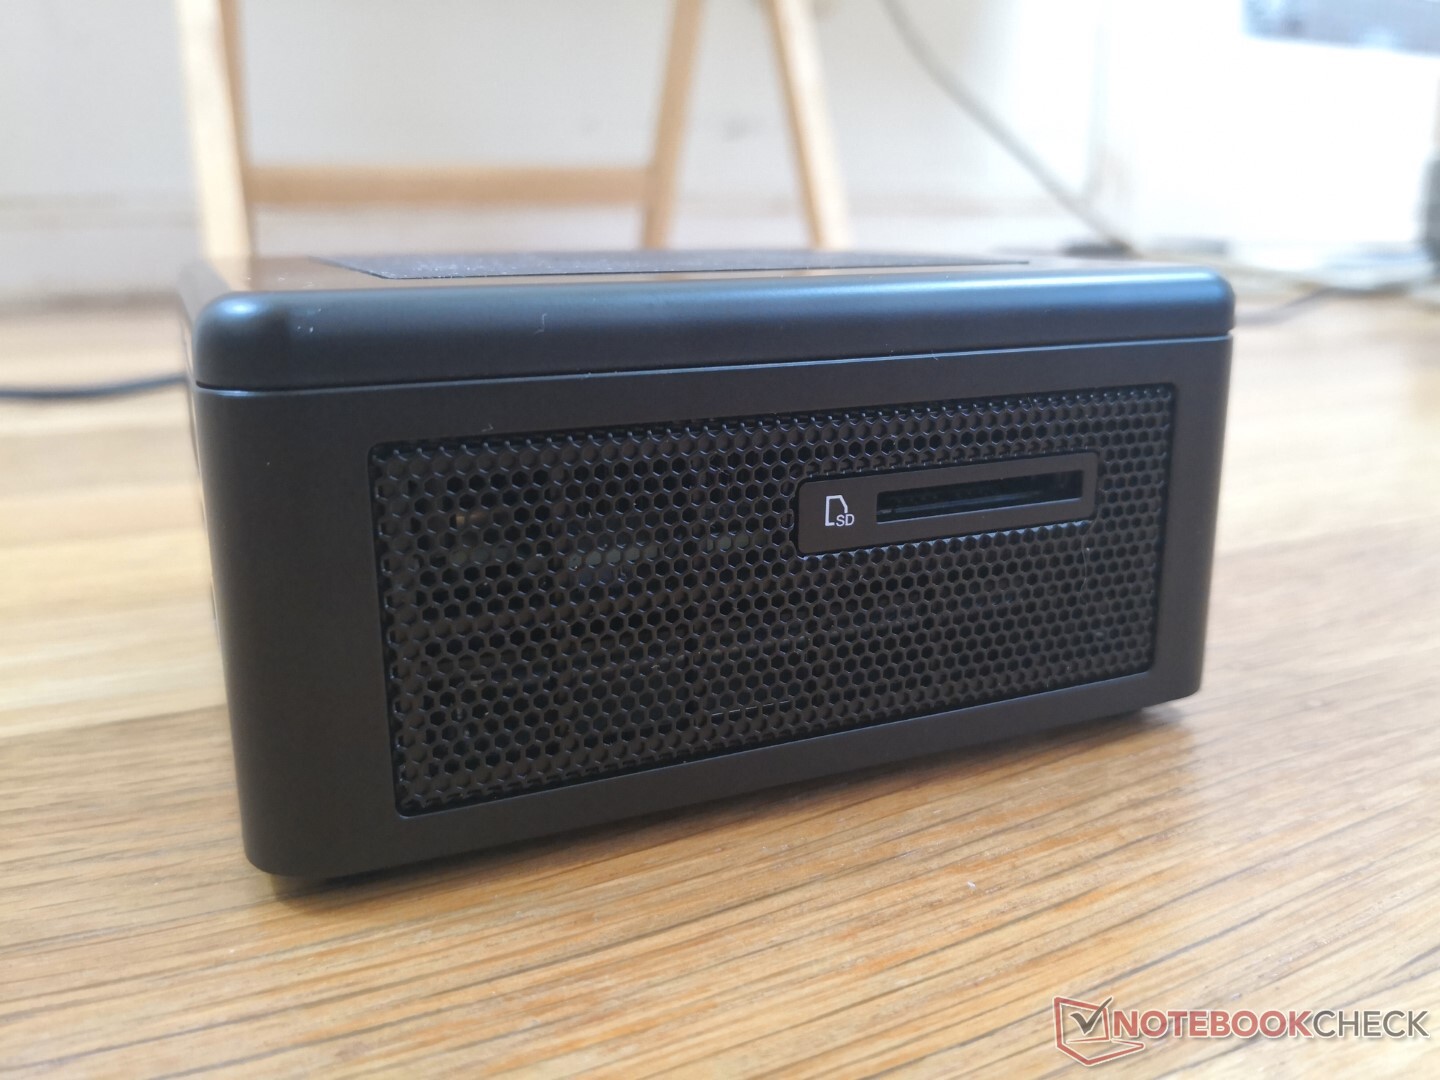
| SD Card Reader | |
| average JPG Copy Test (av. of 3 runs) | |
| Intel NUC11PAQi7 (Toshiba Exceria Pro SDXC 64 GB UHS-II) | |
| Intel Hades Canyon NUC8i7HVK (Toshiba Exceria Pro SDXC 64 GB UHS-II) | |
| Intel NUC8i7BE (Toshiba Exceria Pro M501 UHS-II) | |
| Zotac ZBox MI643 (Toshiba Exceria Pro M501 UHS-II) | |
| Beelink SEi10 (Toshiba Exceria Pro M501 UHS-II) | |
| maximum AS SSD Seq Read Test (1GB) | |
| Intel NUC11PAQi7 (Toshiba Exceria Pro SDXC 64 GB UHS-II) | |
| Intel Hades Canyon NUC8i7HVK (Toshiba Exceria Pro SDXC 64 GB UHS-II) | |
| Intel NUC8i7BE (Toshiba Exceria Pro M501 UHS-II) | |
| Zotac ZBox MI643 (Toshiba Exceria Pro M501 UHS-II) | |
| Beelink SEi10 (Toshiba Exceria Pro M501 UHS-II) | |
| Networking | |
| iperf3 transmit AX12 | |
| Beelink SEi10 | |
| Intel NUC8i7BE | |
| Intel NUC11PAQi7 | |
| Intel Hades Canyon NUC8i7HVK | |
| Zotac ZBox MI643 | |
| iperf3 receive AX12 | |
| Beelink SEi10 | |
| Intel NUC11PAQi7 | |
| Intel NUC8i7BE | |
| Intel Hades Canyon NUC8i7HVK | |
| Zotac ZBox MI643 | |
Cinebench R15: CPU Multi 64Bit | CPU Single 64Bit
Blender: v2.79 BMW27 CPU
7-Zip 18.03: 7z b 4 -mmt1 | 7z b 4
Geekbench 5.5: Single-Core | Multi-Core
HWBOT x265 Benchmark v2.2: 4k Preset
LibreOffice : 20 Documents To PDF
R Benchmark 2.5: Overall mean
Cinebench R15: CPU Multi 64Bit | CPU Single 64Bit
Blender: v2.79 BMW27 CPU
7-Zip 18.03: 7z b 4 -mmt1 | 7z b 4
Geekbench 5.5: Single-Core | Multi-Core
HWBOT x265 Benchmark v2.2: 4k Preset
LibreOffice : 20 Documents To PDF
R Benchmark 2.5: Overall mean
* ... Meglio usare valori piccoli
| PCMark 8 Home Score Accelerated v2 | 3954 punti | |
| PCMark 8 Work Score Accelerated v2 | 3074 punti | |
| PCMark 10 Score | 5158 punti | |
Aiuto | ||
| DPC Latencies / LatencyMon - interrupt to process latency (max), Web, Youtube, Prime95 | |
| Beelink SEi10 | |
| Zotac ZBox MI643 | |
| Intel NUC11PAQi7 | |
* ... Meglio usare valori piccoli
| Intel NUC11PAQi7 Samsung SSD 980 Pro 500GB MZ-V8P500BW | Intel NUC10i7FNH Kingston RBUSNS8154P3256GJ1 | Intel Hades Canyon NUC8i7HVK Intel Optane 120 GB SSDPEK1W120GA | Beelink SEi10 Silicon Motion AZW 256G M.2280 NVMe 4X 200725 D | Zotac ZBox MI643 Lexar NM610 1TB | |
|---|---|---|---|---|---|
| AS SSD | -58% | -20% | -83% | -40% | |
| Seq Read (MB/s) | 3257 | 1306 -60% | 1379 -58% | 1111 -66% | 1511 -54% |
| Seq Write (MB/s) | 3937 | 611 -84% | 553 -86% | 323.5 -92% | 1558 -60% |
| 4K Read (MB/s) | 51.3 | 21.53 -58% | 127.9 149% | 33.1 -35% | 43.77 -15% |
| 4K Write (MB/s) | 75.7 | 53.5 -29% | 103.5 37% | 66.2 -13% | 119.5 58% |
| 4K-64 Read (MB/s) | 2283 | 652 -71% | 1258 -45% | 357.3 -84% | 839 -63% |
| 4K-64 Write (MB/s) | 2206 | 648 -71% | 556 -75% | 154.8 -93% | 909 -59% |
| Access Time Read * (ms) | 0.056 | 0.114 -104% | 0.025 55% | 0.066 -18% | 0.032 43% |
| Access Time Write * (ms) | 0.154 | 0.07 55% | 0.033 79% | 0.616 -300% | 0.242 -57% |
| Score Read (Points) | 2660 | 804 -70% | 1524 -43% | 501 -81% | 1034 -61% |
| Score Write (Points) | 2676 | 762 -72% | 714 -73% | 253 -91% | 1185 -56% |
| Score Total (Points) | 6725 | 1944 -71% | 3023 -55% | 983 -85% | 2760 -59% |
| Copy ISO MB/s (MB/s) | 2030 | 976 -52% | 1125 -45% | 1160 -43% | 1373 -32% |
| Copy Program MB/s (MB/s) | 883 | 346 -61% | 342.4 -61% | 121.1 -86% | 280.4 -68% |
| Copy Game MB/s (MB/s) | 1817 | 735 -60% | 768 -58% | 364.4 -80% | 531 -71% |
| CrystalDiskMark 5.2 / 6 | 6% | -45% | -51% | -48% | |
| Write 4K (MB/s) | 244.6 | 442.4 81% | 133.7 -45% | 203 -17% | 214.1 -12% |
| Read 4K (MB/s) | 80.4 | 371.1 362% | 178.6 122% | 63.2 -21% | 62.1 -23% |
| Write Seq (MB/s) | 4094 | 900 -78% | 608 -85% | 1114 -73% | 1664 -59% |
| Read Seq (MB/s) | 4099 | 1582 -61% | 1428 -65% | 1765 -57% | 1797 -56% |
| Write 4K Q32T1 (MB/s) | 715 | 373.8 -48% | 323.6 -55% | 423.9 -41% | 421.8 -41% |
| Read 4K Q32T1 (MB/s) | 783 | 374.9 -52% | 282.3 -64% | 389.2 -50% | 512 -35% |
| Write Seq Q32T1 (MB/s) | 5065 | 893 -82% | 627 -88% | 1104 -78% | 564 -89% |
| Read Seq Q32T1 (MB/s) | 6884 | 1582 -77% | 1521 -78% | 1990 -71% | 2073 -70% |
| Write 4K Q8T8 (MB/s) | 399.1 | ||||
| Read 4K Q8T8 (MB/s) | 688 | ||||
| Media totale (Programma / Settaggio) | -26% /
-35% | -33% /
-29% | -67% /
-72% | -44% /
-43% |
* ... Meglio usare valori piccoli

Throttling disco: DiskSpd Read Loop, Queue Depth 8
| 3DMark 11 Performance | 6156 punti | |
| 3DMark Cloud Gate Standard Score | 17226 punti | |
| 3DMark Fire Strike Score | 3264 punti | |
| 3DMark Time Spy Score | 1316 punti | |
Aiuto | ||
| basso | medio | alto | ultra | |
|---|---|---|---|---|
| GTA V (2015) | 67.6 | 52.5 | 12.6 | 5.72 |
| The Witcher 3 (2015) | 70.3 | 43.7 | 20.7 | 10.3 |
| Dota 2 Reborn (2015) | 78.8 | 61.8 | 37.7 | 35 |
| Final Fantasy XV Benchmark (2018) | 30.3 | 15.6 | 12.7 | |
| X-Plane 11.11 (2018) | 42.3 | 32.7 | 28.8 | |
| Strange Brigade (2018) | 66.2 | 23.8 | 20.1 | 16.9 |
| Intel NUC11PAQi7 Iris Xe G7 96EUs, i7-1165G7, Samsung SSD 980 Pro 500GB MZ-V8P500BW | Intel NUC8i7BE Iris Plus Graphics 655, i7-8559U | Intel Hades Canyon NUC8i7HVK Vega M GH, i7-8809G, Intel Optane 120 GB SSDPEK1W120GA | Beelink SEi10 UHD Graphics G1 (Ice Lake 32 EU), i3-1005G1, Silicon Motion AZW 256G M.2280 NVMe 4X 200725 D | Zotac ZBox MI643 UHD Graphics 620, i5-10210U, Lexar NM610 1TB | GMK NucBox K1 UHD Graphics 600, Celeron J4125, HIKVision C100 NGFF SSD 128GB | |
|---|---|---|---|---|---|---|
| Noise | -10% | -11% | -17% | 2% | -10% | |
| off /ambiente * (dB) | 25.6 | 28.7 -12% | 28.7 -12% | 27.5 -7% | 26.1 -2% | 27.8 -9% |
| Idle Minimum * (dB) | 25.6 | 28.7 -12% | 29 -13% | 30.9 -21% | 27.5 -7% | 27.8 -9% |
| Idle Average * (dB) | 25.6 | 29.3 -14% | 29 -13% | 33.5 -31% | 27.5 -7% | 27.8 -9% |
| Idle Maximum * (dB) | 25.6 | 31.8 -24% | 29 -13% | 33.5 -31% | 27.5 -7% | 27.8 -9% |
| Load Average * (dB) | 33.6 | 39 -16% | 36 -7% | 38.5 -15% | 28.9 14% | 46.8 -39% |
| Witcher 3 ultra * (dB) | 33.6 | 39 -16% | 42 -25% | |||
| Load Maximum * (dB) | 54.5 | 41.4 24% | 49.4 9% | 51.6 5% | 42 23% | 46.8 14% |
* ... Meglio usare valori piccoli
Rumorosità
| Idle |
| 25.6 / 25.6 / 25.6 dB(A) |
| Sotto carico |
| 33.6 / 54.5 dB(A) |
 | ||
30 dB silenzioso 40 dB(A) udibile 50 dB(A) rumoroso |
||
min: | ||
| Off / Standby | |
| Idle | |
| Sotto carico |
|
Leggenda:
min: | |
| Intel NUC11PAQi7 i7-1165G7, Iris Xe G7 96EUs, Samsung SSD 980 Pro 500GB MZ-V8P500BW, , x, | Intel NUC8i7BE i7-8559U, Iris Plus Graphics 655, , , x, | Intel Hades Canyon NUC8i7HVK i7-8809G, Vega M GH, Intel Optane 120 GB SSDPEK1W120GA, , x, | Zotac ZBox MI643 i5-10210U, UHD Graphics 620, Lexar NM610 1TB, , x, | Beelink GTR35 II-G-16512D00W64PRO-1T R5 3550H, Vega 8, Silicon Motion AZW 512G NV428, , x, | |
|---|---|---|---|---|---|
| Power Consumption | -3% | -173% | -29% | -44% | |
| Idle Minimum * (Watt) | 5.6 | 2.7 52% | 15.5 -177% | 7.5 -34% | 8.8 -57% |
| Idle Average * (Watt) | 5.6 | 3.1 45% | 16.2 -189% | 9.2 -64% | 9.1 -63% |
| Idle Maximum * (Watt) | 6 | 6.3 -5% | 16.5 -175% | 9.6 -60% | 9.6 -60% |
| Load Average * (Watt) | 31.4 | 59.7 -90% | 83.4 -166% | 34.4 -10% | 55.3 -76% |
| Witcher 3 ultra * (Watt) | 39 | 47.2 -21% | 121.7 -212% | 50.3 -29% | |
| Load Maximum * (Watt) | 80.5 | 78 3% | 173.5 -116% | 60.6 25% | 65.6 19% |
* ... Meglio usare valori piccoli
Pro
Contro
In termini di prestazioni, il nostro Tiger Lake Core i7 è all'incirca alla pari con il NUC 10 Comet Lake nei carichi multi-threaded mentre è circa il 20% più veloce nei carichi single-threaded. Il suo più grande vantaggio, tuttavia, si trova nelle prestazioni grafiche dove l'Iris Xe può essere oltre 3 volte più veloce del UHD Graphics 620 senza nemmeno bisogno di consumare molta più energia. Se la potenza e l'efficienza della GPU sono più importanti, allora il NUC 11 sarà l'investimento migliore. Altrimenti, gli utenti che intendono gestire principalmente carichi HTPC come lo streaming 4K o la navigazione video si troveranno bene con un vecchio NUC 10, mentre il NUC Hades Canyon sarà ancora l'opzione migliore per i giochi grezzi.
Il NUC mette Tiger Lake in una luce migliore di quello che la maggior parte dei portatili sono riusciti a fare con la stessa serie di processori. Ti costerà più della maggior parte degli altri mini PC Core serie U, ma la qualità e la garanzia di 3 anni lo rendono un investimento più sicuro.
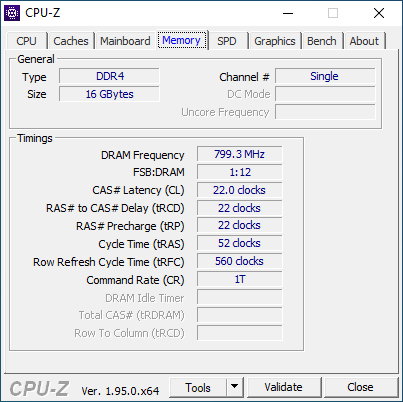
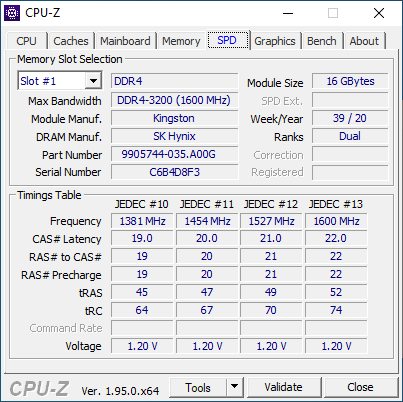
Si consiglia vivamente di configurare il NUC 11 con una memoria dual-channel per aumentare le prestazioni grafiche. Il nostro kit single-channel fornito da Intel ha restituito punteggi 3DMark più lenti del previsto e frame rates che non rendono giustizia alla Iris Xe.
Sui futuri NUC, ci piacerebbe vedere un lettore di impronte digitali integrato e il supporto per gli adattatori USB-C AC. Il mini PC concorrente Beelink GT-R include un lettore di impronte digitali, mentre una fonte di alimentazione esterna USB-C sarebbe una soluzione più universale per il futuro.
Price comparison
