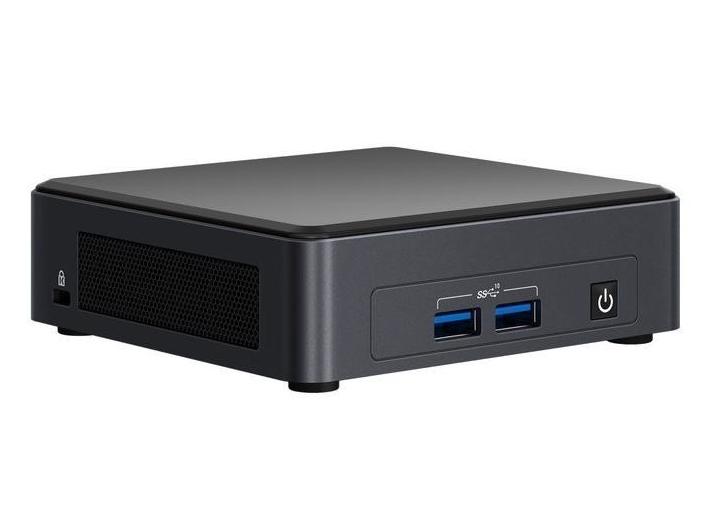
Recensione dell'Intel NUC11TNKi5 Pro Mini Tiger Canyon: Il più piccolo Tiger Lake NUC
Confronto con i potenziali concorrenti
Punteggio | Data | Modello | Peso | Altezza | Dimensione | Risoluzione | Prezzo |
|---|---|---|---|---|---|---|---|
v (old) | 04/2021 | Intel NUC11TNKi5 i5-1135G7, Iris Xe G7 80EUs | 504 gr | 37 mm | x | ||
v (old) | 03/2021 | GMK NucBox 2 i5-8259U, Iris Plus Graphics 655 | 430 gr | 50 mm | x | ||
v (old) | 02/2021 | Intel NUC11PAQi7 i7-1165G7, Iris Xe G7 96EUs | 647 gr | 56 mm | x | ||
v (old) | 02/2020 | Intel NUC10i5FNK i5-10210U, UHD Graphics 620 | 493 gr | 36 mm | 0.00" | 0x0 | |
v (old) | 12/2020 | Beelink SEi10 i3-1005G1, UHD Graphics G1 (Ice Lake 32 EU) | 350 gr | 41 mm | x | ||
v (old) | 10/2020 | Zotac ZBOX MI642 Nano i5-10210U, UHD Graphics 620 | 472 gr | 51 mm | x |
| Networking | |
| iperf3 transmit AX12 | |
| Intel NUC11TNKi5 | |
| Beelink SEi10 | |
| Intel NUC11PAQi7 | |
| GMK NucBox 2 | |
| iperf3 receive AX12 | |
| Intel NUC11TNKi5 | |
| Beelink SEi10 | |
| Intel NUC11PAQi7 | |
| GMK NucBox 2 | |
Cinebench R15: CPU Multi 64Bit | CPU Single 64Bit
Blender: v2.79 BMW27 CPU
7-Zip 18.03: 7z b 4 -mmt1 | 7z b 4
Geekbench 5.5: Single-Core | Multi-Core
HWBOT x265 Benchmark v2.2: 4k Preset
LibreOffice : 20 Documents To PDF
R Benchmark 2.5: Overall mean
Cinebench R15: CPU Multi 64Bit | CPU Single 64Bit
Blender: v2.79 BMW27 CPU
7-Zip 18.03: 7z b 4 -mmt1 | 7z b 4
Geekbench 5.5: Single-Core | Multi-Core
HWBOT x265 Benchmark v2.2: 4k Preset
LibreOffice : 20 Documents To PDF
R Benchmark 2.5: Overall mean
* ... Meglio usare valori piccoli
| PCMark 10 Score | 4512 punti | |
Aiuto | ||
| DPC Latencies / LatencyMon - interrupt to process latency (max), Web, Youtube, Prime95 | |
| Beelink SEi10 | |
| GMK NucBox 2 | |
| Intel NUC11PAQi7 | |
| Intel NUC11TNKi5 | |
* ... Meglio usare valori piccoli
| Intel NUC11TNKi5 Transcend M.2 SSD 430S TS512GMTS430S | GMK NucBox 2 Netac S930E8/256GPN | Intel NUC11PAQi7 Samsung SSD 980 Pro 500GB MZ-V8P500BW | Beelink SEi10 Silicon Motion AZW 256G M.2280 NVMe 4X 200725 D | Zotac ZBOX MI642 Nano Western Digital WD Blue 3D WDBNCE5000PNC | |
|---|---|---|---|---|---|
| AS SSD | 91% | 434% | 17% | 18% | |
| Seq Read (MB/s) | 527 | 2069 293% | 3257 518% | 1111 111% | 507 -4% |
| Seq Write (MB/s) | 469 | 1203 157% | 3937 739% | 323.5 -31% | 413.8 -12% |
| 4K Read (MB/s) | 20.41 | 41.66 104% | 51.3 151% | 33.1 62% | 36.75 80% |
| 4K Write (MB/s) | 42.52 | 136.9 222% | 75.7 78% | 66.2 56% | 88.5 108% |
| 4K-64 Read (MB/s) | 231.4 | 366.3 58% | 2283 887% | 357.3 54% | 369.4 60% |
| 4K-64 Write (MB/s) | 285.3 | 340.5 19% | 2206 673% | 154.8 -46% | 193.7 -32% |
| Access Time Read * (ms) | 0.124 | 0.064 48% | 0.056 55% | 0.066 47% | 0.103 17% |
| Access Time Write * (ms) | 0.269 | 0.347 -29% | 0.154 43% | 0.616 -129% | 0.095 65% |
| Score Read (Points) | 304 | 615 102% | 2660 775% | 501 65% | 457 50% |
| Score Write (Points) | 375 | 598 59% | 2676 614% | 253 -33% | 324 -14% |
| Score Total (Points) | 839 | 1497 78% | 6725 702% | 983 17% | 1023 22% |
| Copy ISO MB/s (MB/s) | 490.9 | 1186 142% | 2030 314% | 1160 136% | 482.5 -2% |
| Copy Program MB/s (MB/s) | 415.9 | 428.6 3% | 883 112% | 121.1 -71% | 191.9 -54% |
| Copy Game MB/s (MB/s) | 352.3 | 435.7 24% | 1817 416% | 364.4 3% | 248.9 -29% |
| CrystalDiskMark 5.2 / 6 | 149% | 533% | 146% | 23% | |
| Write 4K (MB/s) | 65.9 | 178.4 171% | 244.6 271% | 203 208% | 105.9 61% |
| Read 4K (MB/s) | 24.27 | 61 151% | 80.4 231% | 63.2 160% | 39.15 61% |
| Write Seq (MB/s) | 456.4 | 1040 128% | 4094 797% | 1114 144% | |
| Read Seq (MB/s) | 542 | 1919 254% | 4099 656% | 1765 226% | |
| Write 4K Q32T1 (MB/s) | 331.3 | 417.7 26% | 715 116% | 423.9 28% | 320.5 -3% |
| Read 4K Q32T1 (MB/s) | 295 | 325.6 10% | 783 165% | 389.2 32% | 342.1 16% |
| Write Seq Q32T1 (MB/s) | 506 | 1144 126% | 5065 901% | 1104 118% | 514 2% |
| Read Seq Q32T1 (MB/s) | 562 | 2379 323% | 6884 1125% | 1990 254% | 554 -1% |
| Write 4K Q8T8 (MB/s) | 330.8 | ||||
| Read 4K Q8T8 (MB/s) | 391.8 | ||||
| Media totale (Programma / Settaggio) | 120% /
112% | 484% /
470% | 82% /
64% | 21% /
20% |
* ... Meglio usare valori piccoli

Disk Throttling: DiskSpd Read Loop, Queue Depth 8
| 3DMark 11 Performance | 5363 punti | |
| 3DMark Cloud Gate Standard Score | 15314 punti | |
| 3DMark Fire Strike Score | 2750 punti | |
| 3DMark Time Spy Score | 1161 punti | |
Aiuto | ||
| basso | medio | alto | ultra | |
|---|---|---|---|---|
| The Witcher 3 (2015) | 59.8 | |||
| Dota 2 Reborn (2015) | 73.8 | 56 | 34.2 | 31.4 |
| Final Fantasy XV Benchmark (2018) | 26.8 | 13.7 | 10.5 | |
| X-Plane 11.11 (2018) | 37.1 | 27.3 | 29.1 |
| Intel NUC11TNKi5 | GMK NucBox 2 | Intel NUC11PAQi7 | Beelink SEi10 | Zotac ZBOX MI642 Nano | Intel NUC8i7BE | |
|---|---|---|---|---|---|---|
| Noise | 18% | 12% | 0% | 1% | 5% | |
| off /ambiente * (dB) | 24.8 | 25.6 -3% | 25.6 -3% | 27.5 -11% | 27.8 -12% | 28.7 -16% |
| Idle Minimum * (dB) | 35.6 | 25.7 28% | 25.6 28% | 30.9 13% | 27.8 22% | 28.7 19% |
| Idle Average * (dB) | 35.6 | 25.7 28% | 25.6 28% | 33.5 6% | 33.9 5% | 29.3 18% |
| Idle Maximum * (dB) | 35.6 | 25.7 28% | 25.6 28% | 33.5 6% | 33.9 5% | 31.8 11% |
| Load Average * (dB) | 36.2 | 35.3 2% | 33.6 7% | 38.5 -6% | 43.7 -21% | 39 -8% |
| Witcher 3 ultra * (dB) | 38 | 33.6 12% | 39 -3% | |||
| Load Maximum * (dB) | 47.6 | 35.1 26% | 54.5 -14% | 51.6 -8% | 43.7 8% | 41.4 13% |
* ... Meglio usare valori piccoli
Rumorosità
| Idle |
| 35.6 / 35.6 / 35.6 dB(A) |
| Sotto carico |
| 36.2 / 47.6 dB(A) |
 | ||
30 dB silenzioso 40 dB(A) udibile 50 dB(A) rumoroso |
||
min: | ||
| Off / Standby | |
| Idle | |
| Sotto carico |
|
Leggenda:
min: | |
| Intel NUC11TNKi5 | GMK NucBox 2 | Intel NUC11PAQi7 | Intel NUC10i5FNK | Beelink SEi10 | Zotac ZBOX MI642 Nano | |
|---|---|---|---|---|---|---|
| Power Consumption | 30% | 31% | -4% | 42% | 23% | |
| Idle Minimum * (Watt) | 11.5 | 6.1 47% | 5.6 51% | 6.3 45% | 8.9 23% | |
| Idle Average * (Watt) | 12.4 | 6.8 45% | 5.6 55% | 15.7 -27% | 6.6 47% | 9 27% |
| Idle Maximum * (Watt) | 12.9 | 7.3 43% | 6 53% | 6.7 48% | 9.9 23% | |
| Load Average * (Watt) | 40.7 | 46.3 -14% | 31.4 23% | 25.9 36% | 33 19% | |
| Witcher 3 ultra * (Watt) | 43.9 | 39 11% | ||||
| Load Maximum * (Watt) | 73.5 | 50.7 31% | 80.5 -10% | 58.6 20% | 46.7 36% | 58 21% |
* ... Meglio usare valori piccoli
Pro
Contro
Il prezzo è sempre stato una battaglia in salita per la serie NUC. Il NUC11TNKi5 con 4 GB di RAM, nessun sistema operativo e nessuna memoria è in vendita a 670 dollari, contro i 500 dollari del GMK NucBox 2 con 8 GB di RAM, Windows 10 OS e un SSD NVMe da 256 GB. Il Beelink SEi10, ancora più economico, costa 400 dollari con 8 GB di RAM, 256 GB di SSD NVMe e anche il supporto Thunderbolt 3. Per rendere davvero utile il NUC 11 Pro, gli utenti dovranno sfruttare le prestazioni relativamente alte del processore e apprezzare sia la garanzia triennale del produttore che la solida qualità costruttiva. Per il resto, i già citati GMK o Beelink funzioneranno altrettanto bene per ambienti HTPC a bassa potenza o per lo streaming 4K.
Non è esattamente economico, ma gli utenti stanno ottenendo un mini PC di prima classe con l'ultima CPU di 11a generazione e tutti i suoi vantaggi in termini di prestazioni.
Per l'inevitabile "NUC 12 Pro", ci piacerebbe vedere USB-C Power Delivery e un alimentatore più piccolo. L'USB-C PD permetterebbe a terzi adattatori USB-C AC di ridurre la dipendenza dagli adattatori proprietari di Intel. L'adattatore Intel sovradimensionato da 120 W qui è grande quanto l'adattatore per il portatile gaming MSI GP66, che è assurdo per un mini PC alimentato da Core U.
Price comparison
