Recensioni Notebook con Intel Iris Xe Graphics G7 80EUs la scheda grafica
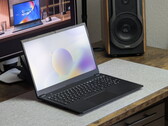
Recensione dello Schenker Connect 15 (E26): Laptop business con batteria sostituibile, SmartCard, Wi-Fi 7 & LTE
Wi-Fi 7, LTE, un lettore di SmartCard e una batteria sostituibile sono diventati sempre più rari nei moderni computer portatili aziendali. Il modello Schenker Connect 15 si concentra proprio su queste caratteristiche, combinando le funzionalità enterprise-friendly con un hardware silenzioso ed efficiente dal punto di vista energetico.
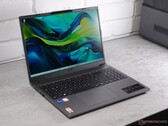
Intel Core 5 120U, Iris Xe G7 80EUs, 15.6", 1.9 kgRecensione dell'Acer Aspire Go 15: Computer portatile economico con buone prestazioni
Con l'Aspire Go 15-51P, Acer ha un portatile Windows 11 che è conveniente e offre comunque un pacchetto complessivo utile. Con un processore Core i5 veloce, 16 GB di RAM e una generosa durata della batteria, l'offerta sembra quasi troppo bella per essere vera.
Intel Core i5-1334U, Iris Xe G7 80EUs, 15.3", 1.7 kgRecensione dello Xiaomi RedmiBook 14 2025 - Laptop economico per tutti i giorni con aggiornamento Raptor Lake e 32 GB di RAM
Il RedmiBook 14 riceve le nuove CPU Raptor Lake Refresh di Intel per l'anno modello 2025. Oltre all'involucro in alluminio di alta qualità, c'è anche uno schermo IPS ad alta risoluzione che può essere utilizzato per modificare le immagini con facilità.
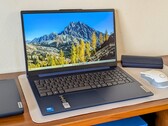
Intel Core 5 220H, Iris Xe G7 80EUs, 14", 1.4 kgRecensione del computer portatile Lenovo IdeaPad Slim 3i 15IRU9: debutto delle prestazioni dell'Intel Core 5 120U
È uno dei computer portatili da 15,6 pollici più economici che si possono trovare senza ricorrere a sistemi usati con processori obsoleti. Si tratta di un'esperienza discreta e semplice, a patto di tenere sotto controllo le proprie aspettative.
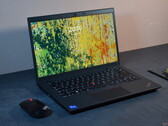
Intel Core 5 120U, Iris Xe G7 80EUs, 15.6", 1.6 kgRecensione del Lenovo ThinkPad L14 Gen 4 Intel: Non più all'altezza
Prima di testare gli ultimi modelli della serie ThinkPad L, diamo uno sguardo al passato. Il Lenovo ThinkPad L14 Gen 4 Intel ha molte caratteristiche utili per chi lavora in ufficio, ma vacilla in alcune discipline importanti rispetto ai concorrenti più moderni - lo schermo è un esempio importante.
Intel Core i5-1335U, Iris Xe G7 80EUs, 14", 1.6 kgGetac S410 G5: Intel Core i5-1350P, 14.00", 2.9 kg
recensione » Recensione del notebook rugged Getac S410 Gen 5: Raptor Lake-P per prestazioni extra
Schenker Work 14 Base: Intel Core i5-1235U, 14.00", 1.3 kg
recensione » Recensione dello Schenker Work 14 Base - portatile da ufficio economico, con molte porte e un luminoso display IPS
HP EliteBook x360 830 G10 7L7U1ET: Intel Core i5-1335U, 13.30", 1.3 kg
recensione » Recensione del portatile HP EliteBook x360 830 G10: Convertibile in metallo con touchscreen non riflettente
Acer TravelMate P4 TMP414-53-58XQ: Intel Core i5-1335U, 14.00", 1.5 kg
recensione » Recensione del portatile Acer TravelMate P4: L'understatement è per i capi
Huawei MateBook 14 (2024): Intel Core i5-1240P, 14.00", 1.4 kg
recensione » Recensione del nuovo Huawei MateBook 14: Un tentativo di creare un'alternativa al MacBook Air
Acer Swift Go 14 SFG14-71: Intel Core i5-1335U, 14.00", 1.3 kg
recensione » Recensione dell'Acer Swift Go 14 (2023): un portatile da 14 pollici con un pannello OLED da 2,9k a 800 dollari
Lenovo ThinkPad E16 G1 Core i5-1335U: Intel Core i5-1335U, 16.00", 1.8 kg
recensione » Recensione del Lenovo ThinkPad E16 G1 Intel: Il Core i5 è testa a testa con l'AMD Ryzen 7
Dell Latitude 13 7340 i5-1345U: Intel Core i5-1345U, 13.30", 1.1 kg
recensione » Recensione del portatile Dell Latitude 7340: 0.22 libbre in meno con un impatto trascurabile sulle prestazioni
Lenovo ThinkPad X13 Yoga G4 21F20017GE: Intel Core i5-1335U, 13.30", 1.3 kg
recensione » Recensione del portatile Lenovo ThinkPad X13 Yoga G4: Convertibile con una lunga durata della batteria e prestazioni deboli
Lenovo ThinkPad T14 G4 21HD0043GE: Intel Core i5-1335U, 14.00", 1.4 kg
recensione » Recensione del portatile Lenovo ThinkPad T14 G4 Intel: Aggiornamento Raptor Lake per la serie T
HP EliteBook 1040 G10 818N7EA: Intel Core i5-1335U, 14.00", 1.3 kg
recensione » Recensione del portatile HP EliteBook 1040 G10: la risposta di HP al ThinkPad X1 Carbon
Lenovo IdeaPad Flex 5 14IRU8: Intel Core i5-1335U, 14.00", 1.6 kg
recensione » Recensione del Lenovo IdeaPad Flex 5i 14IRU8: Un economico convertibile da 14 pollici con Thunderbolt 4
Minisforum Venus Series NPB5: Intel Core i5-13500H, 0.6 kg
recensione » Recensione del Minisforum Venus Series NPB5: Il mini PC con Raptor Lake-H, ovvero un Intel Core i5-13500H e USB4
Dell Latitude 7440: Intel Core i5-1345U, 14.00", 1.2 kg
recensione » Recensione del portatile Dell Latitude 7440: Batte il Latitude 9440 in alcune aree chiave
Durabook R8 Tablet: Intel Core i5-1230U, 8.00", 0.9 kg
recensione » Recensione del Durabook R8: Il primo tablet rugged al mondo senza ventole con Intel 12a generazione
Acer Aspire 5 Spin 14: Intel Core i5-1335U, 14.00", 1.6 kg
recensione » Recensione dell'Acer Aspire 5 Spin 14: Il portatile 2-in-1 con penna
Dell Latitude 3440: Intel Core i5-1345U, 14.00", 1.5 kg
recensione » Recensione del portatile Dell Latitude 3440: Debutto delle prestazioni dell'Intel Core i5-1345U
Samsung Galaxy Book3 15, Core i5-1335U: Intel Core i5-1335U, 15.60", 1.5 kg
recensione » Recensione del Samsung Galaxy Book3: L'Intel Core i5-1335U celebra una solida anteprima
Samsung Galaxy Book3 Pro 16: Intel Core i5-1340P, 16.00", 1.6 kg
recensione » Recensione del Samsung Galaxy Book3 Pro 16: Laptop da ufficio con Core-i5 e buona autonomia
Samsung Galaxy Book3 Pro 360 16, i5-1340P: Intel Core i5-1340P, 16.00", 1.7 kg
recensione » Recensione del Samsung Galaxy Book3 Pro 360 convertibile da 16 pollici: la nuova generazione di display incontra un processore rinnovato
Huawei MateBook D 14 2023, 53013PKG: Intel Core i5-1155G7, 14.00", 1.4 kg
recensione » Recensione del portatile Huawei MateBook D 14 (2022): Unibody per principianti
Dell Latitude 7230 Rugged Extreme: Intel Core i5-1240U, 12.00", 1.6 kg
recensione » Recensione del tablet Dell Latitude 7230 Rugged Extreme: Uno dei migliori display della categoria
Acer TravelMate P4 TMP416-51-55KN: Intel Core i5-1240P, 16.00", 1.6 kg
recensione » Recensione dell'Acer TravelMate P4 TMP416-51: Un portatile leggero per l'ufficio con resistenza e potenza
Huawei MateBook D 15 2023-53013BSJ: Intel Core i5-1155G7, 15.60", 1.6 kg
recensione » Recensione del Huawei MateBook D 15 (2022): Un portatile che ricorda il MacBook Pro
HP Dragonfly Pro Chromebook: Intel Core i5-1235U, 14.00", 1.5 kg
recensione » Recensione dell'HP Dragonfly Pro Chromebook: Un Chromebook per gli utenti di MacBook Pro 14
Intel NUC 12 Pro Kit NUC12WSBi5: Intel Core i5-1240P, 0.5 kg
recensione » Recensione del mini PC Intel NUC 12 Pro Kit (Core i5-1240P): Scattante e con un'ottima connettività
Dell Latitude 3520: Intel Core i5-1135G7, 15.60", 1.8 kg
recensione » Recensione del Dell Latitude 3520: Il laptop da ufficio con Core i5 offre buona autonomia
Huawei MateBook D 15 2021, i5-1135G7: Intel Core i5-1135G7, 15.60", 1.5 kg
recensione » Recensione del portatile Huawei MateBook D 15 Intel: Un portatile economico e silenzioso
Asus F415EA-EK115W: Intel Core i5-1135G7, 14.00", 1.6 kg
recensione » Recensione dell'Asus F415EA: Laptop da ufficio Core i5 silenzioso e con temperature basse
Huawei MateBook D 14 (2021): Intel Core i5-1135G7, 14.00", 1.4 kg
recensione » Recensione del Huawei MateBook D 14: Un portatile da ufficio silenzioso con una lunga durata della batteria
LG Gram 15Z90Q: Intel Core i5-1240P, 15.60", 1.1 kg
recensione » Recensione del portatile LG Gram 15 (2022): Concentrato di portabilità
Lenovo IdeaPad Gaming Chromebook 16: Intel Core i5-1235U, 16.00", 1.8 kg
recensione » Recensione del Lenovo IdeaPad Gaming Chromebook 16: Giochi in streaming mentre fai i compiti
Lenovo ThinkPad T14s G3 21BR00CDGE: Intel Core i5-1235U, 14.00", 1.3 kg
recensione » Recensione del portatile Lenovo ThinkPad T14s G3 Intel: silenzioso, efficiente e veloce
Beelink SEi12 Core i5-1235U: Intel Core i5-1235U, 0.5 kg
recensione » Recensione del mini PC Beelink SEi12: Supera l'Intel NUC 11
Lenovo ThinkPad X13 G3 21BN0046GE: Intel Core i5-1235U, 13.30", 1.3 kg
recensione » Recensione del portatile Lenovo ThinkPad X13 G3: Resistenza nell'uso esterno con Intel Alder Lake-U
Intel NUC Pro Chassis_i5_1145G7: Intel Core i5-1145G7
recensione » Recensione dell'Intel NUC Pro Chassis Element: barebone modulare per molti scopi
Intel NUC Pro Chassis_i5_1245U: Intel Core i5-1245U
recensione » Recensione dell'Intel NUC Pro Chassis Element: barebone modulare per molti scopi
Acer Swift 3 SF314-71-56U3: Intel Core i5-12500H, 14.00", 1.4 kg
recensione » Recensione dell'Acer Swift 3 SF314: Computer portatile compatto con un bellissimo display OLED e una CPU veloce
Dell XPS 13 9315 2-in-1 Core i5-1230U: Intel Core i5-1230U, 13.00", 0.8 kg
recensione » Il Dell Surface Pro 8: recensione del convertibile 2-in-1 XPS 13 9315
Asus Zenbook 17 Fold UX9702: Intel Core i7-1250U, 17.30", 1.8 kg
recensione » Recensione dell'Asus Zenbook 17 Fold - Debutto del convertibile OLED da 17 pollici pieghevole
LG Gram 14Z90Q: Intel Core i5-1240P, 14.00", 1 kg
recensione » Recensione del portatile LG Gram 14 (2022): Elegante, leggero ed economico
Lenovo ThinkPad T16 G1 21BWS00200: Intel Core i5-1240P, 16.00", 1.9 kg
recensione » Recensione del portatile Lenovo ThinkPad T16 G1 Intel: un maratoneta da 16 pollici
Dynabook Portégé X30L-K-139: Intel Core i5-1240P, 13.30", 0.9 kg
recensione » Recensione del Dynabook Portégé X30L-K-139 - Il portatile business pesa solo 900 grammi
Lenovo IdeaPad 5 Pro 14ITL6: Intel Core i5-1135G7, 14.00", 1.4 kg
recensione » Recensione del Lenovo IdeaPad 5 Pro 14ITL6: un portatile da 14 pollici dall'aspetto accattivante
HP Envy 14-eb0252ng: Intel Core i5-1135G7, 14.00", 1.5 kg
recensione » Recensione del portatile HP Envy 14: Un tuttofare di successo
Lenovo IdeaPad Flex 5i 14IAU7: Intel Core i5-1235U, 14.00", 1.6 kg
recensione » Recensione del convertibile Lenovo IdeaPad Flex 5i 14IAU7: Core i5-1235U fatto bene
Microsoft Surface Laptop Go 2 Core i5: Intel Core i5-1135G7, 12.40", 1.1 kg
recensione » Recensione del Microsoft Surface Laptop Go 2: un compagno compatto con un vecchio hardware
LG Gram 17 (2022): Intel Core i5-1240P, 17.00", 1.4 kg
recensione » Recensione dell'LG Gram 17 (2022): Un portatile leggero per l'ufficio con un ampio display e un'ottima durata della batteria
Dell XPS 13 Plus 9320 i5-1240p: Intel Core i5-1240P, 13.40", 1.2 kg
recensione » Recensione del portatile Dell XPS 13 Plus: La configurazione base è la scelta migliore?
Dell XPS 13 9315, i5-1230U: Intel Core i5-1230U, 13.40", 1.2 kg
recensione » Recensione del portatile Dell XPS 13 9315: Basse prestazioni, incredibile durata della batteria
VAIO FE 14.1 VWNC51429-SL: Intel Core i5-1235U, 14.10", 1.6 kg
recensione » Recensione del portatile VAIO FE14: Evitare il Core i5-1235U e scegliere il Core i7-1255U
Gateway Ultra Slim 14.1 GWTC51427: Intel Core i5-1235U, 14.10", 1.6 kg
recensione » Recensione del portatile Gateway Ultra Slim 14.1 GWTC51427: Debutto delle prestazioni del Core i5-1235U
Lenovo ThinkPad X1 Carbon G10 21CC001RGE: Intel Core i5-1250P, 14.00", 1.2 kg
recensione » Recensione del portatile Lenovo ThinkPad X1 Carbon G10: Alder-Lake P28 senza grande effetto
Lenovo Yoga Slim 7i Pro 14IAP G7: Intel Core i5-1240P, 14.00", 1.3 kg
recensione » Recensione del notebook Lenovo Yoga Slim 7i Pro 14IAP: Subnotebook economico con 12 core e display 2.8K
LG Gram 14T90P: Intel Core i5-1135G7, 14.00", 1.2 kg
recensione » Recensione del convertibile LG Gram 14T90P: Lo sfidante di Lenovo Yoga e HP Spectre
Samsung Galaxy Book2 Pro 13 NP930XED-KA1DE: Intel Core i5-1240P, 13.30", 0.9 kg
recensione » Recensione del Samsung Galaxy Book2 Pro 13: Subnotebook con l'efficiente Alder Lake i5
Dell Latitude 7420 JW6MH: Intel Core i5-1145G7, 14.00", 1.3 kg
recensione » Recensione di Dell Latitude 7420: PC Windows - Massima sicurezza
VAIO SX12 VJS124X1011P: Intel Core i5-1155G7, 12.50", 0.9 kg
recensione » Debutto di Intel Core i5-1155G7: Recensione del portatile VAIO SX12
Dell Latitude 5320-TM4V2: Intel Core i5-1135G7, 13.30", 1.3 kg
recensione » Latitude 5320 in rassegna: Dell rovina la sostituzione del mouse
Huawei MateBook E Core i5: Intel Core i5-1130G7, 12.60", 0.7 kg
recensione » Recensione Huawei MateBook E Laptop - Un nuovo tablet Windows con OLED
Samsung Galaxy Book Pro 360 15 NP950QDB-KC3DE: Intel Core i5-1135G7, 15.60", 1.4 kg
recensione » Recensione del convertibile Samsung Galaxy Book Pro 360 15": maggiore ingombro, più potenza
Acer Extensa 15 EX215-54-5103: Intel Core i5-1135G7, 15.60", 1.9 kg
recensione » Recensione dell'Acer Extensa 15 EX215-54: Potenza del Core i5 ad un prezzo contenuto
Huawei MateBook 13s i5 11300H: Intel Core i5-11300H, 13.40", 1.3 kg
recensione » Recensione Huawei MateBook 13s: Ottimo subnotebook con display a 90 Hz
Acer Swift 3 SF314-511-54ZK: Intel Core i5-1135G7, 14.00", 1.2 kg
recensione » Recensione dell'Acer Swift 3 SF314: Il portatile supera il test a pieni voti
Acer TravelMate P4 TMP414-51-59MR: Intel Core i5-1135G7, 14.00", 1.4 kg
recensione » Recensione del Acer TravelMate P4: Il business endurance runner con Thunderbolt 4
Dell Latitude 14 5420-D2G5W: Intel Core i5-1135G7, 14.00", 1.5 kg
recensione » Recensione del Dell Latitude 14 5420: Un portatile così vicino a rivendicare la corona del business
Dell Inspiron 15 3000 3511: Intel Core i5-1135G7, 15.60", 1.7 kg
recensione » Recensione del portatile Dell Inspiron 15 3000 3511: più economico
HP Pavilion 14-dv0357ng: Intel Core i5-1135G7, 14.00", 1.4 kg
recensione » Recensione del Laptop HP Pavilion 14: Un dispositivo ben congegnato, un esterno attraente
Beelink GTI 11: Intel Core i5-1135G7, 0.6 kg
recensione » La nostra migliore alternativa Intel NUC 11: Recensione del mini PC Beelink GTI 11
Lenovo ThinkPad L14 G2-20X1003WGE: Intel Core i5-1135G7, 14.00", 1.7 kg
recensione » Recensione Lenovo ThinkPad L14 G2: Buono anche con Intel
Asus ExpertBook B1 B1400CEAE, i5-1135G7: Intel Core i5-1135G7, 14.00", 1.5 kg
recensione » Recensione dell'Asus ExpertBook B1 B1400: Piccolo, leggero ed economico
Asus ExpertBook B1 B1500CEAE, i5-1135G7: Intel Core i5-1135G7, 15.60", 1.7 kg
recensione » Recensione dell'Asus ExpertBook B1 B1500: Molte porte sul questo portatile business
Asus ExpertBook B5 Flip B5302FEA: Intel Core i5-1135G7, 13.30", 1.3 kg
recensione » Recensione dell'Asus ExpertBook B5 Flip: Convertibile compatto e resistente ideale per l'università, l'ufficio e il divano
Lenovo Yoga Slim 7 14ITL05 82A300CNGE: Intel Core i5-1135G7, 14.00", 1.4 kg
recensione » Recensione del Lenovo Yoga Slim 7 14ITL05: Notebook da 14 pollici silenzioso e resistente
Dynabook Tecra A40-J-12E: Intel Core i5-1135G7, 14.00", 1.4 kg
recensione » Recensione del Dynabook Tecra A40: Un sussurro in ufficio...
Lenovo ThinkBook Plus Gen2 Core i5: Intel Core i5-1130G7, 13.30", 1.2 kg
recensione » Recensione del Lenovo ThinkBook Plus Gen2: Computer portatile e-ink con touchscreen
LG Gram 17Z90P-G.AA56G: Intel Core i5-1135G7, 17.00", 1.4 kg
recensione » Recensione dell'LG Gram 17Z90P: Leggero flessibile con un display 16:10
Gateway GWTN141-10GR: Intel Core i5-1135G7, 14.10", 1.6 kg
recensione » Recensione del computer portatile Walmart Gateway GWTN141: Potenziale punto di forza il prezzo di 500 dollari
Fujitsu LifeBook U7311 i5: Intel Core i5-1135G7, 13.30", 1.2 kg
recensione » Recensione del computer portatile Fujitsu LifeBook U7311: ci sono molte porte...
HP Pavilion x360 14-dy0157ng: Intel Core i5-1135G7, 14.00", 1.5 kg
recensione » Recensione dell'HP Pavilion x360 14 (2021): Il portatile 2-in-1 supporta l'input tramite penna e Power Delivery
Dell Inspiron 13 5301-0D0XN: Intel Core i5-1135G7, 13.30", 1.1 kg
recensione » Recensione del Dell Inspiron 13 5301: Subnotebook elegante e compatto, ma...
HP Pavilion x360 15-er0155ng: Intel Core i5-1135G7, 15.60", 1.8 kg
recensione » Recensione dell'HP Pavilion x360 15" (2021) 2-in-1: Schermo poco luminoso, prezzo elevato
Samsung Galaxy Book NP750XDA: Intel Core i5-1135G7, 15.60", 1.6 kg
recensione » Recensione del Galaxy Book (2021): un notebook Samsung economico per gli utenti dell'ufficio
Honor MagicBook 15 i5 1135G7: Intel Core i5-1135G7, 15.60", 1.5 kg
recensione » Recensione del computer portatile Honor MagicBook 15 (2021) - Il passaggio a Intel è inutilmente costoso
Acer Spin 3 SP313-51N-56YV: Intel Core i5-1135G7, 13.30", 1.4 kg
recensione » Recensione del convertibile Acer Spin 3 SP313-51N: Un buon tuttofare con dei punti deboli
Samsung Galaxy Book Pro 360 13: Intel Core i5-1135G7, 13.20", 1.1 kg
recensione » Recensione del Samsung Galaxy Book Pro 360 13": La nuova classe business di Samsung per i convertibili
Dell XPS 13 9305 Core i5 FHD: Intel Core i5-1135G7, 13.30", 1.2 kg
recensione » Recensione del computer portatile Dell XPS 13 9305 Core i5 Full HD: Meno display, colori migliori
HP Spectre x360 13-aw2003dx: Intel Core i5-1135G7, 13.30", 1.2 kg
recensione » Recensione del computer portatile Convertible HP Spectre x360 13 11° generazione Intel: La prova che l'OLED non è tutto
Acer TravelMate Spin P4 TMP414RN-51-53J8: Intel Core i5-1135G7, 14.00", 1.4 kg
recensione » Recensione del portatile Acer TravelMate Spin P4 - modello di business con Thunderbolt 4
Lenovo ThinkPad L13 Yoga Gen2-20VK000VGE: Intel Core i5-1135G7, 13.30", 1.5 kg
recensione » Recensione del portatile Lenovo ThinkPad L13 Yoga Gen 2: convertibile business ora con Tiger Lake
Lenovo ThinkBook 15 Gen2 ITL: Intel Core i5-1135G7, 15.60", 1.8 kg
recensione » Recensione del Computer portatile Lenovo ThinkBook 15 Gen2: Laptop economico Tiger Lake
Intel NUC11TNKi5: Intel Core i5-1135G7, 0.5 kg
recensione » Recensione dell'Intel NUC11TNKi5 Pro Mini Tiger Canyon: Il più piccolo Tiger Lake NUC
Lenovo ThinkBook 14 G2 ITL 20VD008WGE: Intel Core i5-1135G7, 14.00", 1.5 kg
recensione » Recensione del Laptop Lenovo ThinkBook 14 Gen 2 Tiger Lake: Computer portatile da ufficio con scarsa autonomia
Schenker VIA 14 Late 2020: Intel Core i5-1135G7, 14.00", 1.1 kg
recensione » Recensione del Laptop Schenker VIA 14: Ultrabook leggero in magnesio con una durata della batteria estremamente lunga
Acer Swift 5 SF514-55T-58DN: Intel Core i5-1135G7, 14.00", 1 kg
recensione » Recensione del portatile Acer Swift 5 SF514-55T: Sottile tuttofare su base EVO
Microsoft Surface Pro 7 Plus: Intel Core i5-1135G7, 12.30", 0.8 kg
recensione » Recensione del Microsoft Surface Pro 7 Plus: Tiger Lake fornisce un aumento delle prestazioni
Acer Aspire 5 A515-56-511A: Intel Core i5-1135G7, 15.60", 1.9 kg
recensione » Recensione del Laptop Acer Aspire 5 A515: Uno sguardo a un portatile Tiger Lake
Lenovo ThinkPad L13 Gen2-20VH0017GE: Intel Core i5-1135G7, 13.30", 1.4 kg
recensione » Recensione del Laptop Lenovo ThinkPad L13 Gen 2: Elegante ultrabook ora con Intel Tiger Lake
GPD Win 3: Intel Core i5-1135G7, 5.50", 0.6 kg
recensione » Recensione del GPD Win 3: Lo switch non ufficiale di Microsoft
Lenovo ThinkBook 13s-ITL-20V90003GE: Intel Core i5-1135G7, 13.30", 1.3 kg
recensione » Recensione del Lenovo ThinkBook 13s: Durata della batteria o prestazioni? Decidi tu.
Dell Inspiron 15 7506 2-in-1 P97F: Intel Core i5-1135G7, 15.60", 1.8 kg
recensione » Recensione del convertibile Dell Inspiron 15 7506 2-in-1: Facile da usare, facile da avere
Lenovo Yoga 9i 14ITL5: Intel Core i5-1135G7, 14.00", 1.4 kg
recensione » Recensione del convertibile Lenovo Yoga 9i 14: Il gemello dello Yoga C940
Lenovo Yoga 7 14ITL5: Intel Core i5-1135G7, 14.00", 1.5 kg
recensione » Recensione del Laptop Lenovo Yoga 7i 14 pollici Tiger Lake: Core i5-1135G7 Debutto
Asus VivoBook 17 X1704VA: Intel Core 5 120U, 17.30", 2.1 kg
Recensioni esterne » Asus VivoBook 17 X1704VA
HP Laptop 14-ep1000: Intel Core 5 120U, 14.00", 1.4 kg
Recensioni esterne » HP Laptop 14-ep1000
Medion Signium 14 S1: Intel Core 5 120U, 14.00", 1 kg
Recensioni esterne » Medion Signium 14 S1
HP Omnibook 5 Flip 14-fp0000TU: Intel Core i5-1334U, 14.00", 1.7 kg
Recensioni esterne » HP Omnibook 5 Flip 14-fp0000TU
Acer Aspire Lite 14 AL14-52M: Intel Core i5-1334U, 14.00", 1.5 kg
Recensioni esterne » Acer Aspire Lite 14 AL14-52M
Acer Aspire Go AG15-51P-56UR: Intel Core i5-1334U, 15.30", 1.7 kg
Recensioni esterne » Acer Aspire Go AG15-51P-56UR
Honor MagicBook X16 Plus 2025: Intel Core 5 220H, 16.00", 1.8 kg
Recensioni esterne » Honor MagicBook X16 Plus 2025
Acer Aspire Lite 15 AL15-72P: Intel Core i5-13500H, 15.60", 1.8 kg
Recensioni esterne » Acer Aspire Lite 15 AL15-72P
Lenovo IP Flex 5 Chromebook Plus 14IAU7, i5-1334U: Intel Core i5-1334U, 14.00", 1.6 kg
Recensioni esterne » Lenovo IP Flex 5 Chromebook Plus 14IAU7, i5-1334U
LG gram Book 15U50T: Intel Core i5-1334U, 15.60", 1.7 kg
Recensioni esterne » LG gram Book 15U50T
Lenovo Thinkpad E14 G5, i5-1335U: Intel Core i5-1335U, 14.00", 1.5 kg
Recensioni esterne » Lenovo Thinkpad E14 G5, i5-1335U
Dell Inspiron 14 7440 2-in-1: Intel Core 5 120U, 14.00", 1.7 kg
Recensioni esterne » Dell Inspiron 14 7440 2-in-1
Dell Inspiron 16 5640: Intel Core i5-1334U, 16.00", 2.1 kg
Recensioni esterne » Dell Inspiron 16 5640
MSI Modern 14 F13MG: Intel Core i5-1335U, 14.00", 1.5 kg
Recensioni esterne » MSI Modern 14 F13MG
Asus Chromebook Plus CX3402CVA : Intel Core i5-1335U, 14.00", 1.5 kg
Recensioni esterne » Asus Chromebook Plus CX3402CVA
Acer TravelMate P2 TMP215-55: Intel Core i5-1334U, 15.60", 1.6 kg
Recensioni esterne » Acer TravelMate P2 TMP215-55
Acer Aspire 5 A514-55, i5-1235U: Intel Core i5-1235U, 14.00", 1.7 kg
Recensioni esterne » Acer Aspire 5 A514-55, i5-1235U
Acer TravelMate P4 TMP414-53-58XQ: Intel Core i5-1335U, 14.00", 1.5 kg
Recensioni esterne » Acer TravelMate P4 TMP414-53-58XQ
Acer Aspire Go AG15-51P: Intel Core i5-1334U, 15.30", 1.7 kg
Recensioni esterne » Acer Aspire Go AG15-51P
Asus ExpertBook B1 B1503CVA: Intel Core i5-1335U, 15.60", 1.7 kg
Recensioni esterne » Asus ExpertBook B1 B1503CVA
MSI Modern 15 F13MG: Intel Core i5-1335U, 15.60", 1.7 kg
Recensioni esterne » MSI Modern 15 F13MG
Infinix Inbook Air Pro Plus: Intel Core i5-1334U, 14.00", 1 kg
Recensioni esterne » Infinix Inbook Air Pro Plus
Lenovo IdeaPad Slim 3 16IRU9: Intel Core 5 120U, 16.00", 1.7 kg
Recensioni esterne » Lenovo IdeaPad Slim 3 16IRU9
Acer Chromebook Plus 515 CBE595: Intel Core 5 120U, 15.60", 1.7 kg
Recensioni esterne » Acer Chromebook Plus 515 CBE595
Dell Latitude 3550: Intel Core i5-1335U, 15.60", 1.8 kg
Recensioni esterne » Dell Latitude 3550
Acer Swift Go 14 SFG14-71: Intel Core i5-1335U, 14.00", 1.3 kg
Recensioni esterne » Acer Swift Go 14 SFG14-71
Acer TravelMate P4 TMP416-51-55KN: Intel Core i5-1240P, 16.00", 1.6 kg
Recensioni esterne » Acer TravelMate P4 TMP416-51-55KN
Acer Aspire Spin 14 ASP14-51: Intel Core 5 120U, 14.00", 1.6 kg
Recensioni esterne » Acer Aspire Spin 14 ASP14-51
Acer Aspire 5 A514-56M, i5-1335U: Intel Core i5-1335U, 14.00", 1.7 kg
Recensioni esterne » Acer Aspire 5 A514-56M, i5-1335U
Acer Chromebook Plus 516 GE CBG516-2H: Intel Core 5 120U, 16.00", 1.7 kg
Recensioni esterne » Acer Chromebook Plus 516 GE CBG516-2H
Asus ExpertBook B1 B1502CVA: Intel Core i5-1335U, 15.60", 1.7 kg
Recensioni esterne » Asus ExpertBook B1 B1502CVA
Medion Akoya E16433: Intel Core i5-1235U, 16.00", 2 kg
Recensioni esterne » Medion Akoya E16433
Acer Aspire 5 A15-51M: Intel Core 5 120U, 15.60", 1.8 kg
Recensioni esterne » Acer Aspire 5 A15-51M
Dell Inspiron 5330, i5-1340P: Intel Core i5-1340P, 13.30", 1.3 kg
Recensioni esterne » Dell Inspiron 5330, i5-1340P
Acer Swift Go 16 SFG16-71, i5-1335U: Intel Core i5-1335U, 16.00", 1.6 kg
Recensioni esterne » Acer Swift Go 16 SFG16-71, i5-1335U
Acer Chromebook Plus 515 CB515-2H, i5-1335U: Intel Core i5-1335U, 15.60", 1.7 kg
Recensioni esterne » Acer Chromebook Plus 515 CB515-2H, i5-1335U
Asus ExpertBook B5 Flip B5402FVA: Intel Core i5-1340P, 14.00", 1.4 kg
Recensioni esterne » Asus ExpertBook B5 Flip B5402FVA
Lenovo IdeaPad Slim 3 15IRU9: Intel Core 5 120U, 15.60", 1.6 kg
Recensioni esterne » Lenovo IdeaPad Slim 3 15IRU9
Lenovo IdeaPad Slim 5 15IRU9: Intel Core 5 120U, 15.30", 1.7 kg
Recensioni esterne » Lenovo IdeaPad Slim 5 15IRU9
Dell Latitude 13 5340: Intel Core i5-1335U, 13.30", 1.2 kg
Recensioni esterne » Dell Latitude 13 5340
Lenovo ThinkPad X1 Yoga G8, i5-1345U: Intel Core i5-1345U, 14.00", 1.4 kg
Recensioni esterne » Lenovo ThinkPad X1 Yoga G8, i5-1345U
Acer TravelMate P6 TMP614-53, i5-1335U: Intel Core i5-1335U, 14.00", 1.1 kg
Recensioni esterne » Acer TravelMate P6 TMP614-53, i5-1335U
Honor MagicBook X 14 Pro 2024, i5-13500H: Intel Core i5-13500H, 14.00", 1.4 kg
Recensioni esterne » Honor MagicBook X 14 Pro 2024, i5-13500H
Asus Vivobook 16 A1605: Intel Core 5 120U, 16.00", 1.9 kg
Recensioni esterne » Asus Vivobook 16 A1605
Lenovo ThinkBook 16 G6 IRL: Intel Core i5-1335U, 16.00", 1.7 kg
Recensioni esterne » Lenovo ThinkBook 16 G6 IRL
Lenovo ThinkPad T16 G2, i5-1335U: Intel Core i5-1335U, 16.00", 1.7 kg
Recensioni esterne » Lenovo ThinkPad T16 G2, i5-1335U
Dell Latitude 7030 Rugged Extreme: Intel Core i5-1240U, 10.10", 1 kg
Recensioni esterne » Dell Latitude 7030 Rugged Extreme
Asus Vivobook 14 X1404ZA, i5-1235U: Intel Core i5-1235U, 14.00", 1.4 kg
Recensioni esterne » Asus Vivobook 14 X1404ZA, i5-1235U
HP 470 G10: Intel Core i5-1335U, 17.30", 2.1 kg
Recensioni esterne » HP 470 G10
Lenovo ThinkPad L13 G4: Intel Core i5-1335U, 13.30", 1.3 kg
Recensioni esterne » Lenovo ThinkPad L13 G4
Asus Vivobook 16X K3604: Intel Core i7-1360P, 16.00", 1.6 kg
Recensioni esterne » Asus Vivobook 16X K3604
HP Pavilion 15-eg3000ng: Intel Core i5-1335U, 15.60", 1.7 kg
Recensioni esterne » HP Pavilion 15-eg3000ng
HP EliteBook 640 G10: Intel Core i5-1335U, 14.00", 1.4 kg
Recensioni esterne » HP EliteBook 640 G10
Acer TravelMate P4 TMP413-51: Intel Core i5-1335U, 13.30", 1.4 kg
Recensioni esterne » Acer TravelMate P4 TMP413-51
HP Pavilion SE 14-ep0000: Intel Core i5-1335U, 14.00", 2.3 kg
Recensioni esterne » HP Pavilion SE 14-ep0000
Getac S410 G5: Intel Core i5-1350P, 14.00", 2.9 kg
Recensioni esterne » Getac S410 G5
HP Envy x360 13-bf0000: Intel Core i5-1230U, 13.30", 1.4 kg
Recensioni esterne » HP Envy x360 13-bf0000
Acer Aspire Lite 15 AL15-51M: Intel Core i5-1155G7, 15.60", 1.6 kg
Recensioni esterne » Acer Aspire Lite 15 AL15-51M
HP 240 G10: Intel Core i5-1335U, 14.00", 1.4 kg
Recensioni esterne » HP 240 G10
Infinix INBook Y2 Plus: Intel Core i5-1155G7, 15.60", 1.8 kg
Recensioni esterne » Infinix INBook Y2 Plus
Dell Latitude 13 7340 i5-1345U: Intel Core i5-1345U, 13.30", 1.1 kg
Recensioni esterne » Dell Latitude 13 7340 i5-1345U
HP EliteBook 650 G10: Intel Core i5-1335U, 15.60", 1.8 kg
Recensioni esterne » HP EliteBook 650 G10
Acer TravelMate P2 TMP216-51: Intel Core i5-1335U, 16.00", 1.9 kg
Recensioni esterne » Acer TravelMate P2 TMP216-51
Lenovo Yoga Pro 7 14IRH G8, i5-13500H: Intel Core i5-13500H, 14.50", 1.5 kg
Recensioni esterne » Lenovo Yoga Pro 7 14IRH G8, i5-13500H
Panasonic Toughbook FZ-40: Intel Core i5-1145G7, 14.00", 3.4 kg
Recensioni esterne » Panasonic Toughbook FZ-40
Lenovo IdeaPad Duet 5 12IRU8: Intel Core i5-1335U, 12.40", 0.7 kg
Recensioni esterne » Lenovo IdeaPad Duet 5 12IRU8
Lenovo Yoga Slim 6 14IRH8: Intel Core i5-13500H, 14.00", 1.4 kg
Recensioni esterne » Lenovo Yoga Slim 6 14IRH8
Xiaomi Redmi Book 16 2024: Intel Core i5-13500H, 16.00", 1.7 kg
Recensioni esterne » Xiaomi Redmi Book 16 2024
Chuwi Corebook X 2023: Intel Core i5-1235U, 14.00", 1.4 kg
Recensioni esterne » Chuwi Corebook X 2023
HP 250 G10: Intel Core i5-1335U, 15.60", 1.5 kg
Recensioni esterne » HP 250 G10
HP Pavilion 15-eg3000: Intel Core i5-1335U, 15.60", 1.7 kg
Recensioni esterne » HP Pavilion 15-eg3000
HP Spectre x360 14-ef2000: Intel Core i5-1335U, 13.50", 1.4 kg
Recensioni esterne » HP Spectre x360 14-ef2000
Asus Vivobook 14 X1404VA: Intel Core i5-1335U, 14.00", 1.4 kg
Recensioni esterne » Asus Vivobook 14 X1404VA
HP Envy Move: Intel Core i5-1335U, 23.80", 4.1 kg
Recensioni esterne » HP Envy Move
Lenovo ThinkPad E16 G1 Core i5-1335U: Intel Core i5-1335U, 16.00", 1.8 kg
Recensioni esterne » Lenovo ThinkPad E16 G1 Core i5-1335U
HP 14-ee0000: Intel Core i5-1335U, 14.00", 1.4 kg
Recensioni esterne » HP 14-ee0000
Asus ExpertBook B5 B5602: Intel Core i5-1240P, 16.00", 1.5 kg
Recensioni esterne » Asus ExpertBook B5 B5602
Lenovo ThinkPad T14 G4 21HD0043GE: Intel Core i5-1335U, 14.00", 1.4 kg
Recensioni esterne » Lenovo ThinkPad T14 G4 21HD0043GE
HP Pavilion Plus 14-eh1000np: Intel Core i5-1340P, 14.00", 1.4 kg
Recensioni esterne » HP Pavilion Plus 14-eh1000np
Dell Vostro 14 3430: Intel Core i5-1335U, 14.00", 1.4 kg
Recensioni esterne » Dell Vostro 14 3430
Dell Inspiron 15 3530: Intel Core i5-1335U, 15.60", 1.7 kg
Recensioni esterne » Dell Inspiron 15 3530
Dell XPS 13 Plus 9320, i5-1340P: Intel Core i5-1340P, 13.40", 1.2 kg
Recensioni esterne » Dell XPS 13 Plus 9320, i5-1340P
Asus Zenbook 14X OLED UX3404VA, i5-13500H: Intel Core i5-13500H, 14.50", 1.6 kg
Recensioni esterne » Asus Zenbook 14X OLED UX3404VA, i5-13500H
Asus VivoBook 15 X1504ZA: Intel Core i5-1235U, 15.60", 1.6 kg
Recensioni esterne » Asus VivoBook 15 X1504ZA
Infinix INBook X3 Slim: Intel Core i5-1235U, 14.20", 1.2 kg
Recensioni esterne » Infinix INBook X3 Slim
HP Pavilion Plus 14-eh1021ns: Intel Core i5-1340P, 14.00", 1.4 kg
Recensioni esterne » HP Pavilion Plus 14-eh1021ns
Asus VivoBook 16 X1605VA: Intel Core i5-1335U, 16.00", 1.9 kg
Recensioni esterne » Asus VivoBook 16 X1605VA
Microsoft Surface Laptop Go 3: Intel Core i5-1235U, 12.40", 1.1 kg
Recensioni esterne » Microsoft Surface Laptop Go 3
Acer Swift Go 14 SFG14-71, i5-1335U: Intel Core i5-1335U, 14.00", 1.3 kg
Recensioni esterne » Acer Swift Go 14 SFG14-71, i5-1335U
Acer Aspire Vero AV15-53P-59MT: Intel Core i5-1335U, 15.60", 1.7 kg
Recensioni esterne » Acer Aspire Vero AV15-53P-59MT
Lenovo ThinkPad X13 Yoga G4 21F20017GE: Intel Core i5-1335U, 13.30", 1.3 kg
Recensioni esterne » Lenovo ThinkPad X13 Yoga G4 21F20017GE
Lenovo Yoga Slim 6 14IAP8, i5-1240P: Intel Core i5-1240P, 14.00", 1.3 kg
Recensioni esterne » Lenovo Yoga Slim 6 14IAP8, i5-1240P
HP Pavilion x360 14-ek0751nd: Intel Core i5-1235U, 14.00", 1.5 kg
Recensioni esterne » HP Pavilion x360 14-ek0751nd
HP Pavilion 15-eg2752nd: Intel Core i5-1235U, 15.60", 1.7 kg
Recensioni esterne » HP Pavilion 15-eg2752nd
HP Envy x360 15-fe0000: Intel Core i5-1335U, 15.60", 1.8 kg
Recensioni esterne » HP Envy x360 15-fe0000
Dell Inspiron 16 7630 2-in-1: Intel Core i5-1335U, 16.00", 2.1 kg
Recensioni esterne » Dell Inspiron 16 7630 2-in-1
Acer Chromebook Spin 714 CP714-2WN: Intel Core i5-1335U, 14.00", 1.4 kg
Recensioni esterne » Acer Chromebook Spin 714 CP714-2WN
Honor MagicBook X 16 Pro 2023: Intel Core i5-13500H, 16.00", 1.8 kg
Recensioni esterne » Honor MagicBook X 16 Pro 2023
Acer Swift Go 14 SFG14-71: Intel Core i5-13500H, 14.00", 1.3 kg
Recensioni esterne » Acer Swift Go 14 SFG14-71
Acer Aspire 5 A515-57-50Y7: Intel Core i5-1235U, 15.60", 1.8 kg
Recensioni esterne » Acer Aspire 5 A515-57-50Y7
HP 15s-fd0082ns: Intel Core i5-1335U, 15.60", 1.6 kg
Recensioni esterne » HP 15s-fd0082ns
HP 15s-fq5110ns: Intel Core i5-1235U, 15.60", 1.7 kg
Recensioni esterne » HP 15s-fq5110ns
Honor MagicBook 14 2023: Intel Core i5-13500H, 14.20", 1.5 kg
Recensioni esterne » Honor MagicBook 14 2023
Huawei MateBook D 14 2023: Intel Core i5-1240P, 14.00", 1.4 kg
Recensioni esterne » Huawei MateBook D 14 2023
HP ProBook 440 G10: Intel Core i5-1335U, 14.00", 1.4 kg
Recensioni esterne » HP ProBook 440 G10
HP ProBook 450 G10: Intel Core i5-1335U, 15.60", 1.8 kg
Recensioni esterne » HP ProBook 450 G10
Lenovo ThinkBook 14s Yoga IRU G3: Intel Core i5-1335U, 14.00", 1.5 kg
Recensioni esterne » Lenovo ThinkBook 14s Yoga IRU G3
Asus ExpertBook B1 B1402CBA: Intel Core i5-1235U, 14.00", 1.5 kg
Recensioni esterne » Asus ExpertBook B1 B1402CBA
LG gram 15Z90R: Intel Core i5-1340P, 15.60", 1.2 kg
Recensioni esterne » LG gram 15Z90R
Asus Vivobook 14X OLED S3405VA: Intel Core i5-13500H, 14.00", 1.4 kg
Recensioni esterne » Asus Vivobook 14X OLED S3405VA
Asus Vivobook 15 X1504VA: Intel Core i5-1335U, 15.60", 1.7 kg
Recensioni esterne » Asus Vivobook 15 X1504VA
Huawei MateBook D 14 2023, 53013PKG: Intel Core i5-1155G7, 14.00", 1.4 kg
Recensioni esterne » Huawei MateBook D 14 2023, 53013PKG
Lenovo IdeaPad Gaming Chromebook 16: Intel Core i5-1235U, 16.00", 1.8 kg
Recensioni esterne » Lenovo IdeaPad Gaming Chromebook 16
Samsung Galaxy Book3 15, Core i5-1335U: Intel Core i5-1335U, 15.60", 1.5 kg
Recensioni esterne » Samsung Galaxy Book3 15, Core i5-1335U
Asus VivoBook 14 F1402ZA, i5-1235U: Intel Core i5-1235U, 14.00", 1.5 kg
Recensioni esterne » Asus VivoBook 14 F1402ZA, i5-1235U
MSI Modern 14 C13M: Intel Core i5-1335U, 14.00", 1.4 kg
Recensioni esterne » MSI Modern 14 C13M
LG Gram SuperSlim 2023, i5-1340P: Intel Core i5-1340P, 15.60", 1 kg
Recensioni esterne » LG Gram SuperSlim 2023, i5-1340P
Dell Vostro 16 5630: Intel Core i5-1340P, 16.00", 1.9 kg
Recensioni esterne » Dell Vostro 16 5630
HP Pavilion 15-eg2000TU: Intel Core i5-1240P, 15.60", 1.7 kg
Recensioni esterne » HP Pavilion 15-eg2000TU
Dell Inspiron 16 5620: Intel Core i5-1235U, 16.00", 1.9 kg
Recensioni esterne » Dell Inspiron 16 5620
Dell Inspiron 14 5410, i5-11300H: Intel Core i5-11300H, 14.00", 1.4 kg
Recensioni esterne » Dell Inspiron 14 5410, i5-11300H
Acer Aspire 3 A315-59, i5-1235U: Intel Core i5-1235U, 15.60", 1.8 kg
Recensioni esterne » Acer Aspire 3 A315-59, i5-1235U
Asus ExpertBook B1 B1502CB, i5-1235U: Intel Core i5-1235U, 15.60", 1.7 kg
Recensioni esterne » Asus ExpertBook B1 B1502CB, i5-1235U
Asus ZenBook S13 OLED UX5304, i5-1335U: Intel Core i5-1335U, 13.30", 1.1 kg
Recensioni esterne » Asus ZenBook S13 OLED UX5304, i5-1335U
Infinix Zero Book: Intel Core i5-12500H, 15.60", 1.8 kg
Recensioni esterne » Infinix Zero Book
Acer Aspire 5 Spin 14: Intel Core i5-1335U, 14.00", 1.6 kg
Recensioni esterne » Acer Aspire 5 Spin 14
HP Pavilion 14-dv2009ns: Intel Core i5-1235U, 14.00", 1.4 kg
Recensioni esterne » HP Pavilion 14-dv2009ns
Asus Vivobook 15 F1605PA: Intel Core i5-11300H, 16.00", 1.9 kg
Recensioni esterne » Asus Vivobook 15 F1605PA
HP Pavilion 14-dv1013ns: Intel Core i5-1155G7, 14.00", 1.4 kg
Recensioni esterne » HP Pavilion 14-dv1013ns
HP Pavilion x360 14-ek0005ns: Intel Core i5-1235U, 14.00", 1.5 kg
Recensioni esterne » HP Pavilion x360 14-ek0005ns
HP 15s-fq5081ns: Intel Core i5-1235U, 15.60", 1.7 kg
Recensioni esterne » HP 15s-fq5081ns
Asus Vivobook 15 X1505ZA: Intel Core i5-1235U, 15.60", 1.7 kg
Recensioni esterne » Asus Vivobook 15 X1505ZA
Asus VivoBook 16X X1605ZA: Intel Core i5-1235U, 16.00", 1.9 kg
Recensioni esterne » Asus VivoBook 16X X1605ZA
Dell Inspiron 14 5430: Intel Core i5-1335U, 14.00", 1.7 kg
Recensioni esterne » Dell Inspiron 14 5430
Dell Inspiron 15 3520: Intel Core i5-1235U, 15.60", 1.9 kg
Recensioni esterne » Dell Inspiron 15 3520
Lenovo IdeaPad Flex 5 14IRU8: Intel Core i5-1335U, 14.00", 1.6 kg
Recensioni esterne » Lenovo IdeaPad Flex 5 14IRU8
HP Pavilion x360 14-ek1000: Intel Core i5-1335U, 14.00", 1.5 kg
Recensioni esterne » HP Pavilion x360 14-ek1000
Wortmann Terra Mobile 1470U: Intel Core i5-1235U, 14.00", 1.1 kg
Recensioni esterne » Wortmann Terra Mobile 1470U
Asus Zenbook 14 Flip UP3404VA: Intel Core i5-1340P, 14.00", 1.5 kg
Recensioni esterne » Asus Zenbook 14 Flip UP3404VA
Acer Aspire 5 A515-58: Intel Core i5-1335U, 15.60", 1.8 kg
Recensioni esterne » Acer Aspire 5 A515-58
Samsung Galaxy Book3 360 13, i5-1340P: Intel Core i5-1340P, 13.30", 1.2 kg
Recensioni esterne » Samsung Galaxy Book3 360 13, i5-1340P
HP 15s-fq5075ns: Intel Core i5-1235U, 15.60", 1.7 kg
Recensioni esterne » HP 15s-fq5075ns
Asus ZenBook Flip 14 UP5401EA, i5-1135G7: Intel Core i5-1135G7, 14.00", 1.4 kg
Recensioni esterne » Asus ZenBook Flip 14 UP5401EA, i5-1135G7
HP Pavilion Plus 14-eh0000ns: Intel Core i5-1240P, 14.00", 1.4 kg
Recensioni esterne » HP Pavilion Plus 14-eh0000ns
Infinix INBook X2, i5-1155G7: Intel Core i5-1155G7, 14.00", 1.2 kg
Recensioni esterne » Infinix INBook X2, i5-1155G7
Dell Vostro 3520, i5-1235U: Intel Core i5-1235U, 15.60", 1.7 kg
Recensioni esterne » Dell Vostro 3520, i5-1235U
Asus Vivobook 15 A1505VA: Intel Core i5-13500H, 15.60", 1.7 kg
Recensioni esterne » Asus Vivobook 15 A1505VA
Asus Zenbook 14 UX3402VA: Intel Core i5-1340P, 14.00", 1.4 kg
Recensioni esterne » Asus Zenbook 14 UX3402VA
Asus Vivobook S 14 Flip TP3402VA: Intel Core i5-13500H, 14.00", 1.5 kg
Recensioni esterne » Asus Vivobook S 14 Flip TP3402VA
Asus Chromebook Vibe CX3401 Flip: Intel Core i5-1235U, 14.00", 1.8 kg
Recensioni esterne » Asus Chromebook Vibe CX3401 Flip
HP 15s-fq5089ns: Intel Core i5-1235U, 15.60", 1.7 kg
Recensioni esterne » HP 15s-fq5089ns
HP 15s-fq4008ns: Intel Core i5-1155G7, 15.60", 1.7 kg
Recensioni esterne » HP 15s-fq4008ns
Acer Aspire 3 A315-59-58K8: Intel Core i5-1235U, 15.60", 1.8 kg
Recensioni esterne » Acer Aspire 3 A315-59-58K8
Samsung Galaxy Book3 360 15, i5-1340P: Intel Core i5-1340P, 15.60", 1.5 kg
Recensioni esterne » Samsung Galaxy Book3 360 15, i5-1340P
Lenovo ThinkPad T14s G3 21BR00CDGE: Intel Core i5-1235U, 14.00", 1.3 kg
Recensioni esterne » Lenovo ThinkPad T14s G3 21BR00CDGE
Lenovo ThinkPad X13 G3 21BN0046GE: Intel Core i5-1235U, 13.30", 1.3 kg
Recensioni esterne » Lenovo ThinkPad X13 G3 21BN0046GE
HP EliteBook x360 830 G9, i5-1235U: Intel Core i5-1235U, 13.30", 1.3 kg
Recensioni esterne » HP EliteBook x360 830 G9, i5-1235U
Lenovo IdeaPad Duet 5 12IAU7, i5-1235U: Intel Core i5-1235U, 12.40", 0.8 kg
Recensioni esterne » Lenovo IdeaPad Duet 5 12IAU7, i5-1235U
Lenovo IdeaPad 3 15ITL6, i5-1155G7: Intel Core i5-1155G7, 15.60", 1.7 kg
Recensioni esterne » Lenovo IdeaPad 3 15ITL6, i5-1155G7
Honor MagicBook X 15 2022, i5-1135G7: Intel Core i5-1135G7, 15.60", 1.6 kg
Recensioni esterne » Honor MagicBook X 15 2022, i5-1135G7
Lenovo ThinkBook 14 G4 IAP, i5-1235U: Intel Core i5-1235U, 14.00", 1.4 kg
Recensioni esterne » Lenovo ThinkBook 14 G4 IAP, i5-1235U
Lenovo Thinkpad X1 Carbon G10, i5-1235U: Intel Core i5-1235U, 14.00", 1.1 kg
Recensioni esterne » Lenovo Thinkpad X1 Carbon G10, i5-1235U
Acer Extensa 15 EX215-54-57VY: Intel Core i5-1135G7, 15.60", 1.9 kg
Recensioni esterne » Acer Extensa 15 EX215-54-57VY
Asus VivoBook 15 F1500EA, i5-1135G7: Intel Core i5-1135G7, 15.60", 1.8 kg
Recensioni esterne » Asus VivoBook 15 F1500EA, i5-1135G7
Acer Spin 3 SP314-55N-55RR: Intel Core i5-1235U, 14.00", 1.5 kg
Recensioni esterne » Acer Spin 3 SP314-55N-55RR
Asus VivoBook 15 F1502ZA, i5-1235U: Intel Core i5-1235U, 15.60", 1.7 kg
Recensioni esterne » Asus VivoBook 15 F1502ZA, i5-1235U
HP 15s-fq5022ns: Intel Core i5-1235U, 15.60", 1.7 kg
Recensioni esterne » HP 15s-fq5022ns
HP 15s-fq5071ns: Intel Core i5-1235U, 15.60", 1.7 kg
Recensioni esterne » HP 15s-fq5071ns
HP Dragonfly Pro Chromebook: Intel Core i5-1235U, 14.00", 1.5 kg
Recensioni esterne » HP Dragonfly Pro Chromebook
Lenovo ThinkBook 14 G4, i5-1240P: Intel Core i5-1240P, 14.00", 1.4 kg
Recensioni esterne » Lenovo ThinkBook 14 G4, i5-1240P
Dell Latitude 7230 Rugged Extreme: Intel Core i5-1240U, 12.00", 1.6 kg
Recensioni esterne » Dell Latitude 7230 Rugged Extreme
Samsung Galaxy Book3 Pro 16: Intel Core i5-1340P, 16.00", 1.6 kg
Recensioni esterne » Samsung Galaxy Book3 Pro 16, Core i5-1340P
Samsung Galaxy Book3 Pro 360 16, i5-1340P: Intel Core i5-1340P, 16.00", 1.7 kg
Recensioni esterne » Samsung Galaxy Book3 Pro 360 16, i5-1340P
Asus Chromebook Flip CX5601, i5-1235U: Intel Core i5-1235U, 16.00", 2.2 kg
Recensioni esterne » Asus Chromebook Flip CX5601, i5-1235U
Acer Chromebook Spin 514 CP514-2H-53K9: Intel Core i5-1130G7, 14.00", 1.4 kg
Recensioni esterne » Acer Chromebook Spin 514 CP514-2H-53K9
HP Spectre x360 14, i5-1235U: Intel Core i5-1235U, 13.50", 1.4 kg
Recensioni esterne » HP Spectre x360 14, i5-1235U
Asus Zenbook 14 Q409ZA, i5-1240P: Intel Core i5-1240P, 14.00", 1.4 kg
Recensioni esterne » Asus Zenbook 14 Q409ZA, i5-1240P
Asus VivoBook S 14 Flip TP3402ZA: Intel Core i5-12500H, 14.00", 1.5 kg
Recensioni esterne » Asus VivoBook S 14 Flip TP3402ZA
Asus Vivobook 14 F1400EA-EB1837W: Intel Core i5-1135G7, 14.00", 1.6 kg
Recensioni esterne » Asus Vivobook 14 F1400EA-EB1837W
HP Envy x360 15-ew0004ns: Intel Core i5-1240P, 15.60", 1.8 kg
Recensioni esterne » HP Envy x360 15-ew0004ns
Microsoft Surface Laptop 5 13, i5-1245U: Intel Core i5-1245U, 13.50", 1.3 kg
Recensioni esterne » Microsoft Surface Laptop 5 13, i5-1245U
Microsoft Surface Pro 9, i5-1245U: Intel Core i5-1245U, 13.00", 0.9 kg
Recensioni esterne » Microsoft Surface Pro 9, i5-1245U
Samsung Galaxy Book3 Pro 14, i5-1340P: Intel Core i5-1340P, 14.00", 1.2 kg
Recensioni esterne » Samsung Galaxy Book3 Pro 14, i5-1340P
Lenovo ThinkBook Plus Gen3, i5-12500H: Intel Core i5-12500H, 17.30", 2 kg
Recensioni esterne » Lenovo ThinkBook Plus Gen3, i5-12500H
Dell Latitude 14 9430, i5-1245U: Intel Core i5-1245U, 14.00", 1.3 kg
Recensioni esterne » Dell Latitude 14 9430, i5-1245U
Lenovo ThinkBook 14s Yoga G2 IAP 21DM0005GE: Intel Core i5-1235U, 14.00", 1.5 kg
Recensioni esterne » Lenovo ThinkBook 14s Yoga G2 IAP 21DM0005GE
HP ProBook 440 G9, i5-1235U: Intel Core i5-1235U, 14.00", 1.4 kg
Recensioni esterne » HP ProBook 440 G9, i5-1235U
Lenovo ThinkPad L15 G3, i5-1235: Intel Core i5-1235U, 15.60", 1.8 kg
Recensioni esterne » Lenovo ThinkPad L15 G3, i5-1235
Fujitsu LifeBook U7512, i5-1235U: Intel Core i5-1235U, 15.60", 1.4 kg
Recensioni esterne » Fujitsu LifeBook U7512, i5-1235U
Asus Vivobook 17 X1702, i5-1235U: Intel Core i5-1235U, 17.30", 2.1 kg
Recensioni esterne » Asus Vivobook 17 X1702, i5-1235U
Acer TravelMate Spin P4 TMP414RN-52-595S: Intel Core i5-1240P, 14.00", 1.5 kg
Recensioni esterne » Acer TravelMate Spin P4 TMP414RN-52-595S
Dynabook Portégé X40L-K-10S: Intel Core i5-1240P, 14.00", 1.1 kg
Recensioni esterne » Dynabook Portégé X40L-K-10S
Microsoft Surface Laptop 5 13, i5-1235U: Intel Core i5-1235U, 13.50", 1.3 kg
Recensioni esterne » Microsoft Surface Laptop 5 13, i5-1235U
Lenovo Yoga Slim 7 Pro 14IAP7, i5-1240P: Intel Core i5-1240P, 14.00", 1.3 kg
Recensioni esterne » Lenovo Yoga Slim 7 Pro 14IAP7, i5-1240P
Asus Vivobook 14 A1402, i5-1235U: Intel Core i5-1235U, 14.00", 1.5 kg
Recensioni esterne » Asus Vivobook 14 A1402, i5-1235U
Dell Vostro 15 3500, i5-1135G7 iGPU: Intel Core i5-1135G7, 15.60", 1.8 kg
Recensioni esterne » Dell Vostro 15 3500, i5-1135G7 iGPU
Lenovo IdeaPad 3 15IAU7-82RK0092GE: Intel Core i5-1235U, 15.60", 1.6 kg
Recensioni esterne » Lenovo IdeaPad 3 15IAU7-82RK0092GE
Acer Chromebook Vero 514 CBV514-1H, i5-1235U: Intel Core i5-1235U, 14.00", 1.5 kg
Recensioni esterne » Acer Chromebook Vero 514 CBV514-1H, i5-1235U
Honor Magicbook X 16, i5-1235U: Intel Core i5-1235U, 16.00", 1.8 kg
Recensioni esterne » Honor Magicbook X 16, i5-1235U
HP Pavilion 14-dv2014TU: Intel Core i5-1235U, 14.00", 1.4 kg
Recensioni esterne » HP Pavilion 14-dv2014TU
Asus Vivobook 14 X1405ZA, i5-1235U: Intel Core i5-1235U, 14.00", 1.6 kg
Recensioni esterne » Asus Vivobook 14 X1405ZA, i5-1235U
HP 15s-fq5034ns: Intel Core i5-1235U, 15.60", 1.7 kg
Recensioni esterne » HP 15s-fq5034ns
Asus Vivobook 14 F1400EA-EB1517W: Intel Core i5-1135G7, 14.00", 1.6 kg
Recensioni esterne » Asus Vivobook 14 F1400EA-EB1517W
HP 470 G9, i5-1235U: Intel Core i5-1235U, 17.30", 2.1 kg
Recensioni esterne » HP 470 G9, i5-1235U
Dell Latitude 15 3530, i5-1235U: Intel Core i5-1235U, 15.60", 1.8 kg
Recensioni esterne » Dell Latitude 15 3530, i5-1235U
Acer TravelMate P2 TMP215-54-598S: Intel Core i5-1235U, 15.60", 1.9 kg
Recensioni esterne » Acer TravelMate P2 TMP215-54-598S
HP EliteBook 650 G9, i5-1235U: Intel Core i5-1235U, 15.60", 1.7 kg
Recensioni esterne » HP EliteBook 650 G9, i5-1235U
Lenovo ThinkBook 15 G4 IAP, i5-1235U: Intel Core i5-1235U, 15.60", 1.7 kg
Recensioni esterne » Lenovo ThinkBook 15 G4 IAP, i5-1235U
Lenovo Ideapad 5 Pro 14IAP7, i5-1240P: Intel Core i5-1240P, 14.00", 1.4 kg
Recensioni esterne » Lenovo Ideapad 5 Pro 14IAP7, i5-1240P
Asus Vivobook S 15 M3502, i5-12500H: Intel Core i5-12500H, 15.60", 1.8 kg
Recensioni esterne » Asus Vivobook S 15 M3502, i5-12500H
Lenovo ThinkBook 13s G4 IAP, i5-1240P: Intel Core i5-1240P, 13.30", 1.2 kg
Recensioni esterne » Lenovo ThinkBook 13s G4 IAP, i5-1240P
Dell XPS 13 9315 2-in-1 Core i5-1230U: Intel Core i5-1230U, 13.00", 0.8 kg
Recensioni esterne » Dell XPS 13 9315 2-in-1 Core i5-1230U
Asus Vivobook Flip 14 TP470EA-EC384W: Intel Core i5-1135G7, 14.00", 1.5 kg
Recensioni esterne » Asus Vivobook Flip 14 TP470EA-EC384W
Acer TravelMate P2 TMP214-53-53VY: Intel Core i5-1135G7, 14.00", 1.6 kg
Recensioni esterne » Acer TravelMate P2 TMP214-53-53VY
Lenovo ThinkPad X13 G3, i5-1240P: Intel Core i5-1240P, 13.30", 1.3 kg
Recensioni esterne » Lenovo ThinkPad X13 G3, i5-1240P
HP Pavilion Plus 14-eh0021TU: Intel Core i5-12500H, 14.00", 1.4 kg
Recensioni esterne » HP Pavilion Plus 14-eh0021TU
HP EliteBook 640 G9, i5-1235U: Intel Core i5-1235U, 14.00", 1.4 kg
Recensioni esterne » HP EliteBook 640 G9, i5-1235U
HP EliteBook 840 G9, i5-1235U: Intel Core i5-1235U, 14.00", 1.4 kg
Recensioni esterne » HP EliteBook 840 G9, i5-1235U
Lenovo ThinkPad E14 G4, i5-1235U: Intel Core i5-1235U, 14.00", 1.6 kg
Recensioni esterne » Lenovo ThinkPad E14 G4, i5-1235U
Lenovo ThinkPad C14 Chromebook, i5-1245U: Intel Core i5-1245U, 14.00", 1.7 kg
Recensioni esterne » Lenovo ThinkPad C14 Chromebook, i5-1245U
Acer Chromebook 516 GE CBG516-1H-53SL: Intel Core i5-1240P, 16.00", 1.7 kg
Recensioni esterne » Acer Chromebook 516 GE CBG516-1H-53SL
Asus Vivobook S 15 K3502, i5-12500H: Intel Core i5-12500H, 15.60", 1.8 kg
Recensioni esterne » Asus Vivobook S 15 K3502, i5-12500H
Fujitsu CH 13 4ZR1C22927: Intel Core i5-1135G7, 13.30", 1 kg
Recensioni esterne » Fujitsu CH 13 4ZR1C22927
Lenovo IdeaPad Flex 5 14IAU7-82R7007XGE: Intel Core i5-1235U, 14.00", 1.6 kg
Recensioni esterne » Lenovo IdeaPad Flex 5 14IAU7-82R7007XGE
Dell Latitude 14 7430, i5-1235U: Intel Core i5-1235U, 14.00", 1.2 kg
Recensioni esterne » Dell Latitude 14 7430, i5-1235U
Asus ExpertBook P1 P1512CEA-EJ0213: Intel Core i5-1135G7, 15.60", 1.8 kg
Recensioni esterne » Asus ExpertBook P1 P1512CEA-EJ0213
Asus Vivobook 14 F1400EA-EB1648 : Intel Core i5-1135G7, 14.00", 1.6 kg
Recensioni esterne » Asus Vivobook 14 F1400EA-EB1648
Samsung Galaxy Book2 15, i5-1235U: Intel Core i5-1235U, 15.60", 1.6 kg
Recensioni esterne » Samsung Galaxy Book2 15, i5-1235U
Asus VivoBook 15 F515EA-EJ2079W: Intel Core i5-1135G7, 15.60", 1.8 kg
Recensioni esterne » Asus VivoBook 15 F515EA-EJ2079W
Monster Huma H5 V3.1: Intel Core i5-1135G7, 15.60", 1.7 kg
Recensioni esterne » Monster Huma H5 V3.1
Fujitsu LifeBook U7312, i5-1235U: Intel Core i5-1235U, 13.30", 1 kg
Recensioni esterne » Fujitsu LifeBook U7312, i5-1235U
Dell Inspiron 14 5420, i5-1235U: Intel Core i5-1235U, 14.00", 1.6 kg
Recensioni esterne » Dell Inspiron 14 5420, i5-1235U
Asus ExpertBook B1 B1400CBA, i5-1235U: Intel Core i5-1235U, 14.00", 1.5 kg
Recensioni esterne » Asus ExpertBook B1 B1400CBA, i5-1235U
Asus ExpertBook B5 B5402CB, i5-1240P: Intel Core i5-1240P, 14.00", 1.3 kg
Recensioni esterne » Asus ExpertBook B5 B5402CB, i5-1240P
HP Probook 450 G9-6A179EA: Intel Core i5-1235U, 15.60", 1.7 kg
Recensioni esterne » HP Probook 450 G9-6A179EA
Dell Vostro 16 5620, i5-1240P: Intel Core i5-1240P, 16.00", 2 kg
Recensioni esterne » Dell Vostro 16 5620, i5-1240P
Asus Vivobook 14X A1403, i5-12500H: Intel Core i5-12500H, 14.00", 1.6 kg
Recensioni esterne » Asus Vivobook 14X A1403, i5-12500H
Asus ExpertBook B5 Flip B5402F, i5-1240P: Intel Core i5-1240P, 14.00", 1.3 kg
Recensioni esterne » Asus ExpertBook B5 Flip B5402F, i5-1240P
Microsoft Surface Pro 9, i5-1235U: Intel Core i5-1235U, 13.00", 0.9 kg
Recensioni esterne » Microsoft Surface Pro 9, i5-1235U
Lenovo IdeaPad 5 15IAL7-82SF000RGE: Intel Core i5-1235U, 15.60", 1.9 kg
Recensioni esterne » Lenovo IdeaPad 5 15IAL7-82SF000RGE
LG Gram 14Z90Q: Intel Core i5-1240P, 14.00", 1 kg
Recensioni esterne » LG Gram 14Z90Q
Dell XPS 13 9315, i5-1230U: Intel Core i5-1230U, 13.40", 1.2 kg
Recensioni esterne » Dell XPS 13 9315, i5-1230U
Dynabook Portégé X30L-K-139: Intel Core i5-1240P, 13.30", 0.9 kg
Recensioni esterne » Dynabook Portégé X30L-K-139
Huawei Matebook D 15 2022, i5-1155G7: Intel Core i5-1155G7, 15.60", 1.6 kg
Recensioni esterne » Huawei Matebook D 15 2022, i5-1155G7
Asus VivoBook 15 K513EA-L12891W: Intel Core i5-1135G7, 15.60", 1.8 kg
Recensioni esterne » Asus VivoBook 15 K513EA-L12891W
Asus Vivobook 14 K413EA-EB1156T: Intel Core i5-1135G7, 14.00", 1.4 kg
Recensioni esterne » Asus Vivobook 14 K413EA-EB1156T
HP 14s-dq4000ns: Intel Core i5-1155G7, 14.00", 1.5 kg
Recensioni esterne » HP 14s-dq4000ns
Asus Expertbook B3 Flip B3402, i5-1235U: Intel Core i5-1235U, 14.00", 1.6 kg
Recensioni esterne » Asus Expertbook B3 Flip B3402, i5-1235U
Acer Aspire 5 A515-57-56UV: Intel Core i5-1235U, 15.60", 1.8 kg
Recensioni esterne » Acer Aspire 5 A515-57-56UV
Asus Vivobook S 14 K3402ZA, i5-12500H: Intel Core i5-12500H, 14.00", 1.5 kg
Recensioni esterne » Asus Vivobook S 14 K3402ZA, i5-12500H
Gateway GWTC51427-BK: Intel Core i5-1235U, 14.10", 1.7 kg
Recensioni esterne » Gateway GWTC51427-BK
Lenovo ThinkPad E14 Gen2-20TA00HKSP: Intel Core i5-1135G7, 14.00", 1.6 kg
Recensioni esterne » Lenovo ThinkPad E14 Gen2-20TA00HKSP
Acer Swift 3 SF314-71-56U3: Intel Core i5-12500H, 14.00", 1.4 kg
Recensioni esterne » Acer Swift 3 SF314-71-56U3
Acer Aspire 3 A315-58-54JJ: Intel Core i5-1135G7, 15.60", 1.7 kg
Recensioni esterne » Acer Aspire 3 A315-58-54JJ
HP 15s-fq2708nd: Intel Core i5-1135G7, 15.60", 1.7 kg
Recensioni esterne » HP 15s-fq2708nd
Acer Aspire 3 A315-58-57F6: Intel Core i5-1135G7, 15.60", 1.7 kg
Recensioni esterne » Acer Aspire 3 A315-58-57F6
Asus VivoBook 14 X415EA-EB1703W: Intel Core i5-1135G7, 14.10", 1.6 kg
Recensioni esterne » Asus VivoBook 14 X415EA-EB1703W
HP 15s-fq5078TU: Intel Core i5-1235U, 15.60", 1.7 kg
Recensioni esterne » HP 15s-fq5078TU
Asus ZenBook Flip 14 UP5401ZA, i5-12500H: Intel Core i5-12500H, 14.00", 1.4 kg
Recensioni esterne » Asus ZenBook Flip 14 UP5401ZA, i5-12500H
Intel NUC M15 LAPBC510: Intel Core i5-1135G7, 15.60", 1.7 kg
Recensioni esterne » Intel NUC M15 LAPBC510
Huawei MateBook 14 (2024): Intel Core i5-1240P, 14.00", 1.4 kg
Recensioni esterne » Huawei MateBook 14 2022, i5-1240P
Asus VivoBook 15X A1503, i5-12500H: Intel Core i5-12500H, 15.60", 1.7 kg
Recensioni esterne » Asus VivoBook 15X A1503, i5-12500H
Asus VivoBook S 14 S3402, i7-12500H: Intel Core i5-12500H, 14.00", 1.5 kg
Recensioni esterne » Asus VivoBook S 14 S3402, i7-12500H
Dell Inspiron 16 7620 2-in-1 K7JT6: Intel Core i5-1235U, 16.00", 2.2 kg
Recensioni esterne » Dell Inspiron 16 7620 2-in-1 K7JT6
VAIO FE 14.1 VWNC51429-SL: Intel Core i5-1235U, 14.10", 1.6 kg
Recensioni esterne » VAIO FE 14.1 VWNC51429-SL
Lenovo ThinkPad L14 G3 21C1003AGE: Intel Core i5-1235U, 14.00", 1.4 kg
Recensioni esterne » Lenovo ThinkPad L14 G3 21C1003AGE
Lenovo IdeaPad 5 Pro 16IAH7-82SK0035GE: Intel Core i5-12500H, 16.00", 2 kg
Recensioni esterne » Lenovo IdeaPad 5 Pro 16IAH7-82SK0035GE
Lenovo ThinkPad L13 Yoga G3 21B50043GE: Intel Core i5-1235U, 13.30", 1.3 kg
Recensioni esterne » Lenovo ThinkPad L13 Yoga G3 21B50043GE
Lenovo ThinkPad T16 G1 21BV006DGE: Intel Core i5-1240P, 16.00", 1.7 kg
Recensioni esterne » Lenovo ThinkPad T16 G1 21BV006DGE
Acer Aspire Vero AV14-51-59UW: Intel Core i5-1235U, 14.00", 1.5 kg
Recensioni esterne » Acer Aspire Vero AV14-51-59UW
Dell Latitude 14 5430-68TVC: Intel Core i5-1245U, 14.00", 1.4 kg
Recensioni esterne » Dell Latitude 14 5430-68TVC
Dell Latitude 15 7530, i5-1245U: Intel Core i5-1245U, 15.60", 1.5 kg
Recensioni esterne » Dell Latitude 15 7530, i5-1245U
MSI Modern 15 B12M, i5-1235U: Intel Core i5-1235U, 15.60", 1.8 kg
Recensioni esterne » MSI Modern 15 B12M, i5-1235U
MSI Prestige 14 Evo A12M-229: Intel Core i5-1240P, 14.00", 1.3 kg
Recensioni esterne » MSI Prestige 14 Evo A12M-229
Lenovo Yoga 7 14IAL7-82QE003GGE: Intel Core i5-1240P, 14.00", 1.4 kg
Recensioni esterne » Lenovo Yoga 7 14IAL7-82QE003GGE
HP Elite Dragonfly Chromebook, i5-1245U: Intel Core i5-1245U, 13.50", 1.3 kg
Recensioni esterne » HP Elite Dragonfly Chromebook, i5-1245U
HP 17-cn1006ns: Intel Core i5-1155G7, 17.30", 2.1 kg
Recensioni esterne » HP 17-cn1006ns
Acer Aspire 5 A515-57-58LU: Intel Core i5-1235U, 15.60", 1.8 kg
Recensioni esterne » Acer Aspire 5 A515-57-58LU
Samsung Galaxy Book2 Pro 360 13, i5-1235U: Intel Core i5-1235U, 13.30", 1.2 kg
Recensioni esterne » Samsung Galaxy Book2 Pro 360 13, i5-1235U
Asus ZenBook 14X UX5401ZA-KP005W: Intel Core i5-12500H, 14.00", 1.4 kg
Recensioni esterne » Asus ZenBook 14X UX5401ZA-KP005W
MSI Summit E14 Evo A12M-051: Intel Core i5-1240P, 14.00", 1.6 kg
Recensioni esterne » MSI Summit E14 Evo A12M-051
Asus Vivobook 14 F415EA-EK1255W: Intel Core i5-1135G7, 14.00", 1.6 kg
Recensioni esterne » Asus Vivobook 14 F415EA-EK1255W
HP 17-cn1012ns: Intel Core i5-1155G7, 17.30", 2.1 kg
Recensioni esterne » HP 17-cn1012ns
HP Envy 13-ba1009ns: Intel Core i5-1135G7, 13.30", 1.3 kg
Recensioni esterne » HP Envy 13-ba1009ns
Asus ExpertBook B2 Flip B2502FBA-N80113X: Intel Core i5-1240P, 14.00", 1.6 kg
Recensioni esterne » Asus ExpertBook B2 Flip B2502FBA-N80113X
Acer Aspire Vero AV15-51-522W: Intel Core i5-1155G7, 15.60", 1.8 kg
Recensioni esterne » Acer Aspire Vero AV15-51-522W
MSI Modern 14 C12M, i5-1235U: Intel Core i5-1235U, 14.00", 1.4 kg
Recensioni esterne » MSI Modern 14 C12M, i5-1235U
HP 15s-fq4085ns: Intel Core i5-1155G7, 15.60", 1.7 kg
Recensioni esterne » HP 15s-fq4085ns
Lenovo IdeaPad 5 Pro 14ITL6: Intel Core i5-1135G7, 14.00", 1.4 kg
Recensioni esterne » Lenovo IdeaPad 5 Pro 14ITL6
Acer Chromebook Spin 714 CP714-1WN-53M9: Intel Core i5-1235U, 14.00", 1.4 kg
Recensioni esterne » Acer Chromebook Spin 714 CP714-1WN-53M9
Asus VivoBook 15 X515EA-BQ943T: Intel Core i5-1135G7, 15.60", 1.8 kg
Recensioni esterne » Asus VivoBook 15 X515EA-BQ943T
Acer Chromebook 515 CB515-1W-50FL: Intel Core i5-1145G7, 15.60", 1.7 kg
Recensioni esterne » Acer Chromebook 515 CB515-1W-50FL
LG Gram 17 (2022): Intel Core i5-1240P, 17.00", 1.4 kg
Recensioni esterne » LG Gram 17 (2022)
Lenovo IdeaPad 3 14ITL6-9QSP: Intel Core i5-1135G7, 14.10", 1.4 kg
Recensioni esterne » Lenovo IdeaPad 3 14ITL6-9QSP
Lenovo V14 G2 ITL-82KA001KSP: Intel Core i5-1135G7, 14.00", 1.6 kg
Recensioni esterne » Lenovo V14 G2 ITL-82KA001KSP
MSI Modern 14 B11MOU-1060XES: Intel Core i5-1155G7, 14.00", 1.3 kg
Recensioni esterne » MSI Modern 14 B11MOU-1060XES
Asus VivoBook 14 K413EA-EB362T: Intel Core i5-1135G7, 14.00", 1.4 kg
Recensioni esterne » Asus VivoBook 14 K413EA-EB362T
Asus Zenbook 14 UX3402ZA, i5-1240P: Intel Core i5-1240P, 14.00", 1.4 kg
Recensioni esterne » Asus Zenbook 14 UX3402ZA, i5-1240P
MSI Modern 15 A11MU-682XE: Intel Core i5-1155G7, 15.60", 1.6 kg
Recensioni esterne » MSI Modern 15 A11MU-682XE
HP Pavilion x360 14-dy0018ns: Intel Core i5-1135G7, 14.00", 1.8 kg
Recensioni esterne » HP Pavilion x360 14-dy0018ns
HP 15s-fq4040ns: Intel Core i5-1155G7, 15.60", 1.7 kg
Recensioni esterne » HP 15s-fq4040ns
Dell Latitude 15 5530-48J03: Intel Core i5-1235U, 15.60", 1.6 kg
Recensioni esterne » Dell Latitude 15 5530-48J03
Samsung Galaxy Book2 Pro 15, i5-1240P: Intel Core i5-1240P, 15.60", 1.1 kg
Recensioni esterne » Samsung Galaxy Book2 Pro 15, i5-1240P
Acer Swift 3 SF314-512-50F6: Intel Core i5-1240P, 14.00", 1.3 kg
Recensioni esterne » Acer Swift 3 SF314-512-50F6
HP Envy x360 13-bd0018na: Intel Core i5-1135G7, 13.30", 1.3 kg
Recensioni esterne » HP Envy x360 13-bd0018na
Dell XPS 13 Plus 9320 i5-1240p: Intel Core i5-1240P, 13.40", 1.2 kg
Recensioni esterne » Dell XPS 13 Plus 9320 i5-1240p
Lenovo Yoga Slim 7 Pro 14IHU5-82NH0048GE: Intel Core i5-11300H, 14.00", 1.4 kg
Recensioni esterne » Lenovo Yoga Slim 7 Pro 14IHU5-82NH0048GE
Asus VivoBook 15 X1502ZA-BQ165W: Intel Core i5-1240P, 15.60", 1.7 kg
Recensioni esterne » Asus VivoBook 15 X1502ZA-BQ165W
LG Gram 14T90P: Intel Core i5-1135G7, 14.00", 1.2 kg
Recensioni esterne » LG Gram 14T90P
Microsoft Surface Laptop Go 2 Core i5: Intel Core i5-1135G7, 12.40", 1.1 kg
Recensioni esterne » Microsoft Surface Laptop Go 2 Core i5
Acer Swift 3 SF316-51-57D7: Intel Core i5-11300H, 16.10", 1.8 kg
Recensioni esterne » Acer Swift 3 SF316-51-57D7
HP Pavilion 14-dv1000ns: Intel Core i5-1155G7, 14.00", 1.4 kg
Recensioni esterne » HP Pavilion 14-dv1000ns
Microsoft Surface Laptop Studio i5-11300H: Intel Core i5-11300H, 14.40", 1.7 kg
Recensioni esterne » Microsoft Surface Laptop Studio i5-11300H
Dynabook Satellite Pro C40-J-11I: Intel Core i5-1135G7, 14.00", 1.6 kg
Recensioni esterne » Dynabook Satellite Pro C40-J-11I
Asus Chromebook Flip CX5 CX5400FMA-AI0077: Intel Core i5-1130G7, 14.00", 1.4 kg
Recensioni esterne » Asus Chromebook Flip CX5 CX5400FMA-AI0077
Acer TravelMate P4 TMP414-51-59MR: Intel Core i5-1135G7, 14.00", 1.4 kg
Recensioni esterne » Acer TravelMate P4 TMP414-51-59MR
Xiaomi Mi Notebook Ultra 2021 i5: Intel Core i5-11300H, 15.60", 1.7 kg
Recensioni esterne » Xiaomi Mi Notebook Ultra 2021 i5
Asus Expertbook B5 B5302C, i5-1135G7: Intel Core i5-1135G7, 13.30", 1.2 kg
Recensioni esterne » Asus Expertbook B5 B5302C, i5-1135G7
Acer Swift 3 SF314-59-50MZ: Intel Core i5-1135G7, 14.00", 1.2 kg
Recensioni esterne » Acer Swift 3 SF314-59-50MZ
Asus Vivobook 14 X413EA-EK1338T: Intel Core i5-1135G7, 14.00", 1.4 kg
Recensioni esterne » Asus Vivobook 14 X413EA-EK1338T
Asus Vivobook 14 F415EA-EK1005W: Intel Core i5-1135G7, 14.00", 1.6 kg
Recensioni esterne » Asus Vivobook 14 F415EA-EK1005W
Asus VivoBook 14 K413EA-EK231T: Intel Core i5-1135G7, 14.00", 1.4 kg
Recensioni esterne » Asus VivoBook 14 K413EA-EK231T
MSI Modern 14 B11MOU-689XES: Intel Core i5-1155G7, 14.00", 1.3 kg
Recensioni esterne » MSI Modern 14 B11MOU-689XES
Acer Aspire 5 A514-54-501Z: Intel Core i5-1135G7, 14.00", 1.6 kg
Recensioni esterne » Acer Aspire 5 A514-54-501Z
Asus VivoBook 15 K513EA-AB54: Intel Core i5-1135G7, 15.60", 1.8 kg
Recensioni esterne » Asus VivoBook 15 K513EA-AB54
Acer Aspire Vero AV15-51-58JC: Intel Core i5-1155G7, 15.60", 1.8 kg
Recensioni esterne » Acer Aspire Vero AV15-51-58JC
HP Pavilion x360 14-dy1002ns: Intel Core i5-1155G7, 14.00", 1.5 kg
Recensioni esterne » HP Pavilion x360 14-dy1002ns
Dell Vostro 13 5301-V078G: Intel Core i5-1135G7, 13.30", 1.1 kg
Recensioni esterne » Dell Vostro 13 5301-V078G
Lenovo ThinkPad L15 G2-20X300P0GE: Intel Core i5-1135G7, 15.60", 2 kg
Recensioni esterne » Lenovo ThinkPad L15 G2-20X300P0GE
Acer Aspire 3 A317-53-58F1: Intel Core i5-1135G7, 17.30", 2.6 kg
Recensioni esterne » Acer Aspire 3 A317-53-58F1
HP ZBook Firefly 14 G8-2C9Q8EA: Intel Core i5-1135G7, 14.00", 1.4 kg
Recensioni esterne » HP ZBook Firefly 14 G8-2C9Q8EA
Samsung Galaxy Book2 Pro 13 NP930XED-KA1DE: Intel Core i5-1240P, 13.30", 0.9 kg
Recensioni esterne » Samsung Galaxy Book2 Pro 13 NP930XED-KA1DE
Dell Latitude 15 9520, i5-1145G7: Intel Core i5-1145G7, 15.00", 1.4 kg
Recensioni esterne » Dell Latitude 15 9520, i5-1145G7
Asus ExpertBook B3 Flip B3402FEA-EC0048R: Intel Core i5-1135G7, 14.00", 1.6 kg
Recensioni esterne » Asus ExpertBook B3 Flip B3402FEA-EC0048R
Acer Aspire Vero AV15-51-55K2: Intel Core i5-1155G7, 15.60", 1.8 kg
Recensioni esterne » Acer Aspire Vero AV15-51-55K2
Acer Swift 3 SF314-511-54ZK: Intel Core i5-1135G7, 14.00", 1.2 kg
Recensioni esterne » Acer Swift 3 SF314-511-54ZK
Huawei MateBook E Core i5: Intel Core i5-1130G7, 12.60", 0.7 kg
Recensioni esterne » Huawei MateBook E Core i5
Asus VivoBook 15 X513EA-BQ003T: Intel Core i5-1135G7, 15.60", 1.8 kg
Recensioni esterne » Asus VivoBook 15 X513EA-BQ003T
HP 15s-fq4004ns: Intel Core i5-1155G7, 15.60", 1.7 kg
Recensioni esterne » HP 15s-fq4004ns
HP Pavilion x360 14-dy1001ns: Intel Core i5-1155G7, 14.00", 1.5 kg
Recensioni esterne » HP Pavilion x360 14-dy1001ns
MSI Modern 15 A11MU-619XES: Intel Core i5-1135G7, 15.60", 1.6 kg
Recensioni esterne » MSI Modern 15 A11MU-619XES
HP Envy x360 13-bd0055nf: Intel Core i5-1135G7, 13.30", 1.3 kg
Recensioni esterne » HP Envy x360 13-bd0055nf
HP 15s-fq2079ns: Intel Core i5-1135G7, 15.60", 1.7 kg
Recensioni esterne » HP 15s-fq2079ns
Medion Akoya S15449-MD62127: Intel Core i5-1135G7, 15.60", 1.8 kg
Recensioni esterne » Medion Akoya S15449-MD62127
Asus Chromebook Flip CX5 CX5500FEA-E60030: Intel Core i5-1135G7, 15.60", 2 kg
Recensioni esterne » Asus Chromebook Flip CX5 CX5500FEA-E60030
HP 17-cn0025nr: Intel Core i5-1135G7, 17.30", 2.1 kg
Recensioni esterne » HP 17-cn0025nr
HP 15s-fq2016sa: Intel Core i5-1135G7, 15.60", 1.7 kg
Recensioni esterne » HP 15s-fq2016sa
Dynabook Tecra A50-J-18Z: Intel Core i5-1135G7, 15.60", 1.7 kg
Recensioni esterne » Dynabook Tecra A50-J-18Z
Lenovo ThinkPad X1 Yoga G6-20XY003GGE: Intel Core i5-1135G7, 14.00", 1.4 kg
Recensioni esterne » Lenovo ThinkPad X1 Yoga G6-20XY003GGE
Dell Latitude 14 3420-WNC19: Intel Core i5-1145G7, 14.00", 1.5 kg
Recensioni esterne » Dell Latitude 14 3420-WNC19
HP 470 G8-3S8S1EA: Intel Core i5-1135G7, 17.30", 2.1 kg
Recensioni esterne » HP 470 G8-3S8S1EA
HP ProBook 430 G8-2W1H2EA: Intel Core i5-1135G7, 13.30", 1.4 kg
Recensioni esterne » HP ProBook 430 G8-2W1H2EA
Dell Latitude 13 7320 Detachable 34TR3: Intel Core i5-1140G7, 13.00", 0.8 kg
Recensioni esterne » Dell Latitude 13 7320 Detachable 34TR3
Asus ExpertBook B7 Flip B7402FEA-L90074R: Intel Core i5-1155G7, 14.00", 1.5 kg
Recensioni esterne » Asus ExpertBook B7 Flip B7402FEA-L90074R
Lenovo V17 G2 ITL-82NX00EBMH: Intel Core i5-1135G7, 17.30", 2.2 kg
Recensioni esterne » Lenovo V17 G2 ITL-82NX00EBMH
Asus VivoBook 15 K513EA-L11430T: Intel Core i5-1135G7, 15.60", 1.7 kg
Recensioni esterne » Asus VivoBook 15 K513EA-L11430T
Asus Vivobook Pro 14 K3400PA-WH51: Intel Core i5-11300H, 14.00", 1.4 kg
Recensioni esterne » Asus Vivobook Pro 14 K3400PA-WH51
Medion Akoya E16401-MD62290: Intel Core i5-1135G7, 16.10", 2 kg
Recensioni esterne » Medion Akoya E16401-MD62290
Lenovo ThinkBook 15 Gen2 ITL: Intel Core i5-1135G7, 15.60", 1.8 kg
Recensioni esterne » Lenovo ThinkBook 15 Gen2 ITL
Asus ExpertBook B1 B1500CEAE, i5-1135G7: Intel Core i5-1135G7, 15.60", 1.7 kg
Recensioni esterne » Asus ExpertBook B1 B1500CEAE, i5-1135G7
MSI Modern 14 B11MOU-852VN: Intel Core i5-1155G7, 14.00", 1.3 kg
Recensioni esterne » MSI Modern 14 B11MOU-852VN
Asus VivoBook S15 S533EA-L11012T: Intel Core i5-1135G7, 15.60", 1.8 kg
Recensioni esterne » Asus VivoBook S15 S533EA-L11012T
Asus VivoBook Flip 14 TP470EA-EC084T: Intel Core i5-1135G7, 14.00", 1.5 kg
Recensioni esterne » Asus VivoBook Flip 14 TP470EA-EC084T
Medion Akoya S15449-MD62034: Intel Core i5-1135G7, 15.60", 1.9 kg
Recensioni esterne » Medion Akoya S15449-MD62034
HP Chromebook x360 14c-cc0025no: Intel Core i5-1135G7, 14.00", 1.7 kg
Recensioni esterne » HP Chromebook x360 14c-cc0025no
Acer Chromebook Spin 713 CP713-3W-503Z: Intel Core i5-1135G7, 13.50", 1.4 kg
Recensioni esterne » Acer Chromebook Spin 713 CP713-3W-503Z
HP Envy 13-ba1013na: Intel Core i5-1135G7, 13.30", 1.3 kg
Recensioni esterne » HP Envy 13-ba1013na
Asus ExpertBook B5 Flip B5302FEA: Intel Core i5-1135G7, 13.30", 1.3 kg
Recensioni esterne » Asus ExpertBook B5 Flip B5302FEA
Asus VivoBook S14 S433EA-AM464T: Intel Core i5-1135G7, 14.00", 1.4 kg
Recensioni esterne » Asus VivoBook S14 S433EA-AM464T
Asus VivoBook Flip 14 TP470EA-EC163T: Intel Core i5-1135G7, 14.00", 1.5 kg
Recensioni esterne » Asus VivoBook Flip 14 TP470EA-EC163T
Acer Aspire Vero AV15-51-55CG: Intel Core i5-1155G7, 15.60", 1.8 kg
Recensioni esterne » Acer Aspire Vero AV15-51-55CG
Alldocube iWork GT i5: Intel Core i5-1135G7, 10.95", 0.6 kg
Recensioni esterne » Alldocube iWork GT i5
Asus Zenbook 17 Fold UX9702: Intel Core i7-1250U, 17.30", 1.8 kg
Recensioni esterne » Asus Zenbook 17 Fold UX9702
Acer Aspire 5 A515-56-572C: Intel Core i5-1135G7, 15.60", 1.9 kg
Recensioni esterne » Acer Aspire 5 A515-56-572C
VAIO SX14 VJS144X0711S: Intel Core i5-1155G7, 14.00", 1.1 kg
Recensioni esterne » VAIO SX14 VJS144X0711S
Acer Swift 3 SF314-511-58NS: Intel Core i5-1135G7, 14.00", 1.2 kg
Recensioni esterne » Acer Swift 3 SF314-511-58NS
HP 15-dy2024nr: Intel Core i5-1135G7, 15.60", 1.7 kg
Recensioni esterne » HP 15-dy2024nr
HP Envy x360 15-ed1016ur: Intel Core i5-1135G7, 15.60", 1.9 kg
Recensioni esterne » HP Envy x360 15-ed1016ur
Asus Chromebook Flip CX5 CX5500FEA-E60038: Intel Core i5-1135G7, 15.60", 2 kg
Recensioni esterne » Asus Chromebook Flip CX5 CX5500FEA-E60038
Dell Latitude 15 3520-7D36T: Intel Core i5-1135G7, 15.60", 1.8 kg
Recensioni esterne » Dell Latitude 15 3520-7D36T
Lenovo IdeaPad Flex 5 CB 13ITL6-82M70028GE: Intel Core i5-1135G7, 13.30", 1.6 kg
Recensioni esterne » Lenovo IdeaPad Flex 5 CB 13ITL6-82M70028GE
Lenovo IdeaPad Slim 5 Pro 14ITL6-82L3009LIN: Intel Core i5-1135G7, 14.00", 1.4 kg
Recensioni esterne » Lenovo IdeaPad Slim 5 Pro 14ITL6-82L3009LIN
Huawei MateBook 14s i5: Intel Core i5-11300H, 14.20", 1.4 kg
Recensioni esterne » Huawei MateBook 14s i5
Acer Chromebook Spin 514 CP514-2H-56QM: Intel Core i5-1140G7, 14.00", 1.4 kg
Recensioni esterne » Acer Chromebook Spin CP514-2H-56QM
Asus Chromebook CX9400, i5-1135G7: Intel Core i5-1135G7, 14.00", 1.1 kg
Recensioni esterne » Asus Chromebook CX9400, i5-1135G7
HP Pavilion x360 15-er0155ng: Intel Core i5-1135G7, 15.60", 1.8 kg
Recensioni esterne » HP Pavilion x360 15-er0155ng
Acer Aspire 5 A515-56-50RS: Intel Core i5-1135G7, 15.60", 1.7 kg
Recensioni esterne » Acer Aspire 5 A515-56-50RS
Dell Inspiron 14 5410 2-in-1: Intel Core i5-1135G7, 14.00", 1.7 kg
Recensioni esterne » Dell Inspiron 14 5410 2-in-1
HP Pavilion x360 14-dy0009ns: Intel Core i5-1135G7, 14.00", 1.6 kg
Recensioni esterne » HP Pavilion x360 14-dy0009ns
Lenovo IdeaPad 3 17ITL6-82H9008UMH: Intel Core i5-1135G7, 17.30", 2.1 kg
Recensioni esterne » Lenovo IdeaPad 3 17ITL6-82H9008UMH
HP Pavilion x360 14-dw1028ns: Intel Core i5-1135G7, 14.00", 1.6 kg
Recensioni esterne » HP Pavilion x360 14-dw1028ns
Asus VivoBook 15 K513EA-L512TS: Intel Core i5-1135G7, 15.60", 1.8 kg
Recensioni esterne » Asus VivoBook K513EA-L512TS
Getac S410 G4, 1135G7: Intel Core i5-1135G7, 14.00", 2.4 kg
Recensioni esterne » Getac S410 G4, 1135G7
Lenovo ThinkPad X1 Titanium Yoga G1-20QB0016GE: Intel Core i5-1140G7, 13.50", 1.2 kg
Recensioni esterne » Lenovo ThinkPad X1 Titanium Yoga G1-20QB0016GE
Dell Latitude 7320 Detachable 34TR3: Intel Core i5-1140G7, 13.00", 0.8 kg
Recensioni esterne » Dell Latitude 7320 Detachable 34TR3
Fujitsu Stylistic Q7311, i5-1135G7: Intel Core i5-1135G7, 13.30", 0.8 kg
Recensioni esterne » Fujitsu Stylistic Q7311, i5-1135G7
Lenovo Yoga Duet 7 13ITL6-82MA000QGE: Intel Core i5-1135G7, 13.00", 0.8 kg
Recensioni esterne » Lenovo Yoga Duet 7 13ITL6-82MA000QGE
Asus VivoBook 14 X415, i5-1135G7: Intel Core i5-1135G7, 14.00", 1.6 kg
Recensioni esterne » Asus VivoBook 14 X415, i5-1135G7
Dynabook Tecra A40-J-12E: Intel Core i5-1135G7, 14.00", 1.4 kg
Recensioni esterne » Dynabook Tecra A40-J-12E
MSI Summit E13 Flip Evo A11MT-095: Intel Core i5-1135G7, 13.40", 1.4 kg
Recensioni esterne » MSI Summit E13 Flip Evo A11MT-095
Realme Book Slim i5: Intel Core i5-1135G7, 14.00", 1.4 kg
Recensioni esterne » realme Book Slim i5
Dell Inspiron 15 3501-PFV0X: Intel Core i5-1135G7, 15.60", 1.9 kg
Recensioni esterne » Dell Inspiron 15 3501-PFV0X
LG Gram 14Z90P-G.AP55G: Intel Core i5-1135G7, 14.00", 1 kg
Recensioni esterne » LG Gram 14Z90P-G.AP55G
Samsung Galaxy Book Pro 13 NP930XDB-KH1US: Intel Core i5-1135G7, 13.30", 0.9 kg
Recensioni esterne » Samsung Galaxy Book Pro 13 NP930XDB-KH1US
Lenovo Yoga Slim 9 14ITL5-82D10044LT: Intel Core i5-1135G7, 14.00", 1.3 kg
Recensioni esterne » Lenovo Yoga Slim 9 14ITL5-82D10044LT
Lenovo IdeaPad 3 14ITL6-82H7009FSP: Intel Core i5-1135G7, 14.00", 1.4 kg
Recensioni esterne » Lenovo IdeaPad 3 14ITL6-82H7009FSP
Lenovo ThinkPad X1 Carbon G9-20XW0026GE: Intel Core i5-1135G7, 14.00", 1.1 kg
Recensioni esterne » Lenovo ThinkPad X1 Carbon G9-20XW0026GE
HP 15s-fq2038ns: Intel Core i5-1135G7, 15.60", 1.7 kg
Recensioni esterne » HP 15s-fq2038ns
HP Envy 13-ba1014ns: Intel Core i5-1135G7, 13.30", 1.3 kg
Recensioni esterne » HP Envy 13-ba1014ns
Asus VivoBook 14 X413EA-EB070T: Intel Core i5-1135G7, 14.00", 1.5 kg
Recensioni esterne » Asus VivoBook 14 X413EA-EB070T
Lenovo ThinkPad X13 G2-20WK00AHGE: Intel Core i5-1135G7, 13.30", 1.3 kg
Recensioni esterne » Lenovo ThinkPad X13 G2-20WK00AHGE
Gateway GWTN141-10GR: Intel Core i5-1135G7, 14.10", 1.6 kg
Recensioni esterne » Gateway GWTN141-10GR
Acer Aspire 5 A517-52-59SV: Intel Core i5-1135G7, 17.30", 2.6 kg
Recensioni esterne » Acer Aspire 5 A517-52-59SV
Acer Swift 3 SF314-59-5021: Intel Core i5-1135G7, 14.00", 1.2 kg
Recensioni esterne » Acer Swift 3 SF314-59-5021
Xiaomi RedmiBook Pro 15, i5-11300H iGPU: Intel Core i5-11300H, 15.60", 1.7 kg
Recensioni esterne » Xiaomi RedmiBook Pro 15, i5-11300H iGPU
Asus ExpertBook B1 B1400CEAE, i5-1135G7: Intel Core i5-1135G7, 14.00", 1.5 kg
Recensioni esterne » Asus ExpertBook B1 B1400CEAE, i5-1135G7
Lenovo ThinkPad T14 G2-20W00027US: Intel Core i5-1145G7, 14.00", 1.5 kg
Recensioni esterne » Lenovo ThinkPad T14 G2-20W00027US
Dell Latitude 13 3320, i5-1135G7: Intel Core i5-1135G7, 13.30", 1.2 kg
Recensioni esterne » Dell Latitude 13 3320, i5-1135G7
Dell Latitude 14 9420 2-in-1, i5-1135G7: Intel Core i5-1135G7, 14.00", 1.3 kg
Recensioni esterne » Dell Latitude 14 9420 2-in-1, i5-1135G7
HP Pavilion x360 14-dw1024nr: Intel Core i5-1135G7, 14.00", 1.6 kg
Recensioni esterne » HP Pavilion x360 14-dw1024nr
HP Pavilion 14-dv0007na: Intel Core i5-1135G7, 14.00", 1.4 kg
Recensioni esterne » HP Pavilion 14-dv0007na
HP 15s-fq2005ns: Intel Core i5-1135G7, 15.60", 1.7 kg
Recensioni esterne » HP 15s-fq2005ns
Acer Swift 3 SF316-51-51BS: Intel Core i5-11300H, 16.10", 1.8 kg
Recensioni esterne » Acer Swift 3 SF316-51-51BS
Samsung Galaxy Book 15, i5-1135G7: Intel Core i5-1135G7, 15.60", 1.6 kg
Recensioni esterne » Samsung Galaxy Book 15, i5-1135G7
Fujitsu Lifebook U7511, i5-1145G7: Intel Core i5-1145G7, 15.60", 1.5 kg
Recensioni esterne » Fujitsu Lifebook U7511, i5-1145G7
HP 14s-dq2003ns: Intel Core i5-1135G7, 14.00", 1.5 kg
Recensioni esterne » HP 14s-dq2003ns
Lenovo Yoga Duet 7 13IML05, i5-1135G7: Intel Core i5-1135G7, 13.00", 0.8 kg
Recensioni esterne » Lenovo Yoga Duet 7 13IML05, i5-1135G7
Fujitsu Lifebook E5411, i5-1145G7: Intel Core i5-1145G7, 14.00", 1.8 kg
Recensioni esterne » Fujitsu Lifebook E5411, i5-1145G7
Acer Swift 5 SF514-55T-5001: Intel Core i5-1135G7, 14.00", 1.1 kg
Recensioni esterne » Acer Swift 5 SF514-55T-5001
Lenovo Yoga Slim 7 15ITL05-82AC002FGE: Intel Core i5-1135G7, 15.60", 1.9 kg
Recensioni esterne » Lenovo Yoga Slim 7 15ITL05-82AC002FGE
Acer Swift 3X SF314-510G-55EP: Intel Core i5-1135G7, 14.00", 1.4 kg
Recensioni esterne » Acer Swift 3X SF314-510G-55EP
Lenovo Yoga Slim 7 13ITL5-82CU002JGE: Intel Core i5-1135G7, 13.30", 1.2 kg
Recensioni esterne » Lenovo Yoga Slim 7 13ITL5-82CU002JGE
Lenovo IdeaPad Flex 5 14ITL05-82HS004TGE: Intel Core i5-1135G7, 14.00", 1.5 kg
Recensioni esterne » Lenovo IdeaPad Flex 5 14ITL05-82HS004TGE
Acer Chromebook 514 CB514-1WT-57YM: Intel Core i5-1135G7, 14.00", 1.4 kg
Recensioni esterne » Acer Chromebook 514 CB514-1WT-57YM
VAIO SE14 NP14V3IN033P: Intel Core i5-1135G7, 14.00", 1.4 kg
Recensioni esterne » VAIO SE14 NP14V3IN033P
Dynabook Portégé X30L-J-10G: Intel Core i5-1135G7, 13.30", 0.9 kg
Recensioni esterne » Dynabook Portégé X30L-J-10G
HP Pavilion 14-dv0021ns: Intel Core i5-1135G7, 14.00", 1.4 kg
Recensioni esterne » HP Pavilion 14-dv0021ns
HP 15s-fq2041ns: Intel Core i5-1135G7, 15.60", 1.7 kg
Recensioni esterne » HP 15s-fq2041ns
Lenovo ThinkPad L13 Yoga Gen2-20VK000VGE: Intel Core i5-1135G7, 13.30", 1.5 kg
Recensioni esterne » Lenovo ThinkPad L13 Yoga Gen2-20VK000VGE
Fujitsu Lifebook U7411, i5-1145G7: Intel Core i5-1145G7, 14.00", 1.2 kg
Recensioni esterne » Fujitsu Lifebook U7411, i5-1145G7
Acer Swift 3X SF314-510G-52N1: Intel Core i5-1135G7, 14.00", 1.4 kg
Recensioni esterne » Acer Swift 3X SF314-510G-52N1
Honor MagicBook 15 i5 1135G7: Intel Core i5-1135G7, 15.60", 1.5 kg
Recensioni esterne » Honor MagicBook 15 i5 1135G7
Samsung Book 15 NP550XDA-KF2BR: Intel Core i5-1135G7, 15.60", 1.8 kg
Recensioni esterne » Samsung Book 15 NP550XDA-KF2BR
Huawei MateBook 14 2021, i5-1135G7: Intel Core i5-1135G7, 14.00", 1.5 kg
Recensioni esterne » Huawei MateBook 14 2021, i5-1135G7
HP Pavilion x360 14-dy0157ng: Intel Core i5-1135G7, 14.00", 1.5 kg
Recensioni esterne » HP Pavilion x360 14-dy0157ng
Lenovo Yoga Slim 7 Carbon 13ITL5-82EV0048GE: Intel Core i5-1135G7, 13.30", 1 kg
Recensioni esterne » Lenovo Yoga Slim 7 Carbon 13ITL5-82EV0048GE
Lenovo ThinkPad L13 Gen2-20VH0017GE: Intel Core i5-1135G7, 13.30", 1.4 kg
Recensioni esterne » Lenovo ThinkPad L13 Gen2-20VH0017GE
Lenovo ThinkBook 13s G2 ITL-20V90003GE: Intel Core i5-1135G7, 13.30", 1.3 kg
Recensioni esterne » Lenovo ThinkBook 13s G2 ITL-20V90003GE
HP Pavilion x360 14-dw1001ns: Intel Core i5-1135G7, 14.00", 1.6 kg
Recensioni esterne » HP Pavilion x360 14-dw1001ns
HP 15-dy2021nr: Intel Core i5-1135G7, 15.60", 1.7 kg
Recensioni esterne » HP 15-dy2021nr
HP Spectre x360 13-aw2003dx: Intel Core i5-1135G7, 13.30", 1.2 kg
Recensioni esterne » HP Spectre x360 13-aw2003dx
Xiaomi RedmiBook Pro 14 2021, i5-1135G7: Intel Core i5-1135G7, 14.00", 1.5 kg
Recensioni esterne » Xiaomi RedmiBook Pro 14 2021, i5-1135G7
Acer Chromebook Spin 713 CP713-3W-57R0: Intel Core i5-1135G7, 13.50", 1.4 kg
Recensioni esterne » Acer Chromebook Spin 713 CP713-3W-57R0
HP Envy x360 13-bd0062TU: Intel Core i5-1135G7, 13.30", 1.3 kg
Recensioni esterne » HP Envy x360 13-bd0062TU
Acer TravelMate Spin P4 TMP414RN-51-53J8: Intel Core i5-1135G7, 14.00", 1.4 kg
Recensioni esterne » Acer TravelMate Spin P4 TMP414RN-51-53J8
HP Pavilion x360 14-dw1002ns: Intel Core i5-1135G7, 14.00", 1.6 kg
Recensioni esterne » HP Pavilion x360 14-dw1002ns
HP Pavilion 14-dv0001ns: Intel Core i5-1135G7, 14.00", 1.4 kg
Recensioni esterne » HP Pavilion 14-dv0001ns
HP Pavilion 13-bb0062tu: Intel Core i5-1135G7, 13.30", 1.2 kg
Recensioni esterne » HP Pavilion 13-bb0062tu
Dynabook Portégé X30L-J-11J: Intel Core i5-1135G7, 13.30", 0.9 kg
Recensioni esterne » Dynabook Portégé X30L-J-11J
Lenovo IdeaPad 3 15ITL6-82H800KDGE: Intel Core i5-1135G7, 15.60", 1.7 kg
Recensioni esterne » Lenovo IdeaPad 3 15ITL6-82H800KDGE
HP 14s-dq2004ns: Intel Core i5-1135G7, 14.00", 1.5 kg
Recensioni esterne » HP 14s-dq2004ns
Lenovo IdeaPad 3 15ITL6-82H800BXGE: Intel Core i5-1135G7, 15.60", 1.7 kg
Recensioni esterne » Lenovo IdeaPad 3 15ITL6-82H800BXGE
HP Pavilion 15-eg0005ns: Intel Core i5-1135G7, 15.60", 1.8 kg
Recensioni esterne » HP Pavilion 15-eg0005ns
Dell Inspiron 13 5301, i5-1135G7: Intel Core i5-1135G7, 13.30", 1.2 kg
Recensioni esterne » Dell Inspiron 13 5301, i5-1135G7
Acer Aspire 5 A515-56-55LT: Intel Core i5-1135G7, 15.60", 1.7 kg
Recensioni esterne » Acer Aspire 5 A515-56-55LT
Acer Aspire 5 A514-54-552U: Intel Core i5-1135G7, 14.00", 1.5 kg
Recensioni esterne » Acer Aspire 5 A514-54-552U
Samsung Galaxy Book Pro 360 13: Intel Core i5-1135G7, 13.20", 1.1 kg
Recensioni esterne » Samsung Galaxy Book Pro 360 13
Microsoft Surface Laptop 4 13 i5: Intel Core i5-1135G7, 13.50", 1.3 kg
Recensioni esterne » Microsoft Surface Laptop 4 13 i5
MSI Modern 14 B11SB, i5-1135G7: Intel Core i5-1135G7, 14.00", 1.3 kg
Recensioni esterne » MSI Modern 14 B11SB, i5-1135G7
Asus VivoBook S14 S435EA-HM003T: Intel Core i5-1135G7, 14.00", 1.3 kg
Recensioni esterne » Asus VivoBook S14 S435EA-HM003T
Acer Spin 5 SP513-55N-53HZ: Intel Core i5-1135G7, 13.50", 1.2 kg
Recensioni esterne » Acer Spin 5 SP513-55N-53HZ
HP Envy 13-ba1028TU: Intel Core i5-1135G7, 13.30", 1.2 kg
Recensioni esterne » HP Envy 13-ba1028TU
Dell Latitude 13 5320, i5-1135G7: Intel Core i5-1135G7, 13.30", 1.2 kg
Recensioni esterne » Dell Latitude 13 5320, i5-1135G7
Dell Latitude 15 5520, i5-1135G7: Intel Core i5-1135G7, 15.60", 1.6 kg
Recensioni esterne » Dell Latitude 15 5520, i5-1135G7
HP Pavilion 13-bb0154ng: Intel Core i5-1135G7, 13.30", 1.2 kg
Recensioni esterne » HP Pavilion 13-bb0154ng
Lenovo ThinkBook 13s-ITL-20V90003GE: Intel Core i5-1135G7, 13.30", 1.3 kg
Recensioni esterne » Lenovo ThinkBook 13s-ITL-20V90003GE
Acer Swift 3 SF314-59-52Q3: Intel Core i5-1135G7, 14.00", 1.2 kg
Recensioni esterne » Acer Swift 3 Infinity 3 SF314-59, i5-1135G7
Honor MagicBook 14, i5-1135G7: Intel Core i5-1135G7, 14.00", 1.4 kg
Recensioni esterne » Honor MagicBook 14, i5-1135G7
Huawei MateBook D 15 2021, i5-1135G7: Intel Core i5-1135G7, 15.60", 1.5 kg
Recensioni esterne » Huawei MateBook D 15 2021, i5-1135G7
HP Pavilion 14-dv0020ns: Intel Core i5-1135G7, 14.00", 1.4 kg
Recensioni esterne » HP Pavilion 14-dv0020ns
Dell Latitude 13 5320, i5-1145G7: Intel Core i5-1145G7, 13.30", 1.2 kg
Recensioni esterne » Dell Latitude 13 5320, i5-1145G7
Dell XPS 13 9310, i5-1135G7 FHD: Intel Core i5-1135G7, 13.40", 1.2 kg
Recensioni esterne » Dell XPS 13 9310, i5-1135G7 FHD
Dell Latitude 13 7320 2-in-1, i5-1145G7: Intel Core i5-1145G7, 13.30", 1.4 kg
Recensioni esterne » Dell Latitude 7320 2-in-1, i5-1145G7
Dell Vostro 14 5402, i5-1135G7: Intel Core i5-1135G7, 14.00", 1.4 kg
Recensioni esterne » Dell Vostro 14 5402, i5-1135G7
Asus Zenbook Flip 13 UX363EA-EM087T: Intel Core i5-1135G7, 14.00", 1.3 kg
Recensioni esterne » Asus Zenbook Flip 13 UX363EA-EM087T
HP 15s-fq2086ns: Intel Core i5-1135G7, 15.60"
Recensioni esterne » HP 15s-fq2086ns
HP 14s-dq2012ns: Intel Core i5-1135G7, 14.00", 1.5 kg
Recensioni esterne » HP 14s-dq2012ns
Acer Swift 5 SF514-55TA-574H: Intel Core i5-1135G7, 14.00", 1.1 kg
Recensioni esterne » Acer Swift 5 SF514-55TA-574H
HP Pavilion 14-dv0000ns: Intel Core i5-1135G7, 14.00", 1.4 kg
Recensioni esterne » HP Pavilion 14-dv0000ns
HP 15s-fq2087ns: Intel Core i5-1135G7, 15.60", 1.7 kg
Recensioni esterne » HP 15s-fq2087ns
HP 15s-fq2000ns: Intel Core i5-1135G7, 15.60", 1.7 kg
Recensioni esterne » HP 15s-fq2000ns
Lenovo ThinkBook 14 G2 ITL 20VD008WGE: Intel Core i5-1135G7, 14.00", 1.5 kg
Recensioni esterne » Lenovo ThinkBook 14 G2 ITL 20VD008WGE
MSI Modern 15 A11M-007NE: Intel Core i5-1135G7, 15.60", 1.6 kg
Recensioni esterne » MSI Modern 15 A11M-007NE
HP 15s-fq2091ns: Intel Core i5-1135G7, 15.60", 1.7 kg
Recensioni esterne » HP 15s-fq2091ns
HP 15s-fq2007ns: Intel Core i5-1135G7, 15.60", 1.7 kg
Recensioni esterne » HP 15s-fq2007ns
HP 15s-fq2002ns: Intel Core i5-1135G7, 15.60", 1.7 kg
Recensioni esterne » HP 15s-fq2002ns
Dell Latitude 13 7320, i5-1135G7: Intel Core i5-1135G7, 13.30", 1.1 kg
Recensioni esterne » Dell Latitude 7320, i5-1135G7
Lenovo ThinkBook 14s Yoga ITL, i5-1135G7: Intel Core i5-1135G7, 14.00", 1.5 kg
Recensioni esterne » Lenovo ThinkBook 14s Yoga ITL, i5-1135G7
MSI Modern 15 A11M, i5-1135G7: Intel Core i5-1135G7, 15.60", 1.6 kg
Recensioni esterne » MSI Modern 15 A11M, i5-1135G7
Dell Inspiron 15 7506 2-in-1 P97F: Intel Core i5-1135G7, 15.60", 1.8 kg
Recensioni esterne » Dell Inspiron 15 7506 2-in-1 P97F
Acer Swift 5 SF514-55T-58DN: Intel Core i5-1135G7, 14.00", 1 kg
Recensioni esterne » Acer Swift 5 SF514-55T-58DN
Dynabook Portégé X30W-J-10H: Intel Core i5-1135G7, 13.30", 1 kg
Recensioni esterne » Dynabook Portégé X30W-J-10H
Lenovo ThinkPad E15 Gen2-20TD0003GE: Intel Core i5-1135G7, 15.60", 1.7 kg
Recensioni esterne » Lenovo ThinkPad E15 Gen2-20TD0003GE
HP 15s-fq2009ns: Intel Core i5-1135G7, 15.60", 1.7 kg
Recensioni esterne » HP 15s-fq2009ns
Microsoft Surface Pro 7 Plus: Intel Core i5-1135G7, 12.30", 0.8 kg
Recensioni esterne » Microsoft Surface Pro 7 Plus
HP 15s-fq2013ns: Intel Core i5-1135G7, 15.60", 1.7 kg
Recensioni esterne » HP 15s-fq2013ns
Microsoft Surface Pro 7+ 3BQ-00003: Intel Core i5-1135G7, 12.30", 0.8 kg
Recensioni esterne » Microsoft Surface Pro 7+ 3BQ-00003
HP EliteBook 840 Aero G8: Intel Core i5-1135G7, 14.00", 1.2 kg
Recensioni esterne » HP EliteBook 840 Aero G8
HP 15s-fq2004ns: Intel Core i5-1135G7, 15.60", 1.7 kg
Recensioni esterne » HP 15s-fq2004ns
HP 14s-dq2006ns: Intel Core i5-1135G7, 14.00", 1.5 kg
Recensioni esterne » HP 14s-dq2006ns
Medion Akoya S15449 MD61991: Intel Core i5-1135G7, 15.60", 1.8 kg
Recensioni esterne » Medion Akoya S15449 MD61991
HP ProBook 450 G8, i5-1135G7: Intel Core i5-1135G7, 15.60", 1.7 kg
Recensioni esterne » HP ProBook 450 G8, i5-1135G7
HP Envy 13-ba1018ns : Intel Core i5-1135G7, 13.30", 1.3 kg
Recensioni esterne » HP Envy 13-ba1018ns
HP 15s-fq2008ns: Intel Core i5-1135G7, 15.60", 1.7 kg
Recensioni esterne » HP 15s-fq2008ns
Asus Zenbook Flip S UX371EA-HL144R: Intel Core i5-1135G7, 13.30", 1.2 kg
Recensioni esterne » Asus Zenbook Flip S UX371EA-HL144R
Lenovo IdeaPad 5 15ITL05-82FG00B0GE: Intel Core i5-1135G7, 15.60", 1.7 kg
Recensioni esterne » Lenovo IdeaPad 5 15ITL05-82FG00B0GE
Dell XPS 13 9310 2-in-1, i5-1135G7: Intel Core i5-1135G7, 13.40", 1.3 kg
Recensioni esterne » Dell XPS 13 9310 2-in-1, i5-1135G7
Acer Swift 3 Air 3: Intel Core i5-1135G7, 13.50", 1.2 kg
Recensioni esterne » Acer Swift 3 Air 3
Lenovo Yoga Slim 7 14ITL05, i5-1135G7: Intel Core i5-1135G7, 14.00", 1.4 kg
Recensioni esterne » Lenovo Yoga Slim 7 14ITL05, i5-1135G7
Fujitsu UH-X, i5: Intel Core i5-1135G7, 13.30", 0.7 kg
Recensioni esterne » Fujitsu UH-X
HP Pavilion 15-eg0656ng: Intel Core i5-1135G7, 15.60", 1.8 kg
Recensioni esterne » HP Pavilion 15-eg0656ng
HP ProBook 650 G8, i5-1135G7: Intel Core i5-1135G7, 15.60", 1.7 kg
Recensioni esterne » HP ProBook 650 G8, i5-1135G7
Asus VivoBook Flip 14 TP470EA-EC033T: Intel Core i5-1135G7, 14.00", 1.5 kg
Recensioni esterne » Asus VivoBook Flip 14 TP470EA-EC033T
Lenovo ThinkPad E14 Gen2-20TA004FUS: Intel Core i5-1135G7, 14.00", 1.6 kg
Recensioni esterne » Lenovo ThinkPad E14 Gen2-20TA004FUS
Acer Book RS Porsche Design AP714-51T-59ZV: Intel Core i5-1135G7, 14.00", 1.3 kg
Recensioni esterne » Acer Book RS Porsche Design AP714-51T-59ZV
Asus Vivobook Flip 14 TP470EA-EC029TS: Intel Core i5-1135G7, 14.00", 1.5 kg
Recensioni esterne » Asus Vivobook Flip 14 TP470EA-EC029TS
HP Pavilion 14-dv0301ng: Intel Core i5-1135G7, 14.00", 1.4 kg
Recensioni esterne » HP Pavilion 14-dv0301ng
Lenovo Yoga 7 14ITL5: Intel Core i5-1135G7, 14.00", 1.5 kg
Recensioni esterne » Lenovo Yoga 7 14ITL5
Acer Aspire 5 A514-54-59BP: Intel Core i5-1135G7, 14.00", 1.6 kg
Recensioni esterne » Acer Aspire 5 A514-54-59BP
Asus VivoBook S14 S433EA-EB043T: Intel Core i5-1135G7, 14.00", 1.4 kg
Recensioni esterne » Asus VivoBook S14 S433EA-EB043T
Asus ZenBook 13 UX325EA, i5-1135G7: Intel Core i5-1135G7, 13.30", 1.1 kg
Recensioni esterne » Asus ZenBook 13 UX325EA, i5-1135G7
Lenovo IdeaPad Slim 5 15, i5-1135G7: Intel Core i5-1135G7, 15.60", 1.7 kg
Recensioni esterne » Lenovo IdeaPad Slim 5 15, i5-1135G7
Acer Aspire 5 A514-54-55X7: Intel Core i5-1135G7, 14.00", 1.7 kg
Recensioni esterne » Acer Aspire 5 A514-54-55X7
Medion Akoya S15449 MD61865: Intel Core i5-1135G7, 15.60", 1.8 kg
Recensioni esterne » Medion Akoya S15449 MD61865
Acer Swift 5 SF514-55TA-57P3: Intel Core i5-1135G7, 14.00", 1.1 kg
Recensioni esterne » Acer Swift 5 SF514-55TA-57P3
Acer Aspire 5 A515-56-51P5: Intel Core i5-1135G7, 15.60", 1.9 kg
Recensioni esterne » Acer Aspire 5 A515-56-51P5
Asus ZenBook 14 UX435EA: Intel Core i5-1135G7, 14.00", 1.3 kg
Recensioni esterne » Asus ZenBook 14 UX435EA
Asus ZenBook 14 UX425EA-HM038T: Intel Core i5-1135G7, 14.00", 1.4 kg
Recensioni esterne » Asus ZenBook 14 UX425EA-HM038T
Lenovo Yoga 9i 14ITL5: Intel Core i5-1135G7, 14.00", 1.4 kg
Recensioni esterne » Lenovo Yoga 9i 14ITL5
Asus Vivobook 15 K513EQ, i5-1135G7: Intel Core i5-1135G7, 15.60", 1.8 kg
Recensioni esterne » Asus Vivobook 15 K513, i5-1135G7
Acer Swift 3 SF314-59-52A6 silber: Intel Core i5-1135G7, 14.00"
Recensioni esterne » Acer Swift 3 SF314-59-52A6 silber
Asus Zenbook Flip 13 UX363EA-EM179R: Intel Core i5-1135G7, 13.30", 1.3 kg
Recensioni esterne » Asus Zenbook Flip 13 UX363EA-EM179R
Acer Book RS Porsche Design AP714-51T-57D6: Intel Core i5-1135G7, 14.00", 1.3 kg
Recensioni esterne » Acer Book RS Porsche Design AP714-51T-57D6
Asus Zenbook Flip 13 UX363EA-EM111T: Intel Core i5-1135G7, 13.30", 1.3 kg
Recensioni esterne » Asus Zenbook Flip 13 UX363EA-EM111T
Asus VivoBook 15 S513EA-EJ118T: Intel Core i5-1135G7, 15.60", 1.7 kg
Recensioni esterne » Asus VivoBook 15 S513EA-EJ118T
Acer Aspire 5 A515-56-511A: Intel Core i5-1135G7, 15.60", 1.9 kg
Recensioni esterne » Acer Aspire 5 A515-56-511A
Acer Swift 3 SF314-59-74VC: Intel Core i5-1135G7, 14.00", 1.2 kg
Recensioni esterne » Acer Swift 3 SF314-59-74VC
Schenker Connect 15 (E26): Intel Core 5 120U, 15.60", 1.9 kg
» Confronto tra Intel Core 5 120U: Schenker Connect 15 contro Lenovo IdeaPad Slim 3i in un test di benchmark per i giochi
» Wi-Fi 7 nello Schenker Connect 15: 3.500 Mbps – ma quali vantaggi comporta effettivamente nell’uso quotidiano in ambito aziendale?
» USB-C o connettore cilindrico? Perché alcuni portatili nel 2026 dispongono ancora di due porte di ricarica
» Perché quasi tutti i portatili sono sprovvisti di questa pratica funzionalità
» Questo portatile business è un'impresa in tutto e per tutto sulla carta - e un compromesso nella realtà?
» Verifica del prezzo di Schenker Connect 15: Quanto velocemente 1.000 euro si trasformano in un computer portatile da 1.600 euro
Acer Aspire Go AG15-51P-56UR: Intel Core i5-1334U, 15.30", 1.7 kg
» Fine del supporto di Windows 10: Acer Aspire Go 15 può essere un'alternativa economica per alcuni
Lenovo IdeaPad Gaming Chromebook 16: Intel Core i5-1235U, 16.00", 1.8 kg
» Il Lenovo IdeaPad Gaming Chromebook 16 è ora in vendita, ma una delle sue migliori caratteristiche non è ancora disponibile sul sistema operativo
VAIO FE 14.1 VWNC51429-SL: Intel Core i5-1235U, 14.10", 1.6 kg
» Il Vaio FE 14 2022 è nuovo all'interno ma vecchio all'esterno
Dell Latitude 7420 JW6MH: Intel Core i5-1145G7, 14.00", 1.3 kg
» Non massimamente veloce ma massimamente sicuro: Recensione di Dell Latitude 7420
VAIO SX12 VJS124X1011P: Intel Core i5-1155G7, 12.50", 0.9 kg
» Intel Core i5-1155G7 supera il Core i7-1165G7: il Vaio SX12 da 12 pollici ha le prestazioni di un Ultrabook da 15 pollici
Huawei MateBook E Core i5: Intel Core i5-1130G7, 12.60", 0.7 kg
» Il nuovo Huawei MateBook E è un interessante, ma anche costoso tablet OLED con Windows
Beelink GTI 11: Intel Core i5-1135G7, 0.6 kg
» Beelink GTI 11 mini PC colpisce Intel NUC dove fa male: Prezzo
LG Gram 17Z90P-G.AA56G: Intel Core i5-1135G7, 17.00", 1.4 kg
» Il nuovo LG Gram 17: una performance elevata ma troppo flessibile
Intel NUC11TNKi5: Intel Core i5-1135G7, 0.5 kg
» Intel NUC11TNK con Core i5 ora in spedizione per $579 USD senza RAM, OS o storage
Acer Aspire 5 A515-56-511A: Intel Core i5-1135G7, 15.60", 1.9 kg
» Acer Aspire 5 con Tiger Lake: Un notebook come tanti altri
Lenovo ThinkPad L13 Gen2-20VH0017GE: Intel Core i5-1135G7, 13.30", 1.4 kg
» Il ThinkPad L13 Gen 2 convince nel test con una tastiera eccellente e Thunderbolt 4
GPD Win 3: Intel Core i5-1135G7, 5.50", 0.6 kg
» Il GPD Win 3 costa il doppio di una Playstation 5. Ne vale davvero la pena?
Lenovo ThinkBook 13s-ITL-20V90003GE: Intel Core i5-1135G7, 13.30", 1.3 kg
» Lenovo ThinkBook 13s: Più durata della batteria, meno flessibilità
Lenovo Yoga 7 14ITL5: Intel Core i5-1135G7, 14.00", 1.5 kg
» La CPU Core i5-1135G7 del Lenovo Yoga 7i è alla pari con il Core i7-1165G7, ma la sua grafica Iris Xe è molto indietro