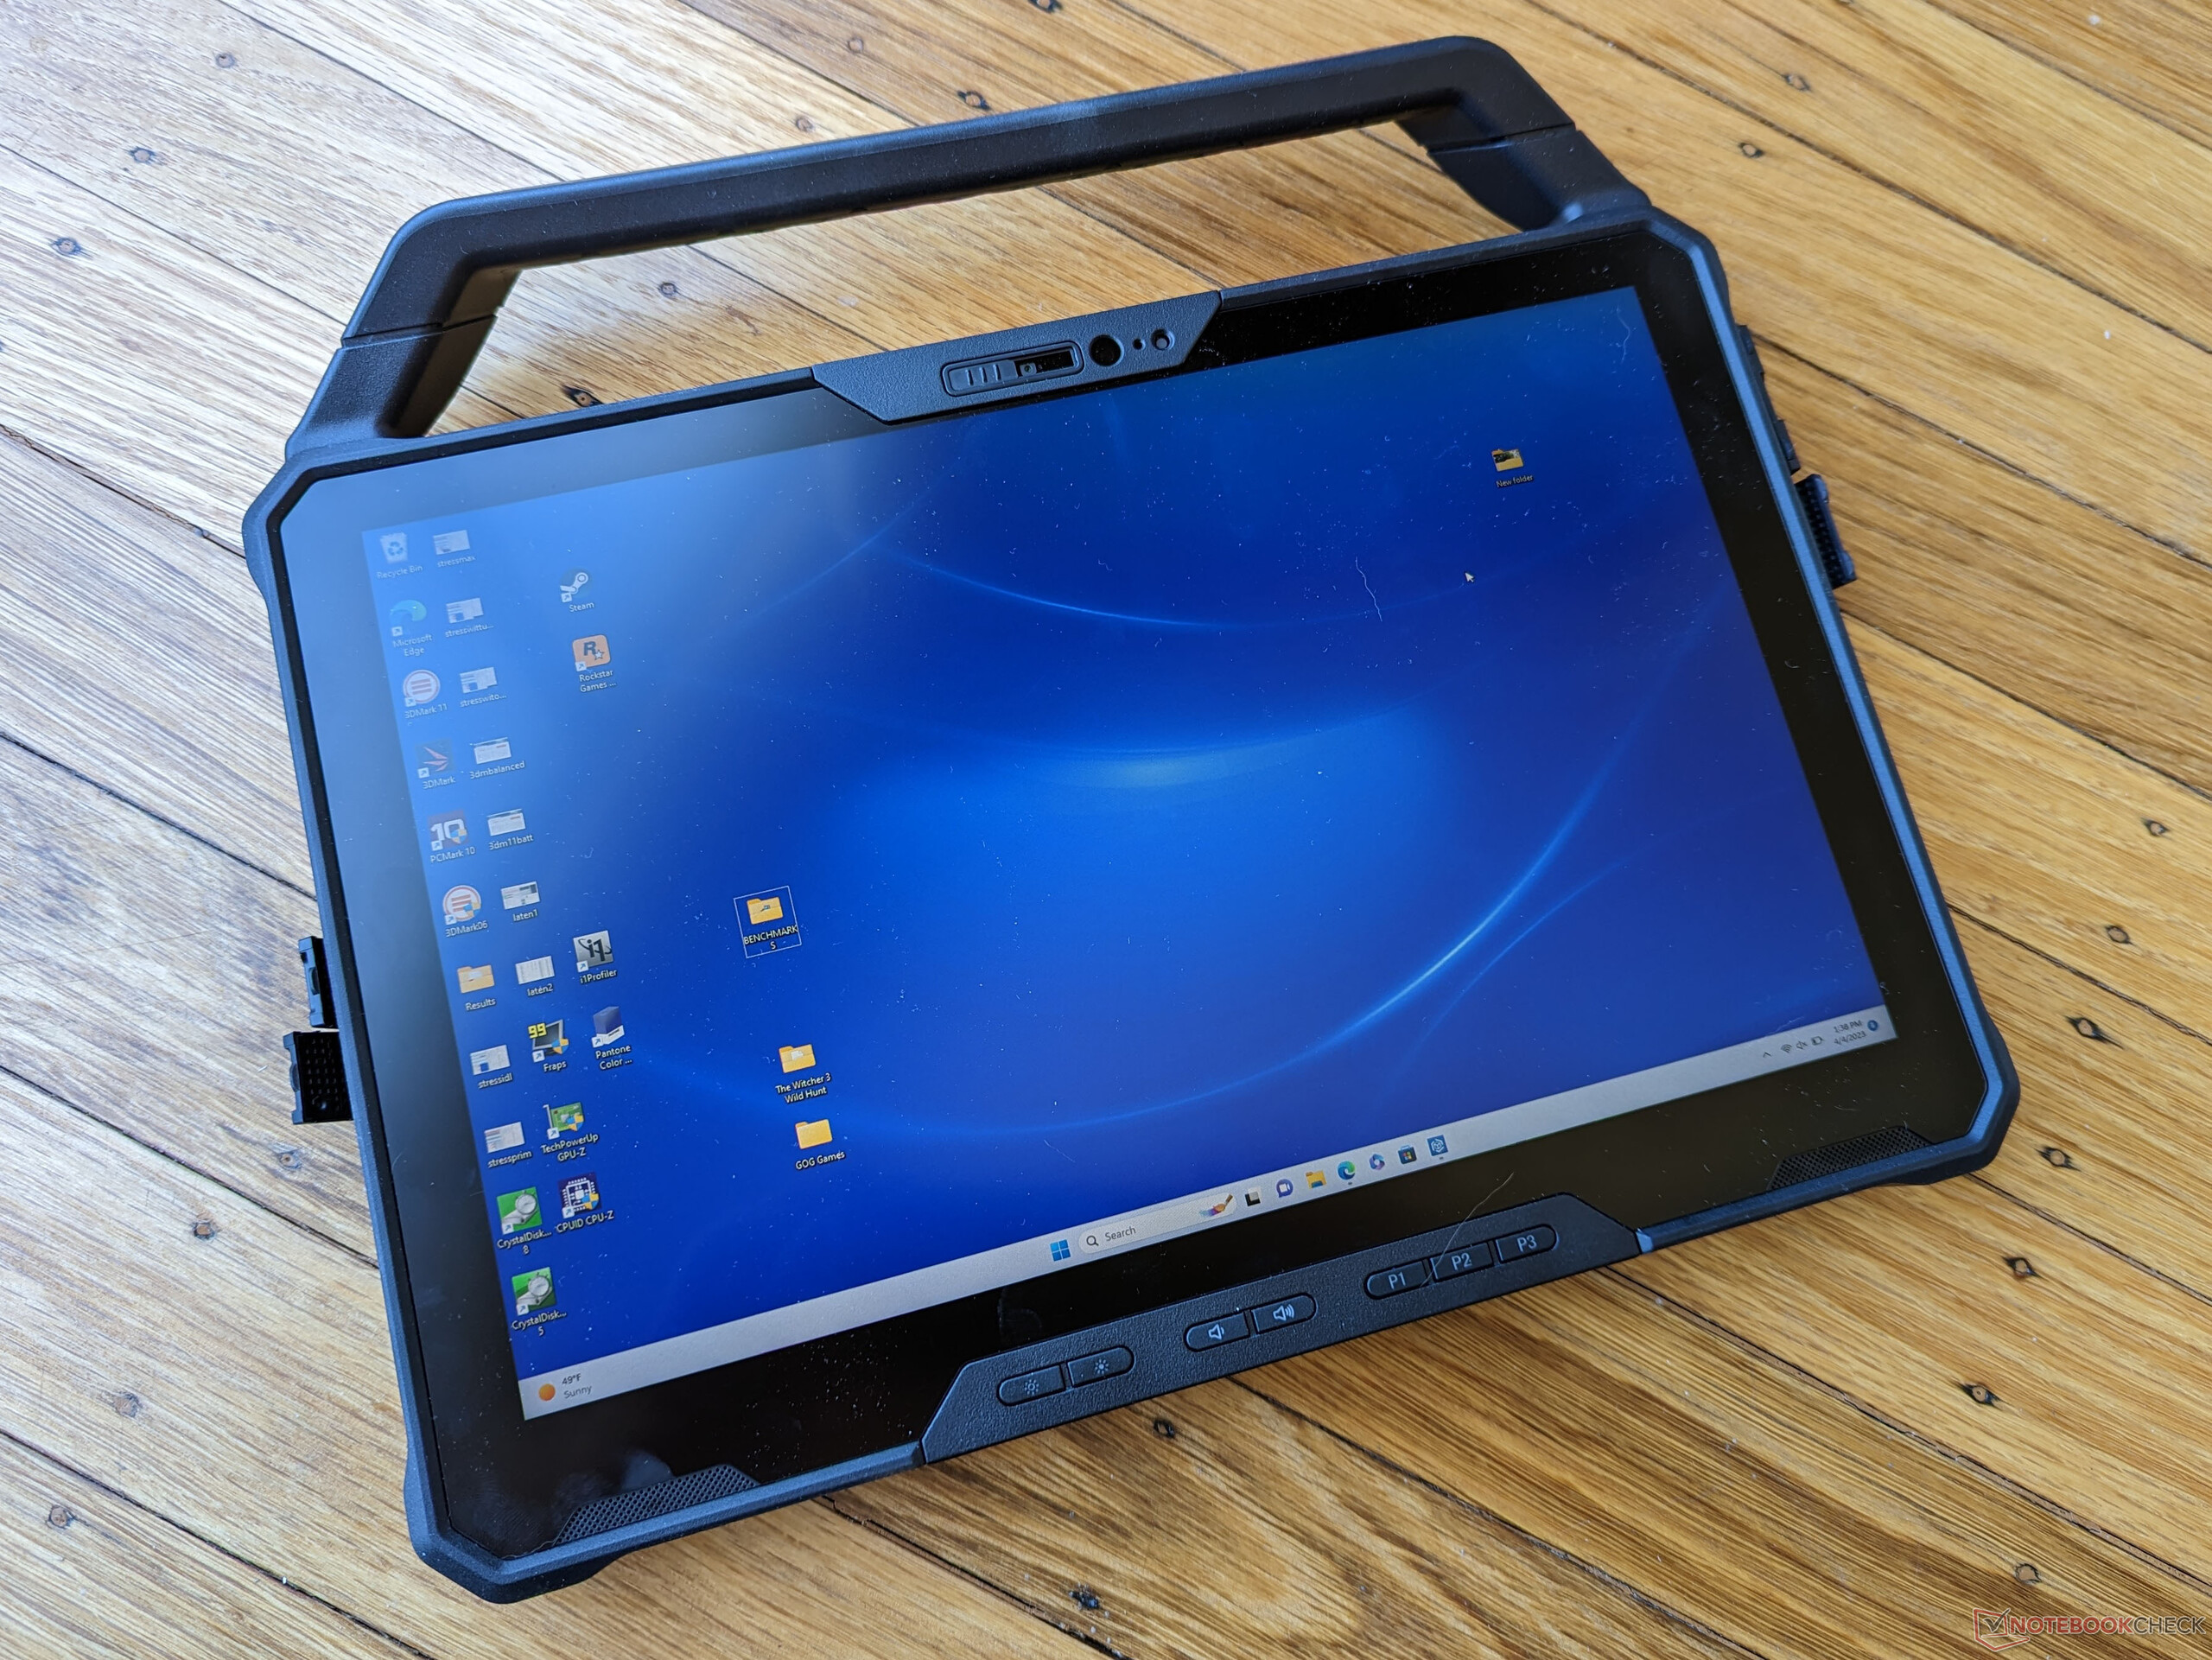
Recensione del tablet Dell Latitude 7230 Rugged Extreme: Uno dei migliori display della categoria

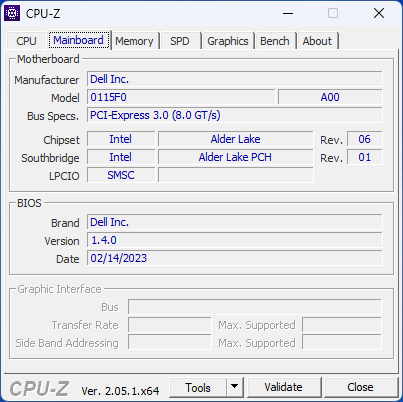
Latitude 7230 Rugged Extreme è stato annunciato nell'ottobre dello scorso anno Ottobre dello scorso anno come successore del modello Latitude 7220 Rugged Extreme. Presenta uno chassis aggiornato con uno schermo di dimensioni maggiori (da 11,6 a 12 pollici), opzioni di CPU Intel più veloci (da 8th gen a 12th gen) e opzioni di connettività più veloci (da Wi-Fi 6 a 6E, 5G).
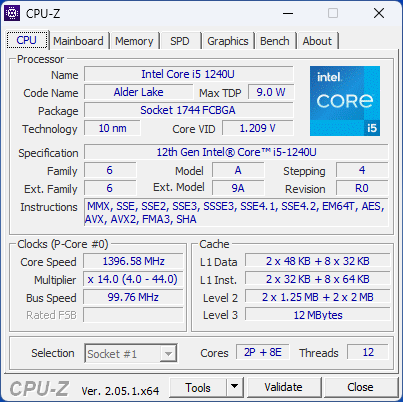
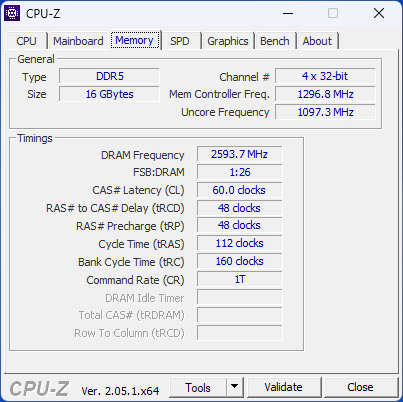
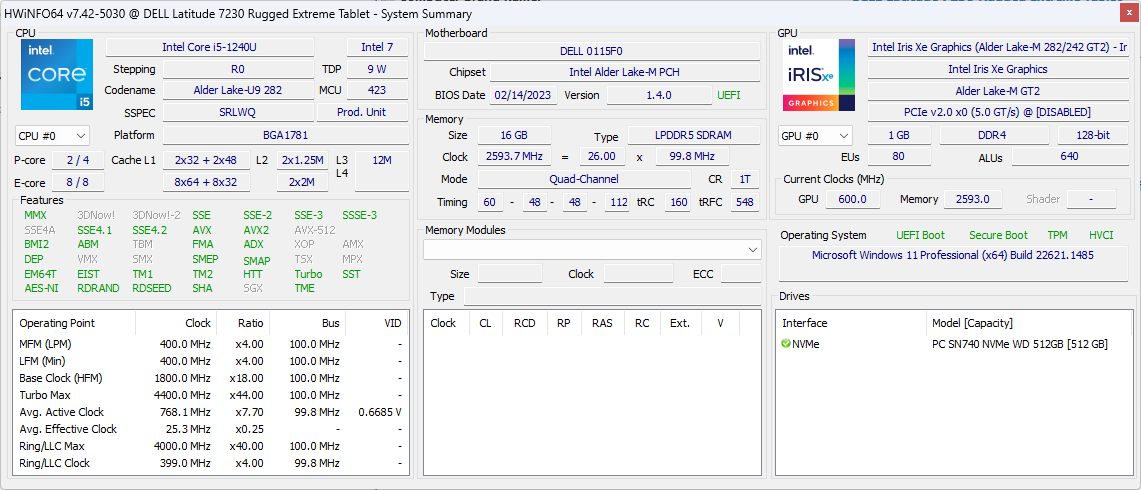
L'unità in esame è una SKU di fascia media con Core i5-1240U, 16 GB di RAM e 512 GB di SSD NVMe per circa 3.200 dollari. Sono disponibili altre SKU con il più lento Core i3-1210U, il più veloce i7-1260U, più RAM o memoria e altre espansioni. Tutte le configurazioni sono dotate dello stesso schermo touchscreen IPS da 1920 x 1200 a 1200 nit. La scheda tecnica completa del modello Latitude 7230 Rugged Extreme è disponibile pubblicamente sul sito Dell https://www.delltechnologies.com/asset/en-gb/products/laptops-and-2-in-1s/technical-support/latitude-7230-rugged-extreme-product-guide-spec-sheet.pdf.
Le alternative includono il modello Acer Enduro T1, il Samsung Galaxy Tab Activeo la serie Panasonic Toughbook serie FZ-G2.
Altre recensioni Dell:
Potenziali concorrenti a confronto
Punteggio | Data | Modello | Peso | Altezza | Dimensione | Risoluzione | Prezzo |
|---|---|---|---|---|---|---|---|
| 83.9 % v7 (old) | 04/2023 | Dell Latitude 7230 Rugged Extreme i5-1240U, Iris Xe G7 80EUs | 1.6 kg | 23.9 mm | 12.00" | 1920x1200 | |
v (old) | 05/2022 | Dell Latitude 7330 Rugged Extreme i7-1185G7, Iris Xe G7 96EUs | 2.7 kg | 36.5 mm | 13.30" | 1920x1080 | |
v (old) | 07/2022 | Panasonic Toughbook 40 i7-1185G7, Iris Xe G7 96EUs | 3.9 kg | 53.4 mm | 14.00" | 1920x1080 | |
| 83.8 % v7 (old) | 01/2022 | Getac B360 i7-10710U, UHD Graphics 620 | 2.4 kg | 34.9 mm | 13.30" | 1920x1080 | |
| 82.4 % v7 (old) | 12/2021 | Acer Enduro Urban N3 EUN314 i7-1165G7, Iris Xe G7 96EUs | 1.8 kg | 21.95 mm | 14.00" | 1920x1080 | |
v (old) | 04/2021 | Durabook S14I i7-1165G7, Iris Xe G7 96EUs | 3 kg | 38.1 mm | 14.00" | 1920x1080 |
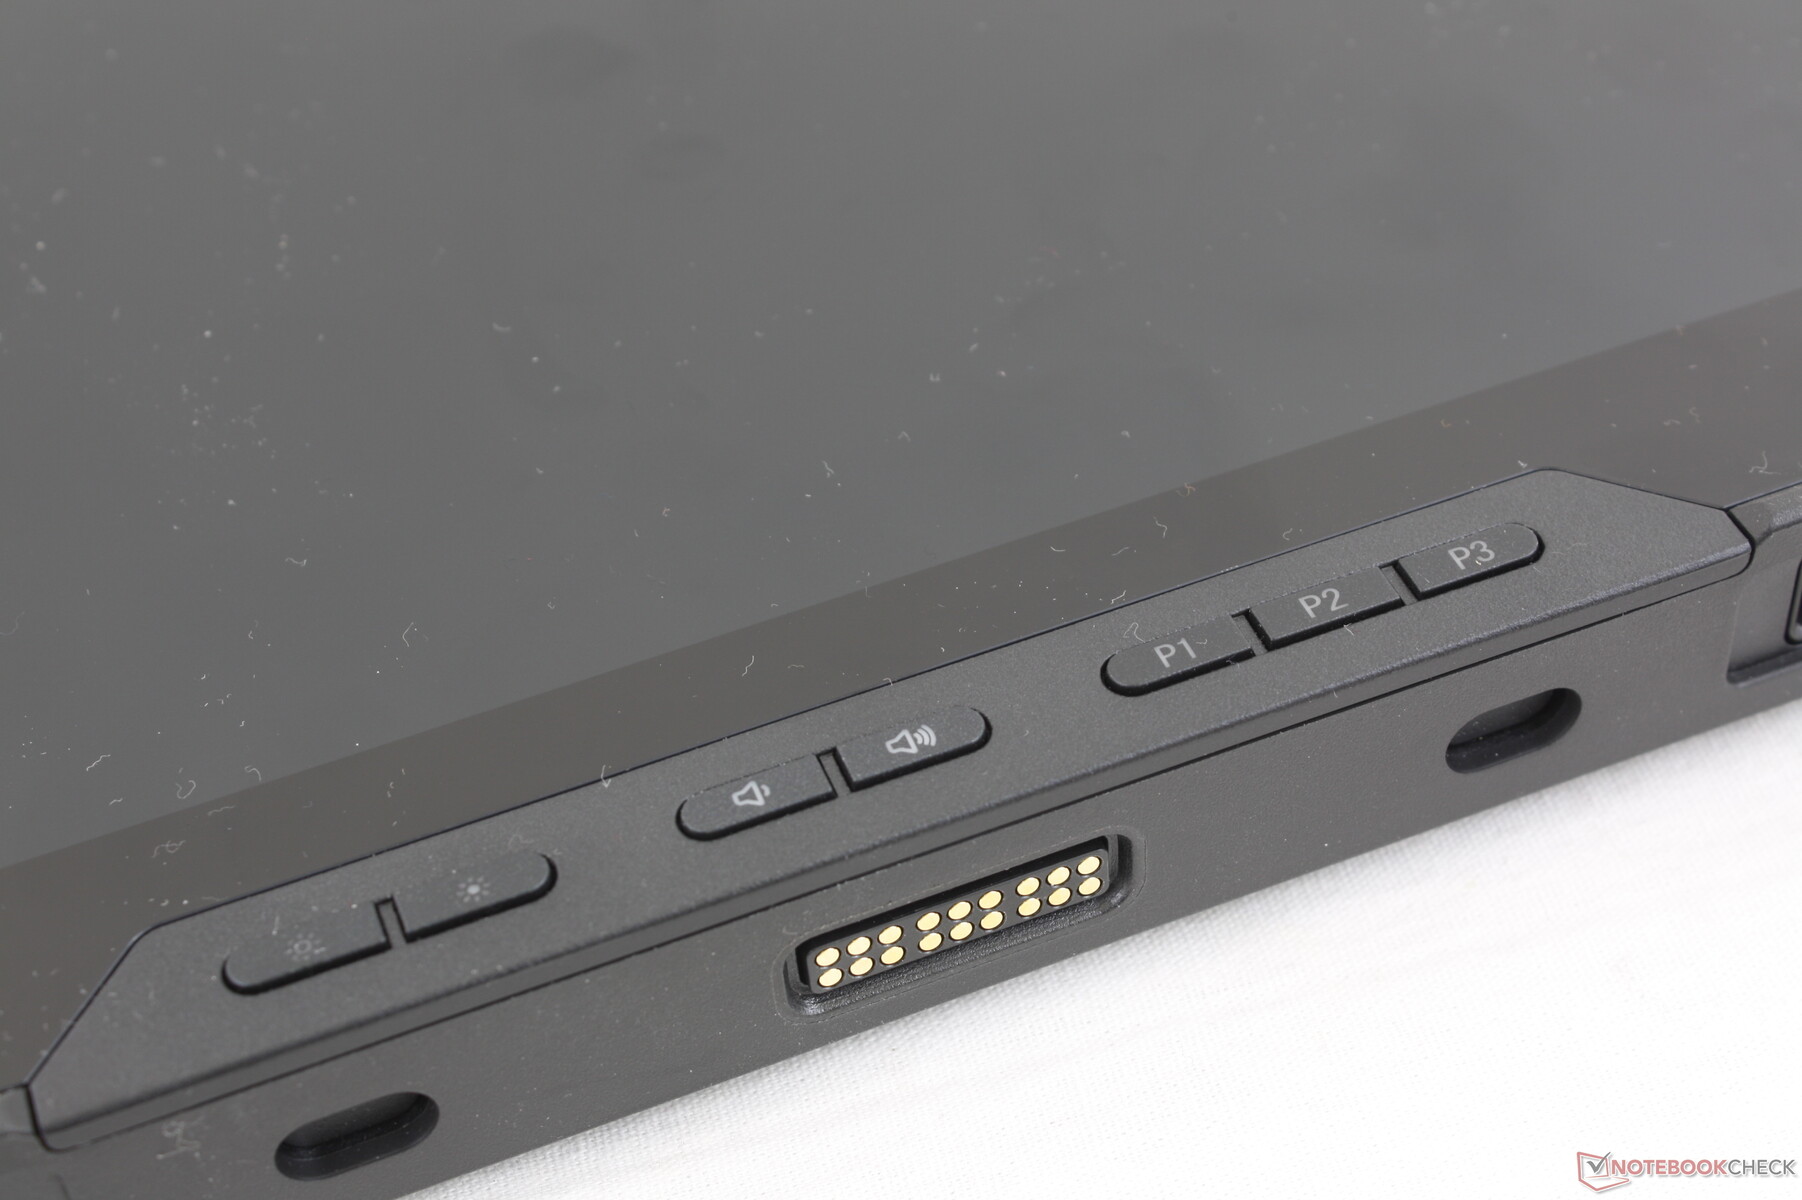
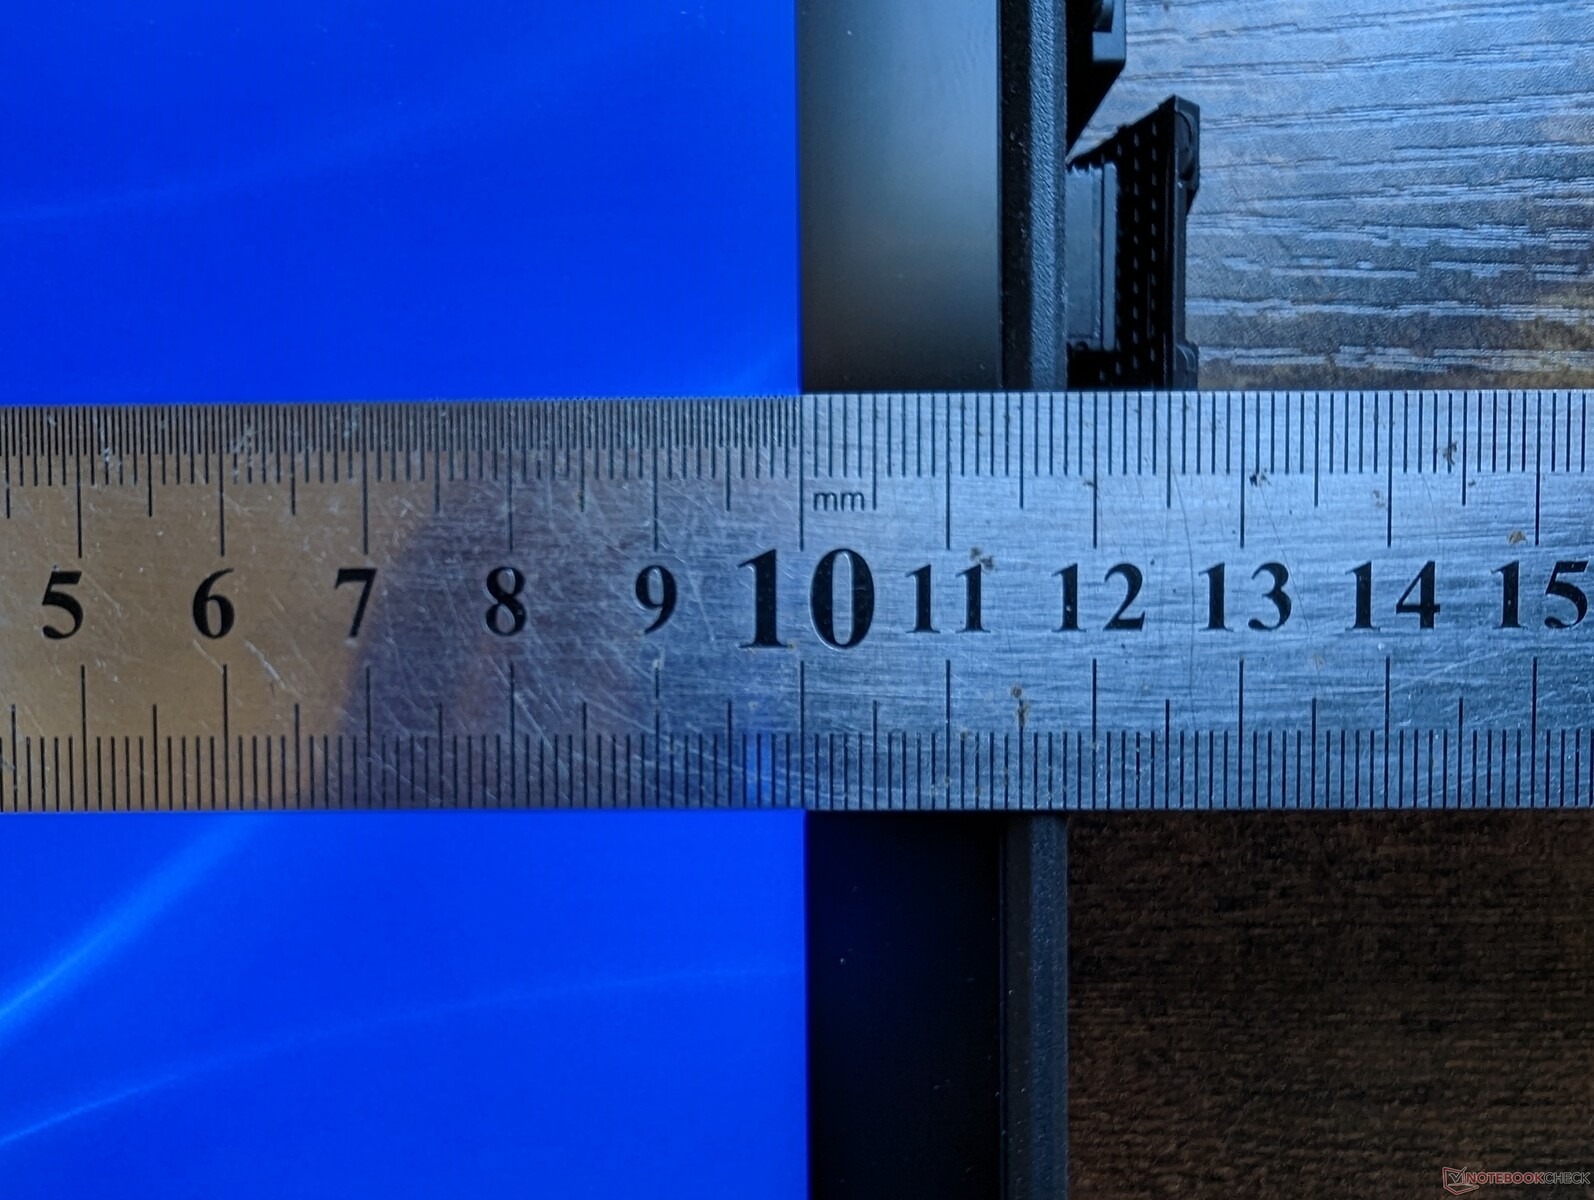
Cassa - Spessa con lunette relativamente strette
Lo chassis è robusto da ogni angolazione, soprattutto lungo i bordi e gli angoli gommati. Il punto più debole è proprio al centro del touchscreen, dove si nota una deformazione quando si preme con un dito. Non si tratta di un problema grave, ma è comunque opportuno segnalare qualsiasi deformazione.
Alcuni aspetti fastidiosi della custodia sono le coperture delle porte e i pulsanti frontali spugnosi. I coperchi delle porte sono difficili da afferrare, mentre le scorciatoie dei pulsanti avrebbero bisogno di una maggiore elasticità quando vengono premuti. Il Toughbook FZ-G2 della concorrenza fa un po' meglio da questo punto di vista.
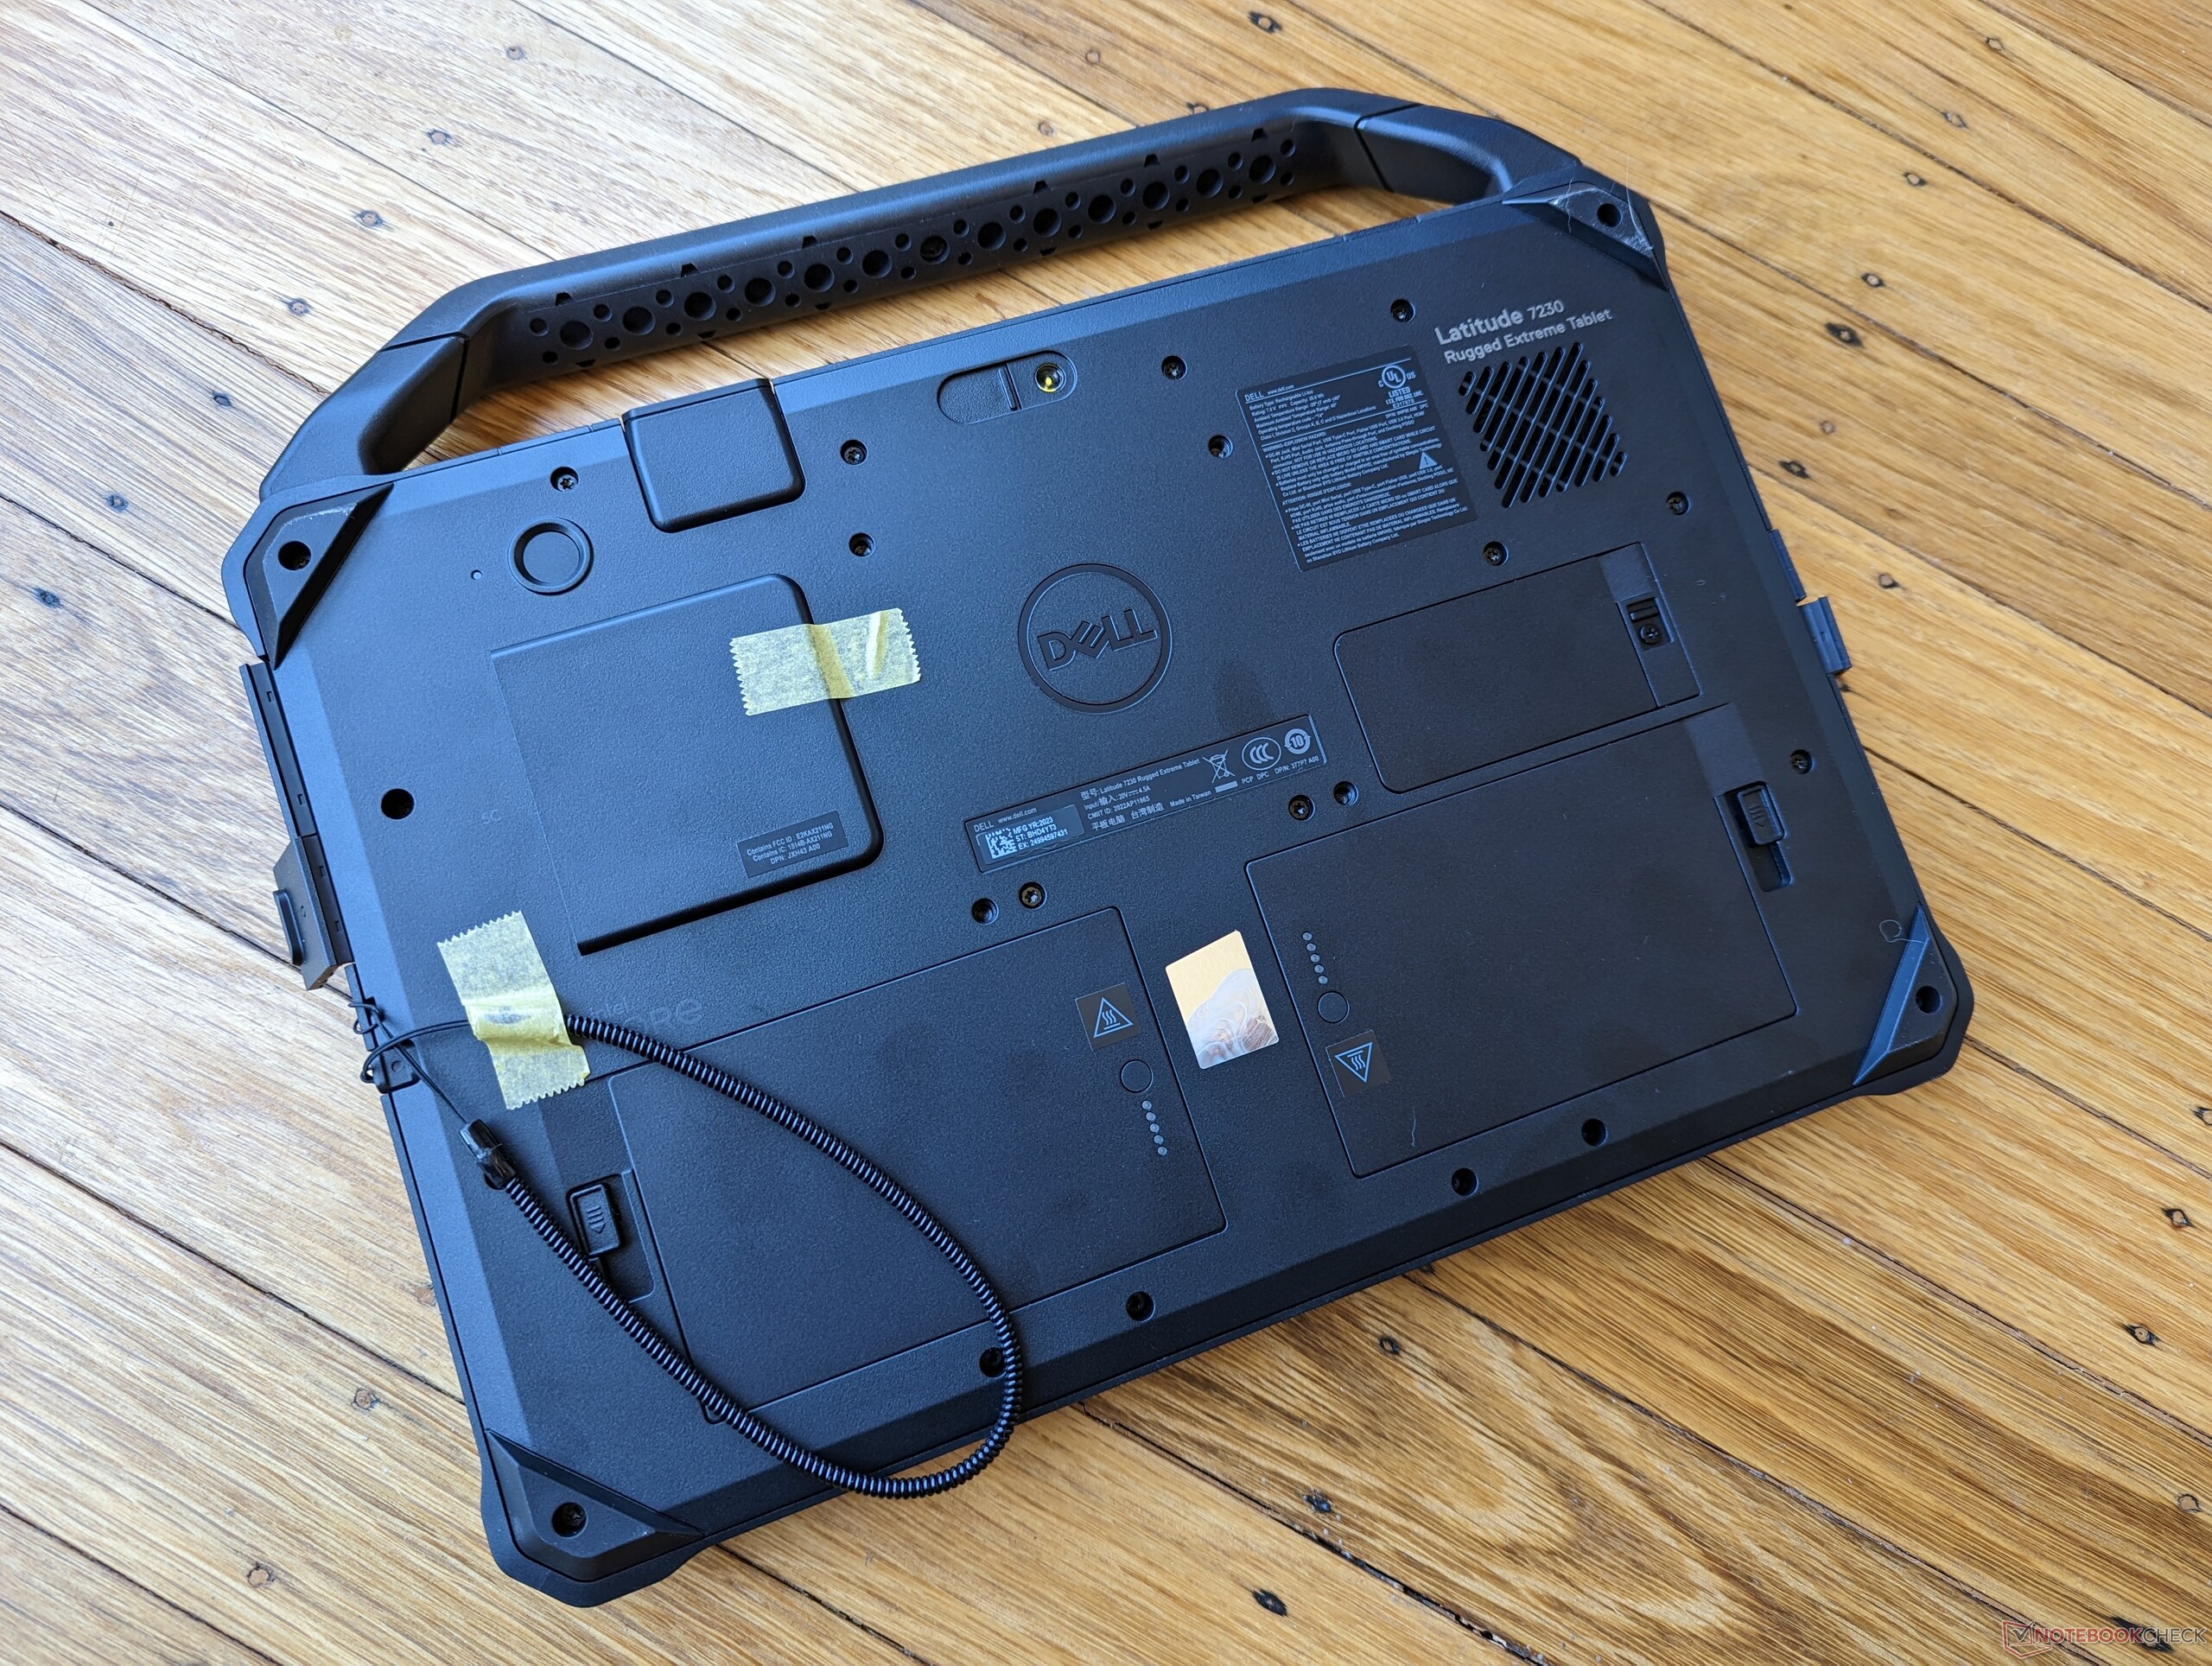
Con un peso di circa 1,6 kg, comprese le due batterie rimovibili, l'unità è uno dei tablet rugged più leggeri della sua categoria. La lunghezza e la larghezza sono comodamente molto vicine allo standard DIN A4, senza considerare la maniglia di trasporto rimovibile.
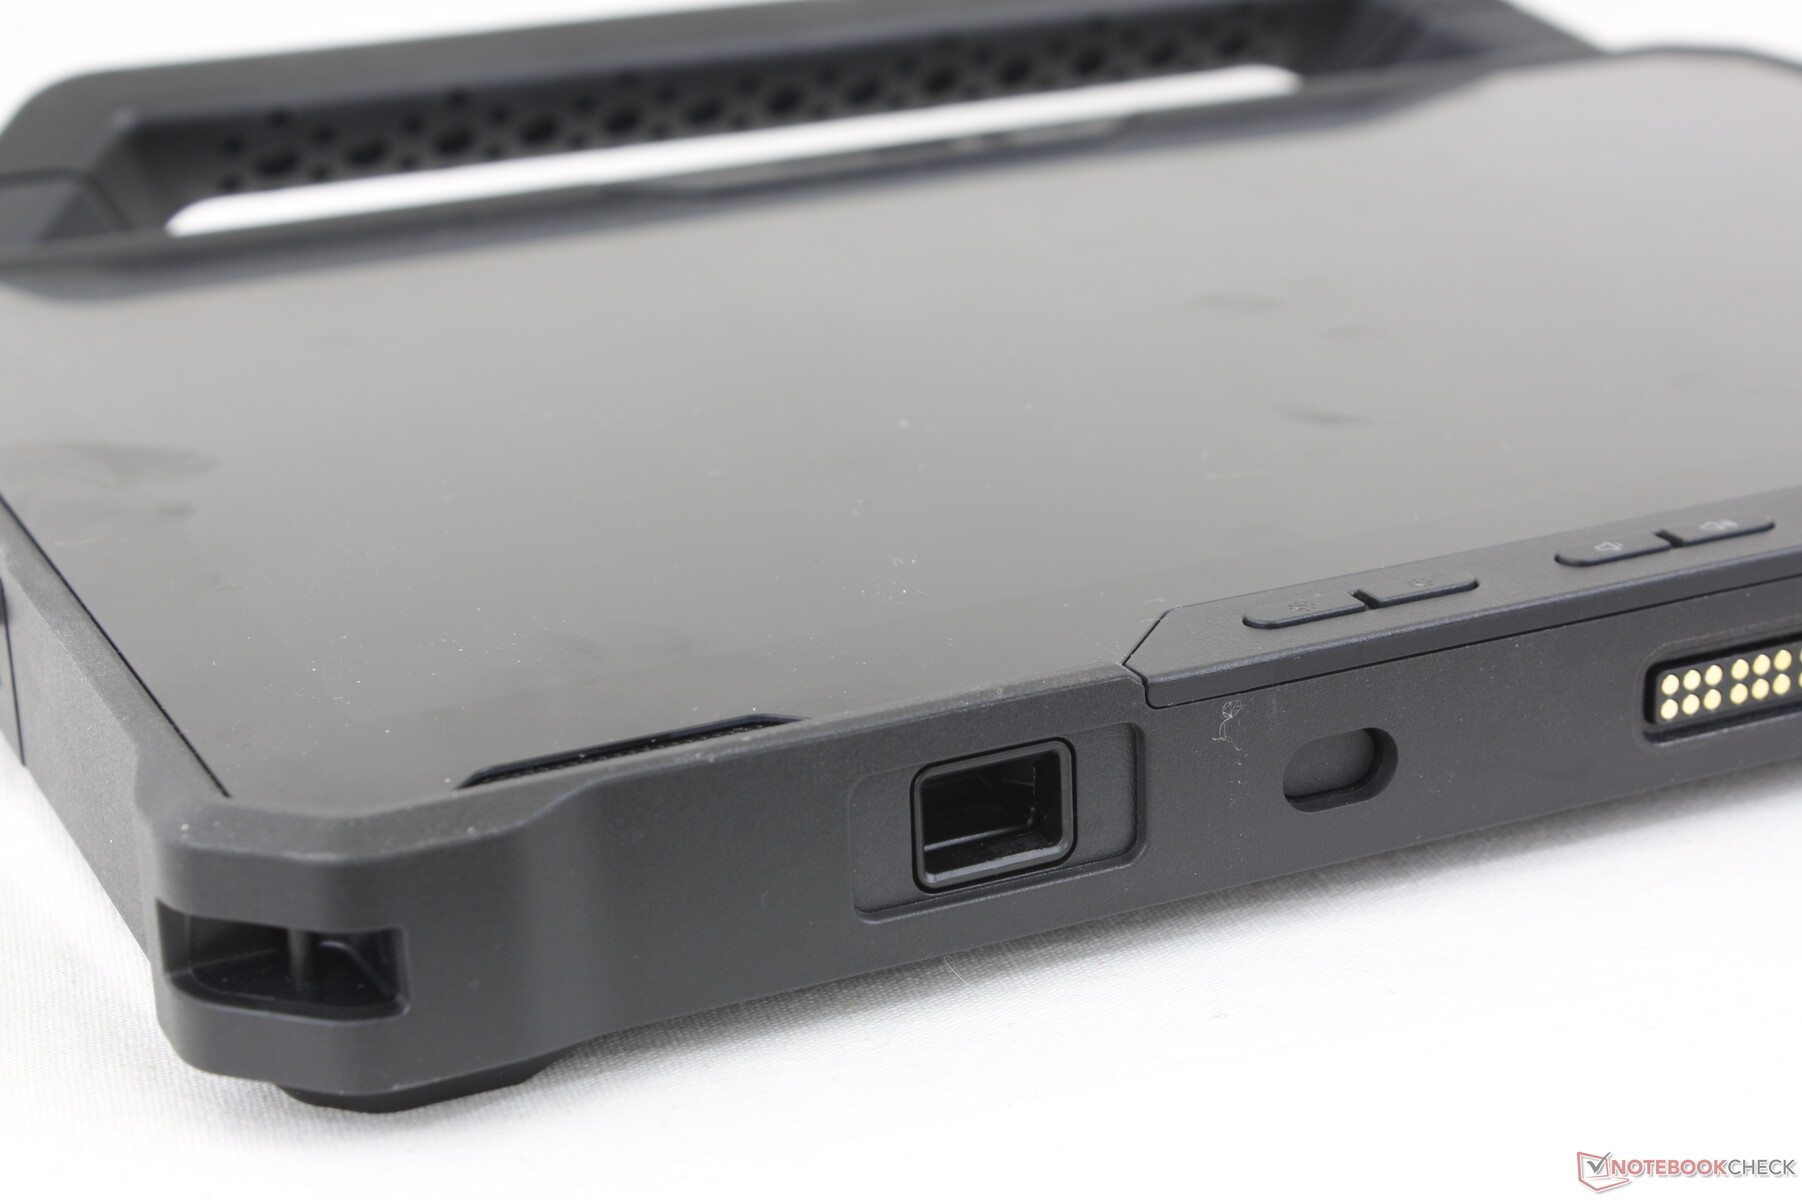
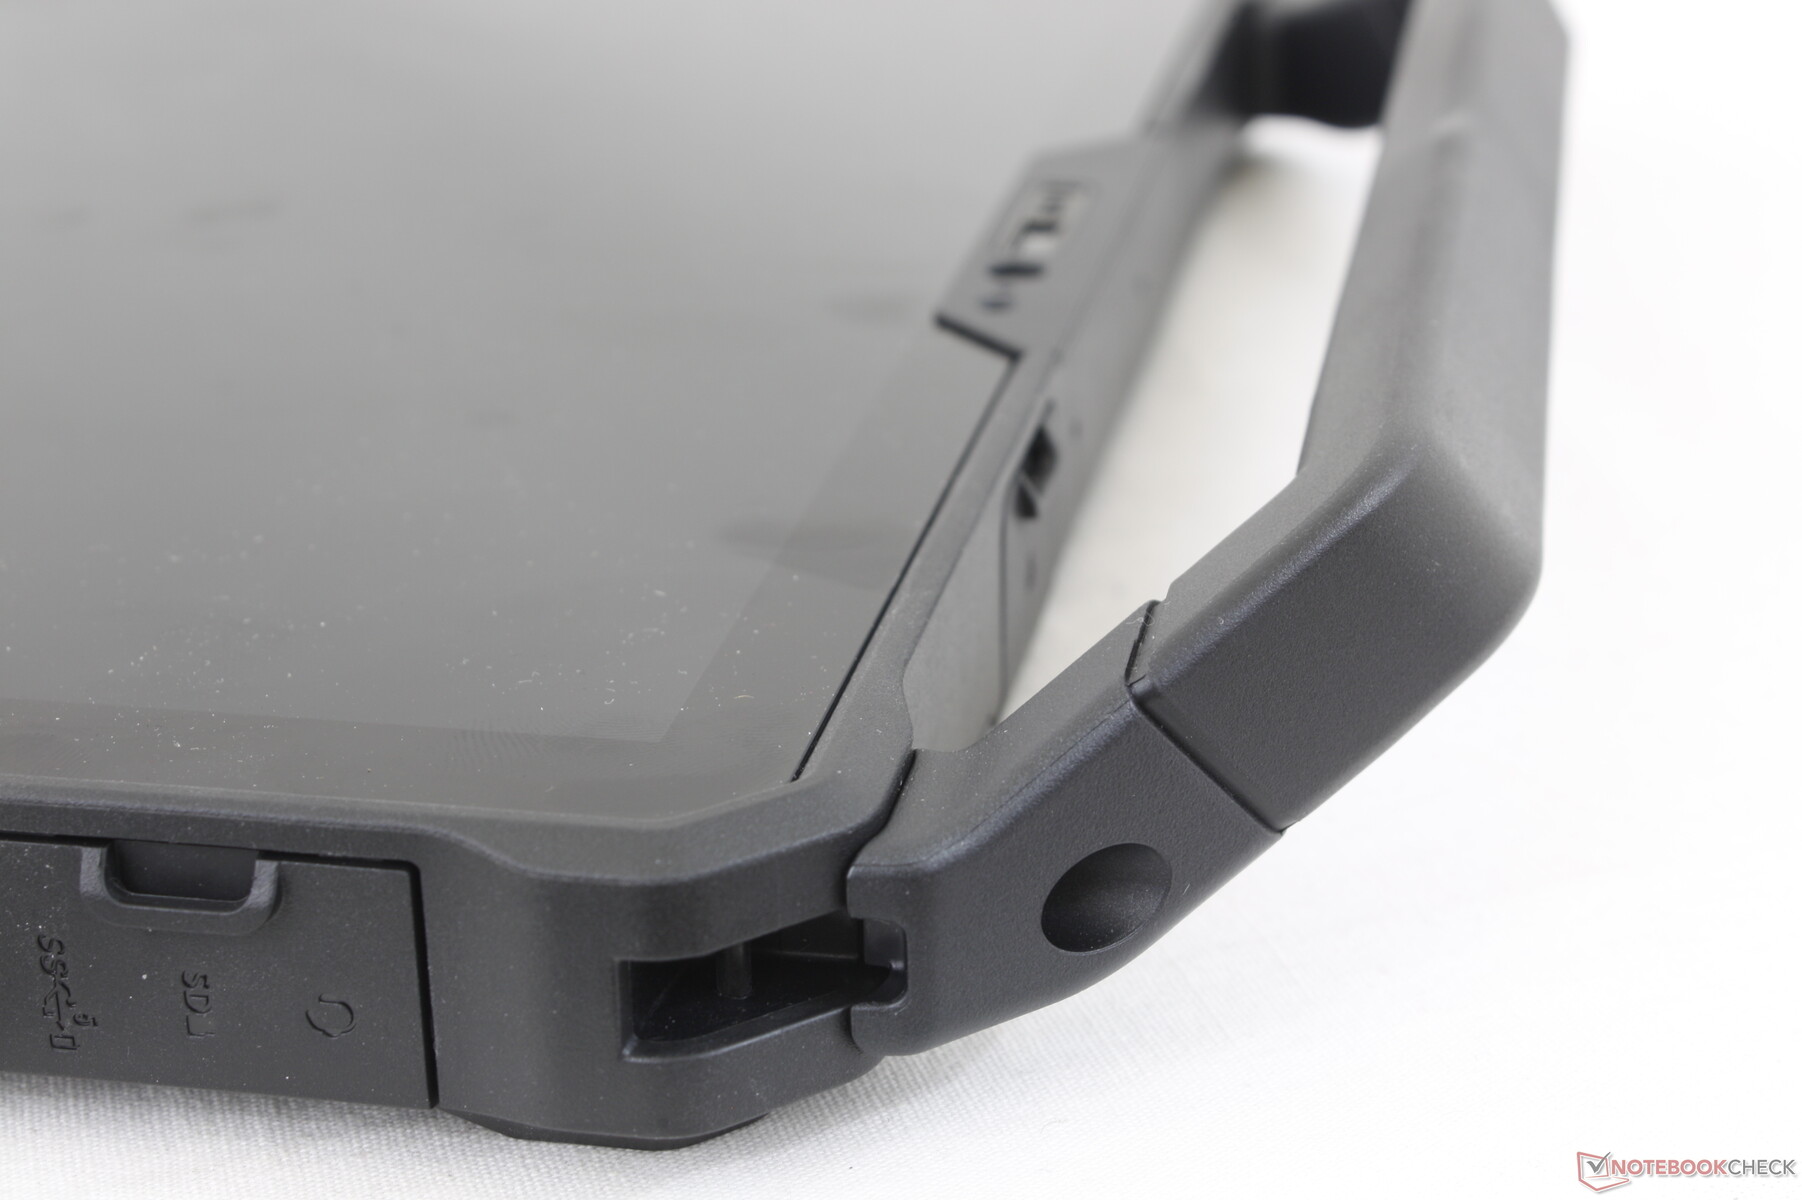
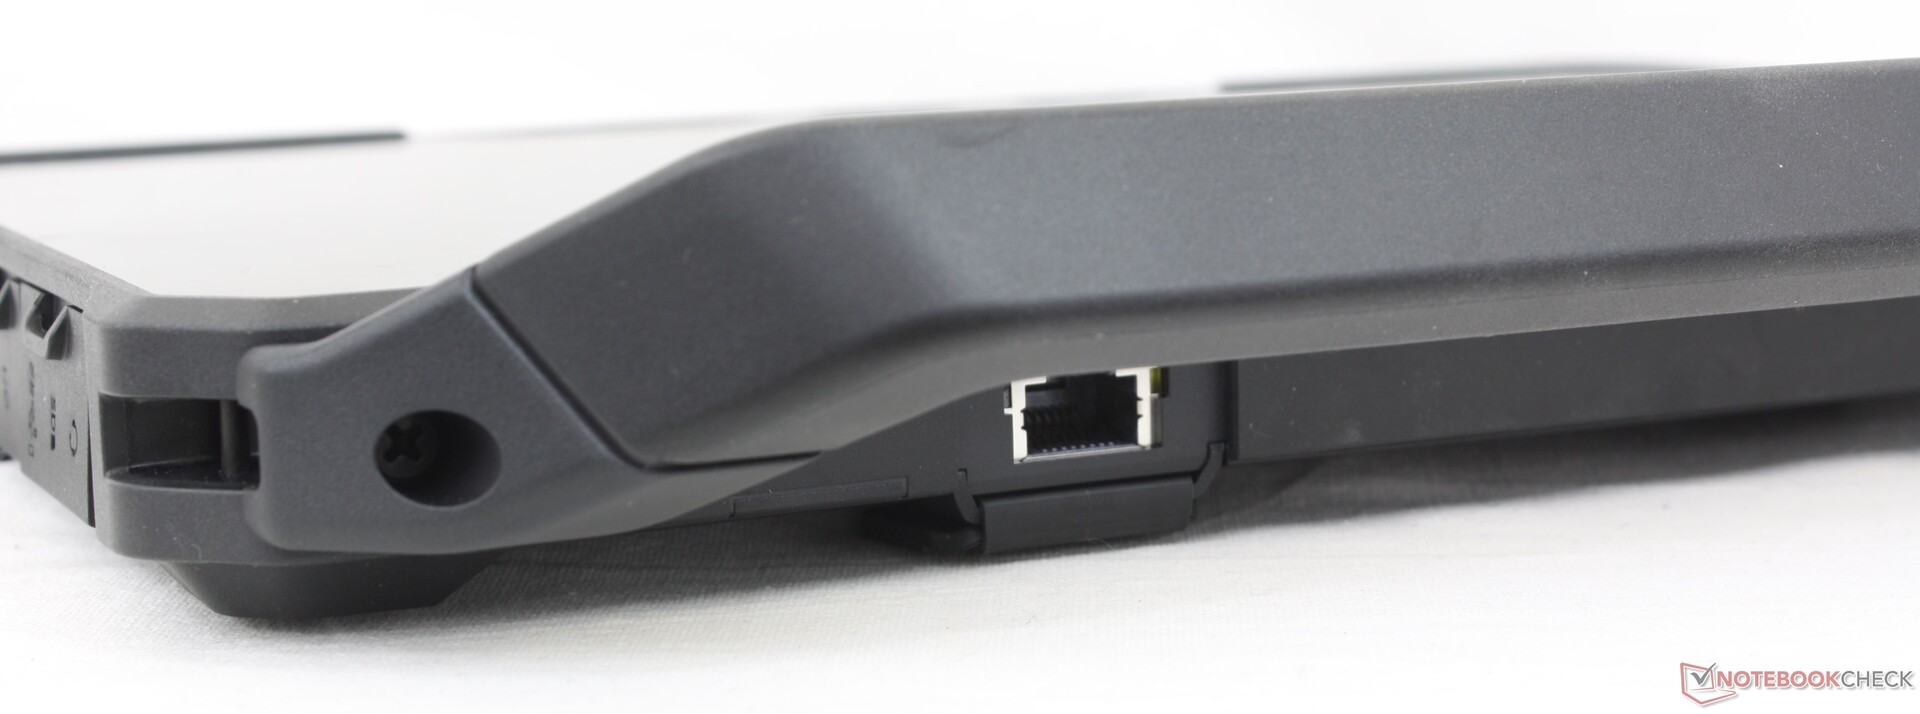
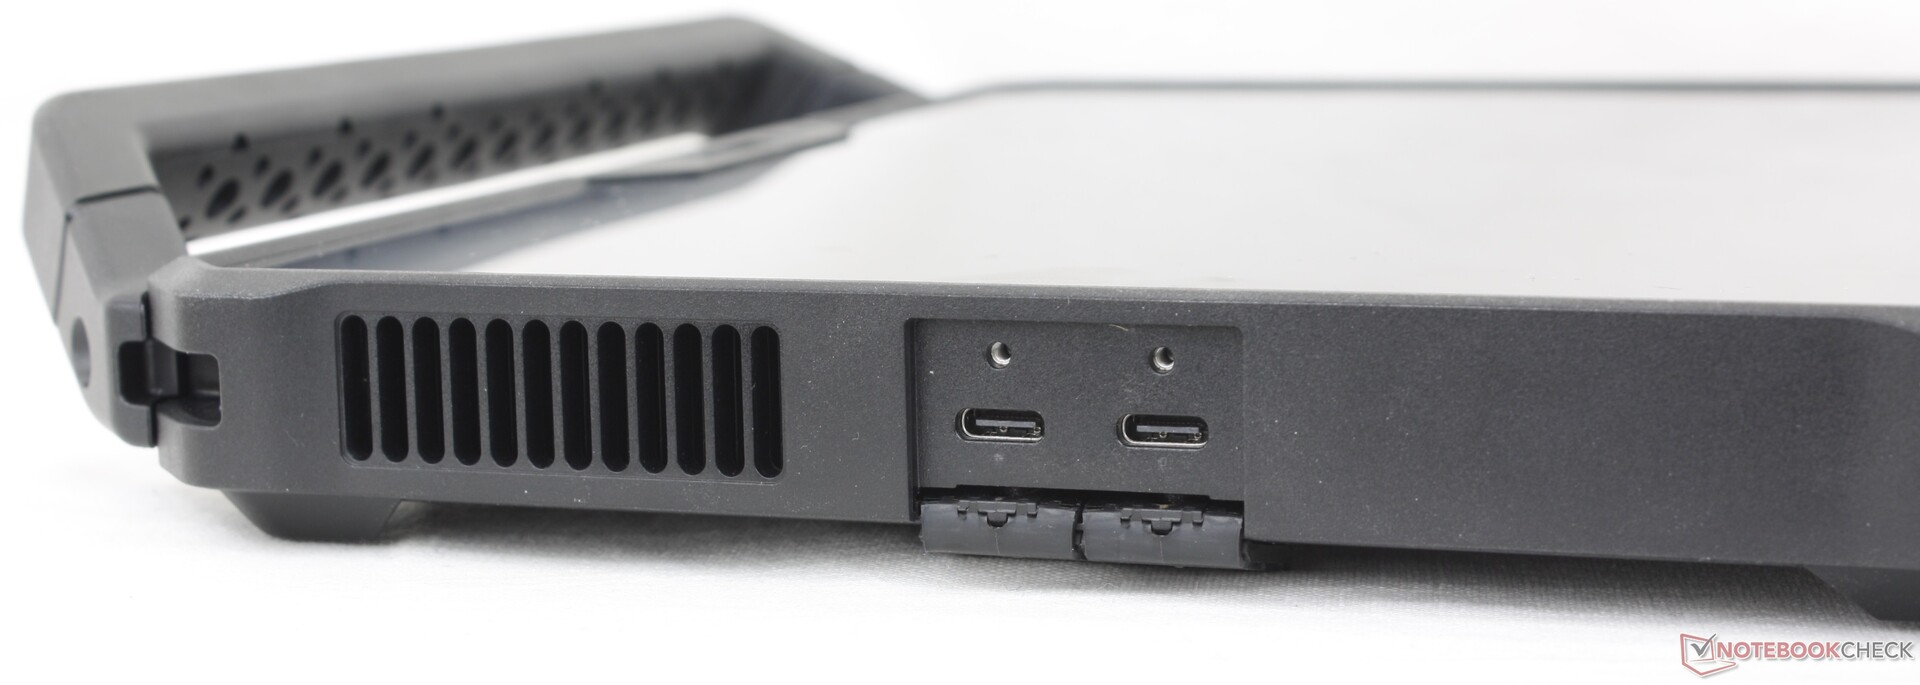
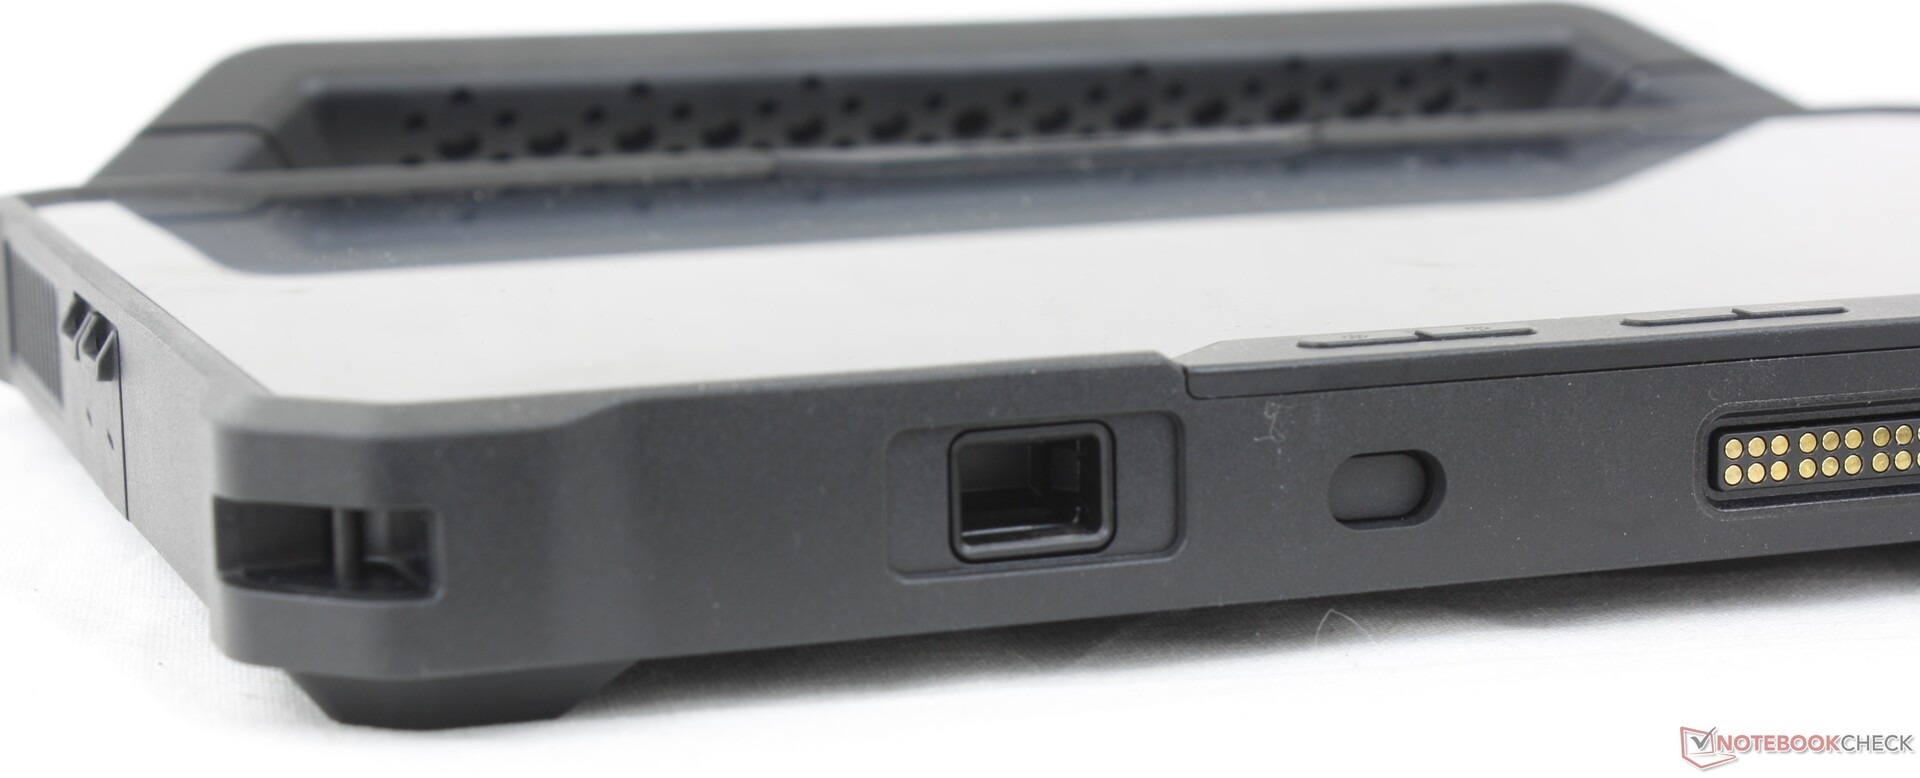
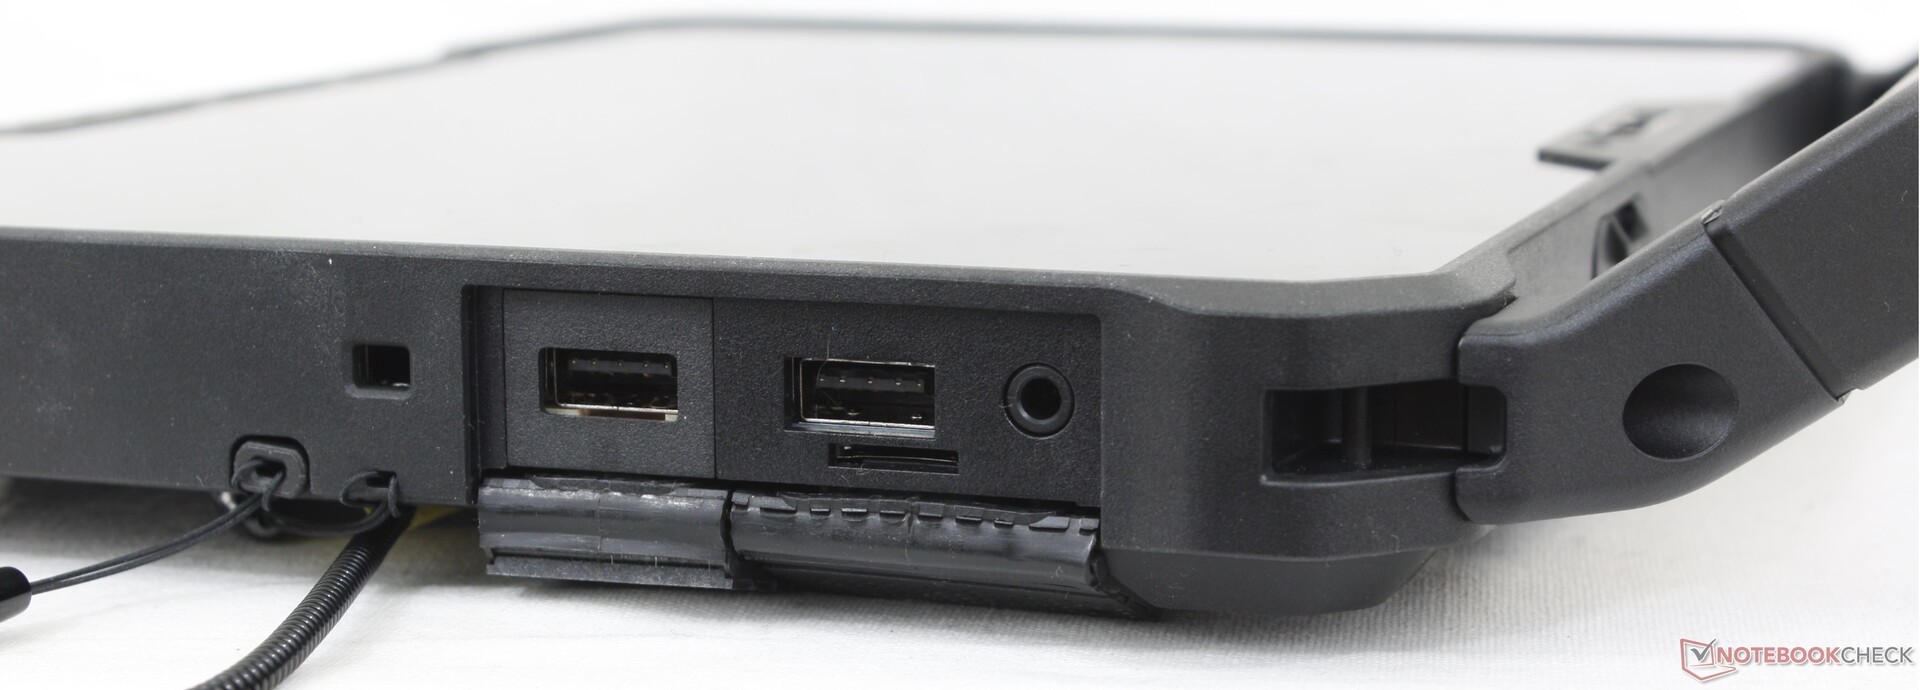
Connettività - Supporto 2x Thunderbolt 4
C'è un'ampia scelta di porte integrate tra cui scegliere. In particolare, le due porte Thunderbolt 4 sono degne di nota in quanto consentono le stesse funzionalità di docking e il supporto di monitor esterni dei moderni ultrabook consumer. Tenete comunque presente che una sarà sempre occupata per la ricarica.
La maggior parte delle altre porte sono opzionali e possono essere configurate al momento del checkout, tra cui HDMI 2.0, USB-A, RJ-45, RS-232 o uno scanner di codici a barre.
Lettore di schede SD
| SD Card Reader | |
| average JPG Copy Test (av. of 3 runs) | |
| Dell Latitude 7330 Rugged Extreme (AV Pro V60) | |
| Dell Latitude 7230 Rugged Extreme (AV Pro V60) | |
| Panasonic Toughbook 40 (AV Pro V60) | |
| Acer Enduro Urban N3 EUN314 (AV Pro V60) | |
| Durabook S14I (Angelbird 128GB AV Pro UHS-II) | |
| maximum AS SSD Seq Read Test (1GB) | |
| Dell Latitude 7330 Rugged Extreme (AV Pro V60) | |
| Dell Latitude 7230 Rugged Extreme (AV Pro V60) | |
| Panasonic Toughbook 40 (AV Pro V60) | |
| Durabook S14I (Angelbird 128GB AV Pro UHS-II) | |
| Acer Enduro Urban N3 EUN314 (AV Pro V60) | |
Comunicazione
L'Intel AX211 si comporta in modo affidabile quando è abbinato al nostro router di test Asus AXE11000 abilitato al Wi-Fi 6E. Il modello può essere configurato senza Wi-Fi, ma raccomandiamo di scegliere con attenzione perché l'installazione da parte dell'utente finale su Latitude 7230 Rugged Extreme è molto più complessa di quella di un tipico ultrabook.
| Networking | |
| iperf3 transmit AX12 | |
| Acer Enduro Urban N3 EUN314 | |
| Durabook S14I | |
| Dell Latitude 7330 Rugged Extreme | |
| Getac B360 | |
| iperf3 receive AX12 | |
| Durabook S14I | |
| Acer Enduro Urban N3 EUN314 | |
| Getac B360 | |
| Dell Latitude 7330 Rugged Extreme | |
| iperf3 transmit AXE11000 | |
| Panasonic Toughbook 40 | |
| Dell Latitude 7230 Rugged Extreme | |
| iperf3 receive AXE11000 | |
| Panasonic Toughbook 40 | |
| Dell Latitude 7230 Rugged Extreme | |
| iperf3 transmit AXE11000 6GHz | |
| Dell Latitude 7230 Rugged Extreme | |
| iperf3 receive AXE11000 6GHz | |
| Dell Latitude 7230 Rugged Extreme | |
Webcam
La webcam posteriore da 11 MP e quella anteriore da 5 MP sono entrambe più nitide di qualsiasi altro computer portatile a conchiglia. Ciascuna webcam ha un proprio cursore fisico per la privacy, mentre la webcam posteriore ha un flash incorporato.
Windows Hello è supportato dalla webcam frontale.


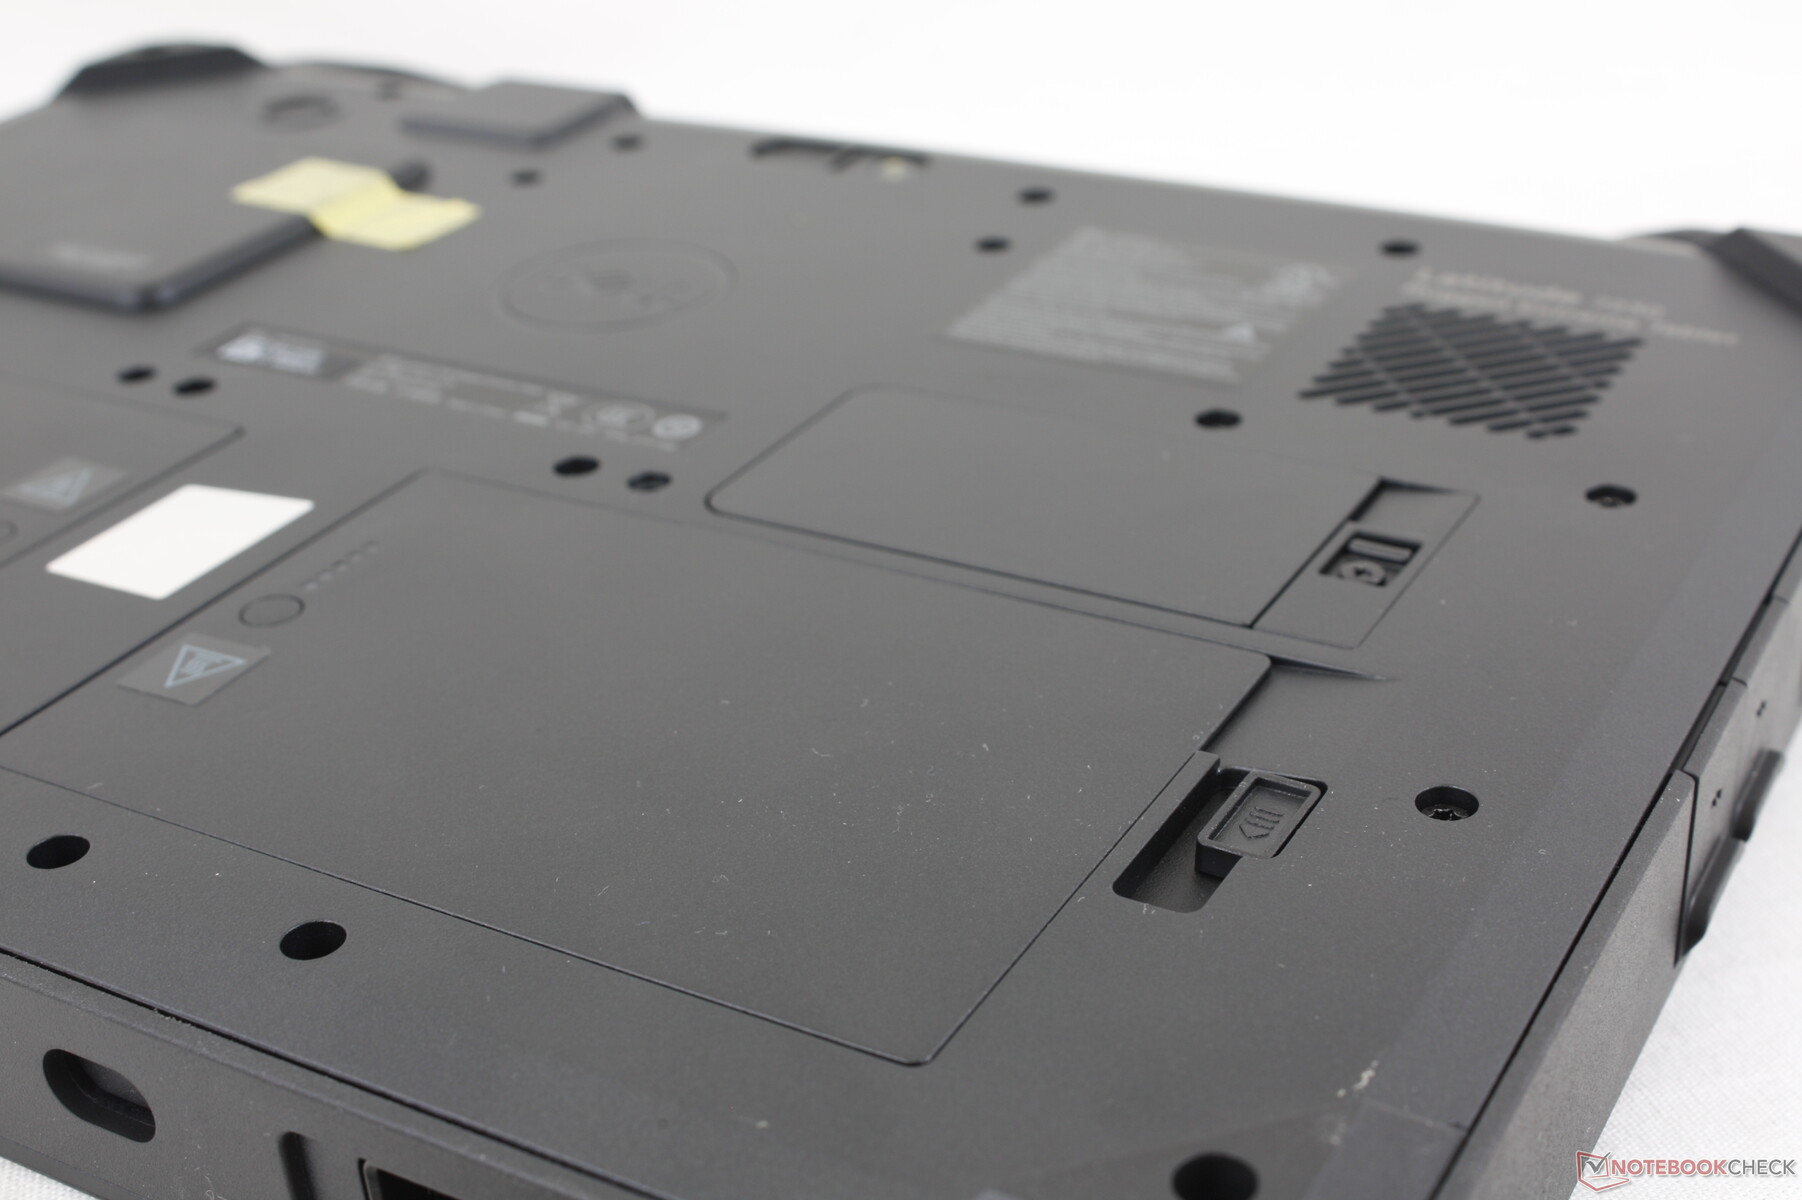
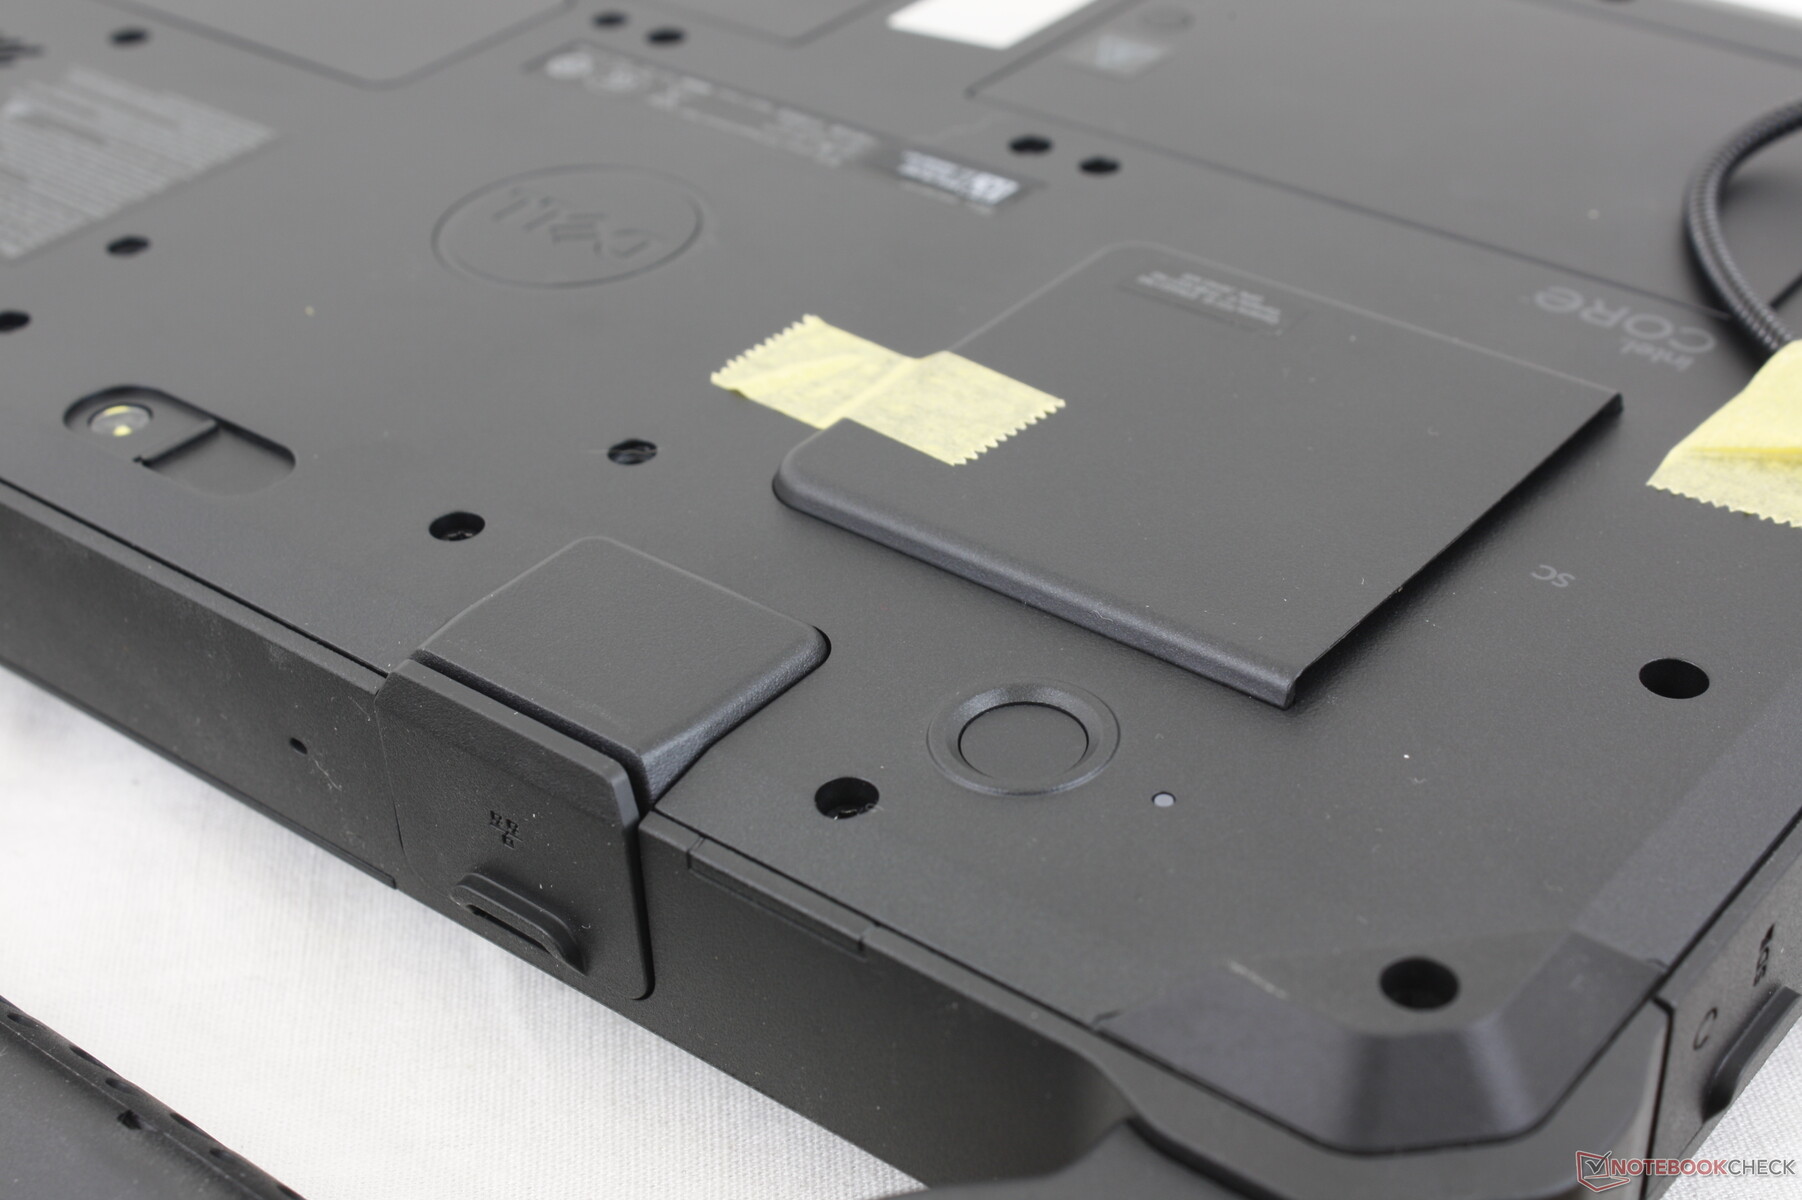
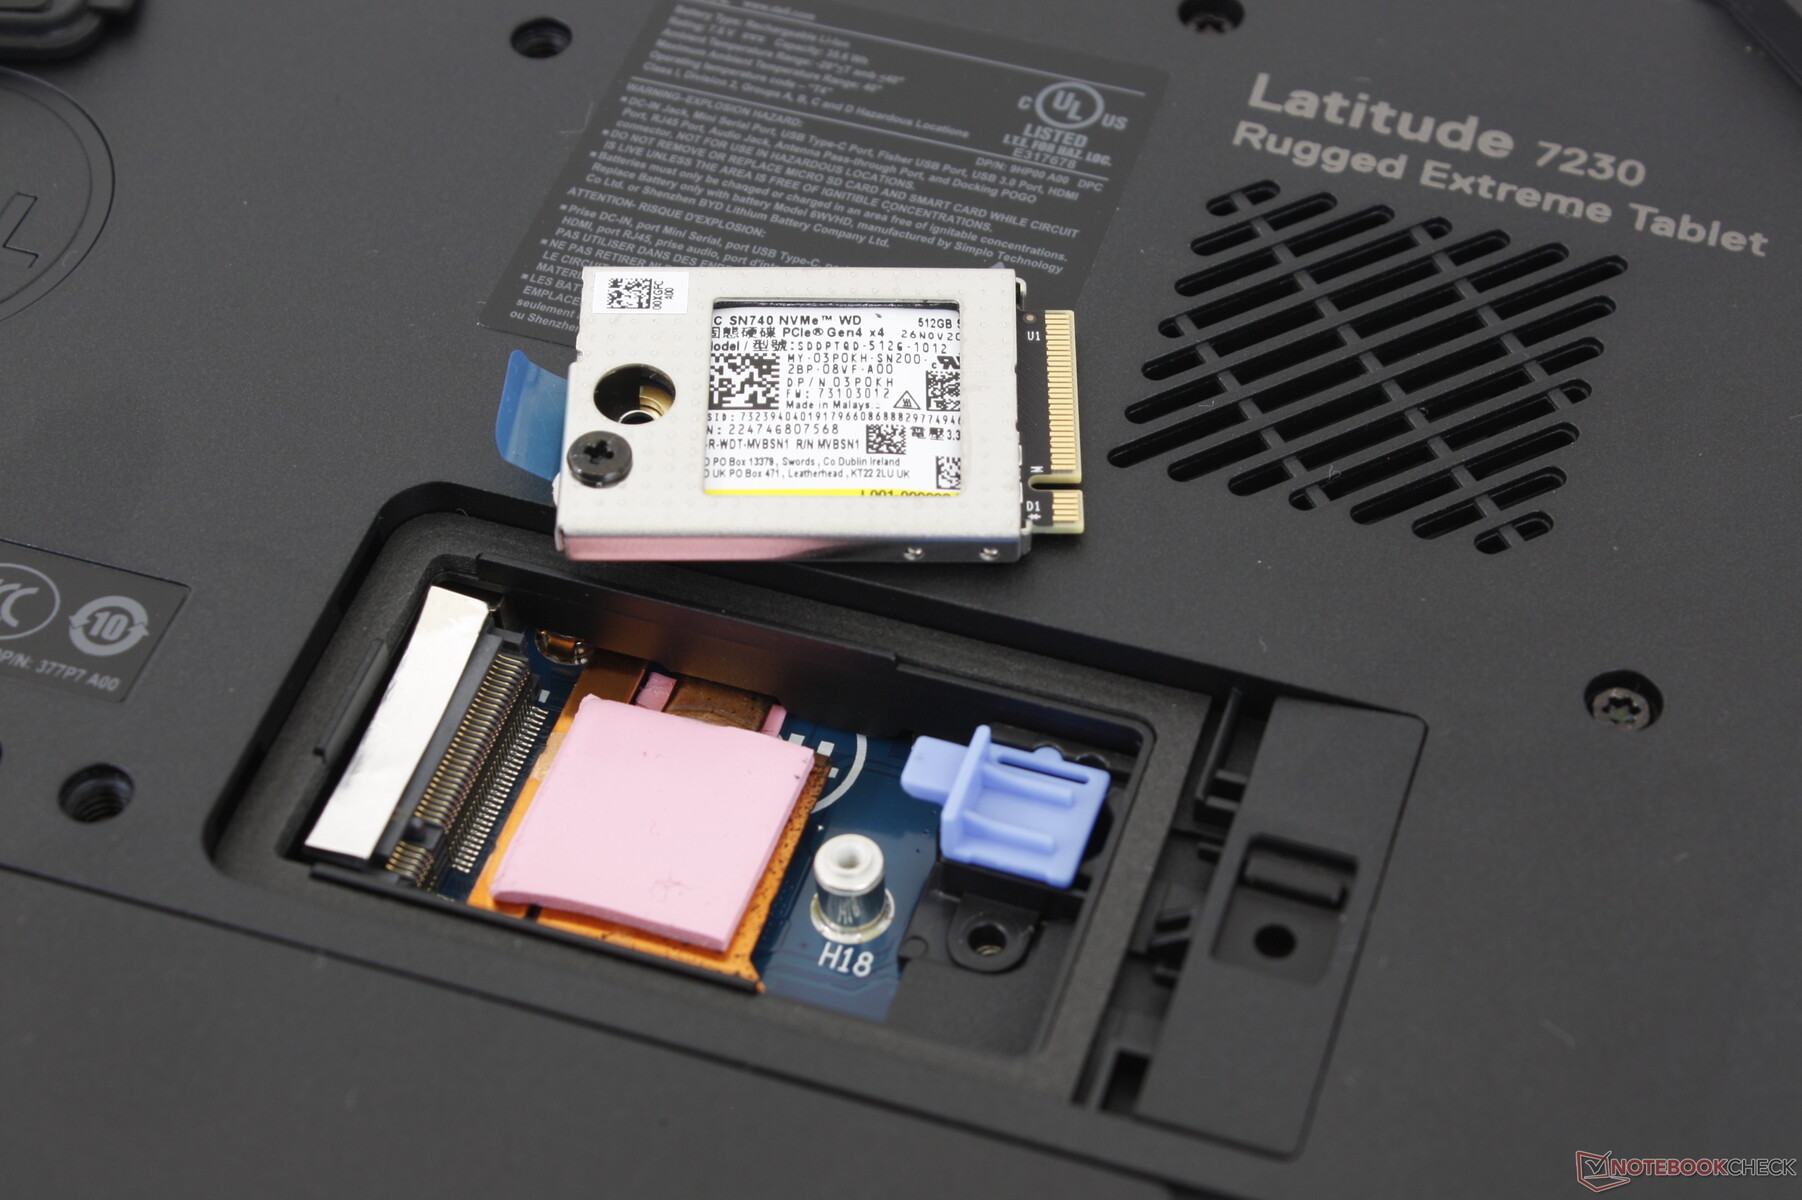
Manutenzione
Il pannello posteriore è fissato da non meno di due dozzine di viti Torx. Fortunatamente, le due batterie e il singolo slot per SSD M.2 sono più facilmente accessibili. La RAM è saldata ed è configurabile solo al momento del checkout.
Un manuale di assistenza ufficiale https://dl.dell.com/content/manual25603516-latitude-7230-rugged-extreme-tablet-service-manual.pdf?language=en-us è disponibile direttamente da Dell se è necessario un ulteriore smontaggio.
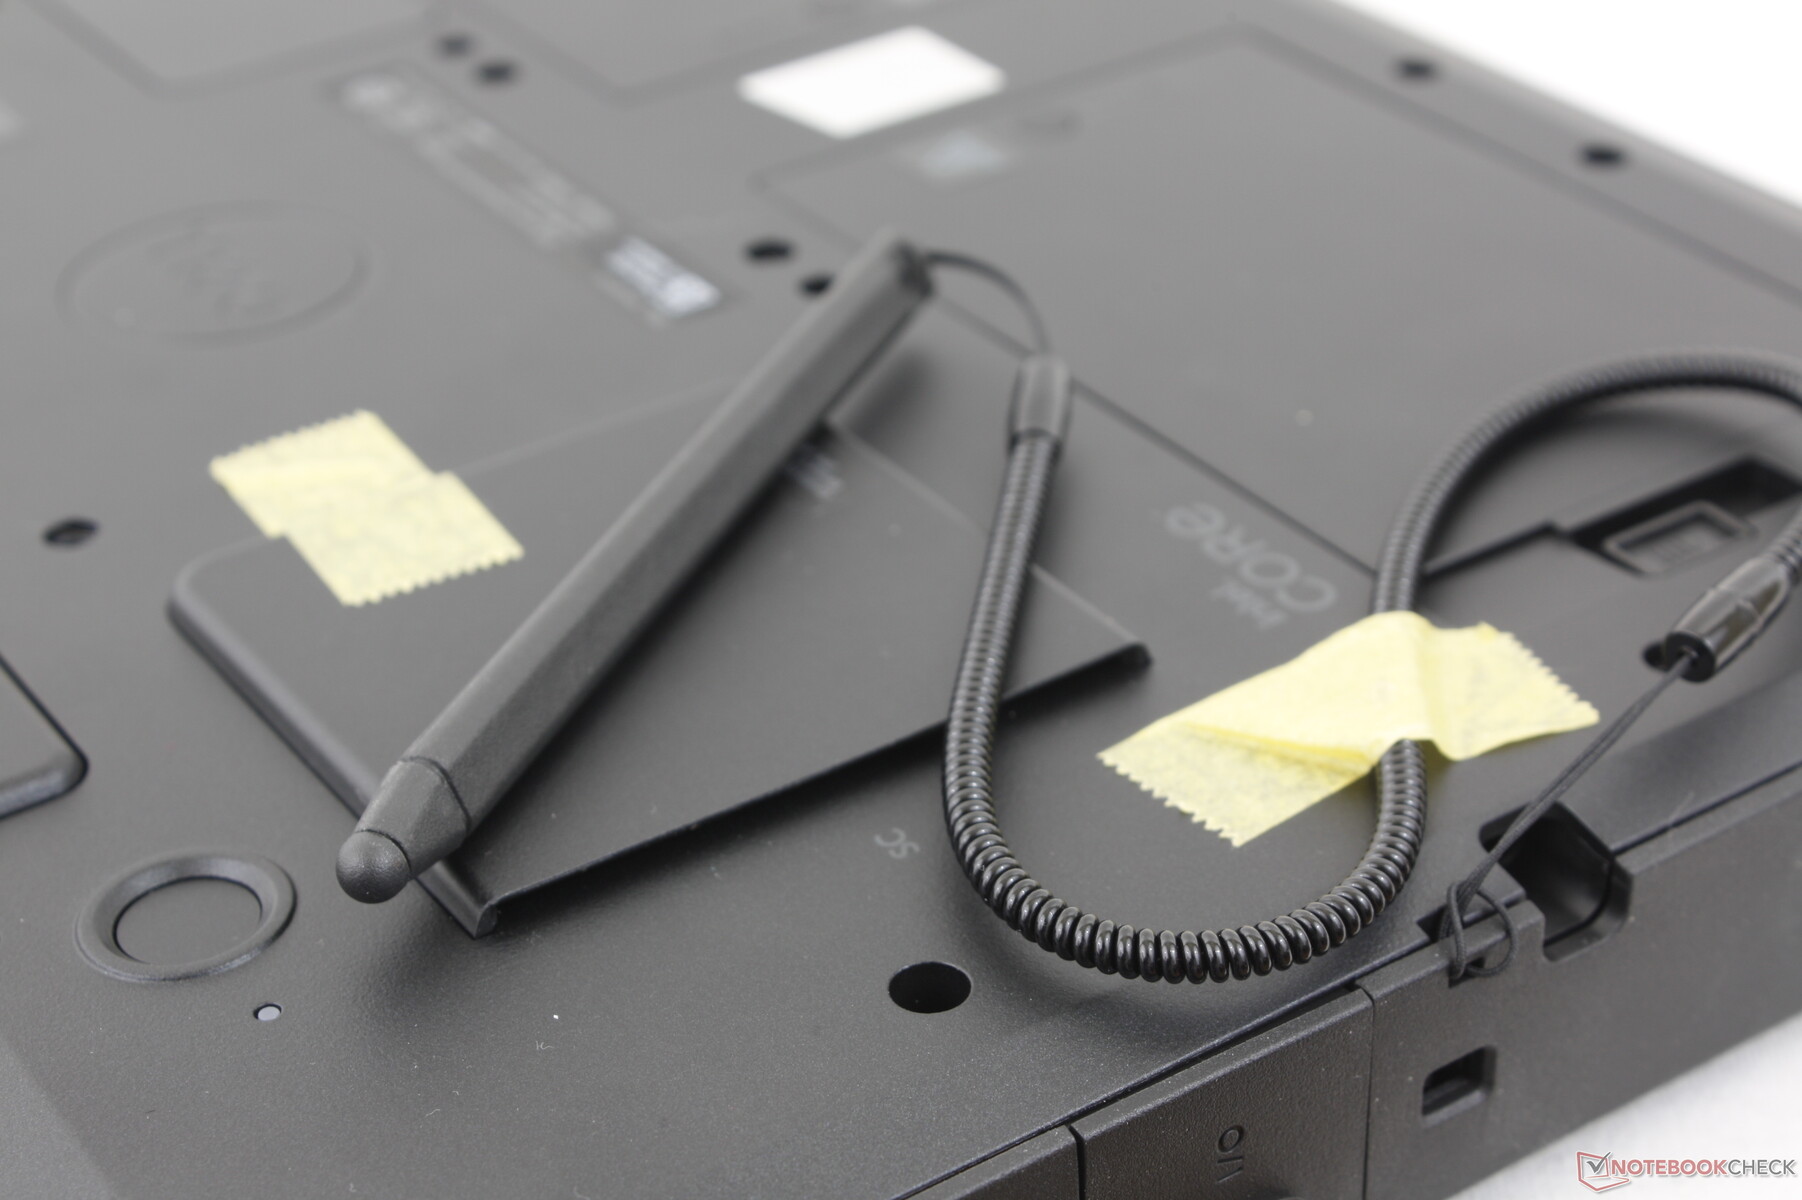
Accessori e garanzia
Gli accessori opzionali includono la tastiera premium, la cinghia per la mano, la penna attiva e molti altri. La confezione di vendita include una penna passiva e una maniglia rigida per il trasporto. La garanzia limitata di tre anni è valida se acquistata negli Stati Uniti.
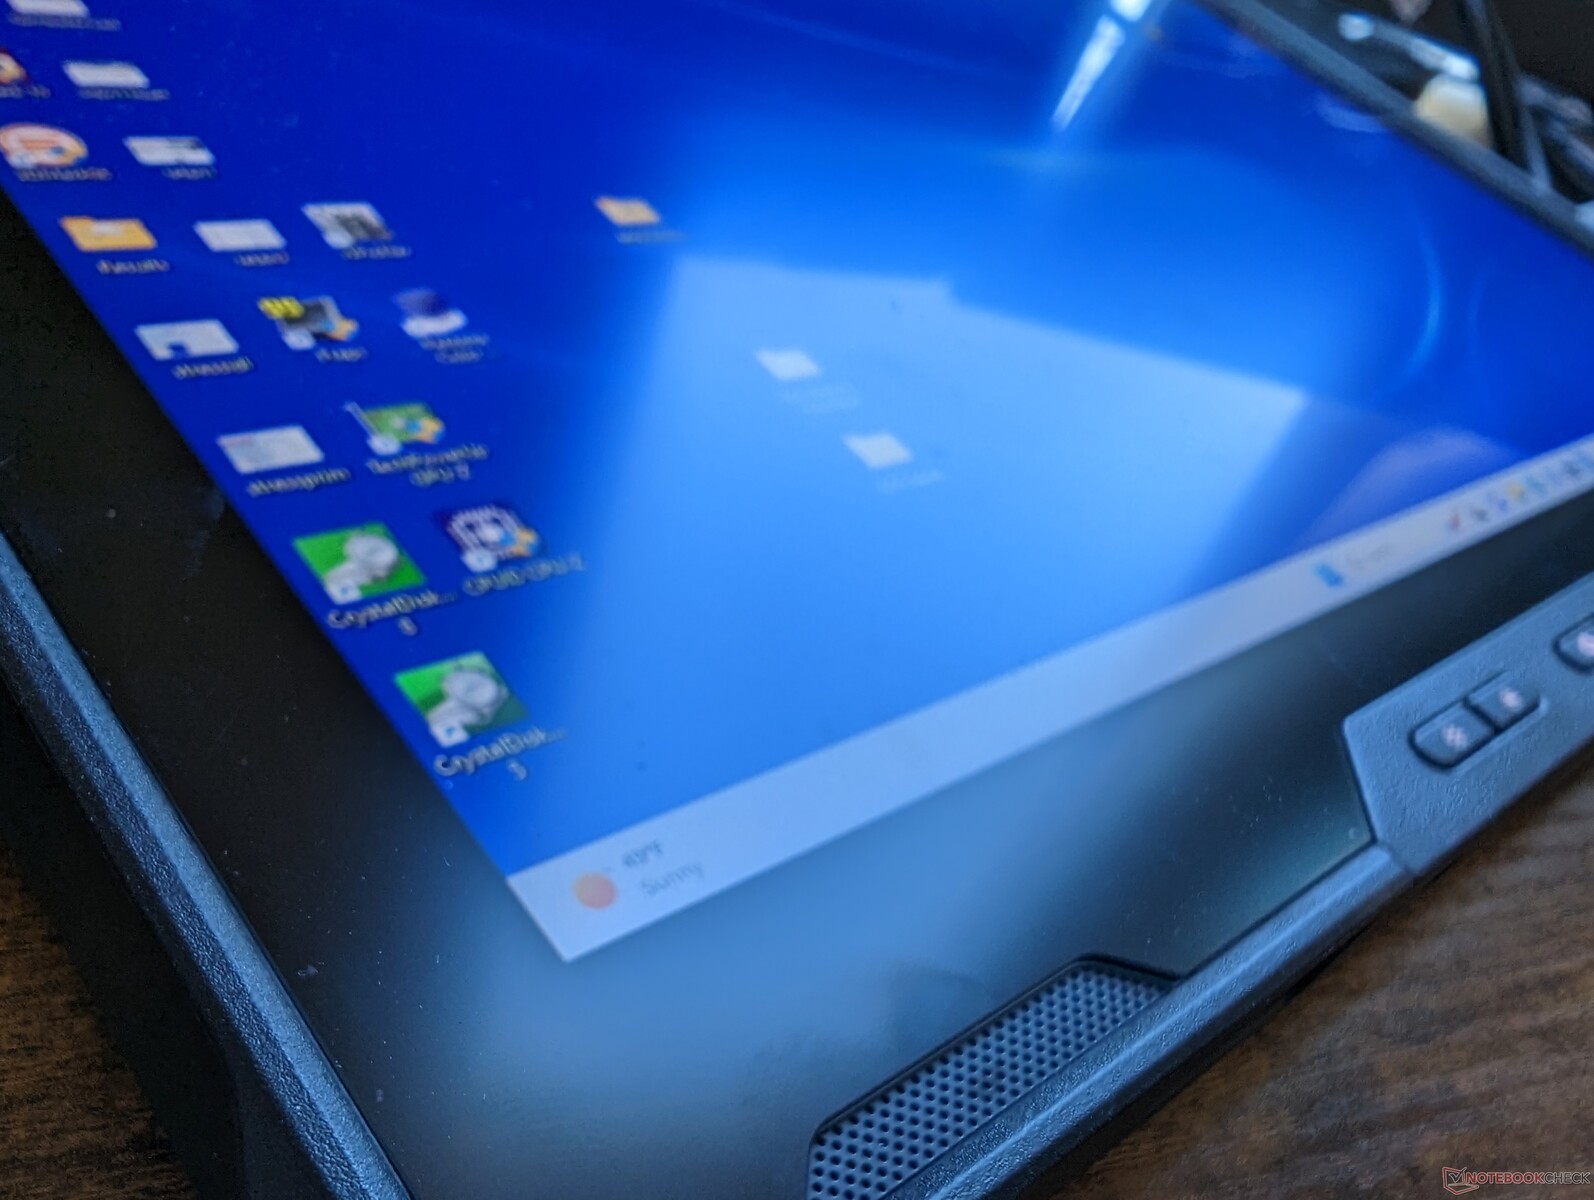
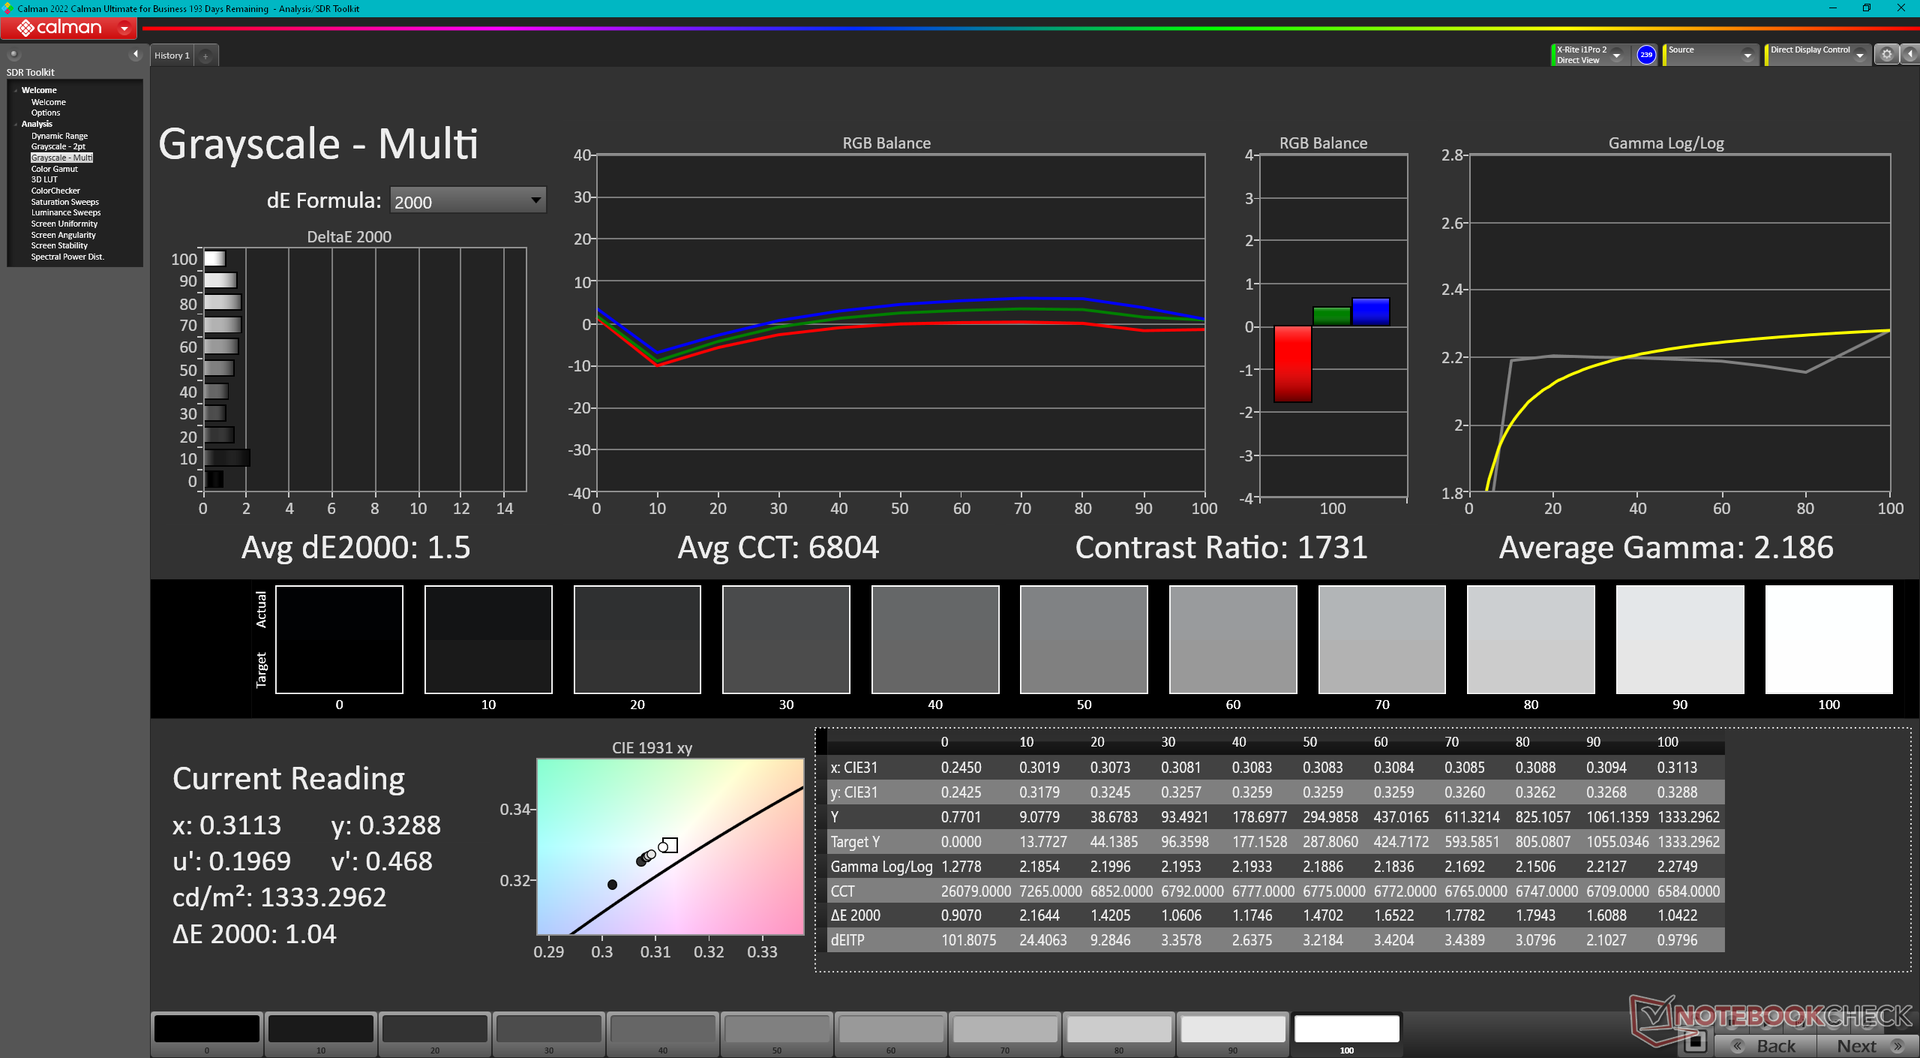
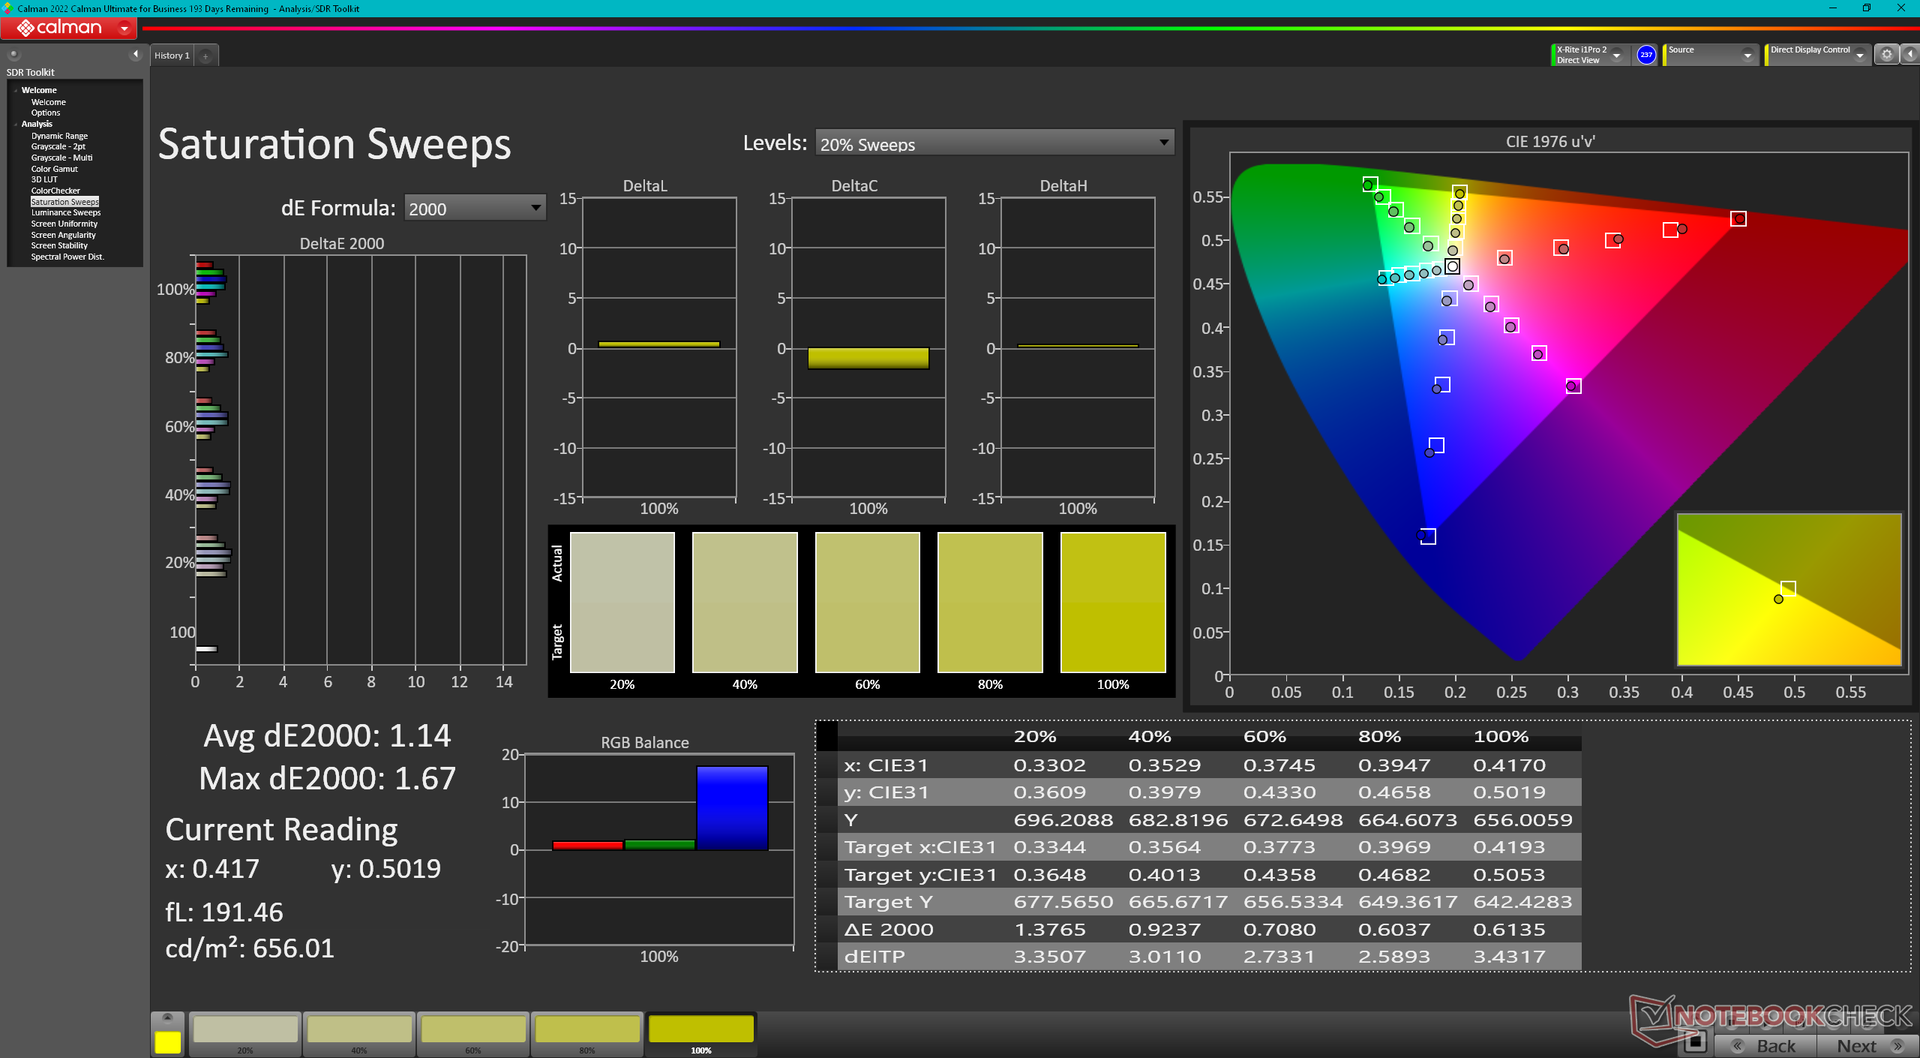
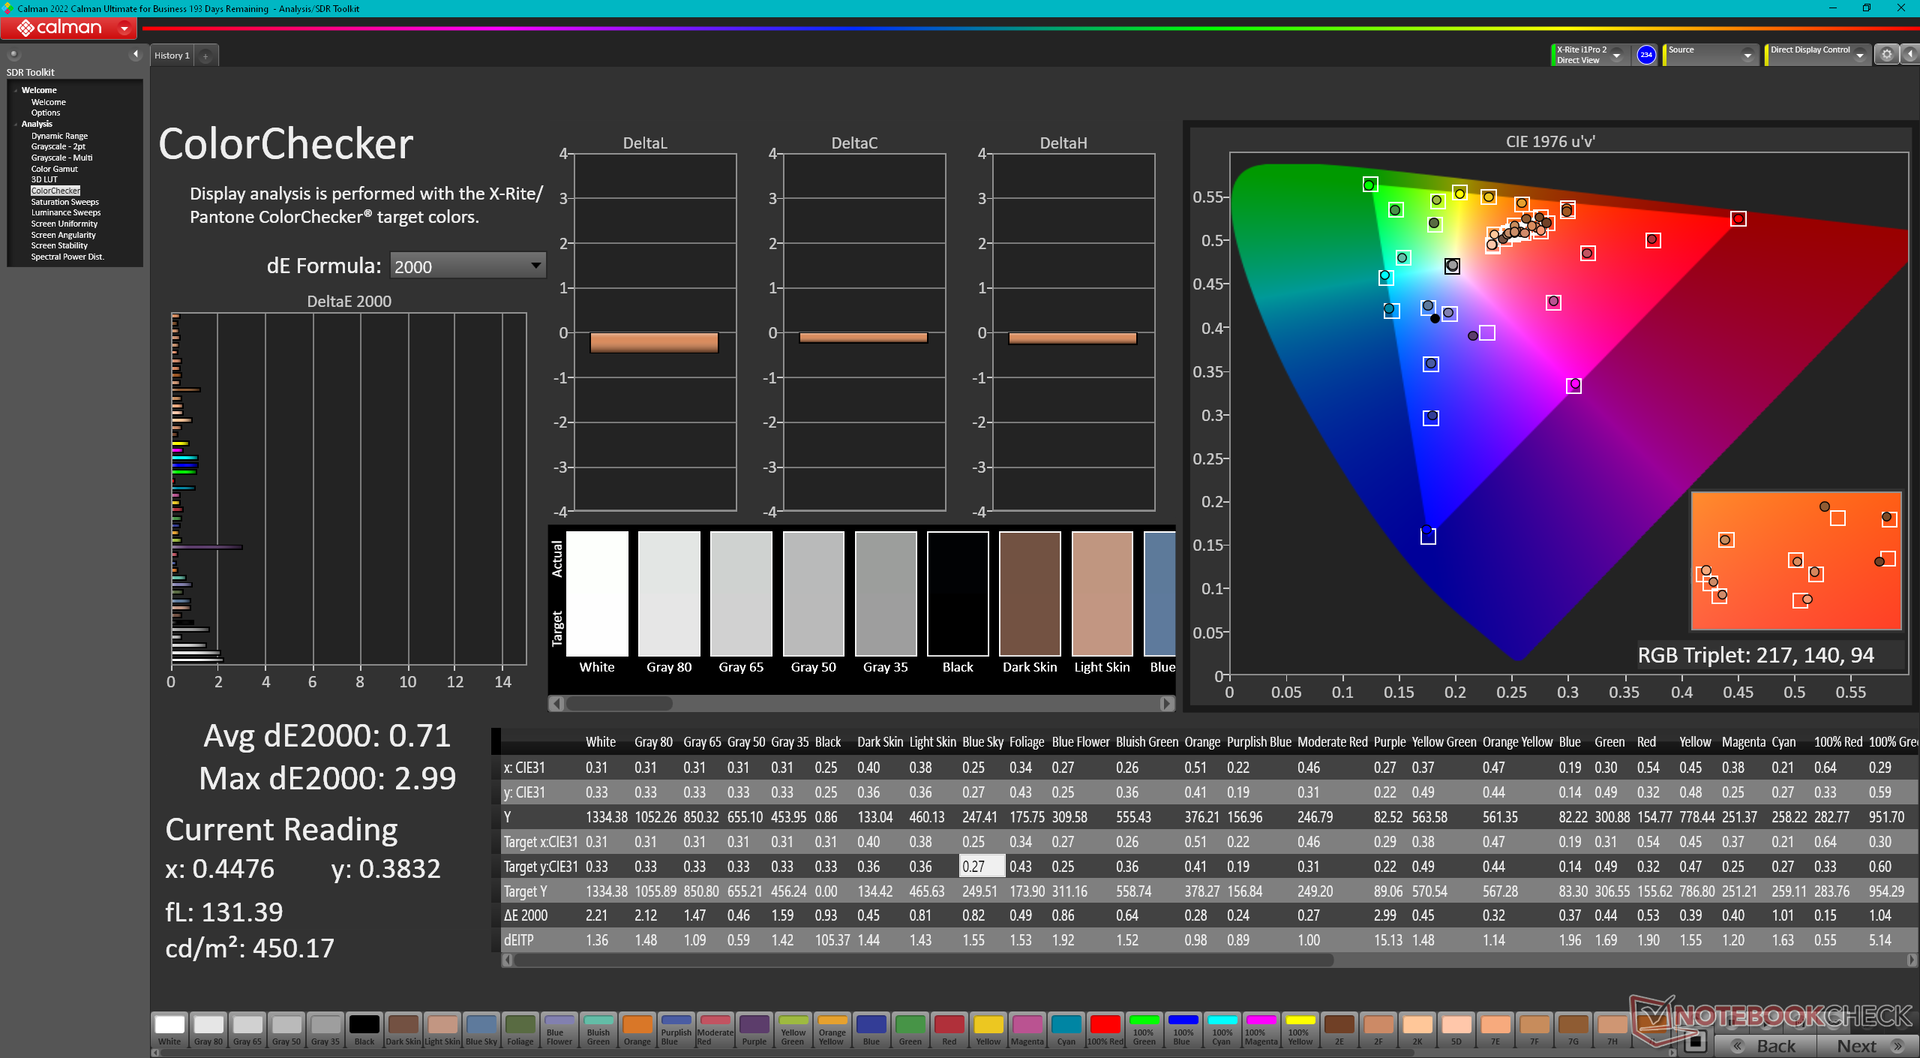
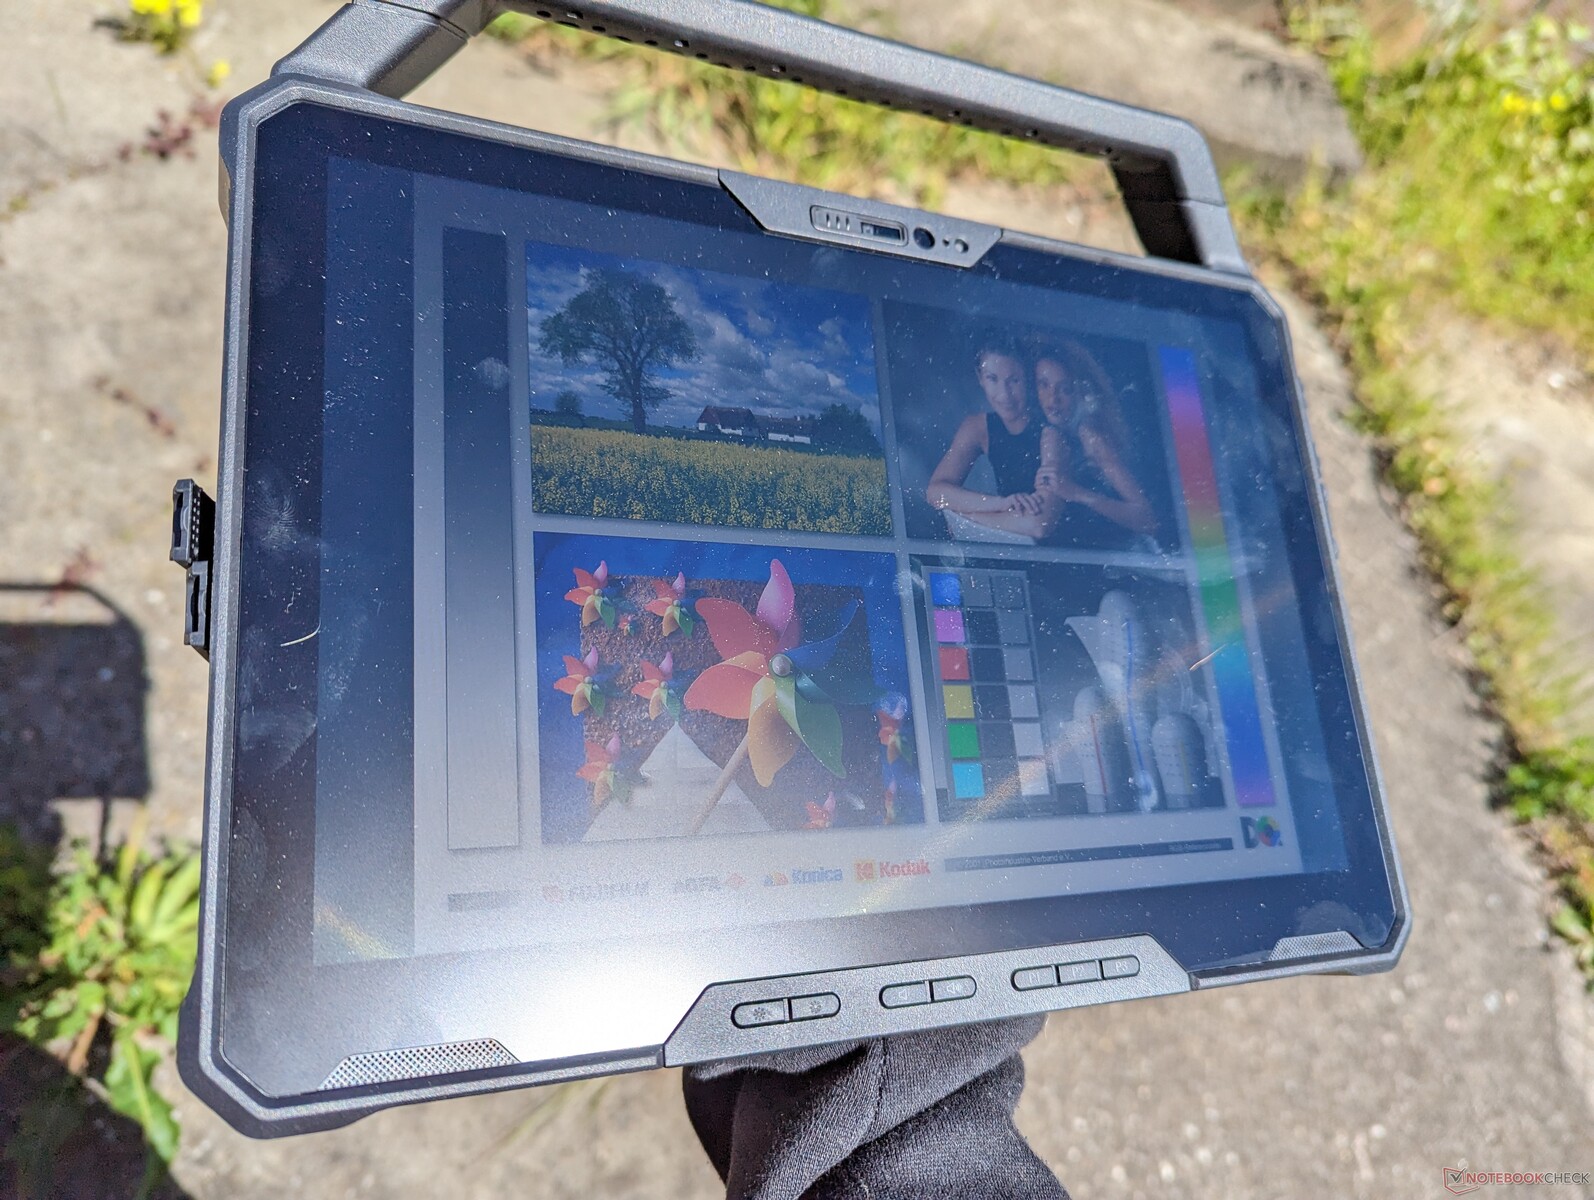
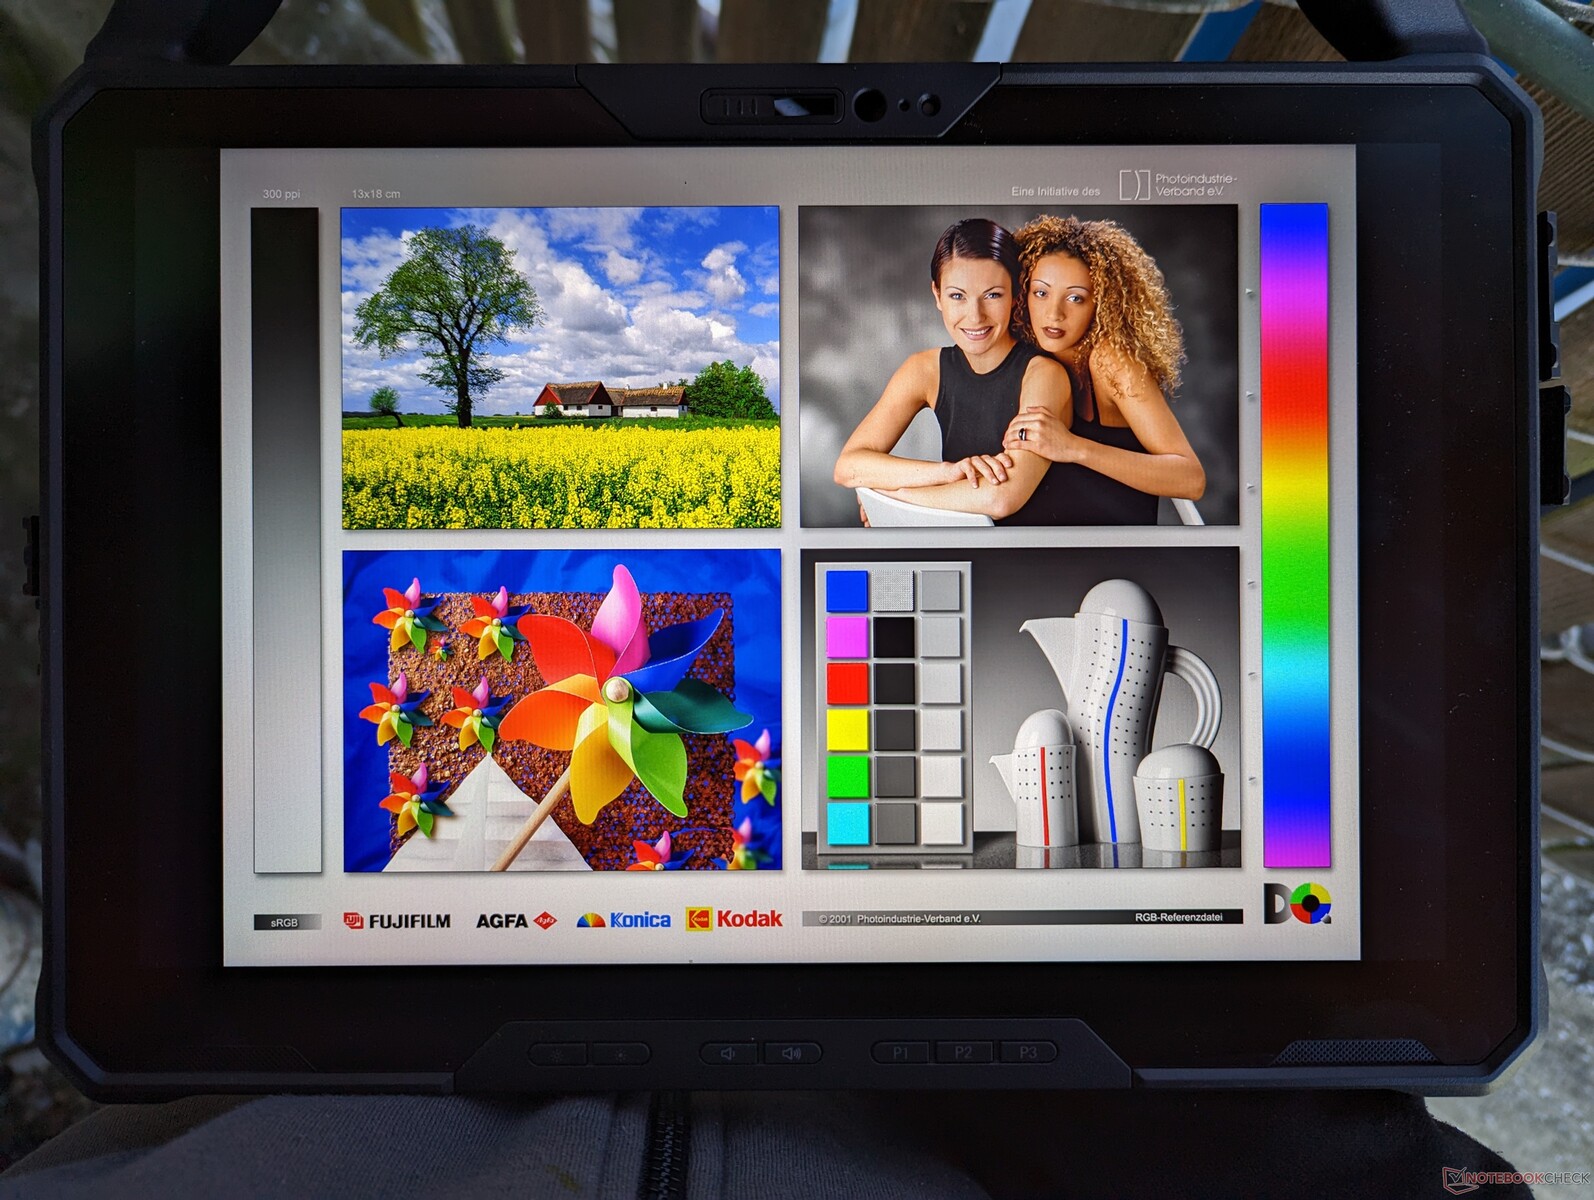
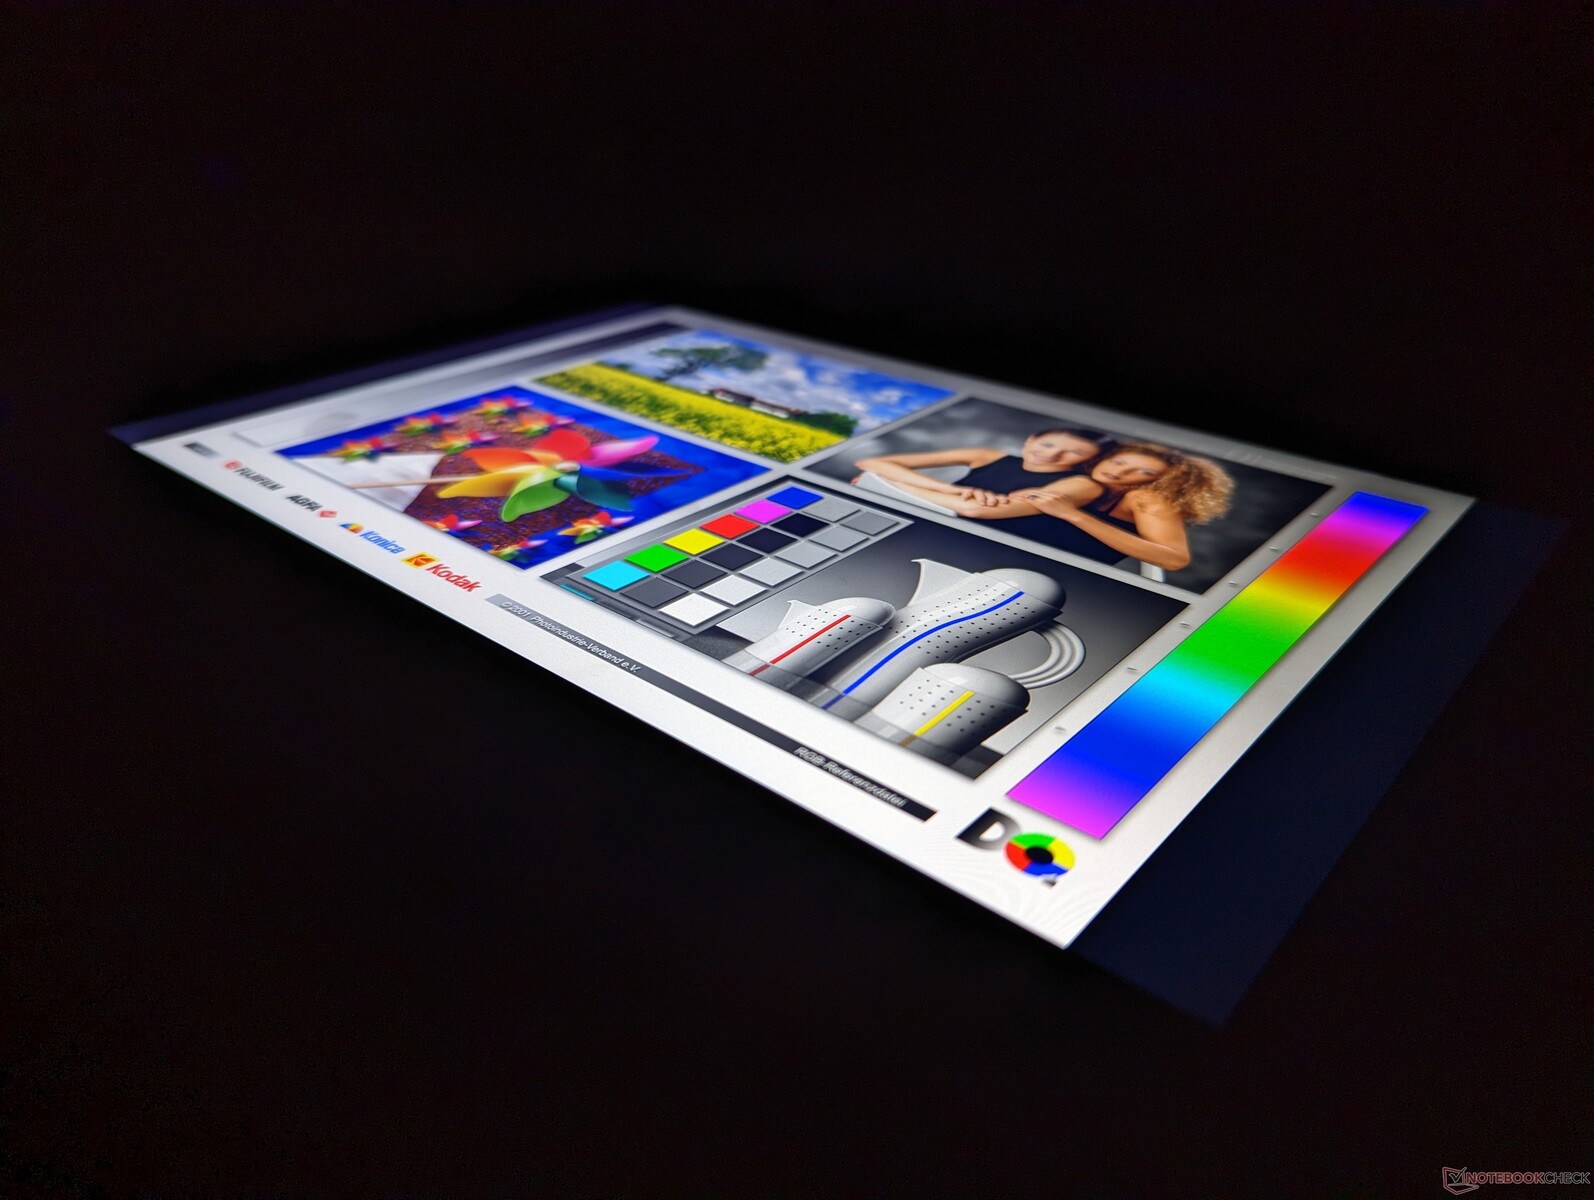
Display - 1200 nit e copertura sRGB completa
Latitude 7230 Rugged è uno dei pochi dispositivi della sua categoria e delle sue dimensioni a offrire >95% di sRGB per colori più accurati e vibranti. Anche i tempi di risposta del bianco e del nero e del grigio sono ragionevolmente veloci, per un effetto ghosting meno evidente. Non c'è modulazione di ampiezza degli impulsi per il controllo della luminosità, il che significa che è possibile utilizzare il tablet a livelli di luminosità molto bassi senza affaticare gli occhi o notare sfarfallii. È uno dei migliori display che abbiamo visto su un tablet rugged.
Il più grande svantaggio del display è la sua granulosità, nonostante i colori eccellenti e la retroilluminazione luminosa. Rispetto agli schermi più nitidi dei tablet o dei laptop consumer, il touchscreen di Latitude 7230 Rugged è sottoposto a strati di vetro e protezione più spessi, il che influisce sulla qualità dell'immagine. Per il pubblico di riferimento, tuttavia, le immagini super nitide non sono di solito una priorità.


| |||||||||||||||||||||||||
Distribuzione della luminosità: 82 %
Al centro con la batteria: 1326.7 cd/m²
Contrasto: 1561:1 (Nero: 0.85 cd/m²)
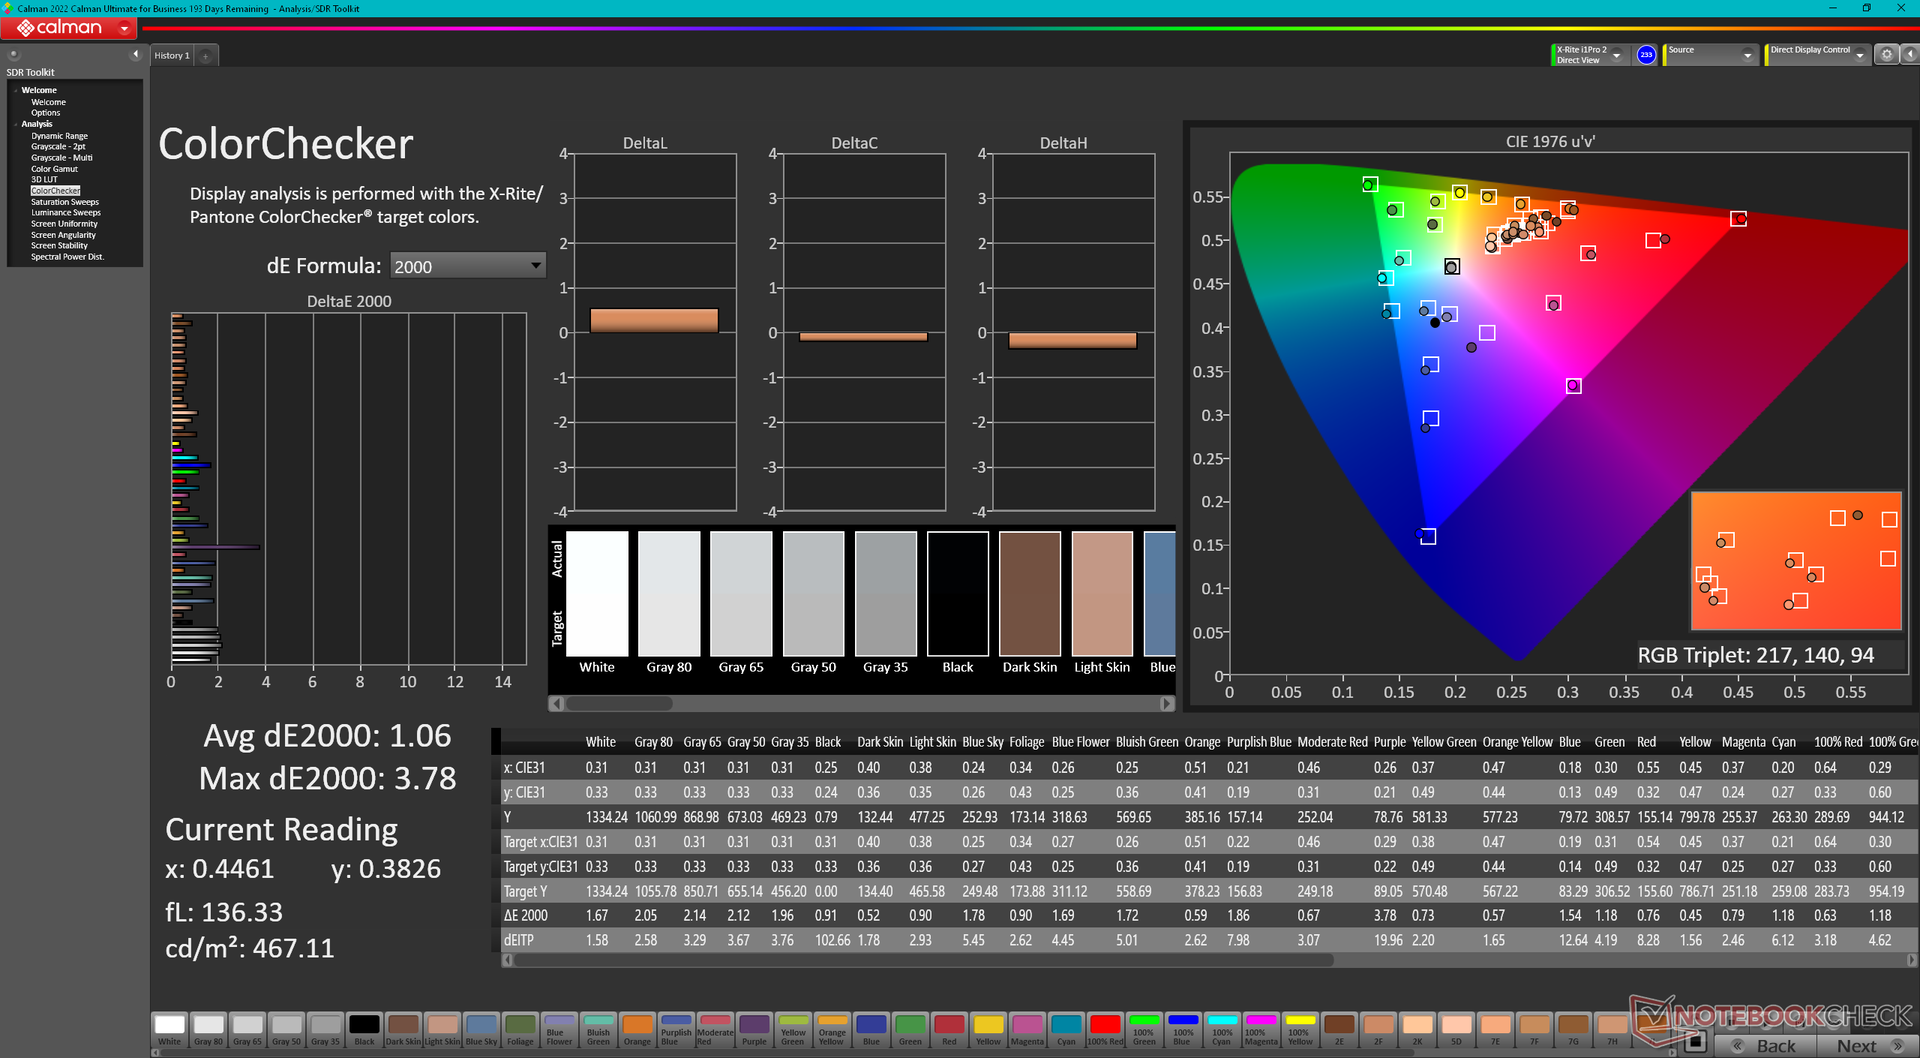
ΔE ColorChecker Calman: 1.06 | ∀{0.5-29.43 Ø4.72}
calibrated: 0.71
ΔE Greyscale Calman: 1.5 | ∀{0.09-98 Ø4.97}
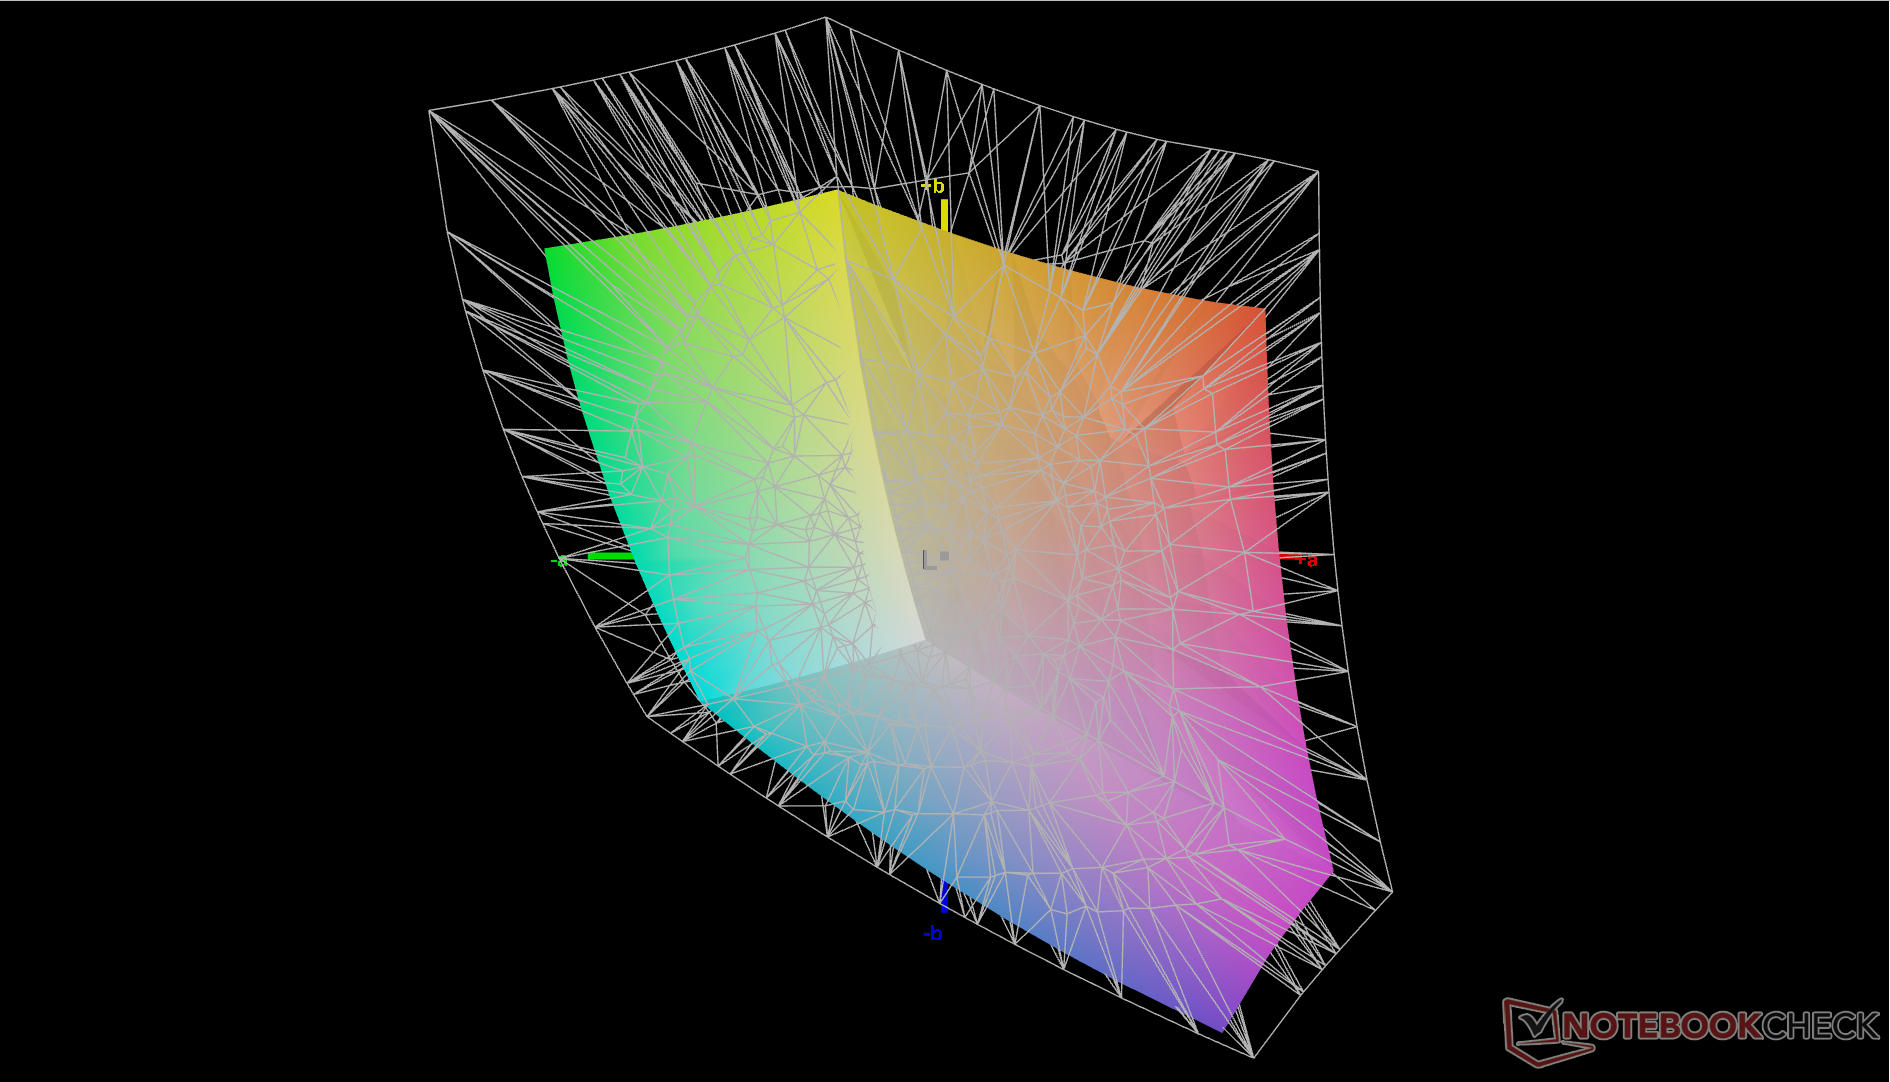
68.4% AdobeRGB 1998 (Argyll 3D)
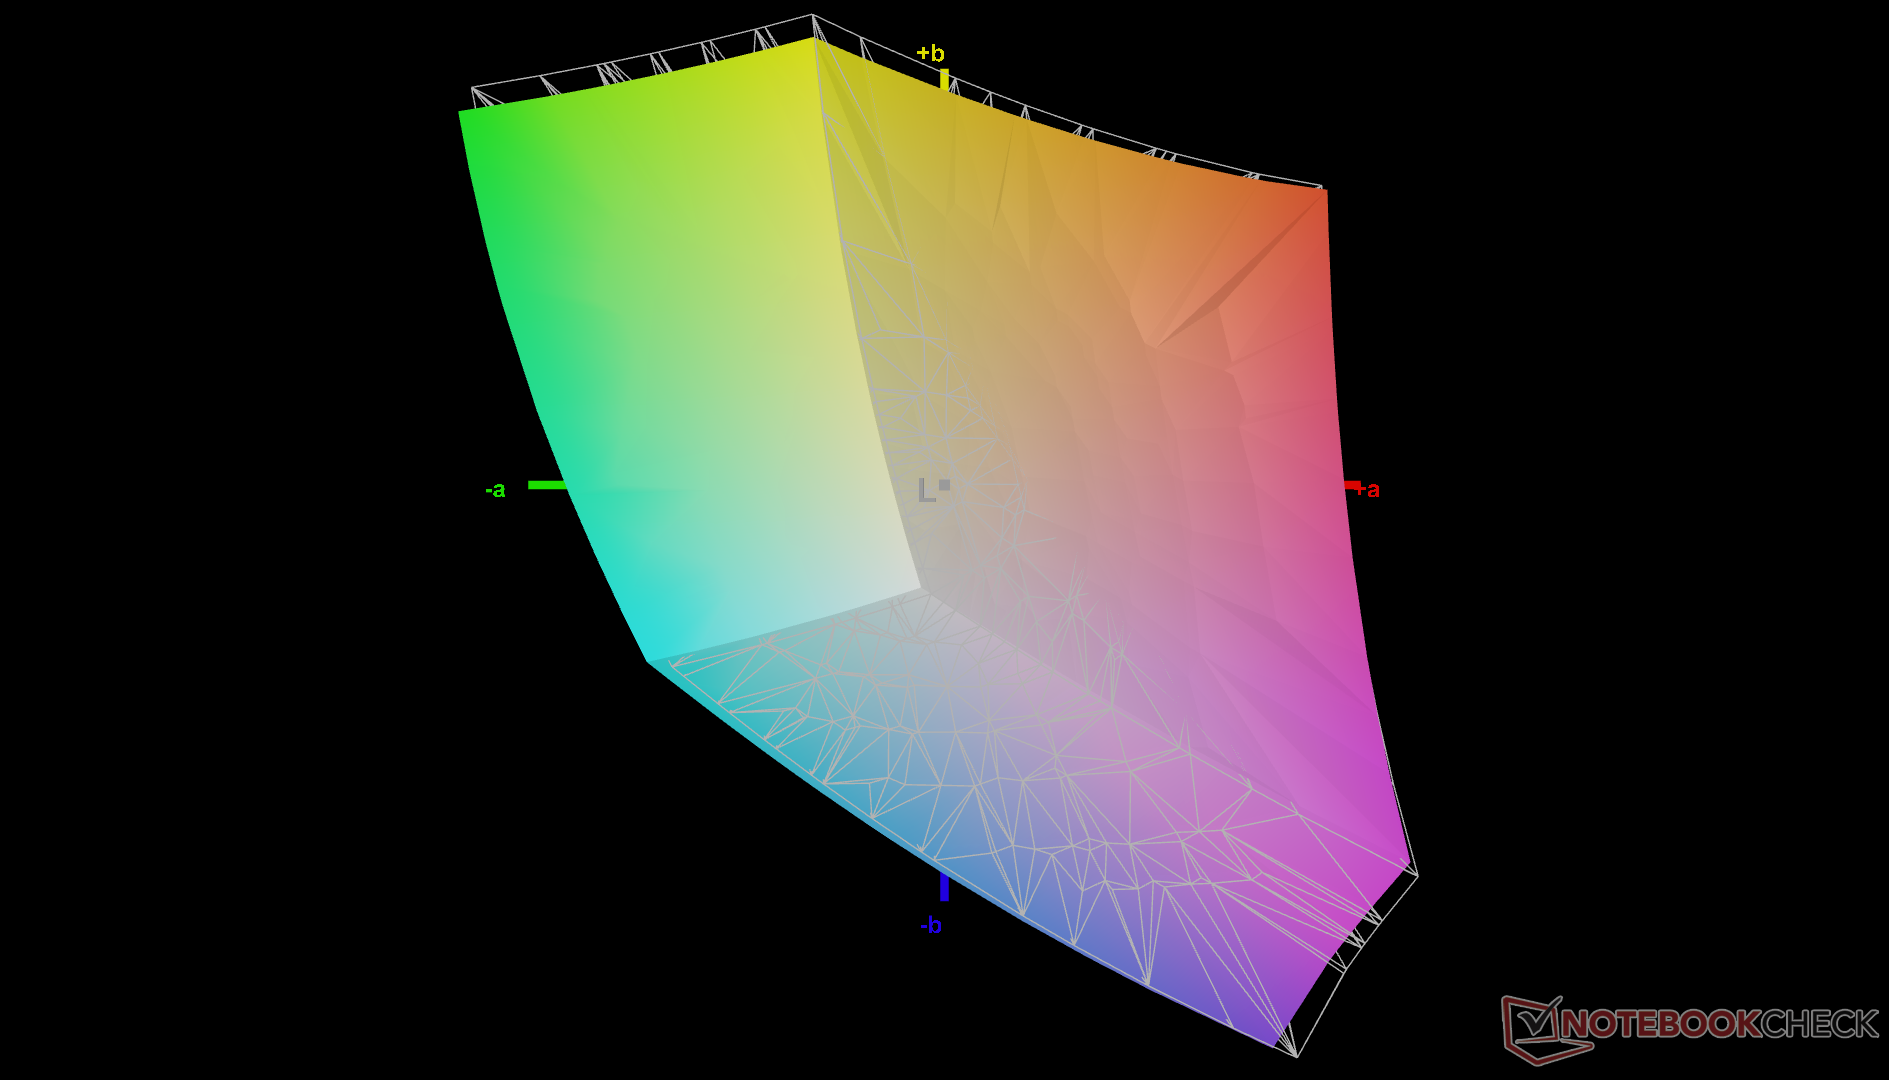
96.1% sRGB (Argyll 3D)
66.2% Display P3 (Argyll 3D)
Gamma: 2.19
CCT: 6804 K
| Dell Latitude 7230 Rugged Extreme Sharp LQ120N1, IPS, 1920x1200, 12" | Dell Latitude 7330 Rugged Extreme Sharp LQ133M1, IPS, 1920x1080, 13.3" | Panasonic Toughbook 40 InfoVision M140NWF5 R3, IPS, 1920x1080, 14" | Getac B360 AU Optronics AUO572D, IPS, 1920x1080, 13.3" | Acer Enduro Urban N3 EUN314 XR140EA6T, IPS, 1920x1080, 14" | Durabook S14I KD140N0730A01, TN, 1920x1080, 14" | |
|---|---|---|---|---|---|---|
| Display | 1% | -45% | -24% | -4% | -33% | |
| Display P3 Coverage (%) | 66.2 | 67.1 1% | 35.8 -46% | 51.3 -23% | 63.5 -4% | 43.55 -34% |
| sRGB Coverage (%) | 96.1 | 98.2 2% | 53.8 -44% | 72 -25% | 91.9 -4% | 65.4 -32% |
| AdobeRGB 1998 Coverage (%) | 68.4 | 69 1% | 37 -46% | 52.2 -24% | 65.5 -4% | 45 -34% |
| Response Times | -141% | -60% | -58% | -89% | 16% | |
| Response Time Grey 50% / Grey 80% * (ms) | 28.4 ? | 74.4 ? -162% | 50.4 ? -77% | 33 ? -16% | 56 ? -97% | 30.4 ? -7% |
| Response Time Black / White * (ms) | 19.4 ? | 42.4 ? -119% | 27.6 ? -42% | 38.8 ? -100% | 35.2 ? -81% | 11.8 ? 39% |
| PWM Frequency (Hz) | 694.4 ? | 870 ? | 1000 ? | 304.9 ? | ||
| Screen | -16% | -118% | -216% | -154% | -348% | |
| Brightness middle (cd/m²) | 1326.7 | 1414.1 7% | 1284.3 -3% | 1505.6 13% | 487.8 -63% | 1180.7 -11% |
| Brightness (cd/m²) | 1193 | 1282 7% | 1289 8% | 1383 16% | 464 -61% | 1102 -8% |
| Brightness Distribution (%) | 82 | 84 2% | 82 0% | 86 5% | 89 9% | 89 9% |
| Black Level * (cd/m²) | 0.85 | 0.83 2% | 0.89 -5% | 0.95 -12% | 0.48 44% | 1.91 -125% |
| Contrast (:1) | 1561 | 1704 9% | 1443 -8% | 1585 2% | 1016 -35% | 618 -60% |
| Colorchecker dE 2000 * | 1.06 | 1.99 -88% | 4.67 -341% | 9.81 -825% | 6.51 -514% | 13.45 -1169% |
| Colorchecker dE 2000 max. * | 3.78 | 3.75 1% | 19.85 -425% | 16.64 -340% | 11.36 -201% | 22.52 -496% |
| Colorchecker dE 2000 calibrated * | 0.71 | 0.72 -1% | 2.21 -211% | 1.44 -103% | 1.77 -149% | 3.19 -349% |
| Greyscale dE 2000 * | 1.5 | 2.8 -87% | 2.7 -80% | 12 -700% | 7.8 -420% | 15.4 -927% |
| Gamma | 2.19 100% | 2.06 107% | 1.97 112% | 1.98 111% | 2.28 96% | 1.97 112% |
| CCT | 6804 96% | 6775 96% | 6222 104% | 4838 134% | 8102 80% | 21134 31% |
| Color Space (Percent of AdobeRGB 1998) (%) | 41.6 | |||||
| Color Space (Percent of sRGB) (%) | 65.5 | |||||
| Media totale (Programma / Settaggio) | -52% /
-30% | -74% /
-94% | -99% /
-152% | -82% /
-113% | -122% /
-229% |
* ... Meglio usare valori piccoli
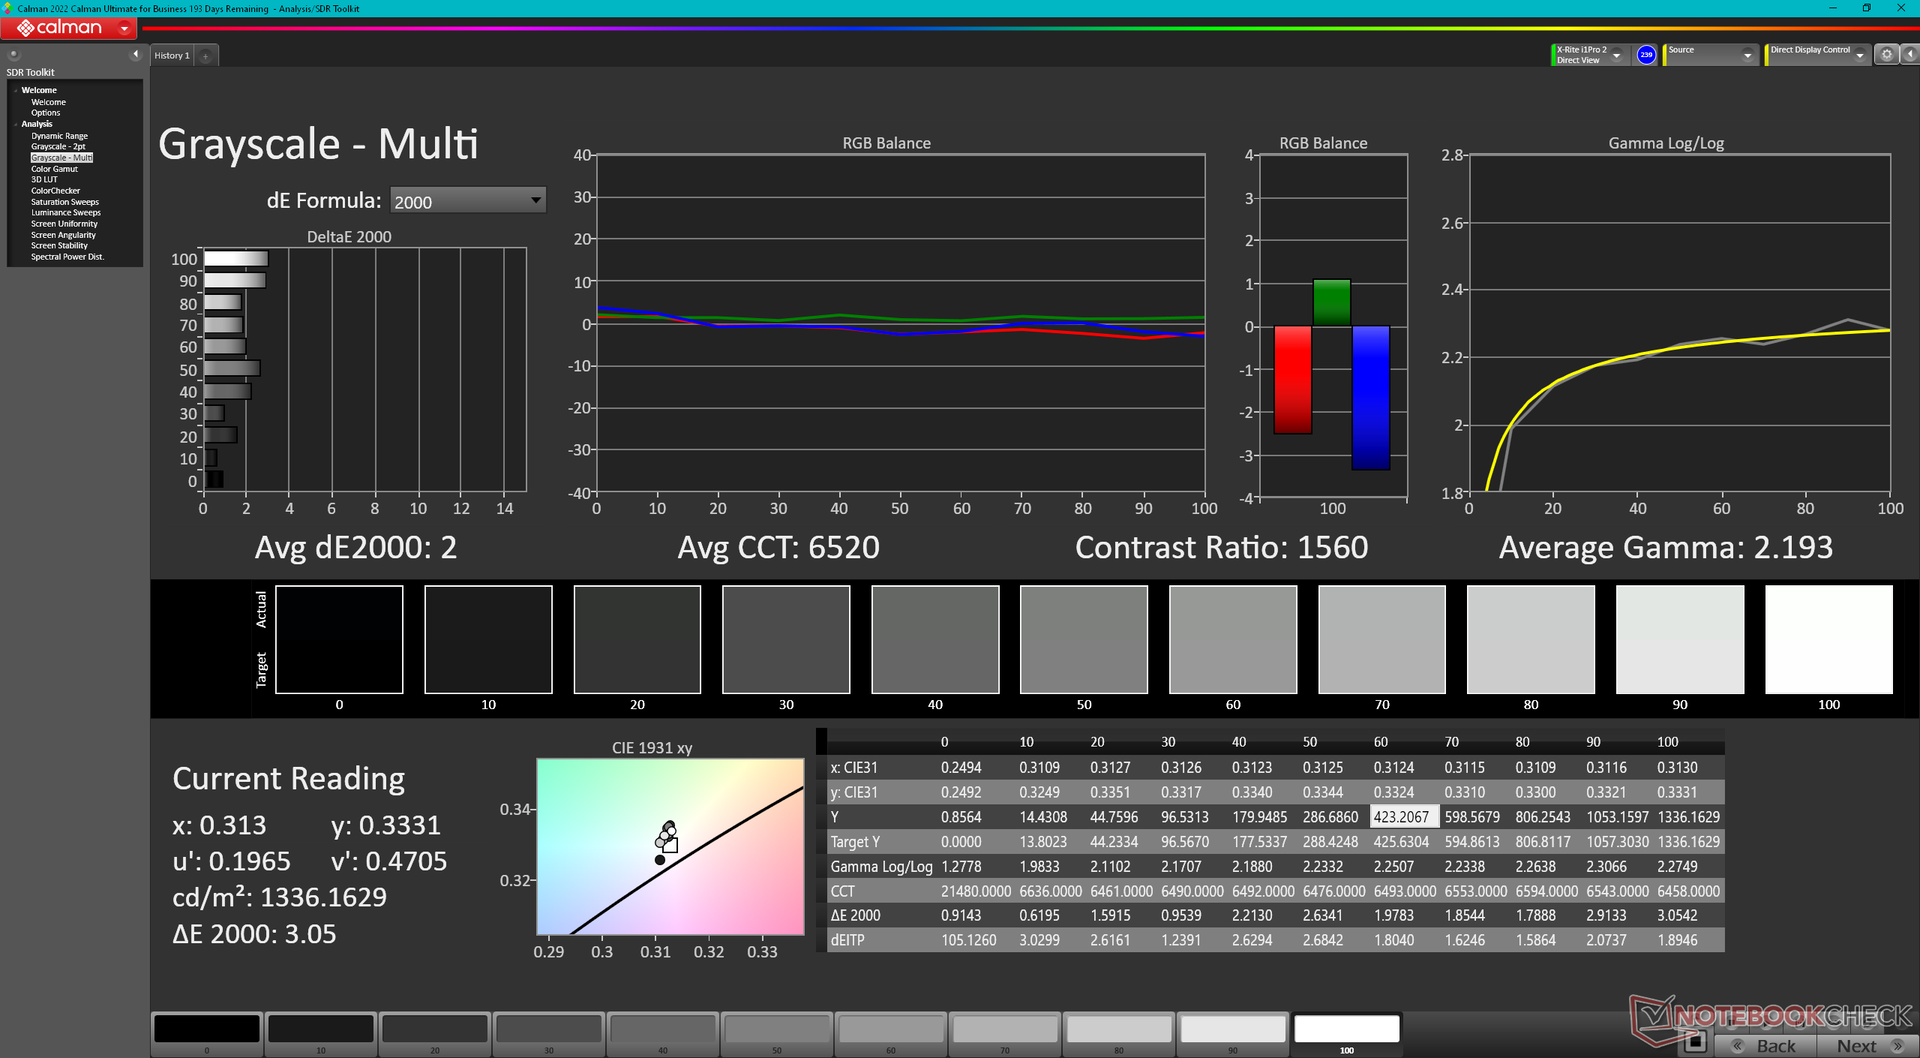
Il display è ben calibrato fin dall'inizio, con valori medi di deltaE in scala di grigi e a colori rispettivamente di 1,5 e 1,06. Il display è stato calibrato in modo ottimale. Il tentativo di calibrare ulteriormente il display con un colorimetro X-Rite non migliorerebbe significativamente l'accuratezza e quindi non è necessaria una calibrazione da parte dell'utente finale.

Tempi di risposta del Display
| ↔ Tempi di risposta dal Nero al Bianco | ||
|---|---|---|
| 19.4 ms ... aumenta ↗ e diminuisce ↘ combinato | ↗ 9.7 ms Incremento | 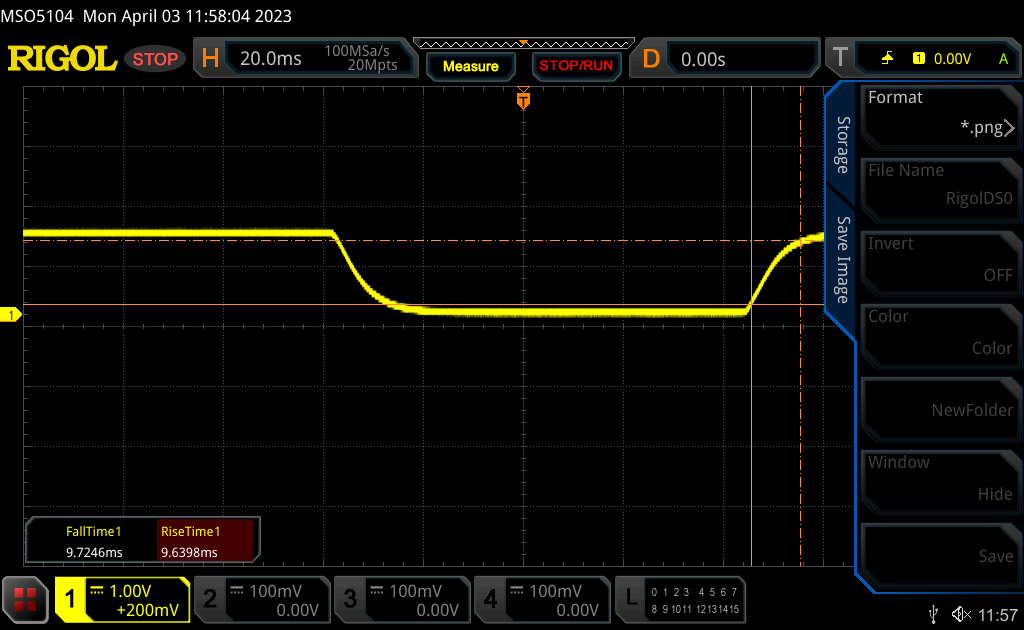 |
| ↘ 9.7 ms Calo | ||
| Lo schermo mostra buoni tempi di risposta durante i nostri tests, ma potrebbe essere troppo lento per i gamers competitivi. In confronto, tutti i dispositivi di test variano da 0.1 (minimo) a 240 (massimo) ms. » 43 % di tutti i dispositivi è migliore. Questo significa che i tempi di risposta rilevati sono simili alla media di tutti i dispositivi testati (19.8 ms). | ||
| ↔ Tempo di risposta dal 50% Grigio all'80% Grigio | ||
| 28.4 ms ... aumenta ↗ e diminuisce ↘ combinato | ↗ 13.8 ms Incremento | 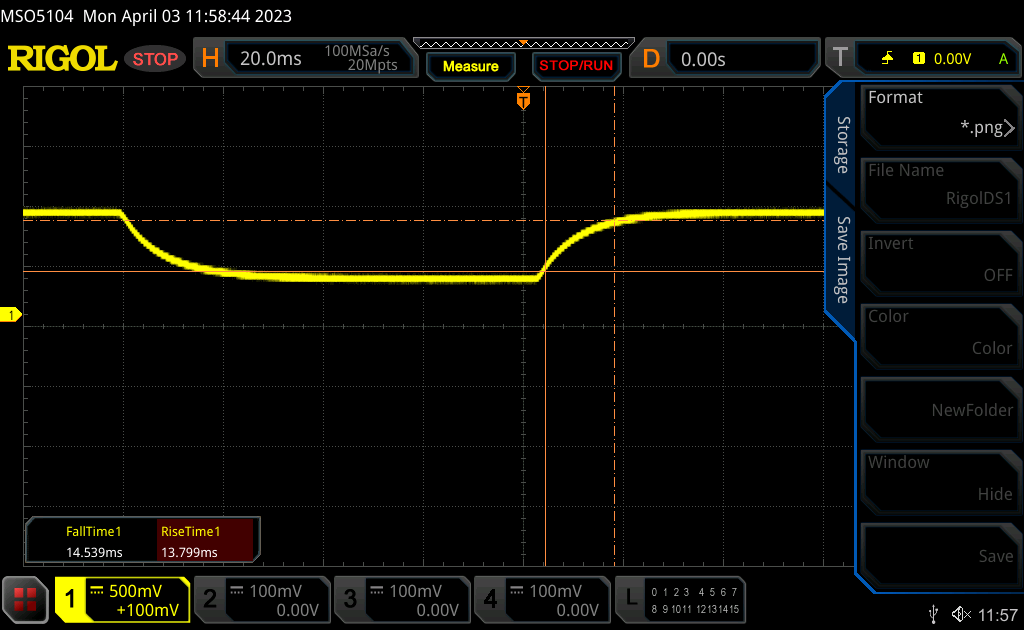 |
| ↘ 14.6 ms Calo | ||
| Lo schermo mostra tempi di risposta relativamente lenti nei nostri tests e potrebbe essere troppo lento per i gamers. In confronto, tutti i dispositivi di test variano da 0.165 (minimo) a 636 (massimo) ms. » 38 % di tutti i dispositivi è migliore. Questo significa che i tempi di risposta rilevati sono simili alla media di tutti i dispositivi testati (31 ms). | ||
Sfarfallio dello schermo / PWM (Pulse-Width Modulation)
| flickering dello schermo / PWM non rilevato | 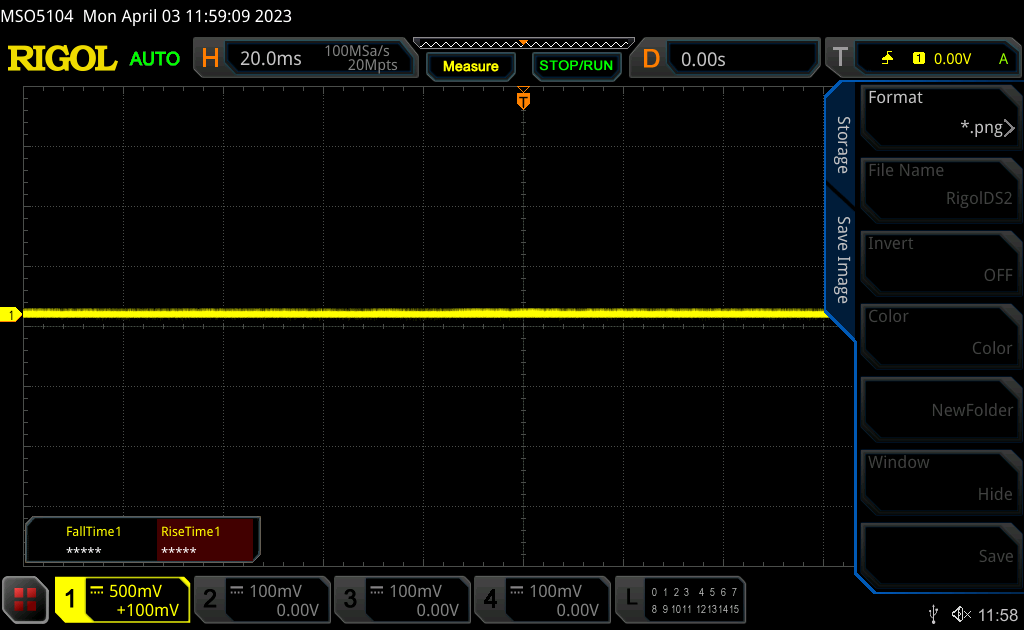 | ||
In confronto: 52 % di tutti i dispositivi testati non utilizza PWM per ridurre la luminosita' del display. Se è rilevato PWM, una media di 7778 (minimo: 5 - massimo: 343500) Hz è stata rilevata. | |||
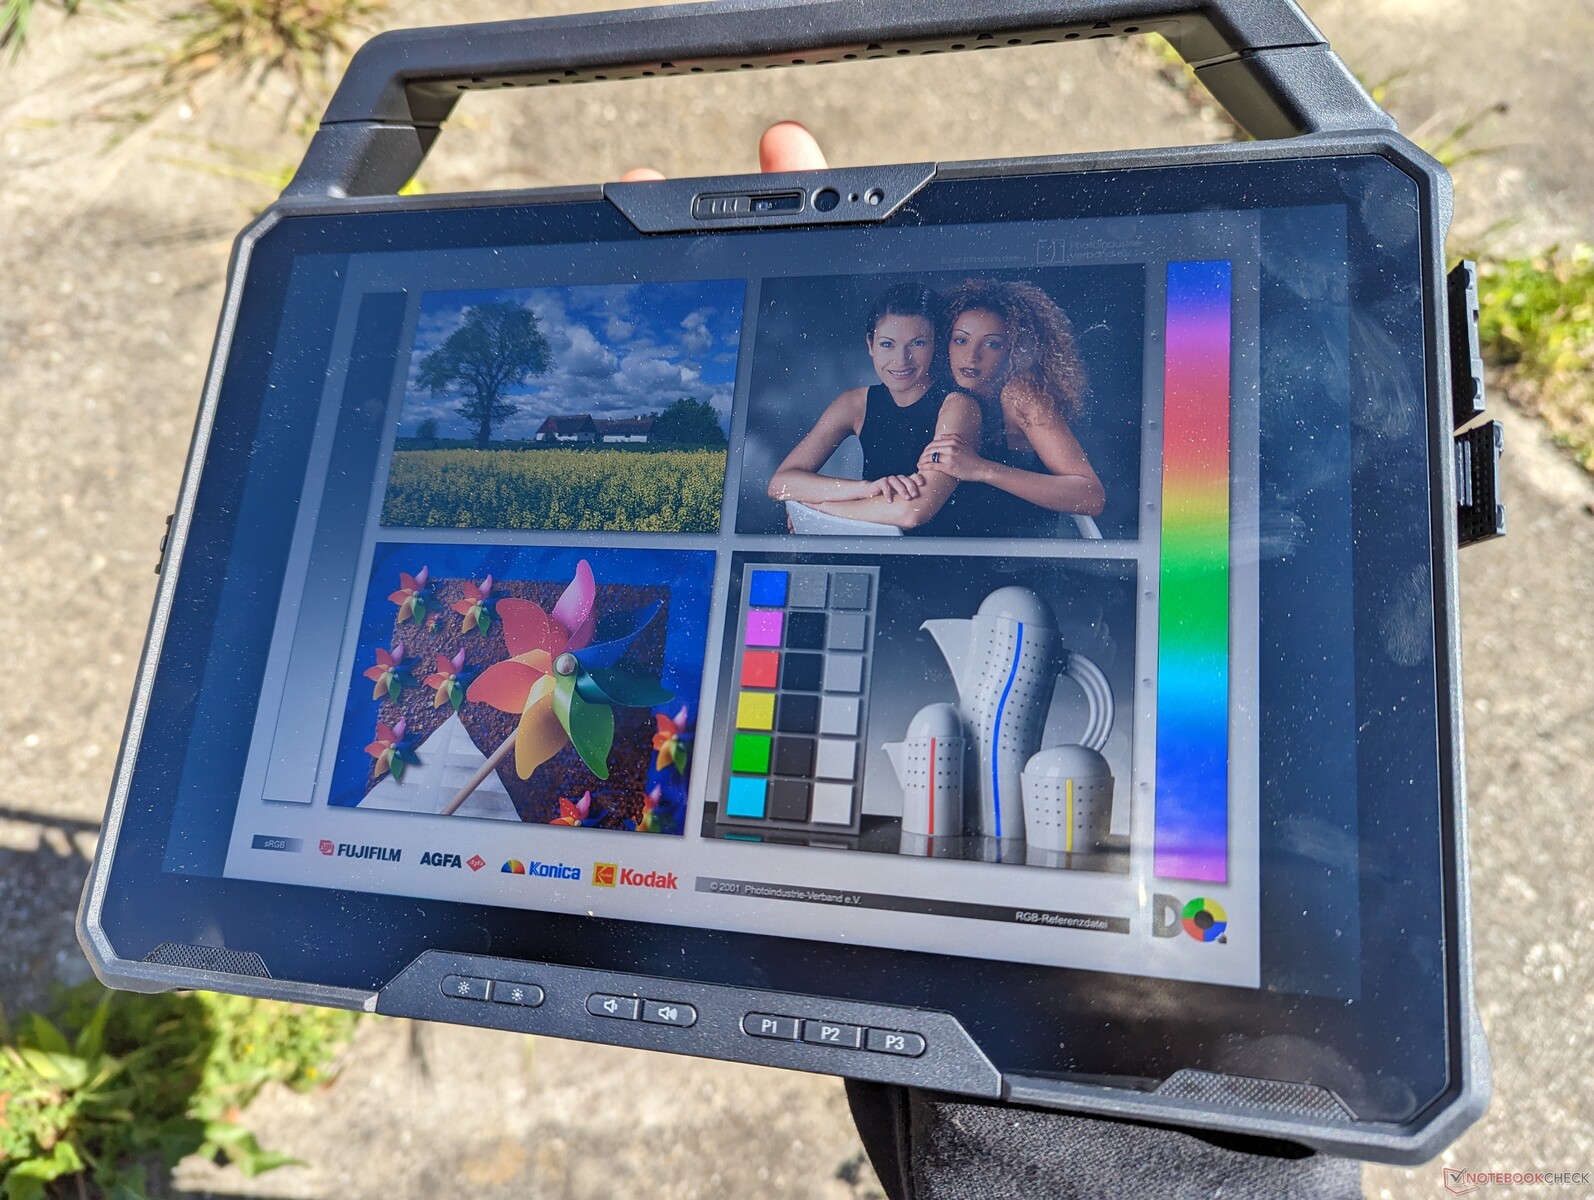
La visibilità all'aperto è eccellente, in quanto il display è ben oltre i 1000 nits, ovvero due volte più luminoso di un tipico tablet o laptop. Tuttavia, si verificano ancora riflessi e colori sbiaditi, per cui è necessario evitare la luce diretta del sole quando possibile per massimizzare la qualità dell'immagine.

Prestazioni
Condizioni di test
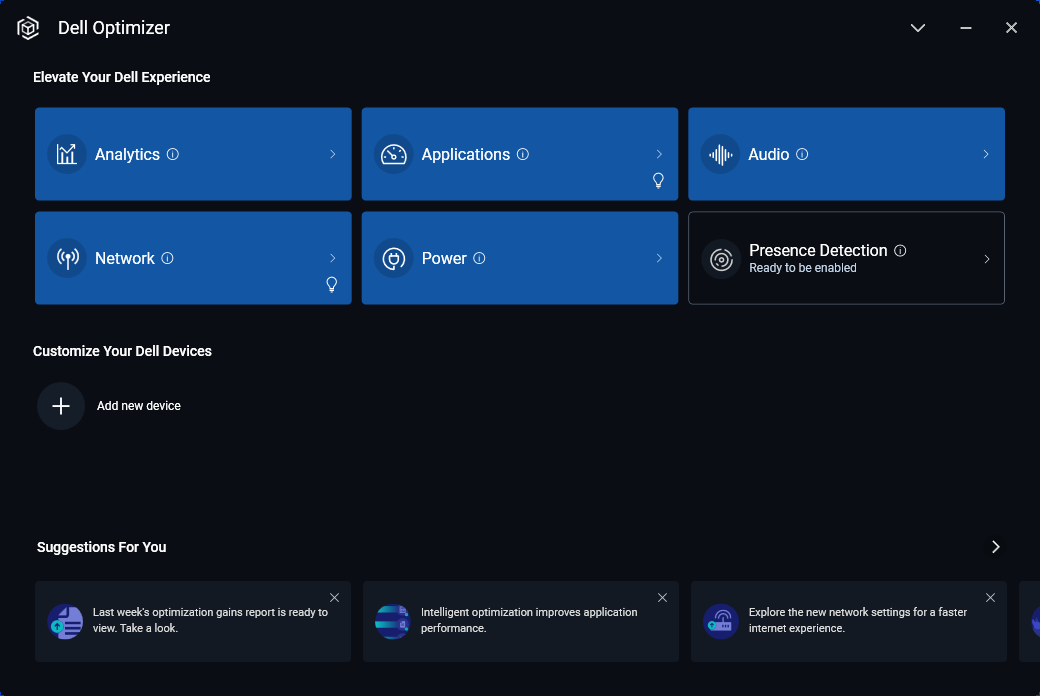
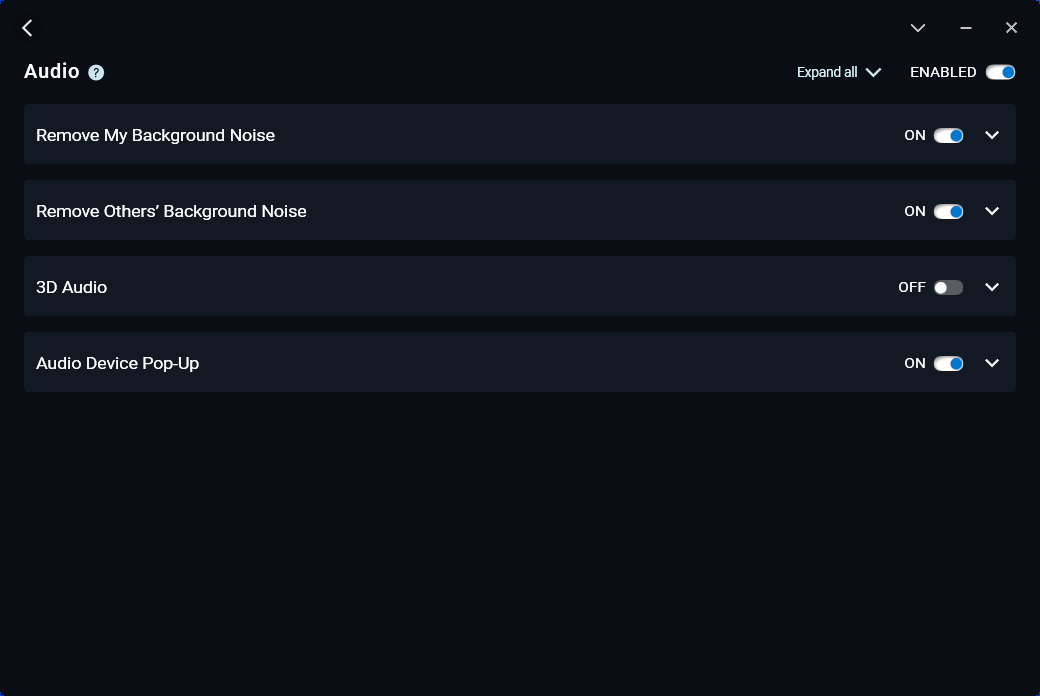
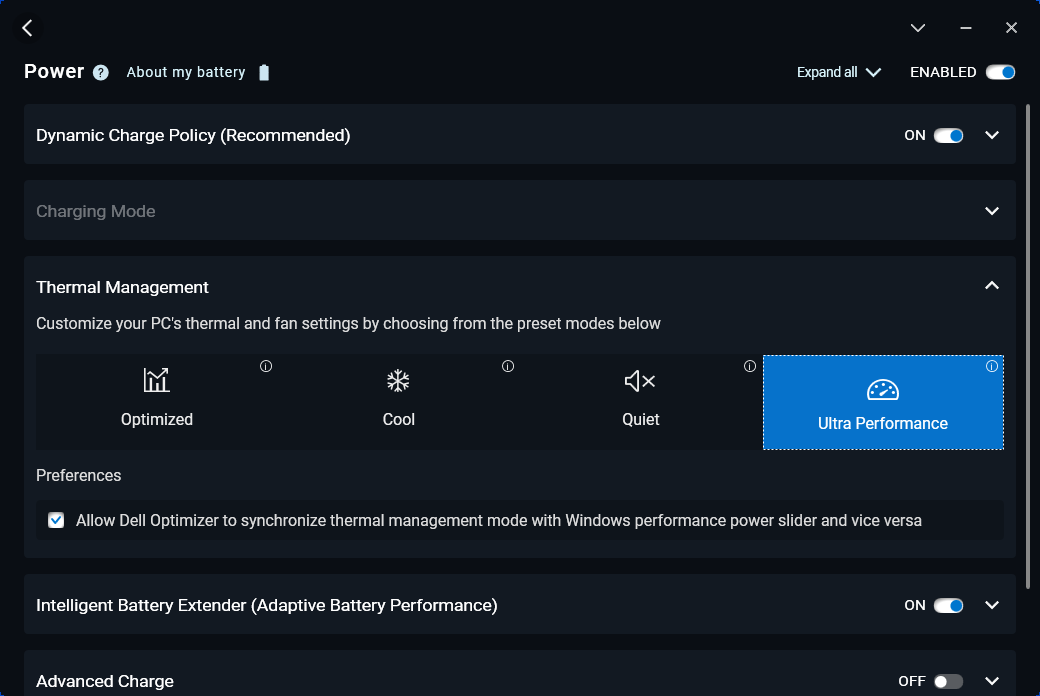
Abbiamo impostato la nostra unità in modalità Ultra Performance tramite il software Dell Optimizer preinstallato prima di eseguire i benchmark qui sotto. Gli utenti dovrebbero abituarsi a Optimizer perché controlla gli aspetti chiave del modello, tra cui i profili di alimentazione, l'audio, il microfono e la connettività wireless.
Dell Presence Detection non è supportato su questo modello.
Processore: veloce come il Core i7-1260U
Le prestazioni della CPU sono eccellenti, soprattutto dopo l'insoddisfacente Core i7-1260U che abbiamo sperimentato sul Latitude 7330. Le prestazioni multi-thread sono significativamente più veloci rispetto al popolare Core i7-1165G7 o i7-1185G7 che alimentavano la maggior parte degli Ultrabook e dei dispositivi rugged di un tempo.
Forse l'aspetto più importante da tenere a mente quando si sceglie tra i modelli Core i5-1240U o Core i7-1260U è che le prestazioni del processore sono quasi identiche. Si differenziano invece soprattutto per le prestazioni grafiche integrate. Se si ha bisogno della potenza aggiuntiva della GPU, la soluzione migliore è il Core i7. Per il resto, entrambi i processori sono in grado di affrontare i carichi di lavoro della CPU a thread singolo e multiplo.
Cinebench R15 Multi Loop
Cinebench R23: Multi Core | Single Core
Cinebench R20: CPU (Multi Core) | CPU (Single Core)
Cinebench R15: CPU Multi 64Bit | CPU Single 64Bit
Blender: v2.79 BMW27 CPU
7-Zip 18.03: 7z b 4 | 7z b 4 -mmt1
Geekbench 5.5: Multi-Core | Single-Core
HWBOT x265 Benchmark v2.2: 4k Preset
LibreOffice : 20 Documents To PDF
R Benchmark 2.5: Overall mean
| CPU Performance rating | |
| HP EliteBook 840 G9 | |
| Asus ExpertBook B5 Flip B5602FBN | |
| Lenovo ThinkPad P14s G3 AMD 21J6S05000 | |
| HP ZBook Firefly 14 G9-6B8A2EA | |
| Lenovo ThinkBook 13s G3 20YA0005GE | |
| HP ProBook 440 G9-5Y3Z3EA | |
| Dell Latitude 7230 Rugged Extreme | |
| Media Intel Core i5-1240U | |
| Dell Latitude 9330 | |
| Dell Latitude 7330 Rugged Extreme | |
| Acer Enduro Urban N3 EUN314 | |
| Panasonic Toughbook 40 | |
| Durabook S14I | |
| Getac B360 -1! | |
| Cinebench R23 / Multi Core | |
| Asus ExpertBook B5 Flip B5602FBN | |
| Lenovo ThinkPad P14s G3 AMD 21J6S05000 | |
| HP EliteBook 840 G9 | |
| HP ZBook Firefly 14 G9-6B8A2EA | |
| Lenovo ThinkBook 13s G3 20YA0005GE | |
| Dell Latitude 7230 Rugged Extreme | |
| Media Intel Core i5-1240U (n=1) | |
| HP ProBook 440 G9-5Y3Z3EA | |
| Dell Latitude 9330 | |
| Dell Latitude 7330 Rugged Extreme | |
| Acer Enduro Urban N3 EUN314 | |
| Panasonic Toughbook 40 | |
| Getac B360 | |
| Durabook S14I | |
| Cinebench R23 / Single Core | |
| Asus ExpertBook B5 Flip B5602FBN | |
| HP ZBook Firefly 14 G9-6B8A2EA | |
| HP EliteBook 840 G9 | |
| HP ProBook 440 G9-5Y3Z3EA | |
| Dell Latitude 7230 Rugged Extreme | |
| Media Intel Core i5-1240U (n=1) | |
| Dell Latitude 9330 | |
| Dell Latitude 7330 Rugged Extreme | |
| Lenovo ThinkPad P14s G3 AMD 21J6S05000 | |
| Lenovo ThinkBook 13s G3 20YA0005GE | |
| Acer Enduro Urban N3 EUN314 | |
| Panasonic Toughbook 40 | |
| Durabook S14I | |
| Getac B360 | |
| Cinebench R20 / CPU (Multi Core) | |
| Lenovo ThinkPad P14s G3 AMD 21J6S05000 | |
| HP EliteBook 840 G9 | |
| Asus ExpertBook B5 Flip B5602FBN | |
| HP ZBook Firefly 14 G9-6B8A2EA | |
| Lenovo ThinkBook 13s G3 20YA0005GE | |
| Dell Latitude 7230 Rugged Extreme | |
| Media Intel Core i5-1240U (n=1) | |
| HP ProBook 440 G9-5Y3Z3EA | |
| Dell Latitude 9330 | |
| Dell Latitude 7330 Rugged Extreme | |
| Acer Enduro Urban N3 EUN314 | |
| Panasonic Toughbook 40 | |
| Getac B360 | |
| Durabook S14I | |
| Cinebench R20 / CPU (Single Core) | |
| Asus ExpertBook B5 Flip B5602FBN | |
| HP ZBook Firefly 14 G9-6B8A2EA | |
| HP ProBook 440 G9-5Y3Z3EA | |
| HP EliteBook 840 G9 | |
| Lenovo ThinkPad P14s G3 AMD 21J6S05000 | |
| Dell Latitude 7230 Rugged Extreme | |
| Media Intel Core i5-1240U (n=1) | |
| Dell Latitude 7330 Rugged Extreme | |
| Dell Latitude 9330 | |
| Lenovo ThinkBook 13s G3 20YA0005GE | |
| Acer Enduro Urban N3 EUN314 | |
| Durabook S14I | |
| Panasonic Toughbook 40 | |
| Getac B360 | |
| Cinebench R15 / CPU Multi 64Bit | |
| Asus ExpertBook B5 Flip B5602FBN | |
| HP EliteBook 840 G9 | |
| Lenovo ThinkBook 13s G3 20YA0005GE | |
| Lenovo ThinkBook 13s G3 20YA0005GE | |
| Lenovo ThinkPad P14s G3 AMD 21J6S05000 | |
| HP ZBook Firefly 14 G9-6B8A2EA | |
| HP ProBook 440 G9-5Y3Z3EA | |
| Dell Latitude 7230 Rugged Extreme | |
| Media Intel Core i5-1240U (n=1) | |
| Dell Latitude 9330 | |
| Acer Enduro Urban N3 EUN314 | |
| Dell Latitude 7330 Rugged Extreme | |
| Panasonic Toughbook 40 | |
| Getac B360 | |
| Durabook S14I | |
| Cinebench R15 / CPU Single 64Bit | |
| HP EliteBook 840 G9 | |
| HP ZBook Firefly 14 G9-6B8A2EA | |
| Asus ExpertBook B5 Flip B5602FBN | |
| HP ProBook 440 G9-5Y3Z3EA | |
| HP ProBook 440 G9-5Y3Z3EA | |
| Lenovo ThinkPad P14s G3 AMD 21J6S05000 | |
| Lenovo ThinkBook 13s G3 20YA0005GE | |
| Dell Latitude 7330 Rugged Extreme | |
| Dell Latitude 7230 Rugged Extreme | |
| Media Intel Core i5-1240U (n=1) | |
| Dell Latitude 9330 | |
| Acer Enduro Urban N3 EUN314 | |
| Durabook S14I | |
| Panasonic Toughbook 40 | |
| Getac B360 | |
| Blender / v2.79 BMW27 CPU | |
| Durabook S14I | |
| Getac B360 | |
| Panasonic Toughbook 40 | |
| Acer Enduro Urban N3 EUN314 | |
| Dell Latitude 7330 Rugged Extreme | |
| Dell Latitude 9330 | |
| HP ZBook Firefly 14 G9-6B8A2EA | |
| HP ProBook 440 G9-5Y3Z3EA | |
| Dell Latitude 7230 Rugged Extreme | |
| Media Intel Core i5-1240U (n=1) | |
| Lenovo ThinkBook 13s G3 20YA0005GE | |
| Lenovo ThinkPad P14s G3 AMD 21J6S05000 | |
| Asus ExpertBook B5 Flip B5602FBN | |
| HP EliteBook 840 G9 | |
| 7-Zip 18.03 / 7z b 4 | |
| HP EliteBook 840 G9 | |
| Lenovo ThinkPad P14s G3 AMD 21J6S05000 | |
| Asus ExpertBook B5 Flip B5602FBN | |
| Lenovo ThinkBook 13s G3 20YA0005GE | |
| HP ZBook Firefly 14 G9-6B8A2EA | |
| Dell Latitude 9330 | |
| Dell Latitude 7230 Rugged Extreme | |
| Media Intel Core i5-1240U (n=1) | |
| HP ProBook 440 G9-5Y3Z3EA | |
| Acer Enduro Urban N3 EUN314 | |
| Dell Latitude 7330 Rugged Extreme | |
| Getac B360 | |
| Panasonic Toughbook 40 | |
| Durabook S14I | |
| 7-Zip 18.03 / 7z b 4 -mmt1 | |
| HP EliteBook 840 G9 | |
| HP ZBook Firefly 14 G9-6B8A2EA | |
| Asus ExpertBook B5 Flip B5602FBN | |
| Dell Latitude 7330 Rugged Extreme | |
| Acer Enduro Urban N3 EUN314 | |
| Lenovo ThinkBook 13s G3 20YA0005GE | |
| Durabook S14I | |
| HP ProBook 440 G9-5Y3Z3EA | |
| Lenovo ThinkPad P14s G3 AMD 21J6S05000 | |
| Panasonic Toughbook 40 | |
| Dell Latitude 9330 | |
| Getac B360 | |
| Dell Latitude 7230 Rugged Extreme | |
| Media Intel Core i5-1240U (n=1) | |
| Geekbench 5.5 / Multi-Core | |
| HP EliteBook 840 G9 | |
| Asus ExpertBook B5 Flip B5602FBN | |
| HP ZBook Firefly 14 G9-6B8A2EA | |
| Lenovo ThinkPad P14s G3 AMD 21J6S05000 | |
| Dell Latitude 9330 | |
| Dell Latitude 7230 Rugged Extreme | |
| Media Intel Core i5-1240U (n=1) | |
| Lenovo ThinkBook 13s G3 20YA0005GE | |
| HP ProBook 440 G9-5Y3Z3EA | |
| Dell Latitude 7330 Rugged Extreme | |
| Acer Enduro Urban N3 EUN314 | |
| Panasonic Toughbook 40 | |
| Getac B360 | |
| Durabook S14I | |
| Geekbench 5.5 / Single-Core | |
| HP EliteBook 840 G9 | |
| HP ZBook Firefly 14 G9-6B8A2EA | |
| Dell Latitude 7230 Rugged Extreme | |
| Media Intel Core i5-1240U (n=1) | |
| HP ProBook 440 G9-5Y3Z3EA | |
| Dell Latitude 9330 | |
| Dell Latitude 7330 Rugged Extreme | |
| Acer Enduro Urban N3 EUN314 | |
| Asus ExpertBook B5 Flip B5602FBN | |
| Durabook S14I | |
| Lenovo ThinkPad P14s G3 AMD 21J6S05000 | |
| Panasonic Toughbook 40 | |
| Lenovo ThinkBook 13s G3 20YA0005GE | |
| Getac B360 | |
| HWBOT x265 Benchmark v2.2 / 4k Preset | |
| Lenovo ThinkPad P14s G3 AMD 21J6S05000 | |
| HP EliteBook 840 G9 | |
| Asus ExpertBook B5 Flip B5602FBN | |
| Lenovo ThinkBook 13s G3 20YA0005GE | |
| HP ZBook Firefly 14 G9-6B8A2EA | |
| Dell Latitude 7230 Rugged Extreme | |
| Media Intel Core i5-1240U (n=1) | |
| HP ProBook 440 G9-5Y3Z3EA | |
| Dell Latitude 9330 | |
| Dell Latitude 7330 Rugged Extreme | |
| Acer Enduro Urban N3 EUN314 | |
| Panasonic Toughbook 40 | |
| Getac B360 | |
| Durabook S14I | |
| LibreOffice / 20 Documents To PDF | |
| Acer Enduro Urban N3 EUN314 | |
| Lenovo ThinkPad P14s G3 AMD 21J6S05000 | |
| Panasonic Toughbook 40 | |
| Dell Latitude 7230 Rugged Extreme | |
| Media Intel Core i5-1240U (n=1) | |
| HP ProBook 440 G9-5Y3Z3EA | |
| Dell Latitude 9330 | |
| Lenovo ThinkBook 13s G3 20YA0005GE | |
| Dell Latitude 7330 Rugged Extreme | |
| Asus ExpertBook B5 Flip B5602FBN | |
| Durabook S14I | |
| HP EliteBook 840 G9 | |
| HP ZBook Firefly 14 G9-6B8A2EA | |
| R Benchmark 2.5 / Overall mean | |
| Getac B360 | |
| Panasonic Toughbook 40 | |
| Durabook S14I | |
| Acer Enduro Urban N3 EUN314 | |
| Dell Latitude 7330 Rugged Extreme | |
| Lenovo ThinkBook 13s G3 20YA0005GE | |
| Lenovo ThinkPad P14s G3 AMD 21J6S05000 | |
| Dell Latitude 7230 Rugged Extreme | |
| Media Intel Core i5-1240U (n=1) | |
| Dell Latitude 9330 | |
| HP ProBook 440 G9-5Y3Z3EA | |
| Asus ExpertBook B5 Flip B5602FBN | |
| HP ZBook Firefly 14 G9-6B8A2EA | |
| HP EliteBook 840 G9 | |
Cinebench R23: Multi Core | Single Core
Cinebench R20: CPU (Multi Core) | CPU (Single Core)
Cinebench R15: CPU Multi 64Bit | CPU Single 64Bit
Blender: v2.79 BMW27 CPU
7-Zip 18.03: 7z b 4 | 7z b 4 -mmt1
Geekbench 5.5: Multi-Core | Single-Core
HWBOT x265 Benchmark v2.2: 4k Preset
LibreOffice : 20 Documents To PDF
R Benchmark 2.5: Overall mean
* ... Meglio usare valori piccoli
| Blender | |
| v3.3 Classroom HIP/AMD | |
| Lenovo ThinkPad P14s G3 AMD 21J6S05000 | |
| Lenovo ThinkPad P14s G3 AMD 21J6S05000 | |
| v3.3 Classroom OPTIX/RTX | |
| HP ZBook Firefly 14 G9-6B8A2EA | |
| v3.3 Classroom CUDA | |
| HP ZBook Firefly 14 G9-6B8A2EA | |
| v3.3 Classroom CPU | |
| Dell Latitude 7230 Rugged Extreme | |
| HP ProBook 440 G9-5Y3Z3EA | |
| HP ZBook Firefly 14 G9-6B8A2EA | |
| HP EliteBook 840 G9 | |
| Asus ExpertBook B5 Flip B5602FBN | |
| Lenovo ThinkPad P14s G3 AMD 21J6S05000 | |
* ... Meglio usare valori piccoli
AIDA64: FP32 Ray-Trace | FPU Julia | CPU SHA3 | CPU Queen | FPU SinJulia | FPU Mandel | CPU AES | CPU ZLib | FP64 Ray-Trace | CPU PhotoWorxx
| Performance rating | |
| Dell Latitude 7330 Rugged Extreme | |
| Acer Enduro Urban N3 EUN314 | |
| Dell Latitude 7230 Rugged Extreme | |
| Media Intel Core i5-1240U | |
| Panasonic Toughbook 40 | |
| Getac B360 | |
| Durabook S14I | |
| AIDA64 / FP32 Ray-Trace | |
| Dell Latitude 7330 Rugged Extreme | |
| Acer Enduro Urban N3 EUN314 | |
| Dell Latitude 7230 Rugged Extreme | |
| Media Intel Core i5-1240U (n=1) | |
| Panasonic Toughbook 40 | |
| Durabook S14I | |
| Getac B360 | |
| AIDA64 / FPU Julia | |
| Dell Latitude 7230 Rugged Extreme | |
| Media Intel Core i5-1240U (n=1) | |
| Dell Latitude 7330 Rugged Extreme | |
| Acer Enduro Urban N3 EUN314 | |
| Getac B360 | |
| Panasonic Toughbook 40 | |
| Durabook S14I | |
| AIDA64 / CPU SHA3 | |
| Dell Latitude 7330 Rugged Extreme | |
| Acer Enduro Urban N3 EUN314 | |
| Dell Latitude 7230 Rugged Extreme | |
| Media Intel Core i5-1240U (n=1) | |
| Panasonic Toughbook 40 | |
| Durabook S14I | |
| Getac B360 | |
| AIDA64 / CPU Queen | |
| Getac B360 | |
| Dell Latitude 7330 Rugged Extreme | |
| Acer Enduro Urban N3 EUN314 | |
| Durabook S14I | |
| Dell Latitude 7230 Rugged Extreme | |
| Media Intel Core i5-1240U (n=1) | |
| Panasonic Toughbook 40 | |
| AIDA64 / FPU SinJulia | |
| Dell Latitude 7330 Rugged Extreme | |
| Acer Enduro Urban N3 EUN314 | |
| Getac B360 | |
| Panasonic Toughbook 40 | |
| Dell Latitude 7230 Rugged Extreme | |
| Media Intel Core i5-1240U (n=1) | |
| Durabook S14I | |
| AIDA64 / FPU Mandel | |
| Dell Latitude 7330 Rugged Extreme | |
| Acer Enduro Urban N3 EUN314 | |
| Dell Latitude 7230 Rugged Extreme | |
| Media Intel Core i5-1240U (n=1) | |
| Panasonic Toughbook 40 | |
| Durabook S14I | |
| Getac B360 | |
| AIDA64 / CPU AES | |
| Dell Latitude 7330 Rugged Extreme | |
| Acer Enduro Urban N3 EUN314 | |
| Durabook S14I | |
| Dell Latitude 7230 Rugged Extreme | |
| Media Intel Core i5-1240U (n=1) | |
| Panasonic Toughbook 40 | |
| Getac B360 | |
| AIDA64 / CPU ZLib | |
| Dell Latitude 7230 Rugged Extreme | |
| Media Intel Core i5-1240U (n=1) | |
| Dell Latitude 7330 Rugged Extreme | |
| Acer Enduro Urban N3 EUN314 | |
| Panasonic Toughbook 40 | |
| Getac B360 | |
| Durabook S14I | |
| AIDA64 / FP64 Ray-Trace | |
| Dell Latitude 7330 Rugged Extreme | |
| Acer Enduro Urban N3 EUN314 | |
| Dell Latitude 7230 Rugged Extreme | |
| Media Intel Core i5-1240U (n=1) | |
| Panasonic Toughbook 40 | |
| Durabook S14I | |
| Getac B360 | |
| AIDA64 / CPU PhotoWorxx | |
| Dell Latitude 7330 Rugged Extreme | |
| Dell Latitude 7230 Rugged Extreme | |
| Media Intel Core i5-1240U (n=1) | |
| Acer Enduro Urban N3 EUN314 | |
| Panasonic Toughbook 40 | |
| Getac B360 | |
| Durabook S14I | |
Prestazioni del sistema
CrossMark: Overall | Productivity | Creativity | Responsiveness
| PCMark 10 / Score | |
| Dell Latitude 7330 Rugged Extreme | |
| Panasonic Toughbook 40 | |
| Dell Latitude 7230 Rugged Extreme | |
| Media Intel Core i5-1240U, Intel Iris Xe Graphics G7 80EUs (n=1) | |
| Durabook S14I | |
| Acer Enduro Urban N3 EUN314 | |
| Getac B360 | |
| PCMark 10 / Essentials | |
| Dell Latitude 7330 Rugged Extreme | |
| Durabook S14I | |
| Dell Latitude 7230 Rugged Extreme | |
| Media Intel Core i5-1240U, Intel Iris Xe Graphics G7 80EUs (n=1) | |
| Panasonic Toughbook 40 | |
| Acer Enduro Urban N3 EUN314 | |
| Getac B360 | |
| PCMark 10 / Productivity | |
| Getac B360 | |
| Durabook S14I | |
| Dell Latitude 7330 Rugged Extreme | |
| Panasonic Toughbook 40 | |
| Dell Latitude 7230 Rugged Extreme | |
| Media Intel Core i5-1240U, Intel Iris Xe Graphics G7 80EUs (n=1) | |
| Acer Enduro Urban N3 EUN314 | |
| PCMark 10 / Digital Content Creation | |
| Dell Latitude 7330 Rugged Extreme | |
| Panasonic Toughbook 40 | |
| Acer Enduro Urban N3 EUN314 | |
| Dell Latitude 7230 Rugged Extreme | |
| Media Intel Core i5-1240U, Intel Iris Xe Graphics G7 80EUs (n=1) | |
| Durabook S14I | |
| Getac B360 | |
| CrossMark / Overall | |
| Dell Latitude 7230 Rugged Extreme | |
| Media Intel Core i5-1240U, Intel Iris Xe Graphics G7 80EUs (n=1) | |
| Panasonic Toughbook 40 | |
| CrossMark / Productivity | |
| Dell Latitude 7230 Rugged Extreme | |
| Media Intel Core i5-1240U, Intel Iris Xe Graphics G7 80EUs (n=1) | |
| Panasonic Toughbook 40 | |
| CrossMark / Creativity | |
| Dell Latitude 7230 Rugged Extreme | |
| Media Intel Core i5-1240U, Intel Iris Xe Graphics G7 80EUs (n=1) | |
| Panasonic Toughbook 40 | |
| CrossMark / Responsiveness | |
| Dell Latitude 7230 Rugged Extreme | |
| Media Intel Core i5-1240U, Intel Iris Xe Graphics G7 80EUs (n=1) | |
| Panasonic Toughbook 40 | |
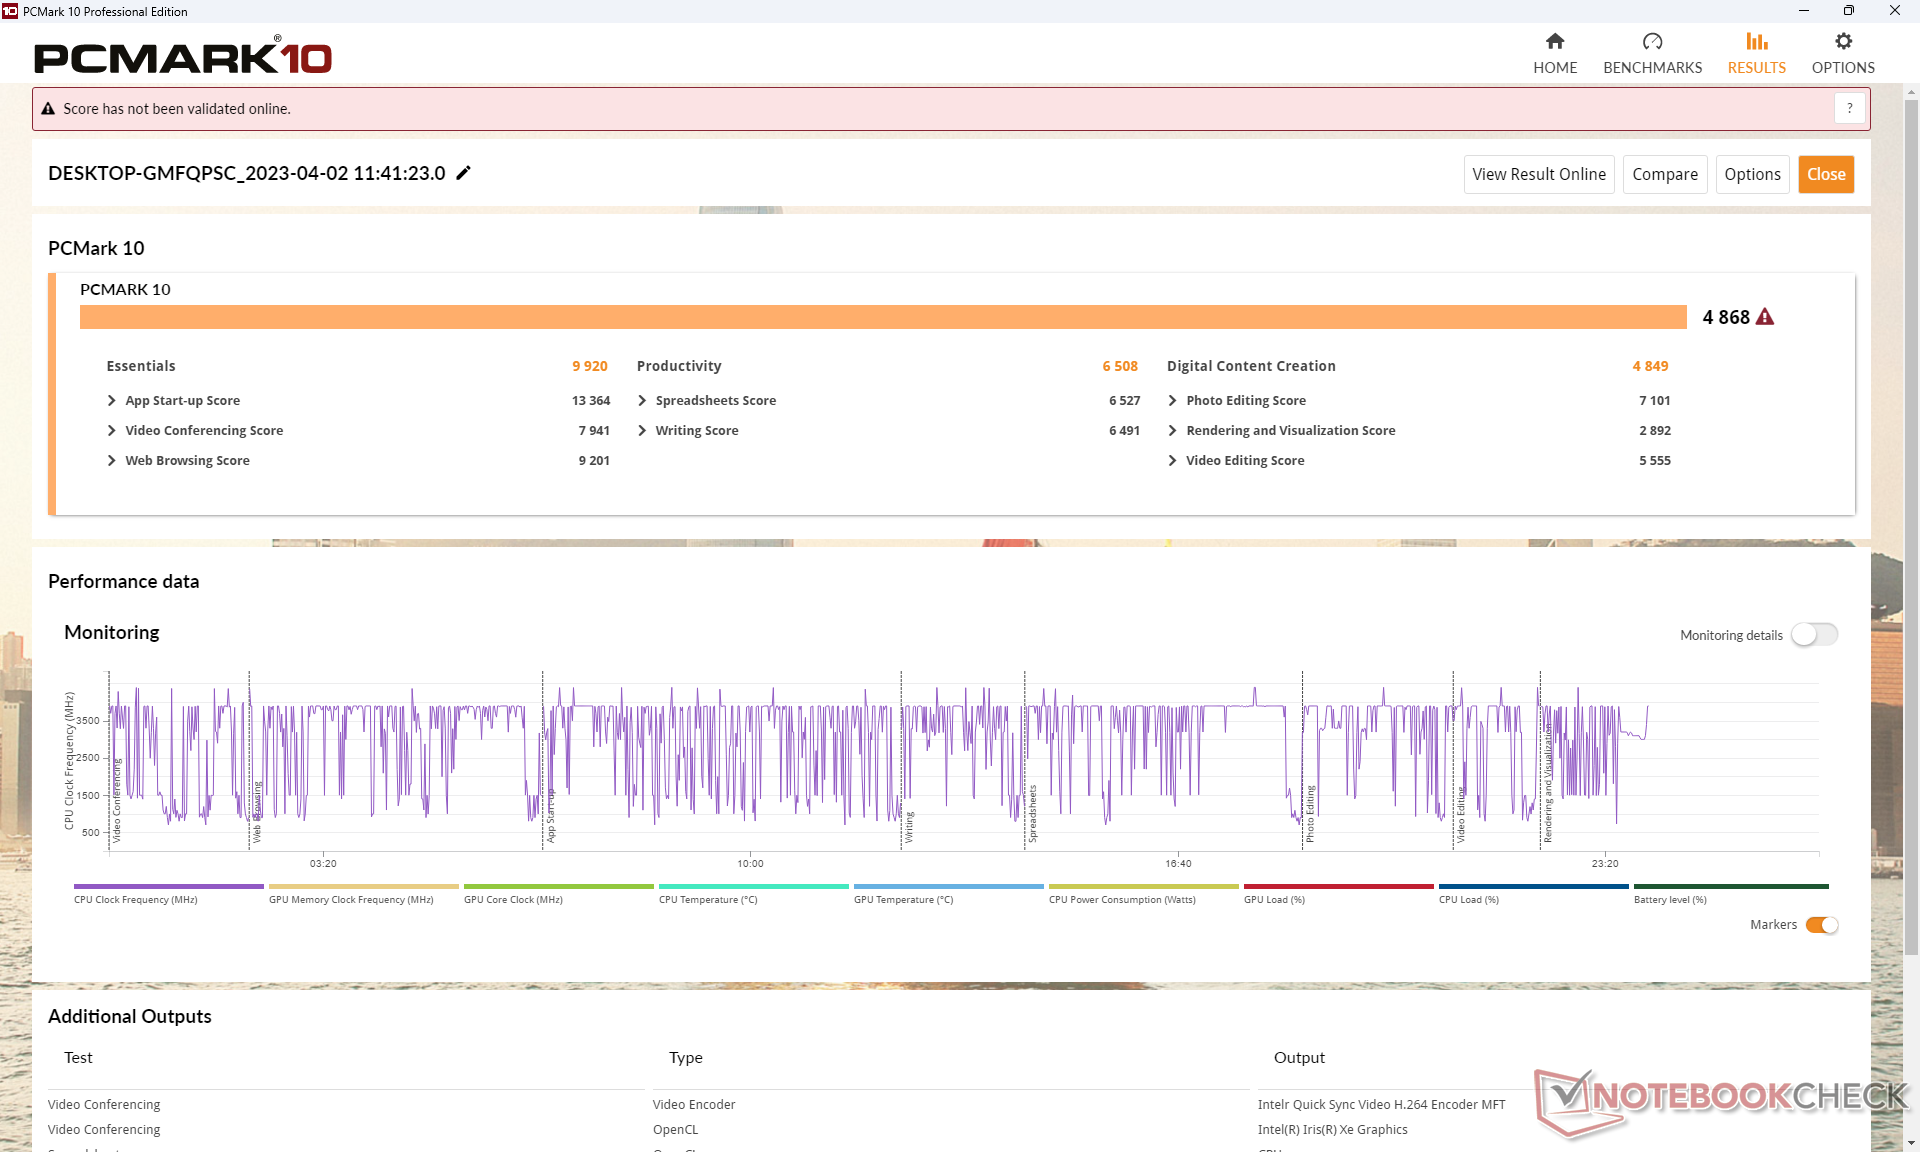
| PCMark 10 Score | 4868 punti | |
Aiuto | ||
| AIDA64 / Memory Copy | |
| Dell Latitude 7230 Rugged Extreme | |
| Media Intel Core i5-1240U (n=1) | |
| Dell Latitude 7330 Rugged Extreme | |
| Acer Enduro Urban N3 EUN314 | |
| Panasonic Toughbook 40 | |
| Getac B360 | |
| Durabook S14I | |
| AIDA64 / Memory Read | |
| Dell Latitude 7330 Rugged Extreme | |
| Dell Latitude 7230 Rugged Extreme | |
| Media Intel Core i5-1240U (n=1) | |
| Acer Enduro Urban N3 EUN314 | |
| Panasonic Toughbook 40 | |
| Getac B360 | |
| Durabook S14I | |
| AIDA64 / Memory Write | |
| Dell Latitude 7330 Rugged Extreme | |
| Dell Latitude 7230 Rugged Extreme | |
| Media Intel Core i5-1240U (n=1) | |
| Acer Enduro Urban N3 EUN314 | |
| Getac B360 | |
| Panasonic Toughbook 40 | |
| Durabook S14I | |
| AIDA64 / Memory Latency | |
| Dell Latitude 7230 Rugged Extreme | |
| Media Intel Core i5-1240U (n=1) | |
| Panasonic Toughbook 40 | |
| Dell Latitude 7330 Rugged Extreme | |
| Acer Enduro Urban N3 EUN314 | |
| Durabook S14I | |
| Getac B360 | |
* ... Meglio usare valori piccoli
Latenza DPC
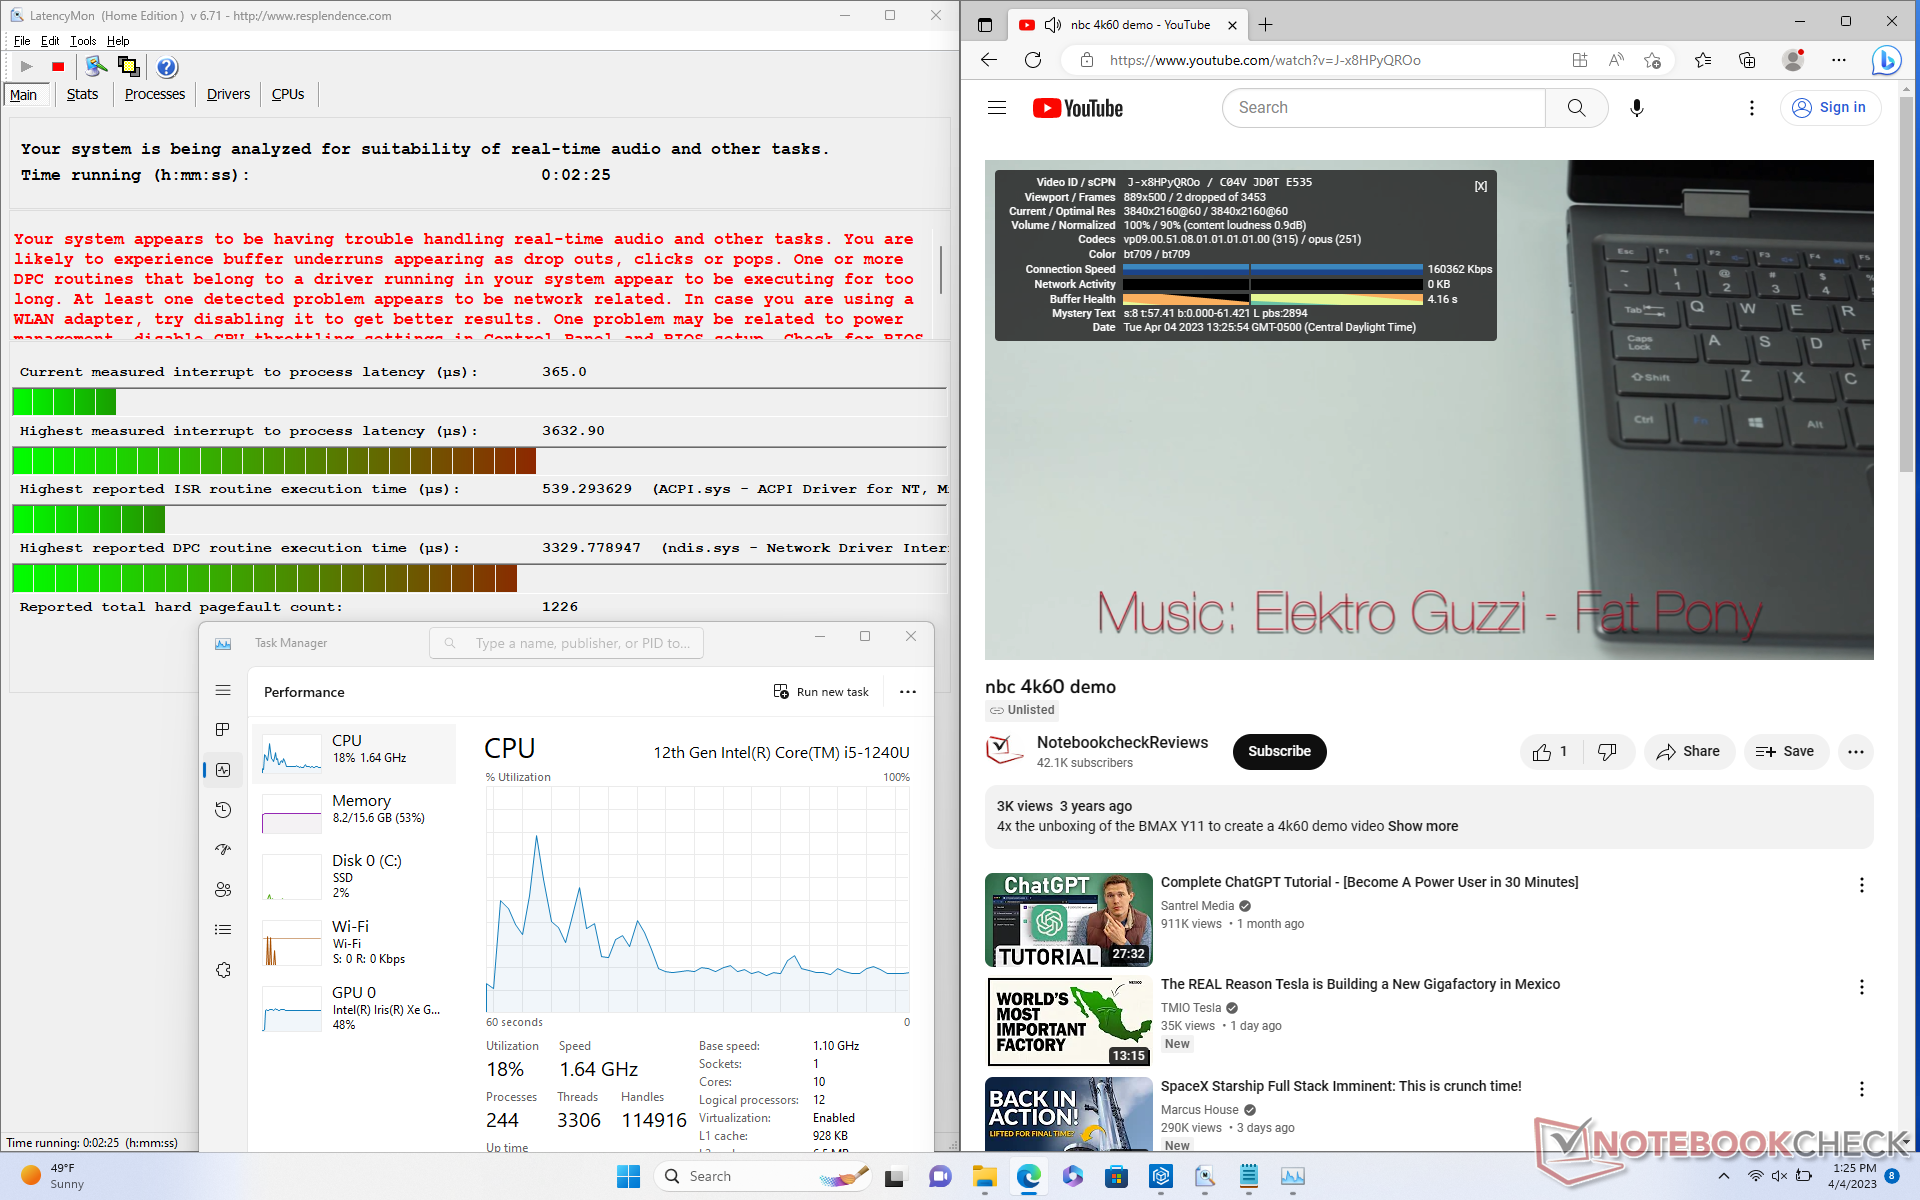
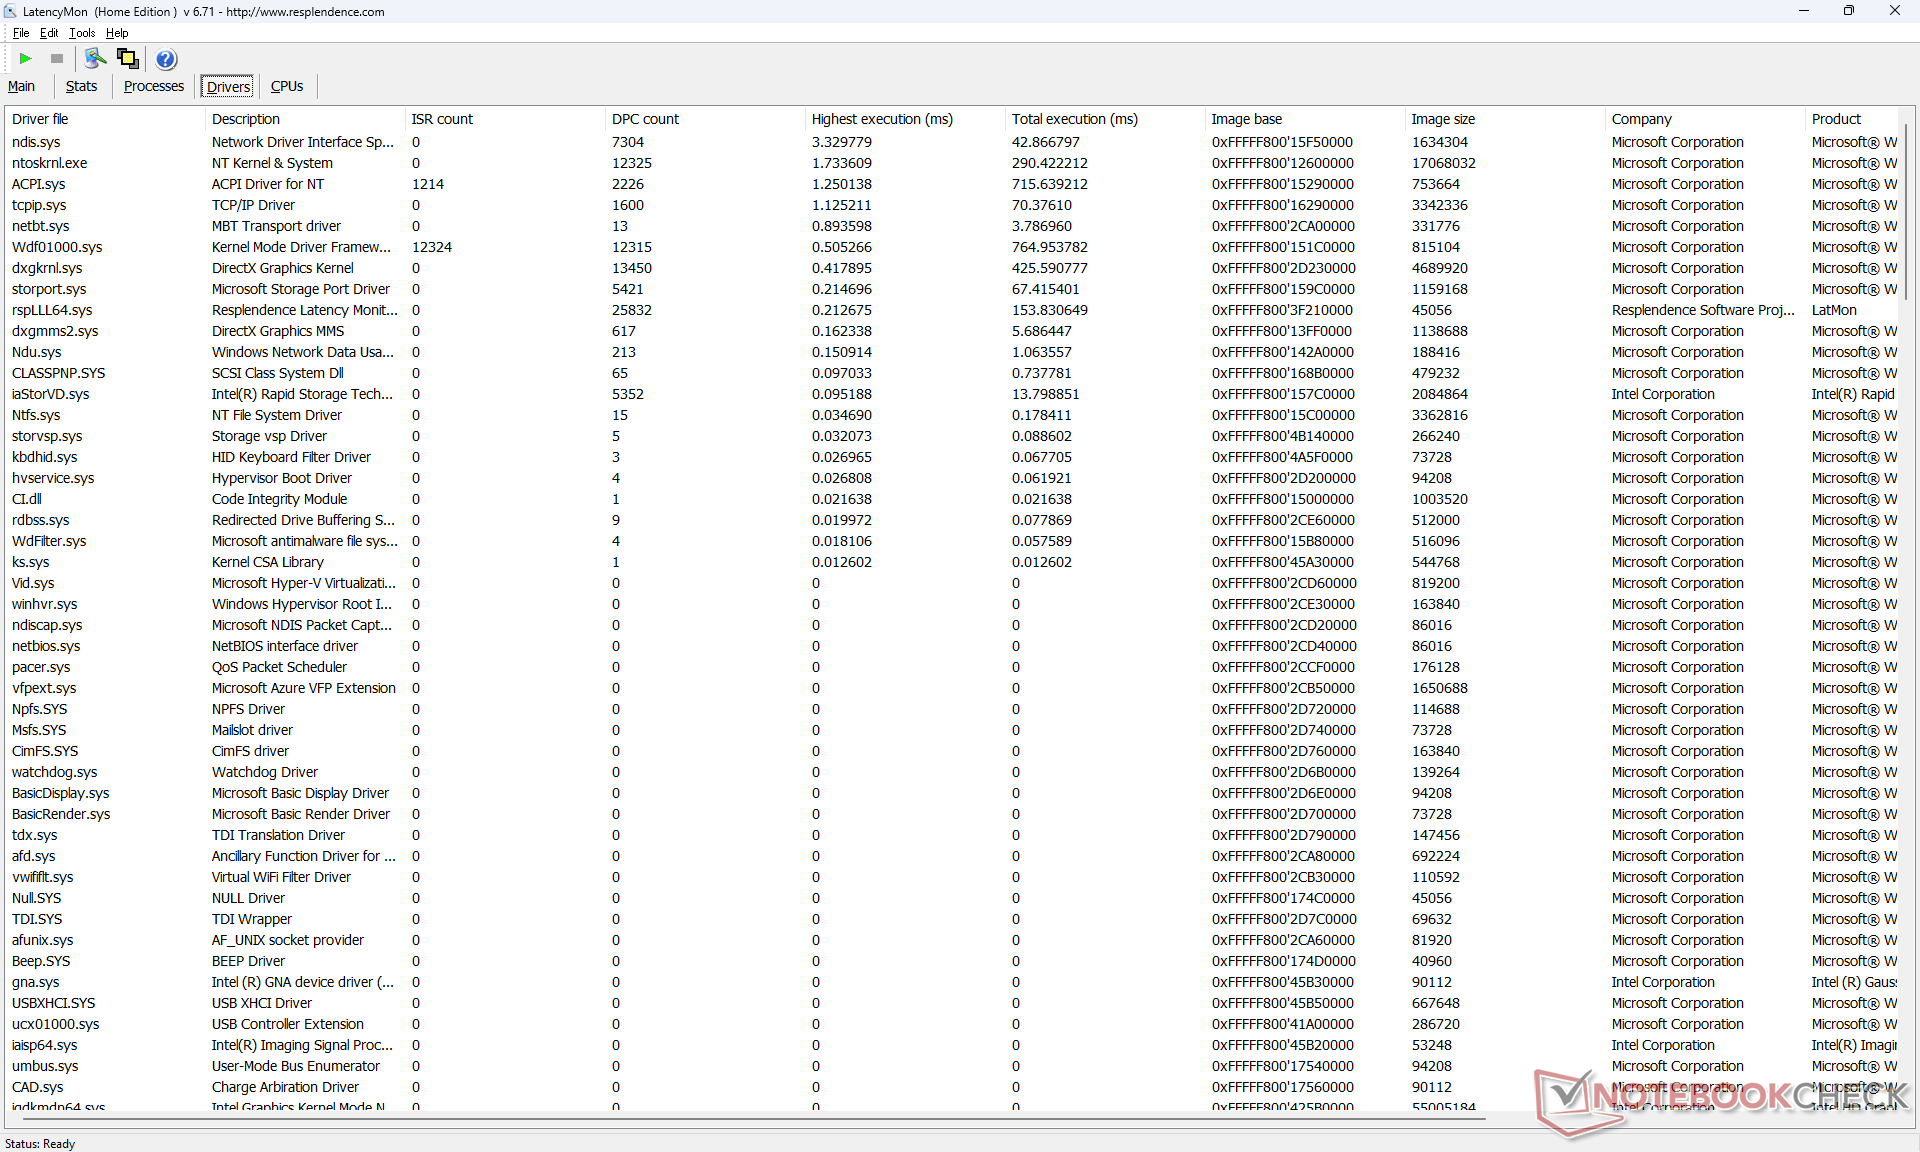
LatencyMon rivela problemi di DPC quando si aprono più schede del browser della nostra homepage, il che è deludente da vedere su un dispositivo robusto in cui la stabilità delle prestazioni è fondamentale. anche la riproduzione di video 4K a 60 FPS è imperfetta, con 2 fotogrammi caduti durante il nostro video di prova della durata di un minuto.
| DPC Latencies / LatencyMon - interrupt to process latency (max), Web, Youtube, Prime95 | |
| Acer Enduro Urban N3 EUN314 | |
| Dell Latitude 7230 Rugged Extreme | |
| Durabook S14I | |
| Panasonic Toughbook 40 | |
| Getac B360 | |
| Dell Latitude 7330 Rugged Extreme | |
* ... Meglio usare valori piccoli
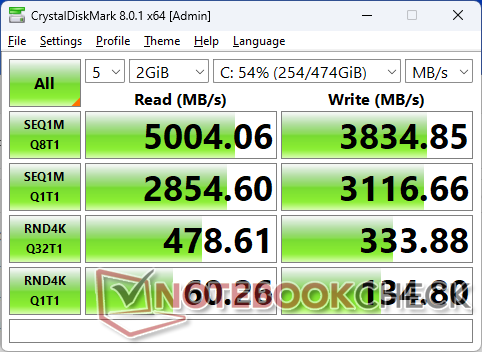
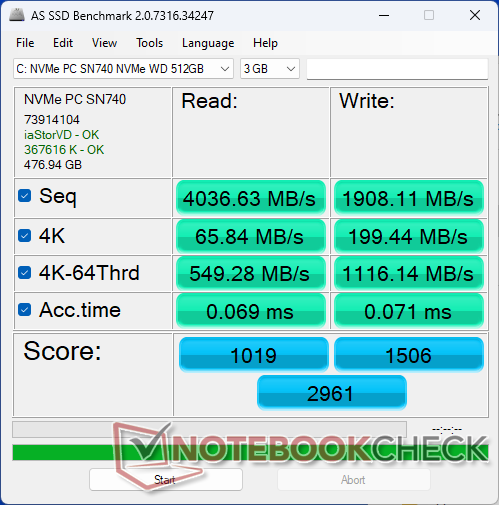
Dispositivi di archiviazione
La nostra unità di prova viene fornita con un'unità SSD rimovibile WD PC SN740 PCIe4 x4 NVMe SSD per velocità di trasferimento sequenziale fino a 4800 MB/s. Le prestazioni massime, tuttavia, non sono sostenibili, poiché le velocità di trasferimento scendono a 2300 MB/s dopo pochi minuti, come mostra il grafico seguente.

| Drive Performance rating - Percent | |
| Dell Latitude 7330 Rugged Extreme | |
| Dell Latitude 7230 Rugged Extreme | |
| Acer Enduro Urban N3 EUN314 | |
| Getac B360 | |
| Durabook S14I | |
| Panasonic Toughbook 40 | |
* ... Meglio usare valori piccoli
Disk Throttling: DiskSpd Read Loop, Queue Depth 8
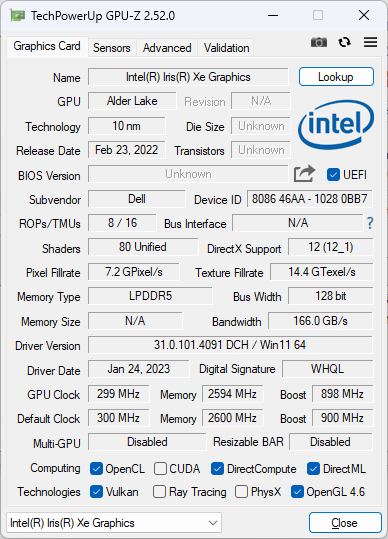
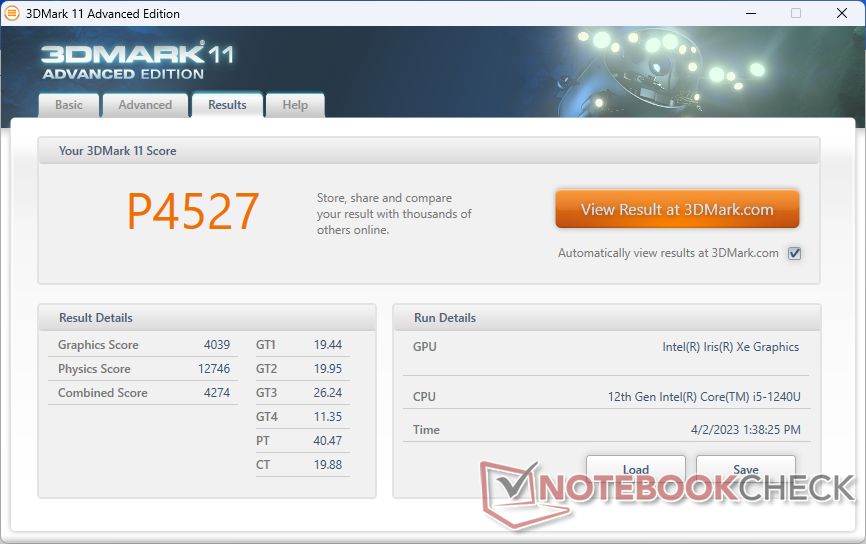
Prestazioni della GPU - Media Iris Xe 80 EUs
Le prestazioni grafiche sono inferiori di circa il 5-15% rispetto alla media dei PC del nostro database dotati della stessa GPU integrata GPU Iris Xe 80 EUs integrata. Le prestazioni complessive sono inferiori di circa il 30-40% rispetto alla comune GPU Iris Xe 96 EUs Iris Xe 96 EUs. Fortunatamente, il modello può essere configurato con il Core i7-1260U che viene fornito con la più veloce Iris Xe 96 EUs per coloro che ne hanno bisogno, come menzionato in precedenza.
Le prestazioni del sistema sembrano essere identiche tra i profili energetici Ottimizzato e Ultra. Un test 3DMark 11 su entrambe le modalità di alimentazione porterebbe a punteggi finali quasi identici.
| 3DMark | |
| 1920x1080 Fire Strike Graphics | |
| Lenovo ThinkPad P14s G3 AMD 21J6S05000 | |
| Asus ExpertBook B5 Flip B5602FBN | |
| HP EliteBook 840 G9 | |
| HP ZBook Firefly 14 G9-6B8A2EA | |
| Dell Latitude 7330 Rugged Extreme | |
| Acer Enduro Urban N3 EUN314 | |
| Panasonic Toughbook 40 | |
| Media Intel Iris Xe Graphics G7 80EUs (1560 - 5398, n=114) | |
| Dell Latitude 7230 Rugged Extreme | |
| Lenovo ThinkBook 13s G3 20YA0005GE | |
| Durabook S14I | |
| HP ProBook 440 G9-5Y3Z3EA | |
| Getac B360 | |
| 2560x1440 Time Spy Graphics | |
| Asus ExpertBook B5 Flip B5602FBN | |
| Lenovo ThinkPad P14s G3 AMD 21J6S05000 | |
| HP ZBook Firefly 14 G9-6B8A2EA | |
| HP EliteBook 840 G9 | |
| Dell Latitude 7330 Rugged Extreme | |
| Acer Enduro Urban N3 EUN314 | |
| Panasonic Toughbook 40 | |
| HP ProBook 440 G9-5Y3Z3EA | |
| Media Intel Iris Xe Graphics G7 80EUs (561 - 1576, n=111) | |
| Lenovo ThinkBook 13s G3 20YA0005GE | |
| Durabook S14I | |
| Dell Latitude 7230 Rugged Extreme | |
| Getac B360 | |
| 3DMark 11 - 1280x720 Performance GPU | |
| Lenovo ThinkPad P14s G3 AMD 21J6S05000 | |
| Asus ExpertBook B5 Flip B5602FBN | |
| HP ZBook Firefly 14 G9-6B8A2EA | |
| HP EliteBook 840 G9 | |
| Acer Enduro Urban N3 EUN314 | |
| Dell Latitude 7330 Rugged Extreme | |
| Panasonic Toughbook 40 | |
| Lenovo ThinkBook 13s G3 20YA0005GE | |
| Media Intel Iris Xe Graphics G7 80EUs (2246 - 6579, n=112) | |
| Durabook S14I | |
| HP ProBook 440 G9-5Y3Z3EA | |
| Dell Latitude 7230 Rugged Extreme | |
| Getac B360 | |
| 3DMark 11 Performance | 4527 punti | |
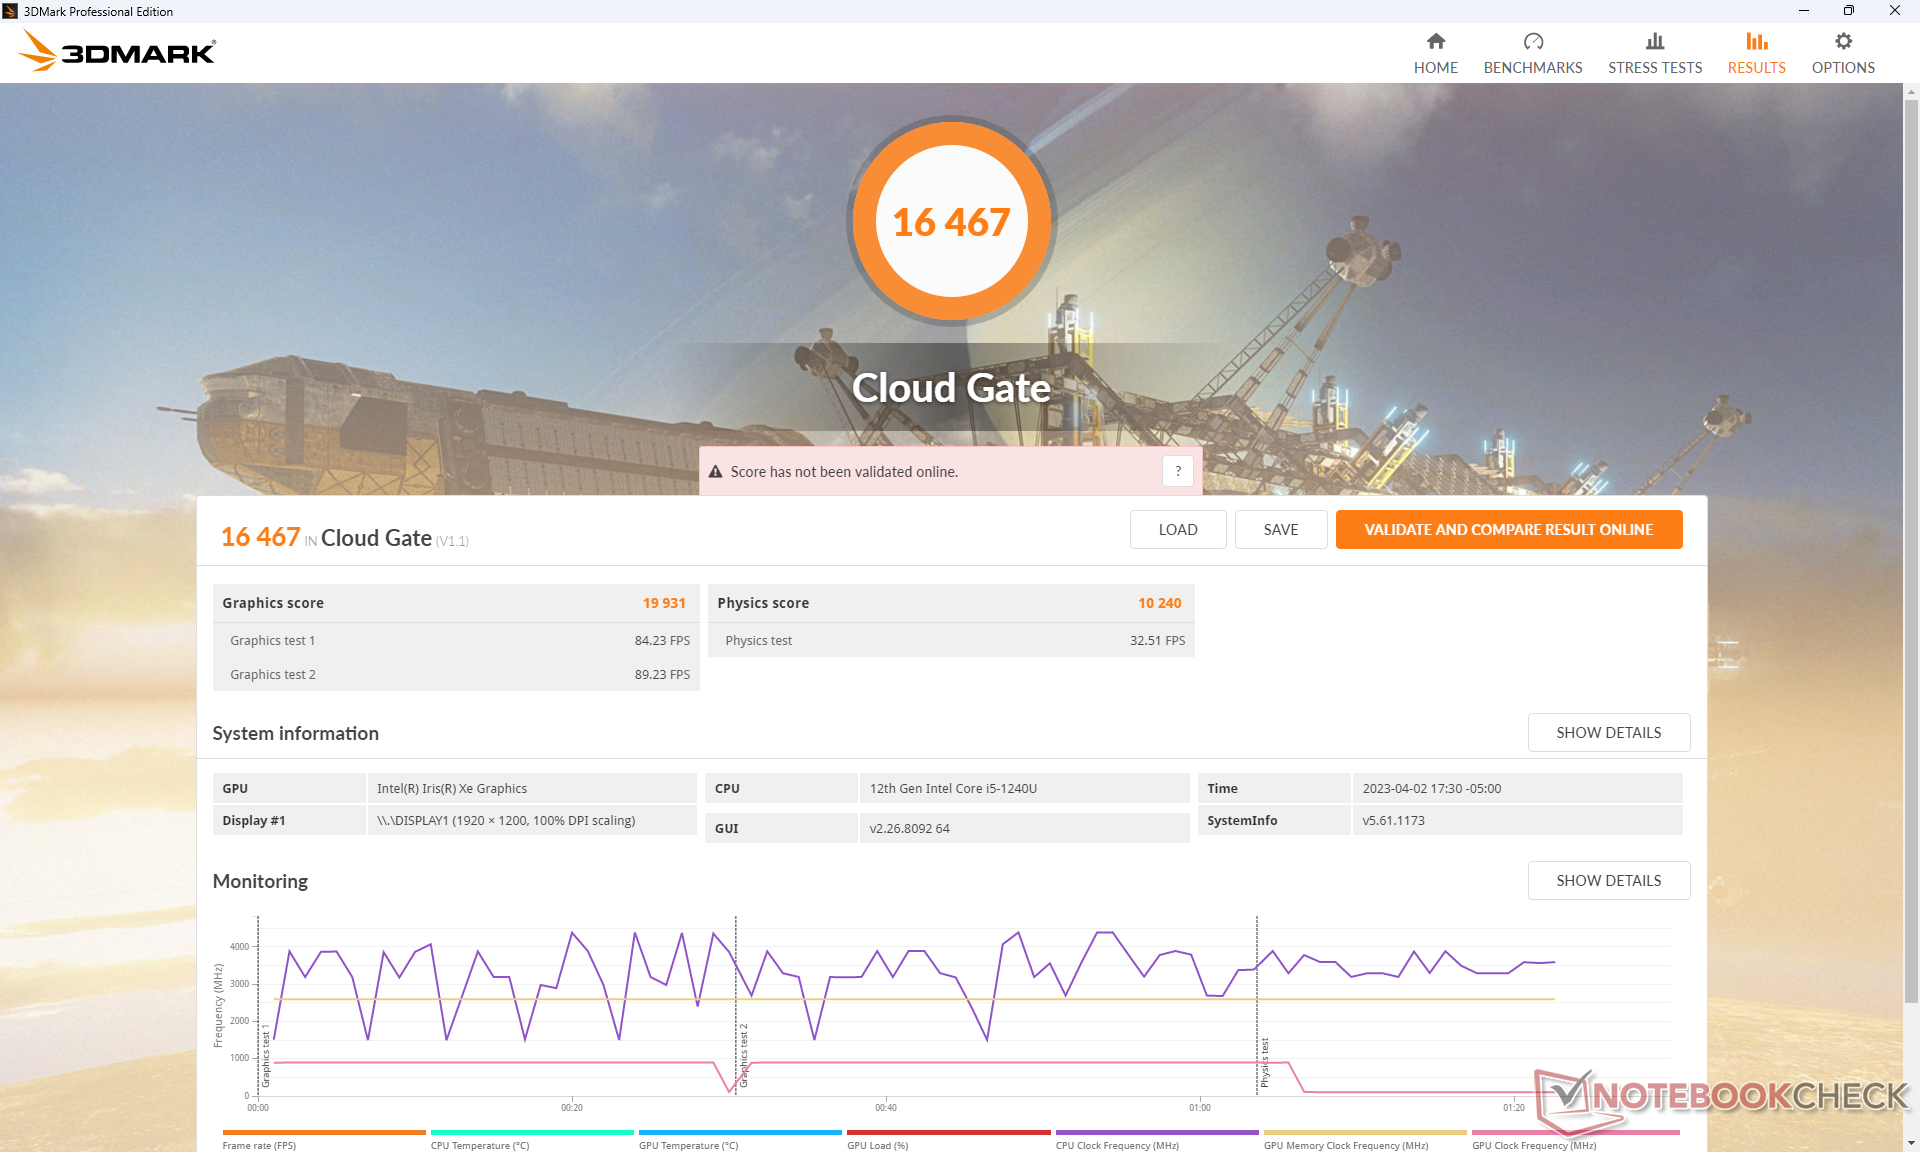
| 3DMark Cloud Gate Standard Score | 16467 punti | |
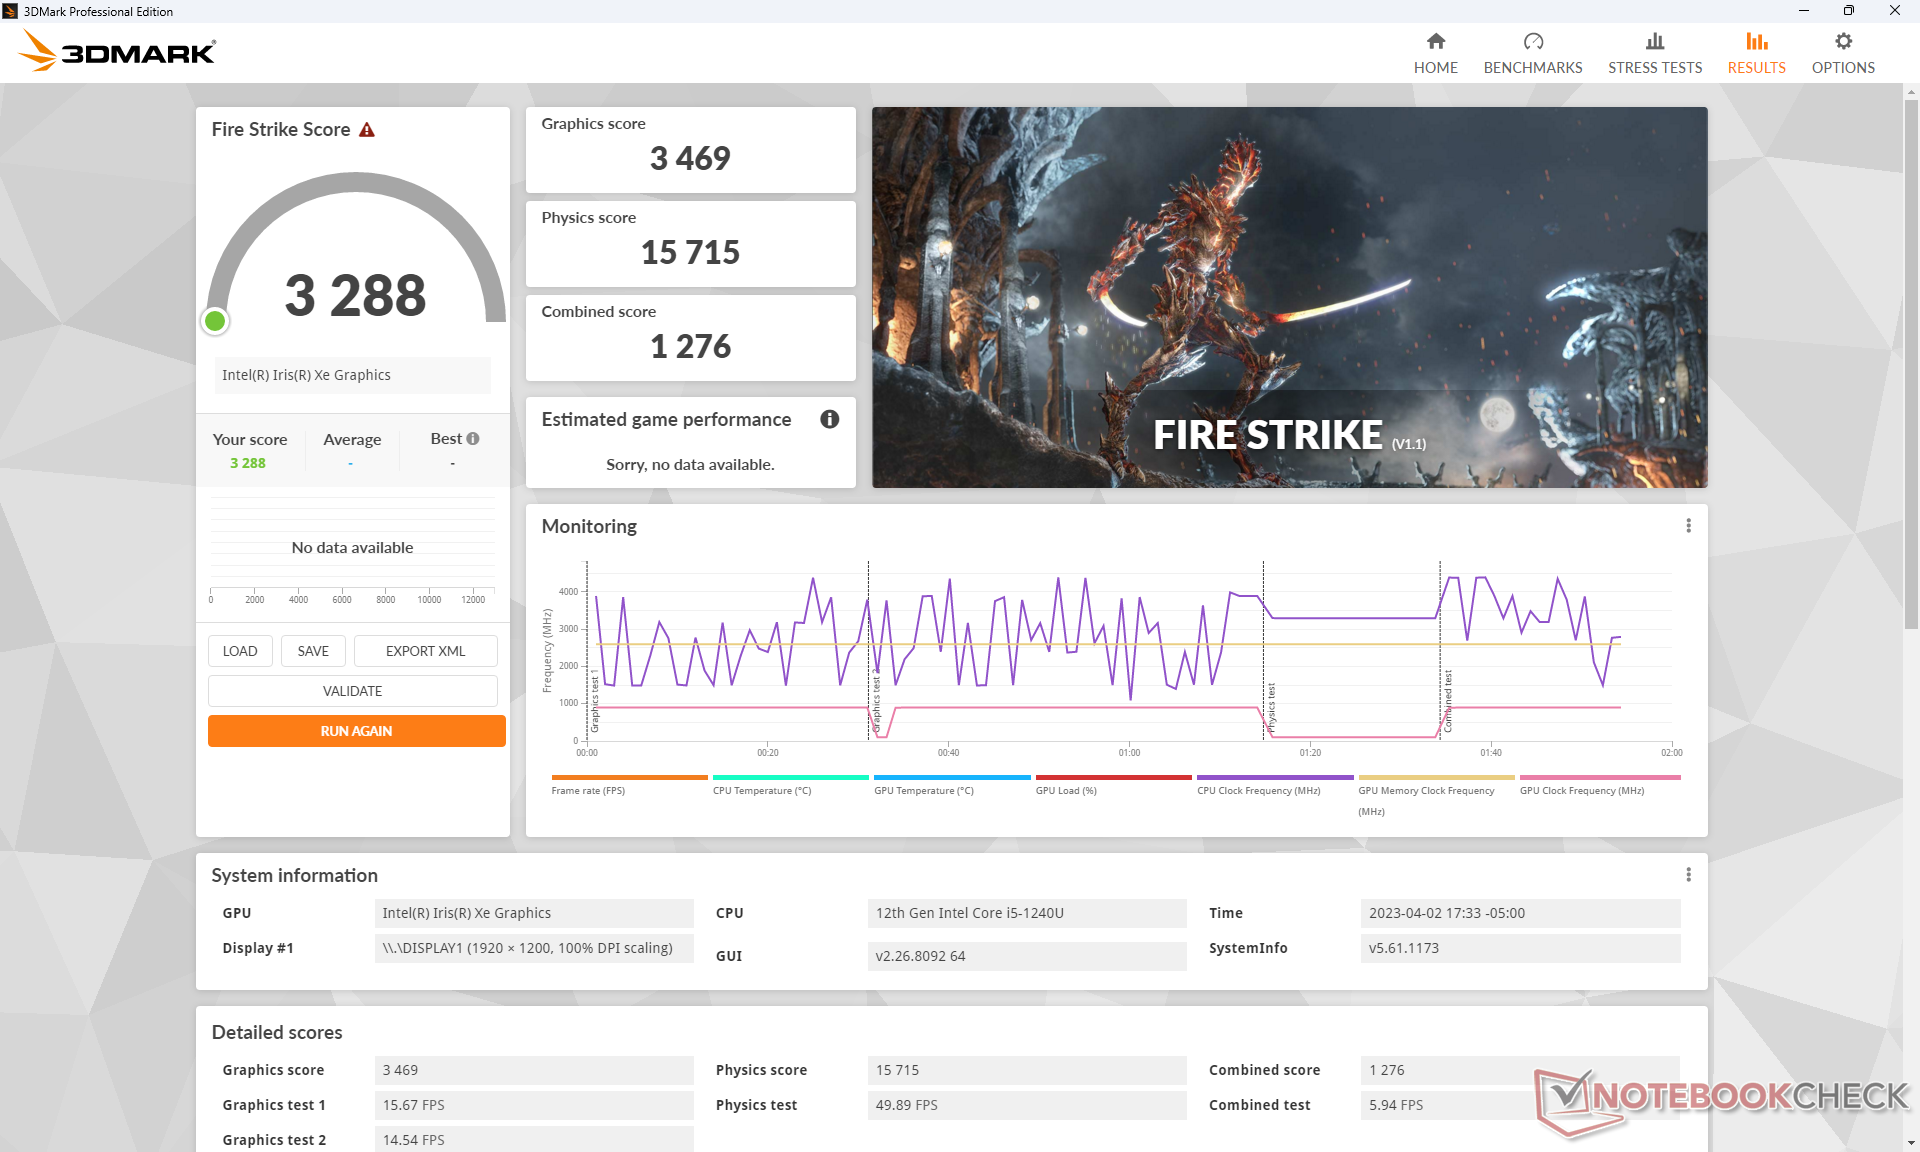
| 3DMark Fire Strike Score | 3288 punti | |
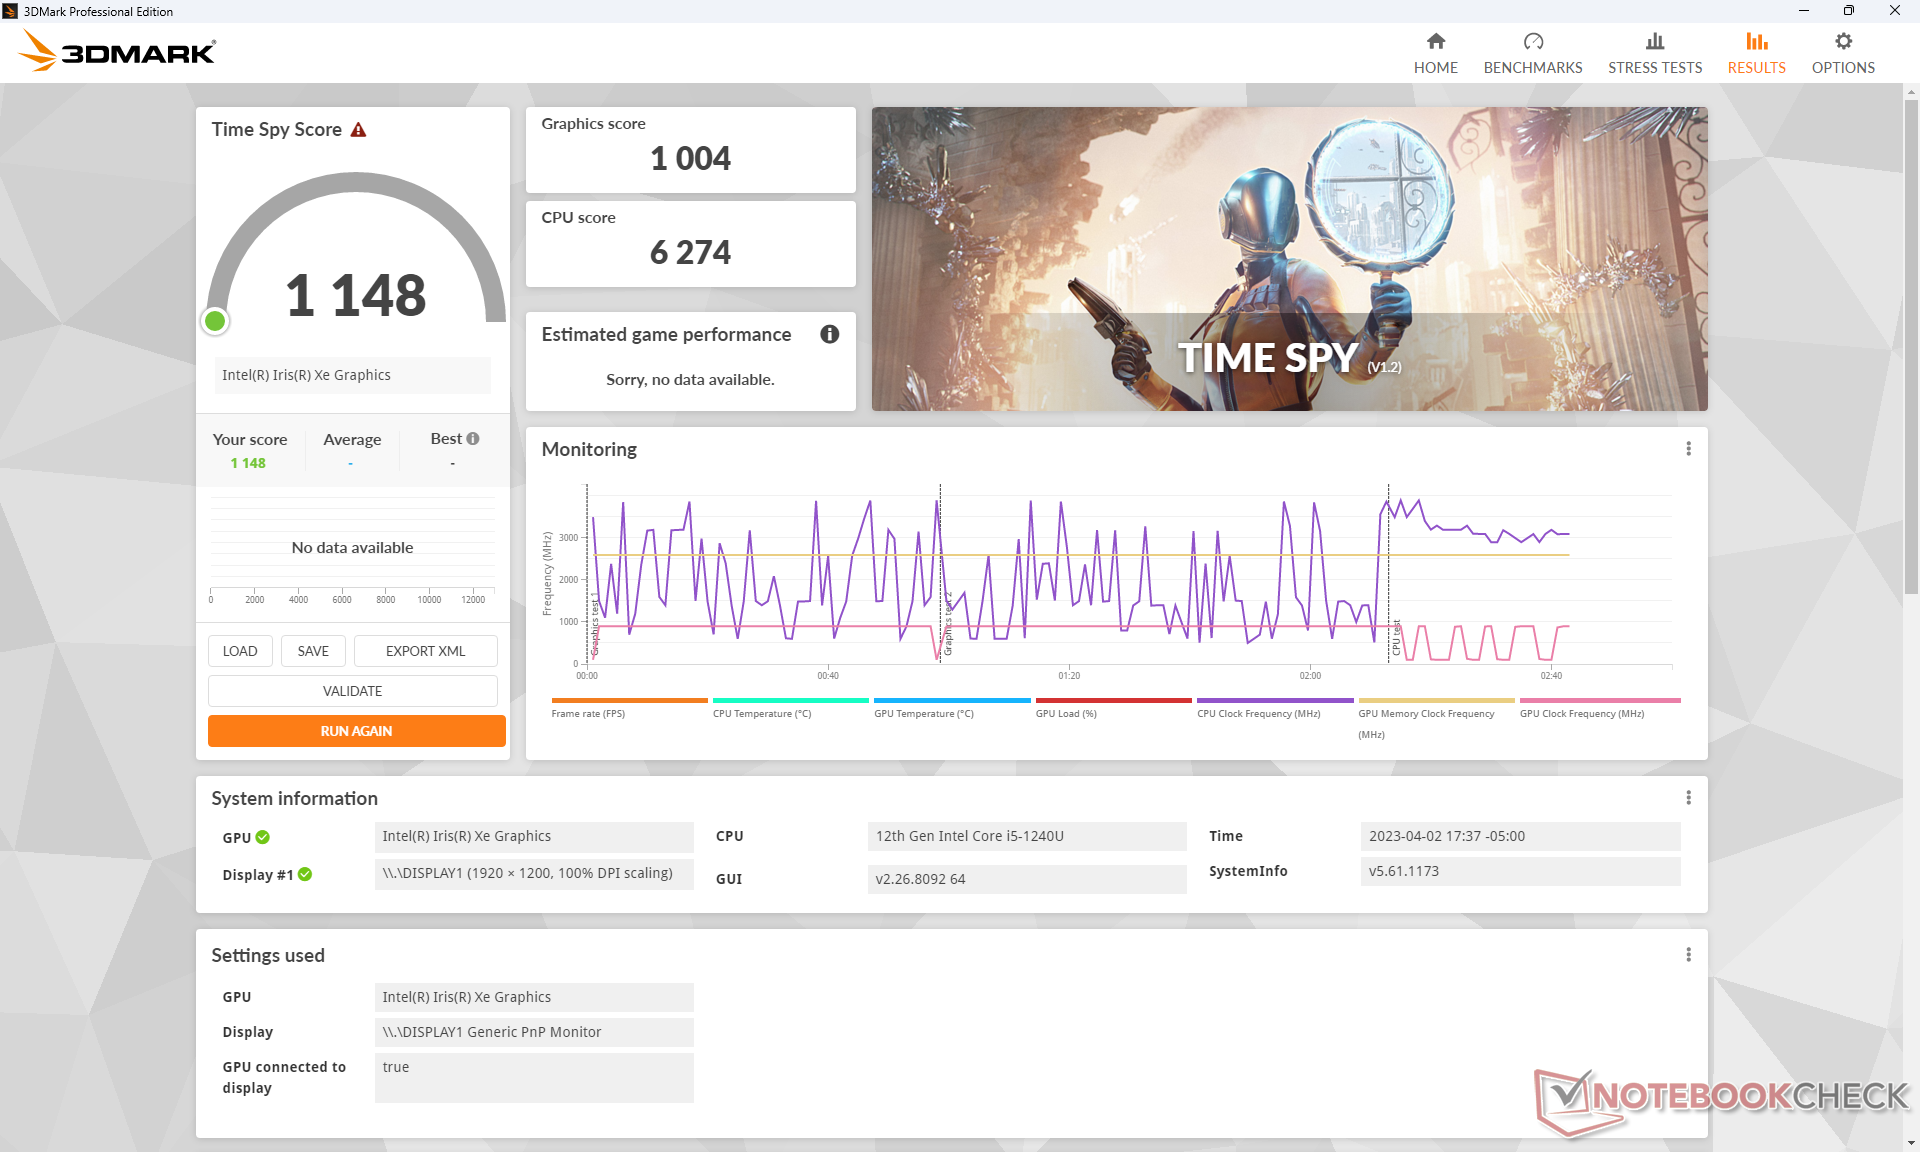
| 3DMark Time Spy Score | 1148 punti | |
Aiuto | ||
| Performance rating - Percent | |
| HP ZBook Firefly 14 G9-6B8A2EA | |
| Lenovo ThinkPad P14s G3 AMD 21J6S05000 | |
| Asus ExpertBook B5 Flip B5602FBN | |
| Dell Latitude 7330 Rugged Extreme -2! | |
| HP EliteBook 840 G9 | |
| Panasonic Toughbook 40 -2! | |
| Lenovo ThinkBook 13s G3 20YA0005GE -2! | |
| Acer Enduro Urban N3 EUN314 | |
| HP ProBook 440 G9-5Y3Z3EA -2! | |
| Durabook S14I -3! | |
| Dell Latitude 7230 Rugged Extreme | |
| Getac B360 -2! | |
| The Witcher 3 - 1920x1080 Ultra Graphics & Postprocessing (HBAO+) | |
| Lenovo ThinkPad P14s G3 AMD 21J6S05000 | |
| HP ZBook Firefly 14 G9-6B8A2EA | |
| Asus ExpertBook B5 Flip B5602FBN | |
| HP EliteBook 840 G9 | |
| Dell Latitude 7330 Rugged Extreme | |
| Panasonic Toughbook 40 | |
| Lenovo ThinkBook 13s G3 20YA0005GE | |
| Acer Enduro Urban N3 EUN314 | |
| Dell Latitude 7230 Rugged Extreme | |
| HP ProBook 440 G9-5Y3Z3EA | |
| Getac B360 | |
| GTA V - 1920x1080 Highest AA:4xMSAA + FX AF:16x | |
| HP ZBook Firefly 14 G9-6B8A2EA | |
| Lenovo ThinkPad P14s G3 AMD 21J6S05000 | |
| Asus ExpertBook B5 Flip B5602FBN | |
| HP EliteBook 840 G9 | |
| Acer Enduro Urban N3 EUN314 | |
| Dell Latitude 7230 Rugged Extreme | |
| Final Fantasy XV Benchmark - 1920x1080 High Quality | |
| Dell Latitude 7330 Rugged Extreme | |
| Lenovo ThinkPad P14s G3 AMD 21J6S05000 | |
| HP ZBook Firefly 14 G9-6B8A2EA | |
| HP EliteBook 840 G9 | |
| Asus ExpertBook B5 Flip B5602FBN | |
| Acer Enduro Urban N3 EUN314 | |
| Panasonic Toughbook 40 | |
| Lenovo ThinkBook 13s G3 20YA0005GE | |
| Dell Latitude 7230 Rugged Extreme | |
| HP ProBook 440 G9-5Y3Z3EA | |
| Durabook S14I | |
| Getac B360 | |
| Strange Brigade - 1920x1080 ultra AA:ultra AF:16 | |
| Asus ExpertBook B5 Flip B5602FBN | |
| HP ZBook Firefly 14 G9-6B8A2EA | |
| Lenovo ThinkPad P14s G3 AMD 21J6S05000 | |
| HP EliteBook 840 G9 | |
| Acer Enduro Urban N3 EUN314 | |
| Dell Latitude 7230 Rugged Extreme | |
| Dota 2 Reborn - 1920x1080 ultra (3/3) best looking | |
| HP ZBook Firefly 14 G9-6B8A2EA | |
| HP EliteBook 840 G9 | |
| Lenovo ThinkPad P14s G3 AMD 21J6S05000 | |
| Dell Latitude 7330 Rugged Extreme | |
| Asus ExpertBook B5 Flip B5602FBN | |
| Panasonic Toughbook 40 | |
| Lenovo ThinkBook 13s G3 20YA0005GE | |
| Dell Latitude 7230 Rugged Extreme | |
| Acer Enduro Urban N3 EUN314 | |
| Durabook S14I | |
| HP ProBook 440 G9-5Y3Z3EA | |
| Getac B360 | |
| X-Plane 11.11 - 1920x1080 high (fps_test=3) | |
| HP ZBook Firefly 14 G9-6B8A2EA | |
| Acer Enduro Urban N3 EUN314 | |
| HP EliteBook 840 G9 | |
| Lenovo ThinkPad P14s G3 AMD 21J6S05000 | |
| HP ProBook 440 G9-5Y3Z3EA | |
| Lenovo ThinkBook 13s G3 20YA0005GE | |
| Asus ExpertBook B5 Flip B5602FBN | |
| Durabook S14I | |
| Panasonic Toughbook 40 | |
| Dell Latitude 7330 Rugged Extreme | |
| Dell Latitude 7230 Rugged Extreme | |
| Getac B360 | |
Witcher 3 FPS Chart
| basso | medio | alto | ultra | |
|---|---|---|---|---|
| GTA V (2015) | 103.3 | 93.3 | 18.5 | 7.79 |
| The Witcher 3 (2015) | 67.3 | 40.9 | 24.1 | 10.6 |
| Dota 2 Reborn (2015) | 98.9 | 77.8 | 50.7 | 45.7 |
| Final Fantasy XV Benchmark (2018) | 31 | 17.3 | 11.8 | |
| X-Plane 11.11 (2018) | 32.6 | 22.6 | 20.6 | |
| Strange Brigade (2018) | 60.2 | 27.4 | 21.4 | 17.9 |
Emissioni: silenziose fino a quando non sono rumorose
Rumore del sistema
Il rumore della ventola è silenzioso e sostanzialmente impercettibile con carichi medio-bassi. L'esecuzione della prima scena di benchmark di 3DMark 06, ad esempio, non induce alcun rumore della ventola fino alla fine del benchmark.
La ventola di piccolo diametro è purtroppo più rumorosa rispetto alla maggior parte dei portatili. Se si eseguono applicazioni molto impegnative come giochi o Prime95, il rumore della ventola può raggiungere i 43 dB(A) ed è uno dei tablet rugged più rumorosi che abbiamo testato. Tuttavia, per raggiungere livelli di rumorosità così elevati, è necessario spingere il tablet ai suoi limiti.
Rumorosità
| Idle |
| 22.9 / 22.9 / 22.9 dB(A) |
| Sotto carico |
| 24.5 / 43.2 dB(A) |
 | ||
30 dB silenzioso 40 dB(A) udibile 50 dB(A) rumoroso |
||
min: | ||
| Dell Latitude 7230 Rugged Extreme Iris Xe G7 80EUs, i5-1240U, WD PC SN740 512GB SDDPMQD-512G-1101 | Dell Latitude 7330 Rugged Extreme Iris Xe G7 96EUs, i7-1185G7 | Panasonic Toughbook 40 Iris Xe G7 96EUs, i7-1185G7, Samsung PM991 MZVLQ1T0HALB | Getac B360 UHD Graphics 620, i7-10710U, Lite-On CA5-8D512 | Acer Enduro Urban N3 EUN314 Iris Xe G7 96EUs, i7-1165G7, Samsung PM991 MZVLQ1T0HALB | Durabook S14I Iris Xe G7 96EUs, i7-1165G7, UDinfo M2P M2P80DE512GBAEP | |
|---|---|---|---|---|---|---|
| Noise | 2% | -13% | 0% | -3% | -18% | |
| off /ambiente * (dB) | 22.8 | 22.9 -0% | 22.8 -0% | 24.3 -7% | 23.8 -4% | 25.2 -11% |
| Idle Minimum * (dB) | 22.9 | 23.1 -1% | 26 -14% | 24.5 -7% | 24.1 -5% | 25.2 -10% |
| Idle Average * (dB) | 22.9 | 23.1 -1% | 26 -14% | 24.5 -7% | 24.1 -5% | 25.2 -10% |
| Idle Maximum * (dB) | 22.9 | 23.1 -1% | 26 -14% | 24.6 -7% | 24.1 -5% | 34.5 -51% |
| Load Average * (dB) | 24.5 | 28 -14% | 37.6 -53% | 29.8 -22% | 27.9 -14% | 34.5 -41% |
| Witcher 3 ultra * (dB) | 36 | 31.2 13% | 37.8 -5% | 27.3 24% | 35.7 1% | |
| Load Maximum * (dB) | 43.2 | 36.2 16% | 40.3 7% | 30.8 29% | 38.6 11% | 36.2 16% |
* ... Meglio usare valori piccoli
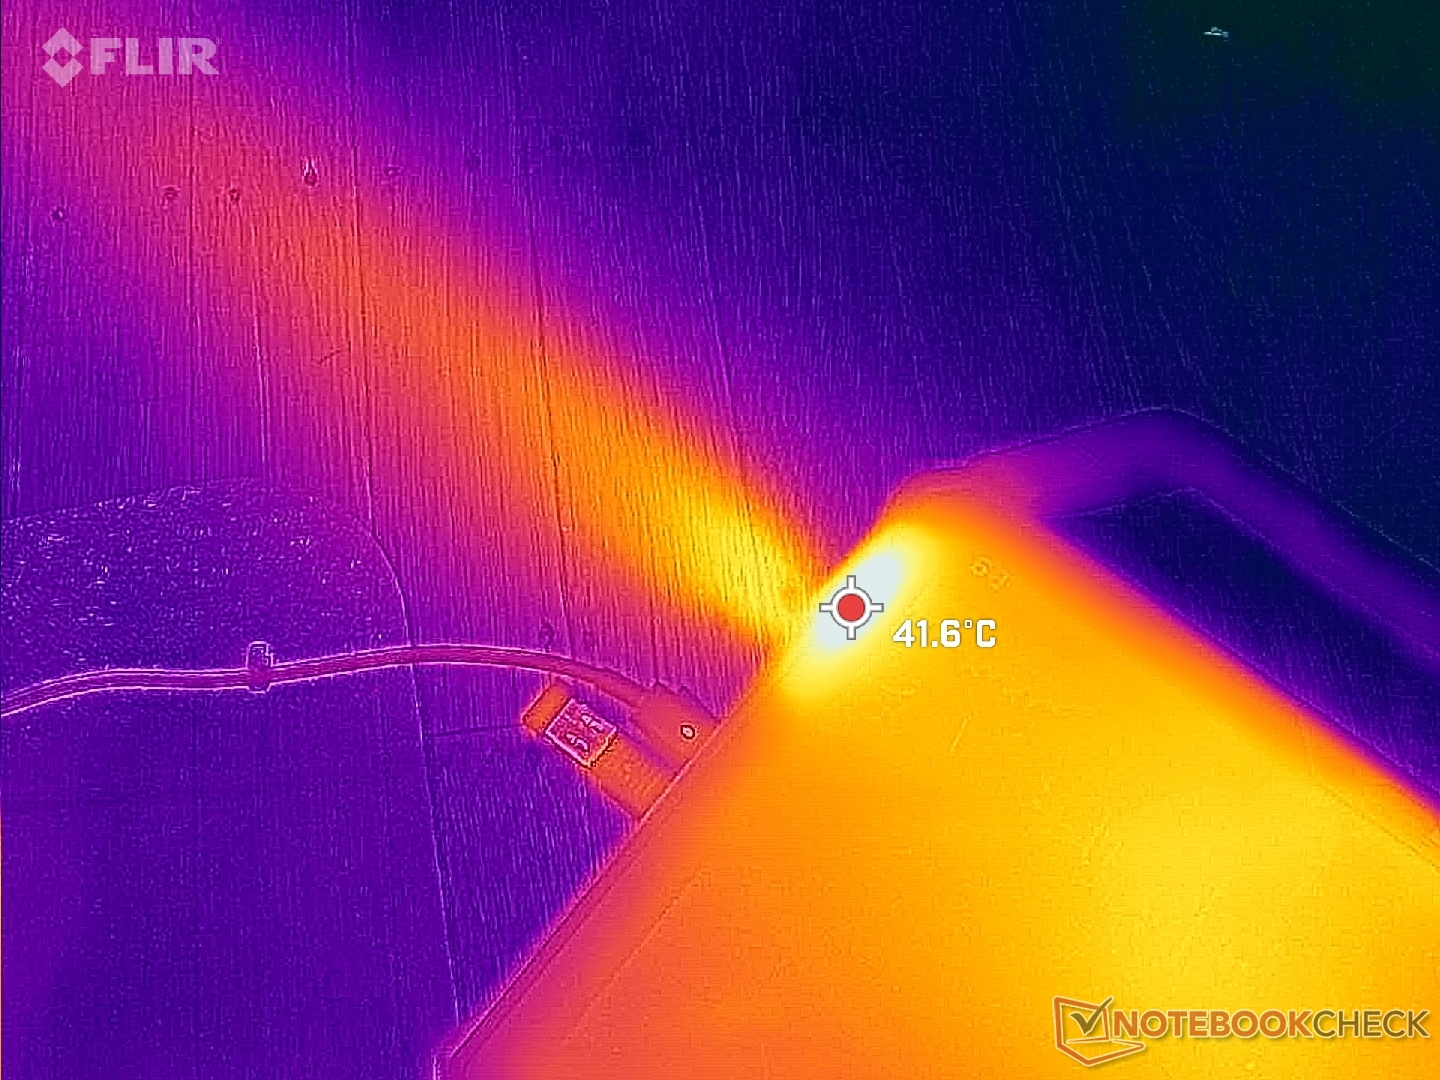
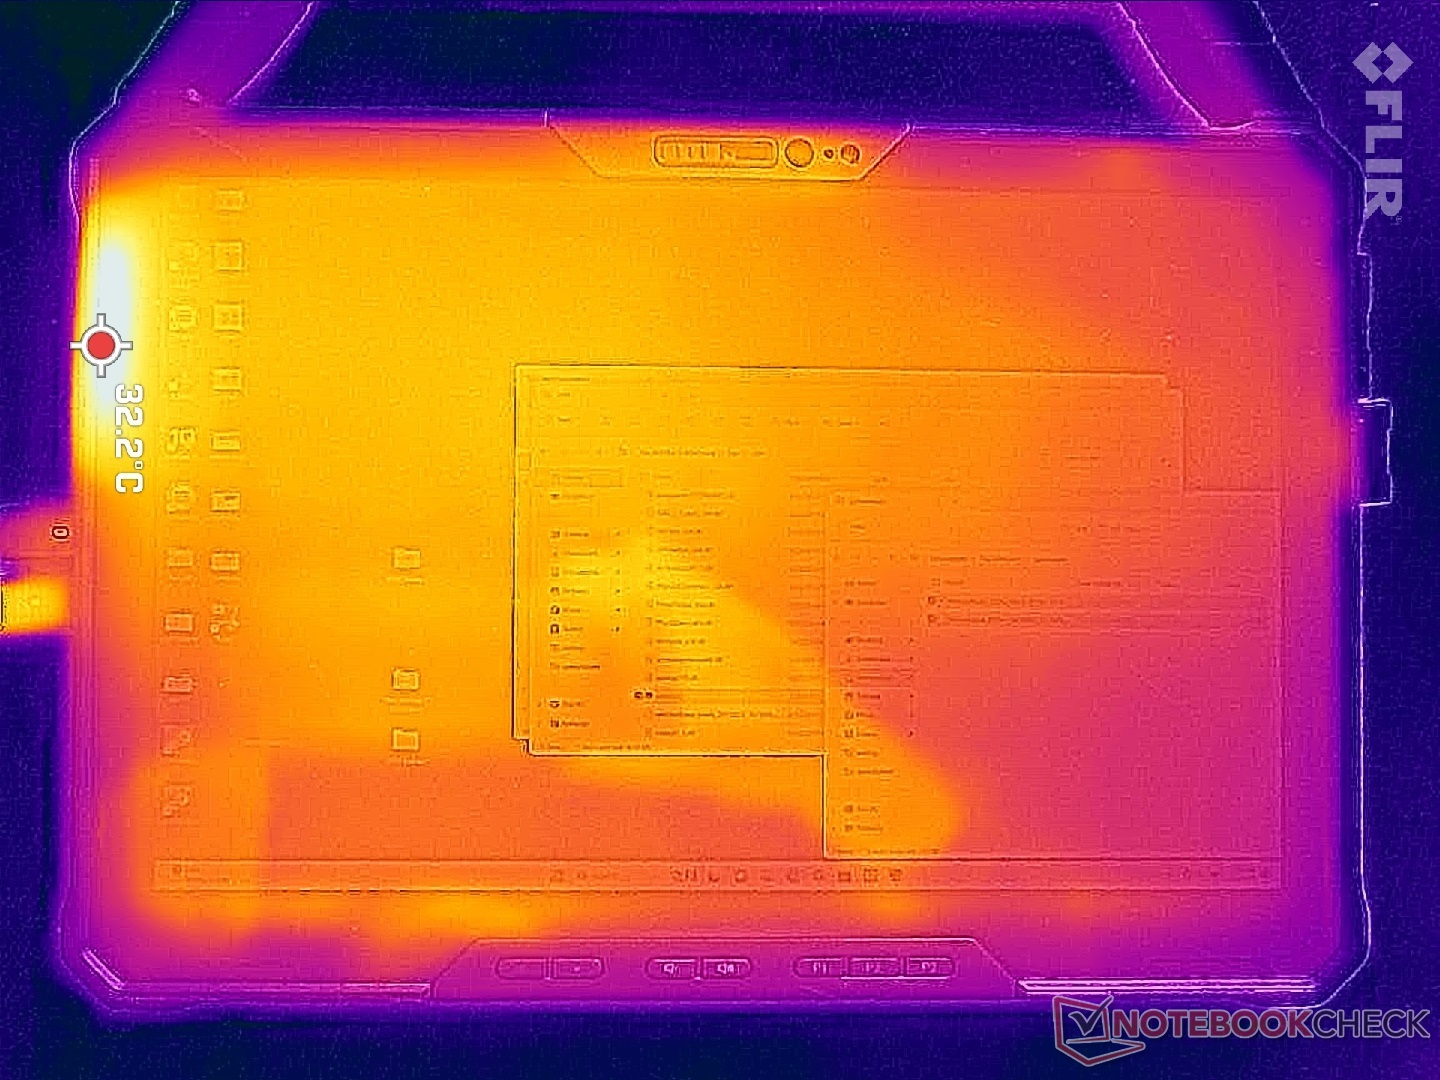
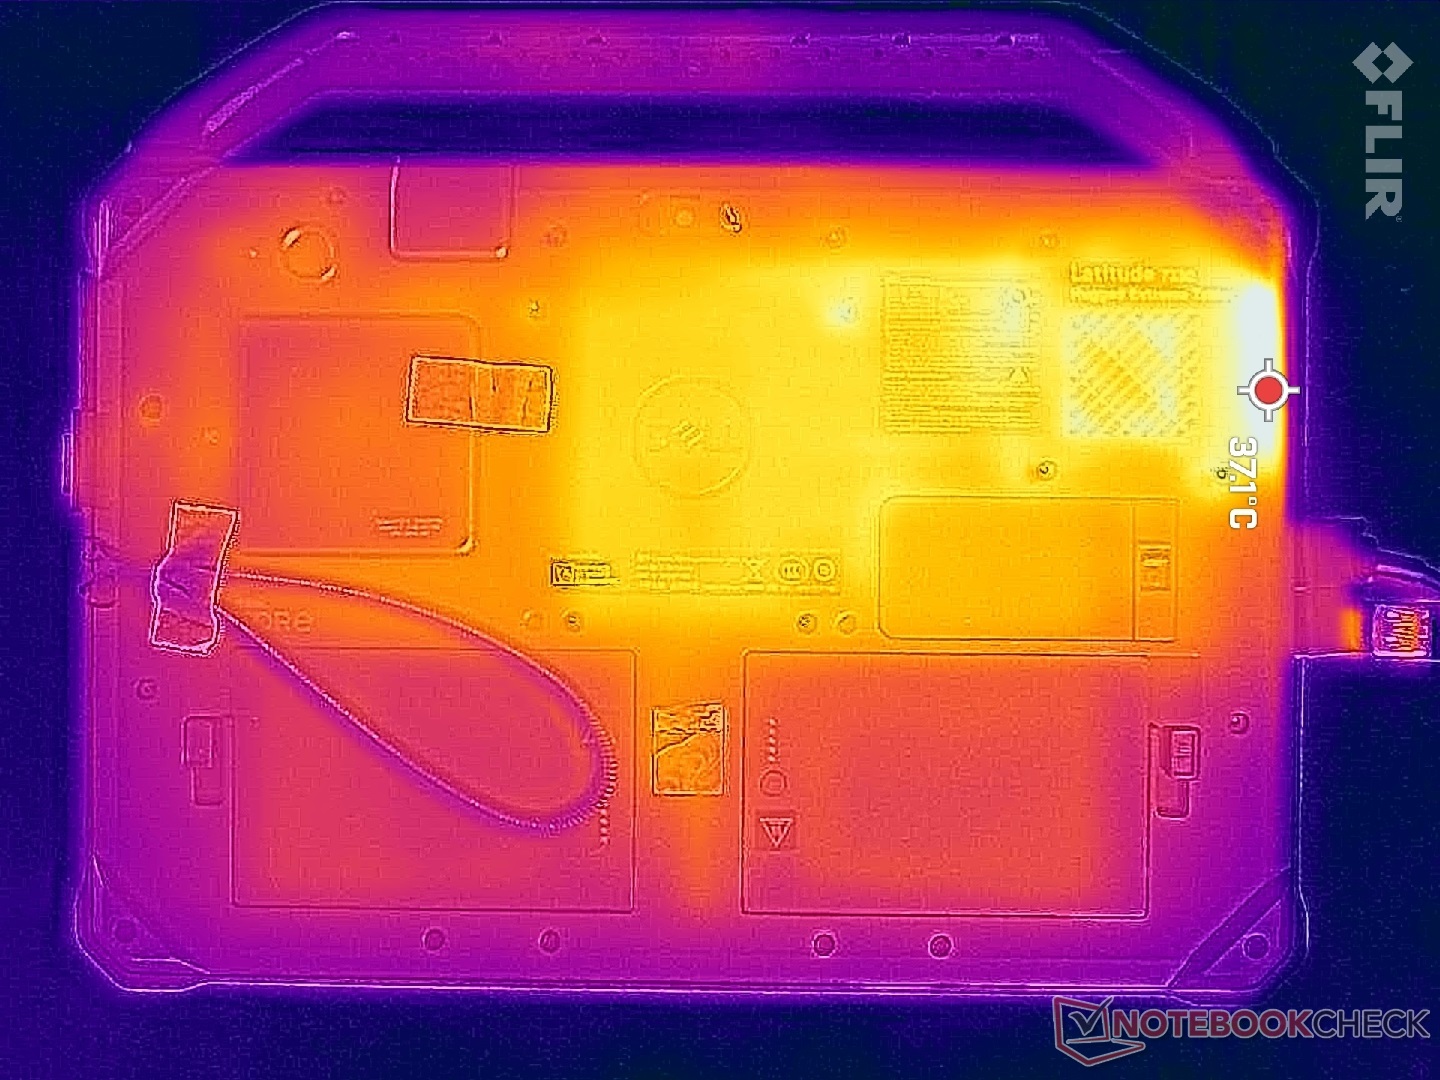
Temperatura
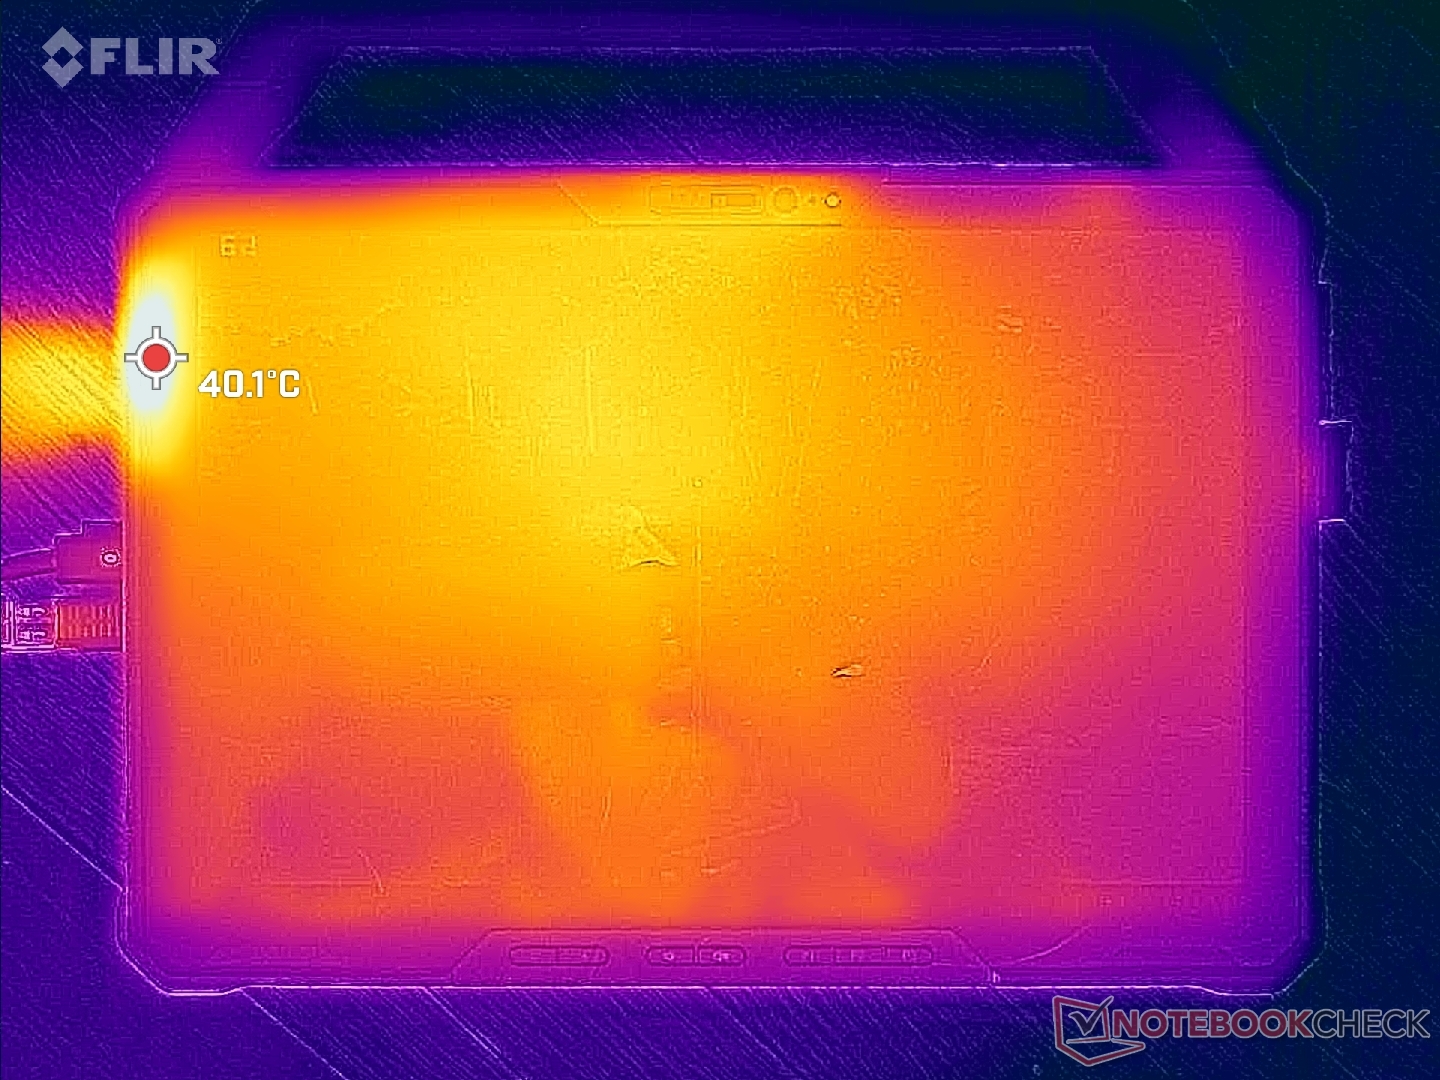
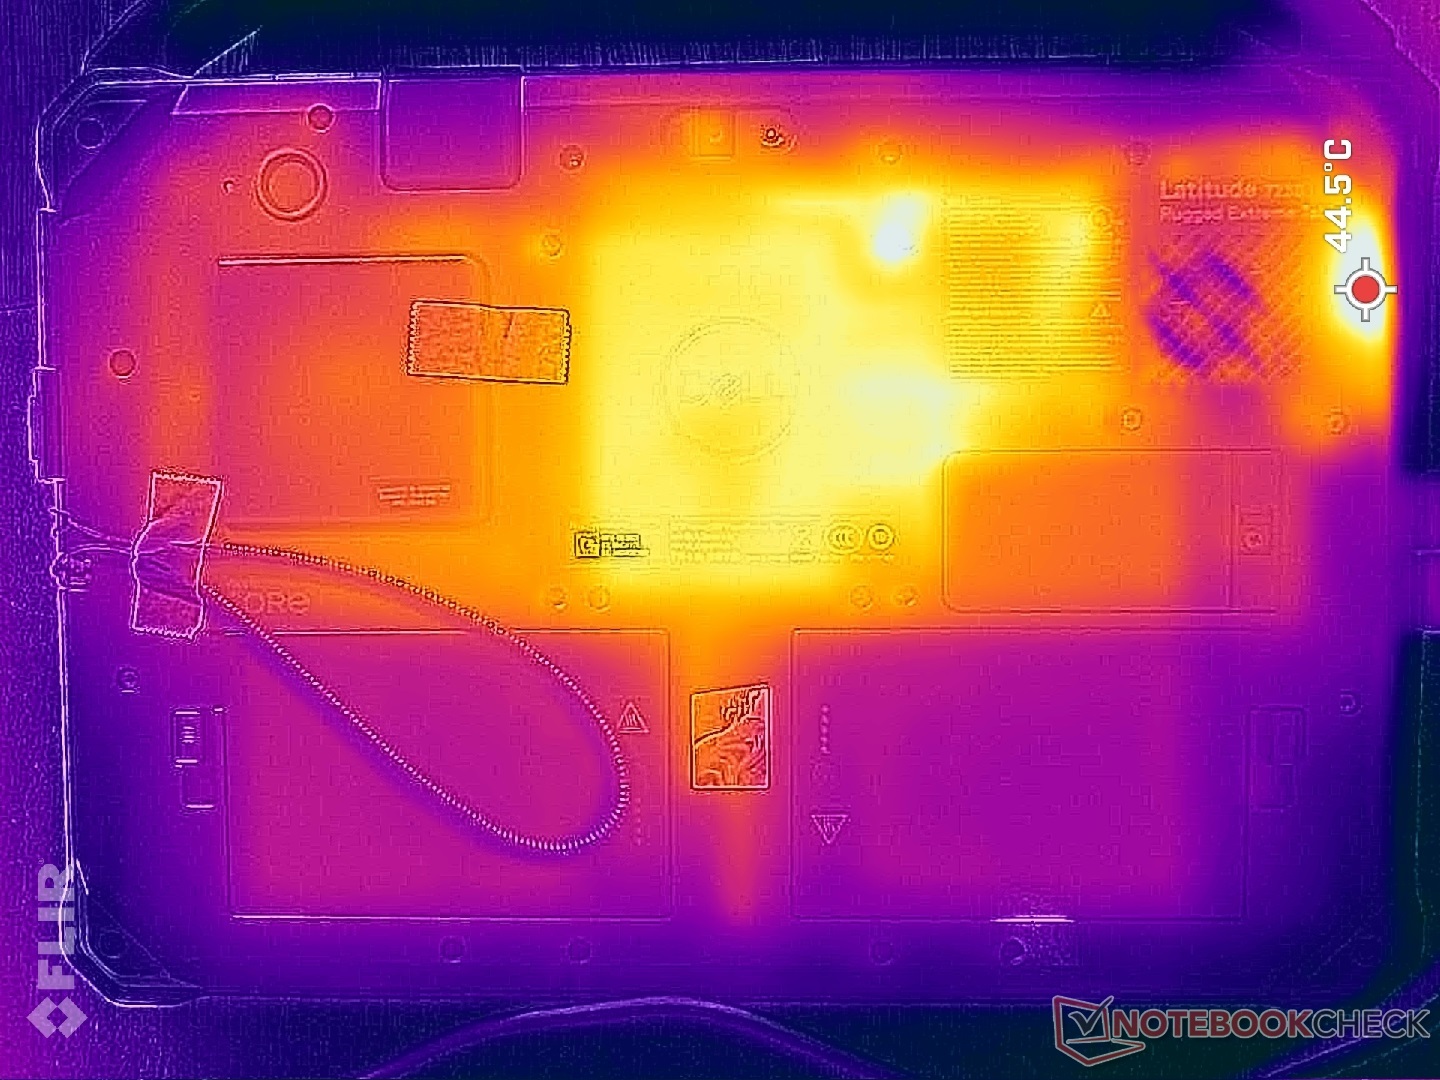
Le temperature di superficie non sono un problema grazie allo spesso profilo robusto, come nella maggior parte dei dispositivi rugged. Nel peggiore dei casi, siamo riusciti a registrare un massimo di 40 C lungo il bordo dell'unità più vicino alle griglie di ventilazione, quando la CPU è al 100% di utilizzo.
(+) La temperatura massima sul lato superiore è di 32.6 °C / 91 F, rispetto alla media di 33.6 °C / 92 F, che varia da 20.7 a 53.2 °C per questa classe Tablet.
(±) Il lato inferiore si riscalda fino ad un massimo di 40.2 °C / 104 F, rispetto alla media di 33.2 °C / 92 F
(+) In idle, la temperatura media del lato superiore è di 29 °C / 84 F, rispetto alla media deld ispositivo di 30 °C / 86 F.
| Dell Latitude 7230 Rugged Extreme Intel Core i5-1240U, Intel Iris Xe Graphics G7 80EUs | Dell Latitude 7330 Rugged Extreme Intel Core i7-1185G7, Intel Iris Xe Graphics G7 96EUs | Panasonic Toughbook 40 Intel Core i7-1185G7, Intel Iris Xe Graphics G7 96EUs | Getac B360 Intel Core i7-10710U, Intel UHD Graphics 620 | Acer Enduro Urban N3 EUN314 Intel Core i7-1165G7, Intel Iris Xe Graphics G7 96EUs | Durabook S14I Intel Core i7-1165G7, Intel Iris Xe Graphics G7 96EUs | |
|---|---|---|---|---|---|---|
| Heat | 13% | 4% | 10% | -1% | -3% | |
| Maximum Upper Side * (°C) | 32.6 | 34.6 -6% | 35.6 -9% | 33.4 -2% | 37.8 -16% | 36.4 -12% |
| Maximum Bottom * (°C) | 40.2 | 36.6 9% | 40 -0% | 42.6 -6% | 45.8 -14% | 38.6 4% |
| Idle Upper Side * (°C) | 30.6 | 24.8 19% | 28.6 7% | 24.2 21% | 26.4 14% | 32.6 -7% |
| Idle Bottom * (°C) | 35 | 25.2 28% | 29.4 16% | 26.2 25% | 30.2 14% | 33.8 3% |
* ... Meglio usare valori piccoli
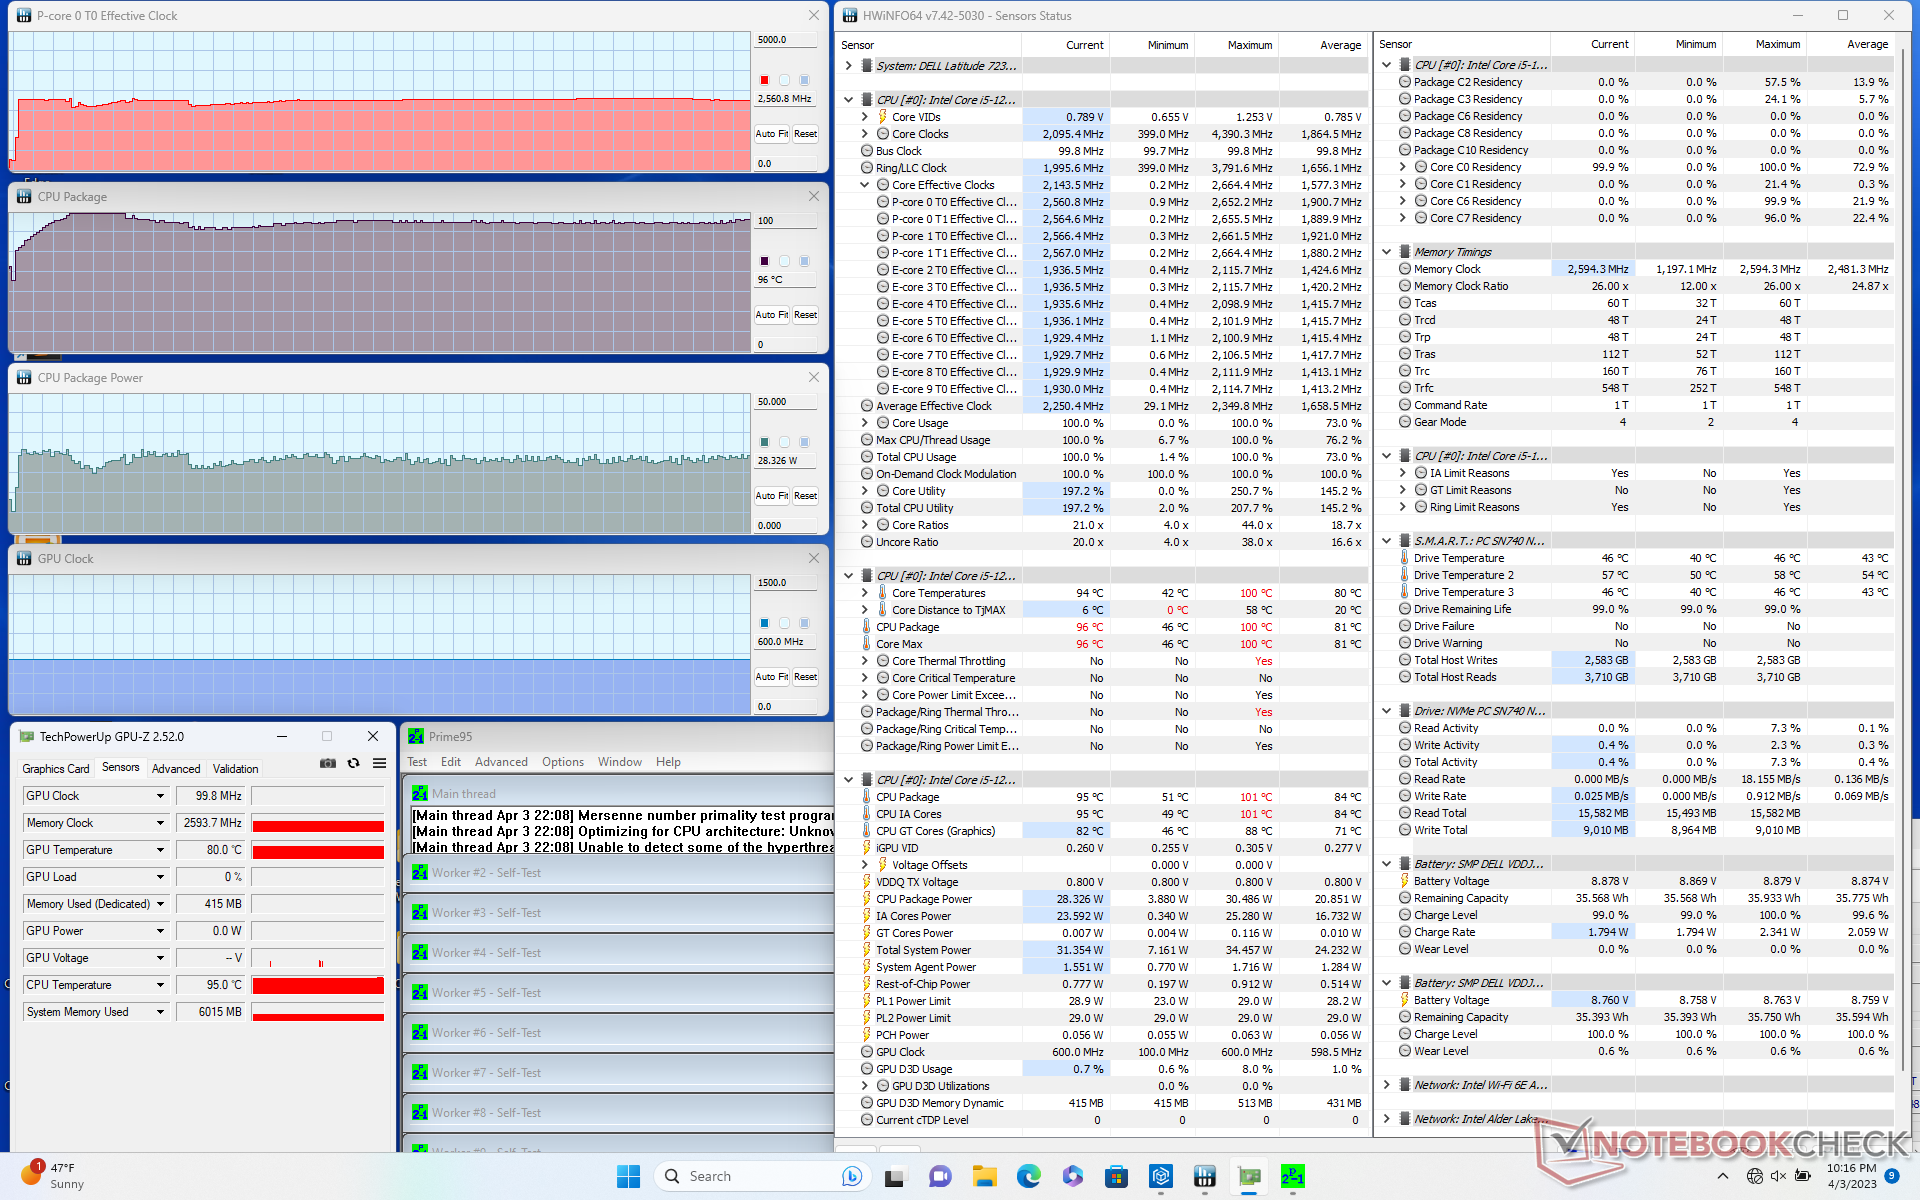
Stress test
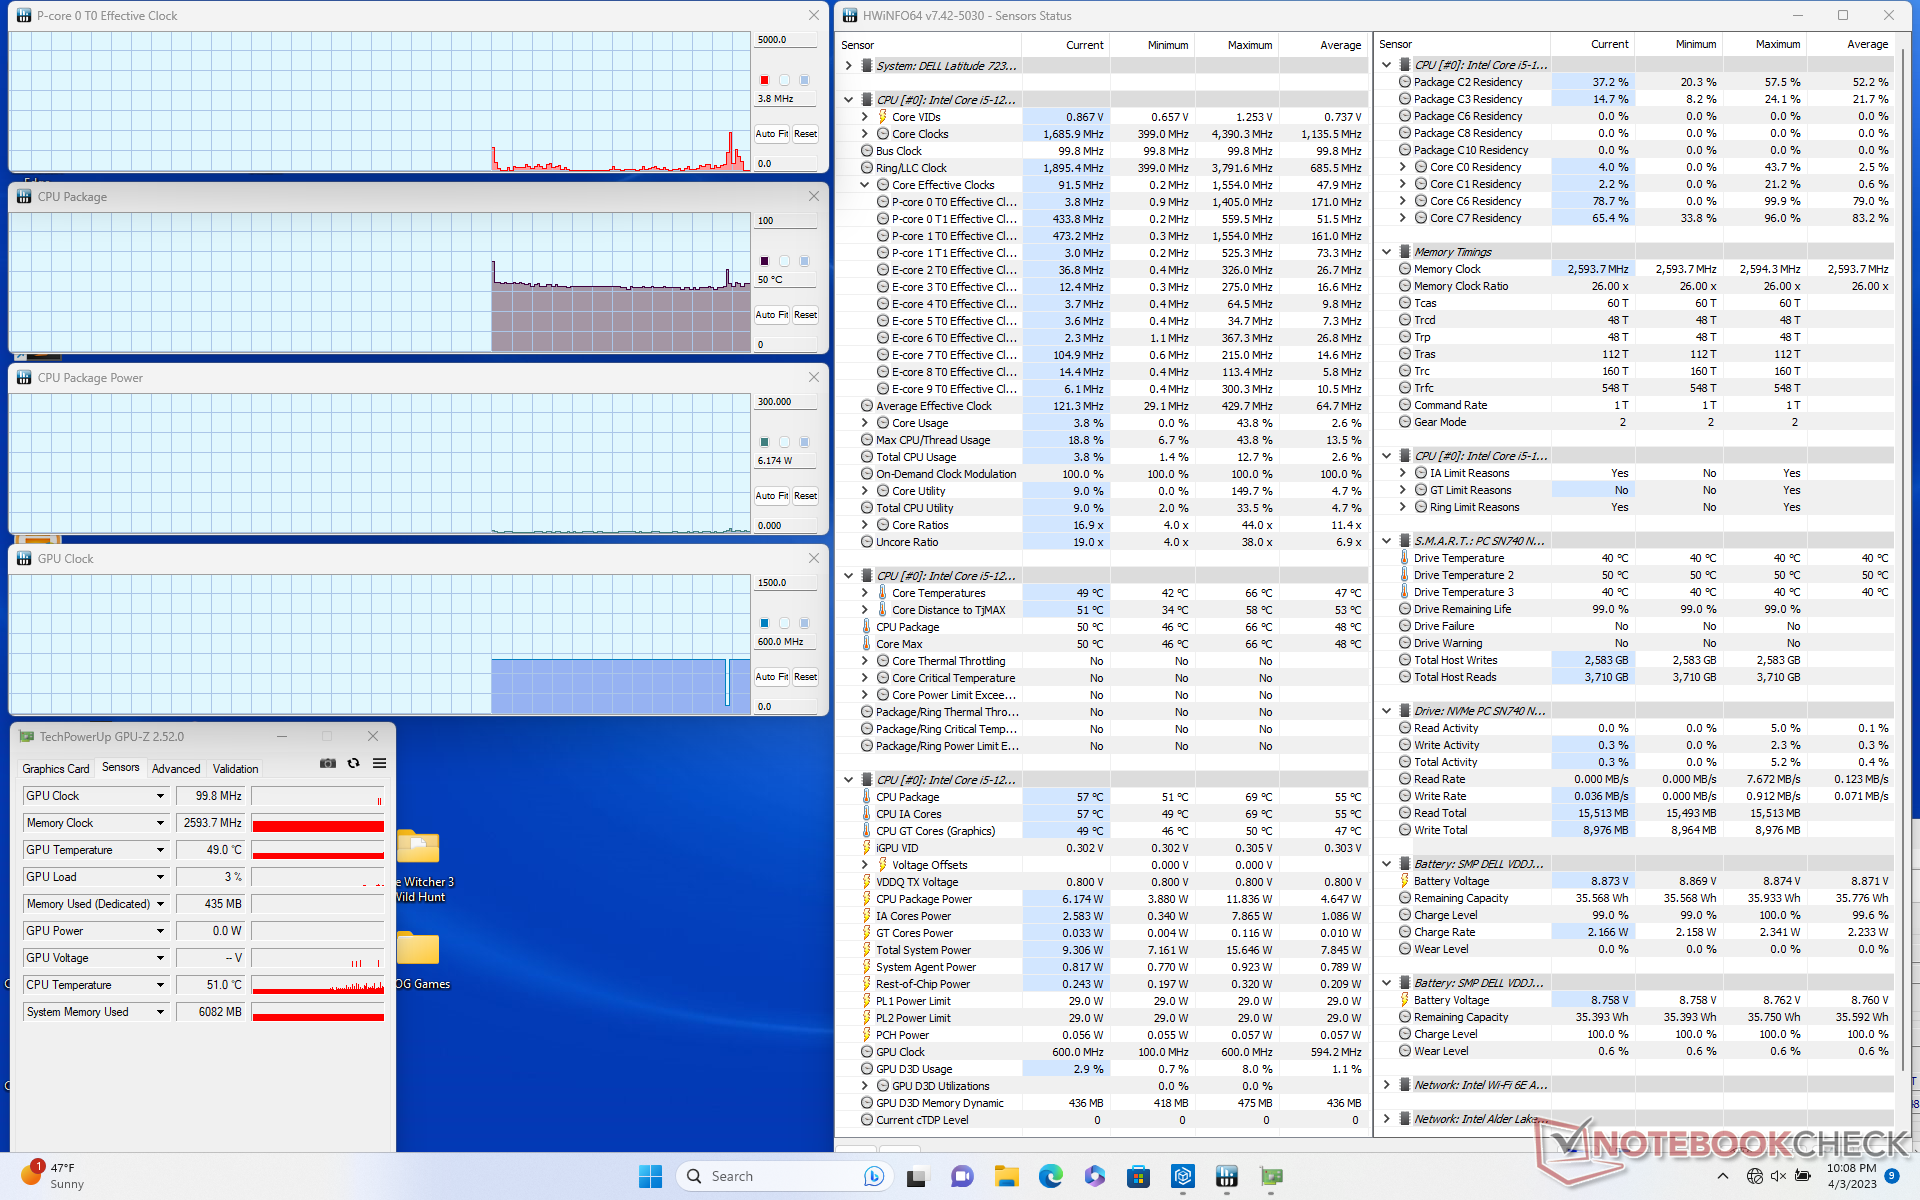
Quando si esegue Prime95 per stressare la CPU, la velocità di clock e l'assorbimento di potenza della scheda aumentano rispettivamente a 2,6 GHz e 30 W, prima di scendere leggermente a 2,5 GHz e 26 W pochi secondi dopo. La temperatura del core si stabilizza a 97 C, più calda di quanto vorremmo. Ripetendo questo test sul più grande Dell Latitude 7330 Rugged si otterrebbe una temperatura del core molto più bassa, pari a soli 68 C.
Il funzionamento a batteria influisce leggermente sulle prestazioni della CPU. Un test 3DMark 11 a batteria restituirebbe punteggi di Fisica e Grafica rispettivamente di 10743 e 4041 punti, rispetto a 12765 e 4053 punti con alimentazione a rete.
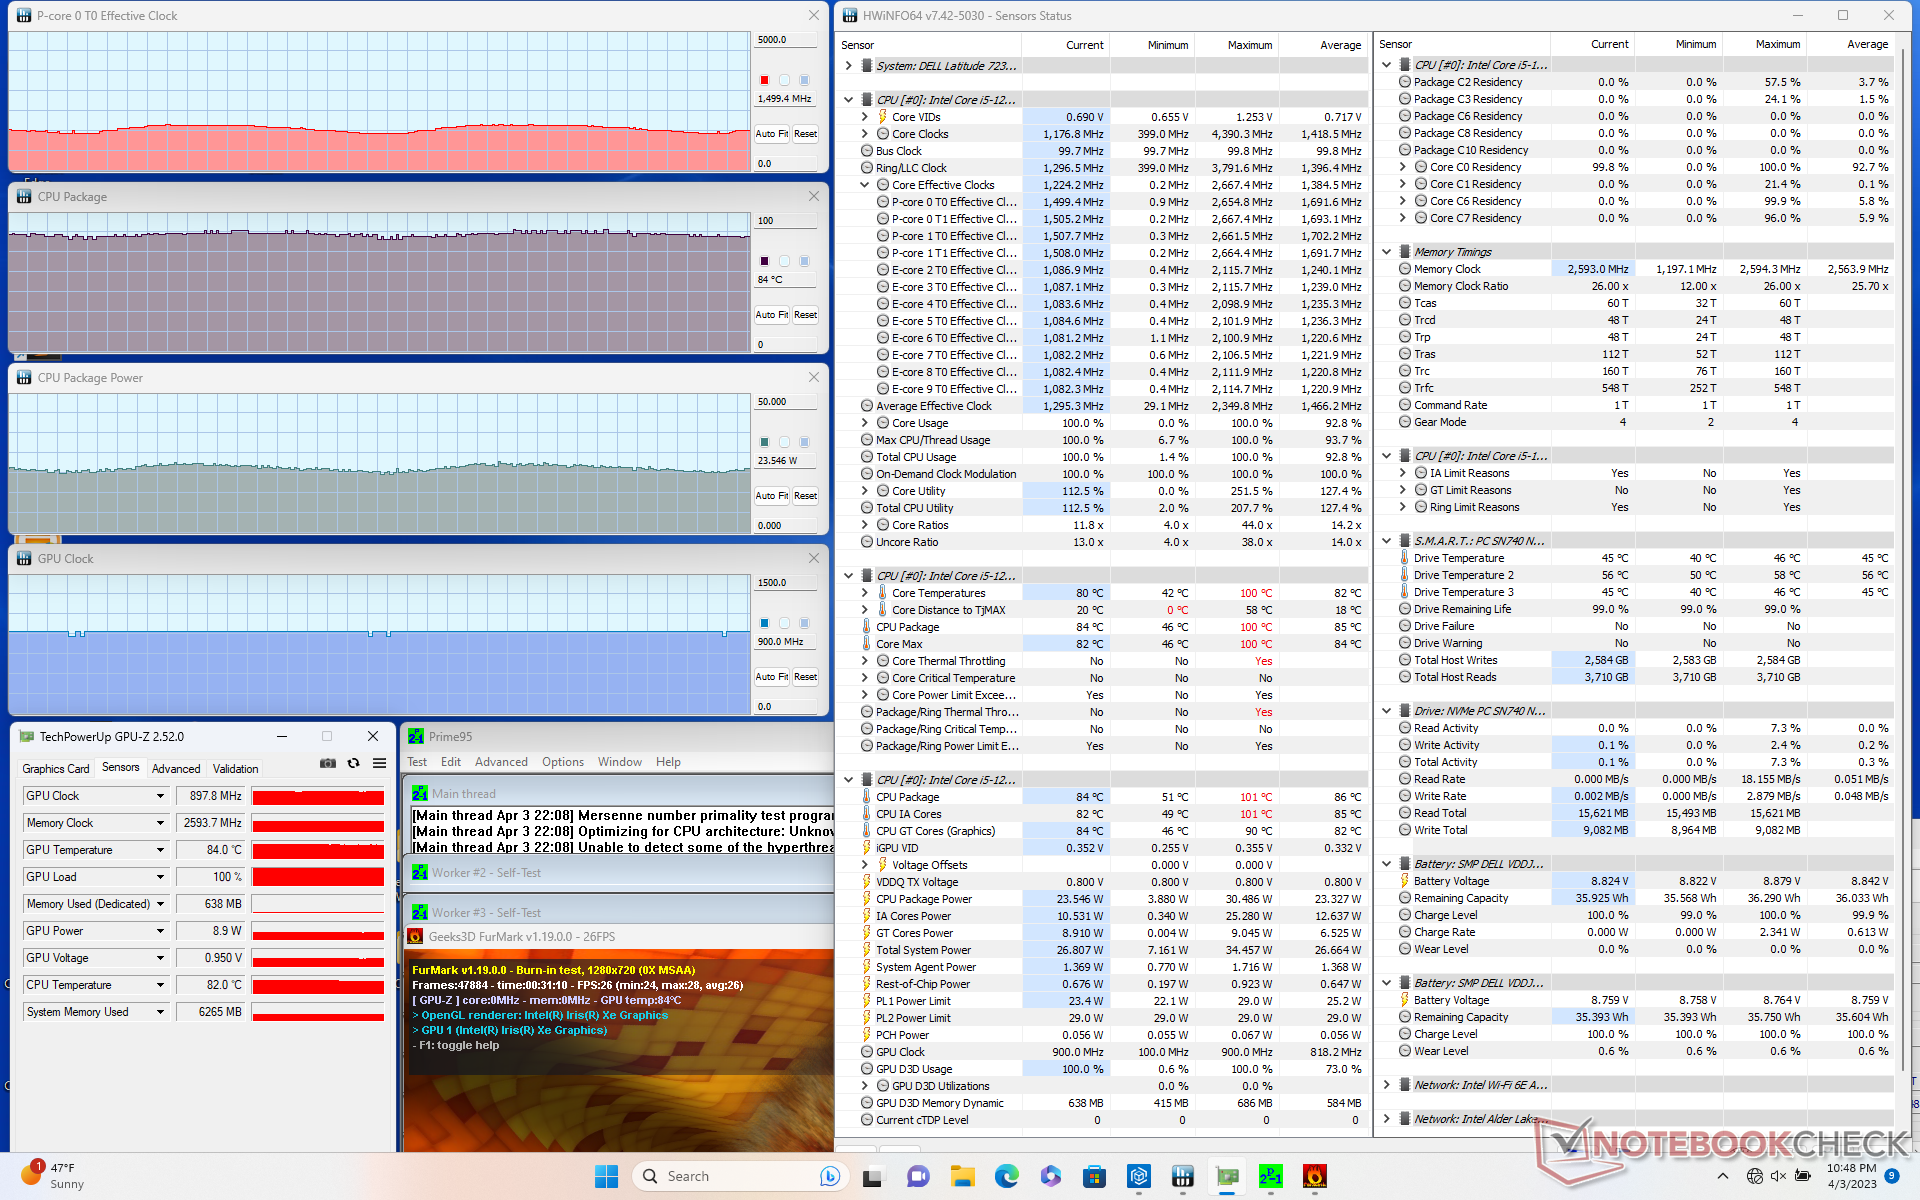

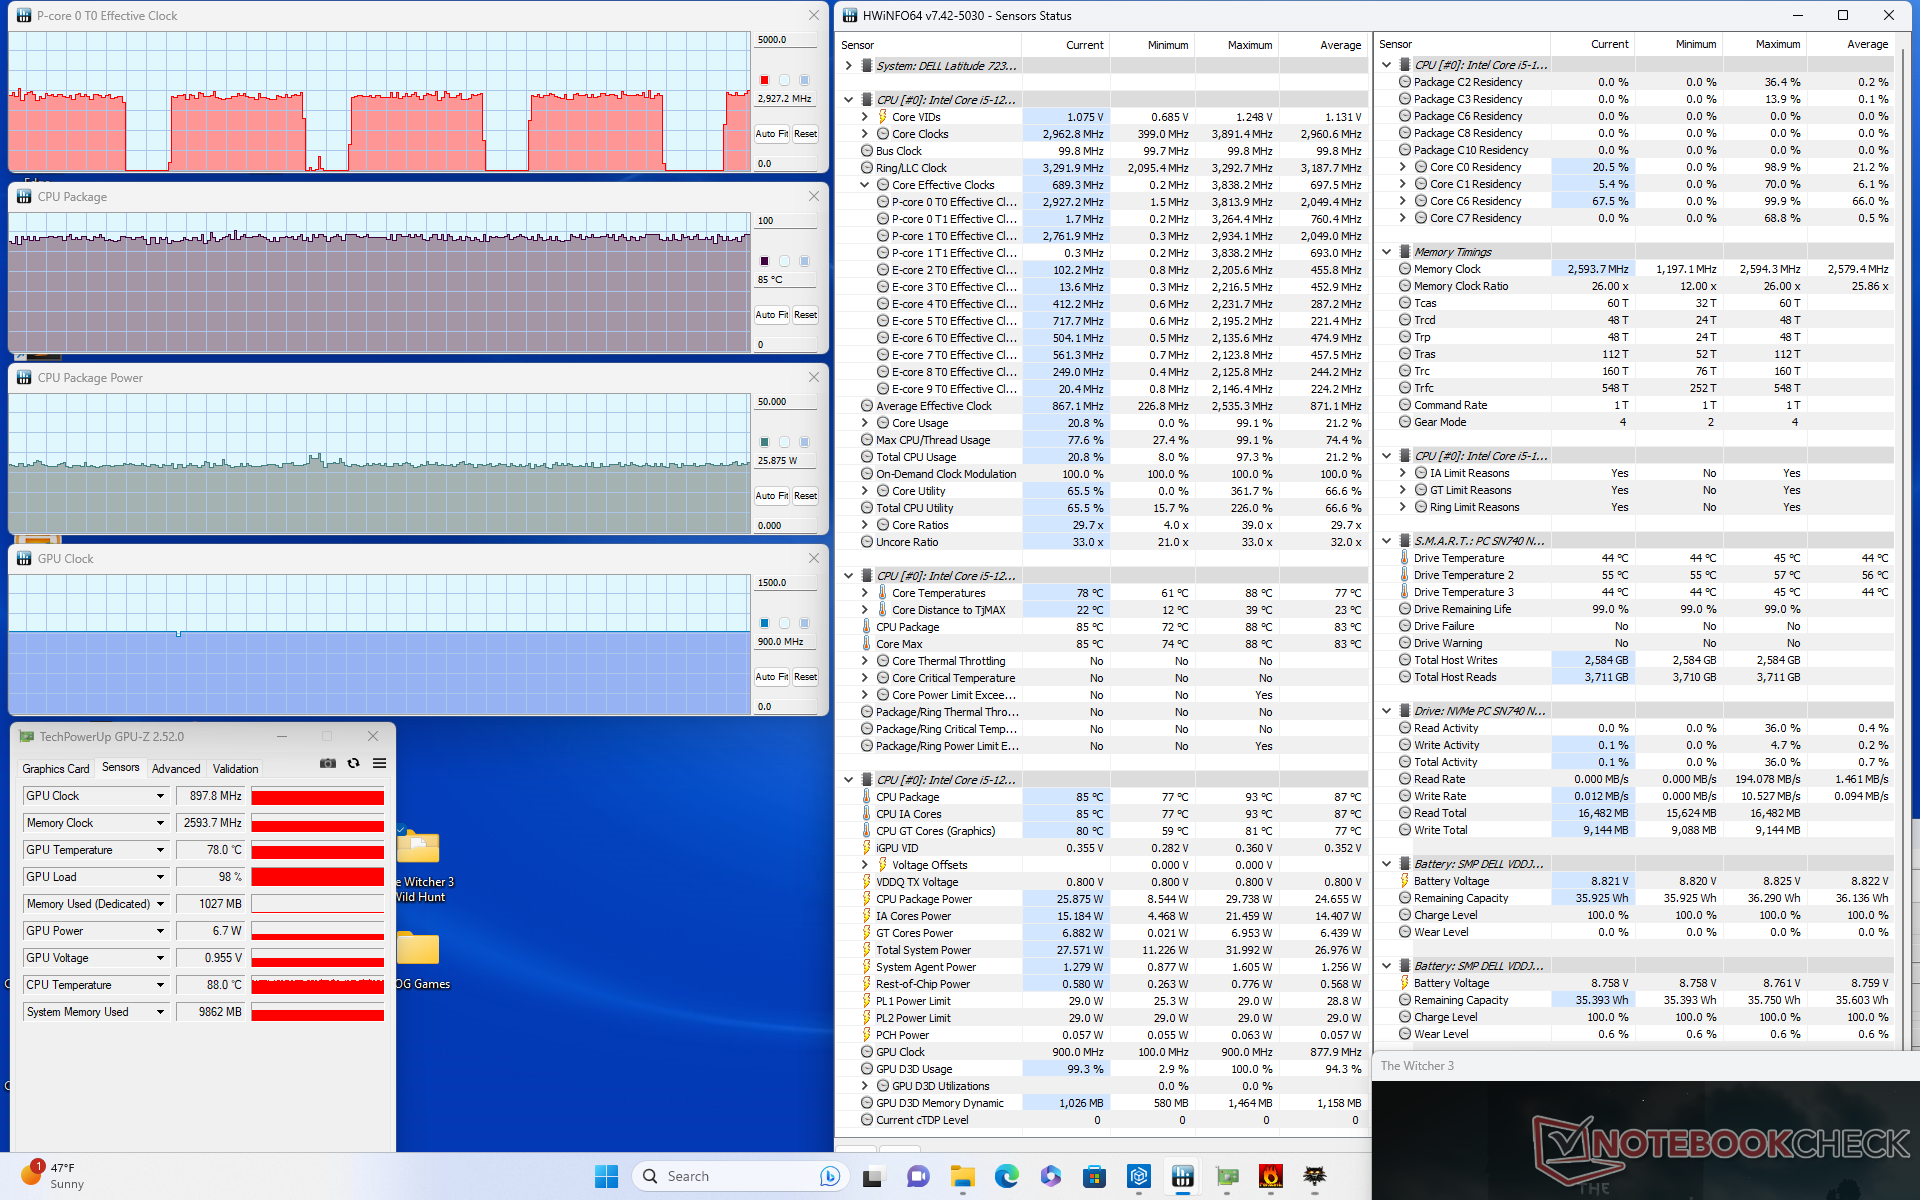
| Clock della CPU (GHz) | Clock della GPU (MHz) | Temperatura media della CPU (°C) | |
| Sistema inattivo | -- | -- | 50 |
| Stress Prime95 | 2,6 | -- | 96 |
| Prime95 + FurMark Stress | 1,4 - 1,6 | 898 | 84 |
| Witcher 3 Stress (modalità Ultra) | ~3,0 | 898 | 85 |
| Witcher 3 Stress (modalità ottimizzata) | ~1,7 | 898 | 83 |
Altoparlanti
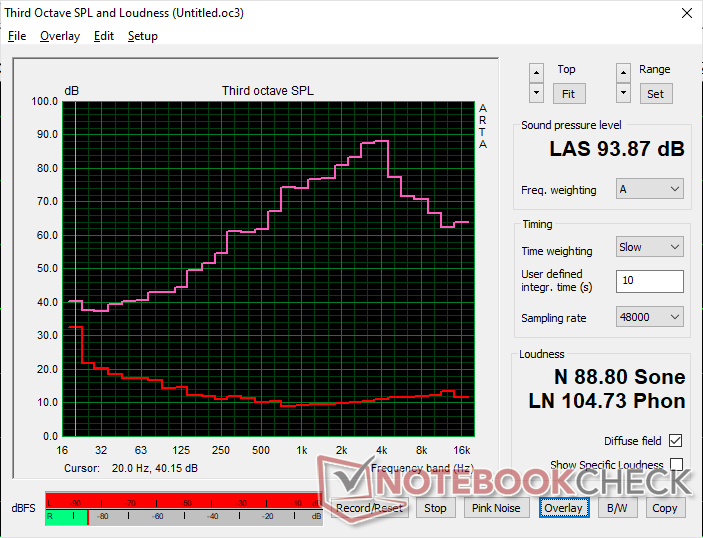
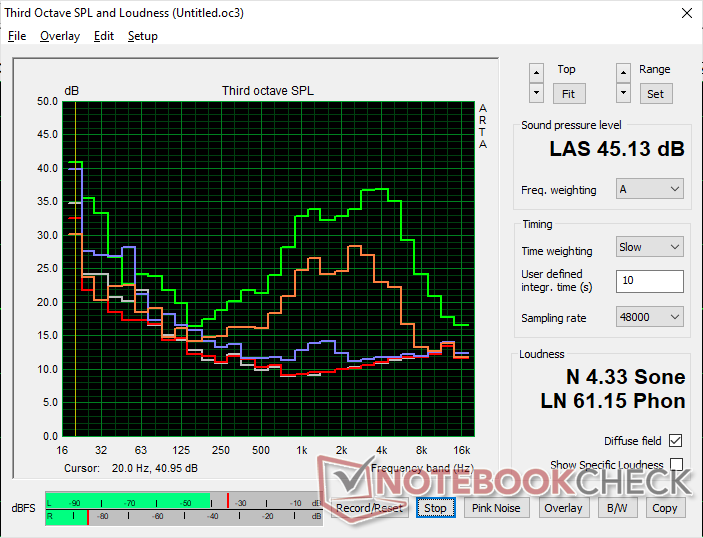
Dell Latitude 7230 Rugged Extreme analisi audio
(+) | gli altoparlanti sono relativamente potenti (93.9 dB)
Bassi 100 - 315 Hz
(-) | quasi nessun basso - in media 19.9% inferiori alla media
(+) | bassi in lineaa (5.2% delta rispetto alla precedente frequenza)
Medi 400 - 2000 Hz
(±) | medi elevati - circa 6.5% superiore alla media
(+) | medi lineari (4.5% delta rispetto alla precedente frequenza)
Alti 2 - 16 kHz
(±) | alti elevati - circa 8.4% superiori alla media
(±) | la linearità degli alti è media (7% delta rispetto alla precedente frequenza)
Nel complesso 100 - 16.000 Hz
(±) | la linearità complessiva del suono è media (19.4% di differenza rispetto alla media
Rispetto alla stessa classe
» 54% di tutti i dispositivi testati in questa classe è stato migliore, 7% simile, 39% peggiore
» Il migliore ha avuto un delta di 7%, medio di 20%, peggiore di 129%
Rispetto a tutti i dispositivi testati
» 48% di tutti i dispositivi testati in questa classe è stato migliore, 7% similare, 45% peggiore
» Il migliore ha avuto un delta di 4%, medio di 24%, peggiore di 134%
Apple MacBook Pro 16 2021 M1 Pro analisi audio
(+) | gli altoparlanti sono relativamente potenti (84.7 dB)
Bassi 100 - 315 Hz
(+) | bassi buoni - solo 3.8% dalla media
(+) | bassi in lineaa (5.2% delta rispetto alla precedente frequenza)
Medi 400 - 2000 Hz
(+) | medi bilanciati - solo only 1.3% rispetto alla media
(+) | medi lineari (2.1% delta rispetto alla precedente frequenza)
Alti 2 - 16 kHz
(+) | Alti bilanciati - appena 1.9% dalla media
(+) | alti lineari (2.7% delta rispetto alla precedente frequenza)
Nel complesso 100 - 16.000 Hz
(+) | suono nel complesso lineare (4.6% differenza dalla media)
Rispetto alla stessa classe
» 0% di tutti i dispositivi testati in questa classe è stato migliore, 0% simile, 100% peggiore
» Il migliore ha avuto un delta di 5%, medio di 17%, peggiore di 45%
Rispetto a tutti i dispositivi testati
» 0% di tutti i dispositivi testati in questa classe è stato migliore, 0% similare, 100% peggiore
» Il migliore ha avuto un delta di 4%, medio di 24%, peggiore di 134%
Gestione dell'energia
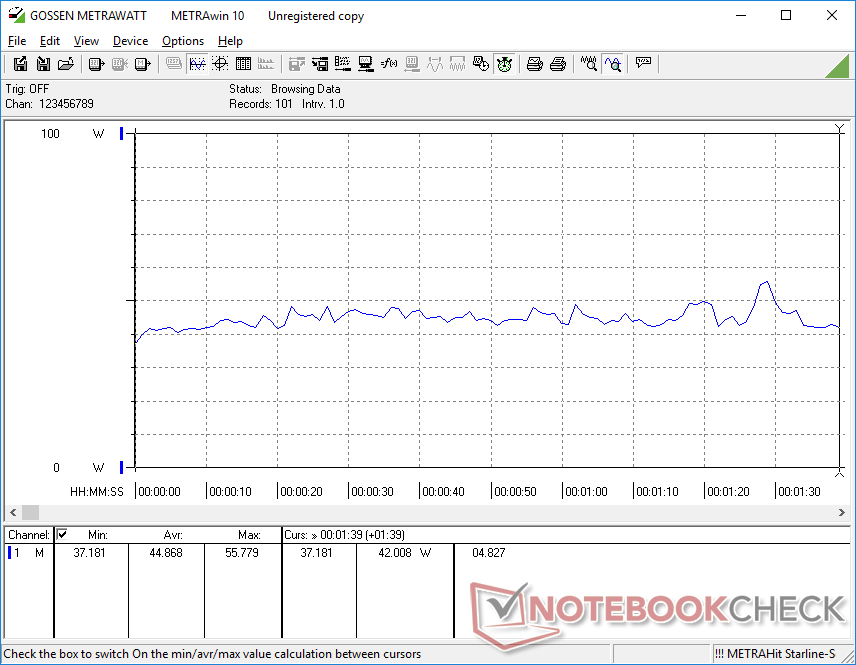
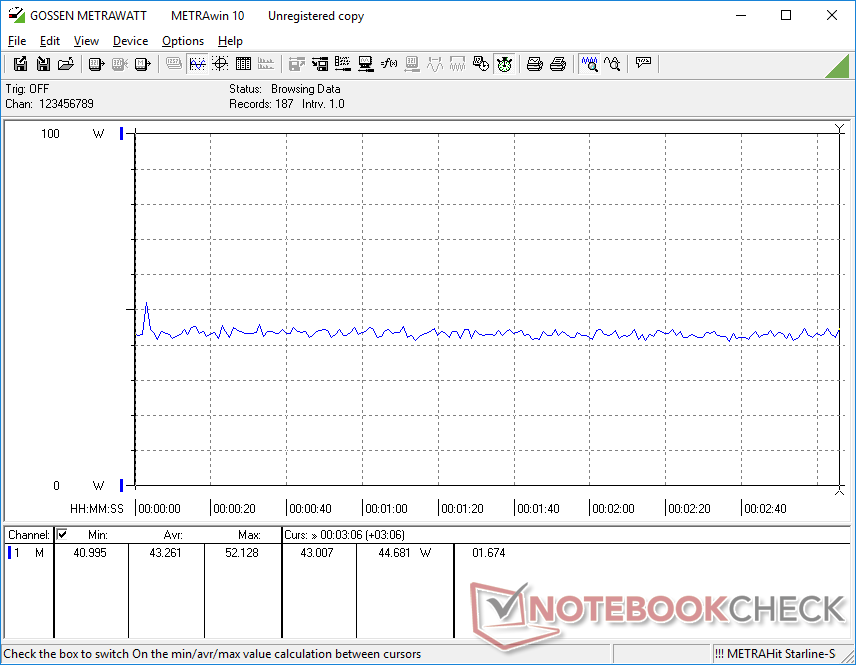
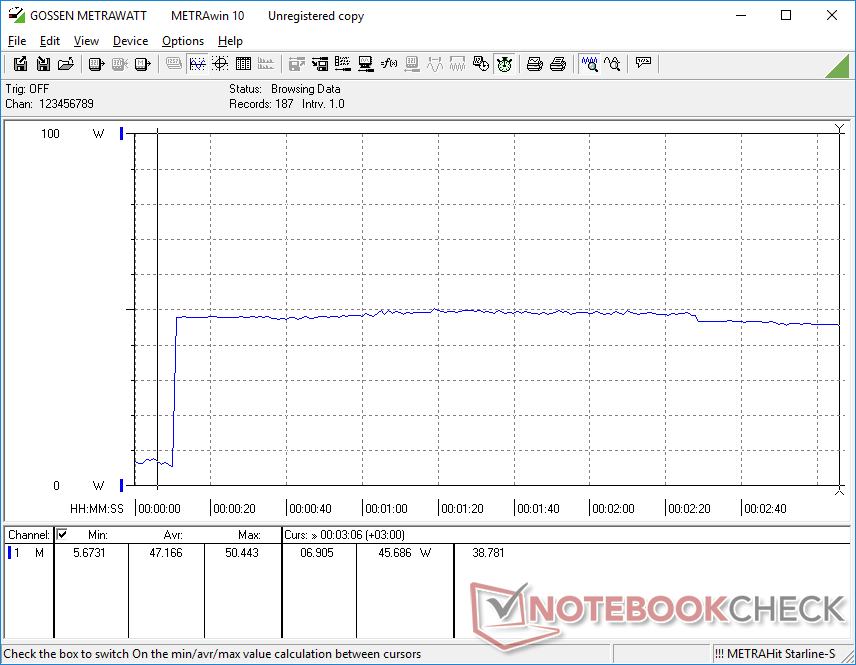
Consumo di energia
Il consumo energetico è per lo più simile a quello di altri dispositivi rugged che utilizzano CPU di 11a generazione più vecchie, come il Dell Latitude 7330 Rugged Extreme o il Panasonic Toughbook 40. Le prestazioni per watt, tuttavia, possono essere molto diverse. In particolare, il nostro Latitude 7230 Rugged è in grado di offrire prestazioni del processore più veloci del 40-50% rispetto al Core i7-1185G7 delDell Latitude 7330 Rugged senza dover consumare più energia. D'altro canto, le prestazioni della GPU sono inferiori del 30-40%.
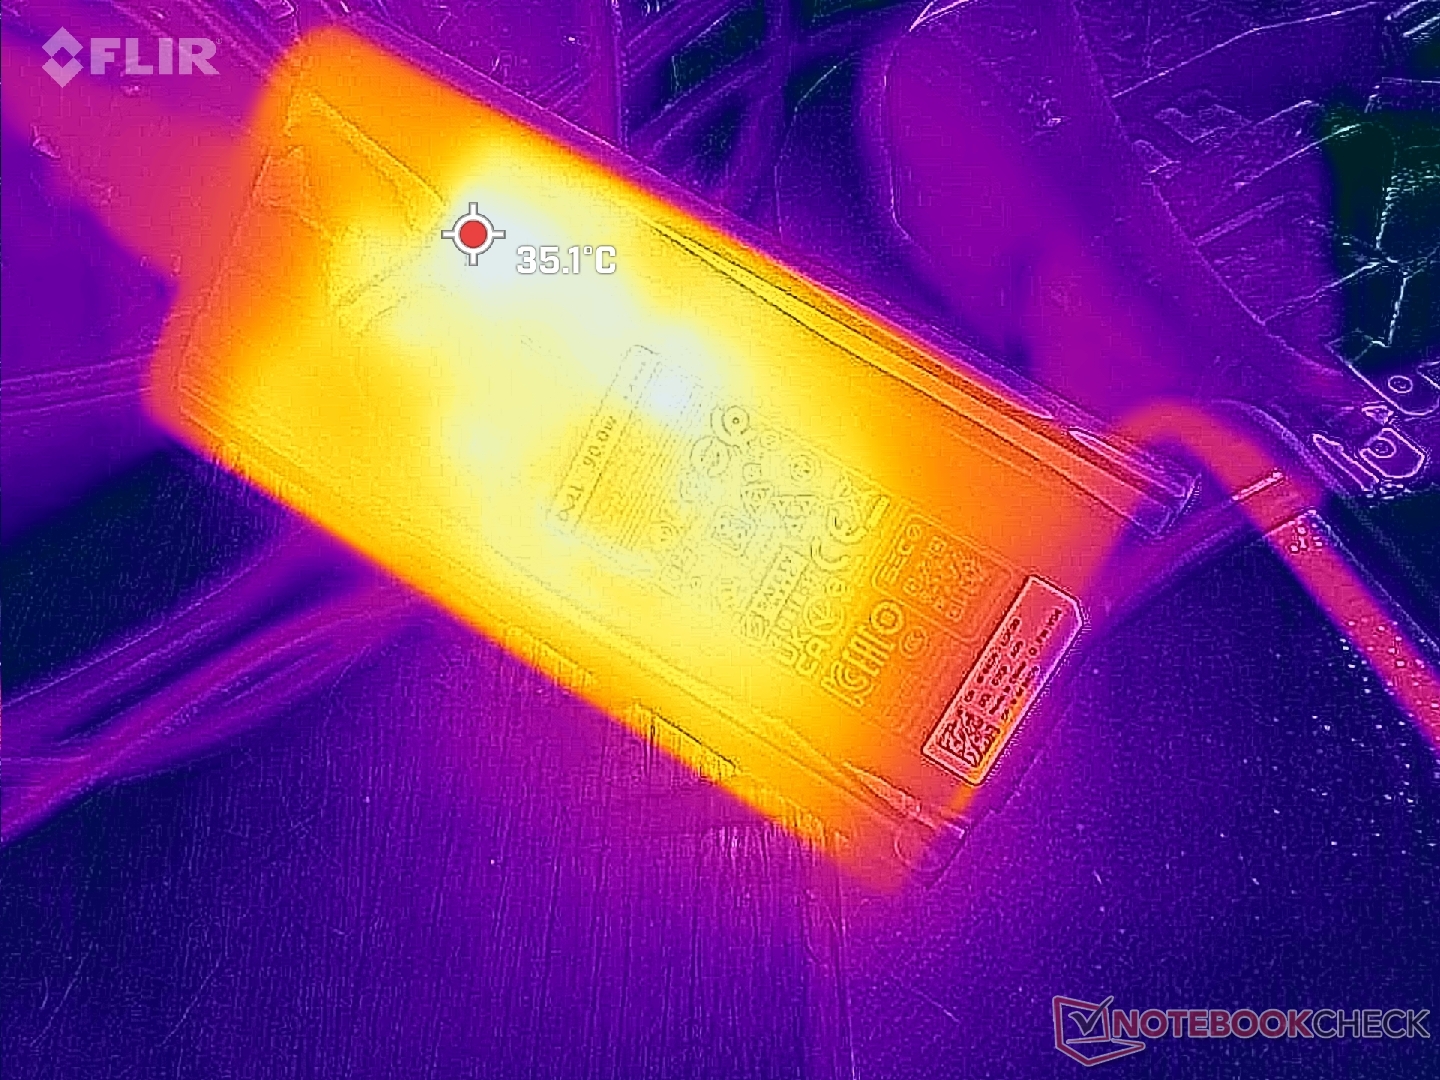
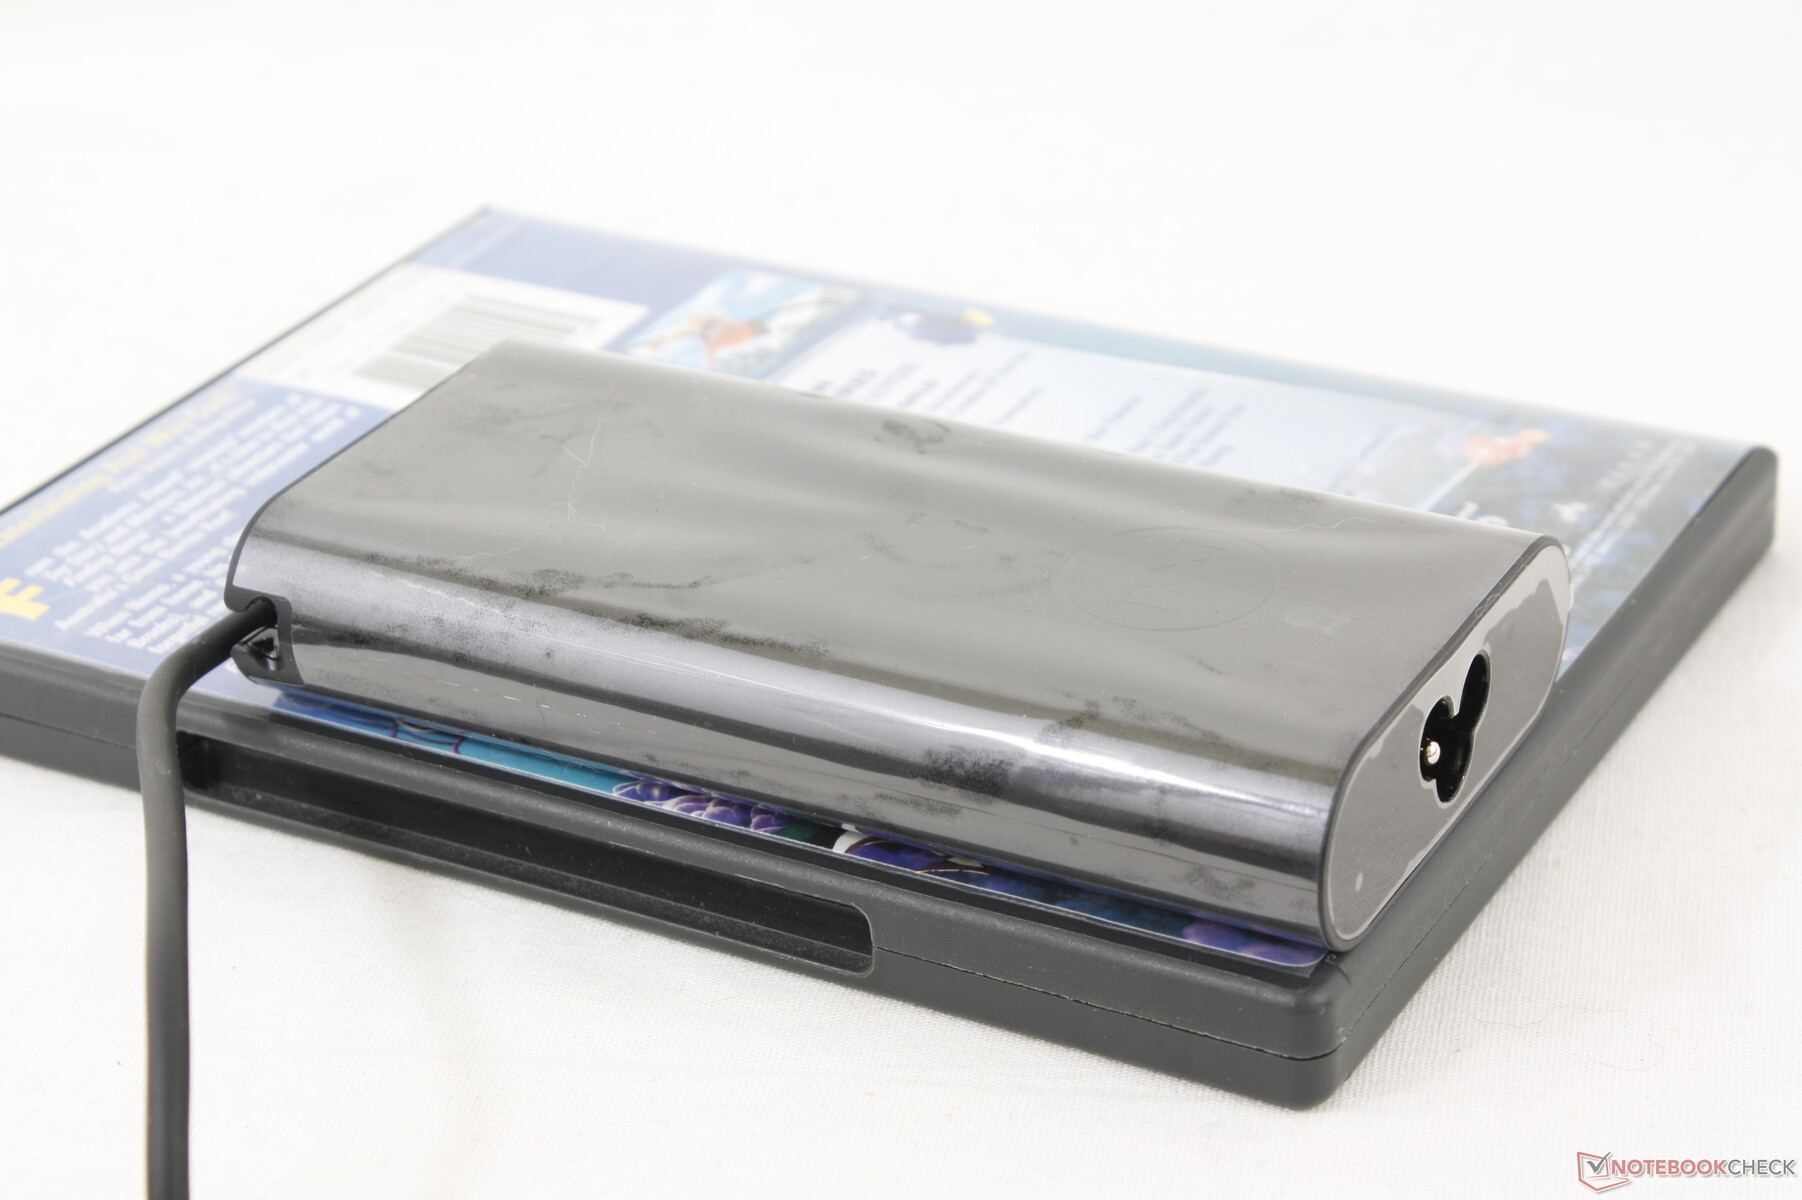
Siamo riusciti a registrare un consumo massimo di 55 W dall'adattatore CA USB-C da 90 W di dimensioni medio-piccole (~13 x 6,5 x 2,3 cm). Questo valore massimo è relativamente basso rispetto a molte alternative Core i7, poiché il nostro Core i5 ha un limite Turbo Boost inferiore. Si noti che il modello viene fornito con lo stesso adattatore CA presente su alcuni laptop XPS.
| Off / Standby | |
| Idle | |
| Sotto carico |
|
Leggenda:
min: | |
| Dell Latitude 7230 Rugged Extreme i5-1240U, Iris Xe G7 80EUs, WD PC SN740 512GB SDDPMQD-512G-1101, IPS, 1920x1200, 12" | Dell Latitude 7330 Rugged Extreme i7-1185G7, Iris Xe G7 96EUs, , IPS, 1920x1080, 13.3" | Panasonic Toughbook 40 i7-1185G7, Iris Xe G7 96EUs, Samsung PM991 MZVLQ1T0HALB, IPS, 1920x1080, 14" | Getac B360 i7-10710U, UHD Graphics 620, Lite-On CA5-8D512, IPS, 1920x1080, 13.3" | Acer Enduro Urban N3 EUN314 i7-1165G7, Iris Xe G7 96EUs, Samsung PM991 MZVLQ1T0HALB, IPS, 1920x1080, 14" | Durabook S14I i7-1165G7, Iris Xe G7 96EUs, UDinfo M2P M2P80DE512GBAEP, TN, 1920x1080, 14" | |
|---|---|---|---|---|---|---|
| Power Consumption | -9% | -15% | -5% | 25% | -25% | |
| Idle Minimum * (Watt) | 6.5 | 4.1 37% | 4.9 25% | 5.4 17% | 3.8 42% | 6.8 -5% |
| Idle Average * (Watt) | 8.9 | 11.7 -31% | 12.3 -38% | 12.2 -37% | 8 10% | 16.4 -84% |
| Idle Maximum * (Watt) | 14.3 | 11.8 17% | 14 2% | 12.6 12% | 8.7 39% | 16.9 -18% |
| Load Average * (Watt) | 44.9 | 48.5 -8% | 54 -20% | 39.1 13% | 34.6 23% | 39.2 13% |
| Witcher 3 ultra * (Watt) | 43.2 | 44.3 -3% | 46.3 -7% | 36.5 16% | 35.4 18% | |
| Load Maximum * (Watt) | 54.8 | 91 -66% | 83.6 -53% | 81.8 -49% | 45.4 17% | 73.1 -33% |
* ... Meglio usare valori piccoli
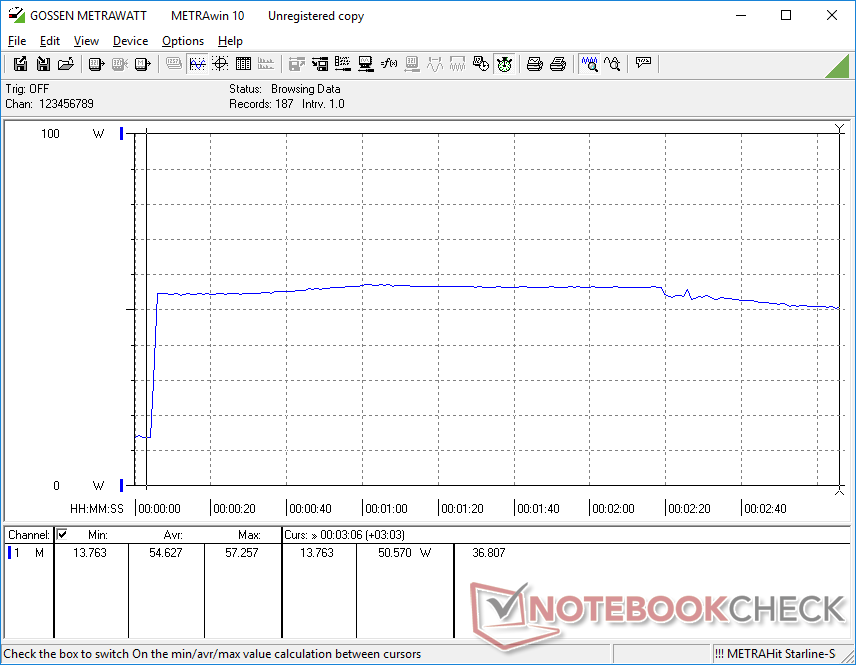
Power Consumption Witcher 3 / Stresstest
Power Consumption external Monitor
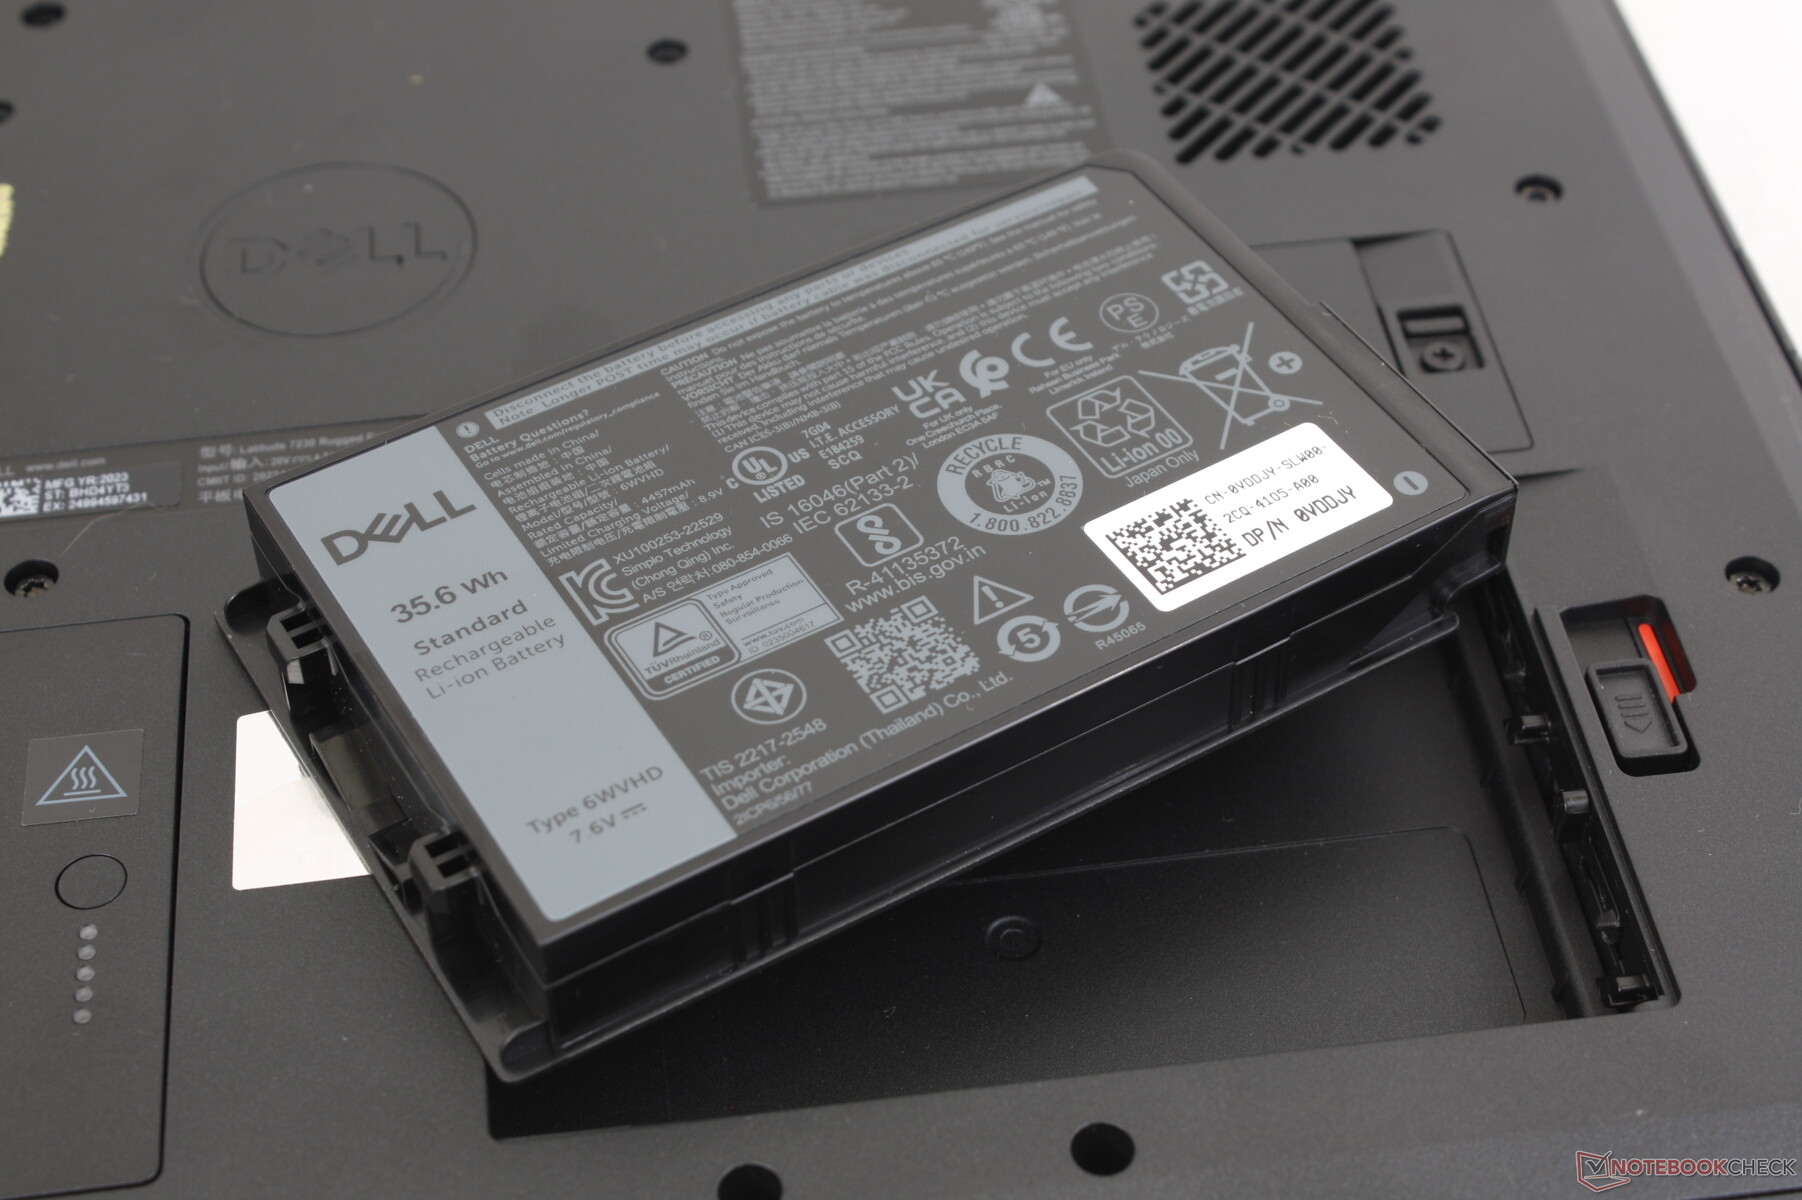
Durata della batteria - 3,5 ore in condizioni di utilizzo estremo
Sono supportate fino a due batterie rimovibili. L'autonomia della WLAN è di quasi 13 ore quando sono installate entrambe le batterie (36 Wh x2). D'altra parte, l'esecuzione di carichi impegnativi al massimo livello di luminosità dovrebbe durare circa 3,5 ore.
La ricarica di entrambe le batterie da vuoto a pieno è purtroppo piuttosto lenta: da 4 a 5 ore rispetto alle 1,5-2 ore della maggior parte degli Ultrabook.
| Dell Latitude 7230 Rugged Extreme i5-1240U, Iris Xe G7 80EUs, 72 Wh | Dell Latitude 7330 Rugged Extreme i7-1185G7, Iris Xe G7 96EUs, 107 Wh | Panasonic Toughbook 40 i7-1185G7, Iris Xe G7 96EUs, 136 Wh | Getac B360 i7-10710U, UHD Graphics 620, 46 Wh | Acer Enduro Urban N3 EUN314 i7-1165G7, Iris Xe G7 96EUs, 50.3 Wh | Durabook S14I i7-1165G7, Iris Xe G7 96EUs, 50 Wh | |
|---|---|---|---|---|---|---|
| Autonomia della batteria | 38% | 46% | -38% | -51% | -58% | |
| WiFi v1.3 (h) | 13 | 18 38% | 19 46% | 8.1 -38% | 6.4 -51% | 5.5 -58% |
| Load (h) | 3.6 |
Pro
Contro
Verdetto - Per lo più un fuoricampo
Le caratteristiche distintive di Latitude 7230 Rugged Extreme sono la copertura completa sRGB, le prestazioni veloci della CPU e il peso ridotto rispetto ad altri tablet rugged. La maggior parte delle alternative presenta colori più scadenti e cornici più spesse.
Vorremmo vedere dei miglioramenti ai coperchi delle porte e ai pulsanti frontali, che sono rispettivamente troppo scivolosi e piccoli. Diventa ancora più difficile maneggiarli se si indossano dei guanti.
L'eccellente durata della batteria, il display super luminoso e la copertura completa sRGB di Latitude 7230 Rugged Extreme definiscono lo standard per i futuri tablet rugged.
I potenziali acquirenti devono tenere presente che il Core i5-1240U, meno costoso, ha prestazioni simili al Core i7-1260U per quanto riguarda le prestazioni della CPU. Se si prevede di eseguire attività più impegnative con questo modello, il rumore della ventola sarà più forte del solito.
Prezzo e disponibilità
Dell distribuisce ora il Latitude 7230 Rugged Extreme a partire da 2.700 dollari per la configurazione base fino a oltre 5.000 dollari se completamente configurato. La nostra unità in prova viene venduta a circa 3.200 dollari.
Dell Latitude 7230 Rugged Extreme
- 04/07/2023 v7 (old)
Allen Ngo
Transparency
La selezione dei dispositivi da recensire viene effettuata dalla nostra redazione. Il campione di prova è stato fornito all'autore come prestito dal produttore o dal rivenditore ai fini di questa recensione. L'istituto di credito non ha avuto alcuna influenza su questa recensione, né il produttore ne ha ricevuto una copia prima della pubblicazione. Non vi era alcun obbligo di pubblicare questa recensione. In quanto società mediatica indipendente, Notebookcheck non è soggetta all'autorità di produttori, rivenditori o editori.
Ecco come Notebookcheck esegue i test
Ogni anno, Notebookcheck esamina in modo indipendente centinaia di laptop e smartphone utilizzando procedure standardizzate per garantire che tutti i risultati siano comparabili. Da circa 20 anni sviluppiamo continuamente i nostri metodi di prova e nel frattempo stabiliamo gli standard di settore. Nei nostri laboratori di prova, tecnici ed editori esperti utilizzano apparecchiature di misurazione di alta qualità. Questi test comportano un processo di validazione in più fasi. Il nostro complesso sistema di valutazione si basa su centinaia di misurazioni e parametri di riferimento ben fondati, che mantengono l'obiettività.Price comparison

