Recensione del portatile Dell Latitude 13 7330 da 1 kg: debutto dell'Intel Core i7-1265U
Da non confondere con il modello Dell Latitude 7330 Rugged Latitude 7330 è il portatile più tradizionale per uffici e aziende. È disponibile sia in versione clamshell che convertibile 2-in-1, ognuna con opzioni simili di CPU Intel Core-U di 12a generazione, porte e design complessivo dello chassis, ma con diverse opzioni di display e materiali dello chassis tra cui scegliere. Consigliamo di consultare la pagina del prodotto o il PDF tecnico disponibile pubblicamente per il modello 7330 per Latitude 7330, in quanto offre più opzioni configurabili rispetto alla maggior parte degli altri portatili, tra cui diverse webcam, dimensioni della batteria, WAN e persino lettori MicroSD
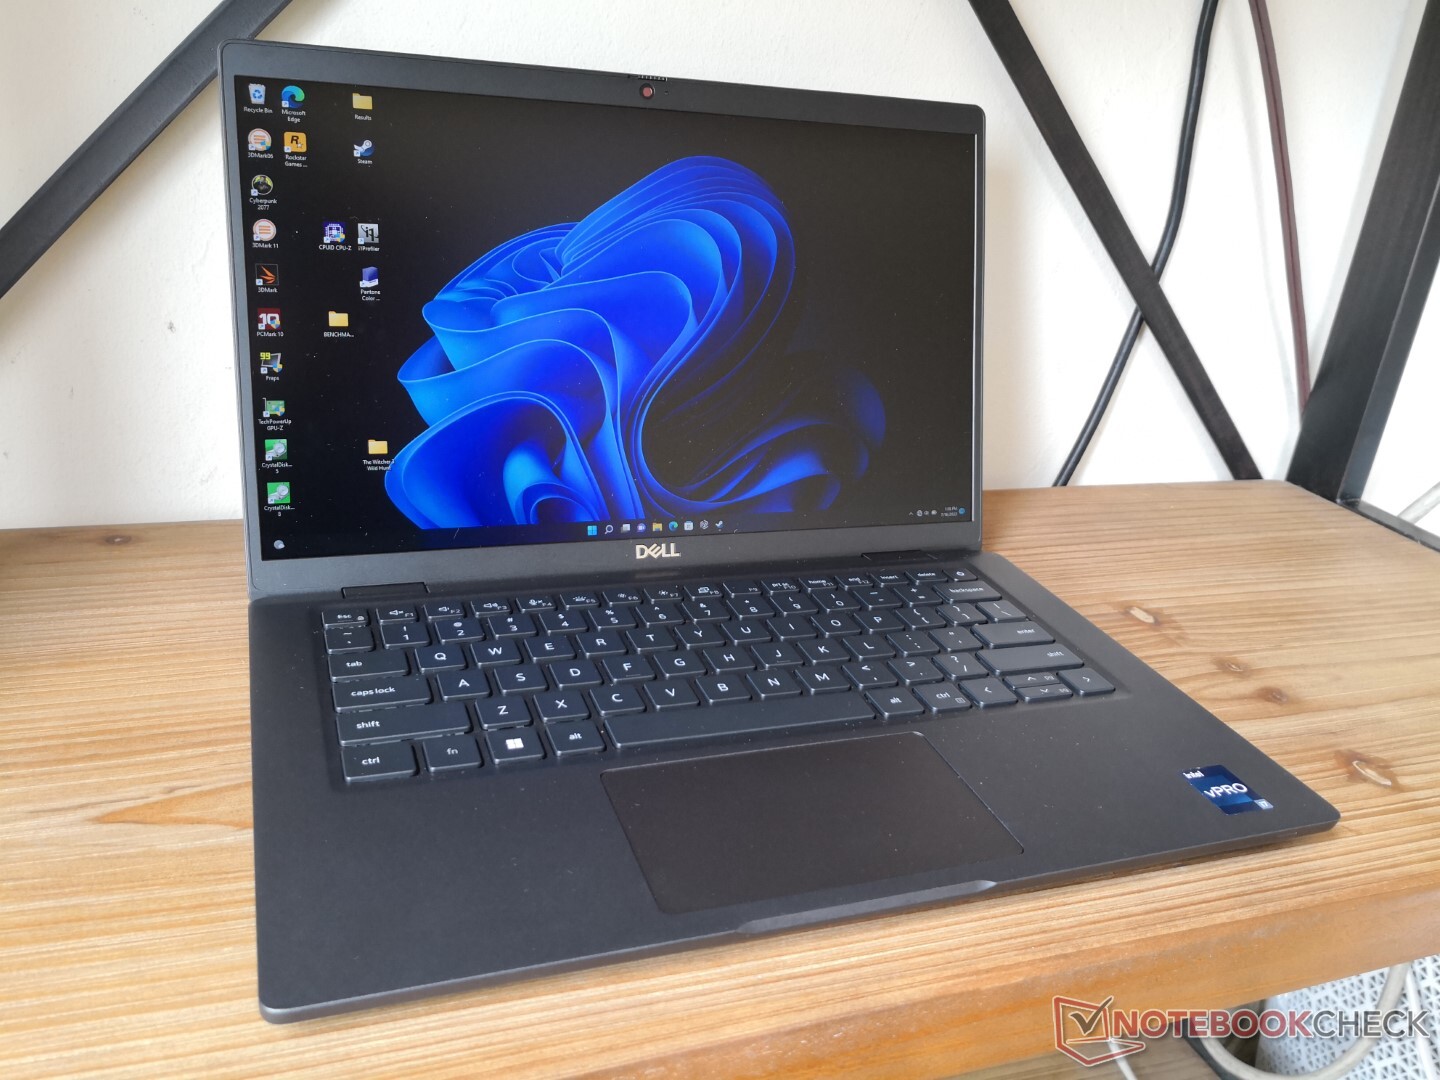
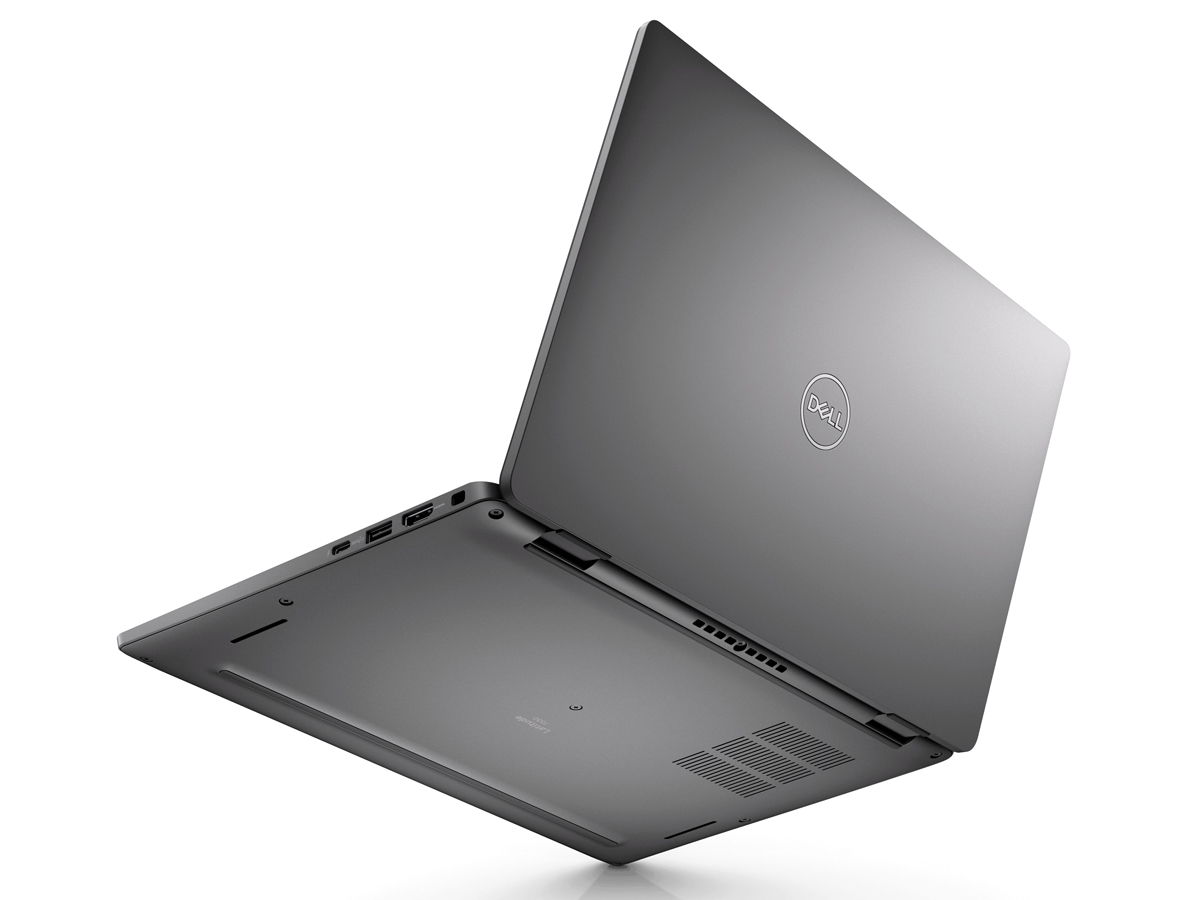
L'unità da noi recensita è il clamshell Latitude 7330 in lega di magnesio con un peso di appena 1 kg, uno dei portatili business da 13,3 pollici più leggeri del mercato. Alcuni altri portatili hanno promesso in passato design simili e super leggeri, come ad esempio la serie LG Gram, Samsung Galaxy Book Pro, HP Elite Dragonflyo la serie Toshiba Portege serie Z che rappresentano tutte delle alternative al Latitude 7330. La configurazione da noi recensita ha un prezzo di vendita di circa 2000 dollari.
Altre recensioni Dell
Potenziali concorrenti a confronto
Punteggio | Data | Modello | Peso | Altezza | Dimensione | Risoluzione | Prezzo |
|---|---|---|---|---|---|---|---|
| 89 % v7 (old) | 07/2022 | Dell Latitude 13 7330 i7-1265U, Iris Xe G7 96EUs | 1 kg | 16.96 mm | 13.30" | 1920x1080 | |
| 87.9 % v7 (old) | 10/2020 | Lenovo ThinkPad X13 Yoga 20SX0004GE i7-10510U, UHD Graphics 620 | 1.3 kg | 15.95 mm | 13.30" | 1920x1080 | |
| 85.1 % v7 (old) | 07/2022 | Framework Laptop 13.5 12th Gen Intel i7-1260P, Iris Xe G7 96EUs | 1.3 kg | 15.85 mm | 13.50" | 2256x1504 | |
| 86.6 % v7 (old) | 12/2020 | Razer Book 13 FHD i7-1165G7, Iris Xe G7 96EUs | 1.4 kg | 15.15 mm | 13.40" | 1920x1200 | |
| 89.4 % v7 (old) | 07/2020 | Dell Latitude 7310 i7-10610U, UHD Graphics 620 | 1.2 kg | 18.3 mm | 13.30" | 1920x1080 | |
| 85.2 % v7 (old) | 05/2021 | Microsoft Surface Laptop 4 13 Ryzen 5 R5 4680U, Vega 7 | 1.3 kg | 14 mm | 13.50" | 2256x1504 |
Il caso - Tre diverse opzioni
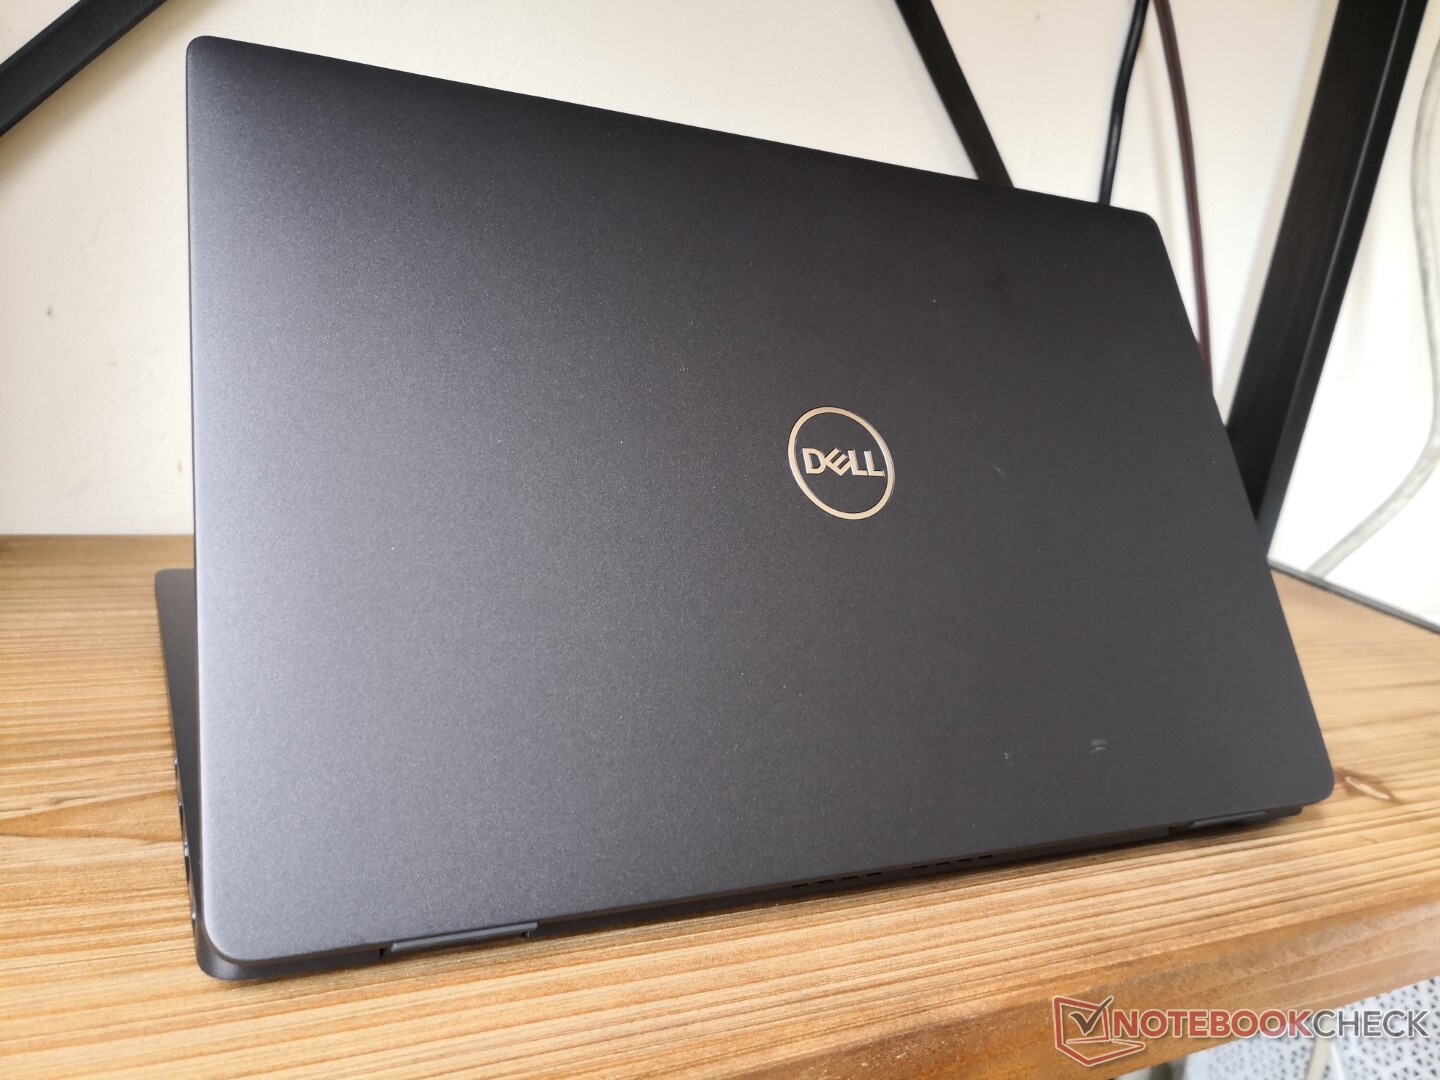
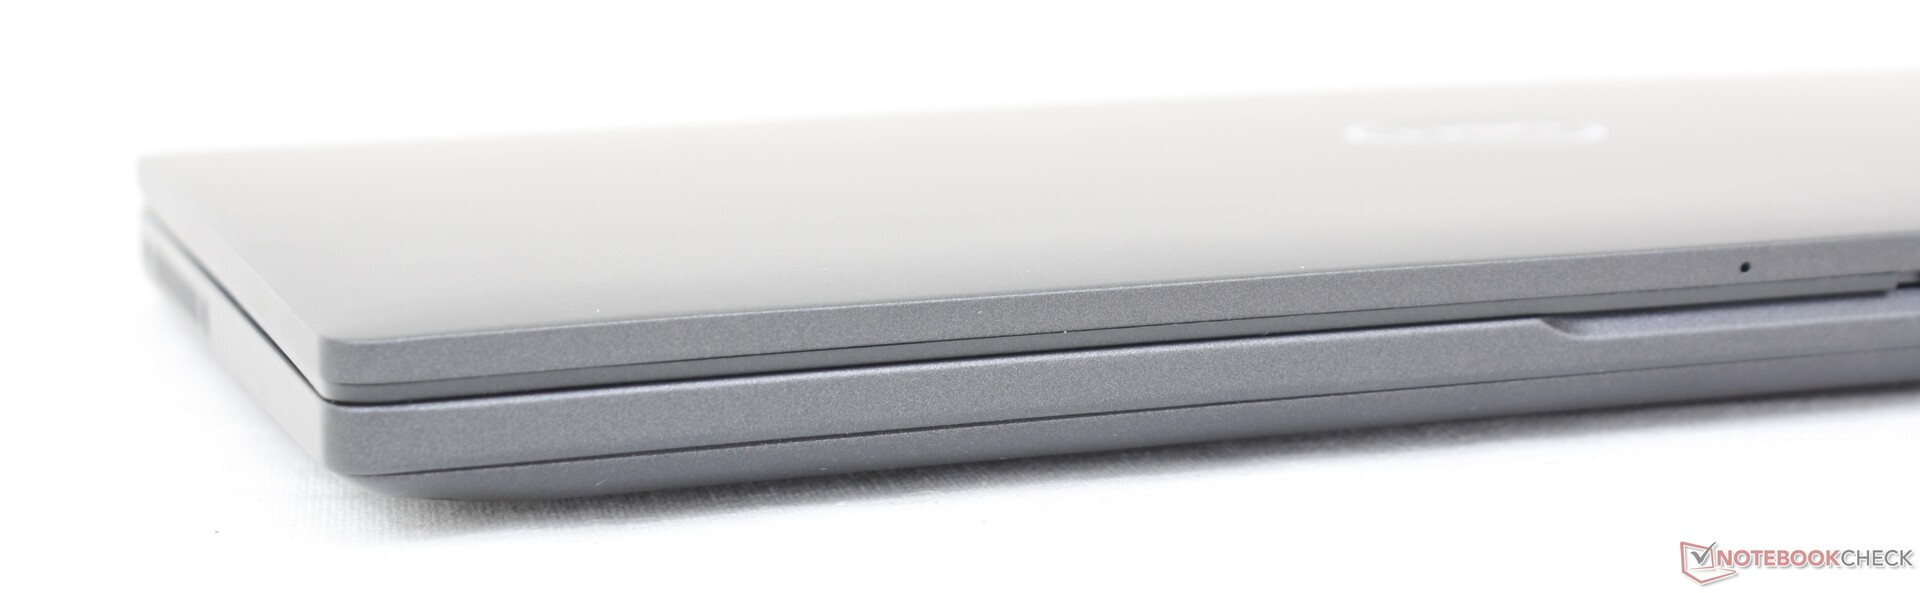
esistono già computer portatili da 13 pollici che promettono di essere di 1 kg o addirittura più leggeri, ma quasi sempre sono accompagnati da alcune avvertenze. In particolare, questi modelli mostrano in genere una flessione molto più accentuata, con un'impressione complessivamente più debole in termini di durata. Basta un minuto con l'LG Gram 13 a confronto con il più pesante Dell XPS 13 9310 e le differenze di spessore dei loro scheletri diventano immediatamente evidenti. Il Latitude 7330 ha in qualche modo evitato questa tendenza, essendo più rigido del previsto per una struttura di 1 kg. La base, ad esempio, non si torce e non si piega come quella del già citato LG. La rigidità complessiva si colloca a metà strada tra il Gram 13 e l'XPS 13, che consideriamo un giusto compromesso se si apprezza il peso superleggero.
Il peso molto ridotto di appena 1 kg è il principale punto di forza dell'opzione in lega di magnesio. La maggior parte dei subnotebook di questa categoria di dimensioni pesa in genere qualche centinaio di grammi in più, un peso che si nota molto quando si viaggia o si lavora in movimento. Le dimensioni complessive sono solo leggermente inferiori rispetto al modello Latitude 7310 che era già abbastanza piccolo
Se invece si opta per le opzioni in fibra di carbonio o in alluminio, il peso aumenta rispettivamente di circa 160 g e 240 g rispetto all'opzione in magnesio.
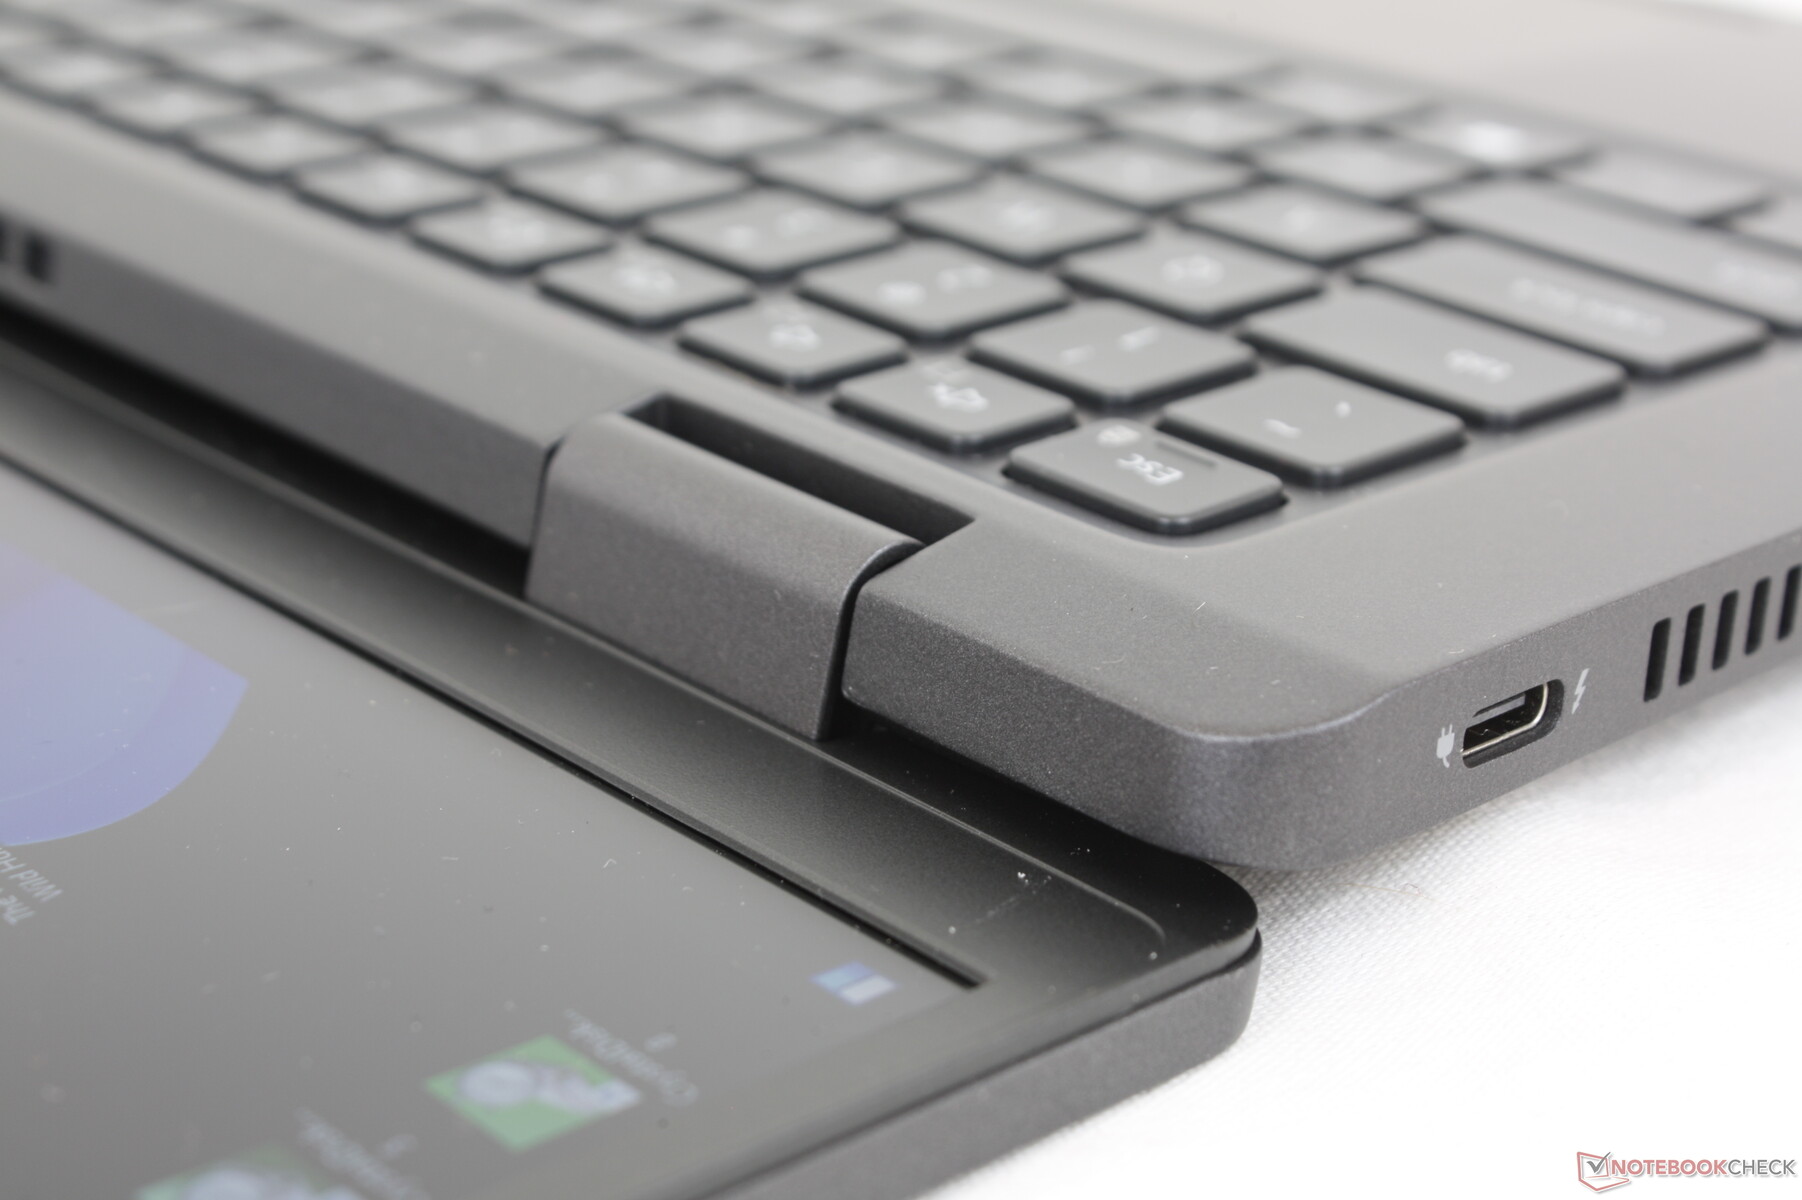
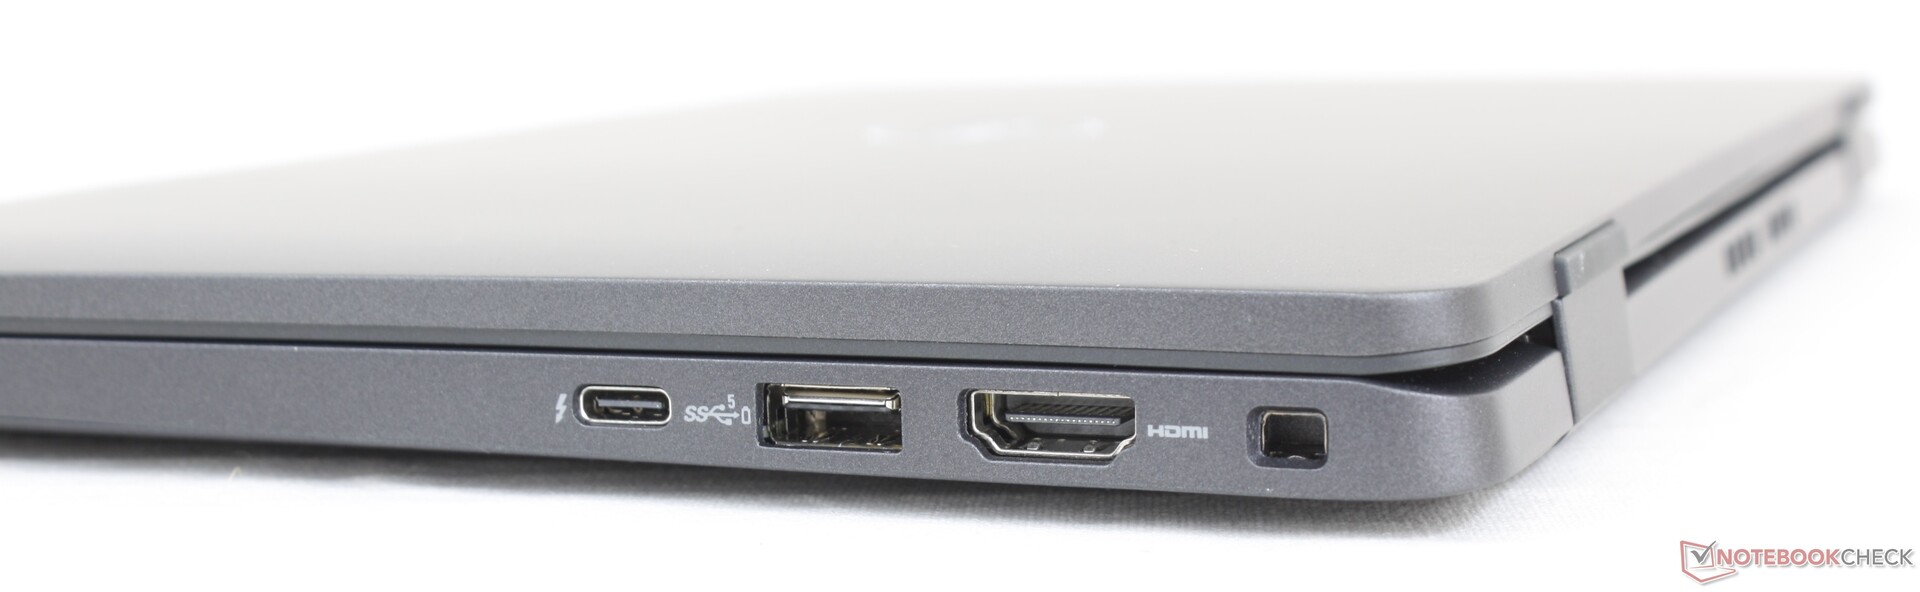
Connettività - Supporto Thunderbolt 4
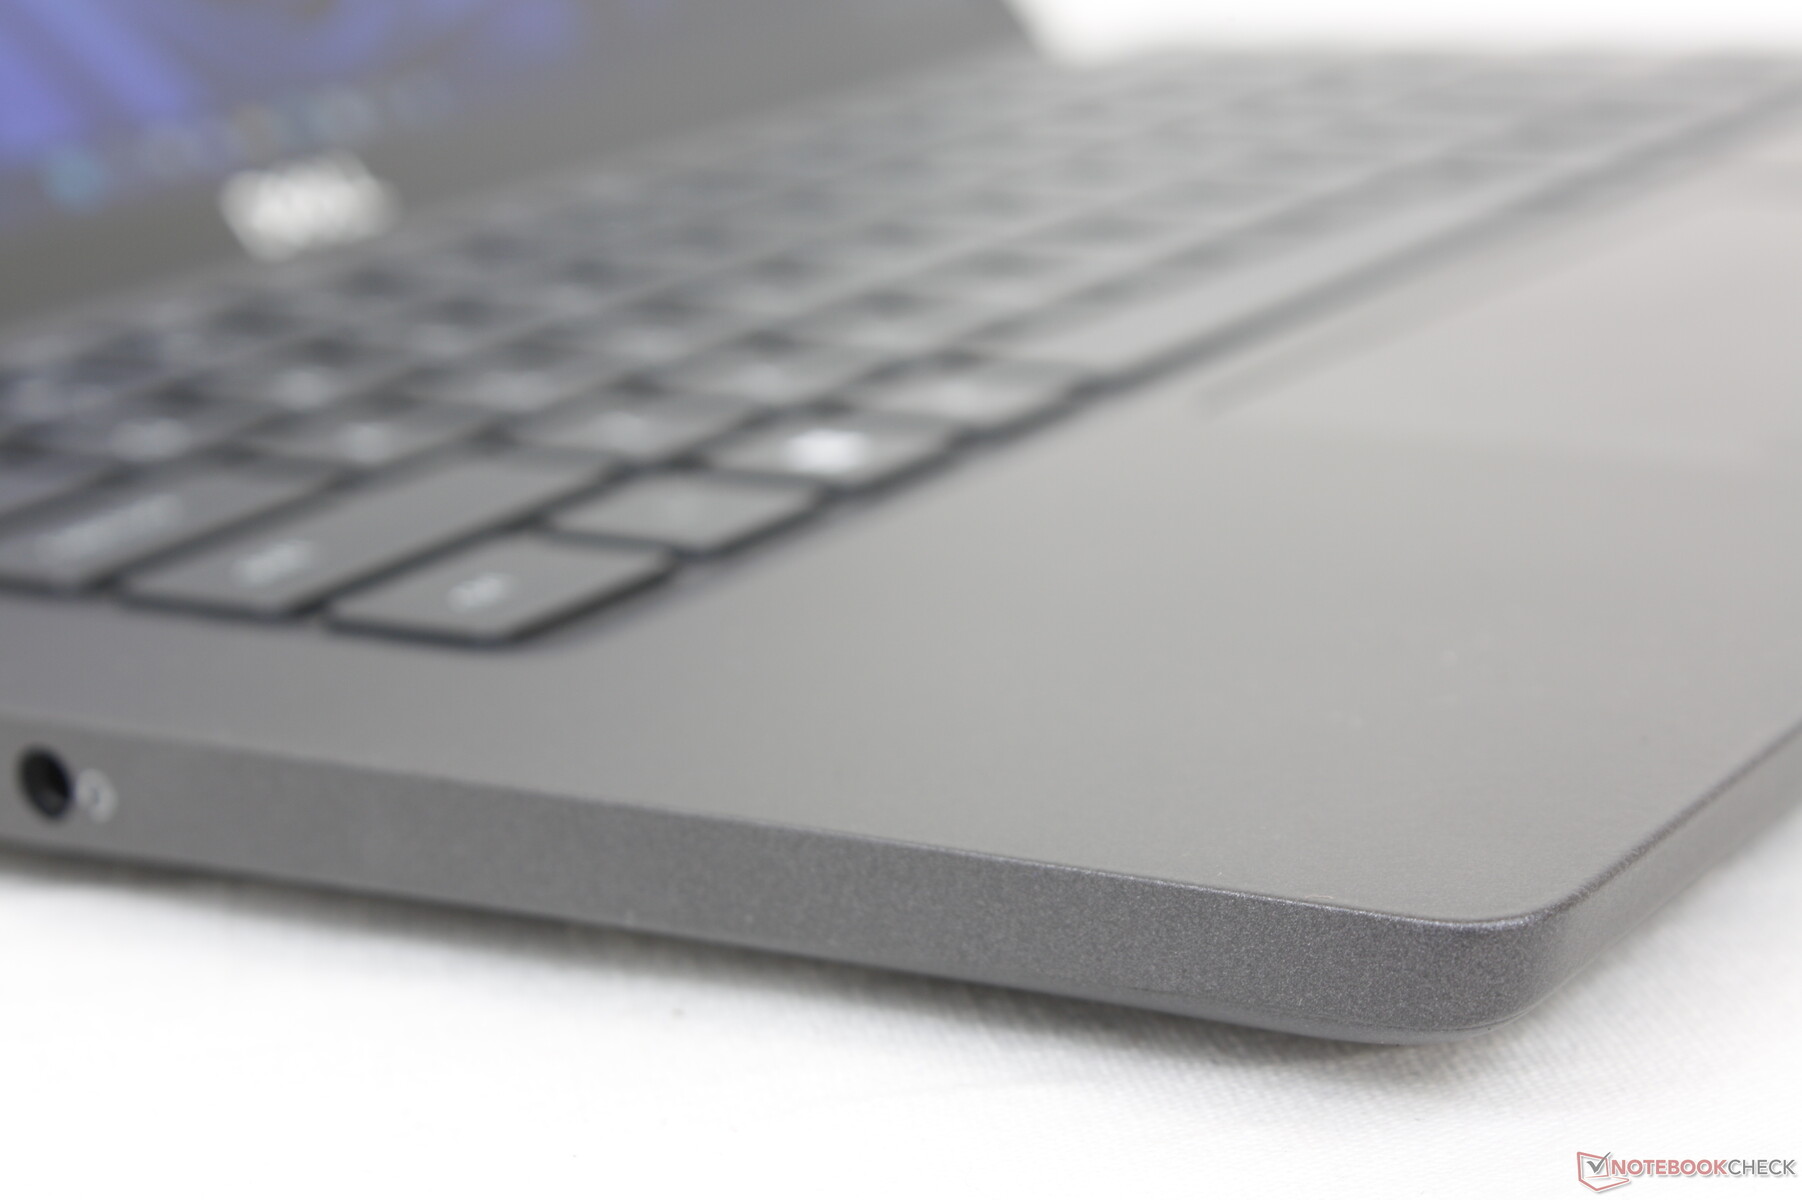
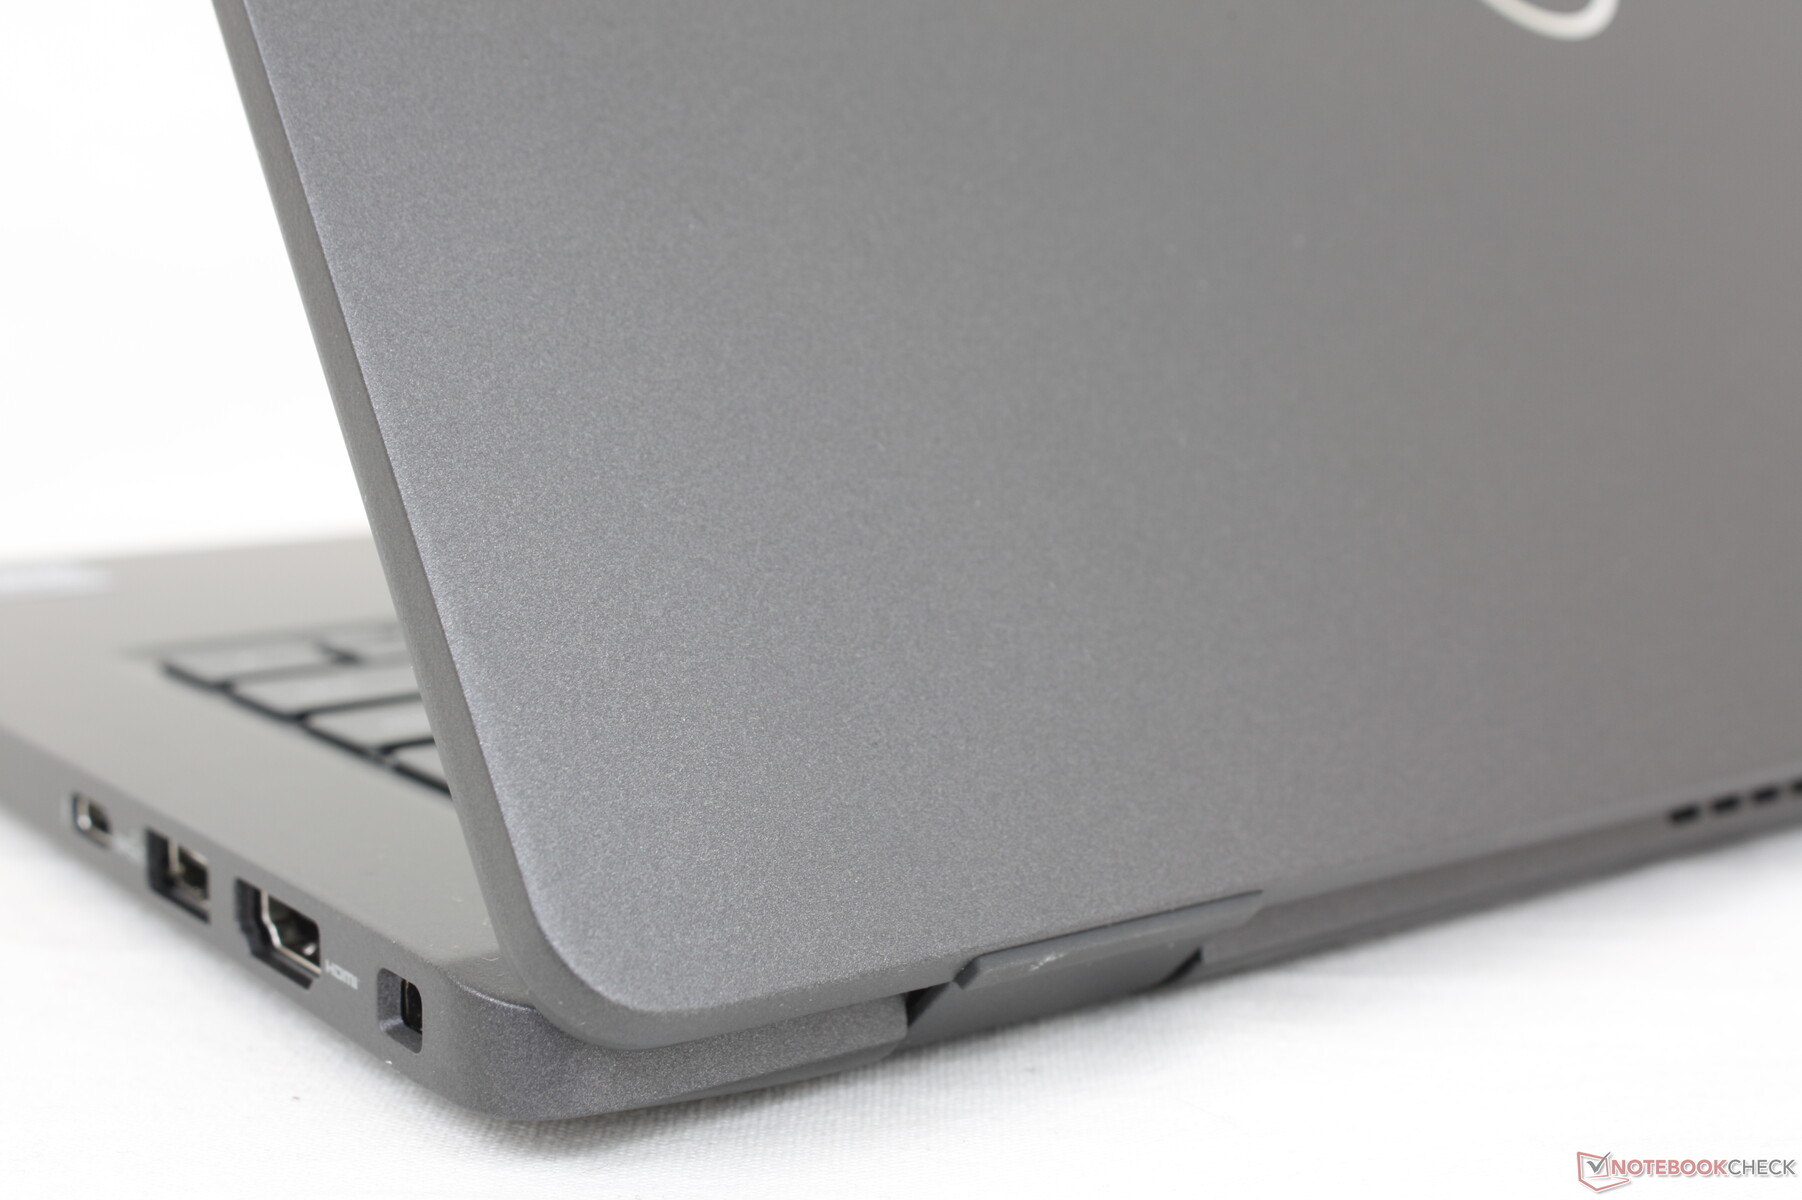
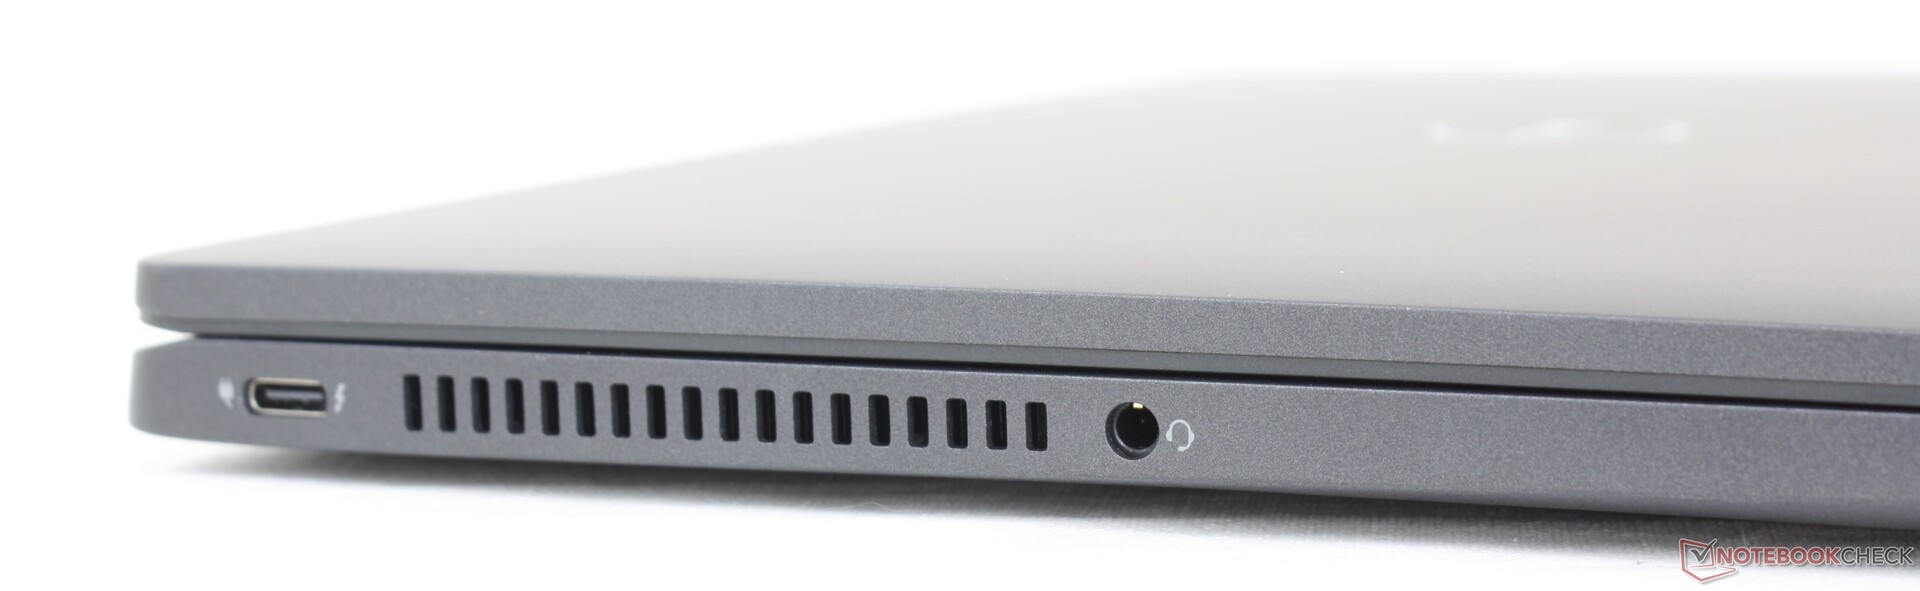
Le opzioni delle porte sono le stesse del modello Latitude 7310, ma riorganizzate per migliorare la praticità. Le due porte USB-C, ad esempio, si trovano ora rispettivamente lungo il bordo sinistro e destro dello chassis, rispetto al vecchio modello che si trovava solo sul bordo sinistro. Questo cambiamento consente agli utenti di caricare il portatile da entrambi i lati.
Comunicazione - LTE opzionale
L'Intel AX211 è dotato di connettività Wi-Fi 6E e Bluetooth 5.2 di serie. Non abbiamo riscontrato grossi problemi di connettività quando è stato accoppiato alla nostra rete a 6 GHz. Le differenze di prestazioni tra Wi-Fi 6 e Wi-Fi 6E saranno minime per la maggior parte degli utenti.
Sebbene la nostra unità non sia configurata con la rete WAN, gli utenti possono scegliere di configurarla con un modulo Qualcomm Snapdragon X20 LTE-A CAT 9 o CAT 16 abilitato alla eSIM.
| Networking | |
| iperf3 transmit AX12 | |
| Microsoft Surface Laptop 4 13 Ryzen 5 | |
| Dell Latitude 7310 | |
| Razer Book 13 FHD | |
| Lenovo ThinkPad X13 Yoga 20SX0004GE | |
| iperf3 receive AX12 | |
| Razer Book 13 FHD | |
| Microsoft Surface Laptop 4 13 Ryzen 5 | |
| Dell Latitude 7310 | |
| Lenovo ThinkPad X13 Yoga 20SX0004GE | |
| iperf3 receive AXE11000 6GHz | |
| Framework Laptop 13.5 12th Gen Intel | |
| Dell Latitude 13 7330 | |
| iperf3 transmit AXE11000 6GHz | |
| Dell Latitude 13 7330 | |
| Framework Laptop 13.5 12th Gen Intel | |
Webcam
Gli utenti possono configurare una webcam HD (720p) o FHD (1080p) con IR opzionale per il supporto di Windows Hello. Consigliamo di passare a 1080p, poiché la qualità delle immagini della nostra configurazione a 720p è sfocata e brutalmente obsoleta.
È presente un cursore manuale dell'otturatore per garantire la privacy.


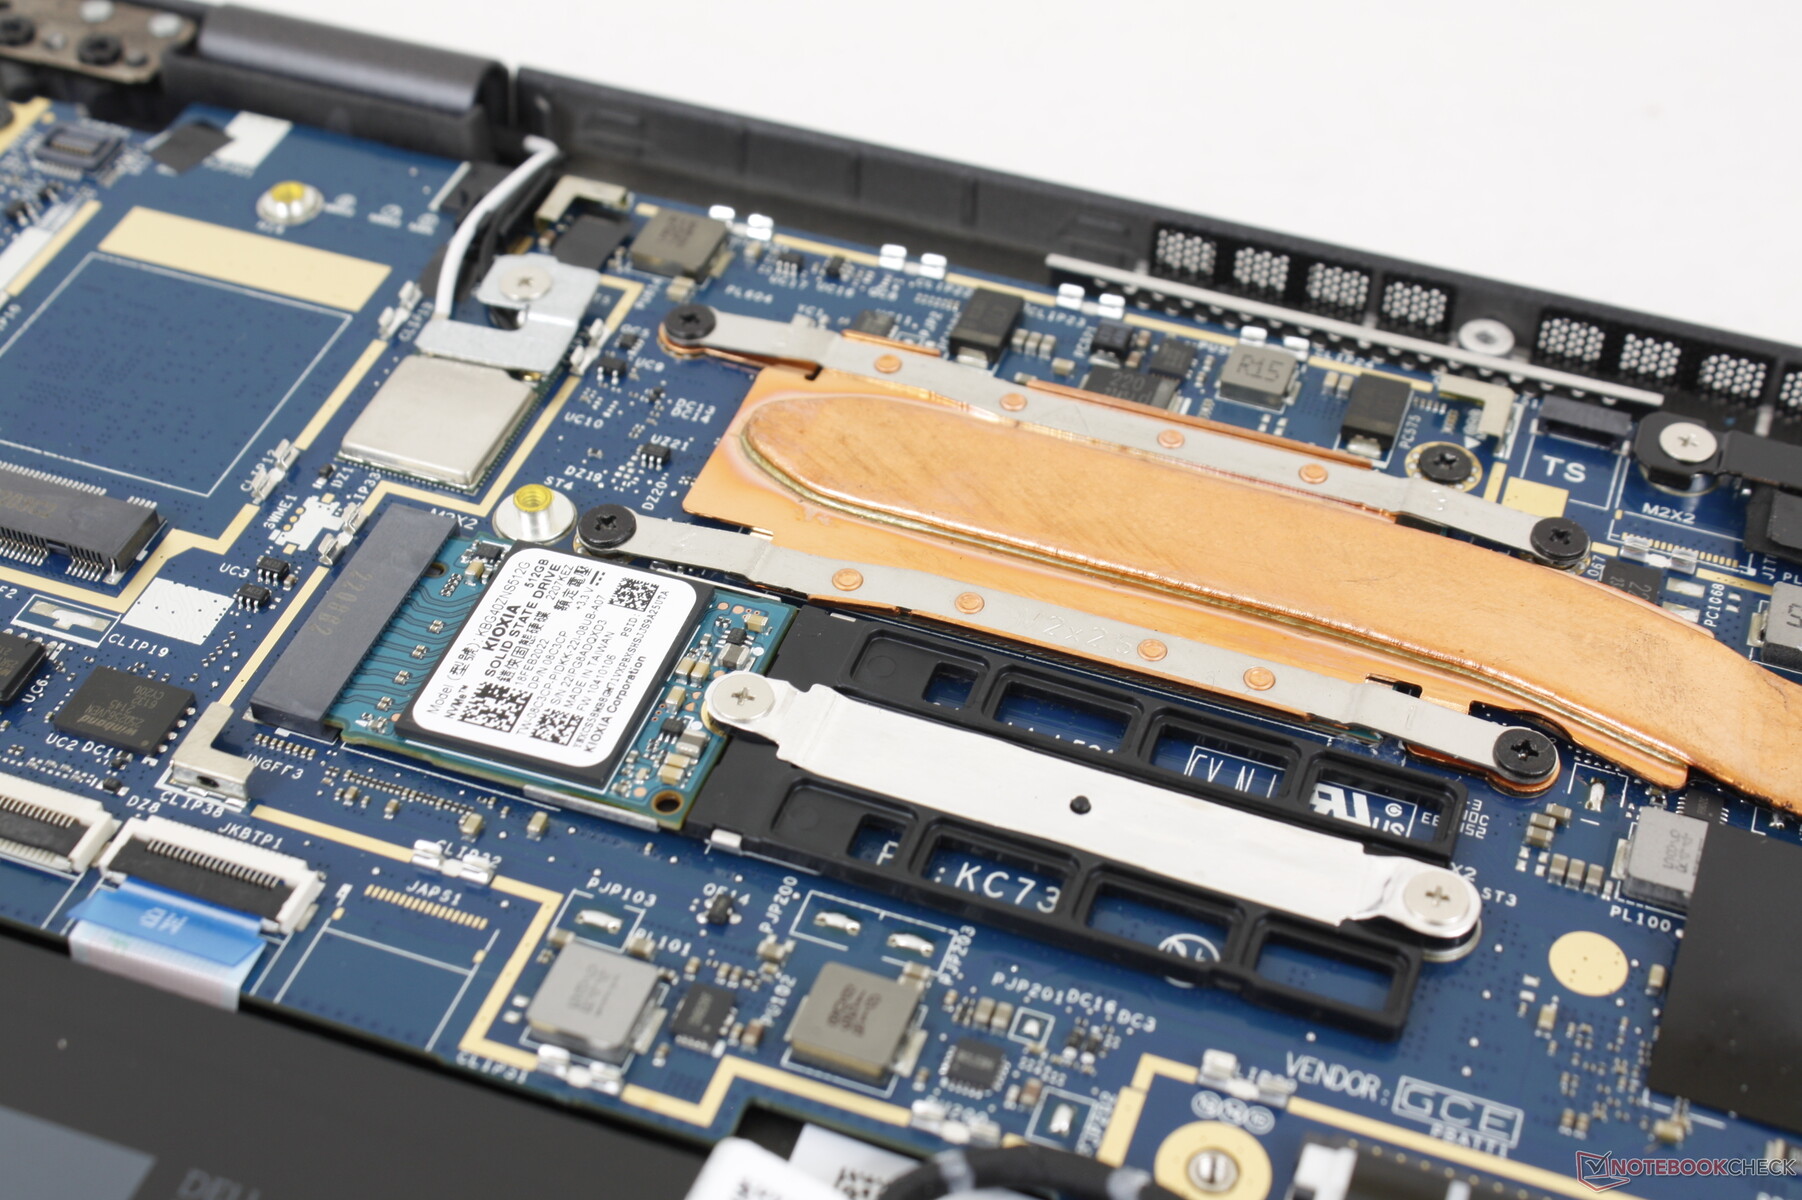
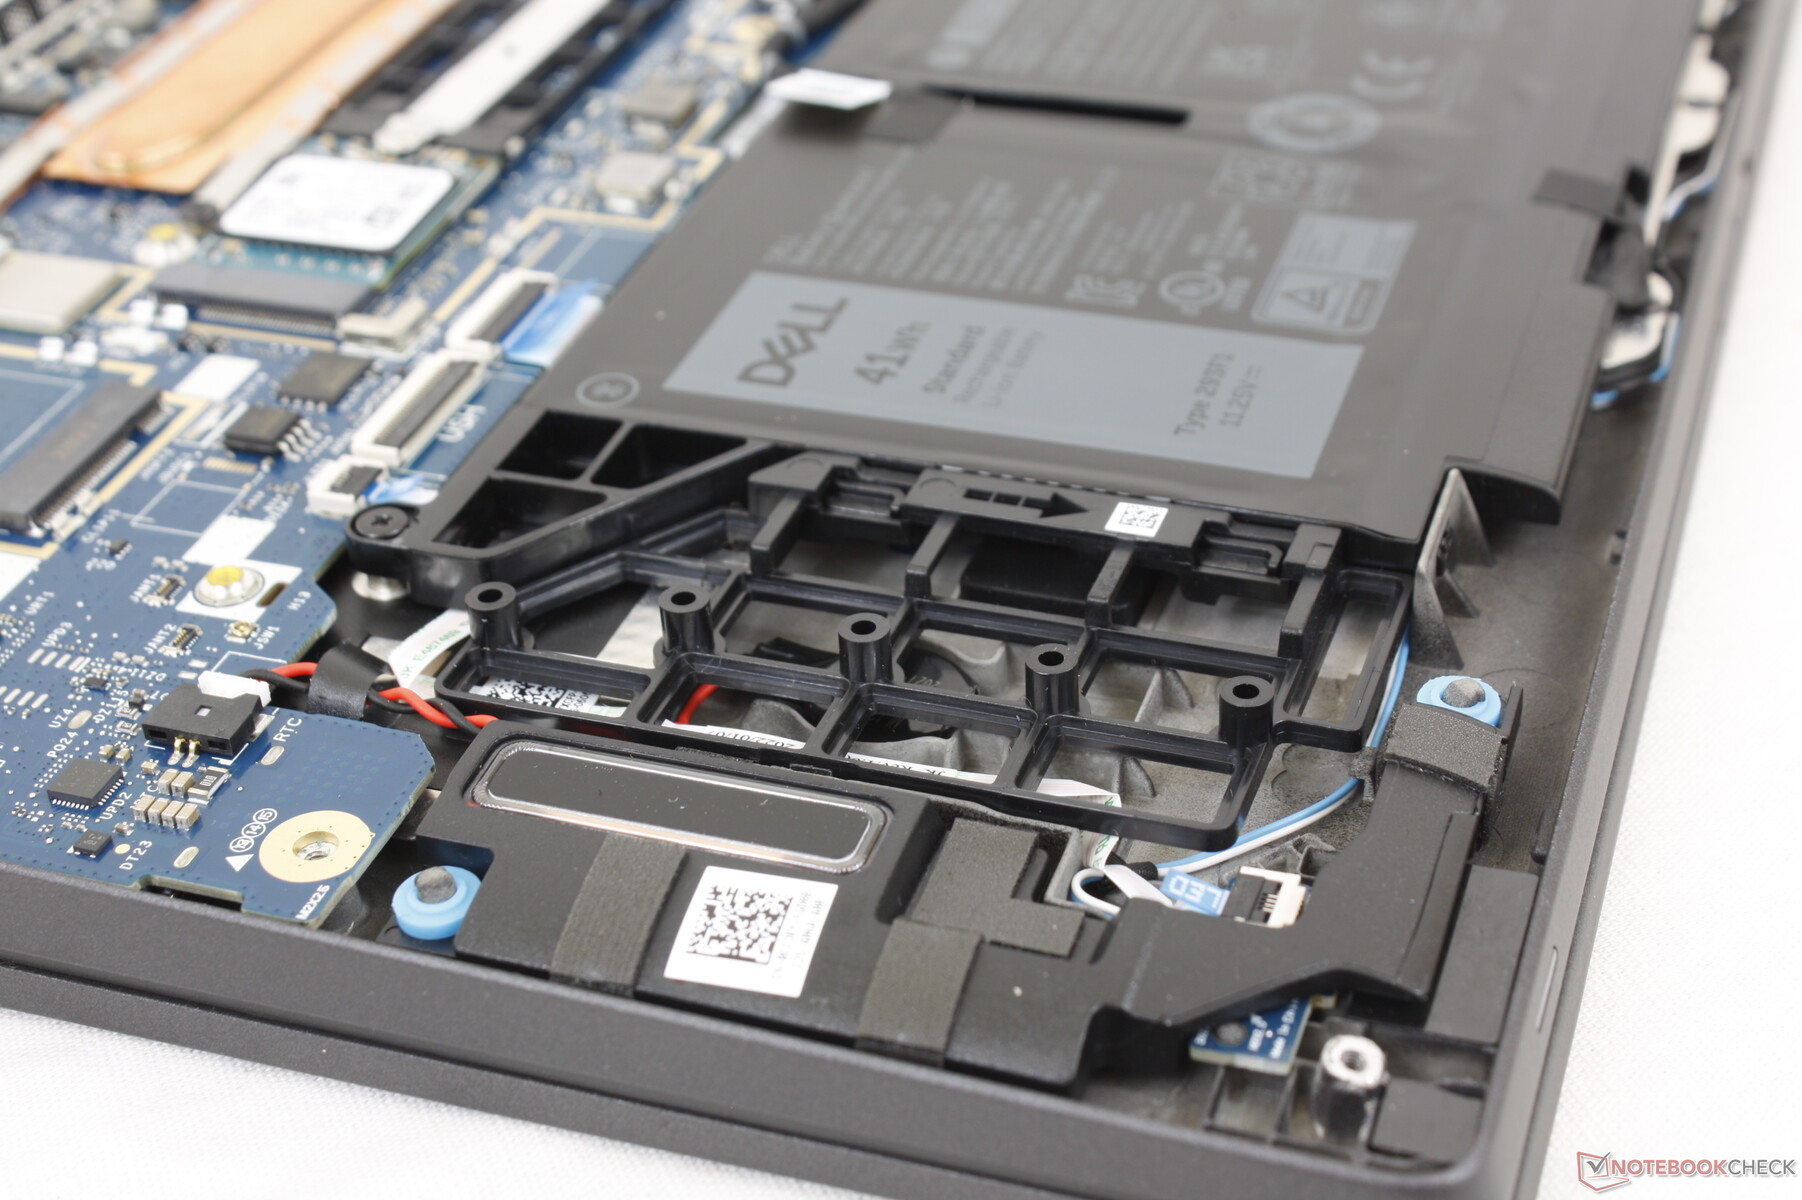
Manutenzione
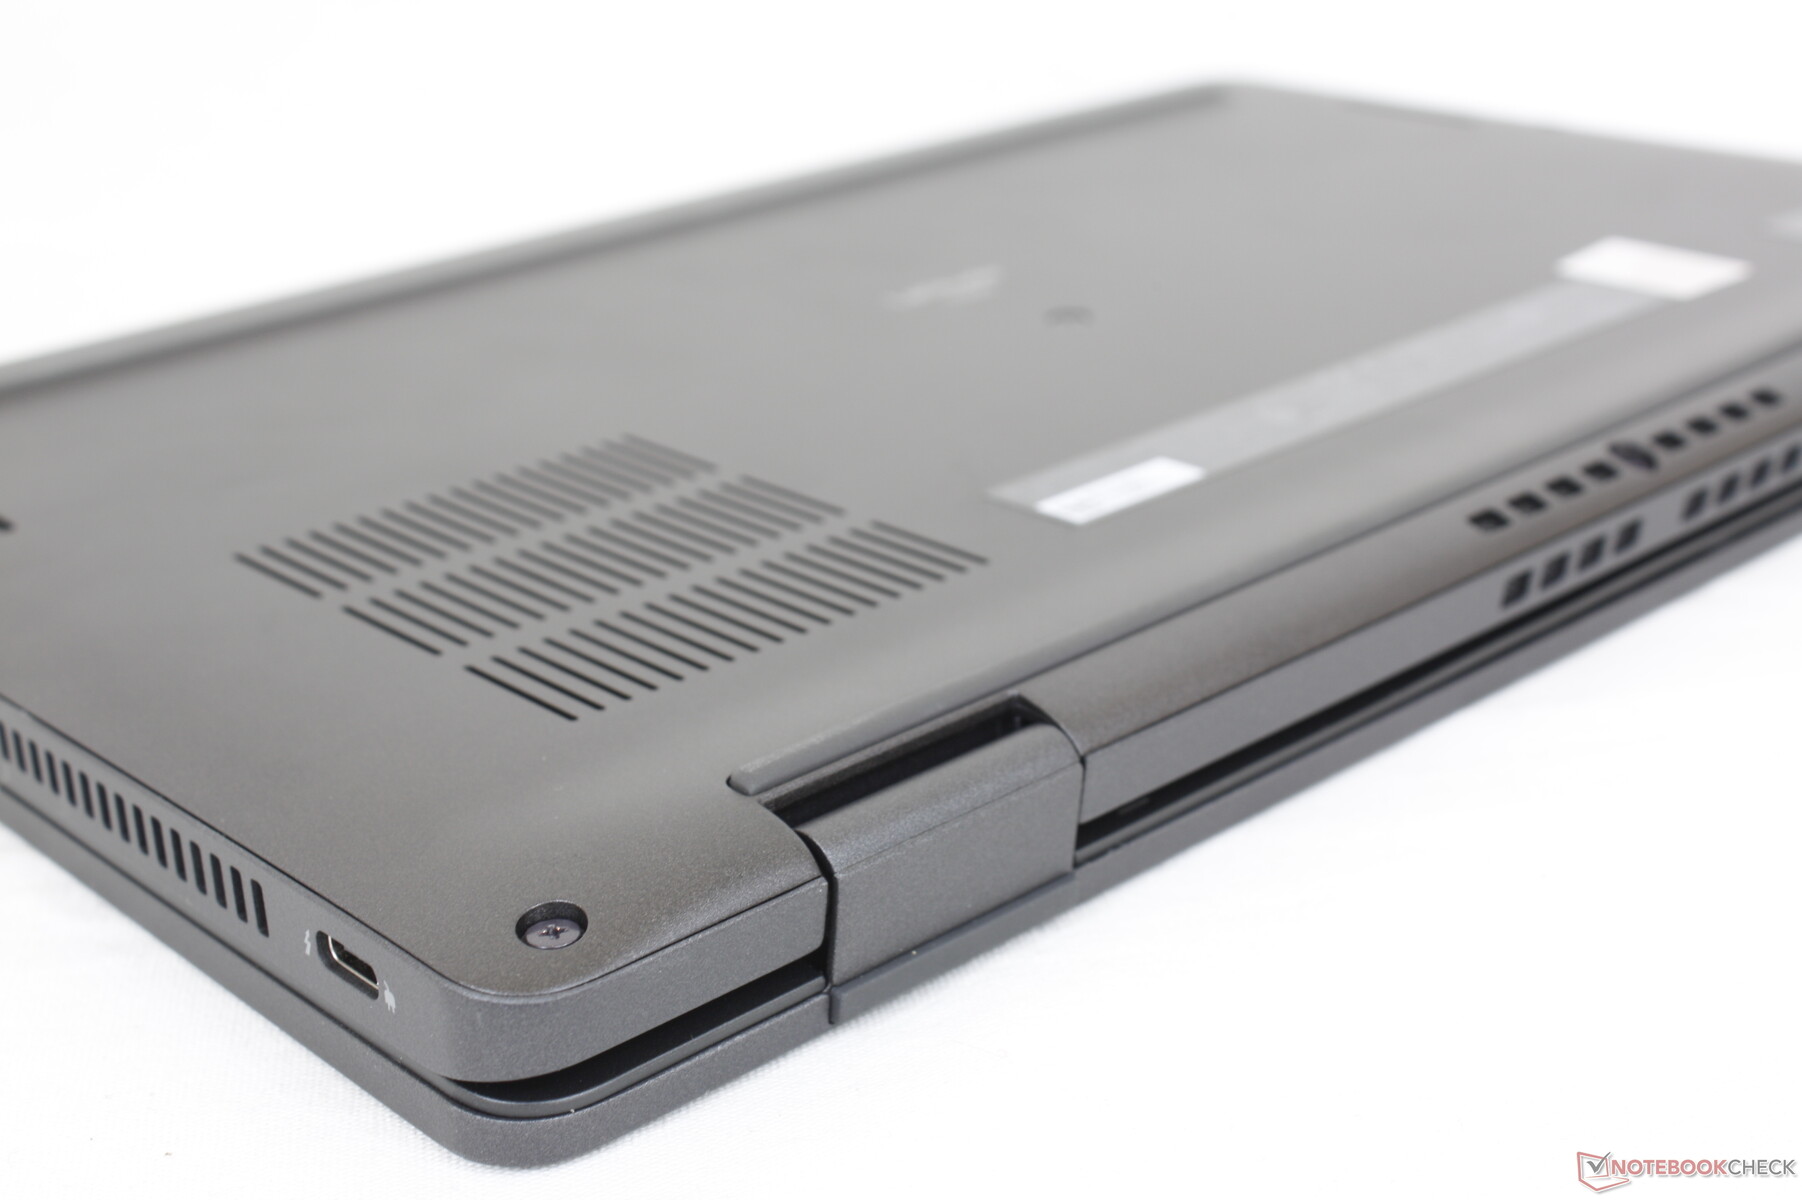
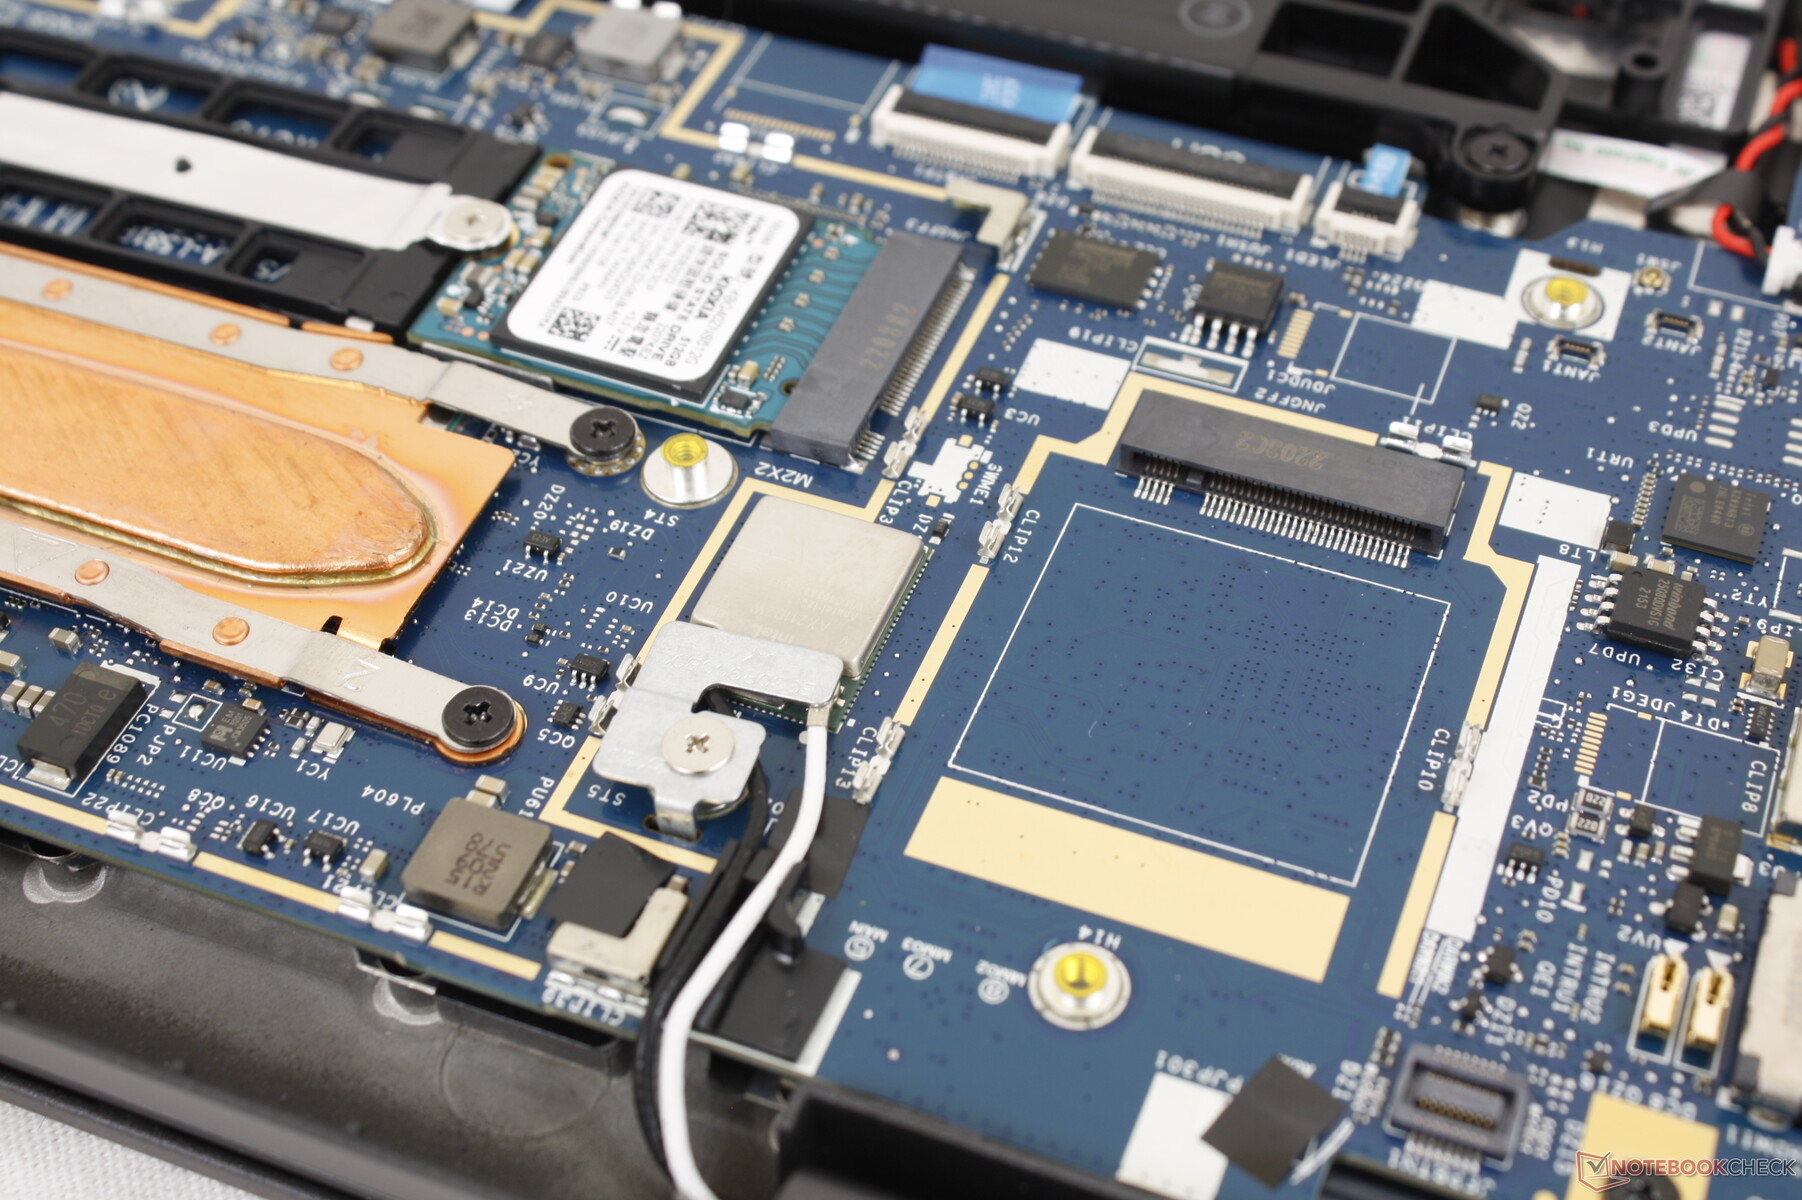
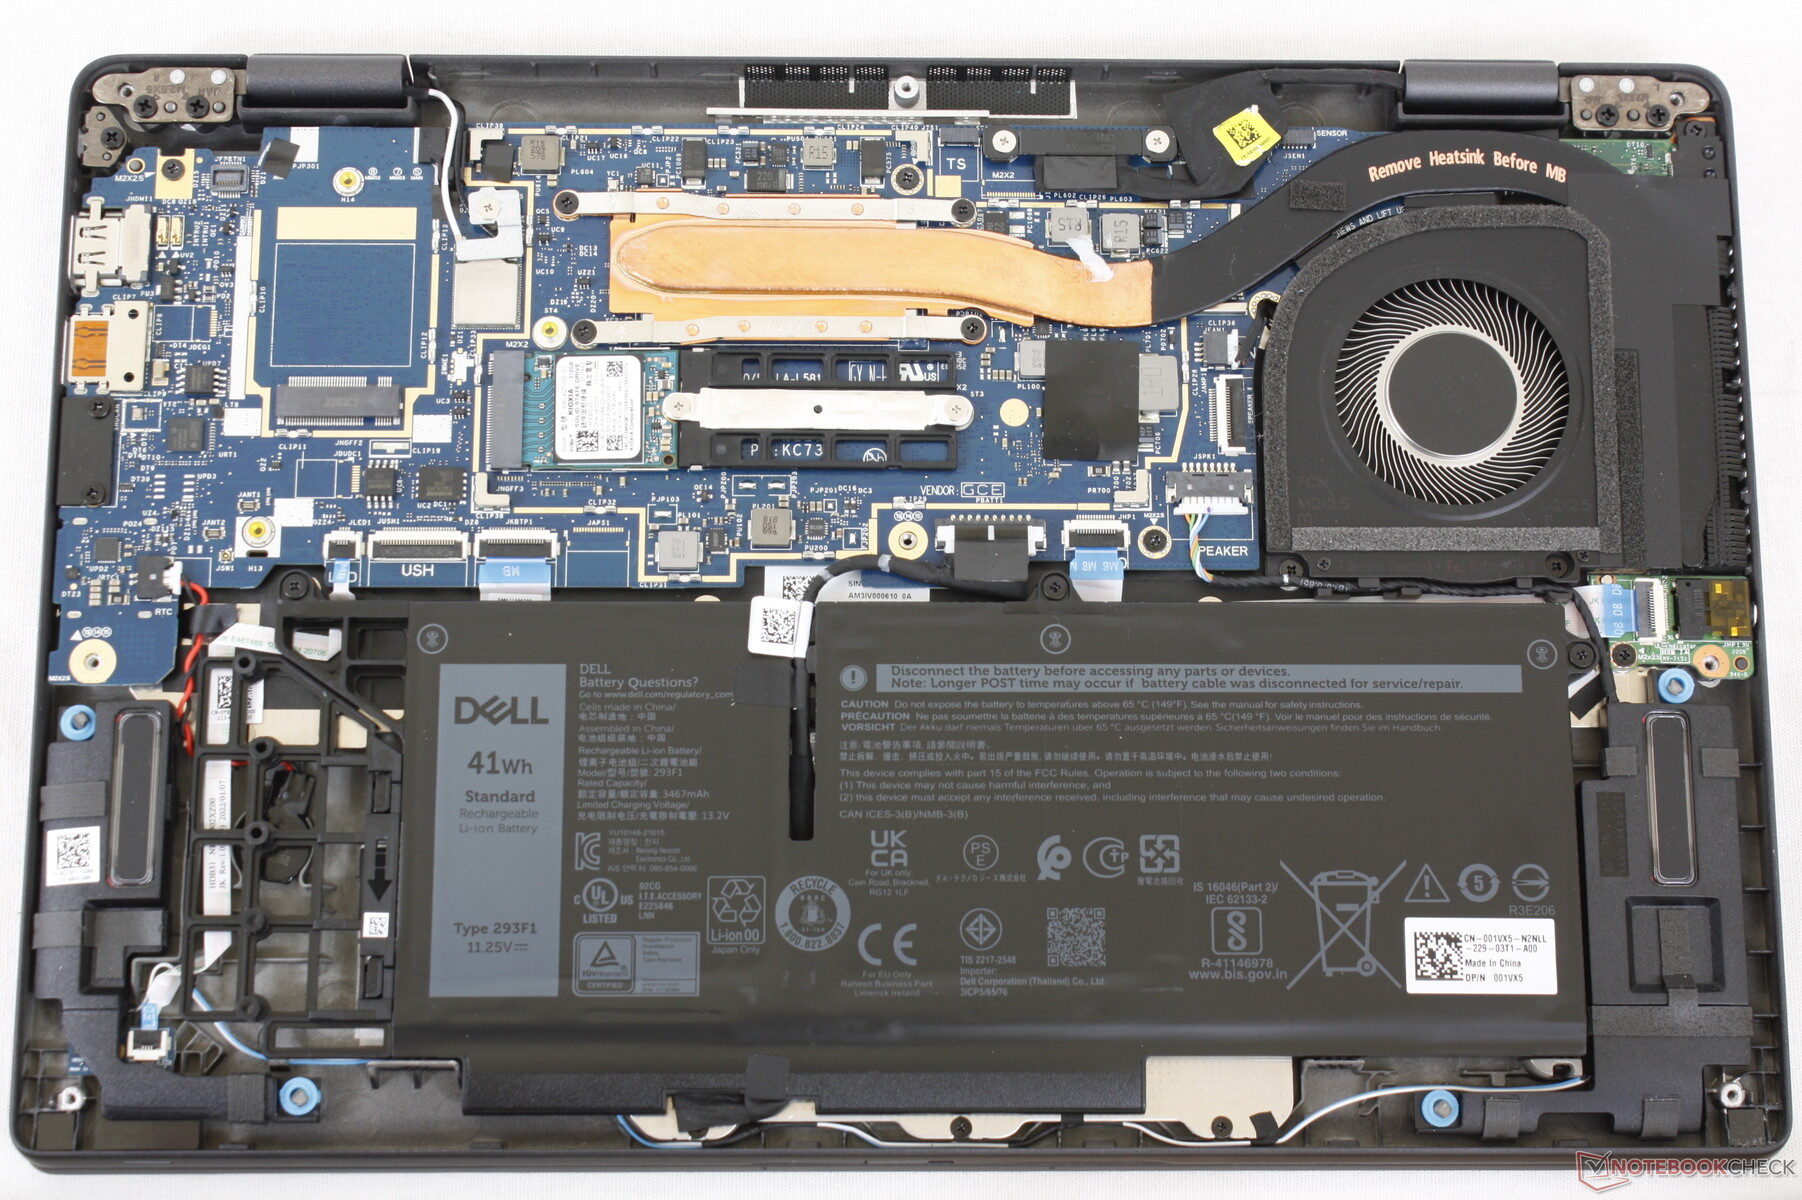
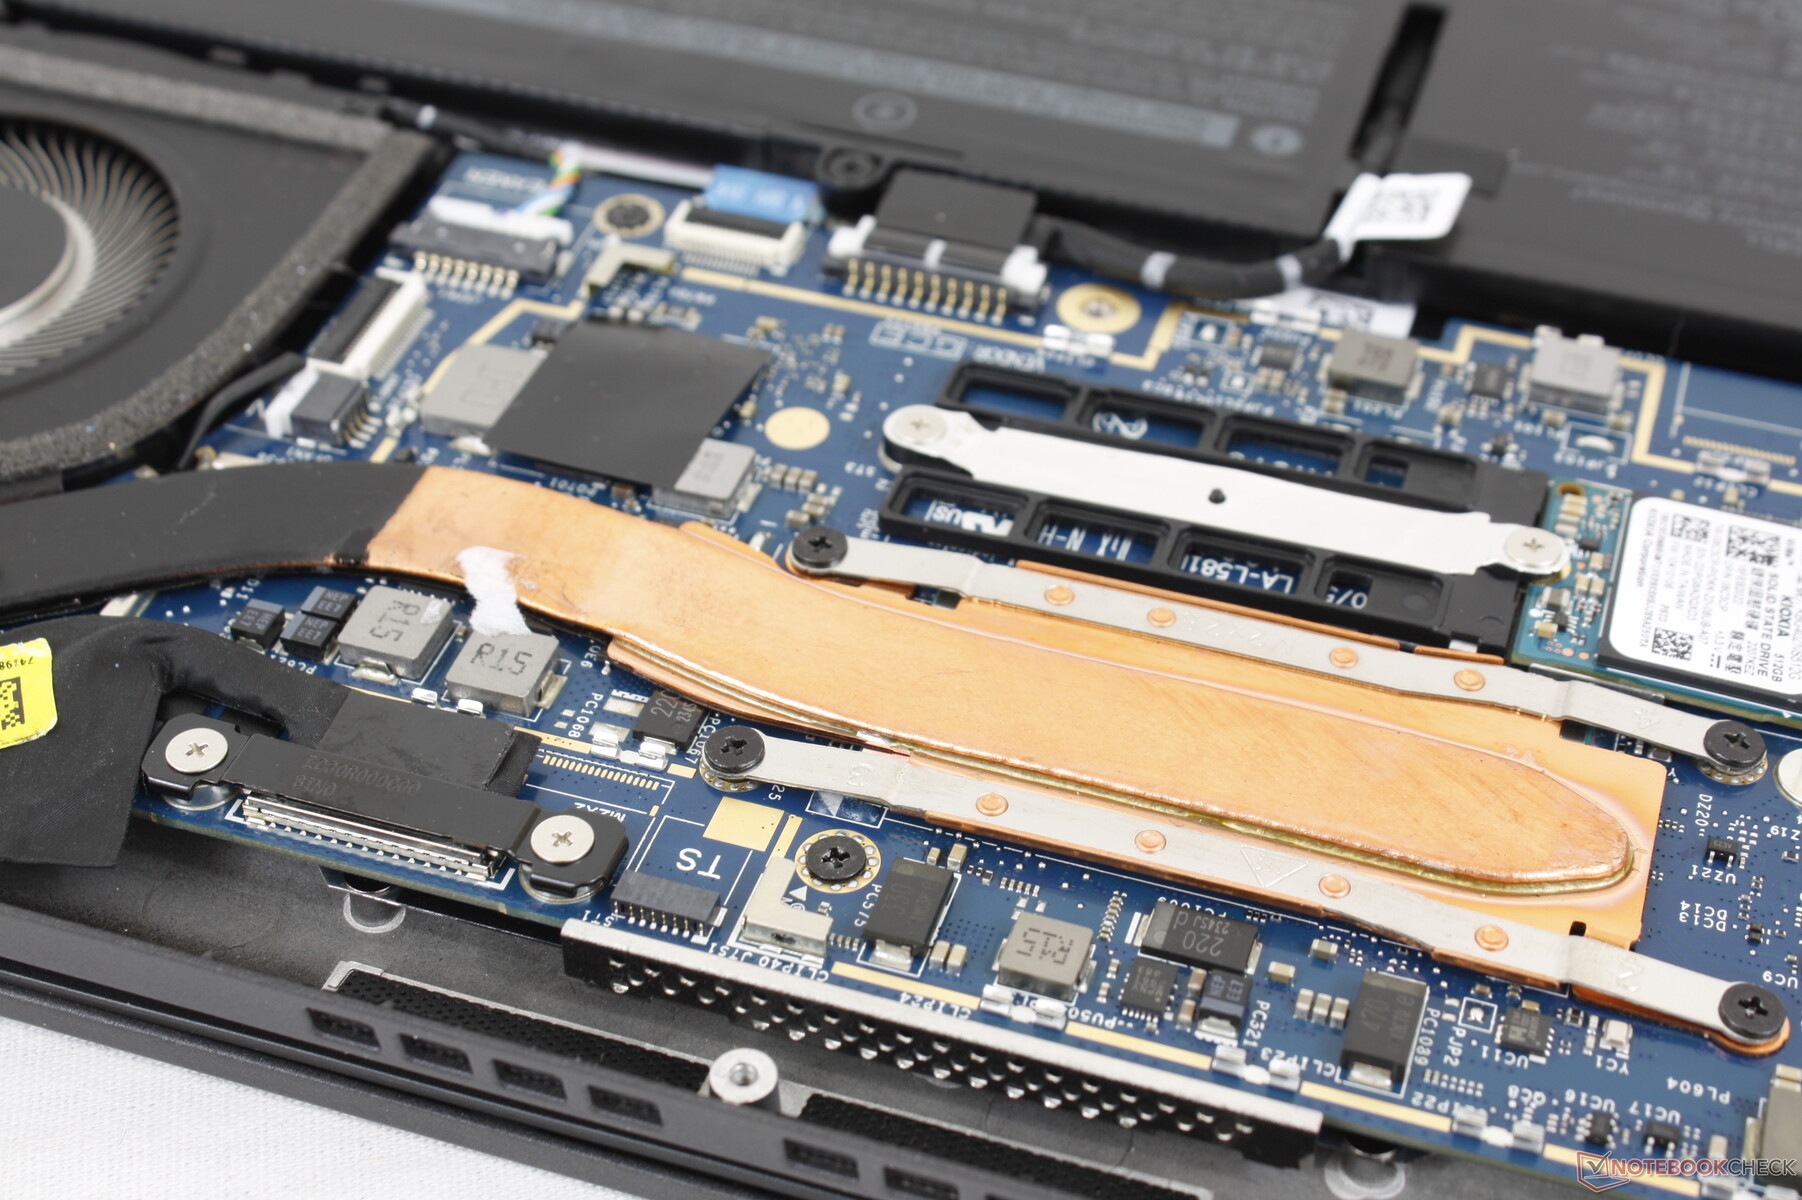
Il pannello inferiore è facilmente rimovibile con un semplice cacciavite Philips. Non c'è molto da riparare oltre all'SSD M.2 e alla batteria, poiché i moduli WLAN e RAM sono saldati.
Si noti che non sono incluse antenne se si configura senza WAN per scoraggiare i proprietari dall'installare il proprio modulo WAN. Inoltre, si noti lo spazio vuoto a sinistra della batteria da 41 Wh per ridurre il peso; questo spazio diventa occupato se si configura con l'opzione più grande da 58 Wh.
Accessori e garanzia
Nella confezione non ci sono altri extra oltre all'adattatore CA e alla documentazione. La garanzia di tre anni è di serie, come di consueto per la maggior parte dei modelli Latitude.
Dispositivi di input - Come prima
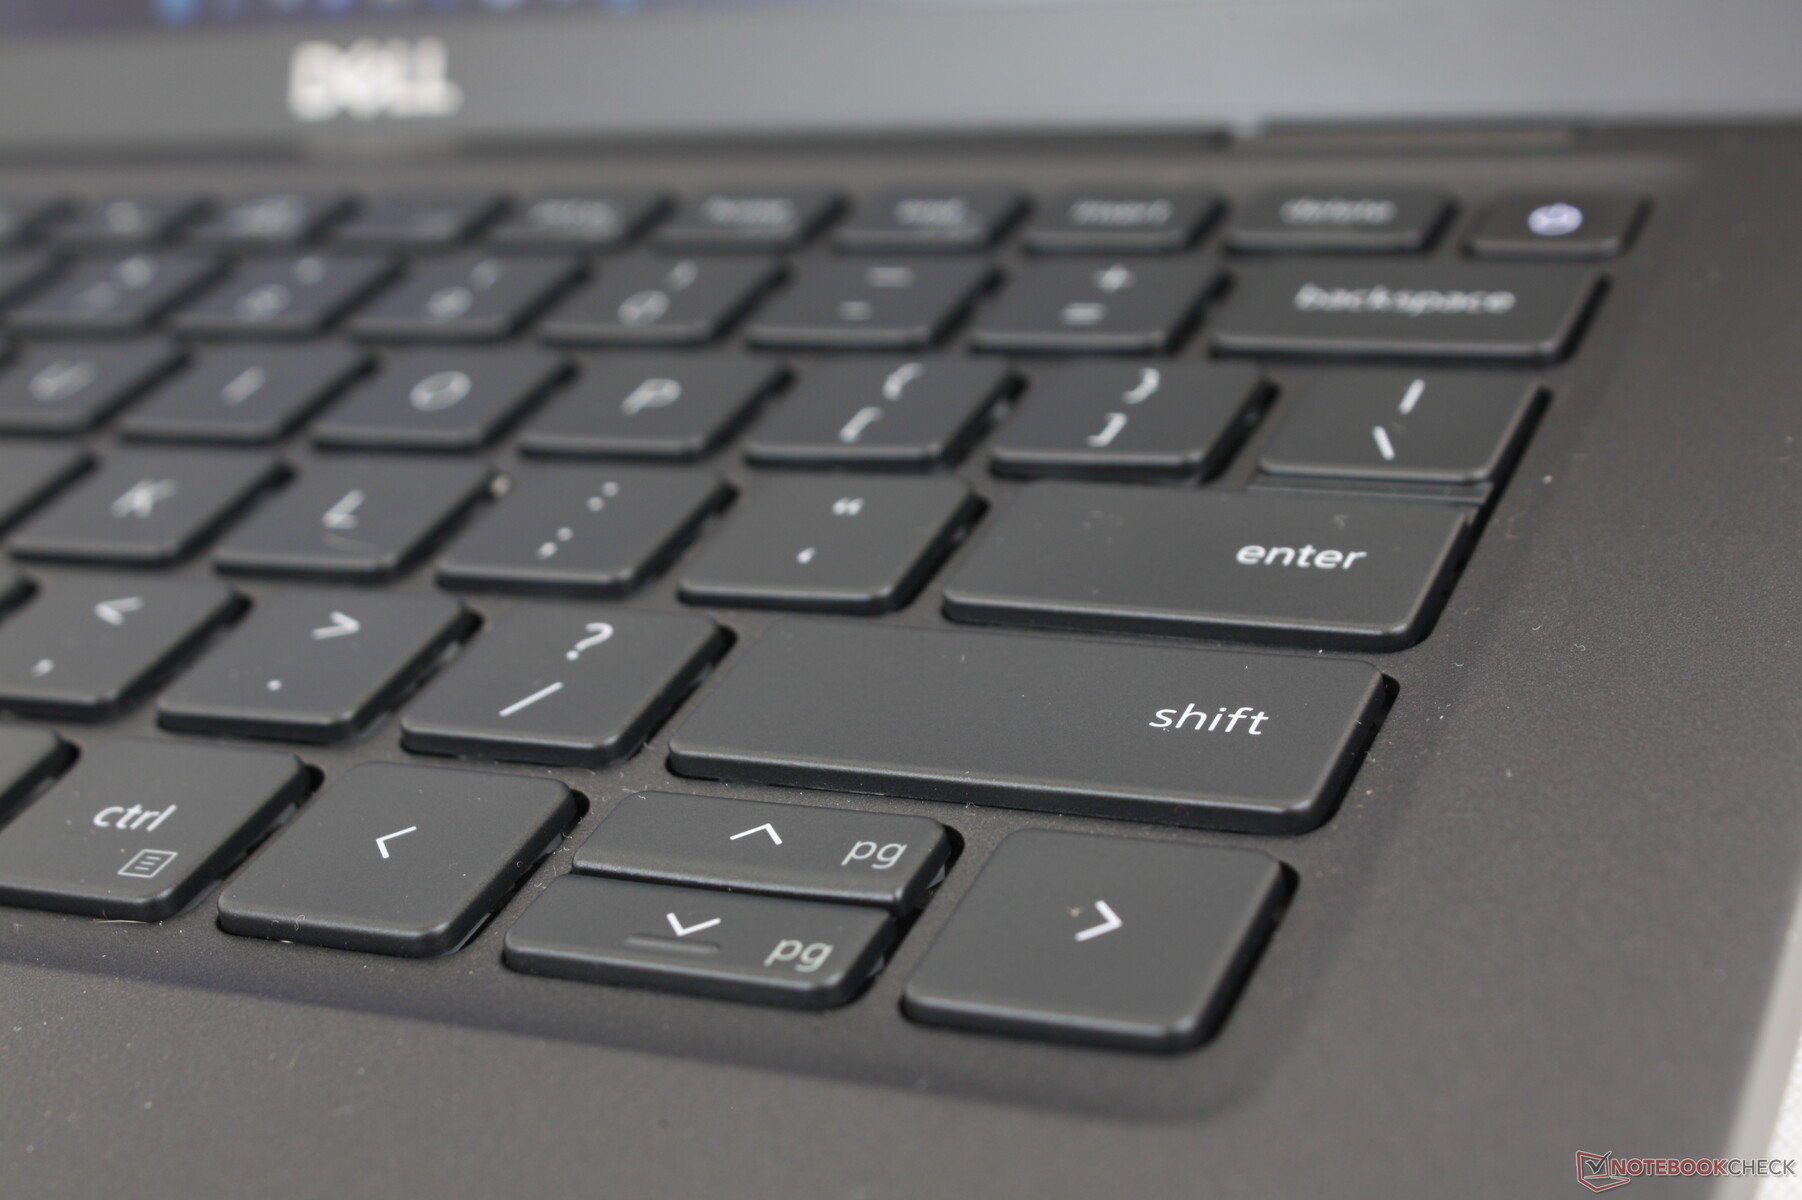
Tastiera
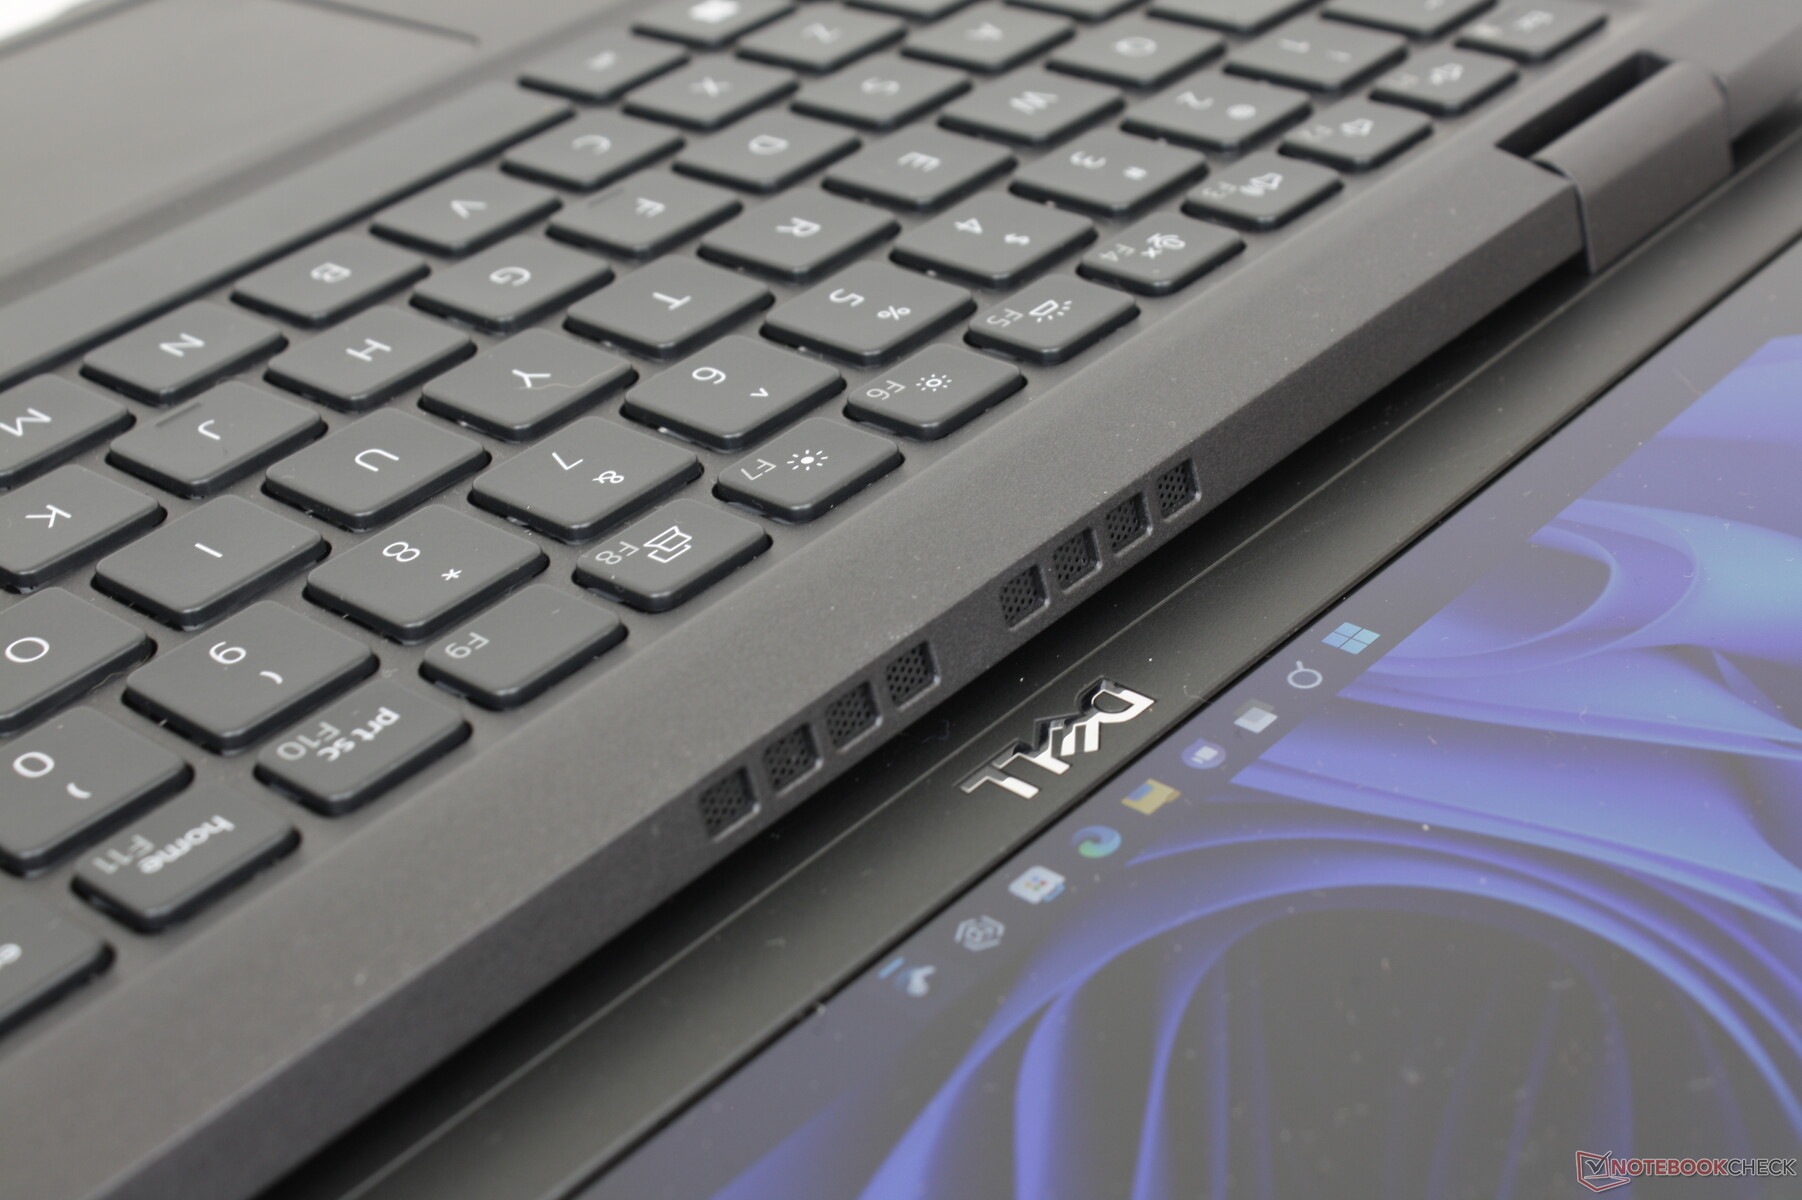
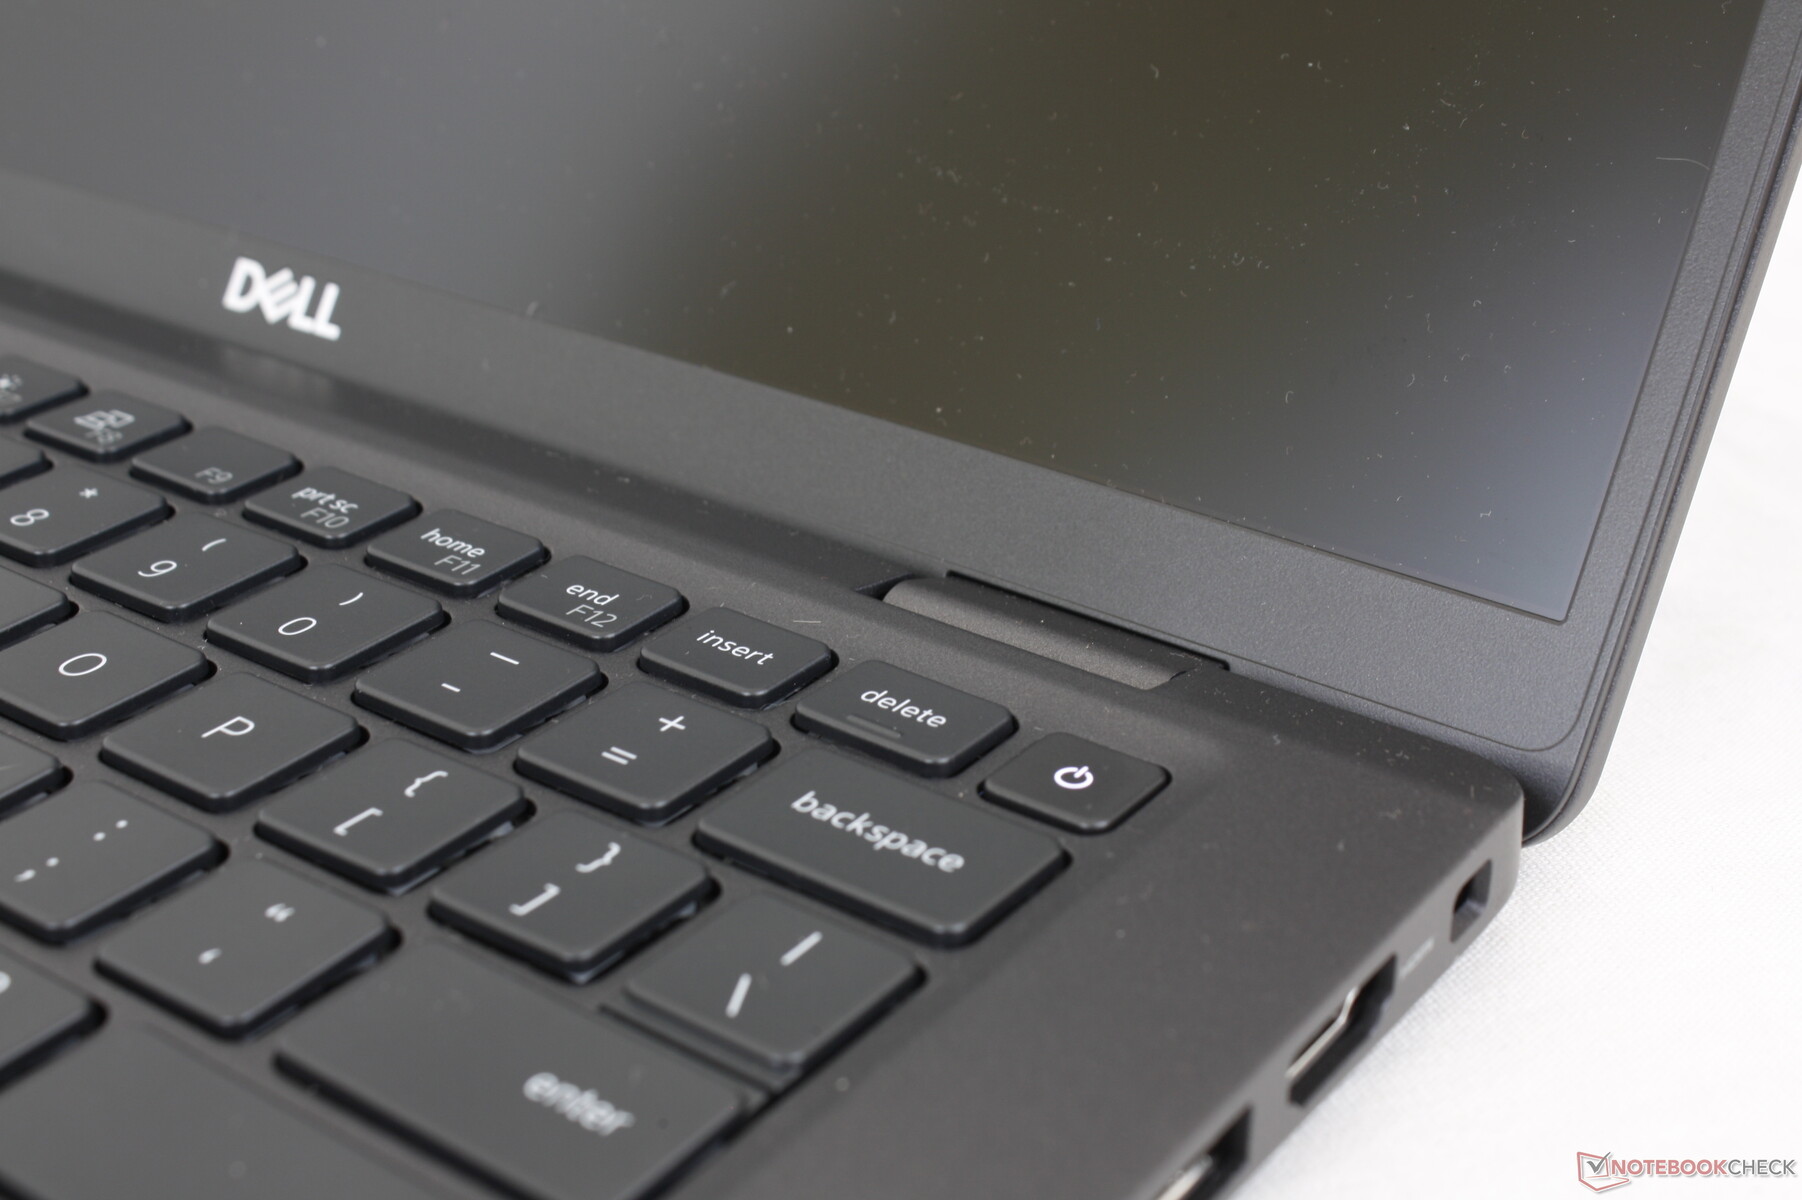
Dell non ha apportato modifiche alla tastiera tra i modelli Latitude 7310 e Latitude 7330. Infatti, molti dei modelli Latitude più recenti condividono lo stesso design e layout della tastiera, compresi i modelli Latitude 7400 7410, 7310 e 7330. Troviamo che i tasti più solidi di Latitude siano più comodi per la digitazione rispetto a quelli più leggeri dell'XPS 13. I tasti dell'LG Gram 14 o della HP EliteBook hanno un feedback più nitido o più chiaro.
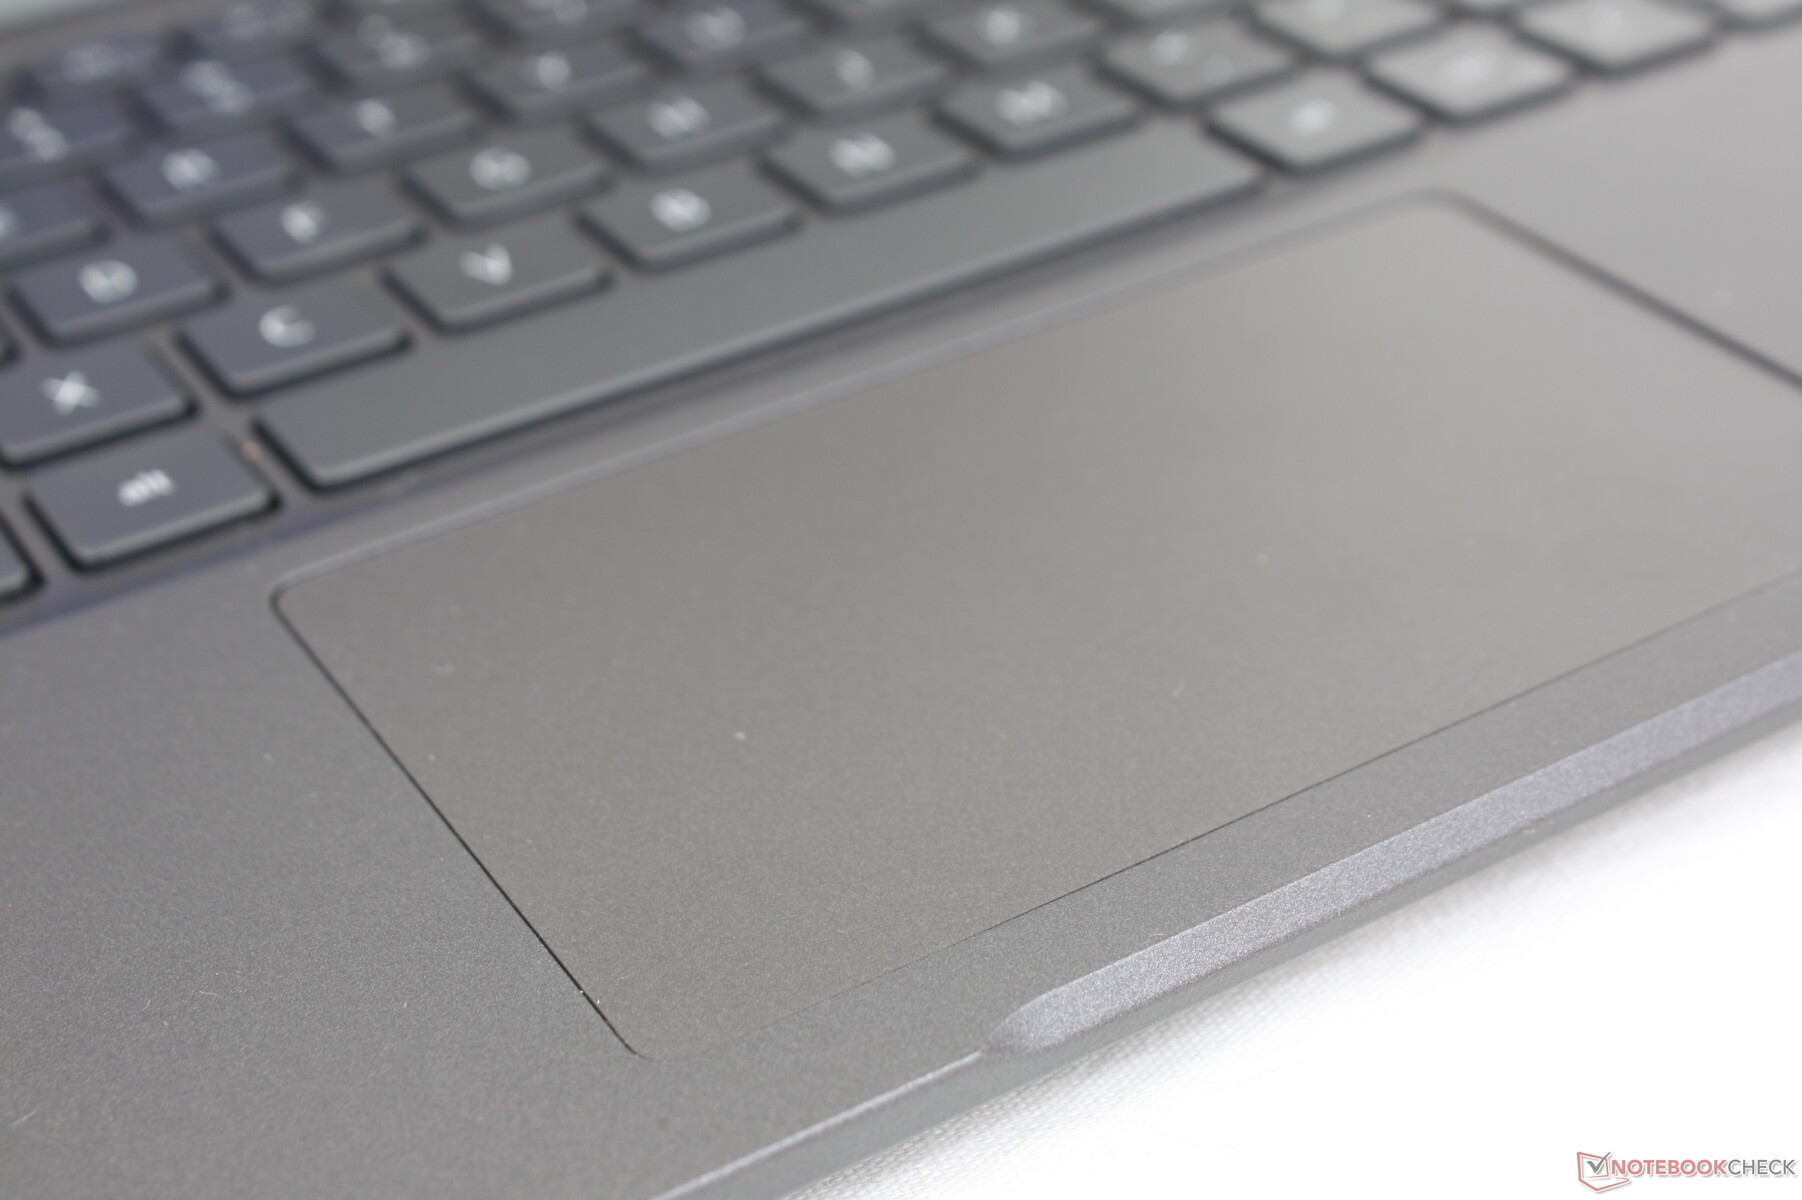
Touchpad
Le dimensioni del Clickpad non sono cambiate rispetto al precedente Latitude 7310 e sono di circa 10 x 6,1 cm. Tuttavia, avremmo voluto che fosse più alto, poiché il movimento verticale del cursore e lo scorrimento multi-touch possono risultare un po' stretti. Anche i tasti del mouse integrato sono più morbidi di quanto vorremmo e dopo un po' diventano stancanti da premere.


Display: nessun OLED o frequenza di aggiornamento rapida
Sono disponibili quattro opzioni di visualizzazione, dalla peggiore alla migliore
- Non touch, 250-nits, ~60% sRGB
- Touch, 300 nit, ~60% sRGB
- Non-touch, 400-nits, 100% sRGB, bassa luce blu, basso consumo energetico
- Non-touch, 400-nits, 100% sRGB, bassa luce blu, basso consumo, ultraleggero
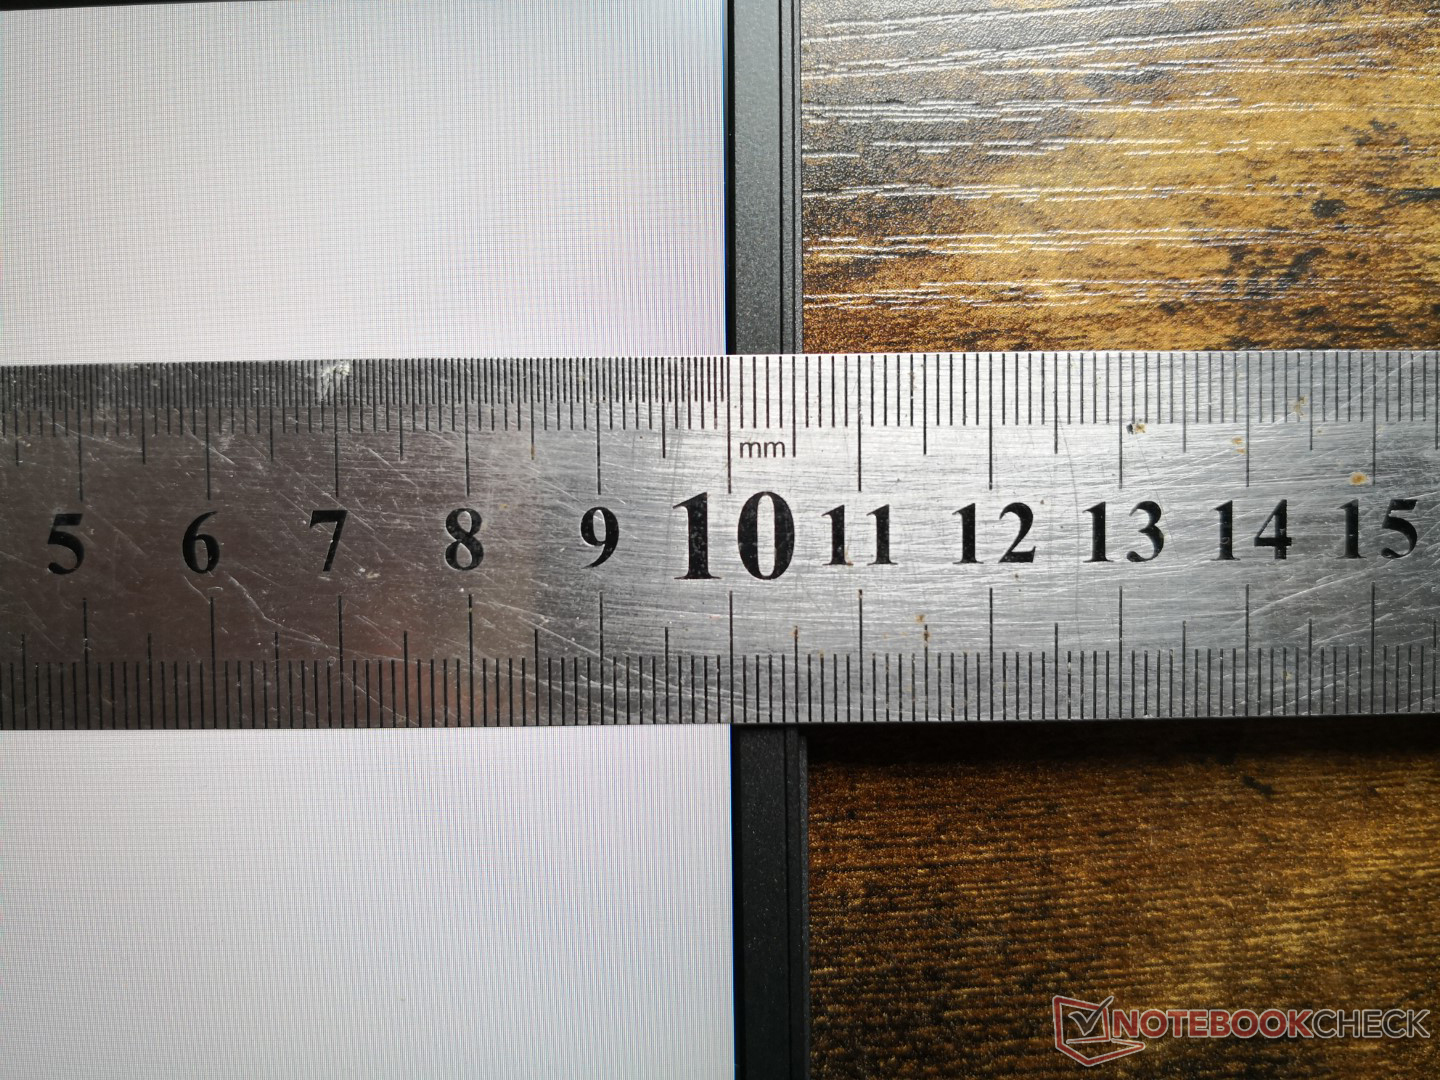
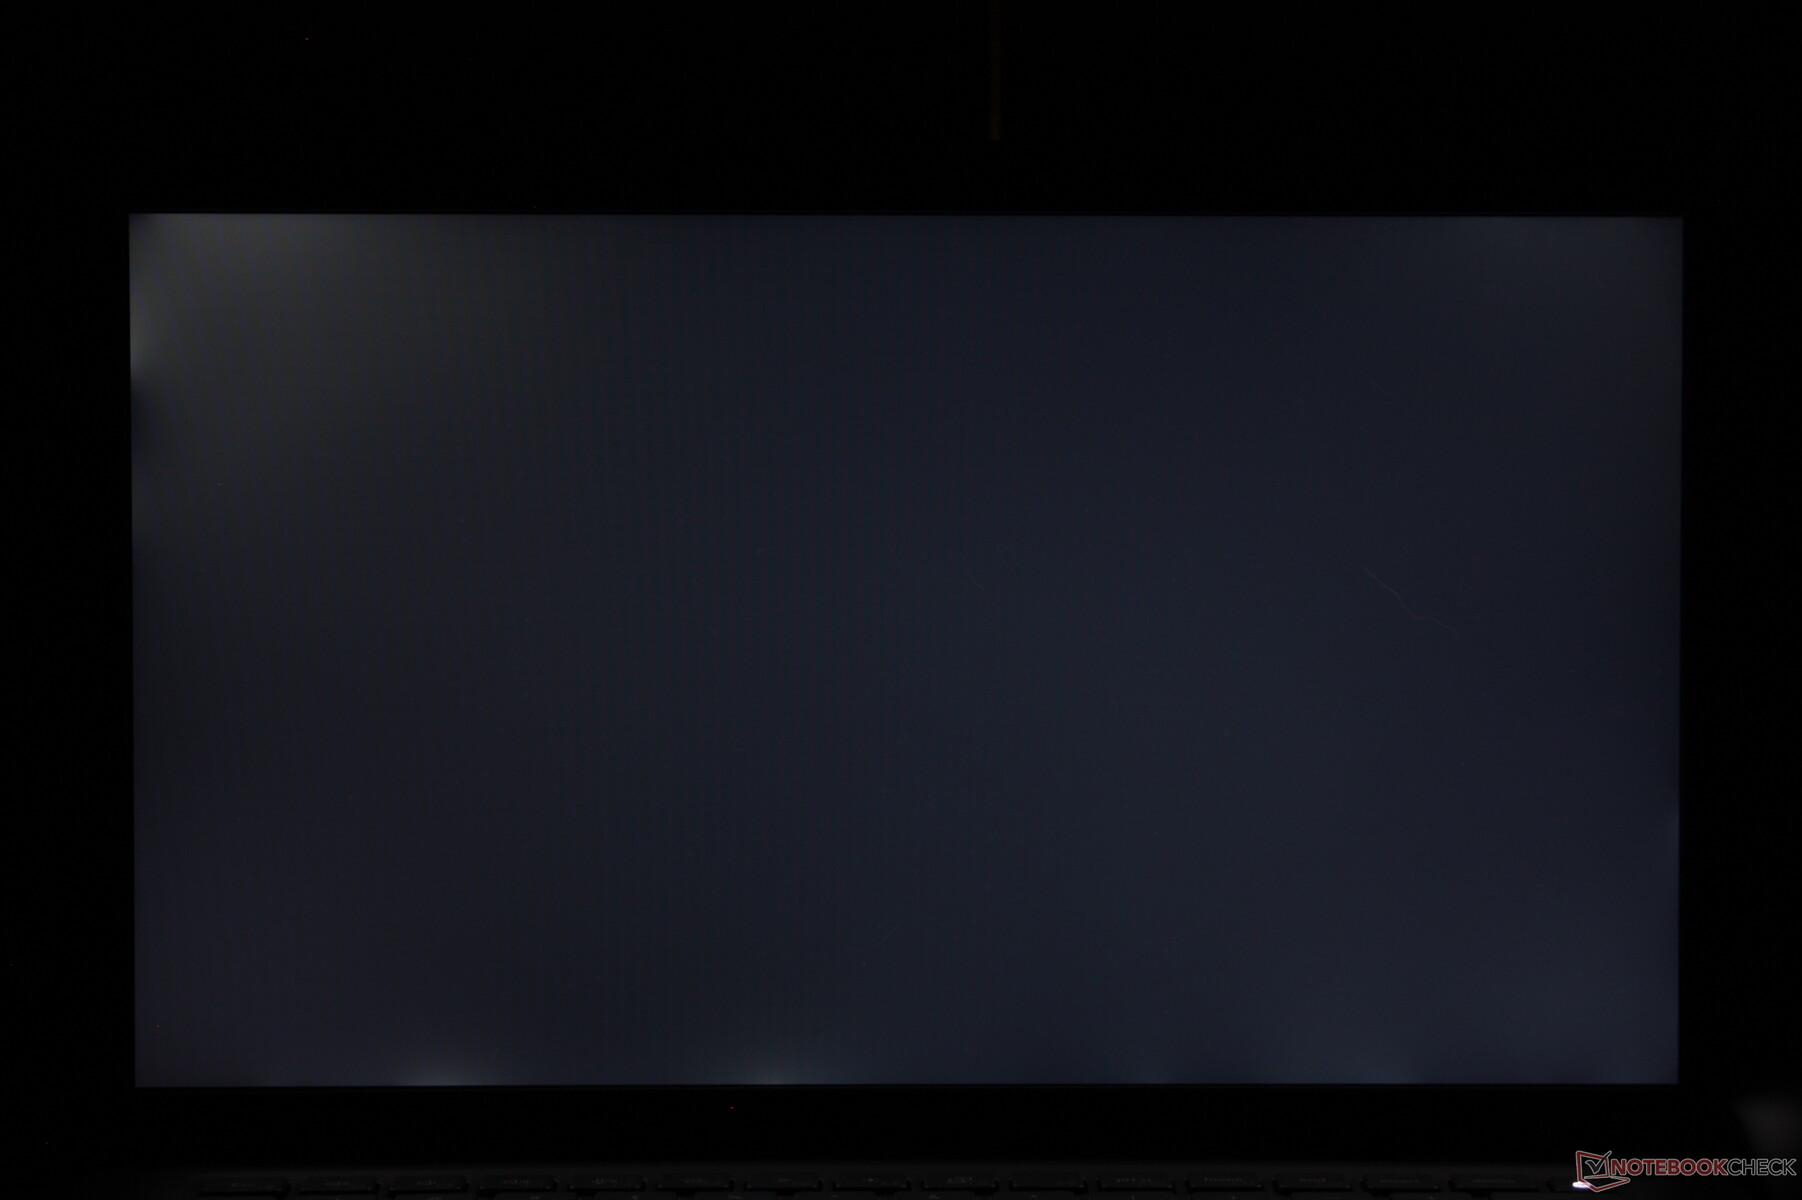
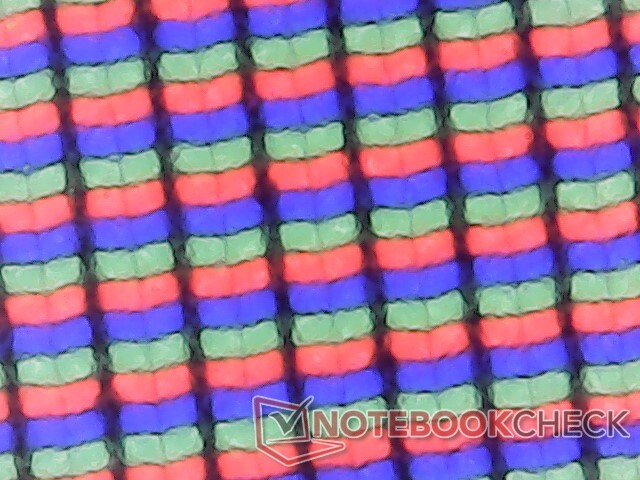
Tutte le opzioni sono FHD, WVA/IPS e solo opache, quindi non esistono alternative 2K, 4K, OLED o lucide. Consigliamo di evitare il primo pannello a causa della scarsa retroilluminazione e della gamma cromatica molto ristretta. La nostra unità di prova specifica è dotata della quarta opzione di cui sopra.
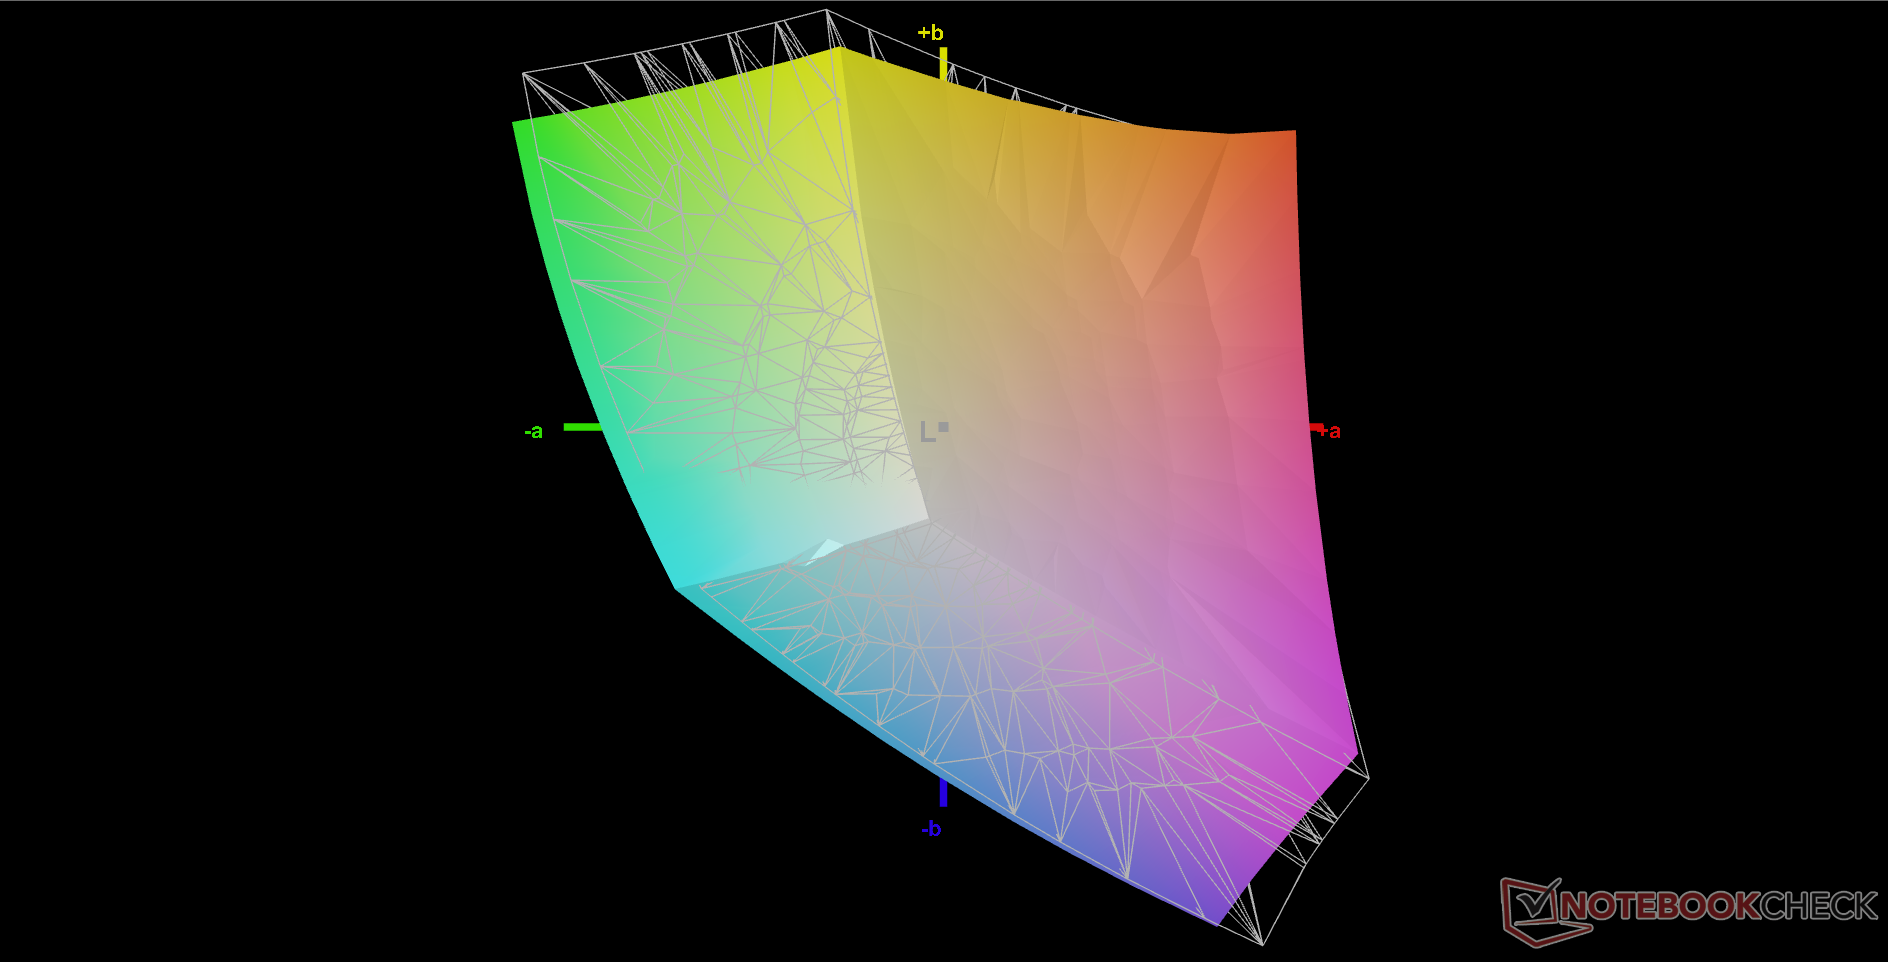
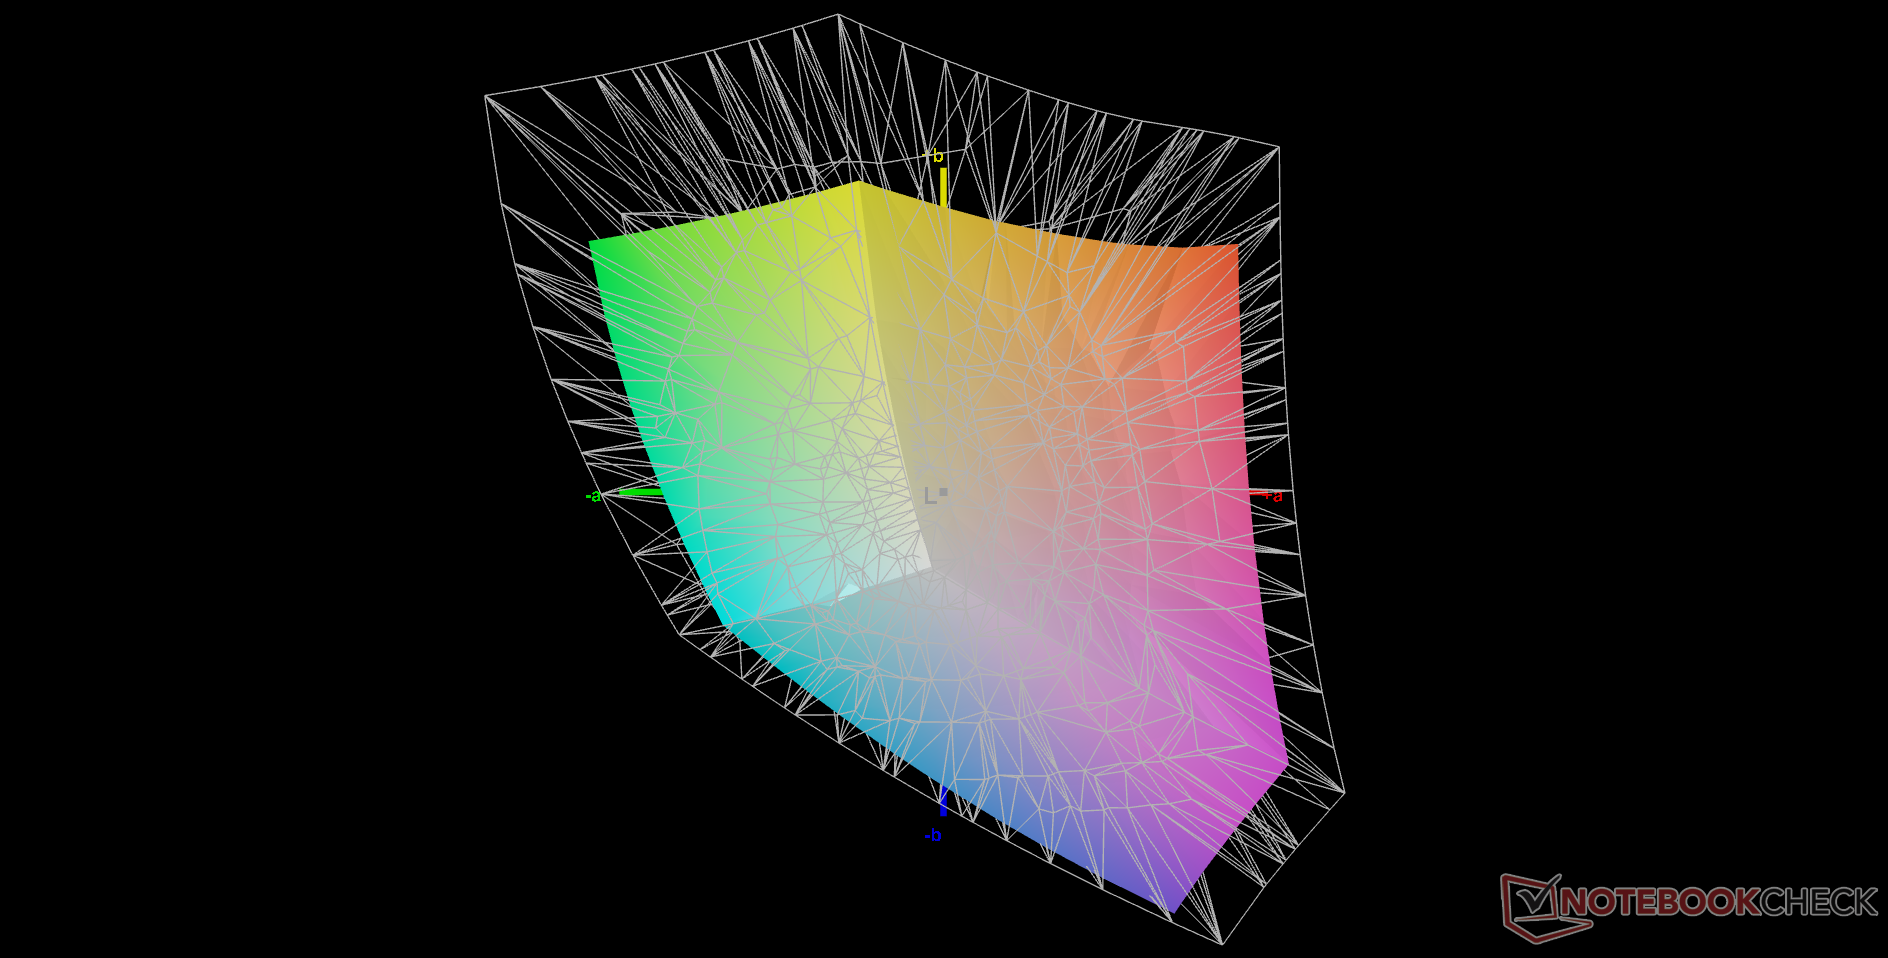
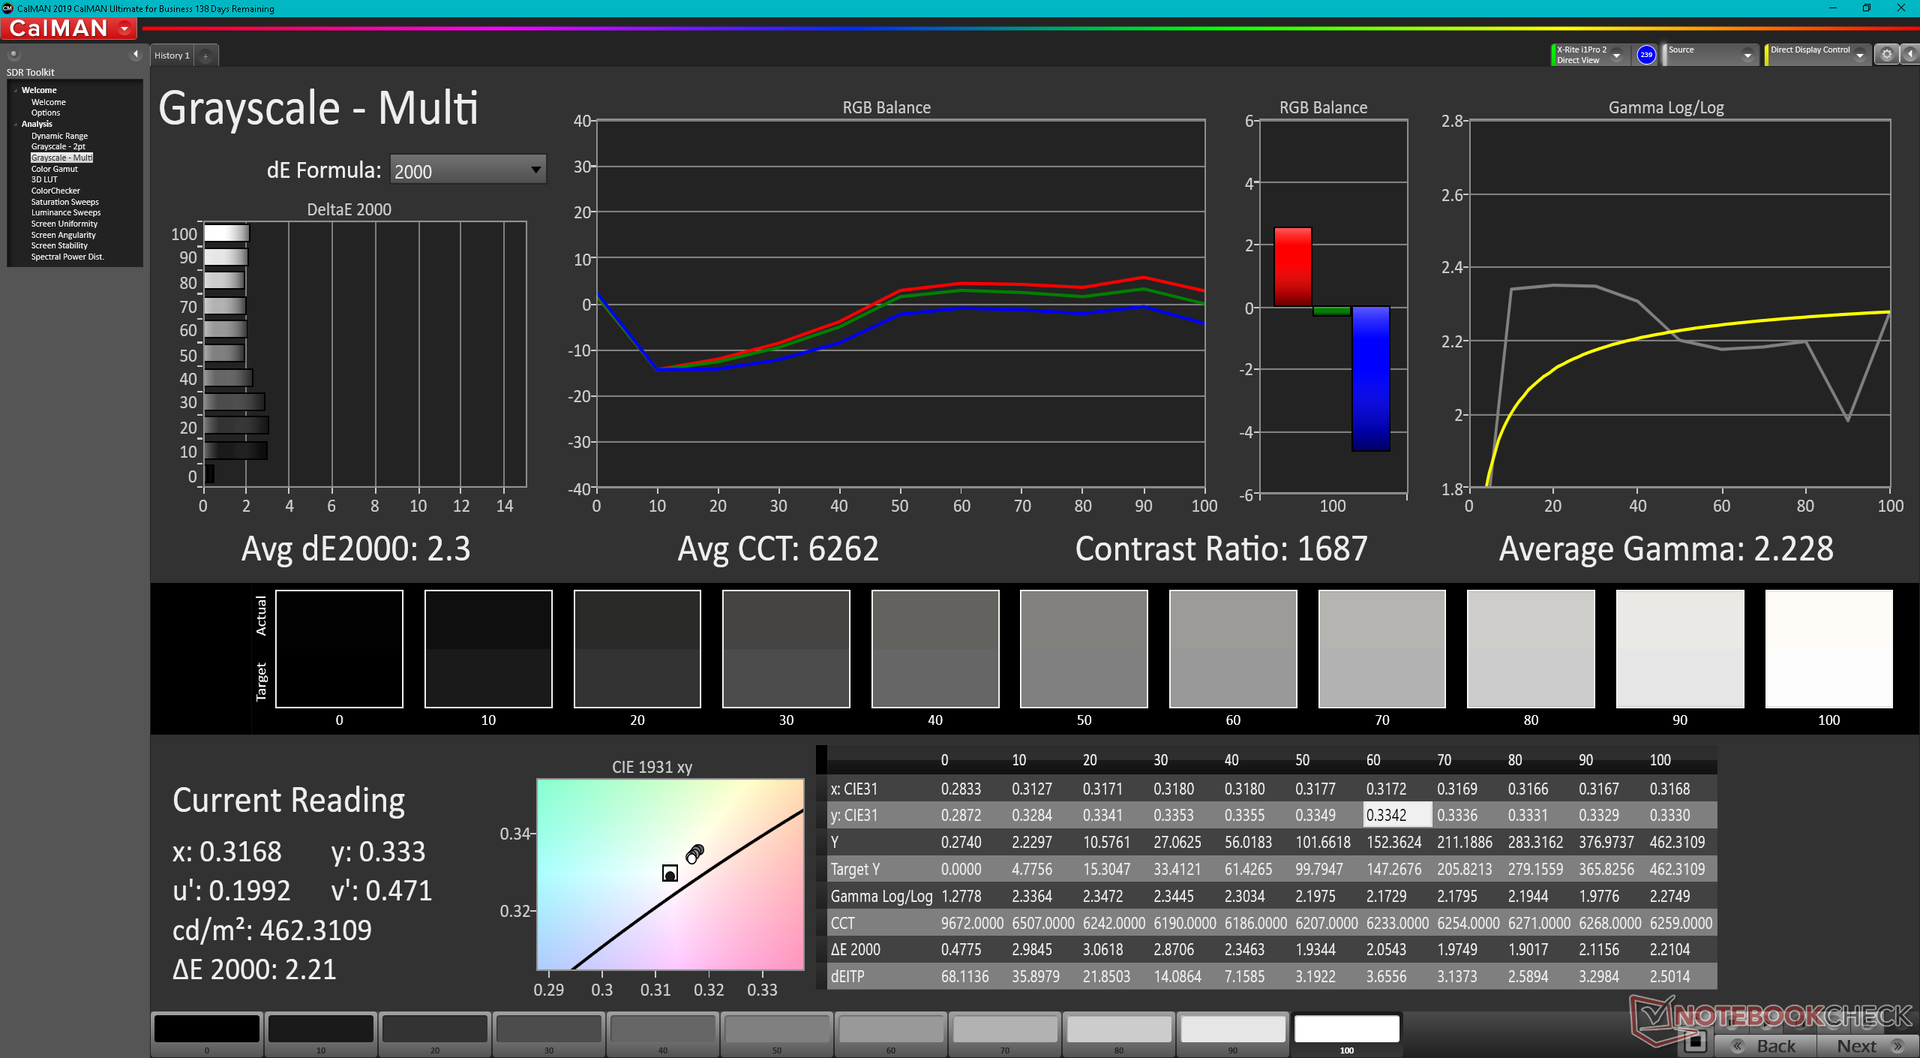
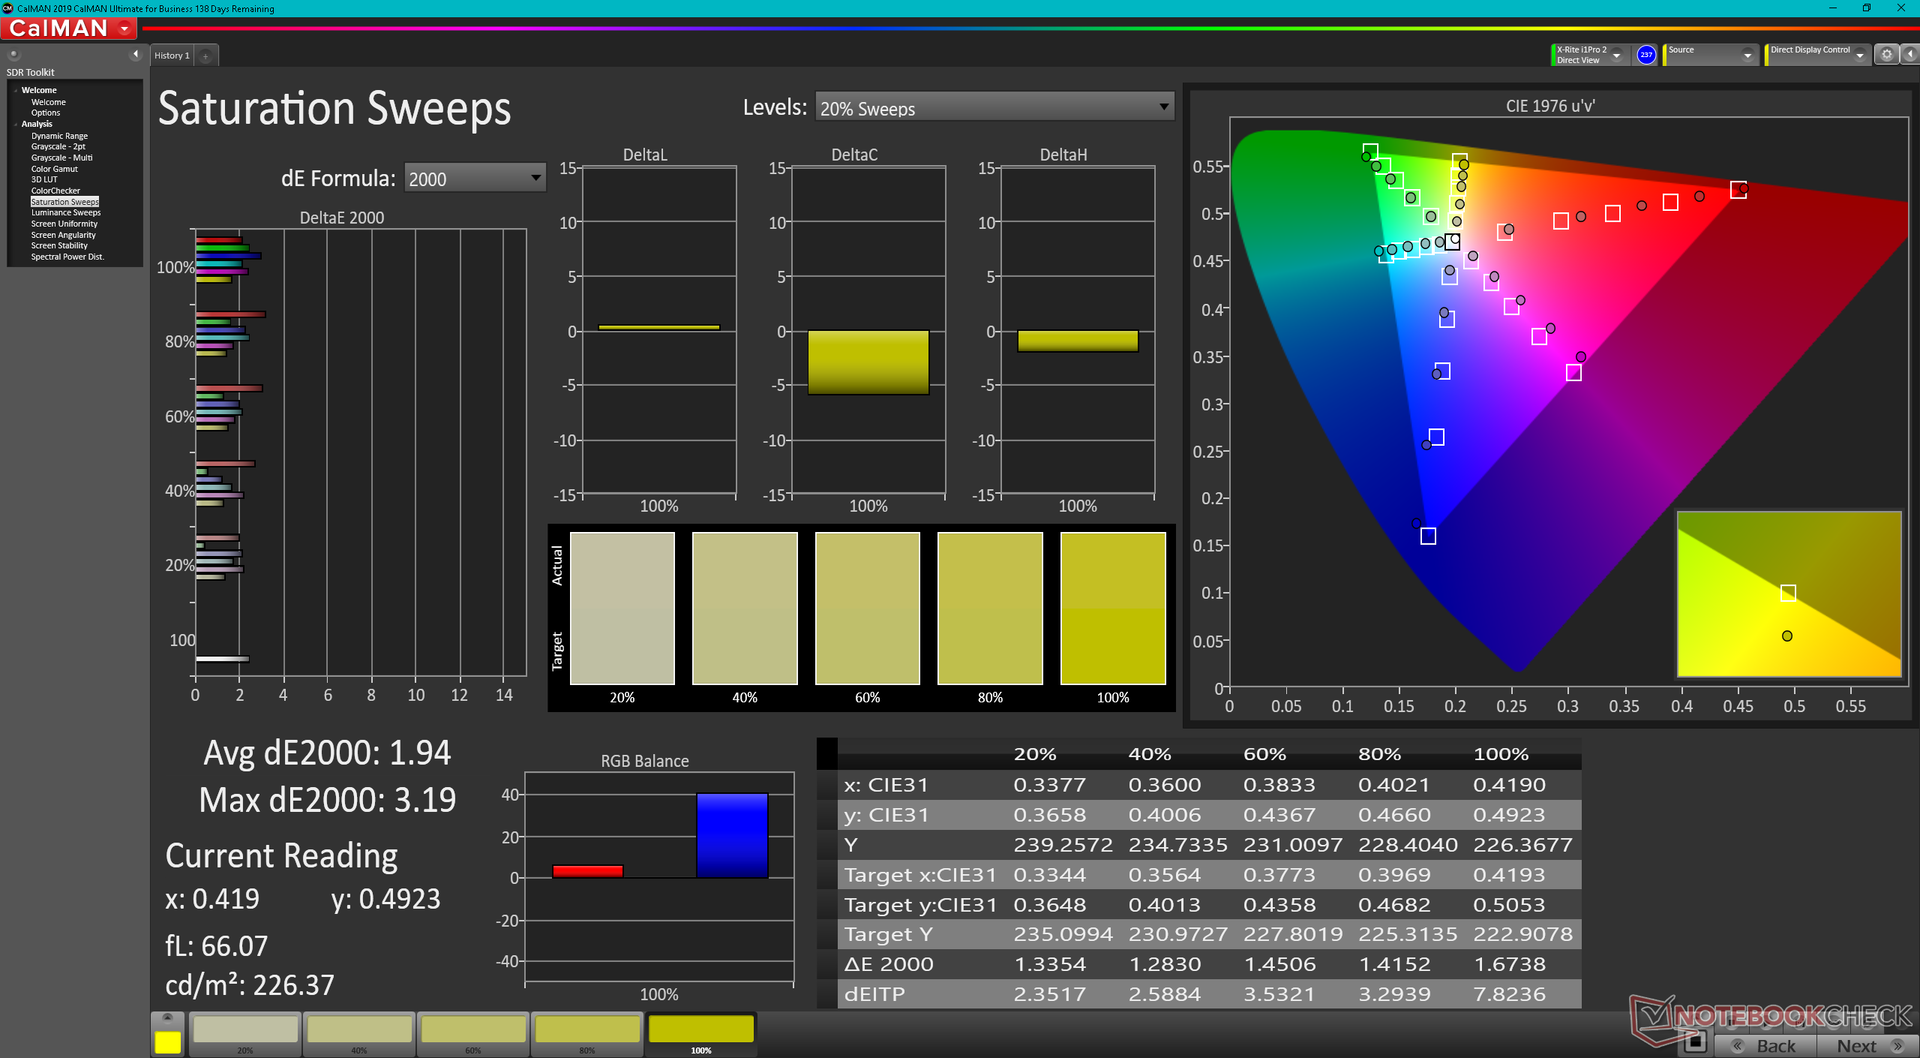
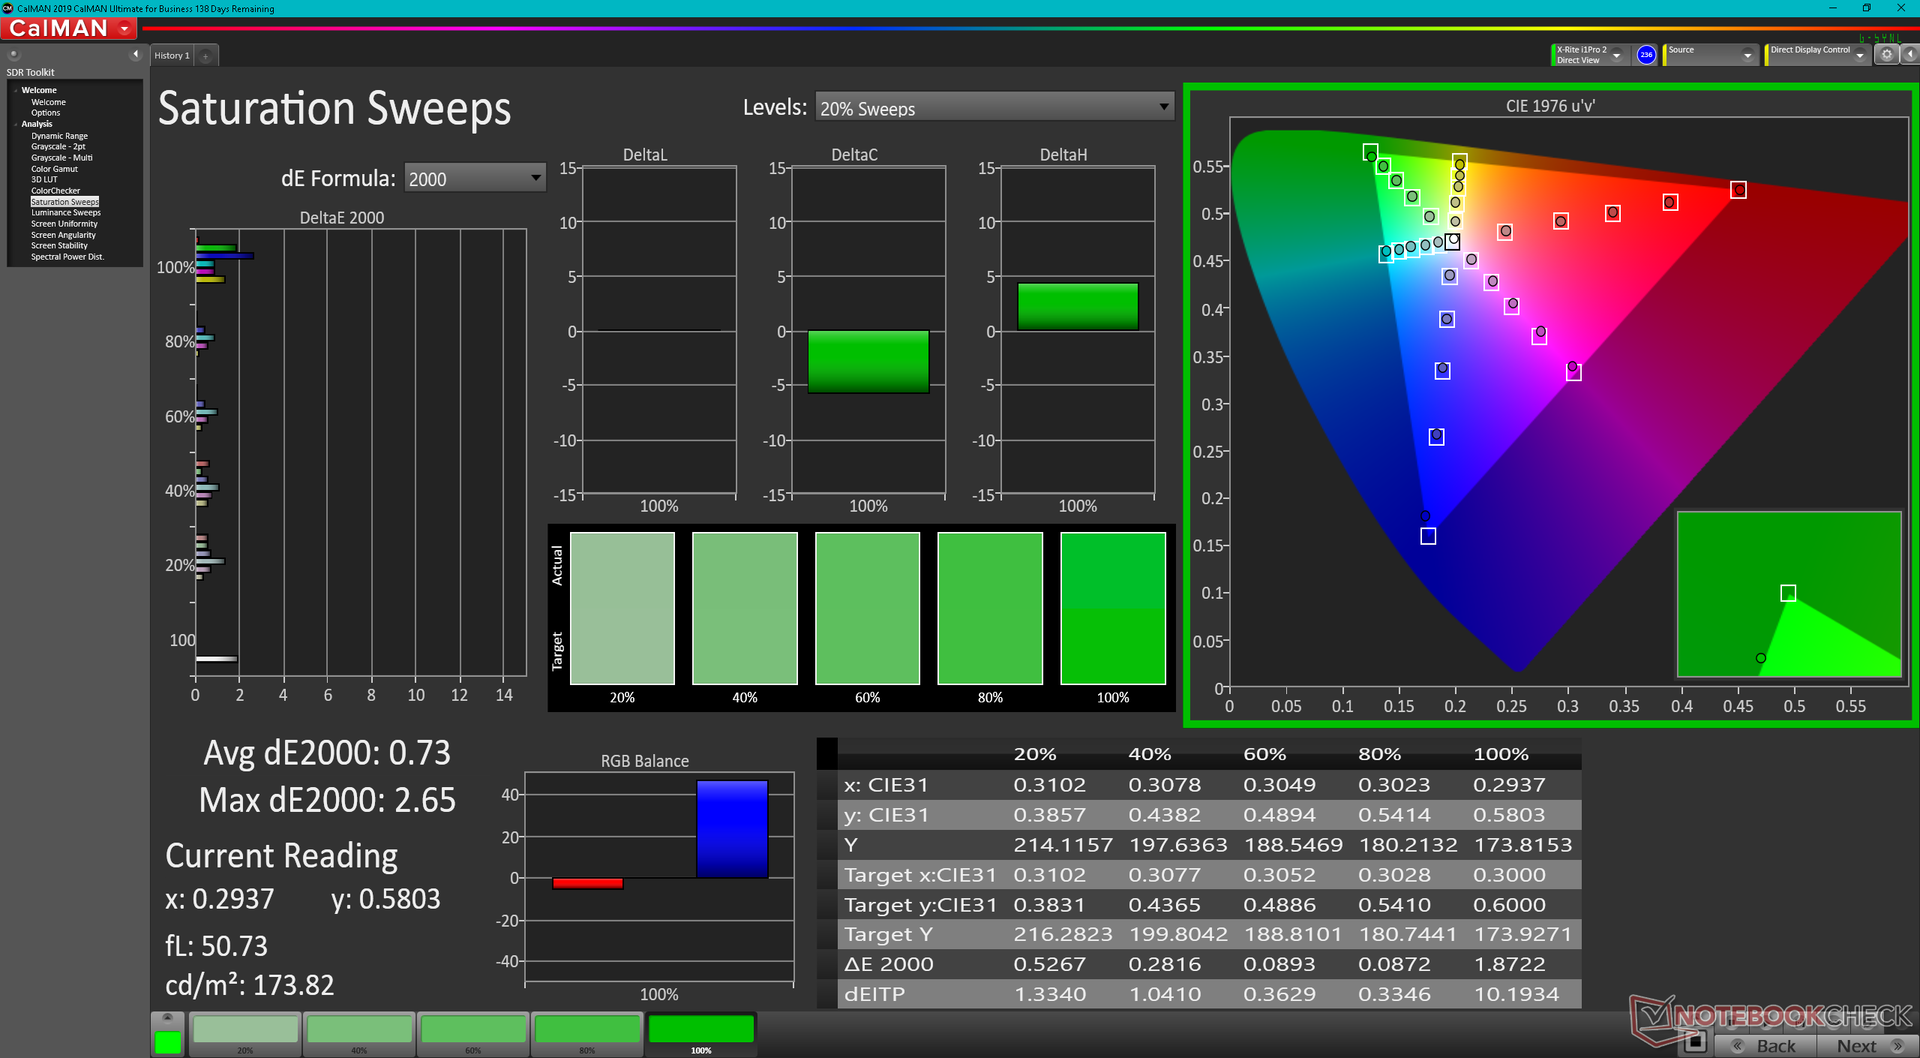
Le nostre misurazioni indipendenti mostrano una copertura sRGB leggermente inferiore, pari al 93%, ma una luminosità massima media leggermente superiore, pari a 445 nit. Si tratta comunque di un display di qualità, considerando l'elevato rapporto di contrasto di oltre 1000:1, ma speriamo che le future SKU includano OLED per tempi di risposta più rapidi in bianco e nero e grigio o almeno pannelli con una frequenza di aggiornamento più elevata per un'interfaccia utente più fluida.
| |||||||||||||||||||||||||
Distribuzione della luminosità: 89 %
Al centro con la batteria: 460.1 cd/m²
Contrasto: 1484:1 (Nero: 0.31 cd/m²)
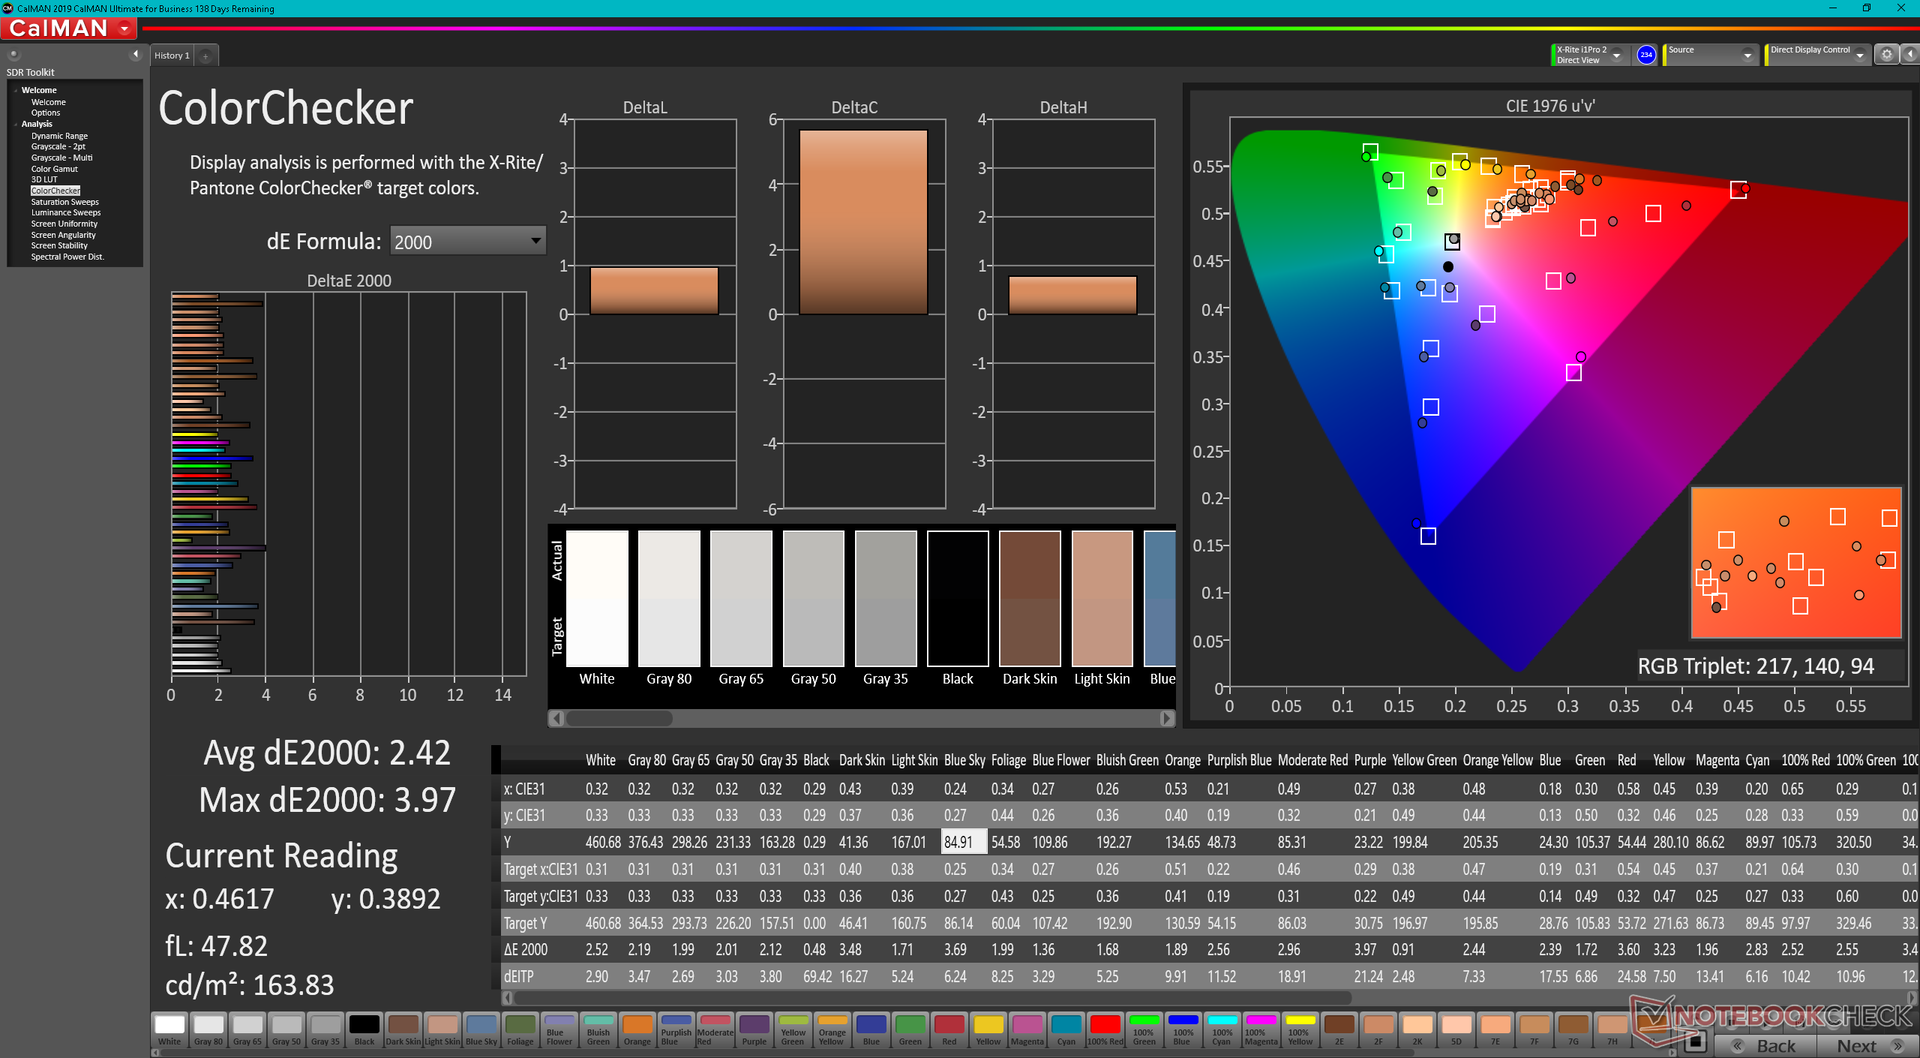
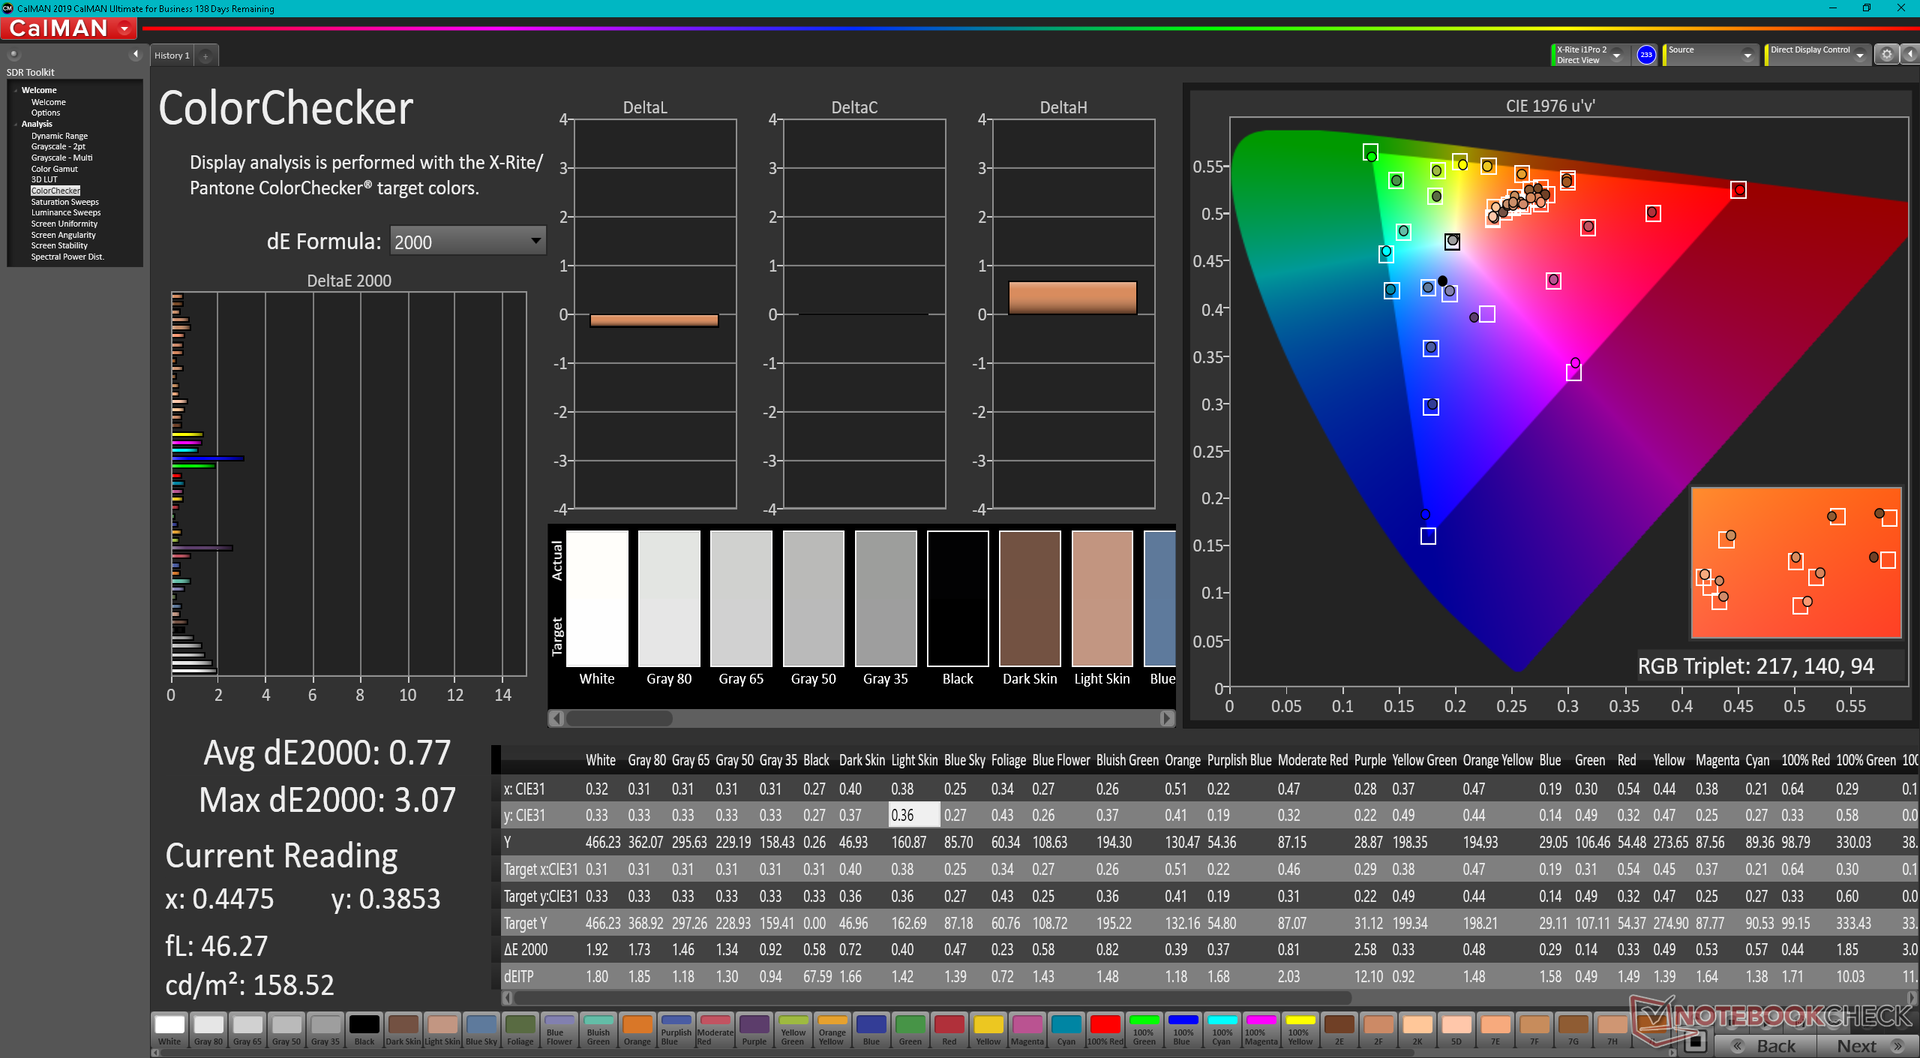
ΔE ColorChecker Calman: 2.42 | ∀{0.5-29.43 Ø4.72}
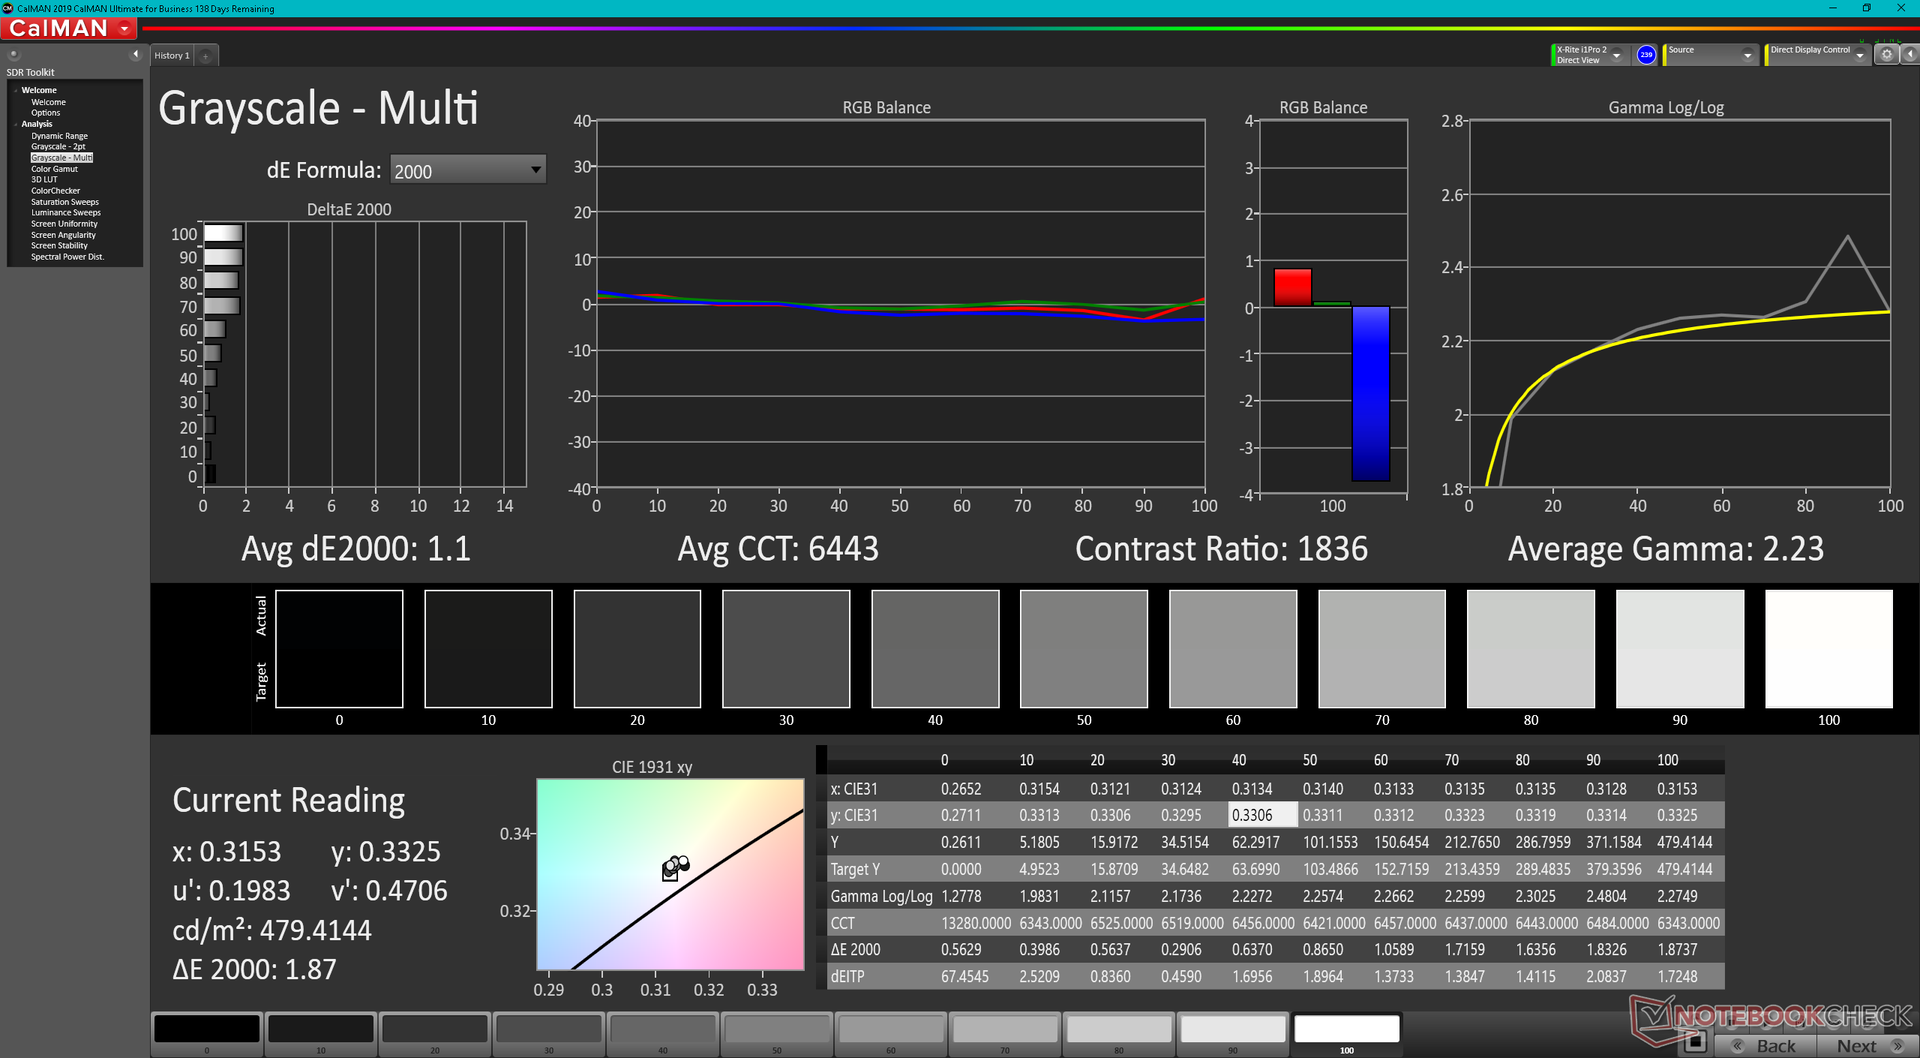
calibrated: 0.77
ΔE Greyscale Calman: 2.3 | ∀{0.09-98 Ø4.97}
68.2% AdobeRGB 1998 (Argyll 3D)
93.5% sRGB (Argyll 3D)
66.1% Display P3 (Argyll 3D)
Gamma: 2.23
CCT: 6262 K
| Dell Latitude 13 7330 LG Philips 133WF9, IPS, 1920x1080, 13.3" | Lenovo ThinkPad X13 Yoga 20SX0004GE N133HCG-GR3, IPS, 1920x1080, 13.3" | Framework Laptop 13.5 12th Gen Intel BOE CQ NE135FBM-N41, IPS, 2256x1504, 13.5" | Razer Book 13 FHD Sharp LQ134N1JW48, IPS, 1920x1200, 13.4" | Dell Latitude 7310 AU Optronics B133HAN, IPS, 1920x1080, 13.3" | Microsoft Surface Laptop 4 13 i7 LQ135P1JX51, IPS, 2256x1504, 13.5" | |
|---|---|---|---|---|---|---|
| Display | 3% | 5% | 6% | 7% | 0% | |
| Display P3 Coverage (%) | 66.1 | 67.2 2% | 69.9 6% | 70.1 6% | 71.8 9% | 64.7 -2% |
| sRGB Coverage (%) | 93.5 | 98.1 5% | 99.4 6% | 99.3 6% | 99.3 6% | 97.2 4% |
| AdobeRGB 1998 Coverage (%) | 68.2 | 69 1% | 71.1 4% | 71.6 5% | 72.4 6% | 66.9 -2% |
| Response Times | -6% | 18% | -24% | 10% | -32% | |
| Response Time Grey 50% / Grey 80% * (ms) | 48.4 ? | 56 ? -16% | 34.7 ? 28% | 56.8 ? -17% | 40.8 ? 16% | 62.8 ? -30% |
| Response Time Black / White * (ms) | 29.6 ? | 28 ? 5% | 27.5 ? 7% | 38.8 ? -31% | 28.8 ? 3% | 39.8 ? -34% |
| PWM Frequency (Hz) | 2475 ? | 21930 ? | ||||
| Screen | 2% | -25% | -9% | -9% | -11% | |
| Brightness middle (cd/m²) | 460.1 | 401 -13% | 449.6 -2% | 545.3 19% | 332.7 -28% | 413 -10% |
| Brightness (cd/m²) | 445 | 383 -14% | 431 -3% | 507 14% | 329 -26% | 400 -10% |
| Brightness Distribution (%) | 89 | 91 2% | 90 1% | 88 -1% | 89 0% | 94 6% |
| Black Level * (cd/m²) | 0.31 | 0.16 48% | 0.31 -0% | 0.31 -0% | 0.25 19% | 0.29 6% |
| Contrast (:1) | 1484 | 2506 69% | 1450 -2% | 1759 19% | 1331 -10% | 1424 -4% |
| Colorchecker dE 2000 * | 2.42 | 2.6 -7% | 2.76 -14% | 1.39 43% | 2.15 11% | 2.8 -16% |
| Colorchecker dE 2000 max. * | 3.97 | 4.2 -6% | 7.96 -101% | 2.61 34% | 3.89 2% | 7.2 -81% |
| Colorchecker dE 2000 calibrated * | 0.77 | 0.9 -17% | 0.58 25% | 2.72 -253% | 1.09 -42% | 0.8 -4% |
| Greyscale dE 2000 * | 2.3 | 3.3 -43% | 5.2 -126% | 1.3 43% | 2.5 -9% | 1.9 17% |
| Gamma | 2.23 99% | 2.01 109% | 2.23 99% | 2.2 100% | 2.3 96% | 2.12 104% |
| CCT | 6262 104% | 6076 107% | 6475 100% | 6476 100% | 6347 102% | 6510 100% |
| Color Space (Percent of AdobeRGB 1998) (%) | 62.7 | 65.9 | 64.1 | 61.6 | ||
| Color Space (Percent of sRGB) (%) | 98.1 | 99.6 | 99.4 | 97.2 | ||
| Media totale (Programma / Settaggio) | -0% /
1% | -1% /
-12% | -9% /
-8% | 3% /
-3% | -14% /
-11% |
* ... Meglio usare valori piccoli
Il display è ben calibrato, con valori medi di scala di grigi e deltaE rispettivamente di 2,3 e 2,42, come mostrano i risultati di CalMAN. Calibrando ulteriormente il display con un colorimetro X-Rite, i valori medi del DeltaE sarebbero inferiori a 1.
Tempi di risposta del Display
| ↔ Tempi di risposta dal Nero al Bianco | ||
|---|---|---|
| 29.6 ms ... aumenta ↗ e diminuisce ↘ combinato | ↗ 14.8 ms Incremento | 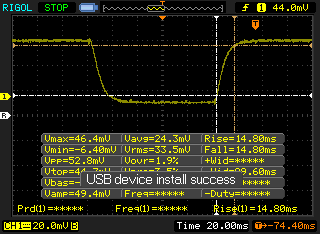 |
| ↘ 14.8 ms Calo | ||
| Lo schermo mostra tempi di risposta relativamente lenti nei nostri tests e potrebbe essere troppo lento per i gamers. In confronto, tutti i dispositivi di test variano da 0.1 (minimo) a 240 (massimo) ms. » 79 % di tutti i dispositivi è migliore. Questo significa che i tempi di risposta rilevati sono peggiori rispetto alla media di tutti i dispositivi testati (19.8 ms). | ||
| ↔ Tempo di risposta dal 50% Grigio all'80% Grigio | ||
| 48.4 ms ... aumenta ↗ e diminuisce ↘ combinato | ↗ 23.6 ms Incremento | 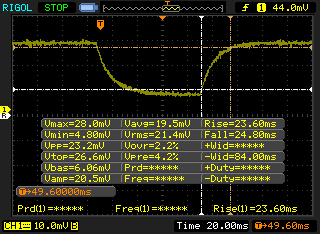 |
| ↘ 24.8 ms Calo | ||
| Lo schermo mostra tempi di risposta lenti nei nostri tests e sarà insoddisfacente per i gamers. In confronto, tutti i dispositivi di test variano da 0.165 (minimo) a 636 (massimo) ms. » 84 % di tutti i dispositivi è migliore. Questo significa che i tempi di risposta rilevati sono peggiori rispetto alla media di tutti i dispositivi testati (31 ms). | ||
Sfarfallio dello schermo / PWM (Pulse-Width Modulation)
| flickering dello schermo / PWM non rilevato | 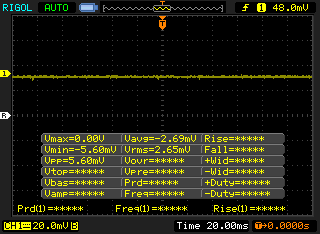 | ||
In confronto: 52 % di tutti i dispositivi testati non utilizza PWM per ridurre la luminosita' del display. Se è rilevato PWM, una media di 7781 (minimo: 5 - massimo: 343500) Hz è stata rilevata. | |||
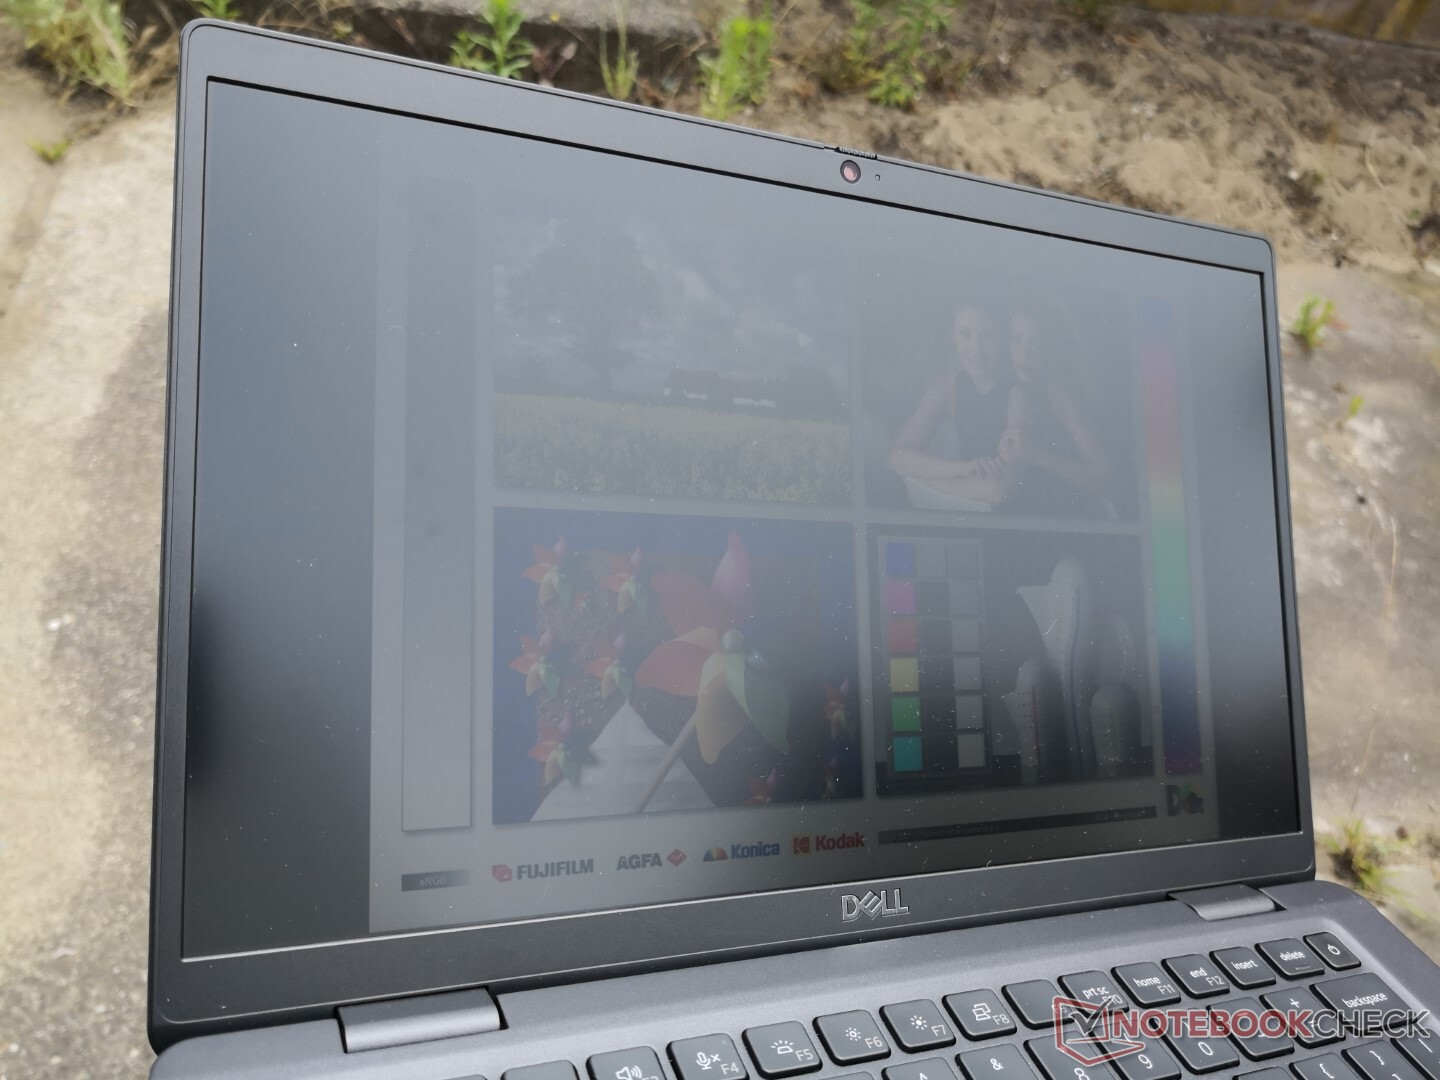
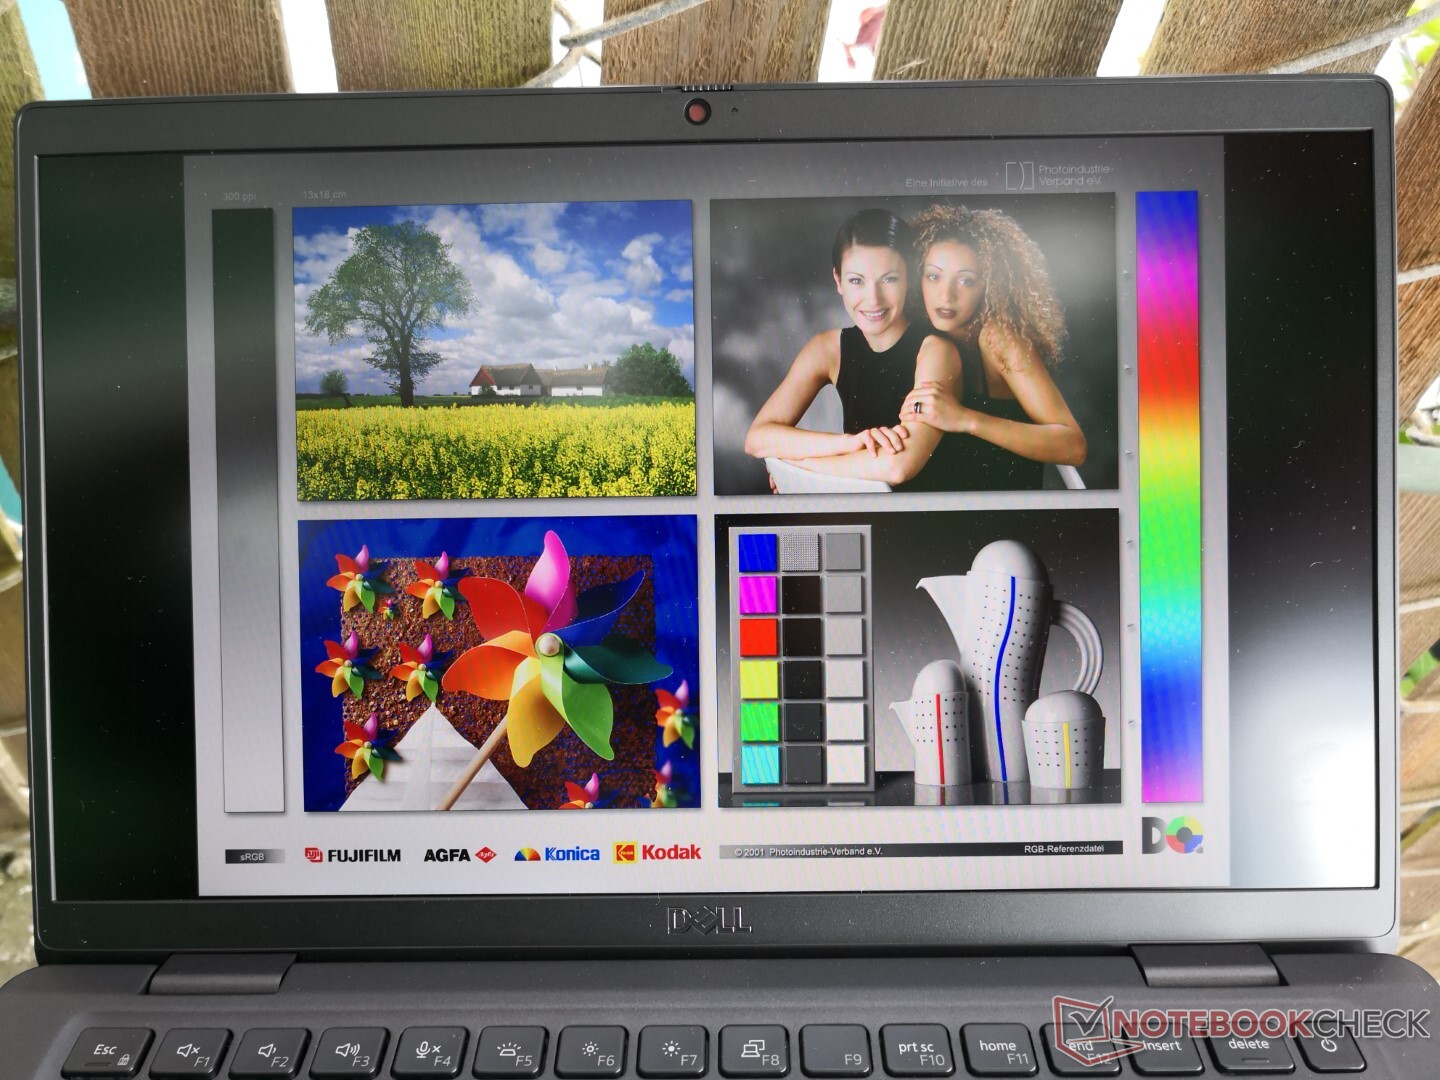
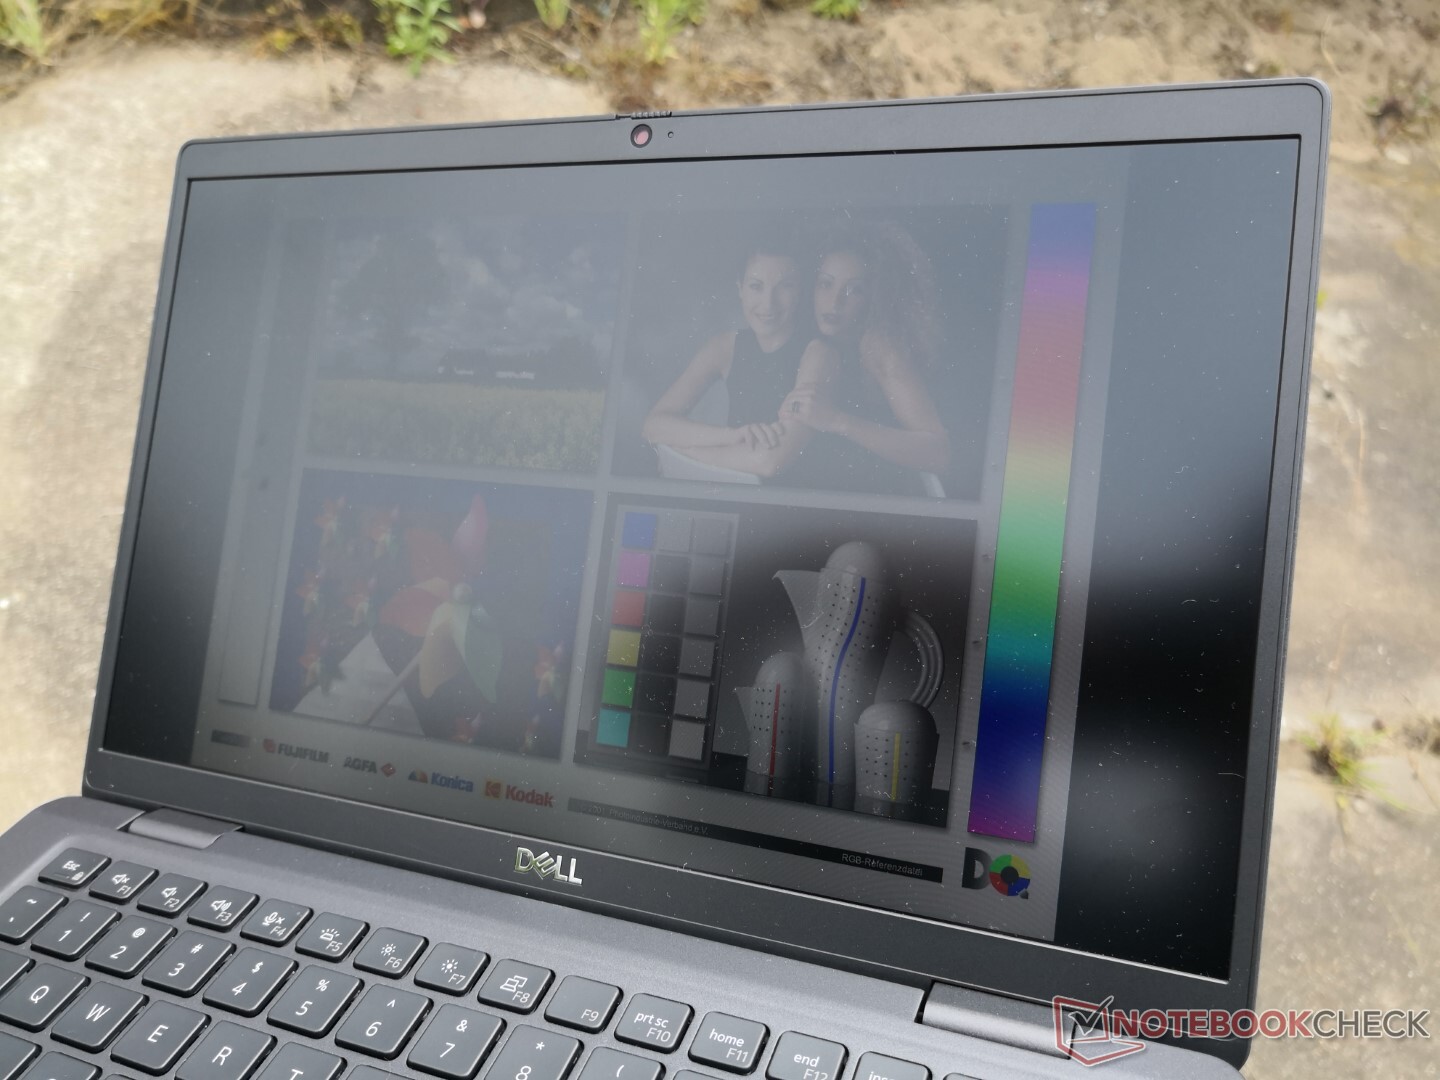
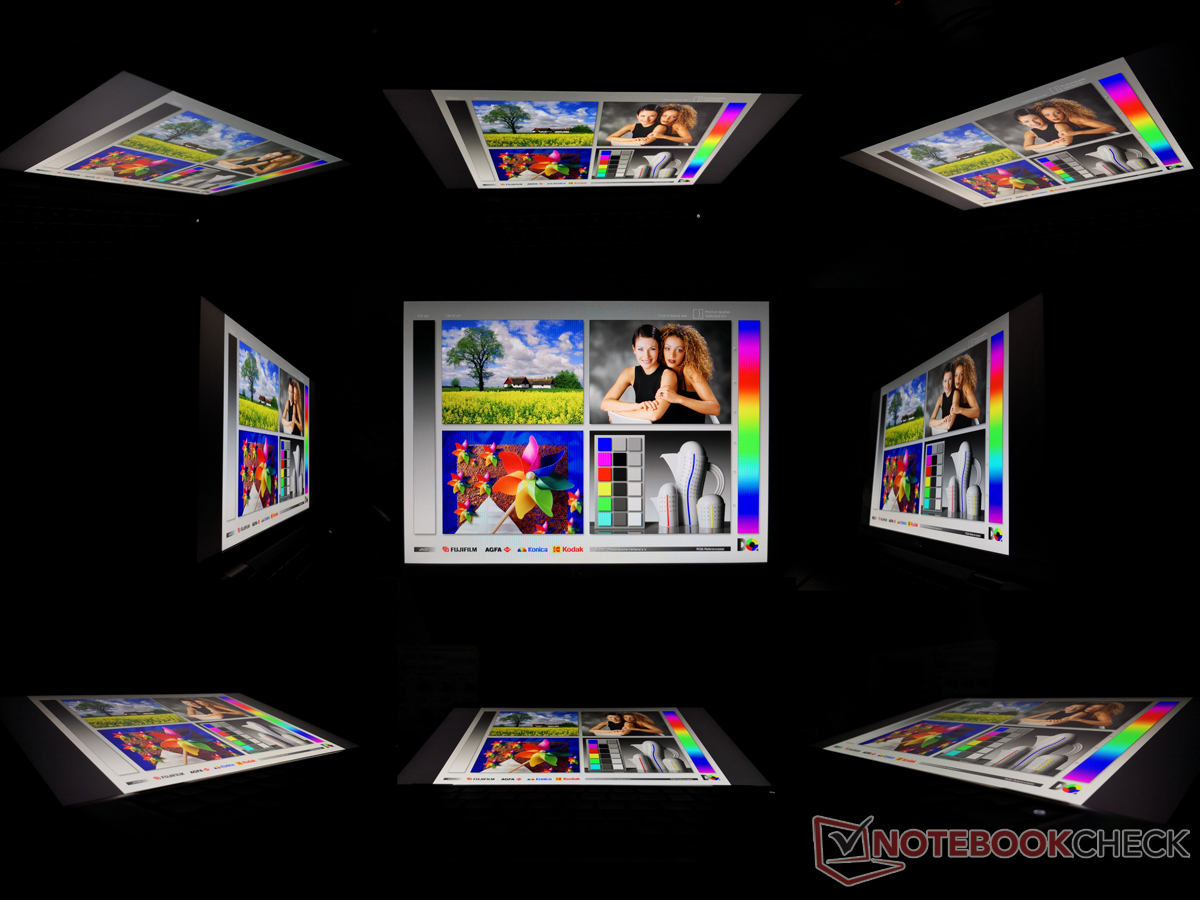
La visibilità all'aperto è abbastanza buona se si lavora all'ombra, grazie al display relativamente luminoso da 450 nit e al rivestimento opaco che riduce i riflessi. Tuttavia, non è ancora abbastanza luminoso per una visione confortevole in giornate soleggiate o luminose e nuvolose.
Prestazioni: il Core i7-1265U convince
Condizioni di test
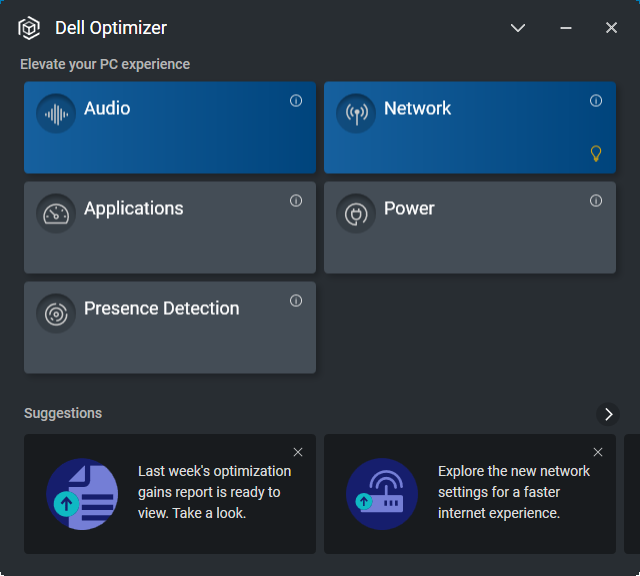
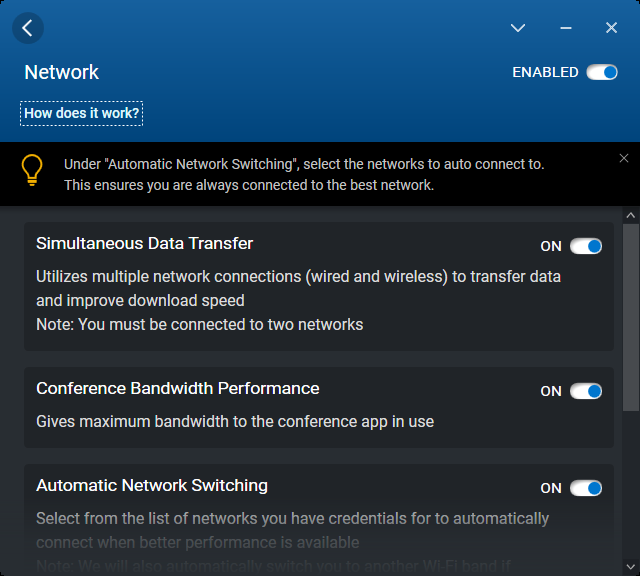
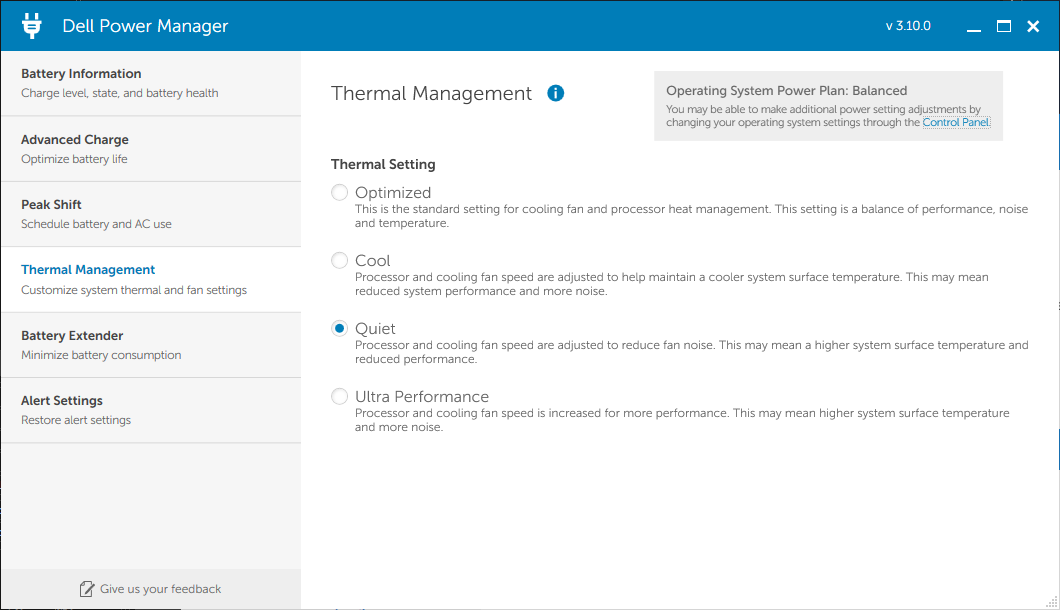
Abbiamo impostato la nostra unità in modalità Performance e Ultra Performance rispettivamente su Windows e sul software Dell Power Manager, prima di eseguire i benchmark riportati di seguito. Si consiglia di familiarizzare con le applicazioni Dell Power Manager, Optimizer e Command preinstallate, in quanto fungono da hub per la gestione degli aggiornamenti e delle funzioni specifiche del modello.

Processore
Dopo essere stato deluso con il Core i5-1235Ule nostre speranze non erano molto alte per il Core i7-1265U. Fortunatamente, l'i7-1265U si sta dimostrando un vero demone della velocità, nonostante appartenga alla famiglia U-series. Le prestazioni single-thread e multi-thread sono superiori del 20% e del 60% rispetto alla media dei portatili del nostro database equipaggiati con il Core i7-1165G7 di ultima generazione Core i7-1165G7. In effetti, la CPU è solo dal 10 al 25% in meno rispetto al più esigente Core i7-1260P. Alcune CPU AMD di fascia alta, come il Ryzen 7 5700U o5800U possono eguagliare o superare il Core i7-1265U nei carichi di lavoro multi-thread, ma sono ancora indietro nelle operazioni single-thread
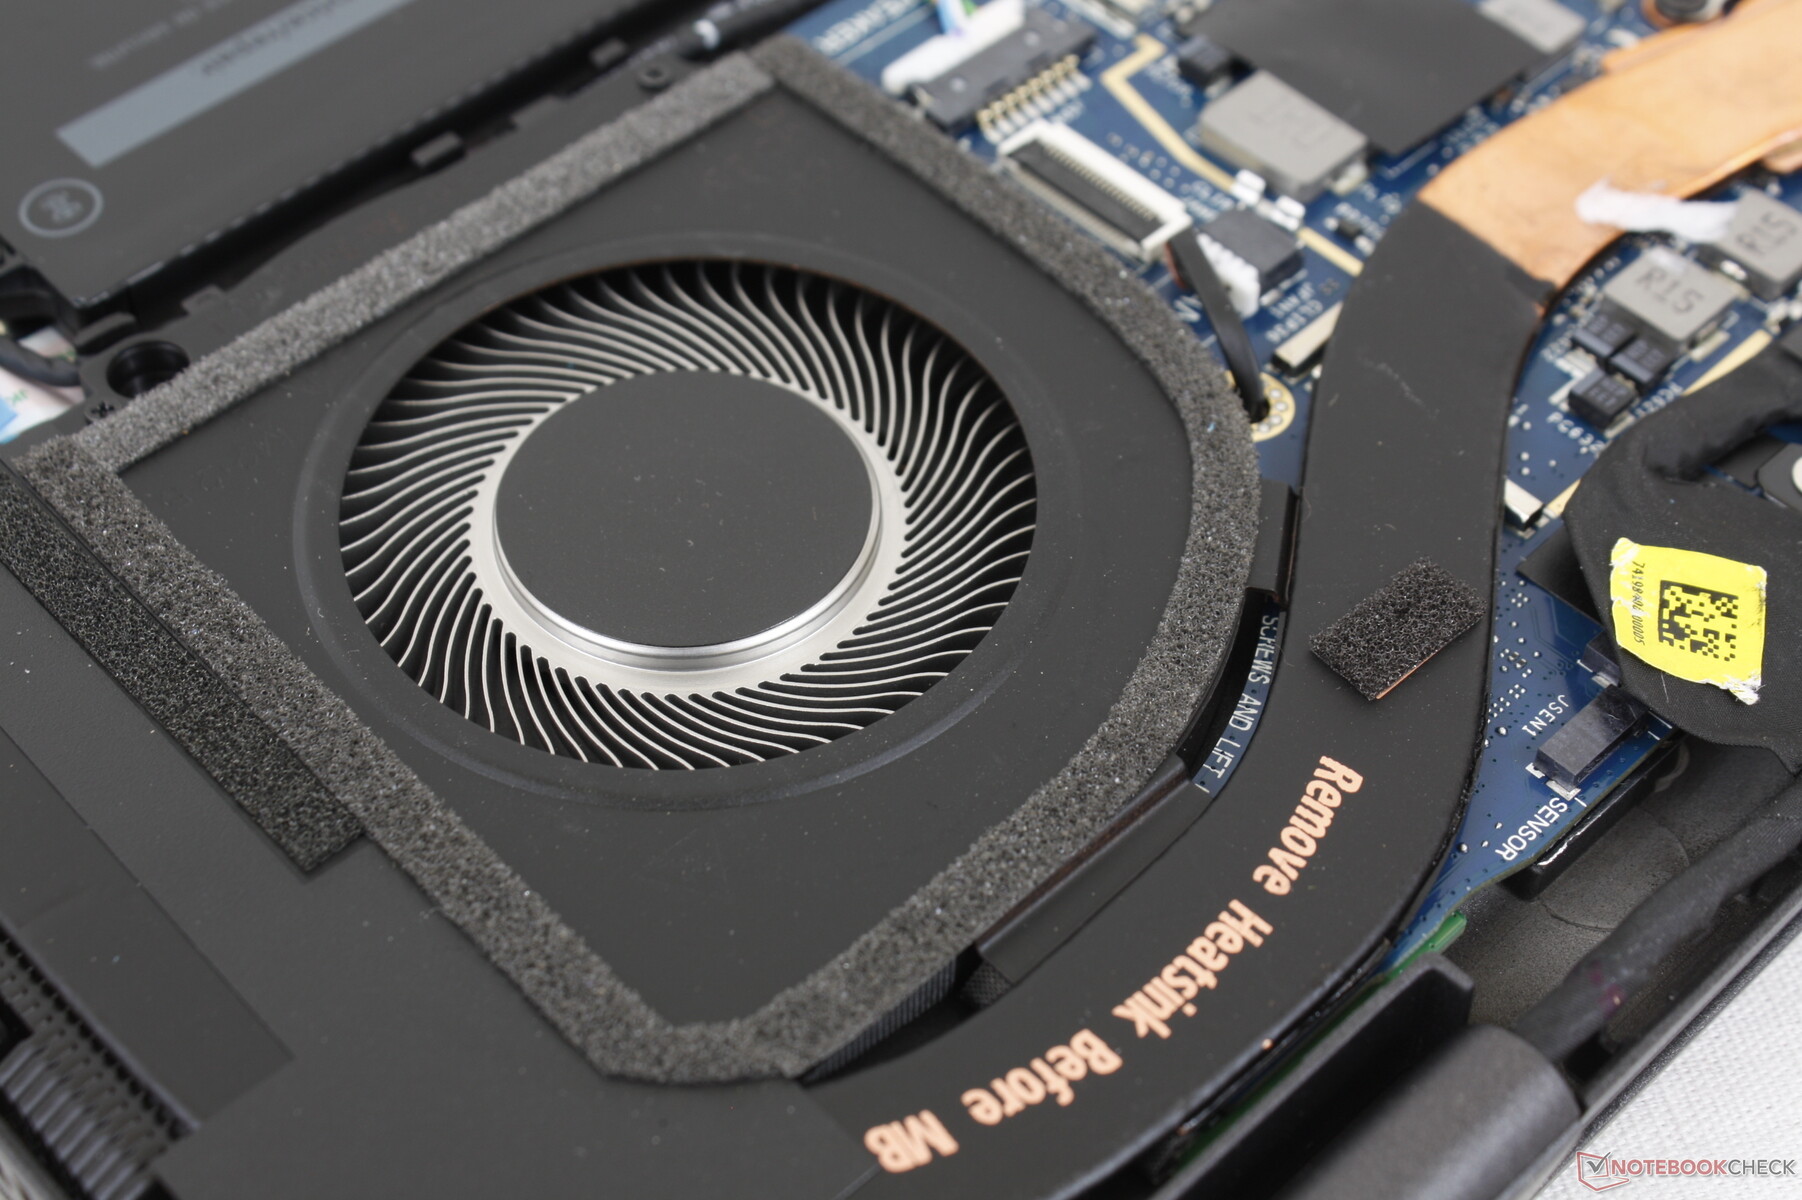
La sostenibilità delle prestazioni è buona, ma potrebbe essere decisamente migliore. L'esecuzione di CineBench R15 xT in loop mostra un punteggio iniziale di 1379 punti prima di scendere costantemente e stabilizzarsi a circa 1000 punti, il che rappresenta un calo delle prestazioni di circa il 27%. Il potenziale di raffreddamento limitato della piccola soluzione di raffreddamento probabilmente impedisce alla CPU di funzionare a velocità di clock più elevate per periodi più lunghi.
Cinebench R15 Multi Loop
Cinebench R23: Multi Core | Single Core
Cinebench R15: CPU Multi 64Bit | CPU Single 64Bit
Blender: v2.79 BMW27 CPU
7-Zip 18.03: 7z b 4 | 7z b 4 -mmt1
Geekbench 5.5: Multi-Core | Single-Core
HWBOT x265 Benchmark v2.2: 4k Preset
LibreOffice : 20 Documents To PDF
R Benchmark 2.5: Overall mean
| Cinebench R23 / Multi Core | |
| Framework Laptop 13.5 12th Gen Intel | |
| MSI Summit E14 Flip Evo A12MT | |
| Dell Latitude 13 7330 | |
| HP Pavilion Aero 13 be0097nr | |
| Asus ZenBook 13 OLED UM325UA | |
| Media Intel Core i7-1265U (4332 - 9219, n=10) | |
| Microsoft Surface Laptop 4 13 Ryzen 5 | |
| Razer Book 13 FHD | |
| Samsung Galaxy Book2 Pro 13 NP930XED-KA1DE | |
| Media Intel Core i7-1165G7 (2525 - 6862, n=64) | |
| Gateway Ultra Slim 14.1 GWTC51427 | |
| Dell Latitude 5320-TM4V2 | |
| Cinebench R23 / Single Core | |
| MSI Summit E14 Flip Evo A12MT | |
| Dell Latitude 13 7330 | |
| Framework Laptop 13.5 12th Gen Intel | |
| Media Intel Core i7-1265U (1144 - 1820, n=10) | |
| Gateway Ultra Slim 14.1 GWTC51427 | |
| Media Intel Core i7-1165G7 (1110 - 1539, n=59) | |
| HP Pavilion Aero 13 be0097nr | |
| Dell Latitude 5320-TM4V2 | |
| Asus ZenBook 13 OLED UM325UA | |
| Microsoft Surface Laptop 4 13 Ryzen 5 | |
| Samsung Galaxy Book2 Pro 13 NP930XED-KA1DE | |
Cinebench R23: Multi Core | Single Core
Cinebench R15: CPU Multi 64Bit | CPU Single 64Bit
Blender: v2.79 BMW27 CPU
7-Zip 18.03: 7z b 4 | 7z b 4 -mmt1
Geekbench 5.5: Multi-Core | Single-Core
HWBOT x265 Benchmark v2.2: 4k Preset
LibreOffice : 20 Documents To PDF
R Benchmark 2.5: Overall mean
* ... Meglio usare valori piccoli
AIDA64: FP32 Ray-Trace | FPU Julia | CPU SHA3 | CPU Queen | FPU SinJulia | FPU Mandel | CPU AES | CPU ZLib | FP64 Ray-Trace | CPU PhotoWorxx
| Performance rating | |
| Microsoft Surface Laptop 4 13 Ryzen 5 | |
| Framework Laptop 13.5 12th Gen Intel | |
| Dell Latitude 13 7330 | |
| Dell Latitude 7310 | |
| Lenovo ThinkPad X13 Yoga 20SX0004GE | |
| AIDA64 / FP32 Ray-Trace | |
| Microsoft Surface Laptop 4 13 Ryzen 5 | |
| Dell Latitude 13 7330 | |
| Framework Laptop 13.5 12th Gen Intel | |
| Dell Latitude 7310 | |
| Lenovo ThinkPad X13 Yoga 20SX0004GE | |
| AIDA64 / FPU Julia | |
| Microsoft Surface Laptop 4 13 Ryzen 5 | |
| Dell Latitude 13 7330 | |
| Framework Laptop 13.5 12th Gen Intel | |
| Dell Latitude 7310 | |
| Lenovo ThinkPad X13 Yoga 20SX0004GE | |
| AIDA64 / CPU SHA3 | |
| Dell Latitude 13 7330 | |
| Framework Laptop 13.5 12th Gen Intel | |
| Microsoft Surface Laptop 4 13 Ryzen 5 | |
| Lenovo ThinkPad X13 Yoga 20SX0004GE | |
| Dell Latitude 7310 | |
| AIDA64 / CPU Queen | |
| Framework Laptop 13.5 12th Gen Intel | |
| Microsoft Surface Laptop 4 13 Ryzen 5 | |
| Dell Latitude 13 7330 | |
| Dell Latitude 7310 | |
| Lenovo ThinkPad X13 Yoga 20SX0004GE | |
| AIDA64 / FPU SinJulia | |
| Microsoft Surface Laptop 4 13 Ryzen 5 | |
| Framework Laptop 13.5 12th Gen Intel | |
| Dell Latitude 13 7330 | |
| Dell Latitude 7310 | |
| Lenovo ThinkPad X13 Yoga 20SX0004GE | |
| AIDA64 / FPU Mandel | |
| Microsoft Surface Laptop 4 13 Ryzen 5 | |
| Dell Latitude 13 7330 | |
| Framework Laptop 13.5 12th Gen Intel | |
| Dell Latitude 7310 | |
| Lenovo ThinkPad X13 Yoga 20SX0004GE | |
| AIDA64 / CPU AES | |
| Framework Laptop 13.5 12th Gen Intel | |
| Dell Latitude 13 7330 | |
| Microsoft Surface Laptop 4 13 Ryzen 5 | |
| Lenovo ThinkPad X13 Yoga 20SX0004GE | |
| Dell Latitude 7310 | |
| AIDA64 / CPU ZLib | |
| Framework Laptop 13.5 12th Gen Intel | |
| Microsoft Surface Laptop 4 13 Ryzen 5 | |
| Dell Latitude 13 7330 | |
| Lenovo ThinkPad X13 Yoga 20SX0004GE | |
| Dell Latitude 7310 | |
| AIDA64 / FP64 Ray-Trace | |
| Microsoft Surface Laptop 4 13 Ryzen 5 | |
| Dell Latitude 13 7330 | |
| Framework Laptop 13.5 12th Gen Intel | |
| Dell Latitude 7310 | |
| Lenovo ThinkPad X13 Yoga 20SX0004GE | |
| AIDA64 / CPU PhotoWorxx | |
| Framework Laptop 13.5 12th Gen Intel | |
| Dell Latitude 13 7330 | |
| Dell Latitude 7310 | |
| Microsoft Surface Laptop 4 13 Ryzen 5 | |
| Lenovo ThinkPad X13 Yoga 20SX0004GE | |
Prestazioni del sistema
I punteggi di PCMark sono superiori a quelli di molti altri portatili business che utilizzano CPU di ultima generazione o più vecchie, come ilMicrosoft Surface Laptop 4 o soprattutto il Latitude 7310. IlRazer Book 13 si avvicina molto grazie alla sua unità SSD più veloce e alle prestazioni della grafica integrata.
CrossMark: Overall | Productivity | Creativity | Responsiveness
| PCMark 10 / Score | |
| Framework Laptop 13.5 12th Gen Intel | |
| Media Intel Core i7-1265U, Intel Iris Xe Graphics G7 96EUs (4753 - 5766, n=7) | |
| Dell Latitude 13 7330 | |
| Razer Book 13 FHD | |
| Microsoft Surface Laptop 4 13 Ryzen 5 | |
| Dell Latitude 7310 | |
| Lenovo ThinkPad X13 Yoga 20SX0004GE | |
| PCMark 10 / Essentials | |
| Framework Laptop 13.5 12th Gen Intel | |
| Dell Latitude 13 7330 | |
| Media Intel Core i7-1265U, Intel Iris Xe Graphics G7 96EUs (9278 - 11418, n=7) | |
| Razer Book 13 FHD | |
| Lenovo ThinkPad X13 Yoga 20SX0004GE | |
| Dell Latitude 7310 | |
| Microsoft Surface Laptop 4 13 Ryzen 5 | |
| PCMark 10 / Productivity | |
| Dell Latitude 7310 | |
| Framework Laptop 13.5 12th Gen Intel | |
| Dell Latitude 13 7330 | |
| Lenovo ThinkPad X13 Yoga 20SX0004GE | |
| Razer Book 13 FHD | |
| Media Intel Core i7-1265U, Intel Iris Xe Graphics G7 96EUs (5828 - 7311, n=7) | |
| Microsoft Surface Laptop 4 13 Ryzen 5 | |
| PCMark 10 / Digital Content Creation | |
| Framework Laptop 13.5 12th Gen Intel | |
| Media Intel Core i7-1265U, Intel Iris Xe Graphics G7 96EUs (5127 - 6330, n=7) | |
| Razer Book 13 FHD | |
| Dell Latitude 13 7330 | |
| Microsoft Surface Laptop 4 13 Ryzen 5 | |
| Dell Latitude 7310 | |
| Lenovo ThinkPad X13 Yoga 20SX0004GE | |
| CrossMark / Overall | |
| Framework Laptop 13.5 12th Gen Intel | |
| Media Intel Core i7-1265U, Intel Iris Xe Graphics G7 96EUs (1301 - 1615, n=7) | |
| Dell Latitude 13 7330 | |
| CrossMark / Productivity | |
| Framework Laptop 13.5 12th Gen Intel | |
| Dell Latitude 13 7330 | |
| Media Intel Core i7-1265U, Intel Iris Xe Graphics G7 96EUs (1230 - 1586, n=7) | |
| CrossMark / Creativity | |
| Framework Laptop 13.5 12th Gen Intel | |
| Media Intel Core i7-1265U, Intel Iris Xe Graphics G7 96EUs (1413 - 1706, n=7) | |
| Dell Latitude 13 7330 | |
| CrossMark / Responsiveness | |
| Framework Laptop 13.5 12th Gen Intel | |
| Media Intel Core i7-1265U, Intel Iris Xe Graphics G7 96EUs (1193 - 1521, n=7) | |
| Dell Latitude 13 7330 | |
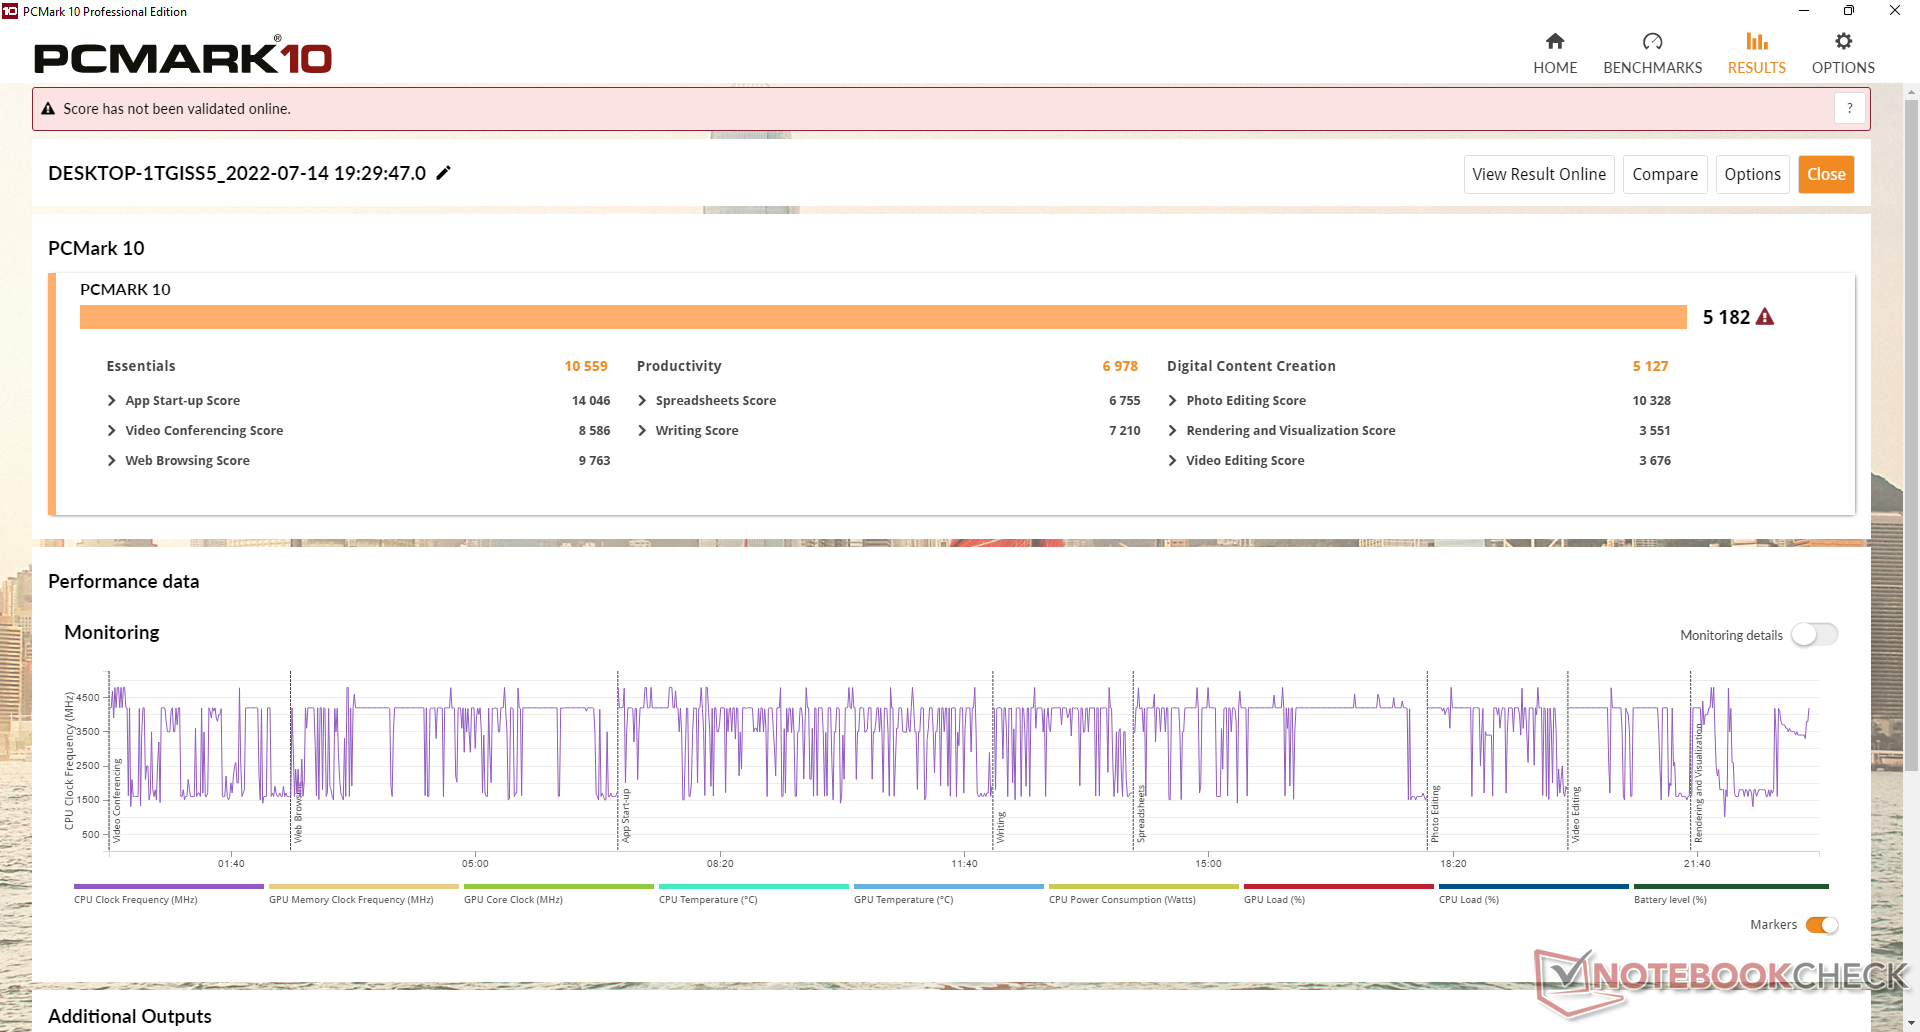
| PCMark 10 Score | 5182 punti | |
Aiuto | ||
| AIDA64 / Memory Copy | |
| Media Intel Core i7-1265U (40212 - 72204, n=10) | |
| Framework Laptop 13.5 12th Gen Intel | |
| Dell Latitude 13 7330 | |
| Microsoft Surface Laptop 4 13 Ryzen 5 | |
| Dell Latitude 7310 | |
| Lenovo ThinkPad X13 Yoga 20SX0004GE | |
| AIDA64 / Memory Read | |
| Media Intel Core i7-1265U (41808 - 69493, n=10) | |
| Framework Laptop 13.5 12th Gen Intel | |
| Microsoft Surface Laptop 4 13 Ryzen 5 | |
| Dell Latitude 13 7330 | |
| Dell Latitude 7310 | |
| Lenovo ThinkPad X13 Yoga 20SX0004GE | |
| AIDA64 / Memory Write | |
| Media Intel Core i7-1265U (41382 - 76027, n=10) | |
| Framework Laptop 13.5 12th Gen Intel | |
| Dell Latitude 13 7330 | |
| Microsoft Surface Laptop 4 13 Ryzen 5 | |
| Dell Latitude 7310 | |
| Lenovo ThinkPad X13 Yoga 20SX0004GE | |
| AIDA64 / Memory Latency | |
| Microsoft Surface Laptop 4 13 Ryzen 5 | |
| Media Intel Core i7-1265U (74.6 - 112.4, n=10) | |
| Lenovo ThinkPad X13 Yoga 20SX0004GE | |
| Dell Latitude 7310 | |
| Framework Laptop 13.5 12th Gen Intel | |
| Dell Latitude 13 7330 | |
* ... Meglio usare valori piccoli
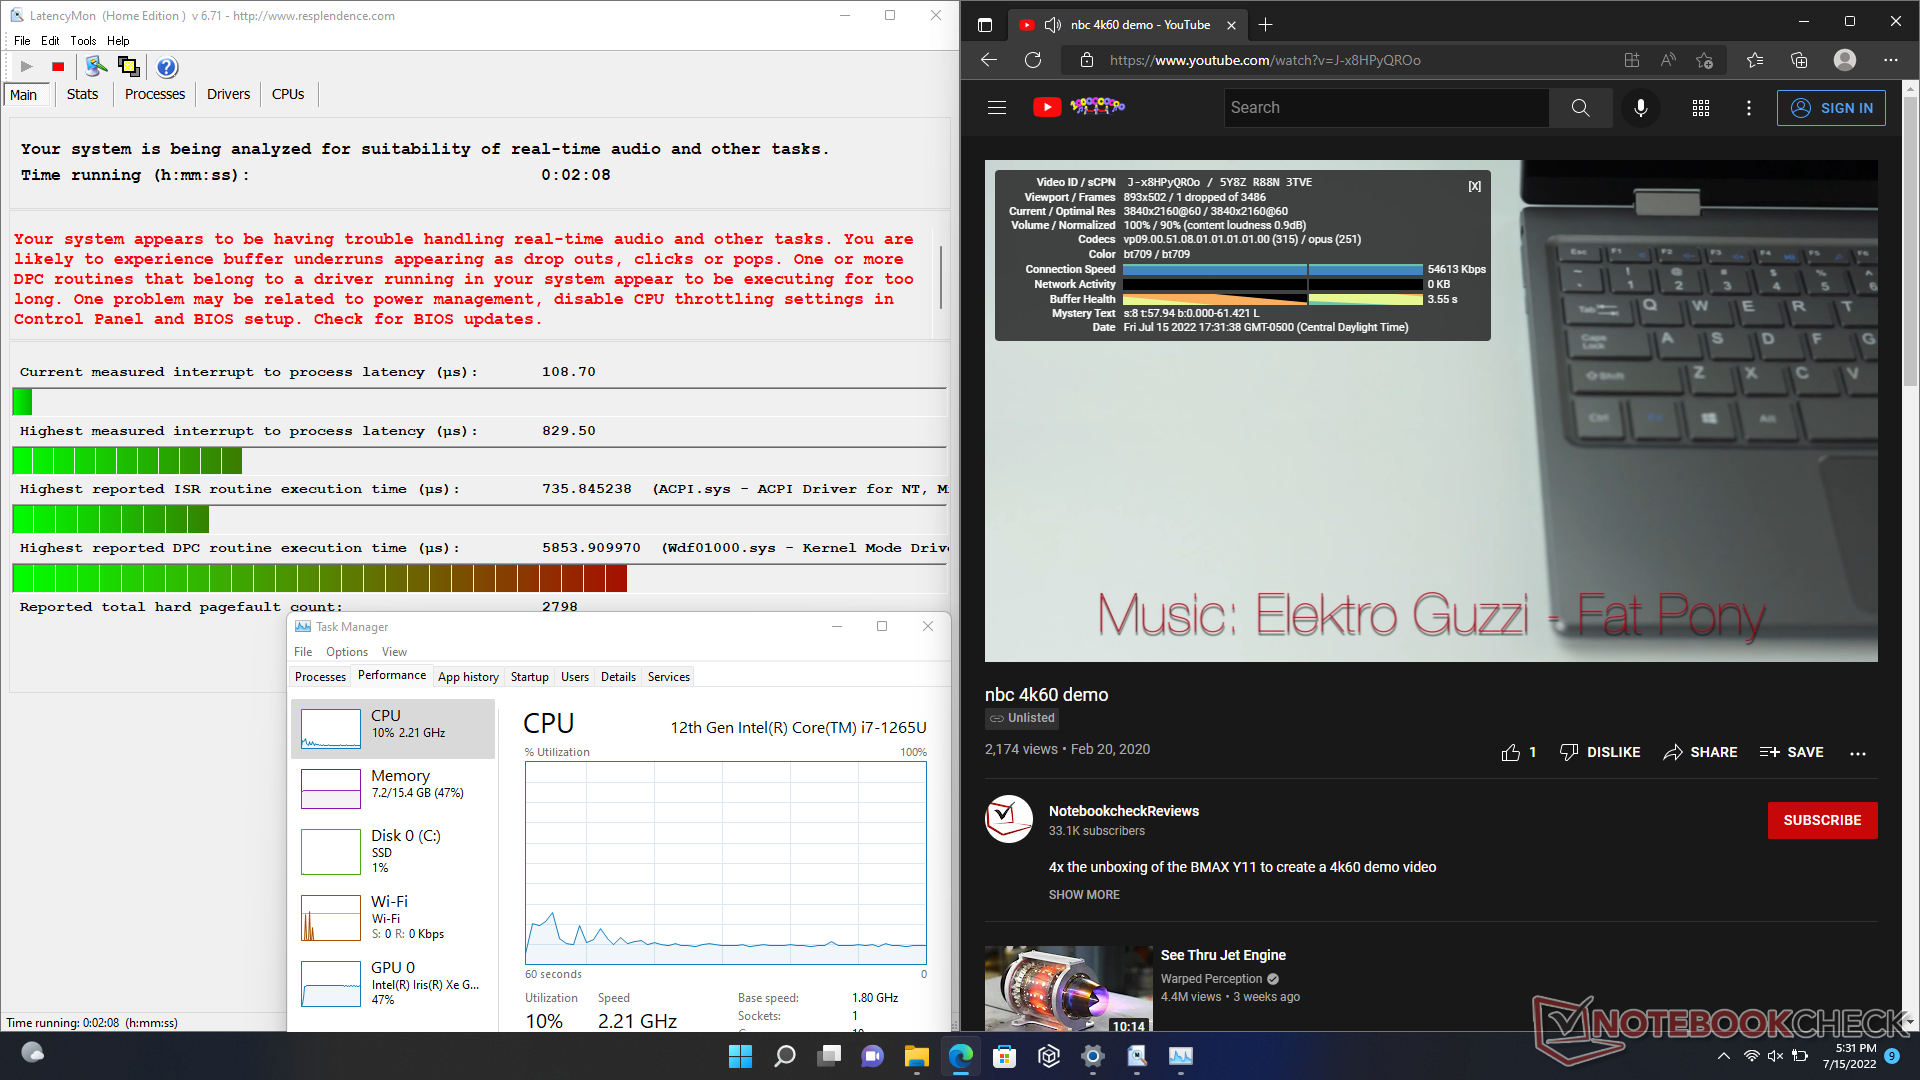
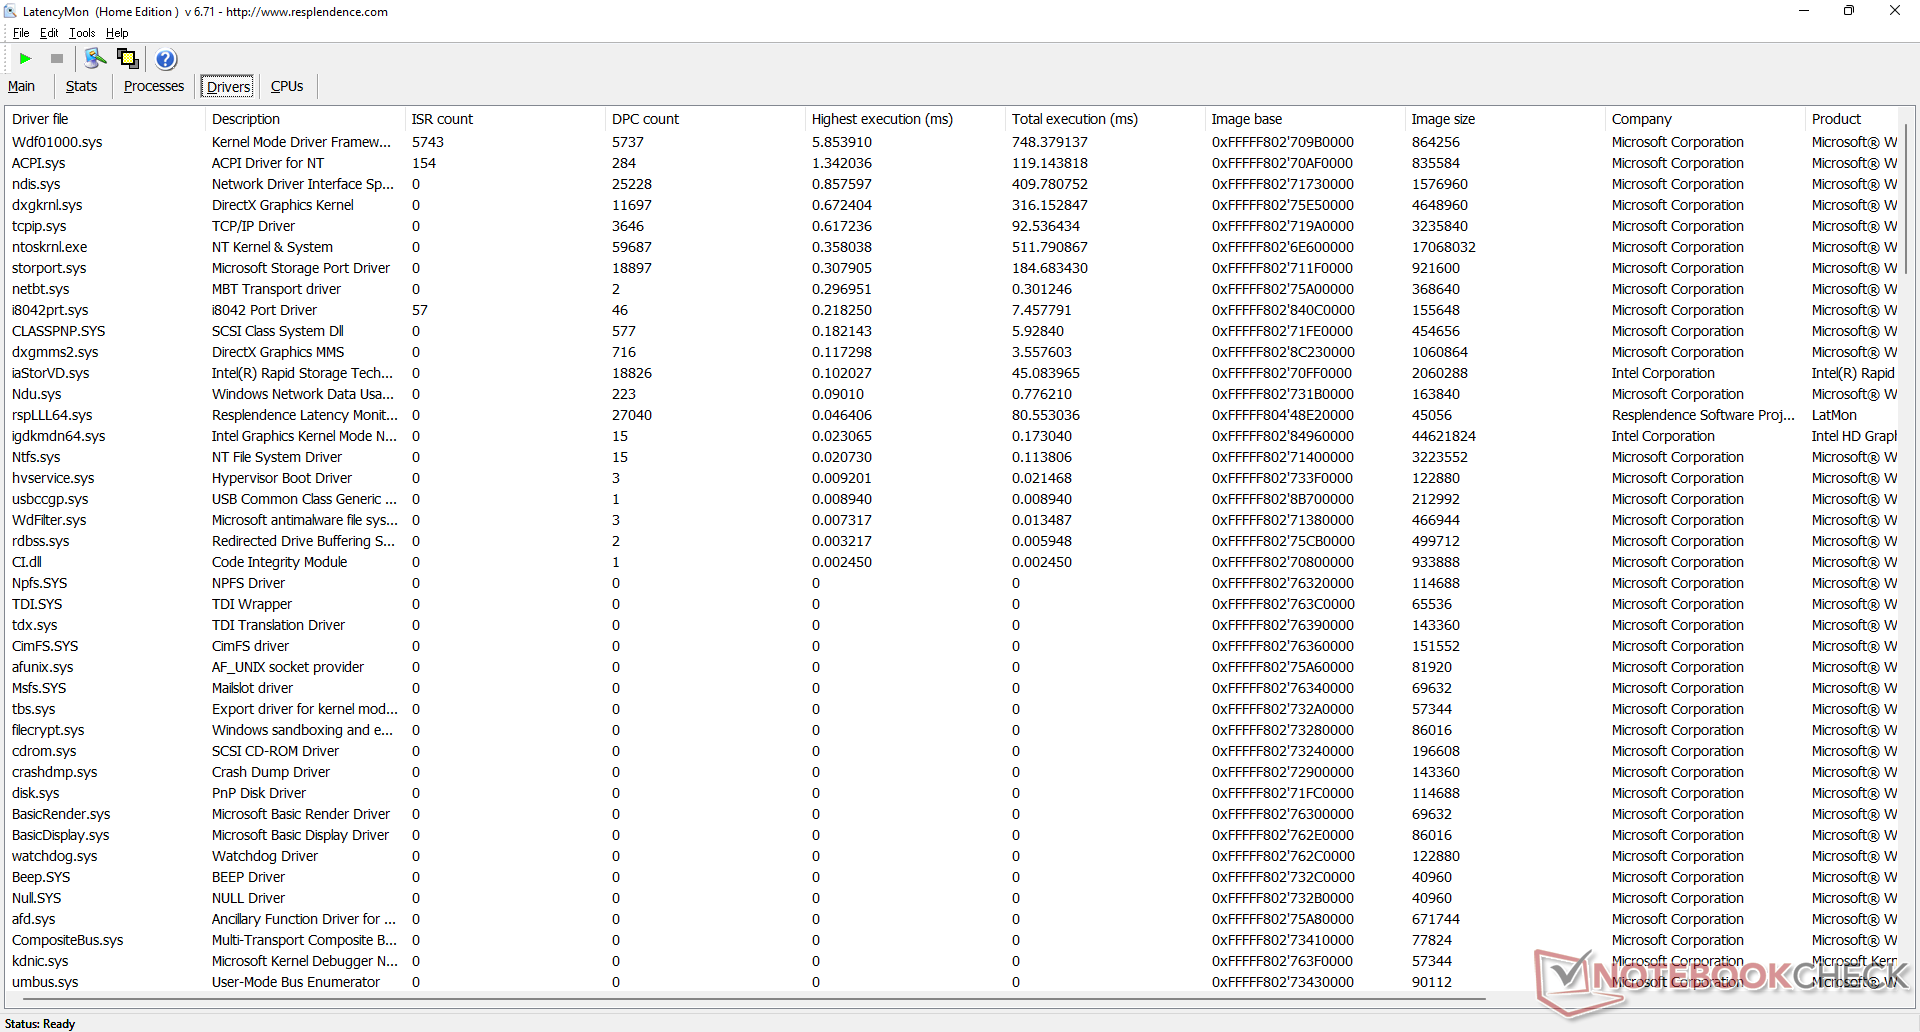
Latenza DPC
LatencyMon rivela problemi di DPC quando si aprono più schede del browser sulla nostra homepage. la riproduzione di video 4K a 60 FPS è invece perfetta, con un solo fotogramma perso durante il nostro video di prova di 60 secondi.
| DPC Latencies / LatencyMon - interrupt to process latency (max), Web, Youtube, Prime95 | |
| Razer Book 13 FHD | |
| Framework Laptop 13.5 12th Gen Intel | |
| Lenovo ThinkPad X13 Yoga 20SX0004GE | |
| Microsoft Surface Laptop 4 13 Ryzen 5 | |
| Dell Latitude 13 7330 | |
| Dell Latitude 7310 | |
* ... Meglio usare valori piccoli
Dispositivi di archiviazione - Solo un'unità interna
Dell ama distribuire molti dei suoi subnotebook con unità SSD M.2 2230 più corte rispetto alle unità 2280 più lunghe della maggior parte degli altri portatili. L'unità 512 GB Kioxia PCIe3 x4 da 512 GB nella nostra unità di test raggiungeva i 2400 MB/s solo per un breve periodo, prima di subire il throttling che riduceva la velocità di trasferimento a soli 1200 MB/s, come mostrano i risultati del nostro test DiskSpd loop qui sotto. È probabile che l'unità sia soggetta a limiti di temperatura quando è sottoposta a stress. In confronto, l'unitàHP EliteBook 845 G9 è in grado di sostenere velocità di trasferimento significativamente più elevate per periodi più lunghi con l'unità PCIe4 x4 in dotazione quando viene sottoposta alle stesse condizioni di test.

| Drive Performance rating - Percent | |
| Lenovo ThinkPad X13 Yoga 20SX0004GE | |
| Framework Laptop 13.5 12th Gen Intel | |
| Dell Latitude 7310 | |
| Razer Book 13 FHD | |
| Dell Latitude 13 7330 | |
| Microsoft Surface Laptop 4 13 Ryzen 5 | |
* ... Meglio usare valori piccoli
Disk Throttling: DiskSpd Read Loop, Queue Depth 8
Prestazioni della GPU - Iris Xe si fa sentire
Le prestazioni grafiche sono più lente di circa il 5-20% rispetto alla media dei laptop del nostro database equipaggiati con lo stesso sistema Iris Xe 96 EUs GPU. È comunque veloce per essere un chip grafico integrato, ma ci sono sicuramente opzioni più veloci disponibili come il Razer Book 13 o Asus Zenbook S 13 alimentato da AMD se la massimizzazione delle prestazioni della GPU è una priorità.
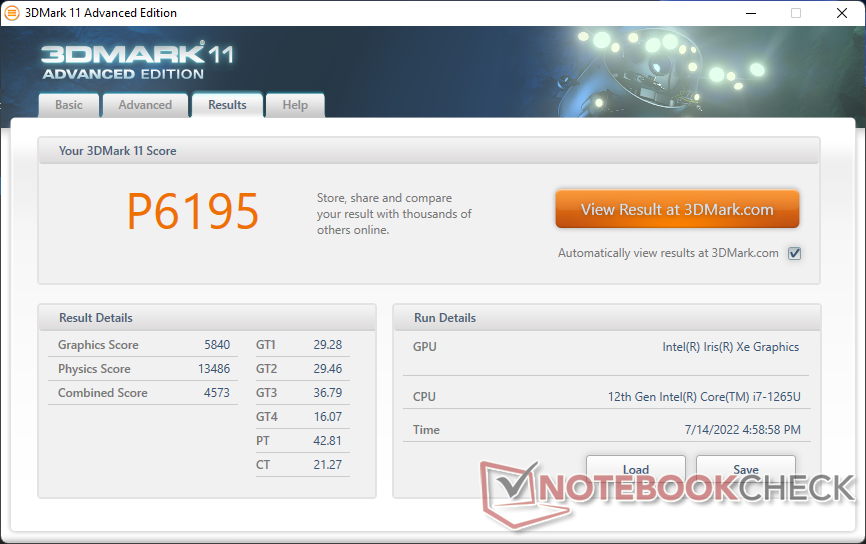
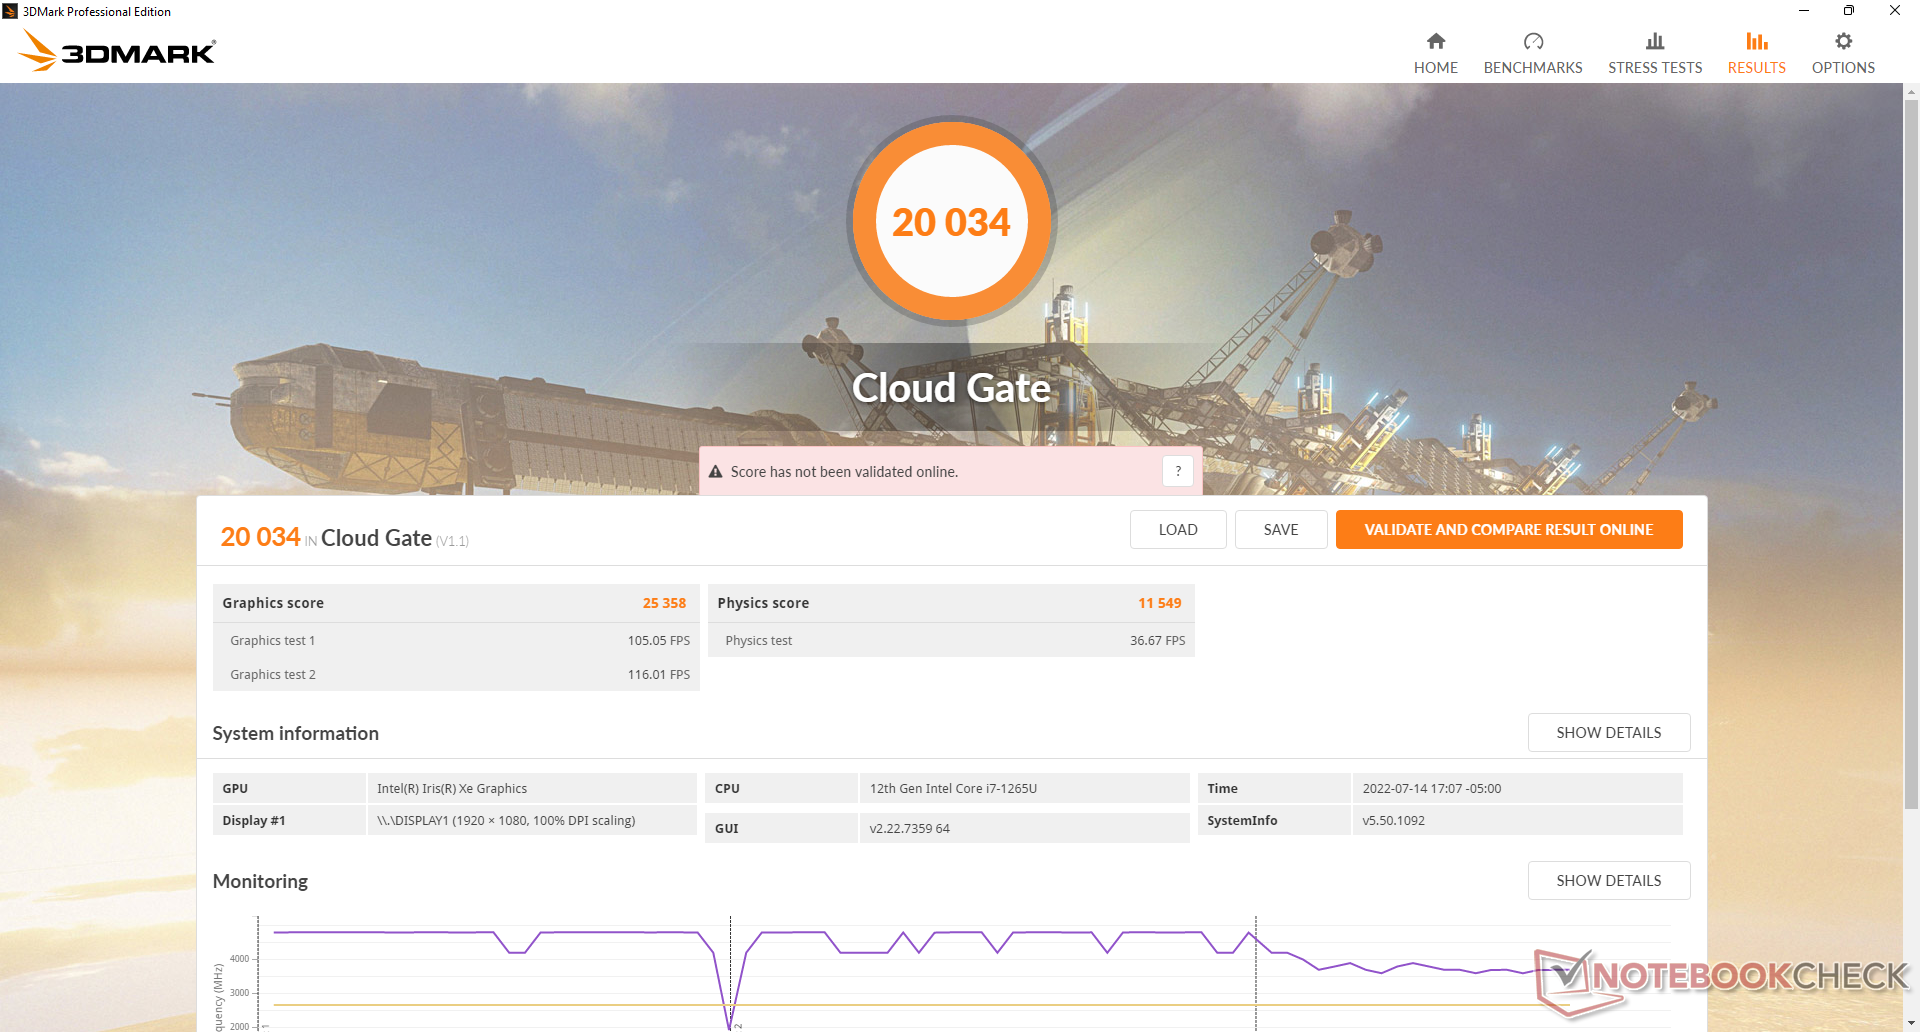
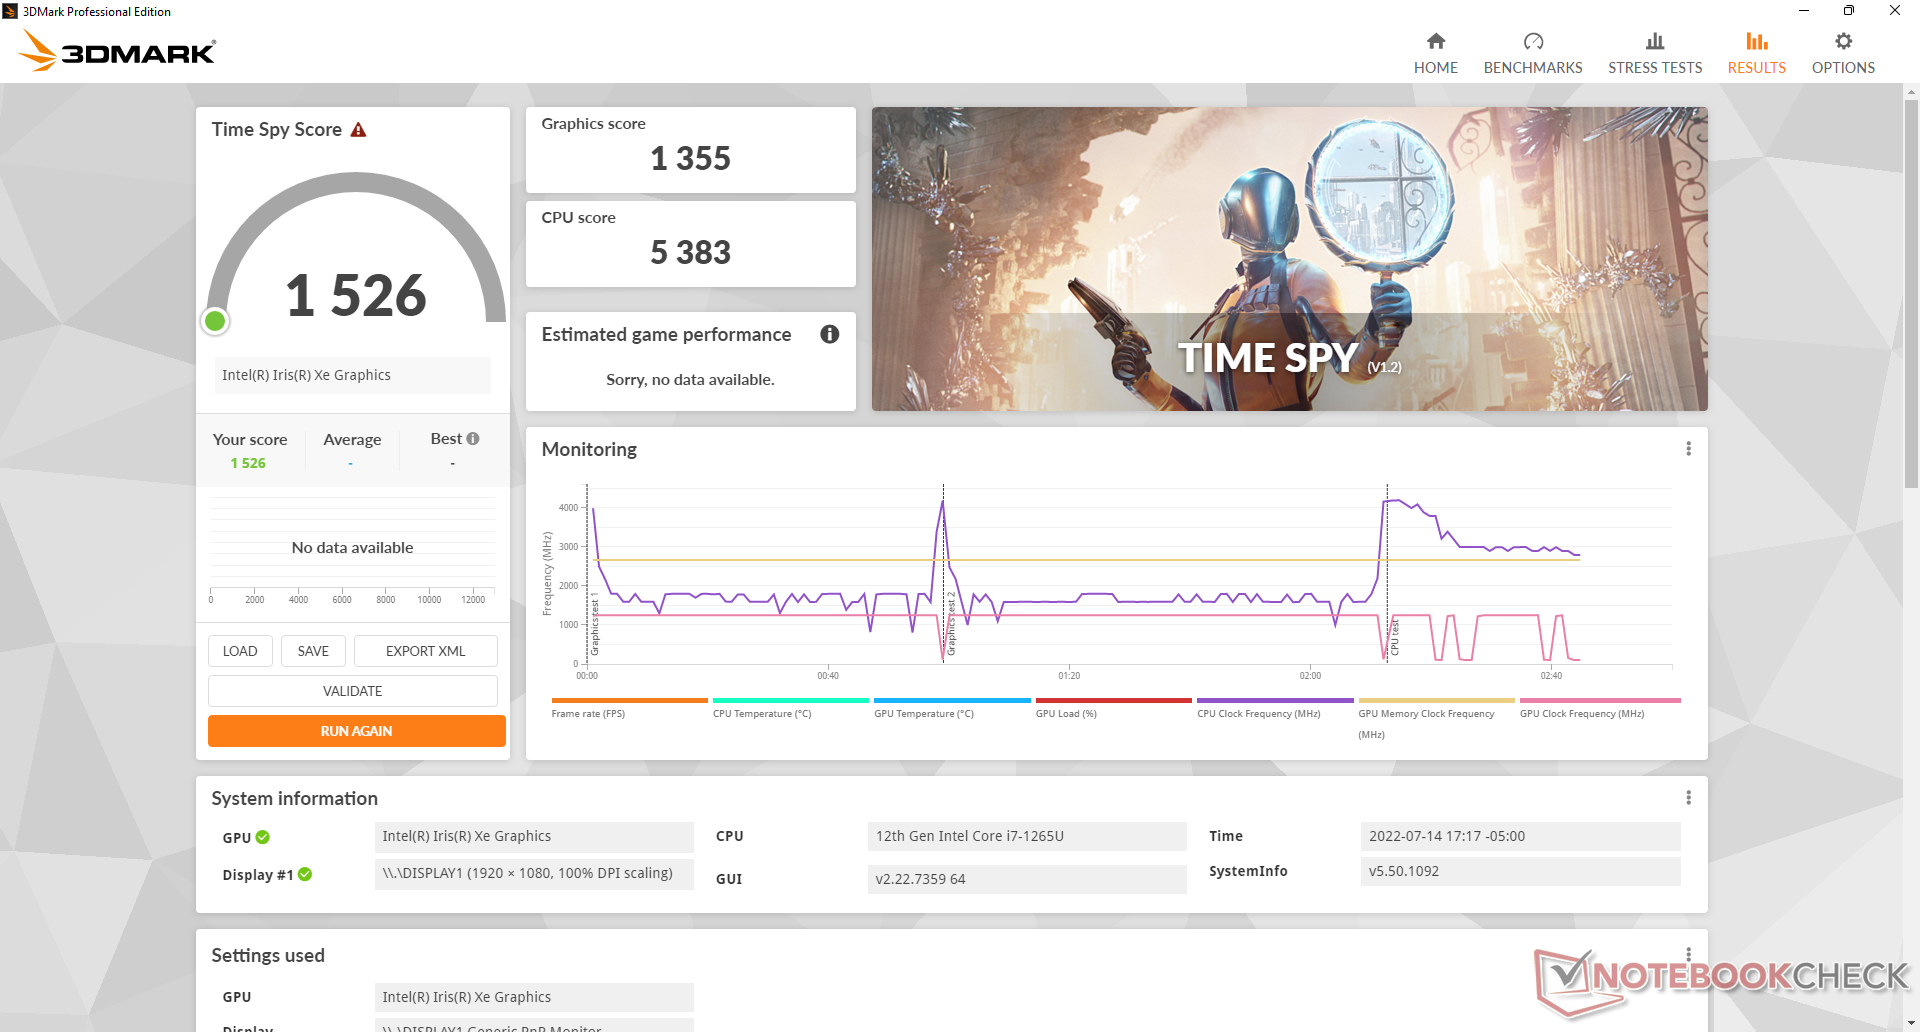
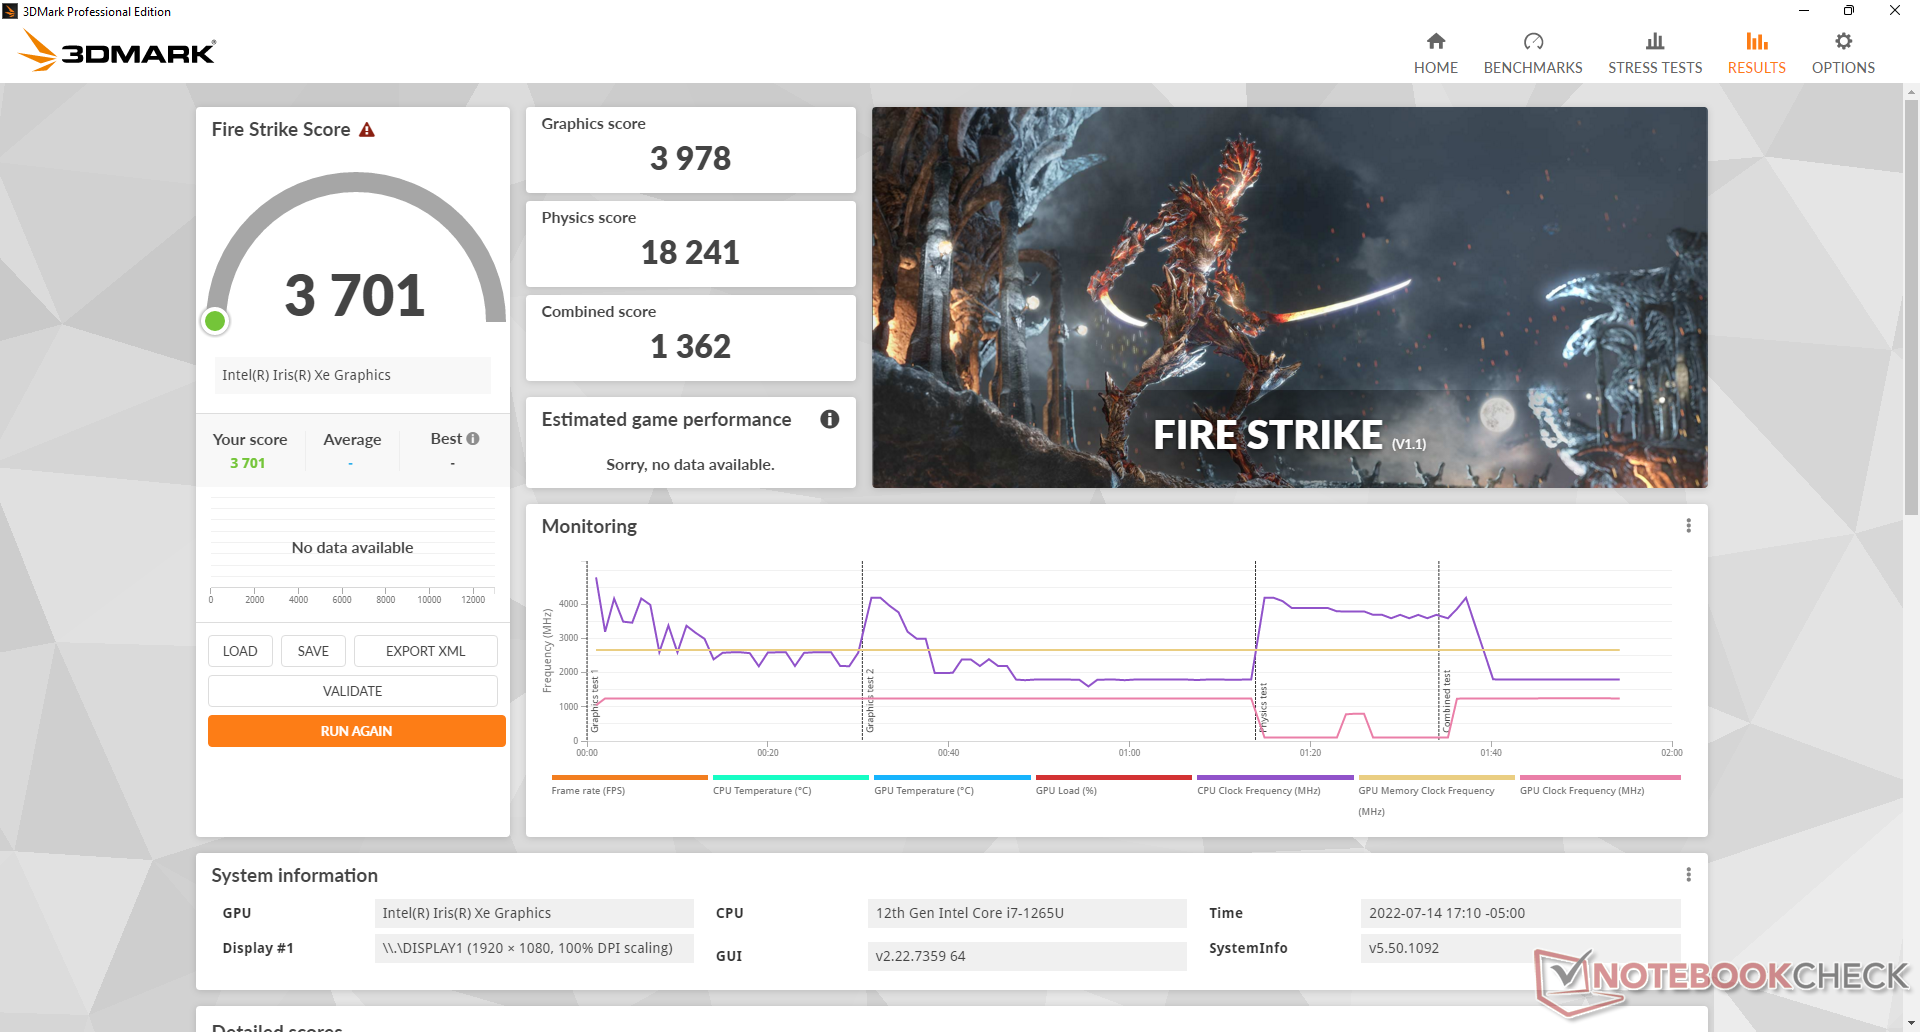
| 3DMark 11 Performance | 6195 punti | |
| 3DMark Cloud Gate Standard Score | 20034 punti | |
| 3DMark Fire Strike Score | 3701 punti | |
| 3DMark Time Spy Score | 1526 punti | |
Aiuto | ||
| Cyberpunk 2077 1.6 | |
| 1920x1080 Low Preset | |
| Framework Laptop 13.5 12th Gen Intel | |
| Media Intel Iris Xe Graphics G7 96EUs (13 - 25.9, n=42) | |
| Dell Latitude 13 7330 | |
| 1920x1080 Medium Preset | |
| Framework Laptop 13.5 12th Gen Intel | |
| Media Intel Iris Xe Graphics G7 96EUs (10.8 - 21.7, n=37) | |
| Dell Latitude 13 7330 | |
| 1920x1080 High Preset | |
| Framework Laptop 13.5 12th Gen Intel | |
| Media Intel Iris Xe Graphics G7 96EUs (9.8 - 16.9, n=34) | |
| Dell Latitude 13 7330 | |
Witcher 3 FPS Chart
| basso | medio | alto | ultra | |
|---|---|---|---|---|
| GTA V (2015) | 84.5 | 64.7 | 13.9 | 6.15 |
| The Witcher 3 (2015) | 71.6 | 47.3 | 23.6 | 11.9 |
| Dota 2 Reborn (2015) | 109.7 | 79.6 | 50.6 | 44.9 |
| Final Fantasy XV Benchmark (2018) | 32.9 | 17.5 | 12.9 | |
| X-Plane 11.11 (2018) | 47.3 | 33.8 | 30.3 | |
| Strange Brigade (2018) | 75.8 | 29.8 | 24.9 | 20 |
| Cyberpunk 2077 1.6 (2022) | 18.7 | 15.4 | 11.2 |
Emissioni
Rumore del sistema - Per lo più silenzioso
Il rumore della ventola tende a oscillare tra i 23,4 dB(A) e i 25,3 dB(A) quando si naviga sul web o si elaborano testi, risultando quasi inudibile nella maggior parte degli ambienti. Tuttavia, inizia a salire rapidamente quando si eseguono carichi più impegnativi come 3DMark 06, dove il rumore della ventola può raggiungere i 38 dB(A) ed essere più forte di quello registrato sul ThinkPad X13 Yoga, Razer Book 13 o il vecchio Latitude 7310. Il rumore della ventola oscillava tra i 37 e i 39 dB(A) durante il funzionamento, invece di rimanere costante Witcher 3 invece di rimanere costante, come sarebbe stato preferibile.
Durante l'esecuzione di Prime95, il rumore della ventola raggiungeva i 43 dB(A) solo per un breve periodo, prima di ridiscendere rapidamente a 39 dB(A).
Rumorosità
| Idle |
| 23.4 / 23.4 / 23.4 dB(A) |
| Sotto carico |
| 37.8 / 43 dB(A) |
 | ||
30 dB silenzioso 40 dB(A) udibile 50 dB(A) rumoroso |
||
min: | ||
| Dell Latitude 13 7330 Iris Xe G7 96EUs, i7-1265U, Toshiba KBG40ZNS512G NVMe | Lenovo ThinkPad X13 Yoga 20SX0004GE UHD Graphics 620, i7-10510U, Samsung SSD PM981a MZVLB512HBJQ | Framework Laptop 13.5 12th Gen Intel Iris Xe G7 96EUs, i7-1260P, WDC PC SN730 SDBPNTY-512G | Razer Book 13 FHD Iris Xe G7 96EUs, i7-1165G7, Samsung SSD PM981a MZVLB256HBHQ | Dell Latitude 7310 UHD Graphics 620, i7-10610U, Samsung SSD PM981a MZVLB512HBJQ | Microsoft Surface Laptop 4 13 Ryzen 5 Vega 7, R5 4680U, Samsung PM991 MZ9LQ256HBJQ | |
|---|---|---|---|---|---|---|
| Noise | -13% | -8% | -4% | -12% | -3% | |
| off /ambiente * (dB) | 23.4 | 29.3 -25% | 22.8 3% | 27 -15% | 29 -24% | 24.6 -5% |
| Idle Minimum * (dB) | 23.4 | 29.3 -25% | 23 2% | 27 -15% | 29 -24% | 24.6 -5% |
| Idle Average * (dB) | 23.4 | 29.3 -25% | 23 2% | 27 -15% | 29 -24% | 24.6 -5% |
| Idle Maximum * (dB) | 23.4 | 31.4 -34% | 23 2% | 27.1 -16% | 29 -24% | 24.6 -5% |
| Load Average * (dB) | 37.8 | 33 13% | 47.3 -25% | 29 23% | 30.1 20% | 39.5 -4% |
| Witcher 3 ultra * (dB) | 39.2 | 47.3 -21% | 33.3 15% | |||
| Load Maximum * (dB) | 43 | 34.9 19% | 49.8 -16% | 44.8 -4% | 41.3 4% | 39.5 8% |
* ... Meglio usare valori piccoli
Temperatura
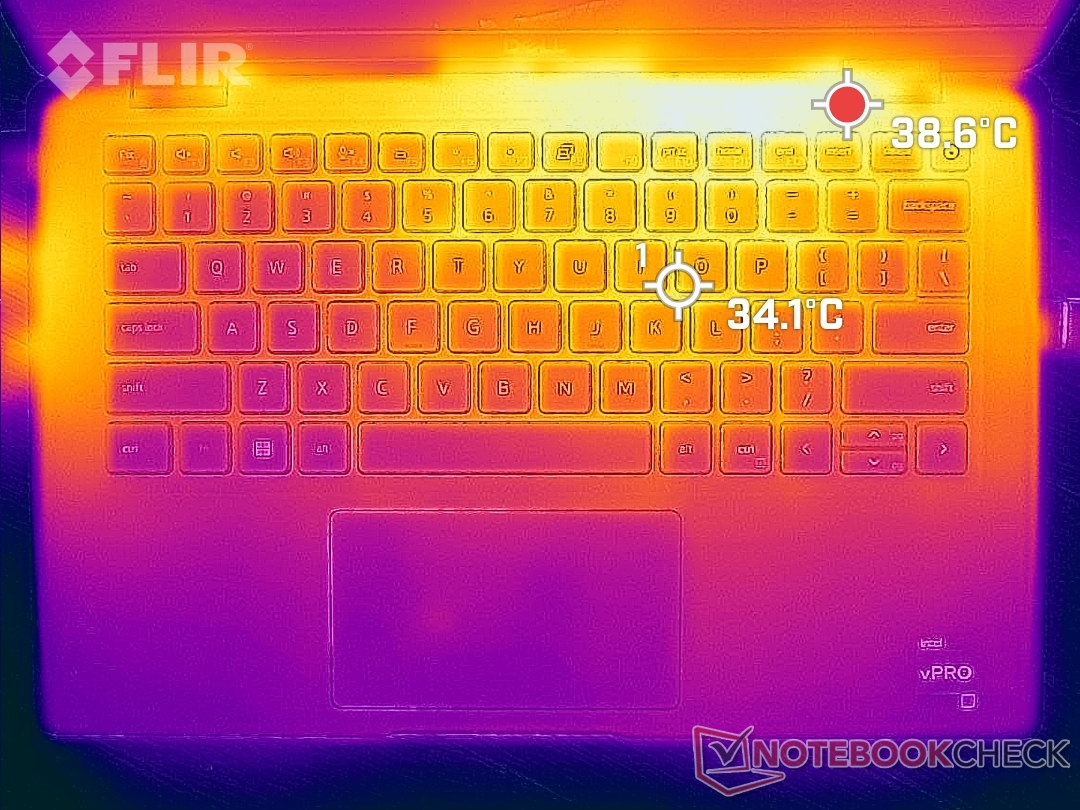
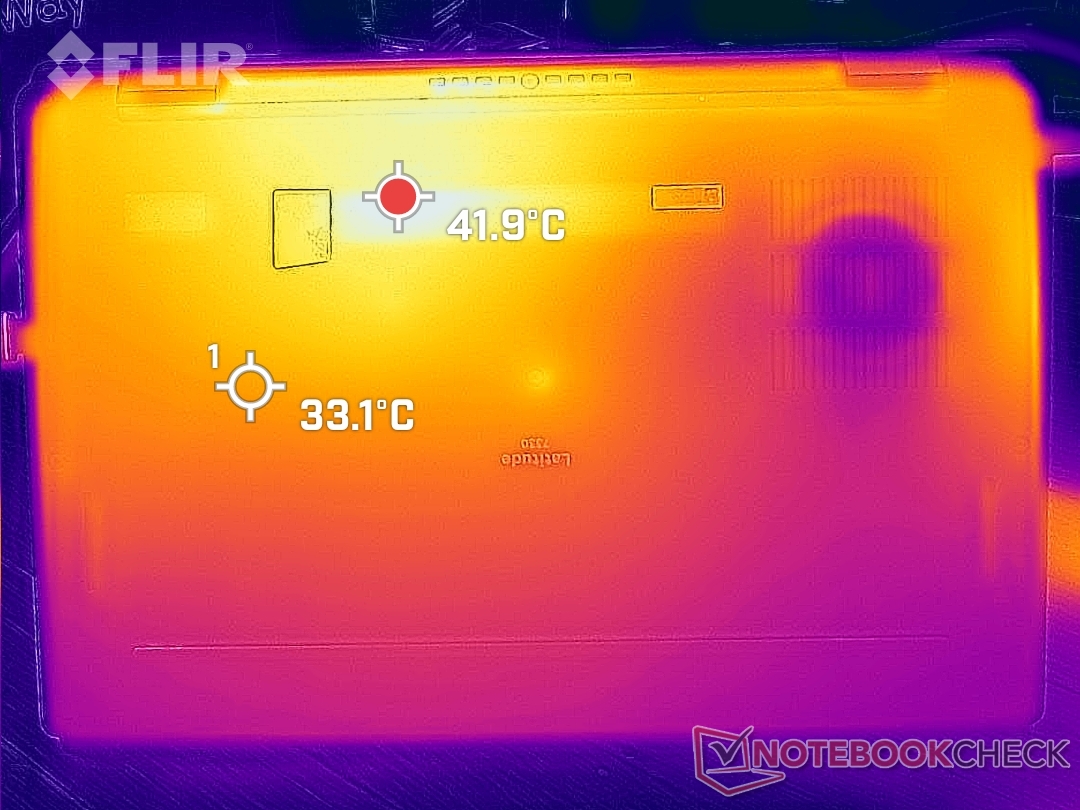
Le temperature di superficie non sono un problema su Latitude 7330. Nel peggiore dei casi, siamo riusciti a registrare punti caldi di 39 C e 42 C sulle superfici superiore e inferiore, rispettivamente, per essere più freschi dei 46 C e 53 C che abbiamo registrato sul vecchio Latitude 7310. Questi punti caldi sono anche verso la parte posteriore dello chassis, lontano dai tasti della tastiera e dai poggiapolsi.
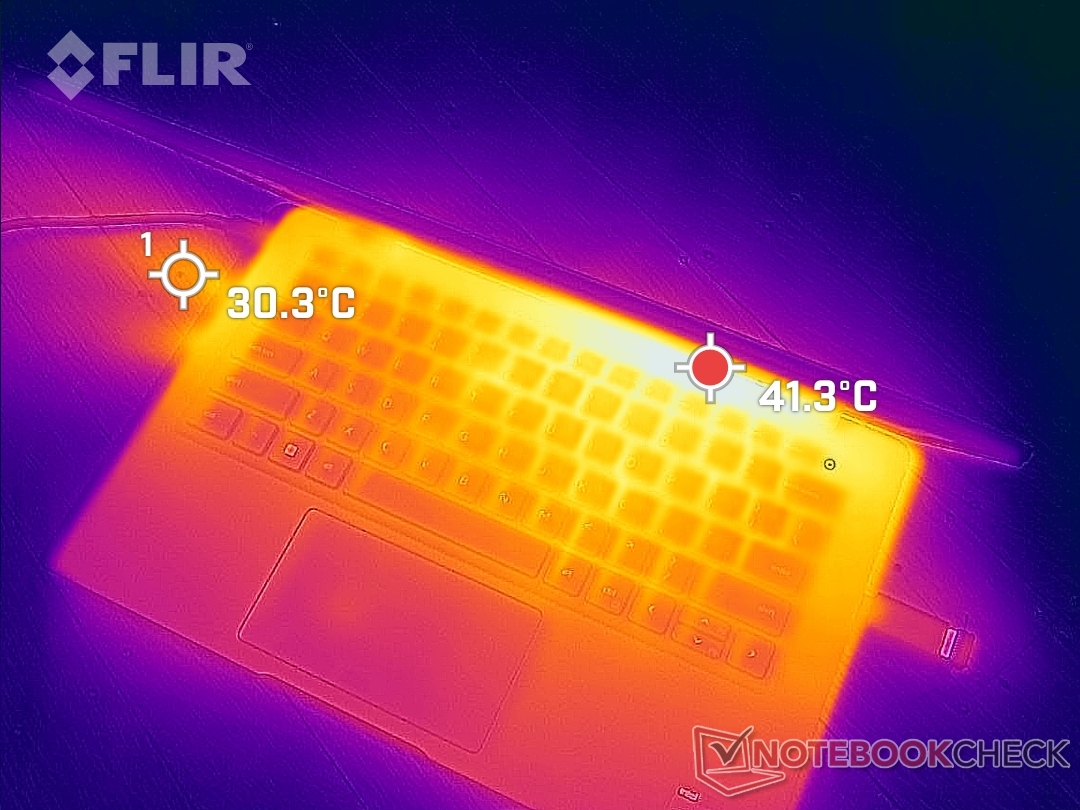
(+) La temperatura massima sul lato superiore è di 38.6 °C / 101 F, rispetto alla media di 34.3 °C / 94 F, che varia da 21.2 a 62.5 °C per questa classe Office.
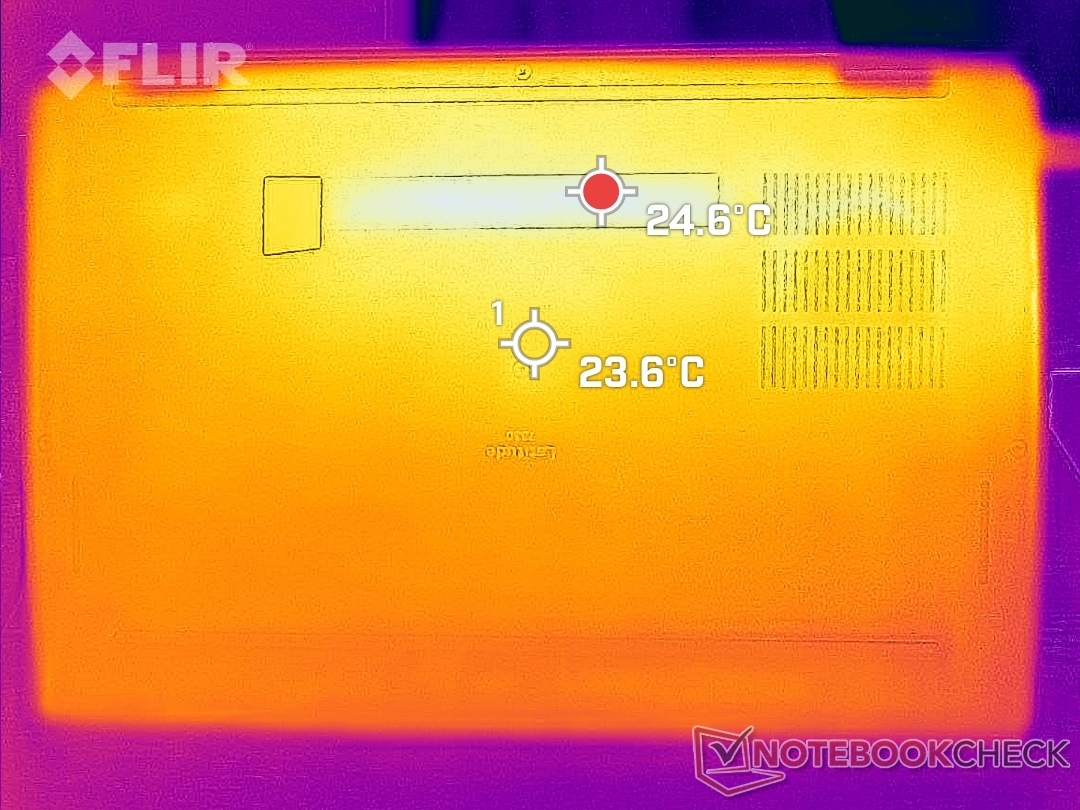
(±) Il lato inferiore si riscalda fino ad un massimo di 42 °C / 108 F, rispetto alla media di 36.8 °C / 98 F
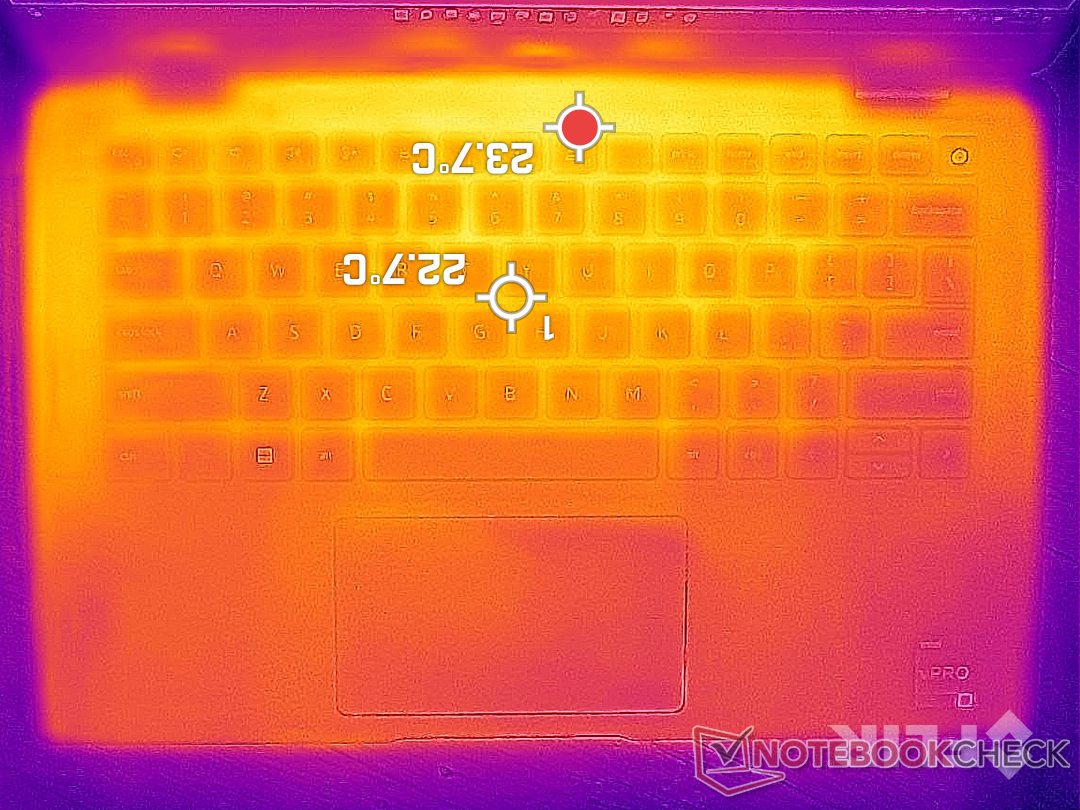
(+) In idle, la temperatura media del lato superiore è di 22.2 °C / 72 F, rispetto alla media deld ispositivo di 29.5 °C / 85 F.
(+) I poggiapolsi e il touchpad sono piu' freddi della temperatura della pelle con un massimo di 23.2 °C / 73.8 F e sono quindi freddi al tatto.
(+) La temperatura media della zona del palmo della mano di dispositivi simili e'stata di 27.5 °C / 81.5 F (+4.3 °C / 7.7 F).
| Dell Latitude 13 7330 Intel Core i7-1265U, Intel Iris Xe Graphics G7 96EUs | Lenovo ThinkPad X13 Yoga 20SX0004GE Intel Core i7-10510U, Intel UHD Graphics 620 | Framework Laptop 13.5 12th Gen Intel Intel Core i7-1260P, Intel Iris Xe Graphics G7 96EUs | Razer Book 13 FHD Intel Core i7-1165G7, Intel Iris Xe Graphics G7 96EUs | Dell Latitude 7310 Intel Core i7-10610U, Intel UHD Graphics 620 | Microsoft Surface Laptop 4 13 Ryzen 5 AMD Ryzen 5 4680U, AMD Radeon RX Vega 7 | |
|---|---|---|---|---|---|---|
| Heat | -31% | -4% | -3% | -22% | -9% | |
| Maximum Upper Side * (°C) | 38.6 | 43.8 -13% | 36.8 5% | 39.2 -2% | 45.2 -17% | 45.8 -19% |
| Maximum Bottom * (°C) | 42 | 65 -55% | 42.4 -1% | 44 -5% | 52.8 -26% | 45.5 -8% |
| Idle Upper Side * (°C) | 23.8 | 29.2 -23% | 24.2 -2% | 23 3% | 28.2 -18% | 24.9 -5% |
| Idle Bottom * (°C) | 24.6 | 32.7 -33% | 29 -18% | 26.8 -9% | 31.6 -28% | 25.7 -4% |
* ... Meglio usare valori piccoli
Stress test
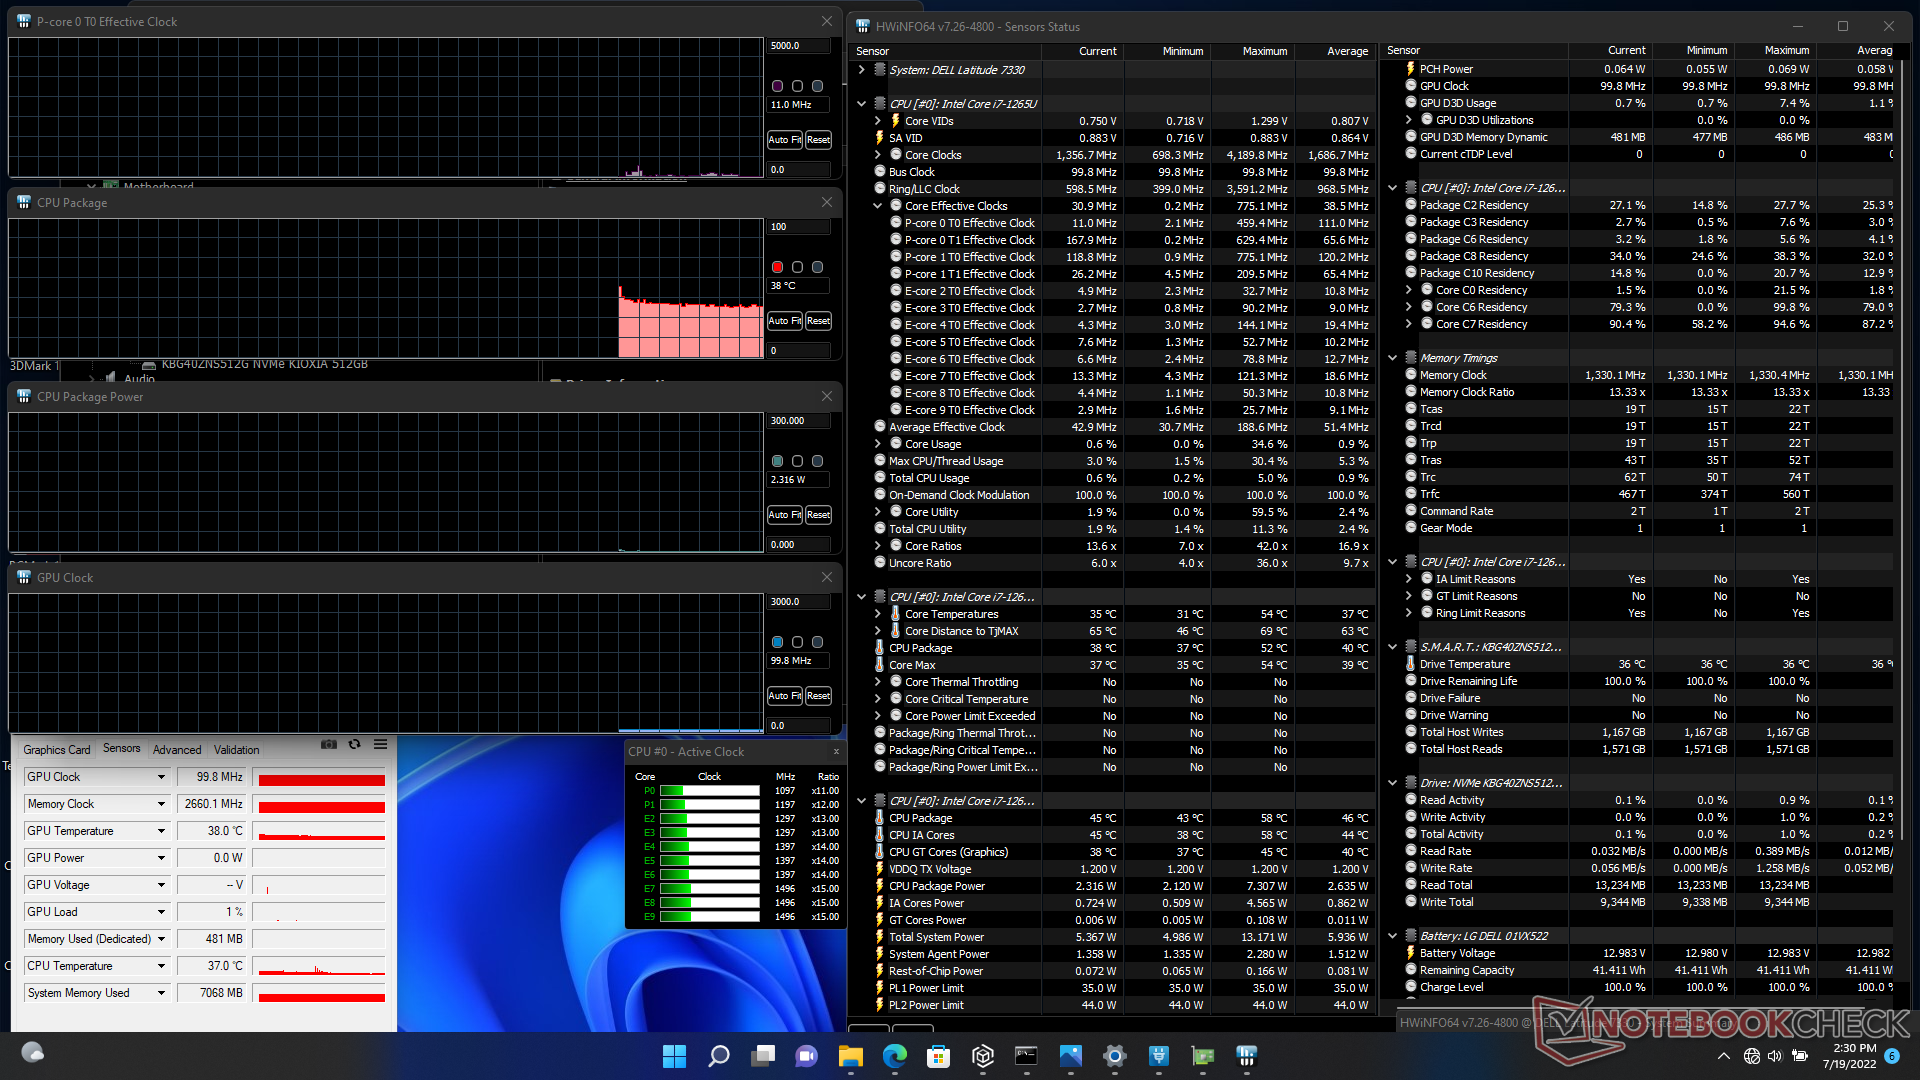
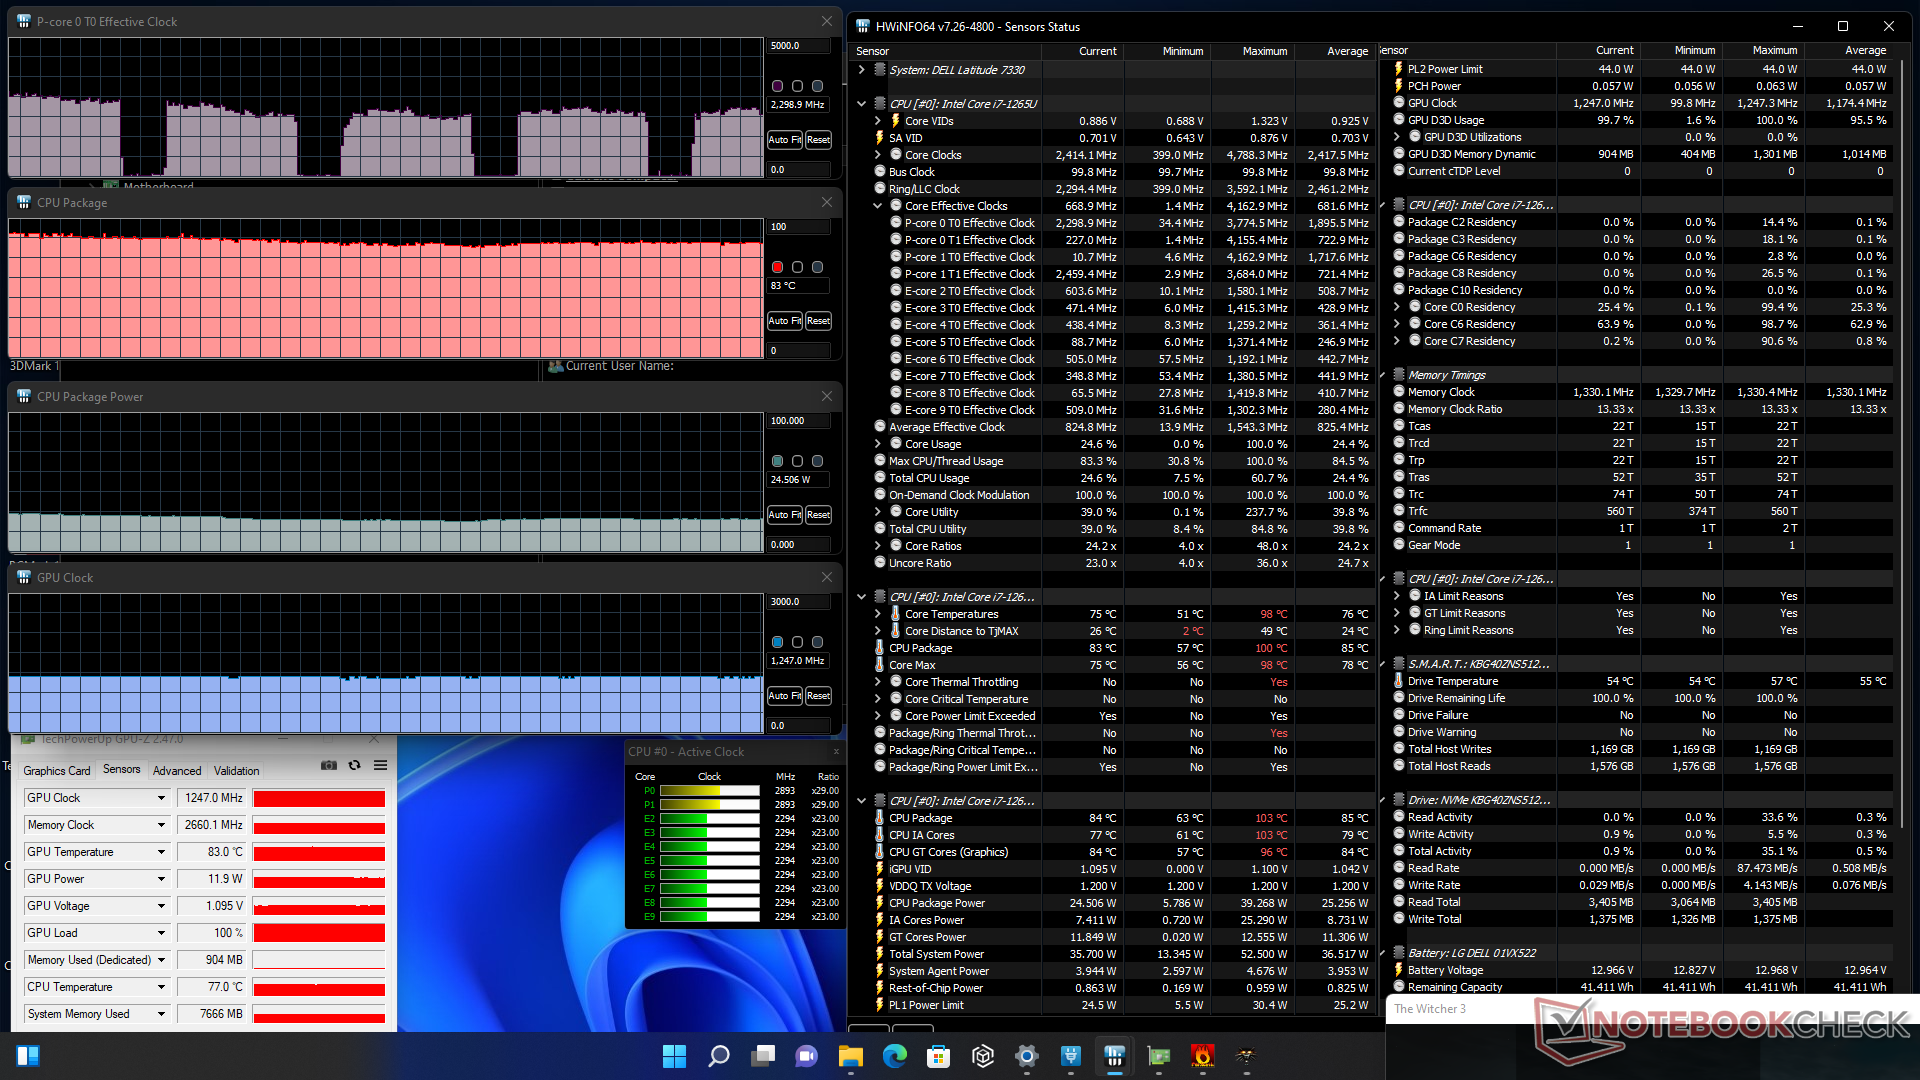
Quando si esegue Prime95, la velocità di clock della CPU sale a 3,8 GHz per i primi secondi, con un consumo di energia della scheda e una temperatura del nucleo di 44 W e 97 C, rispettivamente. Dopo pochi secondi, tuttavia, le frequenze di clock iniziano a diminuire costantemente prima di stabilizzarsi nell'intervallo tra 2,1 e 2,5 GHz e tra 72 e 85 C. Anche l'assorbimento di potenza della scheda scende a 23-25 W, poiché le elevate velocità di clock Turbo Boost non sono sostenibili. Questi risultati sono correlati alle osservazioni sul loop di CineBench R15 riportate sopra. Ripetendo questo test sul Razer Book 13 avrebbe portato a una temperatura del nucleo molto più bassa, pari a 60 C.
L'esecuzione Witcher 3 per rappresentare carichi elevati, si otterrebbe una frequenza di clock della GPU stabile e una temperatura di 1247 MHz e 83 C, rispettivamente, rispetto ai 1300 MHz e ai soli 59 C del suddetto Razer. Il processore di Latitude deve funzionare più caldo per compensare la soluzione di raffreddamento più piccola.
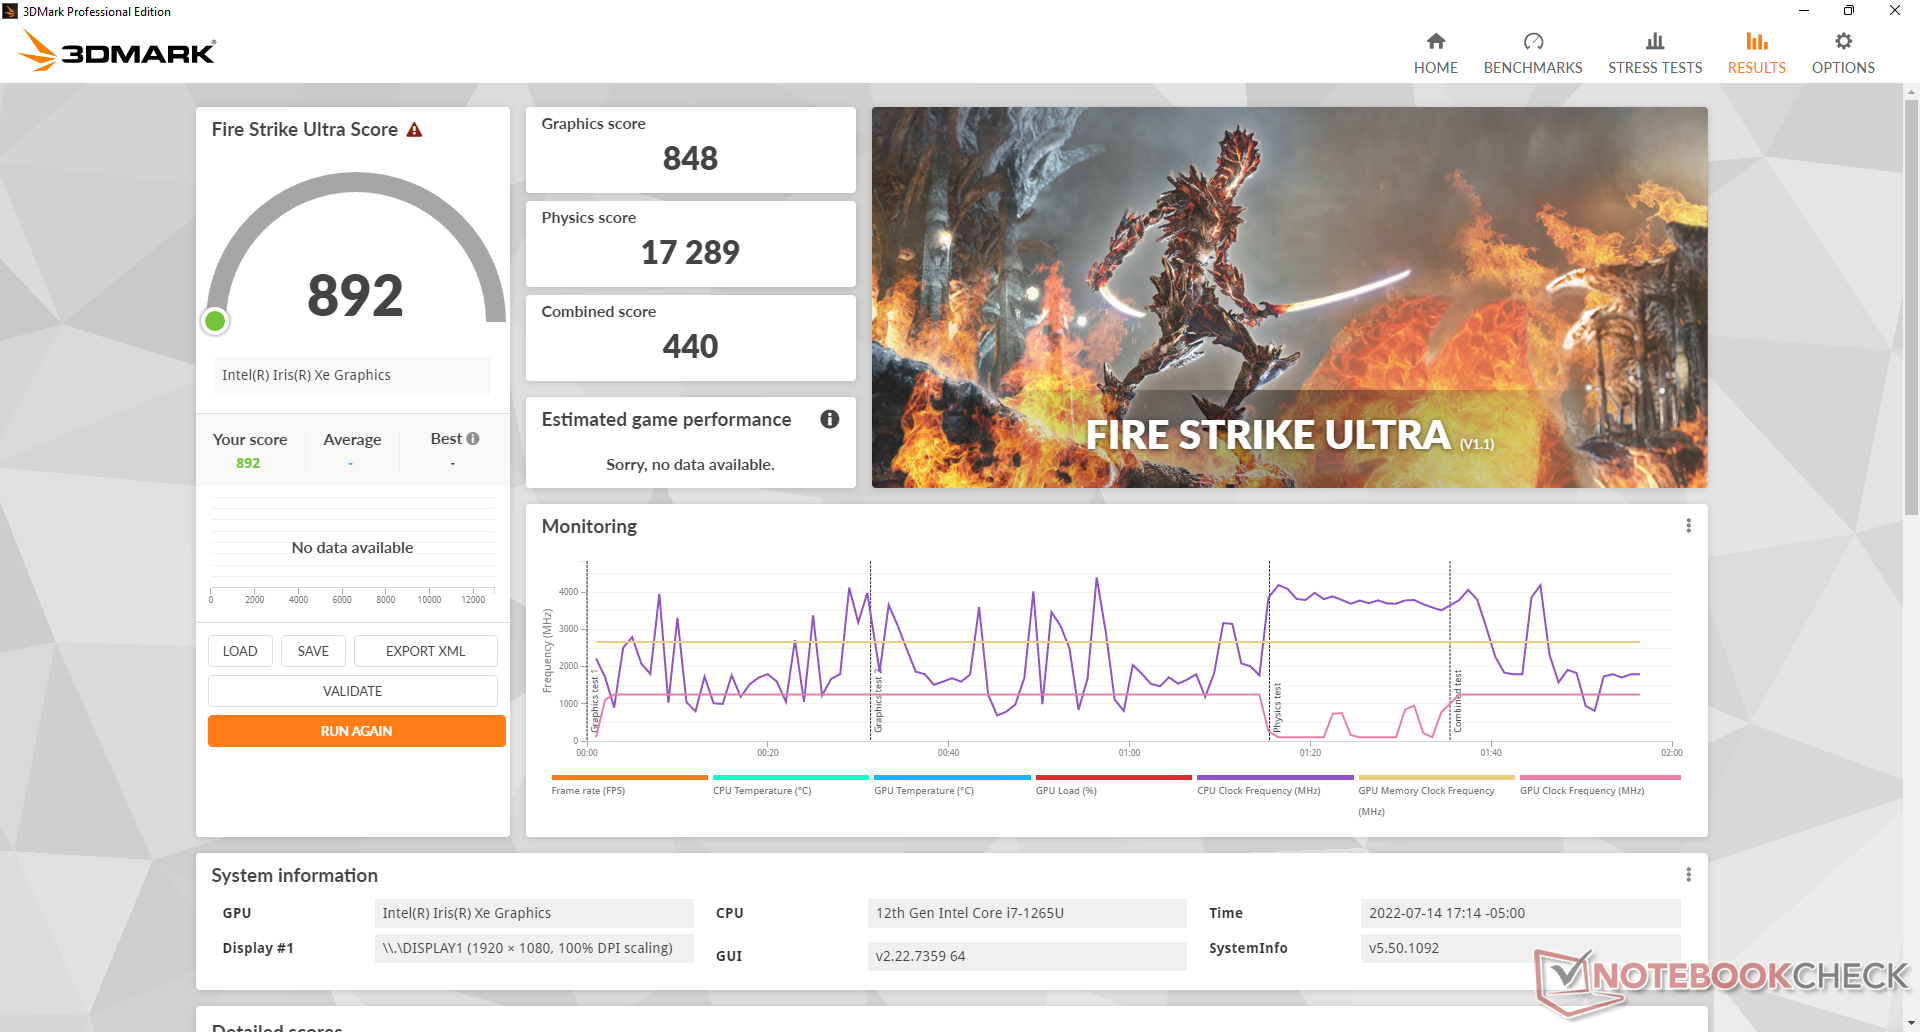
Il funzionamento a batteria limita le prestazioni. Un test 3DMark 11 a batteria restituisce punteggi di Fisica e Grafica rispettivamente di 8511 e 4764 punti, rispetto a 13486 e 5840 punti con alimentazione a rete.
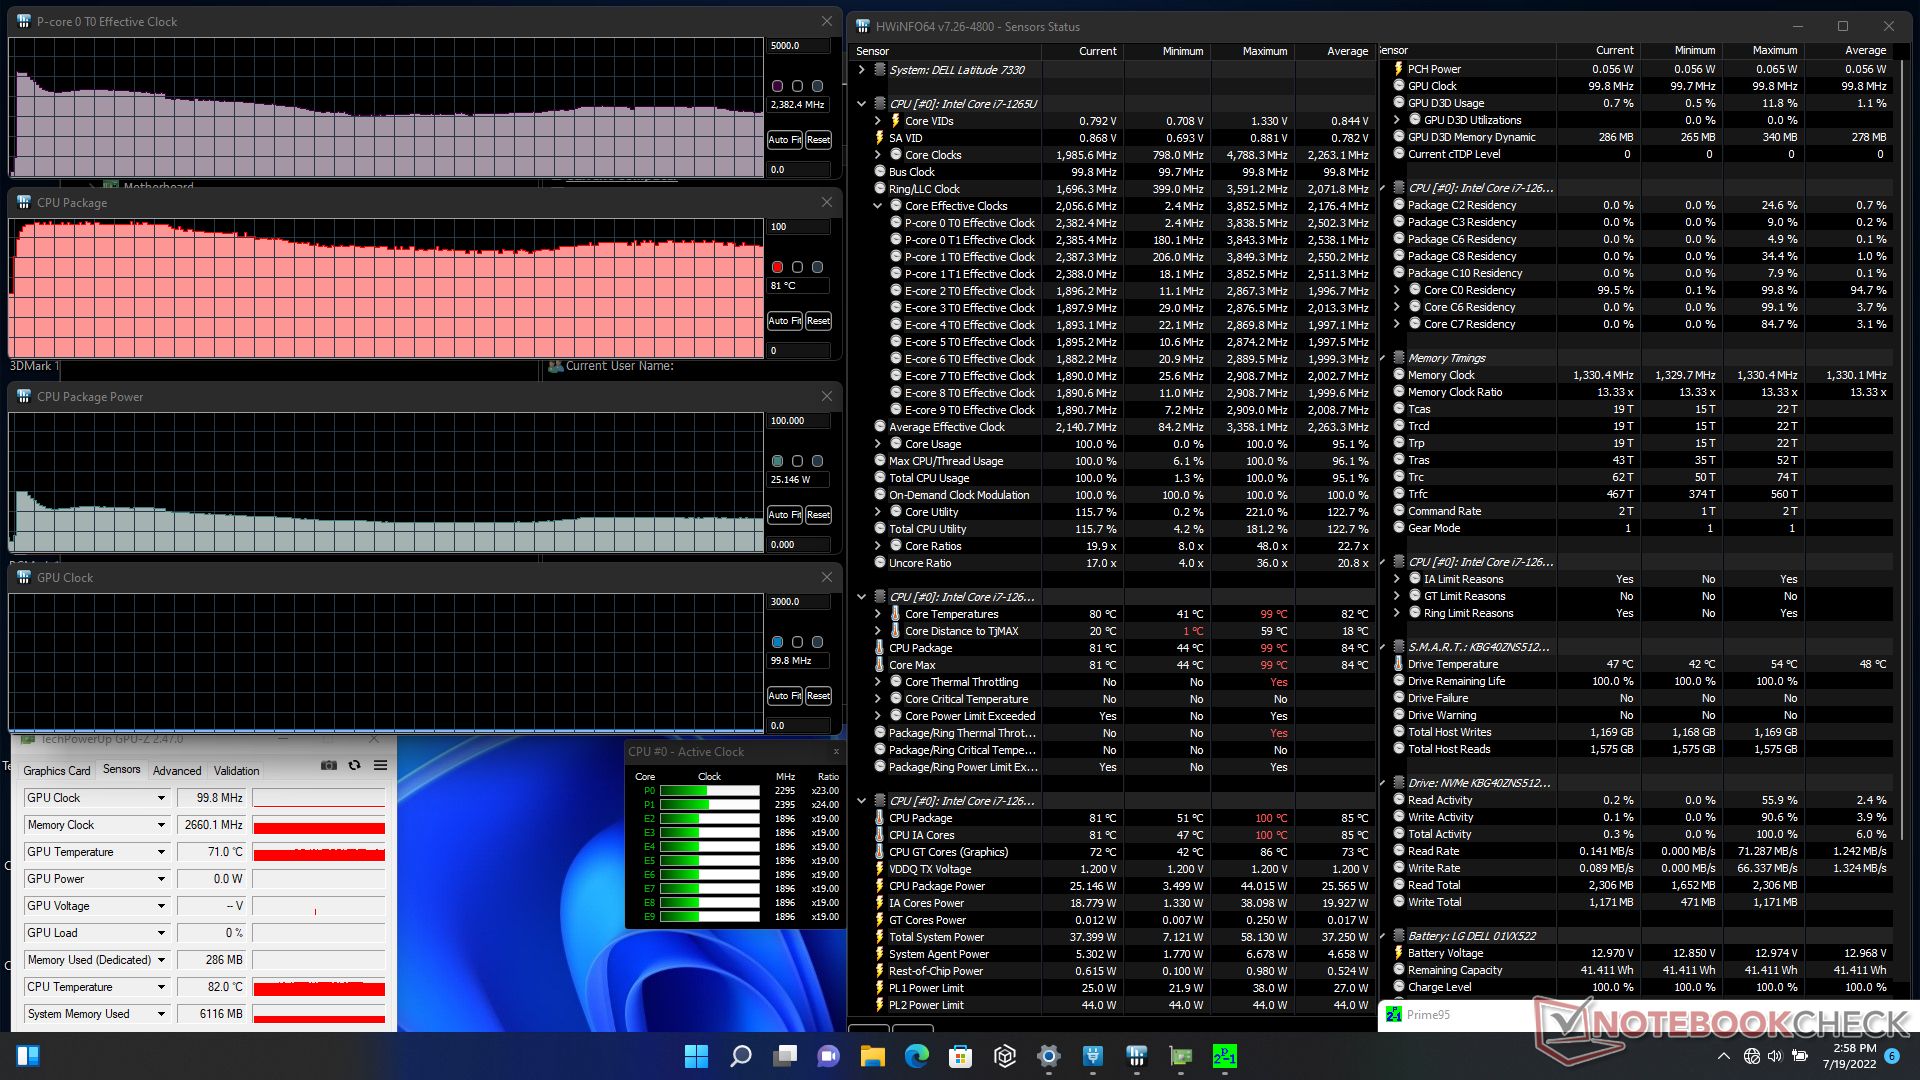
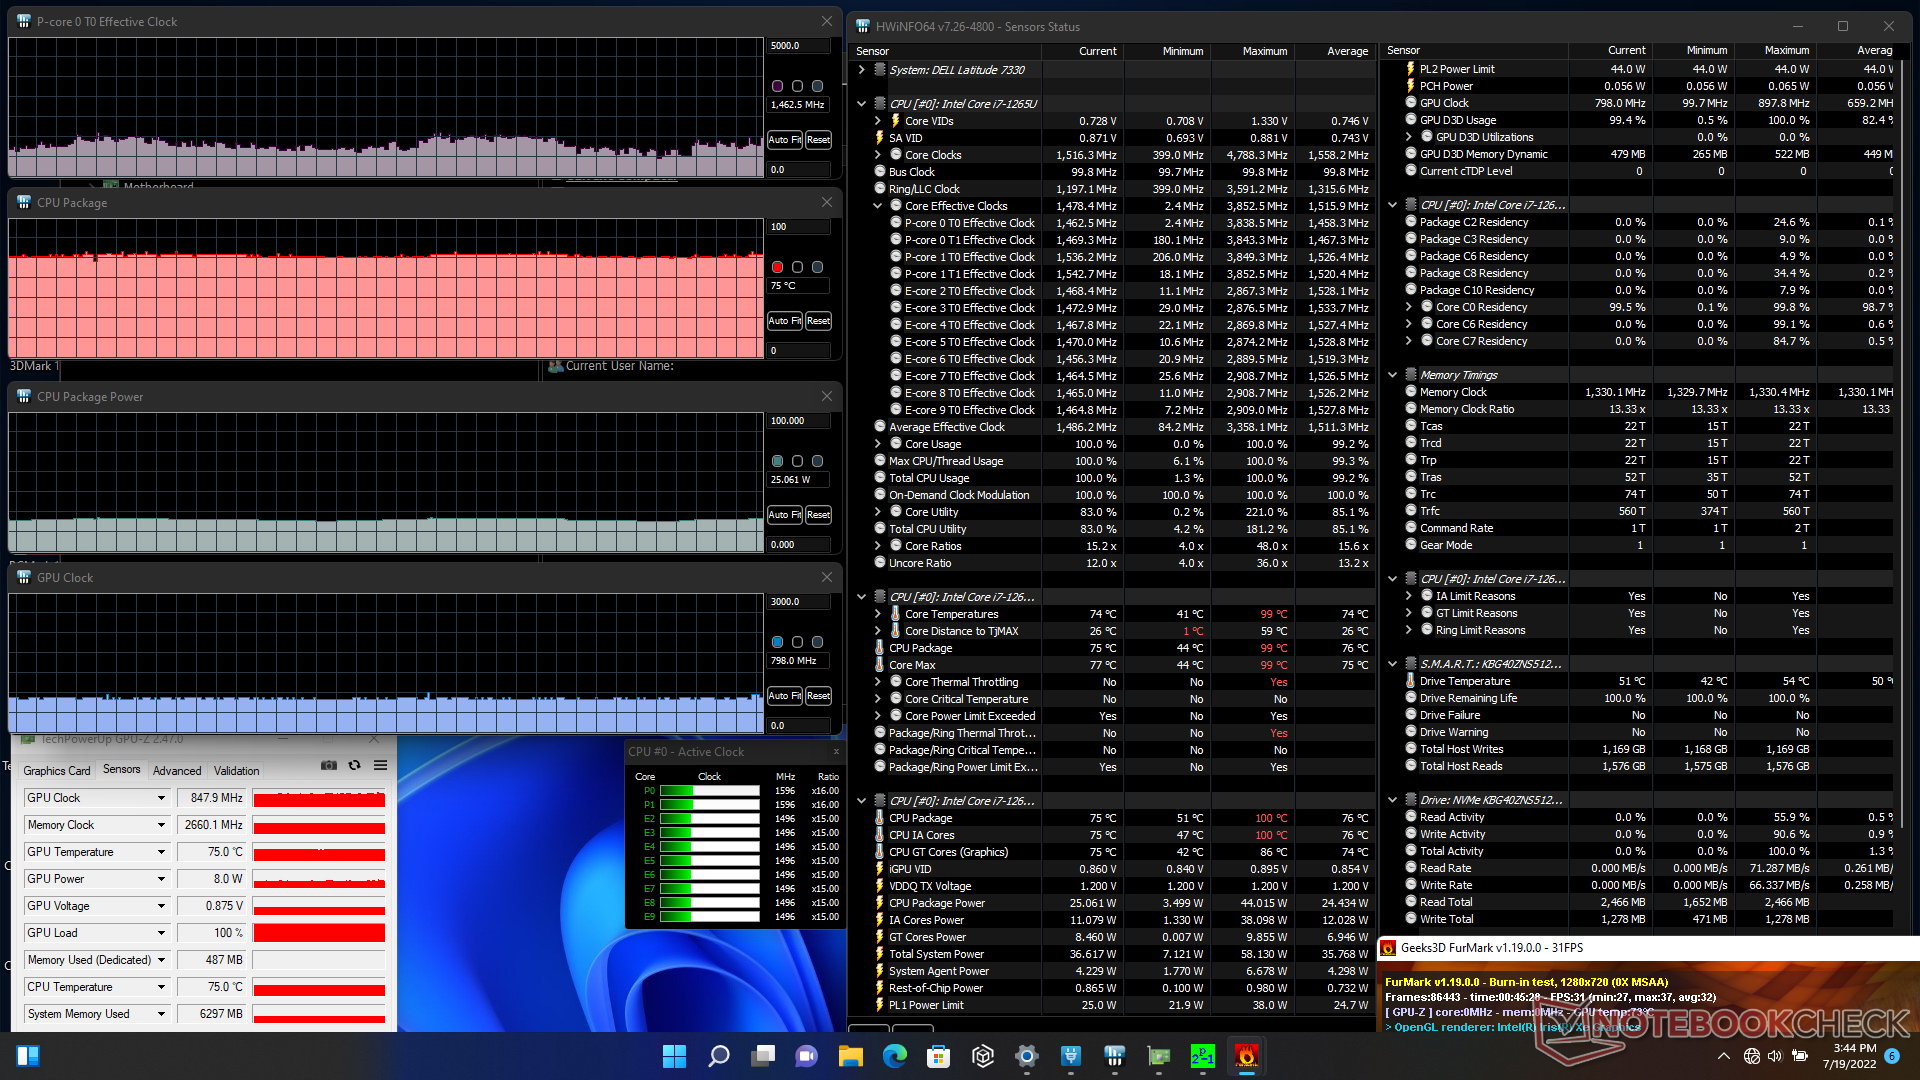
| Clock della CPU (GHz) | Clock della GPU (MHz) | Temperatura media della CPU (°C) | |
| Sistema inattivo | -- | -- | 38 |
| Stress Prime95 | 2,1 - 2,5 | -- | 72 - 85 |
| Prime95 + FurMark Stress | ~1,4 | 848 | 75 |
| Witcher 3 Stress | ~2.3 | 1247 | 83 |
Altoparlanti
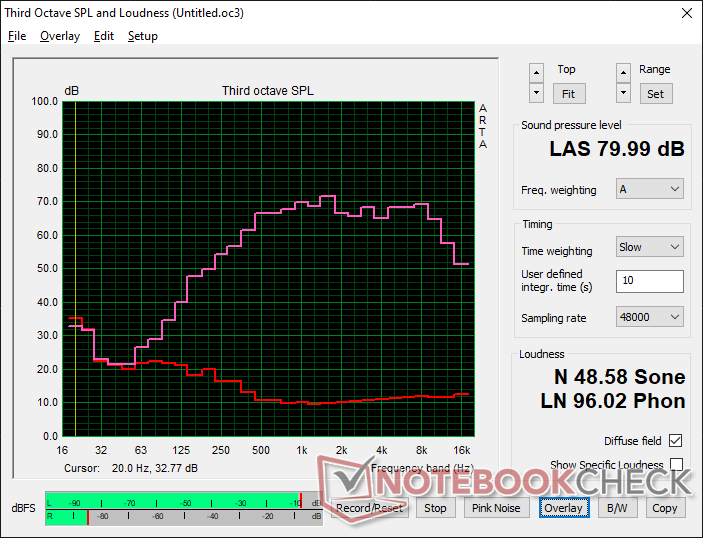
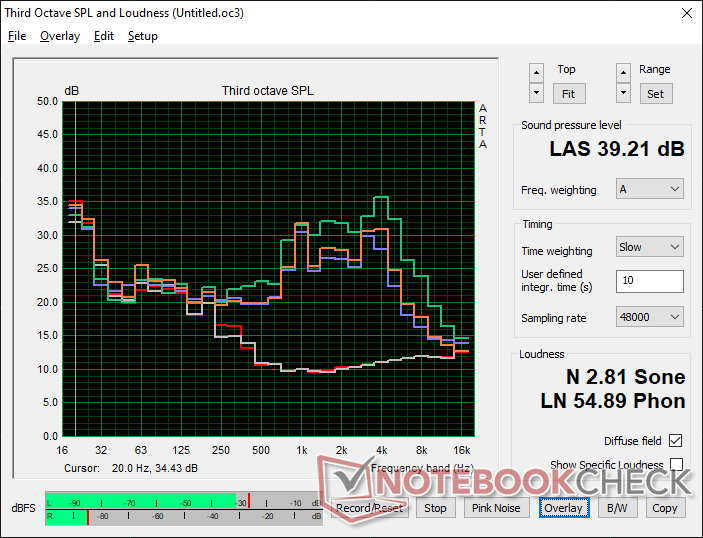
Dell Latitude 13 7330 analisi audio
(±) | potenza degli altiparlanti media ma buona (80 dB)
Bassi 100 - 315 Hz
(-) | quasi nessun basso - in media 18.6% inferiori alla media
(±) | la linearità dei bassi è media (8.6% delta rispetto alla precedente frequenza)
Medi 400 - 2000 Hz
(+) | medi bilanciati - solo only 2.7% rispetto alla media
(+) | medi lineari (5.1% delta rispetto alla precedente frequenza)
Alti 2 - 16 kHz
(+) | Alti bilanciati - appena 1.9% dalla media
(+) | alti lineari (4.1% delta rispetto alla precedente frequenza)
Nel complesso 100 - 16.000 Hz
(+) | suono nel complesso lineare (14.8% differenza dalla media)
Rispetto alla stessa classe
» 13% di tutti i dispositivi testati in questa classe è stato migliore, 4% simile, 84% peggiore
» Il migliore ha avuto un delta di 7%, medio di 21%, peggiore di 53%
Rispetto a tutti i dispositivi testati
» 20% di tutti i dispositivi testati in questa classe è stato migliore, 4% similare, 76% peggiore
» Il migliore ha avuto un delta di 4%, medio di 24%, peggiore di 134%
Apple MacBook Pro 16 2021 M1 Pro analisi audio
(+) | gli altoparlanti sono relativamente potenti (84.7 dB)
Bassi 100 - 315 Hz
(+) | bassi buoni - solo 3.8% dalla media
(+) | bassi in lineaa (5.2% delta rispetto alla precedente frequenza)
Medi 400 - 2000 Hz
(+) | medi bilanciati - solo only 1.3% rispetto alla media
(+) | medi lineari (2.1% delta rispetto alla precedente frequenza)
Alti 2 - 16 kHz
(+) | Alti bilanciati - appena 1.9% dalla media
(+) | alti lineari (2.7% delta rispetto alla precedente frequenza)
Nel complesso 100 - 16.000 Hz
(+) | suono nel complesso lineare (4.6% differenza dalla media)
Rispetto alla stessa classe
» 0% di tutti i dispositivi testati in questa classe è stato migliore, 0% simile, 100% peggiore
» Il migliore ha avuto un delta di 5%, medio di 17%, peggiore di 45%
Rispetto a tutti i dispositivi testati
» 0% di tutti i dispositivi testati in questa classe è stato migliore, 0% similare, 100% peggiore
» Il migliore ha avuto un delta di 4%, medio di 24%, peggiore di 134%
Gestione dell'energia
Consumo di energia - Più esigente
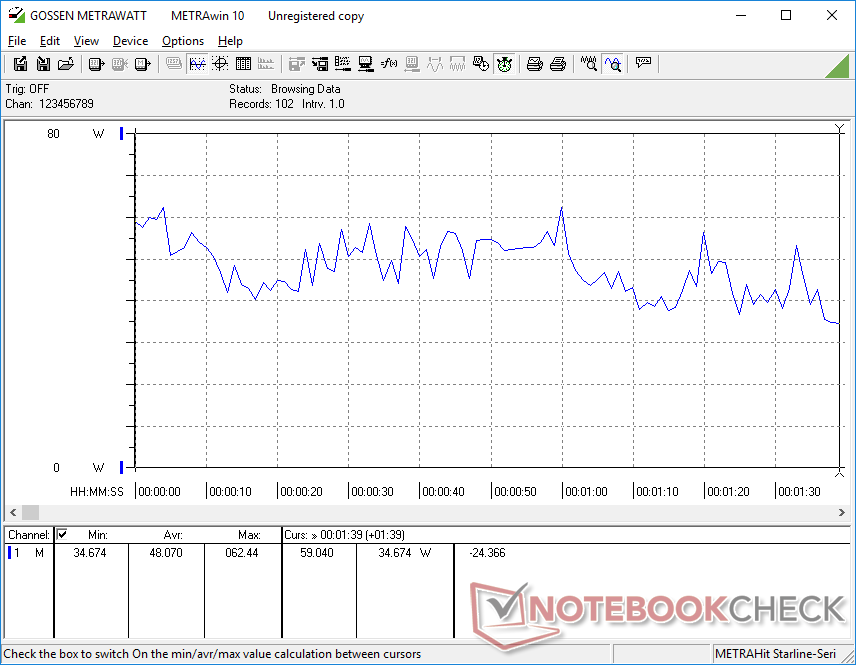
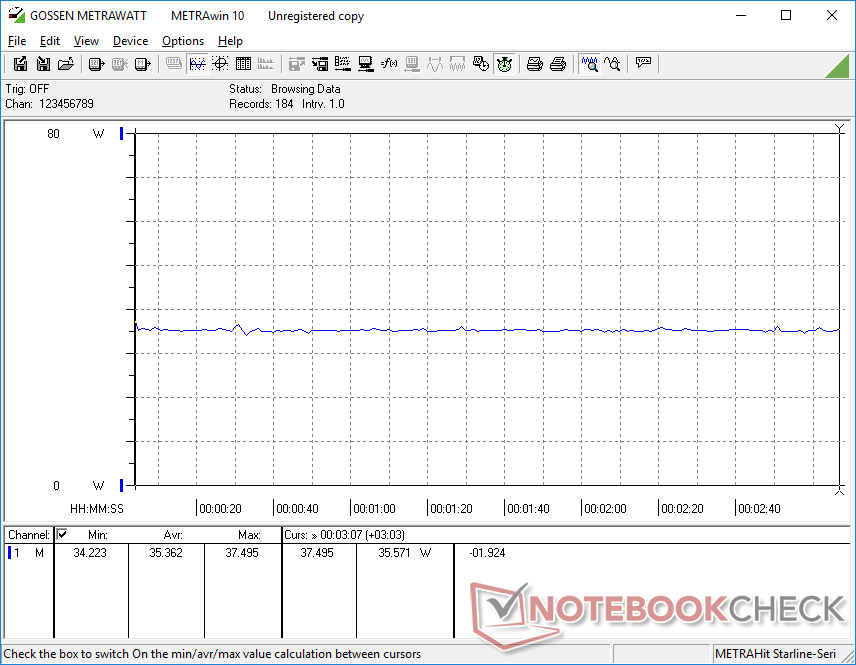
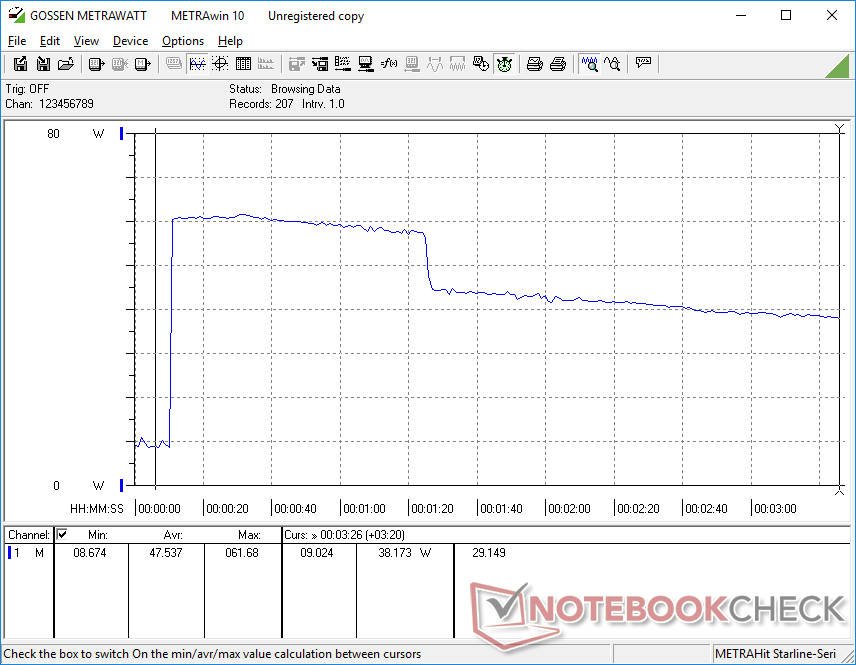
Il consumo energetico è generalmente più elevato rispetto ai portatili che utilizzano hardware di generazione precedente, il che è in linea con le nostre osservazioni sulla piattaforma Alder Lake nel suo complesso. Eseguendo 3DMark06 e Prime95, ad esempio, si consuma rispettivamente il 30% e il 21% in più di energia rispetto al Razer Book 13 con Core i7-1165G7. Le prestazioni saranno anche superiori, ma il rapporto prestazioni/watt non è così alto come speravamo.
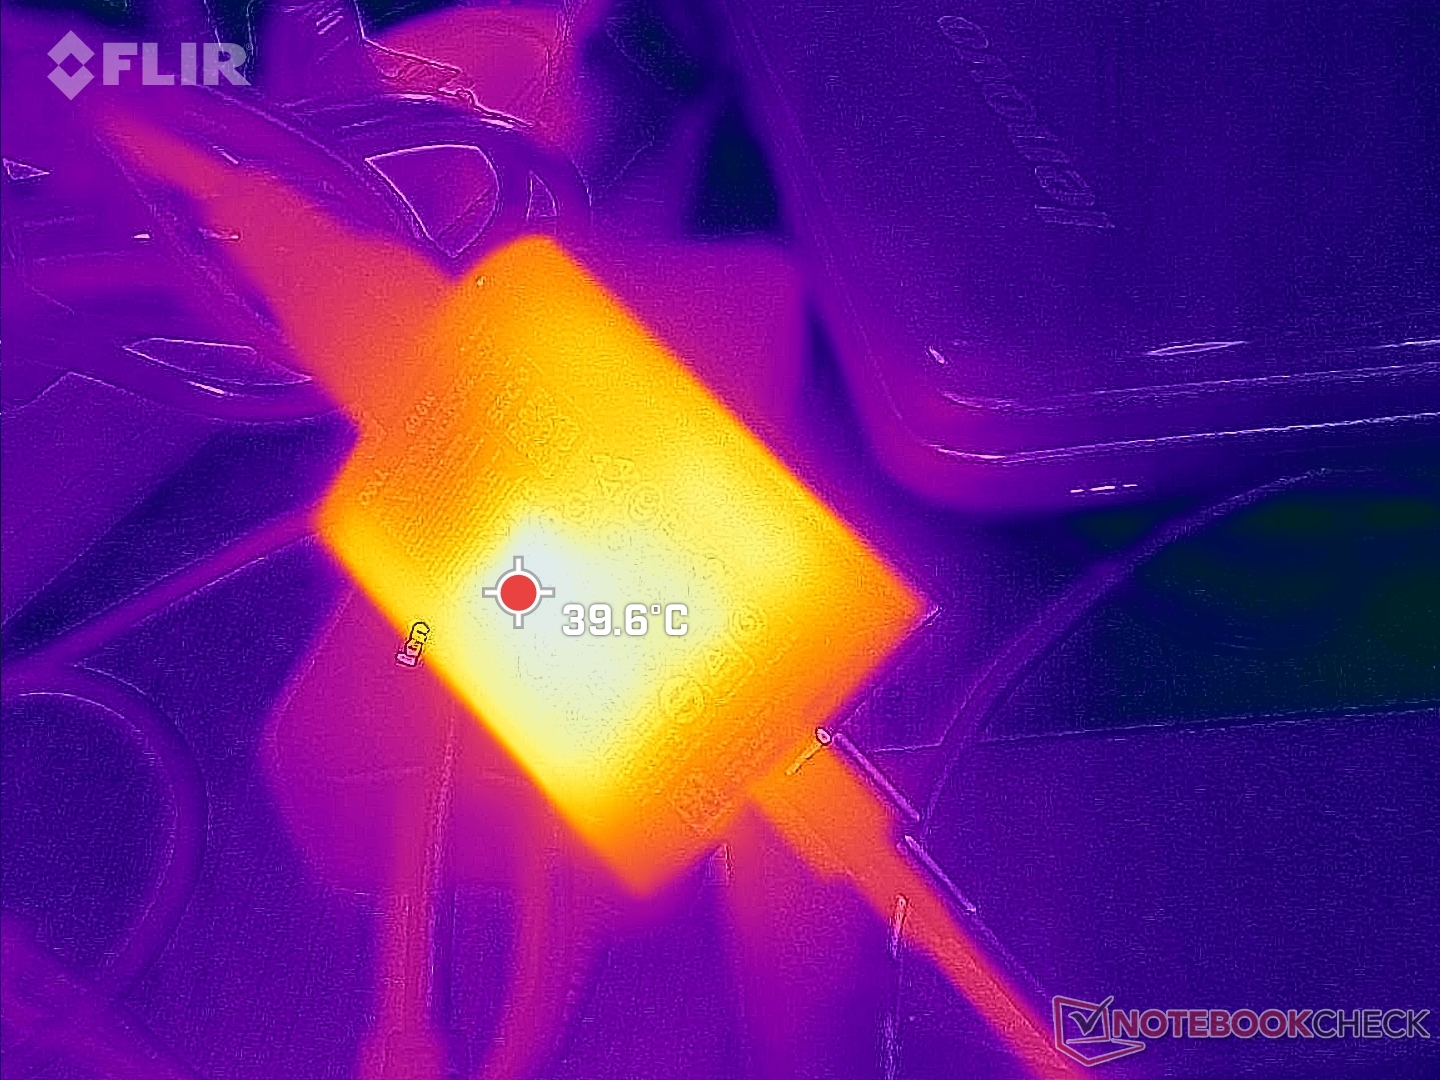
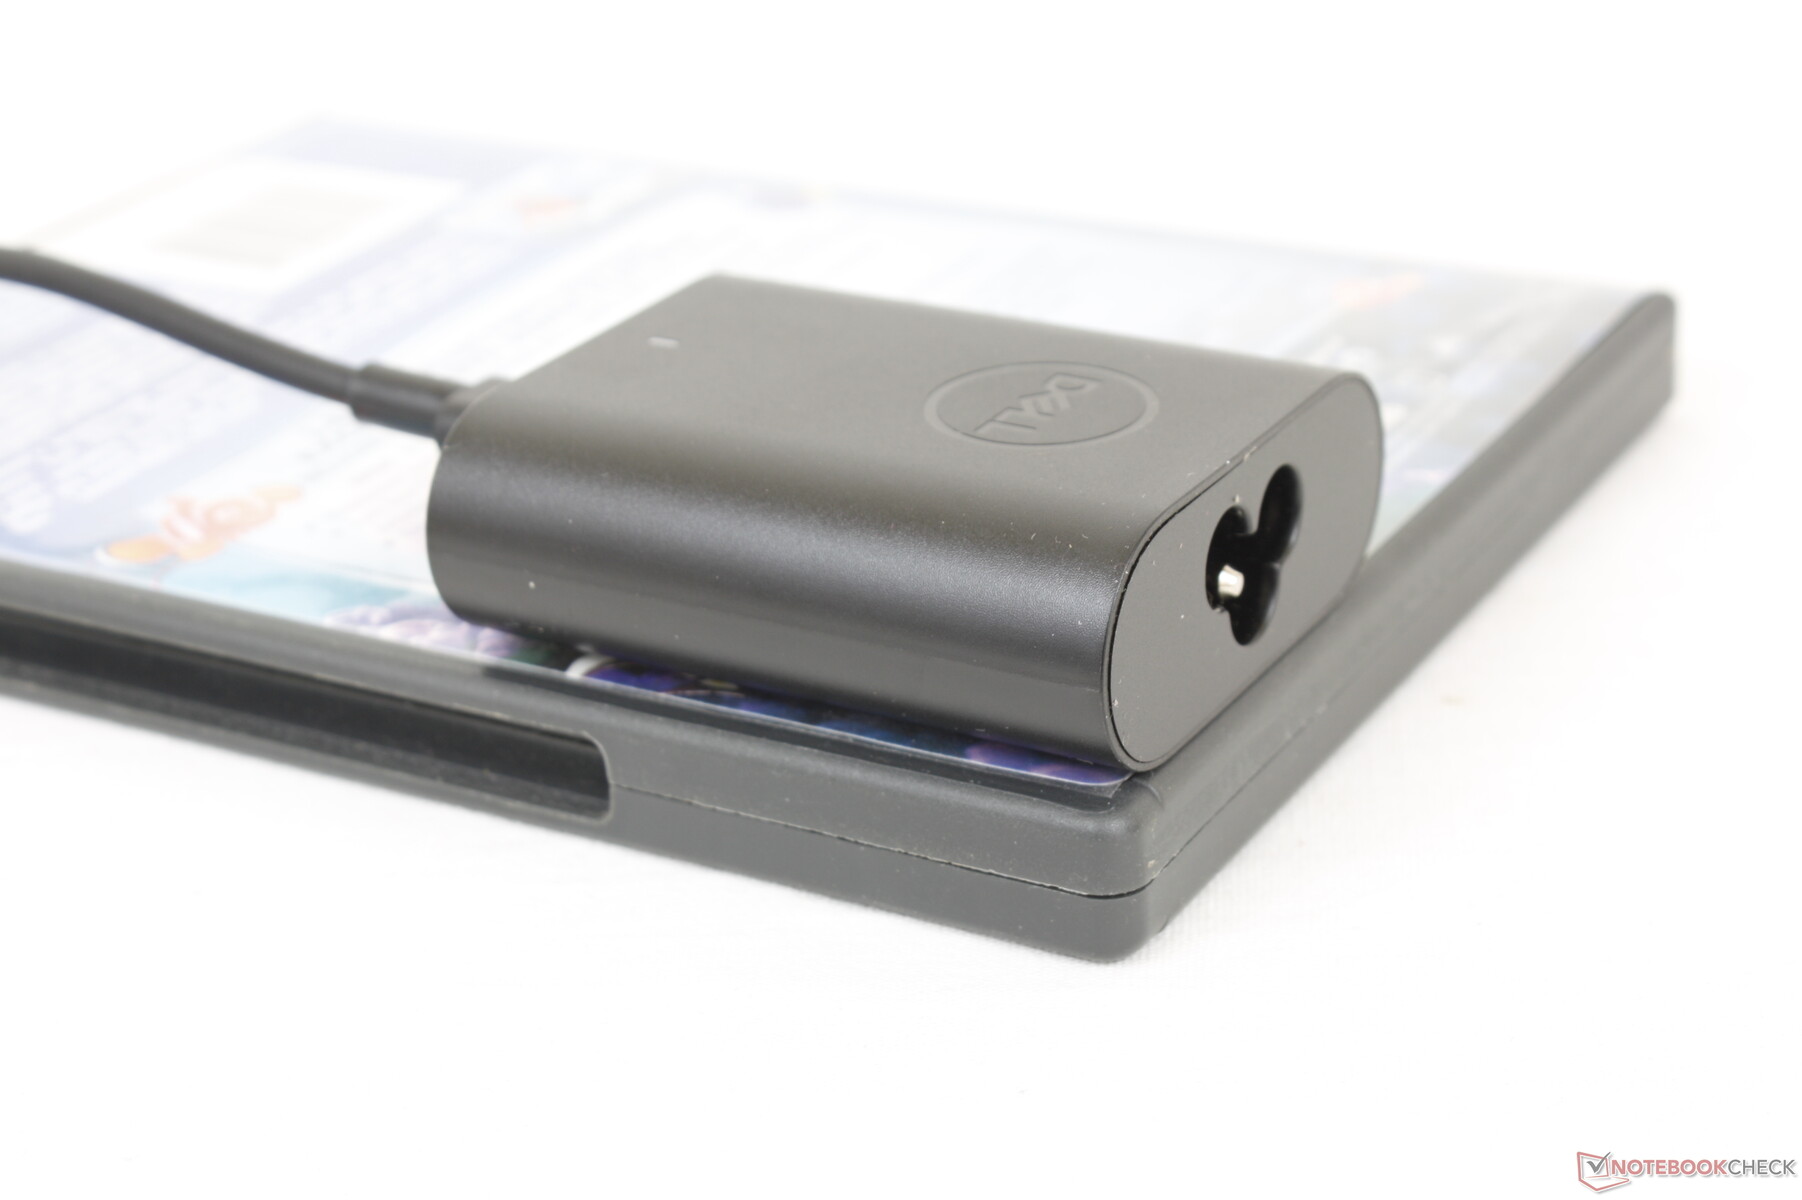
Siamo riusciti a registrare un consumo massimo di 63,6 W dall'adattatore CA USB-C da 60 W, molto piccolo (~6,6 x 5,5 x 2,2 cm). Questo valore è solo temporaneo, come mostra lo screenshot qui sotto, a causa dei limiti termici della soluzione di raffreddamento della CPU. Il sistema si ricarica comunque a una velocità decente quando è sottoposto a un forte stress di elaborazione.
Sono disponibili anche adattatori CA più grandi da 65 W o 90 W, a seconda della configurazione.

| Off / Standby | |
| Idle | |
| Sotto carico |
|
Leggenda:
min: | |
| Dell Latitude 13 7330 i7-1265U, Iris Xe G7 96EUs, Toshiba KBG40ZNS512G NVMe, IPS, 1920x1080, 13.3" | Lenovo ThinkPad X13 Yoga 20SX0004GE i7-10510U, UHD Graphics 620, Samsung SSD PM981a MZVLB512HBJQ, IPS, 1920x1080, 13.3" | Framework Laptop 13.5 12th Gen Intel i7-1260P, Iris Xe G7 96EUs, WDC PC SN730 SDBPNTY-512G, IPS, 2256x1504, 13.5" | Razer Book 13 FHD i7-1165G7, Iris Xe G7 96EUs, Samsung SSD PM981a MZVLB256HBHQ, IPS, 1920x1200, 13.4" | Dell Latitude 7310 i7-10610U, UHD Graphics 620, Samsung SSD PM981a MZVLB512HBJQ, IPS, 1920x1080, 13.3" | Microsoft Surface Laptop 4 13 Ryzen 5 R5 4680U, Vega 7, Samsung PM991 MZ9LQ256HBJQ, IPS, 2256x1504, 13.5" | |
|---|---|---|---|---|---|---|
| Power Consumption | -3% | -44% | -2% | 13% | -8% | |
| Idle Minimum * (Watt) | 2.8 | 3.4 -21% | 5.3 -89% | 3.3 -18% | 2.7 4% | 3.4 -21% |
| Idle Average * (Watt) | 4.8 | 4.98 -4% | 8.4 -75% | 6.4 -33% | 4.4 8% | 6.3 -31% |
| Idle Maximum * (Watt) | 7.3 | 8.1 -11% | 11.2 -53% | 7 4% | 4.8 34% | 8.1 -11% |
| Load Average * (Watt) | 48.1 | 37.2 23% | 57.4 -19% | 37.3 22% | 33.4 31% | 36.2 25% |
| Witcher 3 ultra * (Watt) | 35.4 | 46.7 -32% | 36.4 -3% | |||
| Load Maximum * (Watt) | 63.6 | 63.3 -0% | 61.2 4% | 53.7 16% | 69.7 -10% | 64.1 -1% |
* ... Meglio usare valori piccoli
Power Consumption Witcher 3 / Stresstest
Power Consumption external Monitor
Durata della batteria
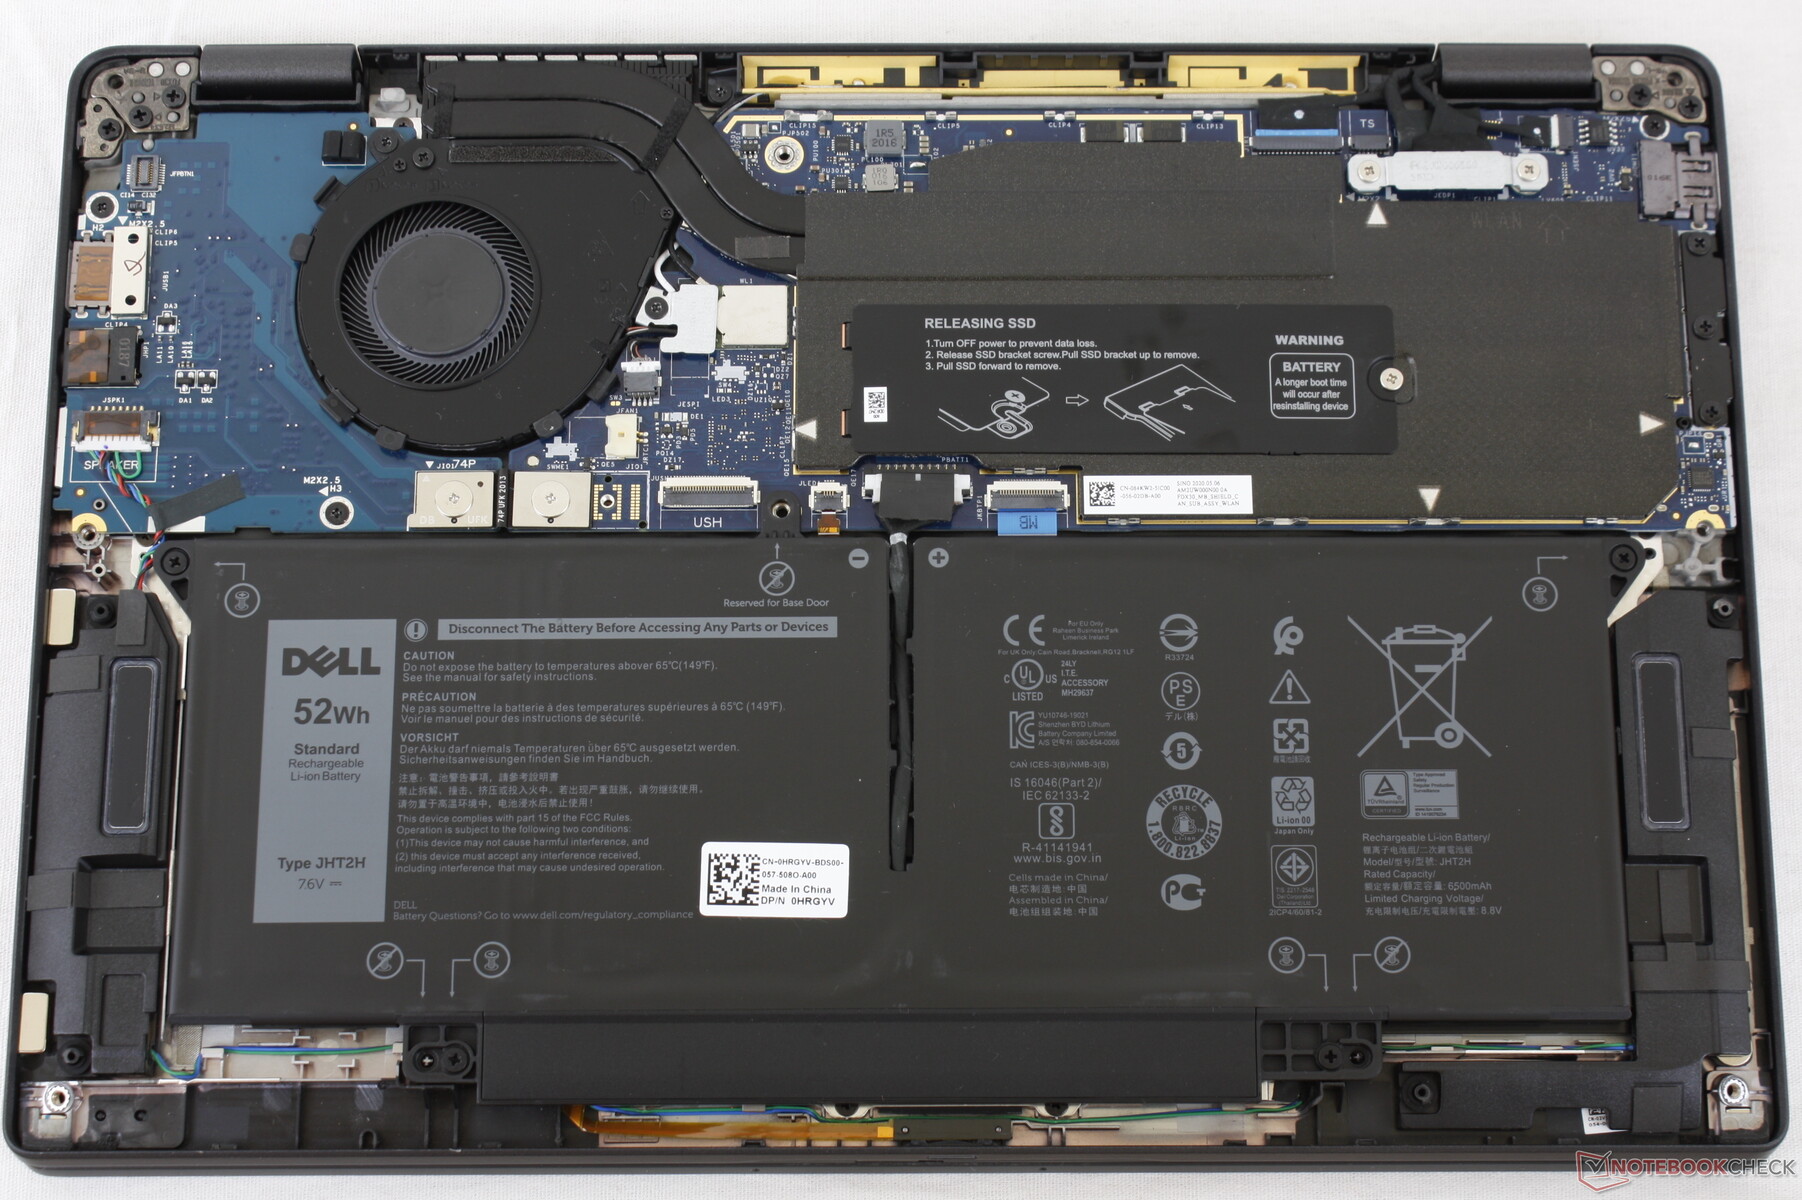
Gli utenti hanno la possibilità di configurare una batteria più leggera da 41 Wh o una più pesante ma più duratura da 58 Wh. Siamo riusciti a spremere poco più di 8 ore di utilizzo reale della WLAN dalla nostra unità di test da 41 Wh, che dovrebbe essere più che sufficiente per la maggior parte degli utenti.
La ricarica da vuoto a pieno regime con l'adattatore CA USB-C in dotazione richiede dalle 2 alle 2,5 ore.
| Dell Latitude 13 7330 i7-1265U, Iris Xe G7 96EUs, 41 Wh | Lenovo ThinkPad X13 Yoga 20SX0004GE i7-10510U, UHD Graphics 620, 50 Wh | Framework Laptop 13.5 12th Gen Intel i7-1260P, Iris Xe G7 96EUs, 55 Wh | Razer Book 13 FHD i7-1165G7, Iris Xe G7 96EUs, 55 Wh | Dell Latitude 7310 i7-10610U, UHD Graphics 620, 52 Wh | Microsoft Surface Laptop 4 13 Ryzen 5 R5 4680U, Vega 7, 47.4 Wh | |
|---|---|---|---|---|---|---|
| Autonomia della batteria | 53% | -10% | 65% | 51% | 31% | |
| Reader / Idle (h) | 21.9 | 36.8 68% | 37.4 71% | |||
| WiFi v1.3 (h) | 8.3 | 8.2 -1% | 7.5 -10% | 14.8 78% | 12.6 52% | 10.9 31% |
| Load (h) | 1.4 | 2.9 107% | 2.1 50% | 1.8 29% |
Pro
Contro
Verdetto - Opzioni, opzioni, opzioni
L'elevato livello di configurazioni contribuisce a differenziare Latitude 7330 da altri subnotebook aziendali. Caratteristiche come il lettore MicroSD, la connettività 4G LTE, la webcam a 1080p, il fattore di forma 2-in-1, la fibra di carbonio, le dimensioni della batteria e persino l'adattatore CA sono tutte opzionali a seconda delle esigenze dell'acquirente. Se i carichi di lavoro quotidiani non richiedono determinate caratteristiche, è possibile ometterle al momento dell'acquisto per ottenere un peso complessivo inferiore. Altri portatili ultraleggeri, come l'LG Gram 13 o la serie X30 di Toshiba, hanno un numero di opzioni configurabili molto inferiore, a causa delle dimensioni di produzione più ridotte rispetto alla serie Dell Latitude.
La serie Latitude 7330 punta molto sulle opzioni configurabili e sulle personalizzazioni per adattarsi meglio alle esigenze specifiche dell'utente. Tuttavia, il suo formato 16:9 comincia a mostrare la sua età.
Le alternative più vicine al modello Latitude 7330 sono i modelli HP EliteBook 830 G8 e G9, che offrono caratteristiche come un rapporto di aspetto 16:10 più ampio, una webcam da 5 MP più nitida, moduli RAM rimovibili e opzioni di visualizzazione a 1000 nit significativamente più luminose, tutte caratteristiche che non sono disponibili su Latitude 7330. Tuttavia, sono leggermente più pesanti del nostro Dell, ma le sue caratteristiche più forti potrebbero valere l'aumento di peso per alcuni utenti.
Prezzo e disponibilità
Latitude 7330 non è ancora disponibile su Amazon o Best Buy. Si consiglia di acquistare direttamente da Dell dove i prezzi si aggirano attualmente intorno ai 2000 dollari.
Dell Latitude 13 7330
- 07/22/2022 v7 (old)
Allen Ngo
Price comparison

