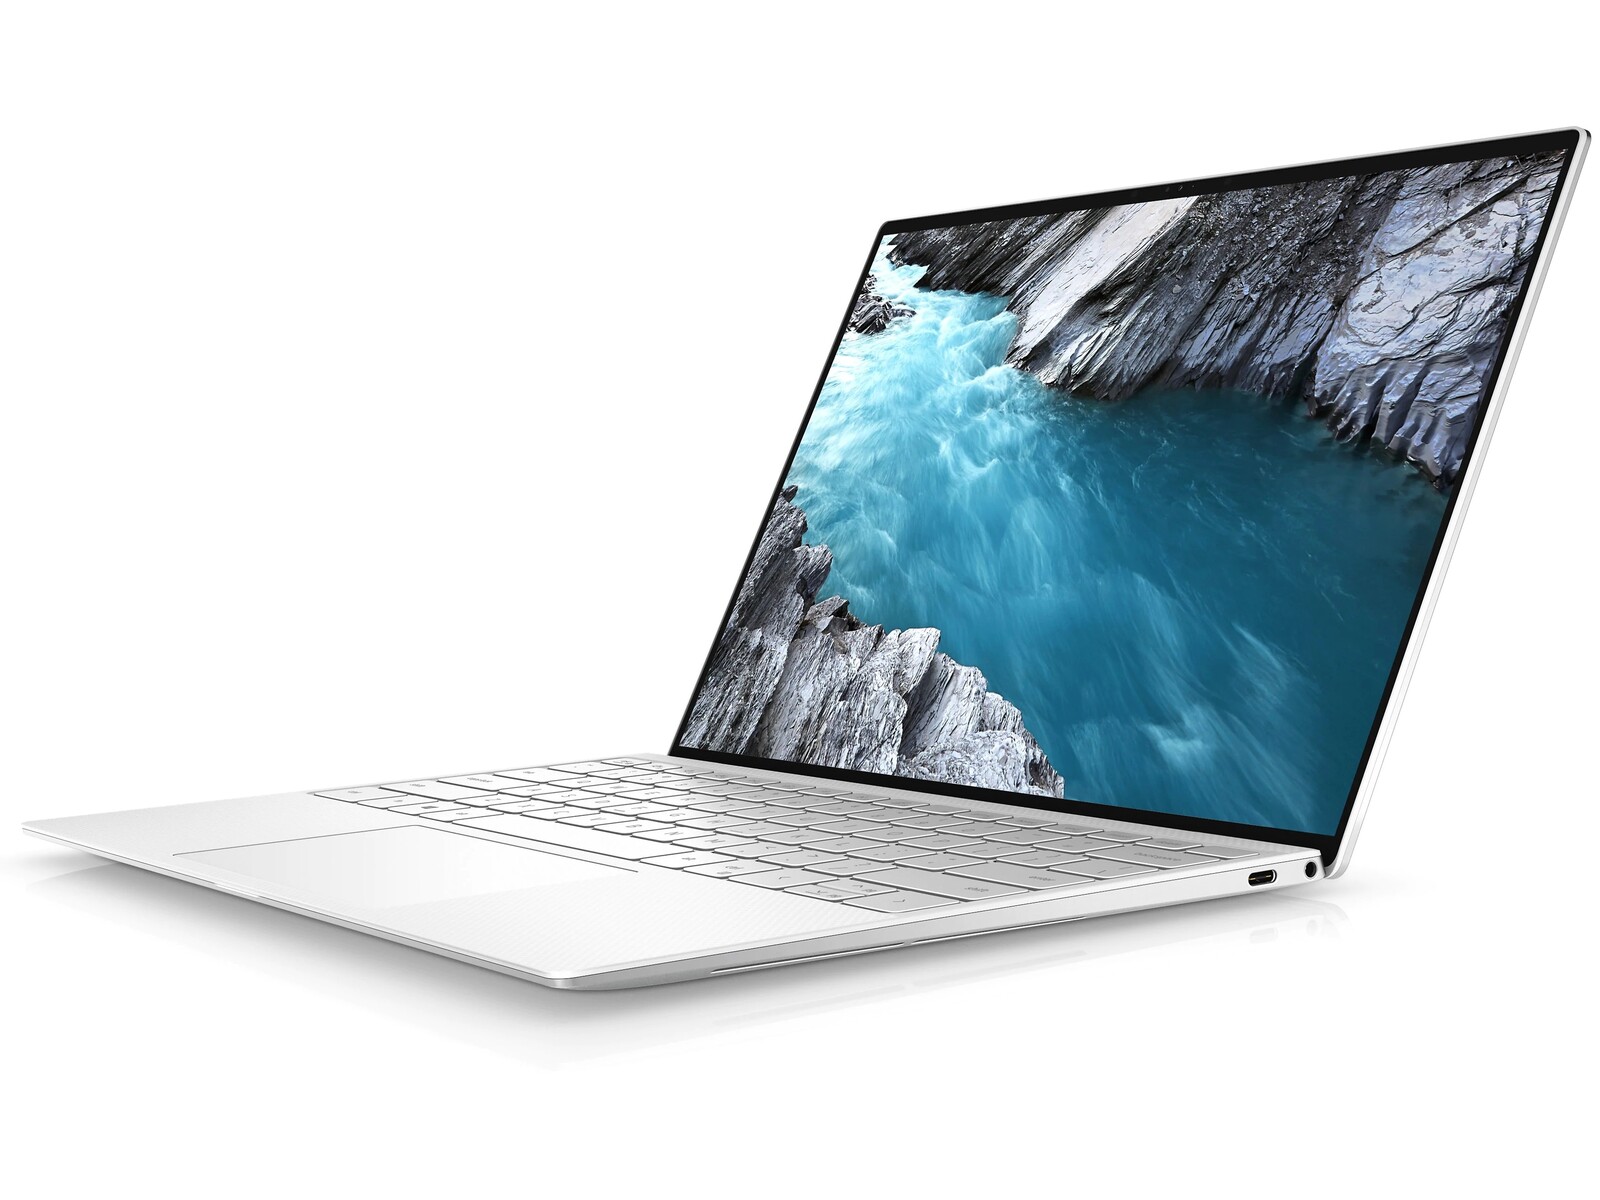
Recensione del computer portatile Dell XPS 13 9310 OLED: È meglio della versione IPS?
L'XPS 13 9310 è stato lanciato alla fine dell'anno scorso insieme alla serie Intel 11° gen Tiger Lake. Le configurazioni di allora includevano opzioni FHD (1920 x 1200) e 4K (3840 x 2400) tutte con pannelli IPS. Dell aveva promesso che l'OLED sarebbe arrivato in una data successiva per integrare le versioni IPS esistenti.
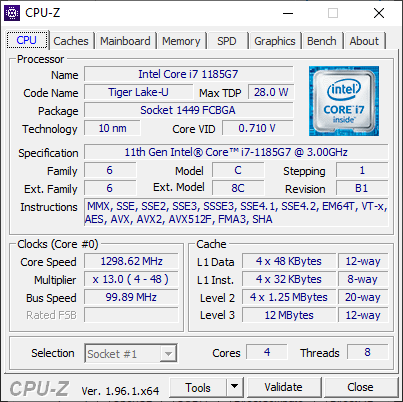
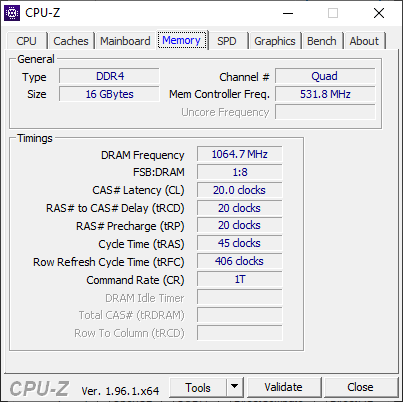
Ora che a metà del 2021, la versione OLED promessa è finalmente disponibile per circa $1650 USD completa di CPU Core i7-1185G7, 16 GB di RAM saldata e touchscreen con risoluzione 3.5K (3456 x 2160). È vero che altri portatili di punta hanno avuto versioni OLED da molto più tempo, ma questa è la prima volta che lo vediamo su un formato 16:10 da 13,4".
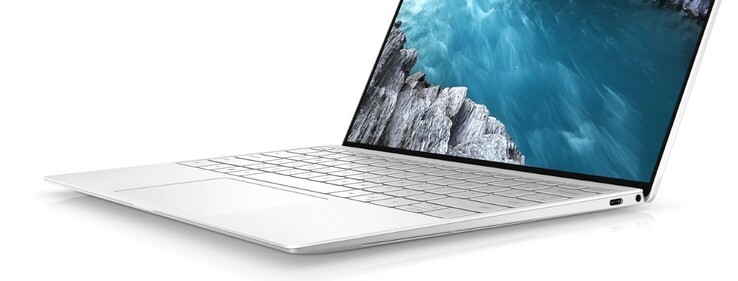
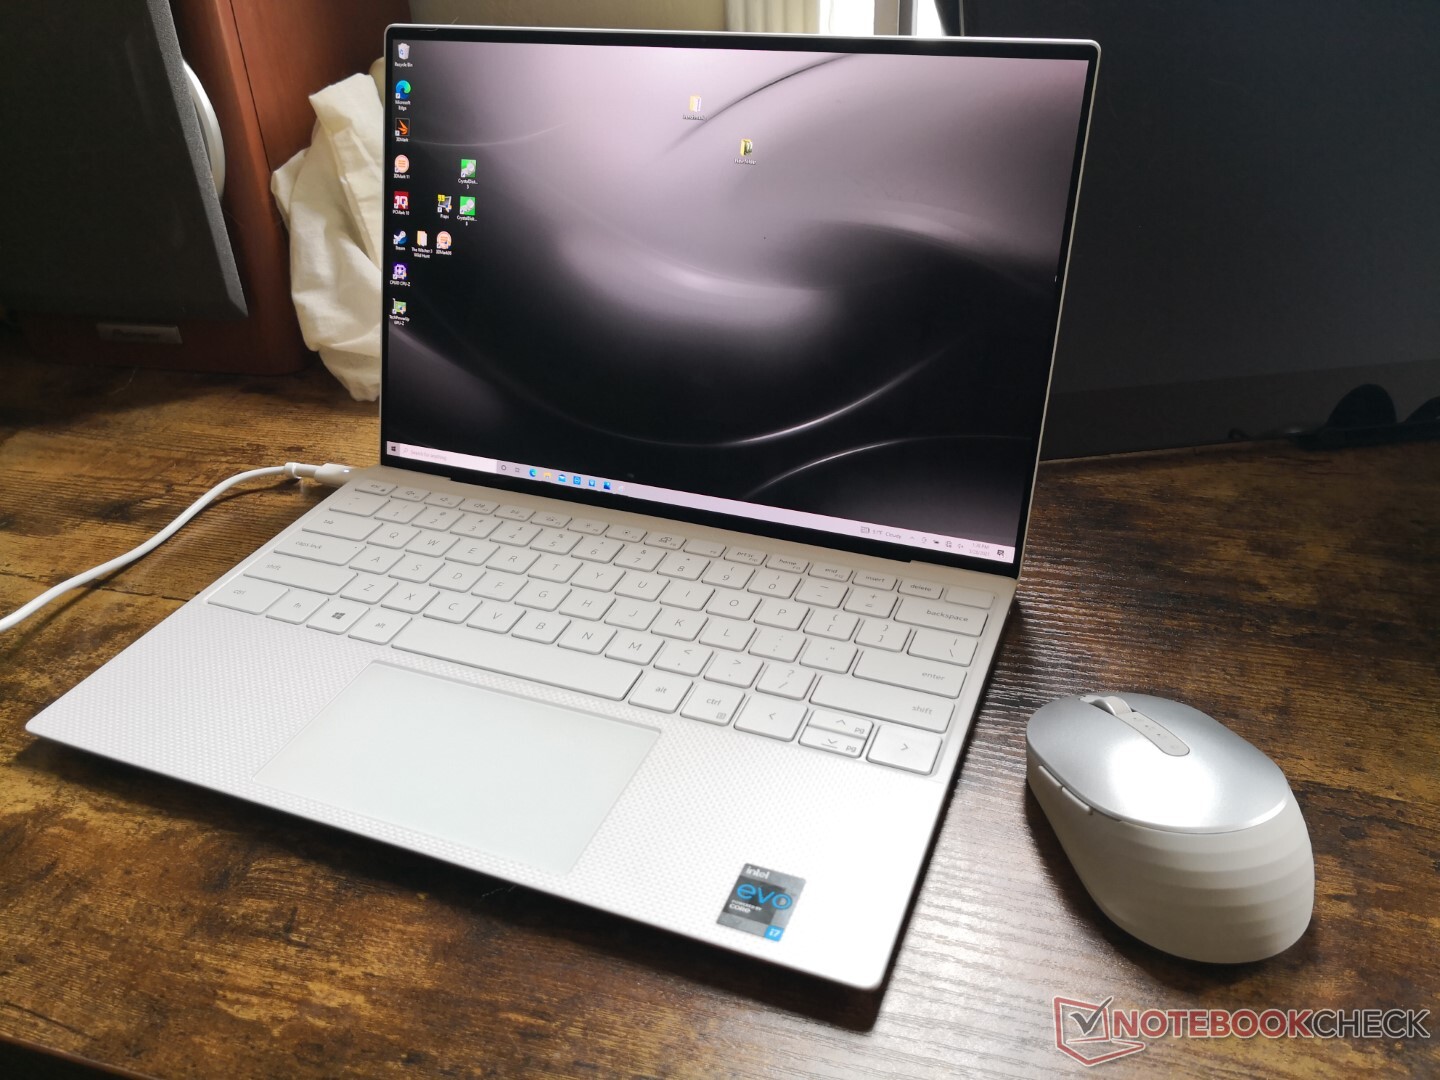
Consigliamo di controllare le nostre tre precedenti recensioni sul XPS 13 9310 FHD, XPS 13 9310 4Ke XPS 13 9300 per saperne di più sul telaio e le sue caratteristiche, dato che l'XPS 13 9310 OLED è esteticamente identico a queste configurazioni. Questa recensione si concentrerà maggiormente sul touchscreen OLED e su ciò che gli utenti possono aspettarsi da esso rispetto alle solite opzioni XPS 13 IPS.
Altre recensioni di Dell:
Confronto con i potenziali concorrenti
Punteggio | Data | Modello | Peso | Altezza | Dimensione | Risoluzione | Prezzo |
|---|---|---|---|---|---|---|---|
| 88.3 % v7 (old) | 06/2021 | Dell XPS 13 9310 OLED i7-1185G7, Iris Xe G7 96EUs | 1.2 kg | 14.8 mm | 13.40" | 3456x2160 | |
| 87.4 % v7 (old) | 12/2020 | Dell XPS 13 9310 Core i7 4K i7-1185G7, Iris Xe G7 96EUs | 1.3 kg | 14.8 mm | 13.40" | 3840x2400 | |
| 88.1 % v7 (old) | 10/2020 | Dell XPS 13 9310 Core i7 FHD i7-1165G7, Iris Xe G7 96EUs | 1.3 kg | 14.8 mm | 13.40" | 1920x1200 | |
| 85.9 % v7 (old) | 11/2019 | Dell XPS 13 7390 Core i7-10710U i7-10710U, UHD Graphics 620 | 1.2 kg | 11.6 mm | 13.30" | 3840x2160 | |
| 86.9 % v7 (old) | 04/2021 | MSI Summit E13 Flip Evo A11MT i7-1185G7, Iris Xe G7 96EUs | 1.4 kg | 14.9 mm | 13.40" | 1920x1200 | |
v (old) | 09/2021 | Asus ZenBook 13 OLED UM325UA R7 5700U, Vega 8 | 1.1 kg | 14.8 mm | 13.30" | 1920x1080 |
Case
Lettore di schede SD
| SD Card Reader | |
| average JPG Copy Test (av. of 3 runs) | |
| Dell XPS 13 9310 Core i7 FHD (Toshiba Exceria Pro M501 64 GB UHS-II) | |
| Dell XPS 13 9310 Core i7 4K (Toshiba Exceria Pro M501 32 GB UHS-II) | |
| Dell XPS 13 9310 OLED (AV PRO microSD 128 GB V60) | |
| Dell XPS 13 7390 Core i7-10710U (Toshiba Exceria Pro M501 64 GB UHS-II) | |
| MSI Summit E13 Flip Evo A11MT (AV PRO microSD 128 GB V60) | |
| maximum AS SSD Seq Read Test (1GB) | |
| Dell XPS 13 9310 Core i7 4K (Toshiba Exceria Pro M501 32 GB UHS-II) | |
| Dell XPS 13 9310 Core i7 FHD (Toshiba Exceria Pro M501 64 GB UHS-II) | |
| Dell XPS 13 7390 Core i7-10710U (Toshiba Exceria Pro M501 64 GB UHS-II) | |
| Dell XPS 13 9310 OLED (AV PRO microSD 128 GB V60) | |
| MSI Summit E13 Flip Evo A11MT (AV PRO microSD 128 GB V60) | |
Comunicazioni
La velocità di trasmissione è più lenta di quella che abbiamo sperimentato sui nostri vecchi XPS 13 anche dopo aver ripetuto questo test più volte. In pratica, però, la connessione rimane stabile e affidabile per lo streaming e la navigazione.
Webcam


Display
Poiché la risoluzione nativa è 3.5K (3456 x 2160) invece di 4K (3840 x 2400), i PPI sono leggermente inferiori rispetto alla configurazione XPS 13 IPS 4K (304 contro 338). Sospettiamo che la risoluzione sia inferiore perché attualmente non ci sono pannelli OLED 4K disponibili nel formato 16:10 da 13,4". Tuttavia, questo può andare a favore dell'OLED in alcuni casi, poiché il testo può essere troppo piccolo sullo schermo 4K 338 PPI.
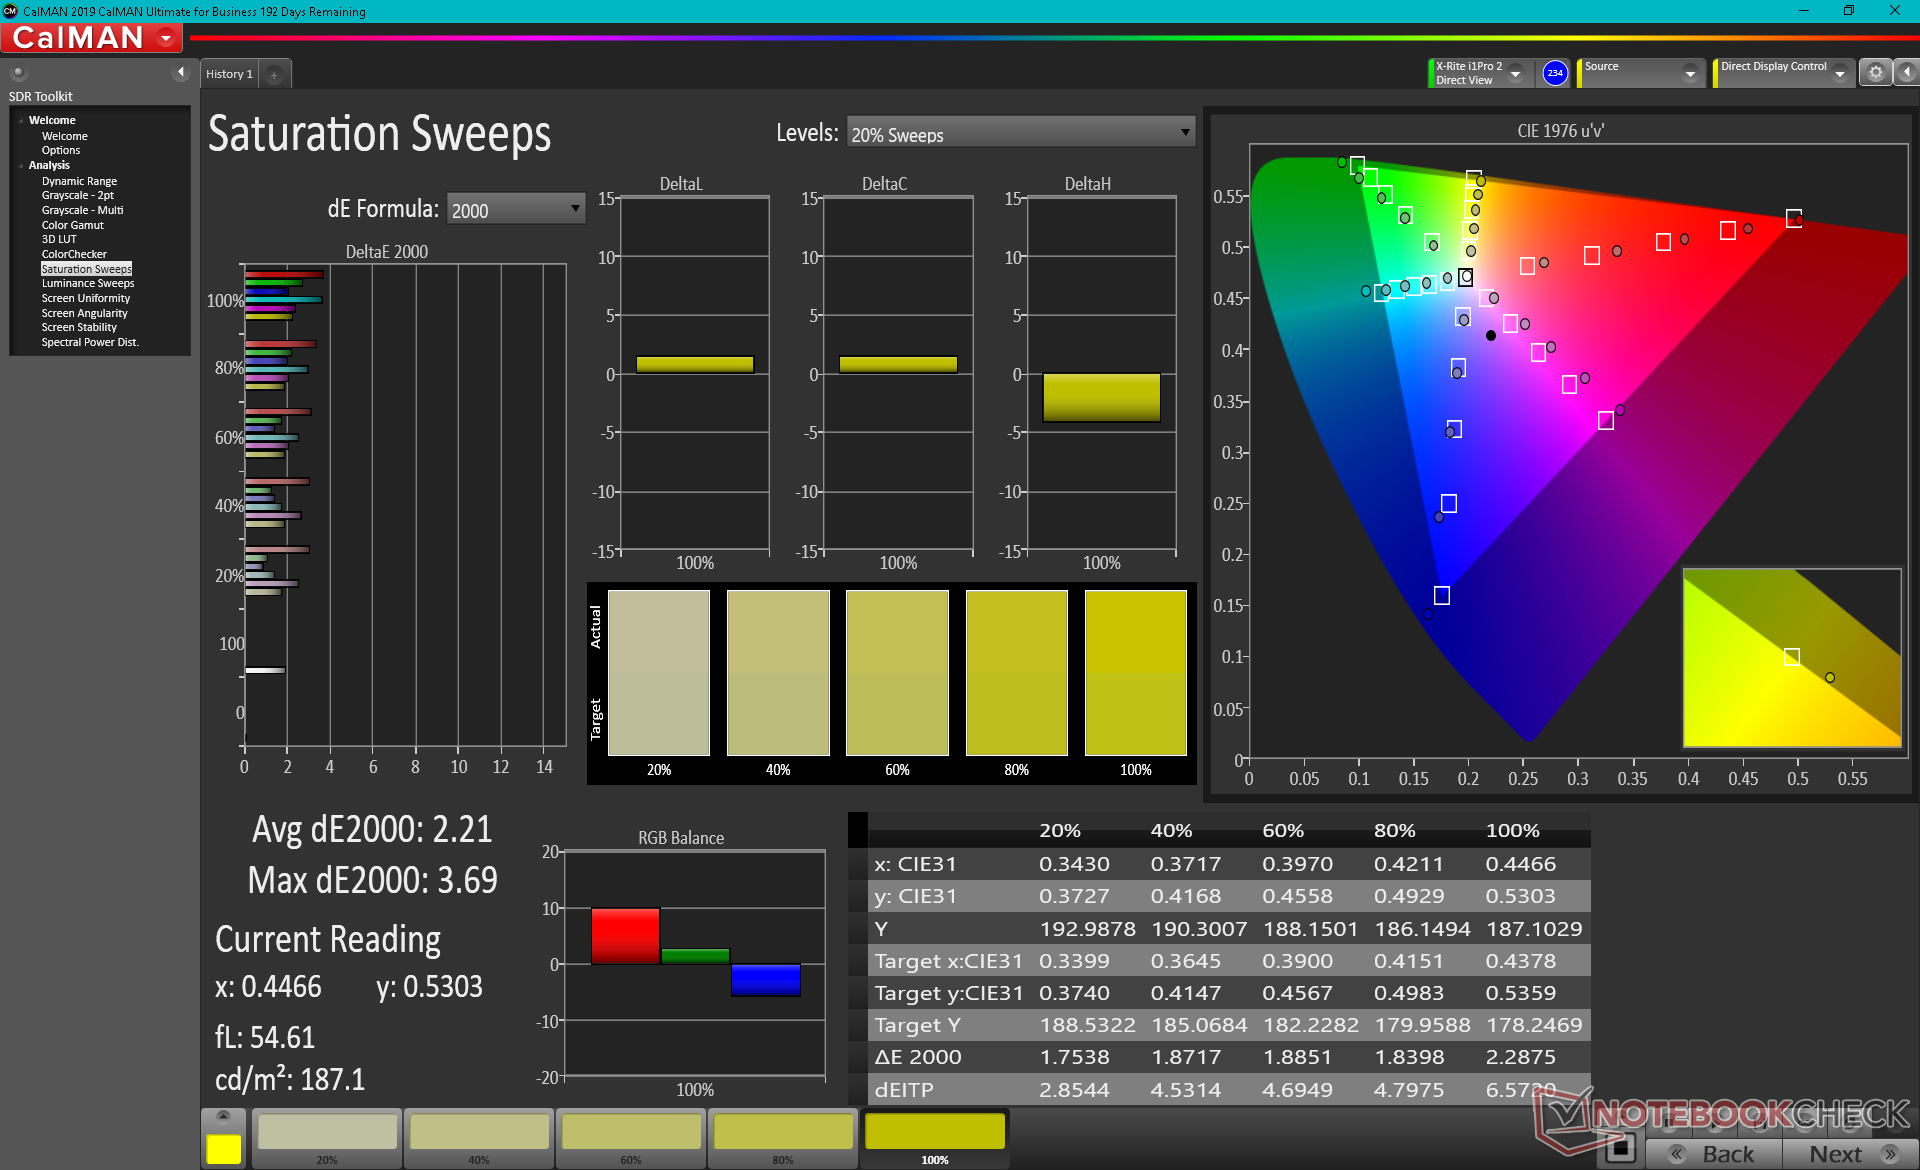
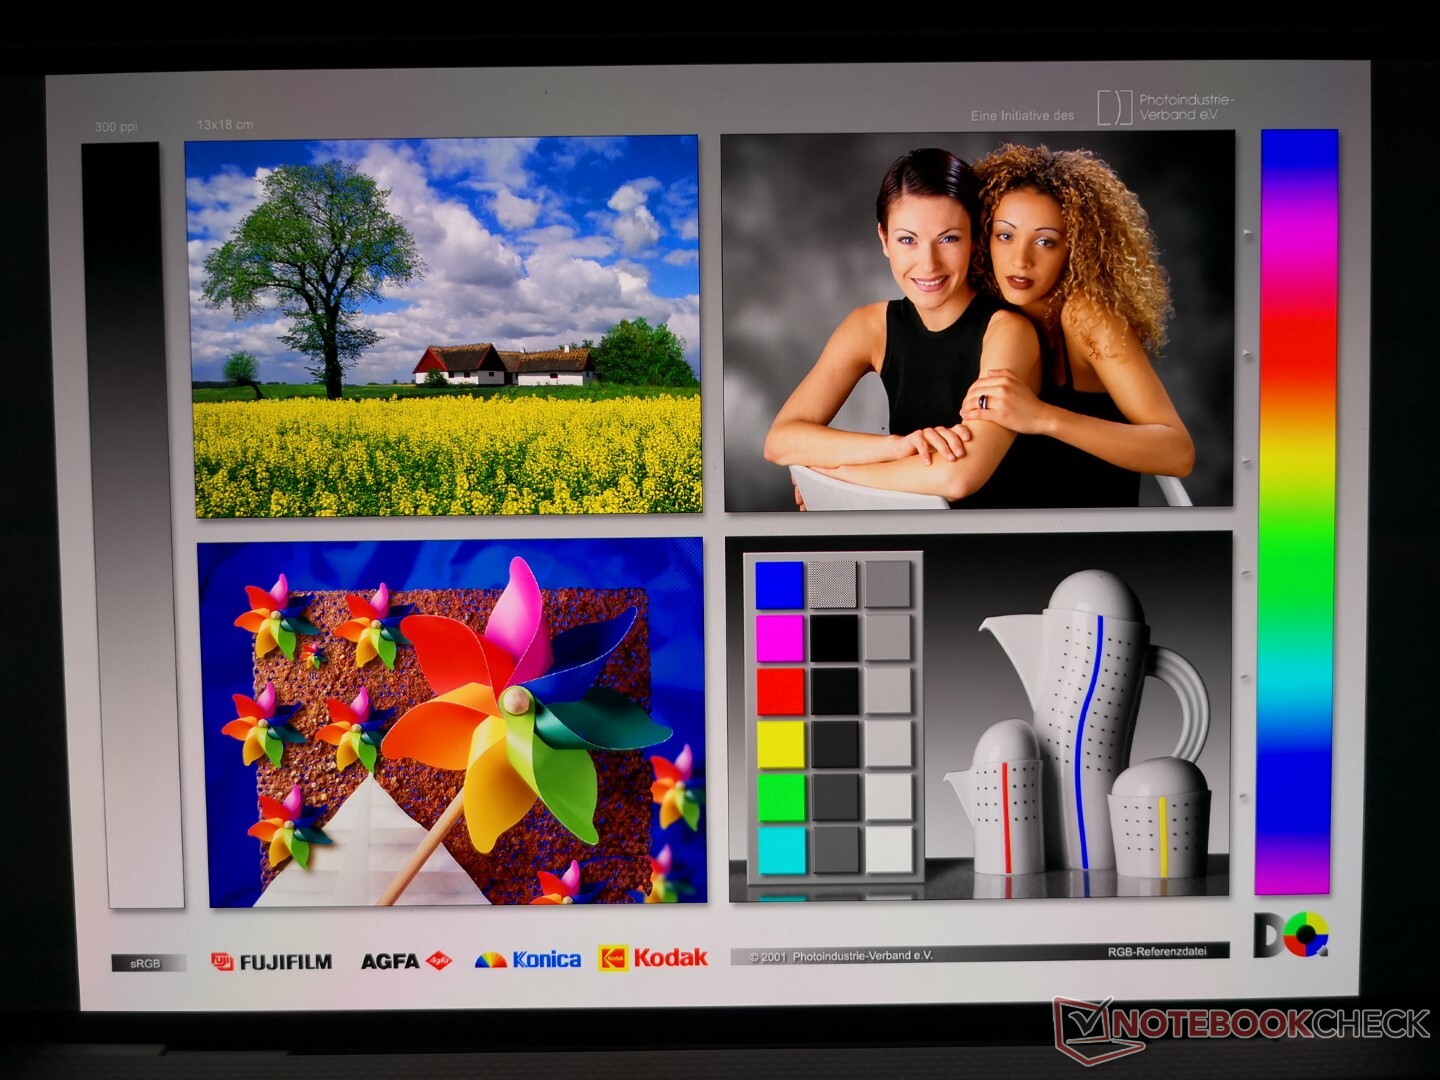
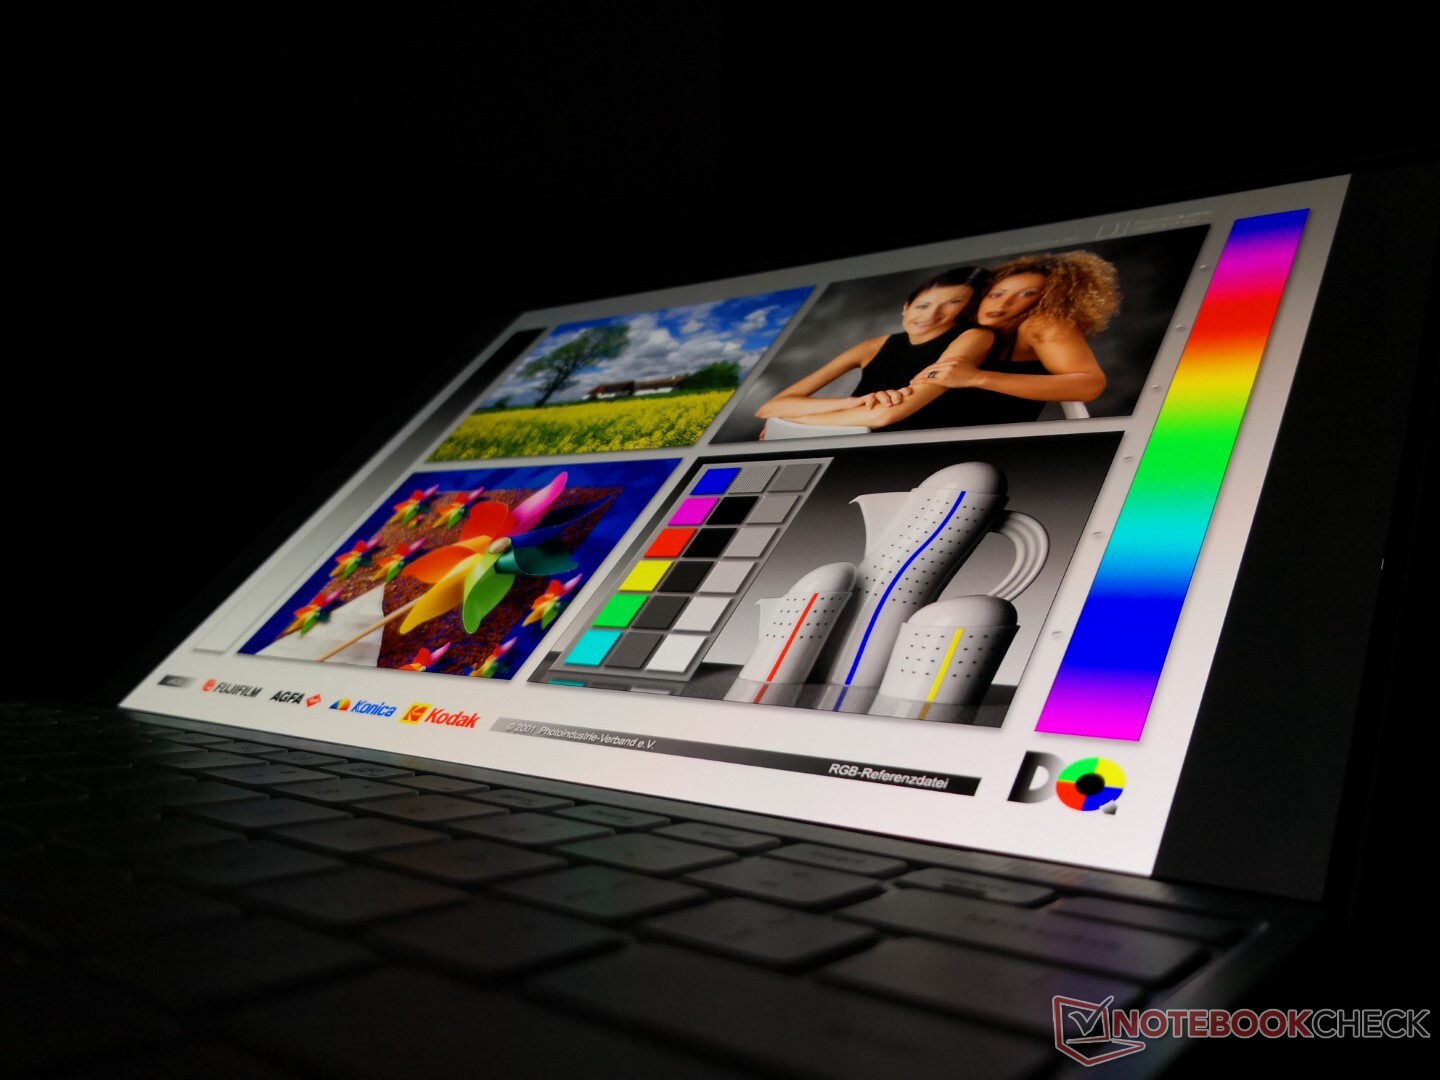
I tre maggiori vantaggi della nostra versione OLED rispetto alle altre versioni XPS 13 IPS sono i tempi di risposta bianco-nero più veloci, il rapporto di contrasto infinito e la maggiore copertura del colore DCI-P3. I colori non mostrano quasi nessun effetto ghosting per una qualità dell'immagine sorprendente soprattutto durante la riproduzione di film.
Anche se il display supporta l'HDR, le impostazioni predefinite di Windows 10 disabilitano automaticamente l'HDR quando si utilizza la batteria per prolungarne la durata. Questa transizione da HDR a non-HDR o viceversa comporta un momentaneo sfarfallio dello schermo ogni volta che il portatile è collegato o scollegato da una presa di corrente. Fortunatamente, gli utenti possono facilmente alternare le impostazioni predefinite inserendo "Windows HD Color" nella barra di ricerca del menu Start, assicurandosi che "Usa HDR" sia impostato su "On", e poi impostando le opzioni della batteria su "Ottimizza per la qualità dell'immagine" invece di "Ottimizza per la durata della batteria". Saprete che le impostazioni stanno funzionando quando lo schermo sfarfalla passando dall'alimentazione con adattatore AC a quella a batteria.
| |||||||||||||||||||||||||
Distribuzione della luminosità: 97 %
Al centro con la batteria: 384 cd/m²
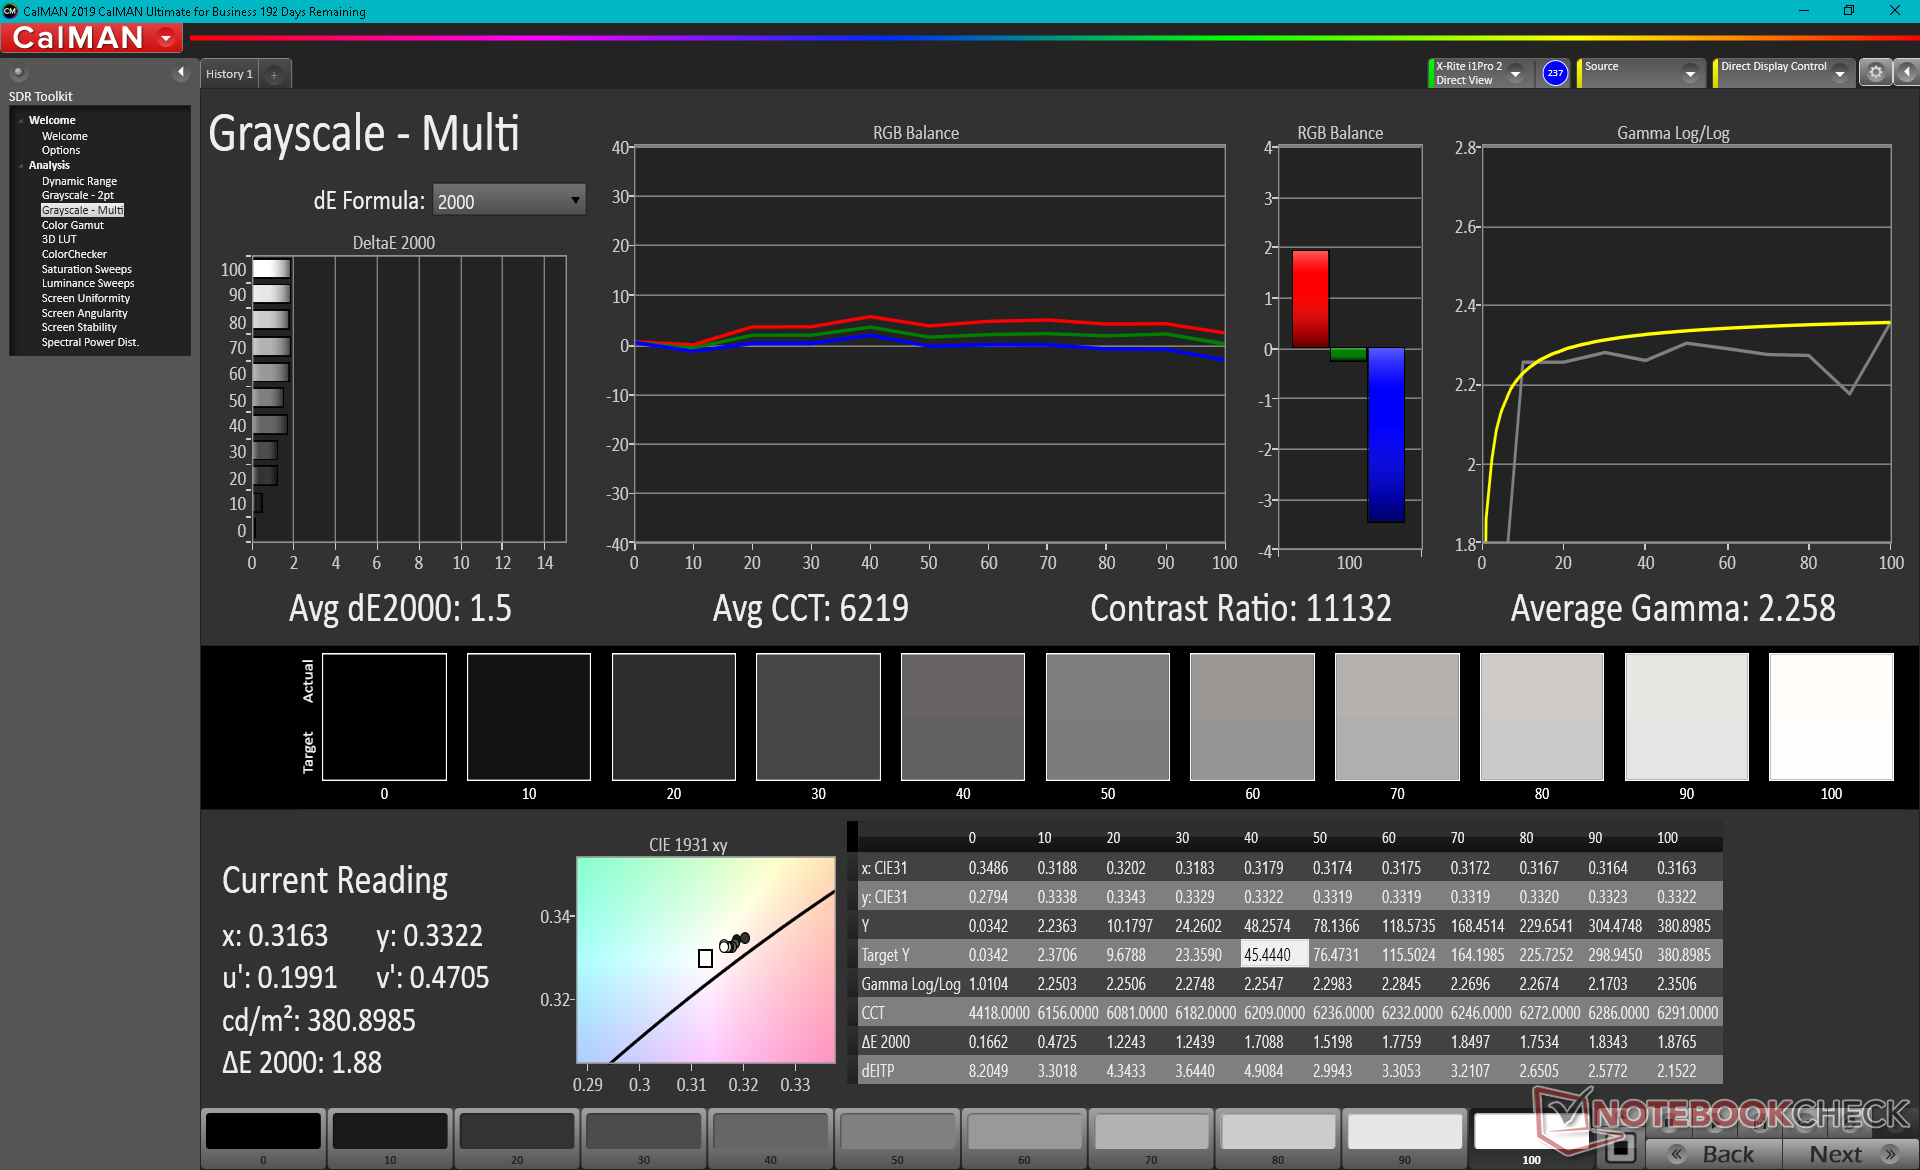
Contrasto: ∞:1 (Nero: 0 cd/m²)
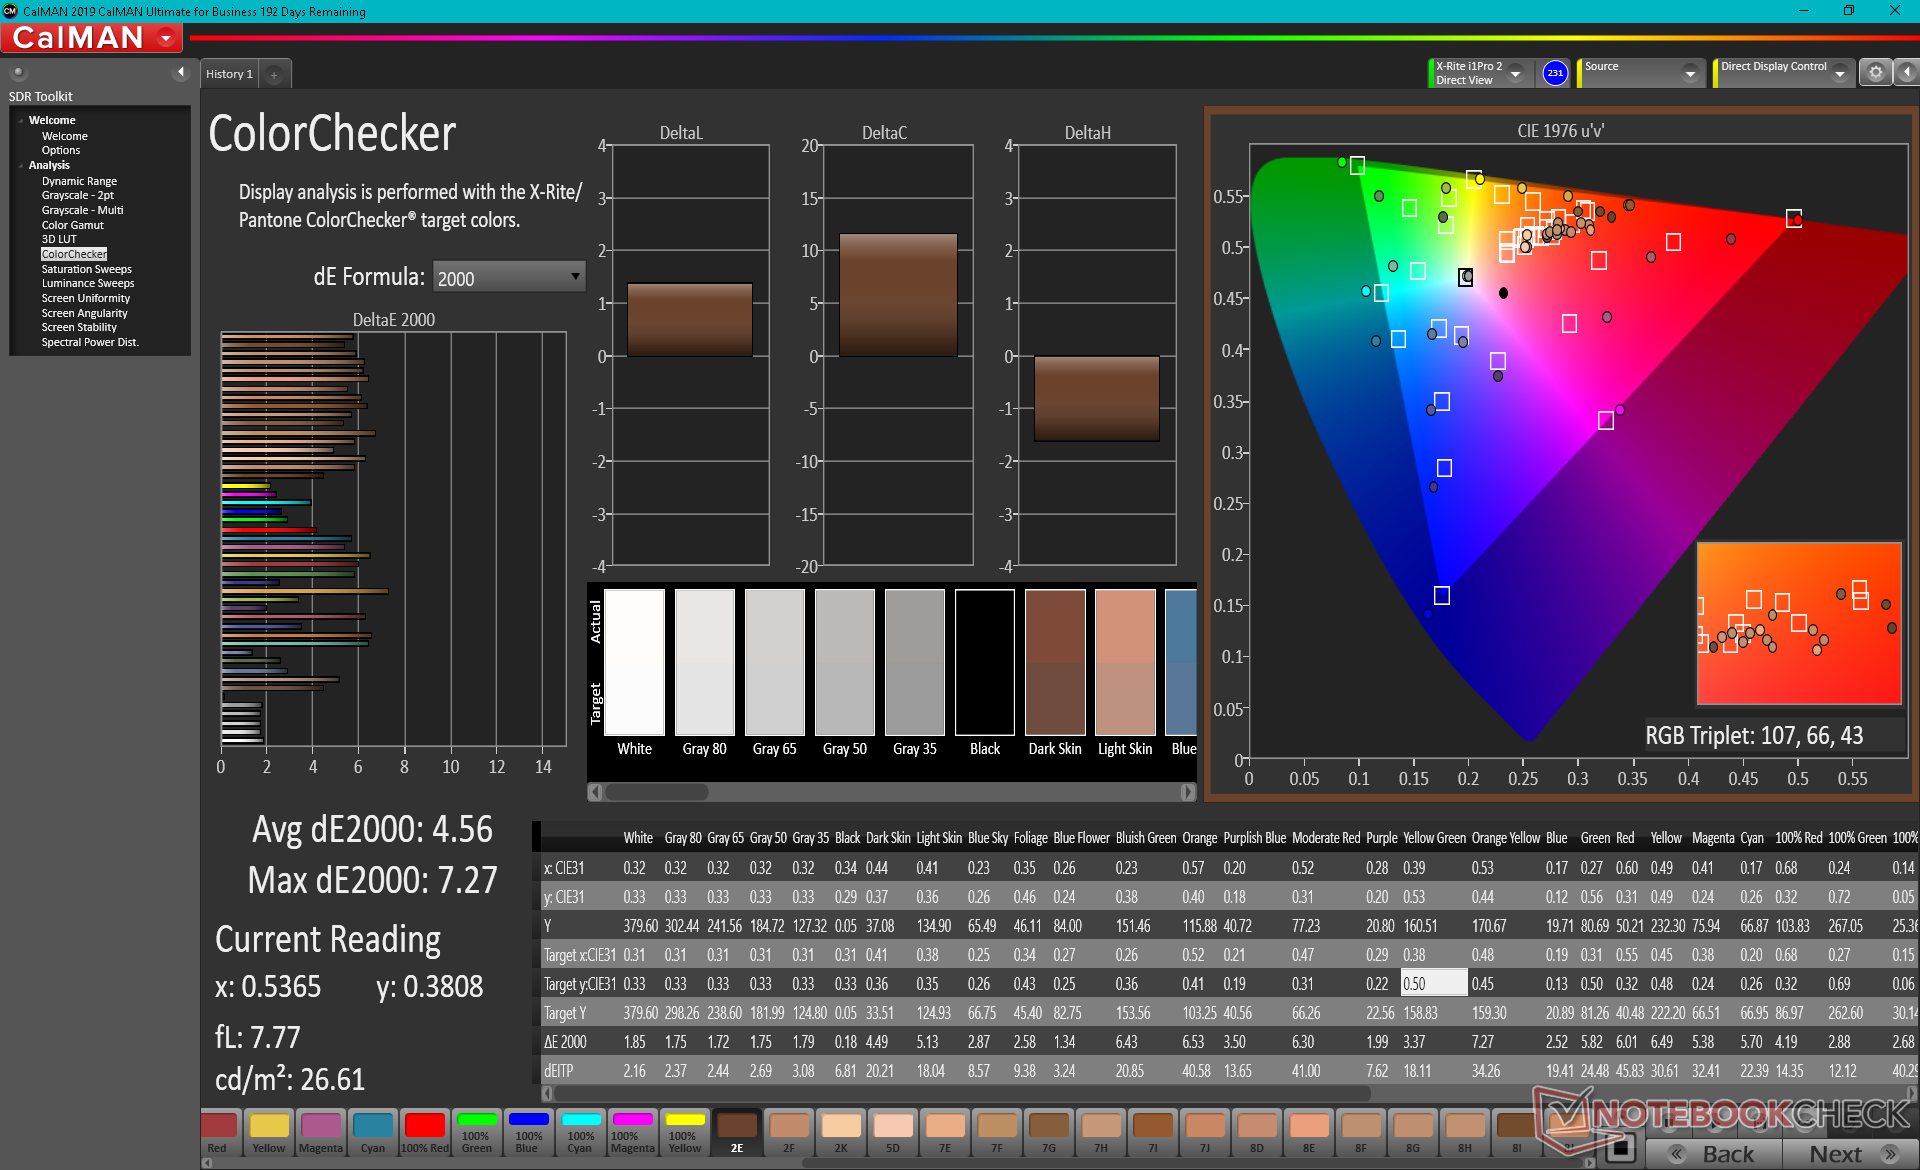
ΔE ColorChecker Calman: 4.56 | ∀{0.5-29.43 Ø4.73}
calibrated: 4.52
ΔE Greyscale Calman: 1.5 | ∀{0.09-98 Ø4.97}
100% sRGB (Argyll 1.6.3 3D)
87.1% AdobeRGB 1998 (Argyll 1.6.3 3D)
97.7% AdobeRGB 1998 (Argyll 3D)
100% sRGB (Argyll 3D)
99.7% Display P3 (Argyll 3D)
Gamma: 2.26
CCT: 6219 K
| Dell XPS 13 9310 OLED Samsung 134XK01, OLED, 13.4", 3456x2160 | Dell XPS 13 9310 Core i7 4K Sharp LQ134R1, IPS, 13.4", 3840x2400 | Dell XPS 13 9310 Core i7 FHD Sharp LQ134N1, IPS, 13.4", 1920x1200 | Dell XPS 13 7390 Core i7-10710U AU Optronics B133ZAN, Dell P/N: 90NTH, IPS, 13.3", 3840x2160 | MSI Summit E13 Flip Evo A11MT Sharp LQ134N1JW53, IPS, 13.4", 1920x1200 | |
|---|---|---|---|---|---|
| Display | -13% | -18% | -25% | -20% | |
| Display P3 Coverage (%) | 99.7 | 80.2 -20% | 70.9 -29% | 63.4 -36% | 69.8 -30% |
| sRGB Coverage (%) | 100 | 100 0% | 99.1 -1% | 93.7 -6% | 98.8 -1% |
| AdobeRGB 1998 Coverage (%) | 97.7 | 78.9 -19% | 72.9 -25% | 64.3 -34% | 70.6 -28% |
| Response Times | -2164% | -1837% | -1836% | -2355% | |
| Response Time Grey 50% / Grey 80% * (ms) | 2.2 ? | 59.2 ? -2591% | 52 ? -2264% | 51.6 ? -2245% | 64 ? -2809% |
| Response Time Black / White * (ms) | 2.2 ? | 40.4 ? -1736% | 33.2 ? -1409% | 33.6 ? -1427% | 44 ? -1900% |
| PWM Frequency (Hz) | 240.4 ? | 2137 ? | 2475 ? | ||
| Screen | 3% | -9% | -50% | 28% | |
| Brightness middle (cd/m²) | 384 | 508.7 32% | 543.3 41% | 408.2 6% | 551.3 44% |
| Brightness (cd/m²) | 387 | 479 24% | 524 35% | 399 3% | 517 34% |
| Brightness Distribution (%) | 97 | 84 -13% | 92 -5% | 89 -8% | 91 -6% |
| Black Level * (cd/m²) | 0.3 | 0.38 | 0.39 | 0.37 | |
| Colorchecker dE 2000 * | 4.56 | 2.72 40% | 3.02 34% | 4.6 -1% | 1.45 68% |
| Colorchecker dE 2000 max. * | 7.27 | 4.7 35% | 7.61 -5% | 11.84 -63% | 2.86 61% |
| Colorchecker dE 2000 calibrated * | 4.52 | 1.92 58% | 1.23 73% | 2.03 55% | 1.7 62% |
| Greyscale dE 2000 * | 1.5 | 3.4 -127% | 5 -233% | 7.5 -400% | 1.3 13% |
| Gamma | 2.26 97% | 2.11 104% | 2.02 109% | 2.12 104% | 2.14 103% |
| CCT | 6219 105% | 6245 104% | 6550 99% | 7966 82% | 6580 99% |
| Color Space (Percent of AdobeRGB 1998) (%) | 87.1 | 70.7 -19% | 66.8 -23% | 59.5 -32% | 65 -25% |
| Color Space (Percent of sRGB) (%) | 100 | 100 0% | 99.6 0% | 93.5 -6% | 99 -1% |
| Contrast (:1) | 1696 | 1430 | 1047 | 1490 | |
| Media totale (Programma / Settaggio) | -725% /
-310% | -621% /
-272% | -637% /
-300% | -782% /
-323% |
* ... Meglio usare valori piccoli
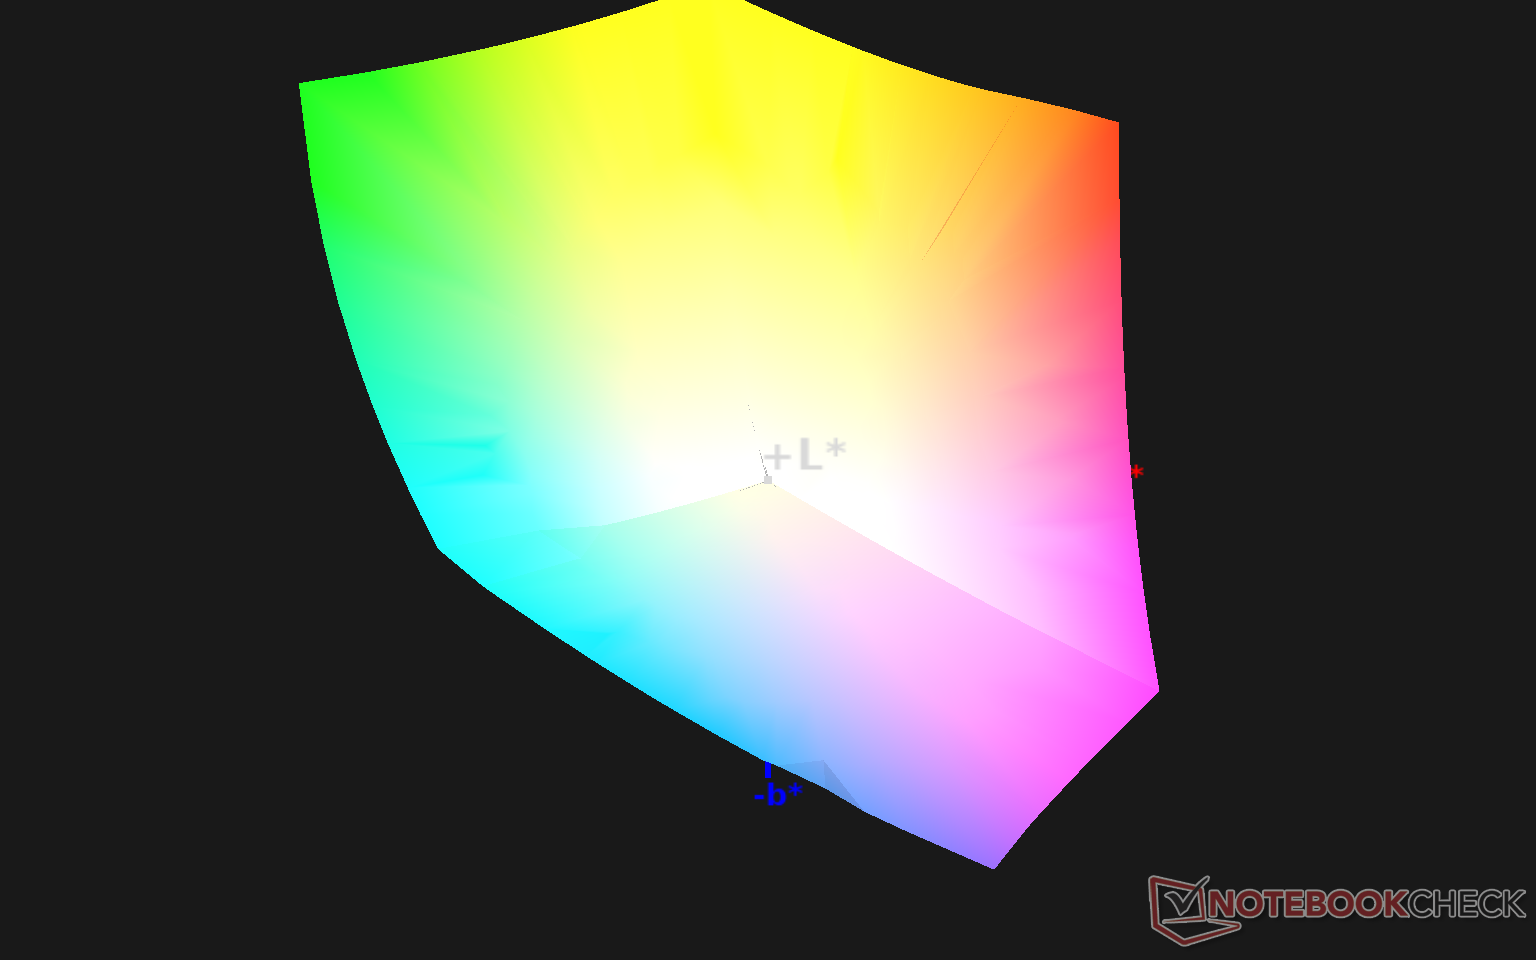
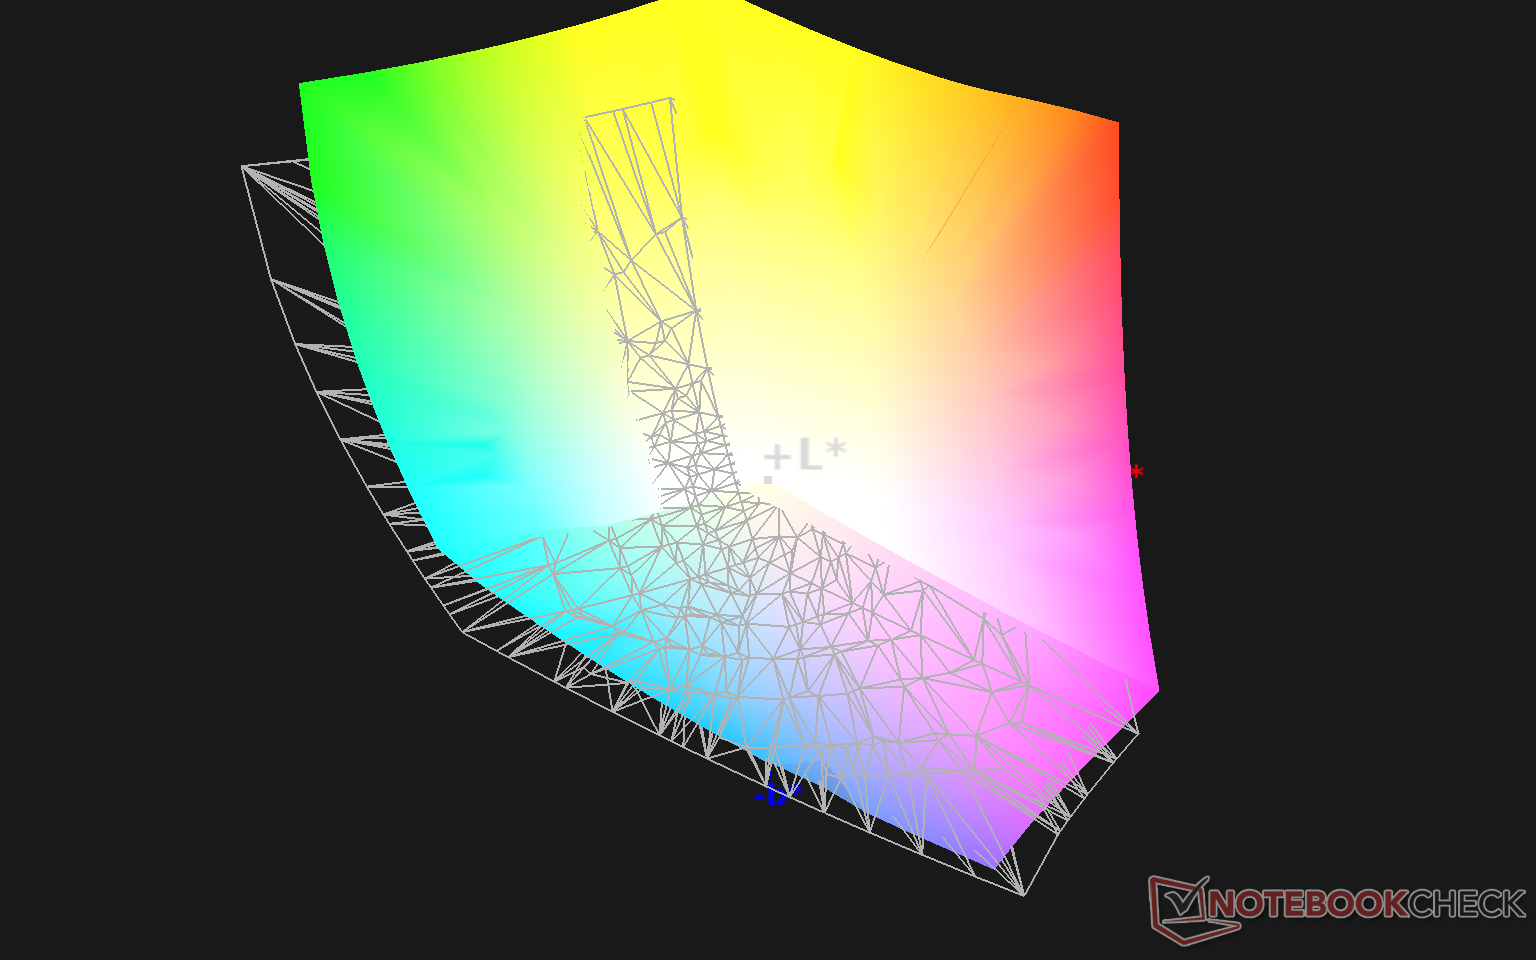
Lo spazio colore copre tutto l'sRGB (o circa il 158%) e l'87% di AdobeRGB. Il suo volume si estende ulteriormente negli spazi rosso, giallo e verde rispetto ad AdobeRGB, che è esattamente quello che ci aspetteremmo da un pannello conforme a DCI-P3.
Tempi di risposta del Display
| ↔ Tempi di risposta dal Nero al Bianco | ||
|---|---|---|
| 2.2 ms ... aumenta ↗ e diminuisce ↘ combinato | ↗ 1 ms Incremento | 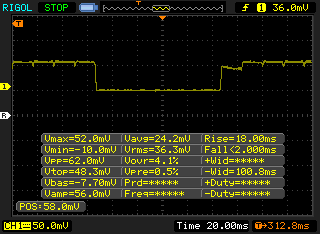 |
| ↘ 1.2 ms Calo | ||
| Lo schermo ha mostrato valori di risposta molto veloci nei nostri tests ed è molto adatto per i gaming veloce. In confronto, tutti i dispositivi di test variano da 0.1 (minimo) a 240 (massimo) ms. » 12 % di tutti i dispositivi è migliore. Questo significa che i tempi di risposta rilevati sono migliori rispettto alla media di tutti i dispositivi testati (19.9 ms). | ||
| ↔ Tempo di risposta dal 50% Grigio all'80% Grigio | ||
| 2.2 ms ... aumenta ↗ e diminuisce ↘ combinato | ↗ 1.2 ms Incremento | 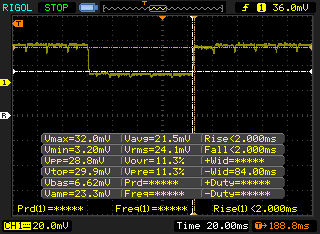 |
| ↘ 1 ms Calo | ||
| Lo schermo ha mostrato valori di risposta molto veloci nei nostri tests ed è molto adatto per i gaming veloce. In confronto, tutti i dispositivi di test variano da 0.165 (minimo) a 636 (massimo) ms. » 11 % di tutti i dispositivi è migliore. Questo significa che i tempi di risposta rilevati sono migliori rispettto alla media di tutti i dispositivi testati (31.1 ms). | ||
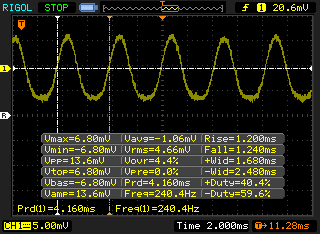
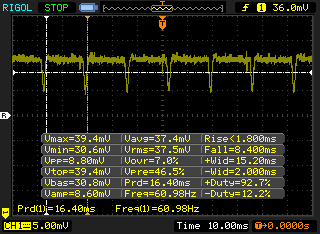
Sfarfallio dello schermo / PWM (Pulse-Width Modulation)
| flickering dello schermo / PWM rilevato | 240.4 Hz | ≤ 51 % settaggio luminosita' |  |
Il display sfarfalla a 240.4 Hz (Probabilmente a causa dell'uso di PWM) Flickering rilevato ad una luminosita' di 51 % o inferiore. Non dovrebbe verificarsi flickering o PWM sopra questo valore di luminosita'. La frequenza di 240.4 Hz è relativamente bassa, quindi gli utenti sensibili potrebbero notare il flickering ed accusare stanchezza agli occhi a questo livello di luminosità e a livelli inferiori. In confronto: 52 % di tutti i dispositivi testati non utilizza PWM per ridurre la luminosita' del display. Se è rilevato PWM, una media di 7798 (minimo: 5 - massimo: 343500) Hz è stata rilevata. | |||
Mentre i pannelli IPS esibiscono tipicamente una sola frequenza di modulazione di larghezza d'impulso, questo pannello OLED esibisce due frequenze discrete di modulazione di larghezza d'impulso a seconda dell'impostazione del livello di luminosità. Siamo in grado di registrare una frequenza di 240,4 Hz e 61 Hz dallo 0%al 51% di luminosità e dal 52% alla massima luminosità, rispettivamente. In confronto, il pannello XPS 13 4K IPS esibirebbe un PWM più alto di 2137 MHz solo dallo 0% al 31% di luminosità. Le versioni XPS 13 IPS possono quindi essere l'opzione migliore se i vostri occhi sono sensibili allo sfarfallio dello schermo.
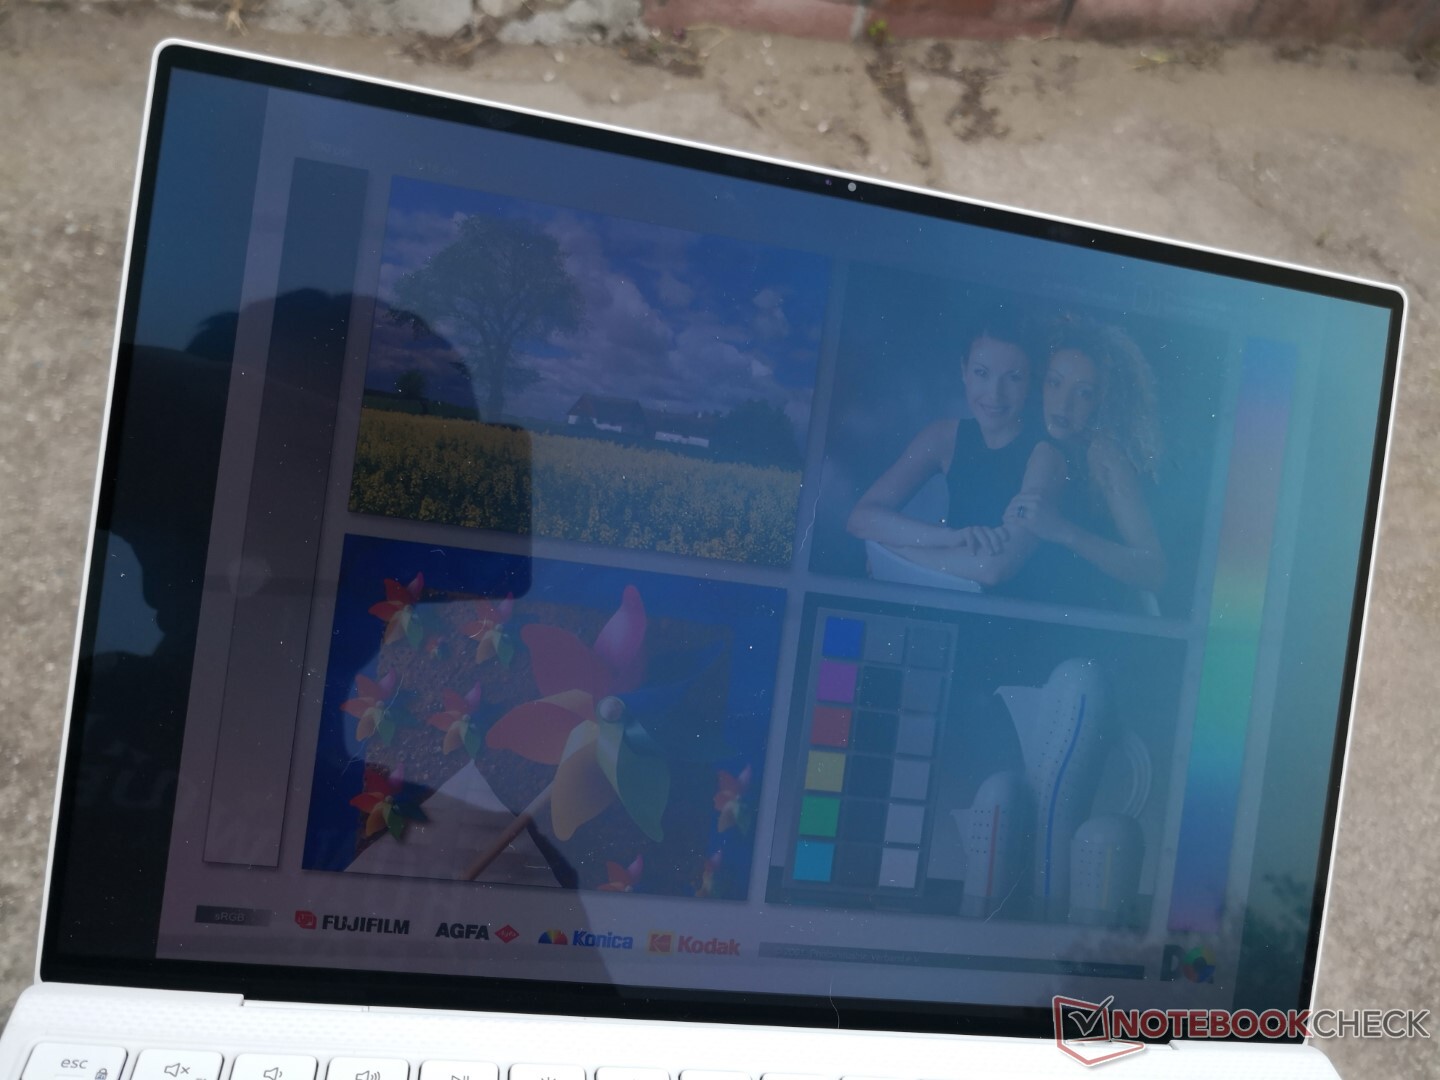
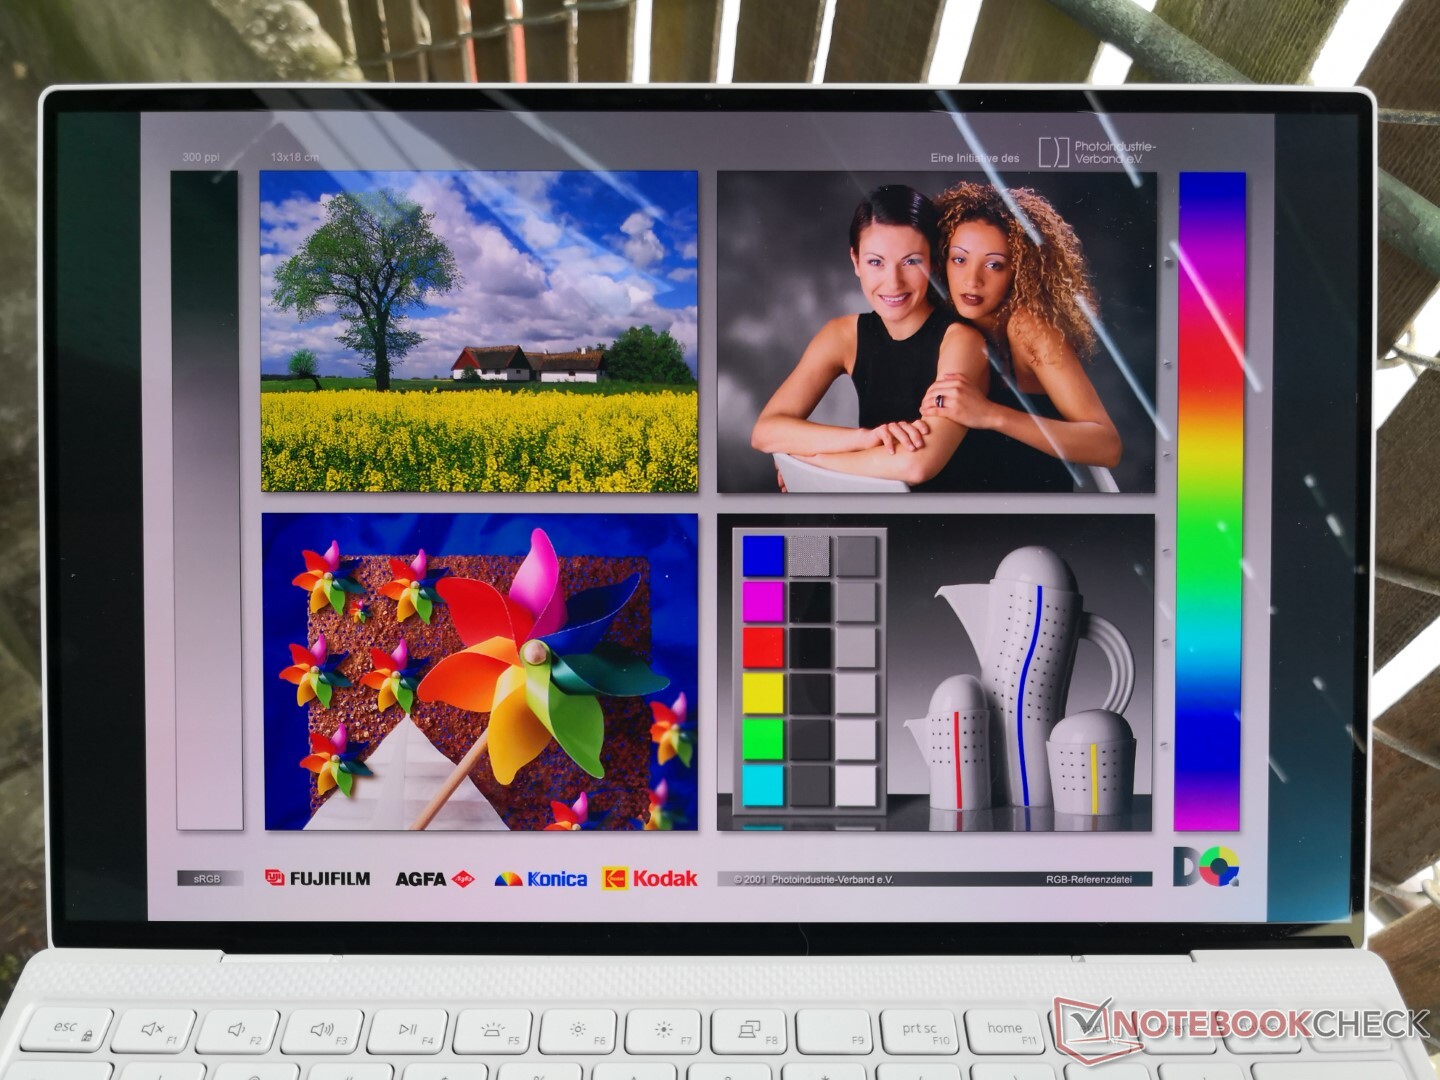
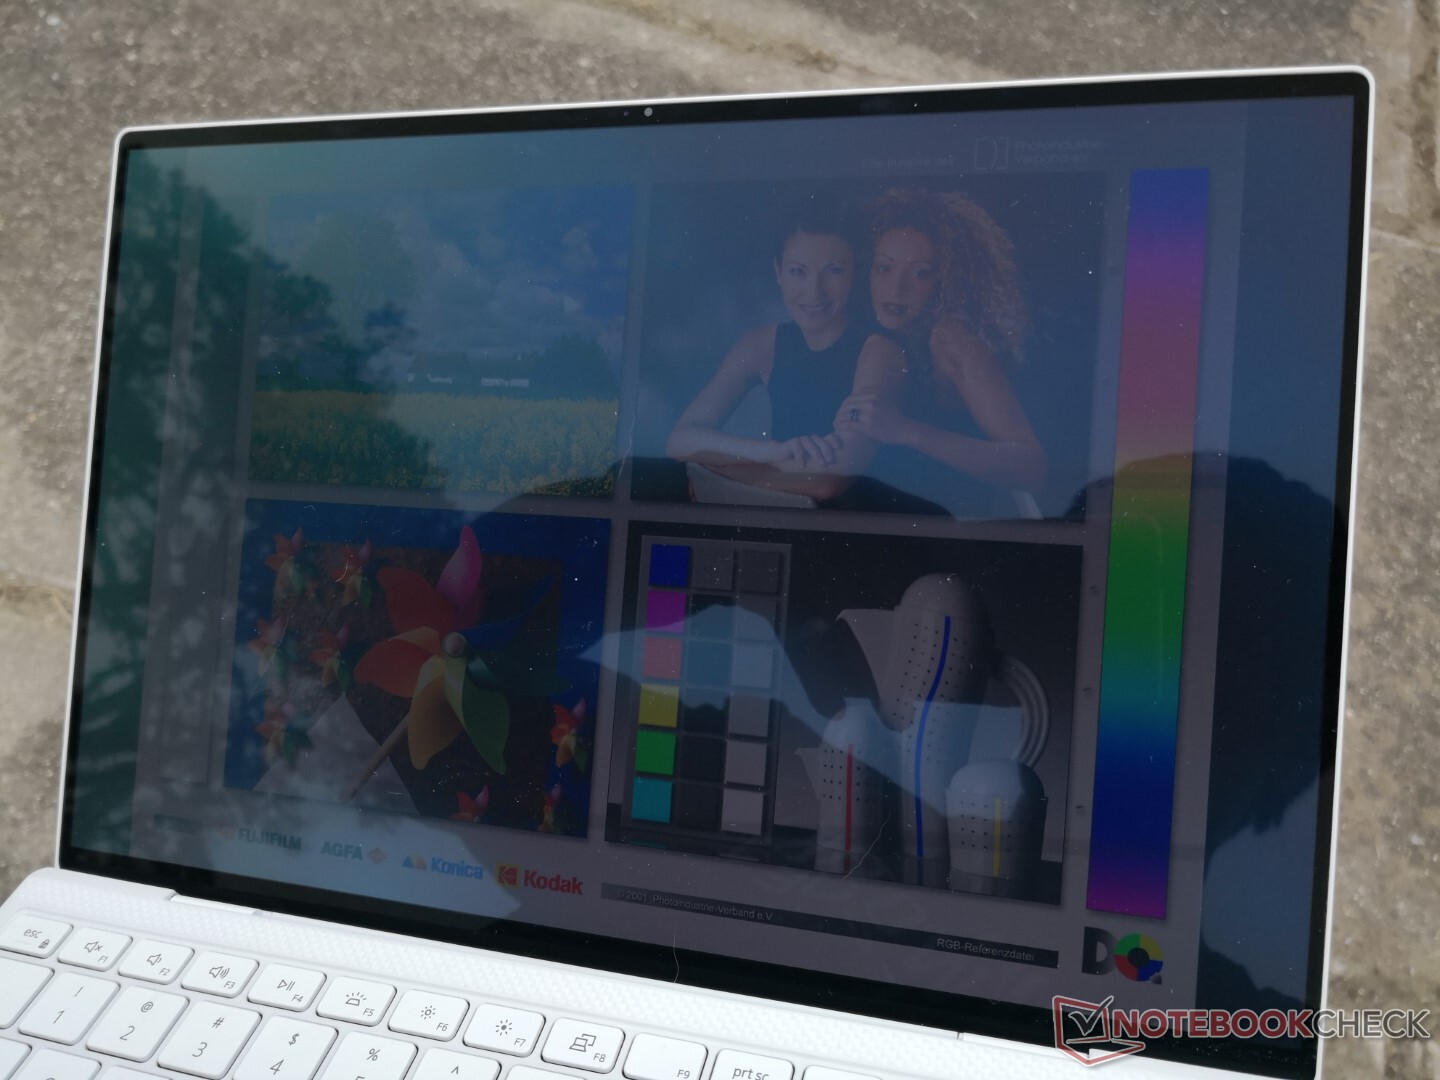
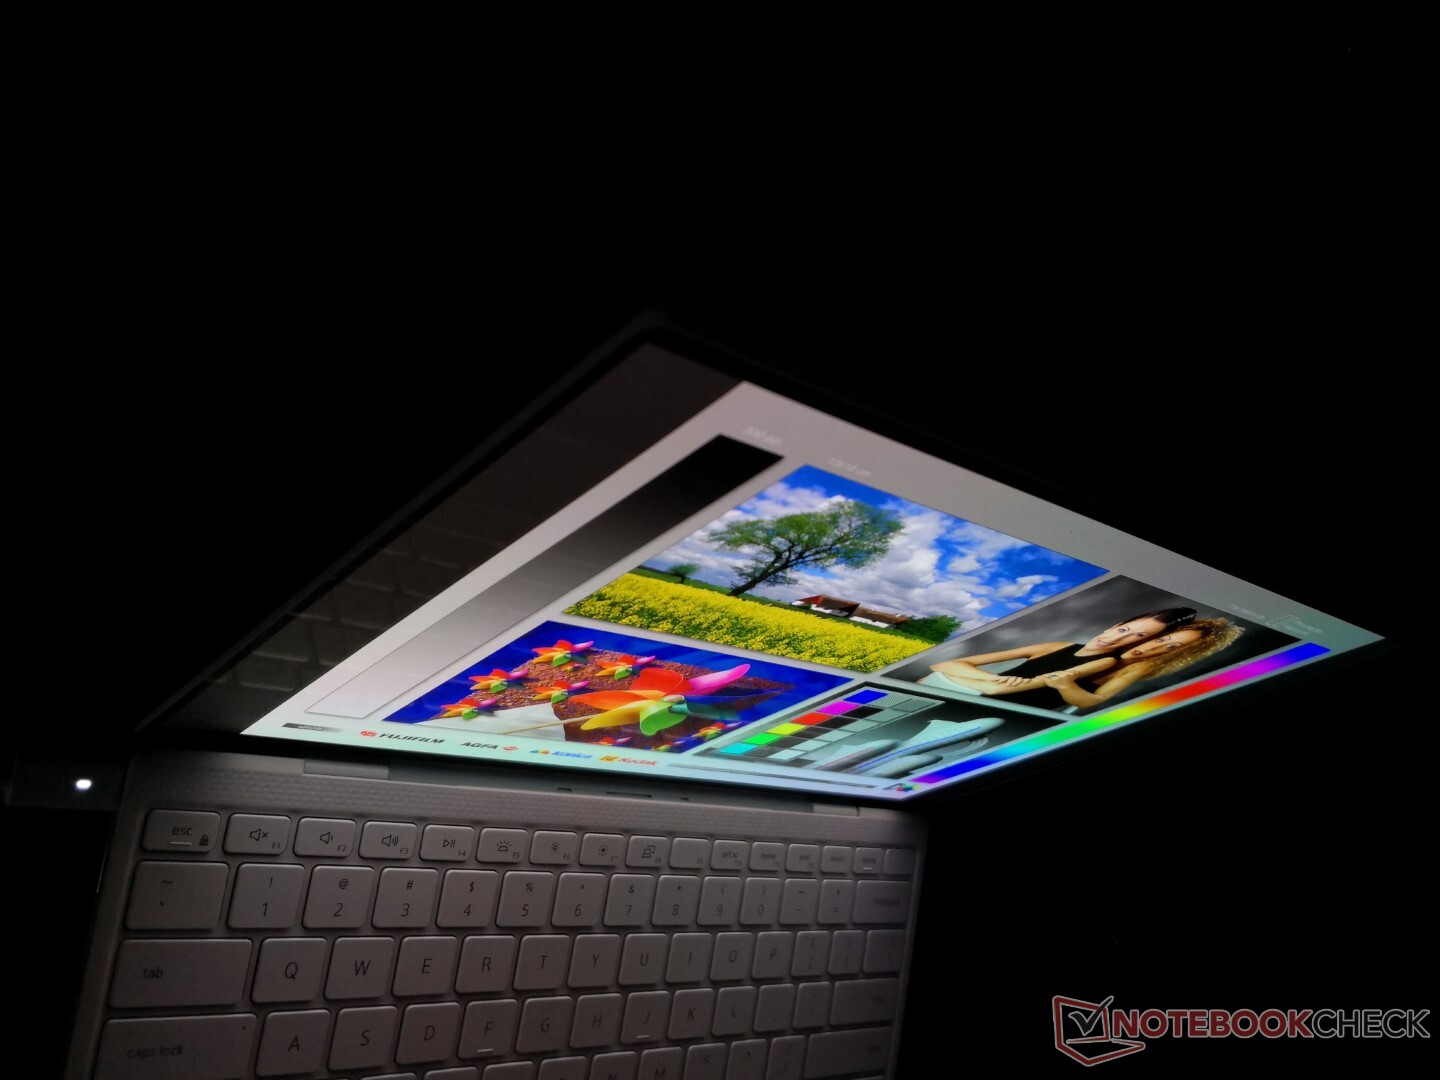
La visibilità all'aperto è un po' confusa. Mentre l'OLED offre un contrasto più profondo per una più facile leggibilità, non è così luminoso come il tipico display IPS dell'XPS 13 (384 nits contro >500 nits). Così, i riflessi rimangono un problema nella maggior parte delle condizioni. Vale anche la pena notare che il display ha una tonalità blu-verde quando i riflessi sono intensi, che è un'altra caratteristica unica non osservata su IPS.
Performance
Processore
Come notato nelle nostre precedenti recensioni dell'XPS 13, le frequenze di clock della CPU vanno in ciclo pesantemente quando si eseguono benchmarks o giochi a causa della Politica di alimentazione dinamica di Dell. Questo può essere notato quando si esegue CineBench R15 xT in un ciclo o quando si gioca a giochi come i punteggi e i frame rates tendono ad essere ciclici riflettendo le frequenze di clock instabili. Per esempio, i punteggi di CineBench R15 xT sarebbero ovunque tra 609 e 765 punti mentre The Witcher 3 il frame rate sarebbe ovunque tra 66 e 95 semplicemente inattivo sulla mappa del mondo.
Cinebench R23: Multi Core | Single Core
Cinebench R15: CPU Multi 64Bit | CPU Single 64Bit
Blender: v2.79 BMW27 CPU
7-Zip 18.03: 7z b 4 -mmt1 | 7z b 4
Geekbench 5.5: Single-Core | Multi-Core
HWBOT x265 Benchmark v2.2: 4k Preset
LibreOffice : 20 Documents To PDF
R Benchmark 2.5: Overall mean
| Cinebench R23 / Multi Core | |
| Asus ZenBook 13 UM325S | |
| Lenovo Yoga Slim 7 14ARE05 82A20008GE | |
| Asus ZenBook 13 OLED UM325UA | |
| Dell XPS 13 9305 Core i5 FHD | |
| Media Intel Core i7-1185G7 (3610 - 6383, n=24) | |
| Dell XPS 13 9310 OLED | |
| HP Envy 13-ba1475ng | |
| Asus VivoBook S13 S333JA-DS51 | |
| Cinebench R23 / Single Core | |
| Dell XPS 13 9310 OLED | |
| Media Intel Core i7-1185G7 (1251 - 1532, n=24) | |
| Asus ZenBook 13 UM325S | |
| HP Envy 13-ba1475ng | |
| Dell XPS 13 9305 Core i5 FHD | |
| Asus ZenBook 13 OLED UM325UA | |
| Lenovo Yoga Slim 7 14ARE05 82A20008GE | |
| Asus VivoBook S13 S333JA-DS51 | |
| HWBOT x265 Benchmark v2.2 / 4k Preset | |
| Asus ZenBook 13 UM325S | |
| Lenovo Yoga Slim 7 14ARE05 82A20008GE | |
| Asus ZenBook 13 OLED UM325UA | |
| Media Intel Core i7-1185G7 (5.02 - 8.13, n=27) | |
| Dell XPS 13 9310 OLED | |
| Dell XPS 13 7390 Core i7-10710U | |
| HP Envy 13-ba1475ng | |
| Asus VivoBook S13 S333JA-DS51 | |
| HP Envy 13-ba0001ng | |
| Asus ZenBook 13 UX325JA | |
| LibreOffice / 20 Documents To PDF | |
| Lenovo Yoga Slim 7 14ARE05 82A20008GE | |
| Asus VivoBook S13 S333JA-DS51 | |
| Asus ZenBook 13 OLED UM325UA | |
| Dell XPS 13 9305 Core i5 FHD | |
| HP Envy 13-ba0001ng | |
| HP Envy 13-ba1475ng | |
| Asus ZenBook 13 UM325S | |
| Asus ZenBook 13 UX325JA | |
| Media Intel Core i7-1185G7 (41.3 - 61.7, n=26) | |
| Dell XPS 13 9310 OLED | |
Cinebench R23: Multi Core | Single Core
Cinebench R15: CPU Multi 64Bit | CPU Single 64Bit
Blender: v2.79 BMW27 CPU
7-Zip 18.03: 7z b 4 -mmt1 | 7z b 4
Geekbench 5.5: Single-Core | Multi-Core
HWBOT x265 Benchmark v2.2: 4k Preset
LibreOffice : 20 Documents To PDF
R Benchmark 2.5: Overall mean
* ... Meglio usare valori piccoli
Prestazioni del sistema
| PCMark 10 Score | 5226 punti | |
Aiuto | ||
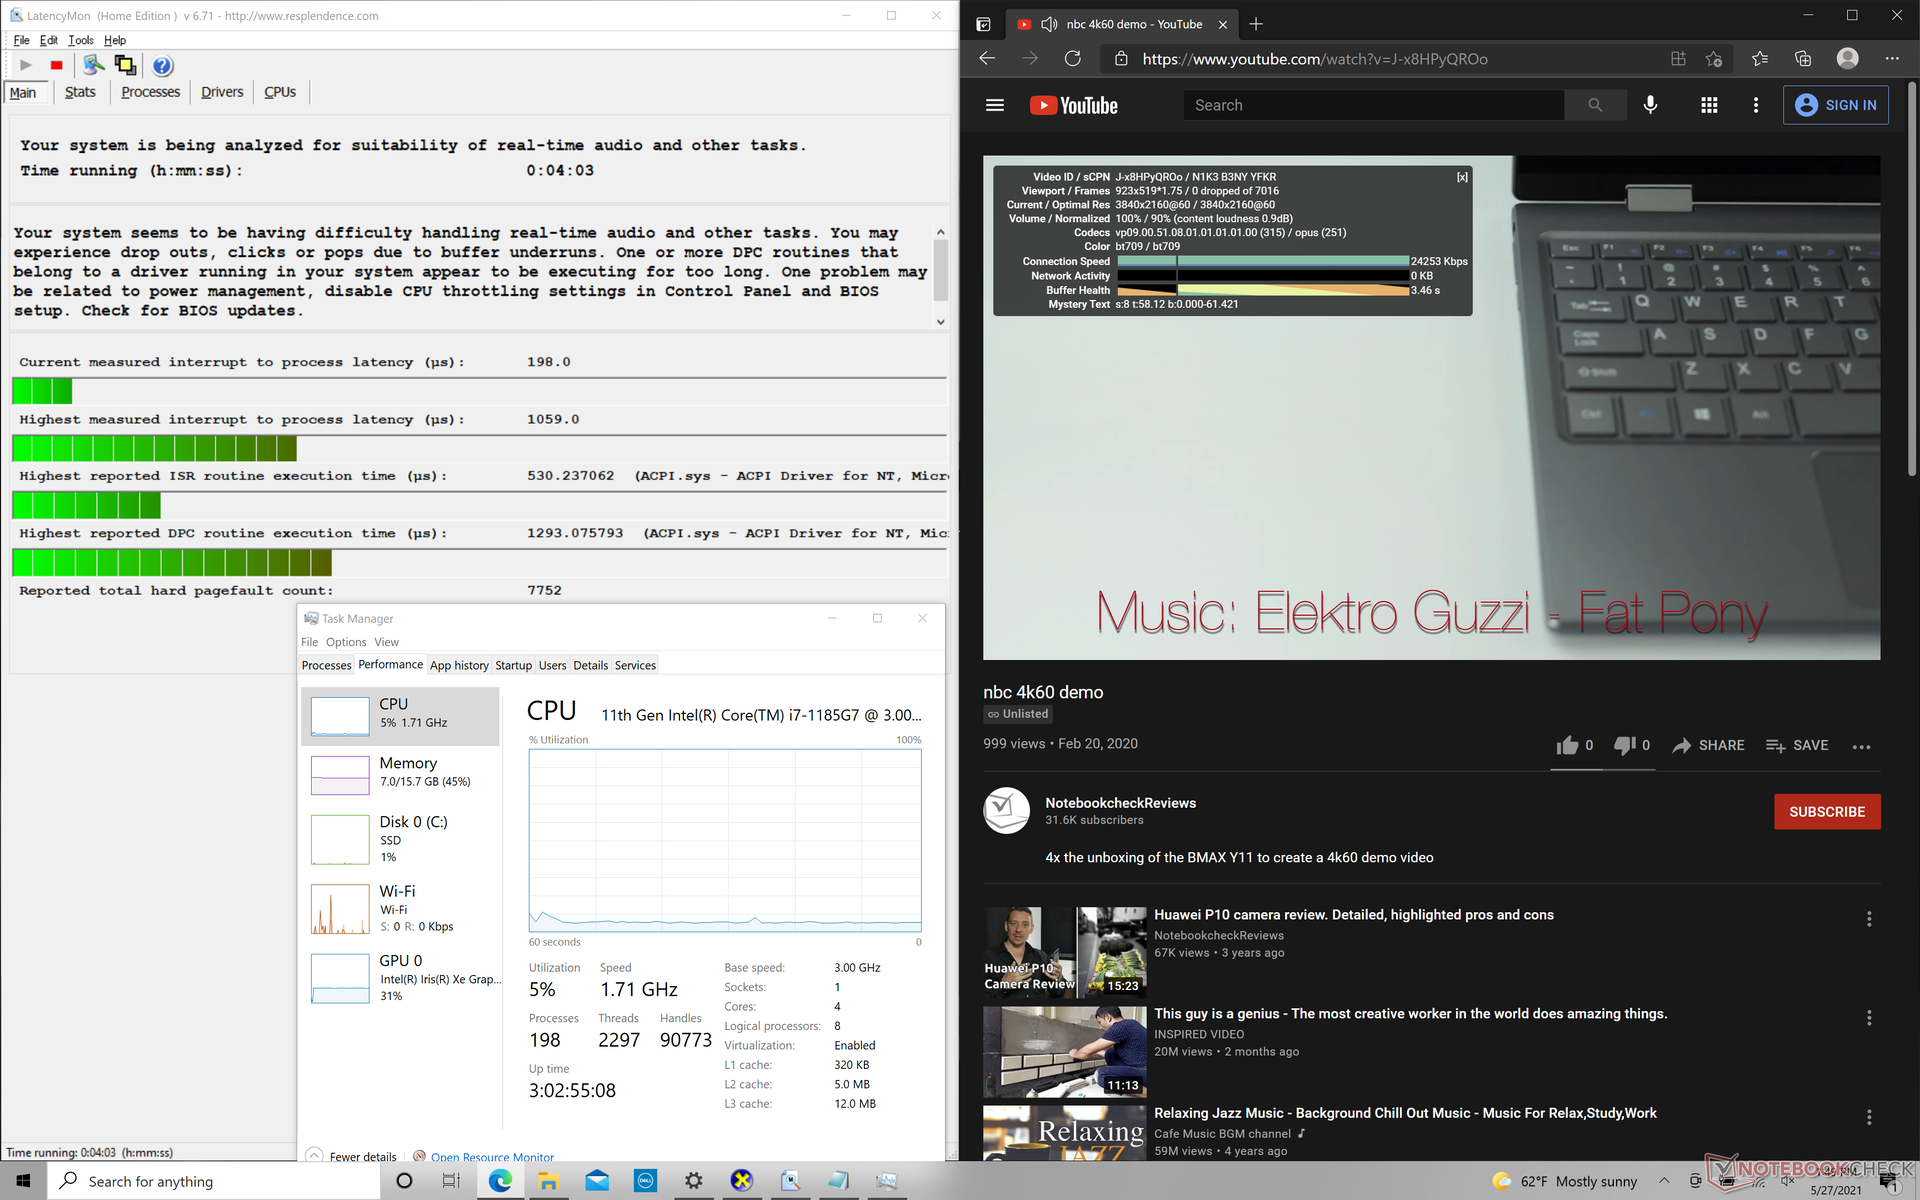
Latenza DPC
La serie continua a mostrare leggeri problemi di latenza DPC. La riproduzione di video 4K a 60 FPS fortunatamente rimane fluida, senza perdite di fotogrammi.
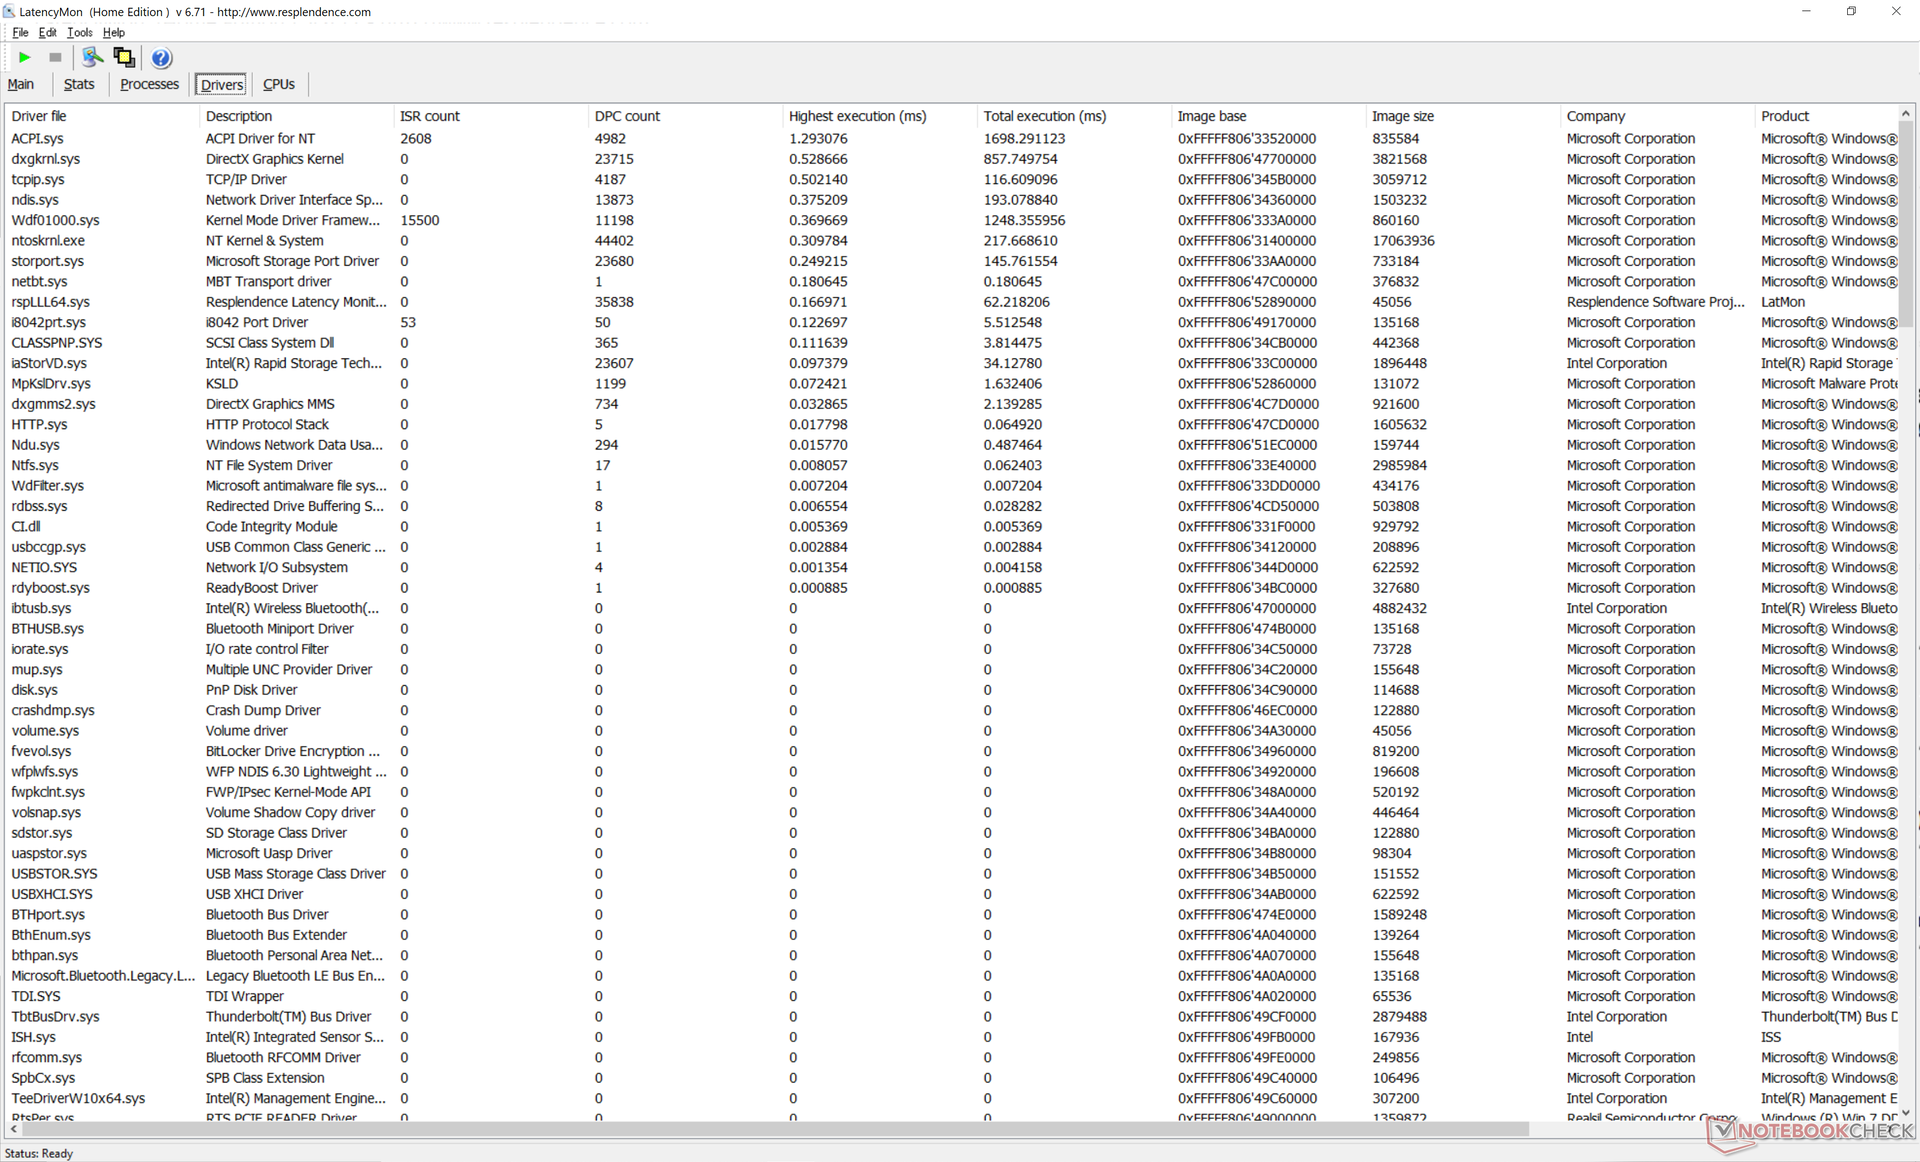
| DPC Latencies / LatencyMon - interrupt to process latency (max), Web, Youtube, Prime95 | |
| MSI Summit E13 Flip Evo A11MT | |
| Dell XPS 13 9310 Core i7 4K | |
| Dell XPS 13 9310 OLED | |
| Dell XPS 13 9310 Core i7 FHD | |
* ... Meglio usare valori piccoli
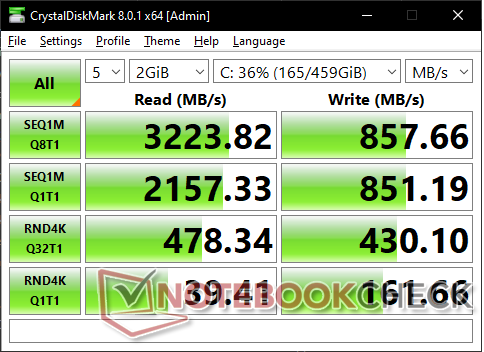
Dispositivi di archiviazione
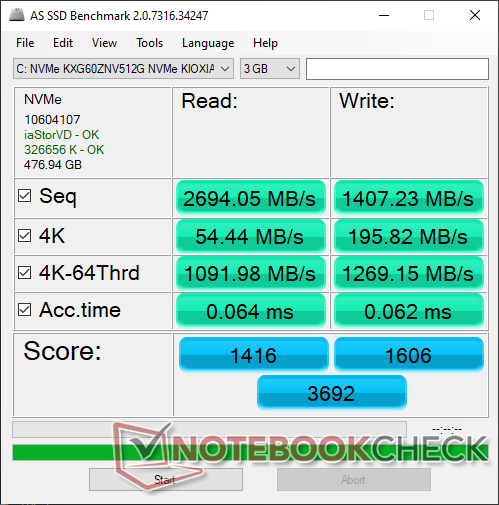
| Dell XPS 13 9310 OLED Toshiba XG6 KXG60ZNV512G | Dell XPS 13 9310 Core i7 FHD Micron 2300 512GB MTFDHBA512TDV | Dell XPS 13 7390 Core i7-10710U SK Hynix PC601 NVMe 512 GB | MSI Summit E13 Flip Evo A11MT Phison 1TB SM2801T24GKBB4S-E162 | |
|---|---|---|---|---|
| AS SSD | -43% | -25% | 23% | |
| Seq Read (MB/s) | 2694 | 2091 -22% | 1804 -33% | 3789 41% |
| Seq Write (MB/s) | 1407 | 1396 -1% | 1000 -29% | 2257 60% |
| 4K Read (MB/s) | 54.4 | 49.29 -9% | 45.1 -17% | 54.2 0% |
| 4K Write (MB/s) | 195.8 | 104.2 -47% | 115 -41% | 78.7 -60% |
| 4K-64 Read (MB/s) | 1092 | 827 -24% | 893 -18% | 1330 22% |
| 4K-64 Write (MB/s) | 1269 | 1636 29% | 732 -42% | 2038 61% |
| Access Time Read * (ms) | 0.064 | 0.066 -3% | 0.044 31% | 0.042 34% |
| Access Time Write * (ms) | 0.062 | 0.365 -489% | 0.095 -53% | 0.04 35% |
| Score Read (Points) | 1416 | 1086 -23% | 1119 -21% | 1763 25% |
| Score Write (Points) | 1606 | 1880 17% | 947 -41% | 2343 46% |
| Score Total (Points) | 3692 | 3499 -5% | 2608 -29% | 4938 34% |
| Copy ISO MB/s (MB/s) | 1782 | 1544 -13% | 1515 -15% | 2270 27% |
| Copy Program MB/s (MB/s) | 1023 | 613 -40% | 535 -48% | 670 -35% |
| Copy Game MB/s (MB/s) | 1148 | 1451 26% | 1211 5% | 1525 33% |
| CrystalDiskMark 5.2 / 6 | 41% | 30% | 95% | |
| Write 4K (MB/s) | 156.8 | 97.5 -38% | 134 -15% | 311.1 98% |
| Read 4K (MB/s) | 39.66 | 50.9 28% | 42.91 8% | 56.6 43% |
| Write Seq (MB/s) | 854 | 1811 112% | 1841 116% | 2397 181% |
| Read Seq (MB/s) | 2167 | 1836 -15% | 1707 -21% | 2277 5% |
| Write 4K Q32T1 (MB/s) | 441.1 | 521 18% | 394.7 -11% | 803 82% |
| Read 4K Q32T1 (MB/s) | 395.5 | 357.5 -10% | 398.5 1% | 849 115% |
| Write Seq Q32T1 (MB/s) | 858 | 2879 236% | 2250 162% | 2410 181% |
| Read Seq Q32T1 (MB/s) | 3258 | 3204 -2% | 3265 0% | 4954 52% |
| Media totale (Programma / Settaggio) | -1% /
-13% | 3% /
-5% | 59% /
49% |
* ... Meglio usare valori piccoli

Throttling Disco: DiskSpd Read Loop, Queue Depth 8
Prestazioni della GPU
| 3DMark 11 Performance | 6398 punti | |
| 3DMark Cloud Gate Standard Score | 15019 punti | |
| 3DMark Fire Strike Score | 4449 punti | |
| 3DMark Time Spy Score | 1526 punti | |
Aiuto | ||
| basso | medio | alto | ultra | QHD | 4K | |
|---|---|---|---|---|---|---|
| The Witcher 3 (2015) | 98.6 | 61.1 | 32 | 13.9 | ||
| Dota 2 Reborn (2015) | 76.1 | 74.7 | 41.6 | 43.4 | 21.5 | |
| Final Fantasy XV Benchmark (2018) | 35 | 19.9 | 15.1 | 15.1 | 15.1 | |
| X-Plane 11.11 (2018) | 25.1 | 35.2 | 29.4 | 17.1 | ||
| Strange Brigade (2018) | 88.4 | 33.2 | 29.7 | 22.3 | 16.9 |
Emissioni
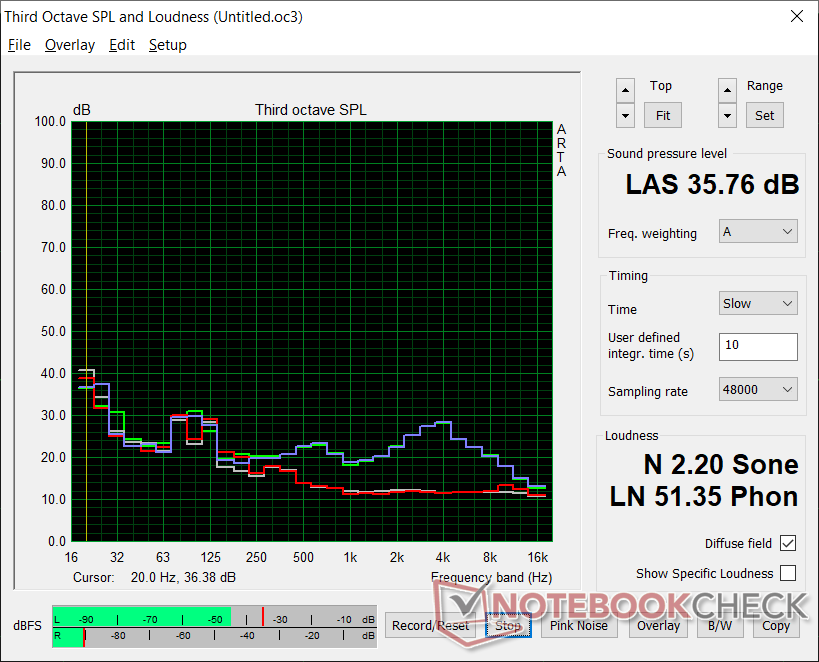
Rumorosità
| Dell XPS 13 9310 OLED Iris Xe G7 96EUs, i7-1185G7, Toshiba XG6 KXG60ZNV512G | Dell XPS 13 9310 Core i7 4K Iris Xe G7 96EUs, i7-1185G7, Micron 2300 512GB MTFDHBA512TDV | Dell XPS 13 9310 Core i7 FHD Iris Xe G7 96EUs, i7-1165G7, Micron 2300 512GB MTFDHBA512TDV | Dell XPS 13 7390 Core i7-10710U UHD Graphics 620, i7-10710U, SK Hynix PC601 NVMe 512 GB | MSI Summit E13 Flip Evo A11MT Iris Xe G7 96EUs, i7-1185G7, Phison 1TB SM2801T24GKBB4S-E162 | |
|---|---|---|---|---|---|
| Noise | -7% | -3% | -19% | -15% | |
| off /ambiente * (dB) | 24.8 | 27.7 -12% | 25.7 -4% | 28 -13% | 24.5 1% |
| Idle Minimum * (dB) | 25 | 27.8 -11% | 25.7 -3% | 28 -12% | 24.7 1% |
| Idle Average * (dB) | 25 | 27.8 -11% | 25.7 -3% | 28 -12% | 24.7 1% |
| Idle Maximum * (dB) | 25 | 27.8 -11% | 25.9 -4% | 28 -12% | 26.4 -6% |
| Load Average * (dB) | 25.3 | 27.9 -10% | 26.2 -4% | 33.7 -33% | 37.8 -49% |
| Witcher 3 ultra * (dB) | 35.8 | 32.8 8% | 36.5 -2% | 41.4 -16% | |
| Load Maximum * (dB) | 35.8 | 37 -3% | 36.6 -2% | 46.5 -30% | 48.8 -36% |
* ... Meglio usare valori piccoli
Rumorosità
| Idle |
| 25 / 25 / 25 dB(A) |
| Sotto carico |
| 25.3 / 35.8 dB(A) |
 | ||
30 dB silenzioso 40 dB(A) udibile 50 dB(A) rumoroso |
||
min: | ||
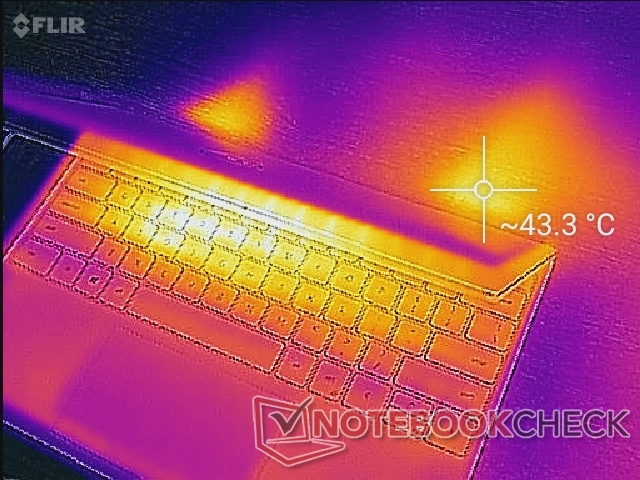
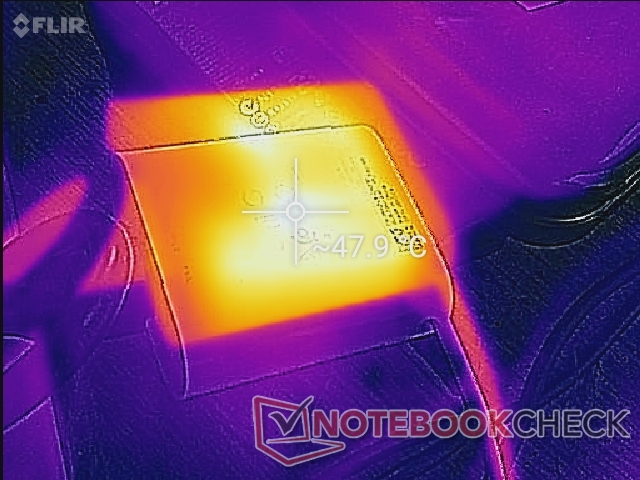
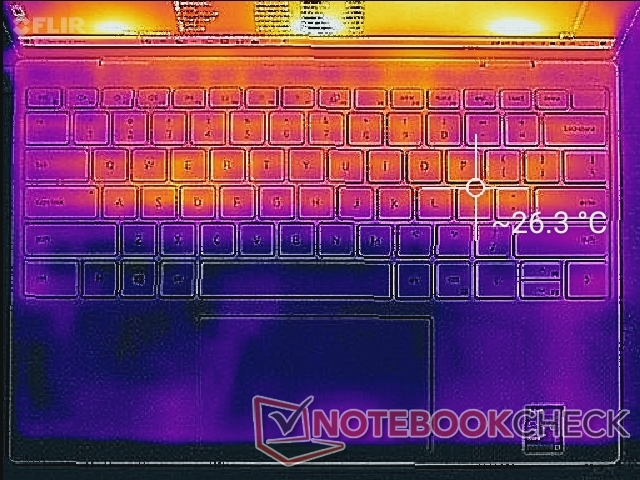
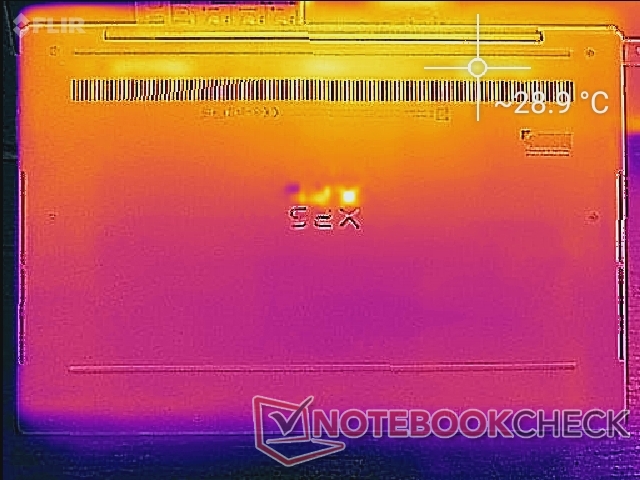
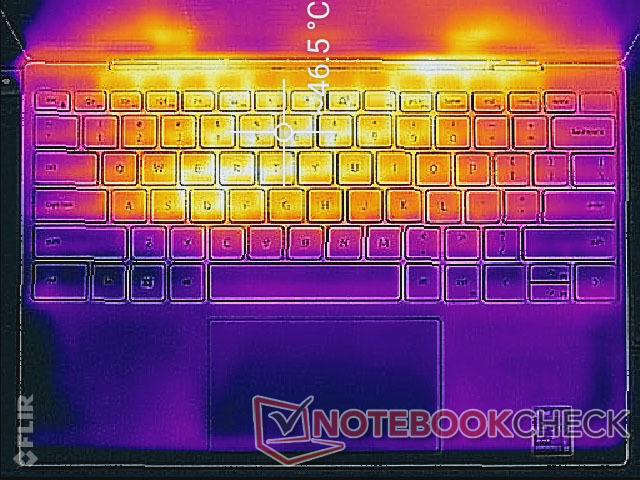
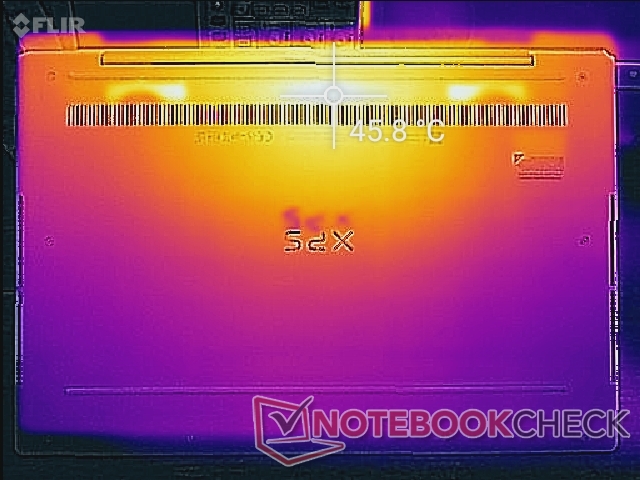
Temperature
Altoparlanti

Gestione energetica
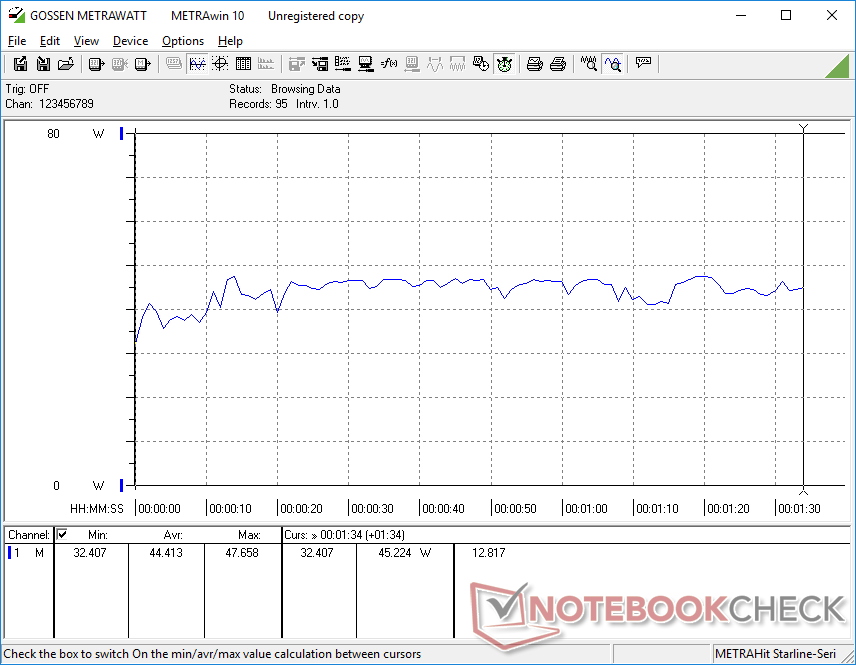
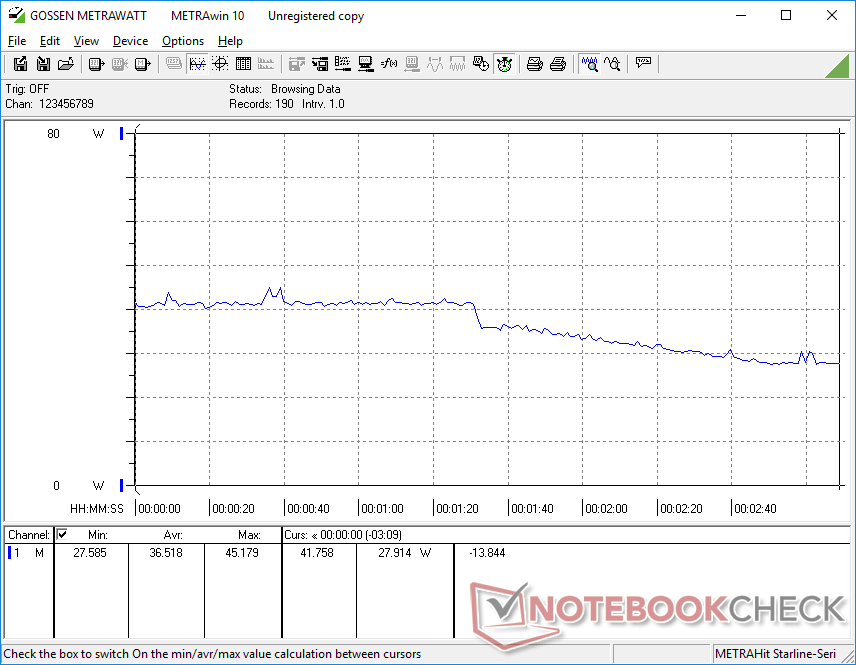
Consumo di energia
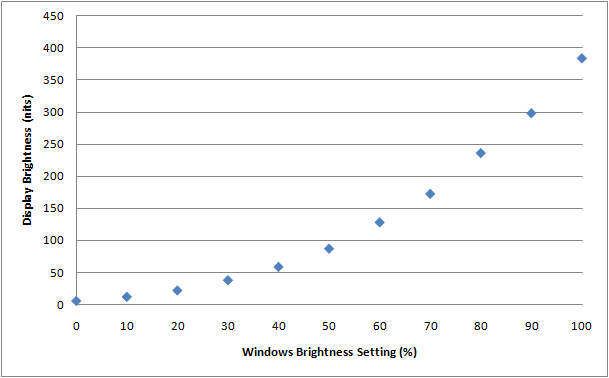
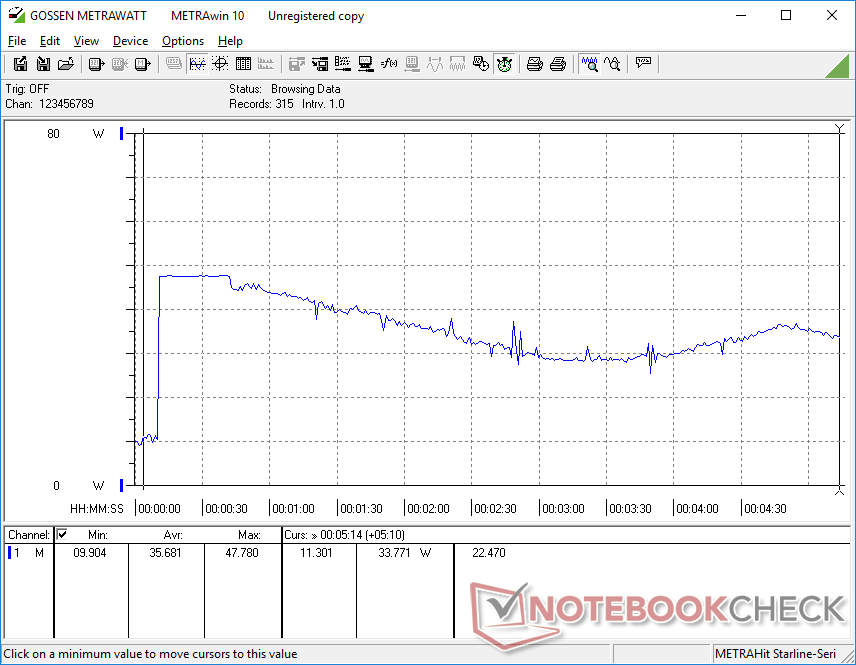
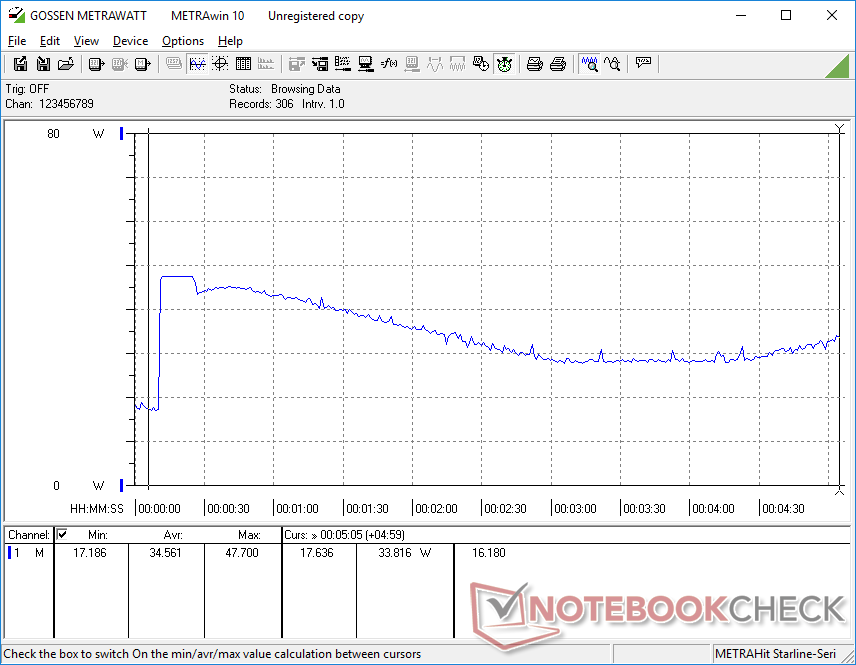
Il comportamento del consumo energetico è esattamente come quello che abbiamo osservato sul Razer Blade 15 OLED. In sintesi, ci vuole più energia per far funzionare il display OLED con impostazioni più luminose e colori più brillanti che su un pannello IPS. Al contrario, ci vuole meno energia per far funzionare un display OLED con impostazioni più fioche e colori più scuri. Per esempio, la visualizzazione di tutto il bianco all'impostazione di luminosità massima sul nostro XPS 13 OLED consuma 6,2 W in più rispetto all'impostazione di luminosità minima, mentre la differenza sarebbe solo 2 W e 4 W sulle versioni XPS 13 FHD IPS e XPS 13 4K IPS, rispettivamente. Questo è circa 3x in più di potenza per l'OLED rispetto a una tipica soluzione IPS FHD.
La visualizzazione di tutto il nero consuma la stessa quantità di energia indipendentemente dall'impostazione della luminosità, poiché i singoli pixel OLED sono essenzialmente spenti per un contrasto infinito. Siamo in grado di misurare un consumo di soli 6 W in queste condizioni, come mostrato dalla tabella qui sotto.
| Colore a tutto schermo | Impostazione della luminosità | Consumo di energia (W) |
|---|---|---|
| Bianco | 0% | 6.1 |
| Bianco | 100% | 12.3 |
| Nero | 0% | 6 |
| Nero | 100% | 6 |
| Off / Standby | |
| Idle | |
| Sotto carico |
|
Leggenda:
min: | |
| Dell XPS 13 9310 OLED i7-1185G7, Iris Xe G7 96EUs, Toshiba XG6 KXG60ZNV512G, OLED, 3456x2160, 13.4" | Dell XPS 13 9310 Core i7 4K i7-1185G7, Iris Xe G7 96EUs, Micron 2300 512GB MTFDHBA512TDV, IPS, 3840x2400, 13.4" | Dell XPS 13 9310 Core i7 FHD i7-1165G7, Iris Xe G7 96EUs, Micron 2300 512GB MTFDHBA512TDV, IPS, 1920x1200, 13.4" | Dell XPS 13 7390 Core i7-10710U i7-10710U, UHD Graphics 620, SK Hynix PC601 NVMe 512 GB, IPS, 3840x2160, 13.3" | MSI Summit E13 Flip Evo A11MT i7-1185G7, Iris Xe G7 96EUs, Phison 1TB SM2801T24GKBB4S-E162, IPS, 1920x1200, 13.4" | |
|---|---|---|---|---|---|
| Power Consumption | -1% | 17% | 2% | -13% | |
| Idle Minimum * (Watt) | 5.7 | 4.3 25% | 3.9 32% | 4.7 18% | 4.8 16% |
| Idle Average * (Watt) | 6 | 8.3 -38% | 5.9 2% | 8.3 -38% | 8.4 -40% |
| Idle Maximum * (Watt) | 12.3 | 8.8 28% | 6.3 49% | 9 27% | 8.6 30% |
| Load Average * (Watt) | 44.4 | 46.2 -4% | 39.7 11% | 42 5% | 47.1 -6% |
| Witcher 3 ultra * (Watt) | 36.5 | 42.2 -16% | 34.8 5% | 51.6 -41% | |
| Load Maximum * (Watt) | 47.8 | 47.3 1% | 47.5 1% | 49 -3% | 65.9 -38% |
* ... Meglio usare valori piccoli
Durata della batteria
L'autonomia dipende molto dalla luminosità e dal colore, come dimostrato dai nostri risultati sul consumo energetico di cui sopra. Quando si naviga sul web in modalità bilanciata con il display impostato a 150 nits, siamo stati in grado di registrare una autonomia di 6 ore e 31 minuti con una carica completa. Quando si esegue questo stesso test con la modalità ad elevato contrasto di Windows attivata, i tempi di autonomia raddoppiano fino a 13 ore e 40 minuti. La modalità ad alto contrasto non è sempre ideale, naturalmente, ma aiuta ad illustrare quanto la durata della batteria può essere estesa semplicemente cambiando lo schermo con colori più scuri. Questo è particolarmente vero quando si naviga sul web o si elabora un testo, dato che la maggior parte dello schermo è bianco in questi scenari.
La durata della batteria è notevolmente più breve rispetto alla versione XPS 13 4K IPS e specialmente alla versione XPS 13 FHD IPS dove la differenza può essere di diverse ore. Temi di colore più scuri o più grigi sono raccomandati se i lunghi tempi di autonomia sono importanti. Forse non a caso, Dell ha impostato lo sfondo di default di Windows e le finestre di Explorer in grigio invece del solito blu brillante e bianco che vediamo sempre sulle normali versioni XPS 13 IPS e sulla maggior parte degli altri portatili.
| Dell XPS 13 9310 OLED i7-1185G7, Iris Xe G7 96EUs, 52 Wh | Dell XPS 13 9310 Core i7 4K i7-1185G7, Iris Xe G7 96EUs, 52 Wh | Dell XPS 13 9310 Core i7 FHD i7-1165G7, Iris Xe G7 96EUs, 52 Wh | Dell XPS 13 7390 Core i7-10710U i7-10710U, UHD Graphics 620, 52 Wh | MSI Summit E13 Flip Evo A11MT i7-1185G7, Iris Xe G7 96EUs, 70 Wh | |
|---|---|---|---|---|---|
| Autonomia della batteria | 11% | 69% | 29% | 72% | |
| WiFi v1.3 (h) | 6.5 | 7.2 11% | 11 69% | 8.4 29% | 11.2 72% |
| Reader / Idle (h) | 30 | 21.1 | |||
| Load (h) | 3.2 | 1.8 |
Pro
Contro
Valutazione complessiva del computer portatile Dell XPS 13 9310 OLED
In modo molto simile a quello che abbiamo concluso con il recente HP Spectre x360 13, OLED non è tutto quando si tratta di display. Ha certamente i suoi vantaggi rispetto all'IPS, ma la sua lista di svantaggi è probabilmente altrettanto importante.
I vantaggi più grandi e più ovvi riguardano la qualità dell'immagine. Non c'è dubbio che l'OLED offra colori superiori, livelli di nero e tempi di risposta nero-bianco/grigio per un'esperienza visiva notevolmente migliore. Se questo è un lusso importante per i vostri carichi di lavoro quotidiani, allora OLED sarà molto più convincente rispetto all'IPS.
I vantaggi dell'OLED sono facili da notare, ma comportano dei compromessi in altre aree.
Gli svantaggi dell'OLED sono generalmente meno ovvi e non così evidenti a prima vista. In primo luogo, sia la luminosità che la risoluzione sono più deboli e inferiori, rispettivamente, rispetto all'opzione 4K dell'XPS 13. In secondo luogo, la modulazione di larghezza d'impulso è presente a frequenze più basse per uno sfarfallio potenzialmente più evidente. E infine, il consumo di energia varierà molto a seconda dei colori riprodotti e della luminosità per una durata della batteria potenzialmente più breve rispetto all'IPS.
Tenete a mente che l'XPS 13 OLED costa circa lo stesso dell'XPS 13 4K IPS. Così, gli utenti non sono più tenuti a pagare costi aggiuntivi solo per il lusso di un pannello OLED a differenza di molti portatili OLED precedenti. Questo rende OLED più facile da raccomandare al giorno d'oggi, a patto che gli utenti siano informati sui suoi pro e contro.
Prezzo e disponibilità
Dell ha lanciato solo di recente la versione XPS 13 9310 OLED e non è ancora ampiamente disponibile nella maggior parte dei rivenditori al momento della recensione. Il sistema è attualmente esaurito presso Best Buy per $1949 USD, il che significa che la vostra migliore scommessa per una versione OLED al momento è ordinare direttamente attraverso Dell.com
Dell XPS 13 9310 OLED
- 08/31/2022 v7 (old)
Allen Ngo
Price comparison
