Recensione del computer portatile Dell Latitude 13 7320 sganciabile: Un migliore Microsoft Surface Pro 7
Presentato al CES 2021 Il Dell Latitude 7320 sganciabile è solo uno dei tre modelli della serie di fascia alta 7320 con gli altri due che sono il Latitude 7320 convertibile e Latitude 7320 clamshell. Insieme, questi modelli seguono direttamente al più vecchio 10° gen Ice Lake Latitude 7310 introducendo nuovi design del telaio e nuove opzioni 11° gen Tiger Lake-U.
Le versioni del Latitude 7320 vanno da $1560 USD se configurato con la CPU base Core i3-1110G4, 4 GB di RAM ed SSD NVMe da 128 GB fino a $2540 USD se configurato con la CPU Core i7-1180G7 vPro, 16 GB di RAM e SSD NVMe da 1 TB. Tutte le opzioni per il resto sono dotate dello stesso touchscreen 3:2 da 13" 1920 x 1280.
I concorrenti diretti includono altri tablets Windows di fascia alta o staccabili tra cui la Serie Microsoft Surface Pro e il Lenovo ThinkPad X12.
Altre recensioni di Dell:
Confronto con i potenziali concorrenti
Punteggio | Data | Modello | Peso | Altezza | Dimensione | Risoluzione | Prezzo |
|---|---|---|---|---|---|---|---|
| 87.7 % v7 (old) | 06/2021 | Dell Latitude 13 7320 Detachable, i7-1180G7 i7-1180G7, Iris Xe G7 96EUs | 782 gr | 8.44 mm | 13.00" | 1920x1280 | |
| 88.5 % v7 (old) | 03/2021 | Microsoft Surface Pro 7 Plus i5-1135G7, Iris Xe G7 80EUs | 796 gr | 8.5 mm | 12.30" | 2736x1824 | |
| 88.5 % v7 (old) | 04/2021 | Lenovo ThinkPad X12 20UVS03G00 i7-1160G7, Iris Xe G7 96EUs | 1.1 kg | 14.5 mm | 12.30" | 1920x1280 | |
| 86.3 % v7 (old) | 10/2019 | Dell XPS 13 7390 2-in-1 Core i7 i7-1065G7, Iris Plus Graphics G7 (Ice Lake 64 EU) | 1.3 kg | 13 mm | 13.40" | 1920x1200 | |
| 87.1 % v7 (old) | 11/2020 | Lenovo Yoga Duet 7 13IML05-82AS000WGE i5-10210U, UHD Graphics 620 | 1.2 kg | 9.2 mm | 13.00" | 2160x1350 |
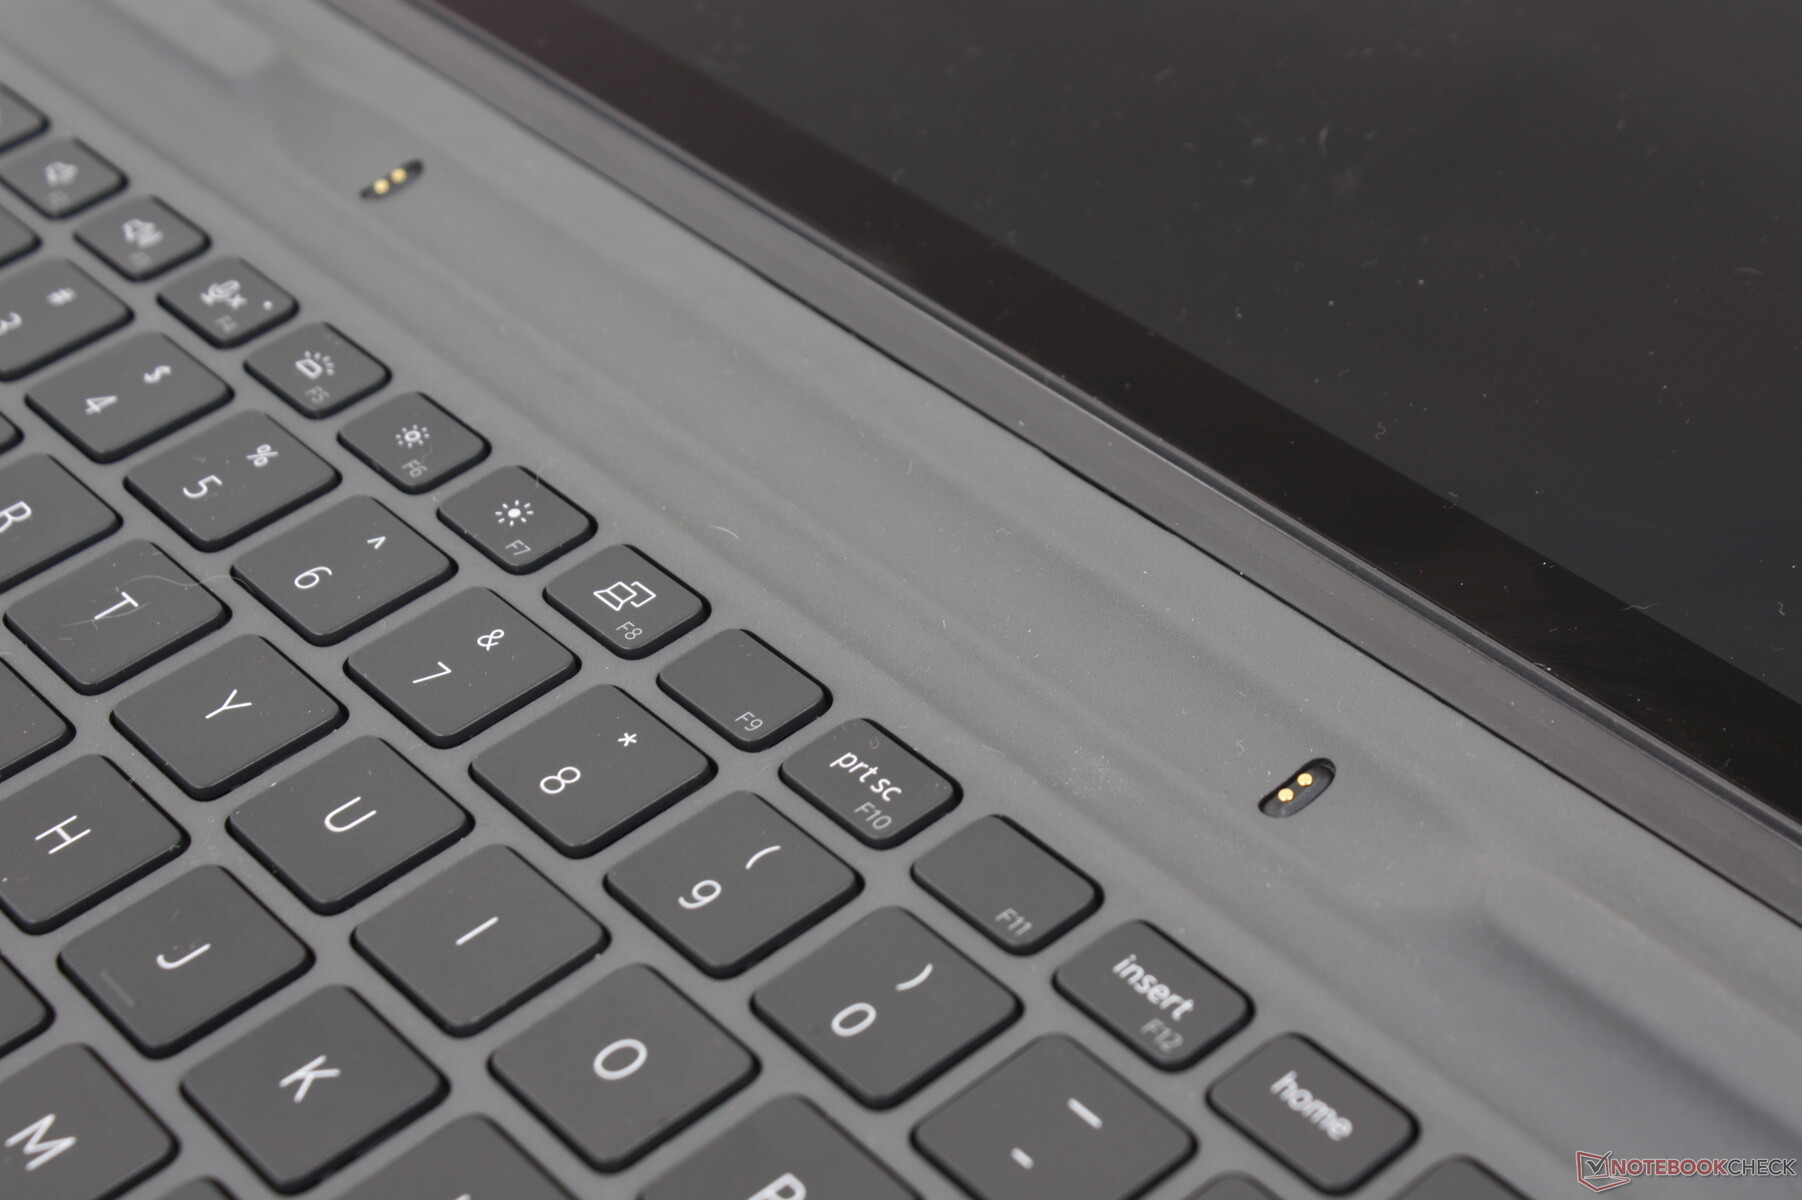
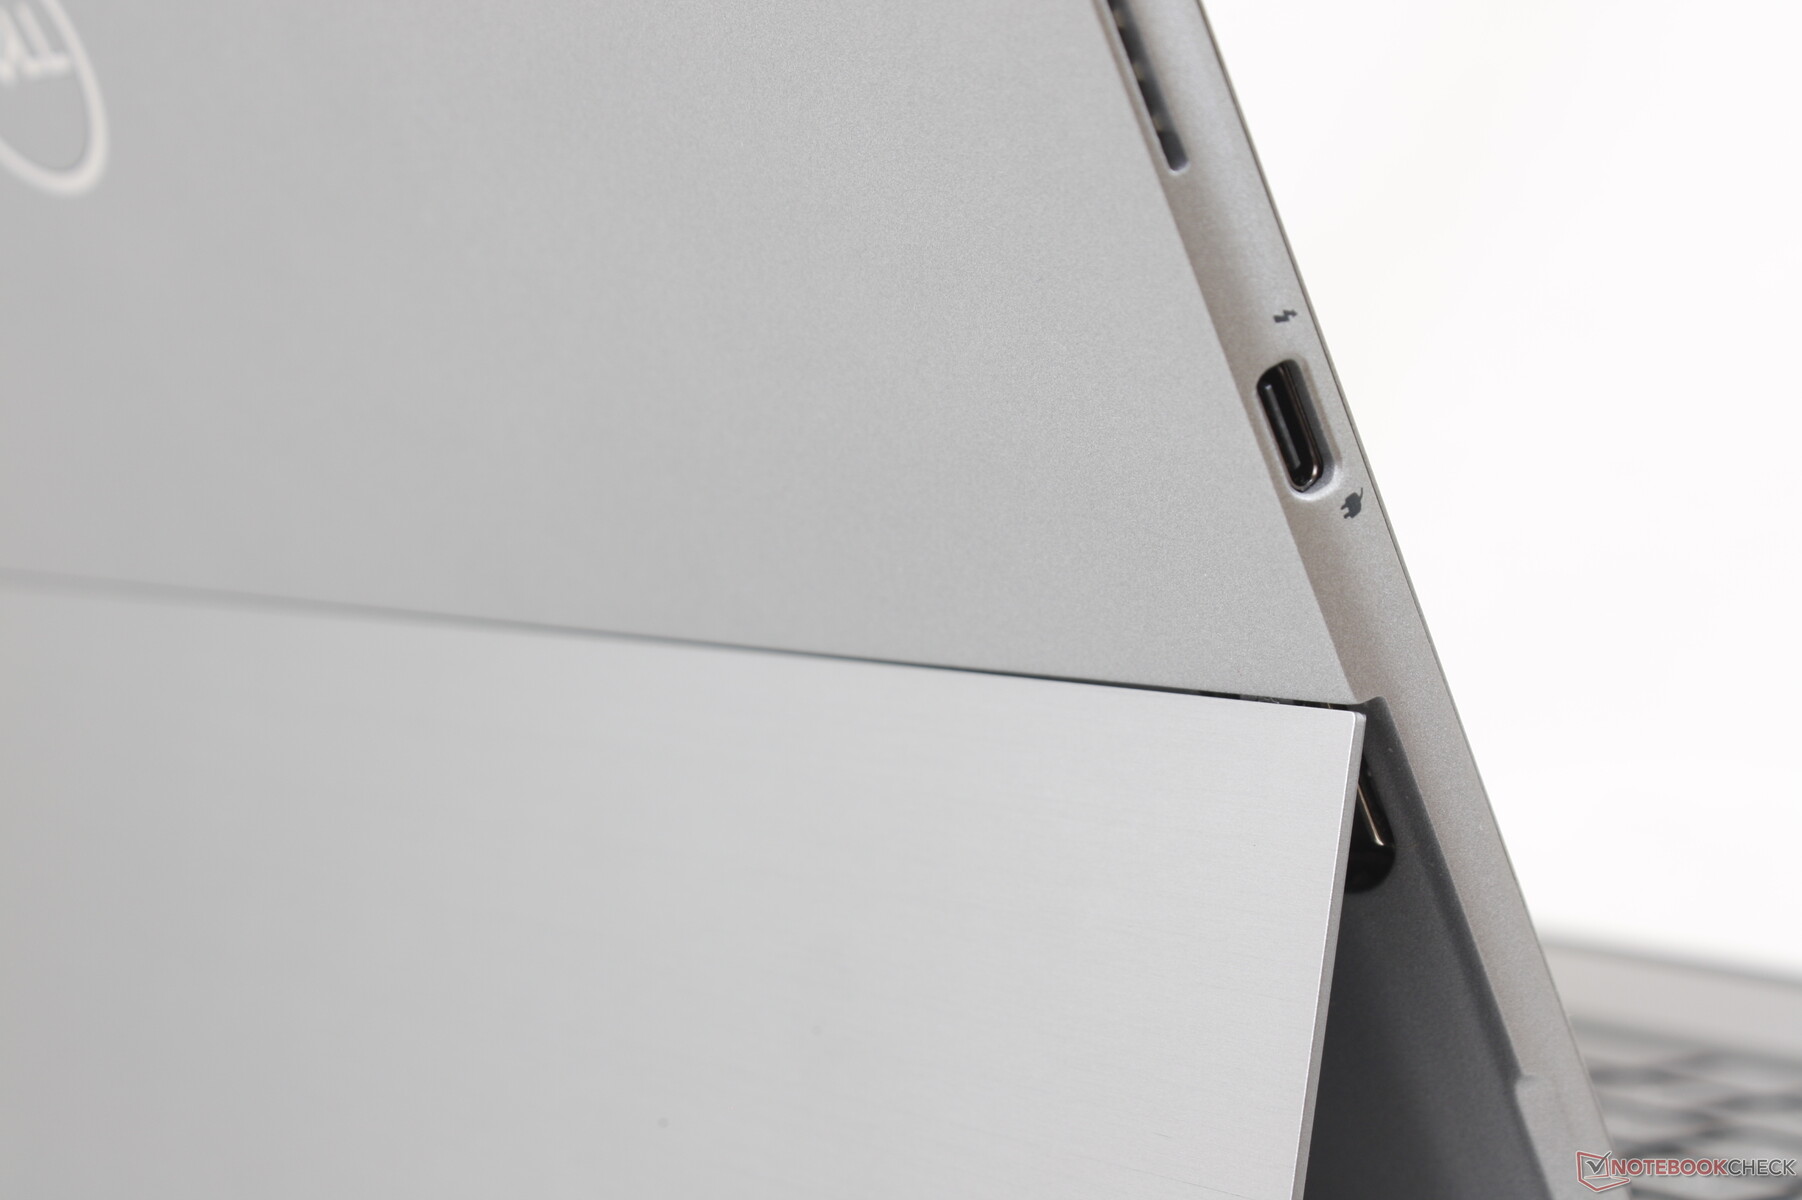
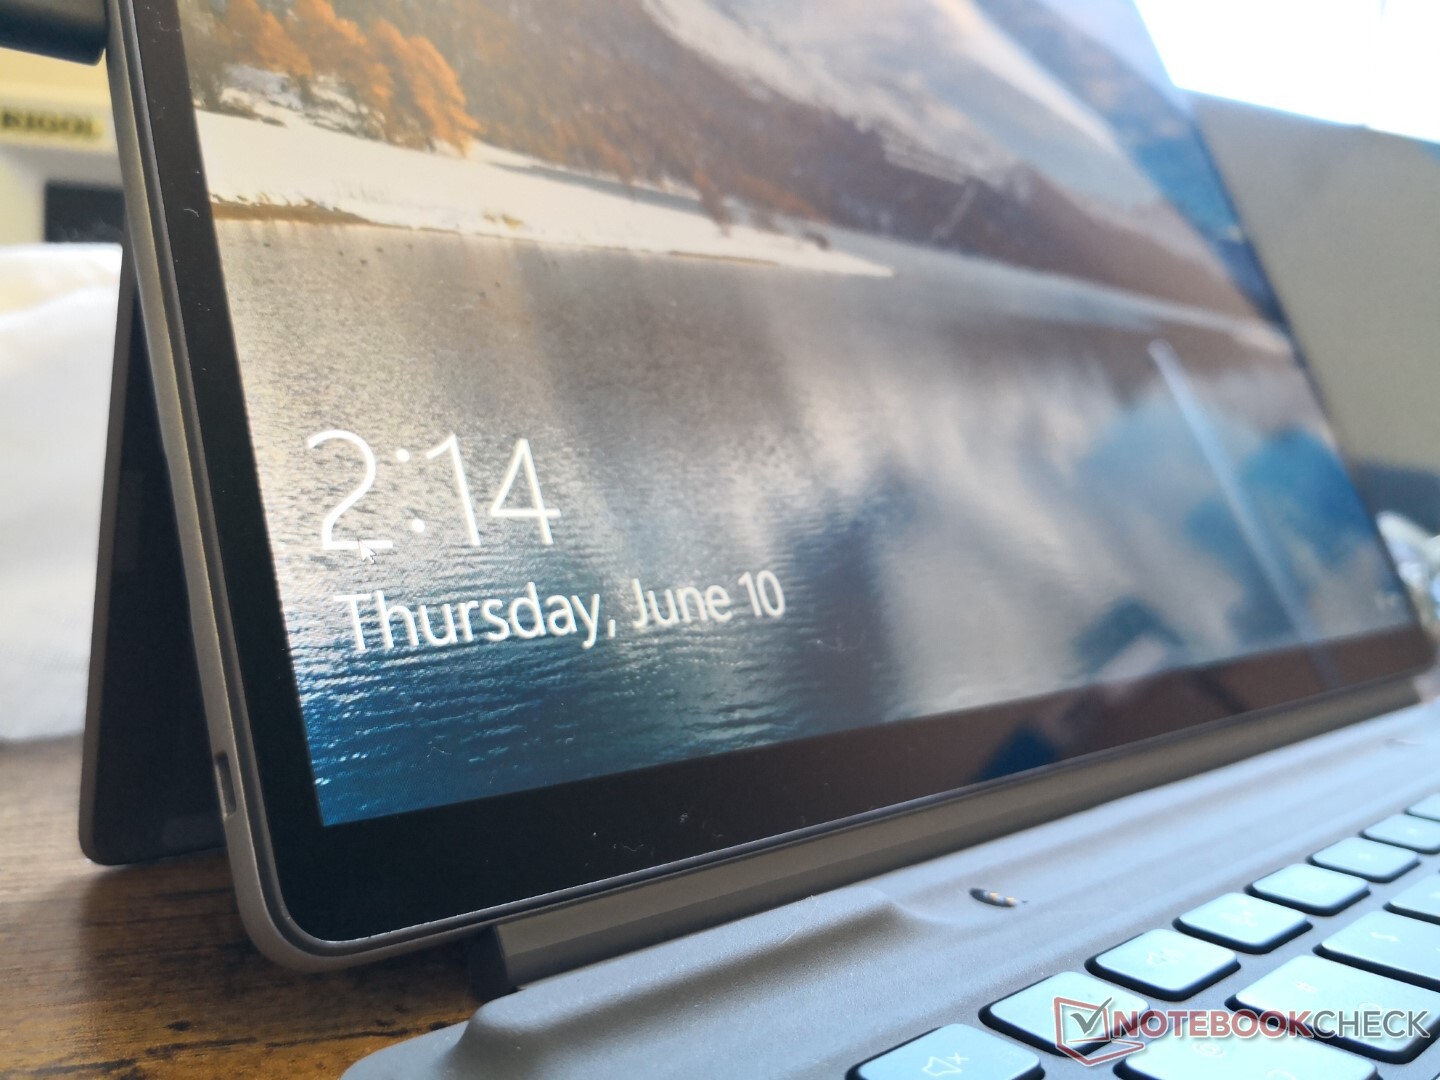
Case - Cornici più strette rispetto al Surface Pro 7
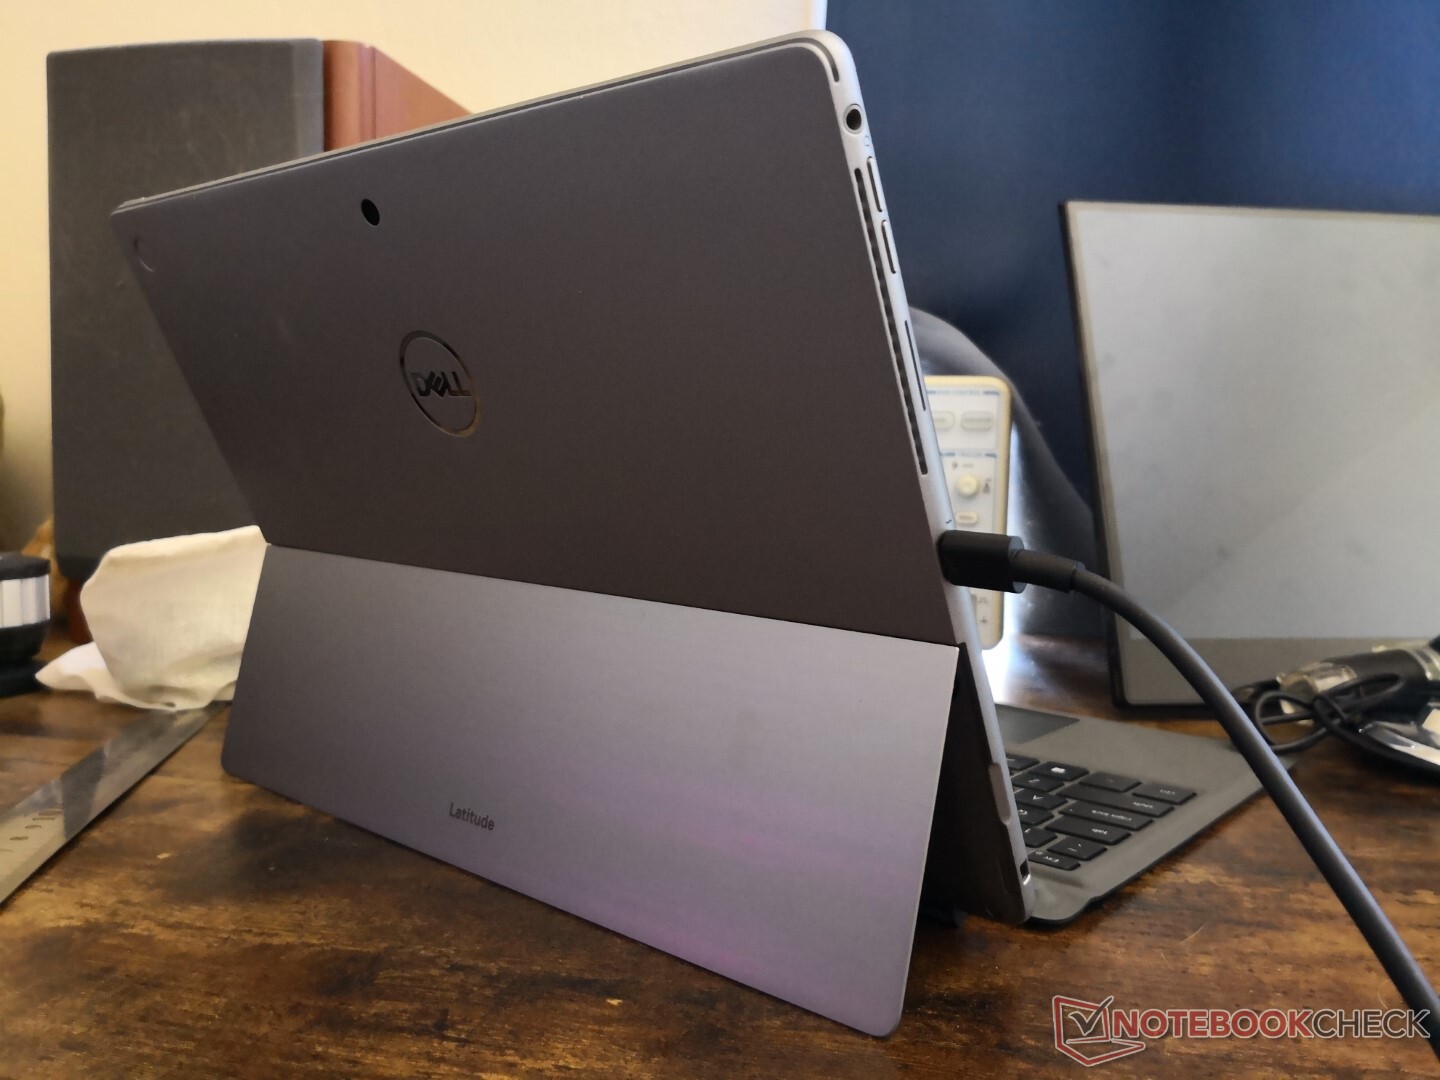
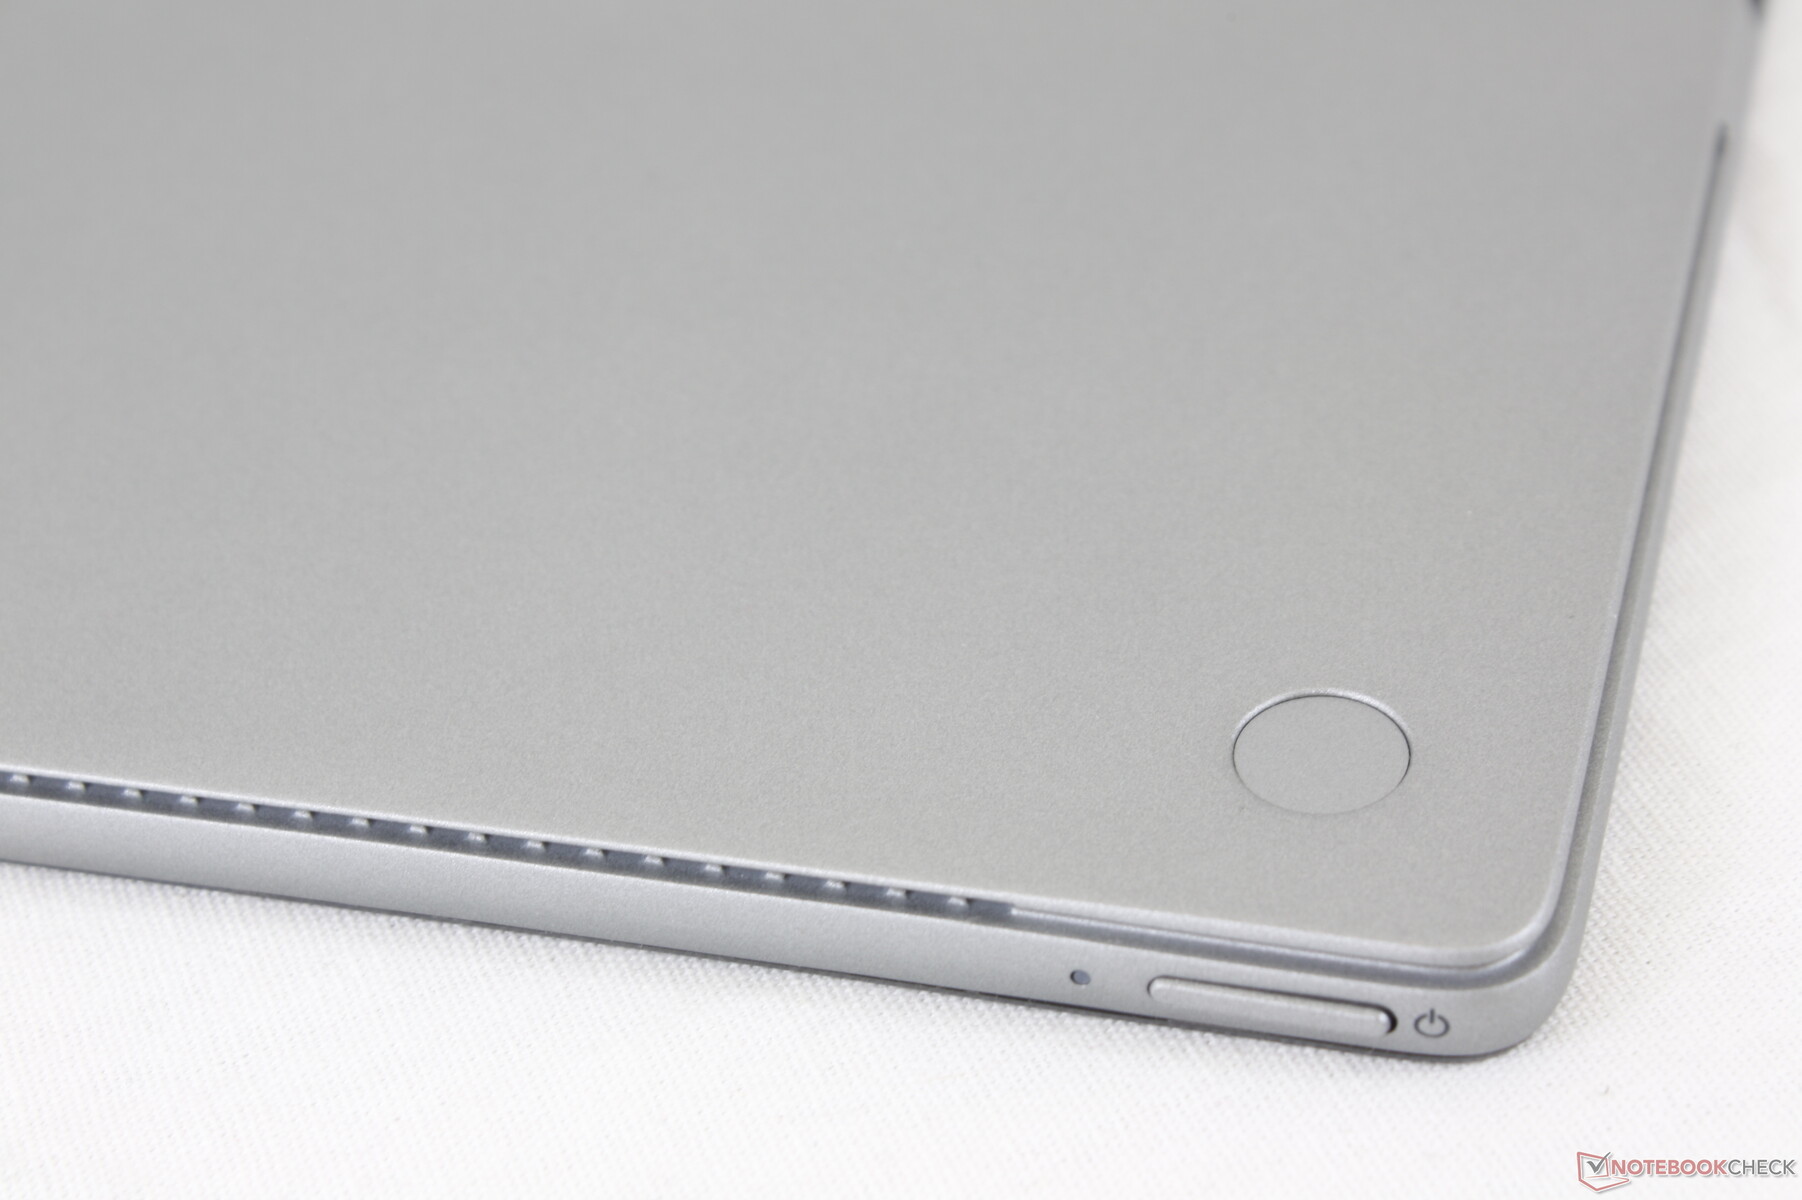
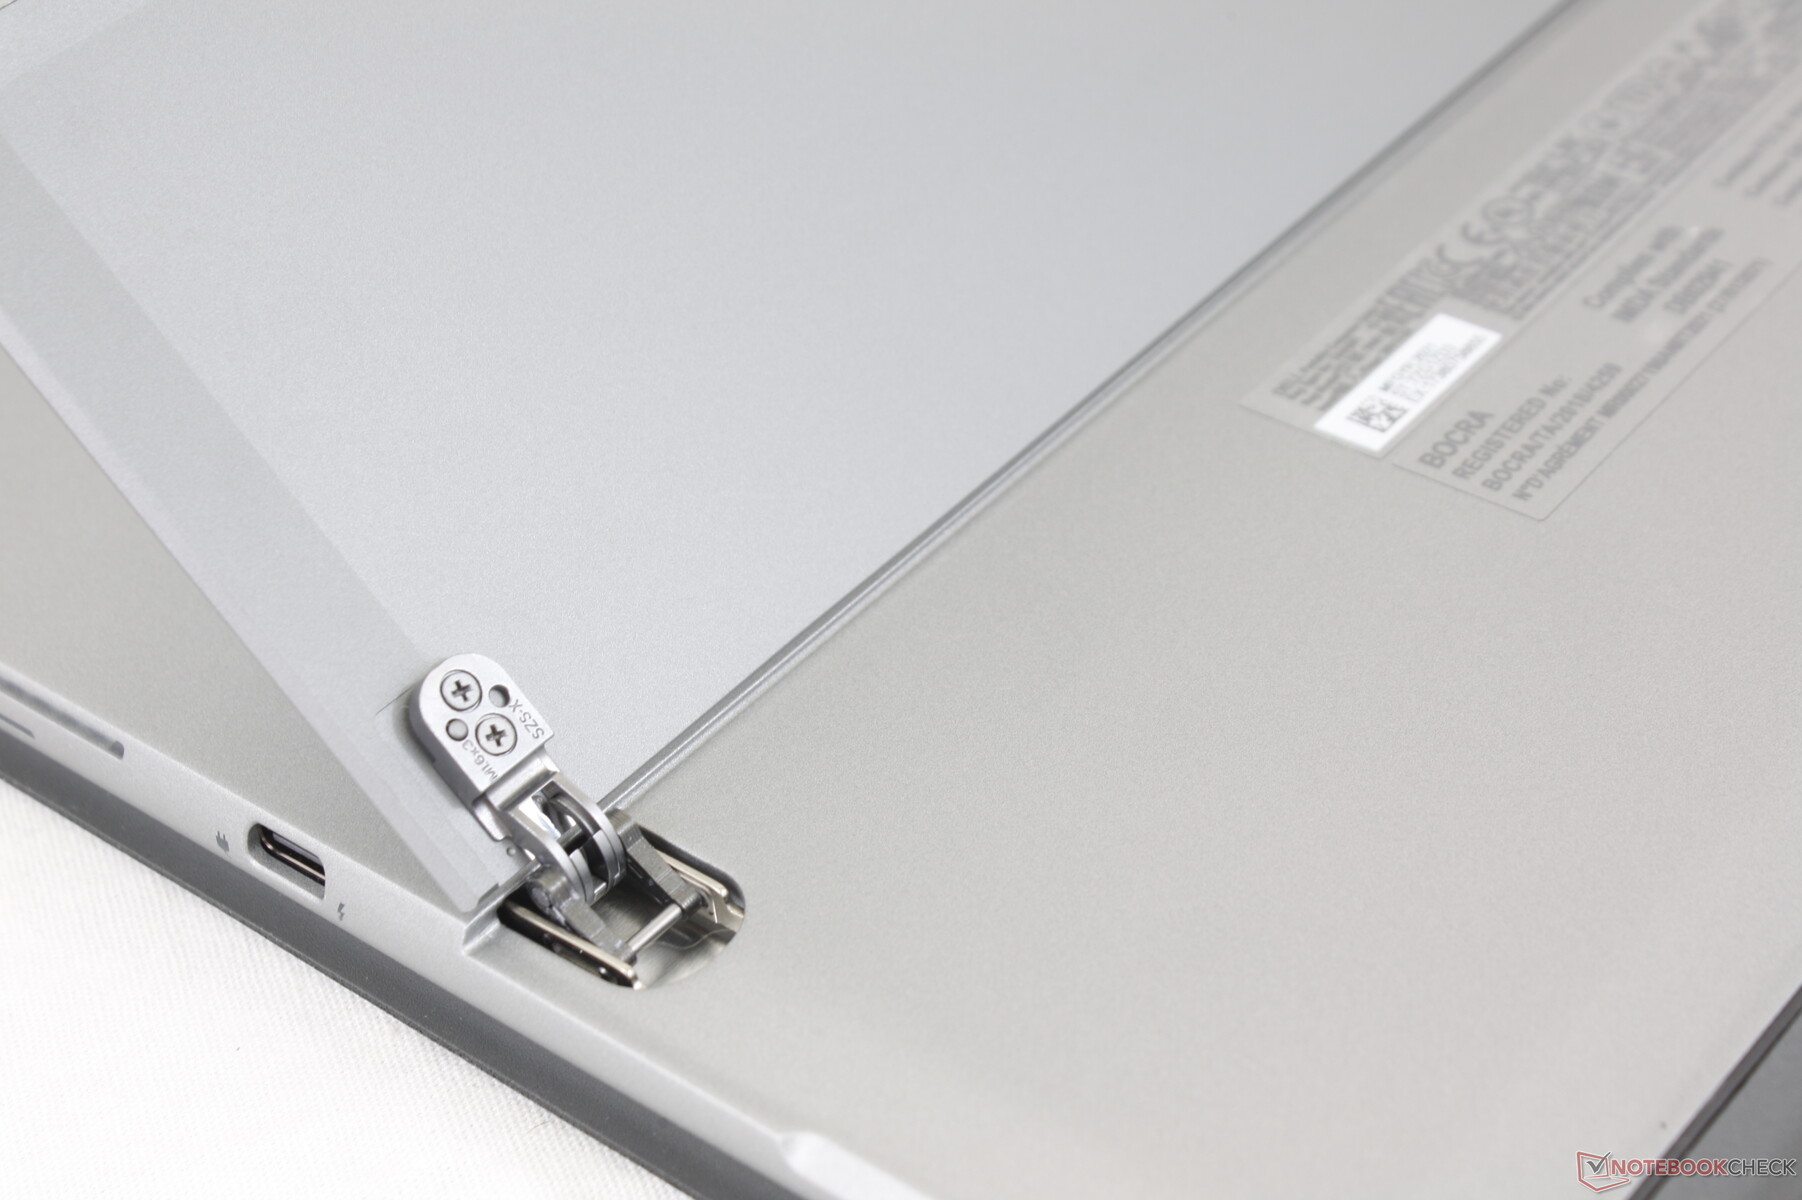
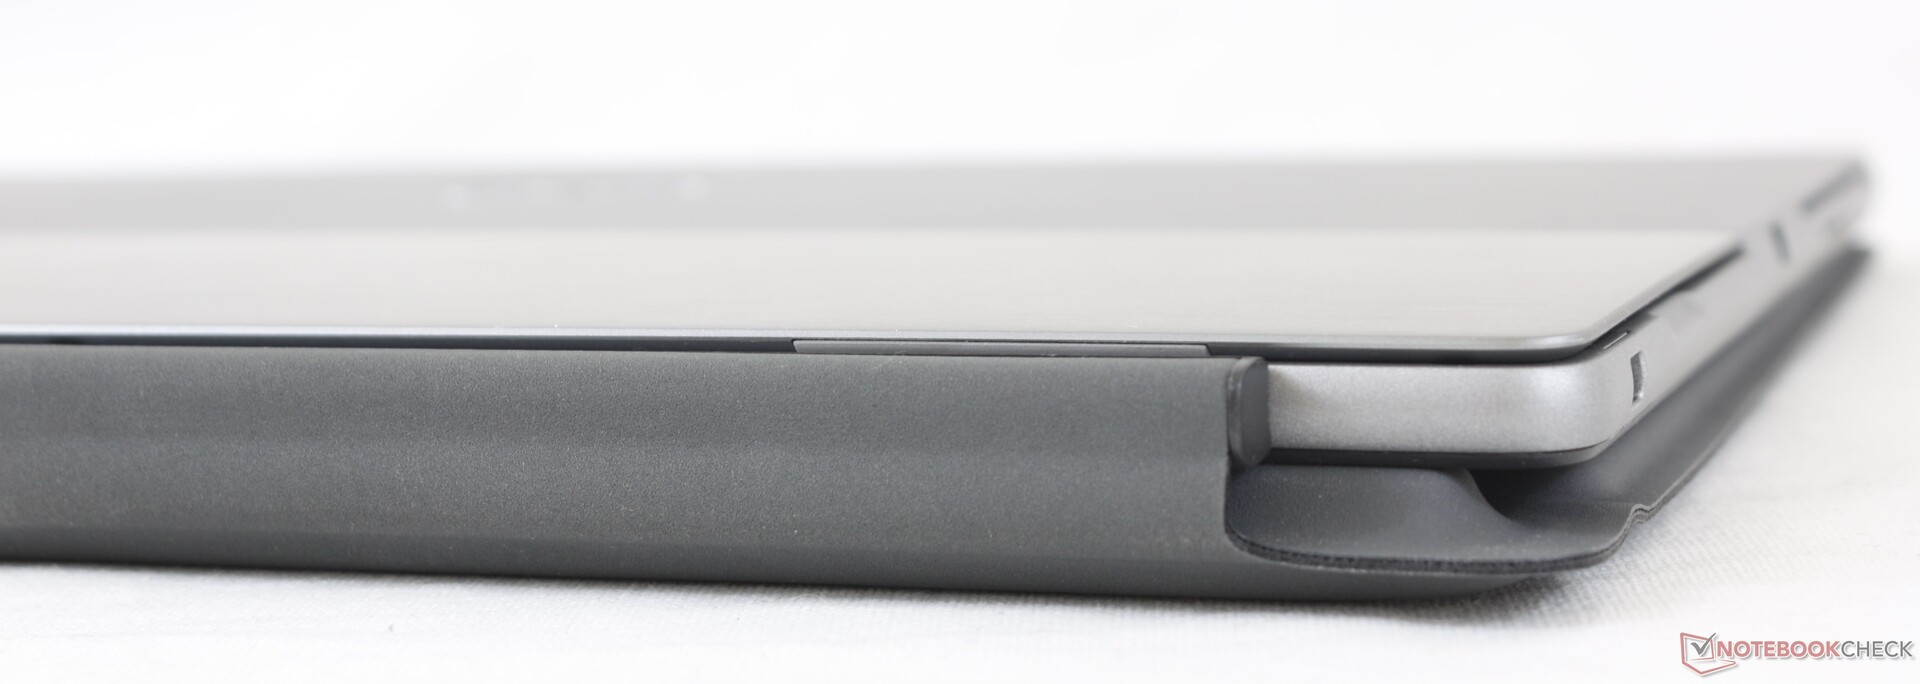
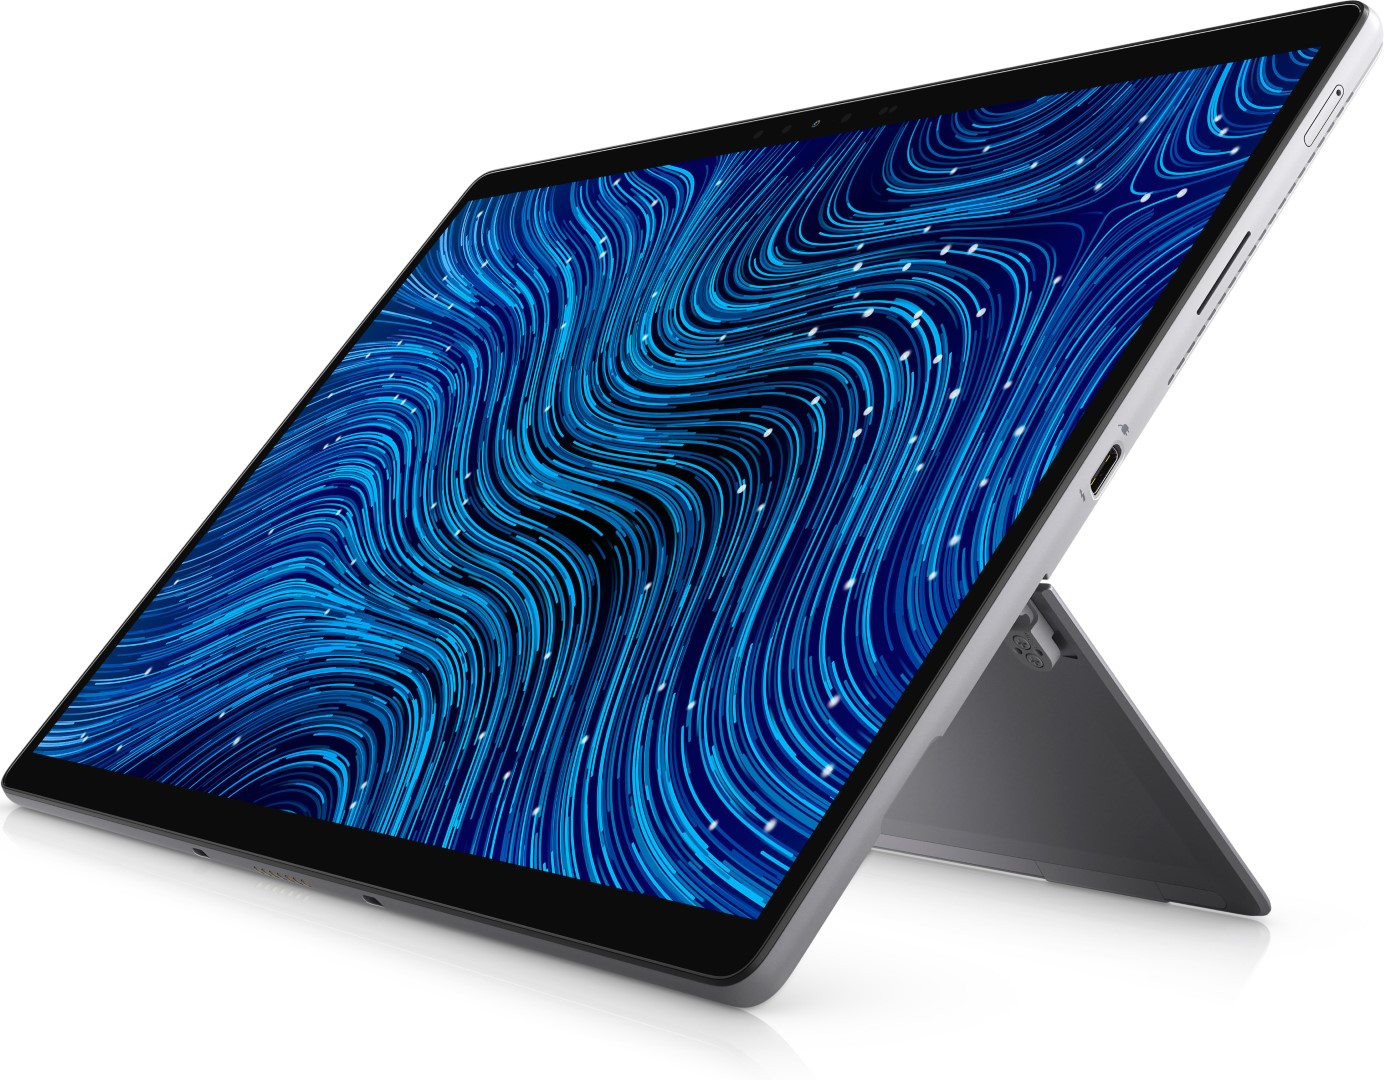
I dispositivi Dell Latitude sono costruiti in modo più robusto rispetto ai tipici Inspiron o Vostro, mentre hanno un aspetto più sobrio di un XPS per adattarsi meglio agli ambienti di lavoro professionali. A differenza di molti dei suoi fratelli a conchiglia Latitude, tuttavia, il Latitude 7320 sganciabile non è conforme allo standard MIL-STD 810G. Il supporto in metallo e il vetro Gorilla Glass anteriore si sentono comunque lussuosi con una flessione minima.
Ci sono un paio di miglioramenti che vorremmo vedere. Il sottile cavalletto di metallo, per esempio, sembra allentato e quindi tende a traballare quando si regolano gli angoli. Anche la base della tastiera si flette più di quanto vorremmo, il che ha un impatto negativo sull'esperienza di digitazione.
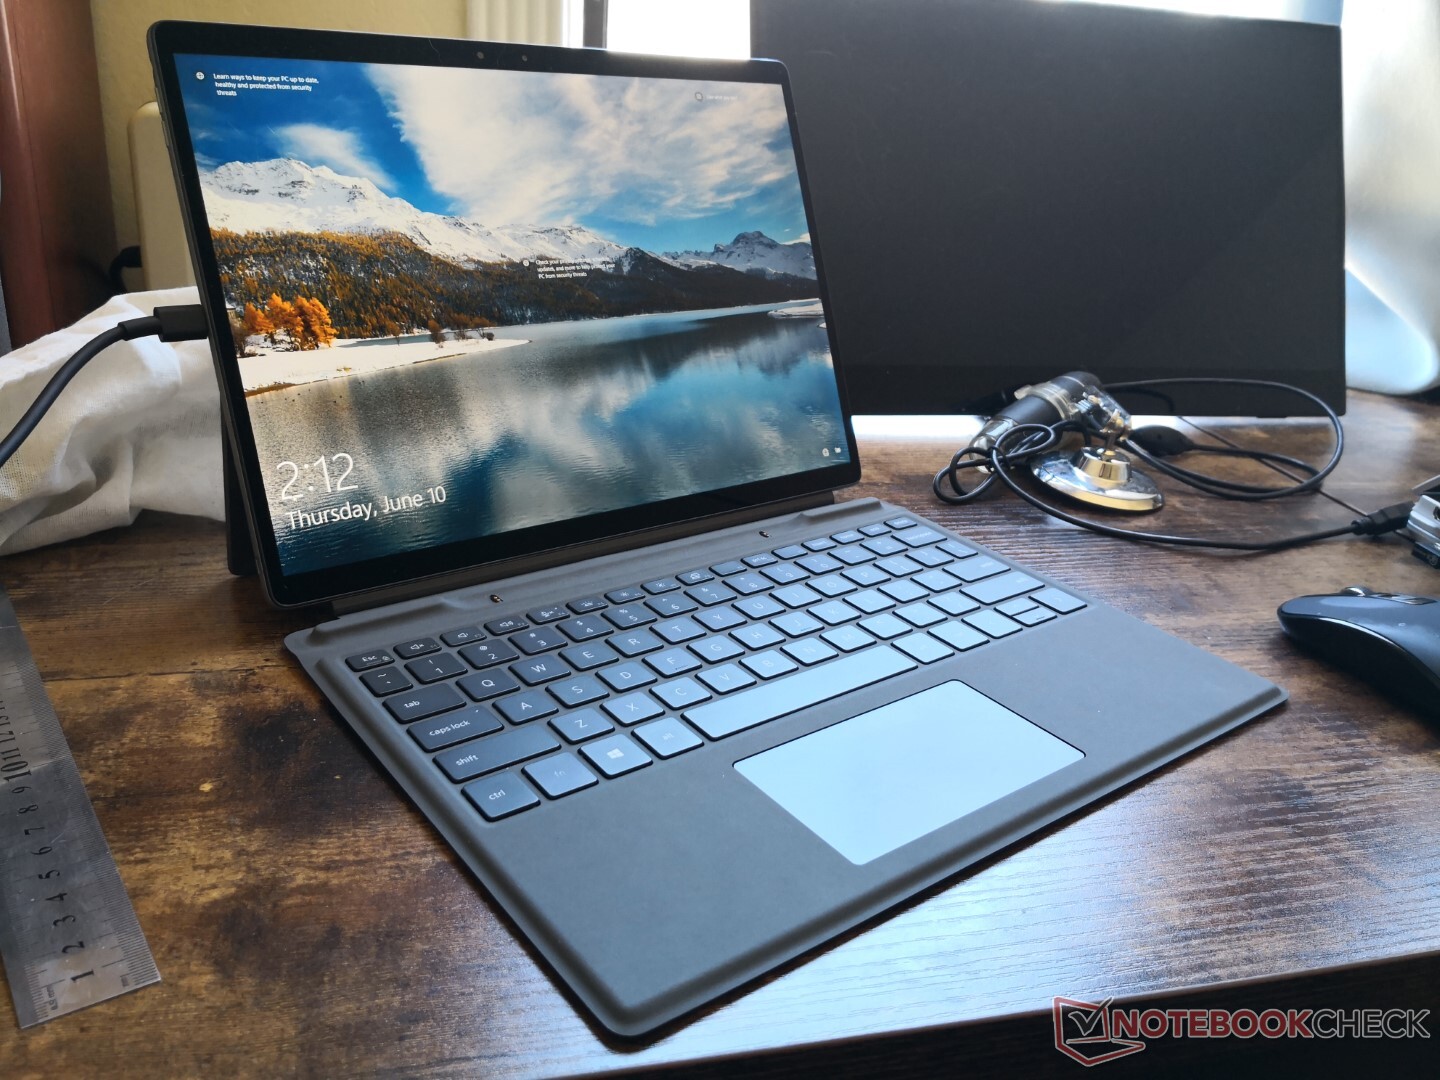
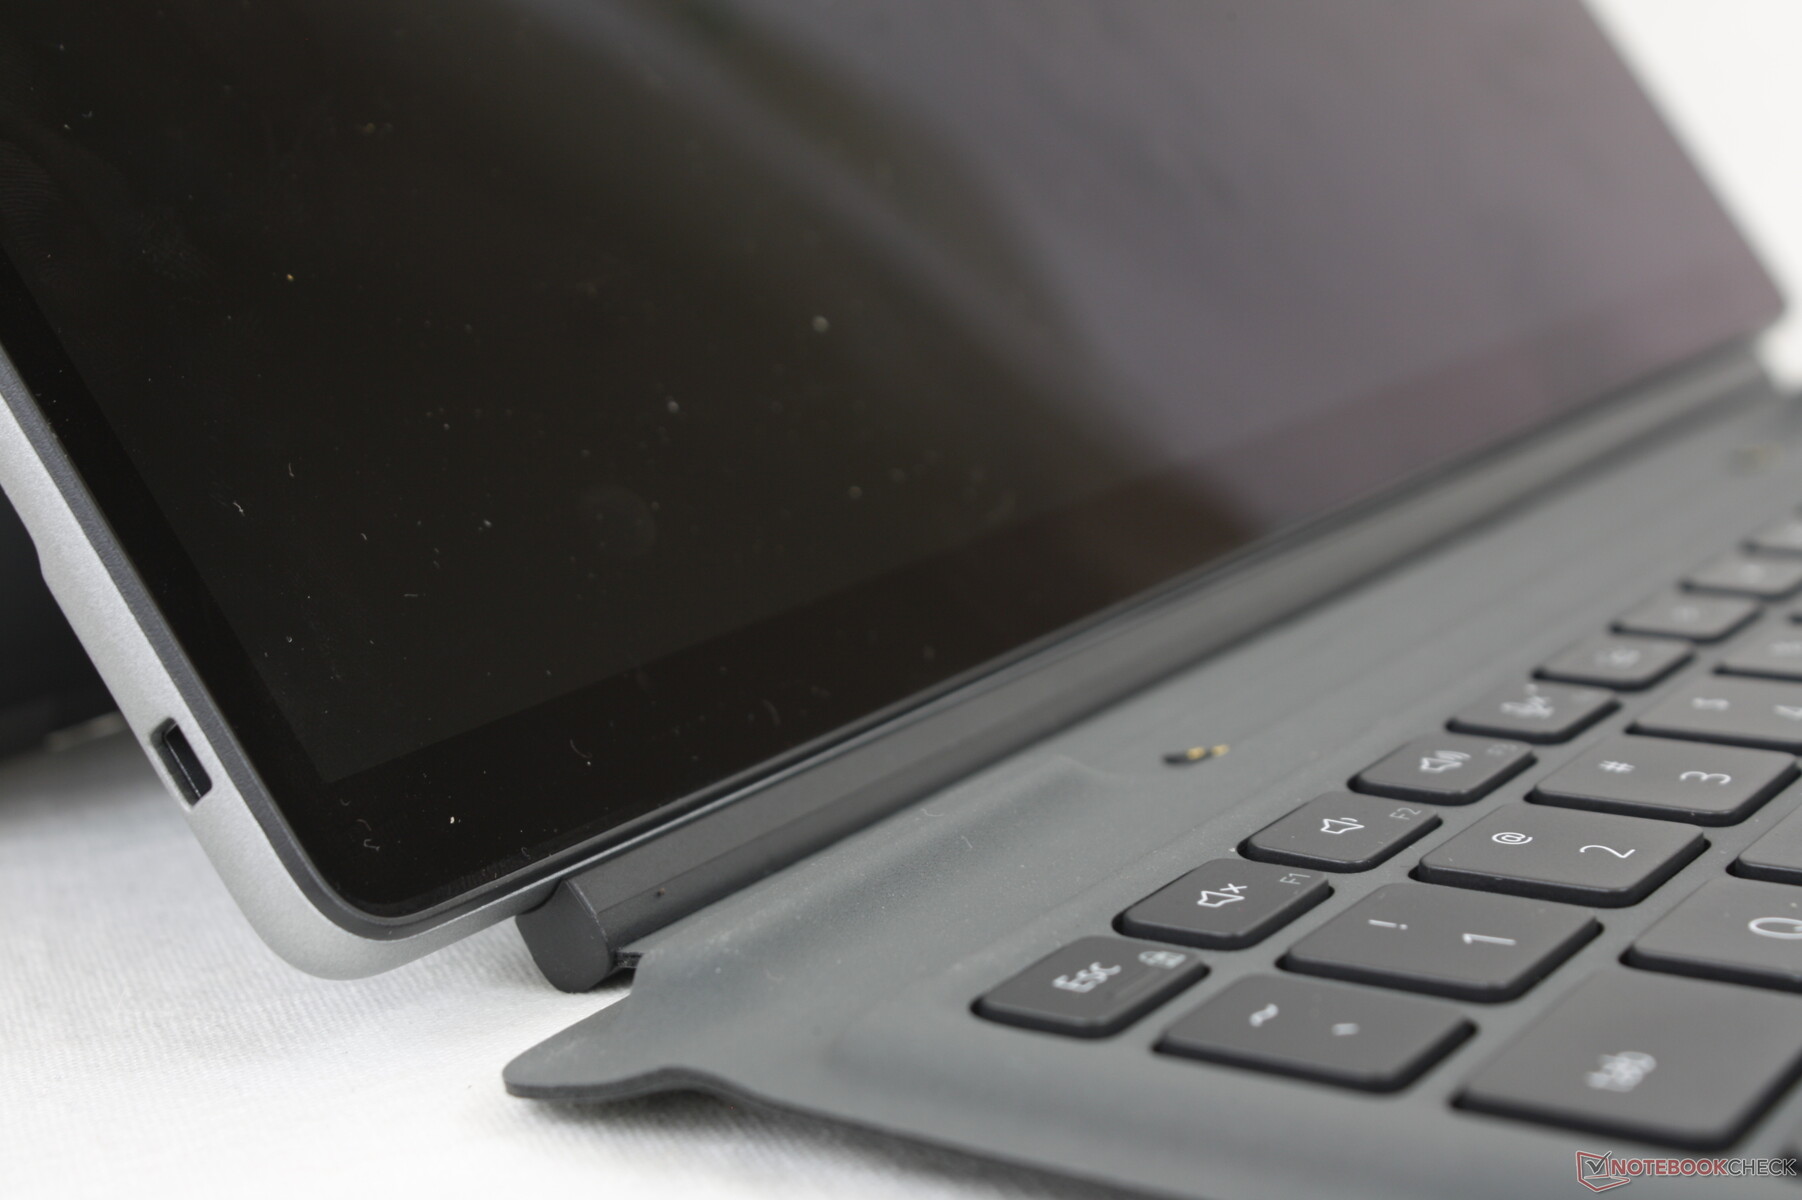
Le dimensioni complessive e il peso sono molto vicini al Surface Pro 7 da 12,3", il che significa che l'unità Dell è in grado di integrare un touchscreen più grande da 13" senza dover aumentare le dimensioni del tablet. Questo fa sembrare le spesse cornici del Microsoft Surface ancora più obsolete di quanto non lo siano già. Ci aspettiamo che Microsoft giochi a recuperare il ritardo introducendo nuovi modelli di Surface Pro con cornici più strette nel prossimo futuro.
| Latitude 7320 sganciabile | Dimensioni (mm) | Peso (g) |
| Tablet | 288,4 x 207,9 x 8,44 | 782 |
| Tastiera Dock | 284.2 x 215,6 x 5,1 | 342 |
| Tablet con tastiera Dock | 288.4 x 215,6 x 13,54 | 1124 |
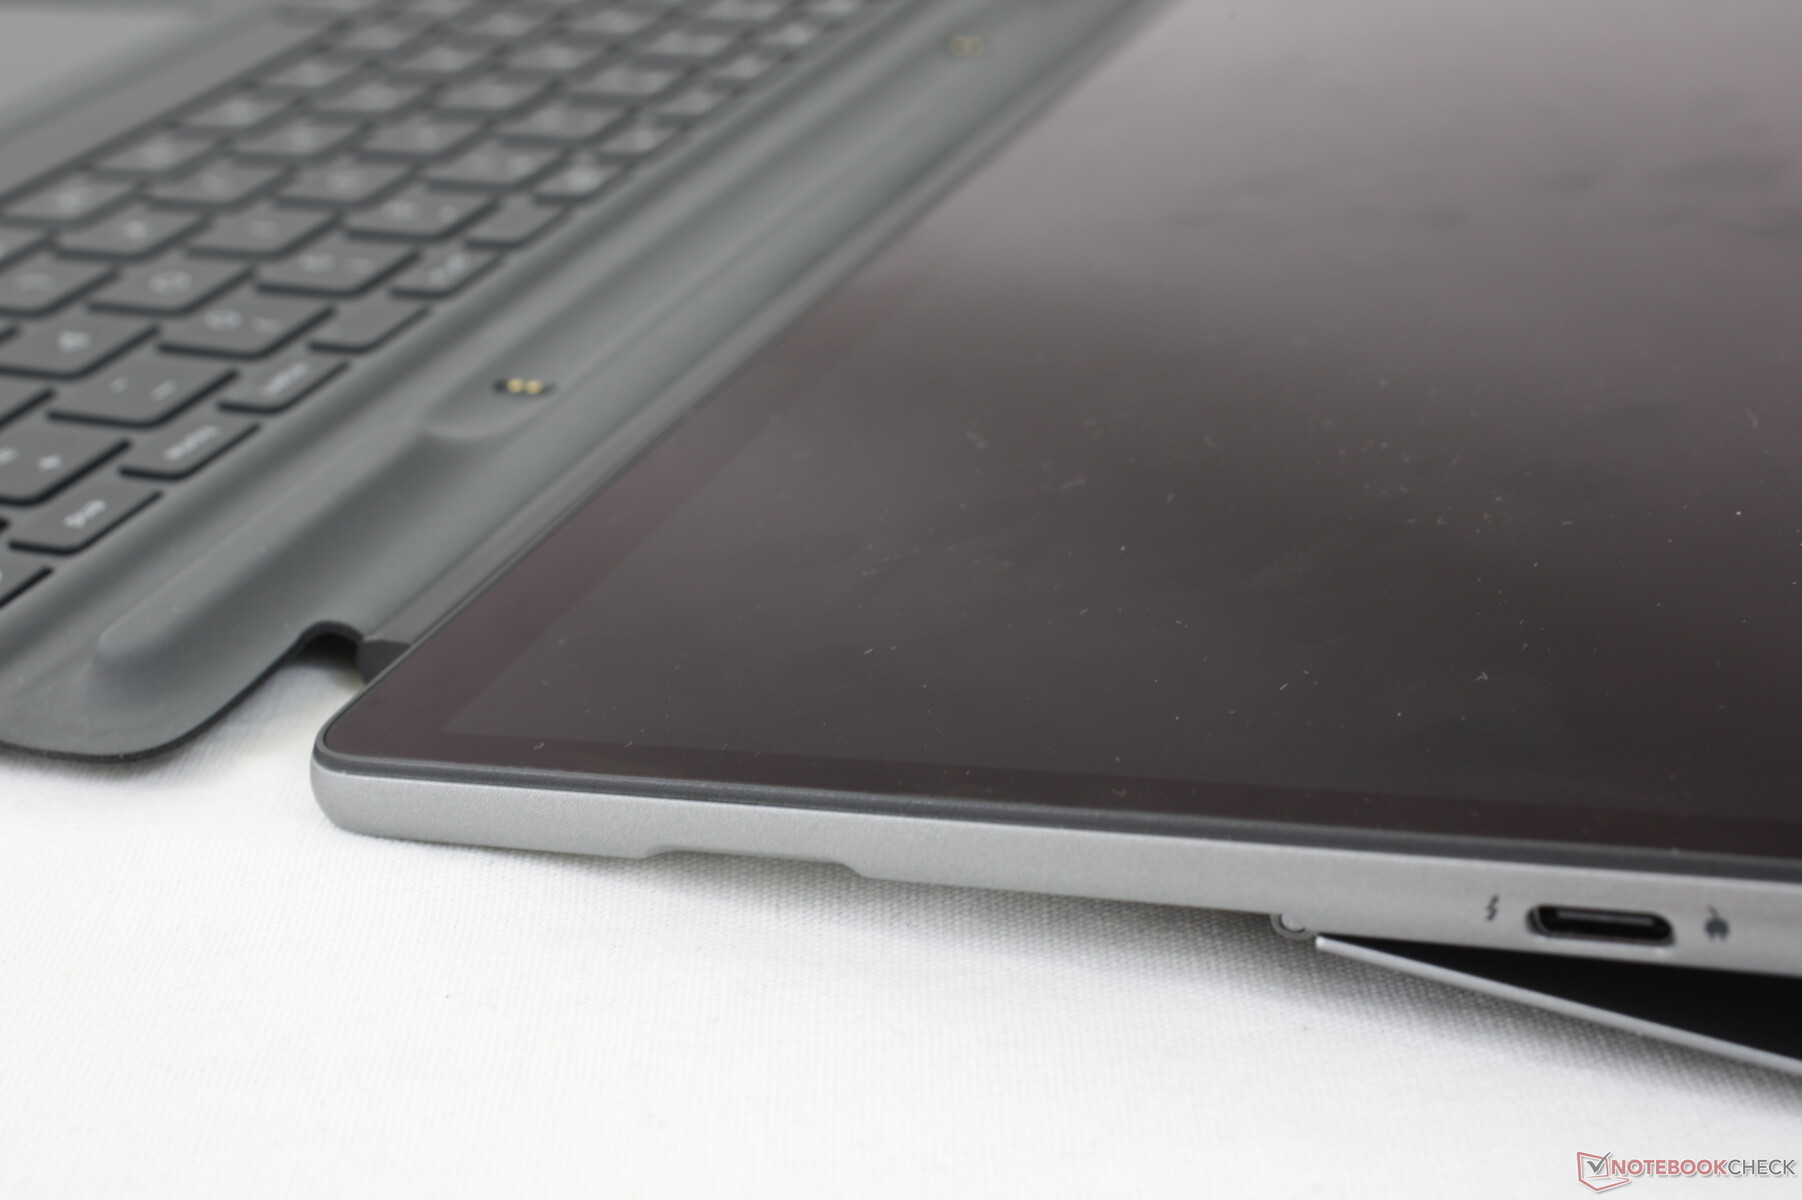
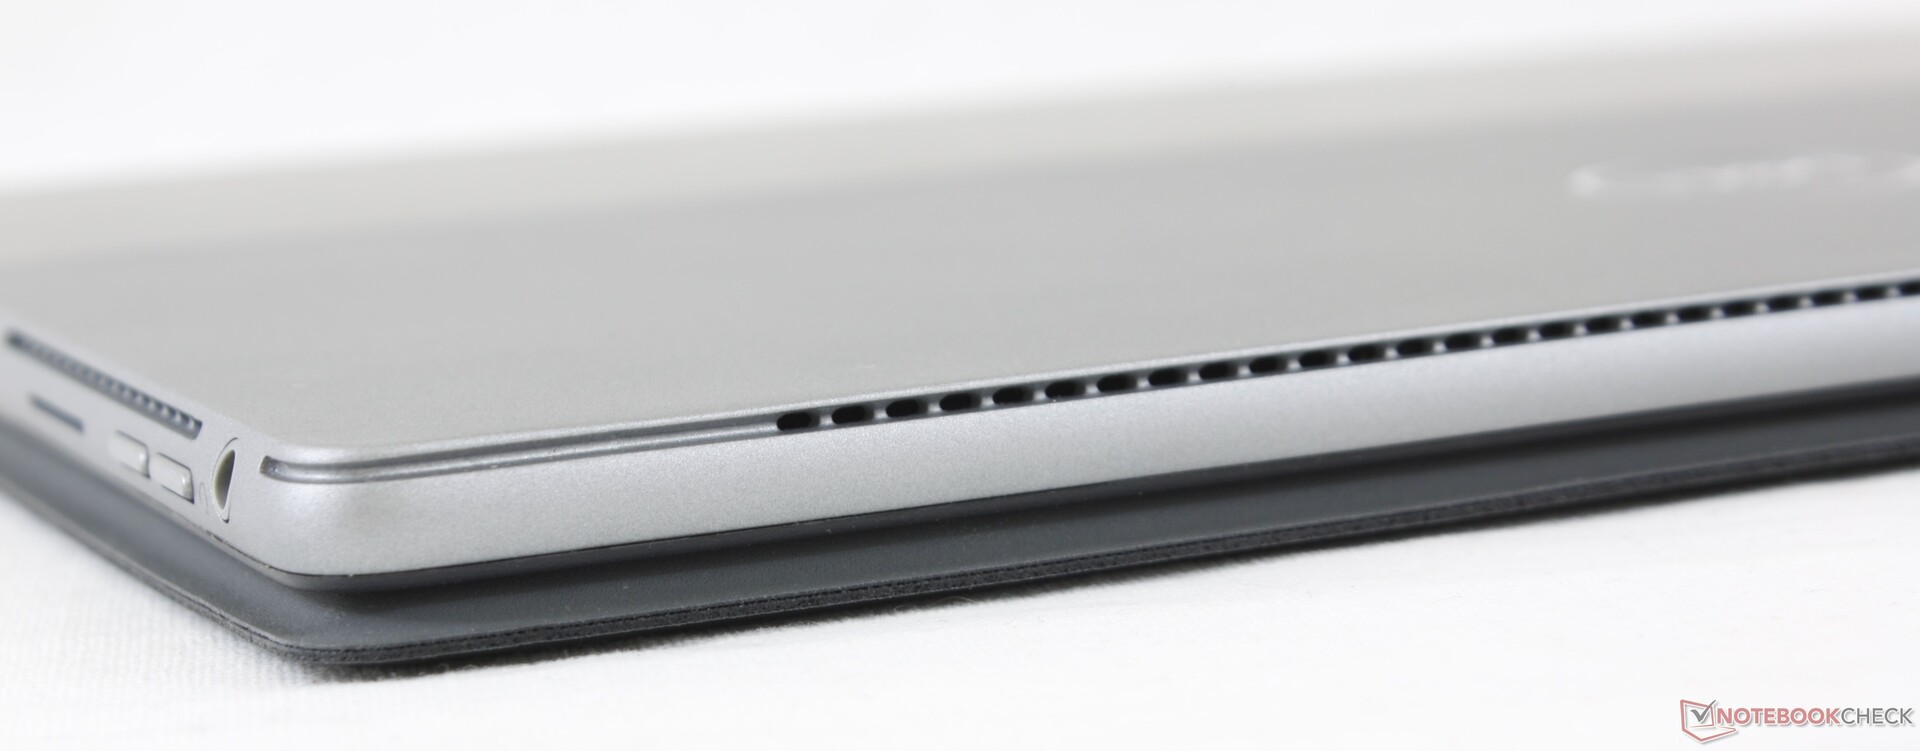
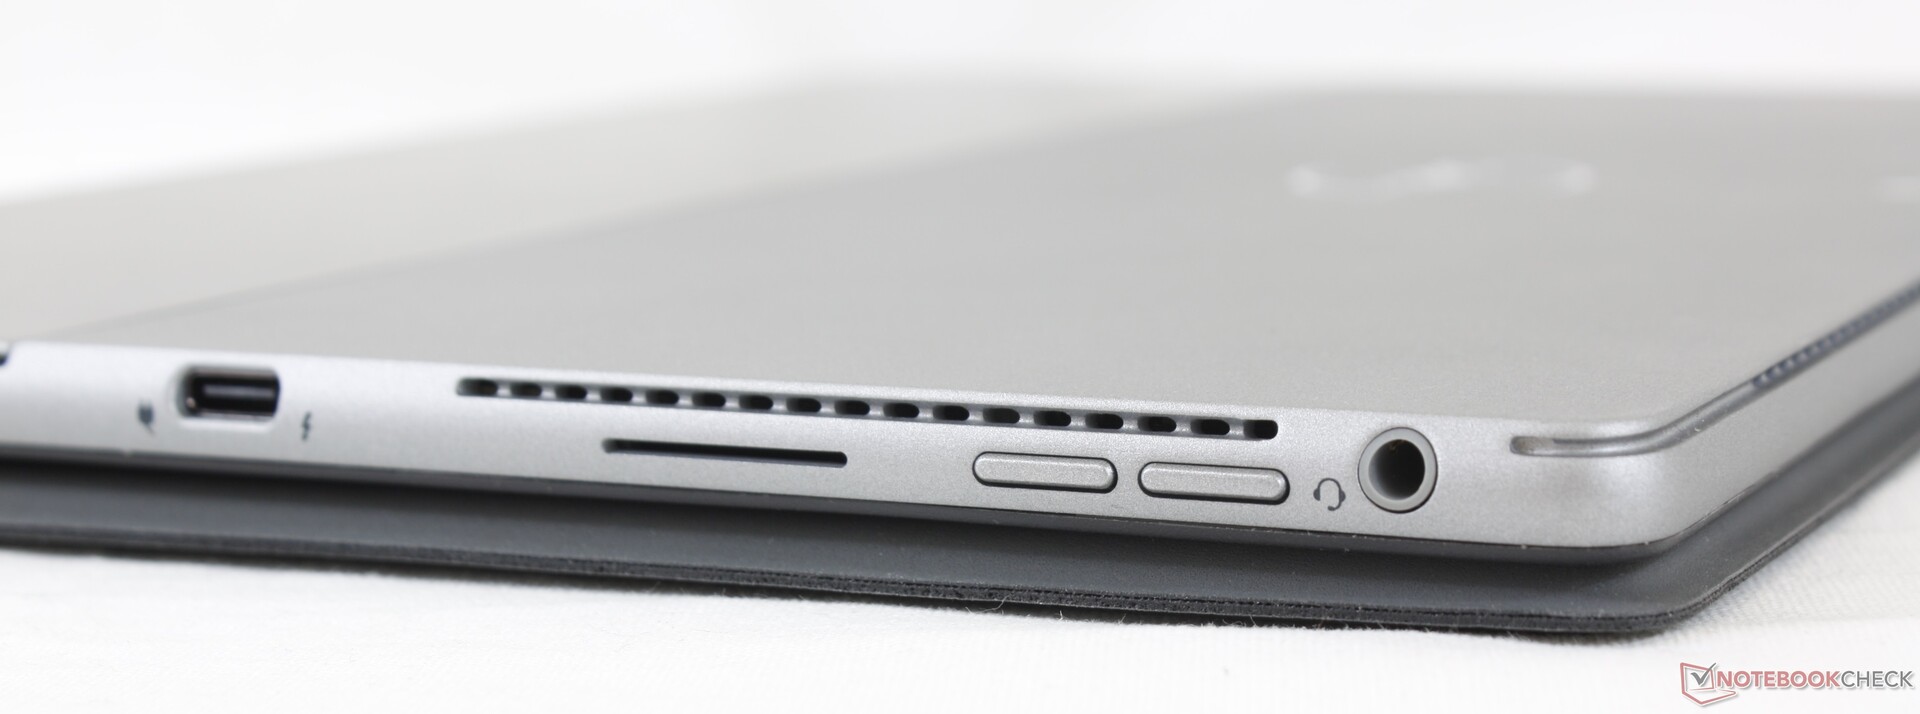
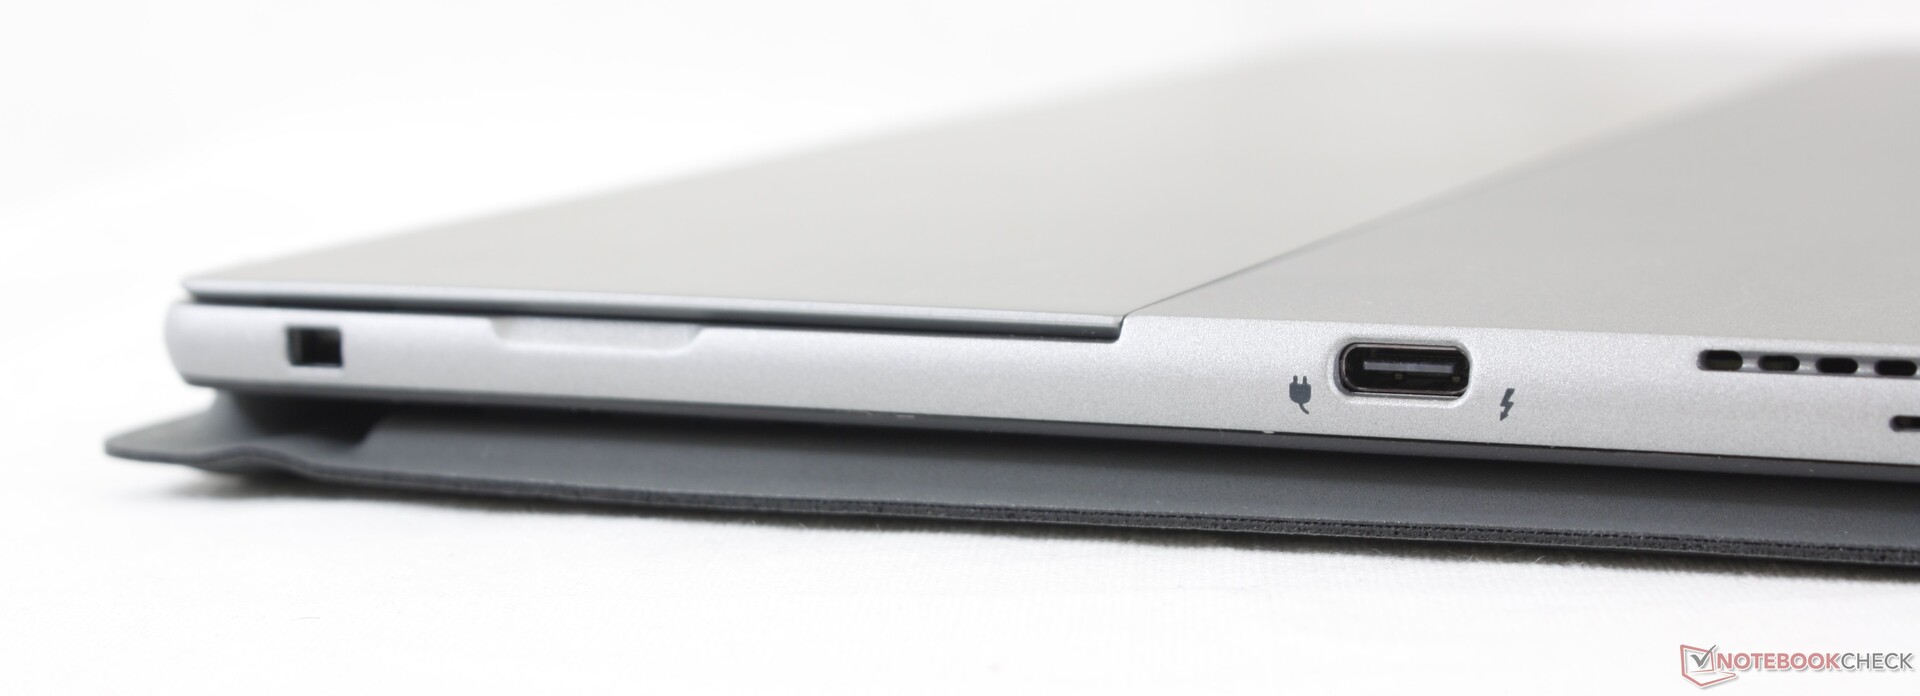
Connessioni - Thunderbolt 4 per tutti
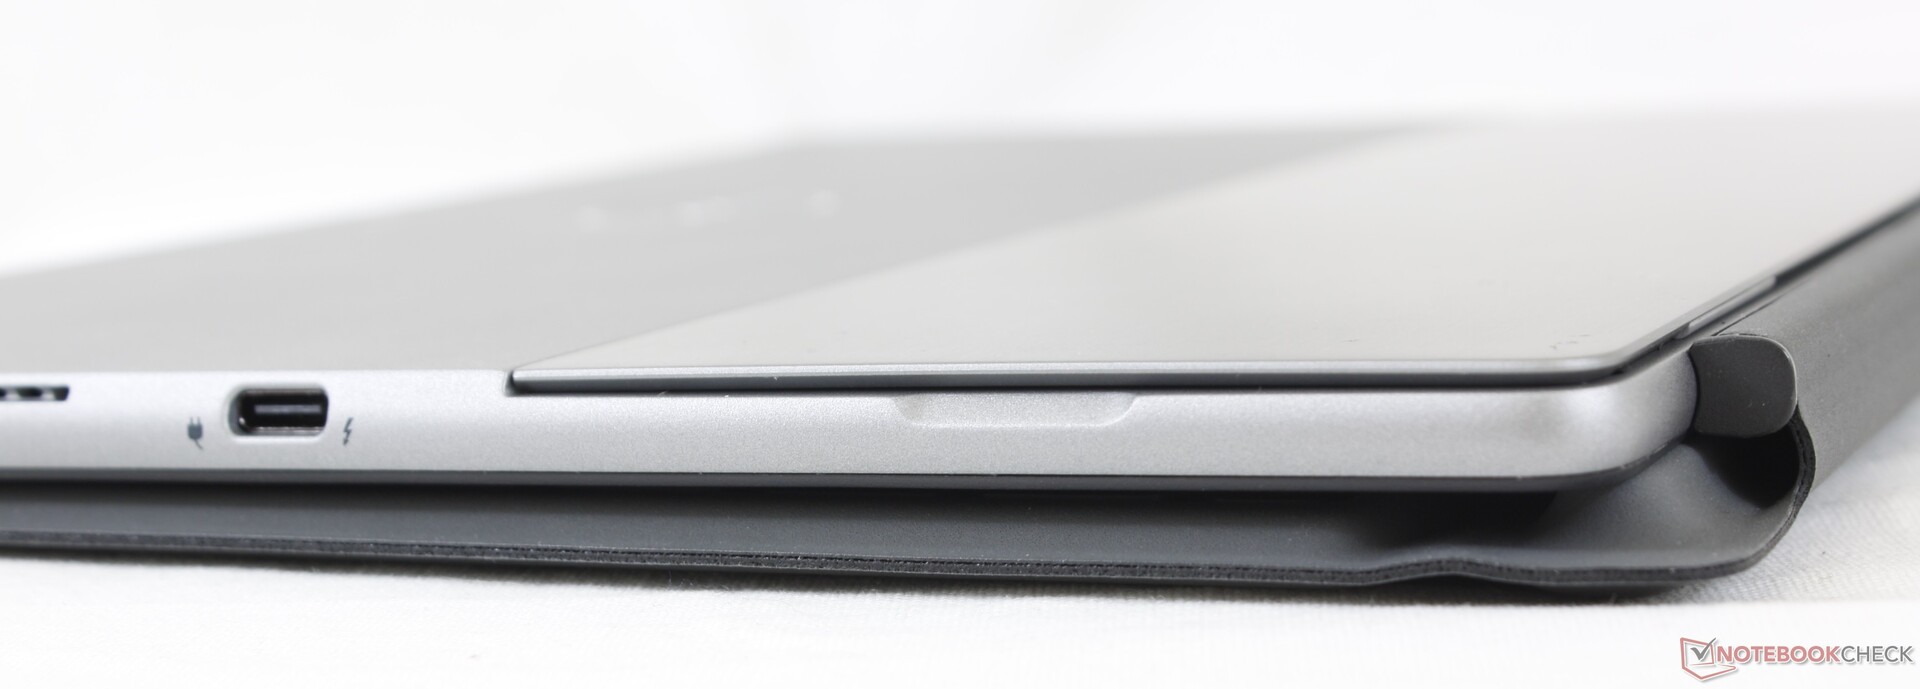
Le porte includono due USB-C ciascuna con ricarica e supporto Thunderbolt 4 e un jack audio da 3,5 mm. Gli extra come il lettore di SmartCard e il vassoio uSIM sono opzionali. Dongle e docking station basate su Thunderbolt sono altamente raccomandati per sfruttare appieno la versatilità delle due porte USB-C.
Non c'è una porta USB-A o un lettore di schede SD.
Comunicazioni
L'Intel AX201 è dotato di serie di connettività Wi-Fi 6 e Bluetooth 5.1. Per i viaggiatori, 4G LTE con supporto eSIM è disponibile se configurato con lo Snapdragon X20 opzionale.
Webcam
Le fotocamere anteriore da 5 MP e posteriore da 8 MP sono di qualità molto più alta rispetto alla tipica webcam dei portatili. La registrazione video, tuttavia, è limitata a soli 1080p a 30 FPS su entrambe le fotocamere, senza alcuna opzione a 60 FPS.


Sicurezza
La maggior parte delle caratteristiche di Latitude come vPro, lettore di impronte digitali, IR, e un sensore di prossimità per addormentare e svegliare automaticamente il dispositivo sono disponibili. L'otturatore della webcam è vistosamente assente, mentre è diventato uno standard sulla maggior parte dei portatili più recenti.
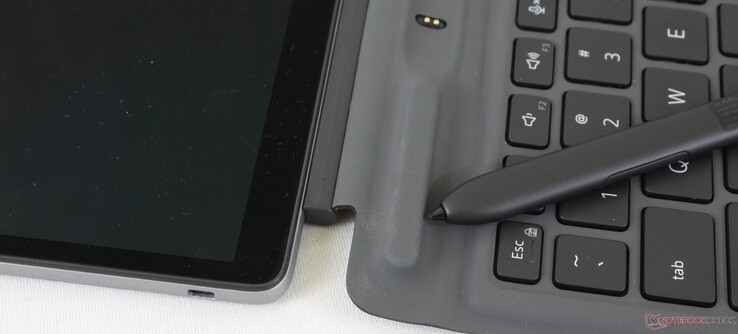
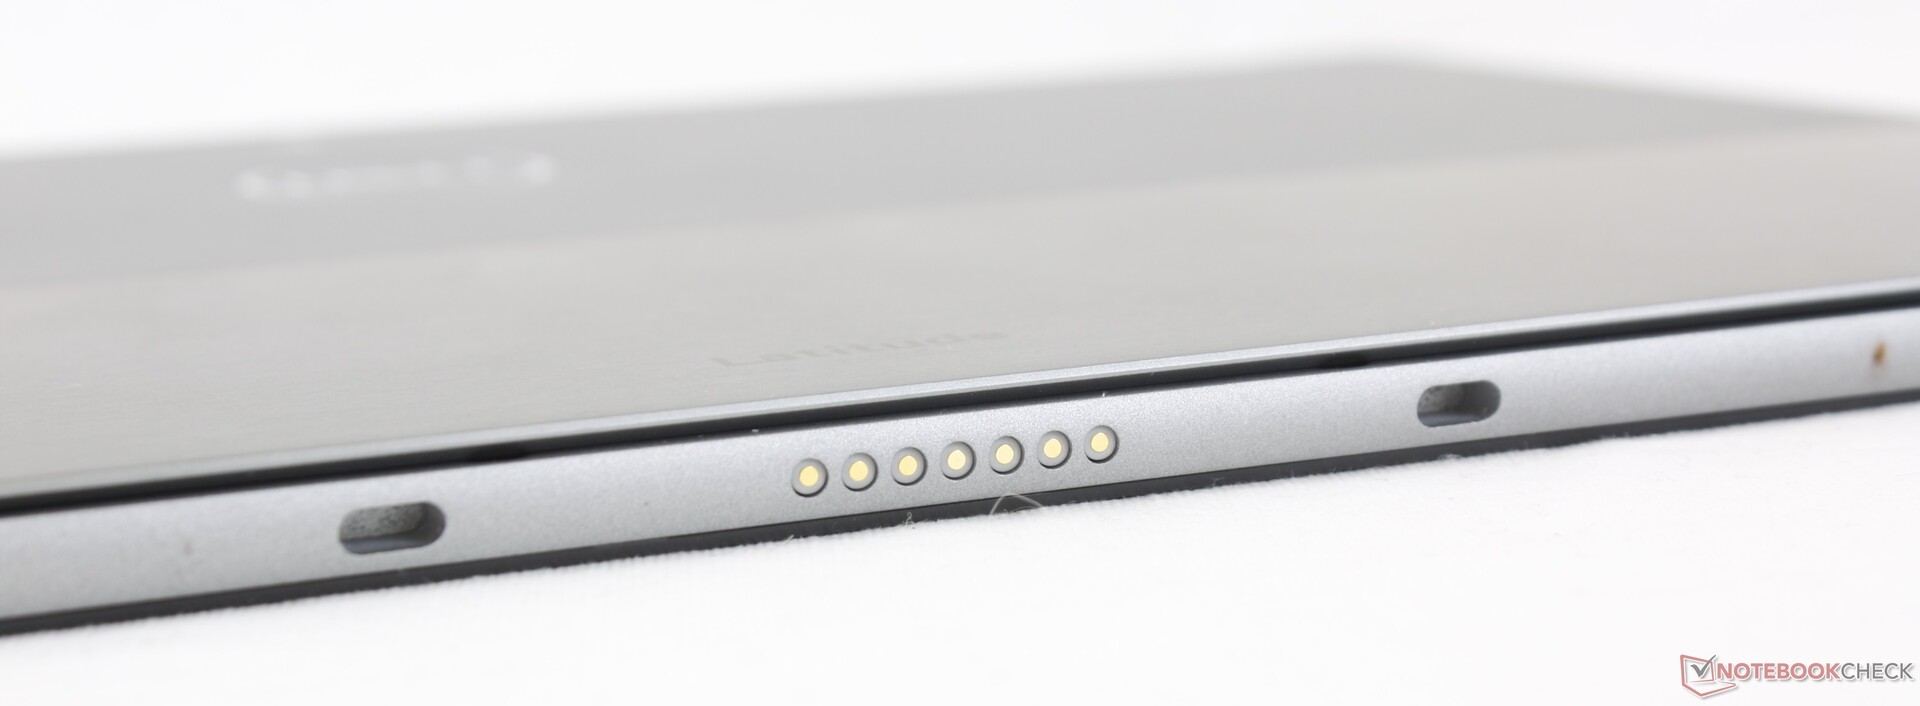
Accessori e garanzia
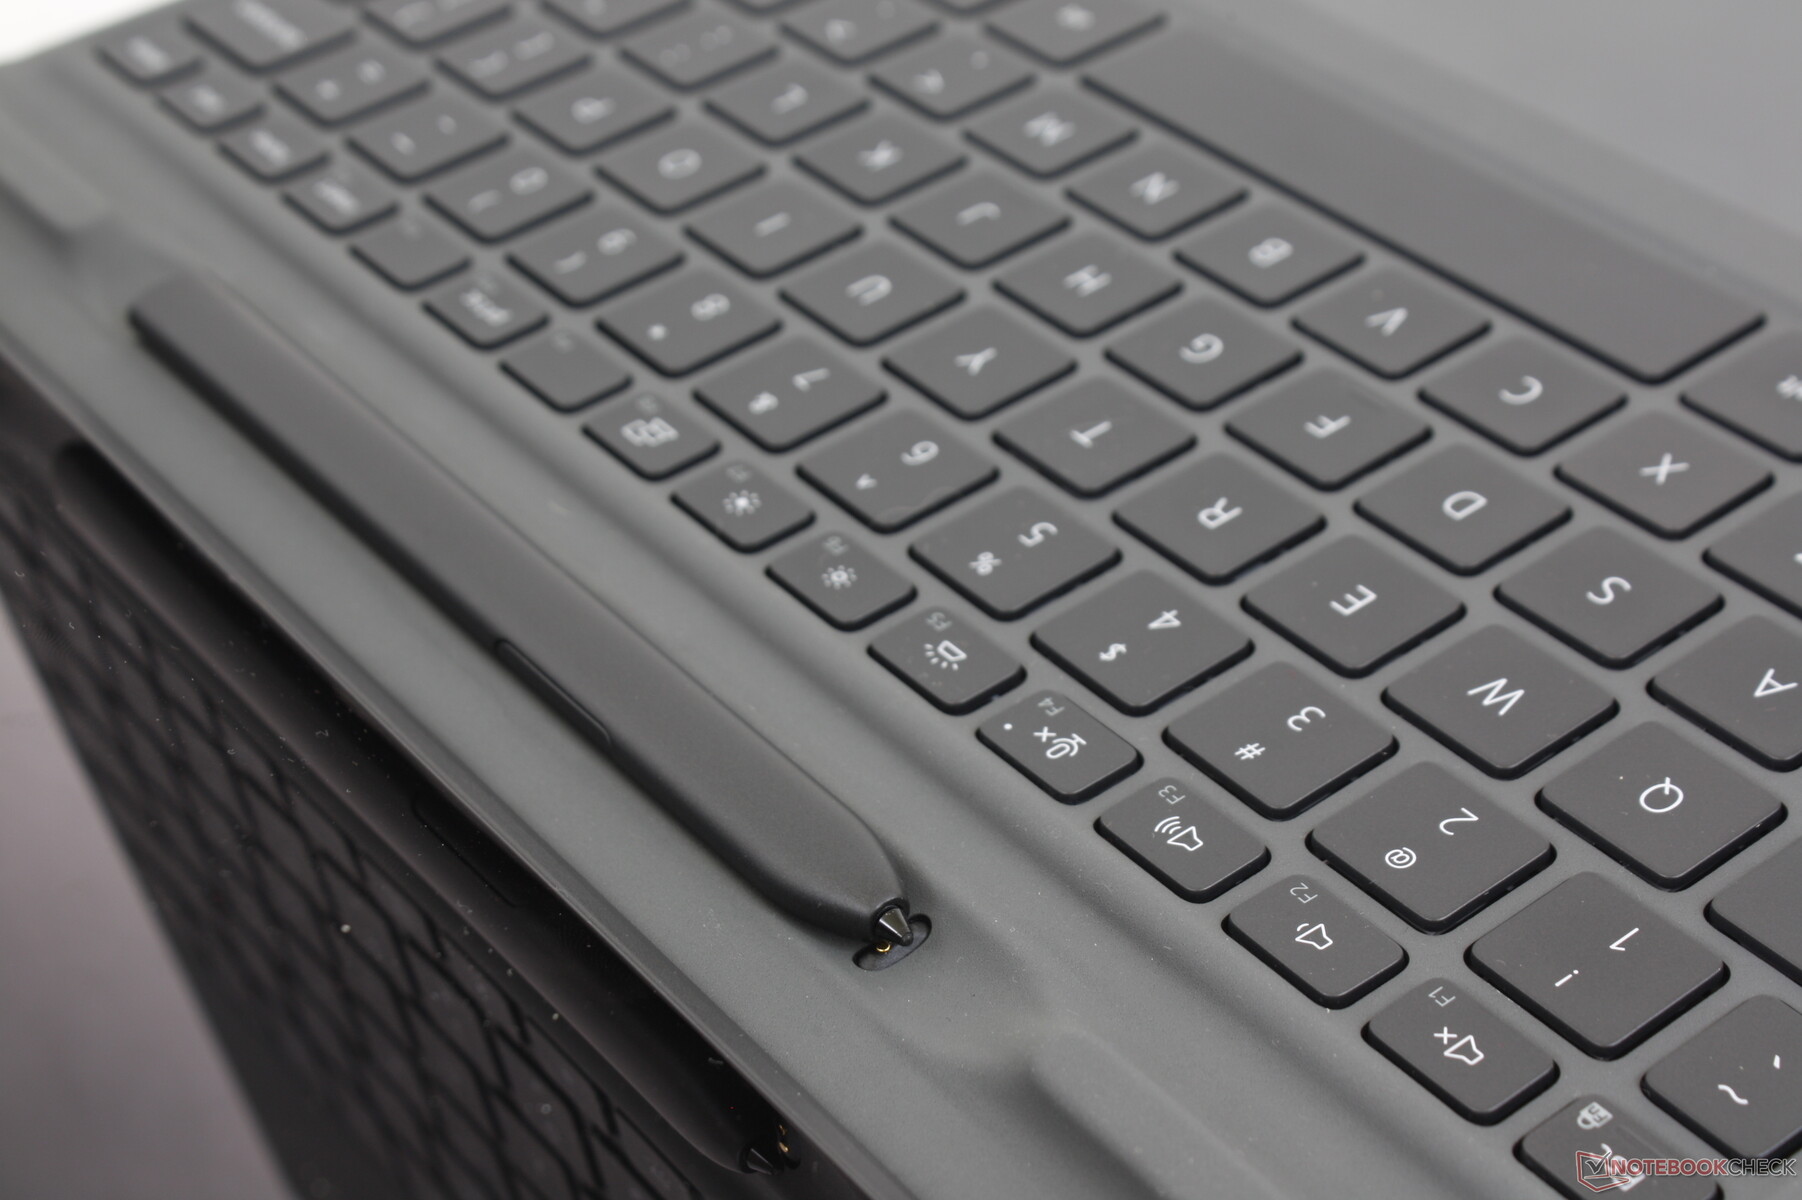
La confezione standard al dettaglio non include la tastiera folio sganciabile M20NCC o la penna attiva PN7320A che costano rispettivamente 200$ e 70$ in più. In confronto, il Lenovo ThinkPad X12 ha l'attacco della tastiera e la penna inclusi di default. Sarebbe stato bello vedere un adattatore da USB-C a USB-A o un panno per la pulizia con la confezione.
Una garanzia di base di tre anni è standard, proprio come su altri sistemi della serie Latitude 7000.
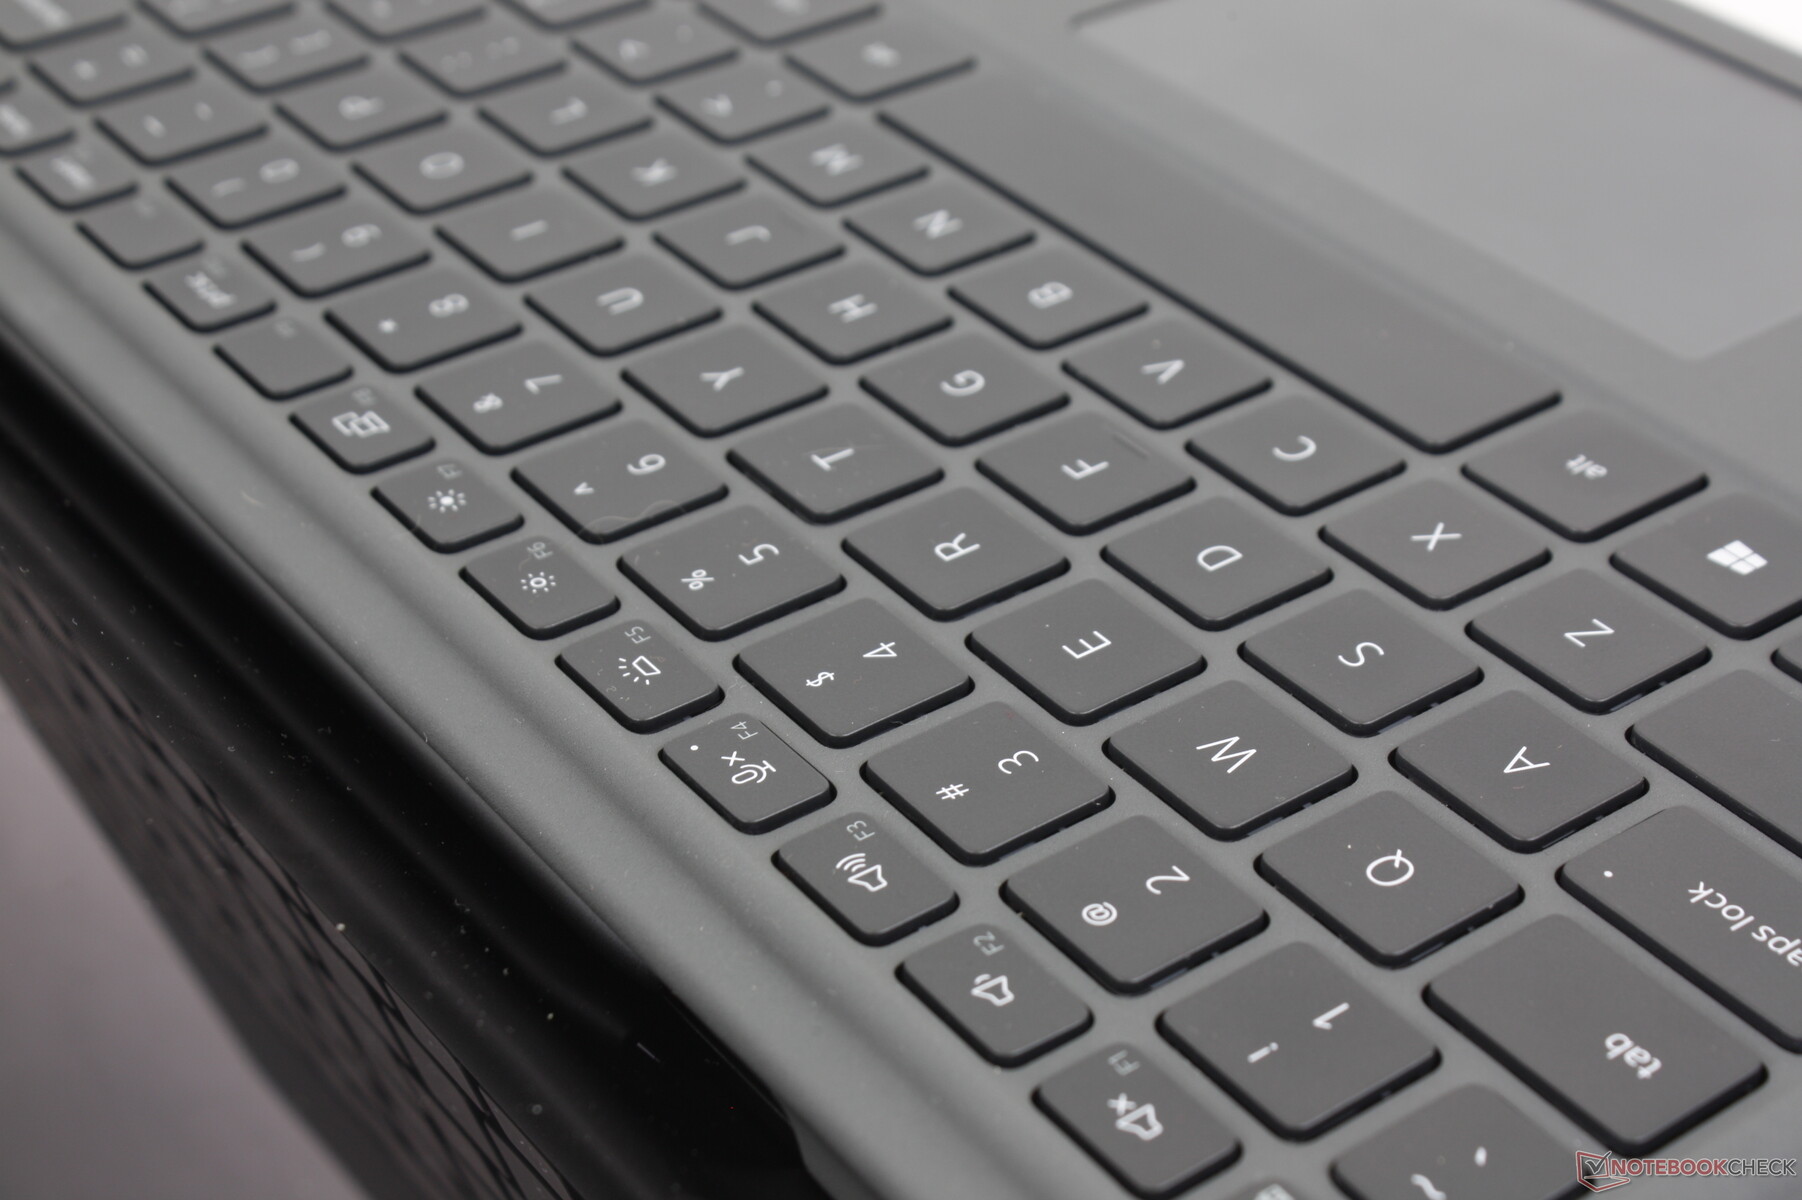
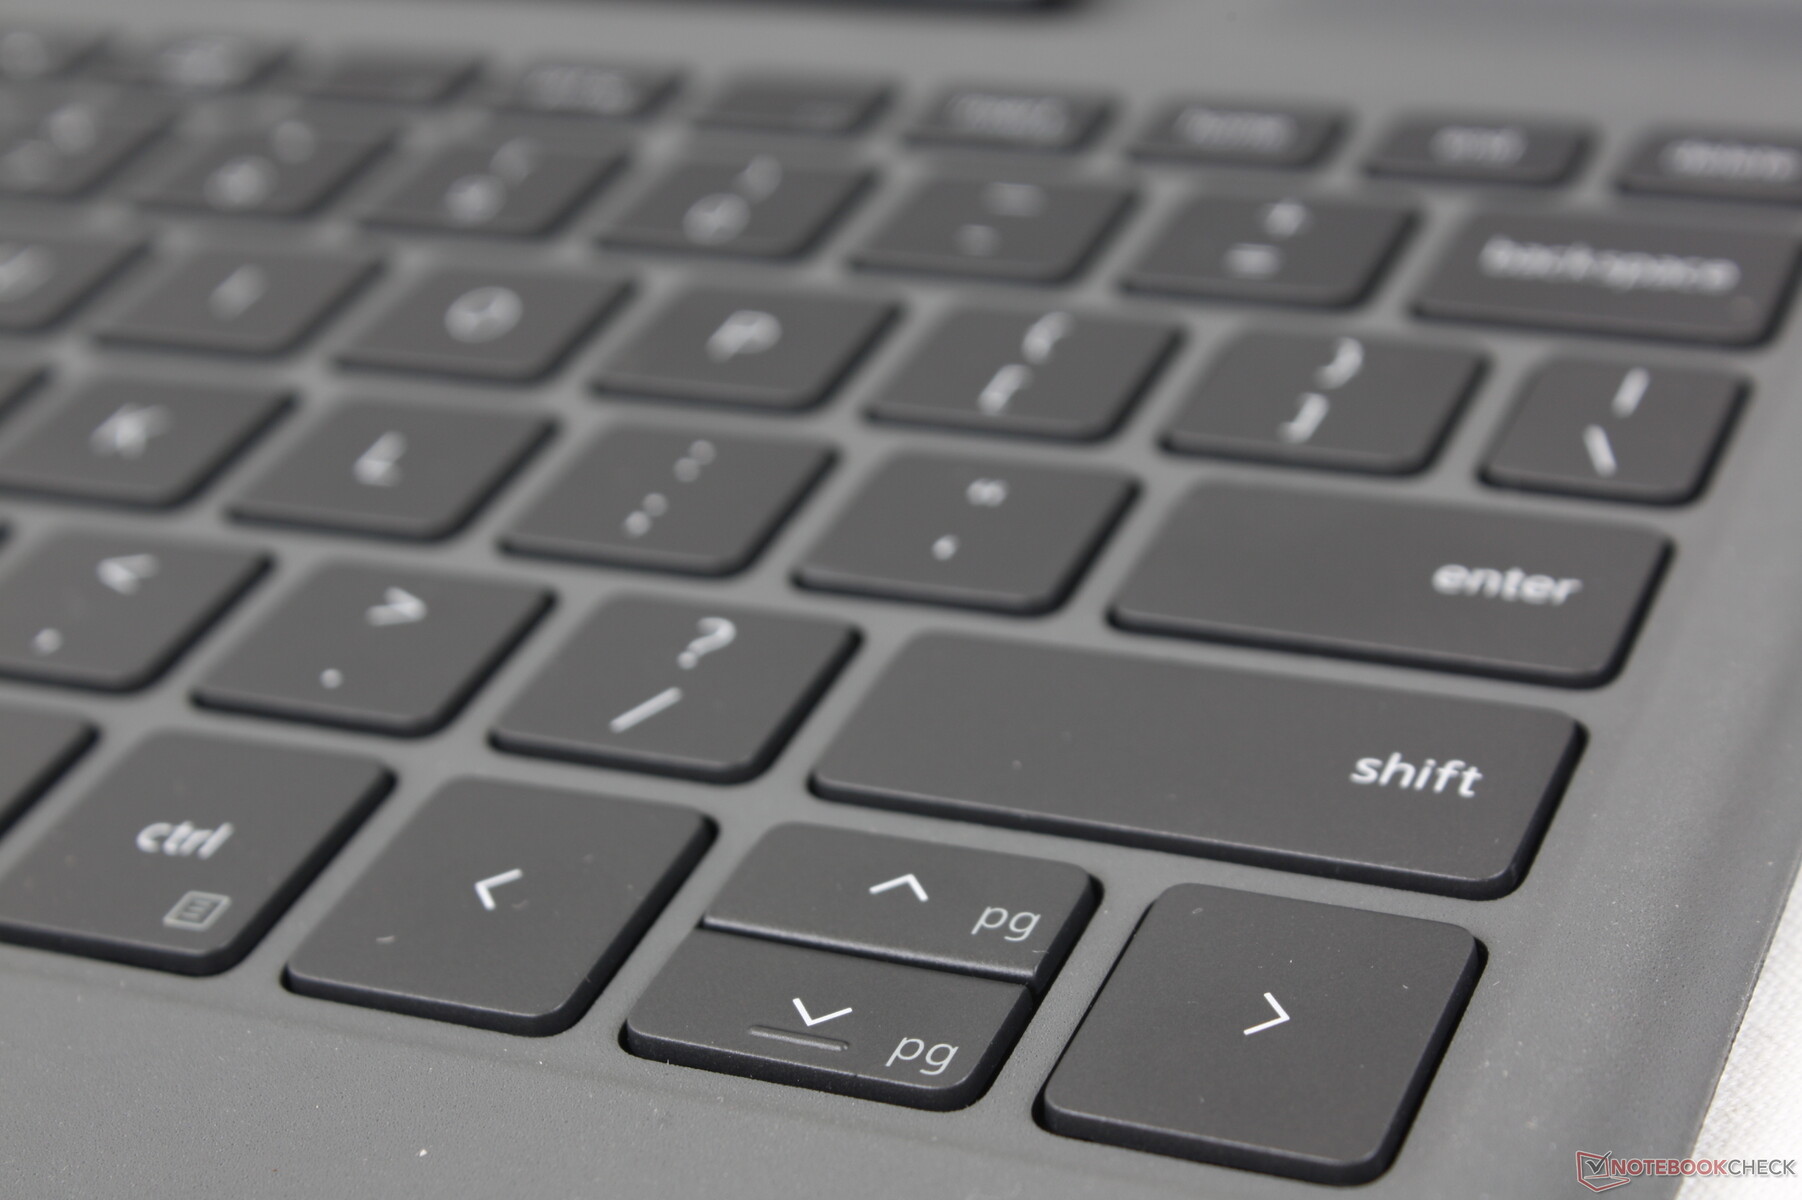
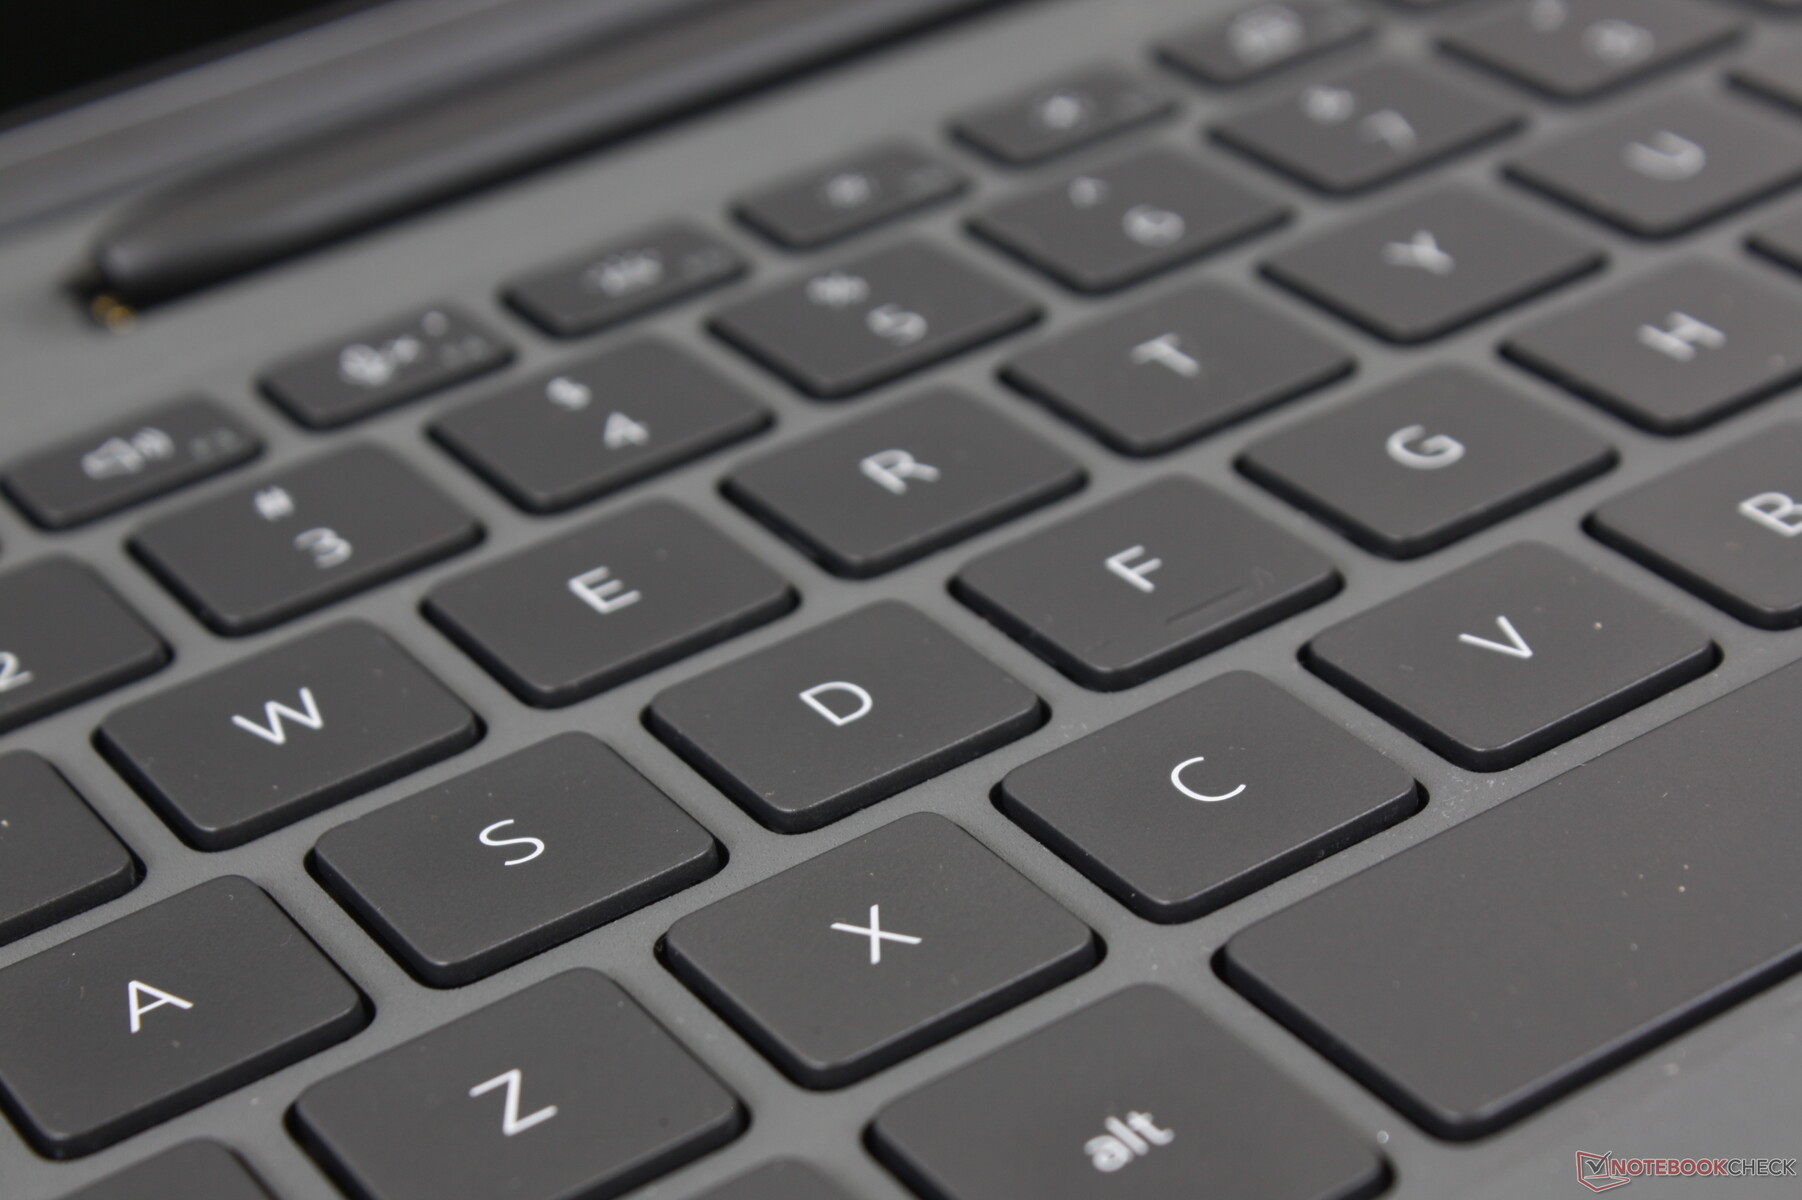
Dispositivi di input - Non sono buoni come un computer portatile
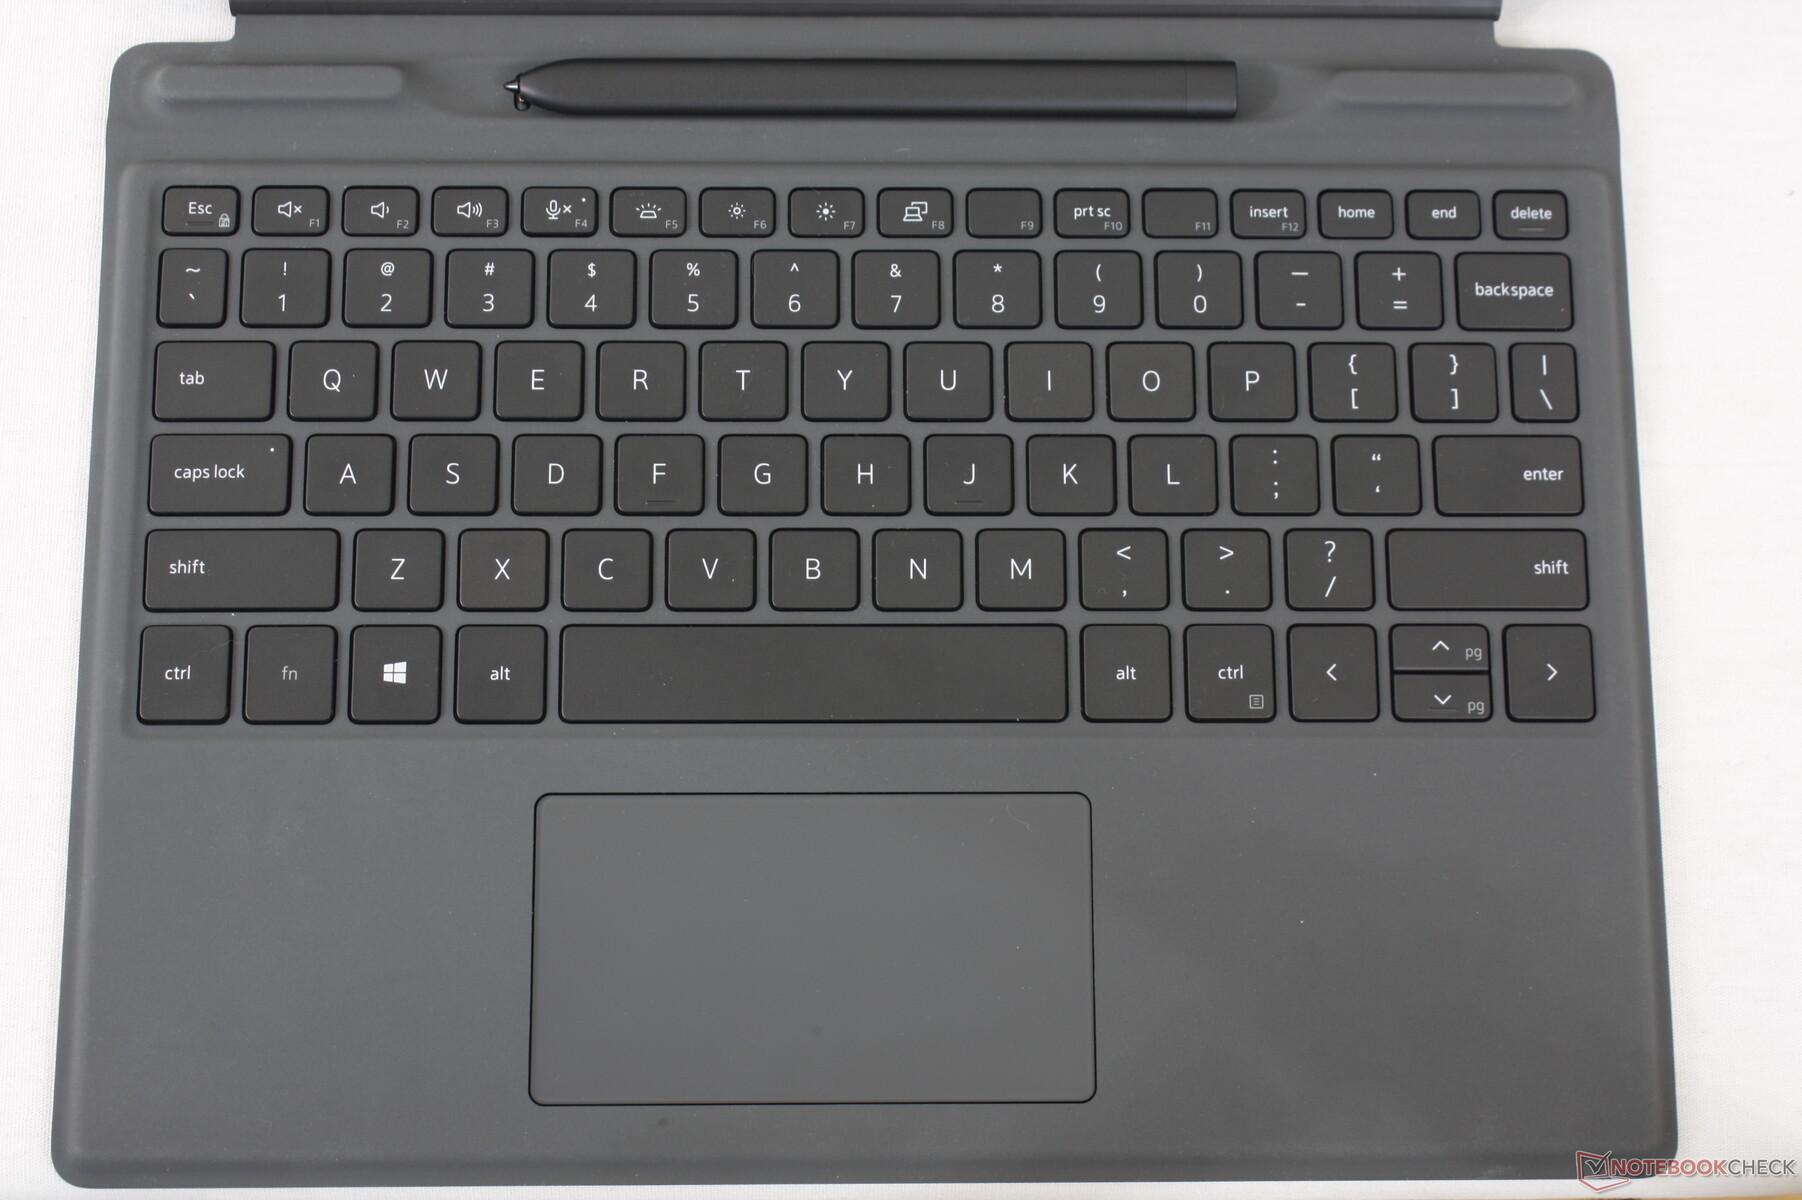
Tastiera
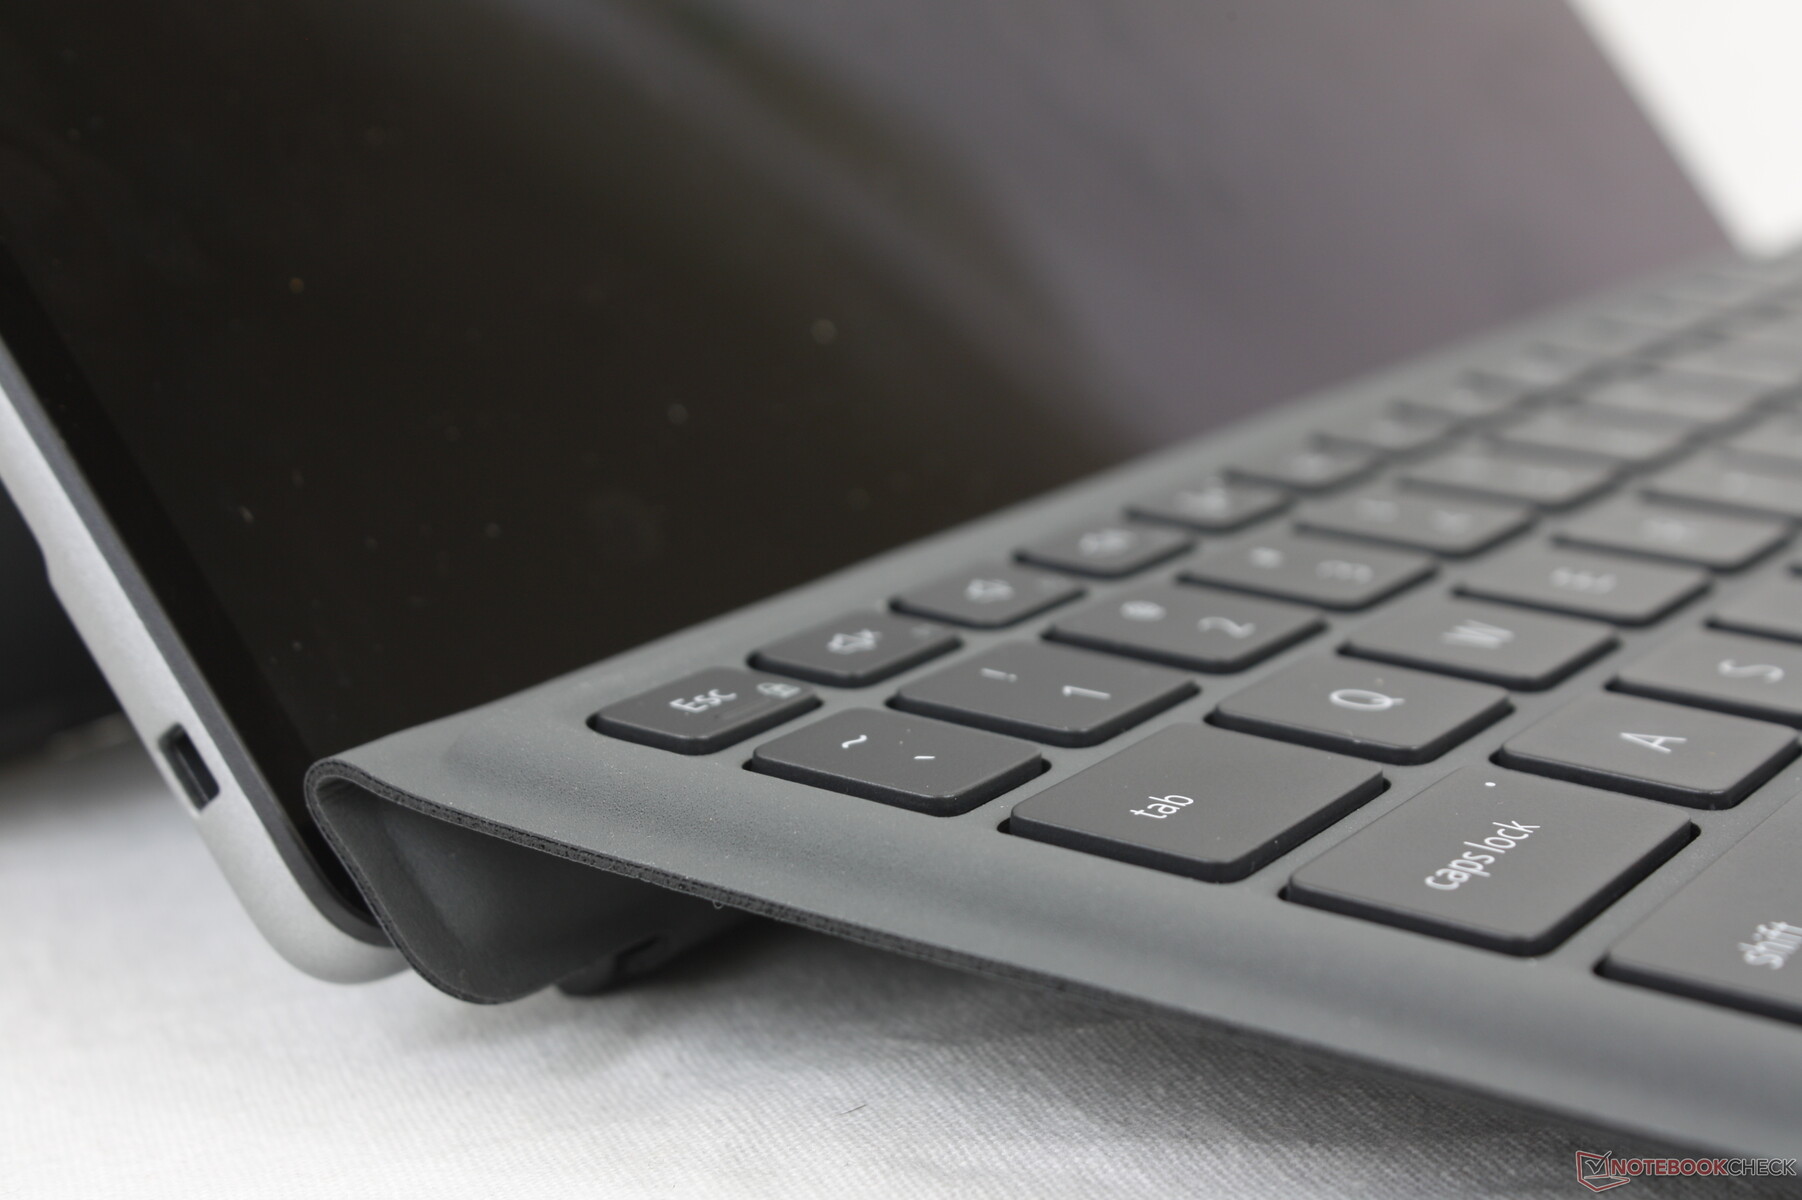
L'esperienza di digitazione sui tablet con tastiere sganciabili è sempre stata sotto la media. La tastiera è di solito sottile e più suscettibile alla flessione di una tastiera standard di un computer portatile, il che fa sì che il feedback dei tasti e la corsa siano più morbidi e meno profondi, rispettivamente. La tastiera sganciabile Latitude 7320 non fa nulla per risolvere questi inconvenienti e quindi non si sembra molto meglio o peggio rispettoad una tastiera folio del Surface Pro. Va bene per la messaggistica e le e-mail, ma vi trovereste meglio con una Latitude 7320 clamshell o convertibile per sessioni di digitazione più lunghe.
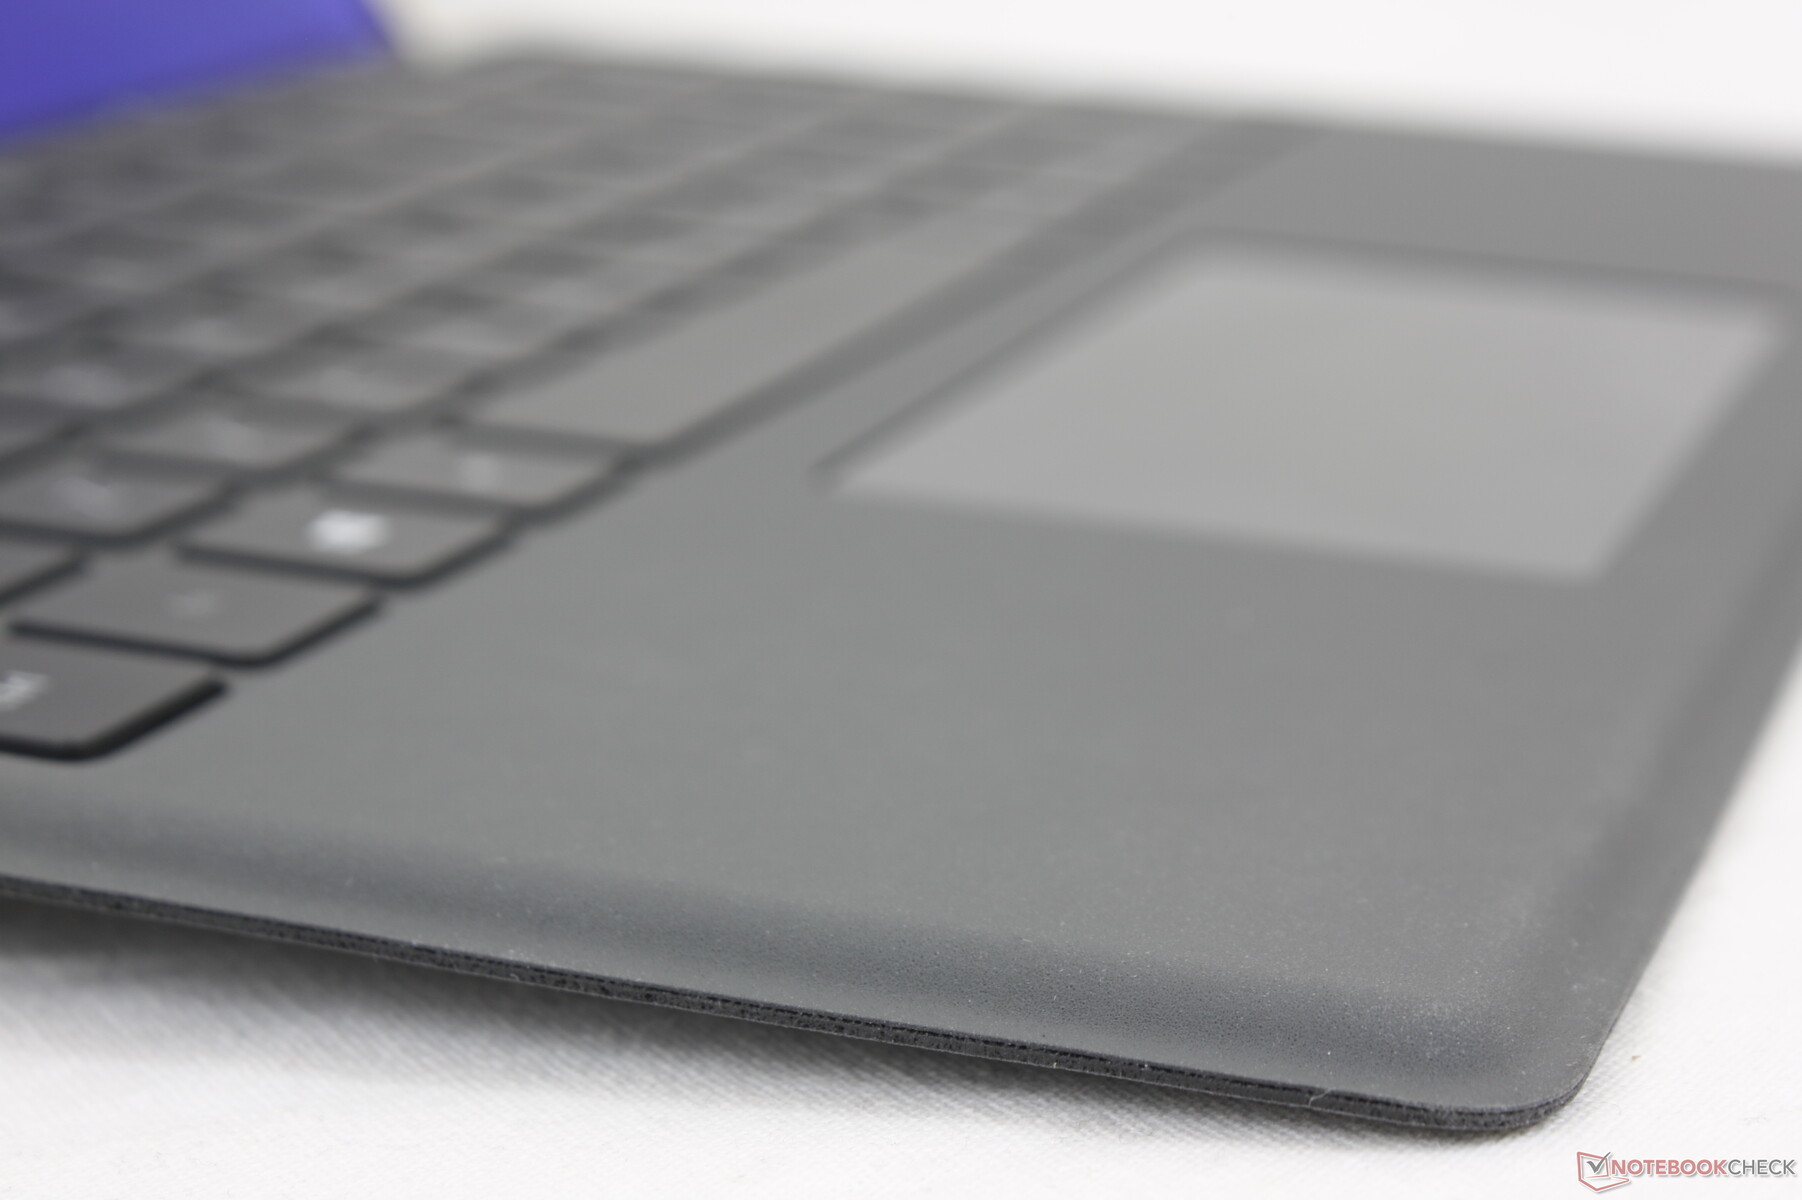
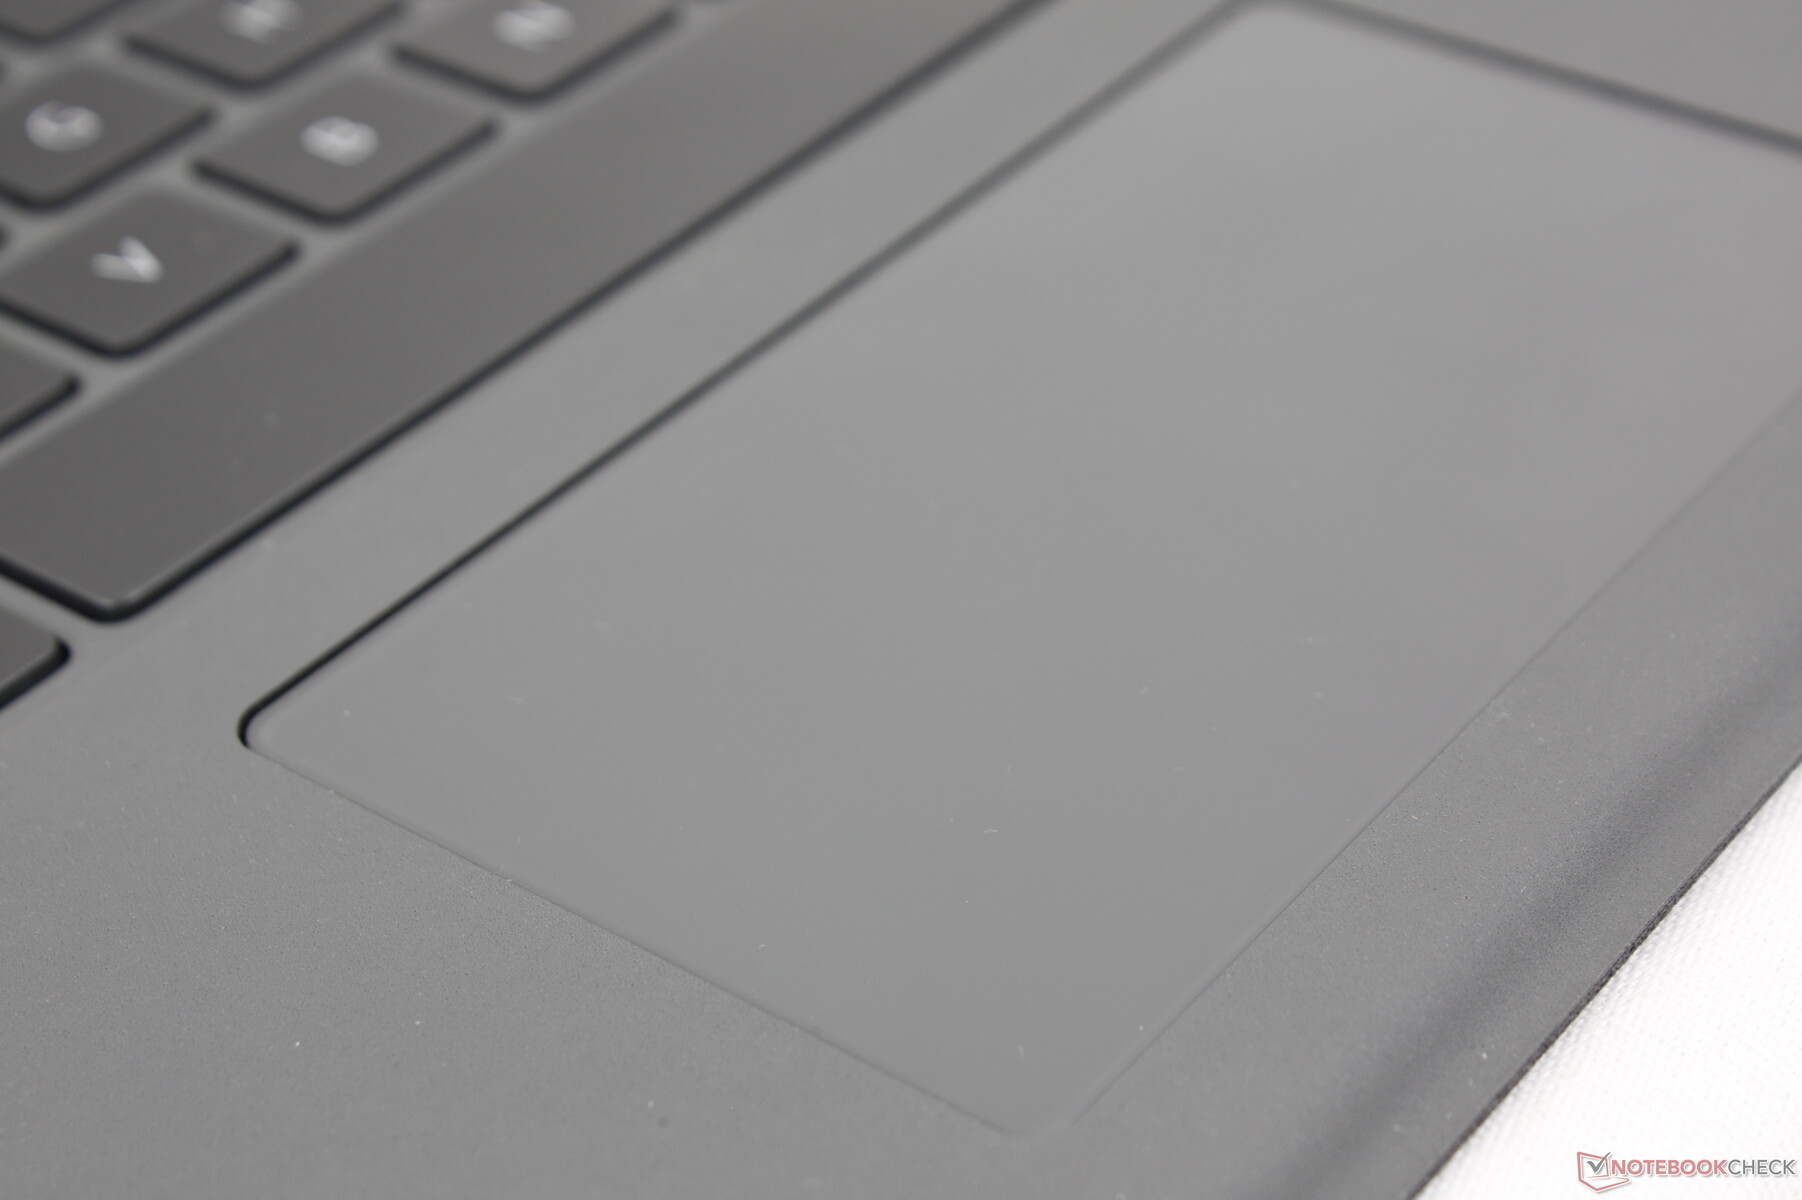
Touchpad
Il clickpad di Precision è relativamente piccolo rispetto al più grande clickpad dell'XPS 13 (10 x 5,5 cm contro 11,2 x 6,5 cm). La sua superficie è completamente liscia tranne che per un po' di attrito quando si scivola a velocità molto basse per un controllo più accurato. I movimenti di base del cursore e gli input multi-touch sono per il resto affidabili.
Cliccare sulla superficie restituisce un click poco profondo e un po' spugnoso. Il rumore è basso, ma avremmo preferito che il feedback fosse più solido.
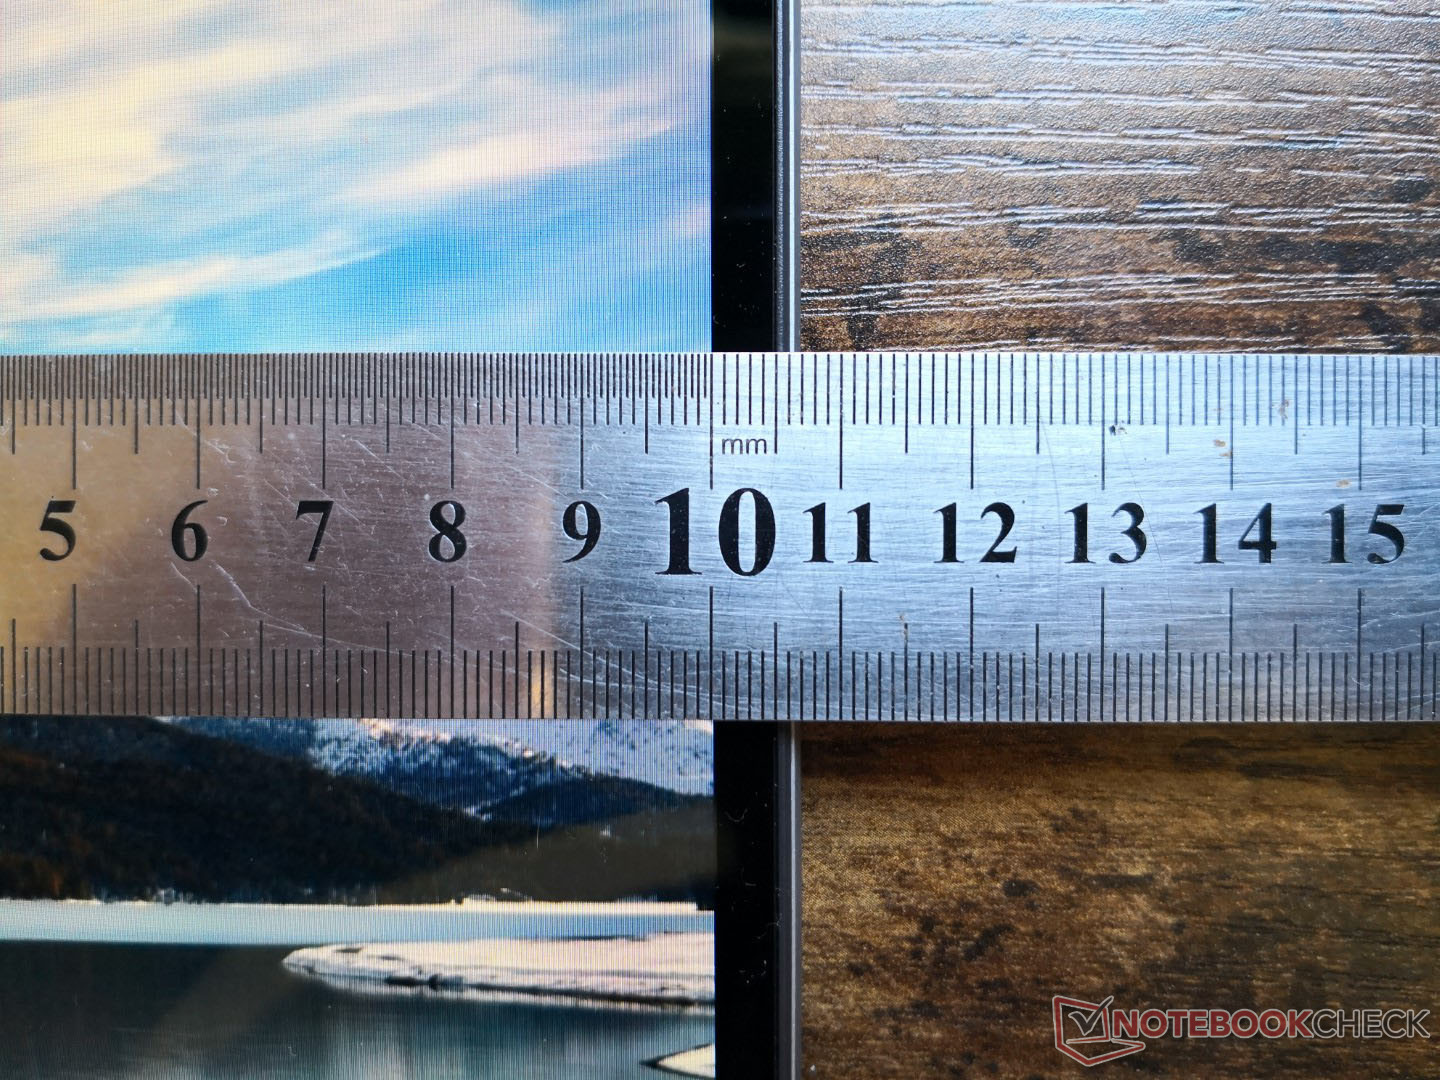
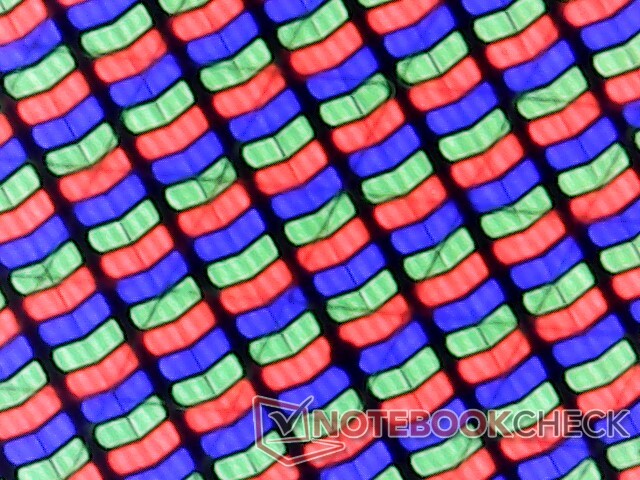
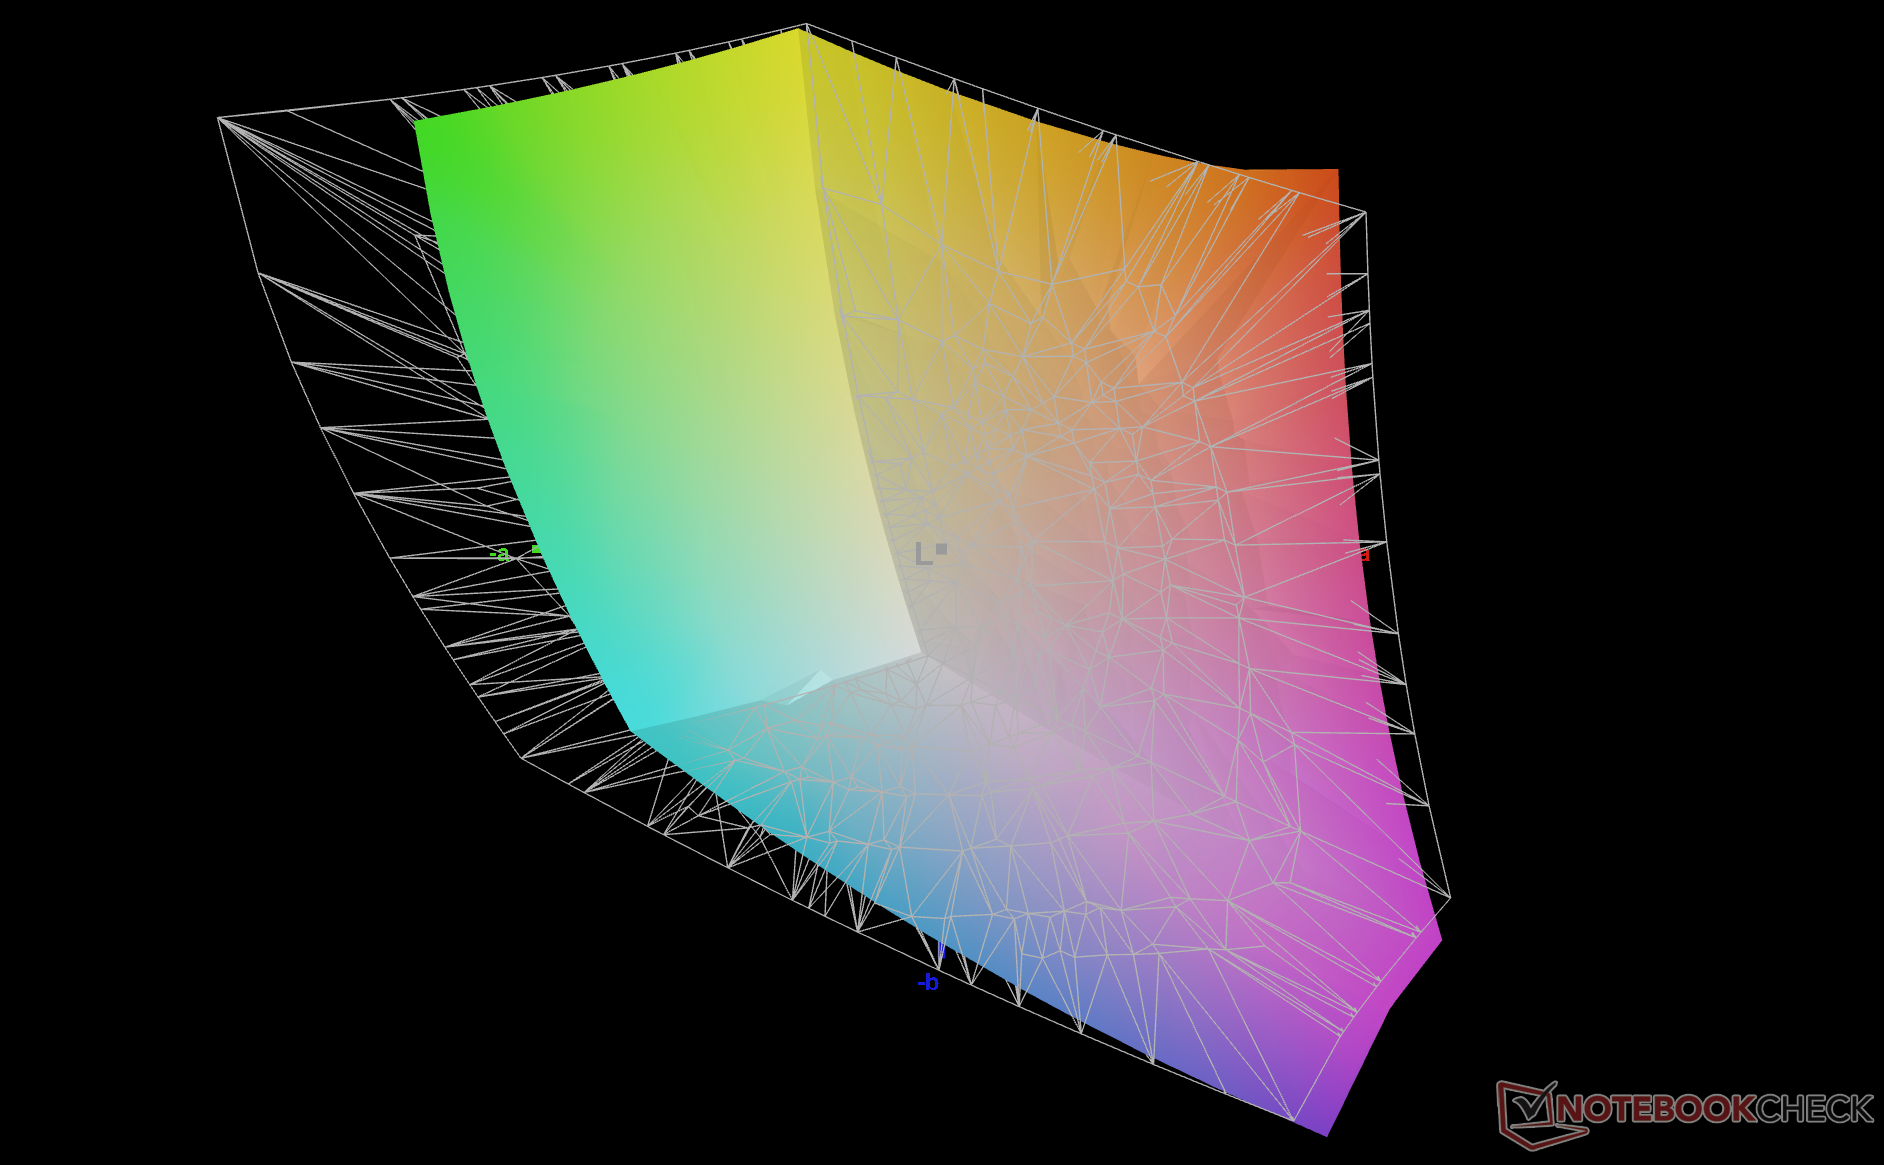
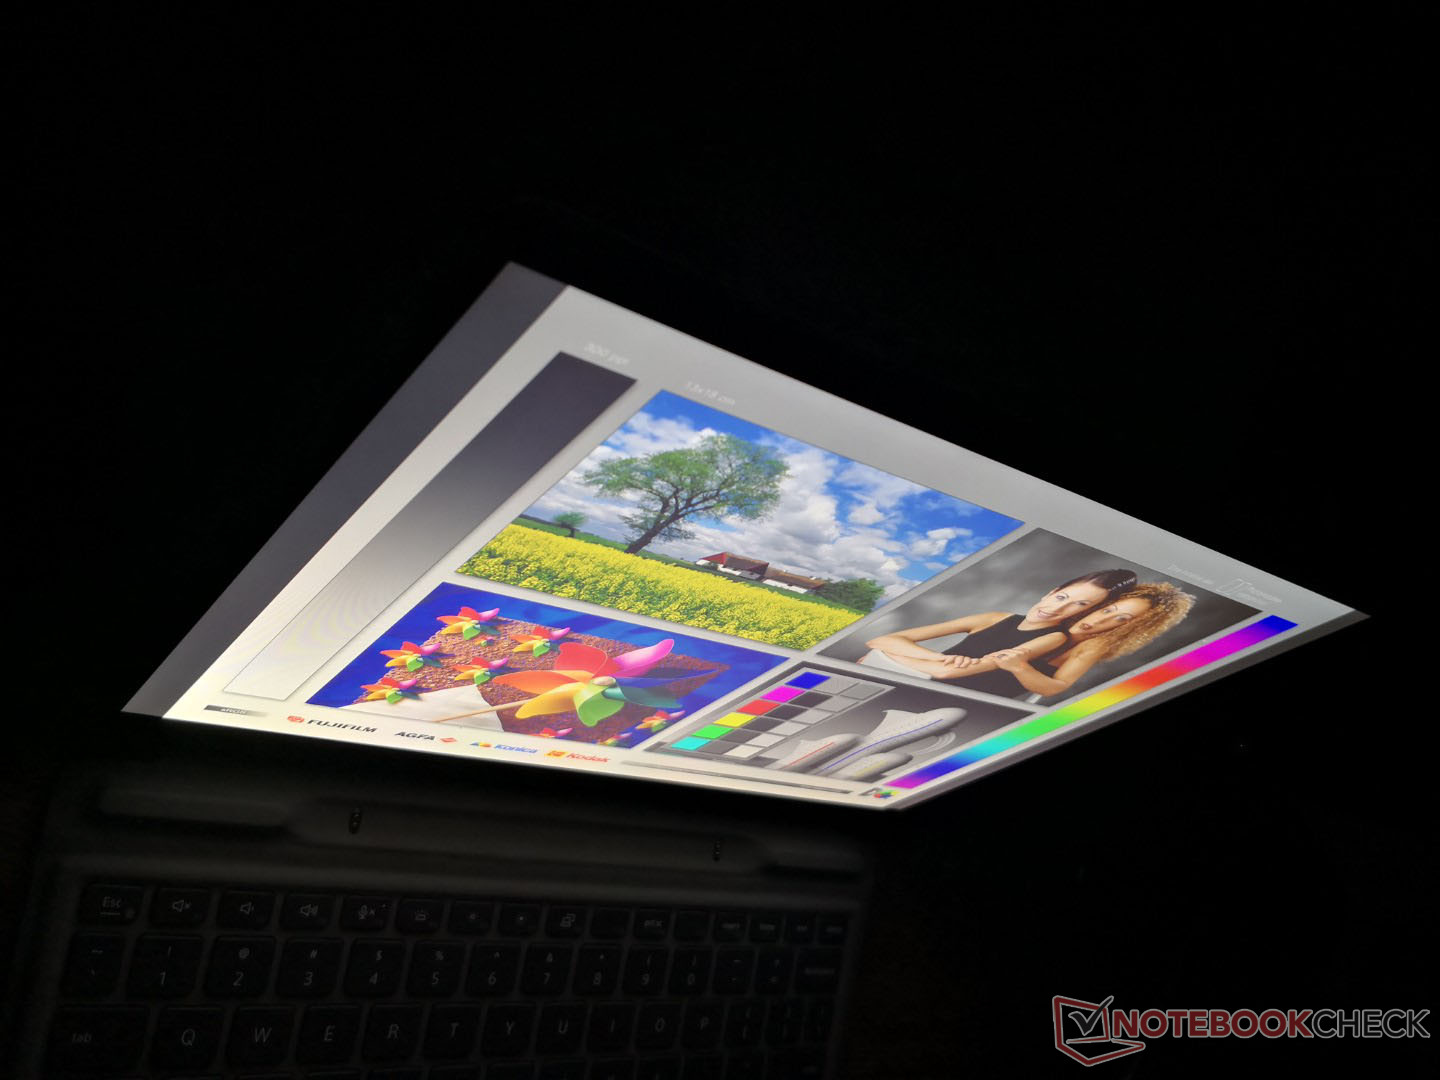
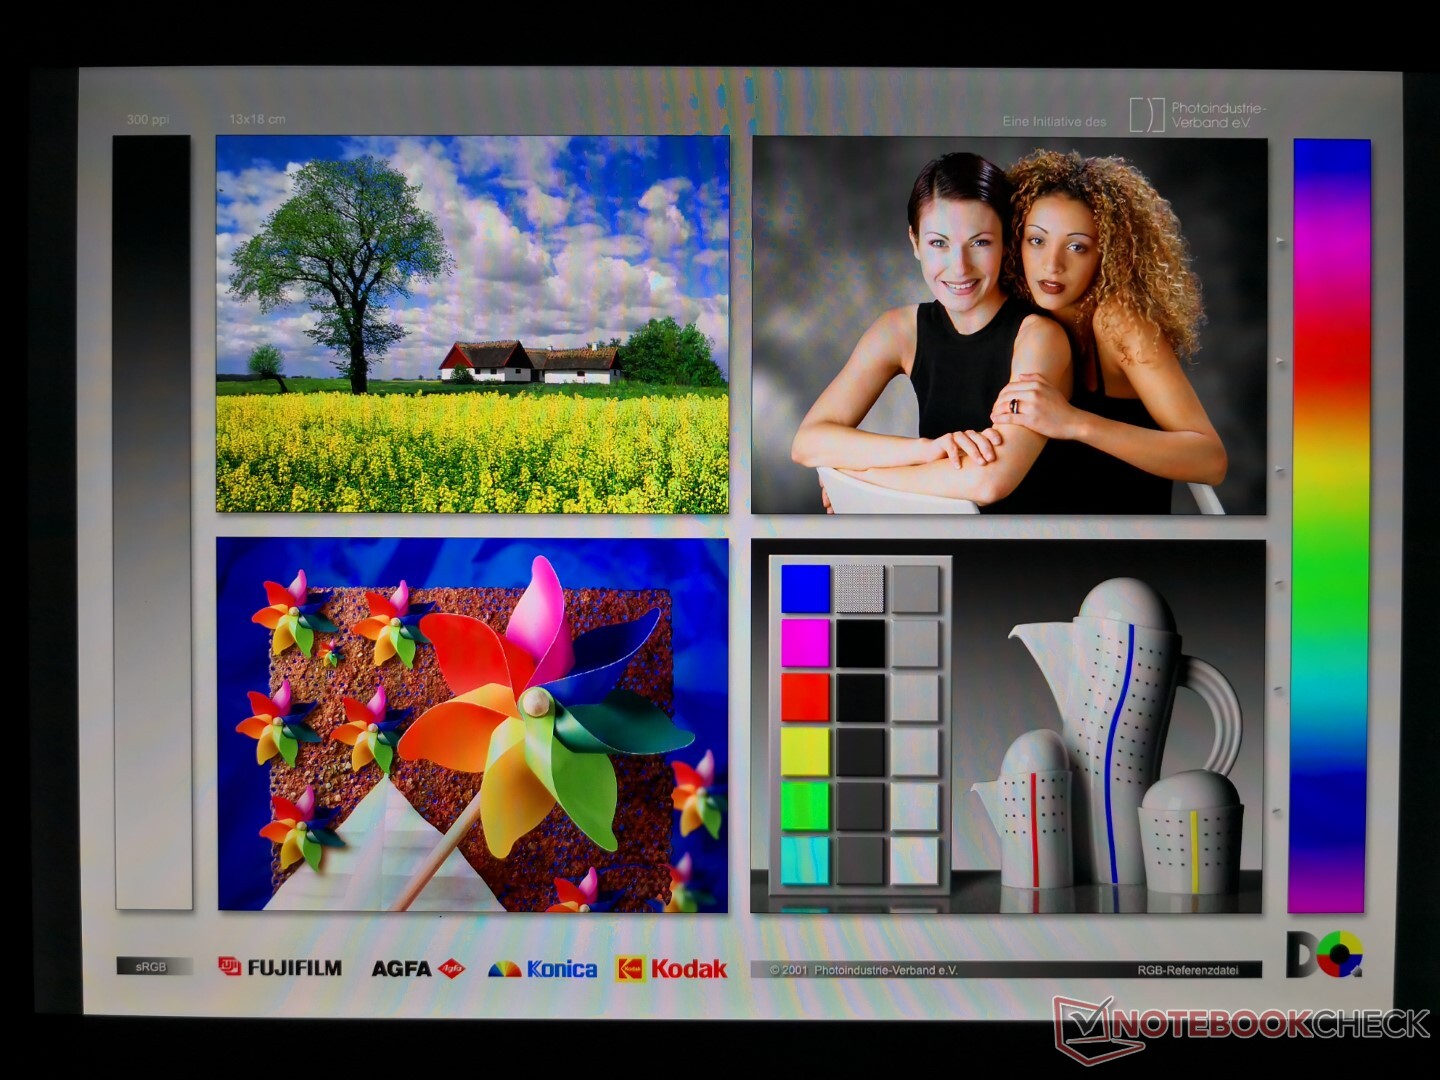
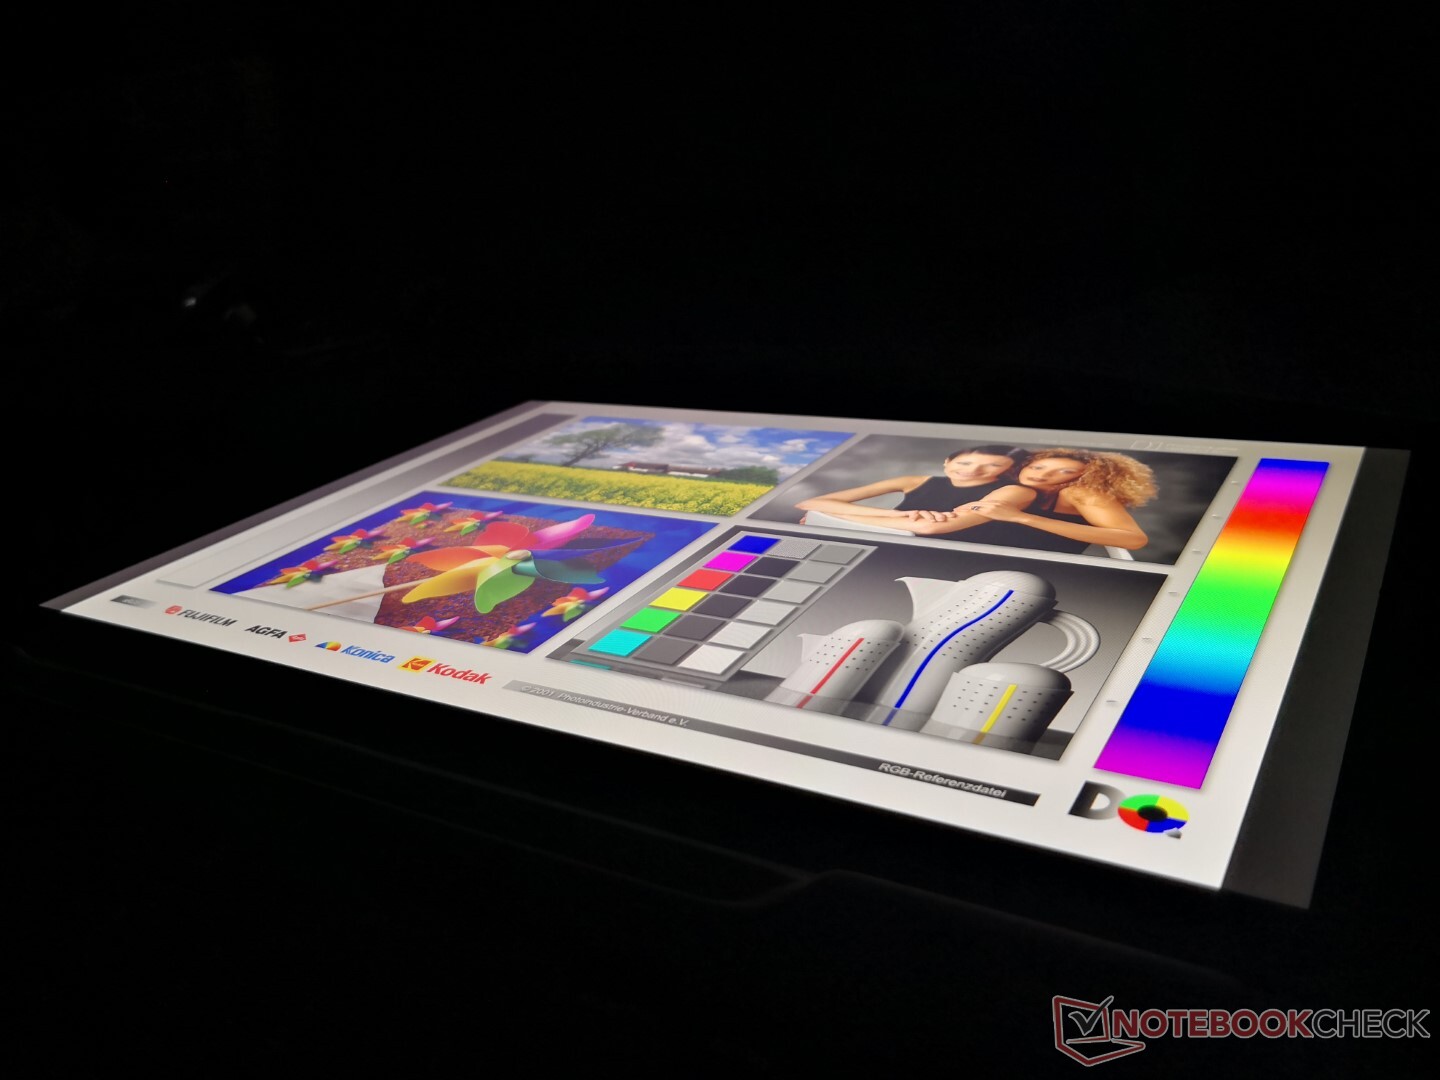
Display - Grande e luminoso
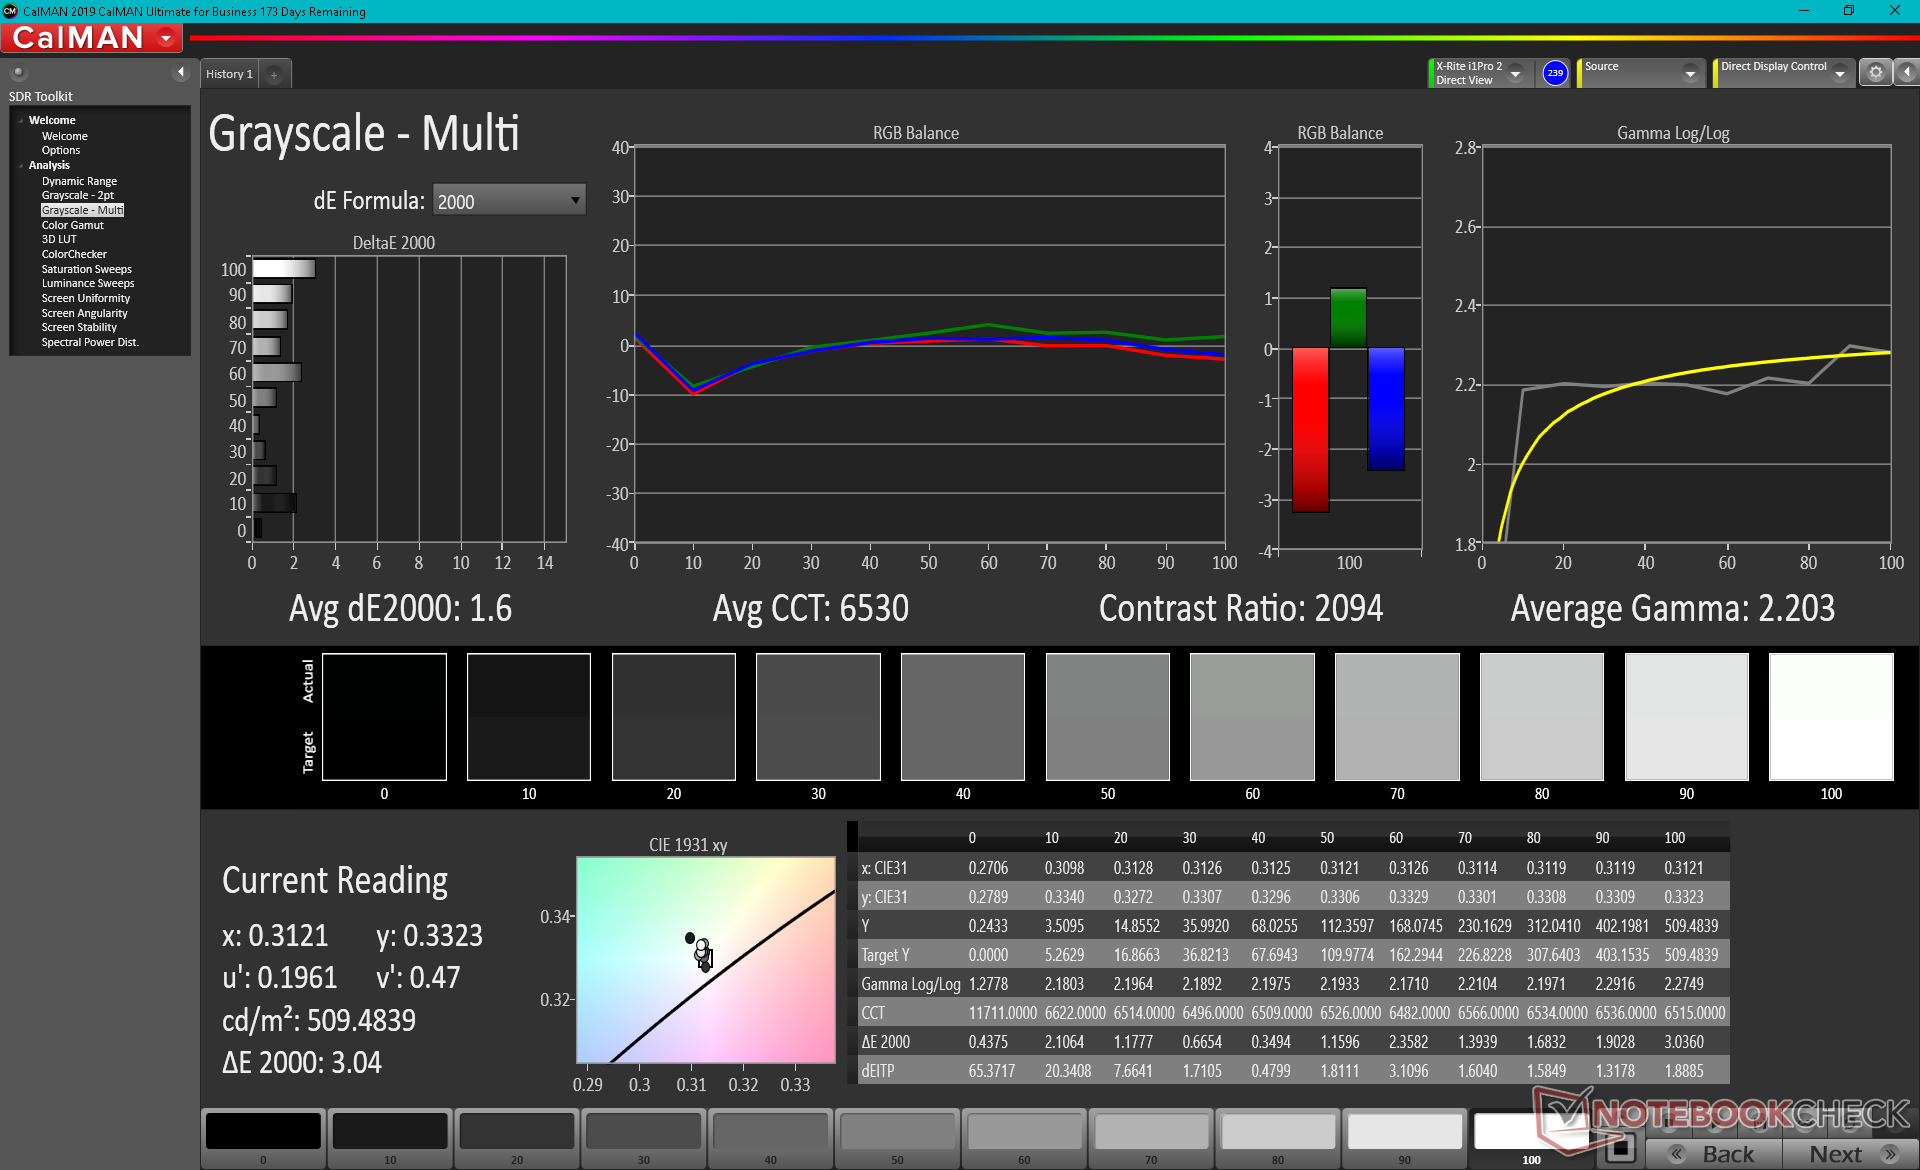
Il pannello 3:2 Sharp LQ130N1 IPS è il primo ad apparire nel nostro database. I suoi attributi sono molto simili al pannello 16:10 Sharp LQ134N1 dell'XPS 13 7390 2-in-1 inclusa la copertura completa sRGB, la retroilluminazione brillante da 500+ nit, e l'alto rapporto di contrasto ~1500:1. I tempi di risposta bianco-nero e grigio-grigio rimangono lenti e quindi il ghosting è evidente. Fortunatamente, questo generalmente non è un problema per la navigazione e la riproduzione di video.
Il ComfortView Plus è incluso per ridurre le emissioni di luce blu e l'affaticamento degli occhi, come gli ultimi portatili XPS. La caratteristica funziona senza impattare sui colori.
| |||||||||||||||||||||||||
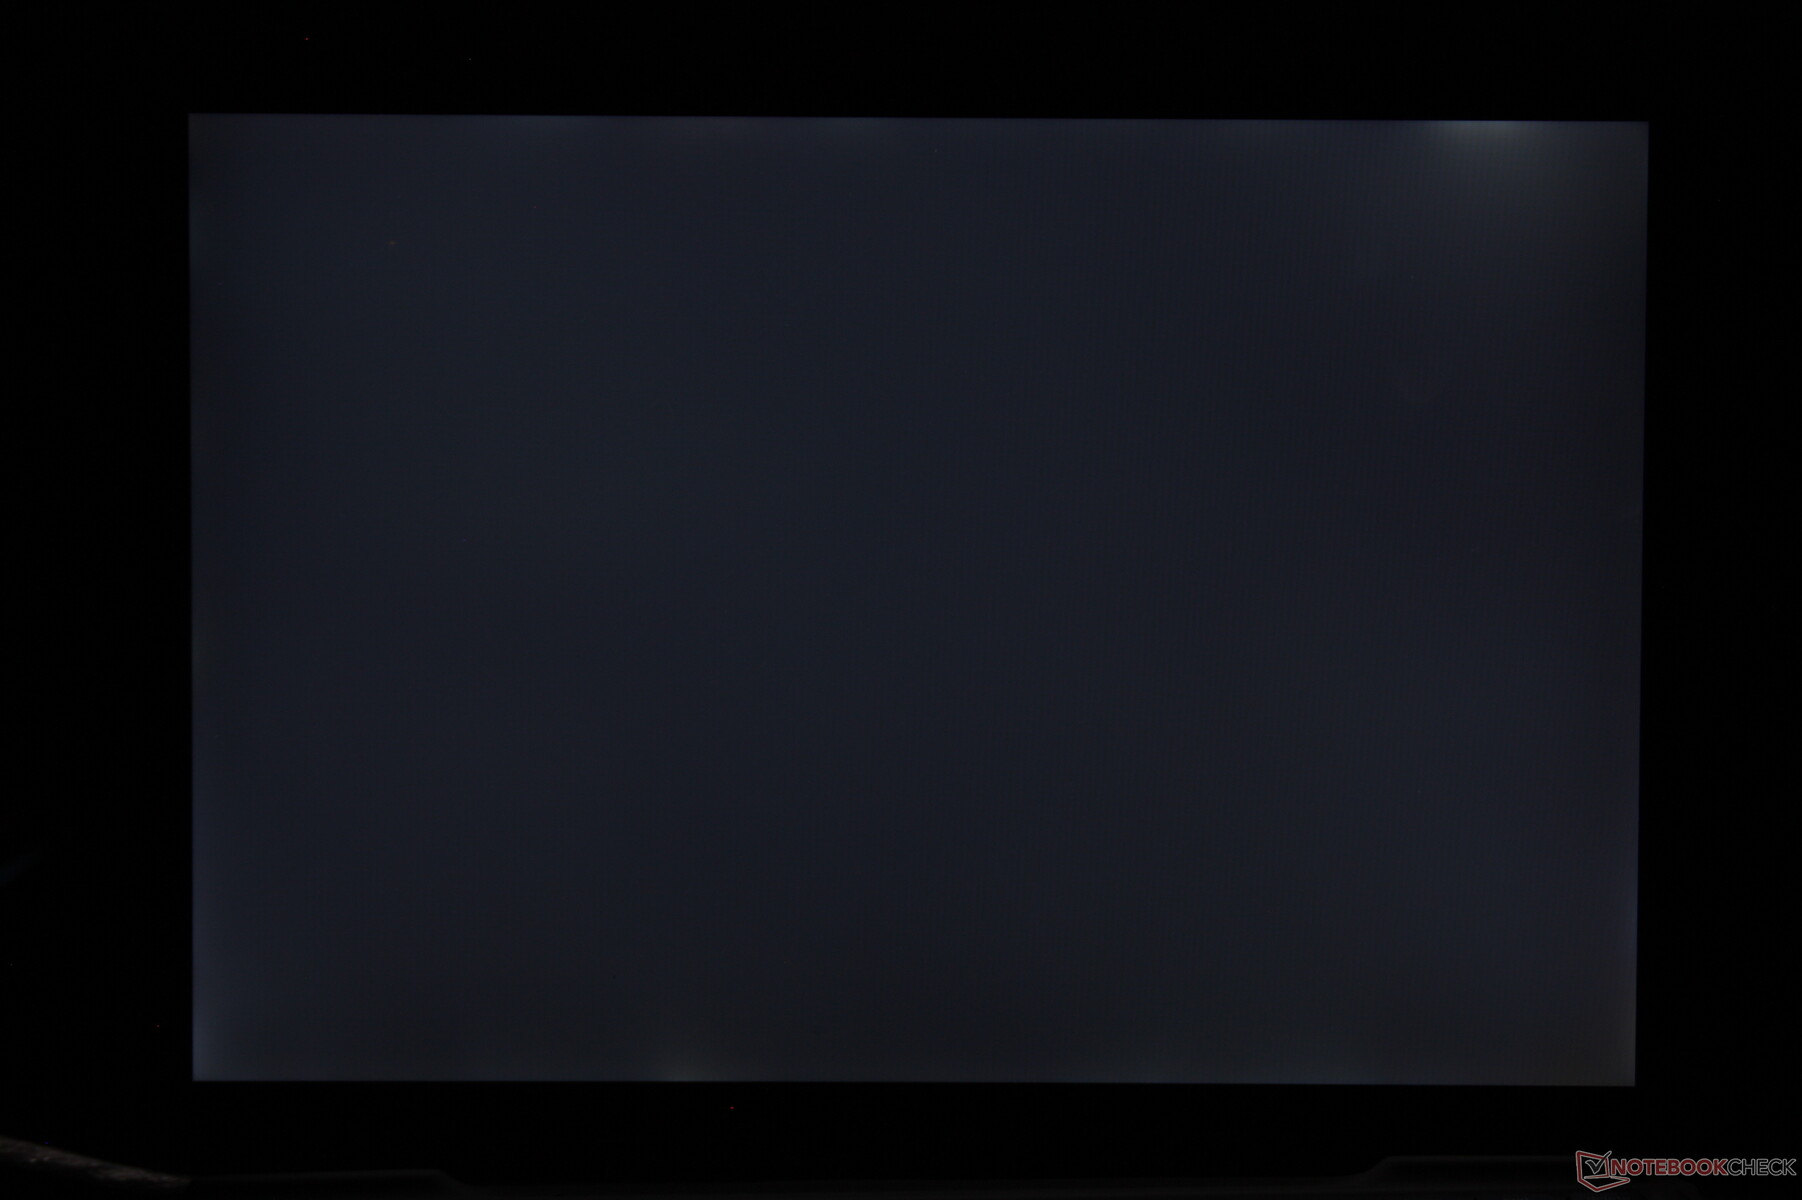
Distribuzione della luminosità: 93 %
Al centro con la batteria: 521.8 cd/m²
Contrasto: 1491:1 (Nero: 0.35 cd/m²)
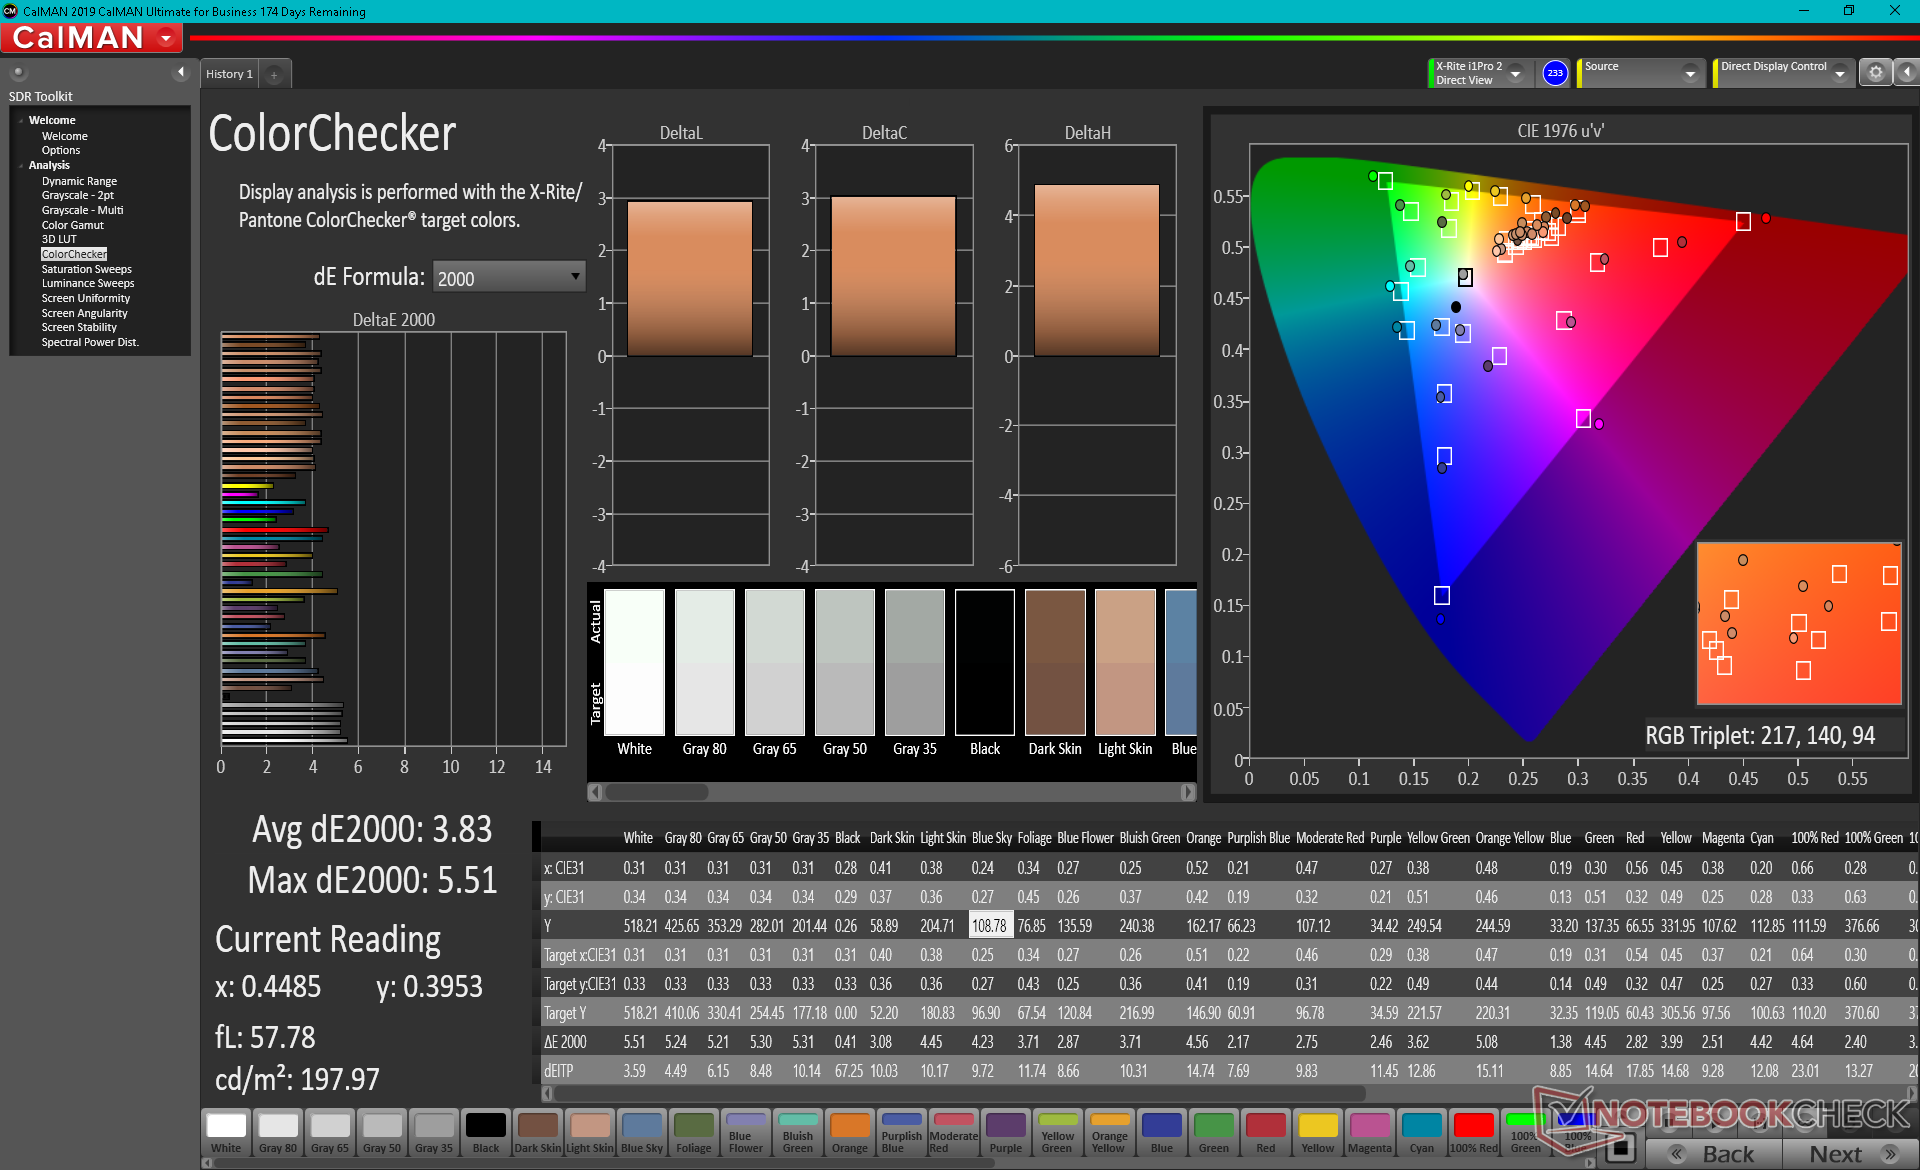
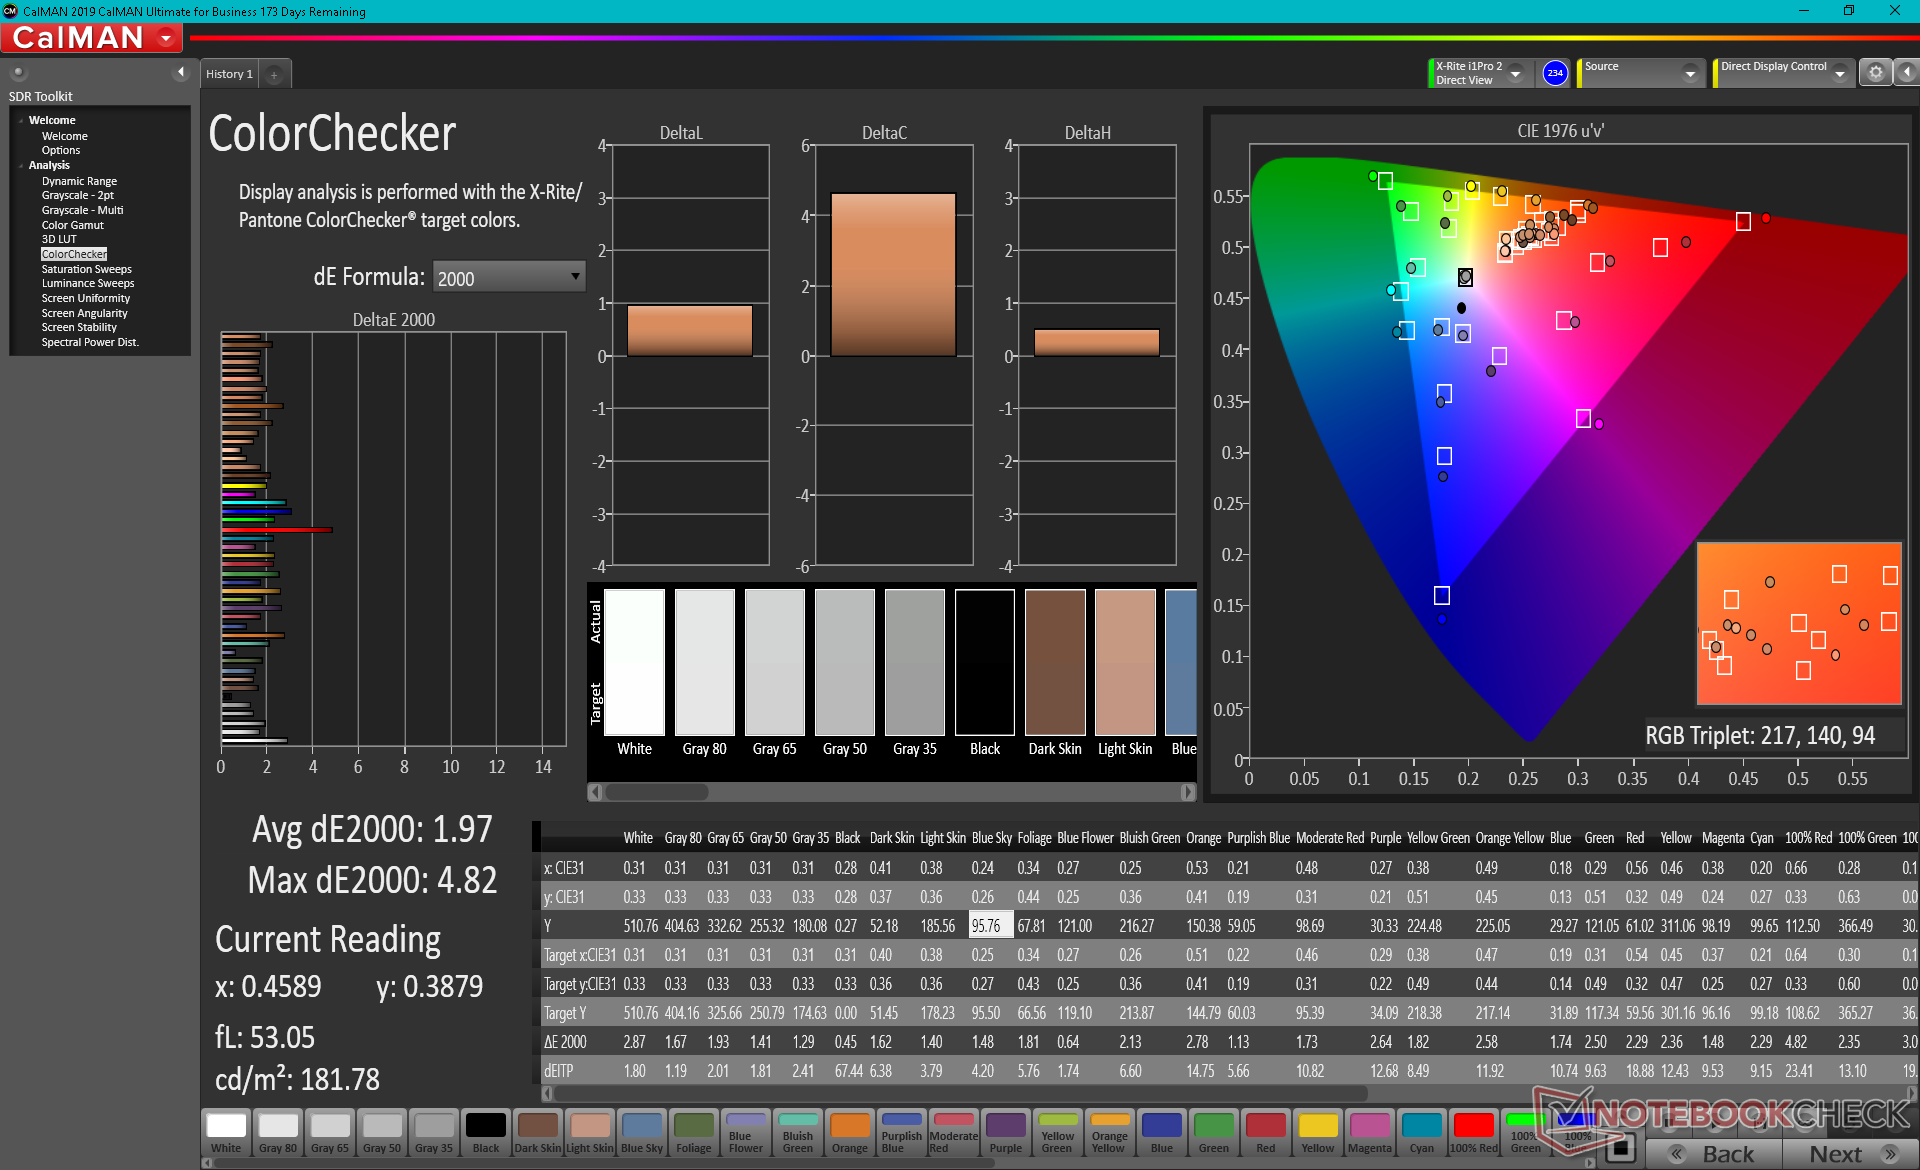
ΔE ColorChecker Calman: 3.83 | ∀{0.5-29.43 Ø4.72}
calibrated: 1.97
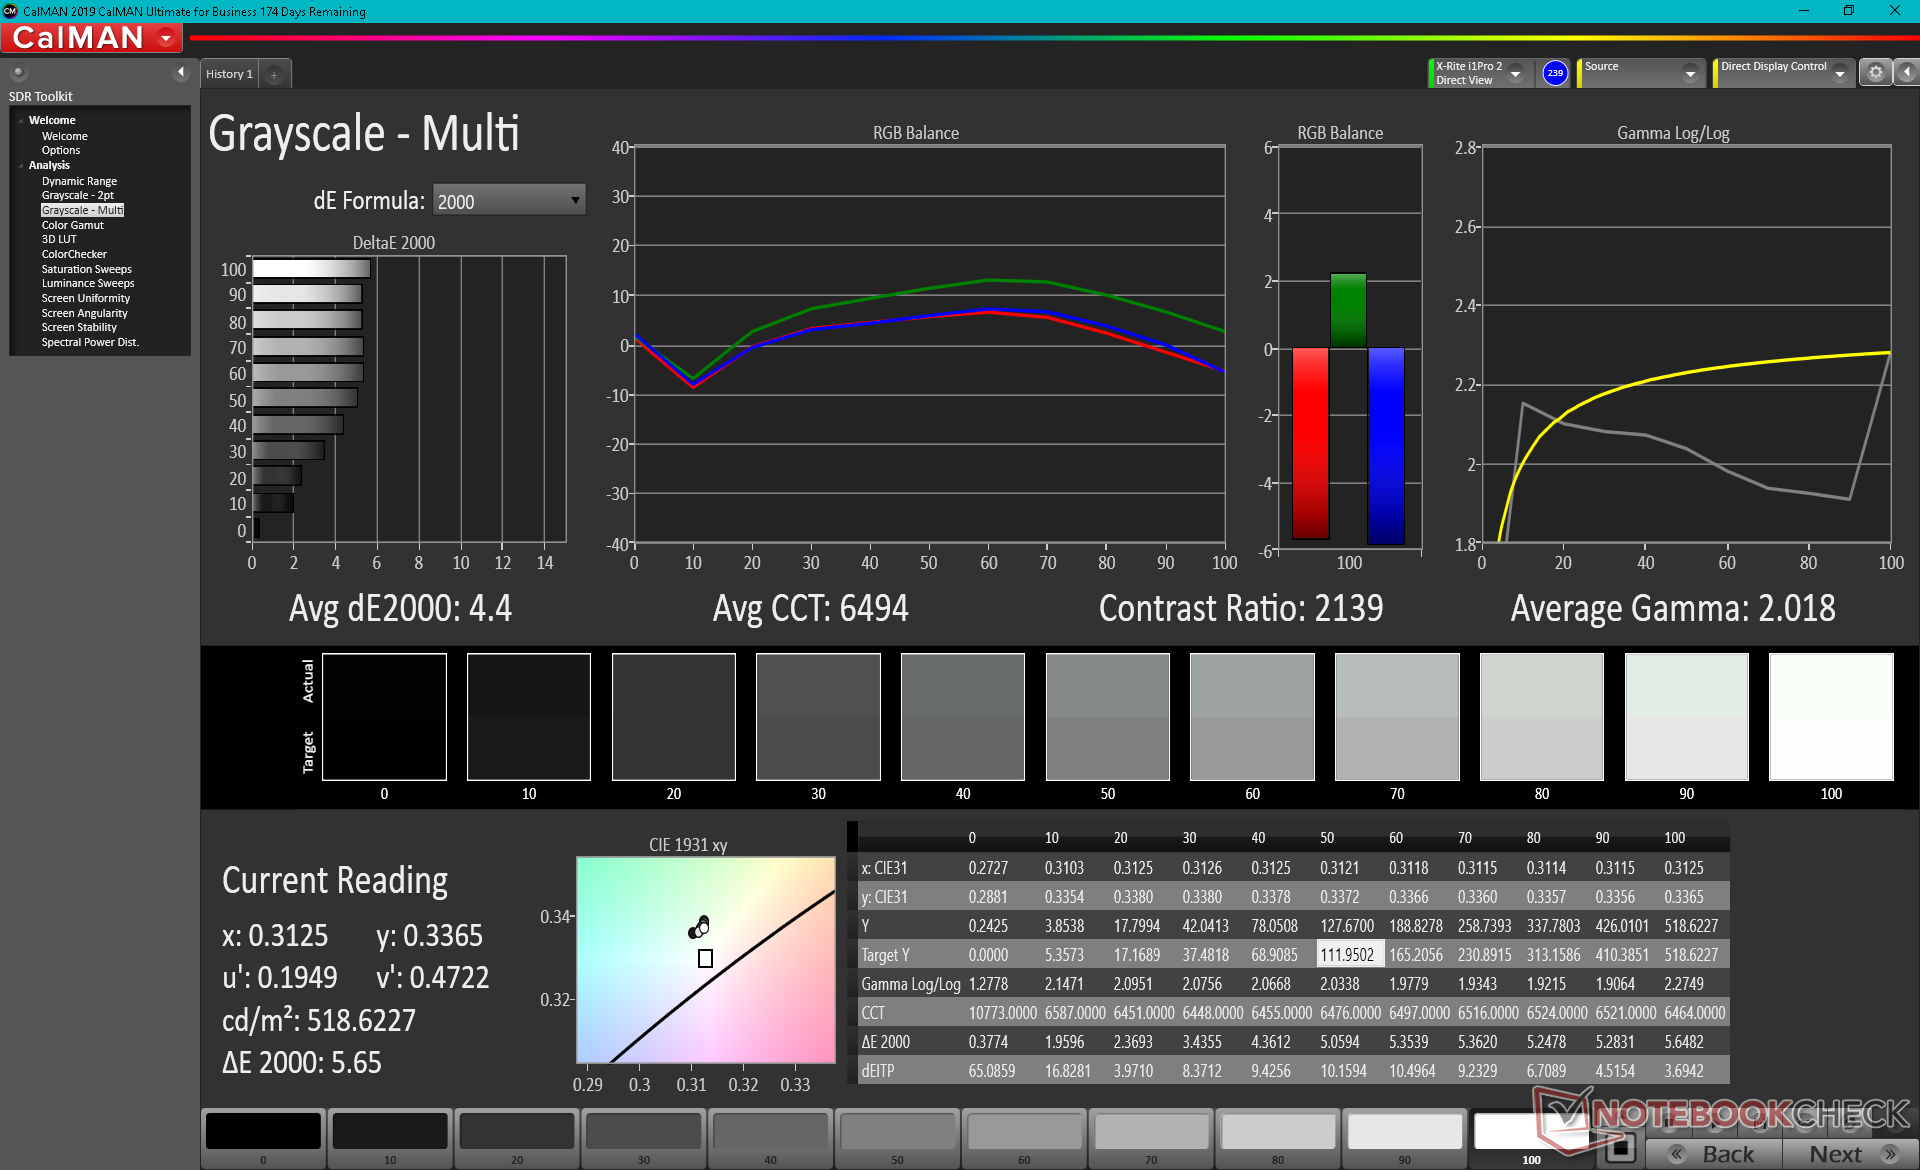
ΔE Greyscale Calman: 4.4 | ∀{0.09-98 Ø4.97}
78.4% AdobeRGB 1998 (Argyll 3D)
100% sRGB (Argyll 3D)
79.5% Display P3 (Argyll 3D)
Gamma: 2.02
CCT: 6494 K
| Dell Latitude 13 7320 Detachable, i7-1180G7 Sharp LQ130N1, IPS, 13", 1920x1280 | Microsoft Surface Pro 7 Plus LG Philips LP123WQ332684, IPS, 12.3", 2736x1824 | Lenovo ThinkPad X12 20UVS03G00 N123NCA-GS1, a-Si IPS LED, 12.3", 1920x1280 | Dell XPS 13 7390 2-in-1 Core i7 Sharp LQ134N1, IPS, 13.4", 1920x1200 | Lenovo Yoga Duet 7 13IML05-82AS000WGE CSOT T3 LEN8290, IPS, 13", 2160x1350 | |
|---|---|---|---|---|---|
| Display | -10% | -10% | -7% | -8% | |
| Display P3 Coverage (%) | 79.5 | 66.9 -16% | 67 -16% | 69.9 -12% | 68.9 -13% |
| sRGB Coverage (%) | 100 | 96.7 -3% | 99.2 -1% | 99.2 -1% | 98.2 -2% |
| AdobeRGB 1998 Coverage (%) | 78.4 | 69.1 -12% | 68.8 -12% | 71.5 -9% | 71.1 -9% |
| Response Times | 2% | -15% | 11% | 6% | |
| Response Time Grey 50% / Grey 80% * (ms) | 53.2 ? | 50.8 ? 5% | 63.2 ? -19% | 47.6 ? 11% | 58 ? -9% |
| Response Time Black / White * (ms) | 32.8 ? | 33.6 ? -2% | 36 ? -10% | 29.2 ? 11% | 26 ? 21% |
| PWM Frequency (Hz) | 2451 ? | 199.2 ? | 2500 ? | ||
| Screen | 16% | 32% | 15% | -10% | |
| Brightness middle (cd/m²) | 521.8 | 408 -22% | 419 -20% | 549.8 5% | 450 -14% |
| Brightness (cd/m²) | 504 | 425 -16% | 406 -19% | 520 3% | 411 -18% |
| Brightness Distribution (%) | 93 | 85 -9% | 94 1% | 86 -8% | 83 -11% |
| Black Level * (cd/m²) | 0.35 | 0.34 3% | 0.23 34% | 0.39 -11% | 0.22 37% |
| Contrast (:1) | 1491 | 1200 -20% | 1822 22% | 1410 -5% | 2045 37% |
| Colorchecker dE 2000 * | 3.83 | 1.5 61% | 1.1 71% | 2.12 45% | 4.15 -8% |
| Colorchecker dE 2000 max. * | 5.51 | 2.5 55% | 2.2 60% | 3.66 34% | 11.49 -109% |
| Colorchecker dE 2000 calibrated * | 1.97 | 1.4 29% | 0.5 75% | 1.37 30% | 1.09 45% |
| Greyscale dE 2000 * | 4.4 | 1.6 64% | 1.5 66% | 2.6 41% | 6.66 -51% |
| Gamma | 2.02 109% | 2.05 107% | 2.06 107% | 2.3 96% | 2.42 91% |
| CCT | 6494 100% | 6432 101% | 6524 100% | 6884 94% | 6043 108% |
| Color Space (Percent of AdobeRGB 1998) (%) | 63.7 | 62.8 | 65.4 | 65 | |
| Color Space (Percent of sRGB) (%) | 96.8 | 99.2 | 99.7 | 98 | |
| Media totale (Programma / Settaggio) | 3% /
8% | 2% /
17% | 6% /
10% | -4% /
-7% |
* ... Meglio usare valori piccoli
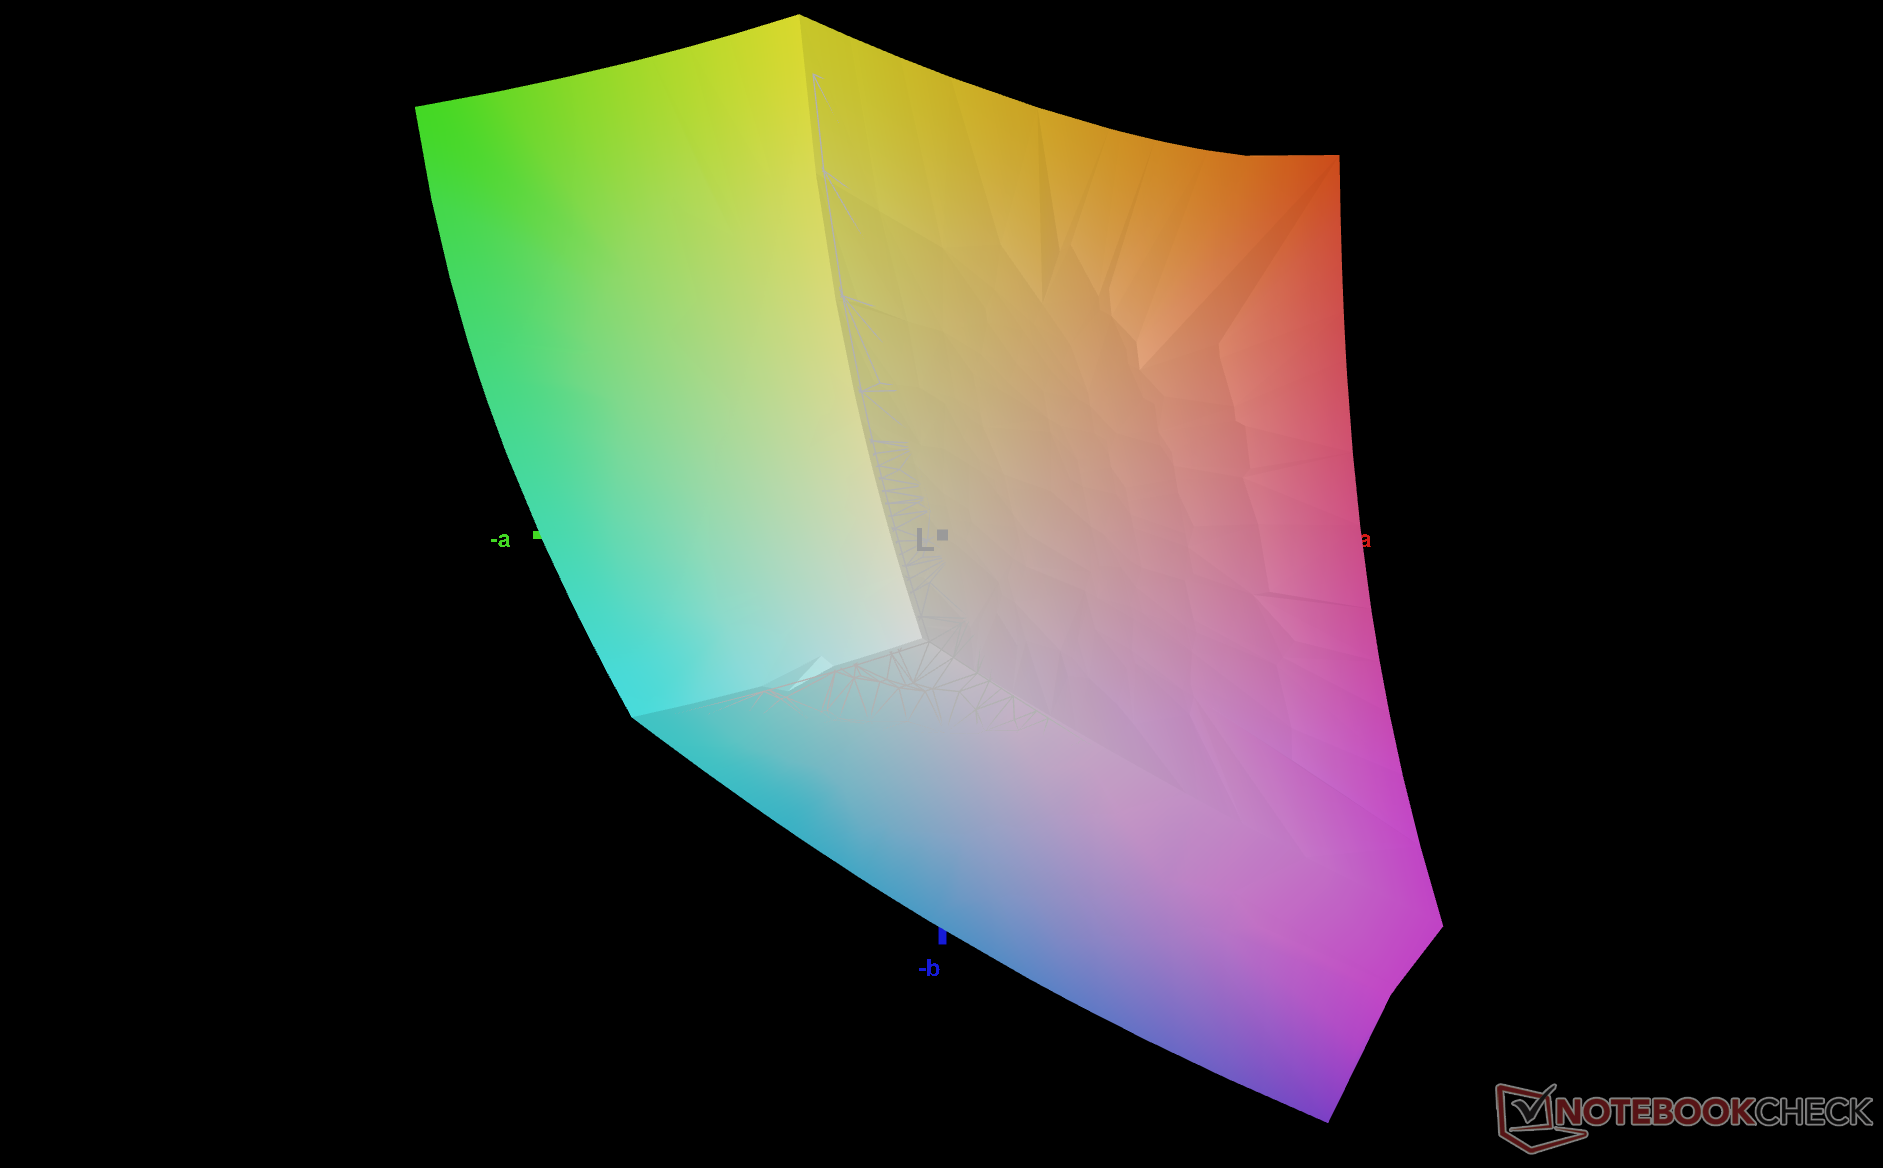
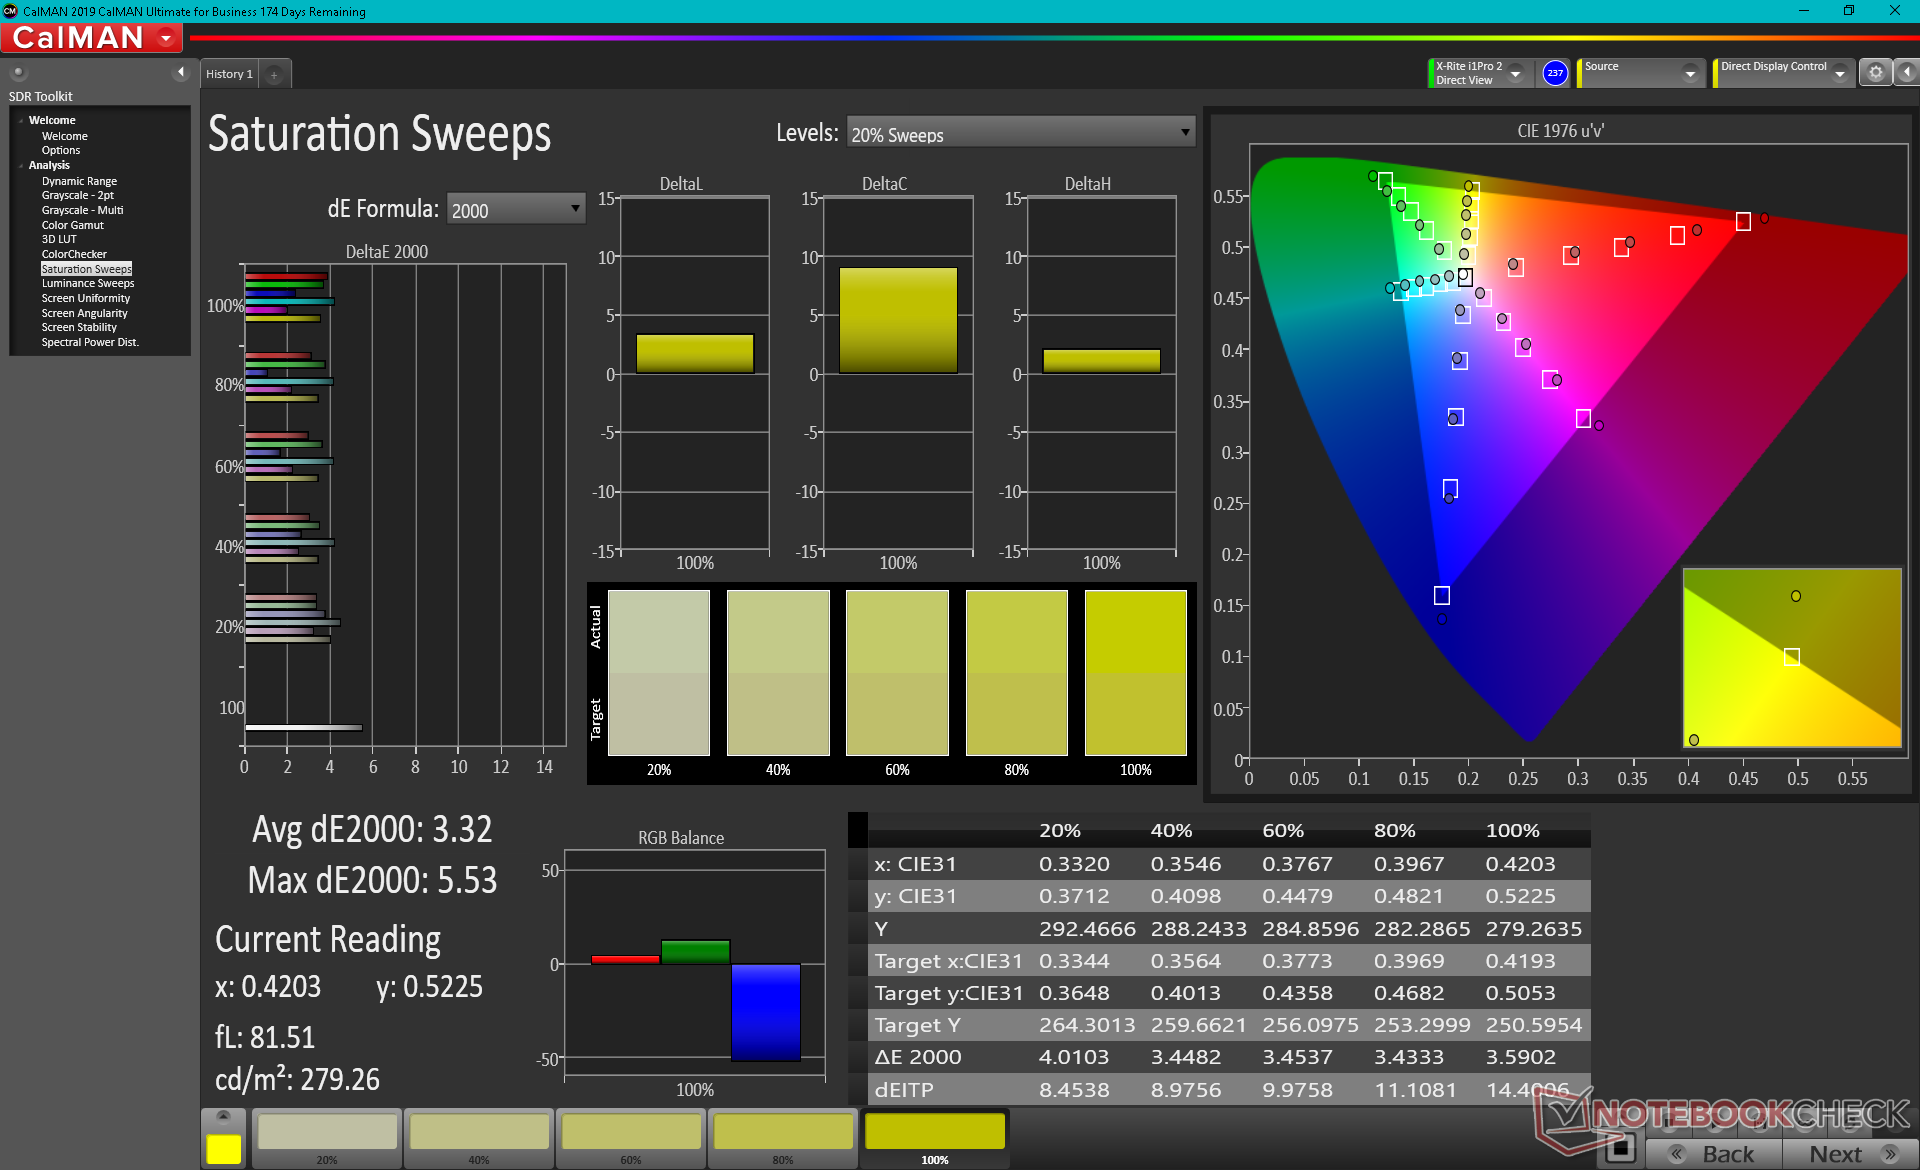
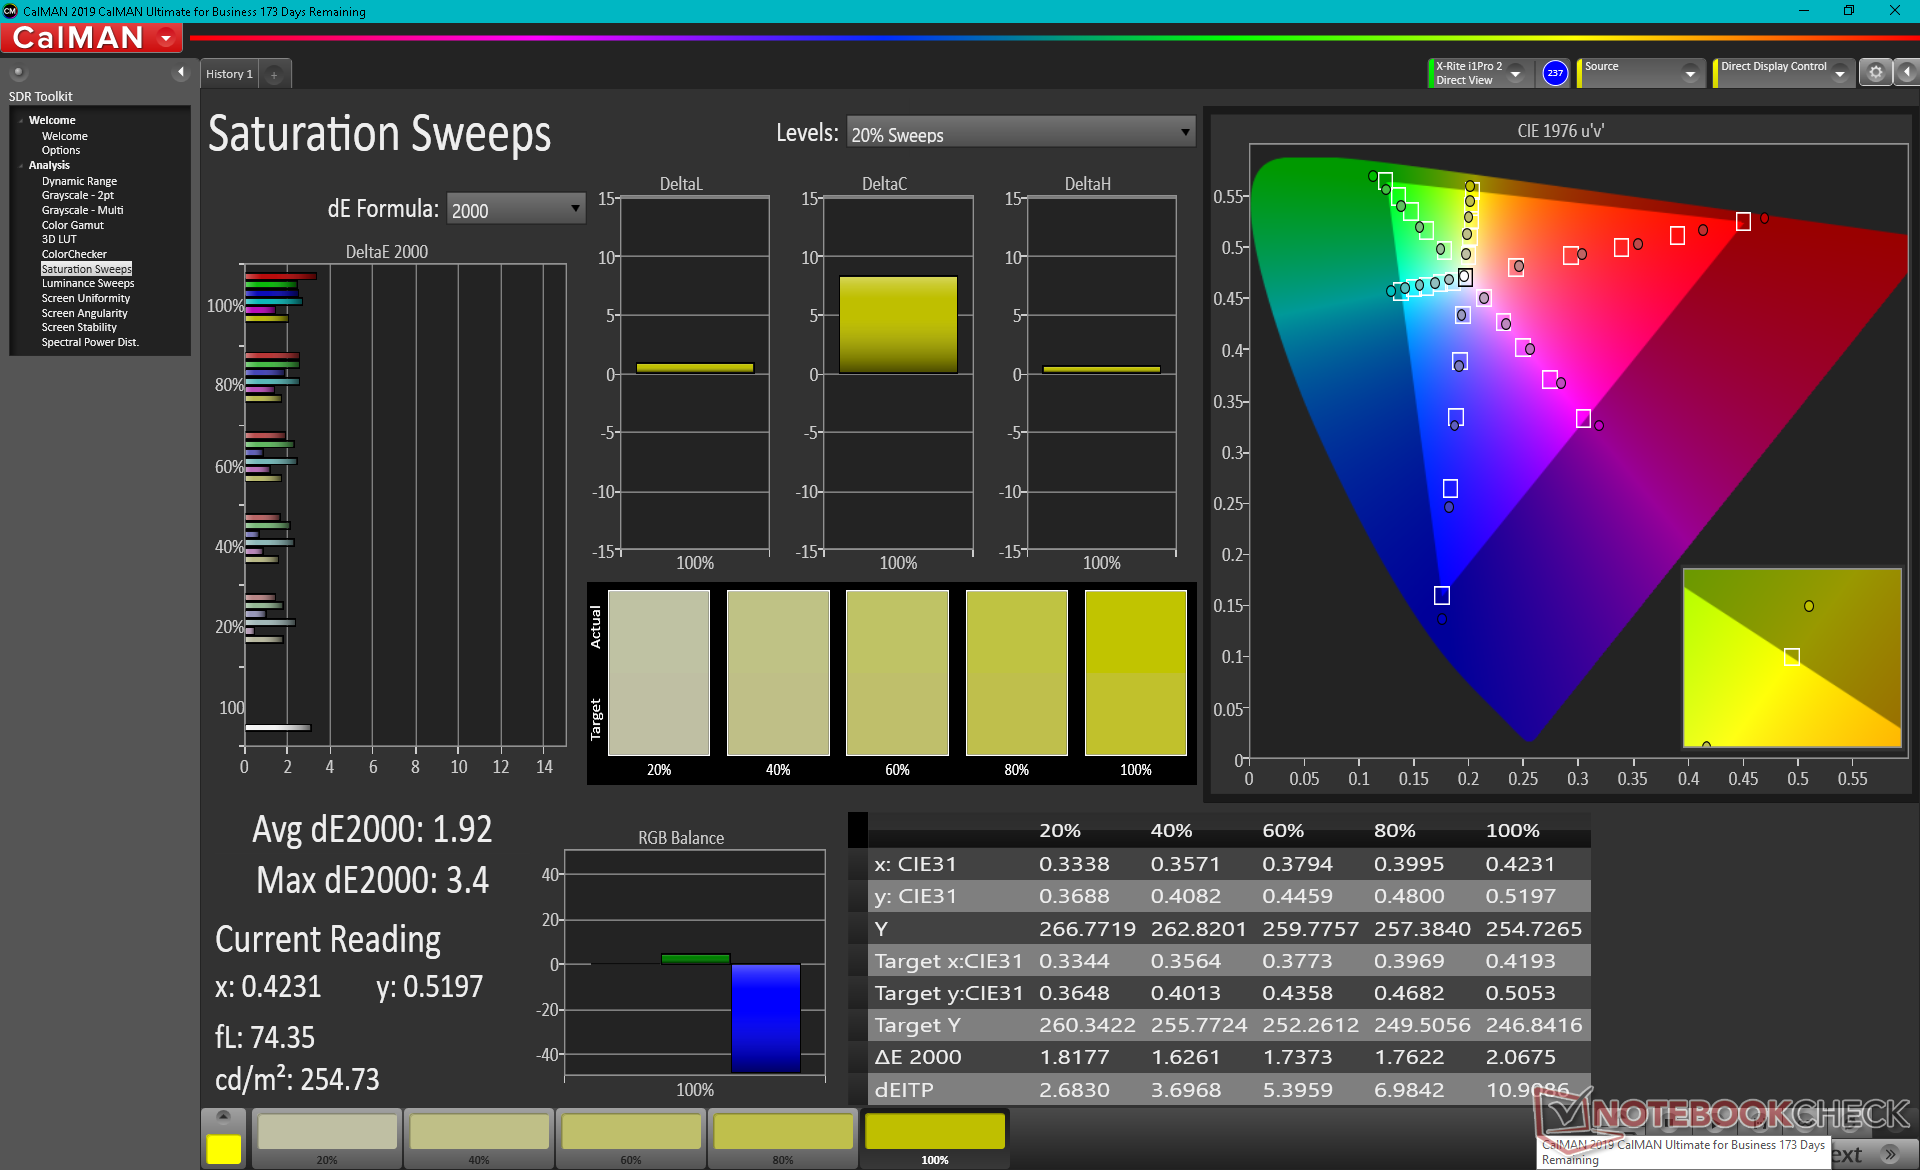
I colori sono decenti, ma potrebbero essere più precisi data la copertura completa sRGB del pannello. Calibrando il pannello da soli si raggiunge una migliore scala di grigi (DeltaE 4.4 a 1.6) e colori (DeltaE 3.83 a 1.97) e una gamma più desiderabile di 2.2.
Tempi di risposta del Display
| ↔ Tempi di risposta dal Nero al Bianco | ||
|---|---|---|
| 32.8 ms ... aumenta ↗ e diminuisce ↘ combinato | ↗ 16.4 ms Incremento | 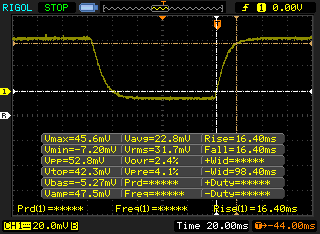 |
| ↘ 16.4 ms Calo | ||
| Lo schermo mostra tempi di risposta lenti nei nostri tests e sarà insoddisfacente per i gamers. In confronto, tutti i dispositivi di test variano da 0.1 (minimo) a 240 (massimo) ms. » 88 % di tutti i dispositivi è migliore. Questo significa che i tempi di risposta rilevati sono peggiori rispetto alla media di tutti i dispositivi testati (19.9 ms). | ||
| ↔ Tempo di risposta dal 50% Grigio all'80% Grigio | ||
| 53.2 ms ... aumenta ↗ e diminuisce ↘ combinato | ↗ 26.4 ms Incremento | 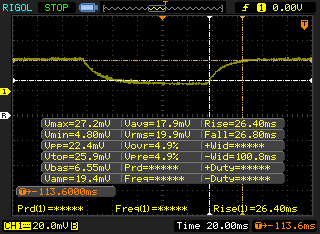 |
| ↘ 26.8 ms Calo | ||
| Lo schermo mostra tempi di risposta lenti nei nostri tests e sarà insoddisfacente per i gamers. In confronto, tutti i dispositivi di test variano da 0.165 (minimo) a 636 (massimo) ms. » 90 % di tutti i dispositivi è migliore. Questo significa che i tempi di risposta rilevati sono peggiori rispetto alla media di tutti i dispositivi testati (31.1 ms). | ||
Sfarfallio dello schermo / PWM (Pulse-Width Modulation)
| flickering dello schermo / PWM rilevato | 2451 Hz | ≤ 42 % settaggio luminosita' | 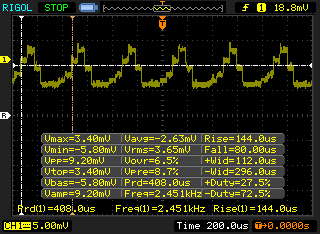 |
Il display sfarfalla a 2451 Hz (Probabilmente a causa dell'uso di PWM) Flickering rilevato ad una luminosita' di 42 % o inferiore. Non dovrebbe verificarsi flickering o PWM sopra questo valore di luminosita'. La frequenza di 2451 Hz è abbastanza alta, quindi la maggioranza degli utenti sensibili al PWM non dovrebbero notare alcun flickering. In confronto: 52 % di tutti i dispositivi testati non utilizza PWM per ridurre la luminosita' del display. Se è rilevato PWM, una media di 7784 (minimo: 5 - massimo: 343500) Hz è stata rilevata. | |||
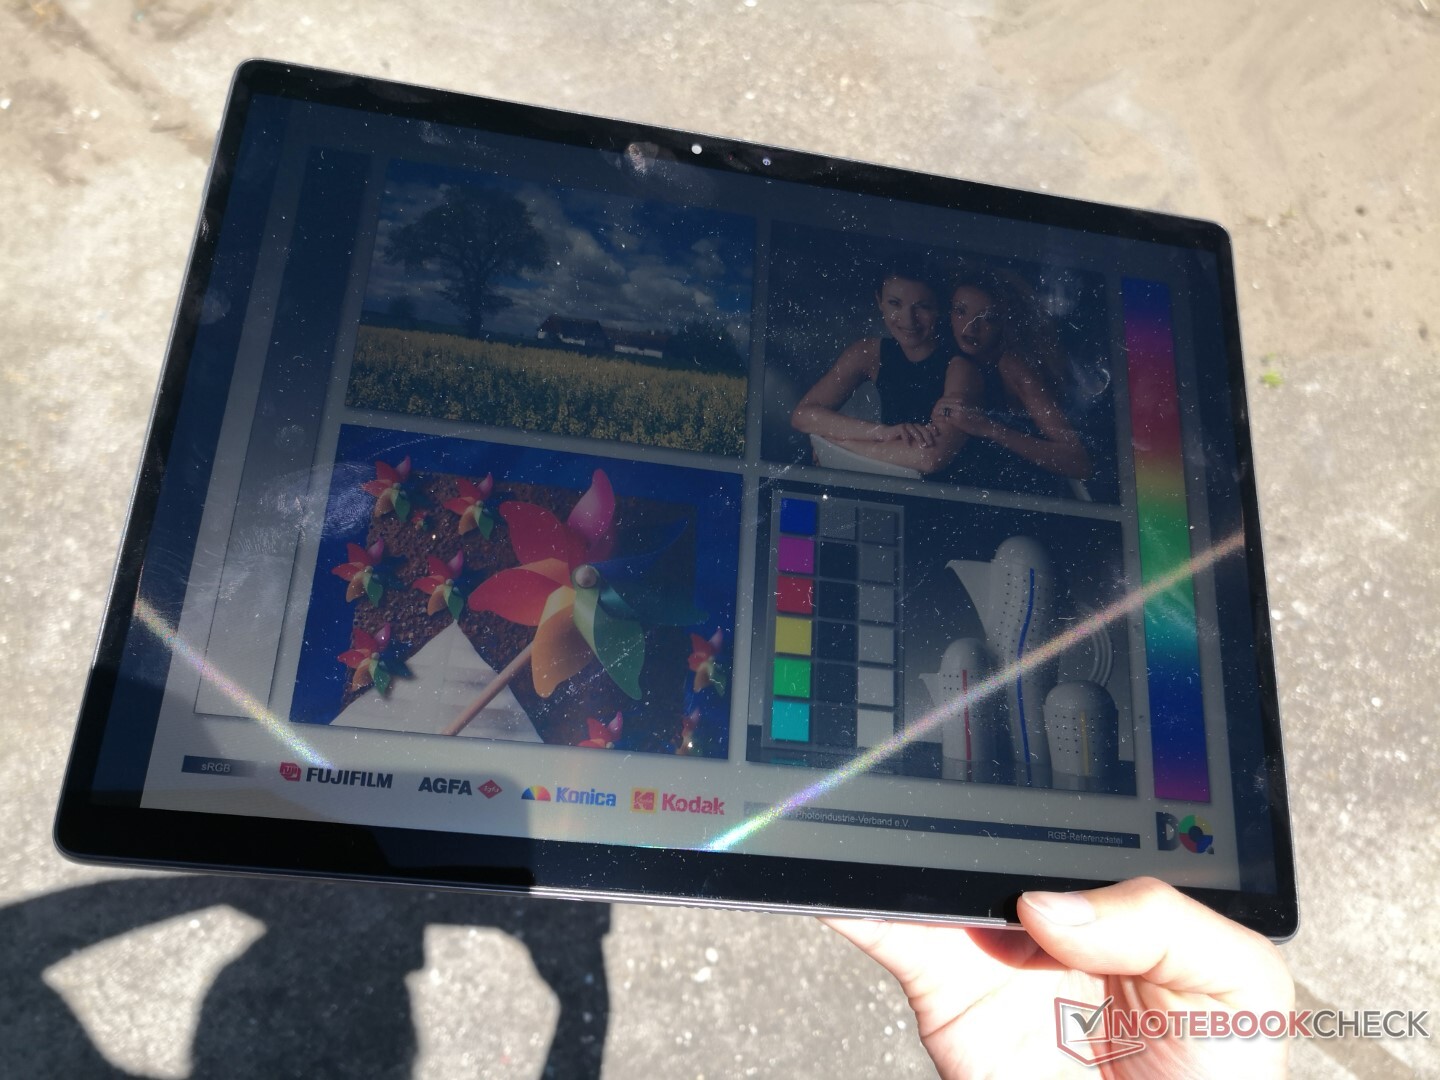
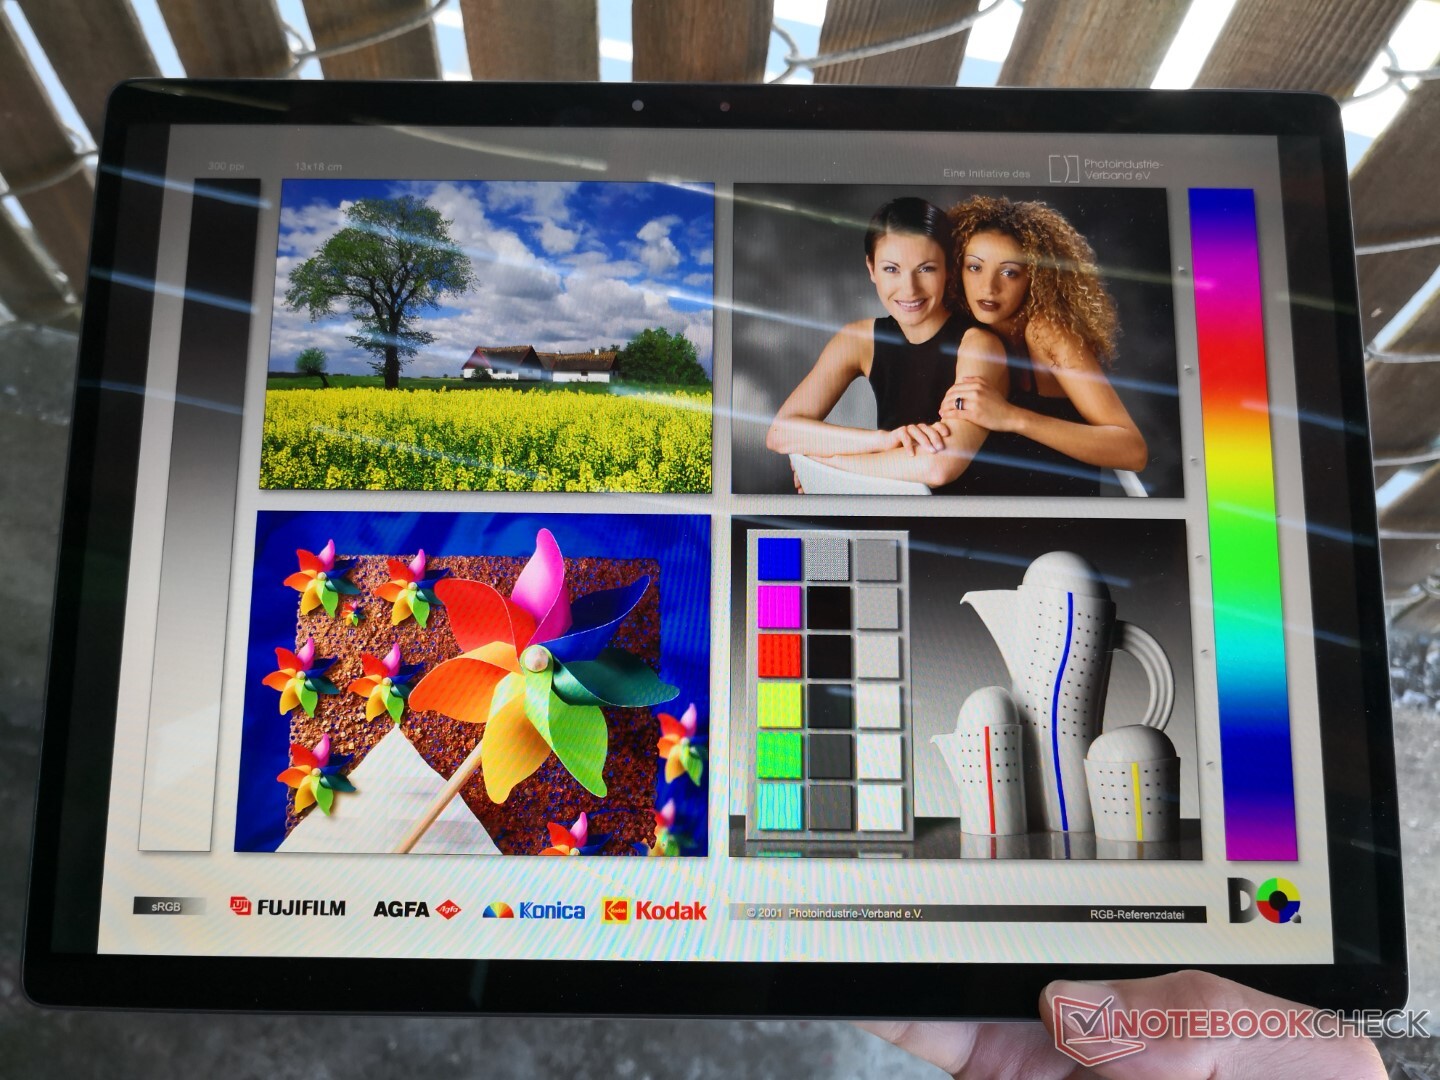
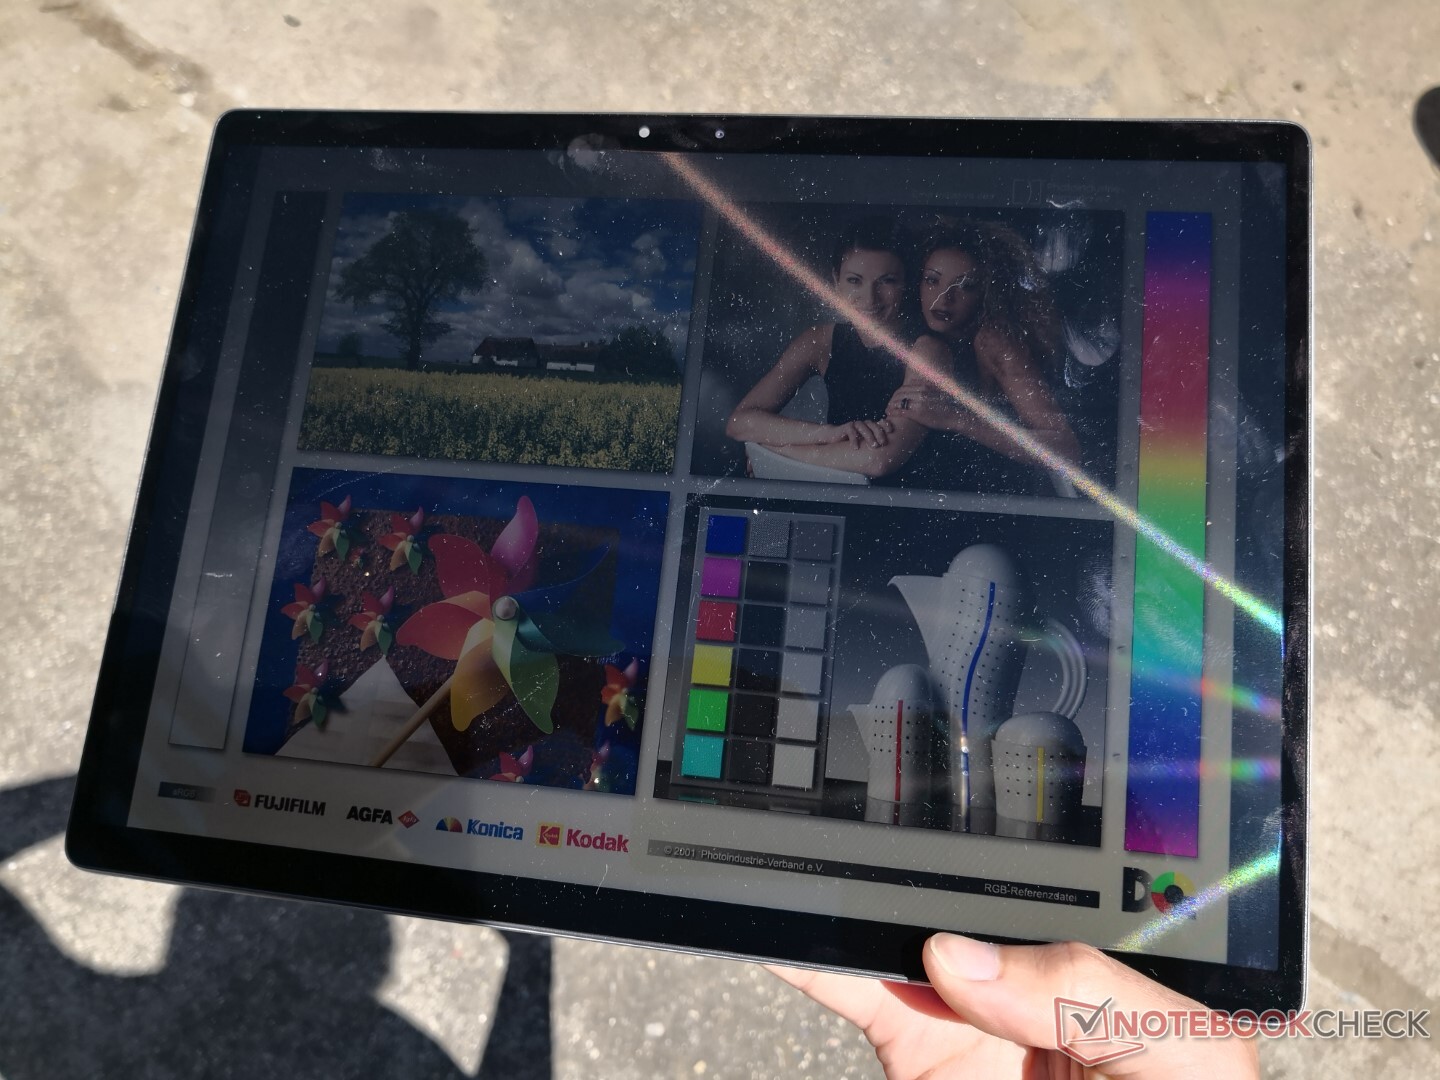
La visibilità esterna è ottima quando è all'ombra. Un po' di riflessi sono sempre presenti, cosa da aspettarsi dal touchscreen super-lucido. Tenete a mente che la luminosità massima scenderà automaticamente da 521.8 nits a soli 438.9 nits perché la funzione Intel Display Power Savings è abilitata di default. Disabilitando questa funzione attraverso Intel Graphics Command Center si evita questo calo di luminosità. Vorrai spremere ogni nit possibile dalla retroilluminazione per un'esperienza visiva più confortevole all'aperto.
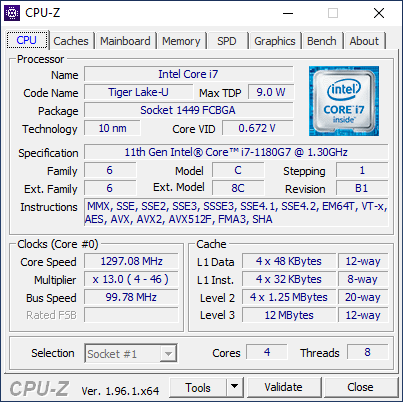
Prestazioni - Tiger Lake-U di 11a generazione
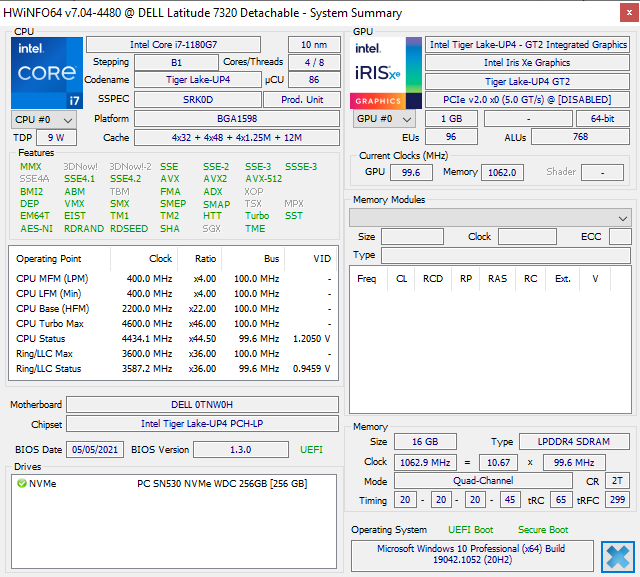
Gli utenti possono scegliere configurazioni con il Core i3-1110G4, Core i5-1130G7, Core i5-1140G7 o Core i7-1180G7 con vPro in contrasto con le solite opzioni Core i3-1115G4, Core i5-1135G7 o Core i7-1165G7 sulla maggior parte degli altri PC Tiger Lake-U. Le versioni Core ix-xxx0 hanno frequenze di clock molto più lente delle versioni Core ix-xxx5. Il nostro Core i7-1180G7, per esempio, ha un clock rate di base di 2.2 GHz rispetto ai 3.0 GHz del Core i7-1165G7. Sospettiamo che il piccolo formato del Latitude 7320 sganciabile abbia proibito a Dell di usare il più veloce Core i7-1165G7 o i7-1185G7.
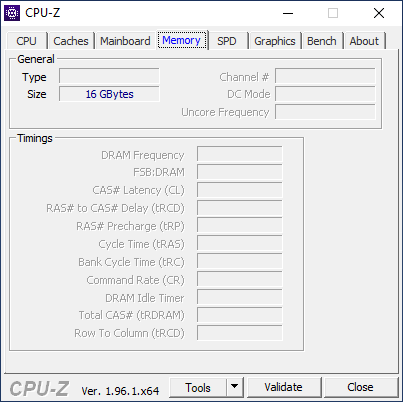
L'Intel Iris Xe è di serie su tutte le versioni eccetto l'opzione Core i3 di fascia bassa. Raccomandiamo comunque di evitare la versione Core i3 a causa dei suoi 4 GB di RAM non aggiornabile.
La nostra unità è stata impostata in modalità Ultra Performance tramite Dell Power Manager prima di eseguire qualsiasi benchmark di performance qui sotto per ottenere i più alti punteggi possibili. I proprietari dovrebbero sicuramente familiarizzare con le applicazioni Dell preinstallate e le loro impostazioni. Dell Optimizer, per esempio, è dove gli utenti possono attivare il sensore di prossimità per evitare che il tablet vada in standby automaticamente.
Processore - il Core i7-1180G7 è molto diverso dal Core i7-1185G7
Le prestazioni multi-thread pure sono quasi il 40% più lente rispetto alla media del Core i7-1185G7, date le già citate differenze significative di clock rate tra di loro. Le prestazioni sono quindi tra il Core i5-1035G1 e il Core i5-1135G7 come si trova sul Surface Go e Surface Pro 7 Plus, rispettivamente. Le prestazioni single-thread rimangono eccellenti e alla pari con altre CPU Tiger Lake-U.
Il Latitude 7320 sganciabile poco del Turbo Boost della CPU, come nella maggior parte degli altri tablets. L'esecuzione di CineBench R15 xT in un ciclo mostra risultati piatti con nessun aumento duraturo delle prestazioni durante i primi minuti del test.
Cinebench R23: Multi Core | Single Core
Cinebench R15: CPU Multi 64Bit | CPU Single 64Bit
Blender: v2.79 BMW27 CPU
7-Zip 18.03: 7z b 4 -mmt1 | 7z b 4
Geekbench 5.5: Single-Core | Multi-Core
HWBOT x265 Benchmark v2.2: 4k Preset
LibreOffice : 20 Documents To PDF
R Benchmark 2.5: Overall mean
| Cinebench R23 / Multi Core | |
| Lenovo IdeaPad Flex 5 14ALC05 82HU002YUS | |
| Lenovo IdeaPad Flex 5 14ALC05-82HU006NGE | |
| Media Intel Core i7-1185G7 (3610 - 6383, n=24) | |
| Microsoft Surface Pro 7 Plus | |
| Dell Latitude 13 7320 Detachable, i7-1180G7 | |
| Media Intel Core i7-1180G7 (n=1) | |
| Lenovo ThinkPad X12 20UVS03G00 | |
| Cinebench R23 / Single Core | |
| Media Intel Core i7-1185G7 (1251 - 1532, n=24) | |
| Microsoft Surface Pro 7 Plus | |
| Dell Latitude 13 7320 Detachable, i7-1180G7 | |
| Media Intel Core i7-1180G7 (n=1) | |
| Lenovo IdeaPad Flex 5 14ALC05 82HU002YUS | |
| Lenovo IdeaPad Flex 5 14ALC05-82HU006NGE | |
| Lenovo ThinkPad X12 20UVS03G00 | |
| Geekbench 5.5 / Single-Core | |
| Dell Latitude 13 7320 Detachable, i7-1180G7 | |
| Media Intel Core i7-1180G7 (n=1) | |
| Media Intel Core i7-1185G7 (1398 - 1626, n=21) | |
| Lenovo ThinkPad X12 20UVS03G00 | |
| Microsoft Surface Pro 7 Plus | |
| Lenovo IdeaPad Flex 5 14ALC05 82HU002YUS | |
| Asus VivoBook Flip 14 TM420IA | |
| Microsoft Surface Laptop Go Core i5 | |
| Lenovo IdeaPad Flex 5 14ALC05-82HU006NGE | |
| HP Envy x360 13-ay0010nr | |
| Lenovo Yoga Duet 7 13IML05-82AS000WGE | |
| Geekbench 5.5 / Multi-Core | |
| Lenovo IdeaPad Flex 5 14ALC05 82HU002YUS | |
| Lenovo IdeaPad Flex 5 14ALC05-82HU006NGE | |
| Media Intel Core i7-1185G7 (4620 - 5944, n=21) | |
| Asus VivoBook Flip 14 TM420IA | |
| Dell Latitude 13 7320 Detachable, i7-1180G7 | |
| Media Intel Core i7-1180G7 (n=1) | |
| Microsoft Surface Pro 7 Plus | |
| Lenovo ThinkPad X12 20UVS03G00 | |
| HP Envy x360 13-ay0010nr | |
| Microsoft Surface Laptop Go Core i5 | |
| Lenovo Yoga Duet 7 13IML05-82AS000WGE | |
| LibreOffice / 20 Documents To PDF | |
| Lenovo Yoga Duet 7 13IML05-82AS000WGE | |
| Lenovo IdeaPad Flex 5 14ALC05-82HU006NGE | |
| Microsoft Surface Laptop Go Core i5 | |
| HP Envy x360 13-ay0010nr | |
| Lenovo ThinkPad X12 20UVS03G00 | |
| Lenovo IdeaPad Flex 5 14ALC05 82HU002YUS | |
| Microsoft Surface Pro 7 Plus | |
| Asus VivoBook Flip 14 TM420IA | |
| Media Intel Core i7-1185G7 (41.3 - 61.7, n=26) | |
| Dell Latitude 13 7320 Detachable, i7-1180G7 | |
| Media Intel Core i7-1180G7 (n=1) | |
| R Benchmark 2.5 / Overall mean | |
| Lenovo Yoga Duet 7 13IML05-82AS000WGE | |
| Lenovo ThinkPad X12 20UVS03G00 | |
| Microsoft Surface Laptop Go Core i5 | |
| Microsoft Surface Pro 7 Plus | |
| Dell Latitude 13 7320 Detachable, i7-1180G7 | |
| Media Intel Core i7-1180G7 (n=1) | |
| Lenovo IdeaPad Flex 5 14ALC05-82HU006NGE | |
| HP Envy x360 13-ay0010nr | |
| Asus VivoBook Flip 14 TM420IA | |
| Lenovo IdeaPad Flex 5 14ALC05 82HU002YUS | |
| Media Intel Core i7-1185G7 (0.55 - 0.615, n=27) | |
Cinebench R23: Multi Core | Single Core
Cinebench R15: CPU Multi 64Bit | CPU Single 64Bit
Blender: v2.79 BMW27 CPU
7-Zip 18.03: 7z b 4 -mmt1 | 7z b 4
Geekbench 5.5: Single-Core | Multi-Core
HWBOT x265 Benchmark v2.2: 4k Preset
LibreOffice : 20 Documents To PDF
R Benchmark 2.5: Overall mean
* ... Meglio usare valori piccoli
Prestazioni del sistema
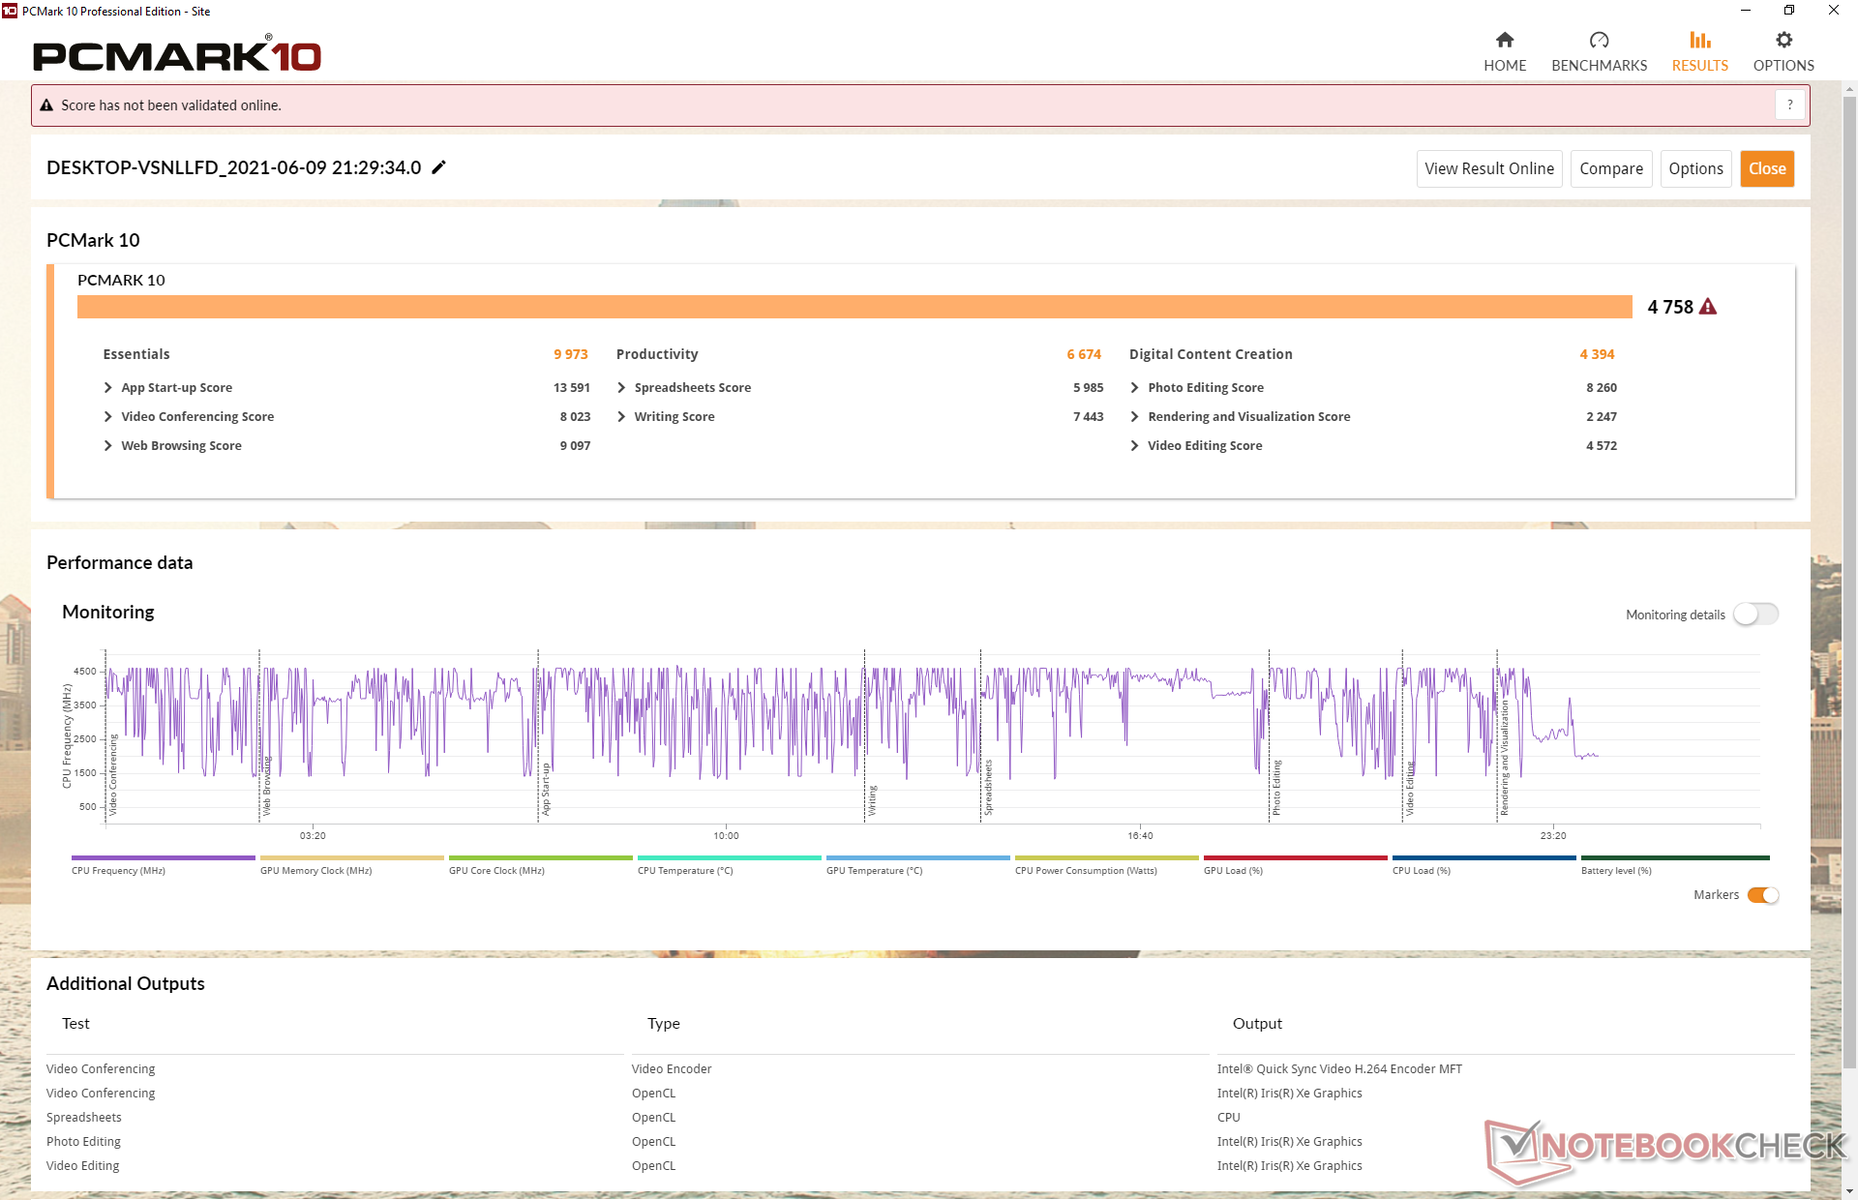
| PCMark 10 Score | 4758 punti | |
Aiuto | ||
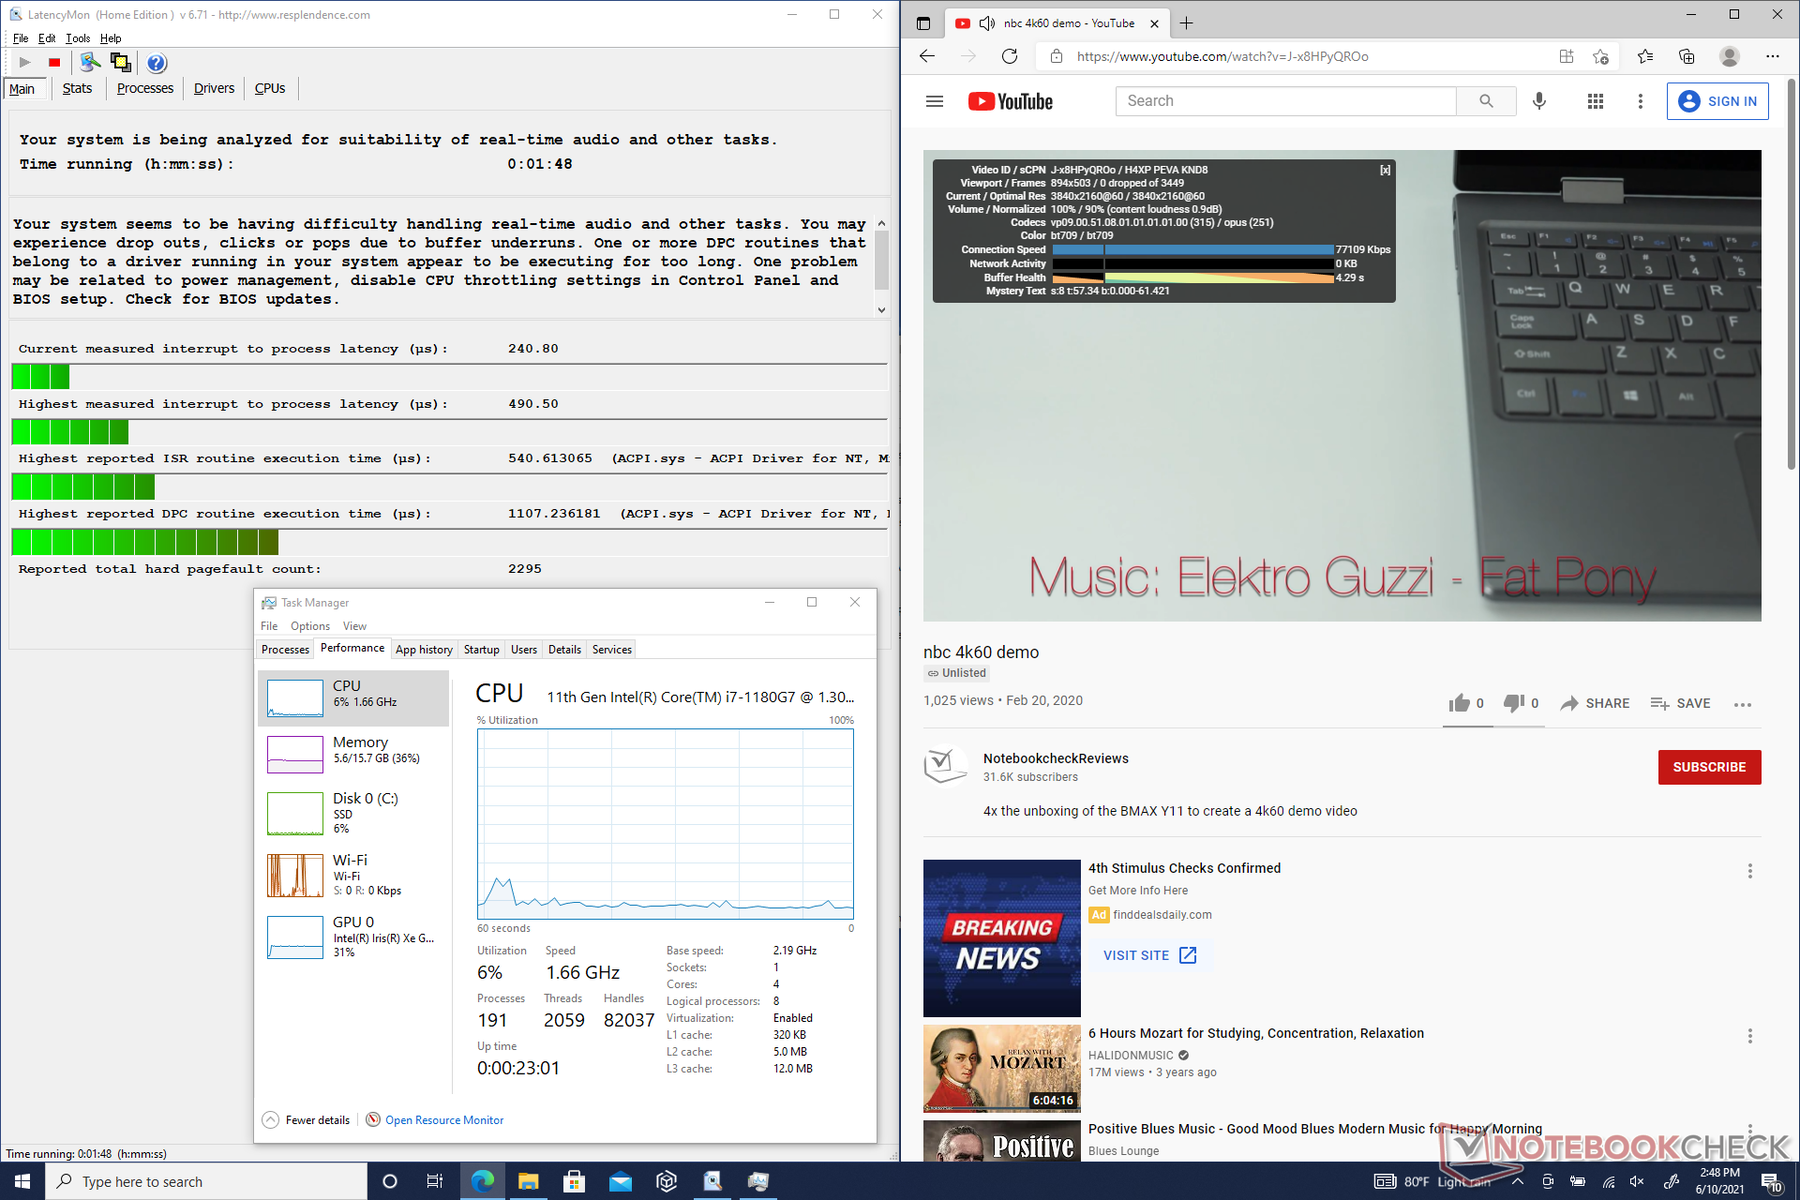
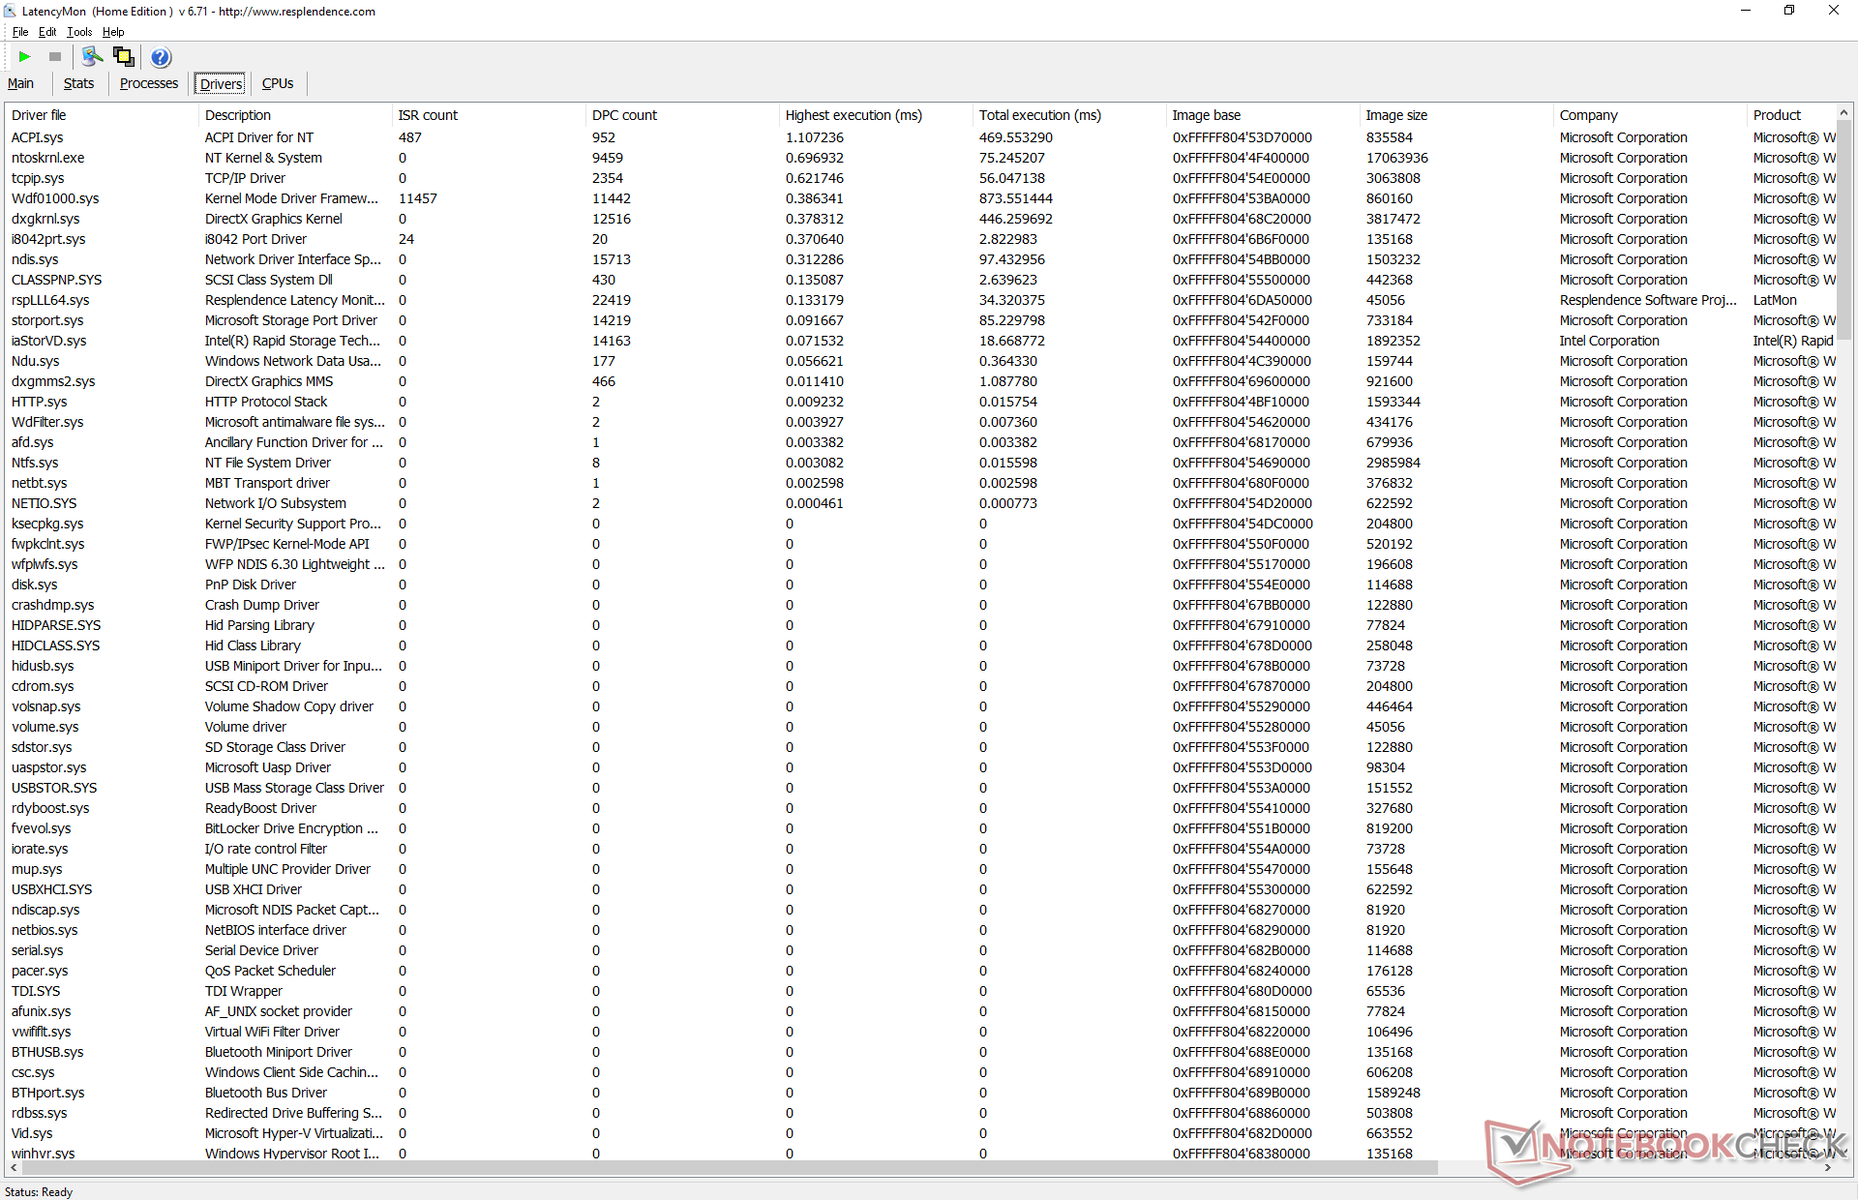
Latenza DPC
LatencyMon mostra solo piccoli problemi di latenza DPC quando si aprono più schede del browser sulla nostra homepage. La riproduzione di video 4K a 60 FPS è per il resto fluida con un basso utilizzo di CPU e GPU e nessun fotogramma perso.
| DPC Latencies / LatencyMon - interrupt to process latency (max), Web, Youtube, Prime95 | |
| Lenovo Yoga Duet 7 13IML05-82AS000WGE | |
| Dell Latitude 13 7320 Detachable, i7-1180G7 | |
| Lenovo ThinkPad X12 20UVS03G00 | |
| Microsoft Surface Pro 7 Plus | |
* ... Meglio usare valori piccoli
Dispositivi di archiviazione
Le opzioni disponibili includono 128 GB NVMe PCIe fino a 1 TB tutti con crittografia automatica (SED). Dell utilizza il formato M.2 2230 più corto invece del solito 2280 probabilmente per risparmiare spazio e peso. Aggiornare l'unità da soli è quindi possibile, anche se non così facile da usare come su un computer portatile. La nostra unità di test è dotata di un Western Digital SN530 da 256 GB di fascia media con velocità di lettura e scrittura sequenziale di circa 2500 MB/s e 1000 MB/s, rispettivamente.
| Dell Latitude 13 7320 Detachable, i7-1180G7 WDC PC SN530 SDBPMPZ-265G | Microsoft Surface Pro 7 Plus Samsung PM991 MZ9LQ256HBJQ | Lenovo ThinkPad X12 20UVS03G00 Toshiba BG4 KBG40ZNT512G | Dell XPS 13 7390 2-in-1 Core i7 Toshiba BG4 KBG40ZPZ512G | Lenovo Yoga Duet 7 13IML05-82AS000WGE Lenovo UMIS RPJTJ256MEE1OWX | |
|---|---|---|---|---|---|
| AS SSD | 104% | 20% | 76% | 66% | |
| Seq Read (MB/s) | 1918 | 1725 -10% | 1760 -8% | 1801 -6% | 1629 -15% |
| Seq Write (MB/s) | 357.6 | 931 160% | 761 113% | 1125 215% | 694 94% |
| 4K Read (MB/s) | 38.97 | 50.1 29% | 47.68 22% | 39.7 2% | 47.87 23% |
| 4K Write (MB/s) | 195.5 | 136.9 -30% | 176 -10% | 67 -66% | 107 -45% |
| 4K-64 Read (MB/s) | 390.9 | 870 123% | 581 49% | 1253 221% | 411 5% |
| 4K-64 Write (MB/s) | 103.9 | 762 633% | 118.5 14% | 209 101% | 377 263% |
| Access Time Read * (ms) | 0.122 | 0.279 -129% | 0.155 -27% | 0.069 43% | 0.068 44% |
| Access Time Write * (ms) | 0.189 | 0.028 85% | 0.188 1% | 0.625 -231% | 0.035 81% |
| Score Read (Points) | 622 | 1093 76% | 805 29% | 1472 137% | 614 -1% |
| Score Write (Points) | 335 | 992 196% | 371 11% | 388 16% | 550 64% |
| Score Total (Points) | 1209 | 2616 116% | 1551 28% | 2583 114% | 1441 19% |
| Copy ISO MB/s (MB/s) | 858 | 1174 37% | 1293 51% | 1074 25% | |
| Copy Program MB/s (MB/s) | 239.9 | 262.8 10% | 560 133% | 532 122% | |
| Copy Game MB/s (MB/s) | 214.3 | 562 162% | 927 333% | 730 241% | |
| CrystalDiskMark 5.2 / 6 | 0% | -28% | 10% | 7% | |
| Write 4K (MB/s) | 177.5 | 165.3 -7% | 72.8 -59% | 106.7 -40% | 118 -34% |
| Read 4K (MB/s) | 47.45 | 42.95 -9% | 26.35 -44% | 49.94 5% | 53 12% |
| Write Seq (MB/s) | 971 | 955 -2% | 823 -15% | 1223 26% | 1208 24% |
| Read Seq (MB/s) | 1544 | 867 -44% | 1169 -24% | 1801 17% | 1625 5% |
| Write 4K Q32T1 (MB/s) | 295.3 | 423.5 43% | 112.6 -62% | 325.3 10% | 431 46% |
| Read 4K Q32T1 (MB/s) | 394.1 | 479.2 22% | 327.2 -17% | 551 40% | 356 -10% |
| Write Seq Q32T1 (MB/s) | 977 | 1060 8% | 1039 6% | 1224 25% | 1278 31% |
| Read Seq Q32T1 (MB/s) | 2482 | 2251 -9% | 2176 -12% | 2350 -5% | 1949 -21% |
| Media totale (Programma / Settaggio) | 52% /
66% | -4% /
-0% | 43% /
52% | 37% /
44% |
* ... Meglio usare valori piccoli

Throttling disco: DiskSpd Read Loop, Queue Depth 8
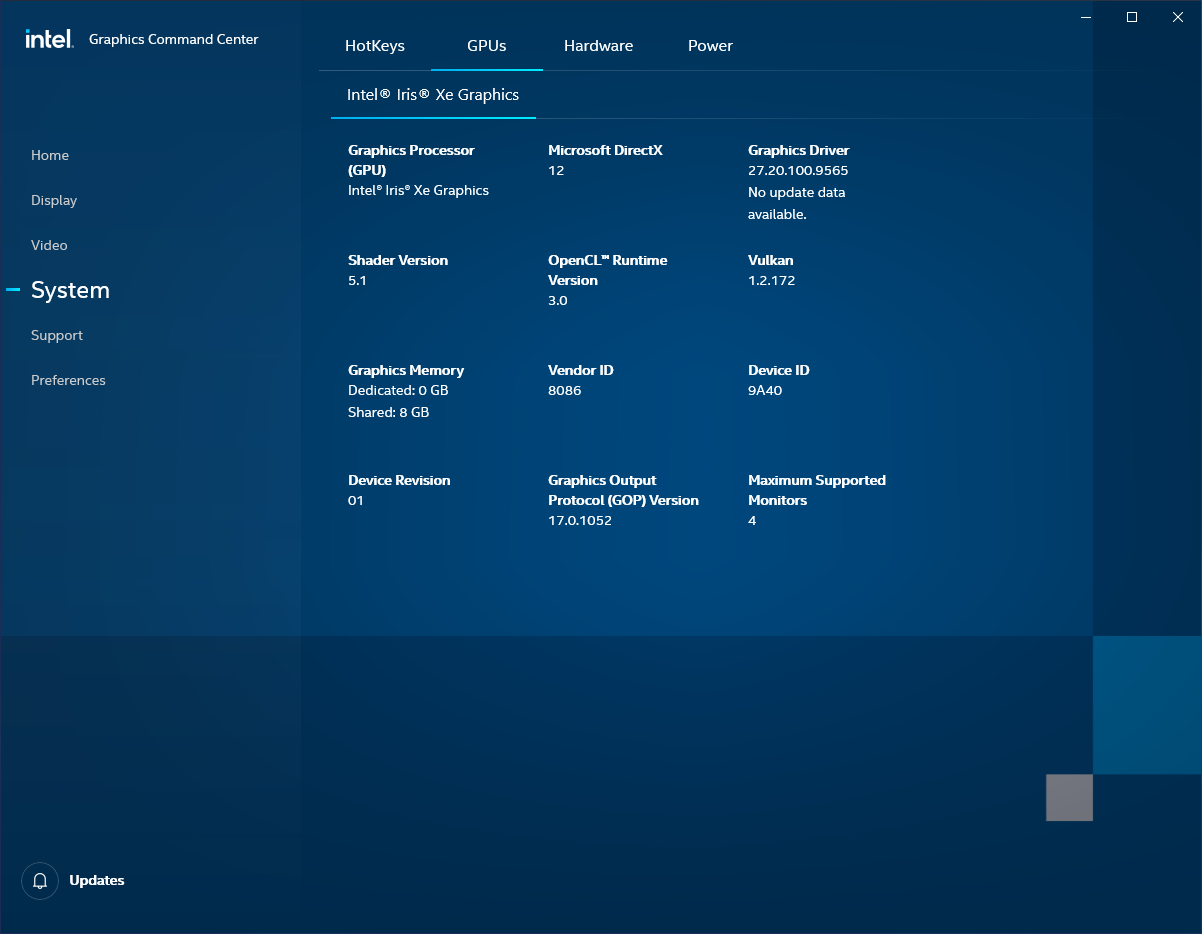
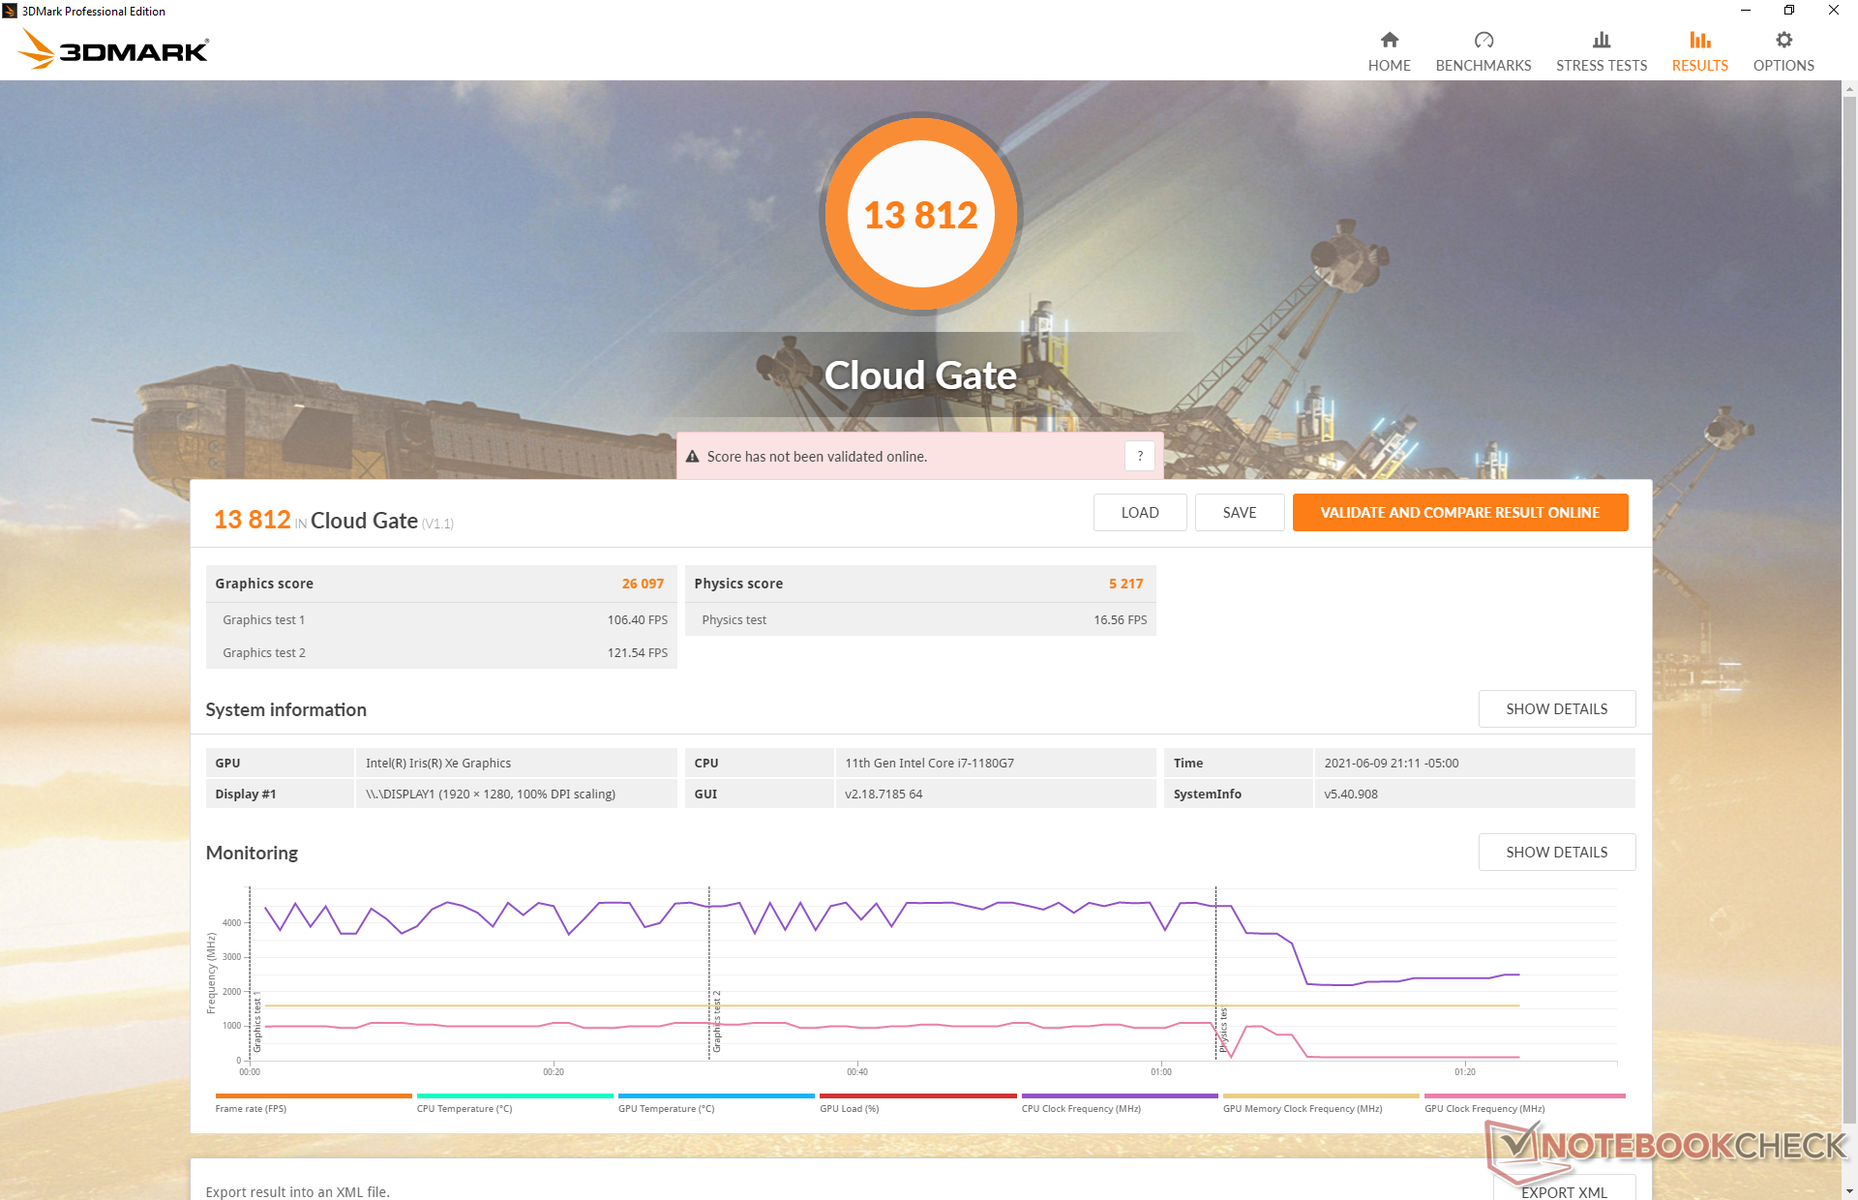
Prestazioni della GPU - la Iris Xe fa la differenza
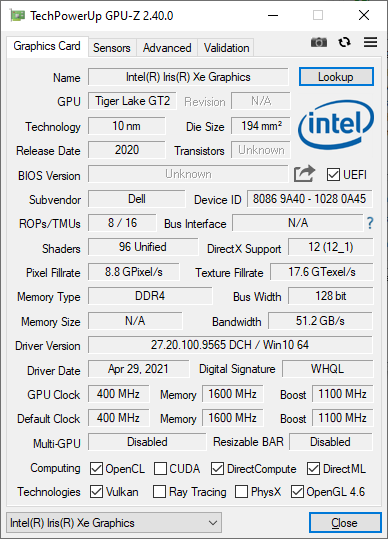
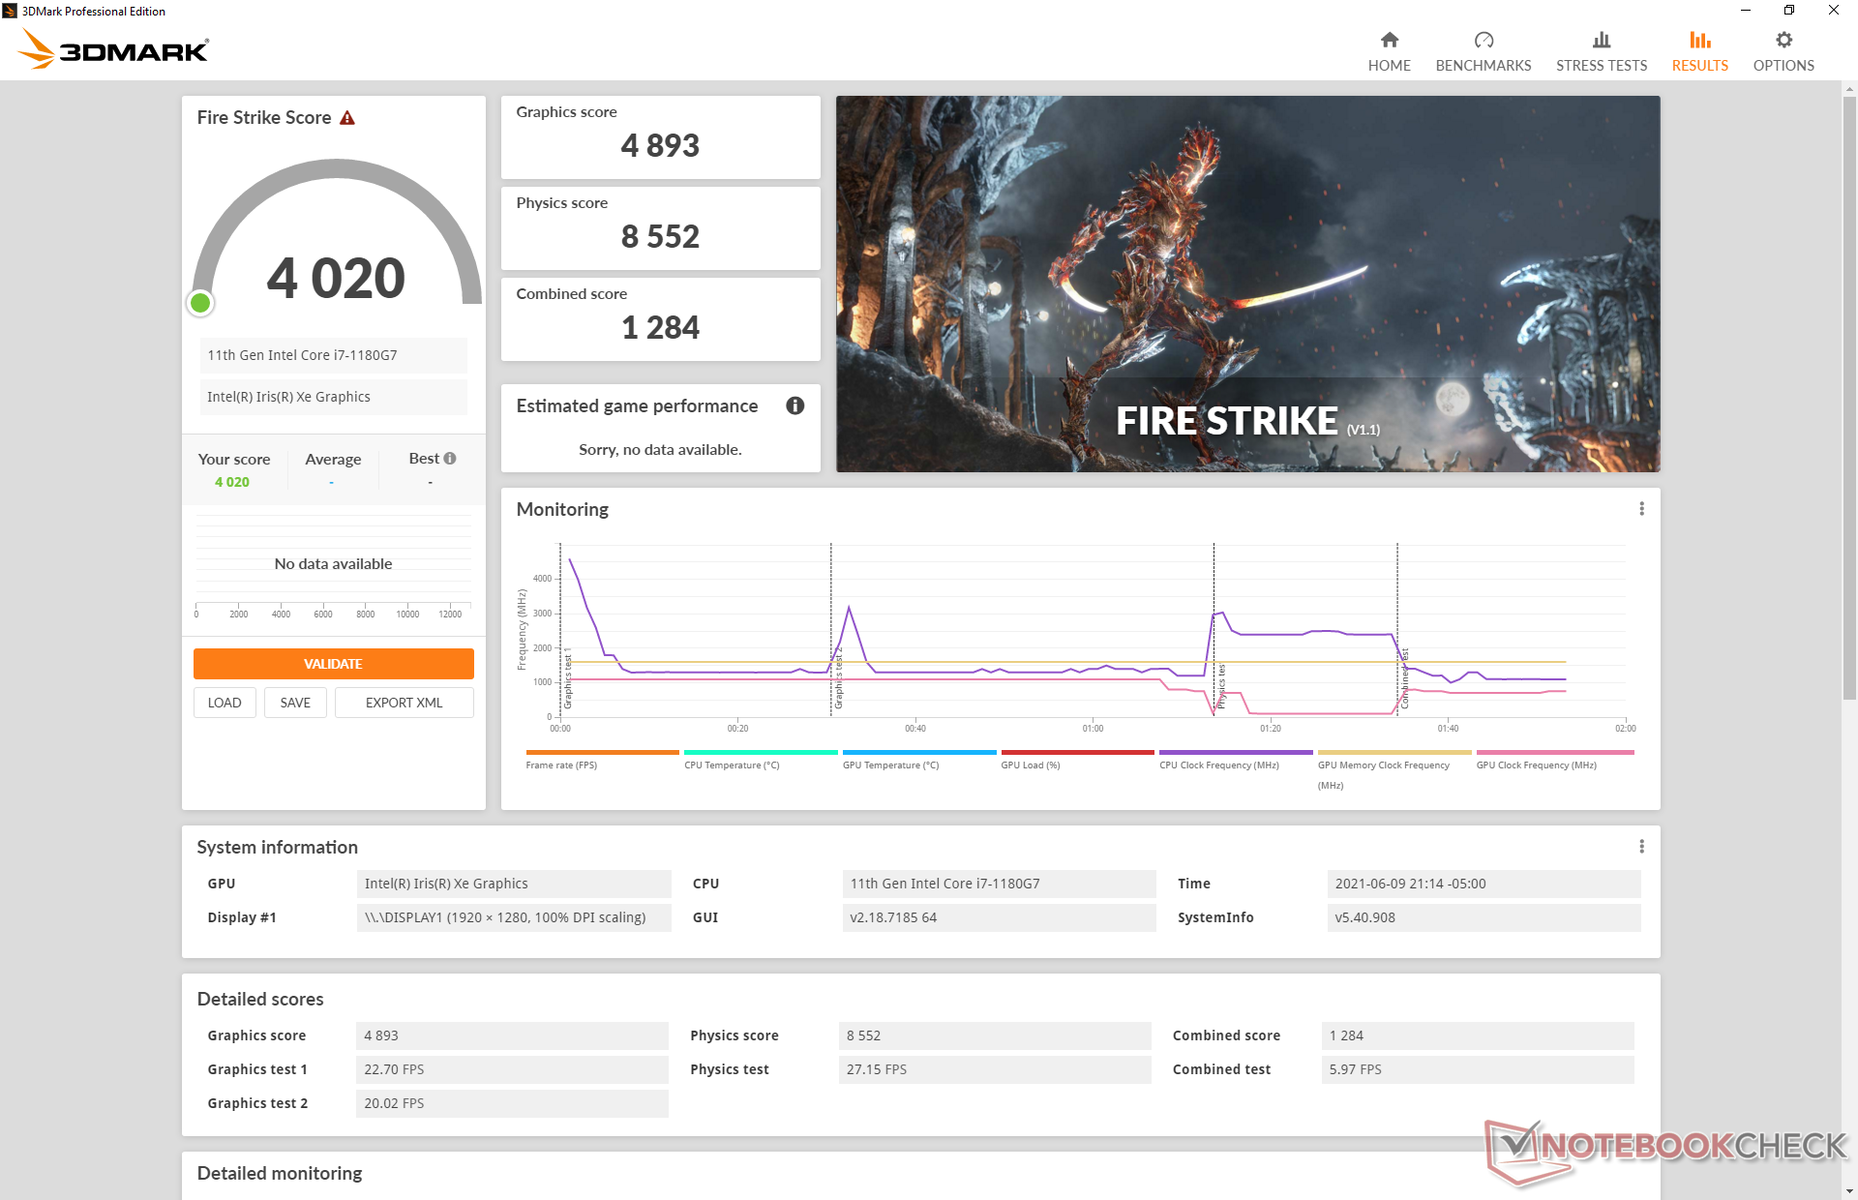
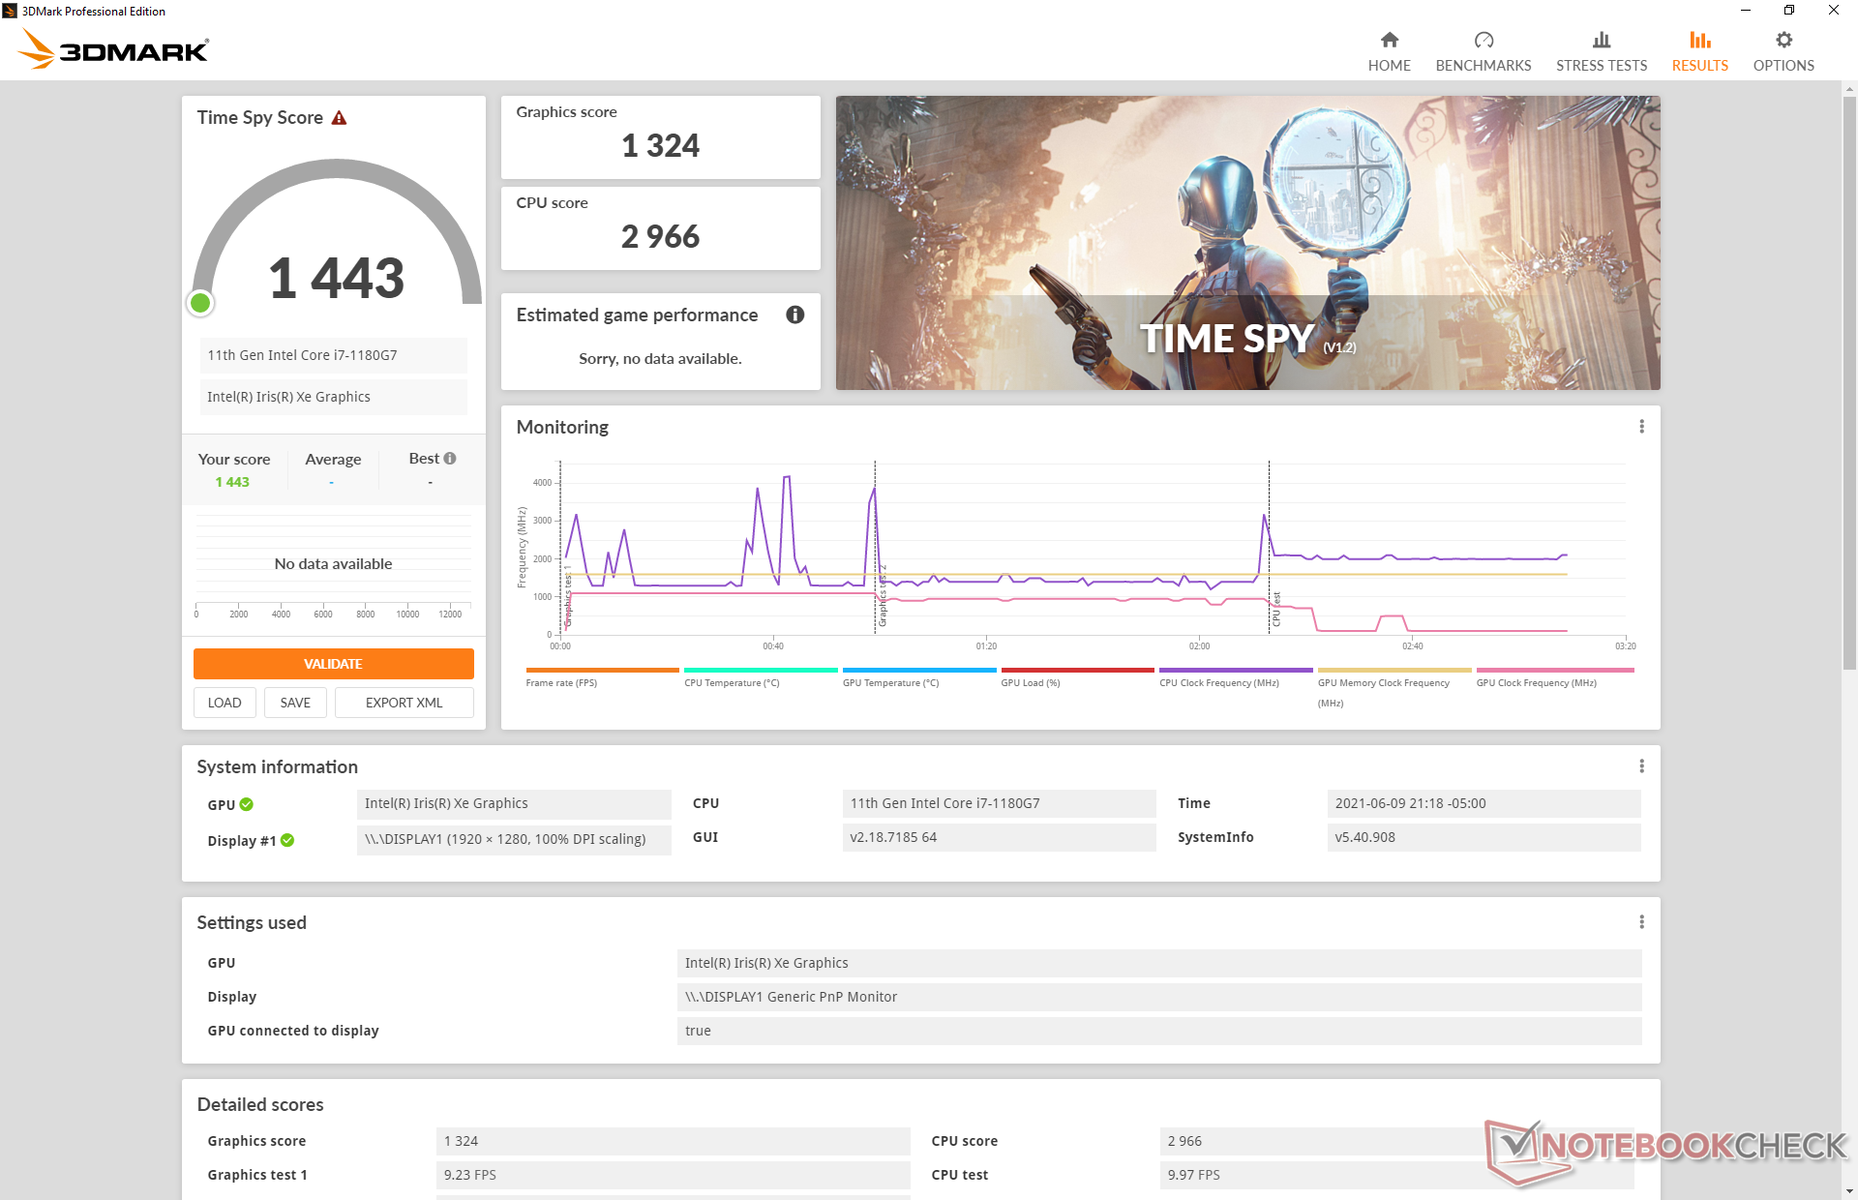
Le prestazioni grafiche sono eccellenti con risultati che sono solo leggermente dietro la media Iris Xe 96 EU nel nostro database, il che è prevedibile considerando la CPU Core i7-1180G7 più lenta. Gli utenti che passano da CPU Intel di vecchia generazione vedranno marcati miglioramenti rispetto al solito UHD Graphics o anche all'Iris Plus dell'anno scorso. La serie GeForce MX è ancora migliore e più consistente per il gaming, ma il gaming non è un focus per il Latitude.
Se avete intenzione di usare a giochi in rapido movimento come Rocket League o Fortnite, allora vi consigliamo di collegare un monitor esterno. Il display interno soffre di un notevole ghosting a causa dei suoi tempi di risposta lenti che hanno un impatto sull'esperienza visiva.
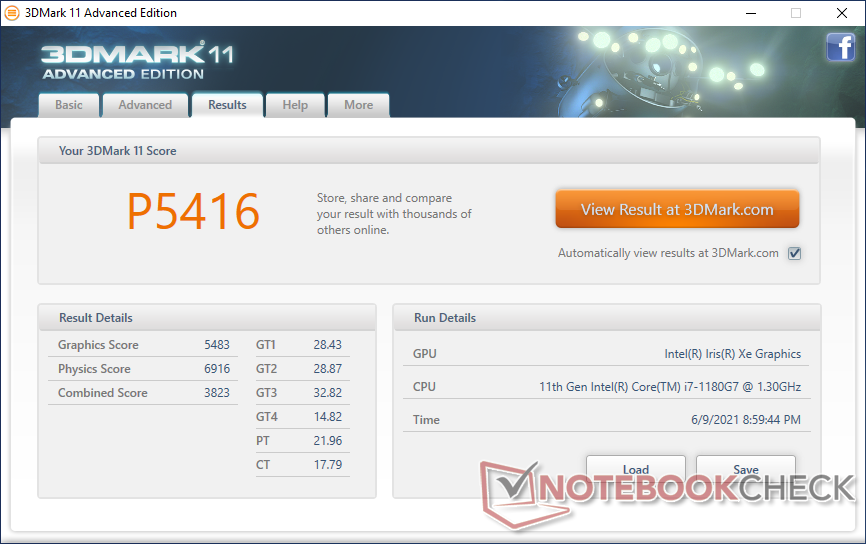
| 3DMark 11 Performance | 5416 punti | |
| 3DMark Cloud Gate Standard Score | 13812 punti | |
| 3DMark Fire Strike Score | 4020 punti | |
| 3DMark Time Spy Score | 1443 punti | |
Aiuto | ||
| basso | medio | alto | ultra | |
|---|---|---|---|---|
| GTA V (2015) | 64.1 | 58.2 | 21 | 9.75 |
| The Witcher 3 (2015) | 80.3 | 53.3 | 30.1 | 13.8 |
| Dota 2 Reborn (2015) | 76.9 | 50.9 | 36.8 | 35.1 |
| Final Fantasy XV Benchmark (2018) | 32.3 | 18.2 | 13.5 | |
| X-Plane 11.11 (2018) | 20.6 | 27.7 | 25.5 |
Emissioni
Rumorosità
Il rumore della ventola è più forte rispetto alla maggior parte dei tablets Windows, specialmente se volete sfruttare le elevate prestazioni grafiche del Latitude 7320 sganciabile. L'esecuzione di 3DMark 06 per soli 90 secondi è sufficiente per far salire il rumore della ventola a quasi 38 dB(A) mentre un gioco completo come The Witcher 3 causerà un rumore della ventola ancora più elevato arrivando a 42 dB(A). Questi livelli sono più tipici di un Ultrabook sotto carico che di un tablet, il che forse non è sorprendente dato che la GPU qui è potente quanto un portatile Core i7 Tiger Lake-U.
I proprietari possono limitare il rumore della ventola (e quindi le prestazioni) regolando le caratteristiche della ventola tramite Dell Power Manager. La maggior parte degli utenti vorrà rimanere in modalità ottimizzata o silenziosa per i carichi di lavoro di base come la navigazione web o lo streaming video.
Tenete a mente che le versioni Core i3 e Core i5 del Surface Pro 7 sono completamente silenziose mentre la versione Core i7 ha una ventola interna. Al contrario, tutte le versioni sganciabili del Latitude 7320 hanno una ventola interna.
| Dell Latitude 13 7320 Detachable, i7-1180G7 Iris Xe G7 96EUs, i7-1180G7, WDC PC SN530 SDBPMPZ-265G | Microsoft Surface Pro 7 Plus Iris Xe G7 80EUs, i5-1135G7, Samsung PM991 MZ9LQ256HBJQ | Lenovo ThinkPad X12 20UVS03G00 Iris Xe G7 96EUs, i7-1160G7, Toshiba BG4 KBG40ZNT512G | Dell XPS 13 7390 2-in-1 Core i7 Iris Plus Graphics G7 (Ice Lake 64 EU), i7-1065G7, Toshiba BG4 KBG40ZPZ512G | Lenovo Yoga Duet 7 13IML05-82AS000WGE UHD Graphics 620, i5-10210U, Lenovo UMIS RPJTJ256MEE1OWX | |
|---|---|---|---|---|---|
| Noise | 6% | -5% | 9% | ||
| off /ambiente * (dB) | 25.3 | 25.1 1% | 28.1 -11% | 25.4 -0% | |
| Idle Minimum * (dB) | 25.4 | 25.1 1% | 28.1 -11% | 25.4 -0% | |
| Idle Average * (dB) | 25.4 | 25.1 1% | 28.1 -11% | 25.4 -0% | |
| Idle Maximum * (dB) | 25.4 | 26 -2% | 28.1 -11% | 25.4 -0% | |
| Load Average * (dB) | 37.7 | 34.6 8% | 31.7 16% | 30 20% | |
| Witcher 3 ultra * (dB) | 42 | 34.6 18% | 43.4 -3% | ||
| Load Maximum * (dB) | 42.1 | 37 12% | 43.4 -3% | 27.5 35% |
* ... Meglio usare valori piccoli
Rumorosità
| Idle |
| 25.4 / 25.4 / 25.4 dB(A) |
| Sotto carico |
| 37.7 / 42.1 dB(A) |
 | ||
30 dB silenzioso 40 dB(A) udibile 50 dB(A) rumoroso |
||
min: | ||
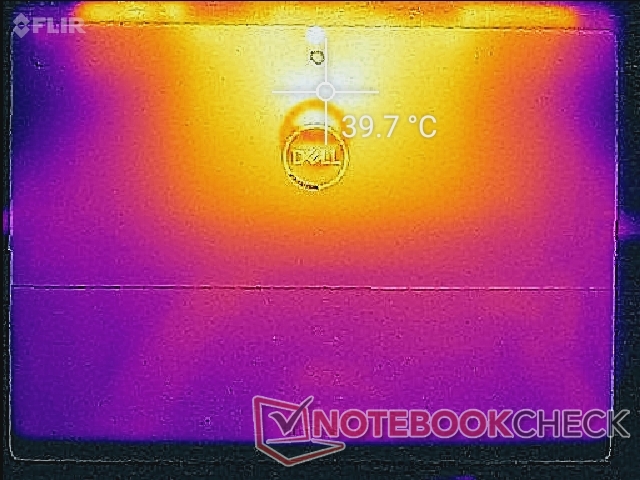
Temperature
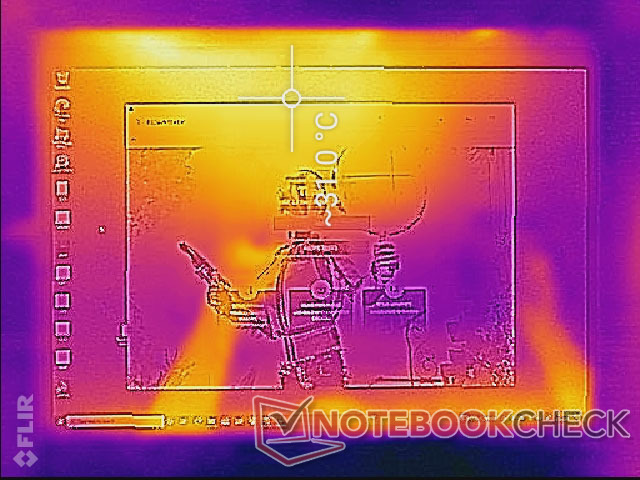
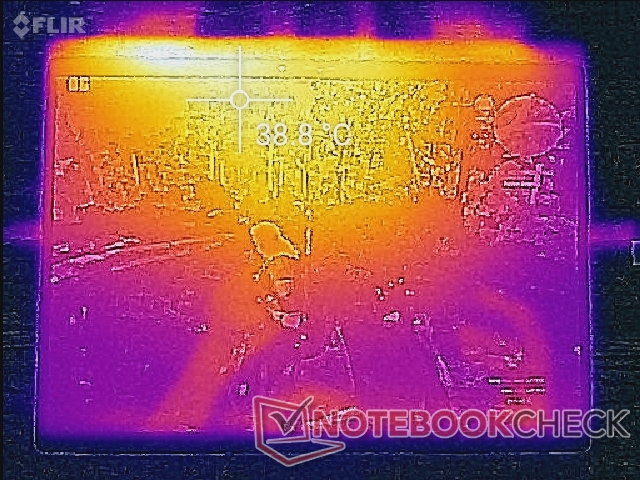
Lo sviluppo della temperatura delle superfici è in gran parte simmetrico con un punto caldo più vicino al centro in alto. Quando si eseguono carichi elevati come i giochi, l'hot point può arrivare a 40° C rispetto a 44° C o 45° C sul Surface Pro 7 o Yoga Duet 7.
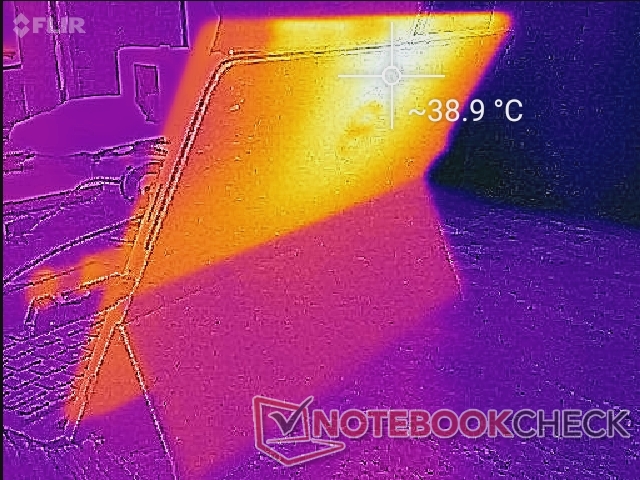
(+) La temperatura massima sul lato superiore è di 38.8 °C / 102 F, rispetto alla media di 35.4 °C / 96 F, che varia da 19.6 a 60 °C per questa classe Convertible.
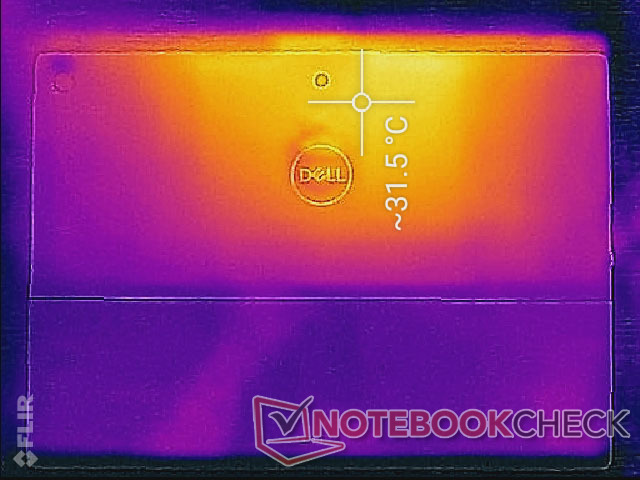
(±) Il lato inferiore si riscalda fino ad un massimo di 40 °C / 104 F, rispetto alla media di 36.9 °C / 98 F
(+) In idle, la temperatura media del lato superiore è di 29.6 °C / 85 F, rispetto alla media deld ispositivo di 30.3 °C / 87 F.
(+) I poggiapolsi e il touchpad sono piu' freddi della temperatura della pelle con un massimo di 29.4 °C / 84.9 F e sono quindi freddi al tatto.
(±) La temperatura media della zona del palmo della mano di dispositivi simili e'stata di 28 °C / 82.4 F (-1.4 °C / -2.5 F).
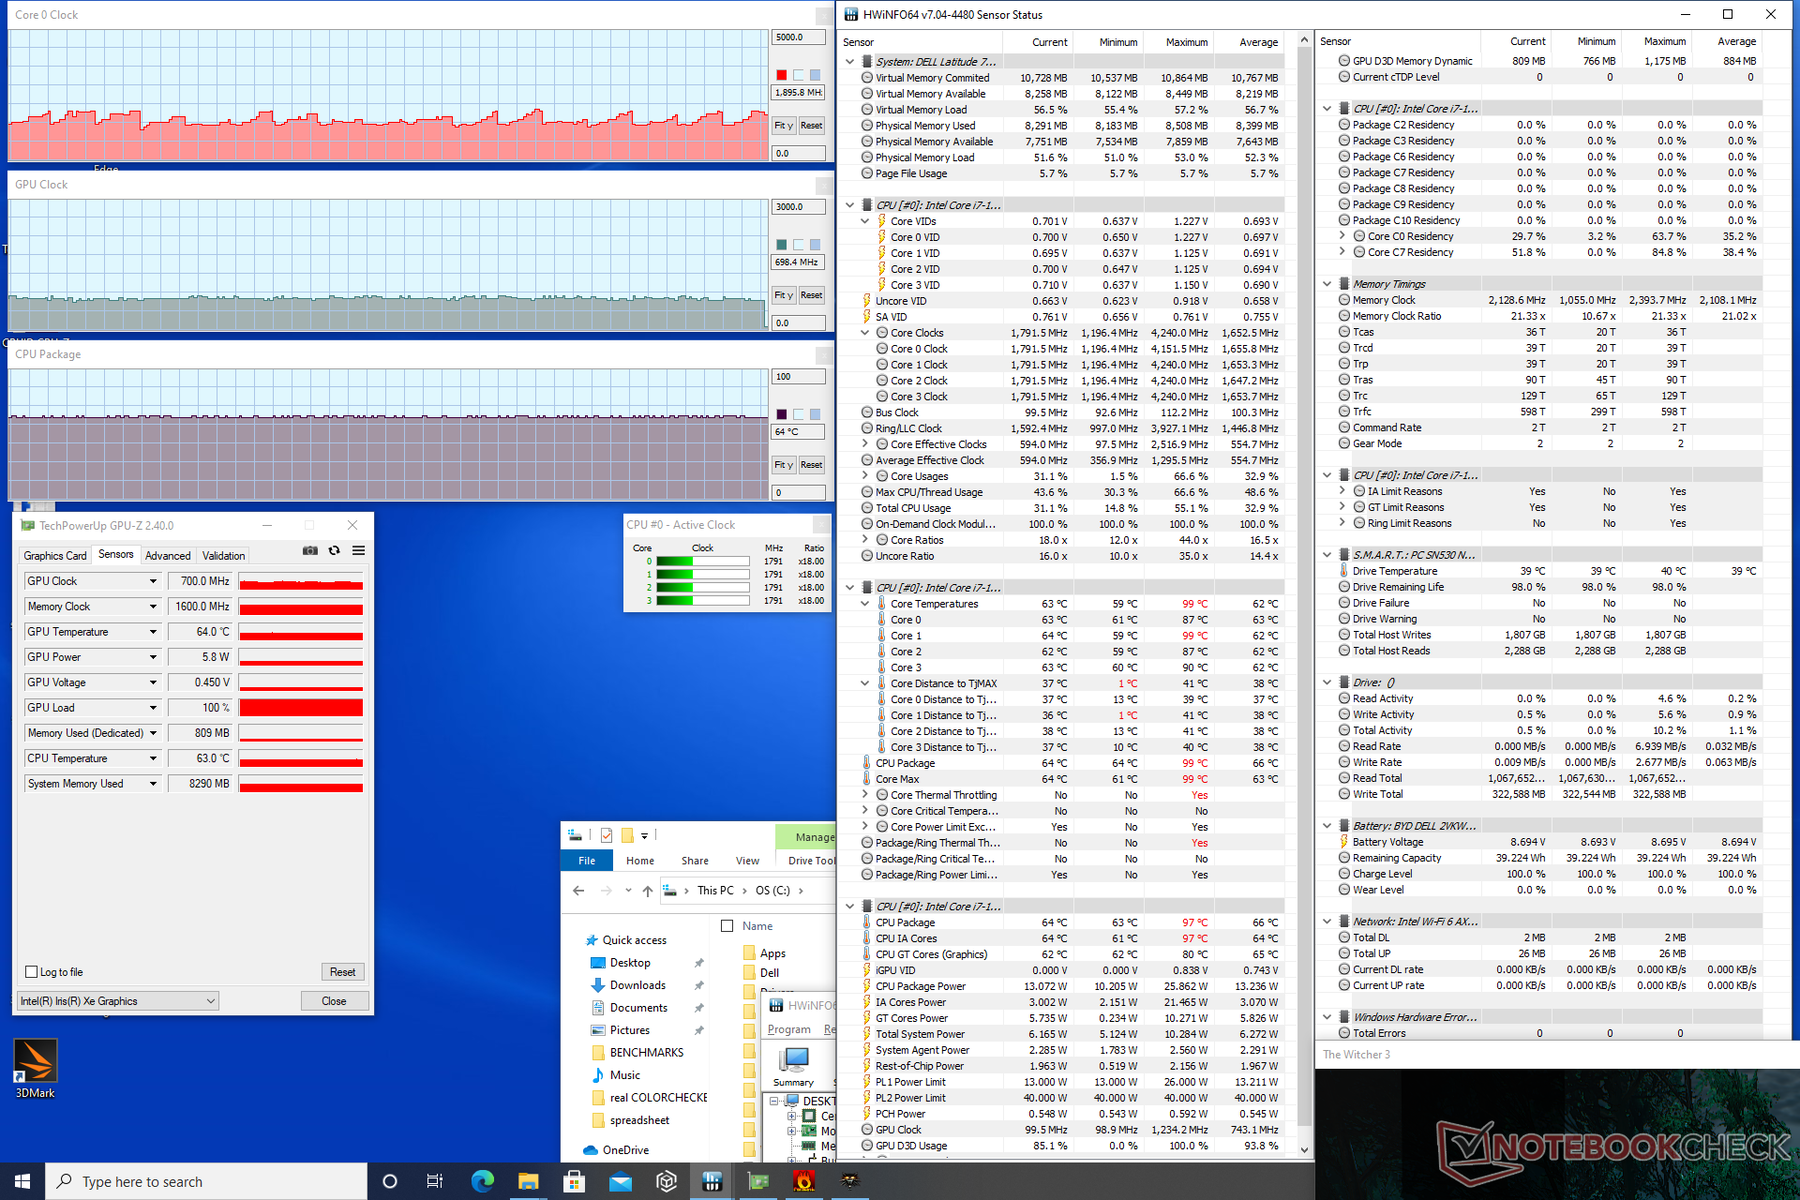
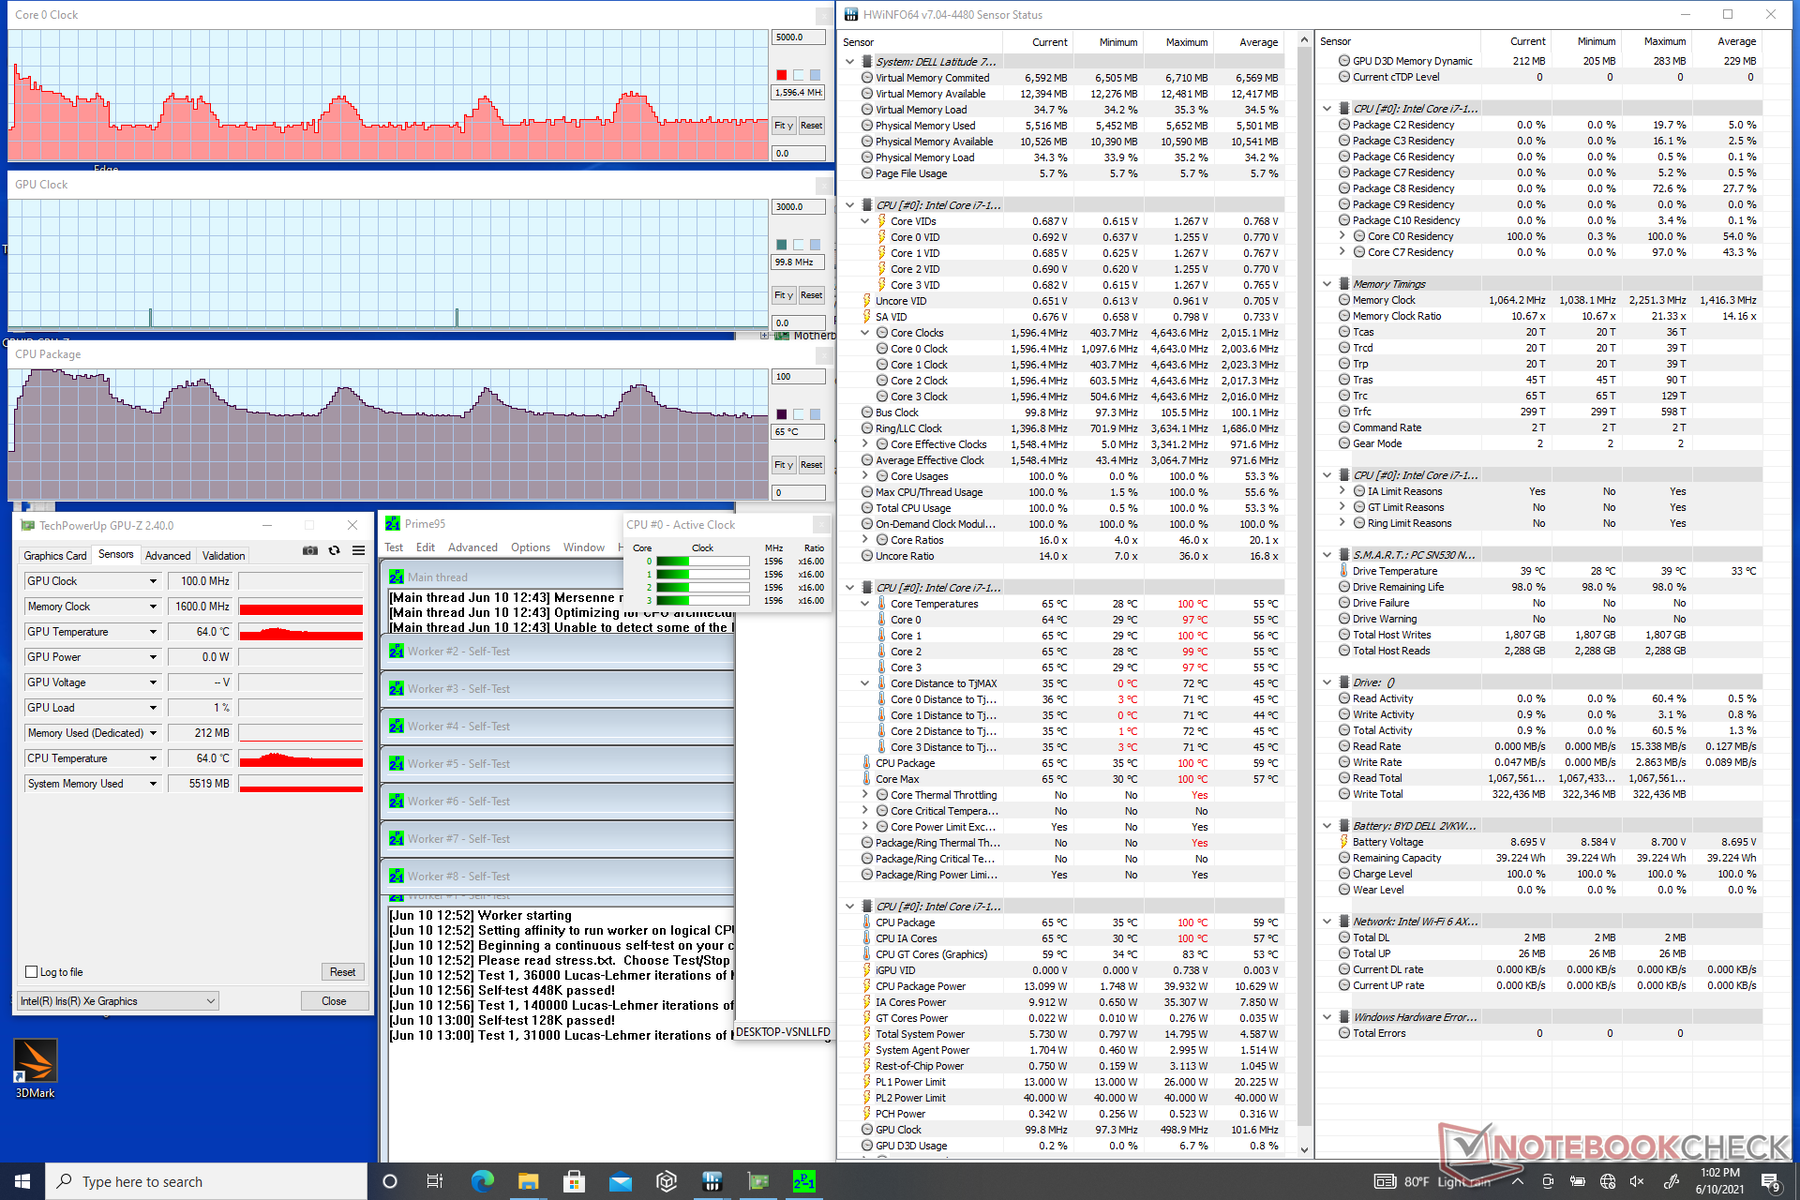
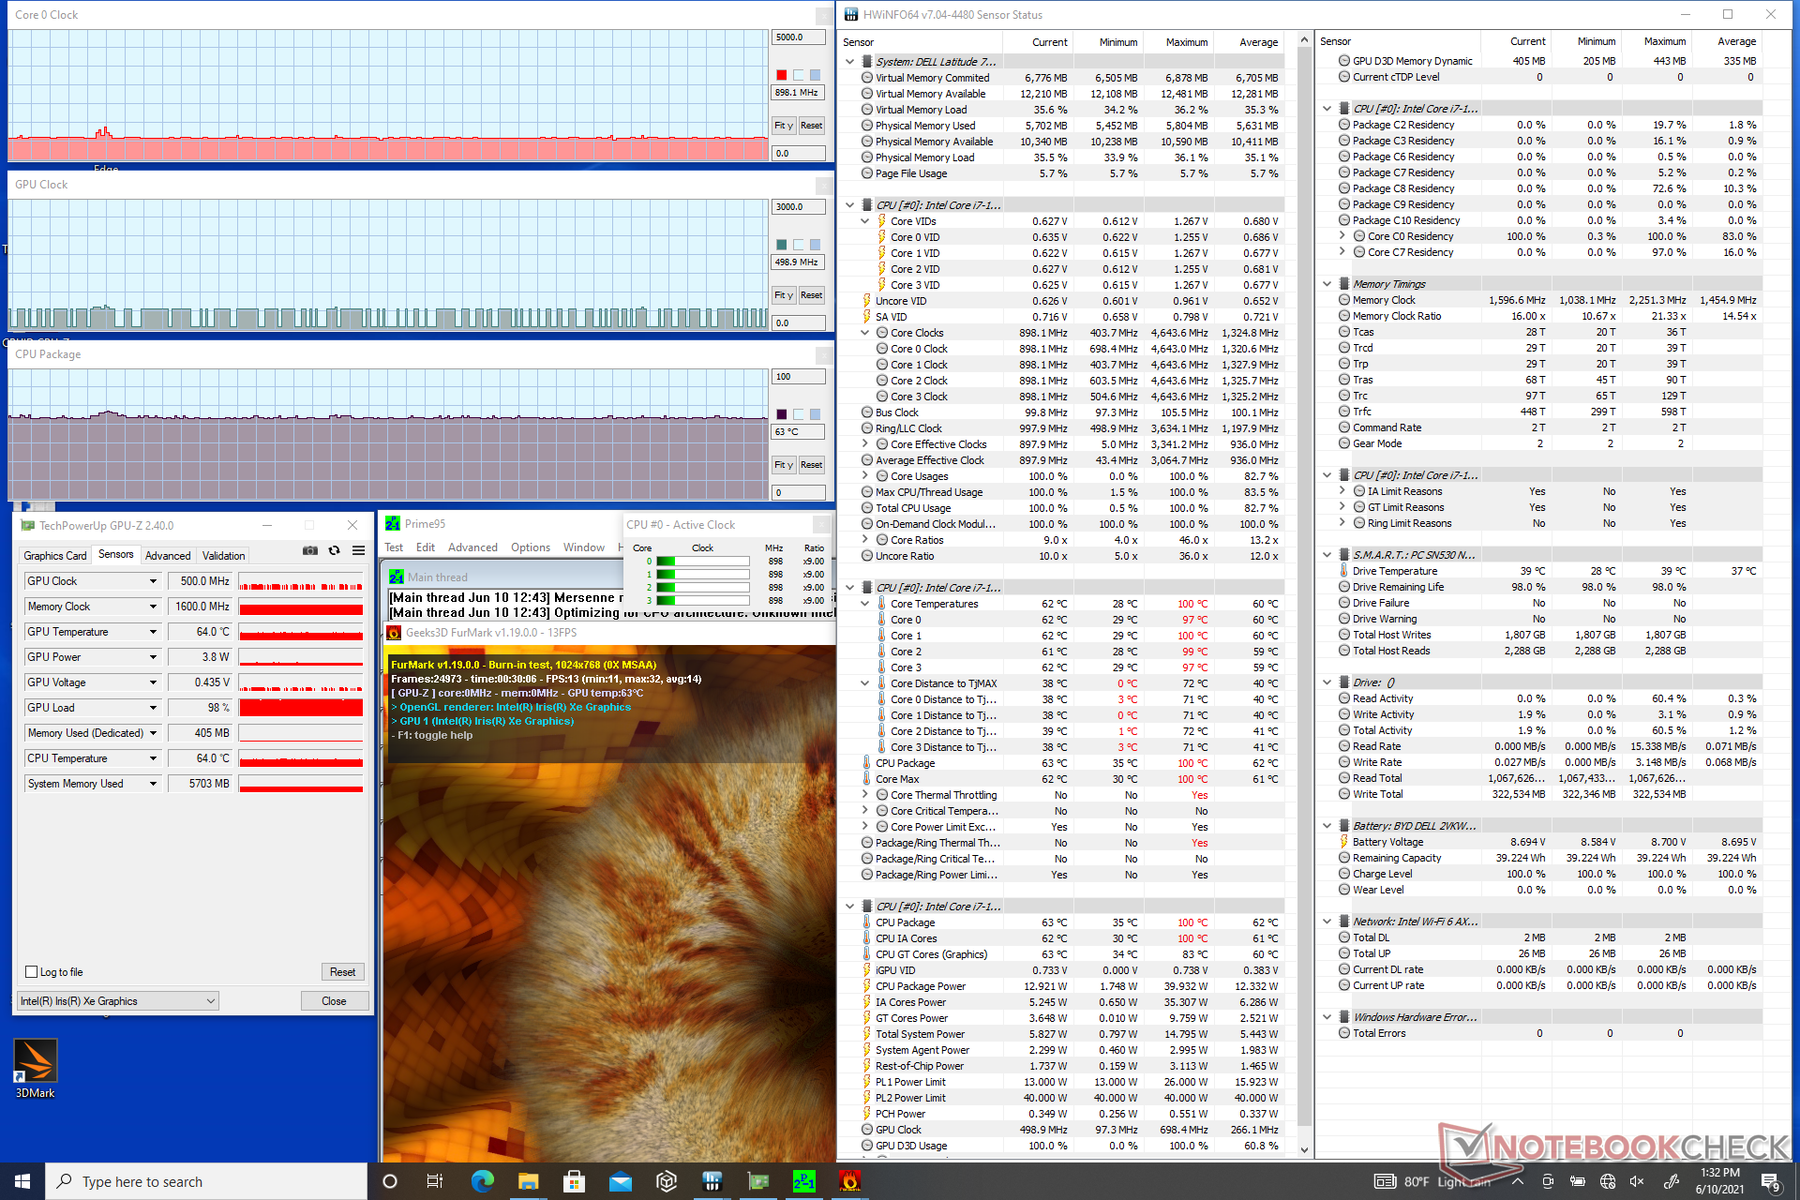
Stress Test
Quando si esegue Prime95 per stressare la CPU, la frequenza di clock saliva a 3,7 GHz solo per i primi uno o due secondi. La temperatura della CPU avrebbe infine raggiunto i 100° C pochi secondi dopo, accompagnata da un calo della frequenza di clock a 2,1 GHz. Dopo qualche altro minuto, le frequenze di clock della CPU e la temperatura avrebbero continuato ad oscillare indefinitamente tra 1,1 GHz e 2,5 GHz e tra 65° C e 87° C, rispettivamente.
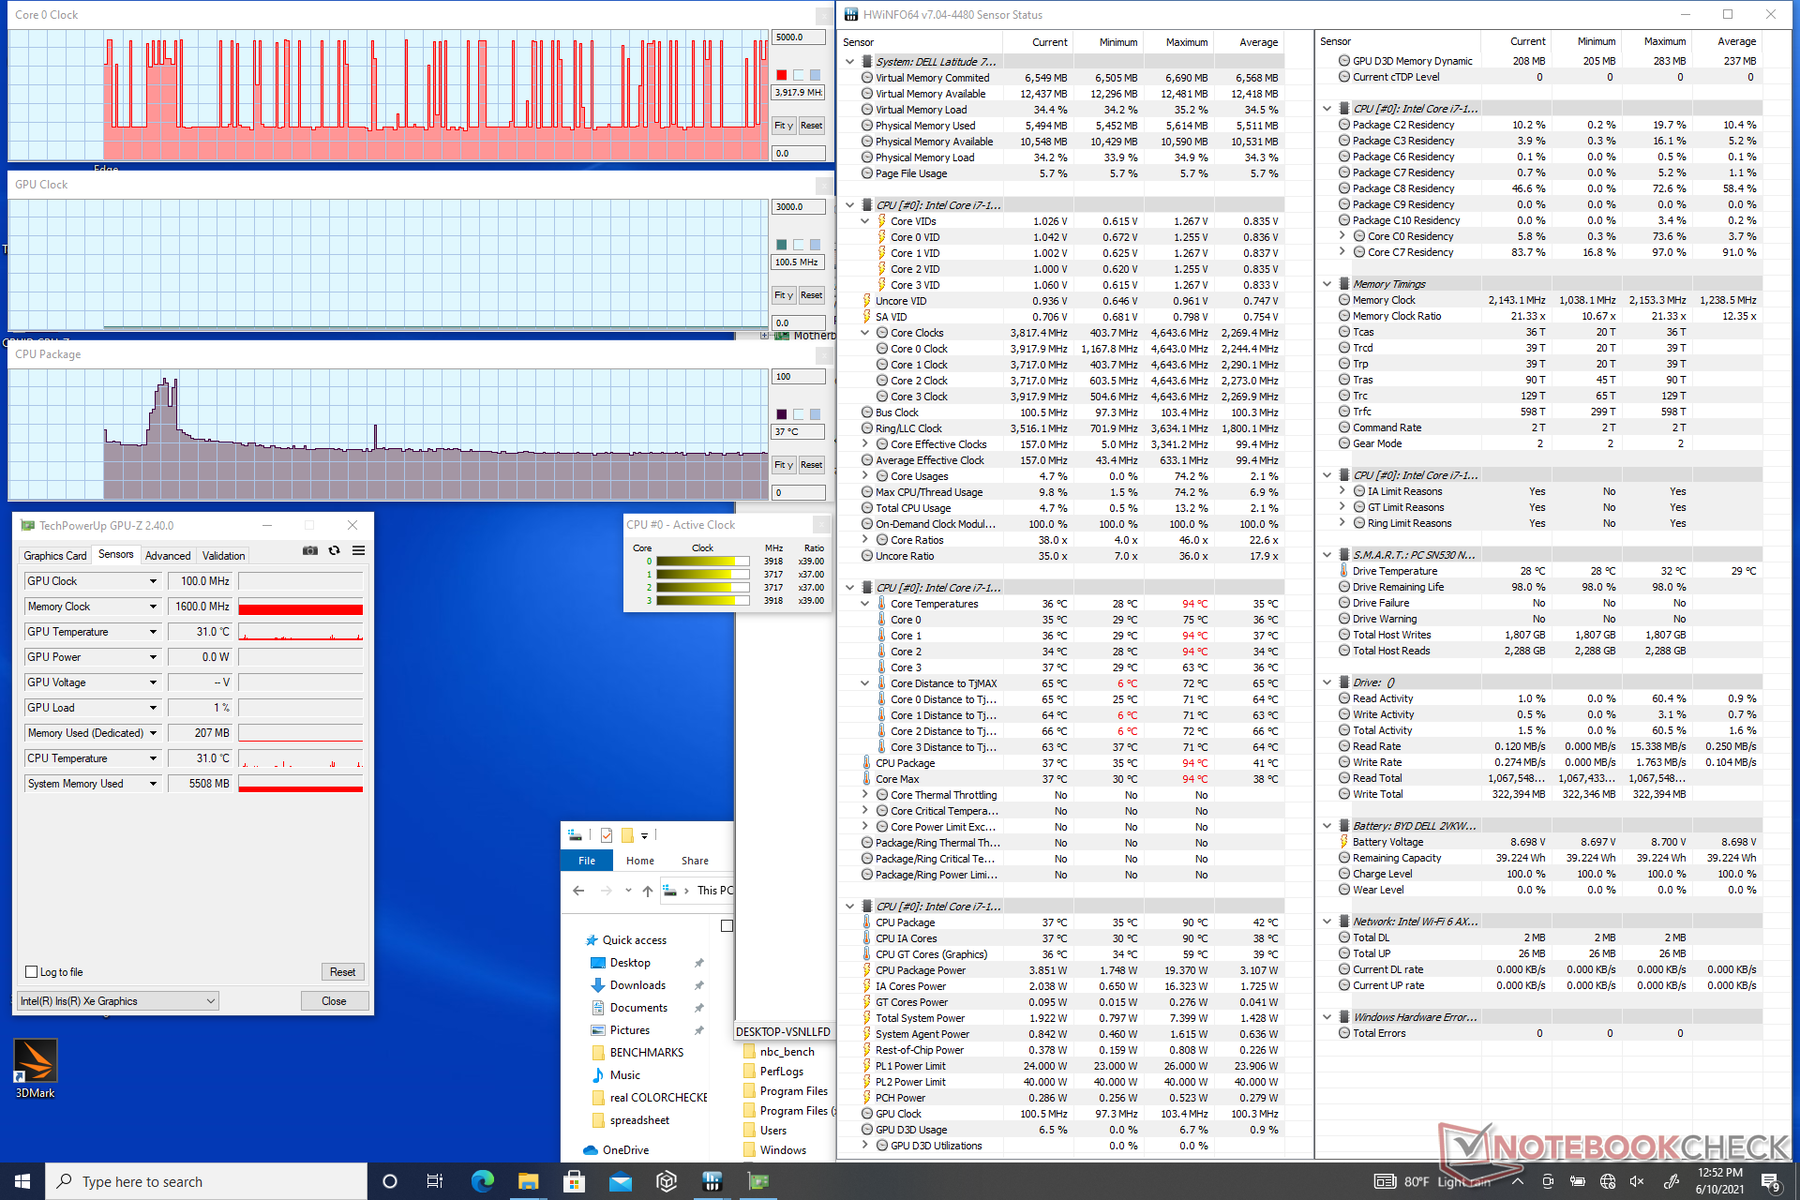
Quando si eseguono carichi elevati come i giochi, la temperatura della CPU si stabilizza a 64° C per essere molto più fredda che sul più lento Ice Lake-powered Latitude 7390 2-in-1 in condizioni simili.
L'utilizzo delle batterie limita le prestazioni grafiche. Un test 3DMark 11 a batteria restituisce punteggi Physics e Graphics di 8192 e 3805 punti, rispettivamente, rispetto a 6916 e 5483 punti quando è alimentato.
| Clock della CPU (GHz)Clock della GPU(MHz)TemperaturamediadellaCPU(°C) |
| Sistema inattivo |
| Prime95 Stress |
| Prime95 + FurMark Stress |
| Witcher 3 Stress |
Altoparlanti
La qualità audio è migliore del previsto. Mentre gli altoparlanti sui tablets tendono ad essere metallici, gli altoparlanti sul Latitude staccabile sono più equilibrati per essere più vicini agli altoparlanti di un Ultrabook.


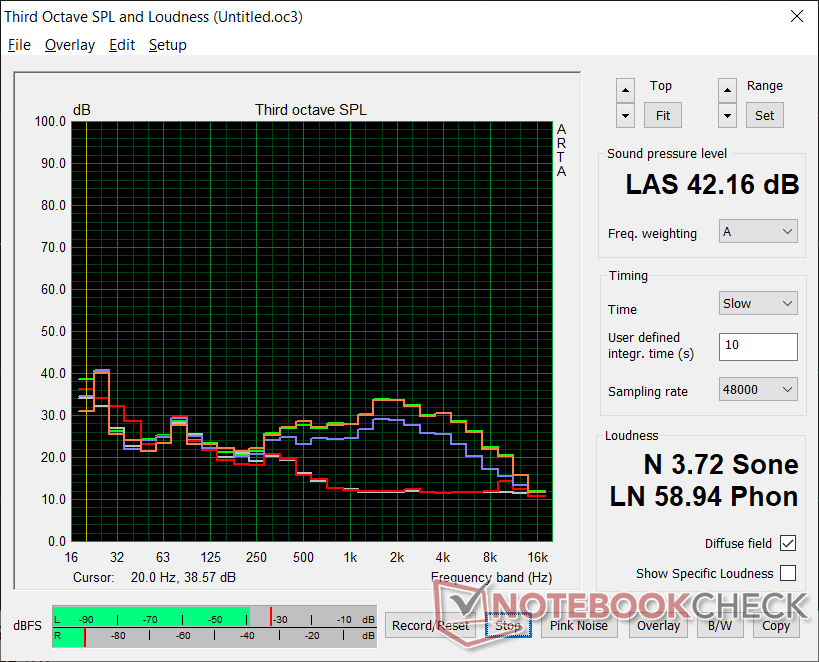
Dell Latitude 13 7320 Detachable, i7-1180G7 analisi audio
(±) | potenza degli altiparlanti media ma buona (77.7 dB)
Bassi 100 - 315 Hz
(±) | bassi ridotti - in media 11.6% inferiori alla media
(±) | la linearità dei bassi è media (11.7% delta rispetto alla precedente frequenza)
Medi 400 - 2000 Hz
(+) | medi bilanciati - solo only 2.7% rispetto alla media
(+) | medi lineari (4% delta rispetto alla precedente frequenza)
Alti 2 - 16 kHz
(+) | Alti bilanciati - appena 3.2% dalla media
(+) | alti lineari (5.2% delta rispetto alla precedente frequenza)
Nel complesso 100 - 16.000 Hz
(+) | suono nel complesso lineare (14% differenza dalla media)
Rispetto alla stessa classe
» 20% di tutti i dispositivi testati in questa classe è stato migliore, 4% simile, 76% peggiore
» Il migliore ha avuto un delta di 6%, medio di 20%, peggiore di 57%
Rispetto a tutti i dispositivi testati
» 16% di tutti i dispositivi testati in questa classe è stato migliore, 4% similare, 80% peggiore
» Il migliore ha avuto un delta di 4%, medio di 24%, peggiore di 134%
Apple MacBook 12 (Early 2016) 1.1 GHz analisi audio
(+) | gli altoparlanti sono relativamente potenti (83.6 dB)
Bassi 100 - 315 Hz
(±) | bassi ridotti - in media 11.3% inferiori alla media
(±) | la linearità dei bassi è media (14.2% delta rispetto alla precedente frequenza)
Medi 400 - 2000 Hz
(+) | medi bilanciati - solo only 2.4% rispetto alla media
(+) | medi lineari (5.5% delta rispetto alla precedente frequenza)
Alti 2 - 16 kHz
(+) | Alti bilanciati - appena 2% dalla media
(+) | alti lineari (4.5% delta rispetto alla precedente frequenza)
Nel complesso 100 - 16.000 Hz
(+) | suono nel complesso lineare (10.2% differenza dalla media)
Rispetto alla stessa classe
» 7% di tutti i dispositivi testati in questa classe è stato migliore, 2% simile, 91% peggiore
» Il migliore ha avuto un delta di 5%, medio di 18%, peggiore di 53%
Rispetto a tutti i dispositivi testati
» 5% di tutti i dispositivi testati in questa classe è stato migliore, 1% similare, 94% peggiore
» Il migliore ha avuto un delta di 4%, medio di 24%, peggiore di 134%
Gestione energetica — Elevata efficienza grazie ad Intel
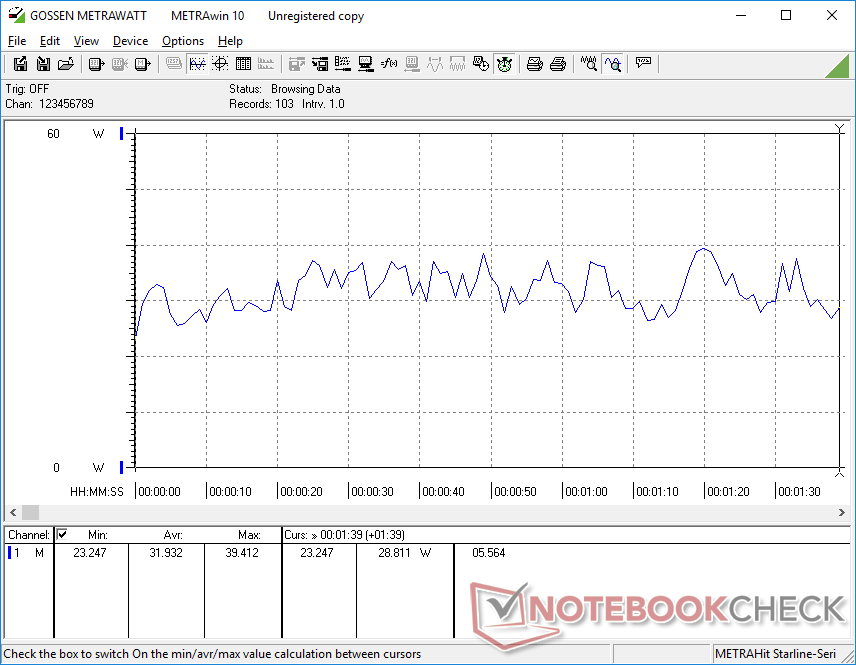
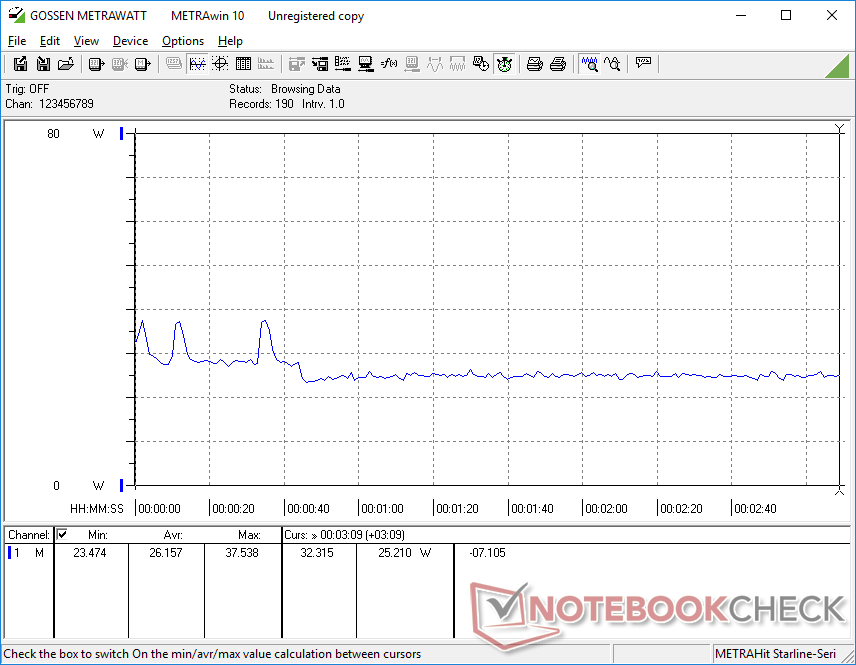
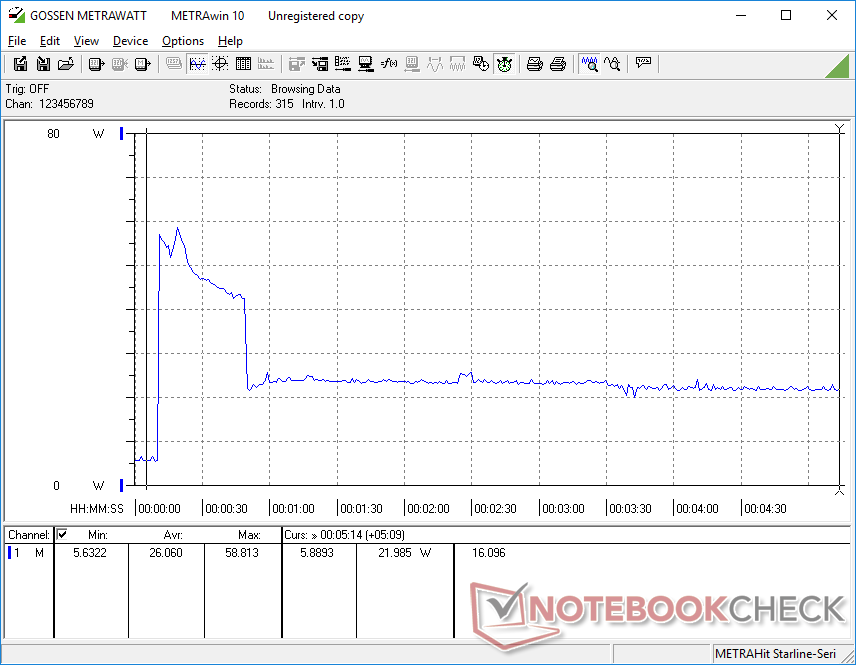
Consumo di energia
Da fermo sul desktop consuma tra i 2 W e i 6 W a seconda dell'impostazione della luminosità per essere più efficiente della maggior parte degli altri tablets Windows. Il Surface Pro 7 consuma quasi due volte più energia del nostro Dell in queste condizioni, nonostante il suo schermo più piccolo da 12,3".
Il consumo di energia quando si eseguono carichi elevati come i giochi è di circa 26 W a 32 W rispetto ai 43 W sul Latitude 7390 2-in-1. Impressionante, il nostro Latitude 7320 sganciabile assorbe il 30% in meno di energia pur fornendo dal 50% al 60% di prestazioni grafiche in più.
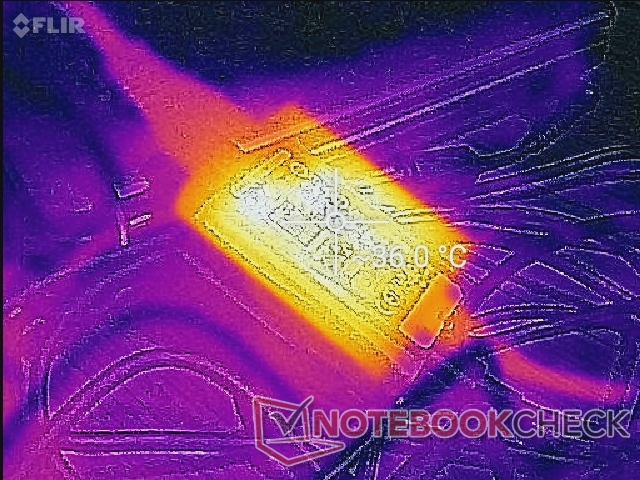
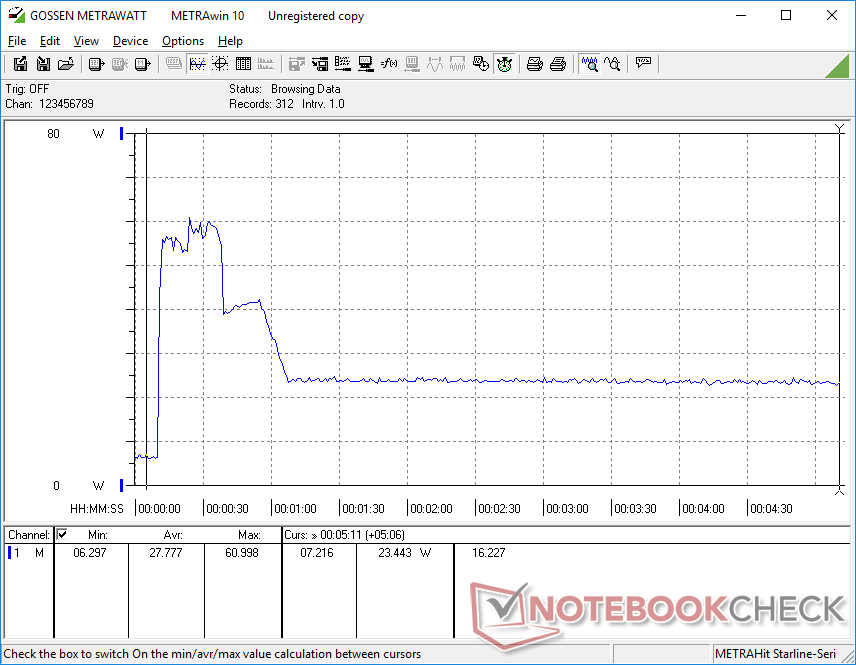
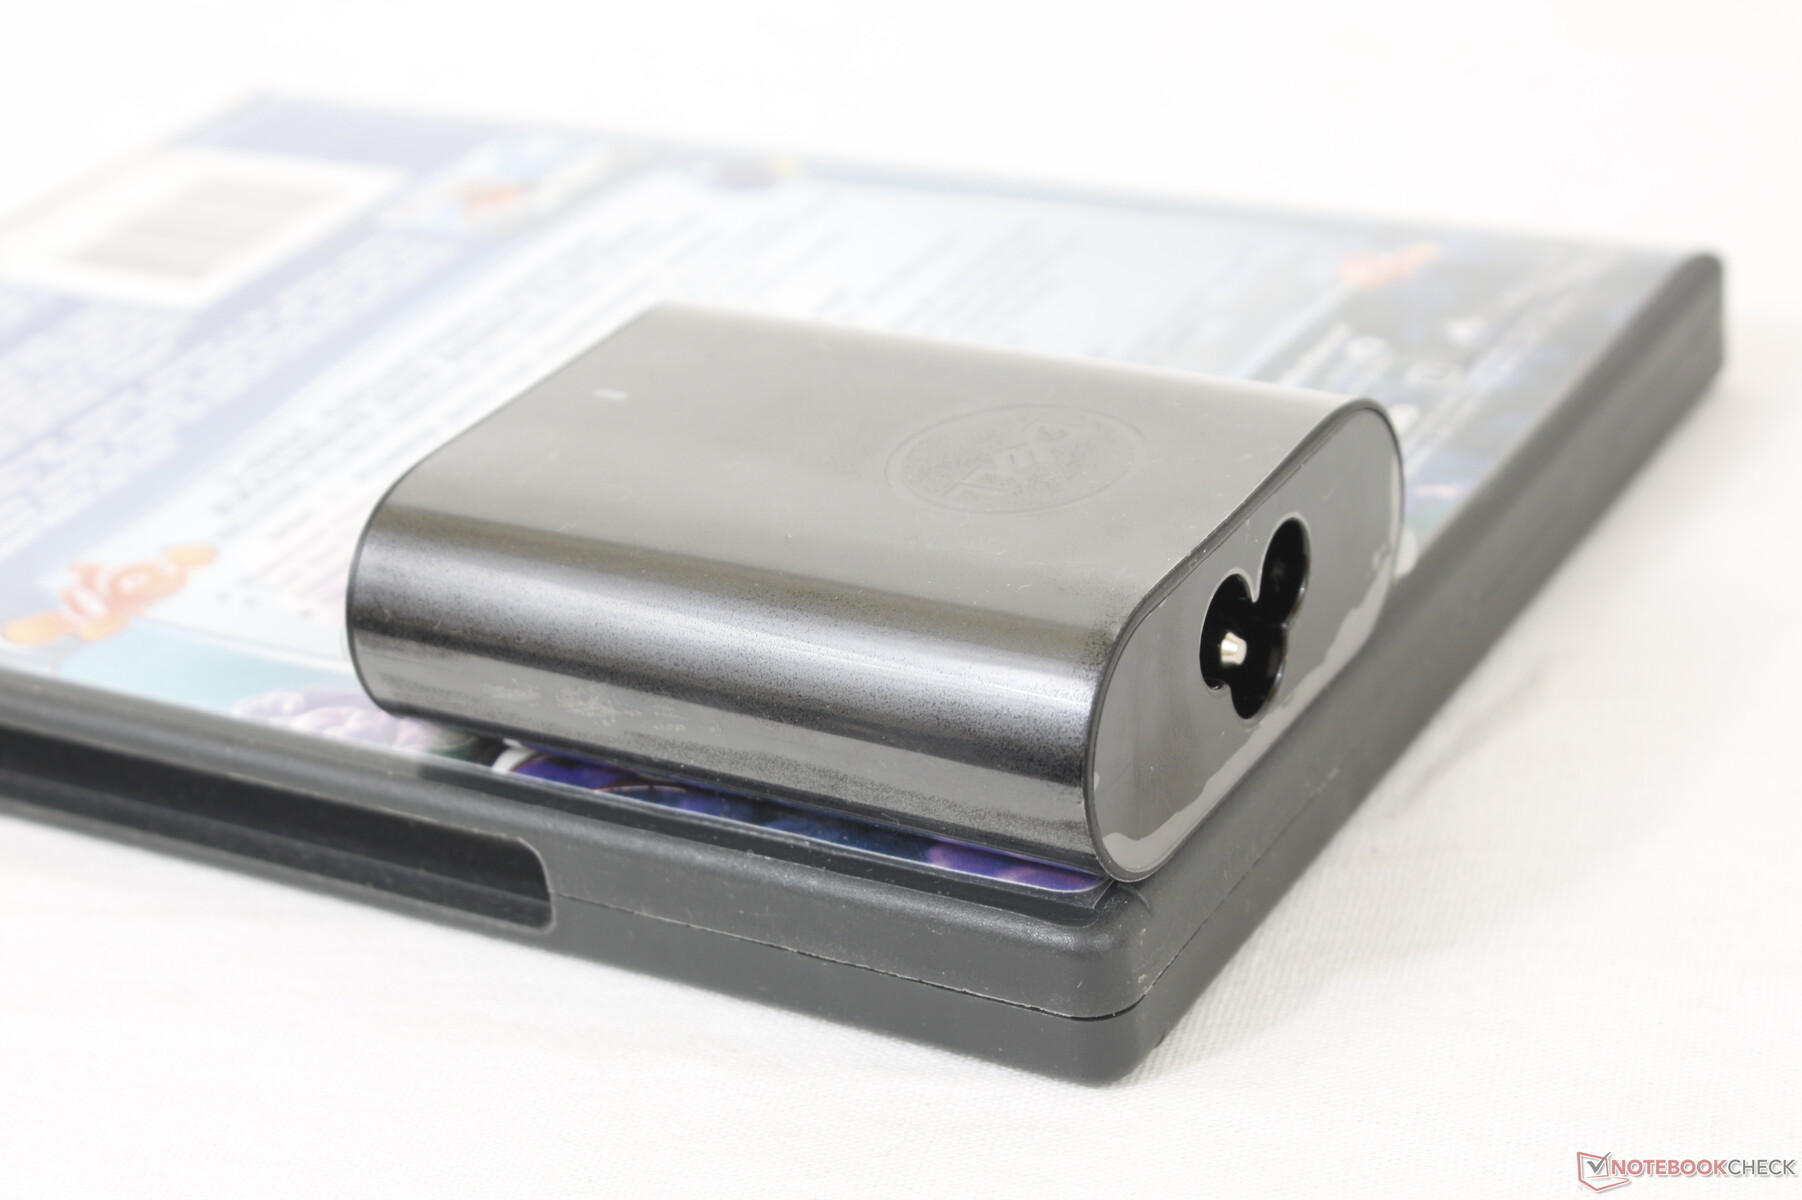
Siamo in grado di misurare un massimo di 61 W dal piccolo alimentatore (~6.5 x 5.5 x 2.2 cm) da 60 W quando la CPU è al 100% di utilizzo. Questo valore dura solo un paio di secondi a causa delle limitazioni termiche, proprio come quello che abbiamo osservato nella nostra sezione Stress Test sopra.
| Off / Standby | |
| Idle | |
| Sotto carico |
|
Leggenda:
min: | |
| Dell Latitude 13 7320 Detachable, i7-1180G7 i7-1180G7, Iris Xe G7 96EUs, WDC PC SN530 SDBPMPZ-265G, IPS, 1920x1280, 13" | Microsoft Surface Pro 7 Plus i5-1135G7, Iris Xe G7 80EUs, Samsung PM991 MZ9LQ256HBJQ, IPS, 2736x1824, 12.3" | Lenovo ThinkPad X12 20UVS03G00 i7-1160G7, Iris Xe G7 96EUs, Toshiba BG4 KBG40ZNT512G, a-Si IPS LED, 1920x1280, 12.3" | Dell XPS 13 7390 2-in-1 Core i7 i7-1065G7, Iris Plus Graphics G7 (Ice Lake 64 EU), Toshiba BG4 KBG40ZPZ512G, IPS, 1920x1200, 13.4" | Lenovo Yoga Duet 7 13IML05-82AS000WGE i5-10210U, UHD Graphics 620, Lenovo UMIS RPJTJ256MEE1OWX, IPS, 2160x1350, 13" | |
|---|---|---|---|---|---|
| Power Consumption | -63% | -22% | -19% | 2% | |
| Idle Minimum * (Watt) | 2.5 | 5.5 -120% | 4 -60% | 2.6 -4% | 3.1 -24% |
| Idle Average * (Watt) | 4.8 | 9.1 -90% | 5.9 -23% | 5.3 -10% | 5.7 -19% |
| Idle Maximum * (Watt) | 6 | 10.8 -80% | 8.3 -38% | 7 -17% | 8.7 -45% |
| Load Average * (Watt) | 31.9 | 39.2 -23% | 30.1 6% | 43.1 -35% | 20.5 36% |
| Witcher 3 ultra * (Watt) | 26.2 | 30.8 -18% | 43.1 -65% | ||
| Load Maximum * (Watt) | 61 | 62.5 -2% | 59 3% | 49 20% | 22.6 63% |
* ... Meglio usare valori piccoli
Durata della batteria - Batteria piccola, lunga durata
L'autonomia è superiore rispetto a molti altri tablets Windows anche dopo aver calcolato la piccola batteria da 40 Wh. Infatti, siamo in grado di registrare poco più di 11 ore di uso reale WLAN per essere 3 ore in più rispetto al Surface Pro 7 Plus.
La ricarica da vuoto a pieno regime richiede due ore complete o circa mezz'ora in più rispetto alla maggior parte degli Ultrabooks.
| Dell Latitude 13 7320 Detachable, i7-1180G7 i7-1180G7, Iris Xe G7 96EUs, 40 Wh | Microsoft Surface Pro 7 Plus i5-1135G7, Iris Xe G7 80EUs, 48.9 Wh | Lenovo ThinkPad X12 20UVS03G00 i7-1160G7, Iris Xe G7 96EUs, 42 Wh | Dell XPS 13 7390 2-in-1 Core i7 i7-1065G7, Iris Plus Graphics G7 (Ice Lake 64 EU), 51 Wh | Lenovo Yoga Duet 7 13IML05-82AS000WGE i5-10210U, UHD Graphics 620, 39 Wh | |
|---|---|---|---|---|---|
| Autonomia della batteria | 12% | -15% | -18% | -24% | |
| Reader / Idle (h) | 17.7 | 13.6 -23% | 12.8 -28% | ||
| WiFi v1.3 (h) | 11 | 8.1 -26% | 8.2 -25% | 9 -18% | 8.7 -21% |
| Load (h) | 2.1 | 3.9 86% | 2 -5% | 1.6 -24% |
Pro
Contro
Valutazione complessiva Dell Latitude 13 7320 - Design minimalista, massima produttività
Se state cercando un tablet Windows senza dovervi accontentare di un Microsoft Surface Pro, allora vale la pena considerare il Dell Latitude 13 7320 staccabile. Il suo principale punto di forza è lo schermo più grande e luminoso da 13" rispetto ai soli 12,3" del Surface Pro 7, pur essendo quasi identico nelle dimensioni complessive. Il modello Dell beneficia di una maggiore efficienza energetica e di una maggiore durata della batteria per essere migliore per i viaggi. Gli utenti dell'ufficio apprezzeranno le sue due porte Thunderbolt 4 che sicuramente torneranno utili per scopi di docking, mentre la maggior parte degli altri tablets sono in genere dotati di una sola porta USB-C.
Il miglior dispositivo sganciabile Windows realizzato da Dell finora. Le cornici strette, il luminoso touchscreen da 500 nit e le doppie porte Thunderbolt 4 aiutano a distinguere il Latitude 13 7320 da altri tablet Windows.
I potenziali acquirenti dovrebbero essere consapevoli del rumore relativamente forte della ventola quando si eseguono carichi impegnativi e che le prestazioni pure della CPU del Core i7-1180G7 sono solo leggermente inferiori al Core i5-1135G7. I nuovi proprietari dovrebbero anche controllare la rigidità del cavalletto per assicurarsi che non sia allentato. Il Latitude 13 7320 staccabile è notevolmente più costoso del Surface Pro 7, ma è dotato di molte più caratteristiche sia all'interno che all'esterno per aiutare a compensare la differenza.
Prezzo e disponibilità
Dell Latitude 13 7320 Detachable, i7-1180G7
- 06/13/2021 v7 (old)
Allen Ngo
Price comparison
