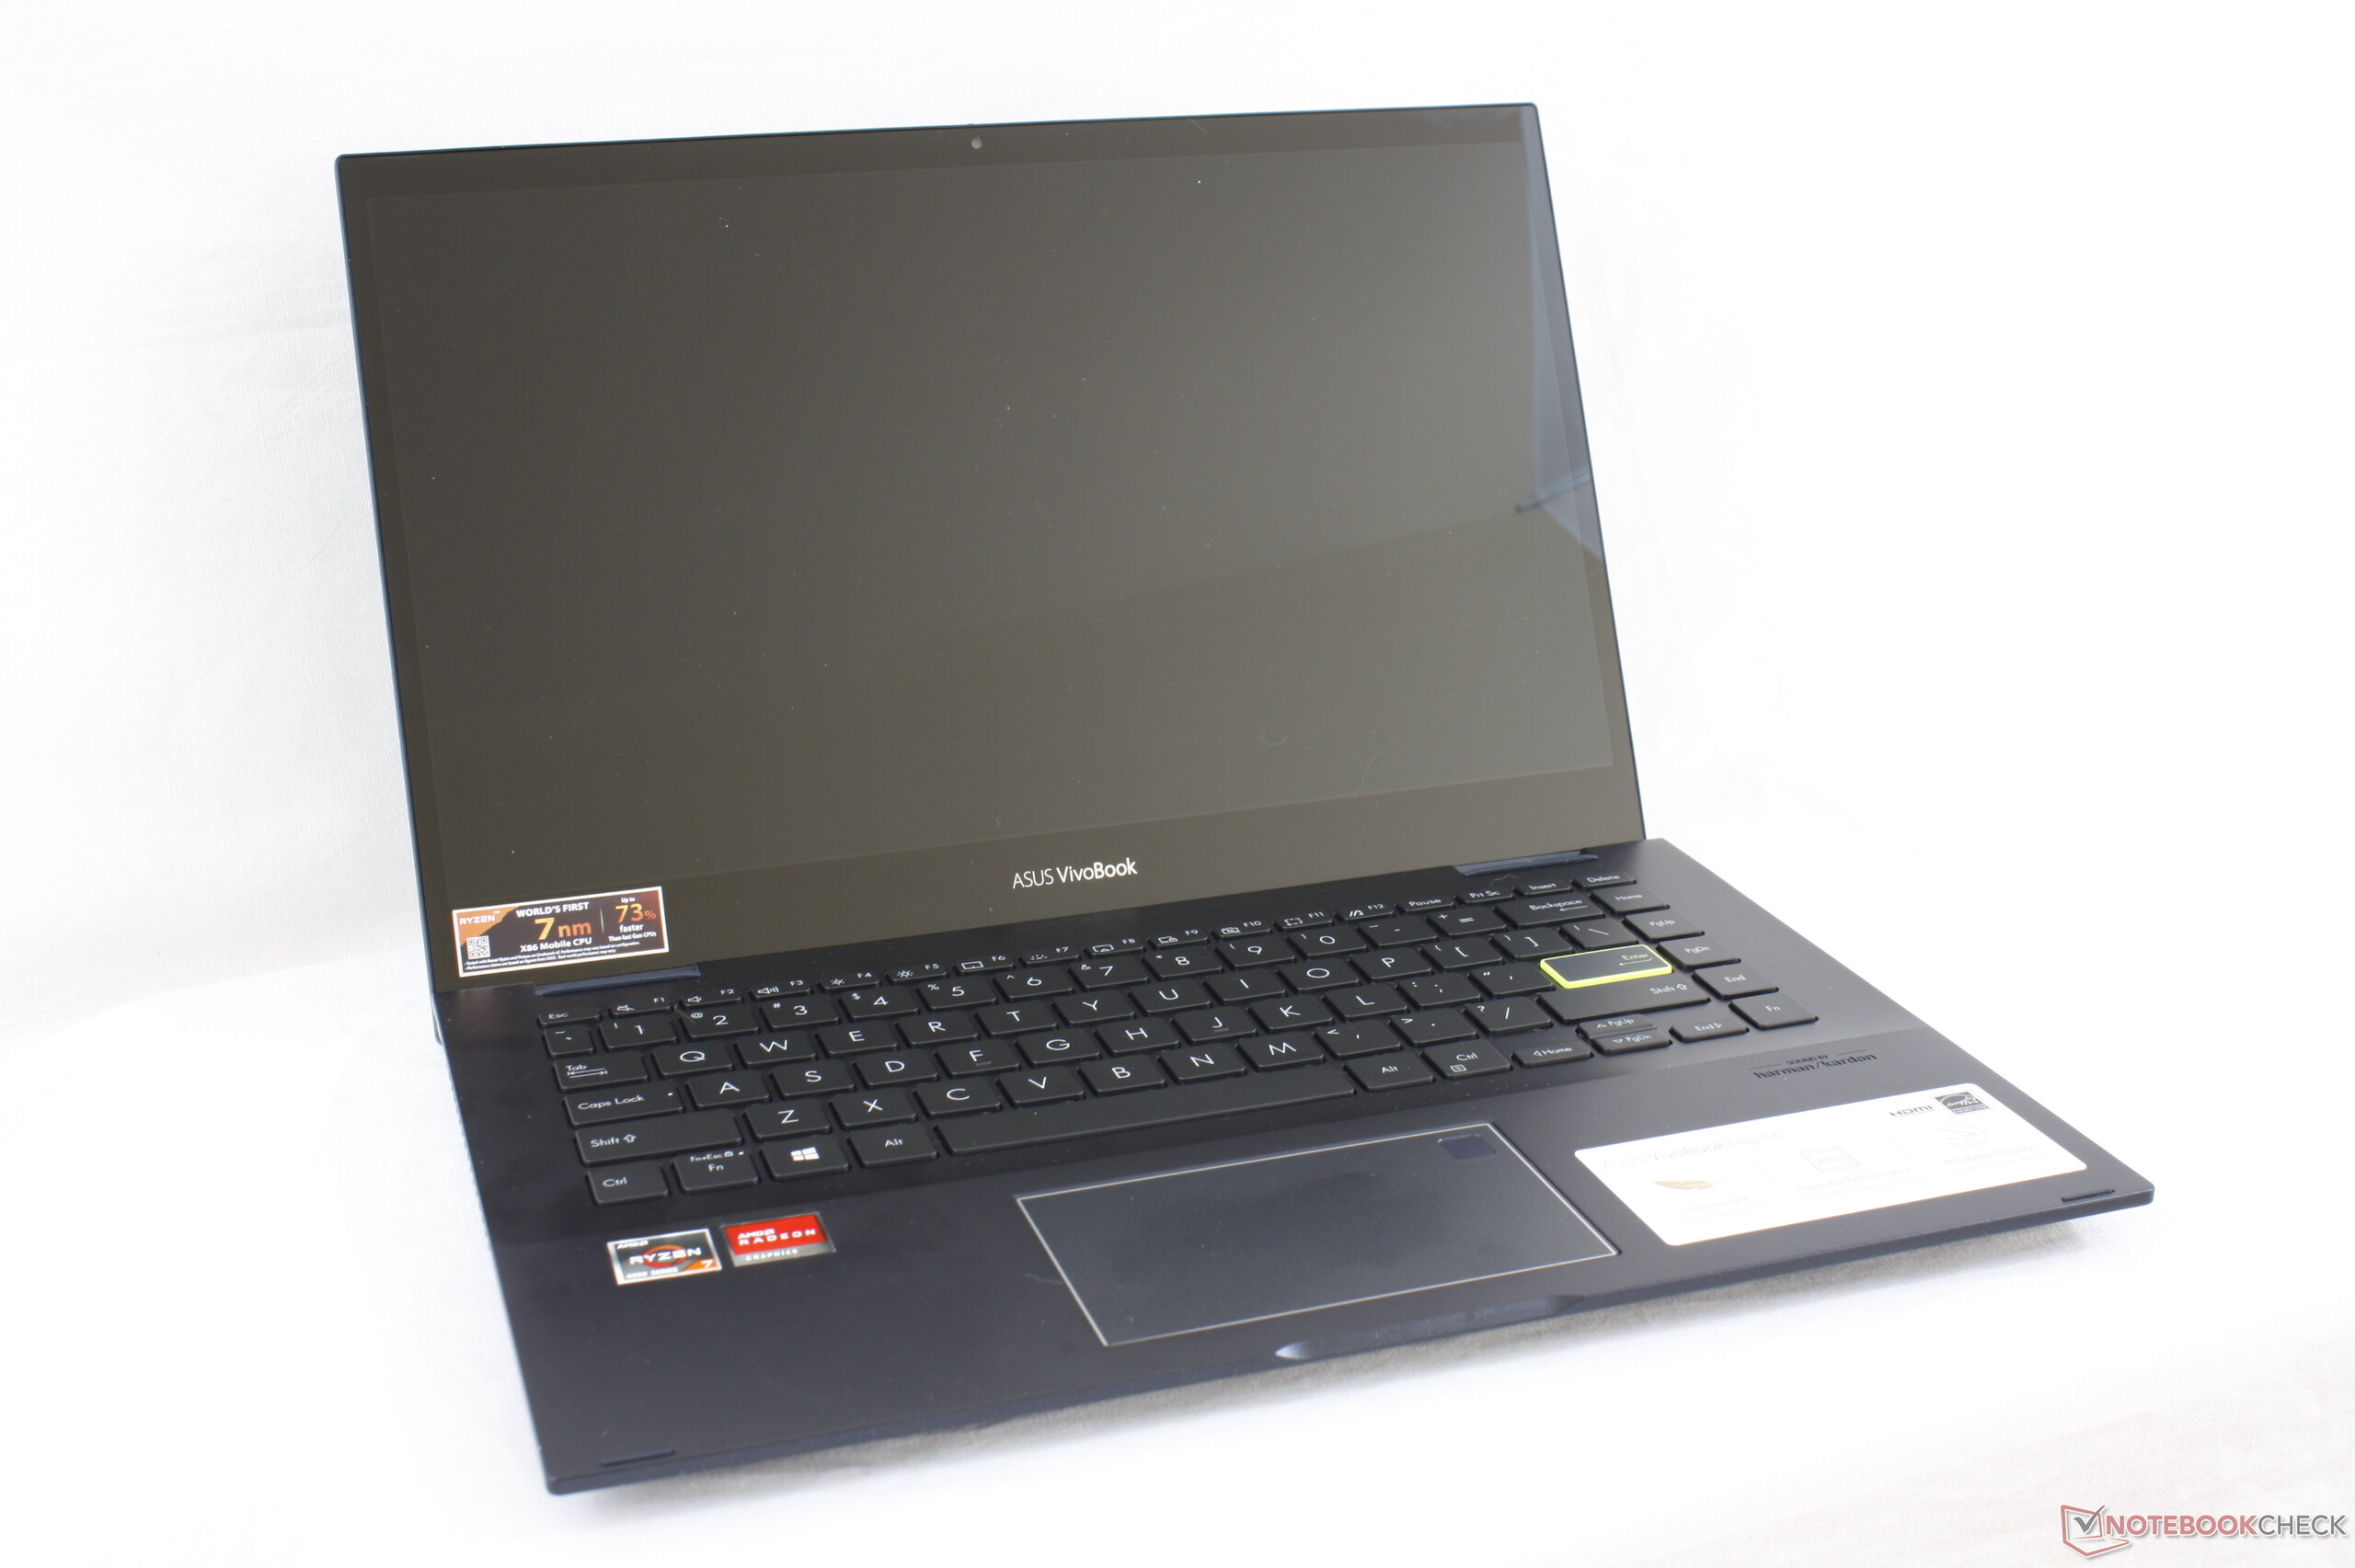
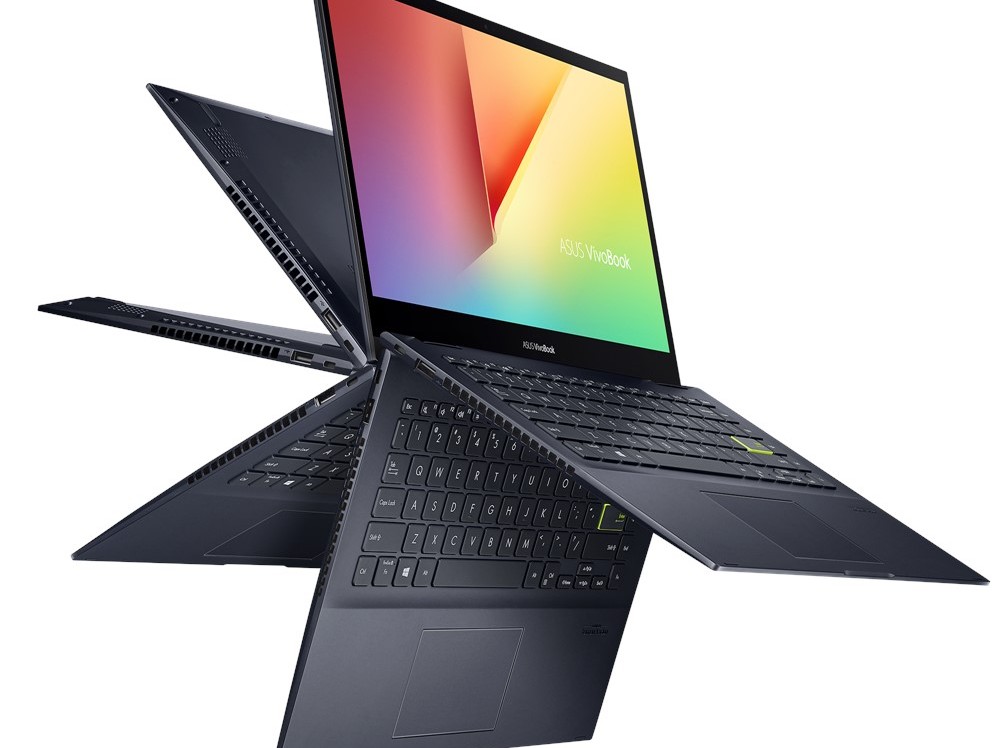
Recensione del Convertibile Asus VivoBook Flip 14 TM420IA Ryzen 7: il Core i7 non è necessario
Punteggio | Data | Modello | Peso | Altezza | Dimensione | Risoluzione | Prezzo |
|---|---|---|---|---|---|---|---|
| 80.7 % v7 (old) | 08/2020 | Asus VivoBook Flip 14 TM420IA R7 4700U, Vega 7 | 1.6 kg | 18.2 mm | 14.00" | 1920x1080 | |
| 84.3 % v7 (old) | 03/2020 | Lenovo Yoga C740-14IML i5-10210U, UHD Graphics 620 | 1.4 kg | 16.9 mm | 14.00" | 1920x1080 | |
| 86.5 % v7 (old) | 05/2020 | Honor Magicbook 14 R5 3500U, Vega 8 | 1.4 kg | 16 mm | 14.00" | 1920x1080 | |
| 85 % v7 (old) | 06/2020 | Acer Swift 3 SF314-42-R27B R3 4300U, Vega 5 | 1.2 kg | 16.55 mm | 14.00" | 1920x1080 | |
| 83 % v7 (old) | 07/2020 | Lenovo IdeaPad 5 15IIL05 i5-1035G1, GeForce MX350 | 1.7 kg | 17.9 mm | 15.60" | 1920x1080 | |
| 81.2 % v7 (old) | 04/2020 | LG Gram 14T90N i7-10510U, UHD Graphics 620 | 1.2 kg | 18 mm | 14.00" | 1920x1080 |
| SD Card Reader | |
| average JPG Copy Test (av. of 3 runs) | |
| Asus VivoBook Flip 14 TM420IA (Toshiba Exceria Pro M501 microSDXC 64GB) | |
| Asus ZenBook Flip 14 UX463FA-AI039T (Toshiba Exceria Pro M501 microSDXC 64GB) | |
| Lenovo IdeaPad 3 14IIL05 (Toshiba Exceria Pro SDXC 64 GB UHS-II) | |
| maximum AS SSD Seq Read Test (1GB) | |
| Asus VivoBook Flip 14 TM420IA (Toshiba Exceria Pro M501 microSDXC 64GB) | |
| Lenovo IdeaPad 3 14IIL05 (Toshiba Exceria Pro SDXC 64 GB UHS-II) | |
| Asus ZenBook Flip 14 UX463FA-AI039T (Toshiba Exceria Pro M501 microSDXC 64GB) | |
| Networking | |
| iperf3 transmit AX12 | |
| Lenovo Yoga C740-14IML | |
| Honor Magicbook 14 | |
| Acer Swift 3 SF314-42-R27B | |
| Asus VivoBook Flip 14 TM420IA | |
| iperf3 receive AX12 | |
| Lenovo Yoga C740-14IML | |
| Acer Swift 3 SF314-42-R27B | |
| Honor Magicbook 14 | |
| Asus VivoBook Flip 14 TM420IA | |


| |||||||||||||||||||||||||
Distribuzione della luminosità: 88 %
Al centro con la batteria: 272.5 cd/m²
Contrasto: 649:1 (Nero: 0.42 cd/m²)
ΔE ColorChecker Calman: 4.65 | ∀{0.5-29.43 Ø4.73}
calibrated: 4.34
ΔE Greyscale Calman: 4.4 | ∀{0.09-98 Ø4.97}
59.8% sRGB (Argyll 1.6.3 3D)
38.4% AdobeRGB 1998 (Argyll 1.6.3 3D)
41.81% AdobeRGB 1998 (Argyll 3D)
60% sRGB (Argyll 3D)
40.47% Display P3 (Argyll 3D)
Gamma: 2.2
CCT: 6984 K
| Asus VivoBook Flip 14 TM420IA BOE NV140FHM-N49, IPS, 14", 1920x1080 | Lenovo ThinkPad X1 Yoga 2020-20UCS03S00 LP140WF9-SPE1, IPS LED, 14", 1920x1080 | Lenovo IdeaPad 3 14IIL05 LG Philips LP140WFA-SPD1, IPS, 14", 1920x1080 | Acer Swift 3 SF314-42-R27B AU Optronics B140HAN04.0, IPS, 14", 1920x1080 | Asus ZenBook Flip 14 UX463FA-AI039T AU AUO323D, IPS, 14", 1920x1080 | Honor Magicbook 14 BOE CQ TV140FHM-NH1, IPS, 14", 1920x1080 | |
|---|---|---|---|---|---|---|
| Display | 58% | -7% | -6% | 46% | 11% | |
| Display P3 Coverage (%) | 40.47 | 64.3 59% | 37.76 -7% | 37.78 -7% | 60.1 49% | 44.93 11% |
| sRGB Coverage (%) | 60 | 95.5 59% | 56.6 -6% | 56.8 -5% | 85.5 43% | 66.2 10% |
| AdobeRGB 1998 Coverage (%) | 41.81 | 65.6 57% | 39.05 -7% | 39.03 -7% | 61.1 46% | 46.42 11% |
| Response Times | -14% | 7% | -4% | 5% | -18% | |
| Response Time Grey 50% / Grey 80% * (ms) | 36.4 ? | 52 ? -43% | 39 ? -7% | 42 ? -15% | 36 ? 1% | 44.8 ? -23% |
| Response Time Black / White * (ms) | 30.4 ? | 25.6 ? 16% | 24 ? 21% | 28 ? 8% | 28 ? 8% | 34 ? -12% |
| PWM Frequency (Hz) | 5952 ? | |||||
| Screen | 52% | -4% | 13% | 34% | 26% | |
| Brightness middle (cd/m²) | 272.5 | 409 50% | 292 7% | 256 -6% | 280 3% | 311 14% |
| Brightness (cd/m²) | 260 | 405 56% | 260 0% | 237 -9% | 286 10% | 296 14% |
| Brightness Distribution (%) | 88 | 95 8% | 80 -9% | 81 -8% | 78 -11% | 92 5% |
| Black Level * (cd/m²) | 0.42 | 0.21 50% | 0.36 14% | 0.17 60% | 0.208 50% | 0.18 57% |
| Contrast (:1) | 649 | 1948 200% | 811 25% | 1506 132% | 1346 107% | 1728 166% |
| Colorchecker dE 2000 * | 4.65 | 4.9 -5% | 6.92 -49% | 5.43 -17% | 3.97 15% | 5.3 -14% |
| Colorchecker dE 2000 max. * | 17.78 | 8.4 53% | 19.36 -9% | 19.73 -11% | 8.29 53% | 18.5 -4% |
| Colorchecker dE 2000 calibrated * | 4.34 | 1.3 70% | 5.13 -18% | 4.8 -11% | 3.42 21% | 4.2 3% |
| Greyscale dE 2000 * | 4.4 | 5.8 -32% | 3.94 10% | 3.29 25% | 2.83 36% | 3.5 20% |
| Gamma | 2.2 100% | 2.53 87% | 2.83 78% | 2.52 87% | 2.34 94% | 2.1 105% |
| CCT | 6984 93% | 7009 93% | 6737 96% | 6840 95% | 6556 99% | 7078 92% |
| Color Space (Percent of AdobeRGB 1998) (%) | 38.4 | 60.7 58% | 36 -6% | 36 -6% | 56 46% | 42.5 11% |
| Color Space (Percent of sRGB) (%) | 59.8 | 95.3 59% | 56 -6% | 57 -5% | 85 42% | 65.8 10% |
| Media totale (Programma / Settaggio) | 32% /
45% | -1% /
-3% | 1% /
7% | 28% /
32% | 6% /
17% |
* ... Meglio usare valori piccoli
Tempi di risposta del Display
| ↔ Tempi di risposta dal Nero al Bianco | ||
|---|---|---|
| 30.4 ms ... aumenta ↗ e diminuisce ↘ combinato | ↗ 18.8 ms Incremento | 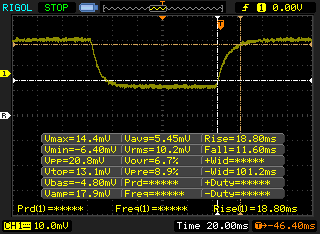 |
| ↘ 11.6 ms Calo | ||
| Lo schermo mostra tempi di risposta lenti nei nostri tests e sarà insoddisfacente per i gamers. In confronto, tutti i dispositivi di test variano da 0.1 (minimo) a 240 (massimo) ms. » 82 % di tutti i dispositivi è migliore. Questo significa che i tempi di risposta rilevati sono peggiori rispetto alla media di tutti i dispositivi testati (19.9 ms). | ||
| ↔ Tempo di risposta dal 50% Grigio all'80% Grigio | ||
| 36.4 ms ... aumenta ↗ e diminuisce ↘ combinato | ↗ 18.8 ms Incremento | 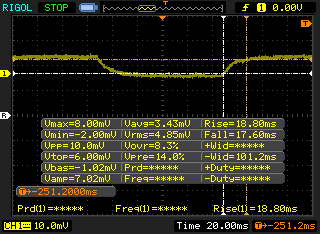 |
| ↘ 17.6 ms Calo | ||
| Lo schermo mostra tempi di risposta lenti nei nostri tests e sarà insoddisfacente per i gamers. In confronto, tutti i dispositivi di test variano da 0.165 (minimo) a 636 (massimo) ms. » 52 % di tutti i dispositivi è migliore. Questo significa che i tempi di risposta rilevati sono peggiori rispetto alla media di tutti i dispositivi testati (31.1 ms). | ||
Sfarfallio dello schermo / PWM (Pulse-Width Modulation)
| flickering dello schermo / PWM non rilevato | 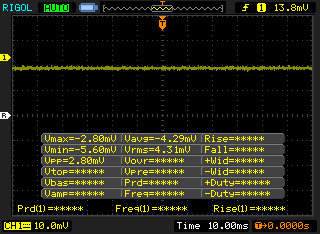 | ||
In confronto: 52 % di tutti i dispositivi testati non utilizza PWM per ridurre la luminosita' del display. Se è rilevato PWM, una media di 7794 (minimo: 5 - massimo: 343500) Hz è stata rilevata. | |||
Cinebench R15: CPU Multi 64Bit | CPU Single 64Bit
Blender: v2.79 BMW27 CPU
7-Zip 18.03: 7z b 4 -mmt1 | 7z b 4
Geekbench 5.5: Single-Core | Multi-Core
HWBOT x265 Benchmark v2.2: 4k Preset
LibreOffice : 20 Documents To PDF
R Benchmark 2.5: Overall mean
| Blender / v2.79 BMW27 CPU | |
| Acer Swift 3 SF314-42-R27B | |
| Asus VivoBook 14 X403FA | |
| Asus VivoBook S14 S433FL | |
| Honor Magicbook 14 | |
| Lenovo IdeaPad 5 14ARE05 | |
| Dell XPS 13 7390 Core i7-10710U | |
| Media AMD Ryzen 7 4700U (407 - 537, n=8) | |
| Asus VivoBook Flip 14 TM420IA | |
| 7-Zip 18.03 / 7z b 4 -mmt1 | |
| Asus VivoBook S14 S433FL | |
| Dell XPS 13 7390 Core i7-10710U | |
| Asus VivoBook Flip 14 TM420IA | |
| Media AMD Ryzen 7 4700U (4208 - 4470, n=8) | |
| Lenovo IdeaPad 5 14ARE05 | |
| Asus VivoBook 14 X403FA | |
| Acer Swift 3 SF314-42-R27B | |
| Honor Magicbook 14 | |
| Geekbench 5.5 / Single-Core | |
| Asus VivoBook S14 S433FL | |
| Asus VivoBook Flip 14 TM420IA | |
| Media AMD Ryzen 7 4700U (1101 - 1168, n=8) | |
| Lenovo IdeaPad 5 14ARE05 | |
| Acer Swift 3 SF314-42-R27B | |
| Honor Magicbook 14 | |
| Geekbench 5.5 / Multi-Core | |
| Media AMD Ryzen 7 4700U (4792 - 6502, n=8) | |
| Asus VivoBook Flip 14 TM420IA | |
| Lenovo IdeaPad 5 14ARE05 | |
| Asus VivoBook S14 S433FL | |
| Acer Swift 3 SF314-42-R27B | |
| Honor Magicbook 14 | |
| HWBOT x265 Benchmark v2.2 / 4k Preset | |
| Asus VivoBook Flip 14 TM420IA | |
| Media AMD Ryzen 7 4700U (6.79 - 10.1, n=8) | |
| Lenovo IdeaPad 5 14ARE05 | |
| Dell XPS 13 7390 Core i7-10710U | |
| Asus VivoBook 14 X403FA | |
| Asus VivoBook S14 S433FL | |
| Acer Swift 3 SF314-42-R27B | |
| Honor Magicbook 14 | |
| LibreOffice / 20 Documents To PDF | |
| Media AMD Ryzen 7 4700U (55.5 - 115.7, n=8) | |
| Acer Swift 3 SF314-42-R27B | |
| Lenovo IdeaPad 5 14ARE05 | |
| Asus VivoBook Flip 14 TM420IA | |
| Asus VivoBook S14 S433FL | |
| R Benchmark 2.5 / Overall mean | |
| Honor Magicbook 14 | |
| Acer Swift 3 SF314-42-R27B | |
| Lenovo IdeaPad 5 14ARE05 | |
| Asus VivoBook S14 S433FL | |
| Media AMD Ryzen 7 4700U (0.598 - 0.651, n=8) | |
| Asus VivoBook Flip 14 TM420IA | |
* ... Meglio usare valori piccoli
| PCMark 8 Home Score Accelerated v2 | 4208 punti | |
| PCMark 8 Work Score Accelerated v2 | 5260 punti | |
| PCMark 10 Score | 5214 punti | |
Aiuto | ||
| DPC Latencies / LatencyMon - interrupt to process latency (max), Web, Youtube, Prime95 | |
| Honor Magicbook 14 | |
| Acer Swift 3 SF314-42-R27B | |
| Lenovo IdeaPad 3 14IIL05 | |
| Asus VivoBook Flip 14 TM420IA | |
| Lenovo ThinkPad X1 Yoga 2020-20UCS03S00 | |
| Asus VivoBook S14 S433FL | |
| Asus ZenBook Flip 14 UX463FA-AI039T | |
* ... Meglio usare valori piccoli
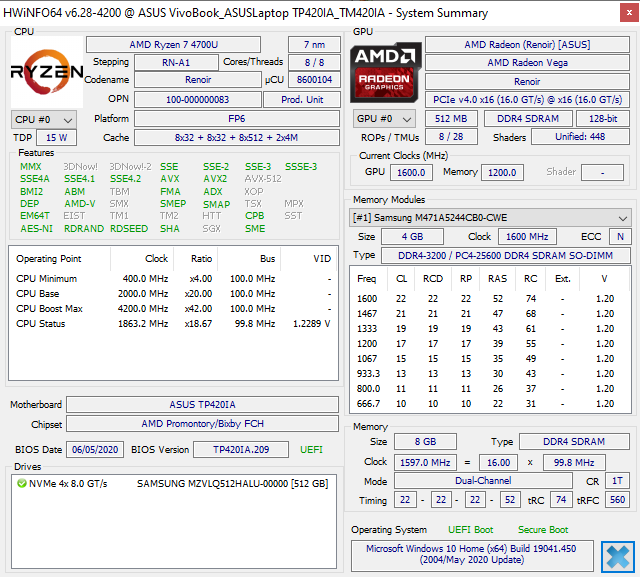
| Asus VivoBook Flip 14 TM420IA Samsung PM991 MZVLQ512HALU | Lenovo IdeaPad 3 14IIL05 WDC PC SN520 SDAPMUW-256G | Acer Swift 3 SF314-42-R27B SK hynix BC511 HFM256GDJTNI-82A0 | Asus ZenBook Flip 14 UX463FA-AI039T Kingston RBUSNS8154P3512GJ1 | Honor Magicbook 14 Samsung SSD PM981a MZVLB256HBHQ | |
|---|---|---|---|---|---|
| AS SSD | -15% | -11% | -22% | 18% | |
| Seq Read (MB/s) | 1397 | 1535 10% | 1682 20% | 1336 -4% | 2591 85% |
| Seq Write (MB/s) | 783 | 1215 55% | 931 19% | 653 -17% | 2133 172% |
| 4K Read (MB/s) | 48.08 | 35.93 -25% | 41.53 -14% | 26.65 -45% | 50 4% |
| 4K Write (MB/s) | 134.6 | 138.3 3% | 109.1 -19% | 52.7 -61% | 95.7 -29% |
| 4K-64 Read (MB/s) | 835 | 467.7 -44% | 603 -28% | 644 -23% | 607 -27% |
| 4K-64 Write (MB/s) | 734 | 399.6 -46% | 713 -3% | 482.9 -34% | 482.6 -34% |
| Access Time Read * (ms) | 0.081 | 0.104 -28% | 0.074 9% | 0.075 7% | |
| Access Time Write * (ms) | 0.084 | 0.029 65% | 0.035 58% | 0.072 14% | 0.034 60% |
| Score Read (Points) | 1022 | 657 -36% | 813 -20% | 804 -21% | 916 -10% |
| Score Write (Points) | 947 | 659 -30% | 915 -3% | 601 -37% | 792 -16% |
| Score Total (Points) | 2474 | 1647 -33% | 2118 -14% | 1786 -28% | 2168 -12% |
| Copy ISO MB/s (MB/s) | 1212 | 754 -38% | 692 -43% | ||
| Copy Program MB/s (MB/s) | 374.3 | 253.1 -32% | 226.5 -39% | ||
| Copy Game MB/s (MB/s) | 829 | 546 -34% | 391.5 -53% | ||
| CrystalDiskMark 5.2 / 6 | 7% | -12% | -29% | 34% | |
| Write 4K (MB/s) | 121.2 | 173.1 43% | 96.3 -21% | 54.6 -55% | 137.7 14% |
| Read 4K (MB/s) | 49.91 | 49.32 -1% | 35.06 -30% | 28.19 -44% | 42.49 -15% |
| Write Seq (MB/s) | 1090 | 1188 9% | 1001 -8% | 840 -23% | 2341 115% |
| Read Seq (MB/s) | 1533 | 1278 -17% | 1072 -30% | 905 -41% | 2436 59% |
| Write 4K Q32T1 (MB/s) | 393.3 | 457.4 16% | 423.9 8% | 409.5 4% | 261 -34% |
| Read 4K Q32T1 (MB/s) | 406 | 505 24% | 464.7 14% | 292.4 -28% | 335.4 -17% |
| Write Seq Q32T1 (MB/s) | 1225 | 1258 3% | 967 -21% | 1038 -15% | 2343 91% |
| Read Seq Q32T1 (MB/s) | 2277 | 1742 -23% | 2179 -4% | 1607 -29% | 3569 57% |
| Media totale (Programma / Settaggio) | -4% /
-7% | -12% /
-11% | -26% /
-25% | 26% /
25% |
* ... Meglio usare valori piccoli

Disk Throttling: DiskSpd Read Loop, Queue Depth 8
| 3DMark 11 Performance | 5105 punti | |
| 3DMark Cloud Gate Standard Score | 17487 punti | |
| 3DMark Fire Strike Score | 2760 punti | |
| 3DMark Time Spy Score | 1028 punti | |
Aiuto | ||
| Final Fantasy XV Benchmark - 1280x720 Lite Quality | |
| Asus VivoBook Flip 14 TM420IA | |
| Beelink GTR35 II-G-16512D00W64PRO-1T | |
| Xiaomi RedmiBook 16 R5 | |
| Huawei MateBook D 15-53010TUY | |
| Asus ZenBook 14 UM431DA-AM020T | |
| HP 14s-dq1431ng | |
| Lenovo ThinkPad X13-20T20033GE | |
| basso | medio | alto | ultra | |
|---|---|---|---|---|
| The Witcher 3 (2015) | 61.4 | 38.6 | 20.2 | 13.2 |
| Dota 2 Reborn (2015) | 93.9 | 70.3 | 44.5 | 41.5 |
| Final Fantasy XV Benchmark (2018) | 30.2 | 15.2 | 9.86 | |
| X-Plane 11.11 (2018) | 40.6 | 32.5 | 28.6 |
| Asus VivoBook Flip 14 TM420IA Vega 7, R7 4700U, Samsung PM991 MZVLQ512HALU | Lenovo IdeaPad 3 14IIL05 UHD Graphics G1 (Ice Lake 32 EU), i3-1005G1, WDC PC SN520 SDAPMUW-256G | Acer Swift 3 SF314-42-R27B Vega 5, R3 4300U, SK hynix BC511 HFM256GDJTNI-82A0 | Asus ZenBook Flip 14 UX463FA-AI039T UHD Graphics 620, i5-10210U, Kingston RBUSNS8154P3512GJ1 | Honor Magicbook 14 Vega 8, R5 3500U, Samsung SSD PM981a MZVLB256HBHQ | Asus VivoBook S14 S433FL GeForce MX250, i7-10510U, Intel Optane Memory H10 with Solid State Storage 32GB + 512GB HBRPEKNX0202A(L/H) | |
|---|---|---|---|---|---|---|
| Noise | -4% | -5% | -1% | -2% | -12% | |
| off /ambiente * (dB) | 27.1 | 30.7 -13% | 30.3 -12% | 30.1 -11% | 29.6 -9% | 30.7 -13% |
| Idle Minimum * (dB) | 27.1 | 30.7 -13% | 30.3 -12% | 30.1 -11% | 29.6 -9% | 31 -14% |
| Idle Average * (dB) | 27.1 | 30.7 -13% | 30.3 -12% | 30.1 -11% | 29.6 -9% | 31 -14% |
| Idle Maximum * (dB) | 27.1 | 30.7 -13% | 30.3 -12% | 30.1 -11% | 29.6 -9% | 31.3 -15% |
| Load Average * (dB) | 35 | 31.6 10% | 32.6 7% | 30.1 14% | 30.8 12% | 43.4 -24% |
| Witcher 3 ultra * (dB) | 41.3 | 42.8 -4% | ||||
| Load Maximum * (dB) | 41.3 | 33.6 19% | 35.6 14% | 32.02 22% | 35.3 15% | 41.5 -0% |
* ... Meglio usare valori piccoli
Rumorosità
| Idle |
| 27.1 / 27.1 / 27.1 dB(A) |
| Sotto carico |
| 35 / 41.3 dB(A) |
 | ||
30 dB silenzioso 40 dB(A) udibile 50 dB(A) rumoroso |
||
min: | ||
(±) La temperatura massima sul lato superiore è di 44.6 °C / 112 F, rispetto alla media di 35.4 °C / 96 F, che varia da 19.6 a 60 °C per questa classe Convertible.
(-) Il lato inferiore si riscalda fino ad un massimo di 46 °C / 115 F, rispetto alla media di 36.9 °C / 98 F
(+) In idle, la temperatura media del lato superiore è di 31 °C / 88 F, rispetto alla media deld ispositivo di 30.3 °C / 87 F.
(±) Riproducendo The Witcher 3, la temperatura media per il lato superiore e' di 36.3 °C / 97 F, rispetto alla media del dispositivo di 30.3 °C / 87 F.
(+) I poggiapolsi e il touchpad sono piu' freddi della temperatura della pelle con un massimo di 30.6 °C / 87.1 F e sono quindi freddi al tatto.
(-) La temperatura media della zona del palmo della mano di dispositivi simili e'stata di 28 °C / 82.4 F (-2.6 °C / -4.7 F).
Asus VivoBook Flip 14 TM420IA analisi audio
(±) | potenza degli altiparlanti media ma buona (79.2 dB)
Bassi 100 - 315 Hz
(±) | bassi ridotti - in media 13.1% inferiori alla media
(±) | la linearità dei bassi è media (9.8% delta rispetto alla precedente frequenza)
Medi 400 - 2000 Hz
(+) | medi bilanciati - solo only 1.8% rispetto alla media
(+) | medi lineari (4.5% delta rispetto alla precedente frequenza)
Alti 2 - 16 kHz
(+) | Alti bilanciati - appena 3% dalla media
(+) | alti lineari (2.9% delta rispetto alla precedente frequenza)
Nel complesso 100 - 16.000 Hz
(+) | suono nel complesso lineare (11.5% differenza dalla media)
Rispetto alla stessa classe
» 9% di tutti i dispositivi testati in questa classe è stato migliore, 3% simile, 88% peggiore
» Il migliore ha avuto un delta di 6%, medio di 20%, peggiore di 57%
Rispetto a tutti i dispositivi testati
» 8% di tutti i dispositivi testati in questa classe è stato migliore, 2% similare, 90% peggiore
» Il migliore ha avuto un delta di 4%, medio di 24%, peggiore di 134%
Apple MacBook 12 (Early 2016) 1.1 GHz analisi audio
(+) | gli altoparlanti sono relativamente potenti (83.6 dB)
Bassi 100 - 315 Hz
(±) | bassi ridotti - in media 11.3% inferiori alla media
(±) | la linearità dei bassi è media (14.2% delta rispetto alla precedente frequenza)
Medi 400 - 2000 Hz
(+) | medi bilanciati - solo only 2.4% rispetto alla media
(+) | medi lineari (5.5% delta rispetto alla precedente frequenza)
Alti 2 - 16 kHz
(+) | Alti bilanciati - appena 2% dalla media
(+) | alti lineari (4.5% delta rispetto alla precedente frequenza)
Nel complesso 100 - 16.000 Hz
(+) | suono nel complesso lineare (10.2% differenza dalla media)
Rispetto alla stessa classe
» 7% di tutti i dispositivi testati in questa classe è stato migliore, 2% simile, 91% peggiore
» Il migliore ha avuto un delta di 5%, medio di 18%, peggiore di 53%
Rispetto a tutti i dispositivi testati
» 5% di tutti i dispositivi testati in questa classe è stato migliore, 1% similare, 94% peggiore
» Il migliore ha avuto un delta di 4%, medio di 24%, peggiore di 134%
| Off / Standby | |
| Idle | |
| Sotto carico |
|
Leggenda:
min: | |
| Asus VivoBook Flip 14 TM420IA R7 4700U, Vega 7, Samsung PM991 MZVLQ512HALU, IPS, 1920x1080, 14" | Lenovo IdeaPad 3 14IIL05 i3-1005G1, UHD Graphics G1 (Ice Lake 32 EU), WDC PC SN520 SDAPMUW-256G, IPS, 1920x1080, 14" | Acer Swift 3 SF314-42-R27B R3 4300U, Vega 5, SK hynix BC511 HFM256GDJTNI-82A0, IPS, 1920x1080, 14" | Asus ZenBook Flip 14 UX463FA-AI039T i5-10210U, UHD Graphics 620, Kingston RBUSNS8154P3512GJ1, IPS, 1920x1080, 14" | Honor Magicbook 14 R5 3500U, Vega 8, Samsung SSD PM981a MZVLB256HBHQ, IPS, 1920x1080, 14" | Asus VivoBook S14 S433FL i7-10510U, GeForce MX250, Intel Optane Memory H10 with Solid State Storage 32GB + 512GB HBRPEKNX0202A(L/H), IPS, 1920x1080, 14" | |
|---|---|---|---|---|---|---|
| Power Consumption | 4% | 13% | -15% | -21% | -16% | |
| Idle Minimum * (Watt) | 4 | 3.2 20% | 3.7 7% | 3.6 10% | 5.2 -30% | 2.4 40% |
| Idle Average * (Watt) | 6.4 | 6.2 3% | 5.6 13% | 7.5 -17% | 7.7 -20% | 4.2 34% |
| Idle Maximum * (Watt) | 7 | 7.2 -3% | 7.8 -11% | 9.4 -34% | 9.3 -33% | 7.8 -11% |
| Load Average * (Watt) | 34.6 | 30 13% | 26.4 24% | 42 -21% | 40.3 -16% | 57 -65% |
| Witcher 3 ultra * (Watt) | 35 | 52 -49% | ||||
| Load Maximum * (Watt) | 45.1 | 50 -11% | 31.4 30% | 51 -13% | 48 -6% | 64 -42% |
* ... Meglio usare valori piccoli
| Asus VivoBook Flip 14 TM420IA R7 4700U, Vega 7, 42 Wh | Lenovo IdeaPad 3 14IIL05 i3-1005G1, UHD Graphics G1 (Ice Lake 32 EU), 35 Wh | Acer Swift 3 SF314-42-R27B R3 4300U, Vega 5, 48.85 Wh | Asus ZenBook Flip 14 UX463FA-AI039T i5-10210U, UHD Graphics 620, 50 Wh | Honor Magicbook 14 R5 3500U, Vega 8, 56 Wh | Asus VivoBook S14 S433FL i7-10510U, GeForce MX250, 50 Wh | |
|---|---|---|---|---|---|---|
| Autonomia della batteria | -25% | 51% | -4% | 19% | 8% | |
| WiFi v1.3 (h) | 8 | 6 -25% | 12.1 51% | 7.7 -4% | 9.5 19% | 8.6 8% |
| Load (h) | 1.7 |
Pro
Contro
Il VivoBook Flip 2020 alimentato da AMD non avrebbe potuto essere lanciato in un momento migliore. Le piattaforme Intel della 10° generazione Ice Lake e Comet Lake-U sono già diventate obsolete rispetto alla serie Zen 2 in termini di prestazioni pure e i prezzi di partenza generalmente più bassi dei portatili AMD rendono le alternative Core i7 ancora meno attraenti al momento. Intel è pronta a riguadagnare un po' di slancio perso nel corso di quest'anno, quando Tiger Lake sarà disponibile, ma i portatili AMD come il nostro VivoBook avranno un campo libero fino ad allora.
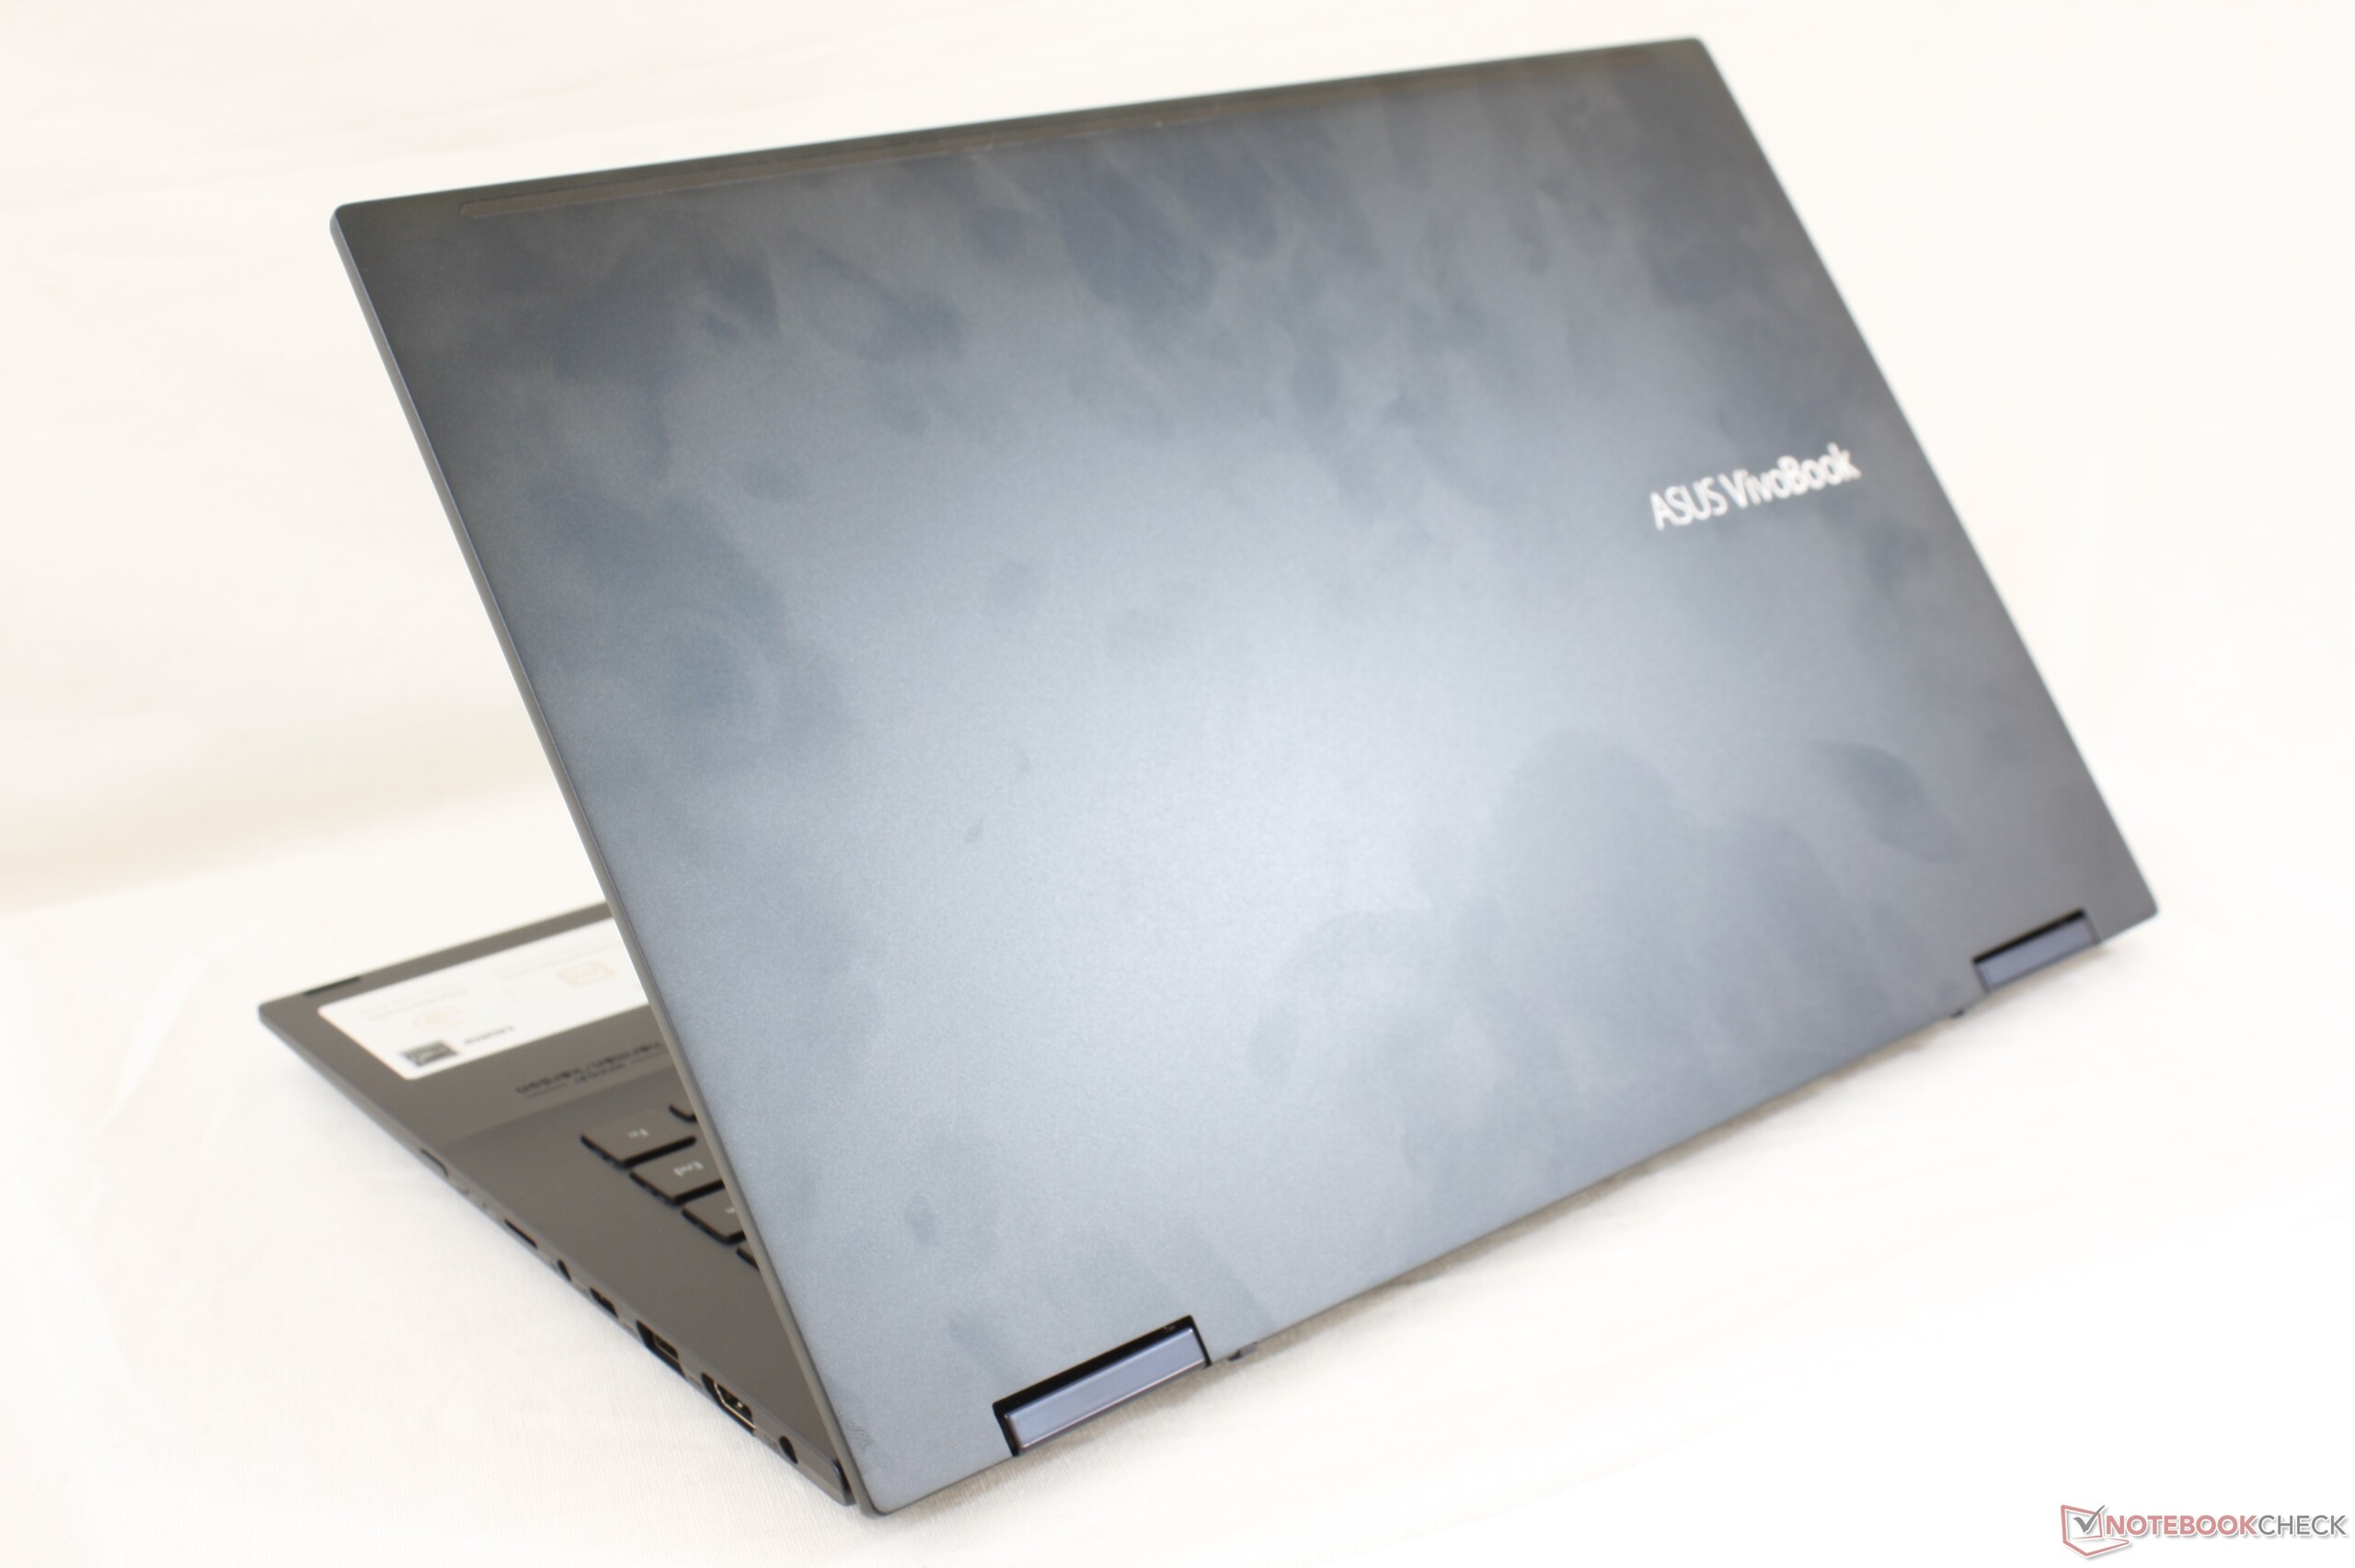
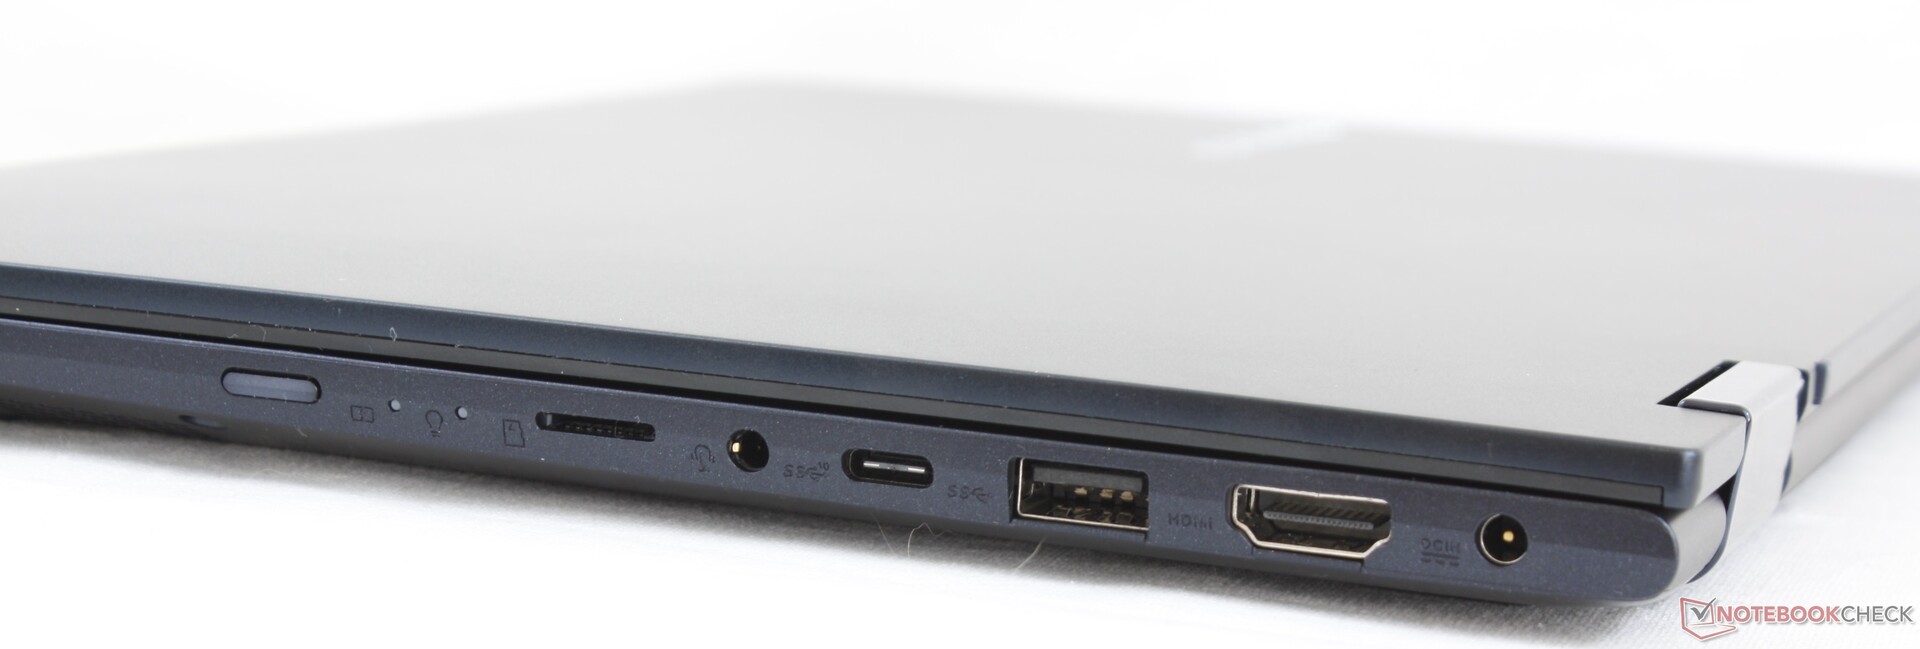
Per quanto riguarda il laptop, gli utenti non sacrificheranno affatto le prestazioni, nonostante il prezzo abbordabile. Invece all'hardware mancheranno alcune caratteristiche di lusso come Thunderbolt 3, ricarica USB-C, Wi-Fi 6 e una telecamera a infrarossi. Il taglio più grande l'ha subito il display e la sua gamma ristretta che impallidisce rispetto alla serie ZenBook. Per il resto, si tratta di un portatile veloce e ben costruito, adatto agli studenti, all'uso multimediale a casa e ai viaggi occasionali.
Un convertibile poco costoso che può funzionare più velocemente della maggior parte delle altre nella sua categoria di dimensioni e che costa centinaia di volte di più. È sopra la media su quasi tutti i fronti, tranne che per il display mediocre.
Asus VivoBook Flip 14 TM420IA
- 08/20/2020 v7 (old)
Allen Ngo
Price comparison
