Recensione del Laptop Dell XPS 13 7390 Core i7-10710U: Più veloce dell'XPS 15 Core i5
Dopo un breve ritardo, il Dell XPS 13 7390 con l'ultimo processore Intel Core i7-10710U di ultima generazione è finalmente arrivato sul mercato. Dell è stata la prima prima con un Intel Core i7 Ice Lake offerto all'inizio del mese scorso e ora è di nuovo la prima con l'Intel Core i7 Comet Lake-U CPU. Questo particolare processore si distingue per essere la prima CPU hexa-core della serie Core U da 15 W, mentre tutte le precedenti CPU Core U avevano un massimo di soli due o quattro cores fisici.
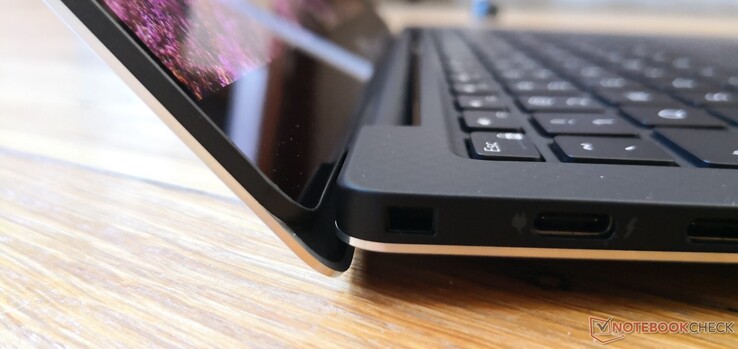
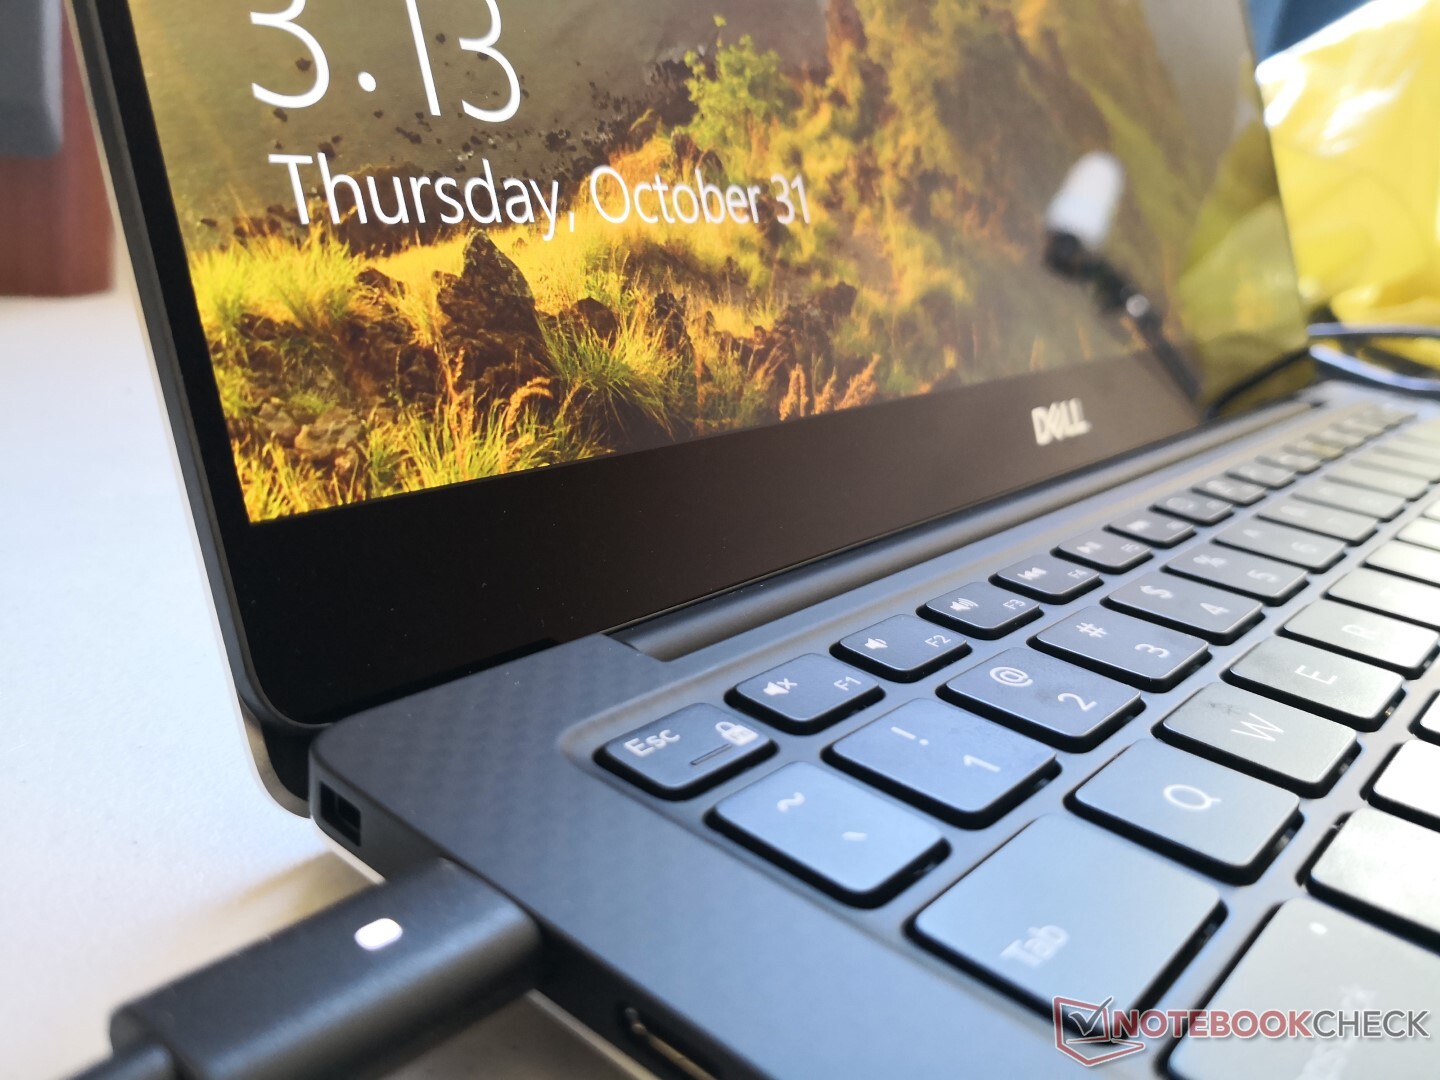
A parte il cambio di CPU, lo chassis rimane identico ai modelli XPS 13 che l'hanno preceduto. Anche il cambio di nome del modello (7390 vs. 9390) è stato annunciato all'inizio di quest'anno come descritto qui di seguito. Raccomandiamo quindi di controllare le nostre recensioni degli XPS 13 9380 ed XPS 13 9370 per saperne di più su tastiera, display, porte e altre caratteristiche fisiche dell'XPS 13. Questa recensione si concentrerà invece sul nuovo Core i7-10710U e su quale aumento di prestazioni gli utenti possono aspettarsi.
Altre recensioni di Dell XPS:
Punteggio | Data | Modello | Peso | Altezza | Dimensione | Risoluzione | Prezzo |
|---|---|---|---|---|---|---|---|
| 85.9 % v7 (old) | 11/2019 | Dell XPS 13 7390 Core i7-10710U i7-10710U, UHD Graphics 620 | 1.2 kg | 11.6 mm | 13.30" | 3840x2160 | |
| 86.6 % v6 (old) | 05/2019 | Asus ZenBook S13 UX392FN i7-8565U, GeForce MX150 | 1.1 kg | 12.9 mm | 13.90" | 1920x1080 | |
| 82.7 % v7 (old) | 11/2019 | Acer Swift 3 SF314-41-R8HZ R5 3500U, Vega 8 | 1.5 kg | 18 mm | 14.00" | 1920x1080 | |
| 84.1 % v6 (old) | 06/2019 | Lenovo Yoga 530-14ARR-81H9000VGE R7 2700U, Vega 10 | 1.7 kg | 17.6 mm | 14.00" | 1920x1080 | |
| 87.7 % v6 (old) | 03/2019 | Dell XPS 13 9380 i7 4K i7-8565U, UHD Graphics 620 | 1.2 kg | 11.6 mm | 13.30" | 3840x2160 |
Case
Lettore schede SD
| SD Card Reader | |
| average JPG Copy Test (av. of 3 runs) | |
| Dell XPS 13 9380 i7 4K (Toshiba Exceria Pro M501 64 GB UHS-II) | |
| Dell XPS 13 7390 2-in-1 Core i3 (Toshiba Exceria Pro M501 64 GB UHS-II) | |
| Dell XPS 13 7390 Core i7-10710U (Toshiba Exceria Pro M501 64 GB UHS-II) | |
| Dell XPS 13 7390 2-in-1 Core i7 (Toshiba Exceria Pro M501 64 GB UHS-II) | |
| maximum AS SSD Seq Read Test (1GB) | |
| Dell XPS 13 9380 i7 4K (Toshiba Exceria Pro M501 64 GB UHS-II) | |
| Dell XPS 13 7390 2-in-1 Core i3 (Toshiba Exceria Pro M501 64 GB UHS-II) | |
| Dell XPS 13 7390 Core i7-10710U (Toshiba Exceria Pro M501 64 GB UHS-II) | |
| Dell XPS 13 7390 2-in-1 Core i7 (Toshiba Exceria Pro M501 64 GB UHS-II) | |
Comunicazioni
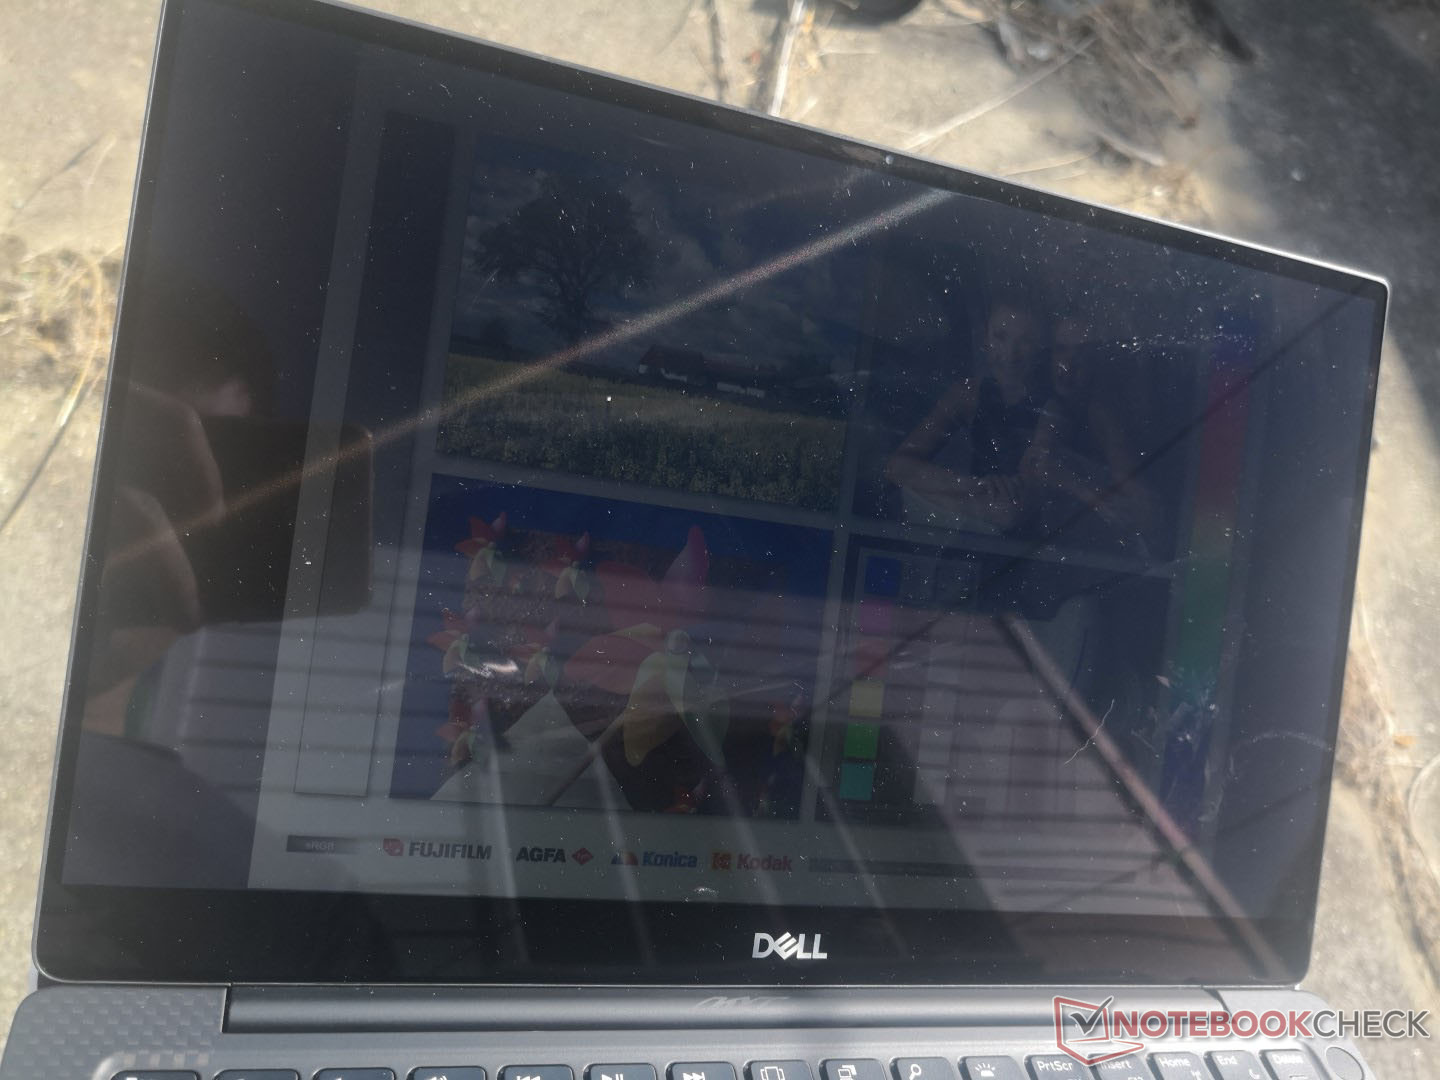
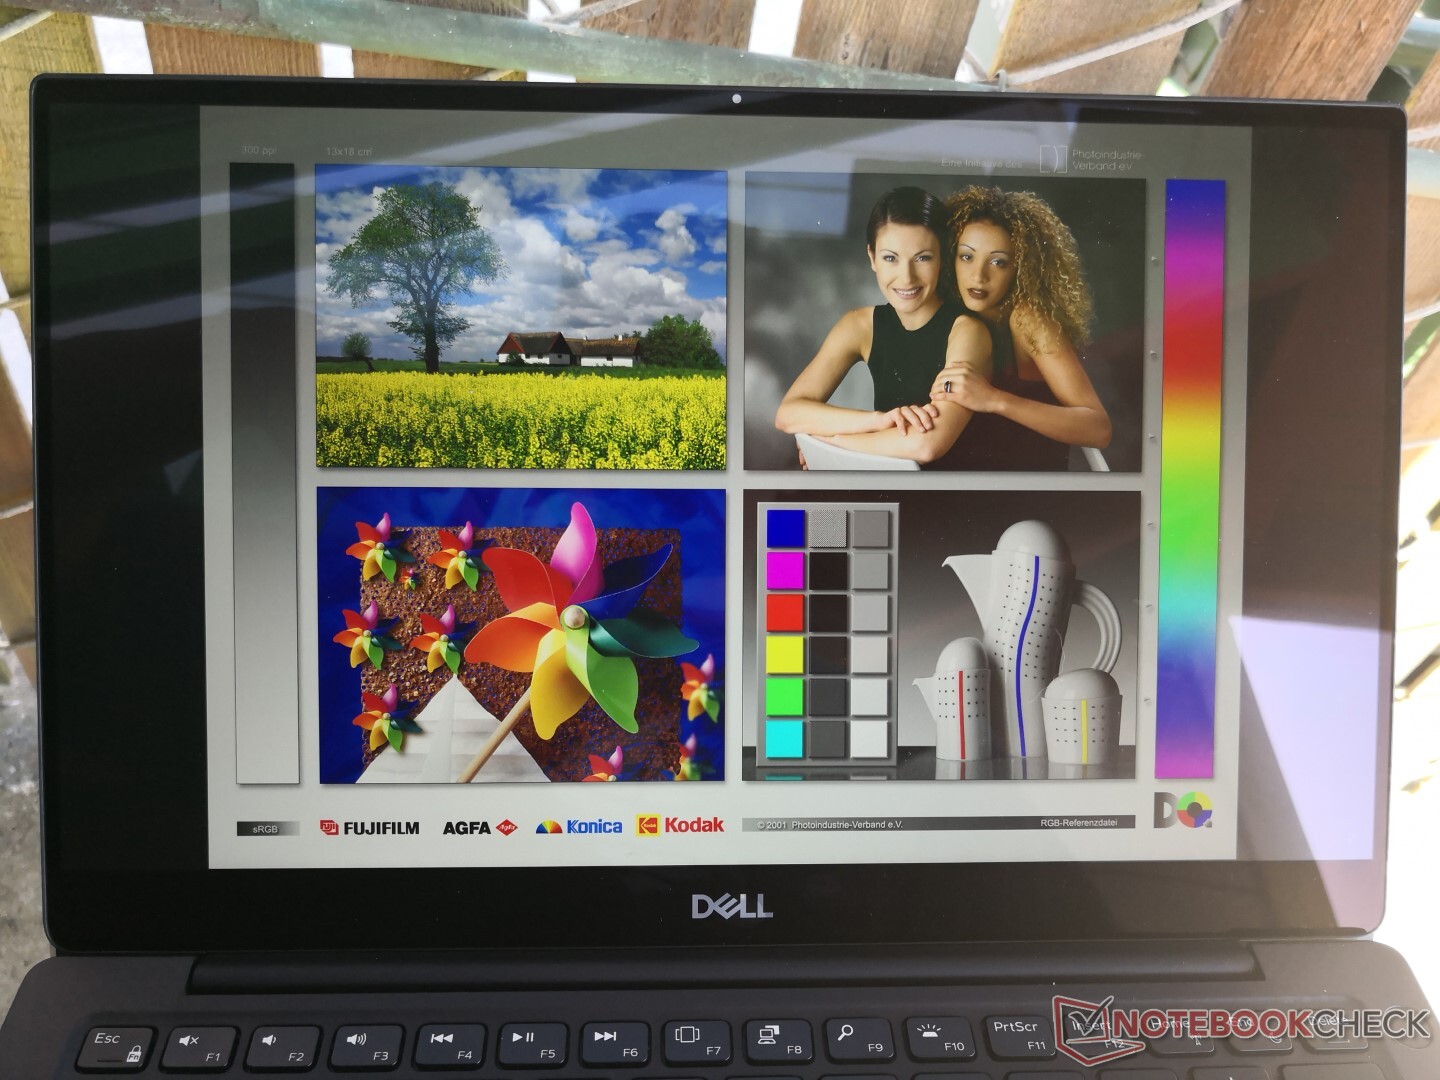
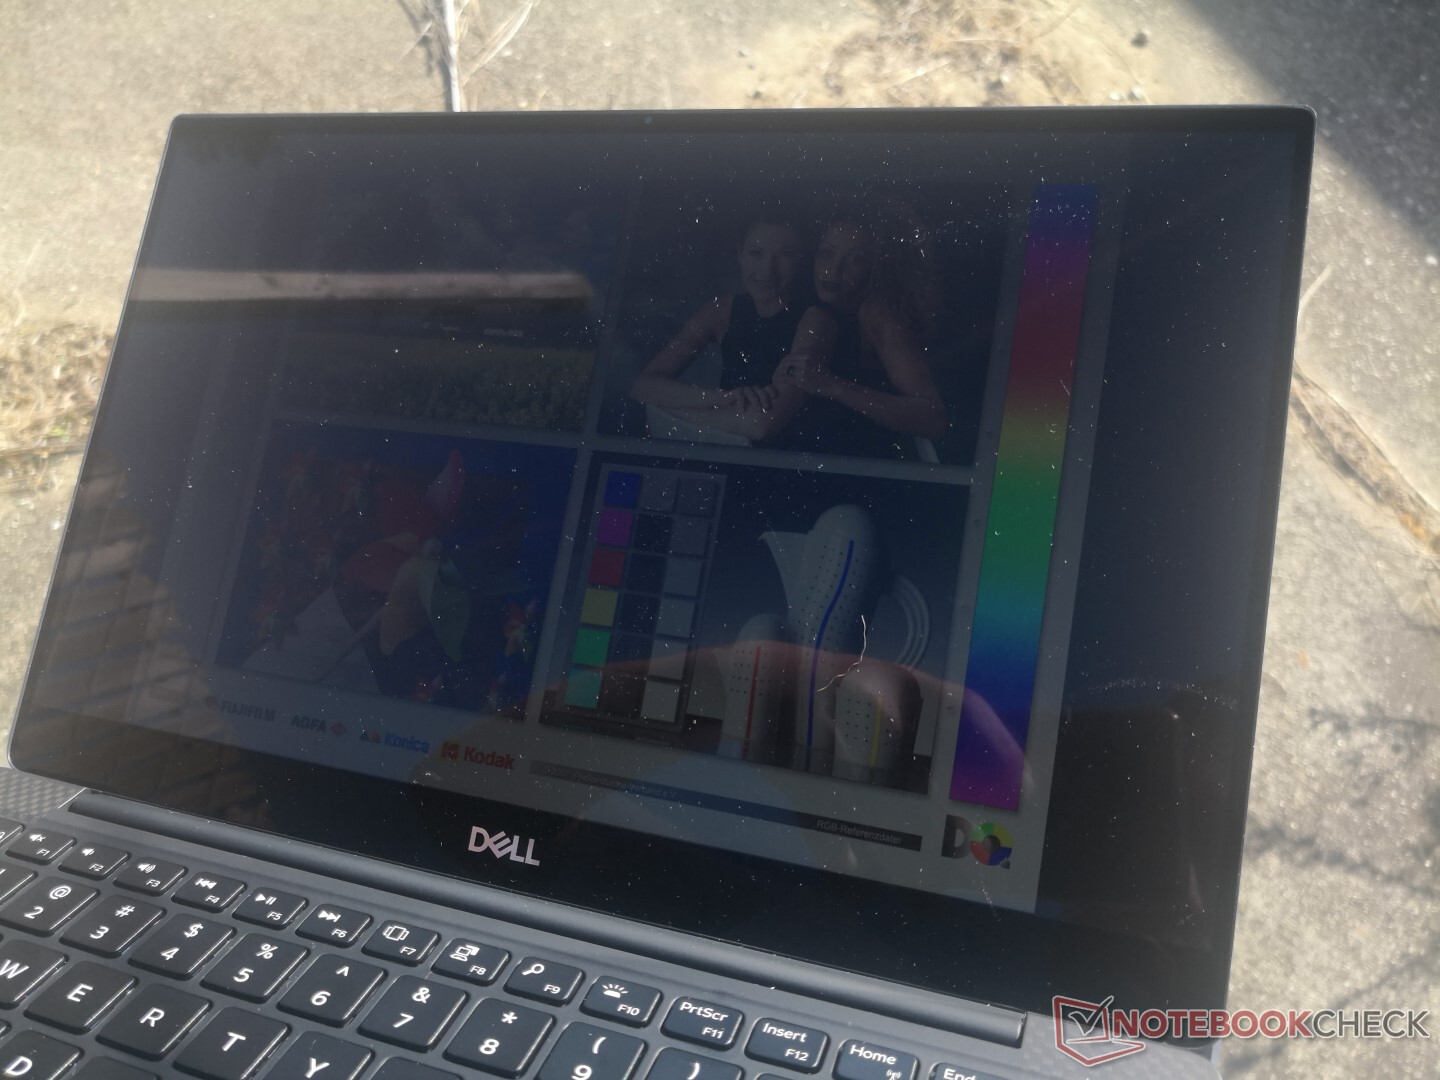
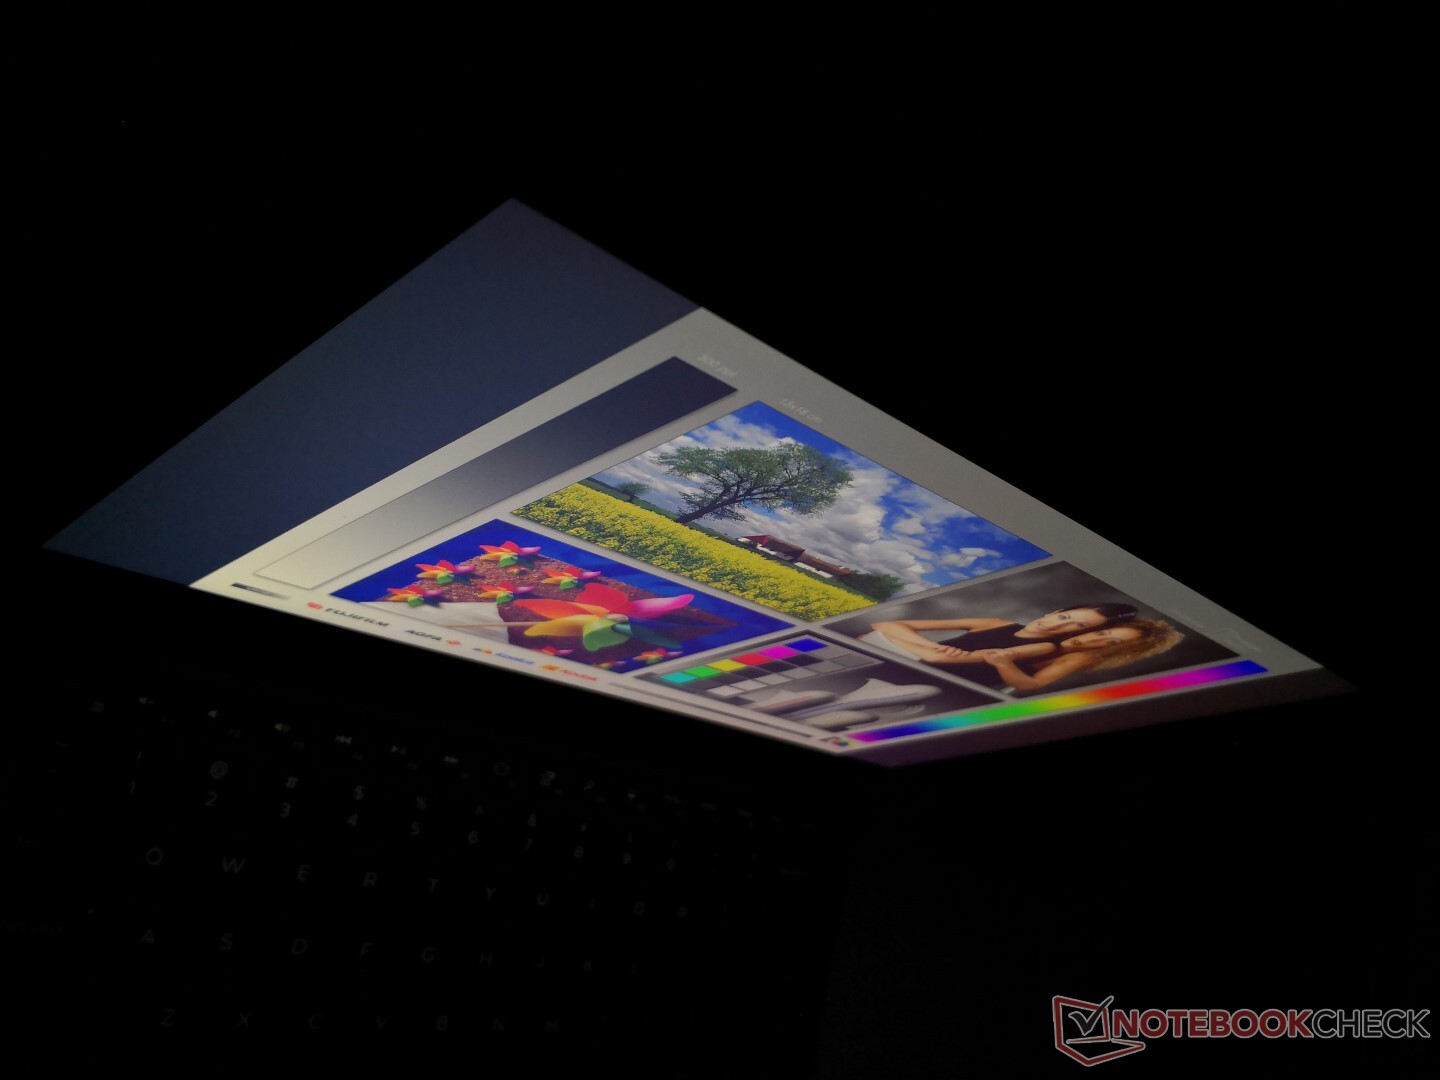
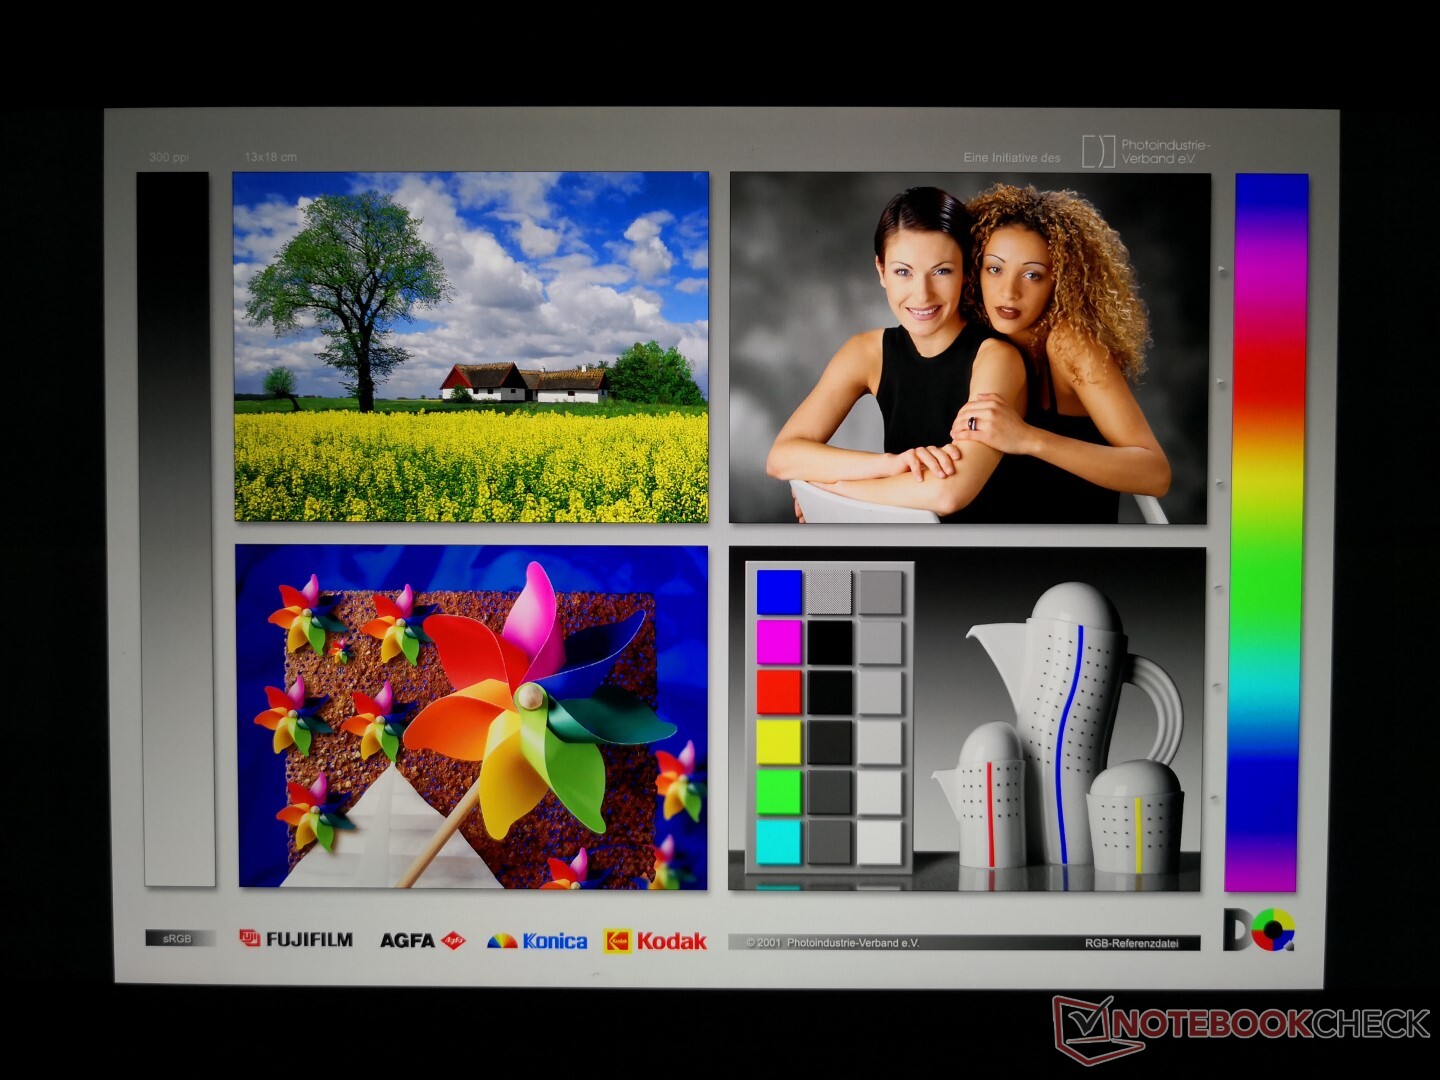
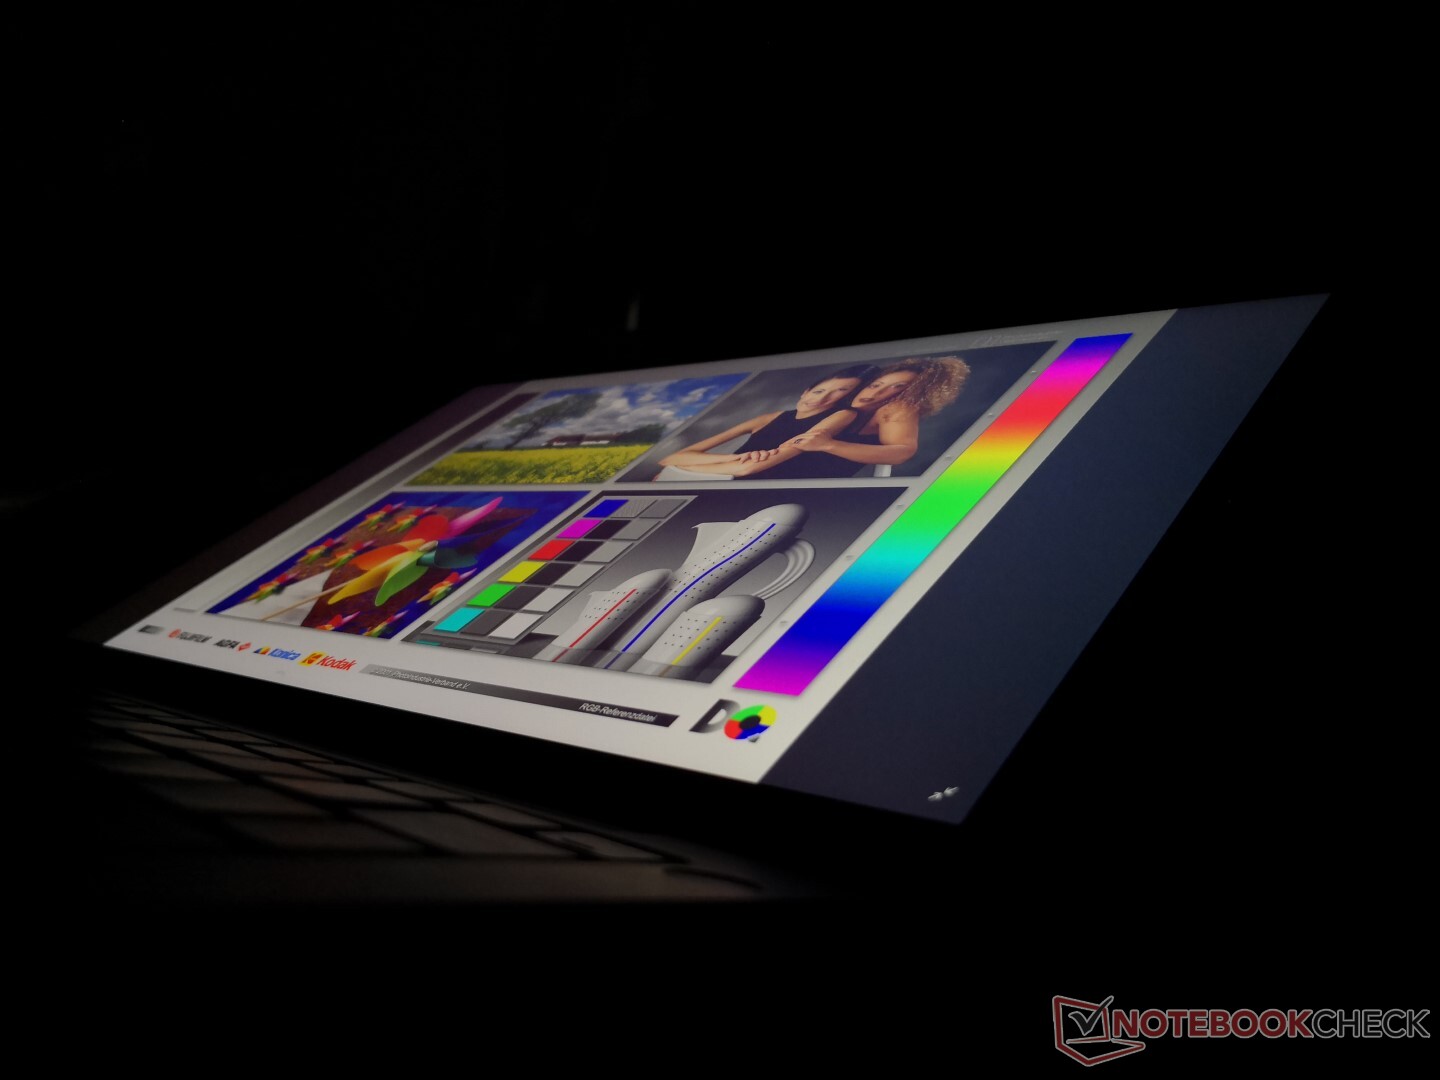
Display
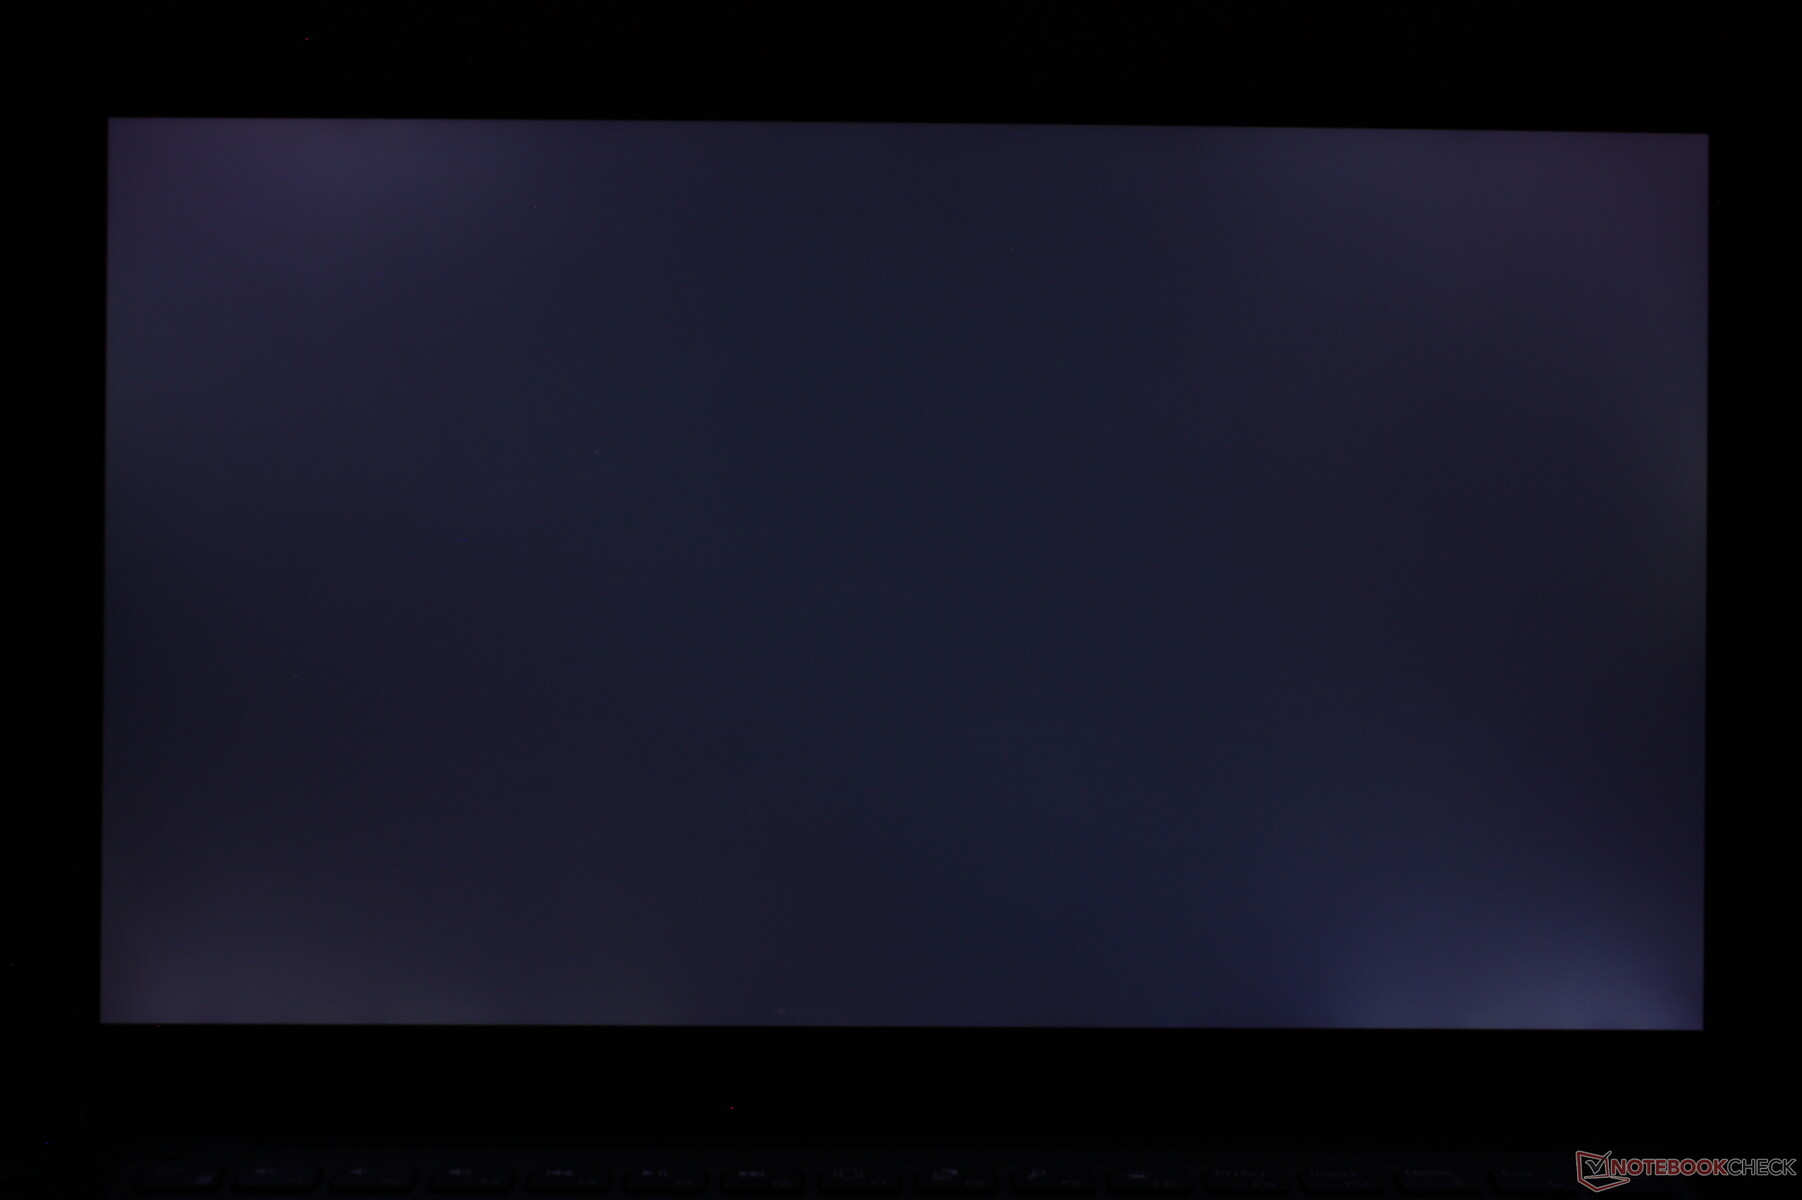
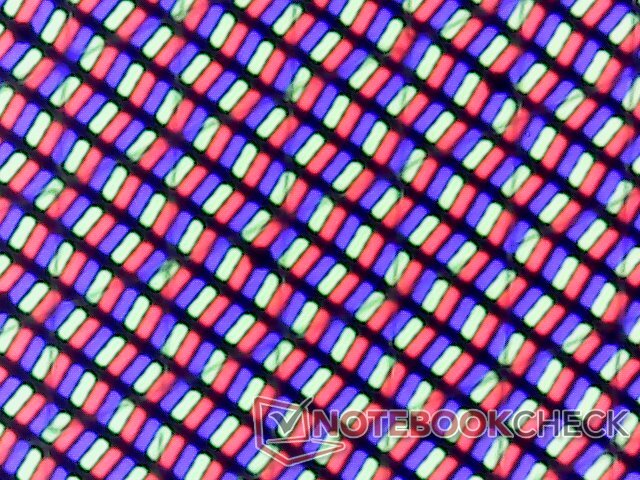
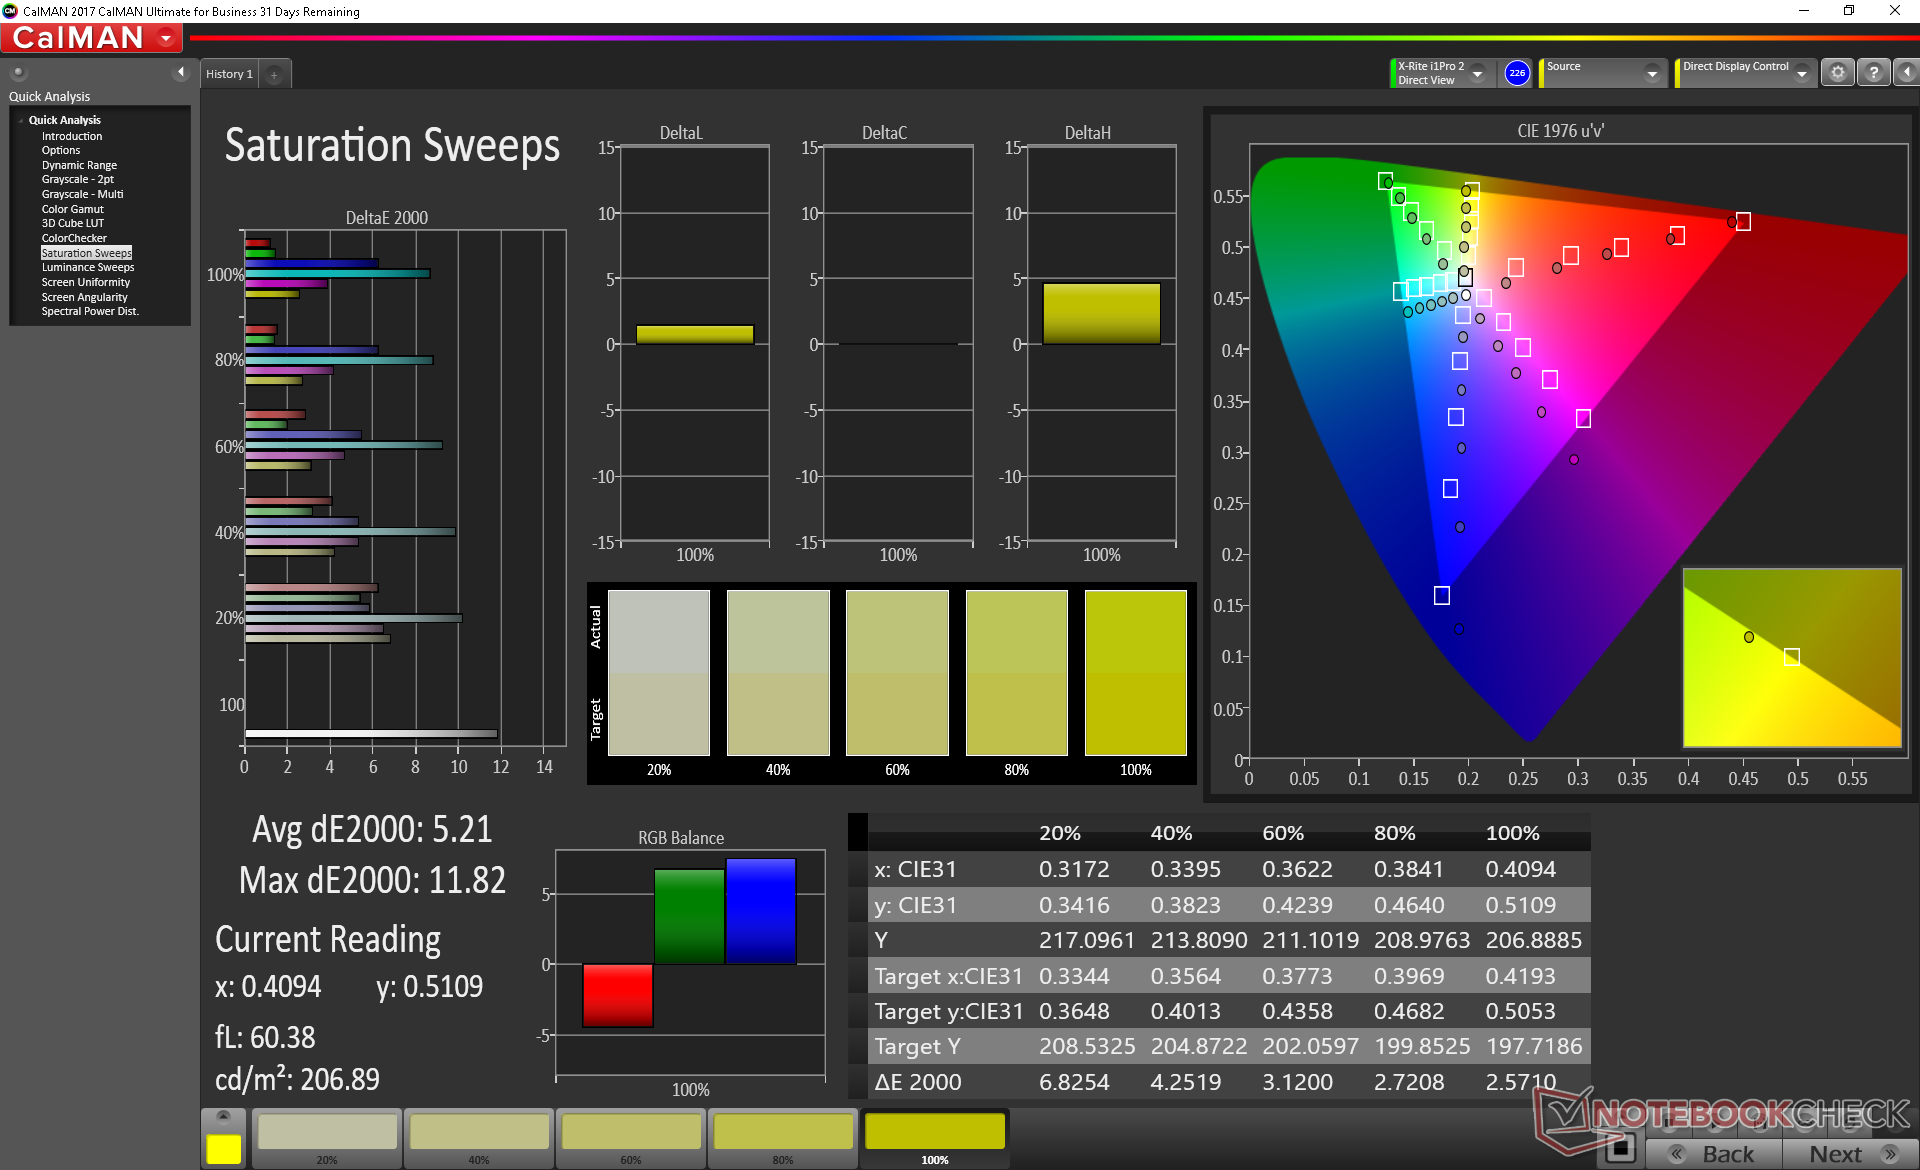
Dell ha equipaggiato la nostra unità Comet Lake-U con lo stesso pannello 4K UHD AU Optronics B133ZAN IPS della serie XPS 13 9380. Pertanto, caratteristiche innate come la copertura del colore, i tempi di risposta e i rapporti di contrasto sono quasi gli stessi.
L'effetto bleeding irregolare della retroilluminazione, tuttavia, questa volta è leggermente peggiore. La nostra immagine mostra un effetto bleeding moderato dagli angoli dello schermo che diventa evidente quando si visualizzano video con bordi neri.
La luminosità massima scende a circa 300 nits da 400 nits se scollegato da una presa di corrente. A differenza della maggior parte degli altri computer portatili, questo comportamento di risparmio energetico può essere attivato solo tramite il BIOS di XPS 13.
| |||||||||||||||||||||||||
Distribuzione della luminosità: 89 %
Al centro con la batteria: 311.7 cd/m²
Contrasto: 1047:1 (Nero: 0.39 cd/m²)
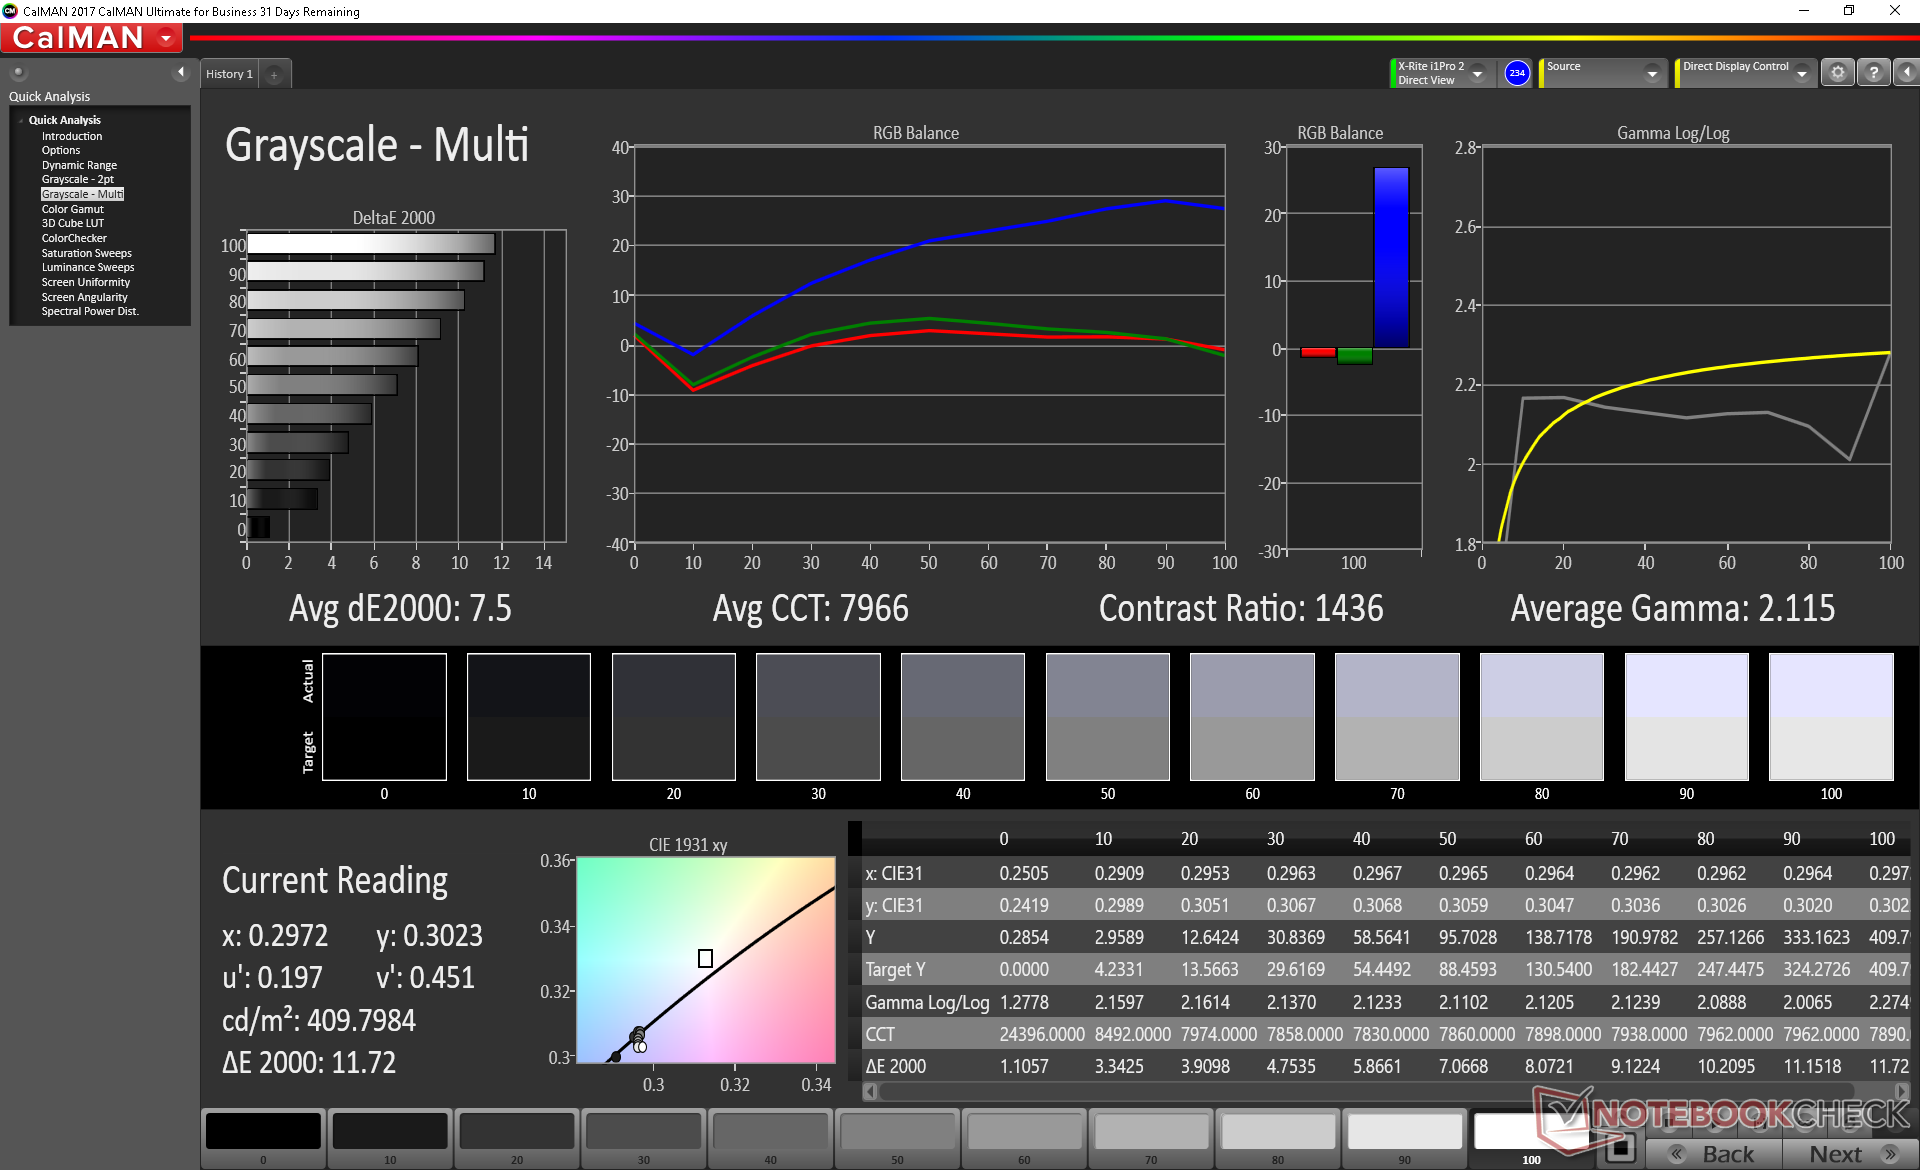
ΔE ColorChecker Calman: 4.6 | ∀{0.5-29.43 Ø4.72}
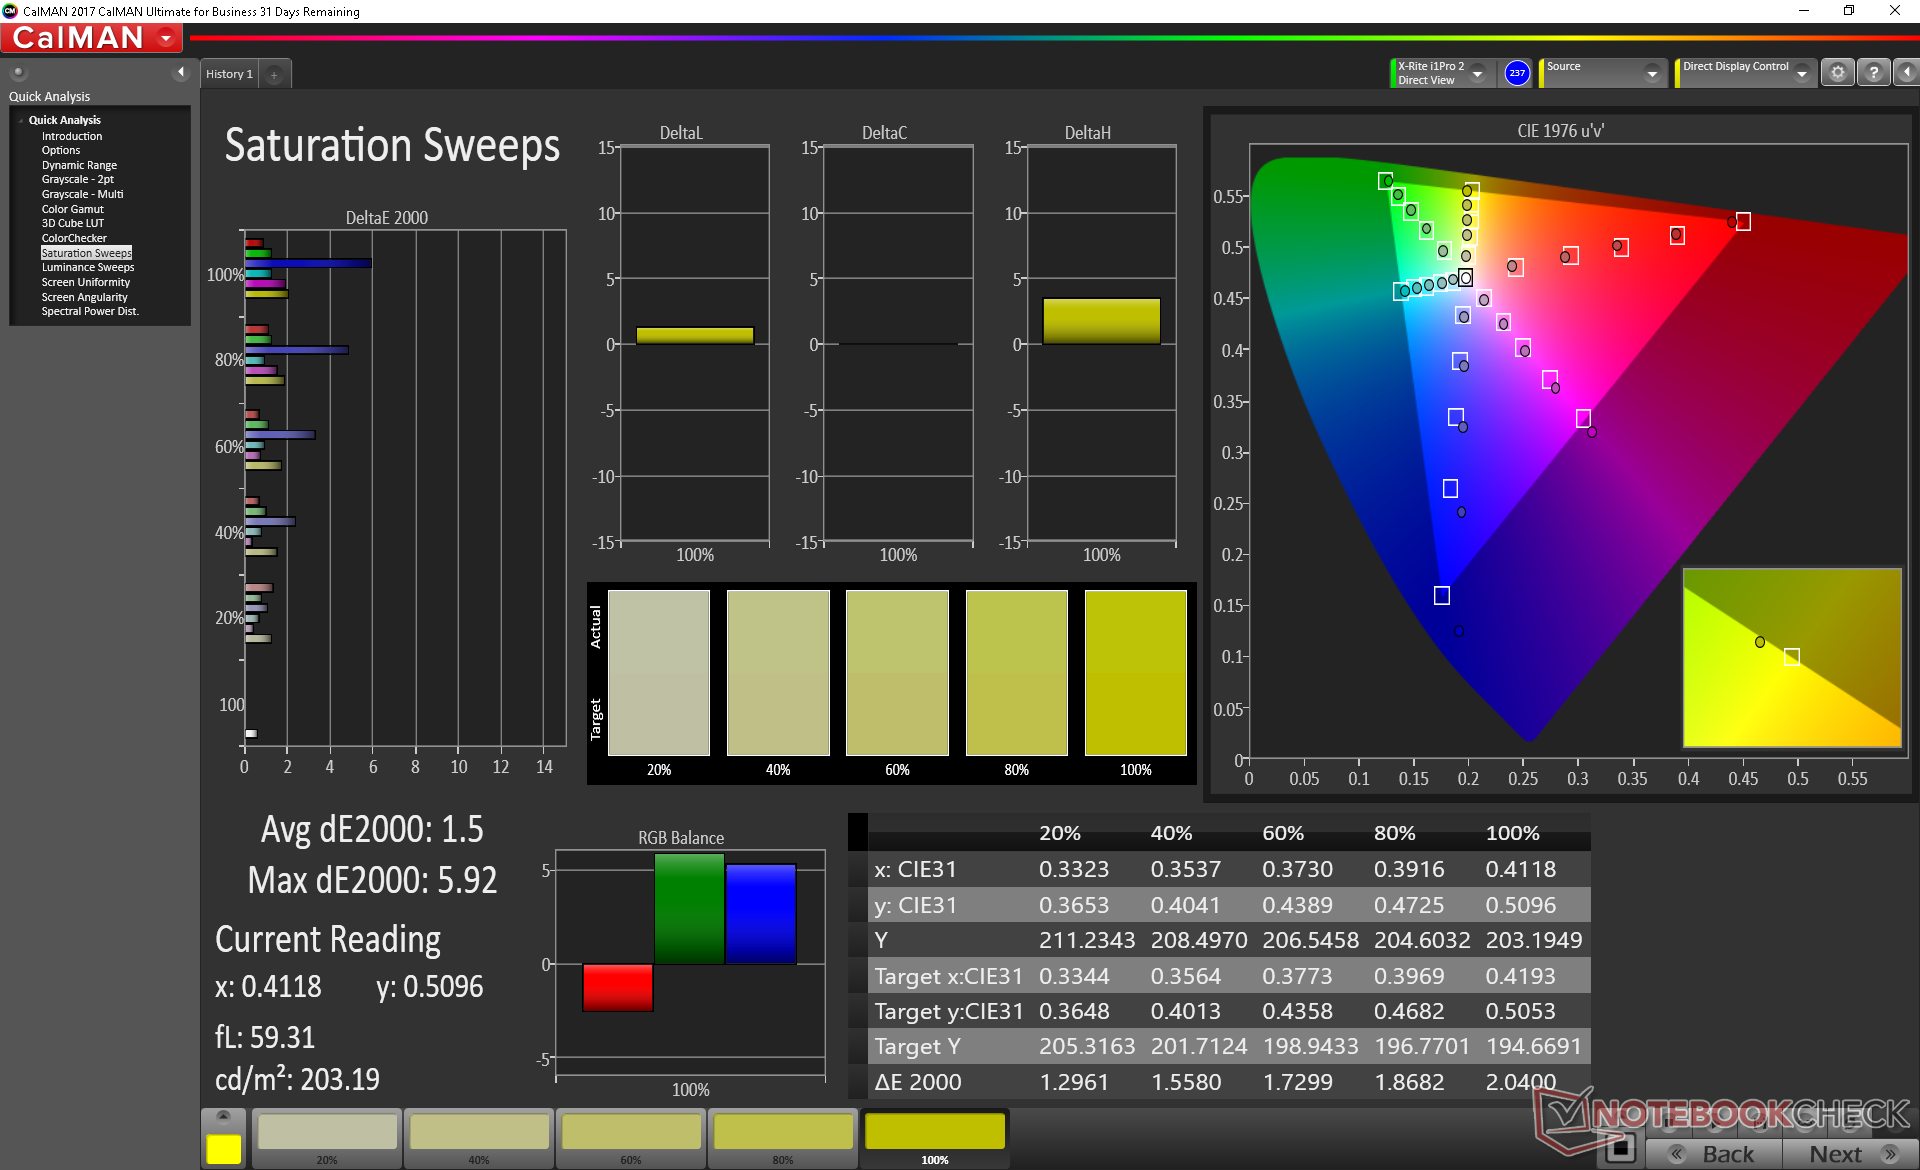
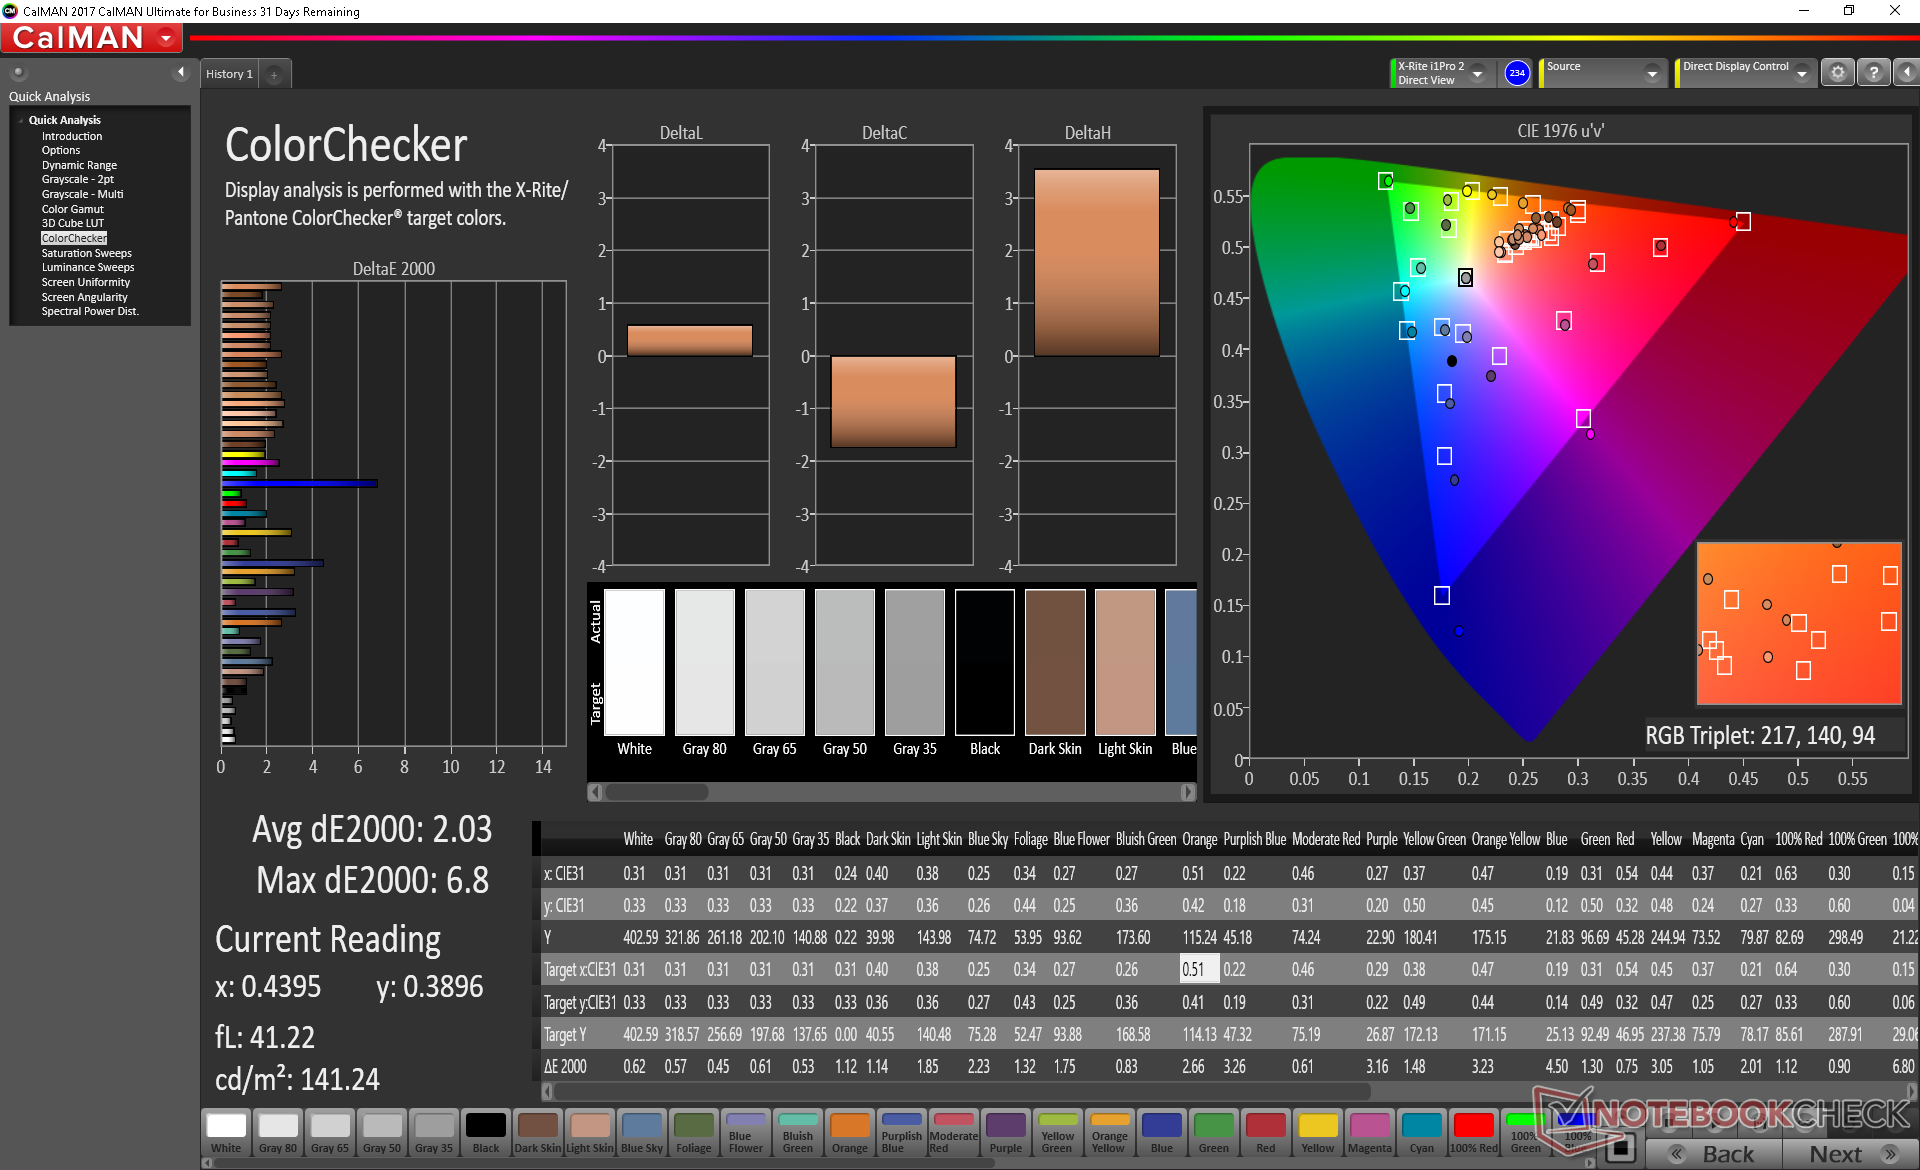
calibrated: 2.03
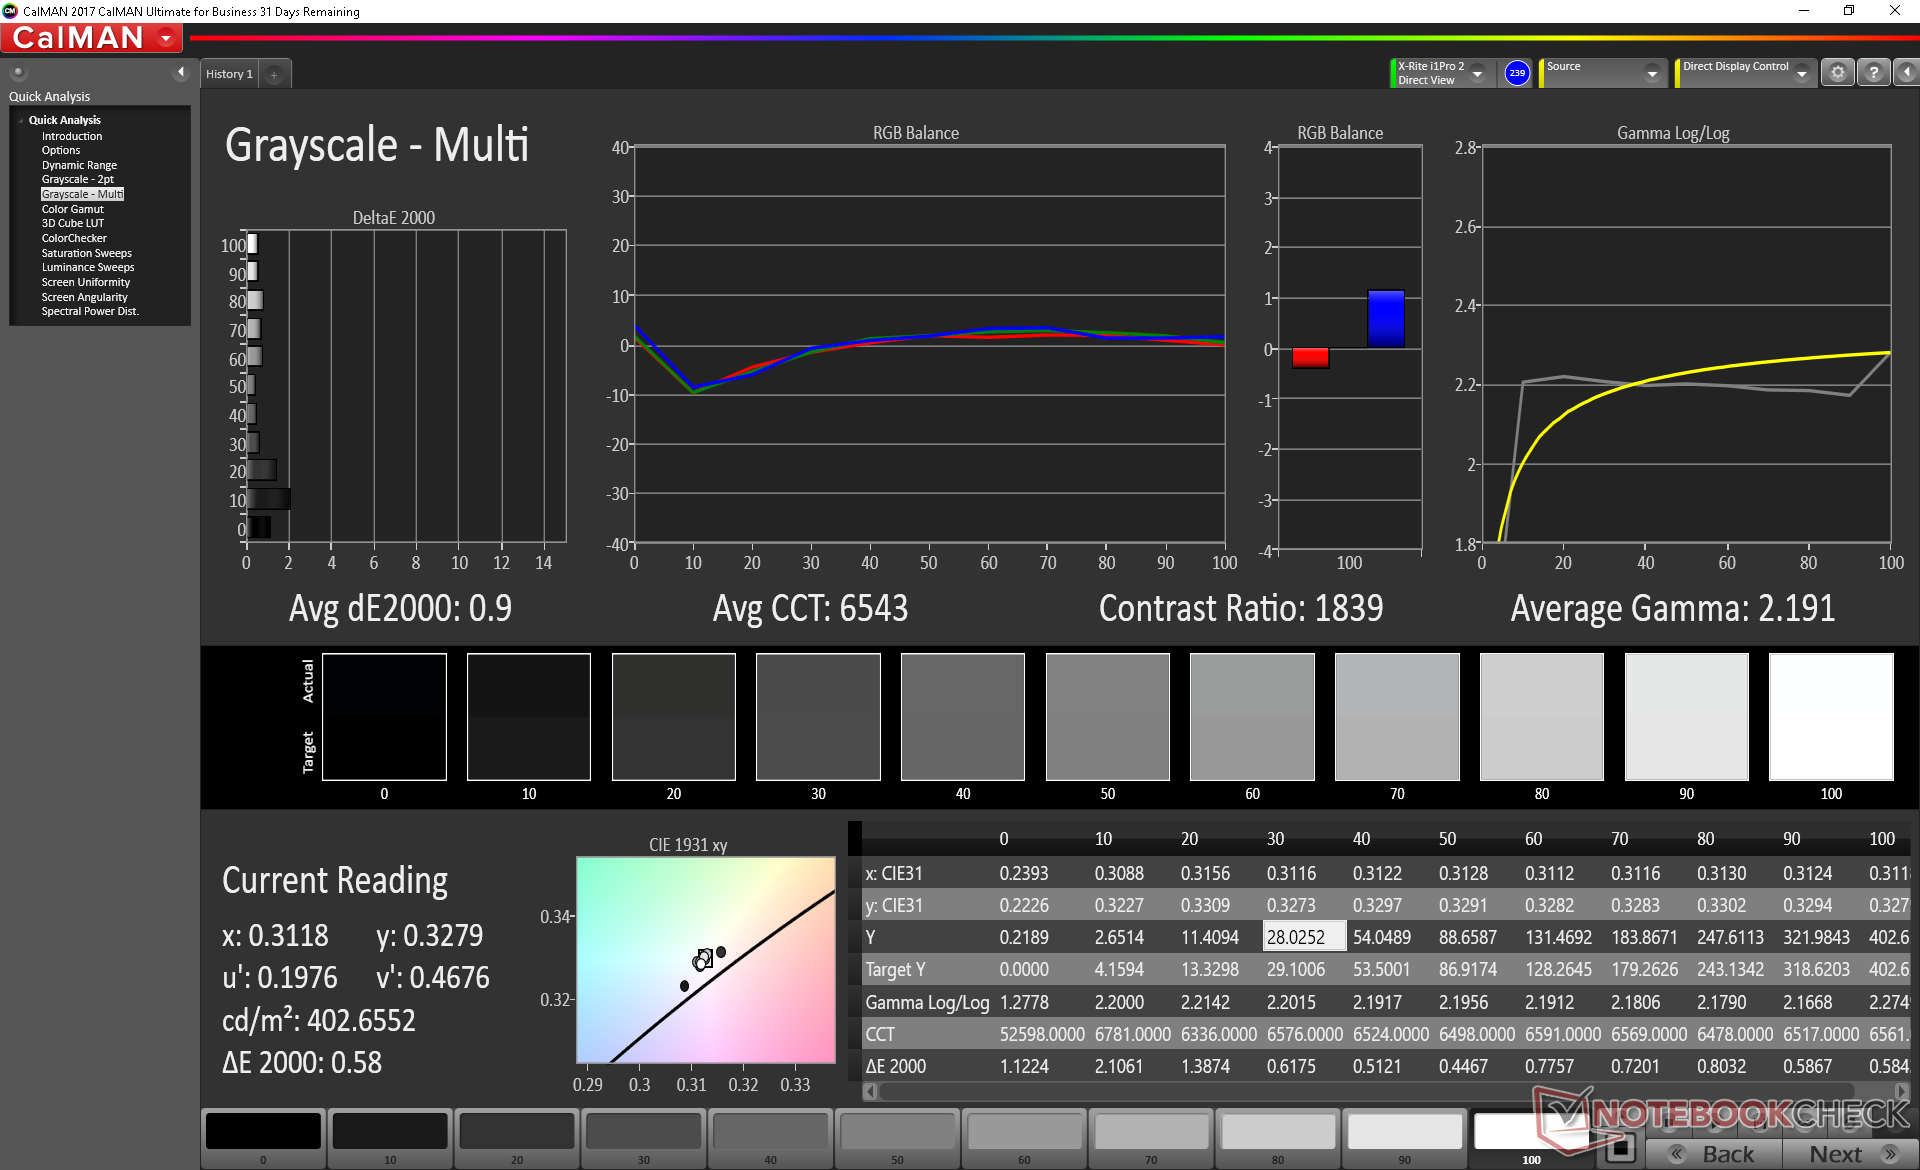
ΔE Greyscale Calman: 7.5 | ∀{0.09-98 Ø4.97}
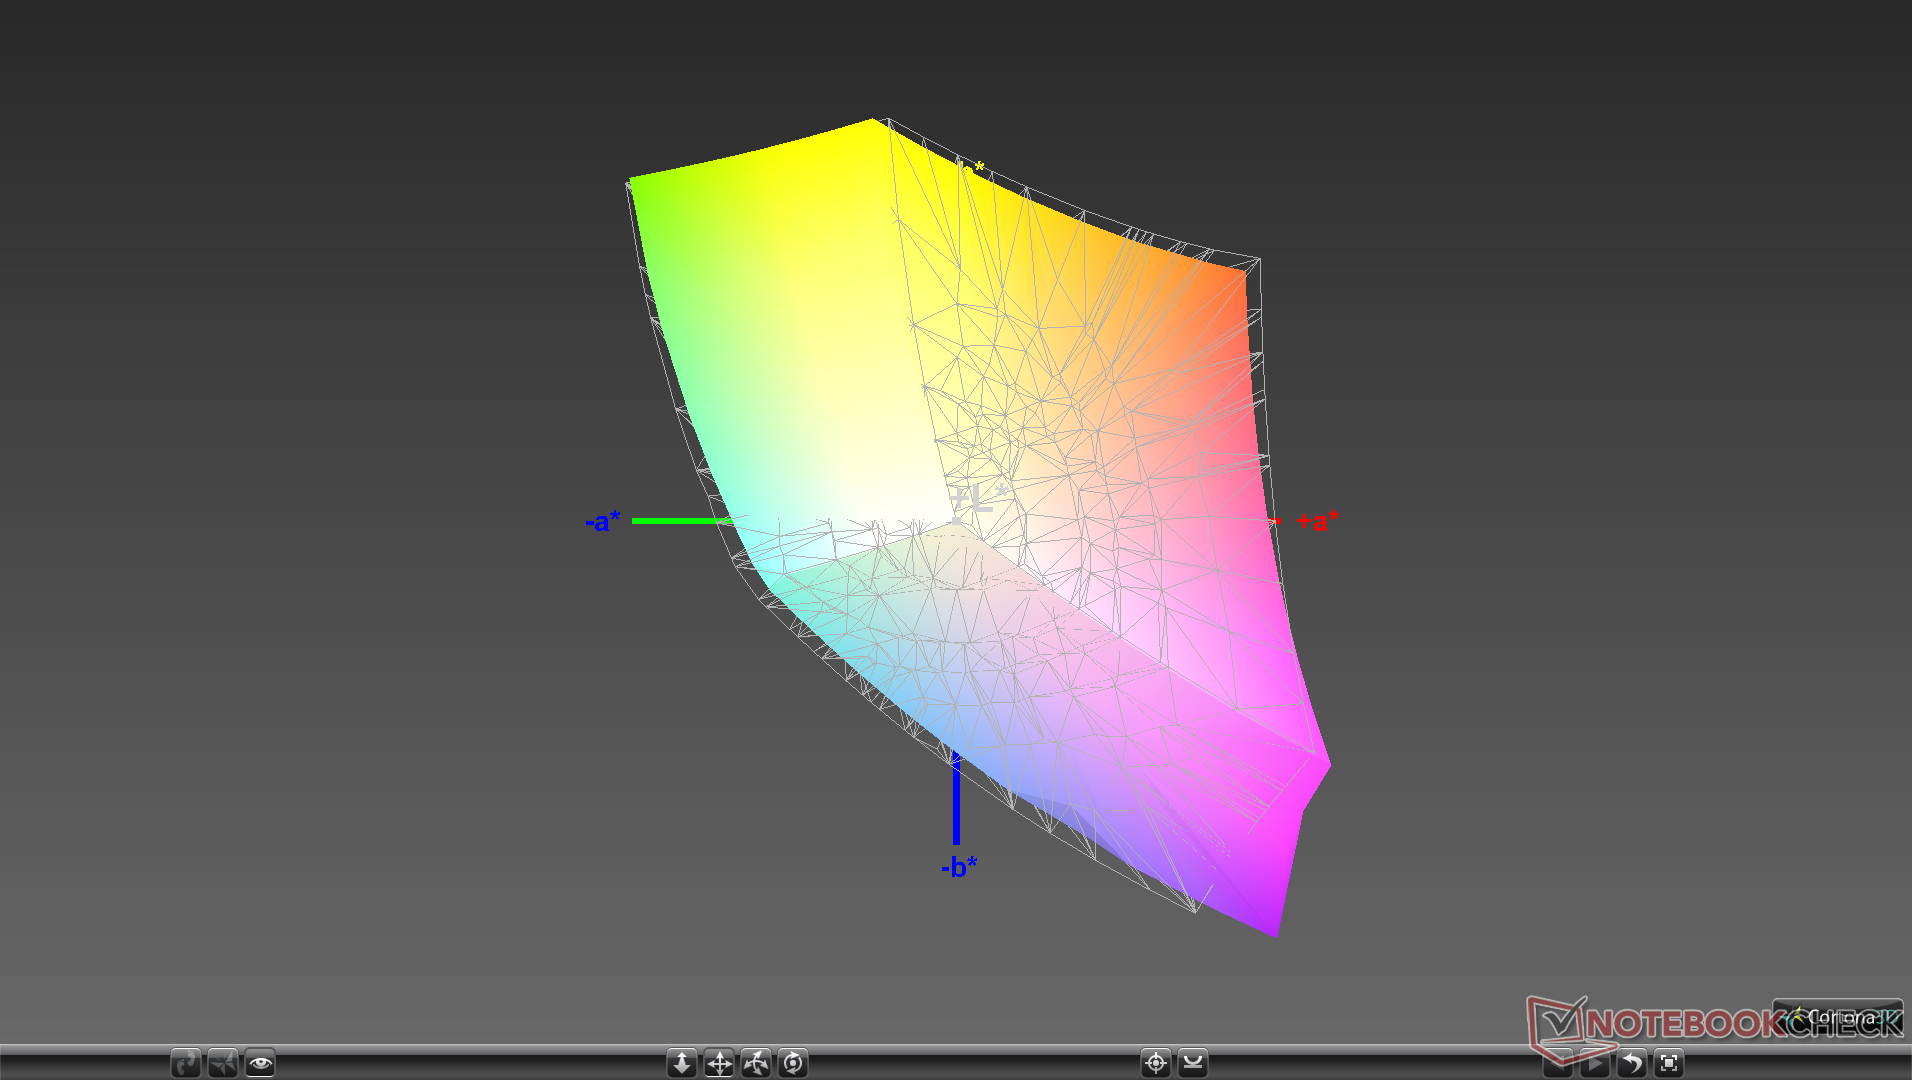
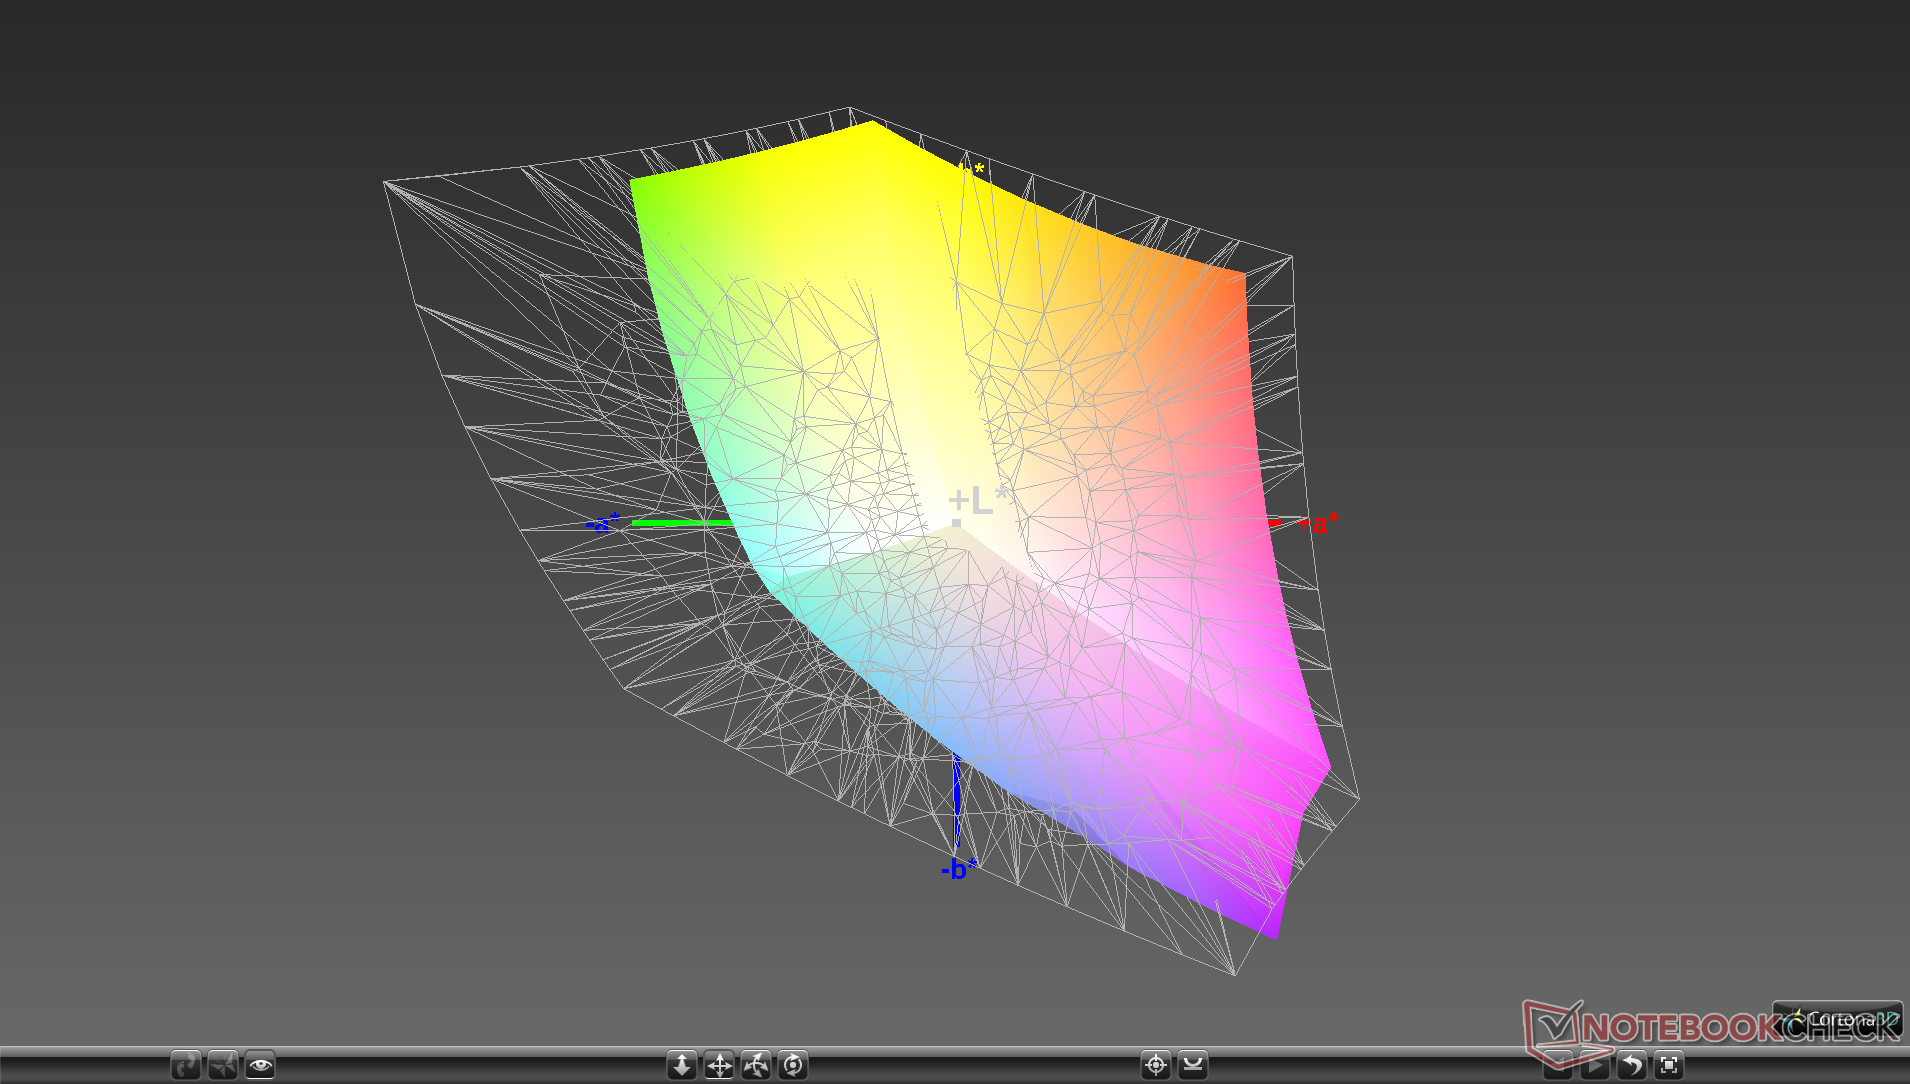
93.5% sRGB (Argyll 1.6.3 3D)
59.5% AdobeRGB 1998 (Argyll 1.6.3 3D)
64.3% AdobeRGB 1998 (Argyll 3D)
93.7% sRGB (Argyll 3D)
63.4% Display P3 (Argyll 3D)
Gamma: 2.12
CCT: 7966 K
| Dell XPS 13 7390 Core i7-10710U AU Optronics B133ZAN, Dell P/N: 90NTH, IPS, 13.3", 3840x2160 | Dell XPS 13 7390 2-in-1 Core i7 Sharp LQ134N1, IPS, 13.4", 1920x1200 | Dell XPS 13 9380 i7 4K ID: AUO 282B B133ZAN Dell: 90NTH, IPS, 13.3", 3840x2160 | Dell XPS 13 9380 2019 ID: AUO 282B B133ZAN Dell: 90NTH, IPS, 13.3", 3840x2160 | Dell XPS 13 9370 i7 UHD ID: Sharp SHP148B, Name: LQ133D1, Dell P/N: 8XDHY, IPS, 13.3", 3840x2160 | Dell XPS 13 i5-8250U ID: Sharp SHP144A, Name: LQ133Z1, IGZO IPS, 13.3", 3200x1800 | |
|---|---|---|---|---|---|---|
| Display | 9% | 1% | 1% | 7% | 0% | |
| Display P3 Coverage (%) | 63.4 | 69.9 10% | 64.8 2% | 64.7 2% | 68.9 9% | 63.9 1% |
| sRGB Coverage (%) | 93.7 | 99.2 6% | 93.6 0% | 93.1 -1% | 98.4 5% | 91.7 -2% |
| AdobeRGB 1998 Coverage (%) | 64.3 | 71.5 11% | 65.8 2% | 65.3 2% | 69.5 8% | 65.7 2% |
| Response Times | 11% | -20% | -10% | -33% | 28% | |
| Response Time Grey 50% / Grey 80% * (ms) | 51.6 ? | 47.6 ? 8% | 64.8 ? -26% | 58 ? -12% | 69.6 ? -35% | 29 ? 44% |
| Response Time Black / White * (ms) | 33.6 ? | 29.2 ? 13% | 38 ? -13% | 36 ? -7% | 44 ? -31% | 30 ? 11% |
| PWM Frequency (Hz) | 2500 ? | 3759 ? | 19500 ? | |||
| Screen | 30% | 21% | 9% | 18% | 1% | |
| Brightness middle (cd/m²) | 408.2 | 549.8 35% | 428.3 5% | 404 -1% | 478.5 17% | 361 -12% |
| Brightness (cd/m²) | 399 | 520 30% | 414 4% | 389 -3% | 466 17% | 303 -24% |
| Brightness Distribution (%) | 89 | 86 -3% | 88 -1% | 85 -4% | 86 -3% | 72 -19% |
| Black Level * (cd/m²) | 0.39 | 0.39 -0% | 0.27 31% | 0.37 5% | 0.43 -10% | 0.33 15% |
| Contrast (:1) | 1047 | 1410 35% | 1586 51% | 1092 4% | 1113 6% | 1094 4% |
| Colorchecker dE 2000 * | 4.6 | 2.12 54% | 2.69 42% | 3.72 19% | 3.09 33% | 5.26 -14% |
| Colorchecker dE 2000 max. * | 11.84 | 3.66 69% | 6.19 48% | 7.38 38% | 5.94 50% | 7.79 34% |
| Colorchecker dE 2000 calibrated * | 2.03 | 1.37 33% | 2.01 1% | 2.06 -1% | 2.06 -1% | |
| Greyscale dE 2000 * | 7.5 | 2.6 65% | 3.7 51% | 4.44 41% | 2.4 68% | 5.69 24% |
| Gamma | 2.12 104% | 2.3 96% | 2.1 105% | 2.34 94% | 2.063 107% | 1.63 135% |
| CCT | 7966 82% | 6884 94% | 6706 97% | 7095 92% | 6883 94% | 6499 100% |
| Color Space (Percent of AdobeRGB 1998) (%) | 59.5 | 65.4 10% | 60.4 2% | 60 1% | 69.47 17% | 59 -1% |
| Color Space (Percent of sRGB) (%) | 93.5 | 99.7 7% | 93.5 0% | 93 -1% | 98.36 5% | 92 -2% |
| Media totale (Programma / Settaggio) | 17% /
24% | 1% /
12% | 0% /
5% | -3% /
10% | 10% /
4% |
* ... Meglio usare valori piccoli

Tempi di risposta del Display
| ↔ Tempi di risposta dal Nero al Bianco | ||
|---|---|---|
| 33.6 ms ... aumenta ↗ e diminuisce ↘ combinato | ↗ 17.2 ms Incremento | 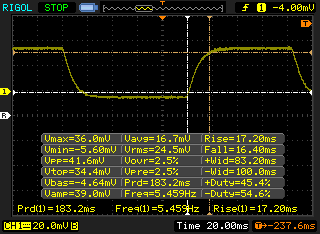 |
| ↘ 16.4 ms Calo | ||
| Lo schermo mostra tempi di risposta lenti nei nostri tests e sarà insoddisfacente per i gamers. In confronto, tutti i dispositivi di test variano da 0.1 (minimo) a 240 (massimo) ms. » 90 % di tutti i dispositivi è migliore. Questo significa che i tempi di risposta rilevati sono peggiori rispetto alla media di tutti i dispositivi testati (19.9 ms). | ||
| ↔ Tempo di risposta dal 50% Grigio all'80% Grigio | ||
| 51.6 ms ... aumenta ↗ e diminuisce ↘ combinato | ↗ 26.4 ms Incremento | 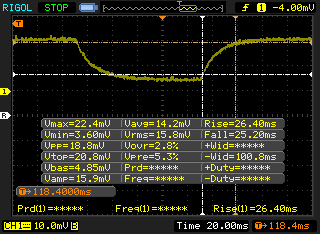 |
| ↘ 25.2 ms Calo | ||
| Lo schermo mostra tempi di risposta lenti nei nostri tests e sarà insoddisfacente per i gamers. In confronto, tutti i dispositivi di test variano da 0.165 (minimo) a 636 (massimo) ms. » 88 % di tutti i dispositivi è migliore. Questo significa che i tempi di risposta rilevati sono peggiori rispetto alla media di tutti i dispositivi testati (31.1 ms). | ||
Sfarfallio dello schermo / PWM (Pulse-Width Modulation)
| flickering dello schermo / PWM non rilevato | 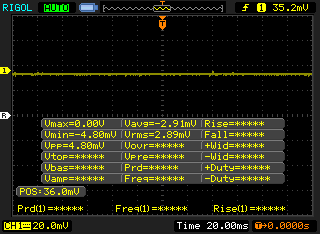 | ||
In confronto: 52 % di tutti i dispositivi testati non utilizza PWM per ridurre la luminosita' del display. Se è rilevato PWM, una media di 7784 (minimo: 5 - massimo: 343500) Hz è stata rilevata. | |||
Prestazioni

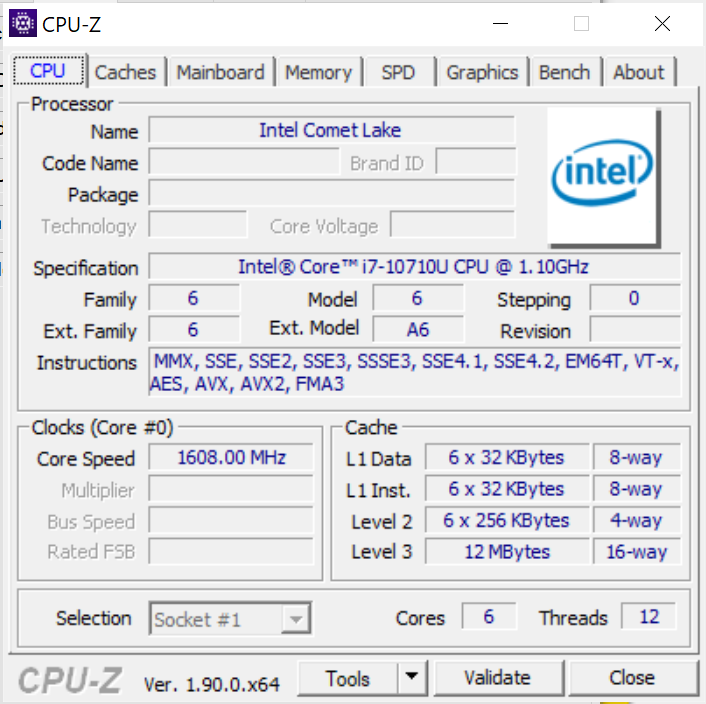
Proprio come il salto dal dual-core Kaby Lake al quad-core Kaby Lake-R, il Comet Lake-U hexa-core aggiunge altri due cores fisici per un totale di 12 threads sotto lo stesso limite da 15 W a 25 W di potenza. Intel è persino riuscita ad aumentare la frequenza del singolo core Turbo Boost da 4,6 GHz sul Core i7-8565U a 4,7 GHz sul Core i7-10710U. Si noti che solo la SKU Core i7 è hexa-core in quanto l'opzione Core i5-10210U Comet Lake-U è quad-core.
Come previsto, l'XPS 13 soffre ancora di problemi di latenza DPC proprio come molti dei suoi fratelli maggiori.
Processore
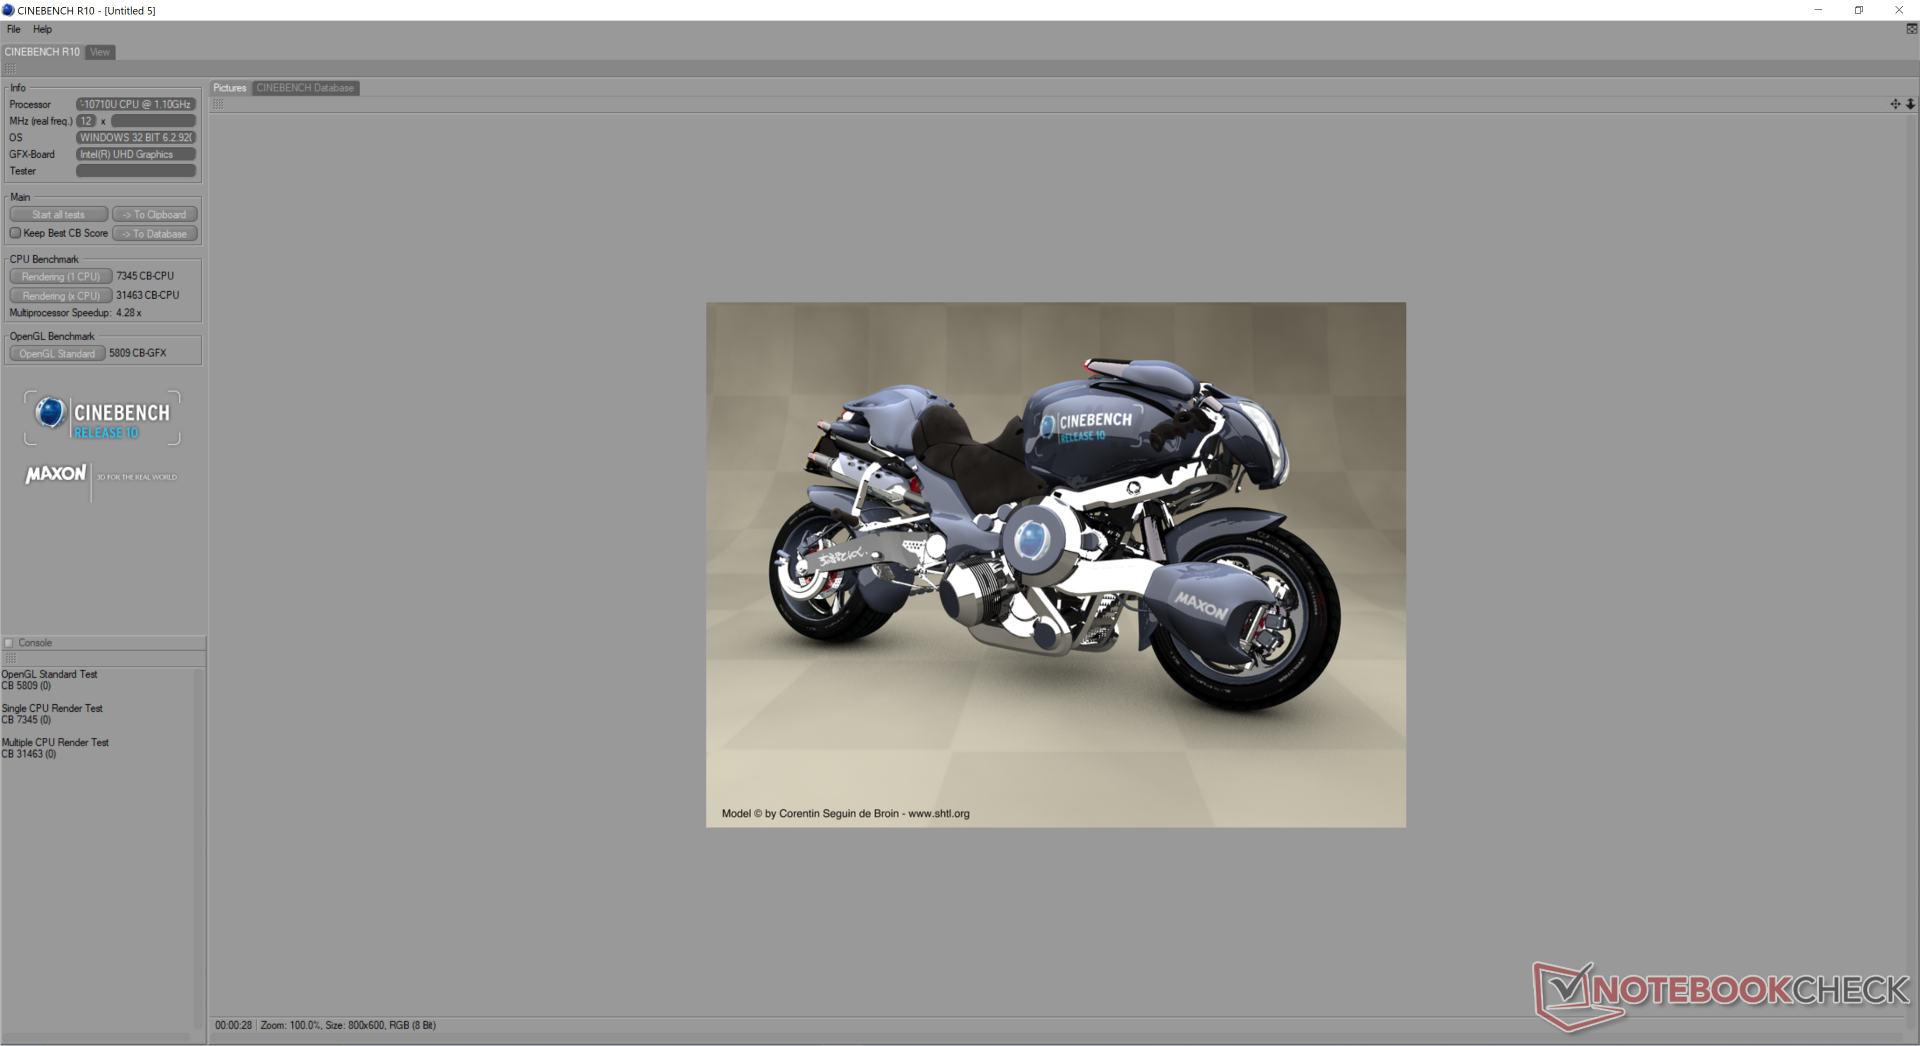
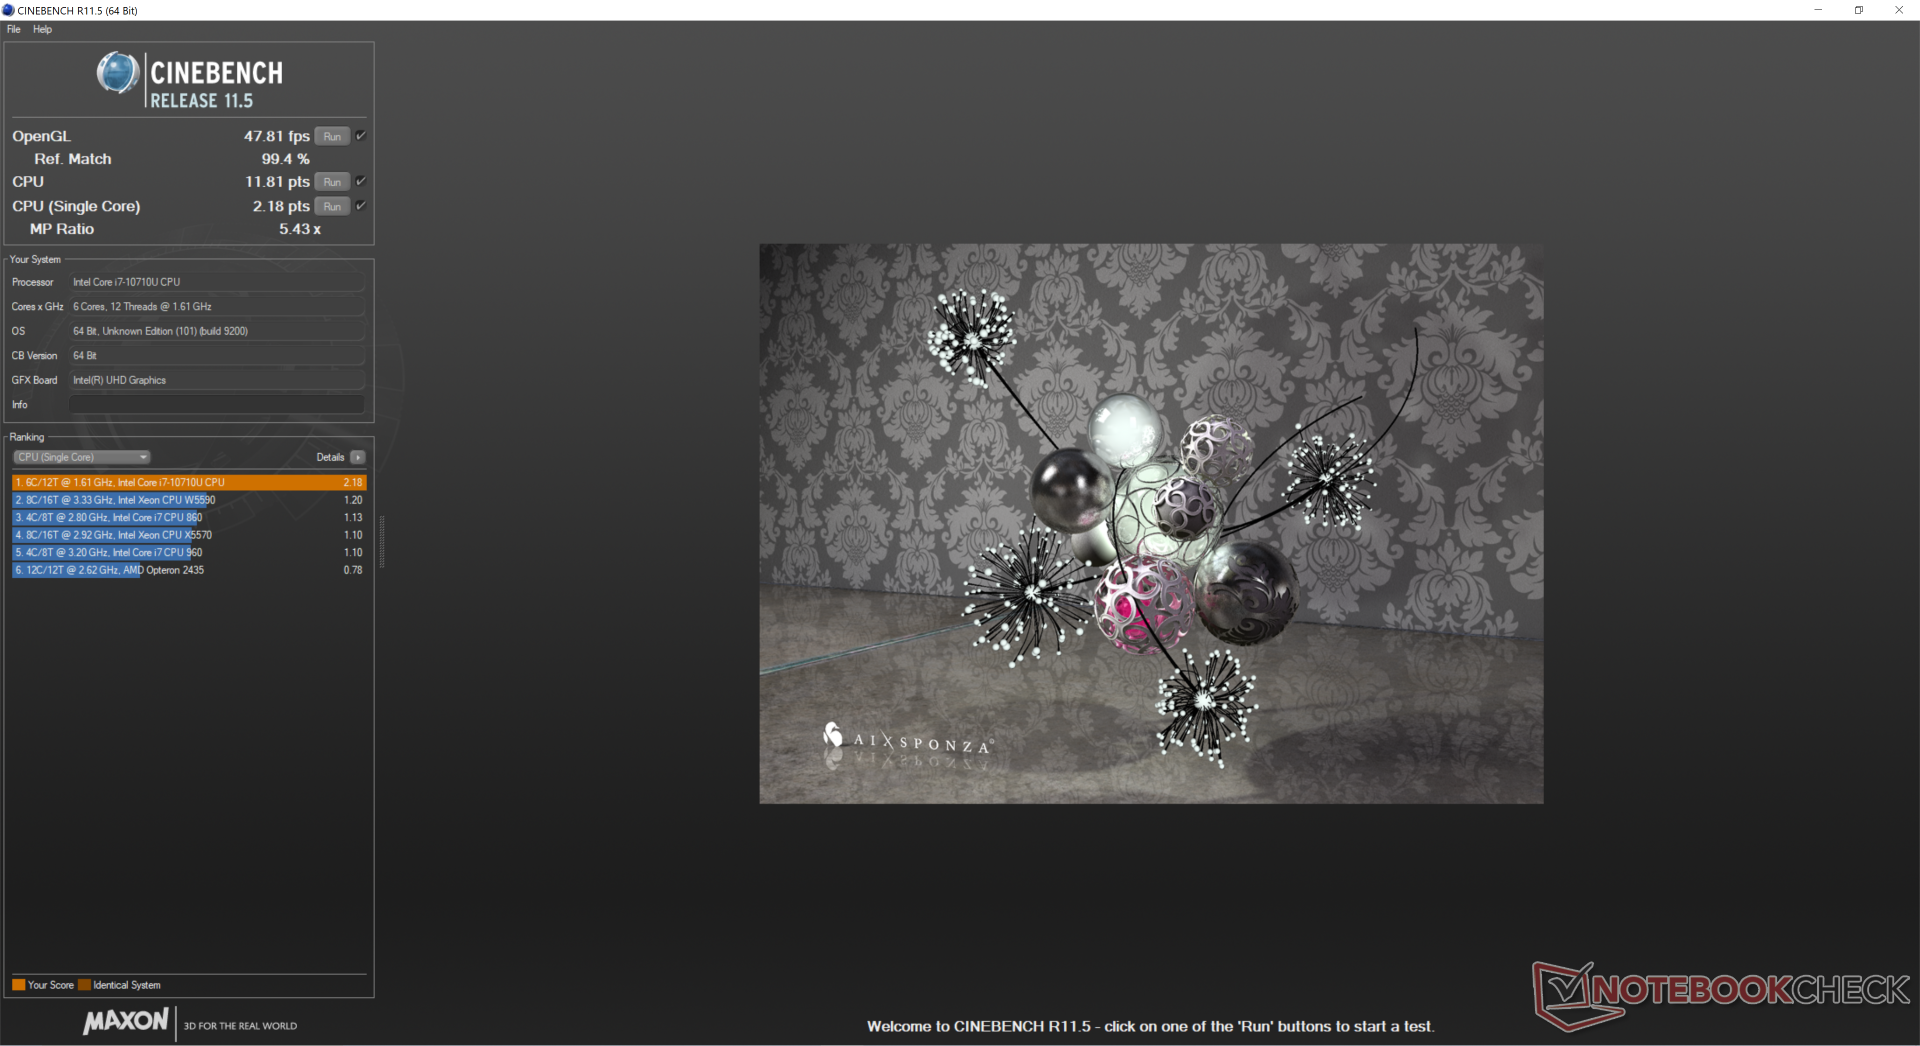
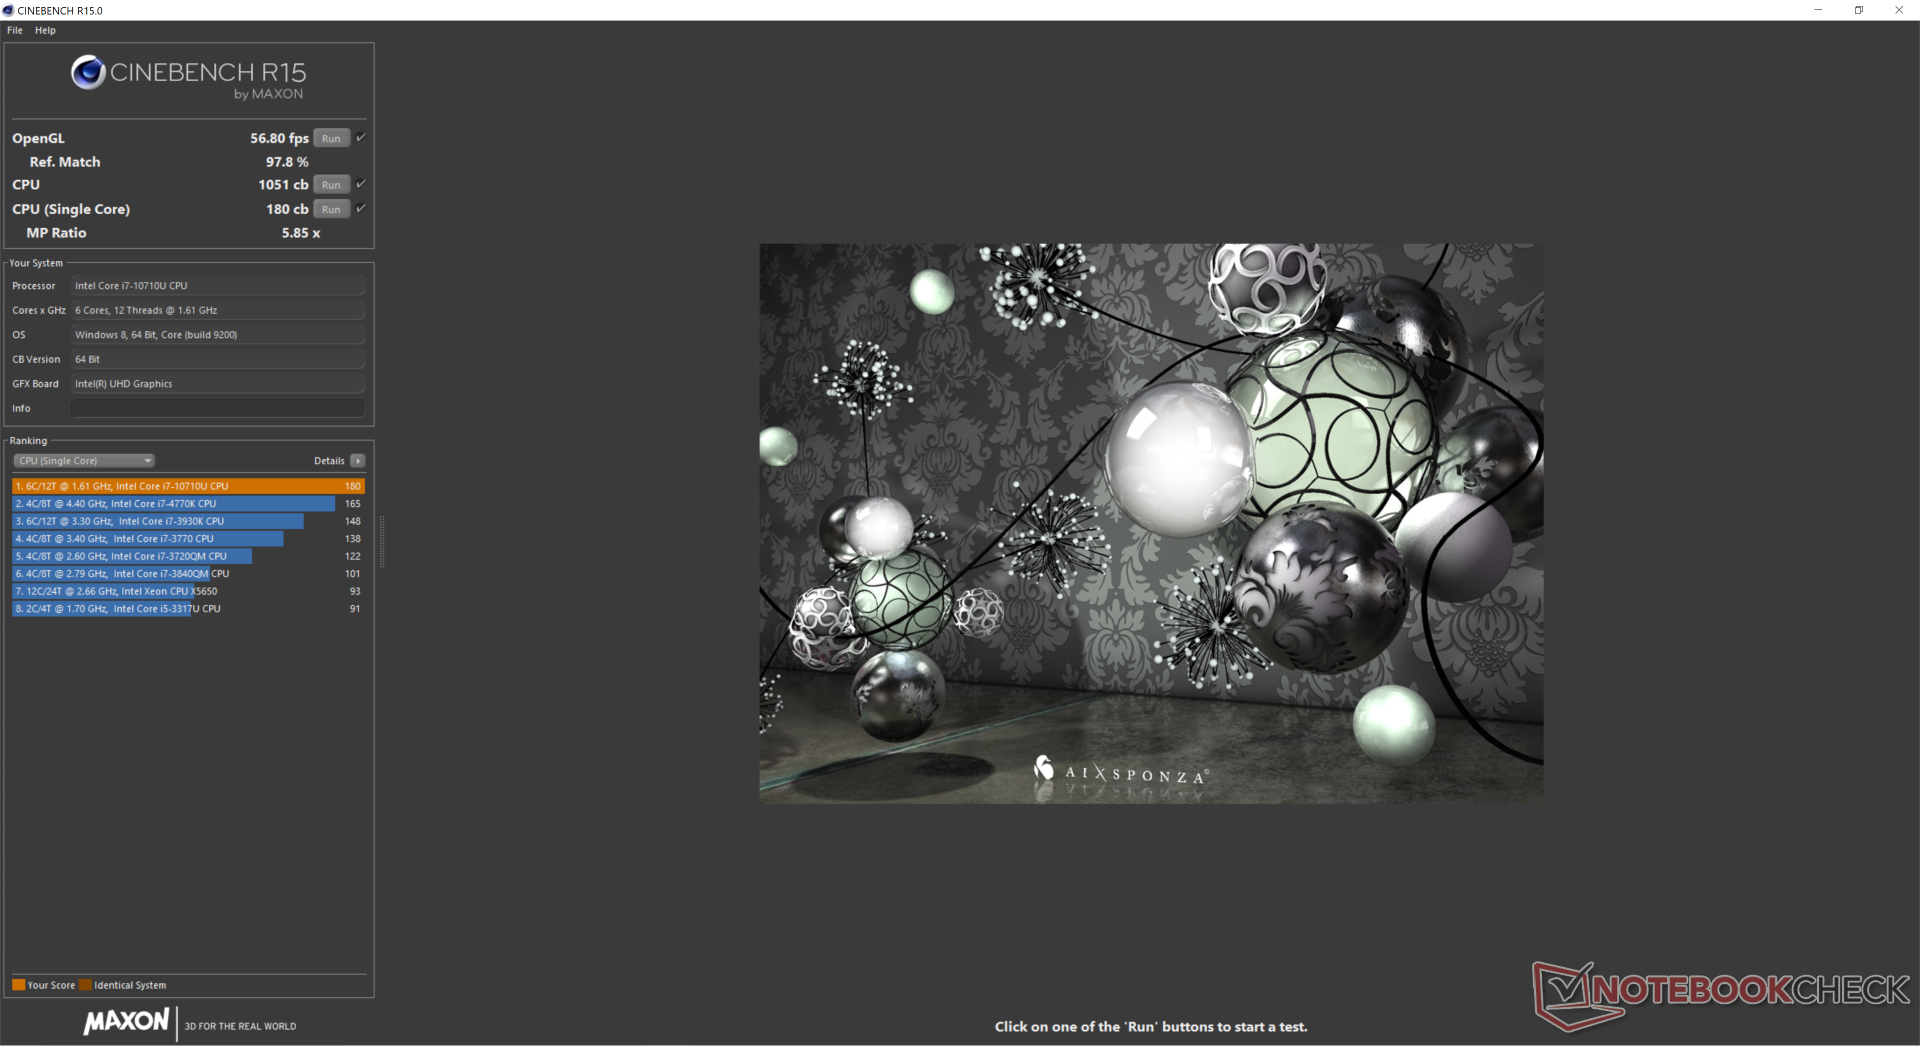
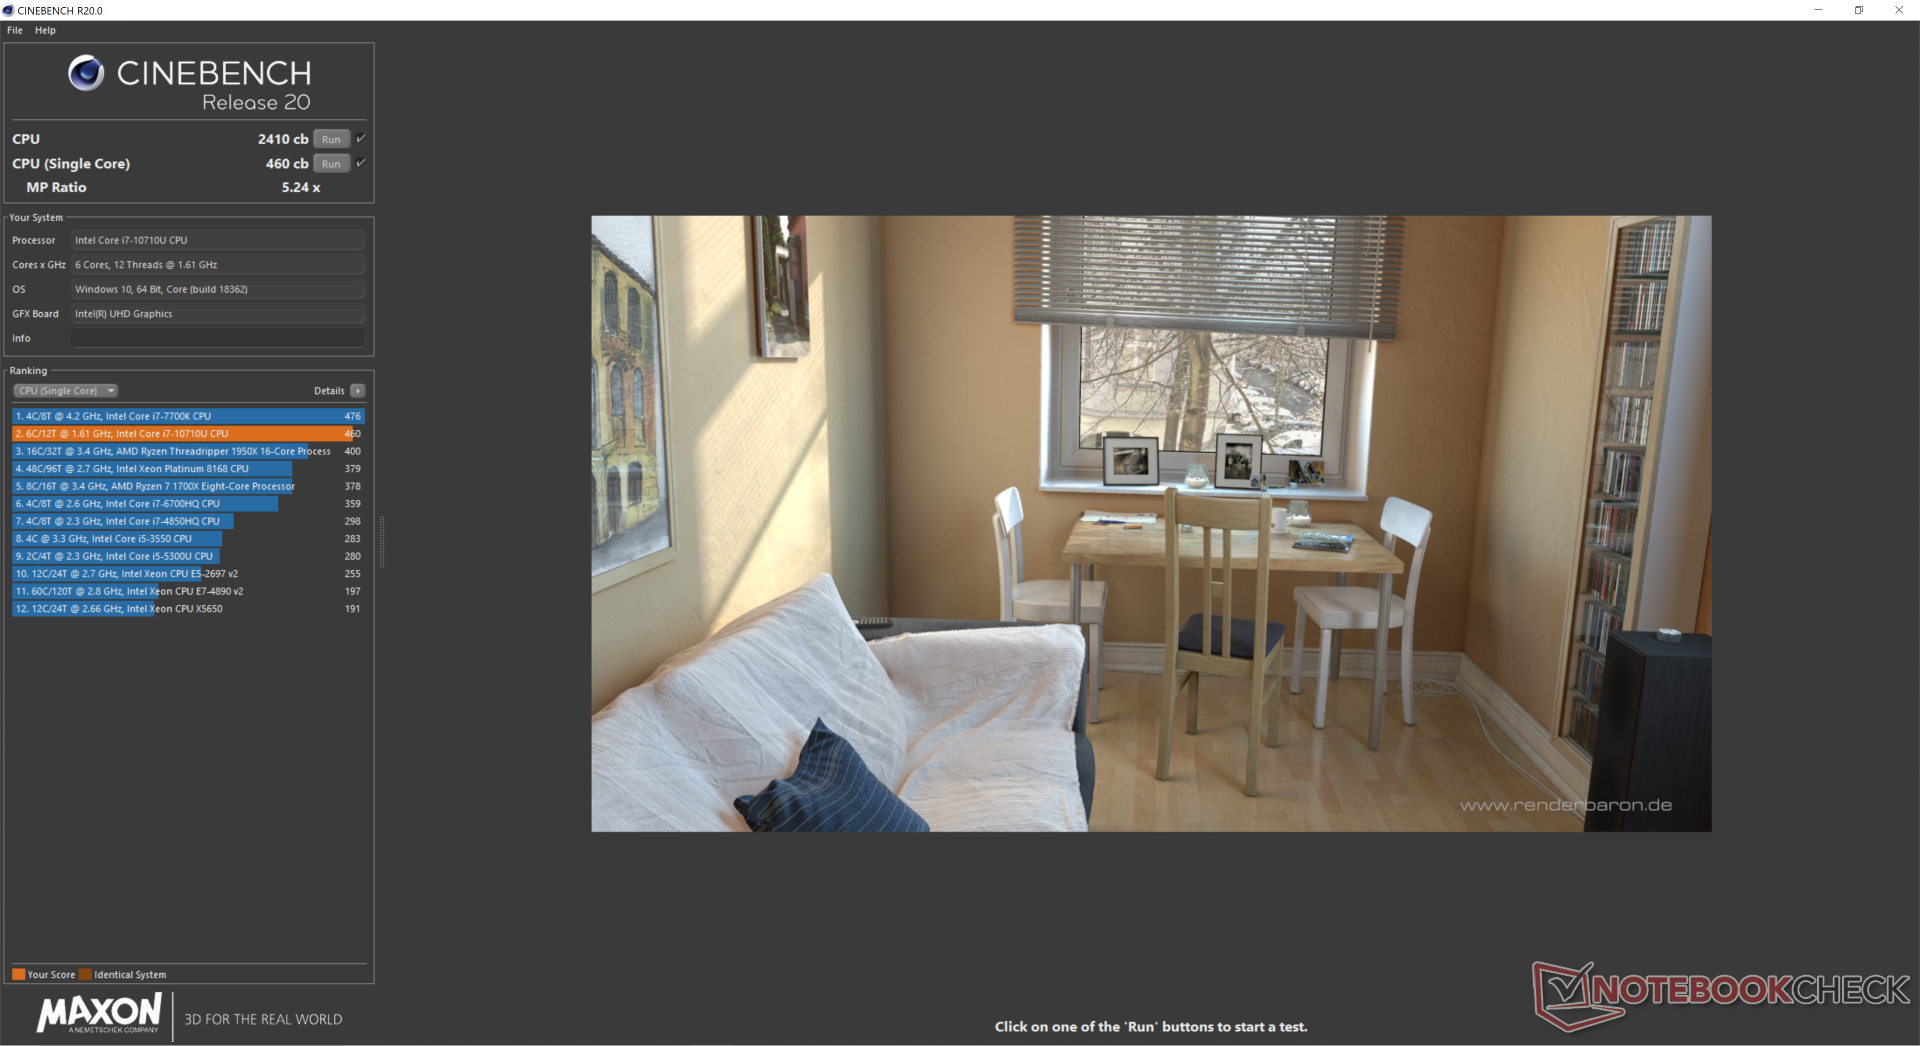
Le prestazioni della CPU sono impressionanti a prima vista a causa del potenziale di Turbo Boost multi-core molto veloce ma di breve durata della CPU hexa-core. Come illustrato dal nostro grafico qui sotto, l'esecuzione di CineBench R15 Multi-Thread in un ciclo porta a punteggi iniziali elevati prima che le prestazioni si riducano nel tempo per tenere sotto controllo le temperature. Mentre questo comportamento è normale per le CPU ULV, la misura in cui ciò accade è più estrema sull'hexa-core XPS 13 7390. I punteggi più alti e più bassi registrati sulla nostra unità hexa-core, per esempio, sono stati rispettivamente di 1062 punti e 689 punti, rispetto ai 637 punti e 581 punti del vecchio XPS 13 9370 con la CPU Core i7-8550U. Questo significa che l'XPS 13 7390 hexa-core dà il suo meglio quando si desiderano brevi picchi di alte prestazioni della CPU.
Guardate le nostre pagine dedicate al Core i7-10710U per maggiori informazioni tecniche e confronti con i benchmarks.
* ... Meglio usare valori piccoli
Prestazioni di sistema
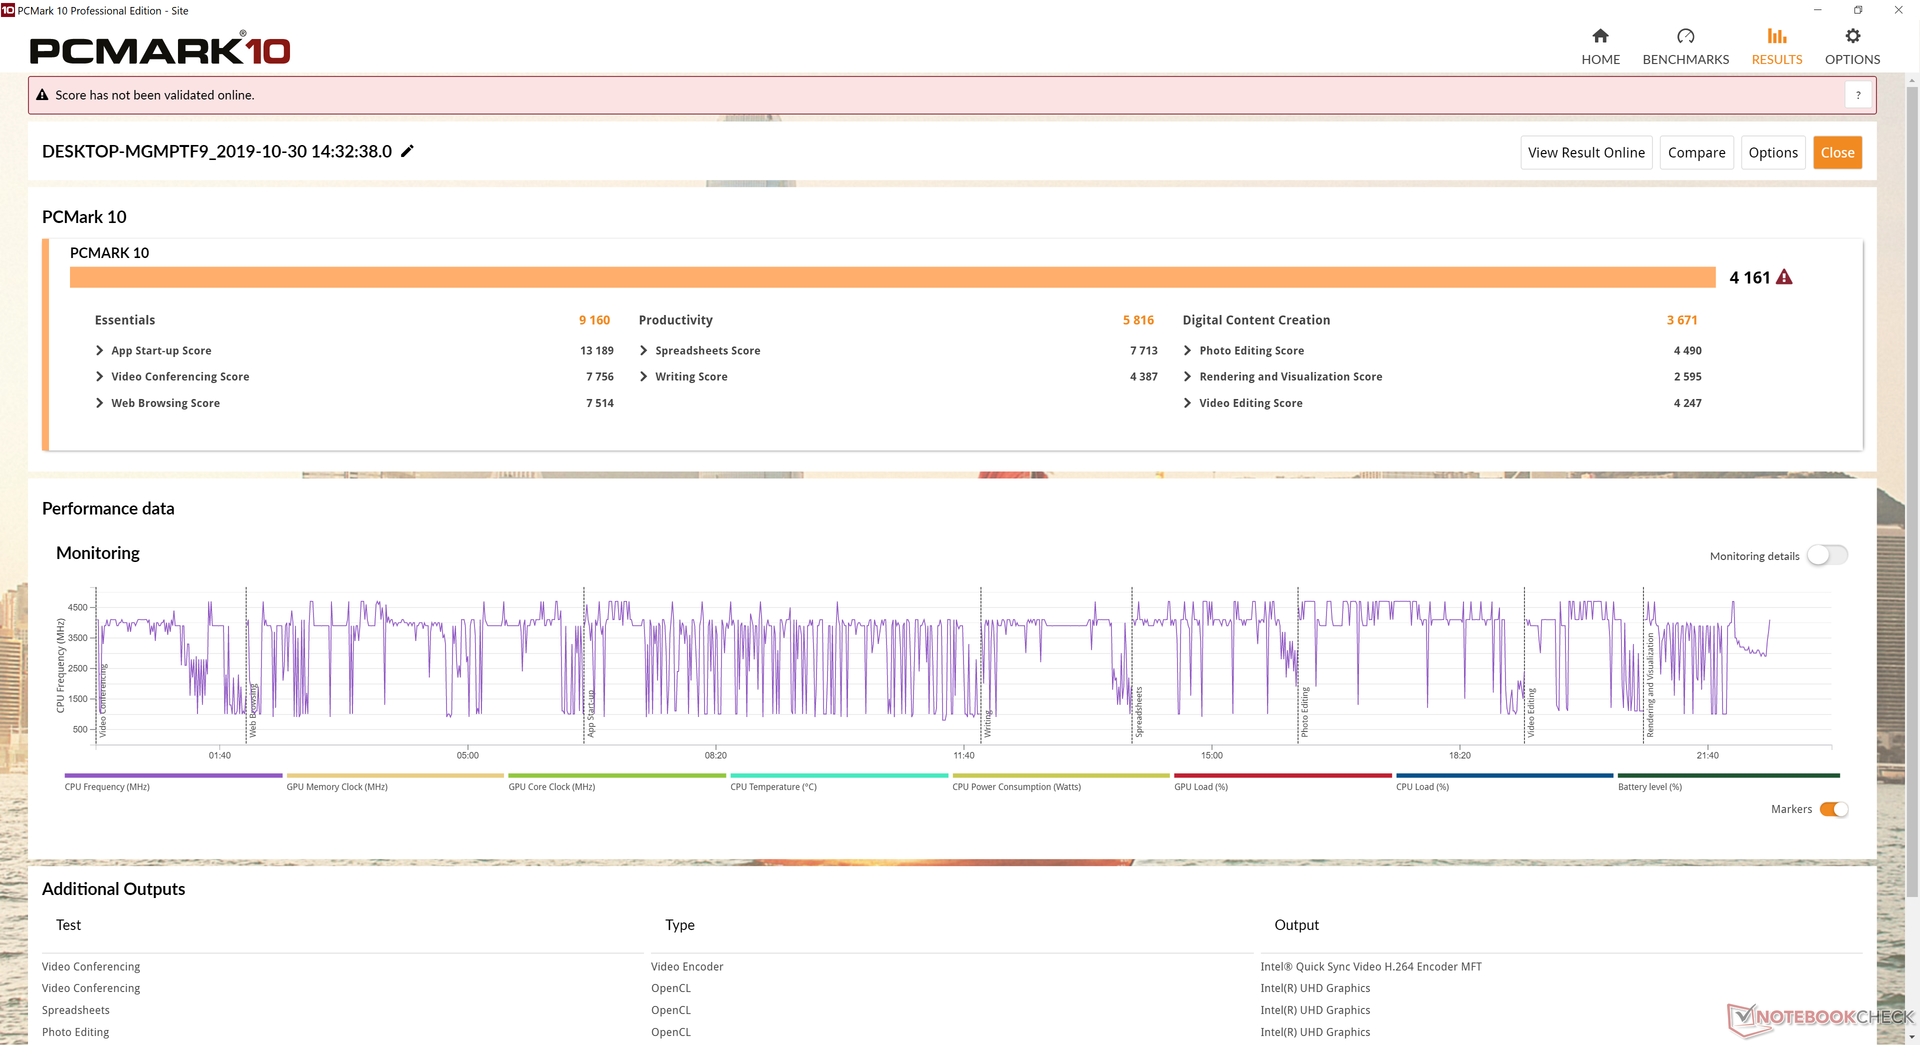
I benchmarks PCMark collocano il nostro XPS 13 7390 Comet Lake-U-powered dietro l'XPS 13 7390 2-in-1 Ice Lake-U-powered nonostante le prestazioni della CPU più veloci del primo. È probabile che la più potente GPU Iris Plus del Core i7-1065G7 sia stata sufficiente a spingere l'XPS 13 7390 2-in-1 sopra la sorella.
Non abbiamo avuto problemi di software o hardware durante il tempo trascorso con l'unità. Raccomandiamo agli utenti di familiarizzare con l'applicazione Dell Power Manager in quanto qui è possibile accedere a funzioni chiave come i profili di potenza, il livello delle prestazioni e lo stato di carica della batteria.
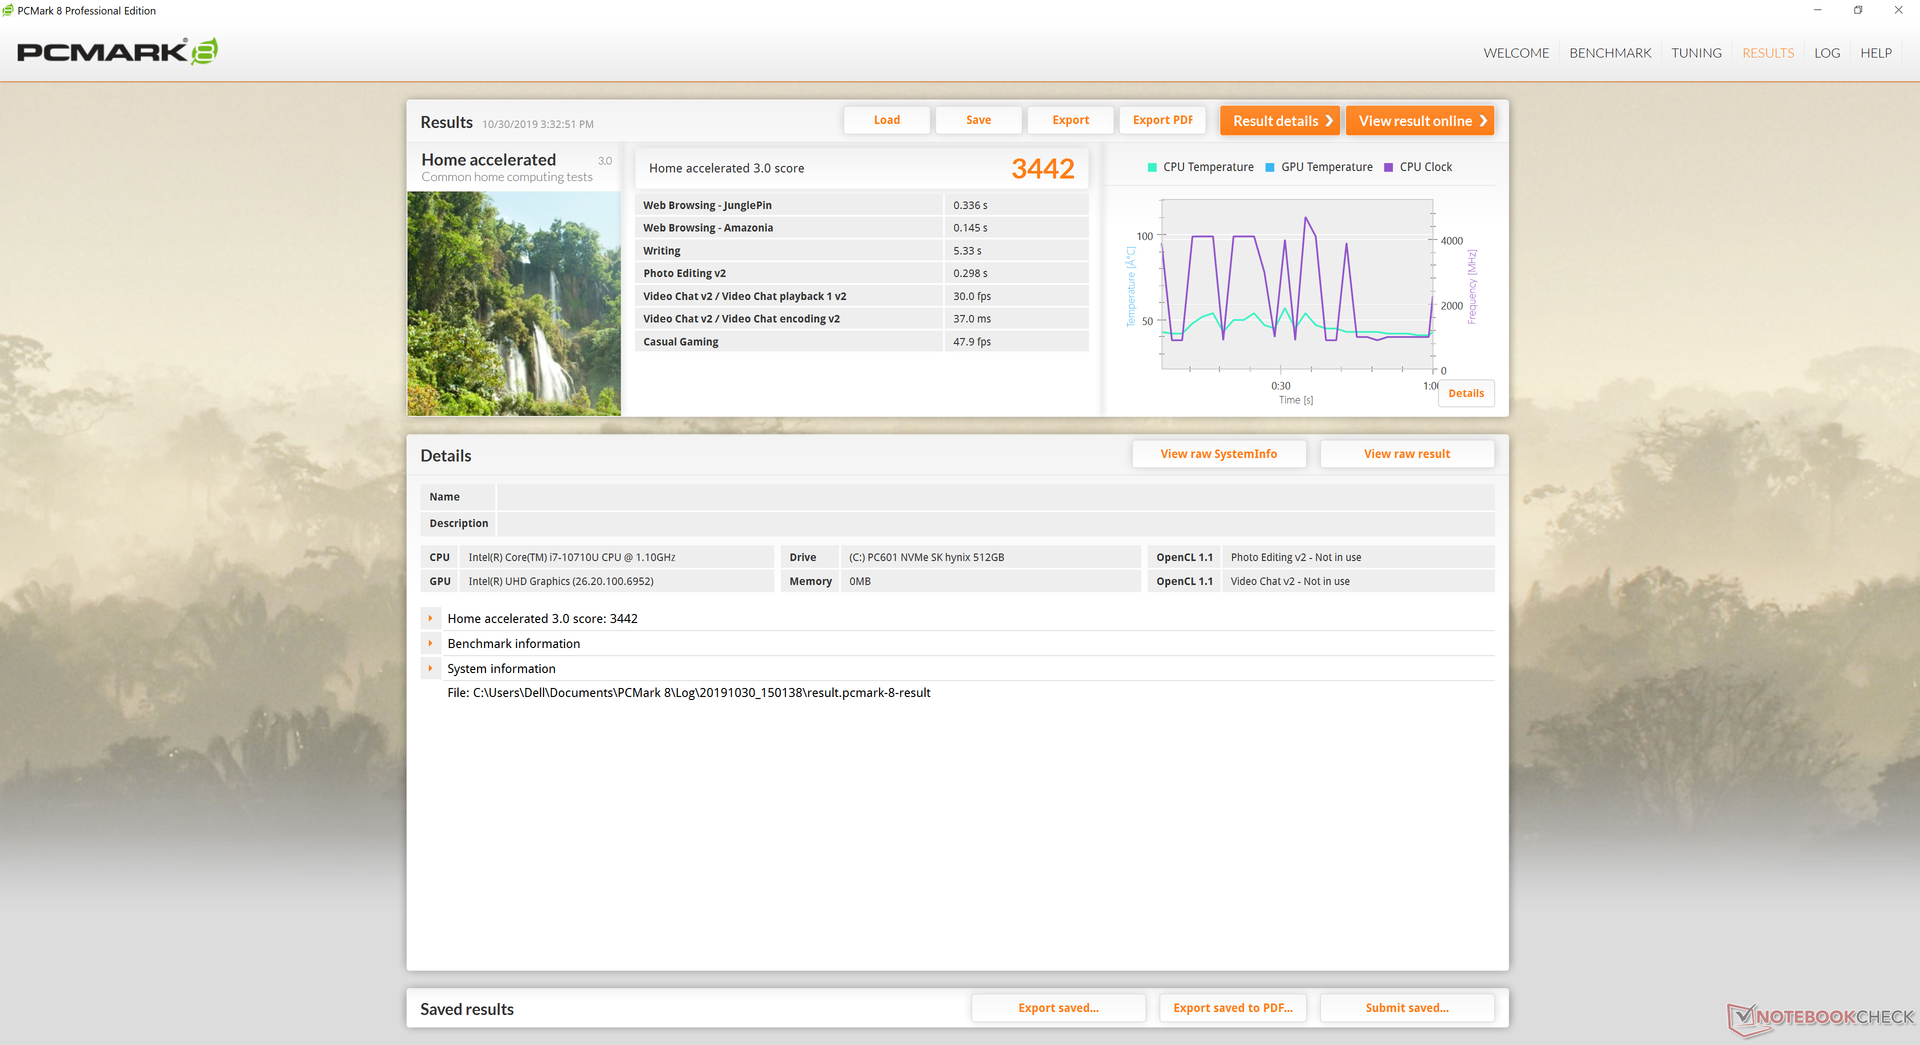
| PCMark 8 Home Score Accelerated v2 | 3442 punti | |
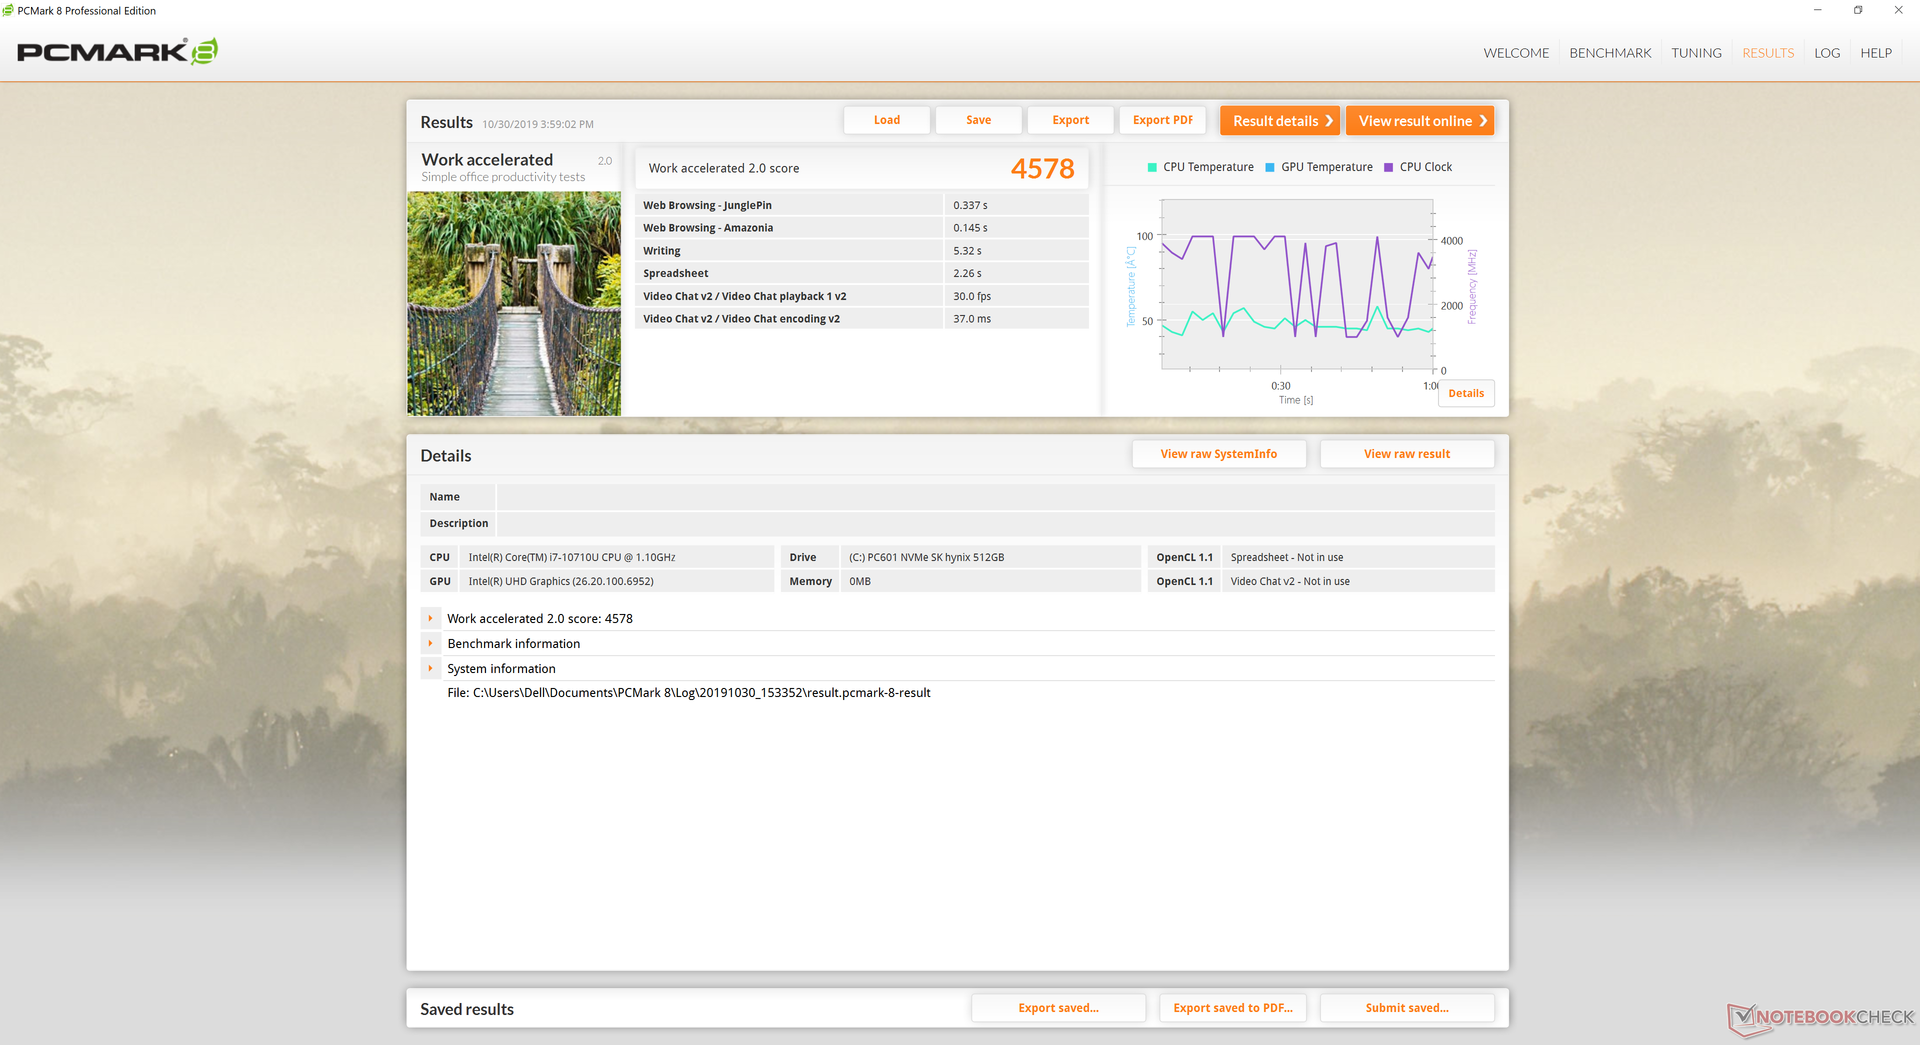
| PCMark 8 Work Score Accelerated v2 | 4578 punti | |
| PCMark 10 Score | 4161 punti | |
Aiuto | ||
Dispositivi di archiviazione
Dell acquista le proprie unità SSD da più fornitori per tutti i loro computer portatili. Abbiamo testato personalmente le unità XPS 13 equipaggiate con Samsung, Toshiba o SK Hynix e quindi è una scommessa sicura che il vostro prossimo acquisto di XPS ospiterà uno di questi tre produttori. Il nostro XPS 13 7390 utilizza il più recente SSD SK Hynix PC601 in contrasto con l'SK Hynix PC401 dell'XPS 13 9380 dello scorso anno.
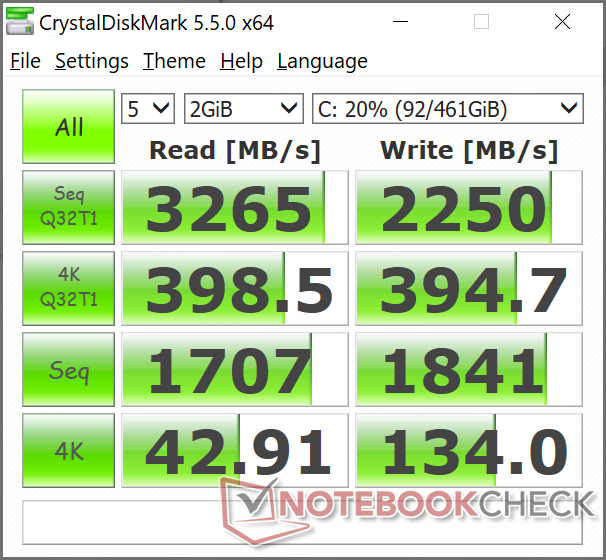
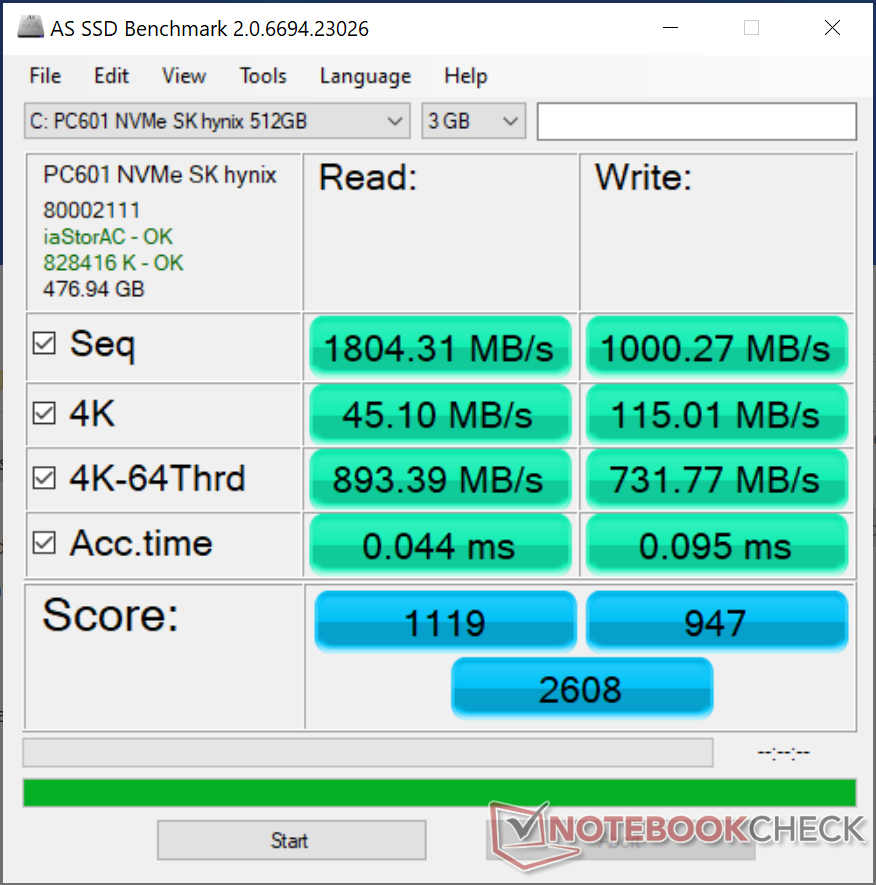
| Dell XPS 13 7390 Core i7-10710U SK Hynix PC601 NVMe 512 GB | Dell XPS 13 7390 2-in-1 Core i7 Toshiba BG4 KBG40ZPZ512G | Dell XPS 13 7390 2-in-1 Core i3 Toshiba BG4 KBG40ZPZ256G | Dell XPS 13 9380 i7 4K Samsung SSD PM981 MZVLB512HAJQ | Dell XPS 13 9380 2019 SK hynix PC401 HFS256GD9TNG | Dell XPS 13 9370 i7 UHD Toshiba XG5 KXG50ZNV512G | |
|---|---|---|---|---|---|---|
| AS SSD | -53% | -69% | 44% | -29% | -23% | |
| Seq Read (MB/s) | 1804 | 1801 0% | 1558 -14% | 1981 10% | 2035 13% | 2205 22% |
| Seq Write (MB/s) | 1000 | 1125 13% | 1103 10% | 1473 47% | 658 -34% | 435.8 -56% |
| 4K Read (MB/s) | 45.1 | 39.7 -12% | 37.52 -17% | 53.3 18% | 39.74 -12% | 29.36 -35% |
| 4K Write (MB/s) | 115 | 67 -42% | 59 -49% | 127.4 11% | 105.7 -8% | 107.4 -7% |
| 4K-64 Read (MB/s) | 893 | 1253 40% | 1684 89% | 1179 32% | 461 -48% | 678 -24% |
| 4K-64 Write (MB/s) | 732 | 209 -71% | 198.9 -73% | 2105 188% | 300.1 -59% | 444.8 -39% |
| Access Time Read * (ms) | 0.044 | 0.069 -57% | 0.099 -125% | 0.036 18% | 0.061 -39% | 0.059 -34% |
| Access Time Write * (ms) | 0.095 | 0.625 -558% | 0.722 -660% | 0.029 69% | 0.051 46% | 0.055 42% |
| Score Read (Points) | 1119 | 1472 32% | 1877 68% | 1430 28% | 704 -37% | 926 -17% |
| Score Write (Points) | 947 | 388 -59% | 368 -61% | 2379 151% | 471 -50% | 596 -37% |
| Score Total (Points) | 2608 | 2583 -1% | 3180 22% | 4526 74% | 1479 -43% | 1911 -27% |
| Copy ISO MB/s (MB/s) | 1515 | 1293 -15% | 677 -55% | 1294 -15% | 893 -41% | 585 -61% |
| Copy Program MB/s (MB/s) | 535 | 560 5% | 298.4 -44% | 503 -6% | 287.9 -46% | 570 7% |
| Copy Game MB/s (MB/s) | 1211 | 927 -23% | 496.1 -59% | 1148 -5% | 618 -49% | 503 -58% |
* ... Meglio usare valori piccoli

Prestazioni GPU
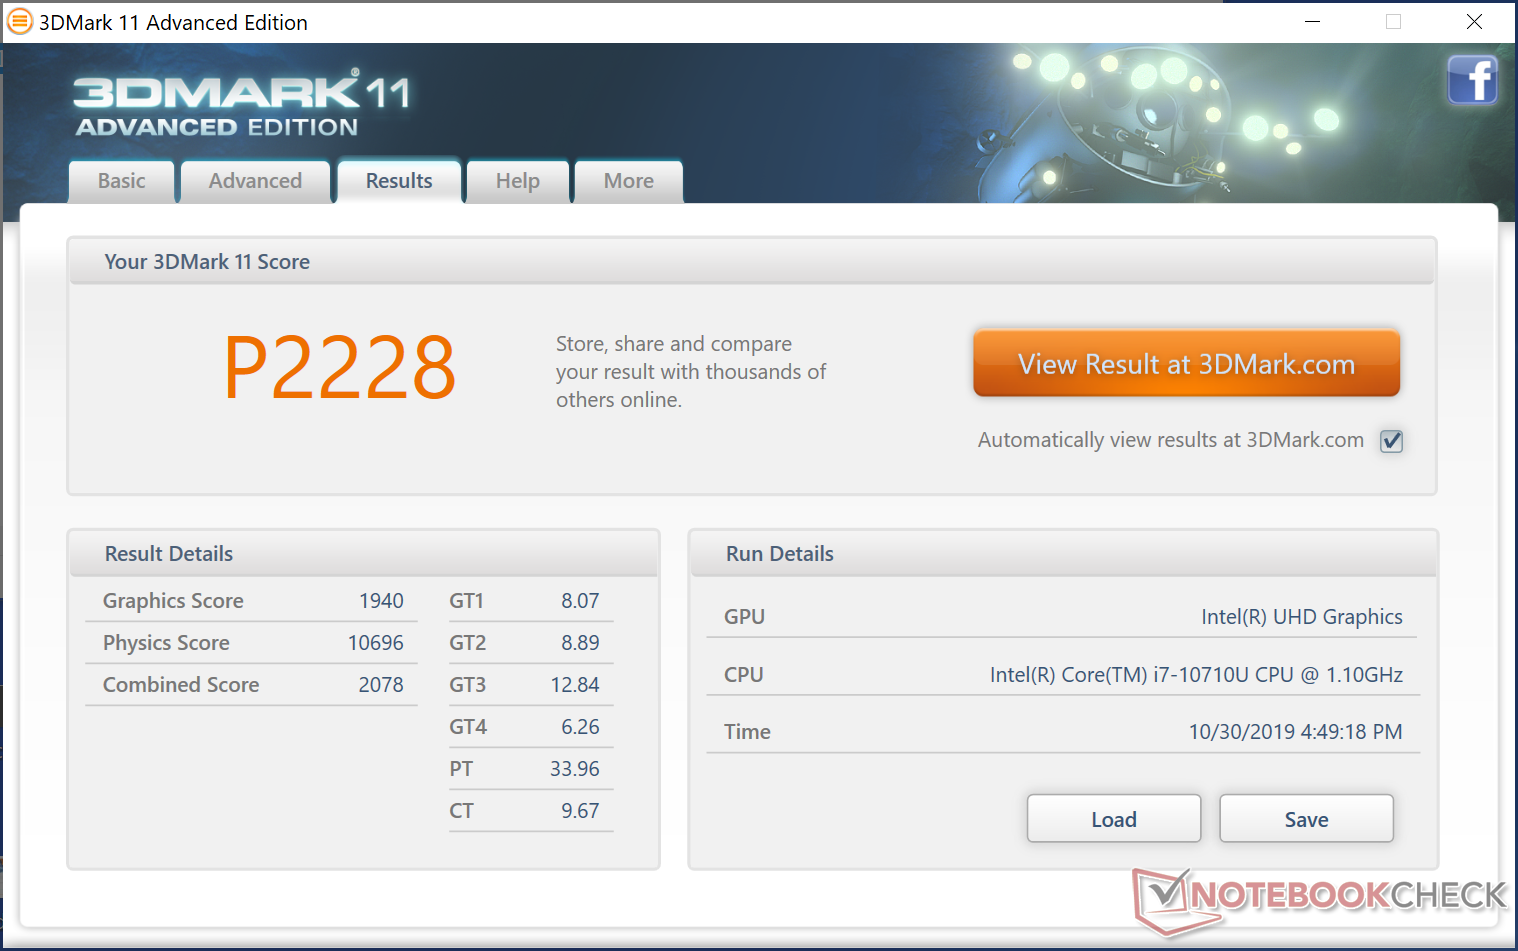
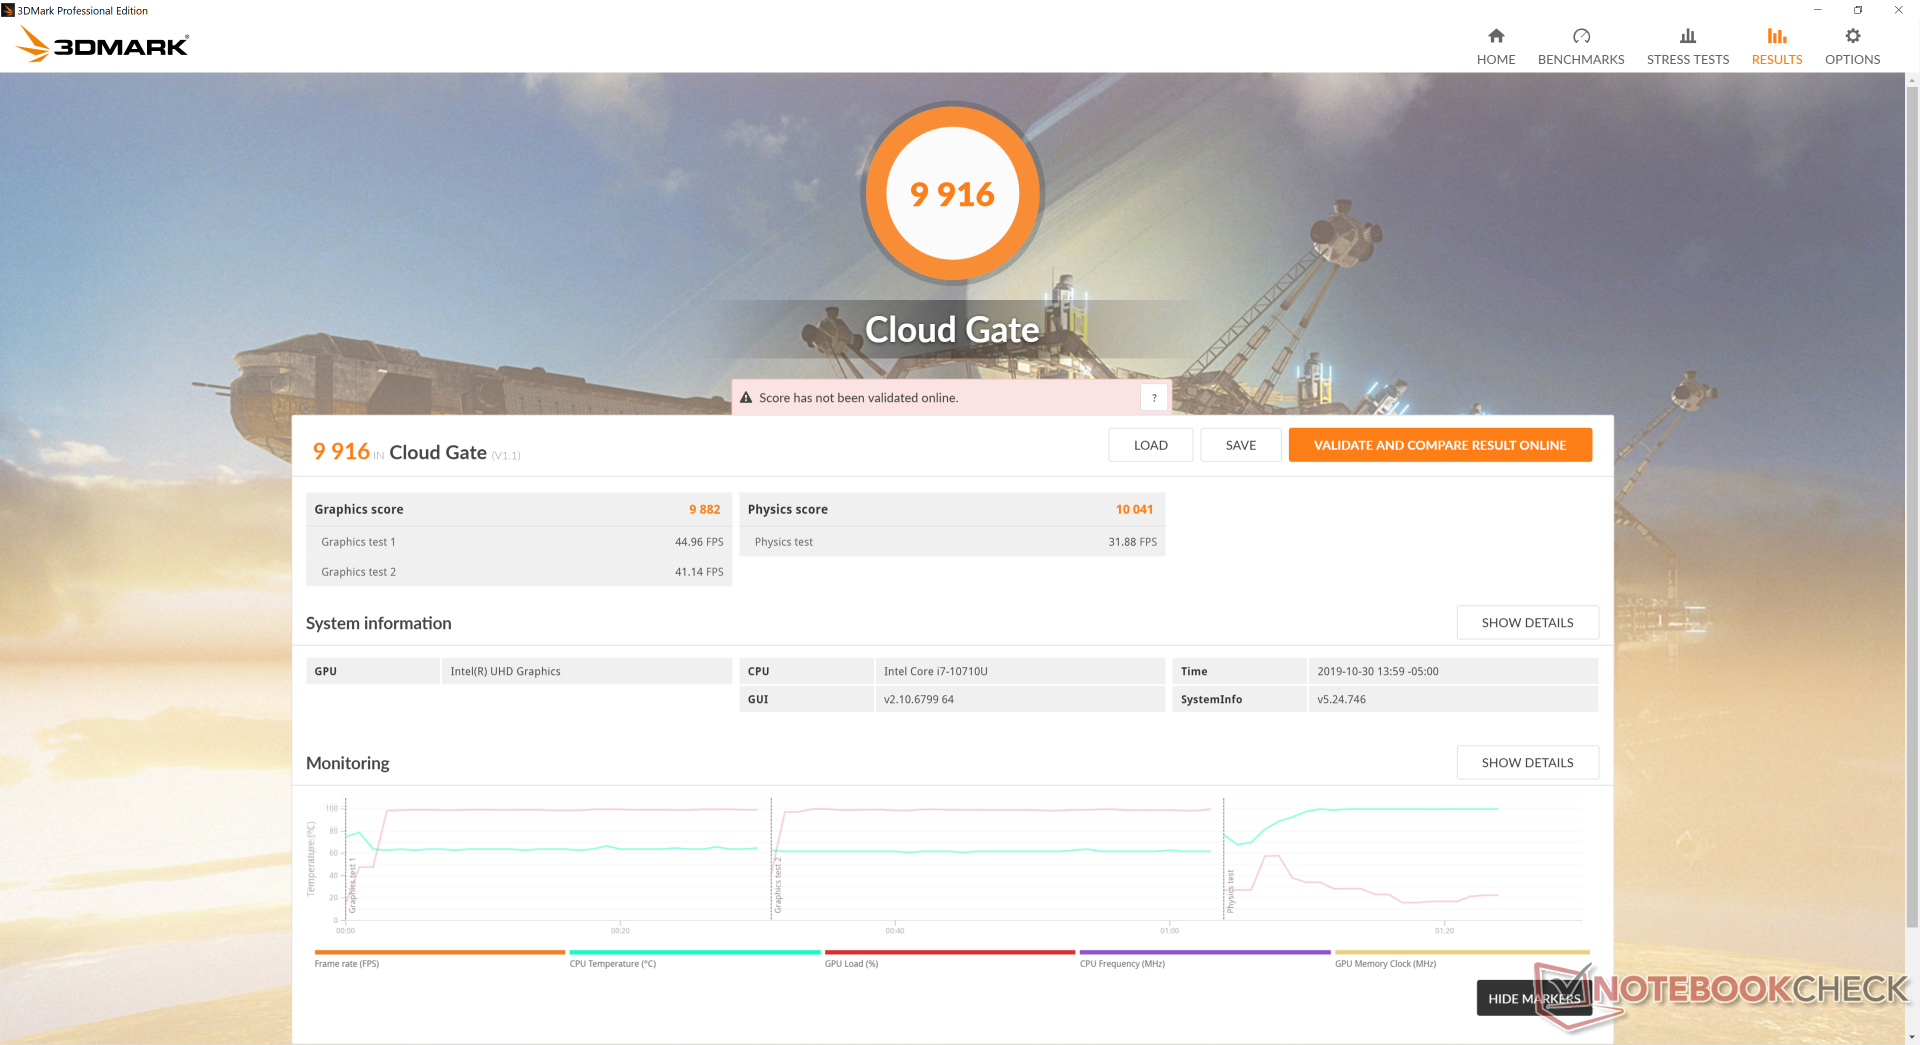
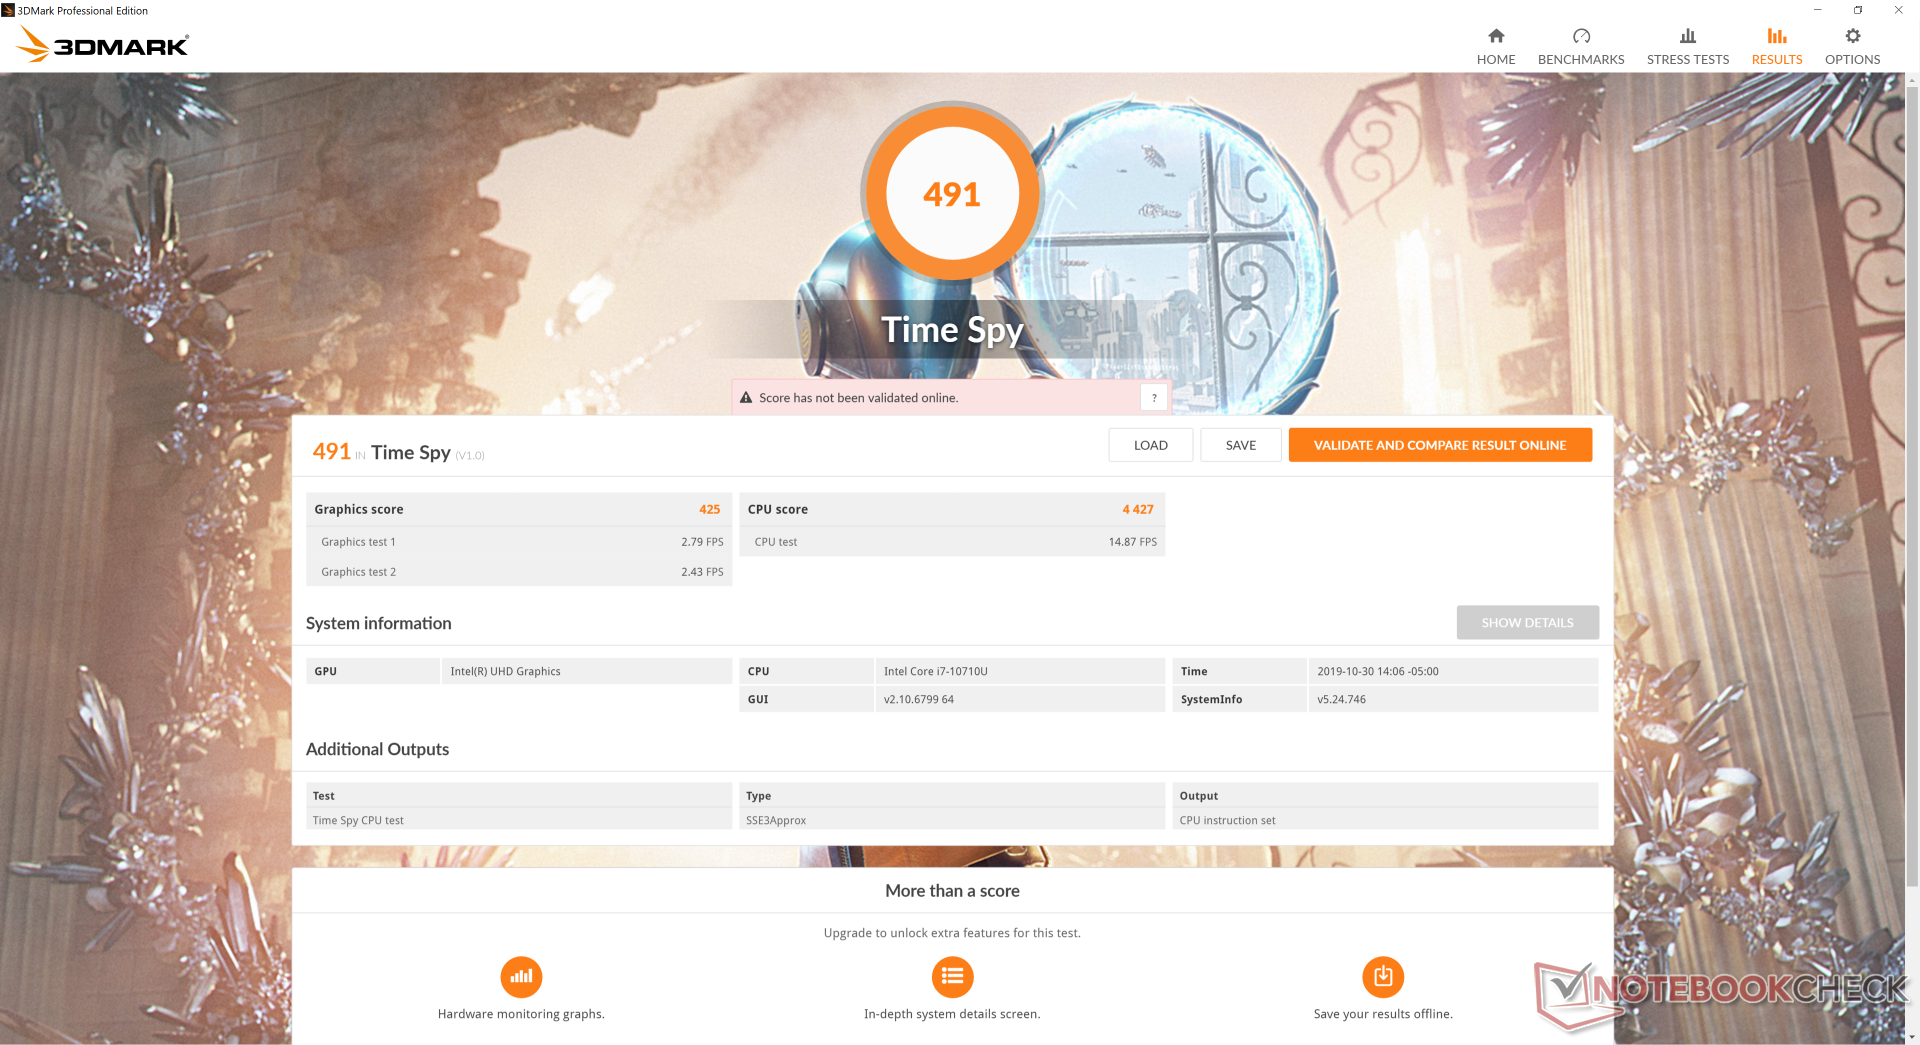
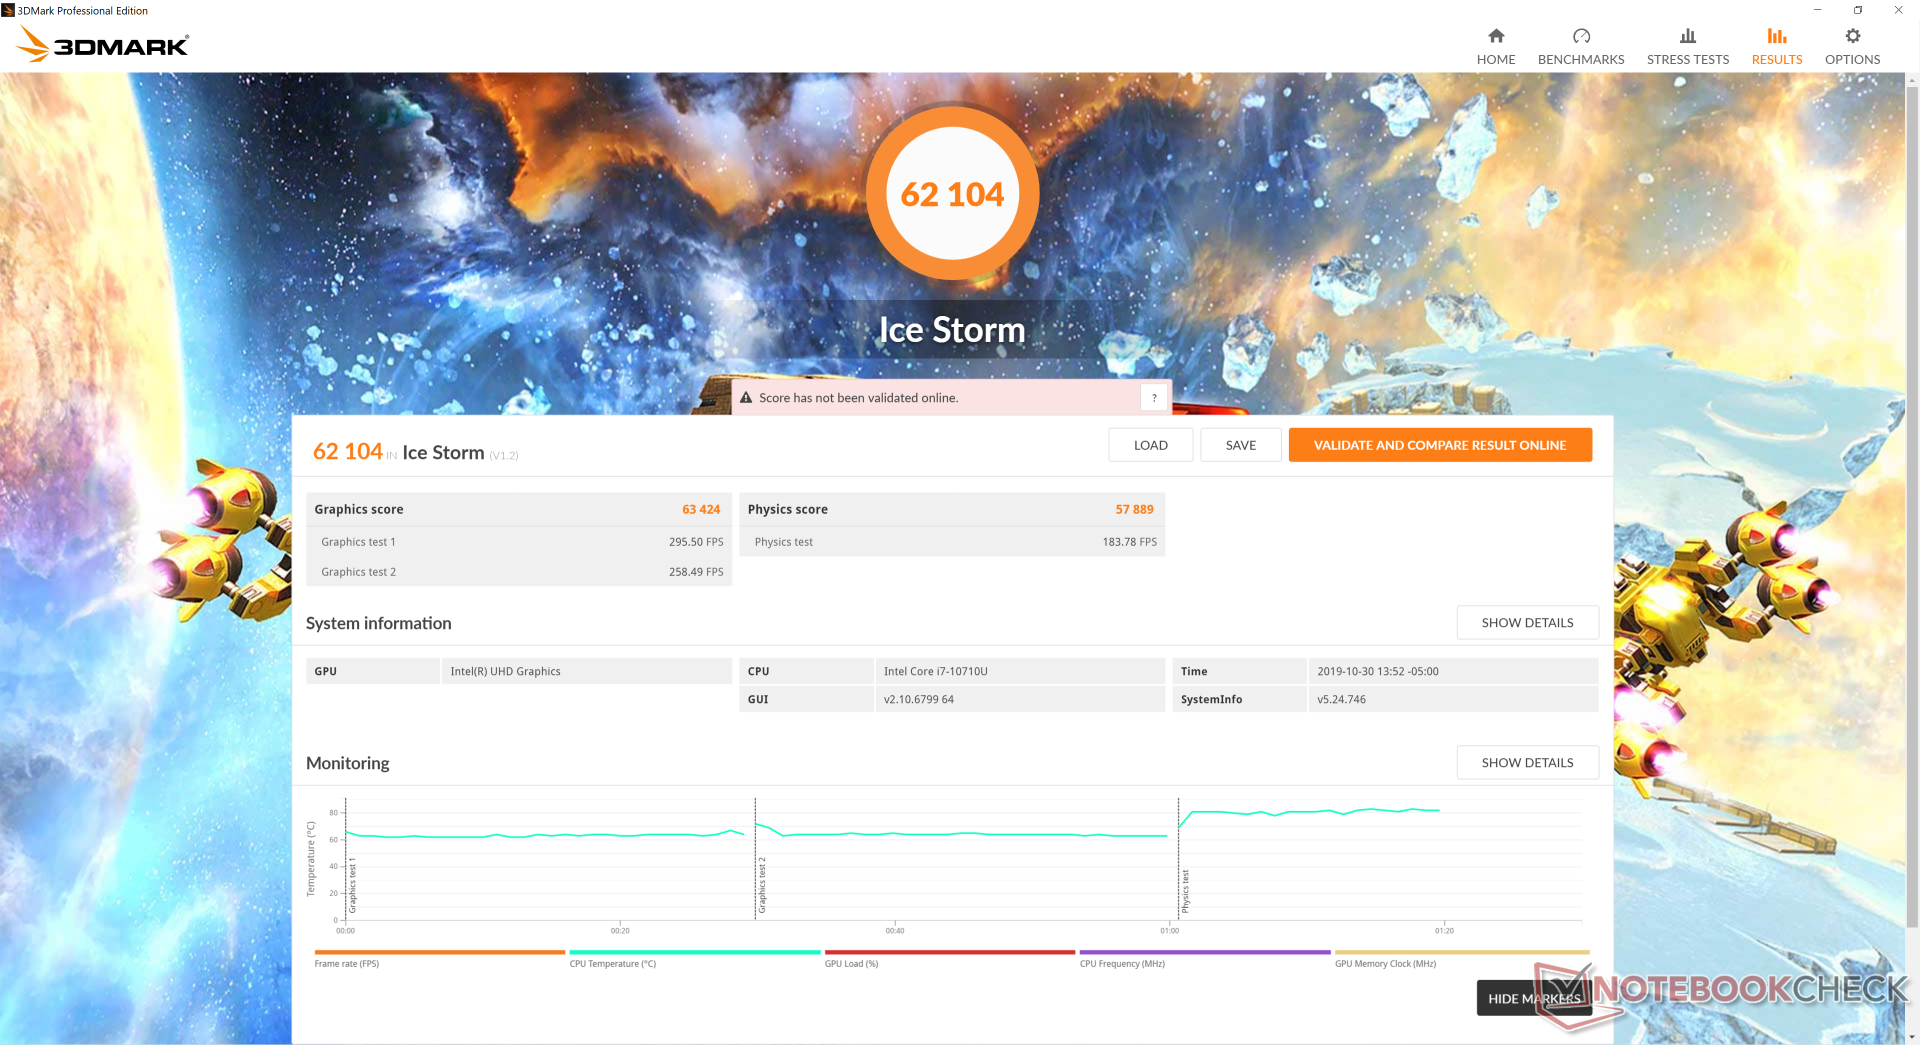
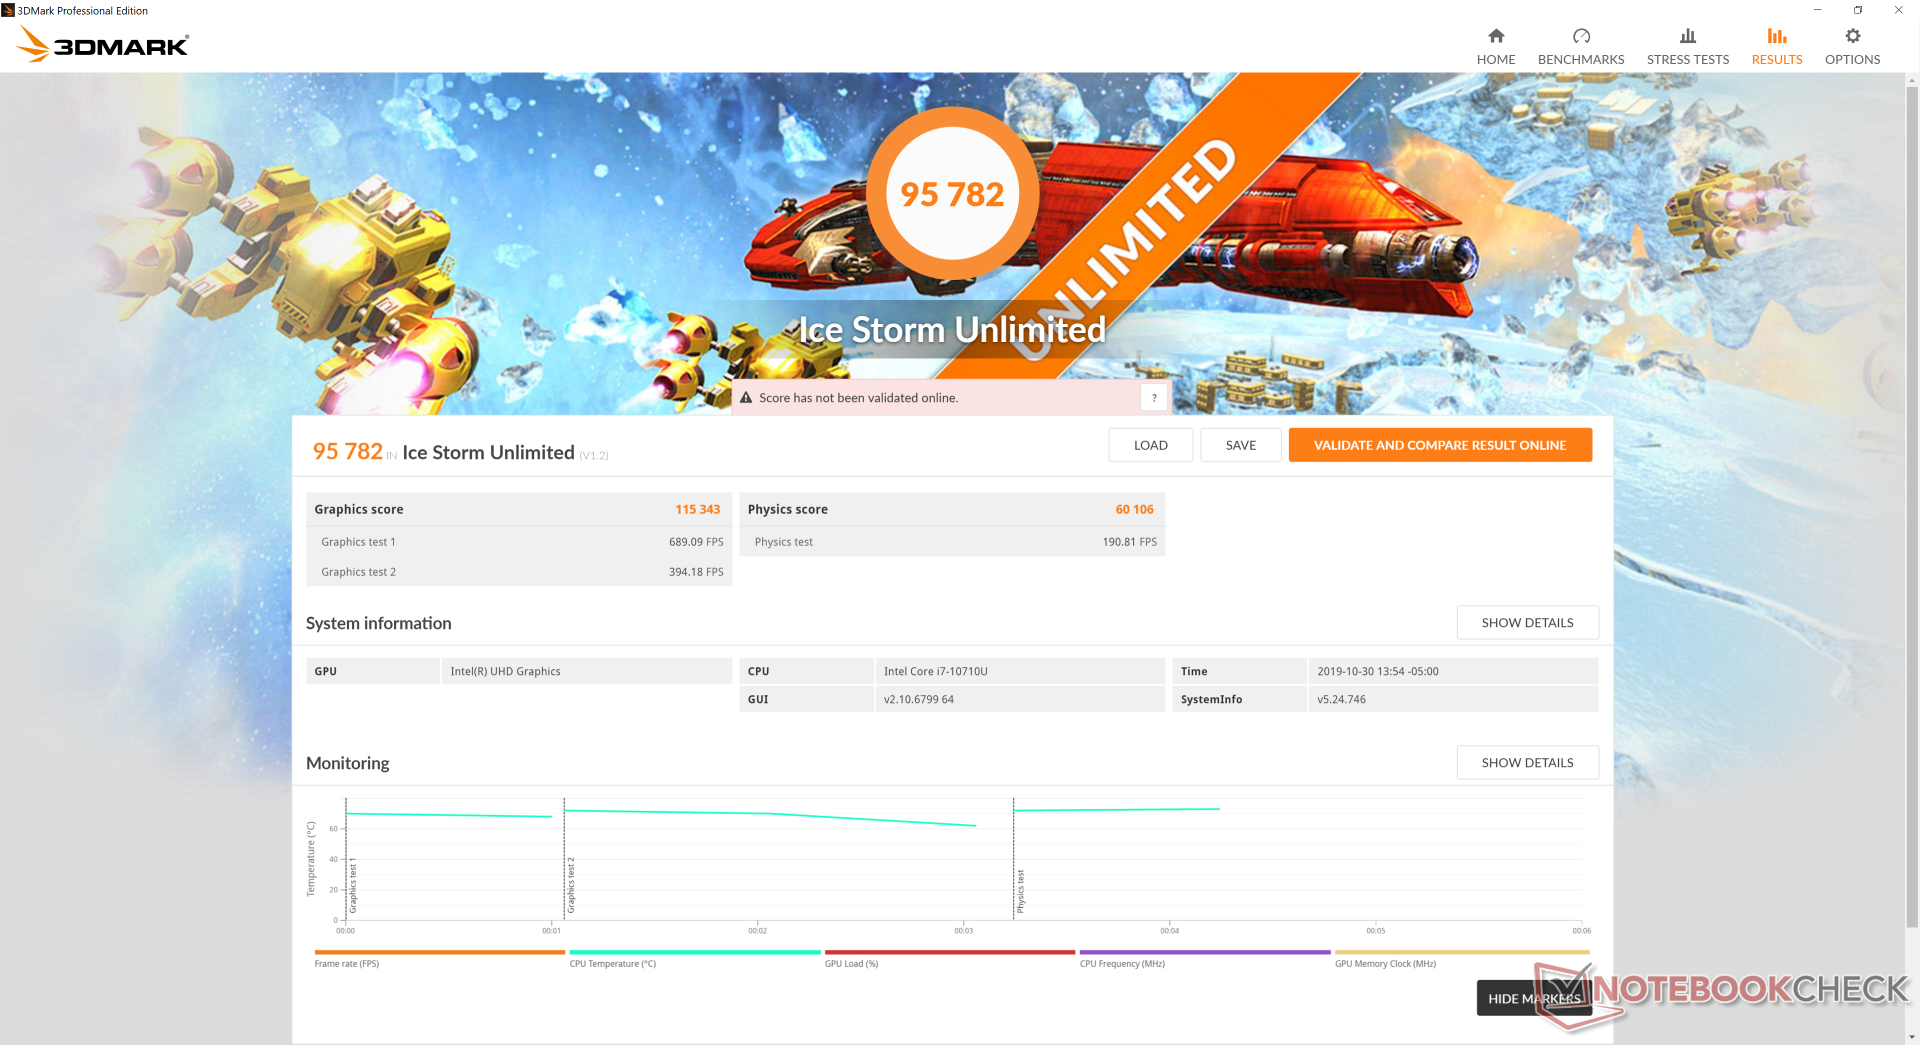
L'UHD Graphics 620 integrata non ha subito modifiche rispetto alla generazione precedente. Mentre i punteggi di Fire Strike e Time Spy Graphics sono ciascuno del 19% più alti della media di UHD Graphics 620 nel nostro database, questo non significa molto, dato che questa particolare GPU è datata. Dovrete optare per un Ultrabook con Core i7-1065G7, Ryzen 7 3700U o GeForce MX150/MX250 se volete più potenza di calcolo.
| 3DMark 06 Standard Score | 14158 punti | |
| 3DMark 11 Performance | 2228 punti | |
| 3DMark Ice Storm Standard Score | 62104 punti | |
| 3DMark Cloud Gate Standard Score | 9916 punti | |
| 3DMark Fire Strike Score | 1237 punti | |
| 3DMark Time Spy Score | 491 punti | |
Aiuto | ||
| basso | medio | alto | ultra | |
|---|---|---|---|---|
| BioShock Infinite (2013) | 85.3 | 42 | 35.8 | 11.2 |
| The Witcher 3 (2015) | 19.7 | |||
| Rocket League (2017) | 76.2 | 36.6 | 23 | |
| Shadow of the Tomb Raider (2018) | 15 |
Emissioni
Rumorosità di sistema
Nulla è cambiato nella soluzione di raffreddamento e quindi il comportamento della ventola non è diverso da quello che abbiamo visto sull'XPS 13 9380. Nel peggiore dei casi, il rumore della ventola sarà costante a circa 31,1-33,7 dB(A) contro uno sfondo di 28 dB(A) durante lo streaming video o durante la navigazione web intensa. Il rumore della ventola può raggiungere i 46,5 dB(A) quando la CPU è al 100% di utilizzo.
Siamo in grado di notare un leggero coil whine o rumore elettronico quando mettiamo un orecchio sui tasti della tastiera.
| Dell XPS 13 7390 Core i7-10710U UHD Graphics 620, i7-10710U, SK Hynix PC601 NVMe 512 GB | Dell XPS 13 7390 2-in-1 Core i7 Iris Plus Graphics G7 (Ice Lake 64 EU), i7-1065G7, Toshiba BG4 KBG40ZPZ512G | Dell XPS 13 7390 2-in-1 Core i3 UHD Graphics G1 (Ice Lake 32 EU), i3-1005G1, Toshiba BG4 KBG40ZPZ256G | Dell XPS 13 9380 i7 4K UHD Graphics 620, i7-8565U, Samsung SSD PM981 MZVLB512HAJQ | Dell XPS 13 9380 2019 UHD Graphics 620, i5-8265U, SK hynix PC401 HFS256GD9TNG | Dell XPS 13 9370 i7 UHD UHD Graphics 620, i5-8550U, Toshiba XG5 KXG50ZNV512G | |
|---|---|---|---|---|---|---|
| Noise | 2% | 2% | -3% | -2% | 2% | |
| off /ambiente * (dB) | 28 | 28.1 -0% | 28 -0% | 28.4 -1% | 30.4 -9% | 28 -0% |
| Idle Minimum * (dB) | 28 | 28.1 -0% | 28 -0% | 29.4 -5% | 30.4 -9% | 28 -0% |
| Idle Average * (dB) | 28 | 28.1 -0% | 28 -0% | 29.4 -5% | 30.4 -9% | 28 -0% |
| Idle Maximum * (dB) | 28 | 28.1 -0% | 28 -0% | 29.4 -5% | 30.4 -9% | 28 -0% |
| Load Average * (dB) | 33.7 | 31.7 6% | 31.7 6% | 34.6 -3% | 31.7 6% | 32.5 4% |
| Load Maximum * (dB) | 46.5 | 43.4 7% | 43.5 6% | 46.8 -1% | 38.1 18% | 42.2 9% |
| Witcher 3 ultra * (dB) | 43.4 |
* ... Meglio usare valori piccoli
Rumorosità
| Idle |
| 28 / 28 / 28 dB(A) |
| Sotto carico |
| 33.7 / 46.5 dB(A) |
 | ||
30 dB silenzioso 40 dB(A) udibile 50 dB(A) rumoroso |
||
min: | ||
Temperature
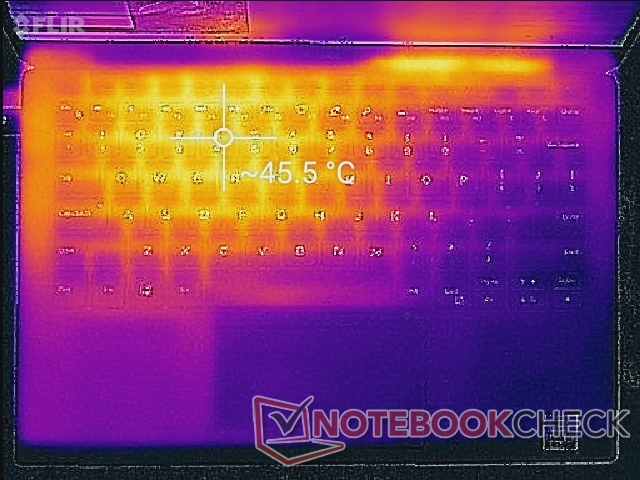
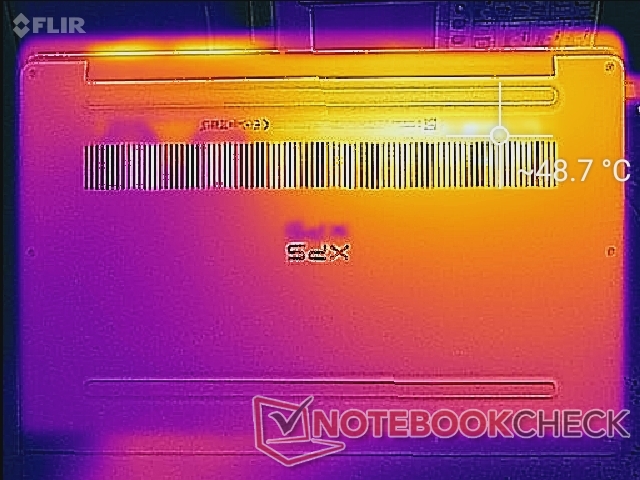
Le temperature di superficie sono quasi identiche a quelle che abbiamo rilevato sull'XPS 13 9380 con la CPU quad-core Whiskey Lake-U. In altre parole, gli utenti stanno raccogliendo i benefici della CPU Comet Lake-U senza un aumento delle temperature comunemente associato ad un aumento delle prestazioni.
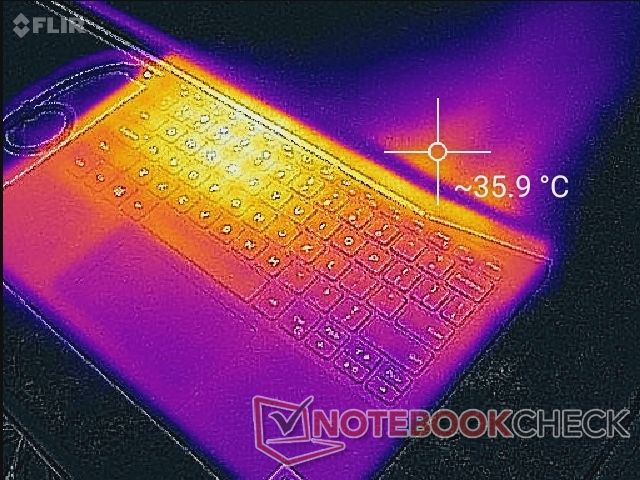
(±) La temperatura massima sul lato superiore è di 44.6 °C / 112 F, rispetto alla media di 35.9 °C / 97 F, che varia da 21.4 a 59 °C per questa classe Subnotebook.
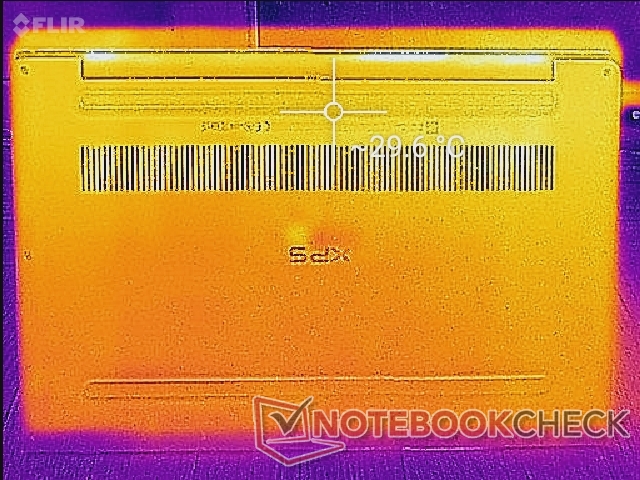
(-) Il lato inferiore si riscalda fino ad un massimo di 49.2 °C / 121 F, rispetto alla media di 39.2 °C / 103 F
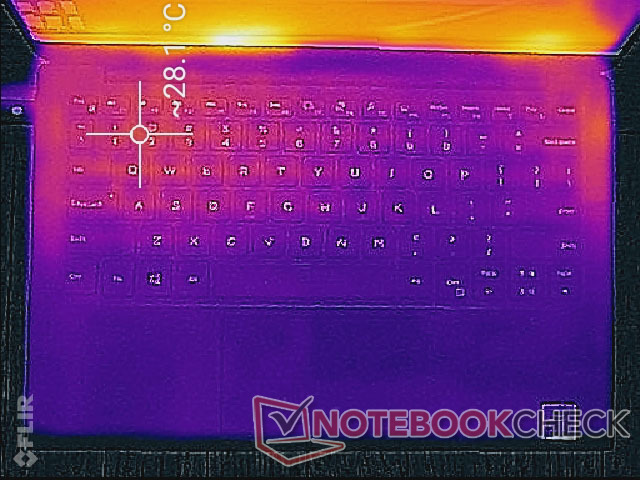
(+) In idle, la temperatura media del lato superiore è di 26.6 °C / 80 F, rispetto alla media deld ispositivo di 30.8 °C / 87 F.
(+) I poggiapolsi e il touchpad sono piu' freddi della temperatura della pelle con un massimo di 31.4 °C / 88.5 F e sono quindi freddi al tatto.
(-) La temperatura media della zona del palmo della mano di dispositivi simili e'stata di 28.2 °C / 82.8 F (-3.2 °C / -5.7 F).
Stress Test
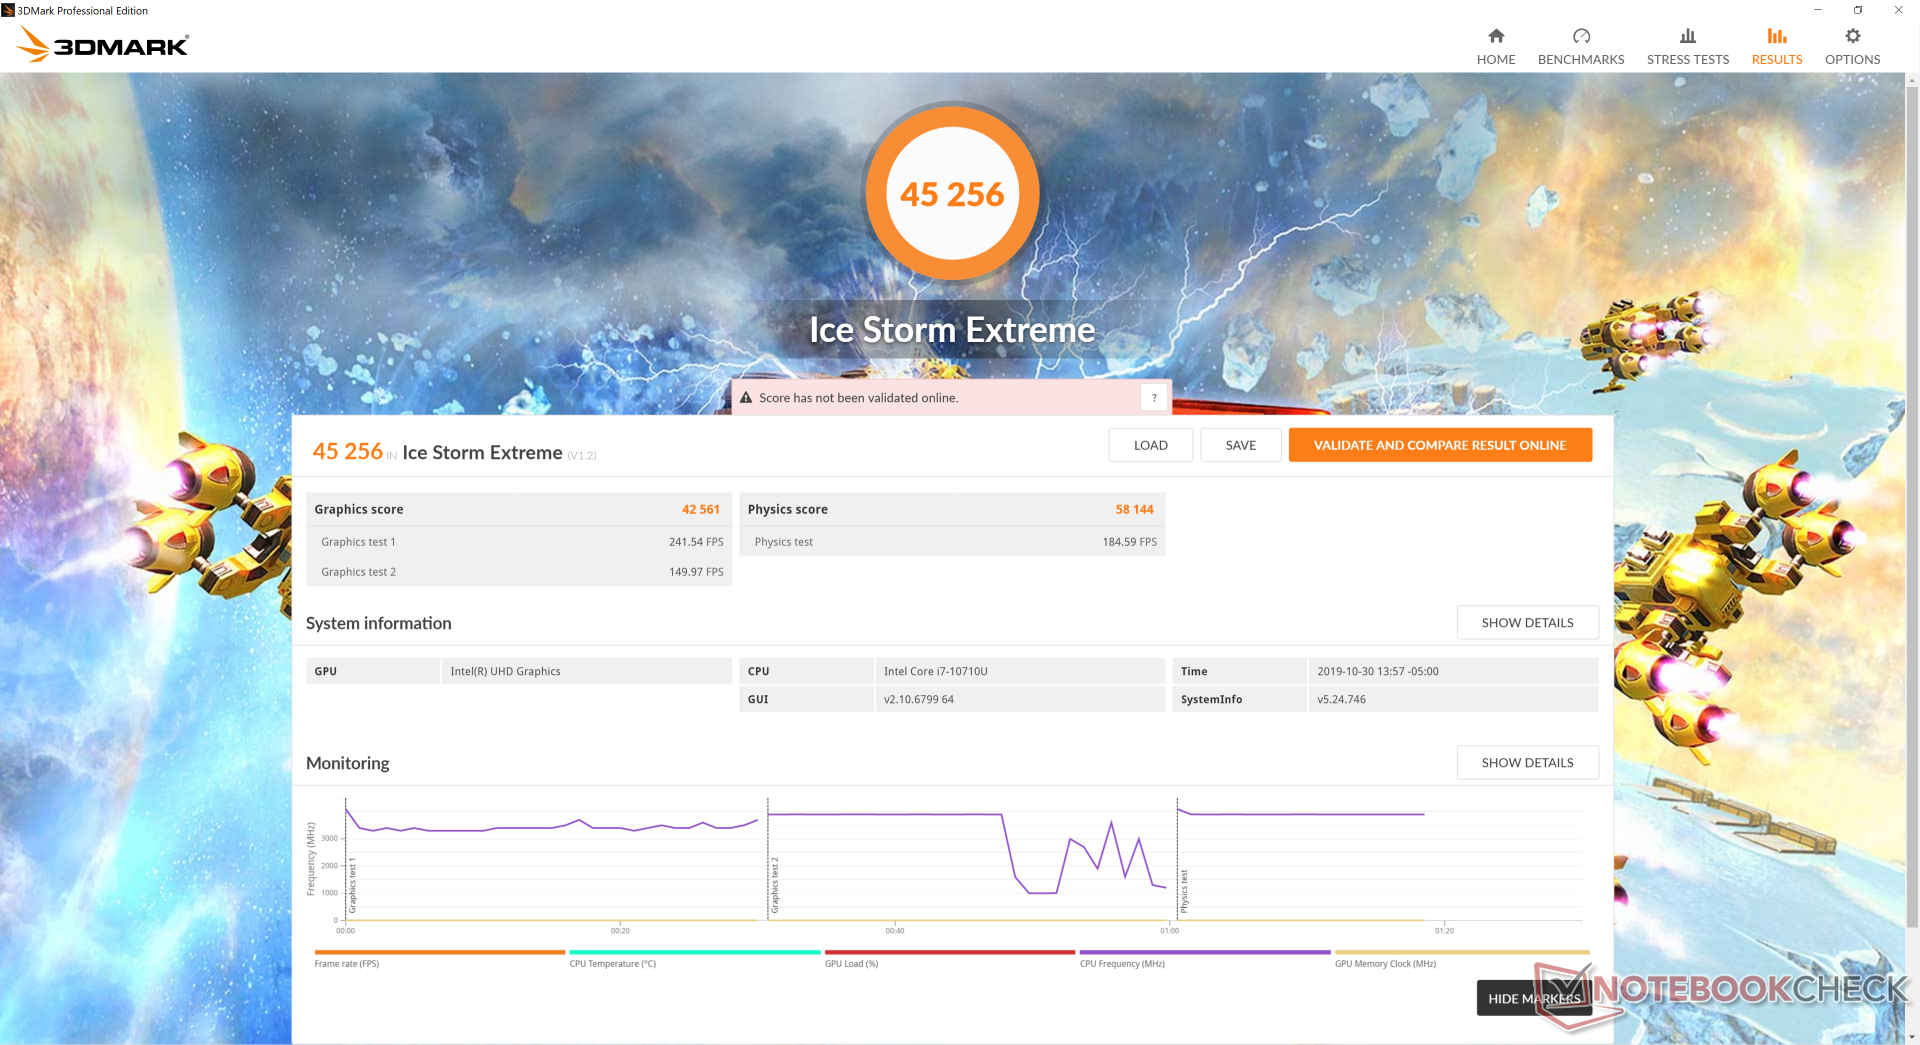
Stressiamo il sistema con carichi sintetici per identificare eventuali problemi di strozzamento o di stabilità. Durante l'esecuzione di Prime95, la CPU accelera fino a 4 GHz per i primi secondi prima di rallentare e stabilizzarsi nella gamma da 3,0 a 3,1 GHz. Anche la temperatura interna diventa stabile a circa 95 °C durante questo periodo. Dopo circa 1,5 minuti, le frequenze di clock e il calo di temperatura passano rispettivamente tra 1,7 GHz a 2,5 GHz e 64 °C a 80 °C, poiché la CPU non è in grado di sostenere un Turbo Boost massimo costante a tempo indeterminato, come scoperto durante il nostro test CineBench R15 Multi-Thread loop test. L'esecuzione di entrambi i test Prime95 e FurMark si traduce in un simile comportamento di clock rate e cicli di temperatura, come mostrato dalle schermate e dalla tabella sottostante.
Mentre la maggior parte dei computer portatili con CPU ULV mostrano cali di prestazioni quando sono sottoposti a sollecitazioni estreme, il comportamento ciclico ad ampio raggio osservato su questa unità XPS 13 è raro. L'approccio unico di Dell ha i suoi pro e contro; mentre la CPU può occasionalmente raggiungere valori di clock più elevati del solito quando è sotto stress, le prestazioni possono anche diventare incoerenti in base al momento per momento.
Il funzionamento a batteria limita le prestazioni della CPU. Un Fire Strike a batterie restituisce punteggi Physics e Graphics di 12325 e 1333 punti, rispettivamente, rispetto ai 14847 e 1339 punti ottenuti con il collegamento alla rete elettrica.
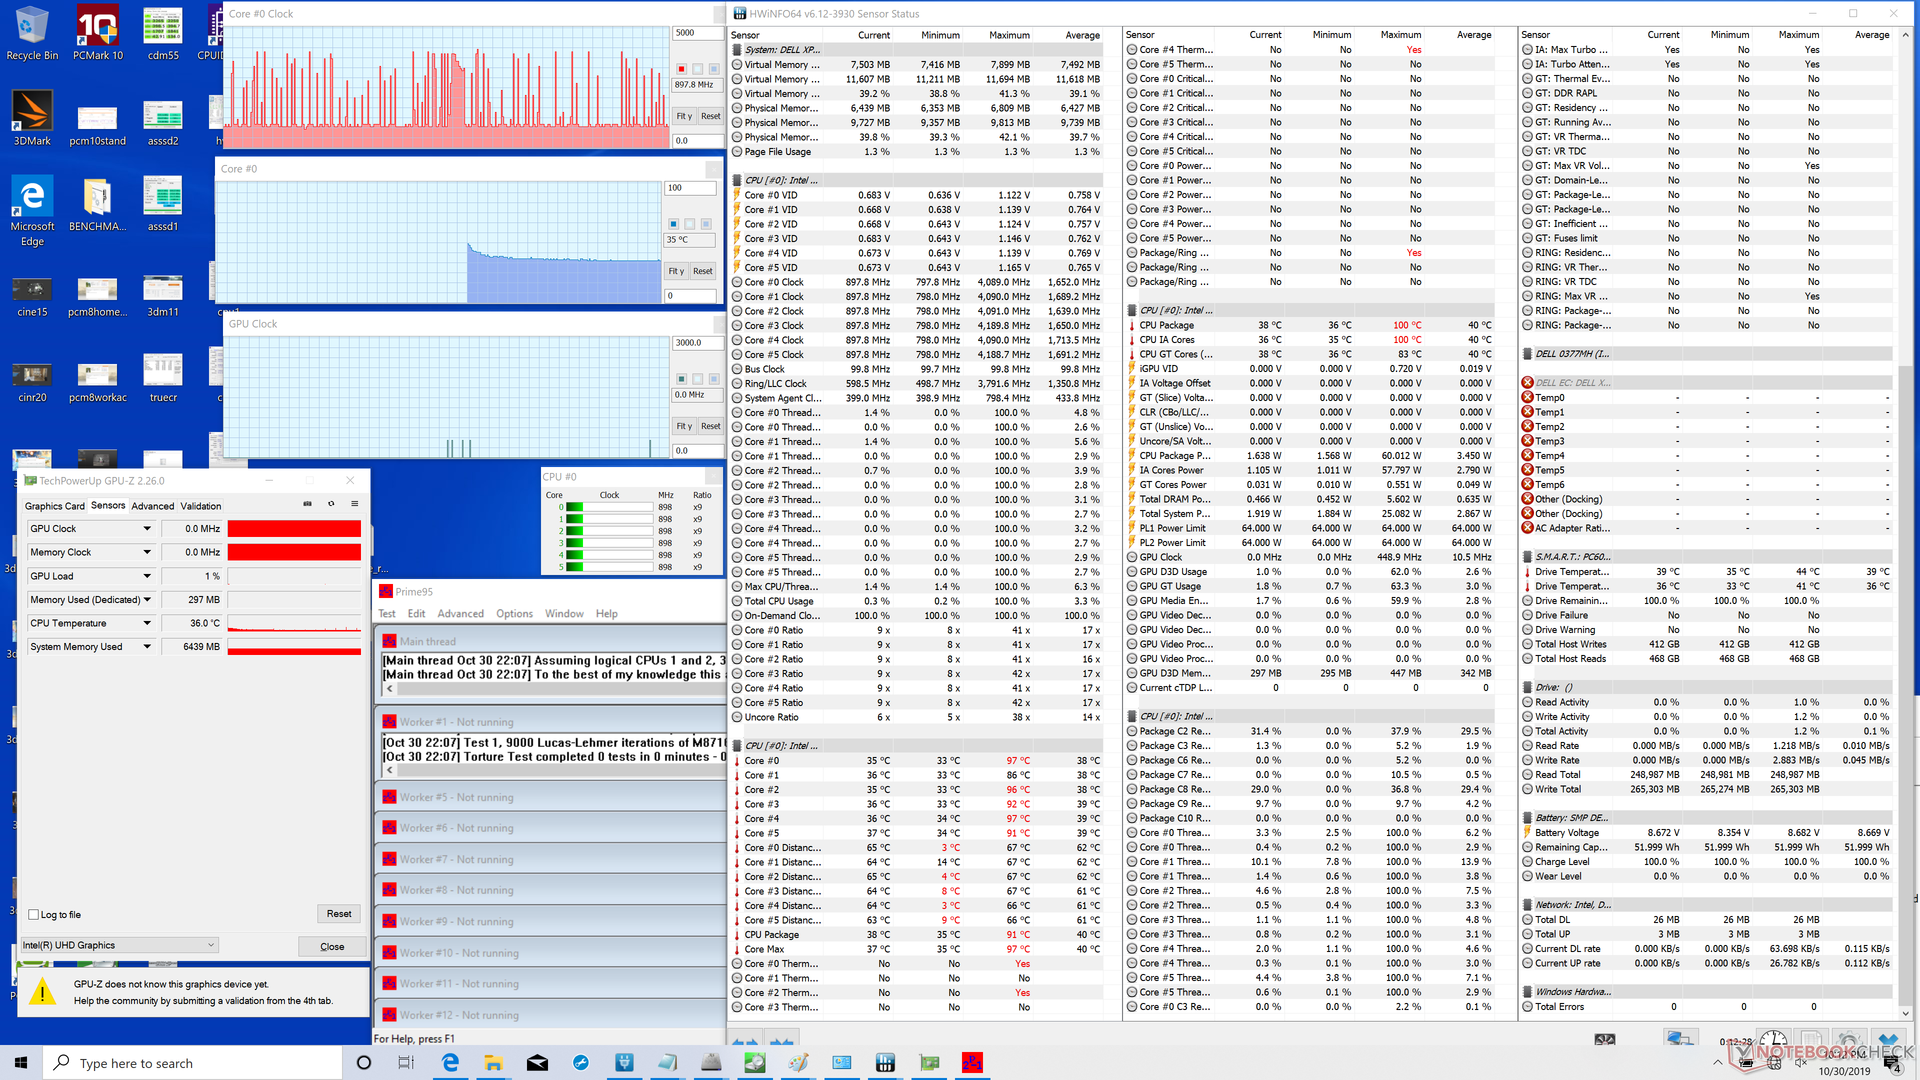
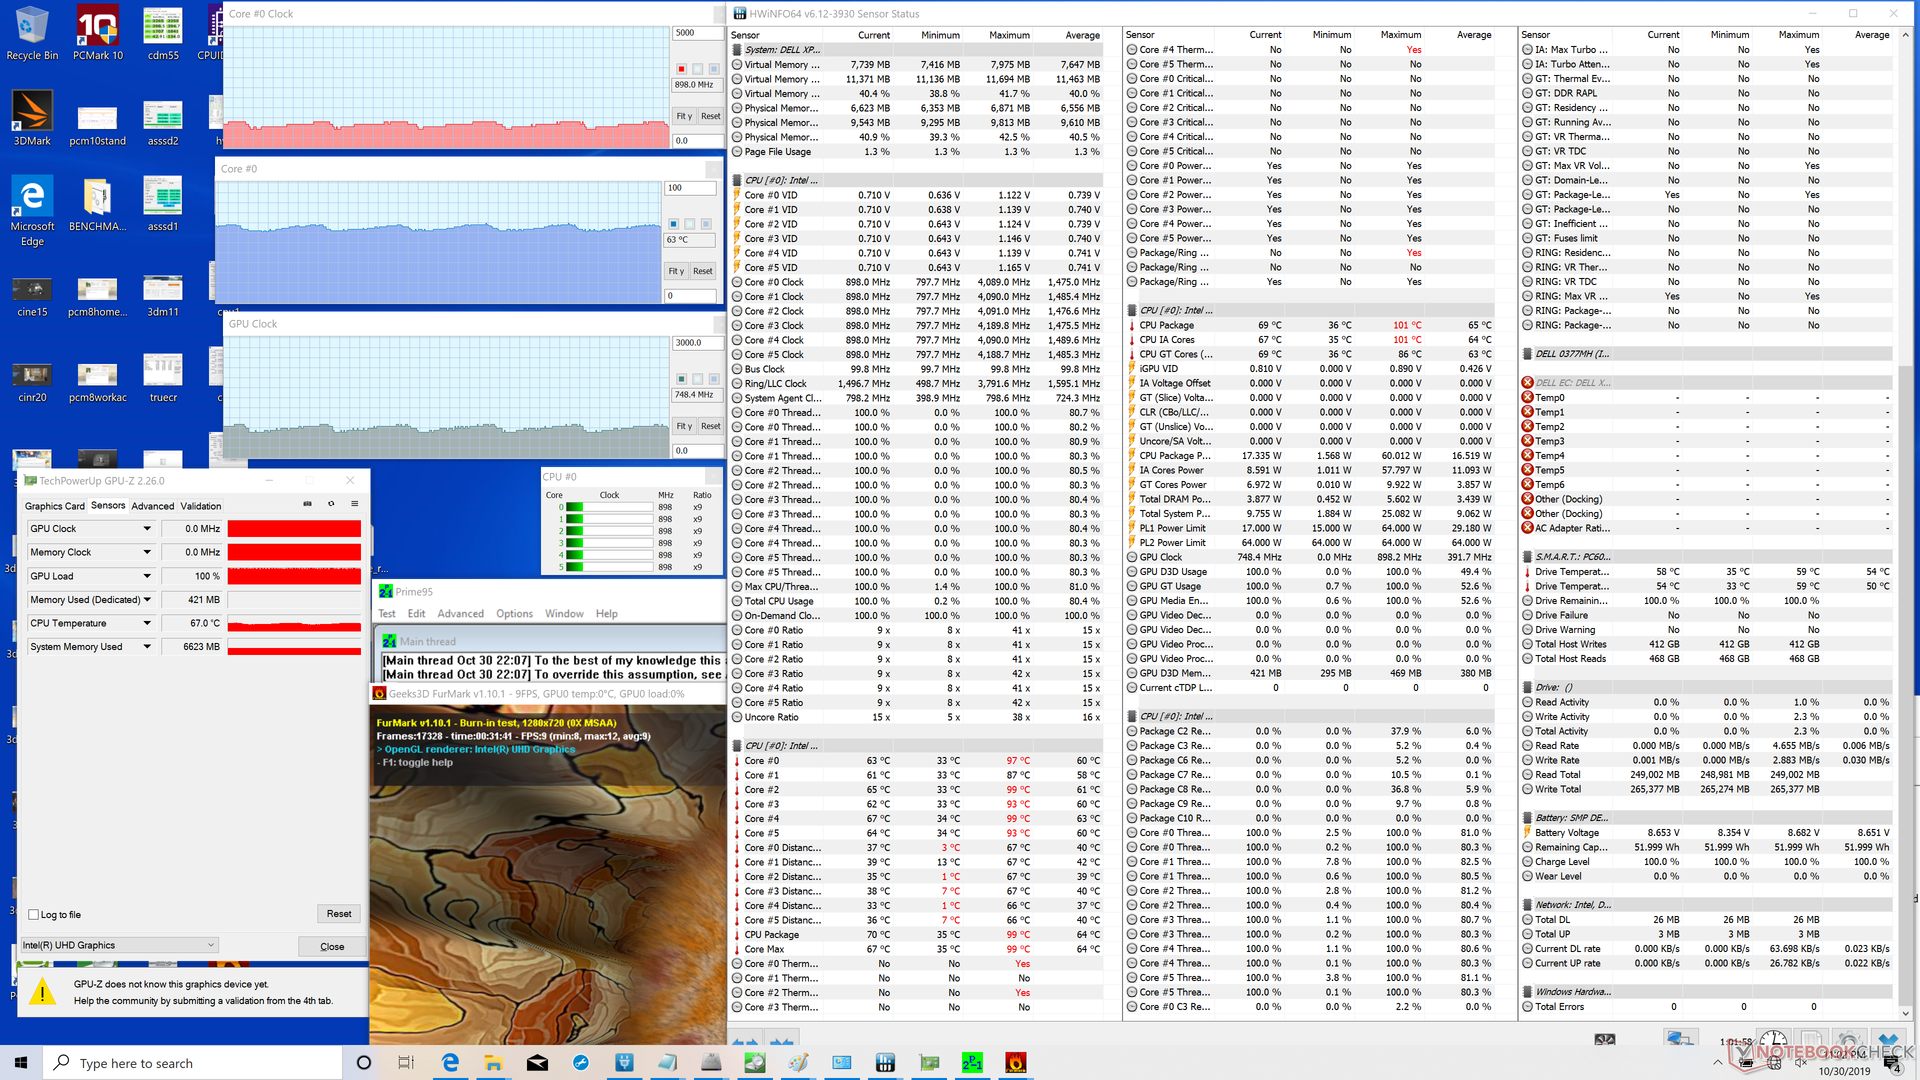

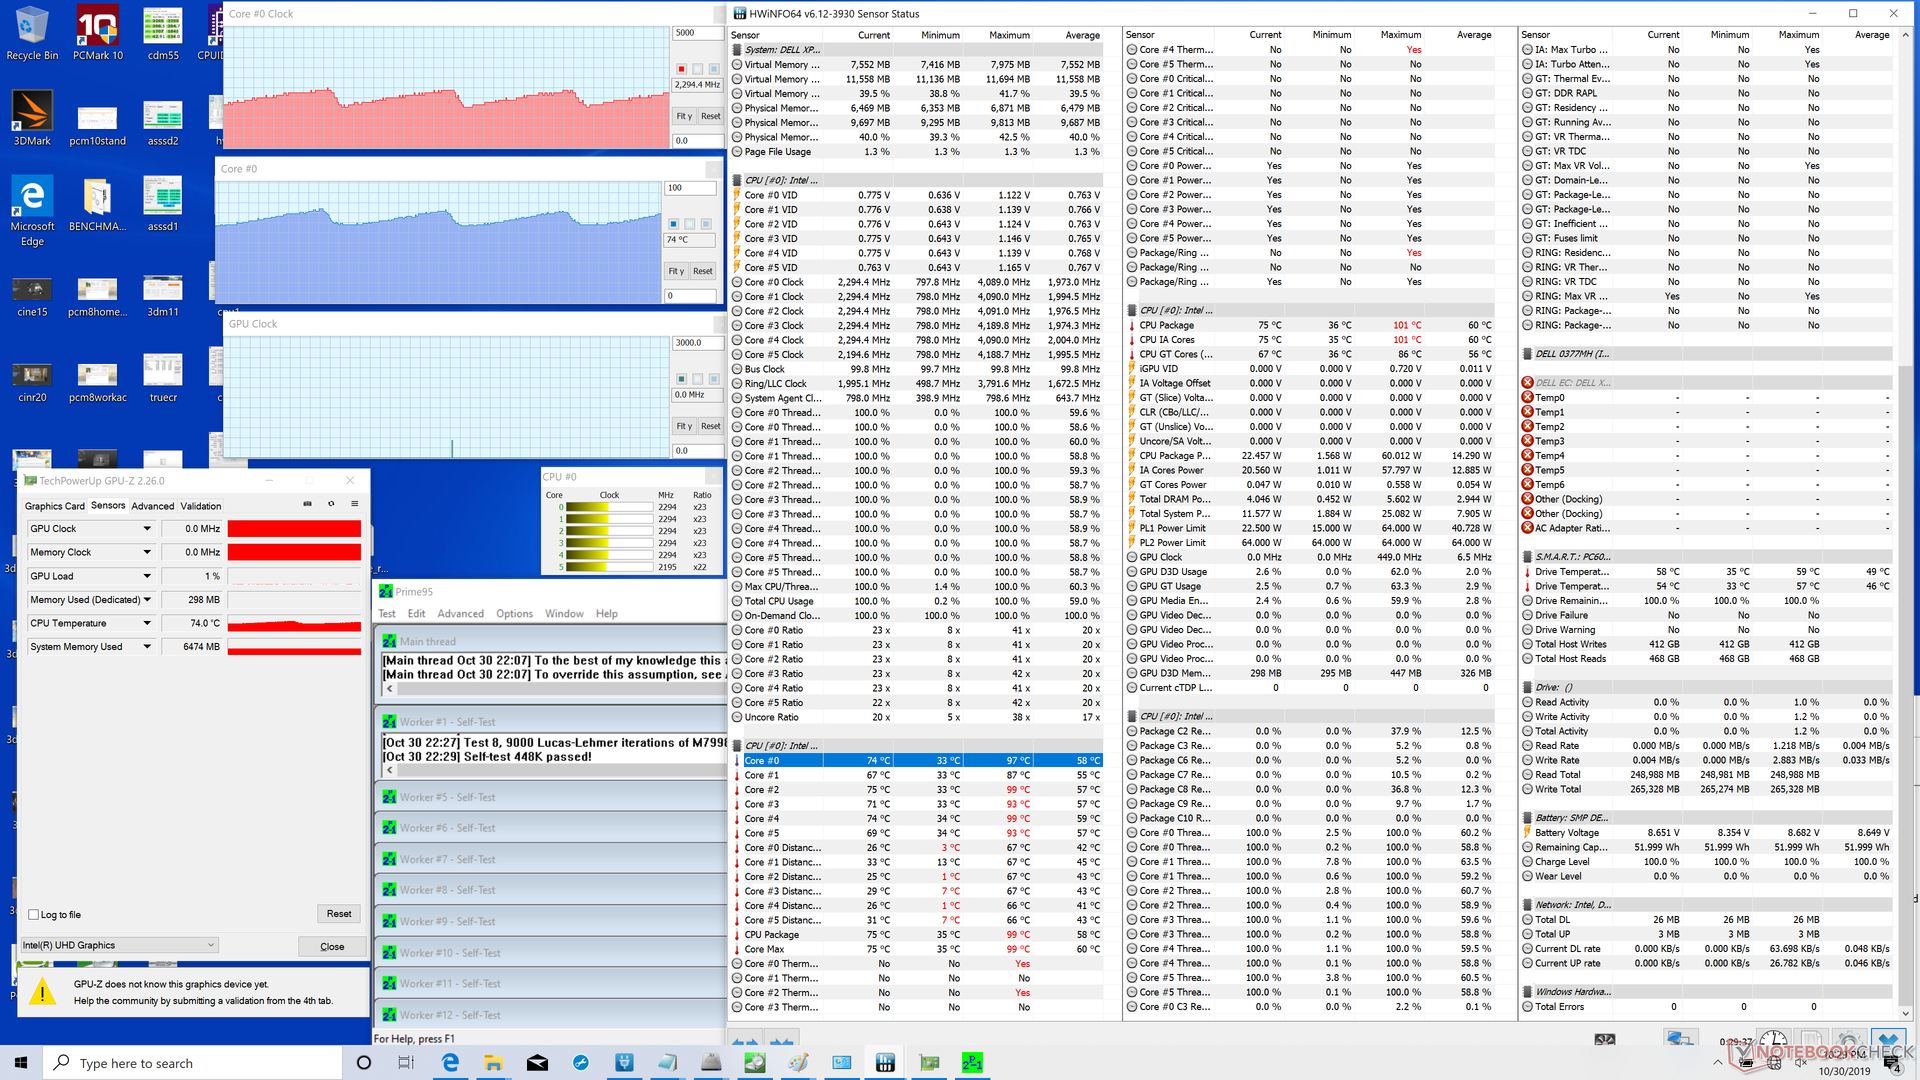
| CPU Clock (GHz) | GPU Clock (MHz) | CPU Temperature (°C) | |
| System Idle | -- | -- | 35 |
| Prime95 Stress | 1.8 - 2.5 | -- | 64 - 80 |
| Prime95 + FurMark Stress | 0.8 - 1.1 | 650 - 850 | 60 - 66 |
Energy Management
Consumo Energetico
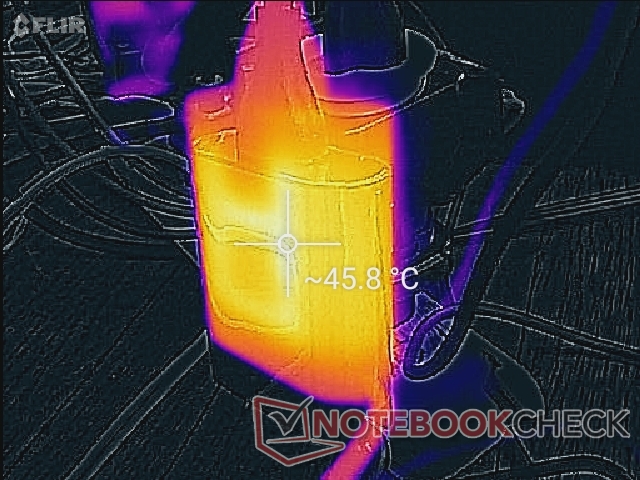
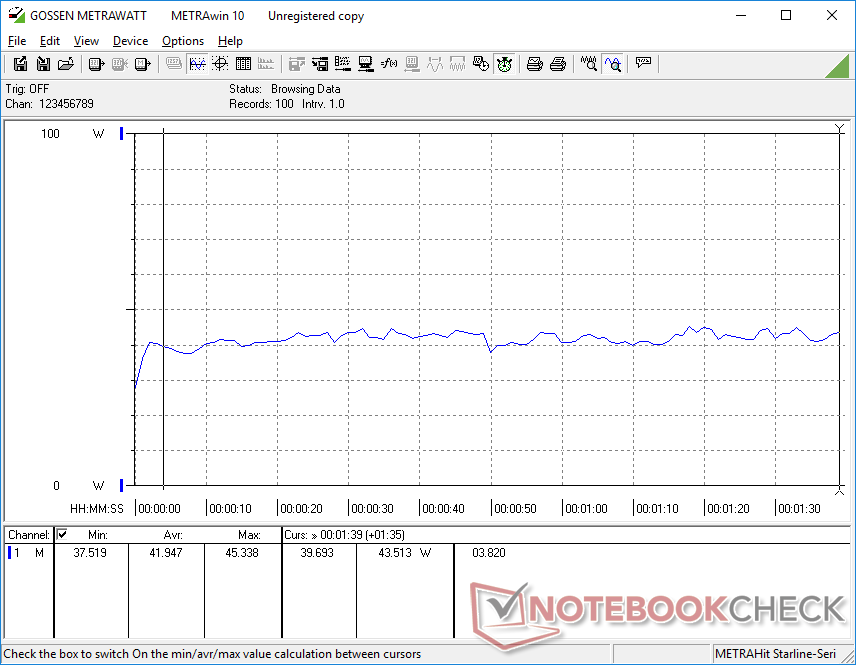
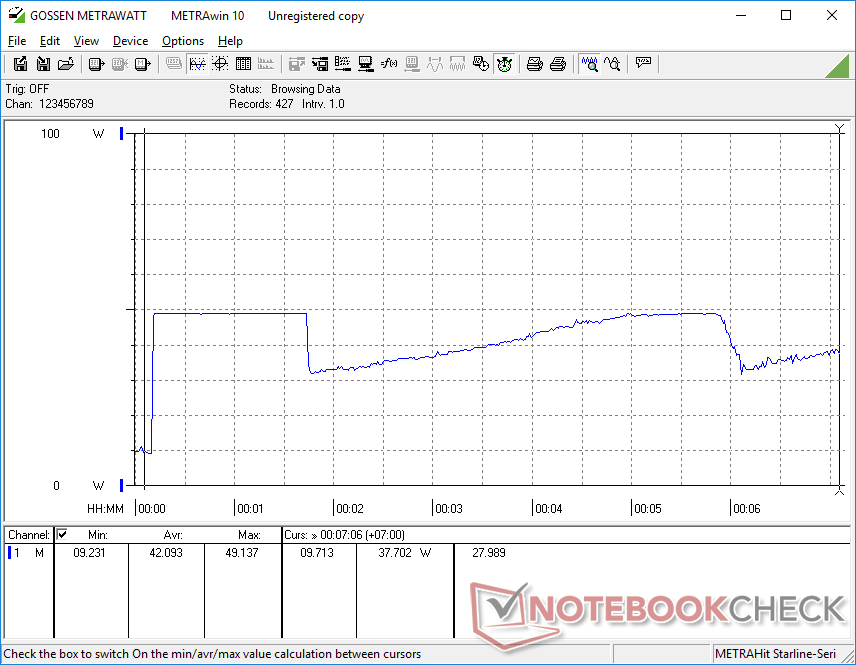
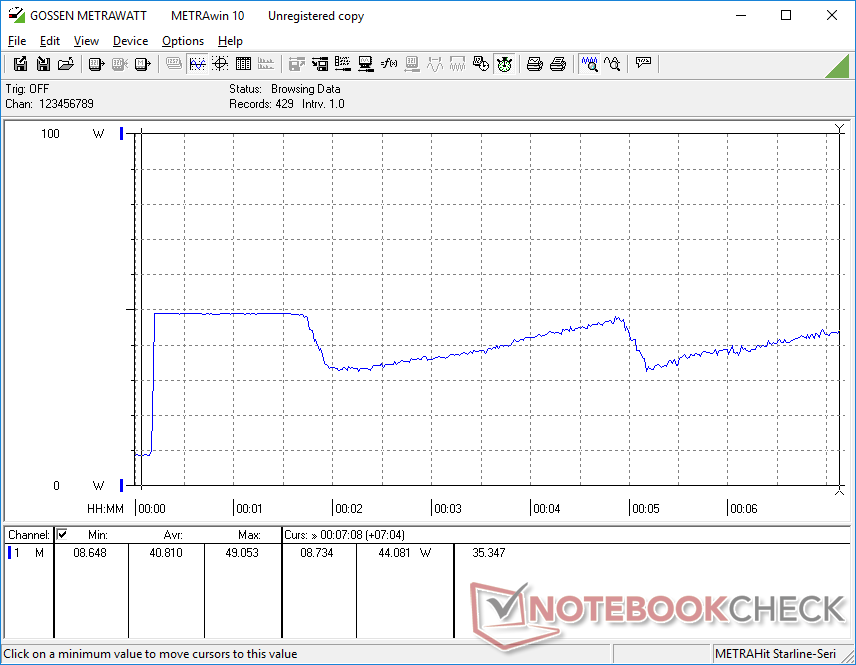
Il consumo medio di energia è molto vicino a quello che abbiamo osservato su entrambi i modelli XPS 13 9380 e XPS 13 9370 di ultima generazione con pannelli 4K UHD. Dopo tutto, ogni unità viene fornita con lo stesso piccolo (~6.0 x 5.5 x 2.3 cm) alimentatore USB Type-C AC da 45 W, che può essere utilizzato anche per ricaricare dispositivi USB Type-C e laptop compatibili con USB Type-C PD. Ciononostante, il consumo di energia oscilla in maniera ciclica in condizioni di estrema sollecitazione di elaborazione, come mostrano i nostri grafici sottostanti.
| Off / Standby | |
| Idle | |
| Sotto carico |
|
Leggenda:
min: | |
| Dell XPS 13 7390 Core i7-10710U i7-10710U, UHD Graphics 620, SK Hynix PC601 NVMe 512 GB, IPS, 3840x2160, 13.3" | Dell XPS 13 7390 2-in-1 Core i7 i7-1065G7, Iris Plus Graphics G7 (Ice Lake 64 EU), Toshiba BG4 KBG40ZPZ512G, IPS, 1920x1200, 13.4" | Dell XPS 13 7390 2-in-1 Core i3 i3-1005G1, UHD Graphics G1 (Ice Lake 32 EU), Toshiba BG4 KBG40ZPZ256G, IPS, 1920x1200, 13.4" | Dell XPS 13 9380 i7 4K i7-8565U, UHD Graphics 620, Samsung SSD PM981 MZVLB512HAJQ, IPS, 3840x2160, 13.3" | Dell XPS 13 9380 2019 i5-8265U, UHD Graphics 620, SK hynix PC401 HFS256GD9TNG, IPS, 3840x2160, 13.3" | Dell XPS 13 9370 i7 UHD i5-8550U, UHD Graphics 620, Toshiba XG5 KXG50ZNV512G, IPS, 3840x2160, 13.3" | |
|---|---|---|---|---|---|---|
| Power Consumption | 20% | 22% | -7% | -2% | -3% | |
| Idle Minimum * (Watt) | 4.7 | 2.6 45% | 3 36% | 5.2 -11% | 4.8 -2% | 5 -6% |
| Idle Average * (Watt) | 8.3 | 5.3 36% | 5.4 35% | 8.6 -4% | 8.6 -4% | 8.3 -0% |
| Idle Maximum * (Watt) | 9 | 7 22% | 7.3 19% | 10.5 -17% | 10.4 -16% | 8.8 2% |
| Load Average * (Watt) | 42 | 43.1 -3% | 33.4 20% | 44.2 -5% | 37.9 10% | 46.4 -10% |
| Load Maximum * (Watt) | 49 | 49 -0% | 48.3 1% | 47.5 3% | 48.5 1% | 48.6 1% |
| Witcher 3 ultra * (Watt) | 43.1 |
* ... Meglio usare valori piccoli
Autonomia della batteria
Forse come diretta conseguenza di un comportamento di consumo energetico simile a quello delle vecchie serie XPS 13 9380 e 9370, la durata della batteria della nuova opzione Comet Lake-U è più o meno la stessa dei suoi fratelli maggiori. Gli utenti possono aspettarsi poco più di 8 ore di utilizzo reale della WLAN prima di doversi ricaricare.
| Dell XPS 13 7390 Core i7-10710U i7-10710U, UHD Graphics 620, 52 Wh | Dell XPS 13 7390 2-in-1 Core i7 i7-1065G7, Iris Plus Graphics G7 (Ice Lake 64 EU), 51 Wh | Dell XPS 13 7390 2-in-1 Core i3 i3-1005G1, UHD Graphics G1 (Ice Lake 32 EU), 51 Wh | Dell XPS 13 9380 i7 4K i7-8565U, UHD Graphics 620, 52 Wh | Dell XPS 13 9380 2019 i5-8265U, UHD Graphics 620, 52 Wh | Dell XPS 13 9370 i7 UHD i5-8550U, UHD Graphics 620, 52 Wh | |
|---|---|---|---|---|---|---|
| Autonomia della batteria | 7% | 6% | -8% | -1% | -7% | |
| WiFi v1.3 (h) | 8.4 | 9 7% | 8.9 6% | 7.7 -8% | 8.3 -1% | 7.8 -7% |
| Reader / Idle (h) | 35.7 | 17.2 | 13.7 | |||
| Load (h) | 2.2 | 2.4 | 1.8 |
Pro
Contro
Giudizio Complessivo
Hai davvero bisogno di un processore hexa-core per un subnotebook? Se la vostra intenzione è quella di utilizzare l'XPS 13 principalmente per la navigazione web, lo streaming video, l'elaborazione di testi o altre attività leggere da ufficio per cui la serie è stata inizialmente progettata, allora il vecchio quad-core Core i7-8565U sarà sufficiente. I punteggi di PCMark 10 sono così vicini tra l'XPS 13 7390 e l'XPS 13 9380 che diventa difficile giustificare il sovrapprezzo dell'XPS 13 hexa-core, soprattutto perché la maggior parte degli utenti non noterà la differenza durante i carichi quotidiani.
D'altra parte, gli utenti che vogliono sfruttare i due cores aggiuntivi di Comet Lake-U saranno felici di scoprire che l'incremento delle prestazioni del multithread grezzo rispetto al Whiskey Lake-U è abbastanza significativo anche dopo aver tenuto conto dell'instabile e ciclico valore di clock e della limitata sostenibilità massima del Turbo Boost. Se si eseguono frequentemente programmi che possono beneficiare di thread aggiuntivi o si desidera collegare le docking station eGPU al proprio XPS 13, allora vale la pena di utilizzare la SKU hexa-core Core i7-10710U.
L'XPS 13 7390 hexa-core è per gli utenti che vogliono le prestazioni di un Core i5 XPS 15 di base in un pacchetto più piccolo da 13,3 pollici. Il sistema è in grado di offrire maggiori prestazioni senza alcuno svantaggio evidente per quanto riguarda la durata della batteria, le temperature di superficie, il consumo energetico o il rumore della ventola.
Dell XPS 13 7390 Core i7-10710U
- 05/15/2020 v7 (old)
Allen Ngo
Price comparison
