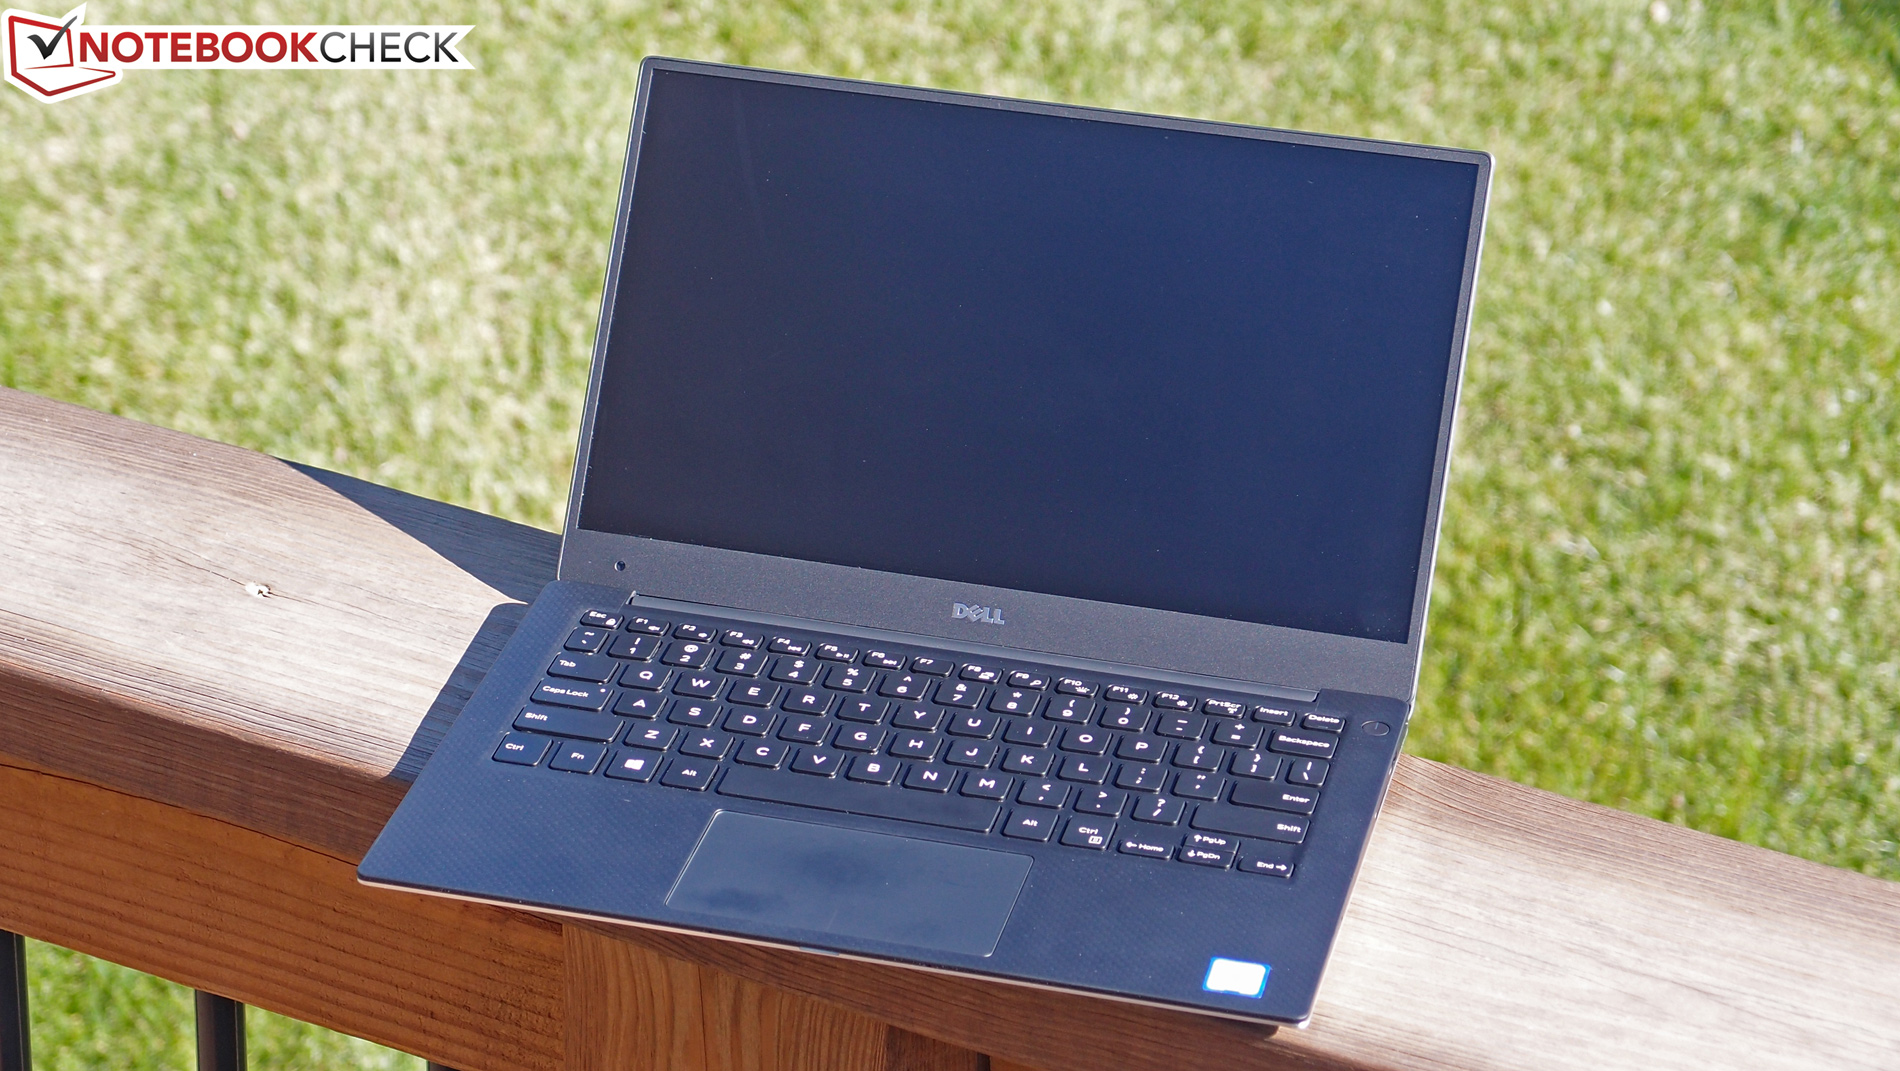
Recensione breve dell'Ultrabook Dell XPS 13-9350 InfinityEdge
| |||||||||||||||||||||||||
Distribuzione della luminosità: 88 %
Al centro con la batteria: 277.5 cd/m²
Contrasto: 1453:1 (Nero: 0.191 cd/m²)
ΔE ColorChecker Calman: 4.88 | ∀{0.5-29.43 Ø4.72}
ΔE Greyscale Calman: 4.26 | ∀{0.09-98 Ø4.97}
65.79% sRGB (Argyll 1.6.3 3D)
41.6% AdobeRGB 1998 (Argyll 1.6.3 3D)
45.97% AdobeRGB 1998 (Argyll 3D)
66.8% sRGB (Argyll 3D)
44.53% Display P3 (Argyll 3D)
Gamma: 2.59
CCT: 6562 K
| Dell XPS 13-9350 | Dell XPS 13-9343 | Dell XPS 13-9343 Non-Touch | Apple MacBook Air 13 inch 2015-03 | Microsoft Surface Book Core i5 | |
|---|---|---|---|---|---|
| Display | 54% | 42% | -10% | 48% | |
| Display P3 Coverage (%) | 44.53 | 72 62% | 65.9 48% | 40.1 -10% | 67 50% |
| sRGB Coverage (%) | 66.8 | 96 44% | 89.6 34% | 59.8 -10% | 95.8 43% |
| AdobeRGB 1998 Coverage (%) | 45.97 | 71.6 56% | 66.2 44% | 41.51 -10% | 68.9 50% |
| Response Times | |||||
| Response Time Grey 50% / Grey 80% * (ms) | 48.4 ? | ||||
| Response Time Black / White * (ms) | 32.8 ? | ||||
| PWM Frequency (Hz) | |||||
| Screen | 19% | -5% | -12% | 33% | |
| Brightness middle (cd/m²) | 277.5 | 367.3 32% | 409.7 48% | 329 19% | 430.9 55% |
| Brightness (cd/m²) | 276 | 372 35% | 405 47% | 310 12% | 410 49% |
| Brightness Distribution (%) | 88 | 77 -12% | 93 6% | 82 -7% | 93 6% |
| Black Level * (cd/m²) | 0.191 | 0.178 7% | 0.366 -92% | 0.405 -112% | 0.254 -33% |
| Contrast (:1) | 1453 | 2063 42% | 1119 -23% | 812 -44% | 1696 17% |
| Colorchecker dE 2000 * | 4.88 | 5.92 -21% | 7.67 -57% | 3.96 19% | 2.06 58% |
| Greyscale dE 2000 * | 4.26 | 4.79 -12% | 4.66 -9% | 3.51 18% | 2.22 48% |
| Gamma | 2.59 85% | 2.42 91% | 1.65 133% | 3.83 57% | 2.13 103% |
| CCT | 6562 99% | 7013 93% | 6502 100% | 6711 97% | 6520 100% |
| Color Space (Percent of AdobeRGB 1998) (%) | 41.6 | 63 51% | 59.65 43% | 38.4 -8% | 64 54% |
| Color Space (Percent of sRGB) (%) | 65.79 | 96.4 47% | 59.8 -9% | 96 46% | |
| Colorchecker dE 2000 max. * | 7.51 | ||||
| Media totale (Programma / Settaggio) | 37% /
28% | 19% /
8% | -11% /
-12% | 41% /
37% |
* ... Meglio usare valori piccoli
| Cinebench R11.5 | |
| CPU Single 64Bit (ordina per valore) | |
| Dell XPS 13-9350 | |
| Dell XPS 13-9343 | |
| Dell XPS 13-9343 Non-Touch | |
| HP EliteBook Folio 1040 G2 H7W22EA | |
| Apple MacBook Air 13 inch 2015-03 | |
| Microsoft Surface Book Core i5 | |
| Apple MacBook Pro Retina 13 inch 2015-03 | |
| Apple MacBook Pro Retina 13 inch 2015-03 | |
| CPU Multi 64Bit (ordina per valore) | |
| Dell XPS 13-9350 | |
| Dell XPS 13-9343 | |
| Dell XPS 13-9343 Non-Touch | |
| HP EliteBook Folio 1040 G2 H7W22EA | |
| Apple MacBook Air 13 inch 2015-03 | |
| Microsoft Surface Book Core i5 | |
| Apple MacBook Pro Retina 13 inch 2015-03 | |
| Apple MacBook Pro Retina 13 inch 2015-03 | |
| Cinebench R15 | |
| CPU Single 64Bit (ordina per valore) | |
| Dell XPS 13-9350 | |
| Dell XPS 13-9343 | |
| Dell XPS 13-9343 Non-Touch | |
| HP EliteBook Folio 1040 G2 H7W22EA | |
| Apple MacBook Air 13 inch 2015-03 | |
| Microsoft Surface Book Core i5 | |
| Apple MacBook Pro Retina 13 inch 2015-03 | |
| CPU Multi 64Bit (ordina per valore) | |
| Dell XPS 13-9350 | |
| Dell XPS 13-9343 | |
| Dell XPS 13-9343 Non-Touch | |
| HP EliteBook Folio 1040 G2 H7W22EA | |
| Apple MacBook Air 13 inch 2015-03 | |
| Microsoft Surface Book Core i5 | |
| Apple MacBook Pro Retina 13 inch 2015-03 | |
| wPrime 2.10 | |
| 32m (ordina per valore) | |
| Dell XPS 13-9350 | |
| Dell XPS 13-9343 | |
| Dell XPS 13-9343 Non-Touch | |
| HP EliteBook Folio 1040 G2 H7W22EA | |
| Apple MacBook Air 13 inch 2015-03 | |
| Microsoft Surface Book Core i5 | |
| 1024m (ordina per valore) | |
| Dell XPS 13-9350 | |
| Dell XPS 13-9343 | |
| Dell XPS 13-9343 Non-Touch | |
| HP EliteBook Folio 1040 G2 H7W22EA | |
| Apple MacBook Air 13 inch 2015-03 | |
| Microsoft Surface Book Core i5 | |
| Super Pi Mod 1.5 XS 32M - 32M (ordina per valore) | |
| Dell XPS 13-9350 | |
| Dell XPS 13-9343 | |
| Dell XPS 13-9343 Non-Touch | |
| HP EliteBook Folio 1040 G2 H7W22EA | |
| Apple MacBook Air 13 inch 2015-03 | |
| Microsoft Surface Book Core i5 | |
| Apple MacBook Pro Retina 13 inch 2015-03 | |
* ... Meglio usare valori piccoli
| PCMark 7 Score | 4989 punti | |
| PCMark 8 Home Score Accelerated v2 | 2983 punti | |
| PCMark 8 Creative Score Accelerated v2 | 3658 punti | |
| PCMark 8 Work Score Accelerated v2 | 4078 punti | |
Aiuto | ||

| 3DMark 06 Standard Score | 9313 punti | |
| 3DMark 11 Performance | 1558 punti | |
| 3DMark Ice Storm Standard Score | 52625 punti | |
| 3DMark Cloud Gate Standard Score | 5931 punti | |
| 3DMark Fire Strike Score | 861 punti | |
Aiuto | ||
| basso | medio | alto | ultra | |
|---|---|---|---|---|
| Metro 2033 (2010) | 31.33 | 19.67 | 9.67 | |
| StarCraft 2 (2010) | 49 | 32 | 21 | |
| BioShock Infinite (2013) | 54.7 | 28.16 | 23.7 | 7.33 |
| 3DMark 06 - 1280x1024 Standard Score AA:0x AF:0x (ordina per valore) | |
| Dell XPS 13-9350 | |
| Dell XPS 13-9343 | |
| Dell XPS 13-9343 Non-Touch | |
| Apple MacBook Air 13 inch 2015-03 | |
| Microsoft Surface Book Core i5 | |
| Apple MacBook Pro Retina 13 inch 2015-03 | |
| 3DMark 11 | |
| 1280x720 Performance (ordina per valore) | |
| Dell XPS 13-9350 | |
| Dell XPS 13-9343 | |
| Dell XPS 13-9343 Non-Touch | |
| HP EliteBook Folio 1040 G2 H7W22EA | |
| Apple MacBook Air 13 inch 2015-03 | |
| Microsoft Surface Book Core i5 | |
| Apple MacBook Pro Retina 13 inch 2015-03 | |
| 1280x720 Performance GPU (ordina per valore) | |
| Dell XPS 13-9350 | |
| Dell XPS 13-9343 Non-Touch | |
| HP EliteBook Folio 1040 G2 H7W22EA | |
| Apple MacBook Air 13 inch 2015-03 | |
| Microsoft Surface Book Core i5 | |
| Apple MacBook Pro Retina 13 inch 2015-03 | |
Rumorosità
| Idle |
| 28.2 / 28.3 / 28.4 dB(A) |
| Sotto carico |
| 30.2 / 30.2 dB(A) |
 | ||
30 dB silenzioso 40 dB(A) udibile 50 dB(A) rumoroso |
||
min: | ||
| Dell XPS 13-9350 | Dell XPS 13-9343 | Dell XPS 13-9343 Non-Touch | Apple MacBook Air 13 inch 2015-03 | Microsoft Surface Book Core i5 | |
|---|---|---|---|---|---|
| Noise | -19% | -8% | -19% | -15% | |
| Idle Minimum * (dB) | 28.2 | 30.2 -7% | 29 -3% | 29.2 -4% | 29.5 -5% |
| Idle Average * (dB) | 28.3 | 30.3 -7% | 29.1 -3% | 29.2 -3% | 29.6 -5% |
| Idle Maximum * (dB) | 28.4 | 30.4 -7% | 29.2 -3% | 29.2 -3% | 29.7 -5% |
| Load Average * (dB) | 30.2 | 34.4 -14% | 31.1 -3% | 40.2 -33% | 37.5 -24% |
| Load Maximum * (dB) | 30.2 | 48 -59% | 38.4 -27% | 46.3 -53% | 40.9 -35% |
* ... Meglio usare valori piccoli
(-) La temperatura massima sul lato superiore è di 45.2 °C / 113 F, rispetto alla media di 35.9 °C / 97 F, che varia da 21.4 a 59 °C per questa classe Subnotebook.
(-) Il lato inferiore si riscalda fino ad un massimo di 45.2 °C / 113 F, rispetto alla media di 39.2 °C / 103 F
(+) In idle, la temperatura media del lato superiore è di 27 °C / 81 F, rispetto alla media deld ispositivo di 30.8 °C / 87 F.
(+) I poggiapolsi e il touchpad sono piu' freddi della temperatura della pelle con un massimo di 30.8 °C / 87.4 F e sono quindi freddi al tatto.
(-) La temperatura media della zona del palmo della mano di dispositivi simili e'stata di 28.2 °C / 82.8 F (-2.6 °C / -4.6 F).
| Dell XPS 13-9350 | Dell XPS 13-9343 | Dell XPS 13-9343 Non-Touch | Apple MacBook Air 13 inch 2015-03 | Microsoft Surface Book Core i5 | |
|---|---|---|---|---|---|
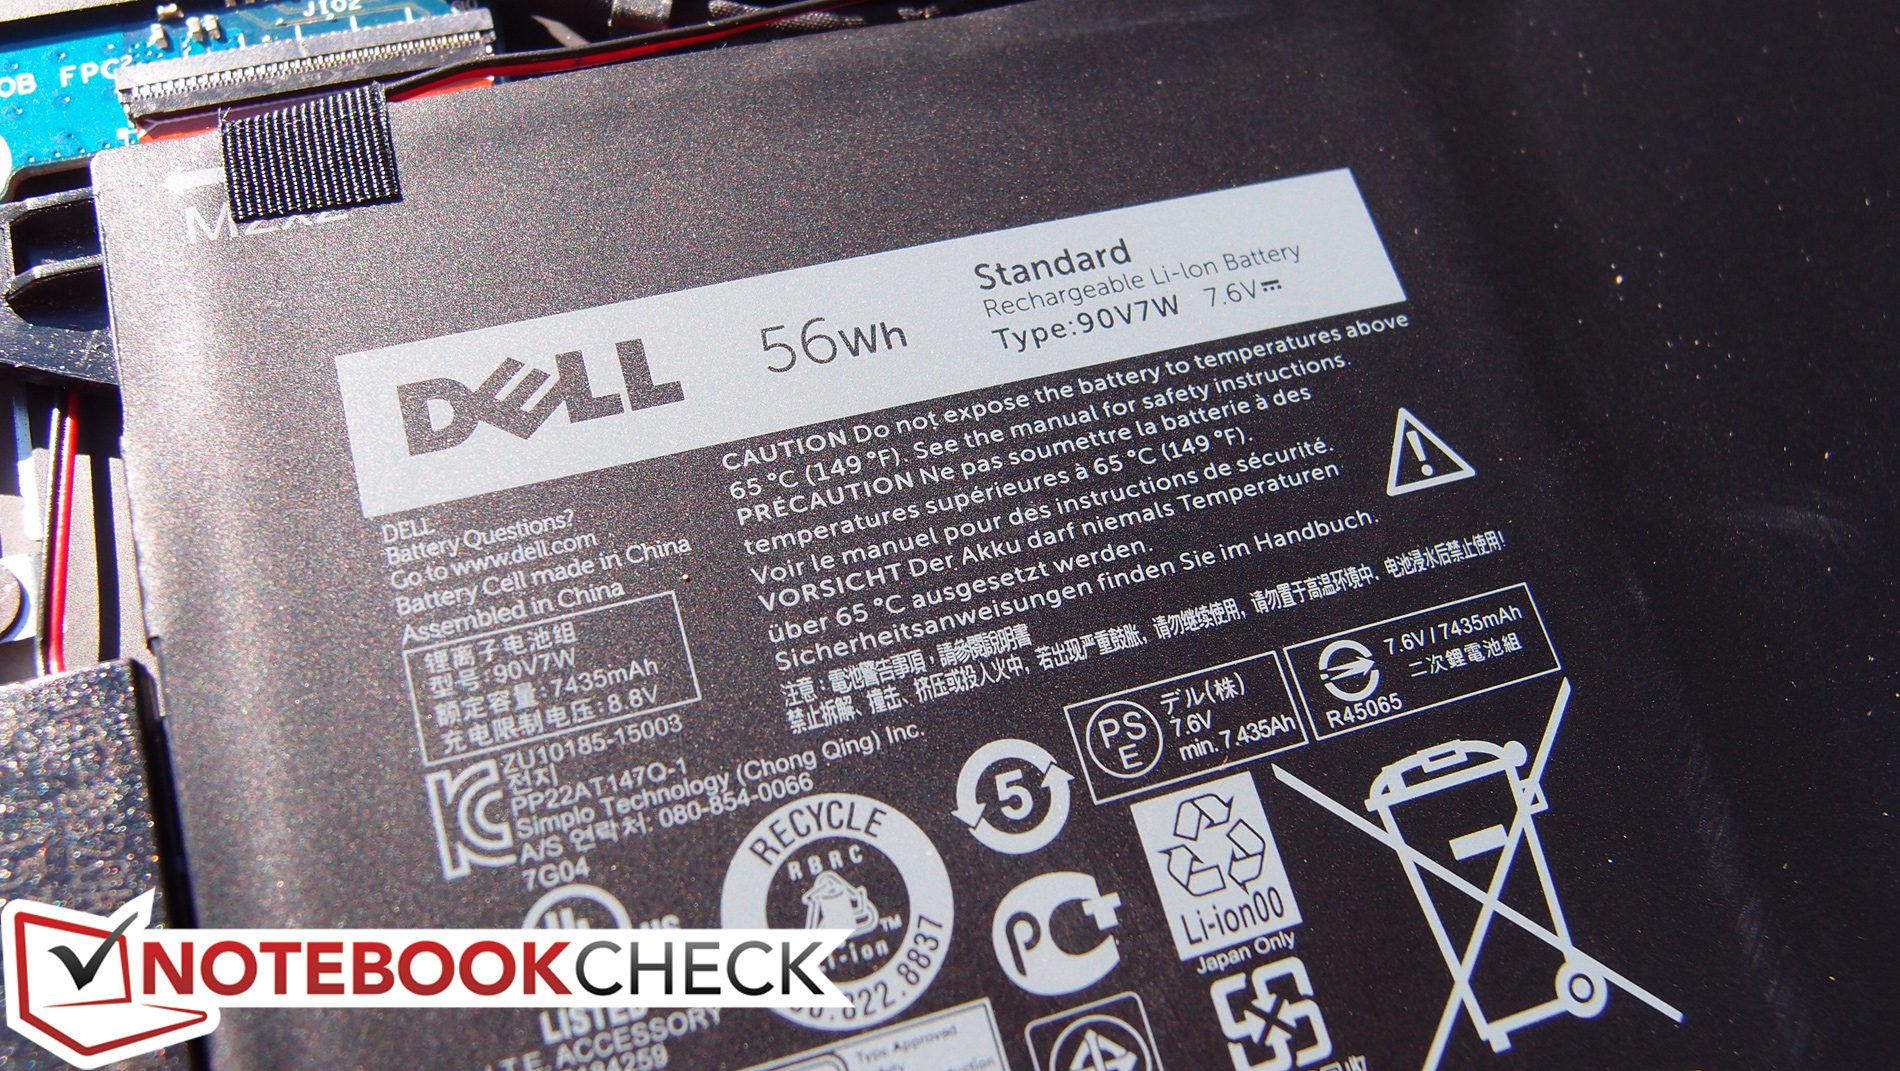
| Autonomia della batteria | 5% | 32% | 34% | 10% | |
| Reader / Idle (h) | 13 | 15.2 17% | 21.6 66% | 26.2 102% | 17.8 37% |
| WiFi v1.3 (h) | 7.5 | 10 33% | 10.3 37% | 6.7 -11% | |
| Load (h) | 2.5 | 2.3 -8% | 2.4 -4% | 1.6 -36% | 2.6 4% |
| WiFi (h) | 9.7 |
Pro
Contro
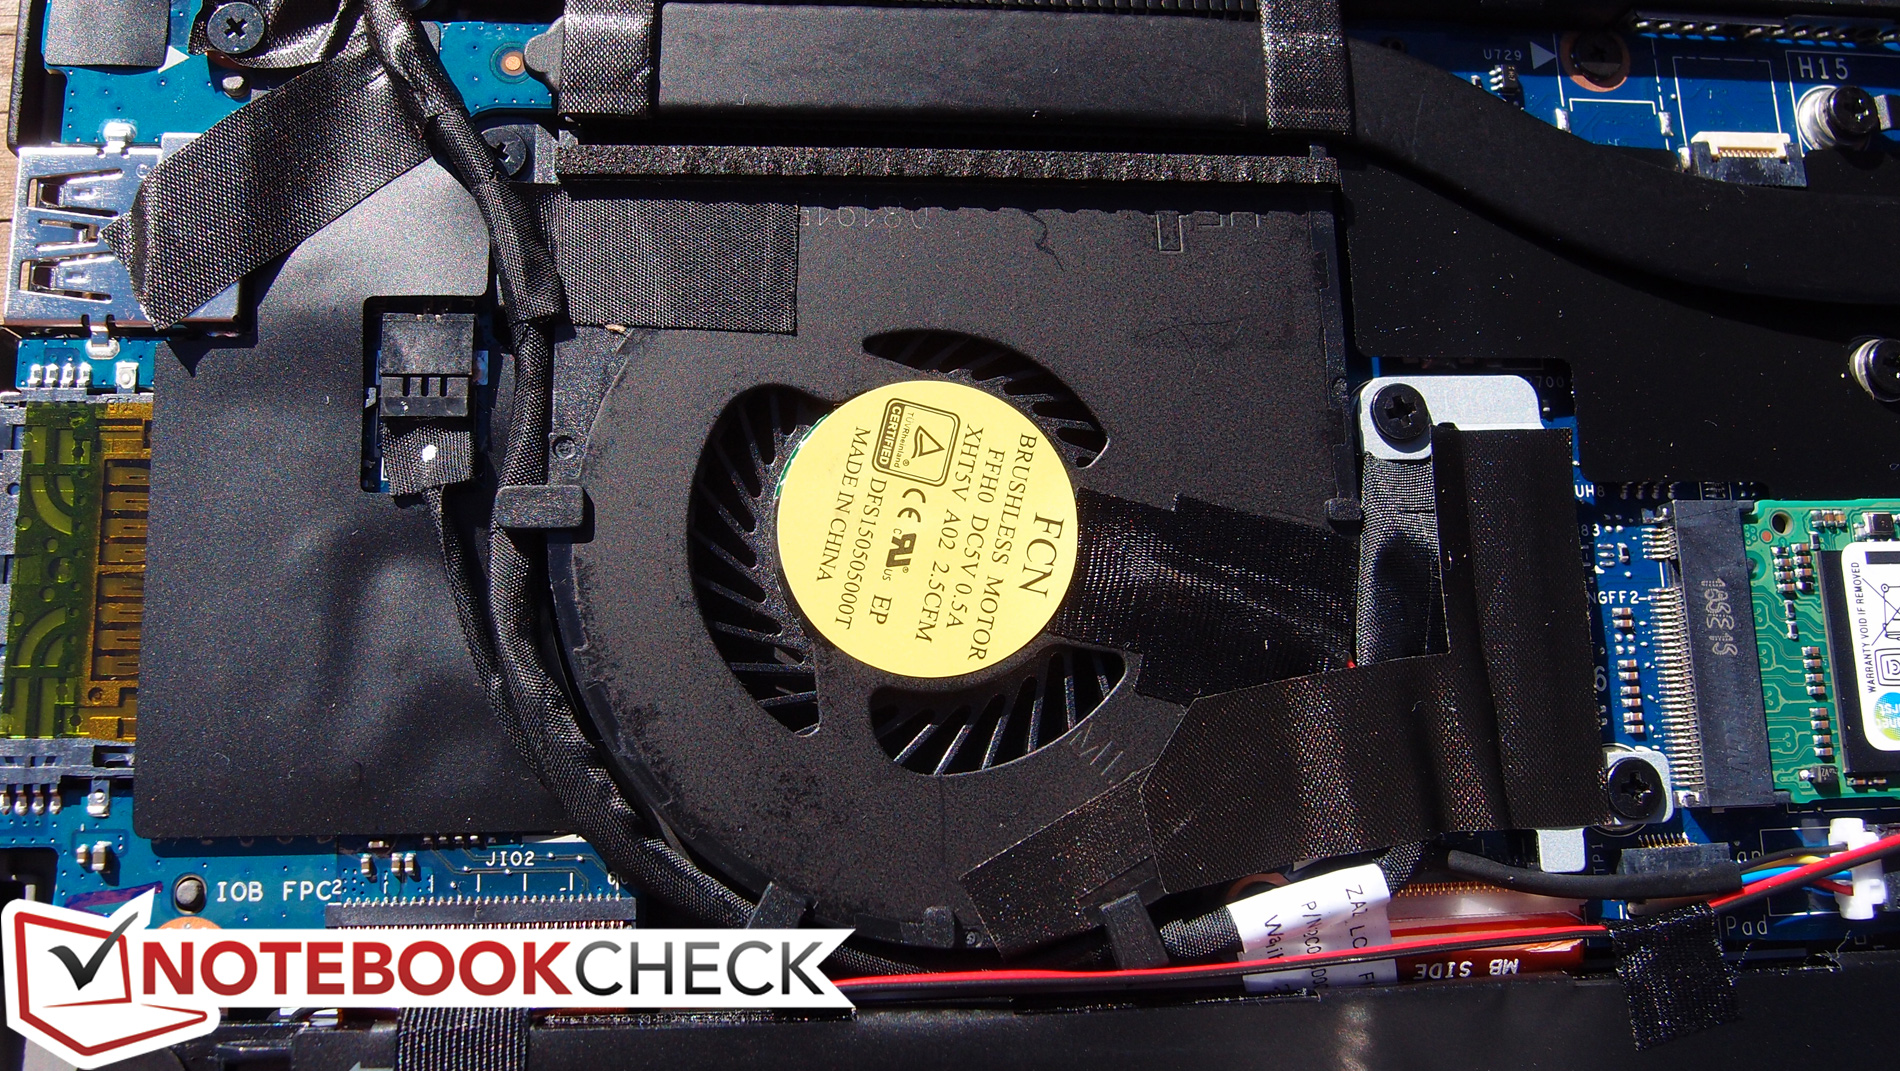
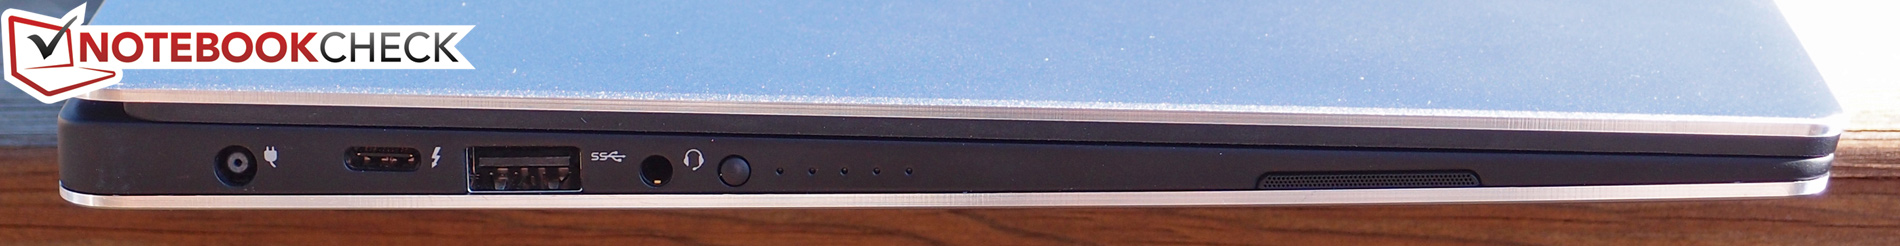
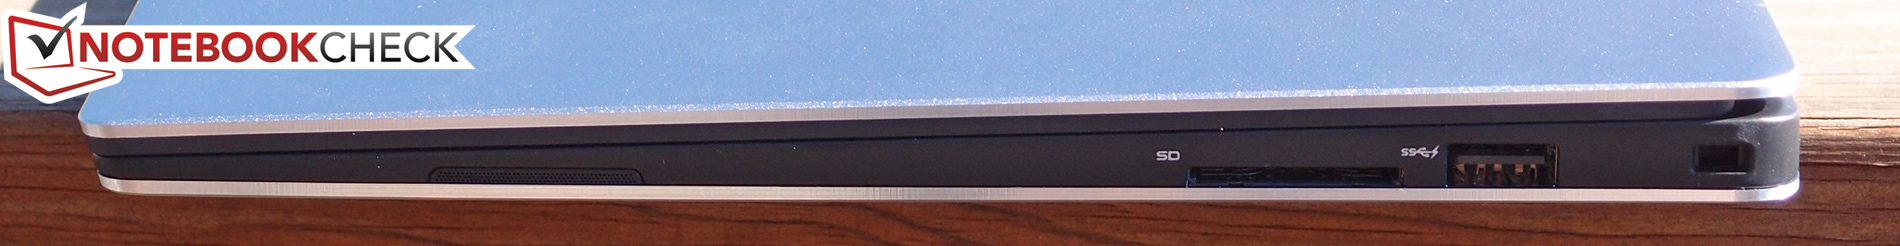
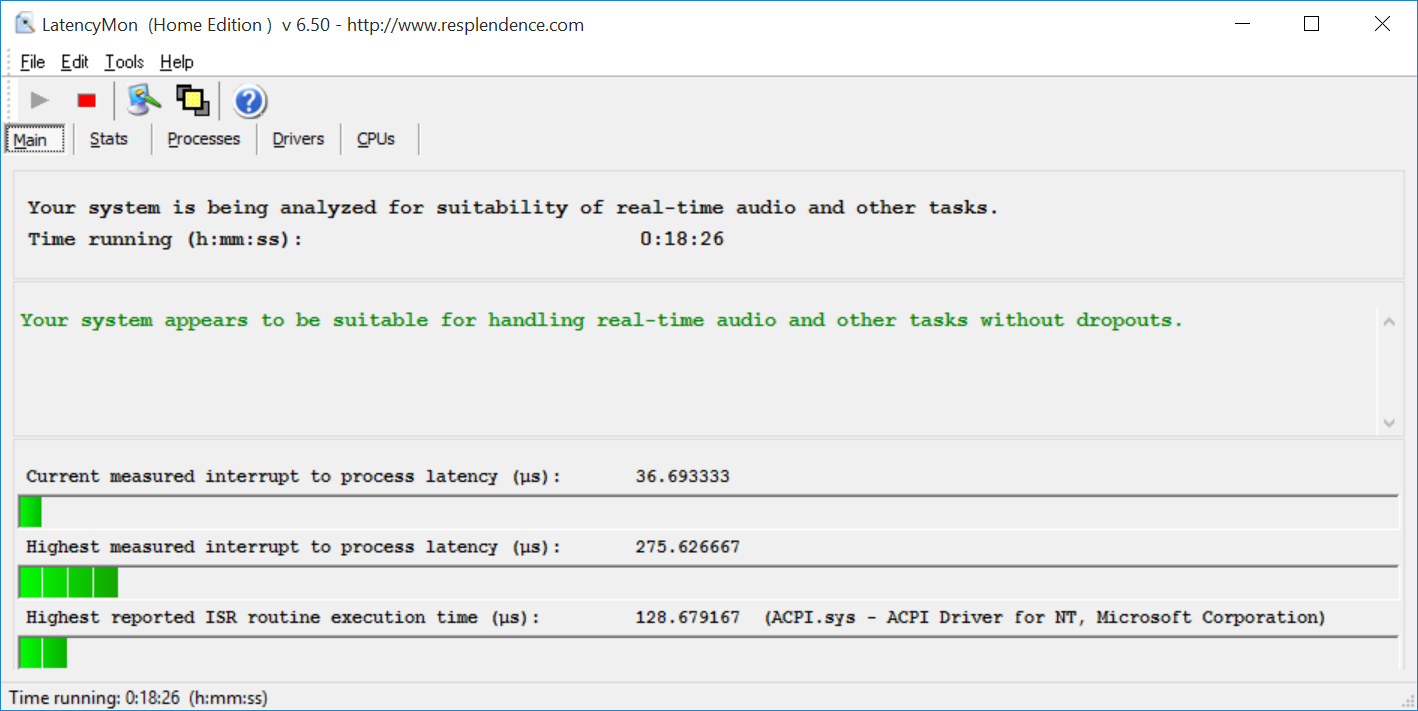
Otto mesi più tardi, il Dell XPS 13 resta un fiero contendente della corona di ultraportatile, con un chipset migliorato ed una nuova CPU, un SSD NVMe più veloce, configurazione di memoria migliorata, scheda grafica integrata superiore, migliore selezione di porte, e soprattutto massima silenziosità. Non si tratta dell'Ultrabook più veloce che abbiamo recensito; ci sono moderni contendenti - come il Microsoft Surface Book e l'Apple MacBook Air 13 — ha hanno un leggero vantaggio. Ma il fatto che queste ottime prestazioni riguardino un sistema già ben bilanciato lo rende ancora più attraente.
Il principale punto di forza del Dell XPS 13-9350 è nel delicato bilanciamento di tutto nel mercato degli ultraportatili. Che si parli di portabilità, performance, versatilità, ergonomicità, calore o rumore, o anche bellezza, non c'è molto di cui lamentarsi.
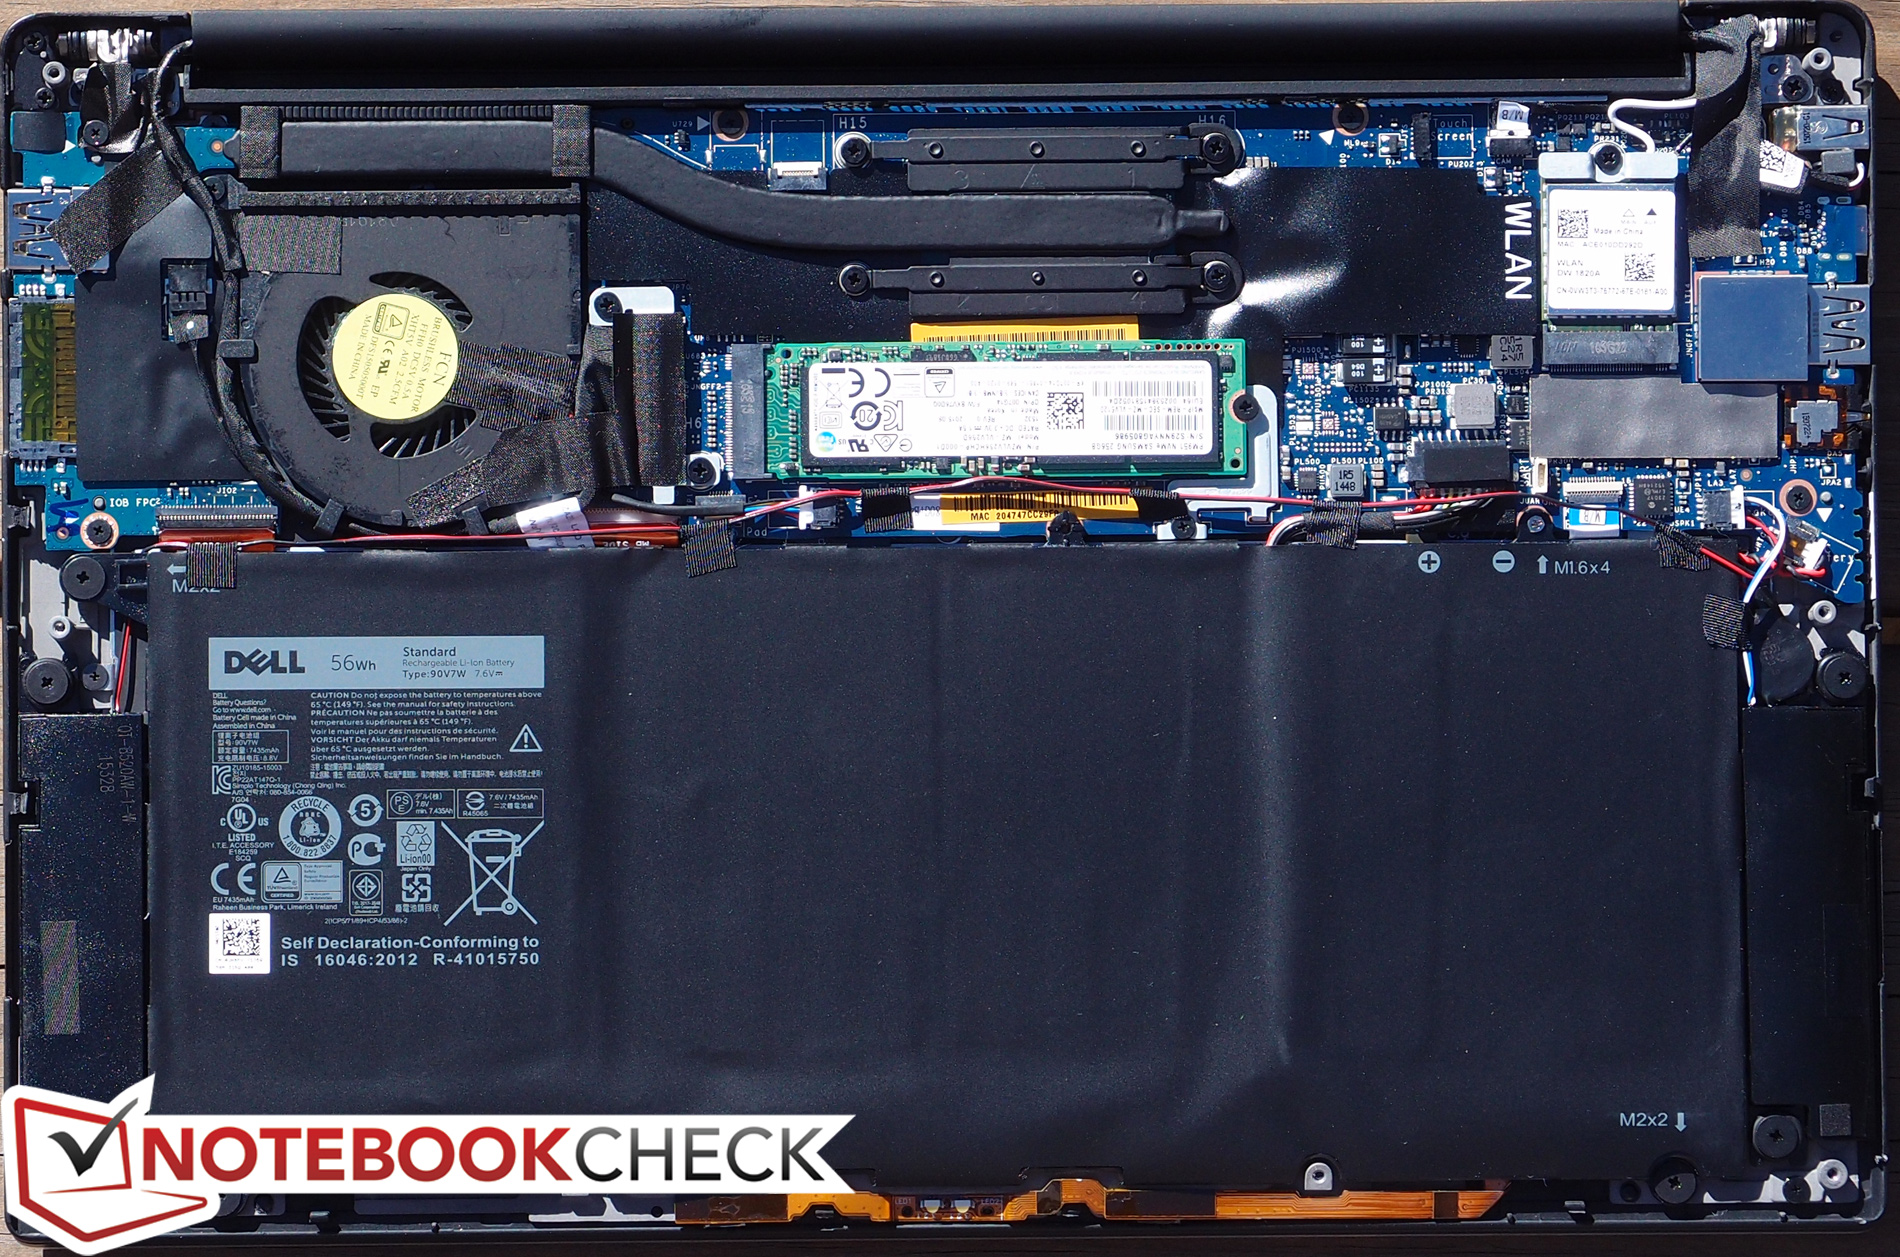
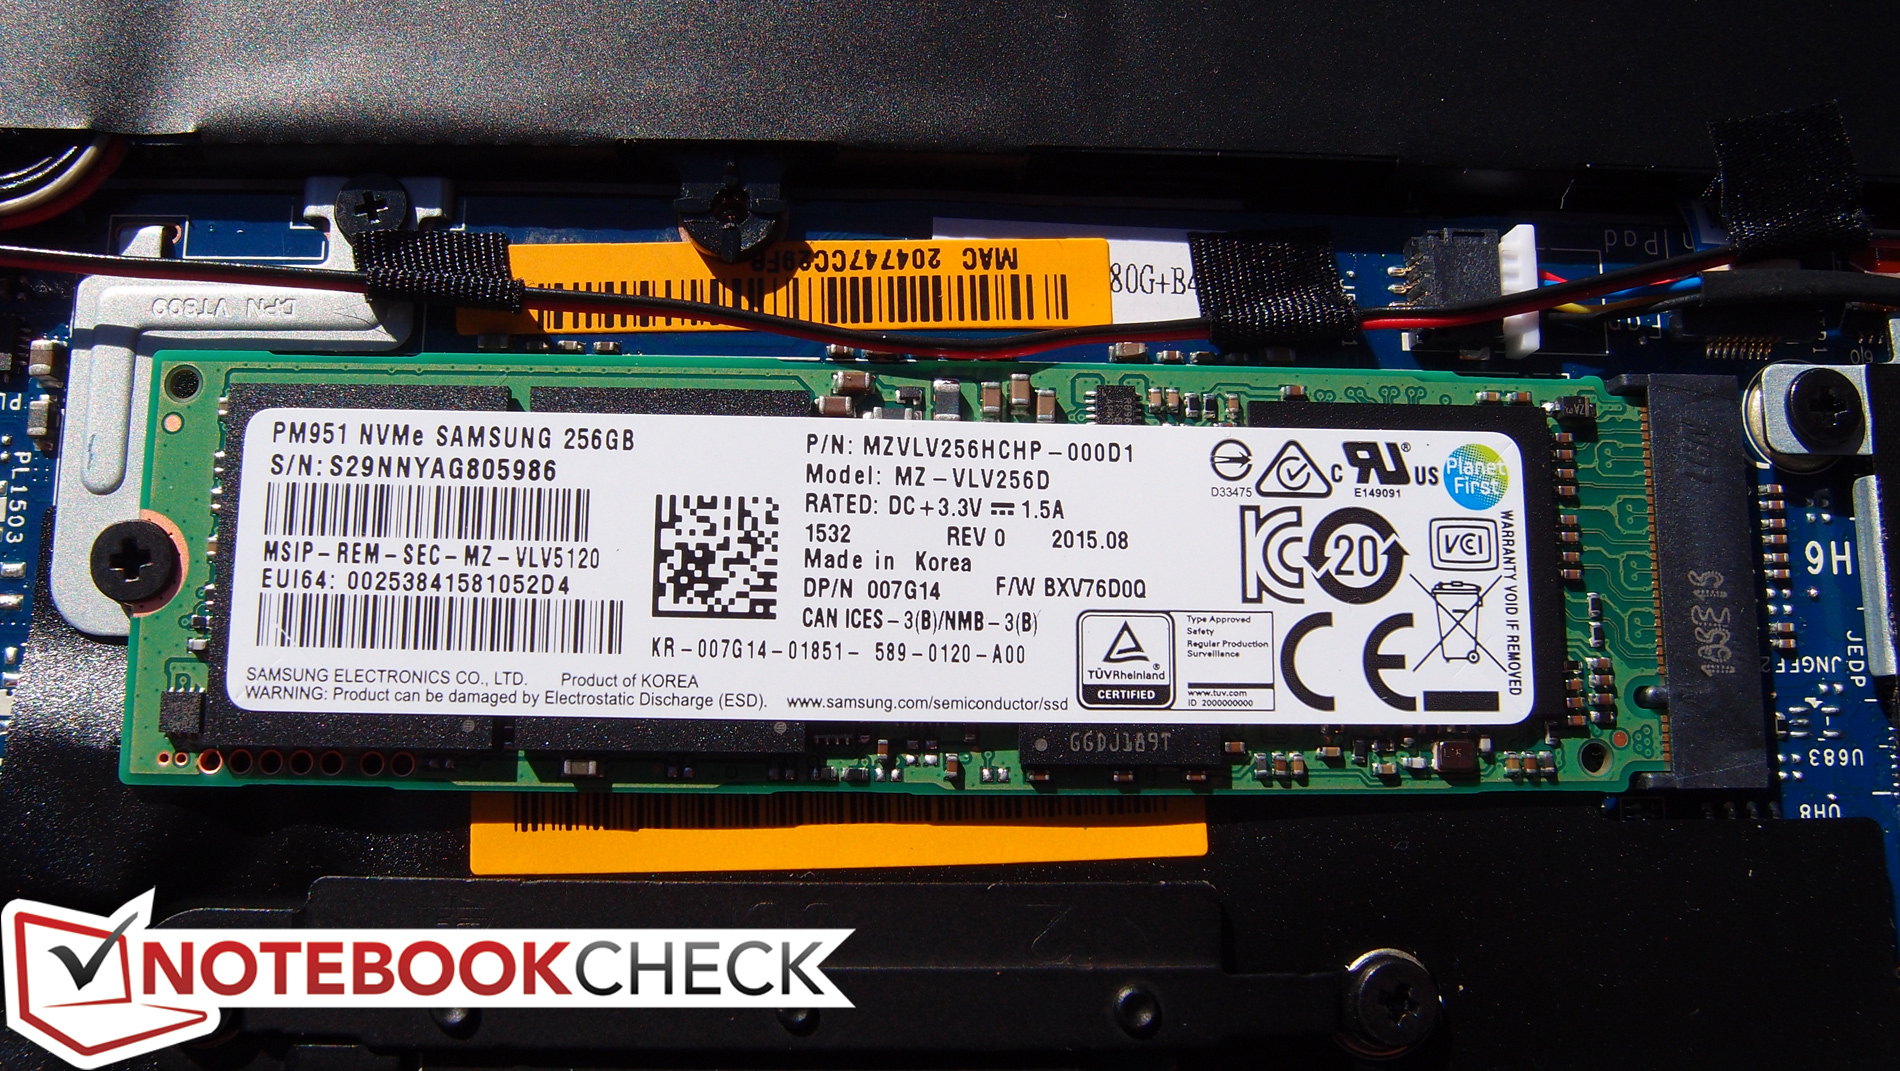
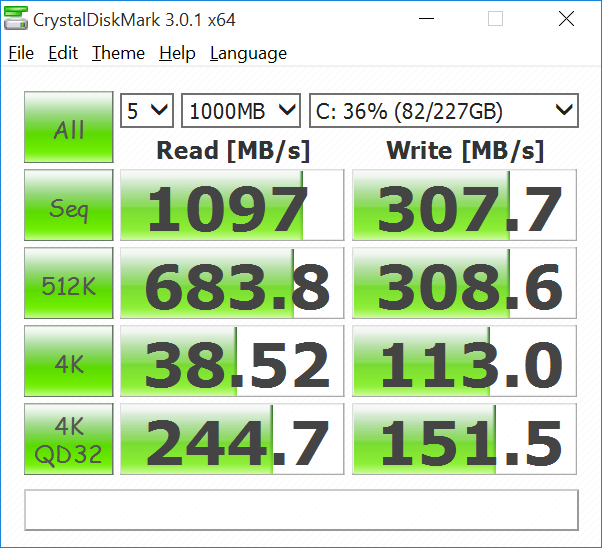
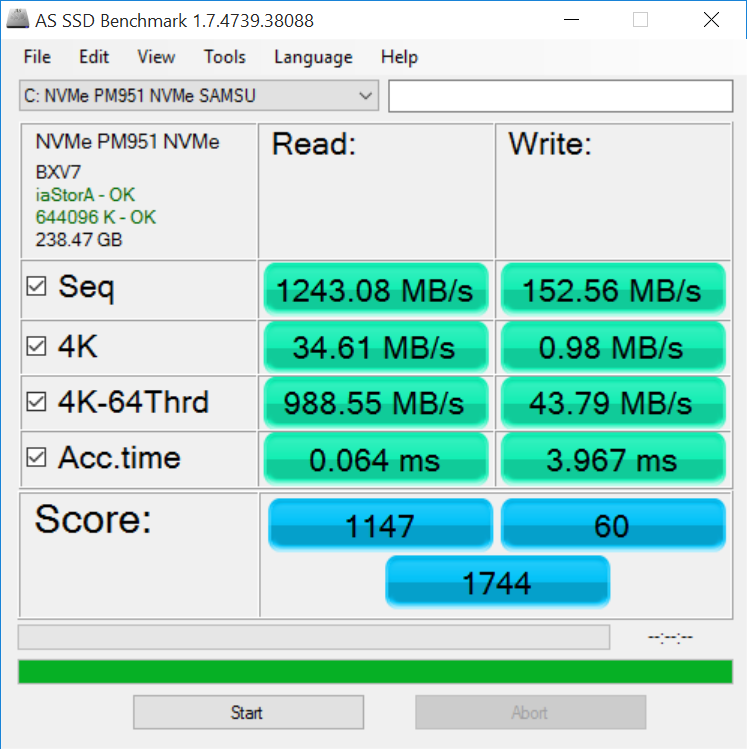
Le lamentele sono in parte quelle del passato: manca una migliore gamma di colore del display, ci sono limiti alle opzioni di upgrade, e la garanzia è breve. La velocità di scrittura dell'SSD Samsung è bassa per la siua classe, ed è un peccato vedere l'auto-luminosità CBAC. Tuttavia, non ci sono altre pecce evidenti, anche dopo una valutazione intensiva e vari test.
Nota: si tratta di una recensione breve con alcune sezioni non tradotte, per la versione integrale in inglese guardate qui.
Dell XPS 13-9350
- 02/16/2016 v5 (old)
Steve Schardein
Price comparison
