Recensione Breve del portatile Dell XPS 13 2016 (i7, 256 GB, QHD+)
| |||||||||||||||||||||||||
Distribuzione della luminosità: 90 %
Al centro con la batteria: 216 cd/m²
Contrasto: 1583:1 (Nero: 0.18 cd/m²)
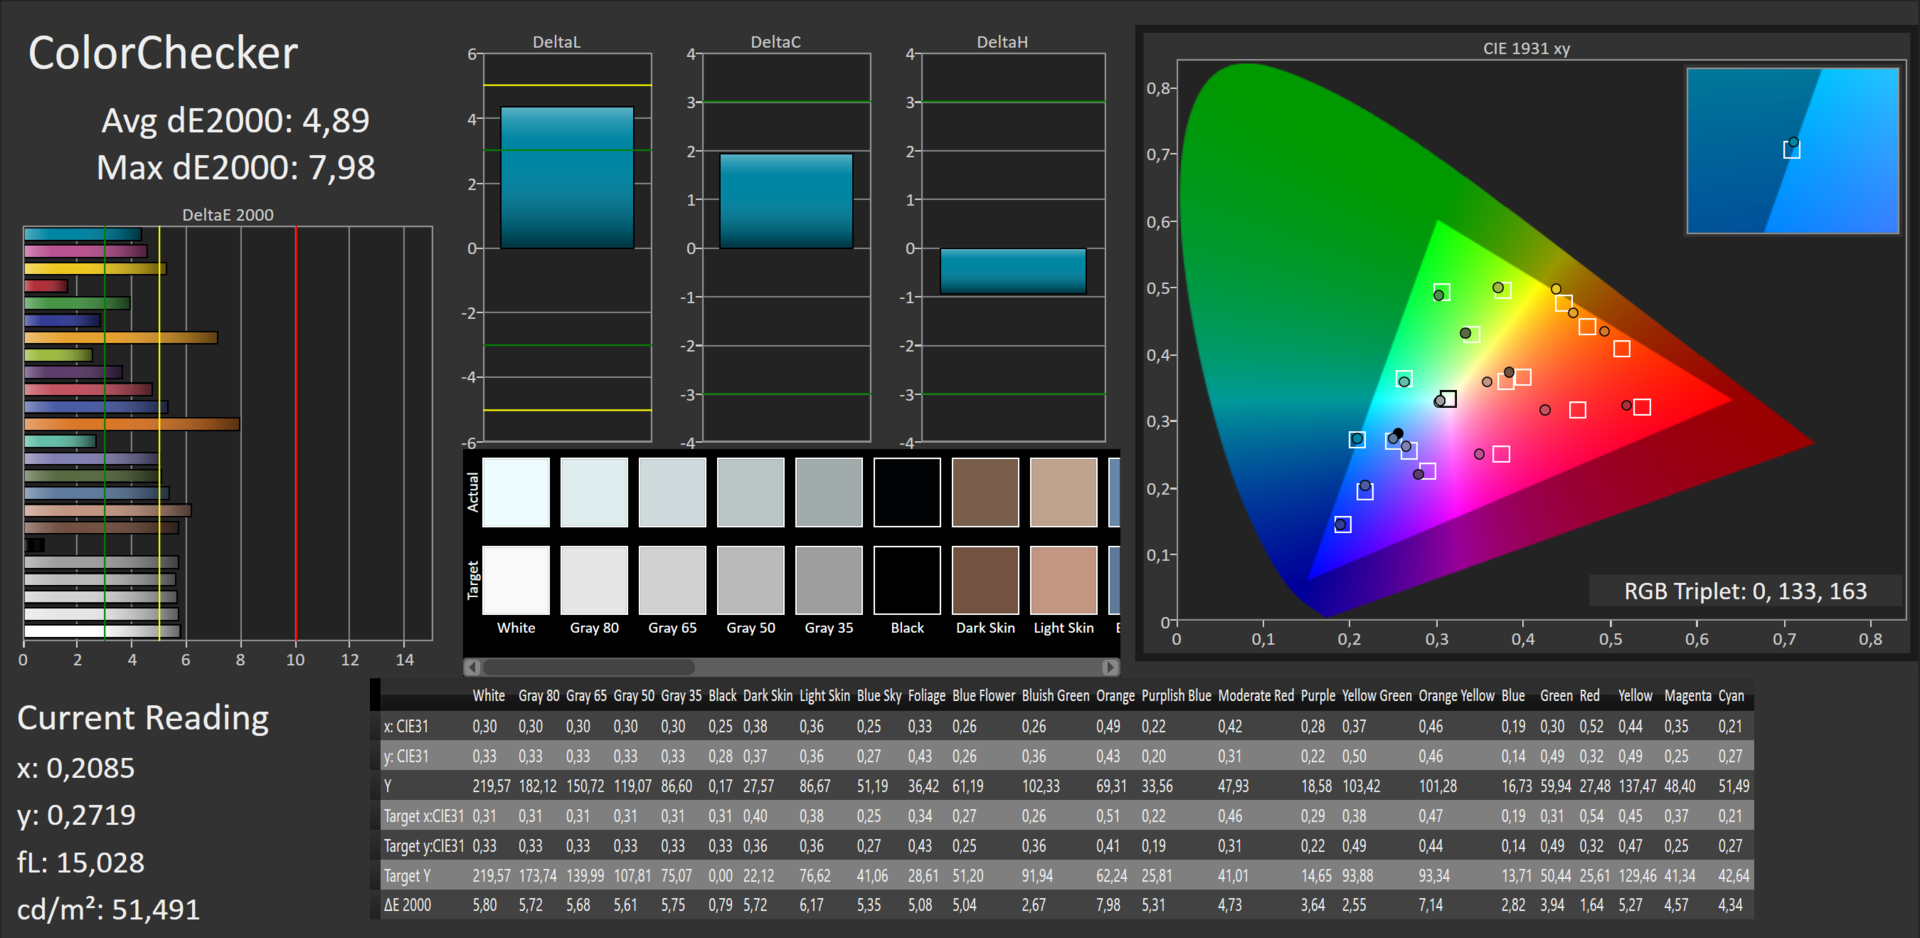
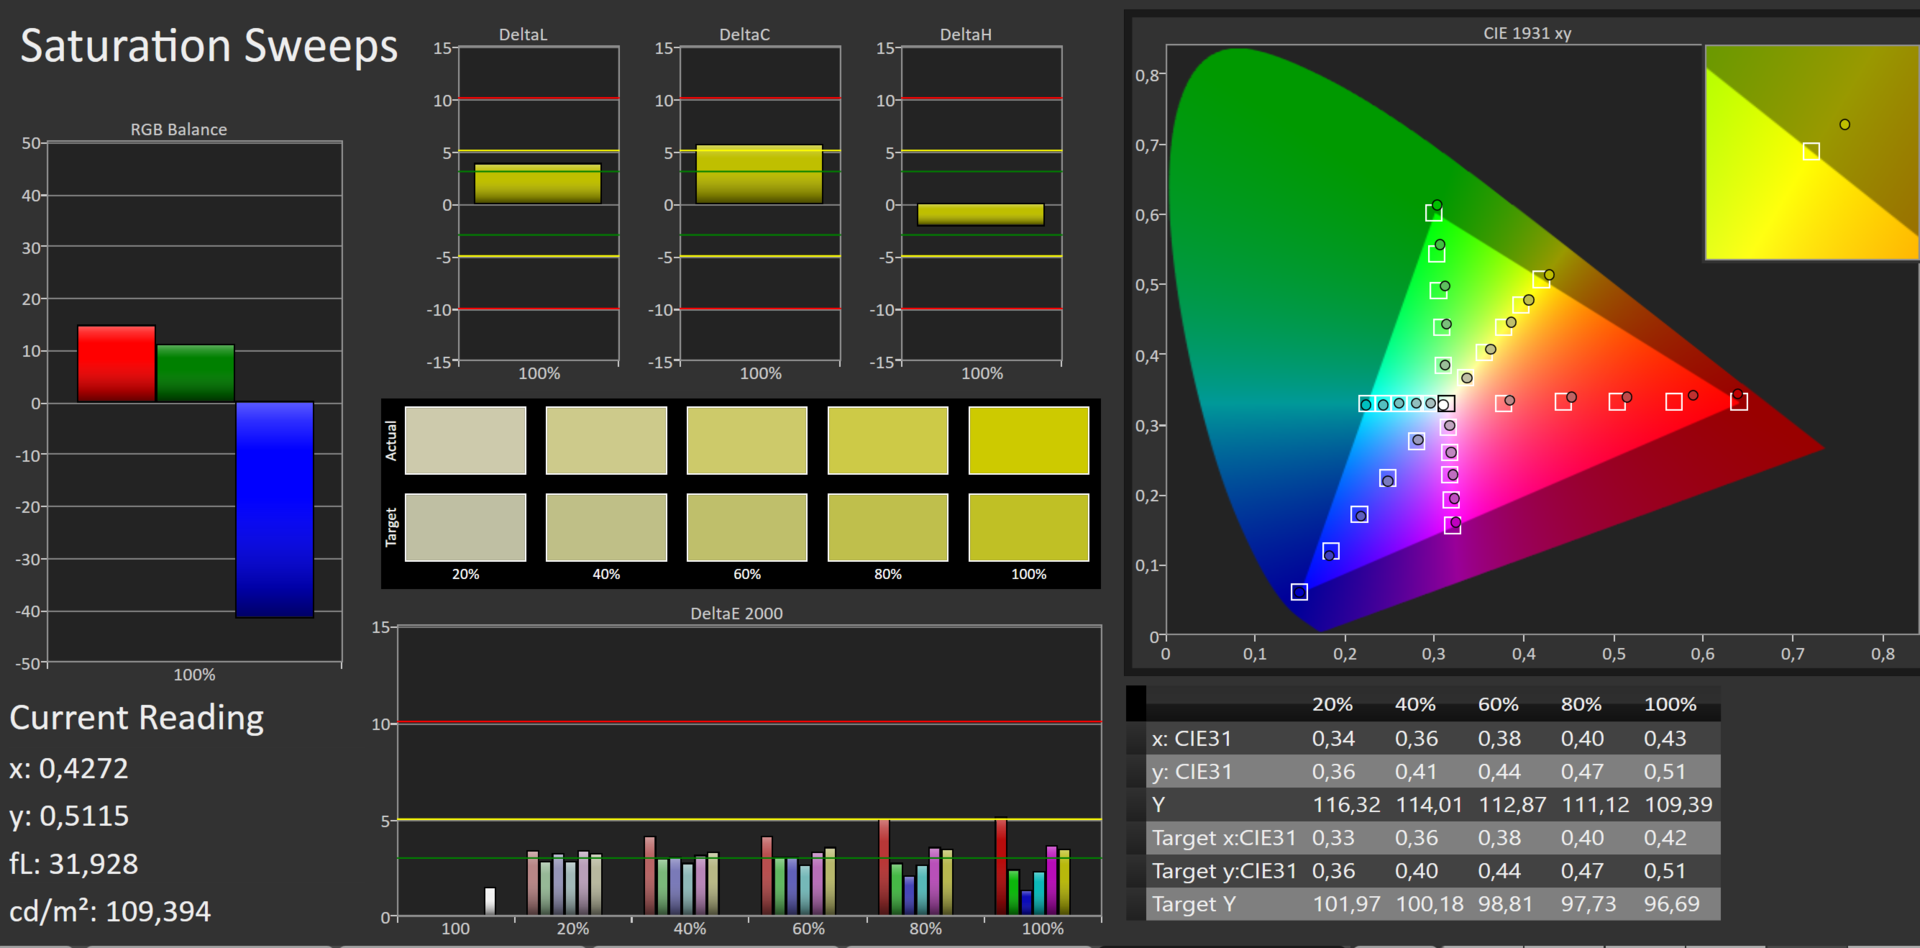
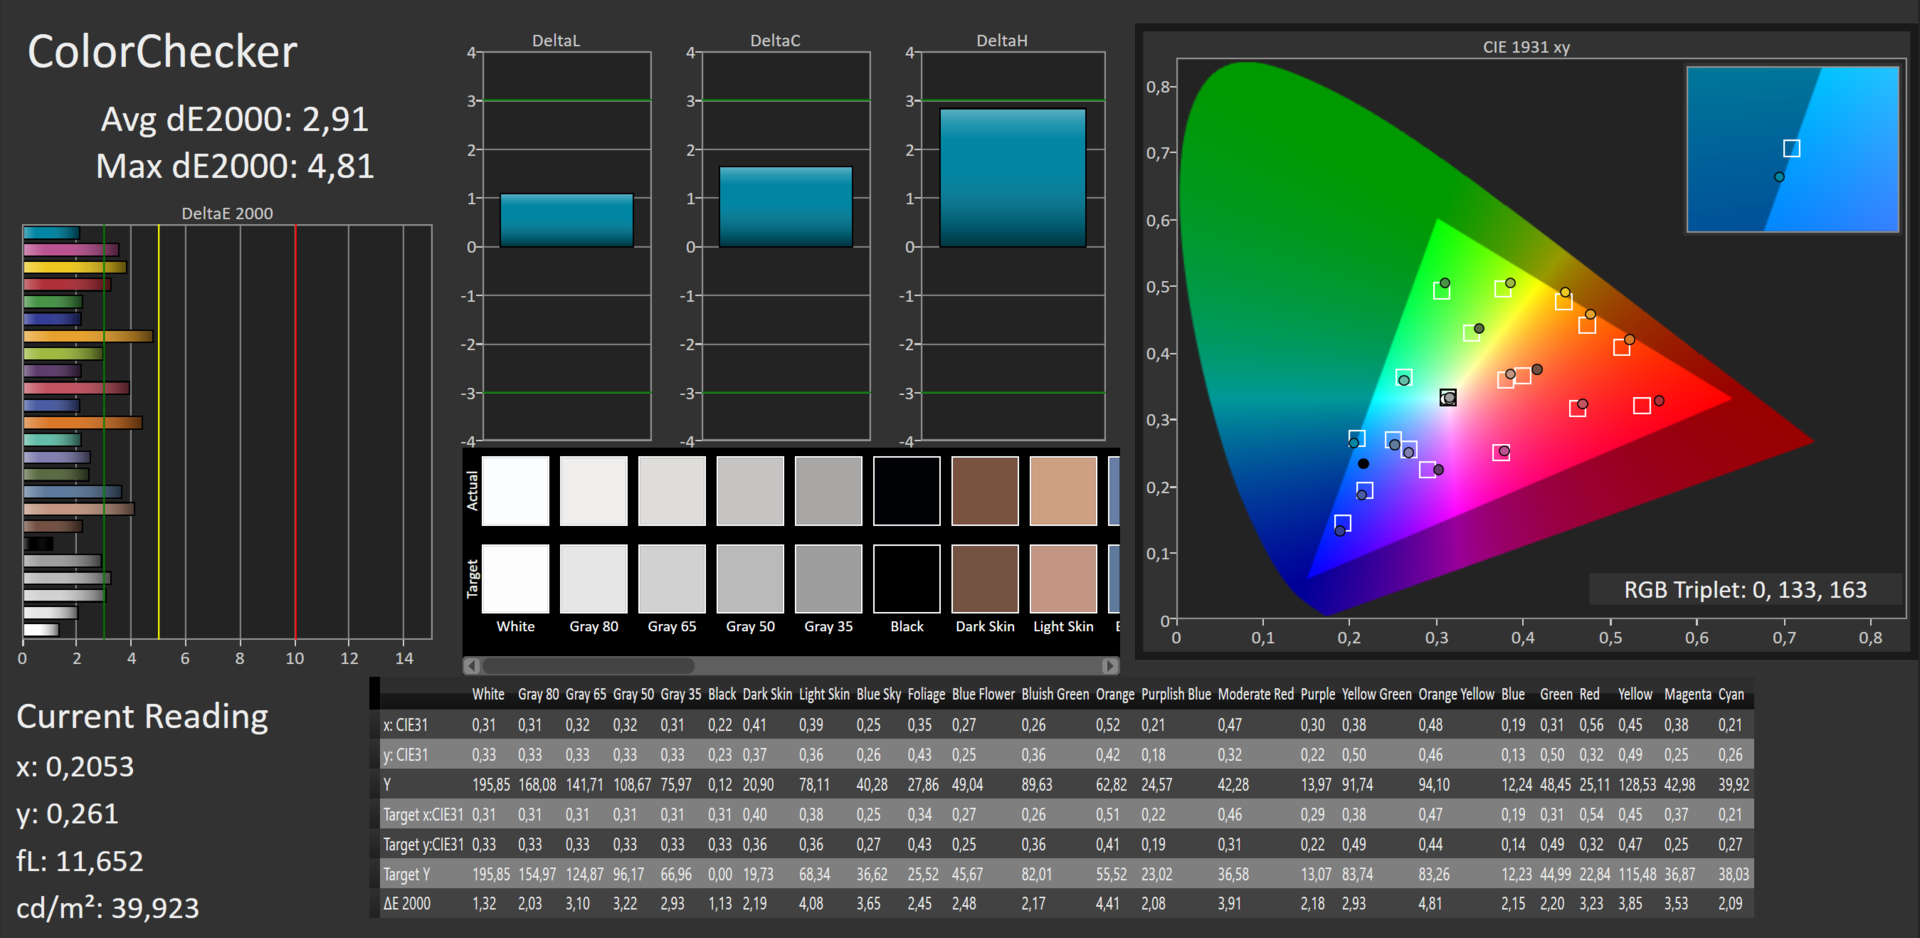
ΔE ColorChecker Calman: 4.89 | ∀{0.5-29.43 Ø4.72}
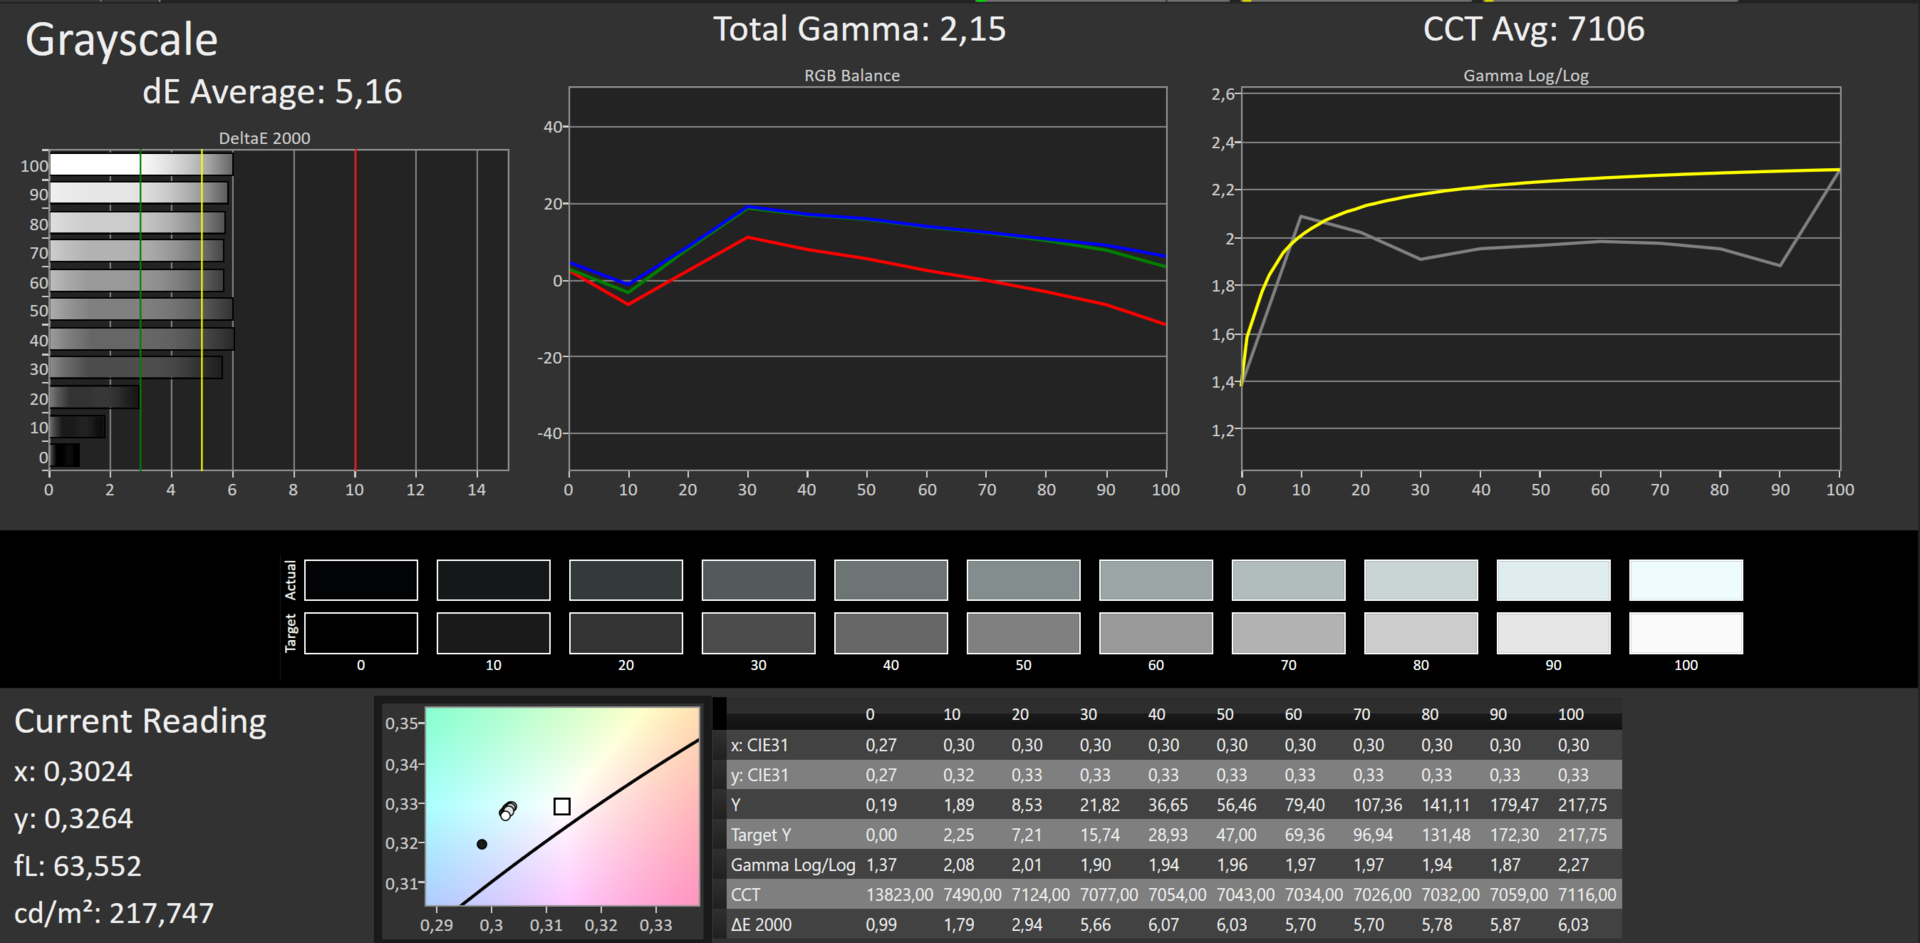
ΔE Greyscale Calman: 5.16 | ∀{0.09-98 Ø4.97}
93% sRGB (Argyll 1.6.3 3D)
59% AdobeRGB 1998 (Argyll 1.6.3 3D)
65.5% AdobeRGB 1998 (Argyll 3D)
93.6% sRGB (Argyll 3D)
63.6% Display P3 (Argyll 3D)
Gamma: 2.15
CCT: 7106 K
| Dell XPS 13-9350 Touch 13.3 3200x1800 IGZO | Dell XPS 13-9350 Non-Touch 13.3 1920x1080 IPS | Dell XPS 13-9343 Touch 13.3 3200x1800 IPS | Dell XPS 13-9343 Non-Touch 13.3 1920x1080 IPS | Apple MB Air 13 2015-03 13.3 1440x900 TN | MS Surface Pro 4 12.3 2736x1824 IPS | MS Surface Book 13.5 3000x2000 IPS | |
|---|---|---|---|---|---|---|---|
| Display | -30% | 8% | 0% | -37% | 2% | 4% | |
| Display P3 Coverage (%) | 63.6 | 44.53 -30% | 72 13% | 65.9 4% | 40.1 -37% | 65 2% | 67 5% |
| sRGB Coverage (%) | 93.6 | 66.8 -29% | 96 3% | 89.6 -4% | 59.8 -36% | 96.5 3% | 95.8 2% |
| AdobeRGB 1998 Coverage (%) | 65.5 | 45.97 -30% | 71.6 9% | 66.2 1% | 41.51 -37% | 67 2% | 68.9 5% |
| Response Times | -10% | -15% | |||||
| Response Time Grey 50% / Grey 80% * (ms) | 40 ? | 46 ? -15% | 48.4 ? -21% | ||||
| Response Time Black / White * (ms) | 30 ? | 31.2 ? -4% | 32.8 ? -9% | ||||
| PWM Frequency (Hz) | 4900 ? | 50 ? | |||||
| Screen | -7% | 8% | -11% | -20% | 3% | 21% | |
| Brightness middle (cd/m²) | 285 | 277.5 -3% | 367.3 29% | 409.7 44% | 329 15% | 413 45% | 430.9 51% |
| Brightness (cd/m²) | 281 | 276 -2% | 372 32% | 405 44% | 310 10% | 396 41% | 410 46% |
| Brightness Distribution (%) | 90 | 88 -2% | 77 -14% | 93 3% | 82 -9% | 87 -3% | 93 3% |
| Black Level * (cd/m²) | 0.18 | 0.191 -6% | 0.178 1% | 0.366 -103% | 0.405 -125% | 0.36 -100% | 0.254 -41% |
| Contrast (:1) | 1583 | 1453 -8% | 2063 30% | 1119 -29% | 812 -49% | 1147 -28% | 1696 7% |
| Colorchecker dE 2000 * | 4.89 | 4.88 -0% | 5.92 -21% | 7.67 -57% | 3.96 19% | 3.09 37% | 2.06 58% |
| Greyscale dE 2000 * | 5.16 | 4.26 17% | 4.79 7% | 4.66 10% | 3.51 32% | 3.92 24% | 2.22 57% |
| Gamma | 2.15 102% | 2.59 85% | 2.42 91% | 1.65 133% | 3.83 57% | 2.3 96% | 2.13 103% |
| CCT | 7106 91% | 6562 99% | 7013 93% | 6502 100% | 6711 97% | 7333 89% | 6520 100% |
| Color Space (Percent of AdobeRGB 1998) (%) | 59 | 41.6 -29% | 63 7% | 59.65 1% | 38.4 -35% | 61 3% | 64 8% |
| Color Space (Percent of sRGB) (%) | 93 | 65.79 -29% | 96.4 4% | 59.8 -36% | 97 4% | 96 3% | |
| Colorchecker dE 2000 max. * | 7.51 | ||||||
| Media totale (Programma / Settaggio) | -19% /
-13% | 8% /
8% | -6% /
-8% | -29% /
-24% | -2% /
1% | 3% /
12% |
* ... Meglio usare valori piccoli
Tempi di risposta del Display
| ↔ Tempi di risposta dal Nero al Bianco | ||
|---|---|---|
| 30 ms ... aumenta ↗ e diminuisce ↘ combinato | ↗ 7 ms Incremento | 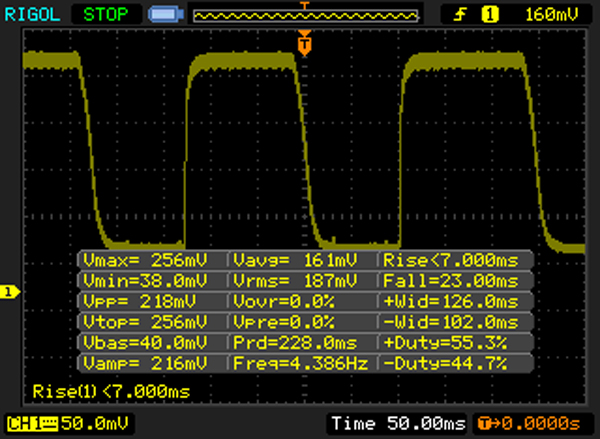 |
| ↘ 23 ms Calo | ||
| Lo schermo mostra tempi di risposta lenti nei nostri tests e sarà insoddisfacente per i gamers. In confronto, tutti i dispositivi di test variano da 0.1 (minimo) a 240 (massimo) ms. » 80 % di tutti i dispositivi è migliore. Questo significa che i tempi di risposta rilevati sono peggiori rispetto alla media di tutti i dispositivi testati (19.8 ms). | ||
| ↔ Tempo di risposta dal 50% Grigio all'80% Grigio | ||
| 40 ms ... aumenta ↗ e diminuisce ↘ combinato | ↗ 10 ms Incremento | 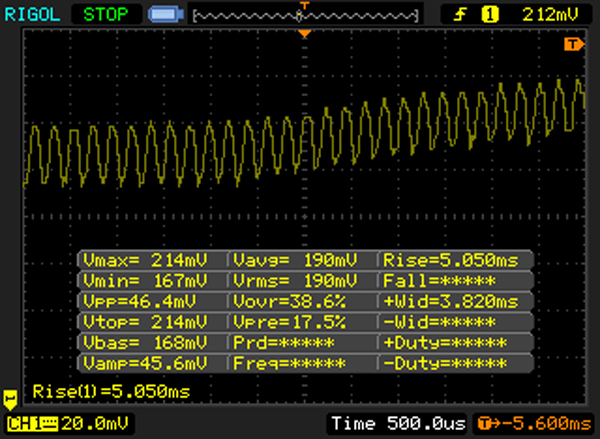 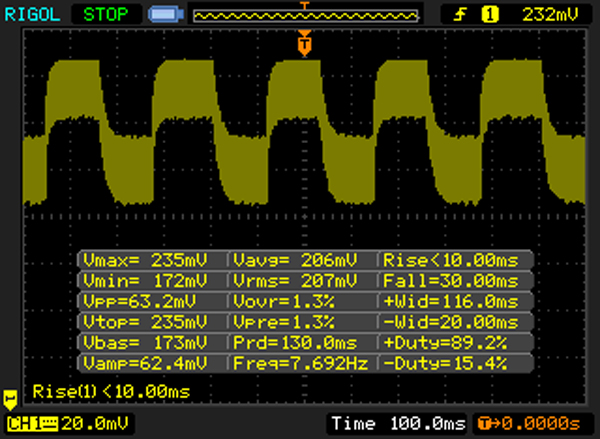 |
| ↘ 30 ms Calo | ||
| Lo schermo mostra tempi di risposta lenti nei nostri tests e sarà insoddisfacente per i gamers. In confronto, tutti i dispositivi di test variano da 0.165 (minimo) a 636 (massimo) ms. » 61 % di tutti i dispositivi è migliore. Questo significa che i tempi di risposta rilevati sono peggiori rispetto alla media di tutti i dispositivi testati (31 ms). | ||
Sfarfallio dello schermo / PWM (Pulse-Width Modulation)
| flickering dello schermo / PWM rilevato | 4900 Hz | ≤ 100 % settaggio luminosita' | 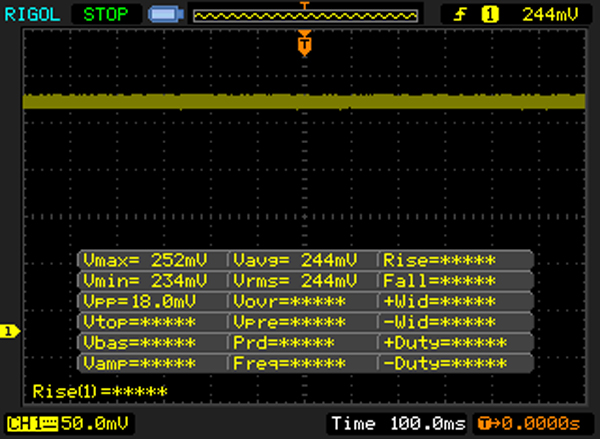 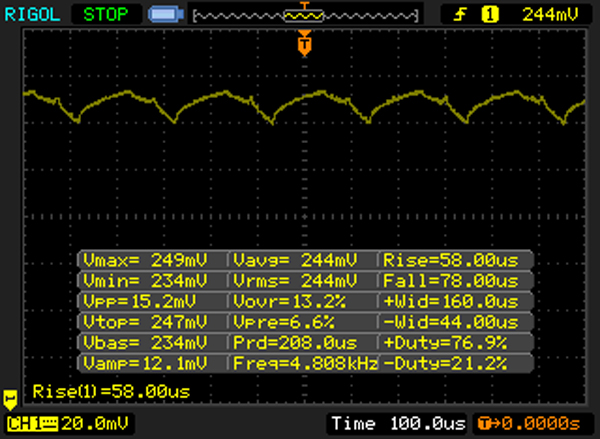 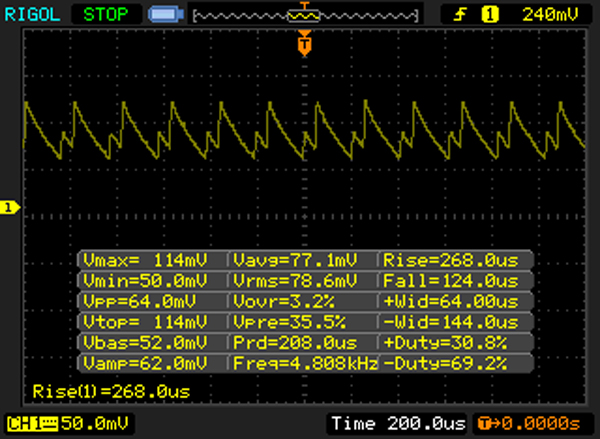 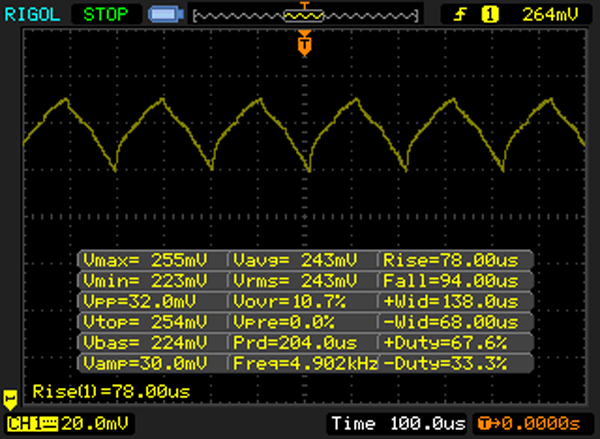 |
Il display sfarfalla a 4900 Hz (Probabilmente a causa dell'uso di PWM) Flickering rilevato ad una luminosita' di 100 % o inferiore. Non dovrebbe verificarsi flickering o PWM sopra questo valore di luminosita'. La frequenza di 4900 Hz è abbastanza alta, quindi la maggioranza degli utenti sensibili al PWM non dovrebbero notare alcun flickering. In confronto: 52 % di tutti i dispositivi testati non utilizza PWM per ridurre la luminosita' del display. Se è rilevato PWM, una media di 7747 (minimo: 5 - massimo: 343500) Hz è stata rilevata. | |||
| PCMark 7 Score | 4977 punti | |
| PCMark 8 Home Score Accelerated v2 | 2822 punti | |
| PCMark 8 Work Score Accelerated v2 | 3735 punti | |
Aiuto | ||
| Dell XPS 13-9350 Touch Samsung PM951 NVMe MZ-VLV256D | Dell XPS 13-9350 Non-Touch Samsung PM951 NVMe MZ-VLV256D | Dell XPS 13-9343 Touch Lite-On IT L8T-256L9G | Dell XPS 13-9343 Non-Touch Samsung SSD PM851 M.2 2280 128GB | Apple MB Air 13 2015-03 Apple SSD SD0256F | MS Surface Pro 4 Samsung MZFLV128 NVMe | MS Surface Book Samsung MZFLV256 NVMe | |
|---|---|---|---|---|---|---|---|
| CrystalDiskMark 3.0 | -12% | -11% | -40% | 33% | -31% | ||
| Read Seq (MB/s) | 764 | 1097 44% | 489.6 -36% | 526 -31% | 1352 77% | 666 -13% | |
| Write Seq (MB/s) | 311.4 | 307.7 -1% | 424.2 36% | 124.2 -60% | 1111 257% | 154.2 -50% | |
| Read 4k (MB/s) | 42.16 | 38.52 -9% | 34.76 -18% | 27.82 -34% | 21.93 -48% | 28.51 -32% | |
| Write 4k (MB/s) | 121 | 113 -7% | 79.3 -34% | 95.5 -21% | 30.94 -74% | 101.5 -16% | |
| Read 4k QD32 (MB/s) | 485.7 | 244.7 -50% | 354 -27% | 325.7 -33% | 339.5 -30% | 368.3 -24% | |
| Write 4k QD32 (MB/s) | 293.6 | 151.5 -48% | 326.3 11% | 124.5 -58% | 342.9 17% | 153.6 -48% | |
| AS SSD | -22% | -18% | -39% | 41% | -20% | 22% | |
| Seq Read (MB/s) | 735 | 1243 69% | 484.7 -34% | 497.9 -32% | 1212 65% | 832 13% | 1223 66% |
| Seq Write (MB/s) | 301.2 | 152.6 -49% | 416.8 38% | 119.6 -60% | 1001 232% | 142.5 -53% | 275.2 -9% |
| 4K Read (MB/s) | 38.21 | 34.61 -9% | 30.89 -19% | 25.94 -32% | 19.16 -50% | 34.24 -10% | 34.31 -10% |
| 4K Write (MB/s) | 97.6 | 0.98 -99% | 58.8 -40% | 84 -14% | 23.73 -76% | 86.5 -11% | 85 -13% |
| Score Read (Points) | 809 | 1147 42% | 425 -47% | 441 -45% | 1281 58% | 645 -20% | 1566 94% |
| Score Write (Points) | 391 | 60 -85% | 369 -6% | 184 -53% | 463 18% | 239 -39% | 394 1% |
| Copy ISO MB/s (MB/s) | 317.8 | 283.1 | 643 | 121.9 | 388.2 | ||
| Copy Program MB/s (MB/s) | 149.1 | 157.5 | 245 | 63.5 | 174.1 | ||
| Media totale (Programma / Settaggio) | -17% /
-17% | -15% /
-15% | -40% /
-39% | 37% /
37% | -26% /
-25% | 22% /
22% |

| 3DMark - 1280x720 Cloud Gate Standard Score (ordina per valore) | |
| Dell XPS 13-9350 Touch | |
| Dell XPS 13-9350 Non-Touch | |
| Dell XPS 13-9343 Touch | |
| Dell XPS 13-9343 Non-Touch | |
| Apple MB Air 13 2015-03 | |
| MS Surface Pro 4 | |
| MS Surface Book | |
| 3DMark 11 Performance | 1556 punti | |
| 3DMark Ice Storm Standard Score | 52990 punti | |
| 3DMark Cloud Gate Standard Score | 5896 punti | |
| 3DMark Fire Strike Score | 847 punti | |
Aiuto | ||
| Metro 2033 - 1360x768 Normal DX10 AA:A AF:4x (ordina per valore) | |
| Dell XPS 13-9350 Non-Touch | |
| Dell XPS 13-9343 Touch | |
| BioShock Infinite - 1366x768 Medium Preset (ordina per valore) | |
| Dell XPS 13-9350 Touch | |
| Dell XPS 13-9350 Non-Touch | |
| Dell XPS 13-9343 Touch | |
| Apple MB Air 13 2015-03 | |
| MS Surface Pro 4 | |
| MS Surface Book | |
| Tomb Raider - 1366x768 Normal Preset AA:FX AF:4x (ordina per valore) | |
| Dell XPS 13-9350 Touch | |
| Apple MB Air 13 2015-03 | |
| MS Surface Pro 4 | |
| MS Surface Book | |
| basso | medio | alto | ultra | |
|---|---|---|---|---|
| Tomb Raider (2013) | 71.8 | 36.6 | 24.4 | 11.2 |
| BioShock Infinite (2013) | 51.4 | 27.9 | 24.1 | 7.4 |
| Dirt Rally (2015) | 95 | 23.6 | 12.7 | |
| Metal Gear Solid V (2015) | 43.7 | 28.3 | 11.5 |
| Dell XPS 13-9350 Touch HD Graphics 520, 6500U, Samsung PM951 NVMe MZ-VLV256D | Dell XPS 13-9350 Non-Touch HD Graphics 520, 6200U, Samsung PM951 NVMe MZ-VLV256D | Dell XPS 13-9343 Touch HD Graphics 5500, 5200U, Lite-On IT L8T-256L9G | Dell XPS 13-9343 Non-Touch HD Graphics 5500, 5200U, Samsung SSD PM851 M.2 2280 128GB | Apple MB Air 13 2015-03 HD Graphics 6000, 5650U, Apple SSD SD0256F | MS Surface Pro 4 HD Graphics 520, 6300U, Samsung MZFLV128 NVMe | MS Surface Book Maxwell GPU (940M, GDDR5), 6300U, Samsung MZFLV256 NVMe | |
|---|---|---|---|---|---|---|---|
| Noise | 13% | -3% | 7% | -3% | -4% | 1% | |
| Idle Minimum * (dB) | 31.8 | 28.2 11% | 30.2 5% | 29 9% | 29.2 8% | 31.5 1% | 29.5 7% |
| Idle Average * (dB) | 31.8 | 28.3 11% | 30.3 5% | 29.1 8% | 29.2 8% | 31.5 1% | 29.6 7% |
| Idle Maximum * (dB) | 34.8 | 28.4 18% | 30.4 13% | 29.2 16% | 29.2 16% | 31.5 9% | 29.7 15% |
| Load Average * (dB) | 34.8 | 30.2 13% | 34.4 1% | 31.1 11% | 40.2 -16% | 40.5 -16% | 37.5 -8% |
| Load Maximum * (dB) | 34.8 | 30.2 13% | 48 -38% | 38.4 -10% | 46.3 -33% | 40.7 -17% | 40.9 -18% |
* ... Meglio usare valori piccoli
Rumorosità
| Idle |
| 31.8 / 31.8 / 34.8 dB(A) |
| Sotto carico |
| 34.8 / 34.8 dB(A) |
 | ||
30 dB silenzioso 40 dB(A) udibile 50 dB(A) rumoroso |
||
min: | ||
| Dell XPS 13-9350 Touch HD Graphics 520, 6500U, Samsung PM951 NVMe MZ-VLV256D | Dell XPS 13-9350 Non-Touch HD Graphics 520, 6200U, Samsung PM951 NVMe MZ-VLV256D | Dell XPS 13-9343 Touch HD Graphics 5500, 5200U, Lite-On IT L8T-256L9G | Dell XPS 13-9343 Non-Touch HD Graphics 5500, 5200U, Samsung SSD PM851 M.2 2280 128GB | Apple MB Air 13 2015-03 HD Graphics 6000, 5650U, Apple SSD SD0256F | MS Surface Pro 4 HD Graphics 520, 6300U, Samsung MZFLV128 NVMe | MS Surface Book Maxwell GPU (940M, GDDR5), 6300U, Samsung MZFLV256 NVMe | |
|---|---|---|---|---|---|---|---|
| Heat | 15% | 19% | 19% | 20% | -4% | 26% | |
| Maximum Upper Side * (°C) | 57 | 45.2 21% | 40.6 29% | 44.6 22% | 43.8 23% | 52.3 8% | 44.2 22% |
| Maximum Bottom * (°C) | 56 | 45.2 19% | 41.2 26% | 44.8 20% | 42.1 25% | 51.4 8% | 41.2 26% |
| Idle Upper Side * (°C) | 34.1 | 30.4 11% | 31.2 9% | 28.8 16% | 28.5 16% | 43.2 -27% | 26 24% |
| Idle Bottom * (°C) | 34.3 | 31.2 9% | 30.6 11% | 28.8 16% | 28.9 16% | 36 -5% | 23.8 31% |
* ... Meglio usare valori piccoli
(-) La temperatura massima sul lato superiore è di 57 °C / 135 F, rispetto alla media di 35.9 °C / 97 F, che varia da 21.4 a 59 °C per questa classe Subnotebook.
(-) Il lato inferiore si riscalda fino ad un massimo di 56 °C / 133 F, rispetto alla media di 39.2 °C / 103 F
(+) In idle, la temperatura media del lato superiore è di 29.9 °C / 86 F, rispetto alla media deld ispositivo di 30.8 °C / 87 F.
(±) I poggiapolsi e il touchpad possono diventare molto caldi al tatto con un massimo di 37.5 °C / 99.5 F.
(-) La temperatura media della zona del palmo della mano di dispositivi simili e'stata di 28.2 °C / 82.8 F (-9.3 °C / -16.7 F).
| Dell XPS 13-9350 Touch 6500U | Dell XPS 13-9350 Non-Touch 6200U | Dell XPS 13-9343 Touch 5500U | Dell XPS 13-9343 Non-Touch 5200U | |
|---|---|---|---|---|
| Power Consumption | -0% | 26% | 24% | |
| Idle Minimum * (Watt) | 6.8 | 6.6 3% | 2.7 60% | 4.4 35% |
| Idle Average * (Watt) | 10 | 9.3 7% | 5.7 43% | 9 10% |
| Idle Maximum * (Watt) | 10.5 | 11 -5% | 6 43% | 10.7 -2% |
| Load Average * (Watt) | 30.2 | 32.2 -7% | 32.1 -6% | 19.6 35% |
| Load Maximum * (Watt) | 33.6 | 33.2 1% | 36.2 -8% | 19.9 41% |
* ... Meglio usare valori piccoli
| Off / Standby | |
| Idle | |
| Sotto carico |
|
Leggenda:
min: | |
| Dell XPS 13-9350 Touch 6500U 56Wh | Dell XPS 13-9350 Non-Touch 6200U 56Wh | Dell XPS 13-9343 Touch 5200U 52Wh | Dell XPS 13-9343 Non-Touch 5200U 54Wh | Apple MB Air 13 2015-03 5650U 54Wh | MS Surface Pro 4 6300U 38Wh | MS Surface Book 6300U 69Wh | |
|---|---|---|---|---|---|---|---|
| Autonomia della batteria | 17% | 26% | 48% | 46% | 9% | 27% | |
| Reader / Idle (h) | 13.1 | 13 -1% | 15.2 16% | 21.6 65% | 26.2 100% | 15 15% | 17.8 36% |
| WiFi v1.3 (h) | 7.2 | 7.5 4% | 10 39% | 10.3 43% | 7.1 -1% | 6.7 -7% | |
| Load (h) | 1.7 | 2.5 47% | 2.3 35% | 2.4 41% | 1.6 -6% | 1.9 12% | 2.6 53% |
| WiFi (h) | 9.7 | ||||||
| H.264 (h) | 10.1 |
Pro
Contro
Ci sono moltissimi dispositivi tra cui scegliere: tra lo stiloso XPS 13 Ultrabook con base ultra sottile, o il tablet Surface Pro 4? O il piatto: XPS 13 FHD vs. XPS 13 QHD? La decisione non dipende dalla potenza del computer; sia l'XPS che il Surface sono allo stesso livello senza throttling. La differenza di prestazioni con la più economica versione Core i5 a nostro parere è trascurabile.
La più breve autonomia dell'XPS 13 i7/QHD rispetto al modello gemello con i5/FHD non sono argomenti a favore. 5:30 ore sono semplicemente troppo poche per un Ultrabook premium-range. I dettagli come il controllo della luminosità ambientale utilizzano anche PWM, le scarse opzioni di manutenzione e la webcam scarsa sono da criticare. Aggiorneremo i nostri lettore sul Content Adaptive Brightness Control (CABC).
Molti argomenti parlano a favore dell'XPS 13 - inclusa la versione i5. Lo chassis di alta qualità con base sottile, proprio come le prestazioni buone sotto carico, la silenziosità e il pannello ad alto contrasto. I potenziali clienti dovranno decidere se sia o meno un must. La gestione via touch funziona in modo impeccabile come sempre, e lo stesso vale anche per i tasti e il ClickPad.
Per 1549 Euro (~$1653), i clienti avranno un subnotebook sofisticato, che può essere tra i migliori. Il modello predecente del 2015 con i7-5500U e SSD 256 GB la fa ancora da padrone e parte da 1500 Euro (~$1601). Sebbene la nuova versione non ha processore e scheda grafica molto veloci, ha una Thunderbolt 3 in USB Type C combinata con USB 3.1 Gen 2. Pertanto, non ci sono molti argomenti a favore del modello 2015; gli utenti saranno più pronti ad una versione docking tramite Thunderbolt 3.
Nota: si tratta di una recensione breve con alcune sezioni non tradotte, per la versione integrale in inglese guardate qui.
Dell XPS 13 2016 i7 256GB QHD
- 02/16/2016 v5 (old)
Sebastian Jentsch