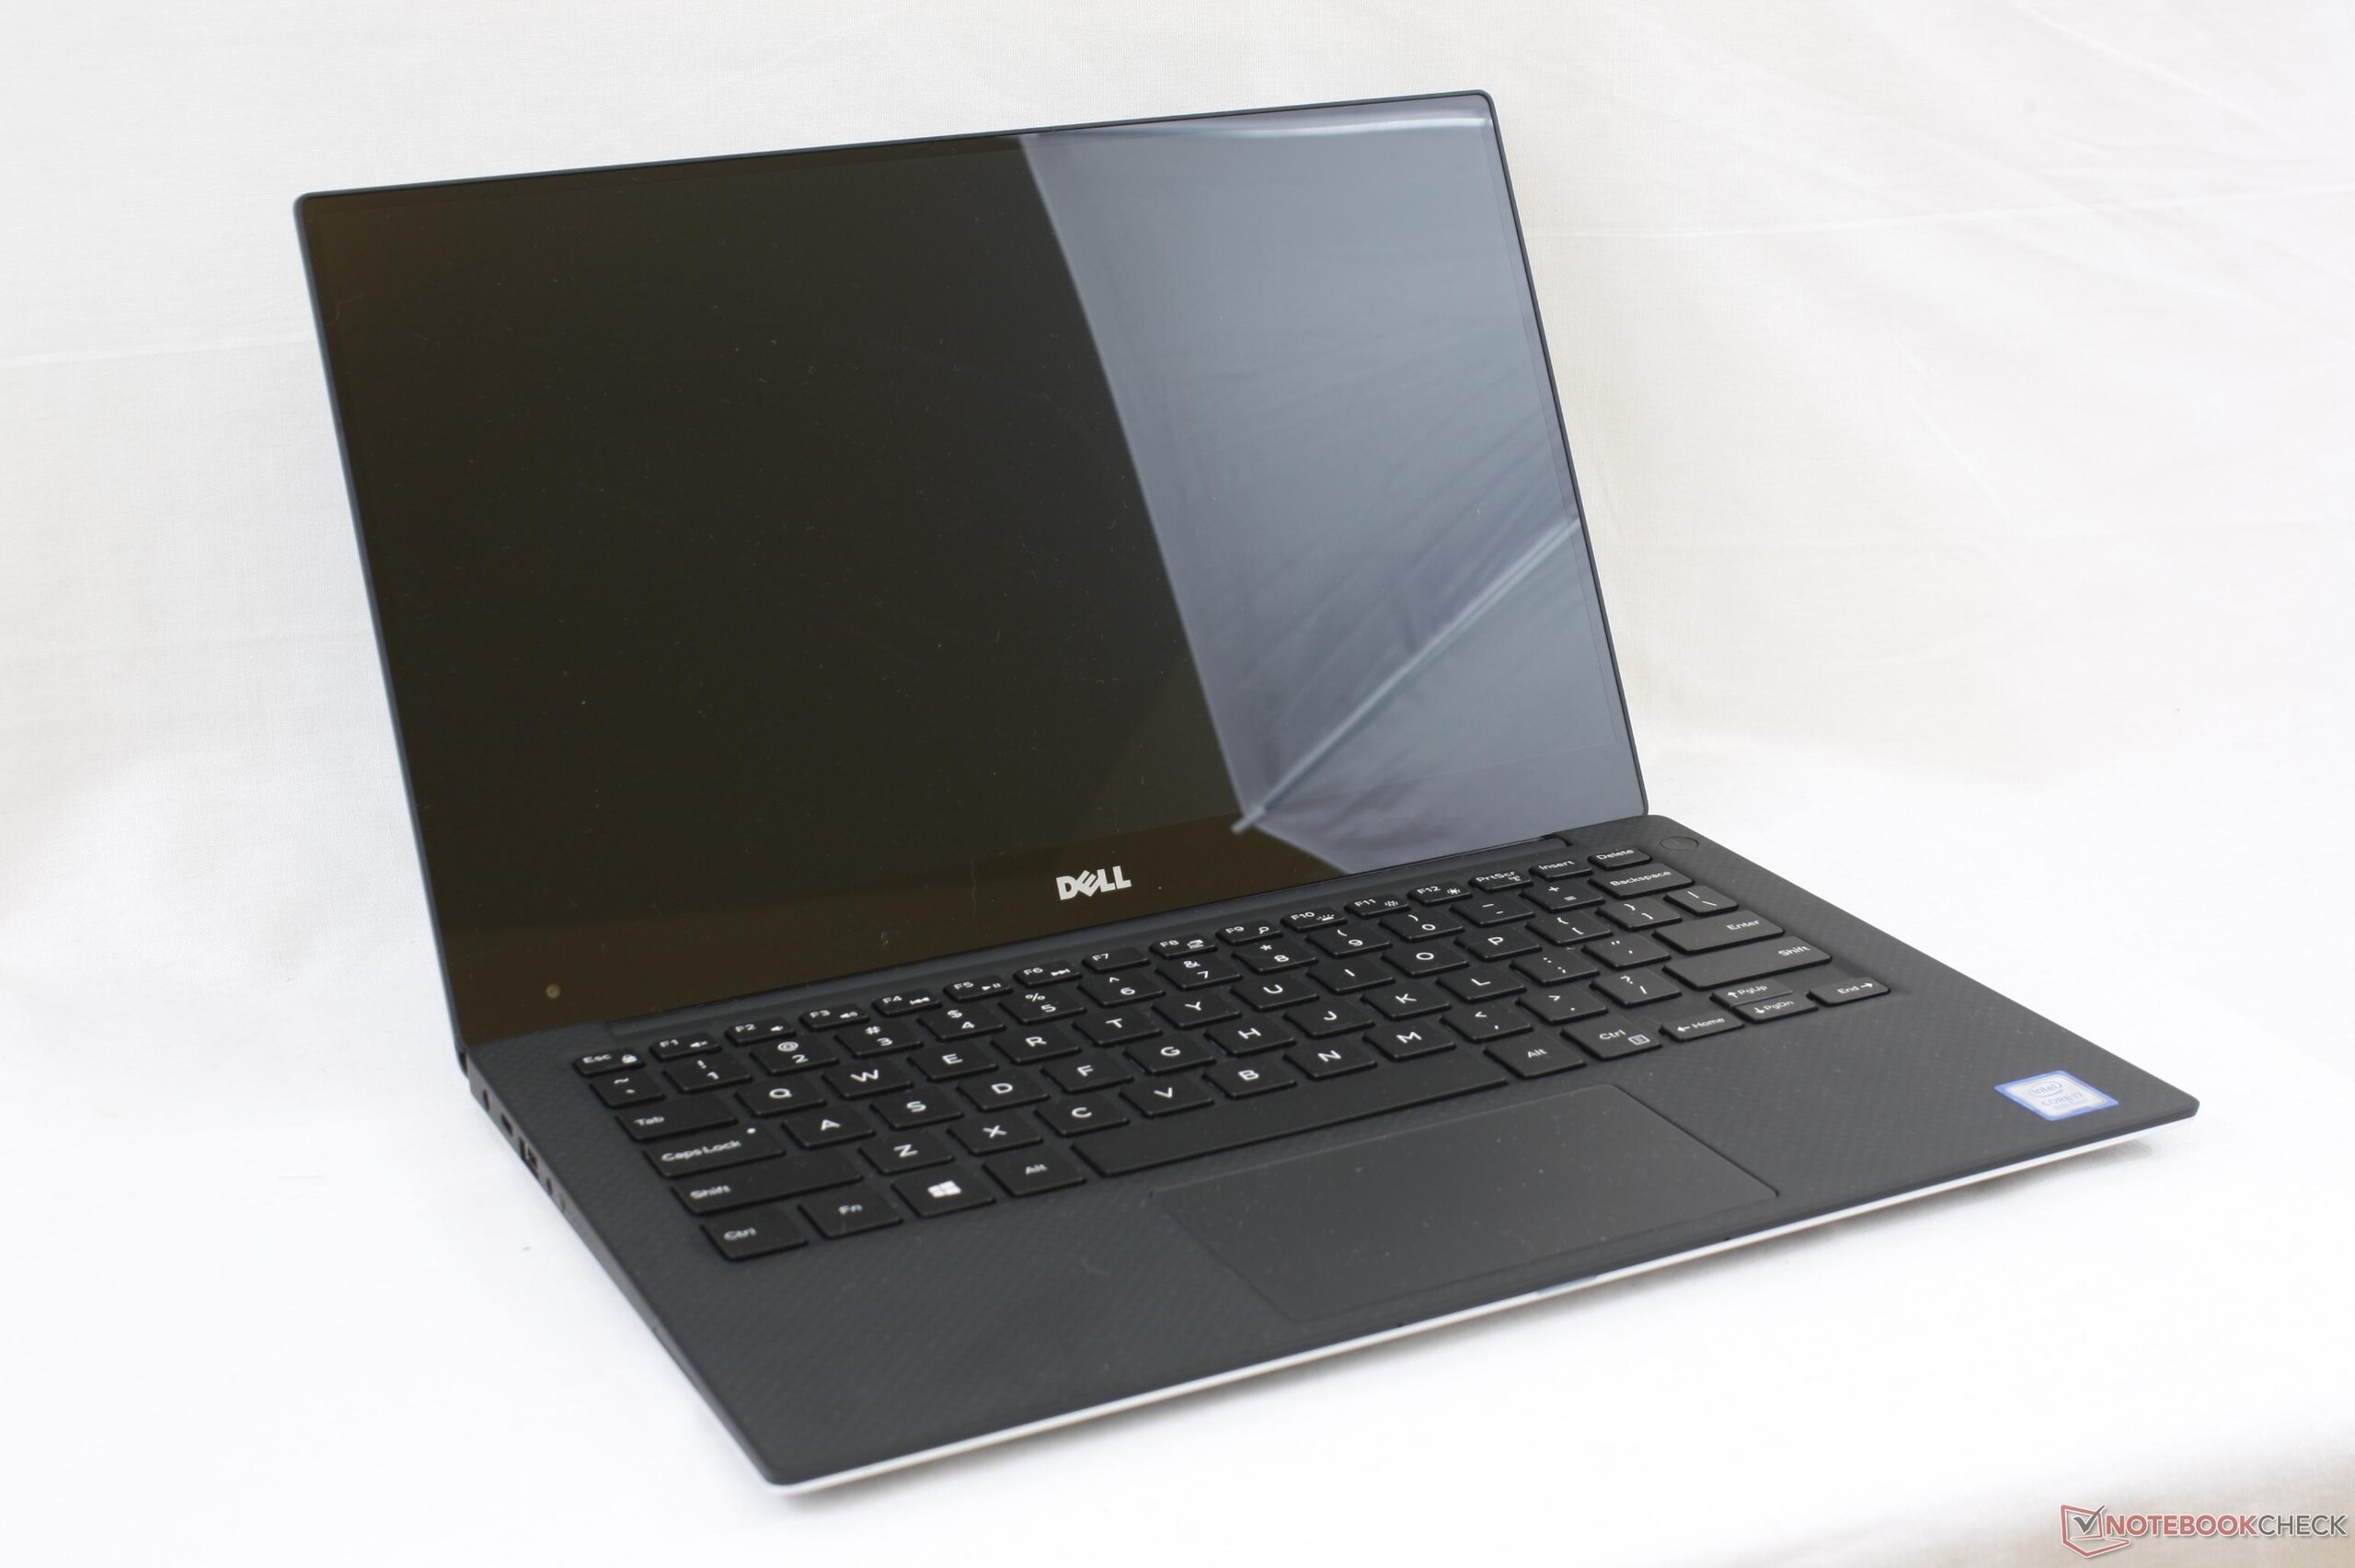
Recensione breve del Portatile Dell XPS 13 (i7-8550U, QHD)


| SD Card Reader | |
| average JPG Copy Test (av. of 3 runs) | |
| Dell XPS 13 i7-8550U | |
| Dell XPS 15 9560 (i7-7700HQ, UHD) | |
| Acer Swift 3 SF315-51G-57E5 | |
| maximum AS SSD Seq Read Test (1GB) | |
| Dell XPS 15 9560 (i7-7700HQ, UHD) | |
| Dell XPS 13 i7-8550U | |
| Acer Swift 3 SF315-51G-57E5 | |
| Networking | |
| iperf3 transmit AX12 | |
| Dell XPS 13 i7-8550U | |
| Samsung Notebook 9 NP900X3N-K01US | |
| HP Spectre x360 13-ac033dx | |
| iperf3 receive AX12 | |
| Samsung Notebook 9 NP900X3N-K01US | |
| HP Spectre x360 13-ac033dx | |
| Dell XPS 13 i7-8550U | |
| |||||||||||||||||||||||||
Distribuzione della luminosità: 83 %
Al centro con la batteria: 386.1 cd/m²
Contrasto: 1170:1 (Nero: 0.33 cd/m²)
ΔE ColorChecker Calman: 4.2 | ∀{0.5-29.43 Ø4.71}
ΔE Greyscale Calman: 5.7 | ∀{0.09-98 Ø4.96}
92.2% sRGB (Argyll 1.6.3 3D)
59% AdobeRGB 1998 (Argyll 1.6.3 3D)
65.4% AdobeRGB 1998 (Argyll 3D)
93% sRGB (Argyll 3D)
63.6% Display P3 (Argyll 3D)
Gamma: 2.28
CCT: 7336 K
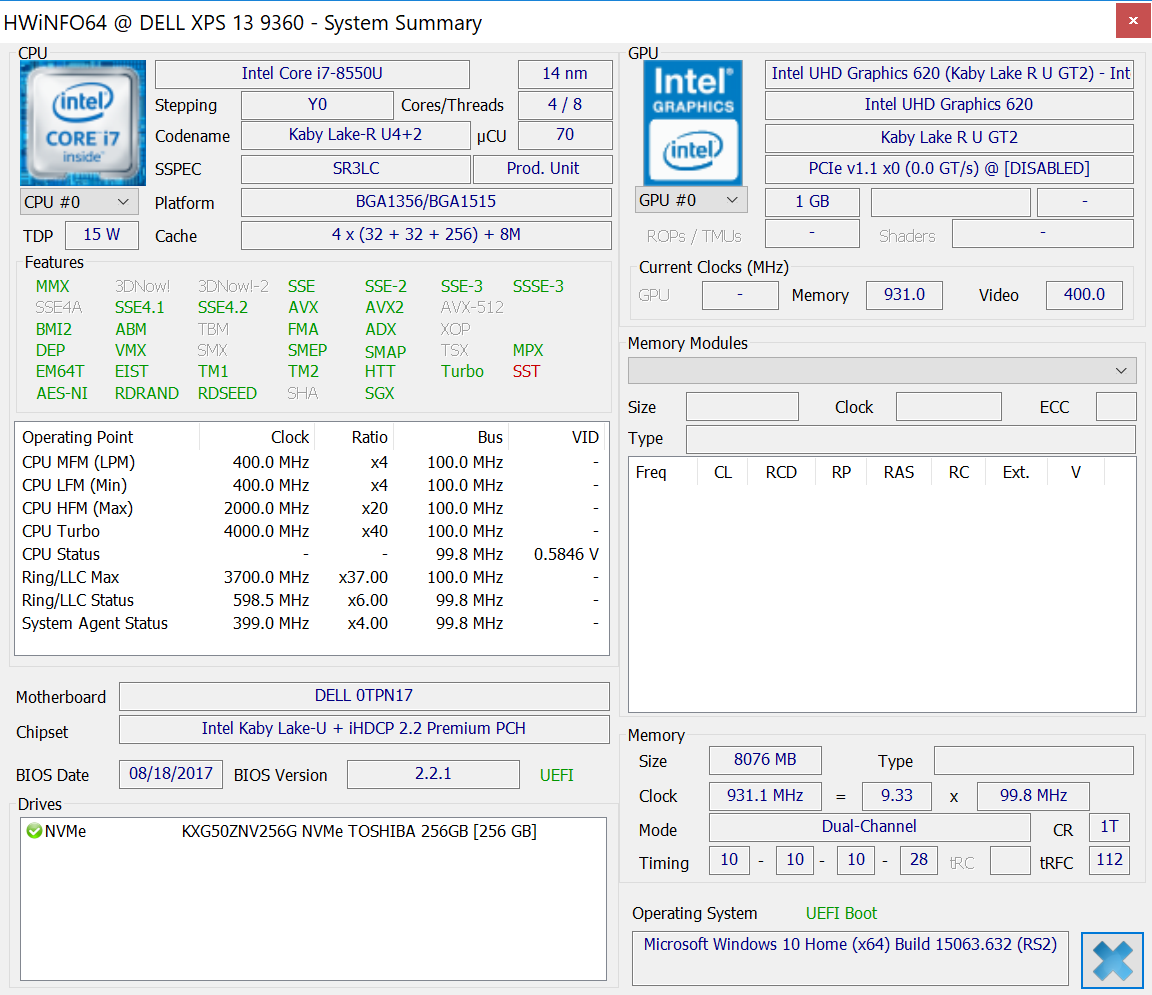
| Dell XPS 13 i7-8550U ID: Sharp SHP144A, Name: LQ133Z1, IGZO IPS, 13.3", 3200x1800 | Samsung Notebook 9 NP900X3N-K01US ID: BOE06E1, Name: NV133FHB-N31, IPS, 13.3", 1920x1080 | Huawei MateBook X Chi Mei CMN8201 / P130ZDZ-EF1, , 13.3", 2160x1440 | Asus ZenBook Flip S UX370 AUO B133HAN04.2, a-Si TFT-LCD, WLED, 13.3", 1920x1080 | Razer Blade Stealth QHD i7-7500U Sharp SHP142F (LQ125T1JW02), , 12.5", 2560x1440 | Dell XPS 13 9360 QHD+ i7 Sharp SHP144A, IPS, 13.3", 3200x1800 | |
|---|---|---|---|---|---|---|
| Display | -2% | 3% | -1% | 6% | -2% | |
| Display P3 Coverage (%) | 63.6 | 63.4 0% | 65.8 3% | 64 1% | 68.7 8% | 62.8 -1% |
| sRGB Coverage (%) | 93 | 88.6 -5% | 96.2 3% | 90 -3% | 95.8 3% | 89.4 -4% |
| AdobeRGB 1998 Coverage (%) | 65.4 | 64 -2% | 66.8 2% | 64.9 -1% | 69.9 7% | 64.6 -1% |
| Response Times | -21% | 10% | -16% | -14% | -15% | |
| Response Time Grey 50% / Grey 80% * (ms) | 35.6 ? | 41.6 ? -17% | 33 ? 7% | 44 ? -24% | 37 ? -4% | 43.6 ? -22% |
| Response Time Black / White * (ms) | 27.2 ? | 34 ? -25% | 24 ? 12% | 29 ? -7% | 33.4 ? -23% | 29.2 ? -7% |
| PWM Frequency (Hz) | 19690 ? | 210.1 ? | 200 ? | |||
| Screen | 4% | 17% | 7% | 1% | 8% | |
| Brightness middle (cd/m²) | 386.1 | 510.7 32% | 408 6% | 334 -13% | 402 4% | 396.2 3% |
| Brightness (cd/m²) | 357 | 481 35% | 395 11% | 321 -10% | 382 7% | 357 0% |
| Brightness Distribution (%) | 83 | 90 8% | 88 6% | 86 4% | 88 6% | 84 1% |
| Black Level * (cd/m²) | 0.33 | 0.66 -100% | 0.45 -36% | 0.25 24% | 0.45 -36% | 0.266 19% |
| Contrast (:1) | 1170 | 774 -34% | 907 -22% | 1336 14% | 893 -24% | 1489 27% |
| Colorchecker dE 2000 * | 4.2 | 2.4 43% | 1.55 63% | 4.24 -1% | 3.6 14% | 3.9 7% |
| Colorchecker dE 2000 max. * | 7.6 | 7.3 4% | 2.19 71% | 6.03 21% | 7.5 1% | 7.58 -0% |
| Greyscale dE 2000 * | 5.7 | 2.4 58% | 1.91 66% | 3.92 31% | 4.3 25% | 4.16 27% |
| Gamma | 2.28 96% | 2.23 99% | 2.34 94% | 2.68 82% | 2.1 105% | 2.31 95% |
| CCT | 7336 89% | 6747 96% | 6491 100% | 6758 96% | 6572 99% | 6514 100% |
| Color Space (Percent of AdobeRGB 1998) (%) | 59 | 57 -3% | 61 3% | 58 -2% | 62.3 6% | 57.5 -3% |
| Color Space (Percent of sRGB) (%) | 92.2 | 88.1 -4% | 96 4% | 90 -2% | 95.7 4% | 88.7 -4% |
| Media totale (Programma / Settaggio) | -6% /
-1% | 10% /
13% | -3% /
2% | -2% /
-0% | -3% /
3% |
* ... Meglio usare valori piccoli
Tempi di risposta del Display
| ↔ Tempi di risposta dal Nero al Bianco | ||
|---|---|---|
| 27.2 ms ... aumenta ↗ e diminuisce ↘ combinato | ↗ 16 ms Incremento | 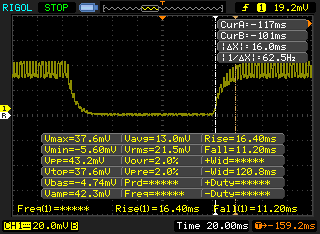 |
| ↘ 11.2 ms Calo | ||
| Lo schermo mostra tempi di risposta relativamente lenti nei nostri tests e potrebbe essere troppo lento per i gamers. In confronto, tutti i dispositivi di test variano da 0.1 (minimo) a 240 (massimo) ms. » 69 % di tutti i dispositivi è migliore. Questo significa che i tempi di risposta rilevati sono peggiori rispetto alla media di tutti i dispositivi testati (19.8 ms). | ||
| ↔ Tempo di risposta dal 50% Grigio all'80% Grigio | ||
| 35.6 ms ... aumenta ↗ e diminuisce ↘ combinato | ↗ 18.4 ms Incremento | 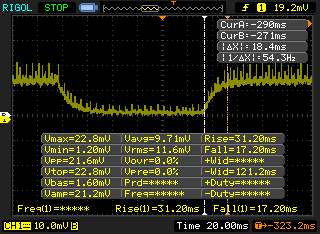 |
| ↘ 17.2 ms Calo | ||
| Lo schermo mostra tempi di risposta lenti nei nostri tests e sarà insoddisfacente per i gamers. In confronto, tutti i dispositivi di test variano da 0.165 (minimo) a 636 (massimo) ms. » 50 % di tutti i dispositivi è migliore. Questo significa che i tempi di risposta rilevati sono peggiori rispetto alla media di tutti i dispositivi testati (31 ms). | ||
Sfarfallio dello schermo / PWM (Pulse-Width Modulation)
| flickering dello schermo / PWM rilevato | 19690 Hz | ≤ 100 % settaggio luminosita' | 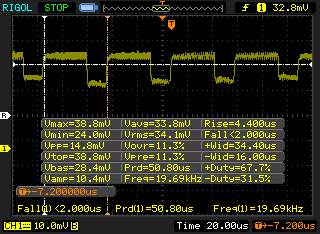 |
Il display sfarfalla a 19690 Hz (Probabilmente a causa dell'uso di PWM) Flickering rilevato ad una luminosita' di 100 % o inferiore. Non dovrebbe verificarsi flickering o PWM sopra questo valore di luminosita'. La frequenza di 19690 Hz è abbastanza alta, quindi la maggioranza degli utenti sensibili al PWM non dovrebbero notare alcun flickering. In confronto: 52 % di tutti i dispositivi testati non utilizza PWM per ridurre la luminosita' del display. Se è rilevato PWM, una media di 7757 (minimo: 5 - massimo: 343500) Hz è stata rilevata. | |||
| wPrime 2.10 - 1024m | |
| Dell XPS 13-9343 Non-Touch | |
| Dell XPS 13 9360-4764 | |
| Tuxedo InfinityBook Pro 13 2017 | |
| Acer Spin 5 SP513-52N-566U | |
| MSI WS63VR 7RL-023US | |
| Eurocom Tornado F5 | |
* ... Meglio usare valori piccoli
| PCMark 8 | |
| Home Score Accelerated v2 | |
| Dell XPS 13 9360 FHD i7 Iris | |
| Dell XPS 13 9360 FHD i5 | |
| Dell XPS 13 i7-8550U | |
| Dell XPS 13 9360 QHD+ i7 | |
| Work Score Accelerated v2 | |
| Dell XPS 13 9360 FHD i7 Iris | |
| Dell XPS 13 9360 FHD i5 | |
| Dell XPS 13 i7-8550U | |
| Dell XPS 13 9360 QHD+ i7 | |
| Creative Score Accelerated v2 | |
| Dell XPS 13 9360 FHD i7 Iris | |
| Dell XPS 13 i7-8550U | |
| Dell XPS 13 9360 FHD i5 | |
| Dell XPS 13 9360 QHD+ i7 | |
| PCMark 8 Home Score Accelerated v2 | 3432 punti | |
| PCMark 8 Creative Score Accelerated v2 | 4604 punti | |
| PCMark 8 Work Score Accelerated v2 | 4436 punti | |
Aiuto | ||
| Dell XPS 13 i7-8550U Toshiba XG5 KXG50ZNV256G | Dell XPS 13 9365-4537 2-in-1 Toshiba NVMe THNSN5256GPUK | Dell XPS 13-9365 2-in-1 Toshiba NVMe THNSN5256GPUK | Dell XPS 13 9360 FHD i5 Toshiba NVMe THNSN5256GPUK | Dell XPS 13 2016 9350 (FHD, i7-6560U) Samsung SSD SM951 512 GB MZHPV512HDGL | |
|---|---|---|---|---|---|
| AS SSD | 23% | 52% | 16% | 86% | |
| Copy Game MB/s (MB/s) | 285.3 | 457.8 60% | 726 154% | 390 37% | 618 117% |
| Copy Program MB/s (MB/s) | 172 | 264.7 54% | 263.8 53% | 188 9% | 333.8 94% |
| Copy ISO MB/s (MB/s) | 329.7 | 714 117% | 950 188% | 283.3 -14% | 830 152% |
| Score Total (Points) | 1284 | 1388 8% | 1495 16% | 1607 25% | 1992 55% |
| Score Write (Points) | 452 | 389 -14% | 375 -17% | 327 -28% | 606 34% |
| Score Read (Points) | 580 | 681 17% | 752 30% | 870 50% | 911 57% |
| Access Time Write * (ms) | 0.051 | 0.041 20% | 0.037 27% | 0.035 31% | 0.031 39% |
| Access Time Read * (ms) | 0.102 | 0.169 -66% | 0.045 56% | 0.055 46% | 0.048 53% |
| 4K-64 Write (MB/s) | 325.1 | 249.4 -23% | 204.7 -37% | 197.7 -39% | 363.4 12% |
| 4K-64 Read (MB/s) | 423.6 | 512 21% | 586 38% | 723 71% | 722 70% |
| 4K Write (MB/s) | 101.7 | 85.8 -16% | 96.9 -5% | 92 -10% | 107.4 6% |
| 4K Read (MB/s) | 28.17 | 34.77 23% | 37.69 34% | 29.52 5% | 46.9 66% |
| Seq Write (MB/s) | 249.2 | 543 118% | 735 195% | 372.8 50% | 1348 441% |
| Seq Read (MB/s) | 1277 | 1342 5% | 1283 0% | 1179 -8% | 1413 11% |
* ... Meglio usare valori piccoli

| 3DMark 11 Performance | 2032 punti | |
| 3DMark Ice Storm Standard Score | 67042 punti | |
| 3DMark Cloud Gate Standard Score | 8459 punti | |
| 3DMark Fire Strike Score | 1071 punti | |
| 3DMark Fire Strike Extreme Score | 490 punti | |
Aiuto | ||
| basso | medio | alto | ultra | |
|---|---|---|---|---|
| BioShock Infinite (2013) | 72.8 | 37.6 | 31.1 | 10 |
| Rise of the Tomb Raider (2016) | 24.9 | 14.6 | 7.4 | |
| Overwatch (2016) | 49.6 | 30.7 | 14.9 |
Rumorosità
| Idle |
| 27.9 / 27.9 / 27.9 dB(A) |
| Sotto carico |
| 30.8 / 33.1 dB(A) |
 | ||
30 dB silenzioso 40 dB(A) udibile 50 dB(A) rumoroso |
||
min: | ||
| Dell XPS 13 i7-8550U UHD Graphics 620, i5-8550U, Toshiba XG5 KXG50ZNV256G | Samsung Notebook 9 NP900X3N-K01US HD Graphics 620, i5-7200U, Samsung CM871a MZNTY256HDHP | Huawei MateBook X HD Graphics 620, i5-7200U, LITEON CB1-SD256 | Asus ZenBook Flip S UX370 HD Graphics 620, i5-7200U, SanDisk SD8SN8U256G1002 | Dell XPS 13 9360 FHD i7 Iris Iris Plus Graphics 640, i7-7560U, Toshiba XG4 NVMe (THNSN5512GPUK) | Dell XPS 13 9360 FHD i5 HD Graphics 620, i5-7200U, Toshiba NVMe THNSN5256GPUK | |
|---|---|---|---|---|---|---|
| Noise | -4% | -8% | -8% | -3% | ||
| off /ambiente * (dB) | 27.9 | 28.4 -2% | 30.5 -9% | 29.9 -7% | ||
| Idle Minimum * (dB) | 27.9 | 28.4 -2% | 30.5 -9% | 29.9 -7% | 28.9 -4% | |
| Idle Average * (dB) | 27.9 | 28.4 -2% | 30.5 -9% | 29.9 -7% | 28.9 -4% | |
| Idle Maximum * (dB) | 27.9 | 28.4 -2% | 30.5 -9% | 30.3 -9% | 28.9 -4% | |
| Load Average * (dB) | 30.8 | 33.2 -8% | 34.2 -11% | 33.9 -10% | 30.9 -0% | |
| Load Maximum * (dB) | 33.1 | 35.2 -6% | 32.5 2% | 34.9 -5% | 33.5 -1% |
* ... Meglio usare valori piccoli
(-) La temperatura massima sul lato superiore è di 49 °C / 120 F, rispetto alla media di 35.9 °C / 97 F, che varia da 21.4 a 59 °C per questa classe Subnotebook.
(-) Il lato inferiore si riscalda fino ad un massimo di 54 °C / 129 F, rispetto alla media di 39.2 °C / 103 F
(+) In idle, la temperatura media del lato superiore è di 25.7 °C / 78 F, rispetto alla media deld ispositivo di 30.8 °C / 87 F.
(+) I poggiapolsi e il touchpad raggiungono la temperatura massima della pelle (32.2 °C / 90 F) e quindi non sono caldi.
(-) La temperatura media della zona del palmo della mano di dispositivi simili e'stata di 28.2 °C / 82.8 F (-4 °C / -7.2 F).
Dell XPS 13 i7-8550U analisi audio
(-) | altoparlanti non molto potenti (66.8 dB)
Bassi 100 - 315 Hz
(+) | bassi buoni - solo 4.5% dalla media
(±) | la linearità dei bassi è media (8.2% delta rispetto alla precedente frequenza)
Medi 400 - 2000 Hz
(±) | medi elevati - circa 5% superiore alla media
(+) | medi lineari (5.8% delta rispetto alla precedente frequenza)
Alti 2 - 16 kHz
(+) | Alti bilanciati - appena 3% dalla media
(±) | la linearità degli alti è media (14.5% delta rispetto alla precedente frequenza)
Nel complesso 100 - 16.000 Hz
(±) | la linearità complessiva del suono è media (17.2% di differenza rispetto alla media
Rispetto alla stessa classe
» 44% di tutti i dispositivi testati in questa classe è stato migliore, 9% simile, 47% peggiore
» Il migliore ha avuto un delta di 5%, medio di 18%, peggiore di 53%
Rispetto a tutti i dispositivi testati
» 32% di tutti i dispositivi testati in questa classe è stato migliore, 8% similare, 60% peggiore
» Il migliore ha avuto un delta di 4%, medio di 23%, peggiore di 134%
Apple MacBook 12 (Early 2016) 1.1 GHz analisi audio
(+) | gli altoparlanti sono relativamente potenti (83.6 dB)
Bassi 100 - 315 Hz
(±) | bassi ridotti - in media 11.3% inferiori alla media
(±) | la linearità dei bassi è media (14.2% delta rispetto alla precedente frequenza)
Medi 400 - 2000 Hz
(+) | medi bilanciati - solo only 2.4% rispetto alla media
(+) | medi lineari (5.5% delta rispetto alla precedente frequenza)
Alti 2 - 16 kHz
(+) | Alti bilanciati - appena 2% dalla media
(+) | alti lineari (4.5% delta rispetto alla precedente frequenza)
Nel complesso 100 - 16.000 Hz
(+) | suono nel complesso lineare (10.2% differenza dalla media)
Rispetto alla stessa classe
» 7% di tutti i dispositivi testati in questa classe è stato migliore, 2% simile, 90% peggiore
» Il migliore ha avuto un delta di 5%, medio di 18%, peggiore di 53%
Rispetto a tutti i dispositivi testati
» 5% di tutti i dispositivi testati in questa classe è stato migliore, 1% similare, 94% peggiore
» Il migliore ha avuto un delta di 4%, medio di 23%, peggiore di 134%
| Off / Standby | |
| Idle | |
| Sotto carico |
|
Leggenda:
min: | |
| Dell XPS 13 i7-8550U i5-8550U, UHD Graphics 620, Toshiba XG5 KXG50ZNV256G, IGZO IPS, 3200x1800, 13.3" | Samsung Notebook 9 NP900X3N-K01US i5-7200U, HD Graphics 620, Samsung CM871a MZNTY256HDHP, IPS, 1920x1080, 13.3" | Asus ZenBook Flip S UX370 i5-7200U, HD Graphics 620, SanDisk SD8SN8U256G1002, a-Si TFT-LCD, WLED, 1920x1080, 13.3" | Dell XPS 13 9360 FHD i7 Iris i7-7560U, Iris Plus Graphics 640, Toshiba XG4 NVMe (THNSN5512GPUK), IPS, 1920x1080, 13.3" | Dell XPS 13 9360 QHD+ i7 i7-7500U, HD Graphics 620, Toshiba NVMe THNSN5256GPUK, IPS, 3200x1800, 13.3" | HP Spectre 13-v131ng i7-7500U, HD Graphics 620, Samsung PM961 NVMe MZVLW512HMJP, IPS UWVA, 1920x1080, 13.3" | |
|---|---|---|---|---|---|---|
| Power Consumption | -29% | 14% | 7% | -5% | -3% | |
| Idle Minimum * (Watt) | 4.1 | 3.8 7% | 2.6 37% | 3.32 19% | 6.4 -56% | 3.6 12% |
| Idle Average * (Watt) | 5.8 | 11 -90% | 5.3 9% | 5.27 9% | 6.6 -14% | 6.4 -10% |
| Idle Maximum * (Watt) | 6 | 11.3 -88% | 8.5 -42% | 6.32 -5% | 6.8 -13% | 9.2 -53% |
| Load Average * (Watt) | 42.5 | 35.6 16% | 29 32% | 32 25% | 27.5 35% | 34 20% |
| Load Maximum * (Watt) | 41.4 | 37.2 10% | 27 35% | 45.9 -11% | 32.4 22% | 34.4 17% |
* ... Meglio usare valori piccoli
| Dell XPS 13 i7-8550U i5-8550U, UHD Graphics 620, 60 Wh | Samsung Notebook 9 NP900X3N-K01US i5-7200U, HD Graphics 620, 30 Wh | Huawei MateBook X i5-7200U, HD Graphics 620, 40 Wh | Asus ZenBook Flip S UX370 i5-7200U, HD Graphics 620, 39 Wh | Dell XPS 13 9360 FHD i7 Iris i7-7560U, Iris Plus Graphics 640, 60 Wh | Dell XPS 13 9360 FHD i5 i5-7200U, HD Graphics 620, 60 Wh | |
|---|---|---|---|---|---|---|
| Autonomia della batteria | -49% | -28% | -10% | 19% | 13% | |
| Reader / Idle (h) | 18.5 | 11.6 -37% | 8.5 -54% | 15.6 -16% | 25.4 37% | 21.6 17% |
| WiFi v1.3 (h) | 9.8 | 4.7 -52% | 5.6 -43% | 8.1 -17% | 10.9 11% | 11.3 15% |
| Load (h) | 2.4 | 1 -58% | 2.7 13% | 2.5 4% | 2.6 8% | 2.6 8% |
Nota: si tratta di una recensione breve, con alcune sezioni non tradotte, per la versione integrale in inglese guardate qui.
Price comparison
