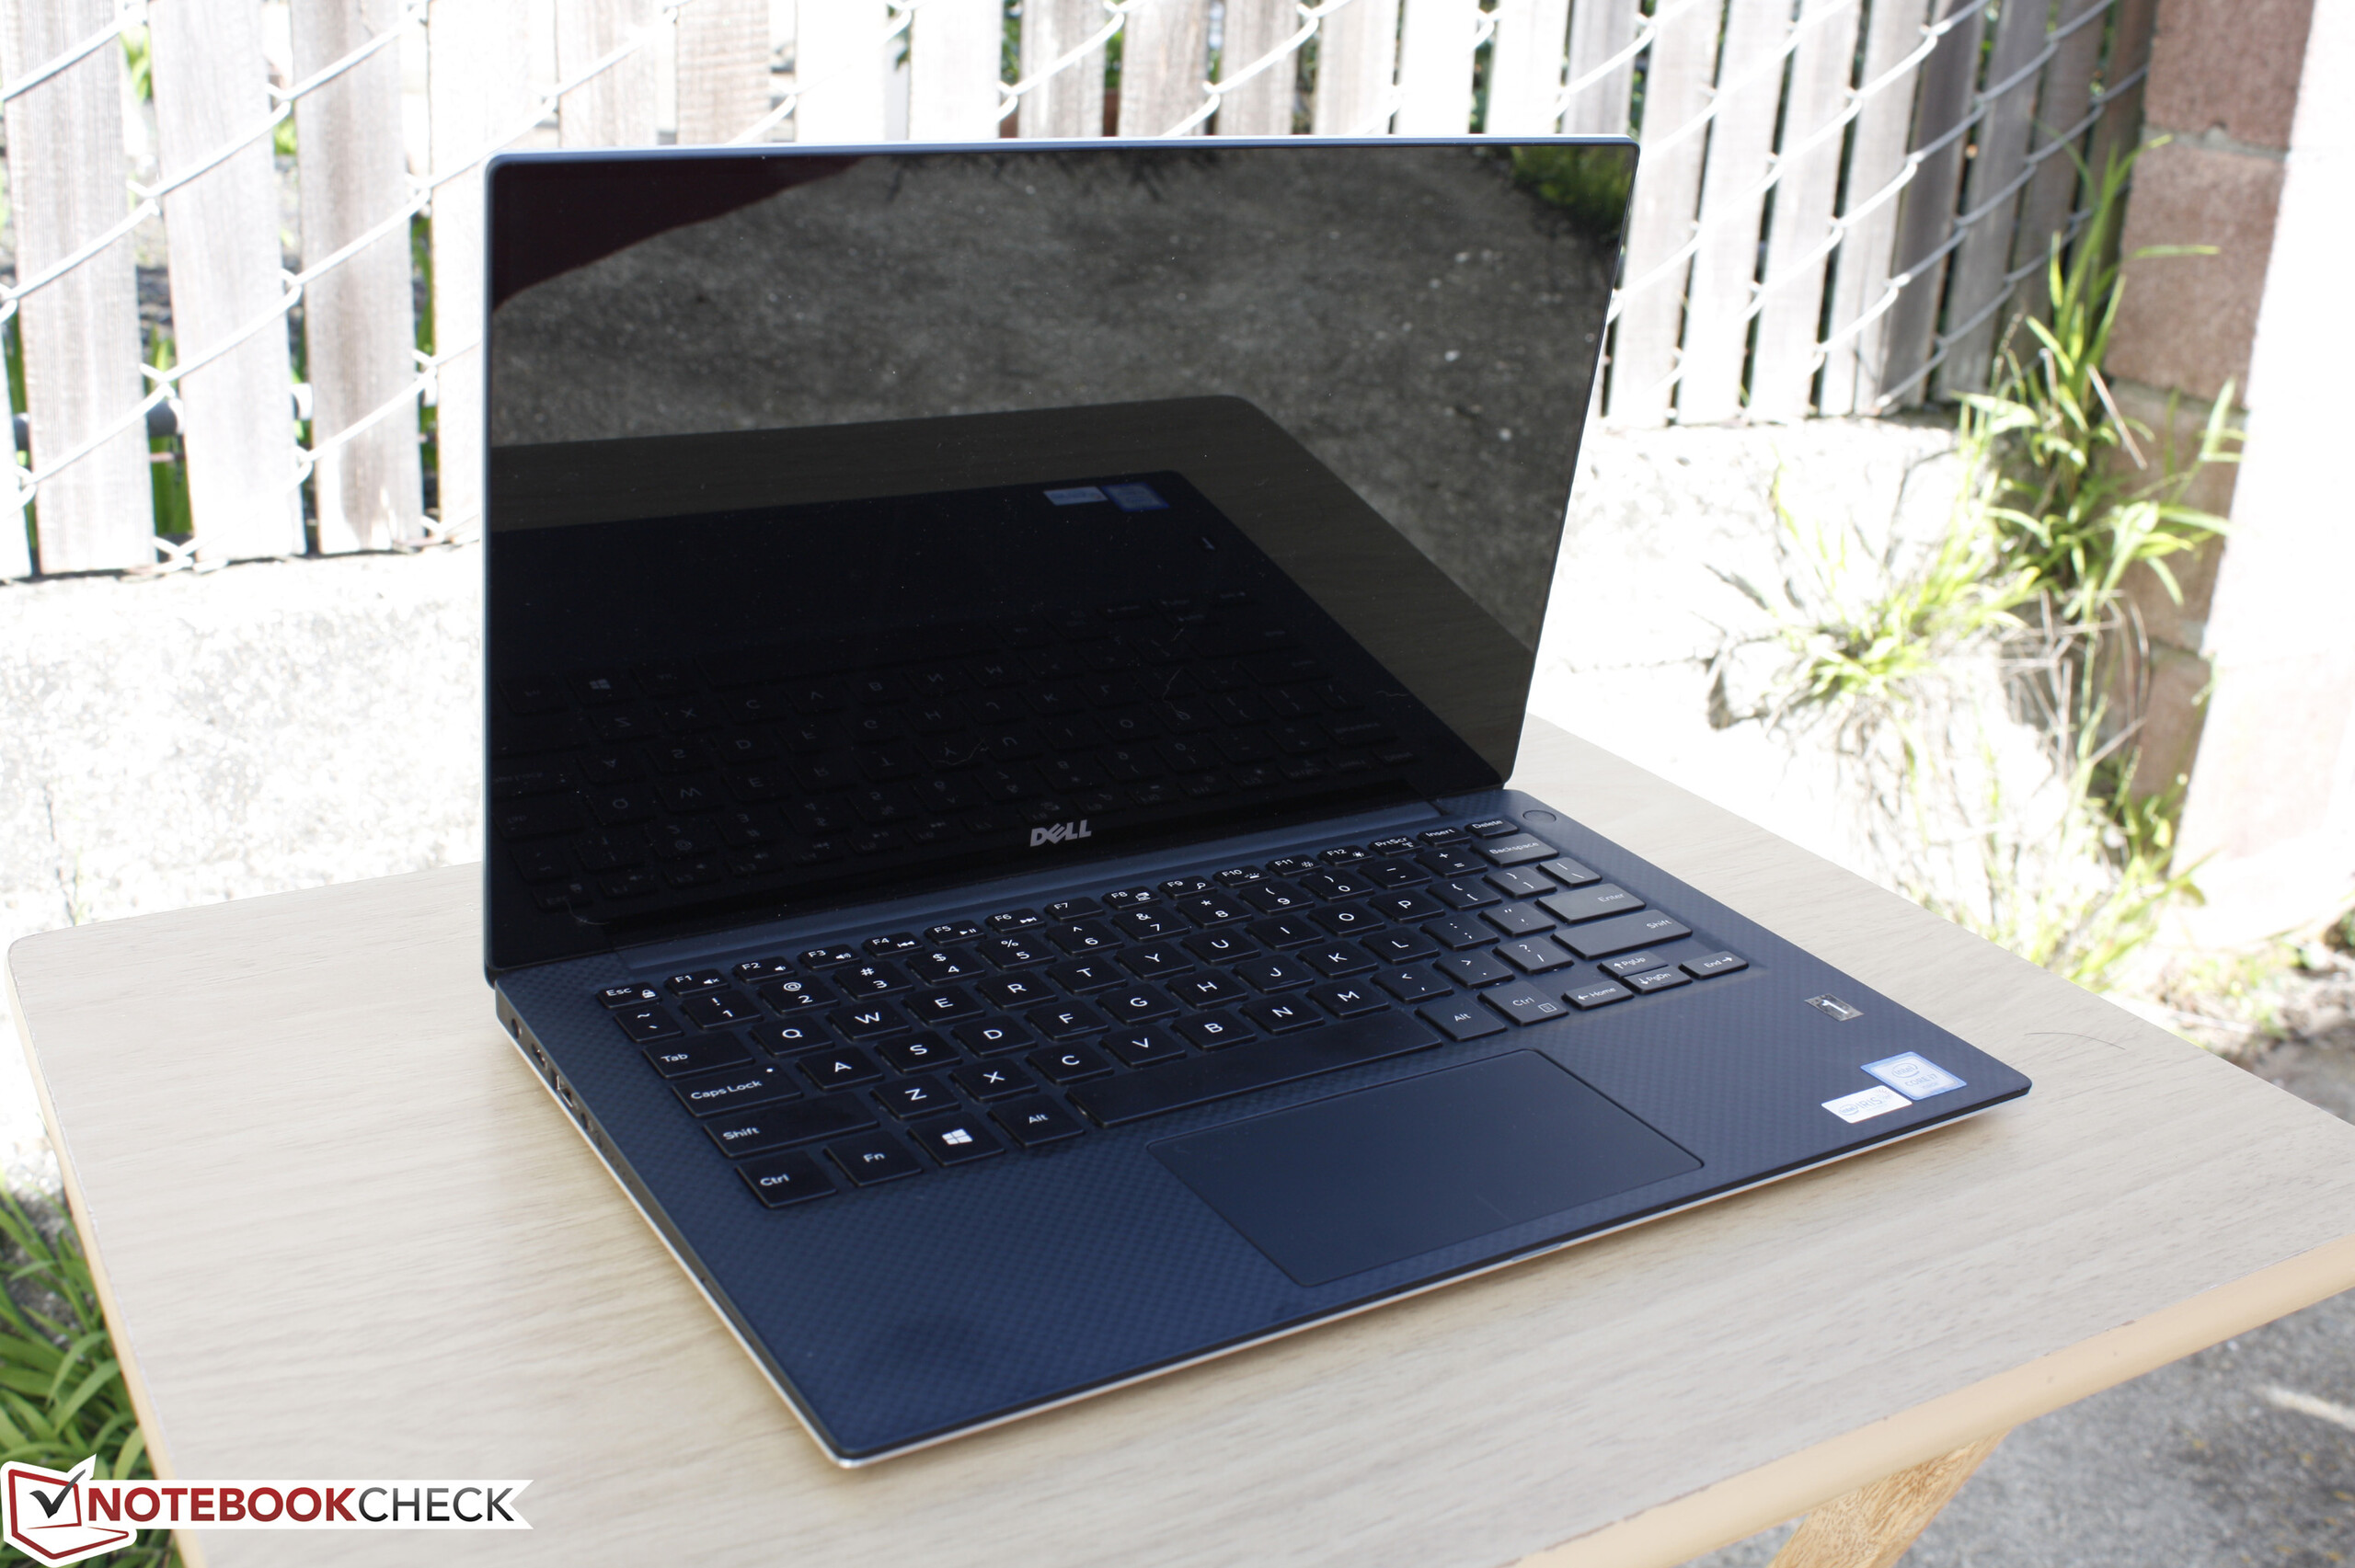
Recensione Breve dell'Ultrabook Dell XPS 13 9350 (i7-6560U, QHD+)
| |||||||||||||||||||||||||
Distribuzione della luminosità: 92 %
Al centro con la batteria: 307.5 cd/m²
Contrasto: 1486:1 (Nero: 0.207 cd/m²)
ΔE ColorChecker Calman: 4.18 | ∀{0.5-29.43 Ø4.73}
ΔE Greyscale Calman: 4.94 | ∀{0.09-98 Ø4.97}
92% sRGB (Argyll 1.6.3 3D)
59% AdobeRGB 1998 (Argyll 1.6.3 3D)
65.4% AdobeRGB 1998 (Argyll 3D)
92.3% sRGB (Argyll 3D)
63.6% Display P3 (Argyll 3D)
Gamma: 2.31
CCT: 7645 K
| Dell XPS 13 9350 WQXGA 13.3", 3200x1800 | HP ProBook 430 G3 P5T00ES 13.3", 1366x768 | Asus Zenbook UX303UB-DH74T 13.3", 3200x1800 | Apple MacBook Air 13 inch 2015-03 13.3", 1440x900 | Lenovo Yoga 900-13ISK 80MK 13.3", 3200x1800 | HP Spectre x360 13-4104ng 13.3", 2560x1440 | |
|---|---|---|---|---|---|---|
| Display | -43% | -5% | -36% | -2% | 3% | |
| Display P3 Coverage (%) | 63.6 | 35.87 -44% | 60.9 -4% | 40.1 -37% | 63.2 -1% | 66.8 5% |
| sRGB Coverage (%) | 92.3 | 54 -41% | 85.4 -7% | 59.8 -35% | 88.7 -4% | 92.8 1% |
| AdobeRGB 1998 Coverage (%) | 65.4 | 37.06 -43% | 62.5 -4% | 41.51 -37% | 64.9 -1% | 67.3 3% |
| Response Times | -9% | -5% | 24% | 45% | ||
| Response Time Grey 50% / Grey 80% * (ms) | 50.8 ? | 54.4 ? -7% | 44.4 ? 13% | 38.8 ? 24% | 24 ? 53% | |
| Response Time Black / White * (ms) | 29.6 ? | 32.8 ? -11% | 36 ? -22% | 22.4 ? 24% | 19 ? 36% | |
| PWM Frequency (Hz) | 192 ? | 1389 | 1316 | |||
| Screen | -92% | -56% | -17% | -33% | -9% | |
| Brightness middle (cd/m²) | 307.5 | 212 -31% | 291.4 -5% | 329 7% | 319.8 4% | 324 5% |
| Brightness (cd/m²) | 297 | 205 -31% | 270 -9% | 310 4% | 302 2% | 324 9% |
| Brightness Distribution (%) | 92 | 90 -2% | 84 -9% | 82 -11% | 88 -4% | 90 -2% |
| Black Level * (cd/m²) | 0.207 | 0.71 -243% | 0.954 -361% | 0.405 -96% | 0.835 -303% | 0.34 -64% |
| Contrast (:1) | 1486 | 299 -80% | 305 -79% | 812 -45% | 383 -74% | 953 -36% |
| Colorchecker dE 2000 * | 4.18 | 12.06 -189% | 4.63 -11% | 3.96 5% | 2.68 36% | 4.36 -4% |
| Colorchecker dE 2000 max. * | 7.84 | 7.51 4% | ||||
| Greyscale dE 2000 * | 4.94 | 13.41 -171% | 5.65 -14% | 3.51 29% | 2.35 52% | 4.62 6% |
| Gamma | 2.31 95% | 2.41 91% | 2.16 102% | 3.83 57% | 2.09 105% | 2.18 101% |
| CCT | 7645 85% | 15382 42% | 6320 103% | 6711 97% | 6975 93% | 6857 95% |
| Color Space (Percent of AdobeRGB 1998) (%) | 59 | 34.3 -42% | 55.2 -6% | 38.4 -35% | 57 -3% | 60 2% |
| Color Space (Percent of sRGB) (%) | 92 | 54.2 -41% | 85.2 -7% | 59.8 -35% | 88 -4% | 93 1% |
| Media totale (Programma / Settaggio) | -48% /
-70% | -22% /
-38% | -27% /
-22% | -4% /
-18% | 13% /
1% |
* ... Meglio usare valori piccoli
Tempi di risposta del Display
| ↔ Tempi di risposta dal Nero al Bianco | ||
|---|---|---|
| 29.6 ms ... aumenta ↗ e diminuisce ↘ combinato | ↗ 6 ms Incremento | 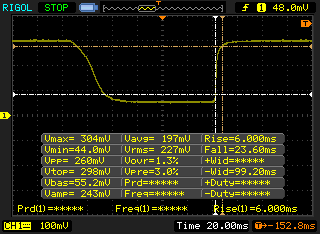 |
| ↘ 23.6 ms Calo | ||
| Lo schermo mostra tempi di risposta relativamente lenti nei nostri tests e potrebbe essere troppo lento per i gamers. In confronto, tutti i dispositivi di test variano da 0.1 (minimo) a 240 (massimo) ms. » 79 % di tutti i dispositivi è migliore. Questo significa che i tempi di risposta rilevati sono peggiori rispetto alla media di tutti i dispositivi testati (19.9 ms). | ||
| ↔ Tempo di risposta dal 50% Grigio all'80% Grigio | ||
| 50.8 ms ... aumenta ↗ e diminuisce ↘ combinato | ↗ 18.4 ms Incremento | 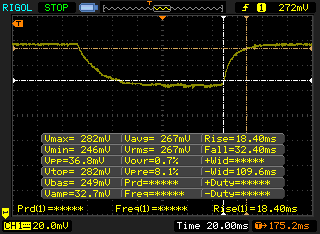 |
| ↘ 32.4 ms Calo | ||
| Lo schermo mostra tempi di risposta lenti nei nostri tests e sarà insoddisfacente per i gamers. In confronto, tutti i dispositivi di test variano da 0.165 (minimo) a 636 (massimo) ms. » 87 % di tutti i dispositivi è migliore. Questo significa che i tempi di risposta rilevati sono peggiori rispetto alla media di tutti i dispositivi testati (31.1 ms). | ||
Sfarfallio dello schermo / PWM (Pulse-Width Modulation)
| flickering dello schermo / PWM non rilevato | 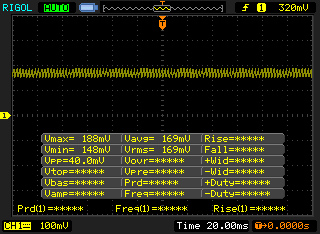 | ||
In confronto: 52 % di tutti i dispositivi testati non utilizza PWM per ridurre la luminosita' del display. Se è rilevato PWM, una media di 7784 (minimo: 5 - massimo: 343500) Hz è stata rilevata. | |||
| Cinebench R11.5 | |
| CPU Single 64Bit (ordina per valore) | |
| Dell XPS 13 9350 WQXGA | |
| Eurocom Shark 4 | |
| Microsoft Surface Pro 4 Core i7 | |
| Asus Zenbook UX303UB-DH74T | |
| Microsoft Surface Book Core i5 | |
| Lenovo ThinkPad T560-20FH001FGE | |
| CPU Multi 64Bit (ordina per valore) | |
| Dell XPS 13 9350 WQXGA | |
| Eurocom Shark 4 | |
| Microsoft Surface Pro 4 Core i7 | |
| Asus Zenbook UX303UB-DH74T | |
| Microsoft Surface Book Core i5 | |
| Lenovo ThinkPad T560-20FH001FGE | |
| Cinebench R10 | |
| Rendering Single CPUs 64Bit (ordina per valore) | |
| Eurocom Shark 4 | |
| Microsoft Surface Pro 4 Core i7 | |
| Microsoft Surface Book Core i5 | |
| Lenovo ThinkPad T560-20FH001FGE | |
| Rendering Multiple CPUs 64Bit (ordina per valore) | |
| Eurocom Shark 4 | |
| Microsoft Surface Pro 4 Core i7 | |
| Microsoft Surface Book Core i5 | |
| Lenovo ThinkPad T560-20FH001FGE | |
| wPrime 2.10 - 1024m (ordina per valore) | |
| Dell XPS 13 9350 WQXGA | |
| Eurocom Shark 4 | |
| Microsoft Surface Pro 4 Core i7 | |
| Asus Zenbook UX303UB-DH74T | |
| Microsoft Surface Book Core i5 | |
| Super Pi Mod 1.5 XS 32M - 32M (ordina per valore) | |
| Dell XPS 13 9350 WQXGA | |
| Eurocom Shark 4 | |
| Microsoft Surface Pro 4 Core i7 | |
| Asus Zenbook UX303UB-DH74T | |
| Microsoft Surface Book Core i5 | |
| Lenovo ThinkPad T560-20FH001FGE | |
* ... Meglio usare valori piccoli
| PCMark 7 - Score (ordina per valore) | |
| Dell XPS 13 9350 WQXGA | |
| Lenovo Yoga 900-13ISK 80MK | |
| Apple MacBook Air 13 inch 2015-03 | |
| Asus Zenbook UX303UB-DH74T | |
| HP ProBook 430 G3 P5T00ES | |
| PCMark 7 Score | 5672 punti | |
| PCMark 8 Home Score Accelerated v2 | 2928 punti | |
| PCMark 8 Creative Score Accelerated v2 | 4470 punti | |
| PCMark 8 Work Score Accelerated v2 | 3438 punti | |
Aiuto | ||
| Dell XPS 13 9350 WQXGA Iris Graphics 540, 6560U, Samsung PM951 NVMe 512 GB | HP ProBook 430 G2 L3Q21EA HD Graphics 5500, 5200U, Samsung SSD PM851 128 GB MZ7TE128HMGR | Asus Zenbook UX303UB-DH74T GeForce 940M, 6500U, CUK Cyclone SSD 1TB | Apple MacBook Air 13 inch 2015-03 HD Graphics 6000, 5650U, Apple SSD SD0256F | Lenovo Yoga 900-13ISK 80MK HD Graphics 520, 6500U, Samsung SSD PM871 MZNLN512HCJH | Dell XPS 13-9333 HD Graphics 4400, 4200U, Liteonit LMT-128M6M | |
|---|---|---|---|---|---|---|
| AS SSD | -74% | -63% | -68% | -42% | -63% | |
| Copy Game MB/s (MB/s) | 753 | 110.3 -85% | 392.8 -48% | 479.3 -36% | 298.7 -60% | |
| Copy Program MB/s (MB/s) | 271.8 | 105 -61% | 233.7 -14% | 245 -10% | 249.6 -8% | |
| Copy ISO MB/s (MB/s) | 1041 | 136.3 -87% | 382.5 -63% | 643 -38% | 364.5 -65% | |
| Score Total (Points) | 3158 | 838 -73% | 882 -72% | 2383 -25% | 1129 -64% | 902 -71% |
| Score Write (Points) | 664 | 218 -67% | 373 -44% | 463 -30% | 429 -35% | 337 -49% |
| Score Read (Points) | 1679 | 415 -75% | 333 -80% | 1281 -24% | 458 -73% | 373 -78% |
| Access Time Write * (ms) | 0.031 | 0.042 -35% | 0.051 -65% | 0.155 -400% | 0.039 -26% | 0.065 -110% |
| Access Time Read * (ms) | 0.046 | 0.141 -207% | 0.14 -204% | 0.171 -272% | 0.054 -17% | 0.078 -70% |
| 4K-64 Write (MB/s) | 492 | 111.1 -77% | 261.1 -47% | 338.9 -31% | 303 -38% | 249.5 -49% |
| 4K-64 Read (MB/s) | 1497 | 342.6 -77% | 256.9 -83% | 1140 -24% | 374.8 -75% | 294.2 -80% |
| 4K Write (MB/s) | 116.5 | 93.5 -20% | 71.3 -39% | 23.73 -80% | 80.6 -31% | 57.6 -51% |
| 4K Read (MB/s) | 38.29 | 26.84 -30% | 25.99 -32% | 19.16 -50% | 32.29 -16% | 29.32 -23% |
| Seq Write (MB/s) | 559 | 130.5 -77% | 409.8 -27% | 1001 79% | 454.6 -19% | 302.2 -46% |
| Seq Read (MB/s) | 1442 | 459 -68% | 505 -65% | 1212 -16% | 505 -65% | 492.7 -66% |
* ... Meglio usare valori piccoli

| 3DMark 11 Performance | 2039 punti | |
| 3DMark Ice Storm Standard Score | 58948 punti | |
| 3DMark Cloud Gate Standard Score | 6730 punti | |
| 3DMark Fire Strike Score | 1114 punti | |
| 3DMark Fire Strike Extreme Score | 503 punti | |
Aiuto | ||
| Tomb Raider - 1366x768 Normal Preset AA:FX AF:4x (ordina per valore) | |
| Dell XPS 13 9350 WQXGA | |
| Asus Zenbook UX303UB-DH74T | |
| Lenovo U31-70 80M5003EGE | |
| Asus Zenbook UX303UA-FN121T | |
| Lenovo IdeaPad Miix 700 | |
| Lenovo ThinkPad L440 20AT004QGE | |
| basso | medio | alto | ultra | |
|---|---|---|---|---|
| Tomb Raider (2013) | 85 | 49.2 | 33.3 | |
| Metro: Last Light (2013) | 28.1 | 23 | 15.8 | |
| Thief (2014) | 23.3 | 15.7 | 13.7 | |
| Metal Gear Solid V (2015) | 48.6 | 28.9 | 13.9 |
| Dell XPS 13 9350 WQXGA Iris Graphics 540, 6560U, Samsung PM951 NVMe 512 GB | HP ProBook 430 G3 P5T00ES HD Graphics 520, 6200U, Hitachi Travelstar Z7K500 HTS725050A7E630 | Asus Zenbook UX303UB-DH74T GeForce 940M, 6500U, CUK Cyclone SSD 1TB | Apple MacBook Air 13 inch 2015-03 HD Graphics 6000, 5650U, Apple SSD SD0256F | Lenovo Yoga 900-13ISK 80MK HD Graphics 520, 6500U, Samsung SSD PM871 MZNLN512HCJH | HP Spectre x360 13-4104ng HD Graphics 520, 6200U, Samsung SSD PM851 256 GB MZNTE256HMHP | |
|---|---|---|---|---|---|---|
| Noise | -7% | -11% | -15% | -6% | -10% | |
| off /ambiente * (dB) | 29.2 | |||||
| Idle Minimum * (dB) | 29.2 | 29.8 -2% | 29.8 -2% | 29.2 -0% | 29.7 -2% | 29.6 -1% |
| Idle Average * (dB) | 29.2 | 29.8 -2% | 29.8 -2% | 29.2 -0% | 29.8 -2% | 29.6 -1% |
| Idle Maximum * (dB) | 29.2 | 30.9 -6% | 29.8 -2% | 29.2 -0% | 30 -3% | 34.6 -18% |
| Load Average * (dB) | 31.4 | 33.3 -6% | 37.4 -19% | 40.2 -28% | 32 -2% | 34.7 -11% |
| Load Maximum * (dB) | 31.4 | 37.4 -19% | 40.3 -28% | 46.3 -47% | 38.5 -23% | 37.9 -21% |
* ... Meglio usare valori piccoli
Rumorosità
| Idle |
| 29.2 / 29.2 / 29.2 dB(A) |
| Sotto carico |
| 31.4 / 31.4 dB(A) |
 | ||
30 dB silenzioso 40 dB(A) udibile 50 dB(A) rumoroso |
||
min: | ||
(±) La temperatura massima sul lato superiore è di 41.4 °C / 107 F, rispetto alla media di 35.9 °C / 97 F, che varia da 21.4 a 59 °C per questa classe Subnotebook.
(-) Il lato inferiore si riscalda fino ad un massimo di 49.2 °C / 121 F, rispetto alla media di 39.2 °C / 103 F
(+) In idle, la temperatura media del lato superiore è di 26.7 °C / 80 F, rispetto alla media deld ispositivo di 30.8 °C / 87 F.
(+) I poggiapolsi e il touchpad sono piu' freddi della temperatura della pelle con un massimo di 28.7 °C / 83.7 F e sono quindi freddi al tatto.
(±) La temperatura media della zona del palmo della mano di dispositivi simili e'stata di 28.2 °C / 82.8 F (-0.5 °C / -0.9 F).
| Off / Standby | |
| Idle | |
| Sotto carico |
|
Leggenda:
min: | |
| Dell XPS 13 9350 WQXGA 56 Wh | HP ProBook 430 G3 P5T00ES 44 Wh | Asus Zenbook UX303UB-DH74T 50 Wh | Apple MacBook Air 13 inch 2015-03 54 Wh | Lenovo Yoga 900-13ISK 80MK 66 Wh | HP Spectre x360 13-4104ng 56 Wh | |
|---|---|---|---|---|---|---|
| Autonomia della batteria | -3% | -2% | 78% | 23% | 60% | |
| Reader / Idle (h) | 10.1 | 7.5 -26% | 10.3 2% | 26.2 159% | 14.1 40% | |
| WiFi v1.3 (h) | 5.2 | 6.3 21% | 5.7 10% | 10.3 98% | 6.7 29% | 8.3 60% |
| Load (h) | 2.1 | 2 -5% | 1.7 -19% | 1.6 -24% | 2.1 0% |
Pro
Contro
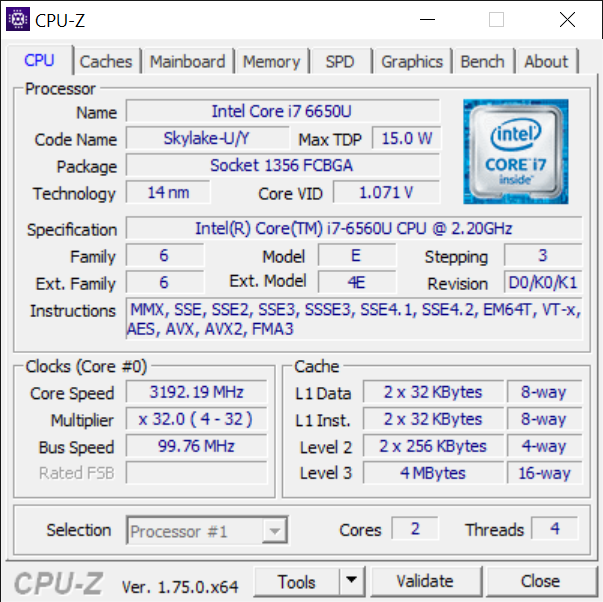
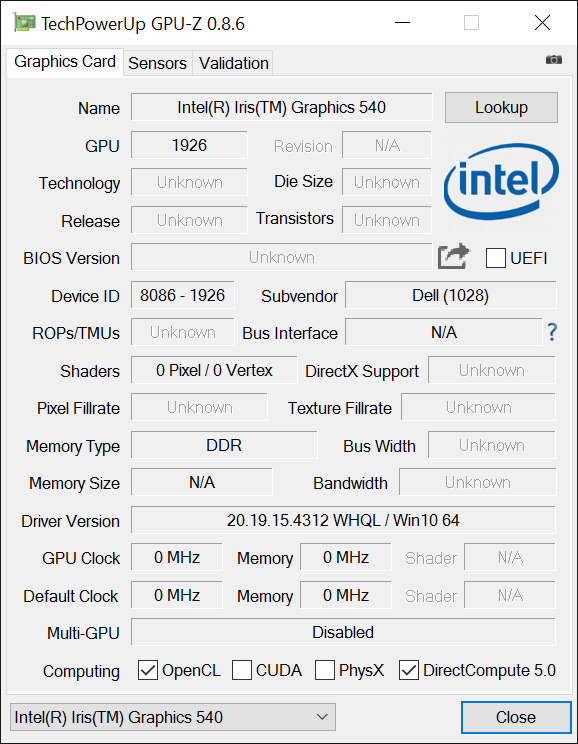
Alcuni dei migliori aspetti dell'XPS 13 sono le dimensioni, la silenziosità e il display. Il Core i7-6560U e la Iris Graphics 540 integrata spingono il sistema senza incrementare la rumorosità della ventola, il che è un'arma a doppio taglio. Mentre le prestazioni sono migliorate, le temperature di superficie e core sono molto più elevate e la CPU potrebbe subire throttling con carico elevato dei giochi. L'autonomia della batteria in particolare si fa notare con l'elevata risoluzione del display QHD+ e con la CPU. Le performance complessivamente sono un po' sotto al Core i7-6650U del Surface Pro 4, specialmente in termini di prestazioni grafiche.
Coloro che non richiedono la potenza della Iris Graphics 540 rispetto alla Graphics 520 possono optare per una più economica SKU ed avere maggiore autonomia. Se la potenza GPU è importante, allora vale la pena investire nel più grande Zenbook UX303 e nella discreta Nvidia per un miglior ritorno in termini di performance senza sacrificare troppo la mobilità.
Nota: si tratta di una recensione breve, con alcune sezioni non tradotte, per la versione integrale in inglese guardate qui.
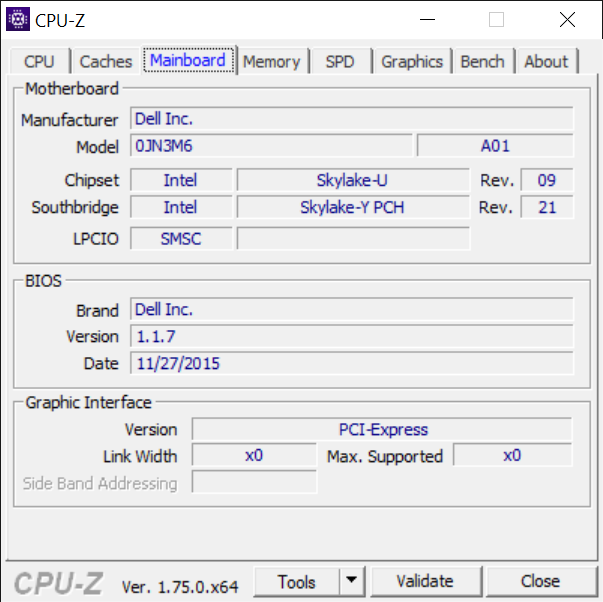
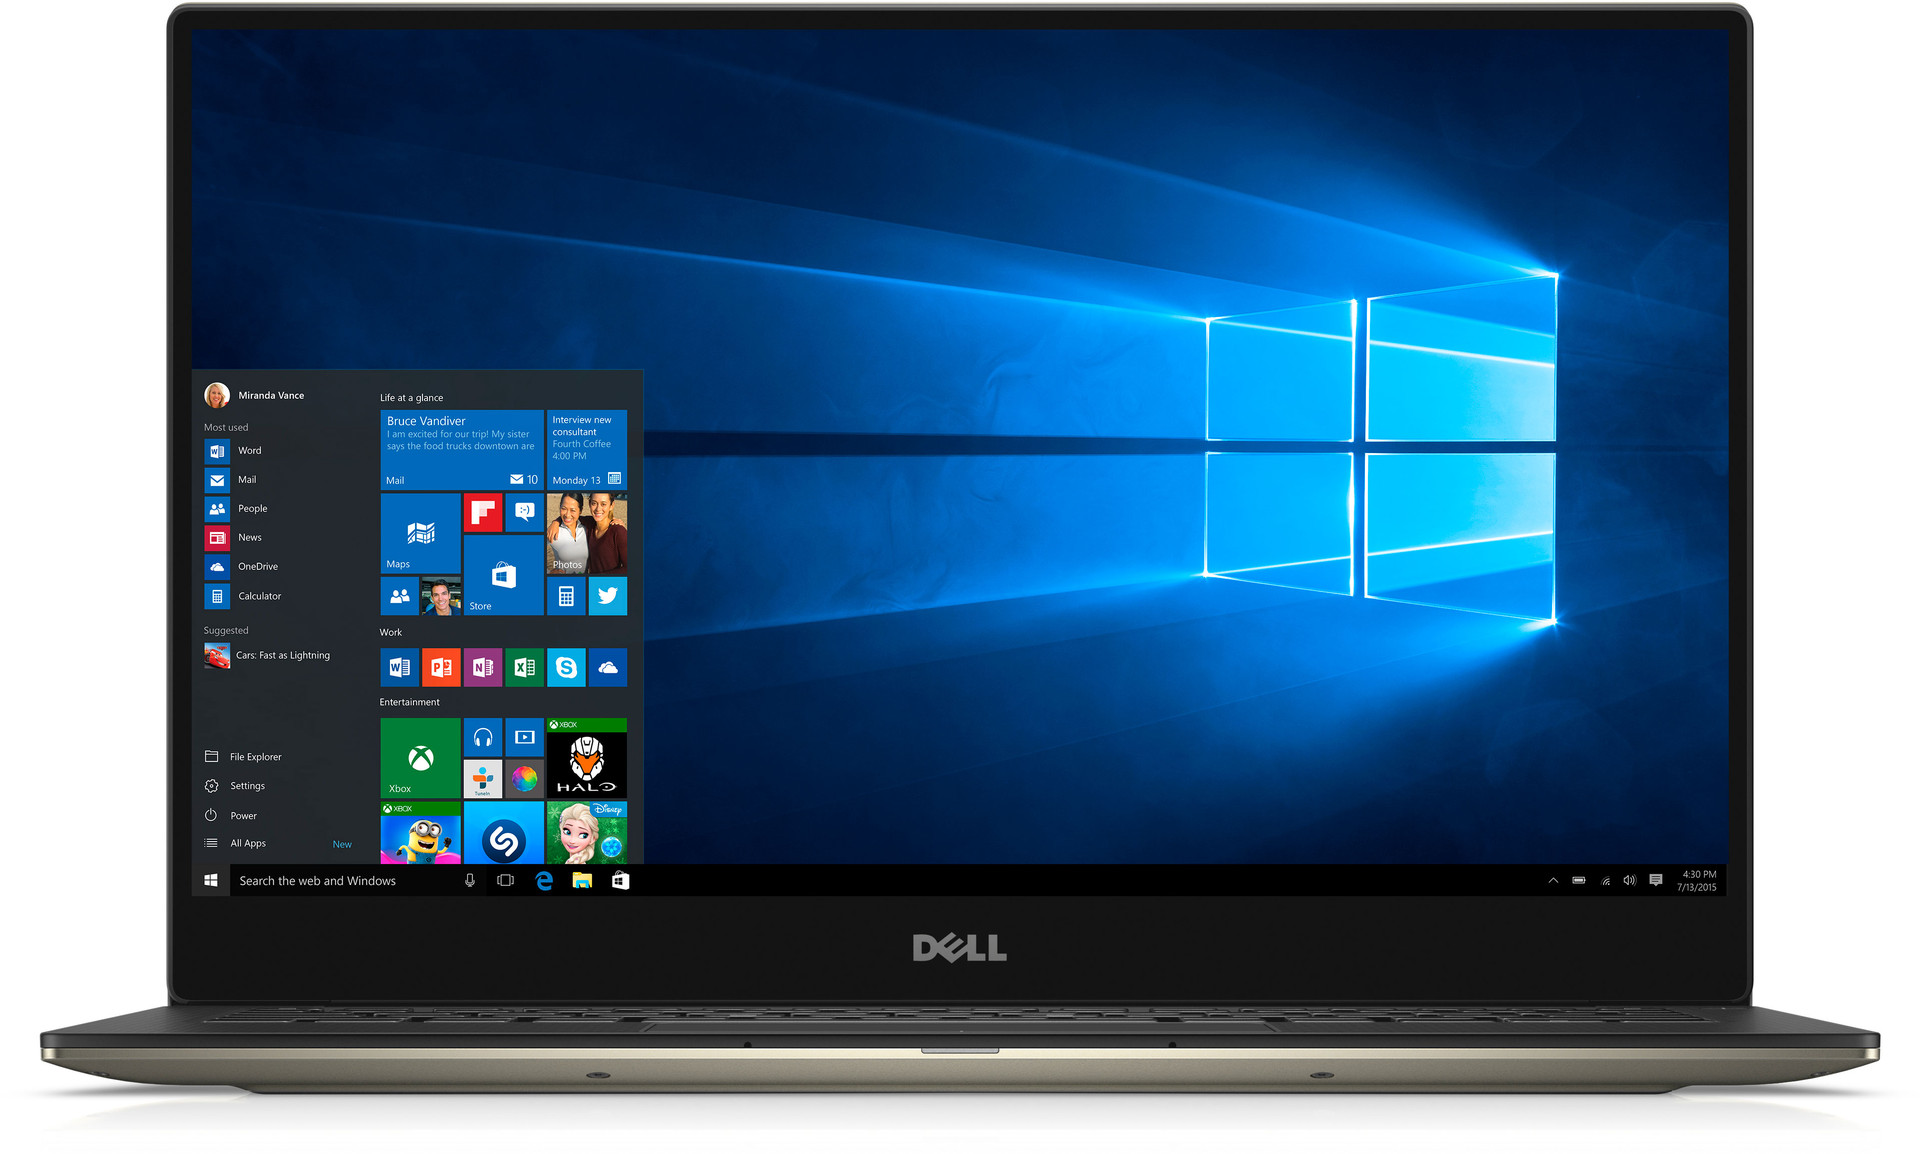
Dell XPS 13 9350 WQXGA
- 02/26/2016 v5 (old)
Allen Ngo
Price comparison
