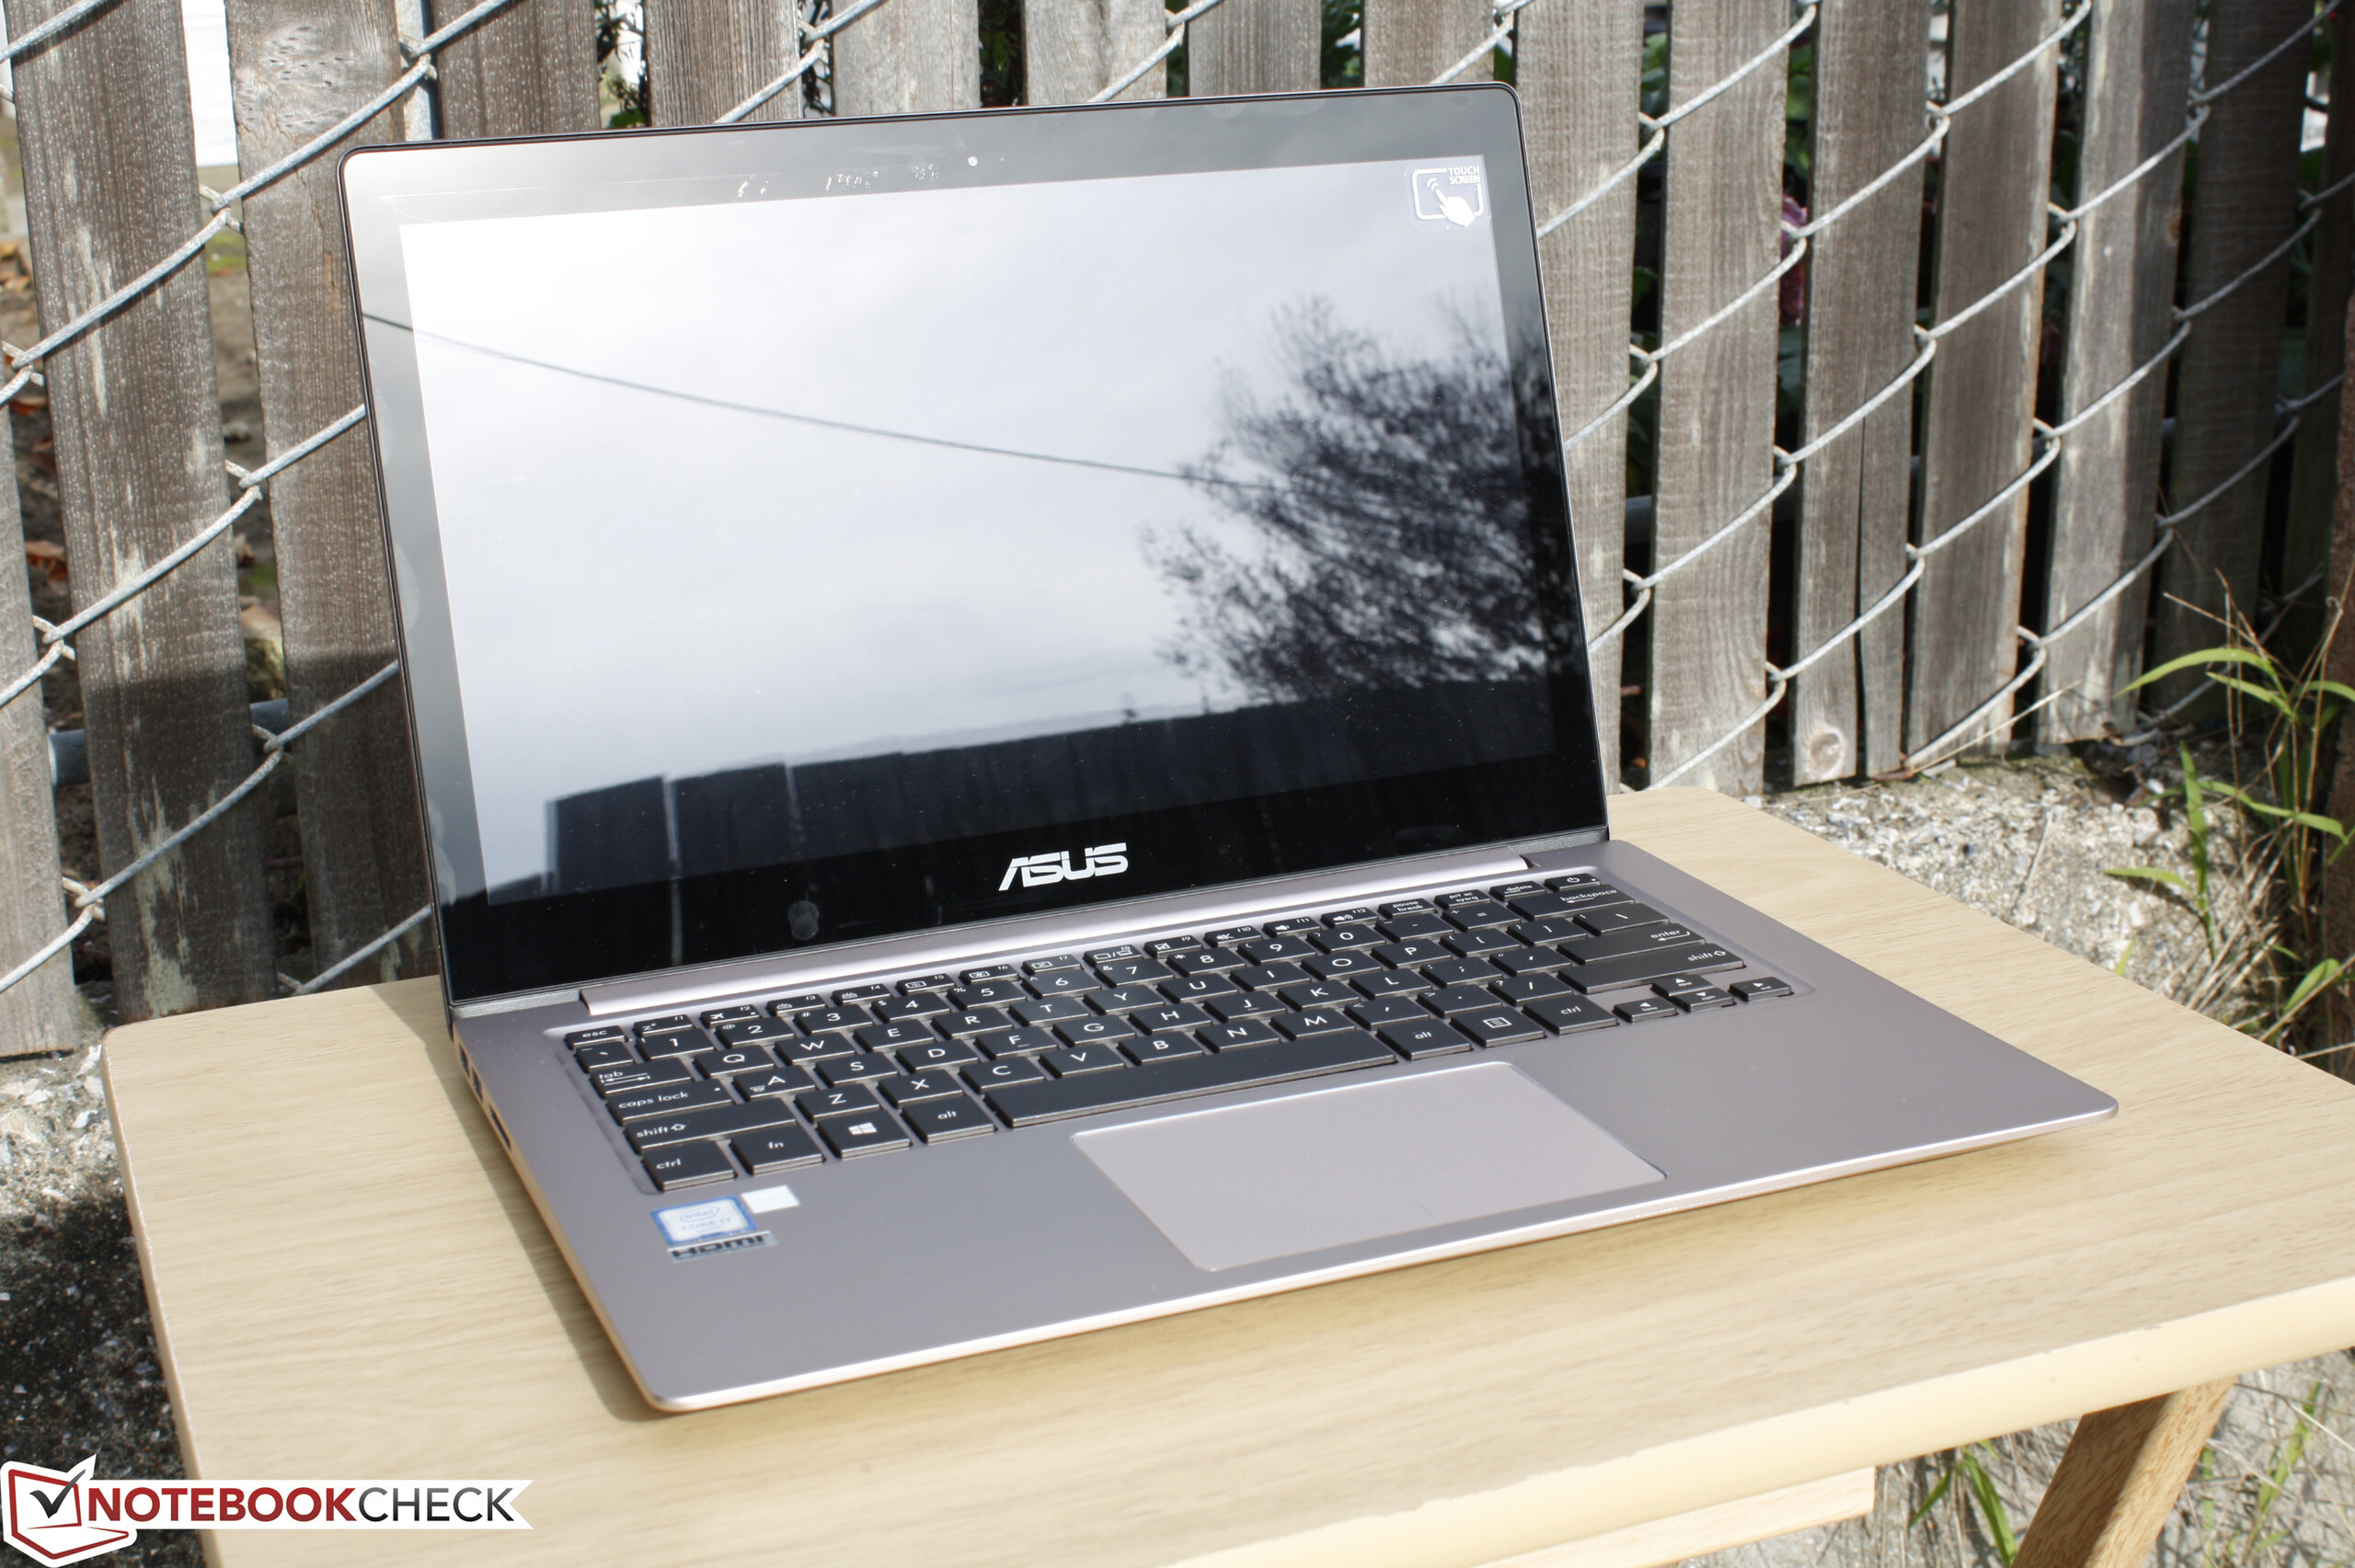
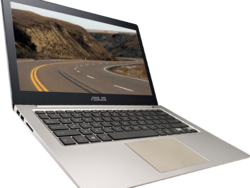
Recensione Breve del portatile Asus Zenbook UX303UB-DH74T


| |||||||||||||||||||||||||
Distribuzione della luminosità: 84 %
Al centro con la batteria: 291.4 cd/m²
Contrasto: 305:1 (Nero: 0.954 cd/m²)
ΔE ColorChecker Calman: 4.63 | ∀{0.5-29.43 Ø4.72}
ΔE Greyscale Calman: 5.65 | ∀{0.09-98 Ø4.97}
85.2% sRGB (Argyll 1.6.3 3D)
55.2% AdobeRGB 1998 (Argyll 1.6.3 3D)
62.5% AdobeRGB 1998 (Argyll 3D)
85.4% sRGB (Argyll 3D)
60.9% Display P3 (Argyll 3D)
Gamma: 2.16
CCT: 6320 K
| Asus Zenbook UX303UB-DH74T 13.3", 3200x1800 | Asus Zenbook UX303UB-R4100T 13.3", 1920x1080 | Asus Zenbook UX305LA-FC012H 13.3", 1920x1080 | HP Spectre x360 13-4104ng 13.3", 2560x1440 | HP Envy 13-d000ng 13.3", 3200x1800 | Dell XPS 13 2016 i7 256GB QHD 13.3", 3200x1800 | |
|---|---|---|---|---|---|---|
| Display | 9% | 5% | 9% | 4% | 6% | |
| Display P3 Coverage (%) | 60.9 | 66.9 10% | 63.9 5% | 66.8 10% | 64 5% | 63.6 4% |
| sRGB Coverage (%) | 85.4 | 92.3 8% | 91.6 7% | 92.8 9% | 88.8 4% | 93.6 10% |
| AdobeRGB 1998 Coverage (%) | 62.5 | 67.6 8% | 65 4% | 67.3 8% | 65 4% | 65.5 5% |
| Response Times | -25% | 47% | 22% | 14% | ||
| Response Time Grey 50% / Grey 80% * (ms) | 44.4 ? | 68 ? -53% | 24 ? 46% | 37.6 ? 15% | 40 ? 10% | |
| Response Time Black / White * (ms) | 36 ? | 35 ? 3% | 19 ? 47% | 26 ? 28% | 30 ? 17% | |
| PWM Frequency (Hz) | 1389 | 178 ? | 1316 ? | 4900 ? | ||
| Screen | 46% | 54% | 40% | 21% | 59% | |
| Brightness middle (cd/m²) | 291.4 | 385 32% | 349 20% | 324 11% | 291 0% | 285 -2% |
| Brightness (cd/m²) | 270 | 394 46% | 338 25% | 324 20% | 276 2% | 281 4% |
| Brightness Distribution (%) | 84 | 89 6% | 87 4% | 90 7% | 82 -2% | 90 7% |
| Black Level * (cd/m²) | 0.954 | 0.41 57% | 0.25 74% | 0.34 64% | 0.63 34% | 0.18 81% |
| Contrast (:1) | 305 | 939 208% | 1396 358% | 953 212% | 462 51% | 1583 419% |
| Colorchecker dE 2000 * | 4.63 | 3.84 17% | 5.49 -19% | 4.36 6% | 2.76 40% | 4.89 -6% |
| Greyscale dE 2000 * | 5.65 | 3.79 33% | 5.43 4% | 4.62 18% | 2.61 54% | 5.16 9% |
| Gamma | 2.16 102% | 2.23 99% | 2.17 101% | 2.18 101% | 2.31 95% | 2.15 102% |
| CCT | 6320 103% | 6499 100% | 7055 92% | 6857 95% | 6731 97% | 7106 91% |
| Color Space (Percent of AdobeRGB 1998) (%) | 55.2 | 60 9% | 60 9% | 60 9% | 57.5 4% | 59 7% |
| Color Space (Percent of sRGB) (%) | 85.2 | 92 8% | 92 8% | 93 9% | 88.7 4% | 93 9% |
| Media totale (Programma / Settaggio) | 10% /
28% | 30% /
42% | 32% /
34% | 16% /
17% | 26% /
41% |
* ... Meglio usare valori piccoli
Tempi di risposta del Display
| ↔ Tempi di risposta dal Nero al Bianco | ||
|---|---|---|
| 36 ms ... aumenta ↗ e diminuisce ↘ combinato | ↗ 15.6 ms Incremento | 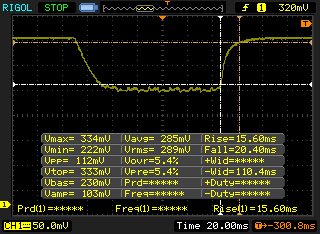 |
| ↘ 20.4 ms Calo | ||
| Lo schermo mostra tempi di risposta lenti nei nostri tests e sarà insoddisfacente per i gamers. In confronto, tutti i dispositivi di test variano da 0.1 (minimo) a 240 (massimo) ms. » 94 % di tutti i dispositivi è migliore. Questo significa che i tempi di risposta rilevati sono peggiori rispetto alla media di tutti i dispositivi testati (19.8 ms). | ||
| ↔ Tempo di risposta dal 50% Grigio all'80% Grigio | ||
| 44.4 ms ... aumenta ↗ e diminuisce ↘ combinato | ↗ 19.6 ms Incremento | 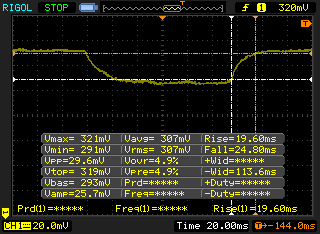 |
| ↘ 24.8 ms Calo | ||
| Lo schermo mostra tempi di risposta lenti nei nostri tests e sarà insoddisfacente per i gamers. In confronto, tutti i dispositivi di test variano da 0.165 (minimo) a 636 (massimo) ms. » 76 % di tutti i dispositivi è migliore. Questo significa che i tempi di risposta rilevati sono peggiori rispetto alla media di tutti i dispositivi testati (31 ms). | ||
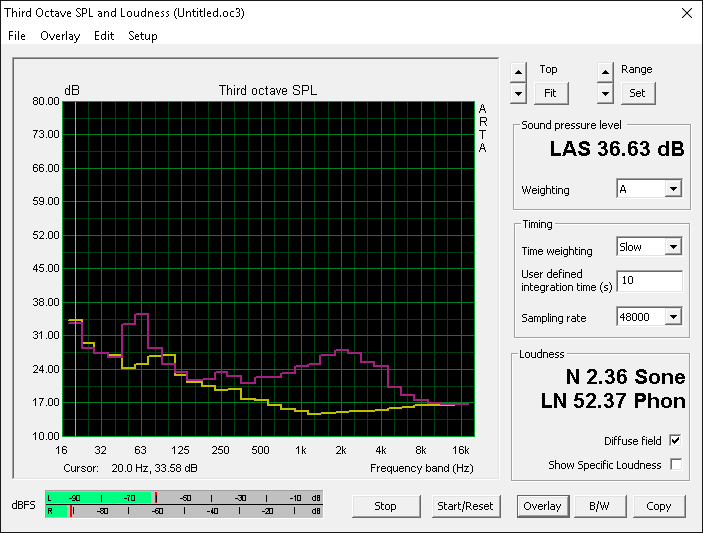
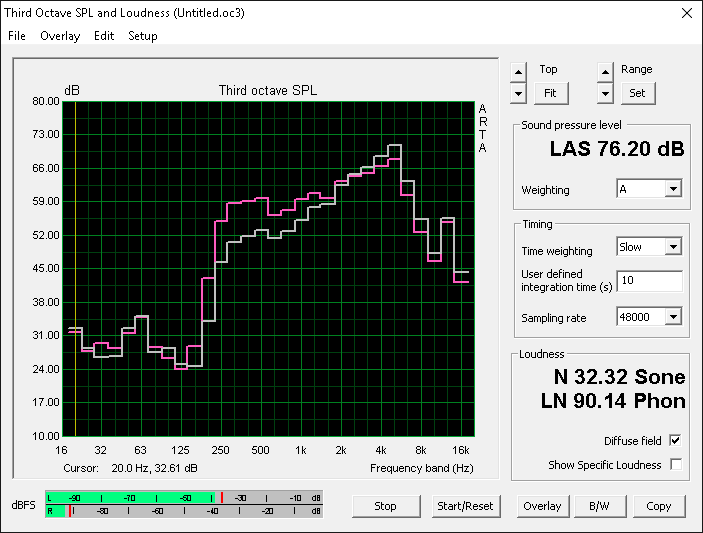
Sfarfallio dello schermo / PWM (Pulse-Width Modulation)
| flickering dello schermo / PWM rilevato | 1389 Hz | 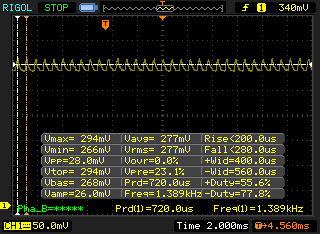 | |
Il display sfarfalla a 1389 Hz (Probabilmente a causa dell'uso di PWM) . La frequenza di 1389 Hz è abbastanza alta, quindi la maggioranza degli utenti sensibili al PWM non dovrebbero notare alcun flickering. In confronto: 52 % di tutti i dispositivi testati non utilizza PWM per ridurre la luminosita' del display. Se è rilevato PWM, una media di 7747 (minimo: 5 - massimo: 343500) Hz è stata rilevata. | |||
| Cinebench R15 | |
| CPU Single 64Bit (ordina per valore) | |
| Asus Zenbook UX303UB-DH74T | |
| Eurocom Shark 4 | |
| HP EliteBook Folio 1040 G2 | |
| Dell Inspiron 17 5759-5118 | |
| Toshiba Tecra Z40 A-147 | |
| CPU Multi 64Bit (ordina per valore) | |
| Asus Zenbook UX303UB-DH74T | |
| Eurocom Shark 4 | |
| HP EliteBook Folio 1040 G2 | |
| Dell Inspiron 17 5759-5118 | |
| Toshiba Tecra Z40 A-147 | |
| Cinebench R11.5 | |
| CPU Single 64Bit (ordina per valore) | |
| Asus Zenbook UX303UB-DH74T | |
| Eurocom Shark 4 | |
| HP EliteBook Folio 1040 G2 | |
| Dell Inspiron 17 5759-5118 | |
| Toshiba Tecra Z40 A-147 | |
| CPU Multi 64Bit (ordina per valore) | |
| Asus Zenbook UX303UB-DH74T | |
| Eurocom Shark 4 | |
| HP EliteBook Folio 1040 G2 | |
| Dell Inspiron 17 5759-5118 | |
| Toshiba Tecra Z40 A-147 | |
| Cinebench R10 | |
| Rendering Multiple CPUs 32Bit (ordina per valore) | |
| Asus Zenbook UX303UB-DH74T | |
| Eurocom Shark 4 | |
| HP EliteBook Folio 1040 G2 | |
| Dell Inspiron 17 5759-5118 | |
| Rendering Single 32Bit (ordina per valore) | |
| Asus Zenbook UX303UB-DH74T | |
| Eurocom Shark 4 | |
| HP EliteBook Folio 1040 G2 | |
| Dell Inspiron 17 5759-5118 | |
| PCMark 7 - Score (ordina per valore) | |
| Asus Zenbook UX303UB-DH74T | |
| Apple MacBook Air 13 inch 2015-03 | |
| HP Spectre 13-4001ng x360 | |
| Dell XPS 13 2016 i7 256GB QHD | |
| Asus Zenbook UX305CA-EHM1 | |
| PCMark 7 Score | 5135 punti | |
| PCMark 8 Home Score Accelerated v2 | 2918 punti | |
| PCMark 8 Creative Score Accelerated v2 | 3837 punti | |
| PCMark 8 Work Score Accelerated v2 | 3862 punti | |
Aiuto | ||

| Asus Zenbook UX303UB-DH74T GeForce 940M, 6500U, CUK Cyclone SSD 1TB | Aorus X3 Plus v5 GeForce GTX 970M, 6700HQ, Samsung SM951 MZVPV512HDGL m.2 PCI-e | Dell XPS 13 2016 i7 256GB QHD HD Graphics 520, 6500U, Samsung PM951 NVMe MZ-VLV256D | Lenovo Yoga 900-13ISK 80MK HD Graphics 520, 6500U, Samsung SSD PM871 MZNLN512HCJH | Lenovo Ideapad Y700-17 80QK7709PB GeForce GTX 960M, 6700HQ, Samsung SSD 850 EVO 500GB | |
|---|---|---|---|---|---|
| AS SSD | 151% | 53% | 18% | 11% | |
| Copy Game MB/s (MB/s) | 392.8 | 927 136% | 298.7 -24% | ||
| Copy Program MB/s (MB/s) | 233.7 | 368.6 58% | 249.6 7% | ||
| Copy ISO MB/s (MB/s) | 382.5 | 1158 203% | 364.5 -5% | ||
| Score Total (Points) | 882 | 2652 201% | 1603 82% | 1129 28% | 853 -3% |
| Score Write (Points) | 373 | 630 69% | 391 5% | 429 15% | 279 -25% |
| Score Read (Points) | 333 | 1345 304% | 809 143% | 458 38% | 372 12% |
| Access Time Write * (ms) | 0.051 | 0.032 37% | 0.034 33% | 0.039 24% | 0.035 31% |
| Access Time Read * (ms) | 0.14 | 0.041 71% | 0.071 49% | 0.054 61% | 0.053 62% |
| 4K-64 Write (MB/s) | 261.1 | 368.3 41% | 263.7 1% | 303 16% | 138.6 -47% |
| 4K-64 Read (MB/s) | 256.9 | 1113 333% | 698 172% | 374.8 46% | 286 11% |
| 4K Write (MB/s) | 71.3 | 114 60% | 97.6 37% | 80.6 13% | 93.7 31% |
| 4K Read (MB/s) | 25.99 | 46.24 78% | 38.21 47% | 32.29 24% | 34.86 34% |
| Seq Write (MB/s) | 409.8 | 1474 260% | 301.2 -27% | 454.6 11% | 470.2 15% |
| Seq Read (MB/s) | 505 | 1859 268% | 735 46% | 505 0% | 514 2% |
* ... Meglio usare valori piccoli
| 3DMark 11 | |
| 1280x720 Performance GPU (ordina per valore) | |
| Asus Zenbook UX303UB-DH74T | |
| Nexoc M731III W670RBQ | |
| Microsoft Surface Pro 4 Core i7 | |
| Lenovo Flex 2 Pro-15 | |
| HP Envy 13-d000ng | |
| 1280x720 Performance (ordina per valore) | |
| Asus Zenbook UX303UB-DH74T | |
| Nexoc M731III W670RBQ | |
| Microsoft Surface Pro 4 Core i7 | |
| Lenovo Flex 2 Pro-15 | |
| HP Envy 13-d000ng | |
| 3DMark | |
| 1920x1080 Fire Strike Score (ordina per valore) | |
| Asus Zenbook UX303UB-DH74T | |
| Nexoc M731III W670RBQ | |
| Microsoft Surface Pro 4 Core i7 | |
| Lenovo Flex 2 Pro-15 | |
| HP Envy 13-d000ng | |
| 1280x720 Cloud Gate Standard Score (ordina per valore) | |
| Asus Zenbook UX303UB-DH74T | |
| Nexoc M731III W670RBQ | |
| Microsoft Surface Pro 4 Core i7 | |
| Lenovo Flex 2 Pro-15 | |
| HP Envy 13-d000ng | |
| 1280x720 Ice Storm Standard Score (ordina per valore) | |
| Asus Zenbook UX303UB-DH74T | |
| Nexoc M731III W670RBQ | |
| Microsoft Surface Pro 4 Core i7 | |
| Lenovo Flex 2 Pro-15 | |
| HP Envy 13-d000ng | |
| 3DMark 11 Performance | 2291 punti | |
| 3DMark Ice Storm Standard Score | 17839 punti | |
| 3DMark Cloud Gate Standard Score | 5995 punti | |
| 3DMark Fire Strike Score | 1347 punti | |
| 3DMark Fire Strike Extreme Score | 680 punti | |
Aiuto | ||
| basso | medio | alto | ultra | |
|---|---|---|---|---|
| Tomb Raider (2013) | 60.3 | 32.7 | 16.2 | |
| BioShock Infinite (2013) | 43.2 | 38.5 | 13.3 | |
| Metro: Last Light (2013) | 32.9 | 21.8 | 10.8 | |
| Thief (2014) | 23.9 | 19.3 | 8.9 | |
| Batman: Arkham Knight (2015) | 21 | |||
| Fallout 4 (2015) | 20 | 11 | 9 |
| Asus Zenbook UX303UB-DH74T GeForce 940M, 6500U, CUK Cyclone SSD 1TB | Lenovo Yoga 900-13ISK 80MK HD Graphics 520, 6500U, Samsung SSD PM871 MZNLN512HCJH | Dell XPS 13 2016 i7 256GB QHD HD Graphics 520, 6500U, Samsung PM951 NVMe MZ-VLV256D | HP Spectre 13-4001ng x360 HD Graphics 5500, 5500U, ADATA AXNS381E-256GM-B | Acer Aspire V3-372-50LK HD Graphics 520, 6200U, Toshiba HG6 THNSNJ256G8NU | |
|---|---|---|---|---|---|
| Noise | 3% | -2% | -0% | 3% | |
| Idle Minimum * (dB) | 29.8 | 29.7 -0% | 31.8 -7% | 29.6 1% | 31.5 -6% |
| Idle Average * (dB) | 29.8 | 29.8 -0% | 31.8 -7% | 29.6 1% | 31.5 -6% |
| Idle Maximum * (dB) | 29.8 | 30 -1% | 34.8 -17% | 29.6 1% | 31.5 -6% |
| Load Average * (dB) | 37.4 | 32 14% | 34.8 7% | 38.6 -3% | 32.4 13% |
| Load Maximum * (dB) | 40.3 | 38.5 4% | 34.8 14% | 41 -2% | 32.3 20% |
* ... Meglio usare valori piccoli
Rumorosità
| Idle |
| 29.8 / 29.8 / 29.8 dB(A) |
| Sotto carico |
| 37.4 / 40.3 dB(A) |
 | ||
30 dB silenzioso 40 dB(A) udibile 50 dB(A) rumoroso |
||
min: | ||
(±) La temperatura massima sul lato superiore è di 45 °C / 113 F, rispetto alla media di 35.9 °C / 97 F, che varia da 21.4 a 59 °C per questa classe Subnotebook.
(±) Il lato inferiore si riscalda fino ad un massimo di 42 °C / 108 F, rispetto alla media di 39.2 °C / 103 F
(+) In idle, la temperatura media del lato superiore è di 24.1 °C / 75 F, rispetto alla media deld ispositivo di 30.8 °C / 87 F.
(+) I poggiapolsi e il touchpad sono piu' freddi della temperatura della pelle con un massimo di 31.6 °C / 88.9 F e sono quindi freddi al tatto.
(-) La temperatura media della zona del palmo della mano di dispositivi simili e'stata di 28.2 °C / 82.8 F (-3.4 °C / -6.1 F).
| Asus Zenbook UX303UB-DH74T 50 Wh | Asus Zenbook UX303UB-R4100T 50 Wh | Lenovo Yoga 900-13ISK 80MK 66 Wh | HP Spectre x360 13-4104ng 56 Wh | HP Envy 13-d000ng 45 Wh | Dell XPS 13 2016 i7 256GB QHD 56 Wh | |
|---|---|---|---|---|---|---|
| Autonomia della batteria | 33% | 26% | 46% | -5% | 18% | |
| Reader / Idle (h) | 10.3 | 16.6 61% | 14.1 37% | 8.6 -17% | 13.1 27% | |
| WiFi v1.3 (h) | 5.7 | 6.8 19% | 6.7 18% | 8.3 46% | 5.4 -5% | 7.2 26% |
| Load (h) | 1.7 | 2 18% | 2.1 24% | 1.8 6% | 1.7 0% |
Pro
Contro

La serie Zenbook dispone ancora dei migliori Ultrabooks con nuove features come le cerniere a 360 gradi o la tastiera sganciabile. Questa configurazione QHD, tuttavia, fa un passo in avanti e uno indietro. Si, la migliore risoluzione è fantastica, ma serve più di un display. Fattori come retroilluminazione, contrasto, e precisione del colore sono peggiori rispetto all'FHD SKU. I tempi di risposta sono sotto la media, sebbene il display non utilizzi modulazione pulse-width per il controllo della luminosità. Infine l'autonomia stata aumentata come capacità e compensa lo schermo che consuma di più.
Non abbiamo lamentele per displays QHD o UHD. Tuttavia, una risoluzione così elevata va a discapito di altri fattori. Passando ad un meno costoso FHD Zenbook SKU potrebbe essere meglio per alcuni utenti.
Nota: si tratta di una recensione breve, con alcune sezioni non tradotte, per la versione integrale in inglese guardate qui.
Asus Zenbook UX303UB-DH74T
- 01/12/2016 v4.1 (old)
Allen Ngo
Price comparison
