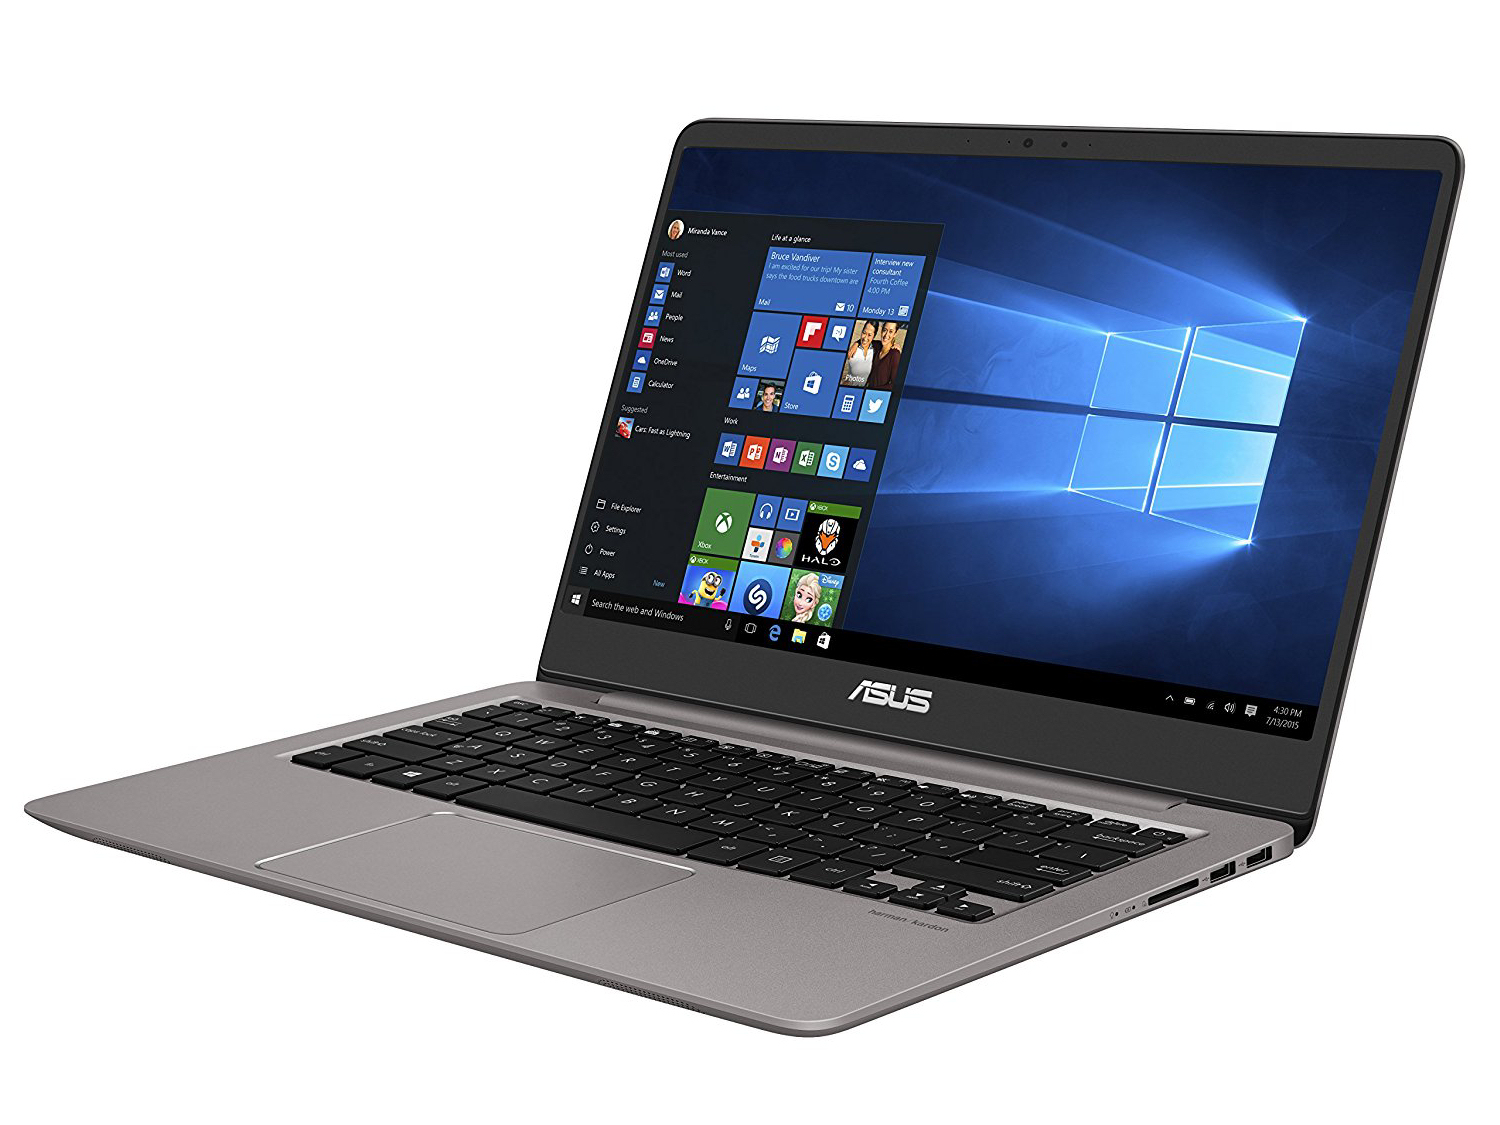
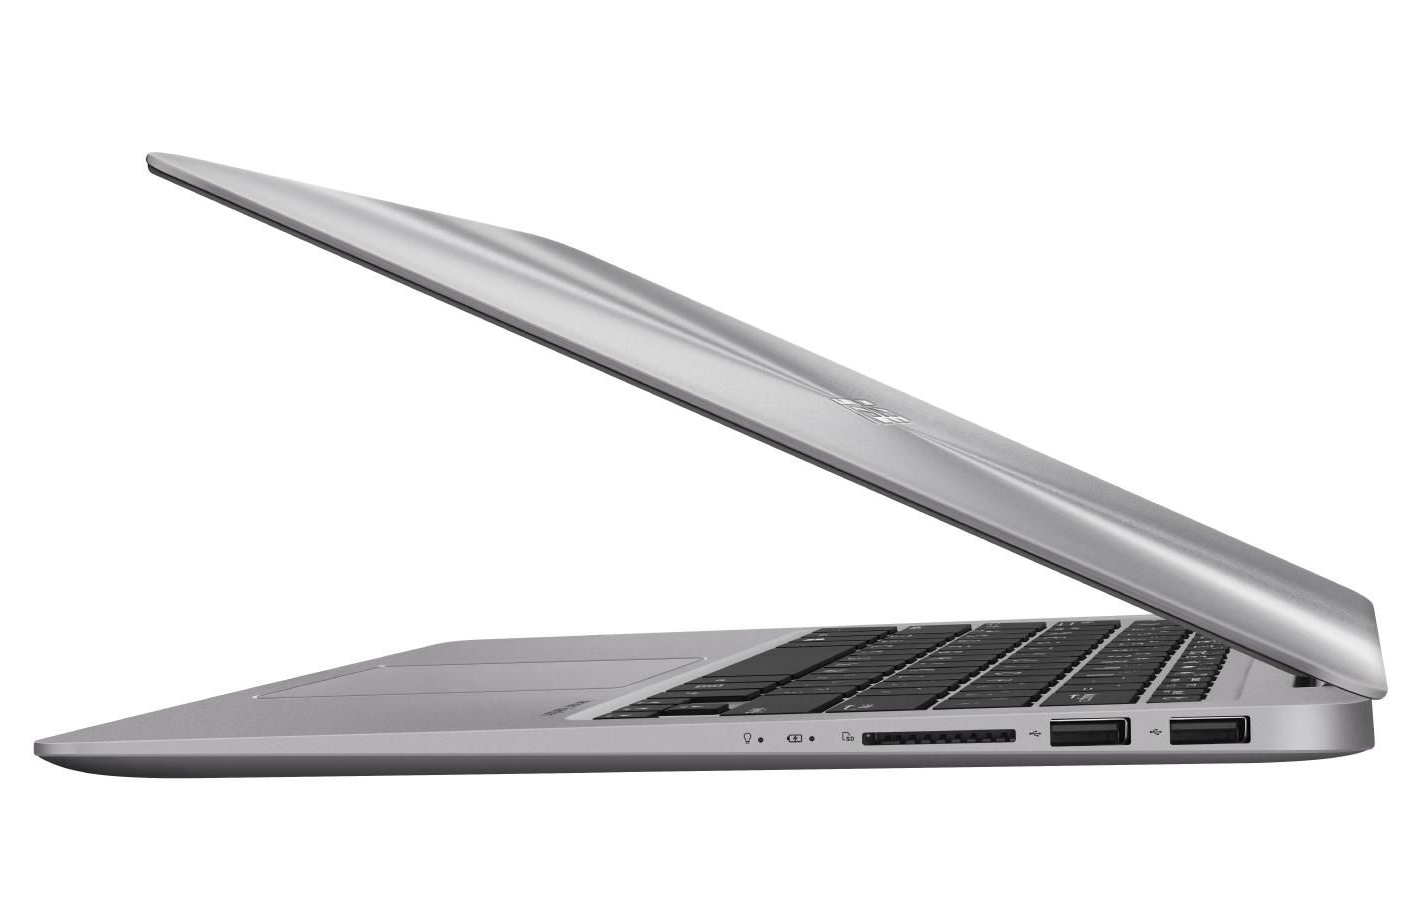
Recensione breve del Portatile Asus ZenBook UX3410UQ (7500U, 940MX, Full HD)
| SD Card Reader | |
| average JPG Copy Test (av. of 3 runs) | |
| Acer Swift 5 SF514-51-59AV | |
| Lenovo ThinkPad X1 Carbon 2017-20HQS03P00 | |
| Asus Zenbook UX3410UQ-GV077T | |
| Asus UX310UQ-FC396T | |
| Asus Zenbook UX3410UA | |
| Acer TravelMate X349-G2 | |
| maximum AS SSD Seq Read Test (1GB) | |
| Acer Swift 5 SF514-51-59AV | |
| Lenovo ThinkPad X1 Carbon 2017-20HQS03P00 | |
| Asus Zenbook UX3410UQ-GV077T | |
| Asus Zenbook UX3410UA | |
| Asus UX310UQ-FC396T | |
| Acer TravelMate X349-G2 | |
| Networking | |
| iperf3 transmit AX12 | |
| Acer TravelMate X349-G2 | |
| HP Spectre 13-v131ng | |
| Asus UX310UQ-FC396T (jseb) | |
| Apple MacBook Pro 13 2016 (Klaus I211) | |
| Lenovo ThinkPad X1 Carbon 2017-20HQS03P00 | |
| Asus Zenbook UX3410UQ-GV077T | |
| Asus Zenbook UX3410UA | |
| iperf3 receive AX12 | |
| Apple MacBook Pro 13 2016 (Klaus I211) | |
| Asus Zenbook UX3410UQ-GV077T | |
| Lenovo ThinkPad X1 Carbon 2017-20HQS03P00 | |
| Acer TravelMate X349-G2 | |
| Asus UX310UQ-FC396T (jseb) | |
| HP Spectre 13-v131ng | |
| Asus Zenbook UX3410UA | |
| |||||||||||||||||||||||||
Distribuzione della luminosità: 84 %
Al centro con la batteria: 381 cd/m²
Contrasto: 1270:1 (Nero: 0.3 cd/m²)
ΔE ColorChecker Calman: 2.84 | ∀{0.5-29.43 Ø4.71}
ΔE Greyscale Calman: 4.02 | ∀{0.09-98 Ø4.96}
86% sRGB (Argyll 1.6.3 3D)
56% AdobeRGB 1998 (Argyll 1.6.3 3D)
69.3% AdobeRGB 1998 (Argyll 3D)
99.2% sRGB (Argyll 3D)
67.2% Display P3 (Argyll 3D)
Gamma: 2.42
CCT: 7430 K
| Asus Zenbook UX3410UQ-GV077T IPS, 1920x1080, 14" | Asus Zenbook UX3410UA IPS, 1920x1080, 14" | Acer TravelMate X349-G2 IPS, 1920x1080, 14" | Acer Swift 5 SF514-51-59AV IPS, 1920x1080, 14" | Lenovo ThinkPad X1 Carbon 2017-20HQS03P00 IPS, 1920x1080, 14" | Apple MacBook Pro 13 2016 2560x1600, 13.3" | HP Spectre 13-v131ng IPS UWVA, 1920x1080, 13.3" | |
|---|---|---|---|---|---|---|---|
| Display | 0% | -38% | -7% | -11% | 23% | -7% | |
| Display P3 Coverage (%) | 67.2 | 67.7 1% | 41.81 -38% | 62.8 -7% | 61.4 -9% | 97.1 44% | 64.6 -4% |
| sRGB Coverage (%) | 99.2 | 99.1 0% | 62.3 -37% | 91.3 -8% | 85.9 -13% | 99.8 1% | 88.8 -10% |
| AdobeRGB 1998 Coverage (%) | 69.3 | 69.4 0% | 43.26 -38% | 64.3 -7% | 62.4 -10% | 86.7 25% | 64.8 -6% |
| Response Times | 4% | -4% | -7% | -2% | -43% | -10% | |
| Response Time Grey 50% / Grey 80% * (ms) | 44 ? | 33 ? 25% | 43 ? 2% | 51 ? -16% | 41.6 ? 5% | 47.2 ? -7% | 46 ? -5% |
| Response Time Black / White * (ms) | 29 ? | 34 ? -17% | 32 ? -10% | 28 ? 3% | 31.6 ? -9% | 51.6 ? -78% | 33 ? -14% |
| PWM Frequency (Hz) | 60 ? | 25000 ? | |||||
| Screen | -2% | -36% | -26% | -20% | 21% | -20% | |
| Brightness middle (cd/m²) | 381 | 376 -1% | 271 -29% | 393 3% | 311 -18% | 600 57% | 404 6% |
| Brightness (cd/m²) | 368 | 355 -4% | 253 -31% | 338 -8% | 288 -22% | 564 53% | 382 4% |
| Brightness Distribution (%) | 84 | 87 4% | 83 -1% | 79 -6% | 85 1% | 89 6% | 91 8% |
| Black Level * (cd/m²) | 0.3 | 0.32 -7% | 0.35 -17% | 0.29 3% | 0.24 20% | 0.57 -90% | 0.35 -17% |
| Contrast (:1) | 1270 | 1175 -7% | 774 -39% | 1355 7% | 1296 2% | 1053 -17% | 1154 -9% |
| Colorchecker dE 2000 * | 2.84 | 3.2 -13% | 5.05 -78% | 6.17 -117% | 5.5 -94% | 1.5 47% | 5.37 -89% |
| Colorchecker dE 2000 max. * | 6.5 | 7.1 -9% | 11.74 -81% | 11.21 -72% | 9 -38% | 2.9 55% | 9.46 -46% |
| Greyscale dE 2000 * | 4.02 | 4.4 -9% | 4.3 -7% | 6.8 -69% | 6.2 -54% | 2 50% | 6.44 -60% |
| Gamma | 2.42 91% | 2.12 104% | 2.44 90% | 2.27 97% | 2.02 109% | 2.27 97% | 2.52 87% |
| CCT | 7430 87% | 7440 87% | 6726 97% | 6873 95% | 5950 109% | 6855 95% | 6738 96% |
| Color Space (Percent of AdobeRGB 1998) (%) | 56 | 63.78 14% | 42 -25% | 51 -9% | 55.96 0% | 77 38% | 58 4% |
| Color Space (Percent of sRGB) (%) | 86 | 98.98 15% | 39 -55% | 91 6% | 85.77 0% | 92 7% | 89 3% |
| Media totale (Programma / Settaggio) | 1% /
-1% | -26% /
-32% | -13% /
-20% | -11% /
-16% | 0% /
13% | -12% /
-16% |
* ... Meglio usare valori piccoli
Sfarfallio dello schermo / PWM (Pulse-Width Modulation)
| flickering dello schermo / PWM rilevato | 60 Hz | ≤ 30 % settaggio luminosita' | 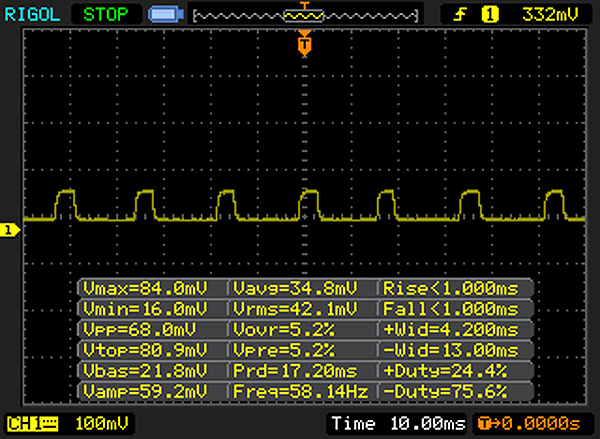 |
Il display sfarfalla a 60 Hz (Probabilmente a causa dell'uso di PWM) Flickering rilevato ad una luminosita' di 30 % o inferiore. Non dovrebbe verificarsi flickering o PWM sopra questo valore di luminosita'. La frequenza di 60 Hz è molto bassa, quindi il flickering potrebbe causare stanchezza agli occhi e mal di testa con un utilizzo prolungato. In confronto: 52 % di tutti i dispositivi testati non utilizza PWM per ridurre la luminosita' del display. Se è rilevato PWM, una media di 7754 (minimo: 5 - massimo: 343500) Hz è stata rilevata. | |||
Tempi di risposta del Display
| ↔ Tempi di risposta dal Nero al Bianco | ||
|---|---|---|
| 29 ms ... aumenta ↗ e diminuisce ↘ combinato | ↗ 17 ms Incremento | 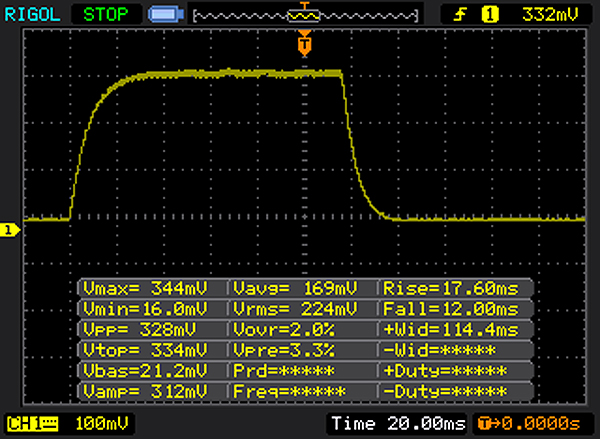 |
| ↘ 12 ms Calo | ||
| Lo schermo mostra tempi di risposta relativamente lenti nei nostri tests e potrebbe essere troppo lento per i gamers. In confronto, tutti i dispositivi di test variano da 0.1 (minimo) a 240 (massimo) ms. » 77 % di tutti i dispositivi è migliore. Questo significa che i tempi di risposta rilevati sono peggiori rispetto alla media di tutti i dispositivi testati (19.8 ms). | ||
| ↔ Tempo di risposta dal 50% Grigio all'80% Grigio | ||
| 44 ms ... aumenta ↗ e diminuisce ↘ combinato | ↗ 24 ms Incremento | 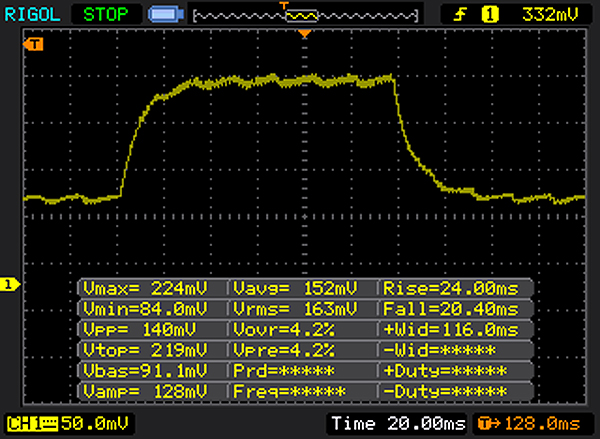 |
| ↘ 20 ms Calo | ||
| Lo schermo mostra tempi di risposta lenti nei nostri tests e sarà insoddisfacente per i gamers. In confronto, tutti i dispositivi di test variano da 0.165 (minimo) a 636 (massimo) ms. » 73 % di tutti i dispositivi è migliore. Questo significa che i tempi di risposta rilevati sono peggiori rispetto alla media di tutti i dispositivi testati (31 ms). | ||
| Cinebench R10 | |
| Rendering Multiple CPUs 32Bit | |
| Asus UX310UQ-FC396T | |
| Asus Zenbook UX3410UQ-GV077T | |
| HP Spectre 13-v131ng | |
| Apple MacBook Pro 13 2016 | |
| Rendering Single 32Bit | |
| Asus Zenbook UX3410UQ-GV077T | |
| HP Spectre 13-v131ng | |
| Asus UX310UQ-FC396T | |
| Apple MacBook Pro 13 2016 | |
| Geekbench 3 | |
| 32 Bit Multi-Core Score | |
| Asus Zenbook UX3410UQ-GV077T | |
| 32 Bit Single-Core Score | |
| Asus Zenbook UX3410UQ-GV077T | |
| Geekbench 4.0 | |
| 64 Bit Multi-Core Score | |
| Asus Zenbook UX3410UQ-GV077T | |
| Apple MacBook Pro 13 2016 | |
| Apple MacBook Pro 13 2016 | |
| 64 Bit Single-Core Score | |
| Asus Zenbook UX3410UQ-GV077T | |
| Apple MacBook Pro 13 2016 | |
| Apple MacBook Pro 13 2016 | |
| Geekbench 4.4 | |
| 64 Bit Multi-Core Score | |
| Asus Zenbook UX3410UQ-GV077T | |
| 64 Bit Single-Core Score | |
| Asus Zenbook UX3410UQ-GV077T | |
| PCMark 8 Home Score Accelerated v2 | 3923 punti | |
Aiuto | ||

| Asus Zenbook UX3410UQ-GV077T SanDisk SD8SNAT256G1002 | Asus Zenbook UX3410UA SanDisk SD8SN8U512G1002 | Acer TravelMate X349-G2 Intel SSD 600p SSDPEKKW512G7 | Acer Swift 5 SF514-51-59AV SK Hynix HFS256G39TND-N210A | Lenovo ThinkPad X1 Carbon 2017-20HQS03P00 Samsung PM961 NVMe MZVLW512HMJP | Apple MacBook Pro 13 2016 Apple SSD AP0256 | HP Spectre 13-v131ng Samsung PM961 NVMe MZVLW512HMJP | |
|---|---|---|---|---|---|---|---|
| CrystalDiskMark 3.0 | 29% | 125% | 13% | 218% | 168% | 158% | |
| Read Seq (MB/s) | 497 | 494.5 -1% | 1818 266% | 517 4% | 1827 268% | 1345 171% | 1090 119% |
| Write Seq (MB/s) | 323.7 | 461.7 43% | 582 80% | 258.1 -20% | 1383 327% | 1320 308% | 1088 236% |
| Read 512 (MB/s) | 289 | 328 13% | 1134 292% | 355 23% | 814 182% | 831 188% | 753 161% |
| Write 512 (MB/s) | 288 | 419.7 46% | 586 103% | 258.5 -10% | 1098 281% | 1486 416% | 911 216% |
| Read 4k (MB/s) | 22.78 | 27.53 21% | 34.93 53% | 29.65 30% | 61 168% | 31.68 39% | 57.5 152% |
| Write 4k (MB/s) | 79.5 | 56.5 -29% | 133.4 68% | 77.3 -3% | 172.2 117% | 11.02 -86% | 140.2 76% |
| Read 4k QD32 (MB/s) | 147 | 351 139% | 373.7 154% | 277.1 89% | 601 309% | 533 263% | 497.1 238% |
| Write 4k QD32 (MB/s) | 257.2 | 249.3 -3% | 210.8 -18% | 242.5 -6% | 495.6 93% | 362 41% | 416 62% |
| 3DMark 11 Performance | 2205 punti | |
Aiuto | ||
| basso | medio | alto | ultra | |
|---|---|---|---|---|
| BioShock Infinite (2013) | 83.8 | 45.4 | 37.4 | 13.2 |
Rumorosità
| Idle |
| 30 / 30 / 31.1 dB(A) |
| HDD |
| 31 dB(A) |
| Sotto carico |
| 32.2 / 37.6 dB(A) |
 | ||
30 dB silenzioso 40 dB(A) udibile 50 dB(A) rumoroso |
||
min: | ||
(+) La temperatura massima sul lato superiore è di 34.1 °C / 93 F, rispetto alla media di 35.9 °C / 97 F, che varia da 21.4 a 59 °C per questa classe Subnotebook.
(+) Il lato inferiore si riscalda fino ad un massimo di 38.3 °C / 101 F, rispetto alla media di 39.2 °C / 103 F
(+) In idle, la temperatura media del lato superiore è di 21.4 °C / 71 F, rispetto alla media deld ispositivo di 30.8 °C / 87 F.
(+) I poggiapolsi e il touchpad sono piu' freddi della temperatura della pelle con un massimo di 28.2 °C / 82.8 F e sono quindi freddi al tatto.
(±) La temperatura media della zona del palmo della mano di dispositivi simili e'stata di 28.2 °C / 82.8 F (0 °C / 0 F).
Asus Zenbook UX3410UQ-GV077T analisi audio
(±) | potenza degli altiparlanti media ma buona (73 dB)
Bassi 100 - 315 Hz
(±) | bassi ridotti - in media 12% inferiori alla media
(+) | bassi in lineaa (4.5% delta rispetto alla precedente frequenza)
Medi 400 - 2000 Hz
(±) | medi elevati - circa 6.5% superiore alla media
(+) | medi lineari (6.7% delta rispetto alla precedente frequenza)
Alti 2 - 16 kHz
(+) | Alti bilanciati - appena 3.9% dalla media
(+) | alti lineari (4.8% delta rispetto alla precedente frequenza)
Nel complesso 100 - 16.000 Hz
(±) | la linearità complessiva del suono è media (17% di differenza rispetto alla media
Rispetto alla stessa classe
» 44% di tutti i dispositivi testati in questa classe è stato migliore, 8% simile, 49% peggiore
» Il migliore ha avuto un delta di 5%, medio di 18%, peggiore di 53%
Rispetto a tutti i dispositivi testati
» 31% di tutti i dispositivi testati in questa classe è stato migliore, 8% similare, 61% peggiore
» Il migliore ha avuto un delta di 4%, medio di 23%, peggiore di 134%
Apple MacBook 12 (Early 2016) 1.1 GHz analisi audio
(+) | gli altoparlanti sono relativamente potenti (83.6 dB)
Bassi 100 - 315 Hz
(±) | bassi ridotti - in media 11.3% inferiori alla media
(±) | la linearità dei bassi è media (14.2% delta rispetto alla precedente frequenza)
Medi 400 - 2000 Hz
(+) | medi bilanciati - solo only 2.4% rispetto alla media
(+) | medi lineari (5.5% delta rispetto alla precedente frequenza)
Alti 2 - 16 kHz
(+) | Alti bilanciati - appena 2% dalla media
(+) | alti lineari (4.5% delta rispetto alla precedente frequenza)
Nel complesso 100 - 16.000 Hz
(+) | suono nel complesso lineare (10.2% differenza dalla media)
Rispetto alla stessa classe
» 7% di tutti i dispositivi testati in questa classe è stato migliore, 2% simile, 90% peggiore
» Il migliore ha avuto un delta di 5%, medio di 18%, peggiore di 53%
Rispetto a tutti i dispositivi testati
» 5% di tutti i dispositivi testati in questa classe è stato migliore, 1% similare, 94% peggiore
» Il migliore ha avuto un delta di 4%, medio di 23%, peggiore di 134%
| Off / Standby | |
| Idle | |
| Sotto carico |
|
Leggenda:
min: | |
Pro
Contro
Asus ha montato sul suo ZenBook un processore Core-i7 della generazione Kaby-Lake. Unitamente alla scheda grafica GeForce 940MX, il computer offre prestazioni adeguate anche per applicazioni che non siano da ufficio ed internet. Il core grafico GeForce è la principale differenza rispetto allo ZenBook UX3410UA che abbiamo già testato, che non aveva una GPU dedicata.
Potreste essere preoccupati dalla presenza di una scheda grafica aggiuntiva rispetto alla rumorosità ed alla minore autonomia. Ma non possiamo confermarlo.
Nel complesso, l'UX3410UQ è più silenzioso dell'UX3410UA ed ha una migliore autonomia nel nostro test pratico WLAN.
Un SSD garantisce un sistema scattante. In aggiunta, c'è un hard drive convenzionale da 2.5" (1 TB) come spazio da archiviazione. Entrambi i dispositivi possono essere scambiati. Tuttavia, se volete farlo dovete aprire il case. Il display matto IPS piace per la sua elevata luminosità, per il contrasto e per gli angoli di visuale stabili.
Nota: si tratta di una recensione breve, con alcune sezioni non tradotte, per la versione integrale in inglese guardate qui.
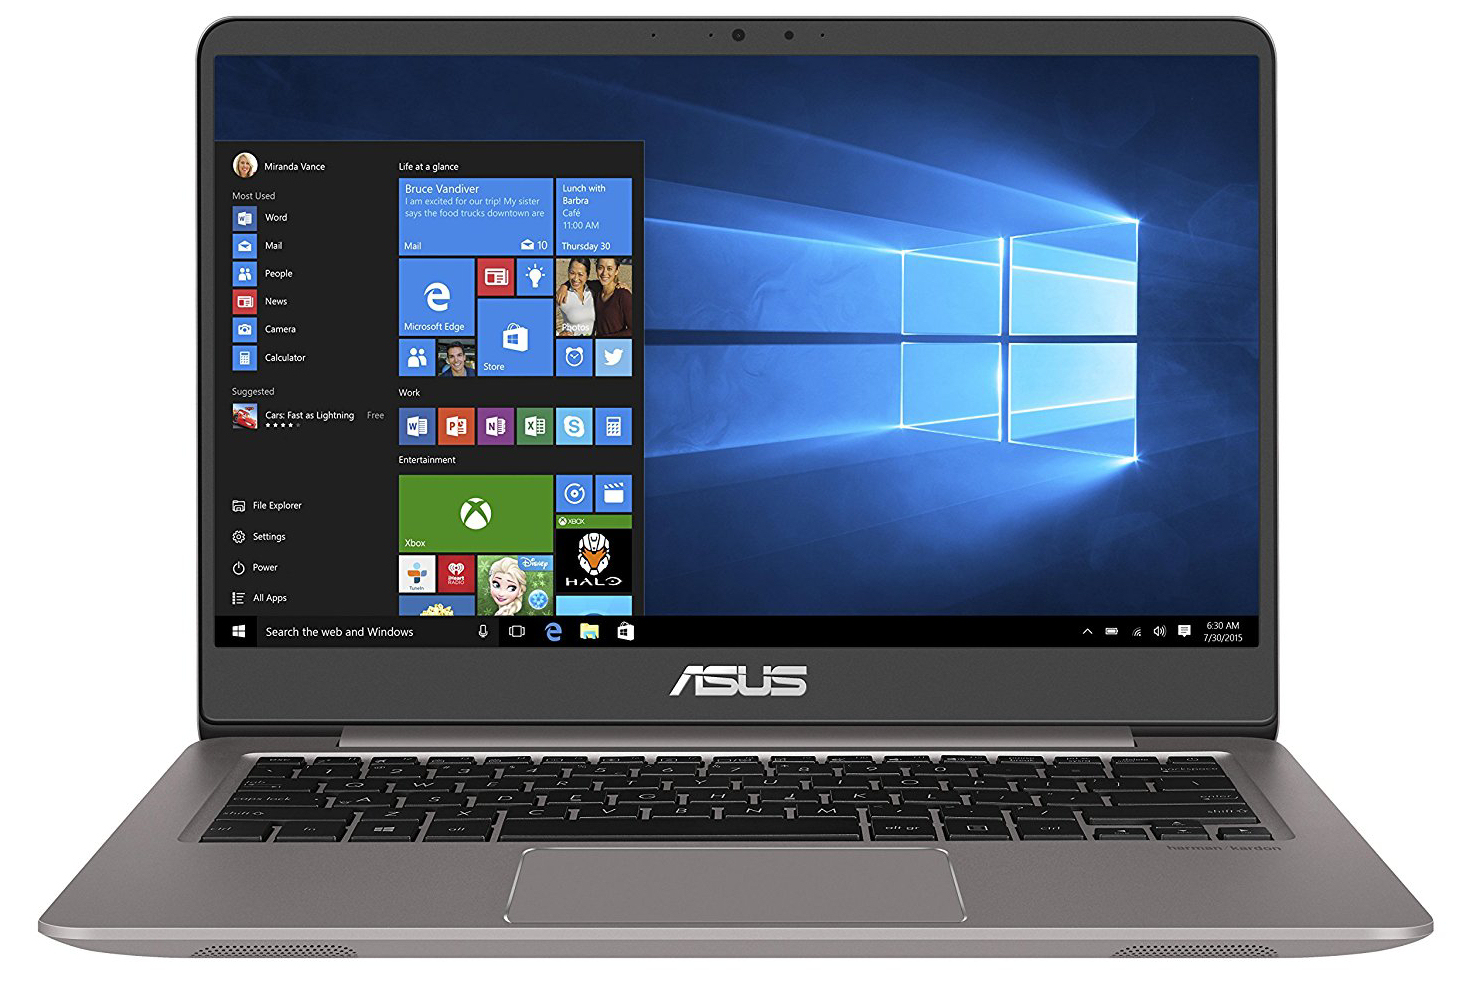
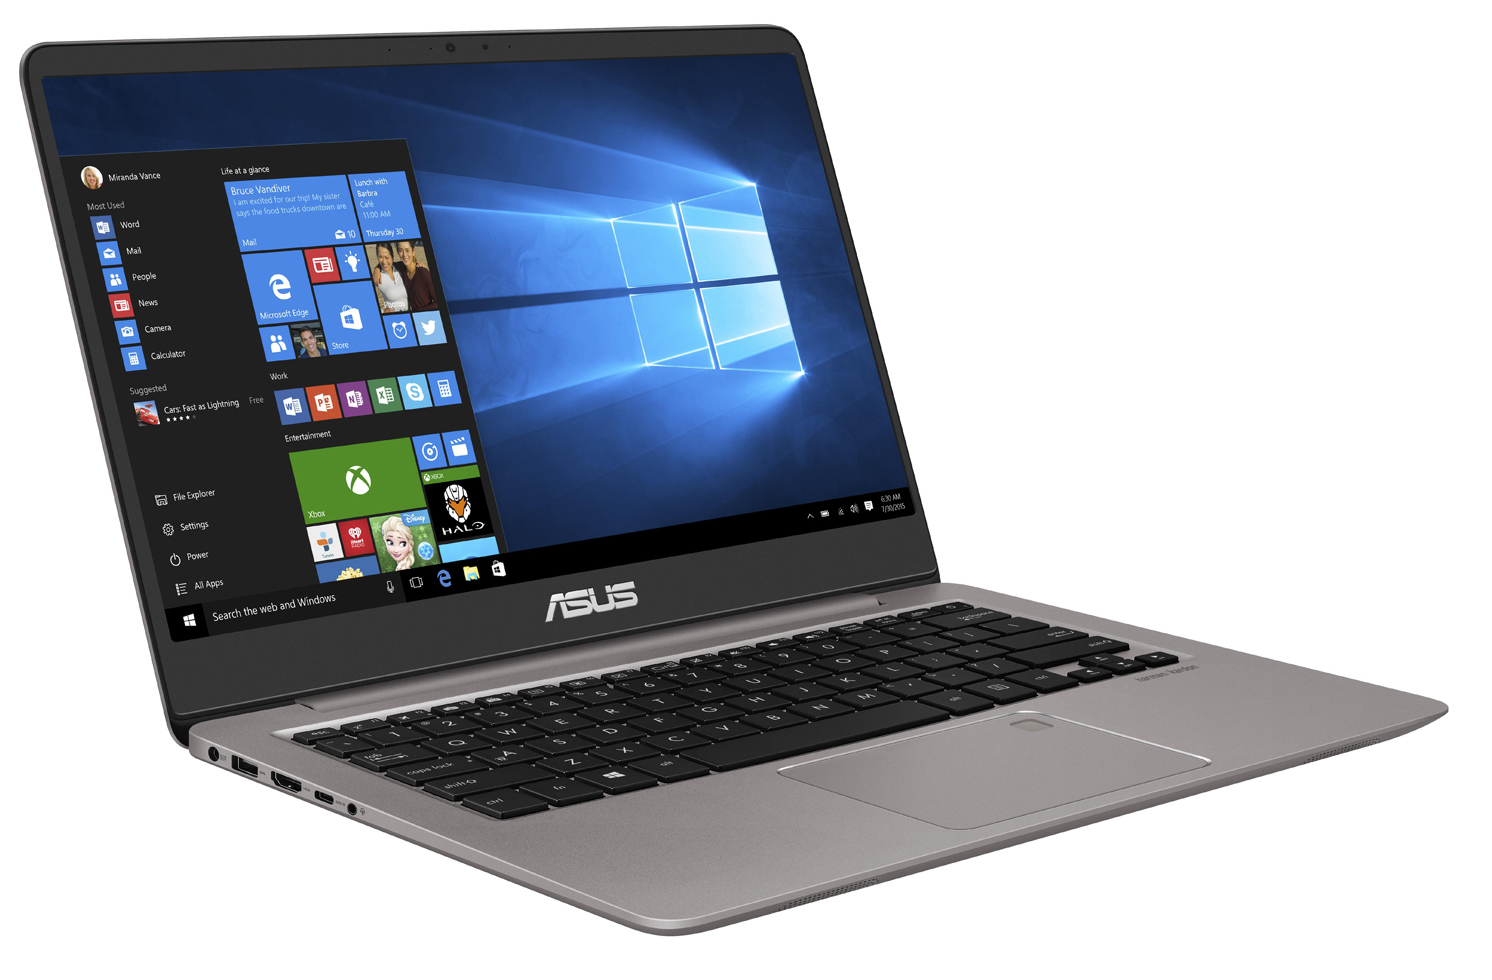
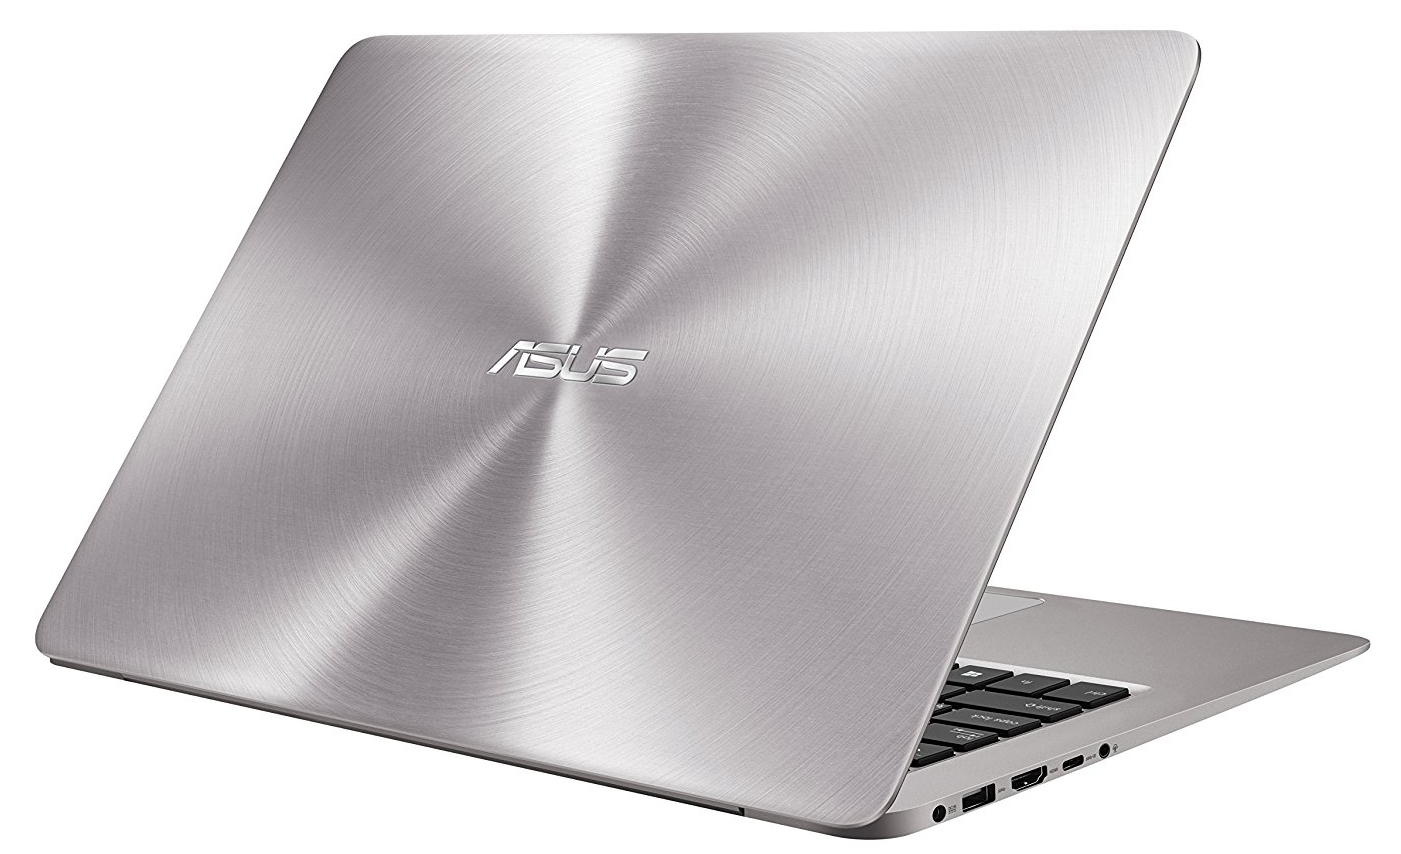
Asus Zenbook UX3410UQ-GV077T
- 05/17/2017 v6 (old)
Sascha Mölck