Recensione breve del Portatile Asus ZenBook UX310UQ (7500U, 940MX, Full HD)

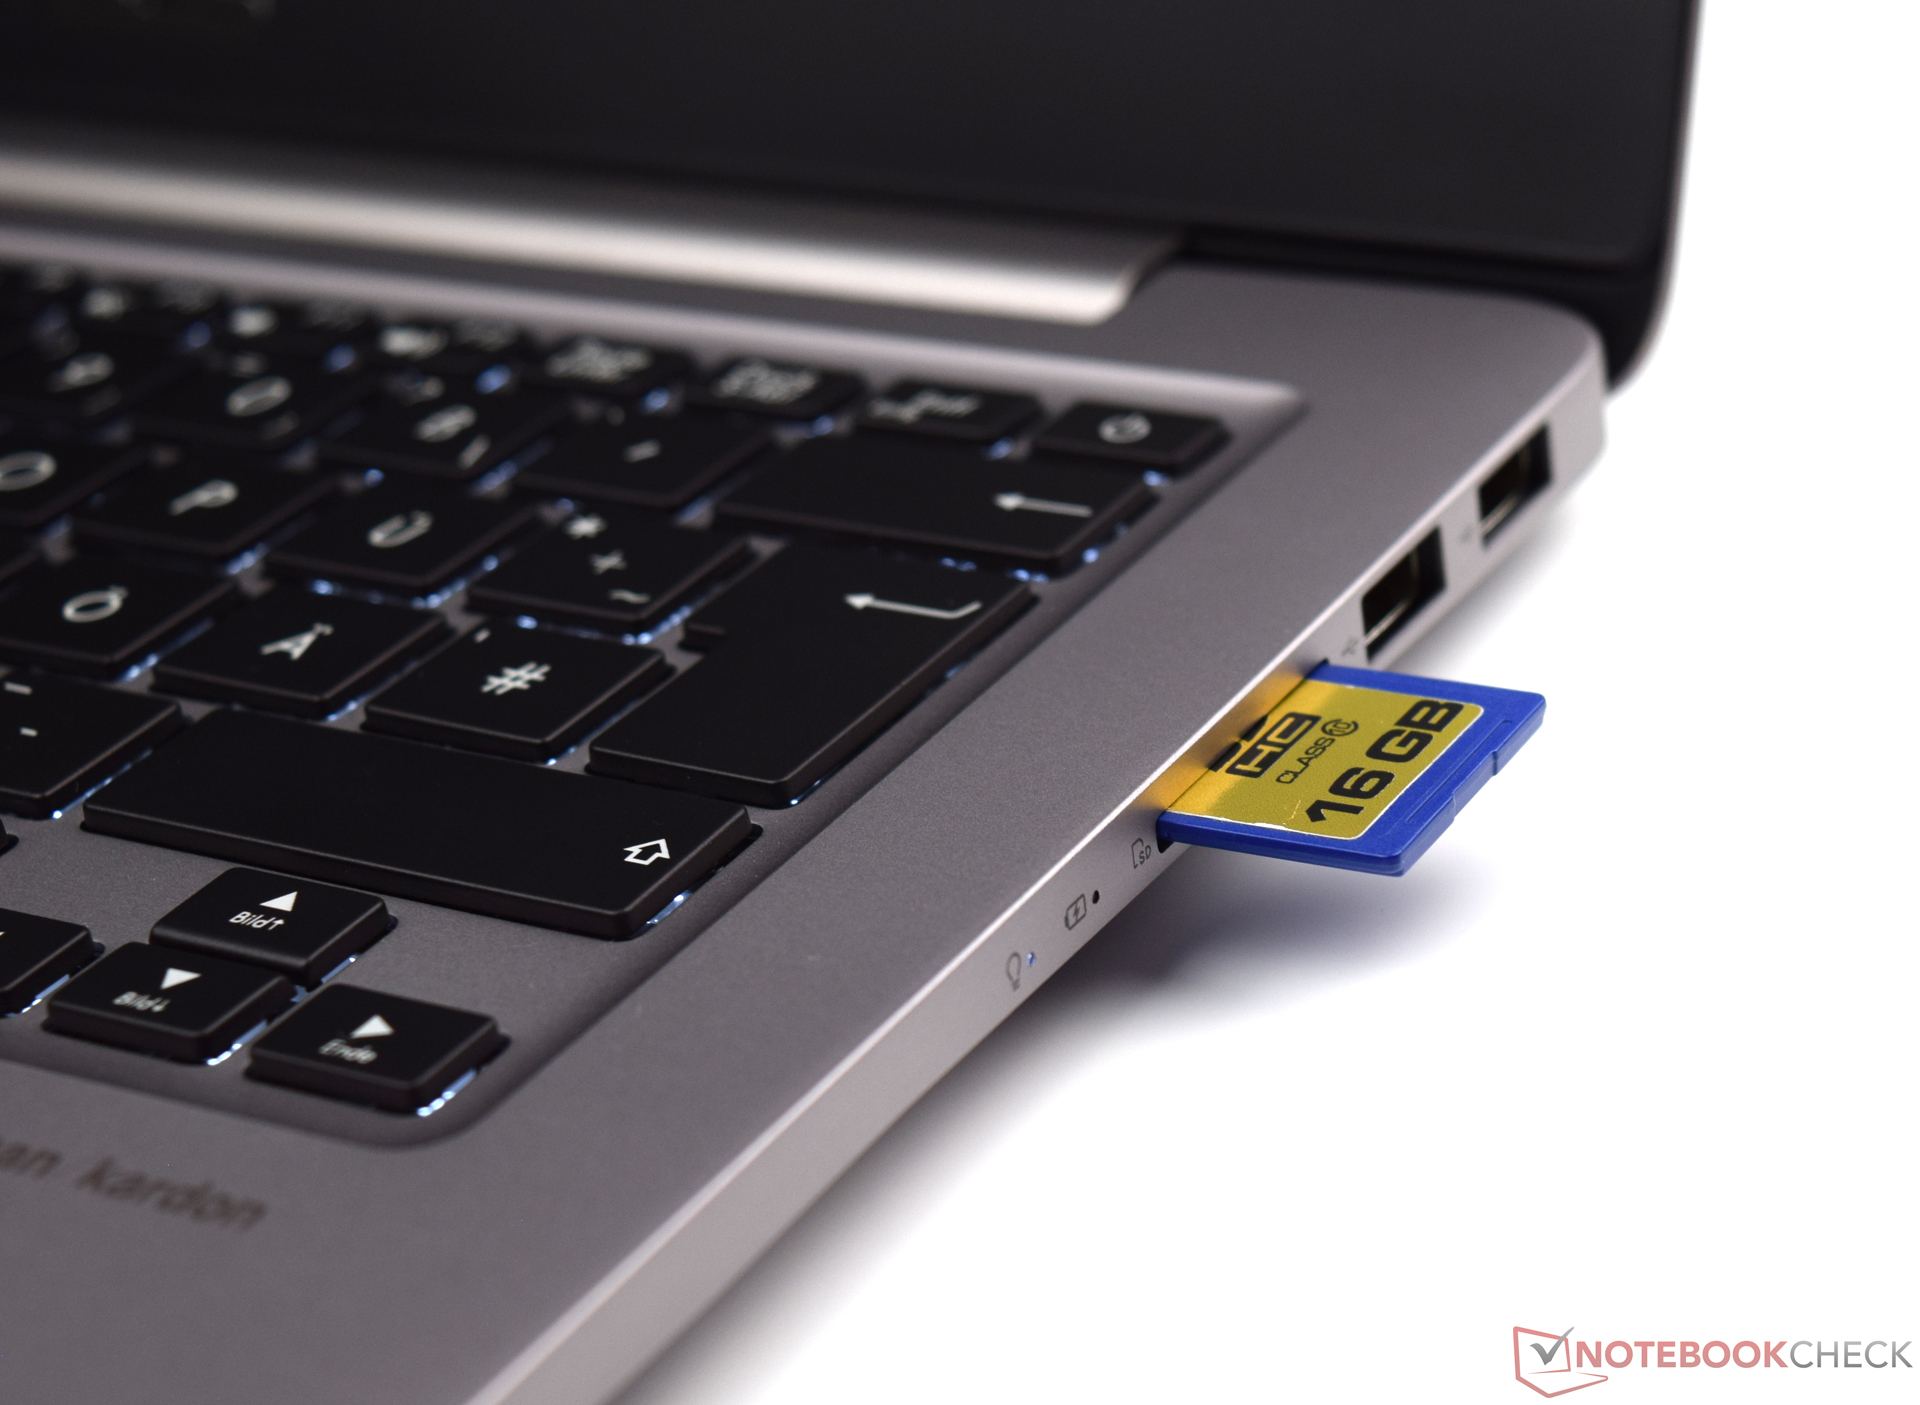
| SD Card Reader | |
| average JPG Copy Test (av. of 3 runs) | |
| Dell XPS 13 9360 FHD i5 | |
| Asus Zenbook UX310UQ-GL011T | |
| Asus UX310UQ-FC396T | |
| Asus Zenbook UX3410UA | |
| Asus Zenbook UX310UA-FC347T iGP | |
| maximum AS SSD Seq Read Test (1GB) | |
| Dell XPS 13 9360 FHD i5 | |
| Asus Zenbook UX310UQ-GL011T | |
| Asus Zenbook UX3410UA | |
| Asus UX310UQ-FC396T | |
| Asus Zenbook UX310UA-FC347T iGP | |
| Networking | |
| iperf3 transmit AX12 | |
| Asus Zenbook UX310UA-FC347T iGP (jseb) | |
| Asus UX310UQ-FC396T (jseb) | |
| Dell XPS 13 9360 FHD i5 | |
| Asus Zenbook UX3410UA | |
| iperf3 receive AX12 | |
| Dell XPS 13 9360 FHD i5 | |
| Asus UX310UQ-FC396T (jseb) | |
| Asus Zenbook UX310UA-FC347T iGP (jseb) | |
| Asus Zenbook UX3410UA | |
| |||||||||||||||||||||||||
Distribuzione della luminosità: 92 %
Al centro con la batteria: 362 cd/m²
Contrasto: 1293:1 (Nero: 0.28 cd/m²)
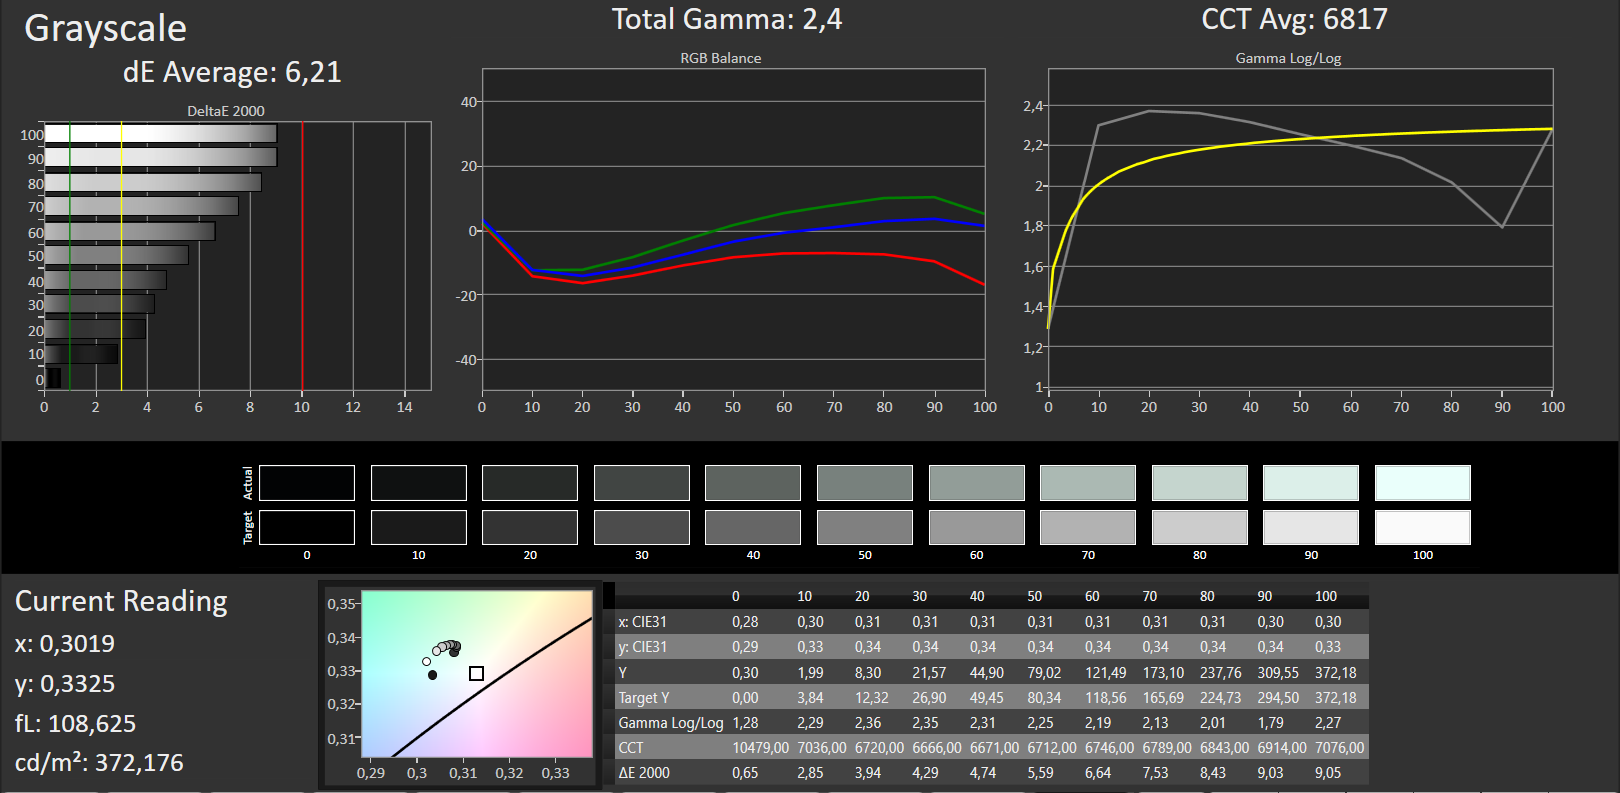
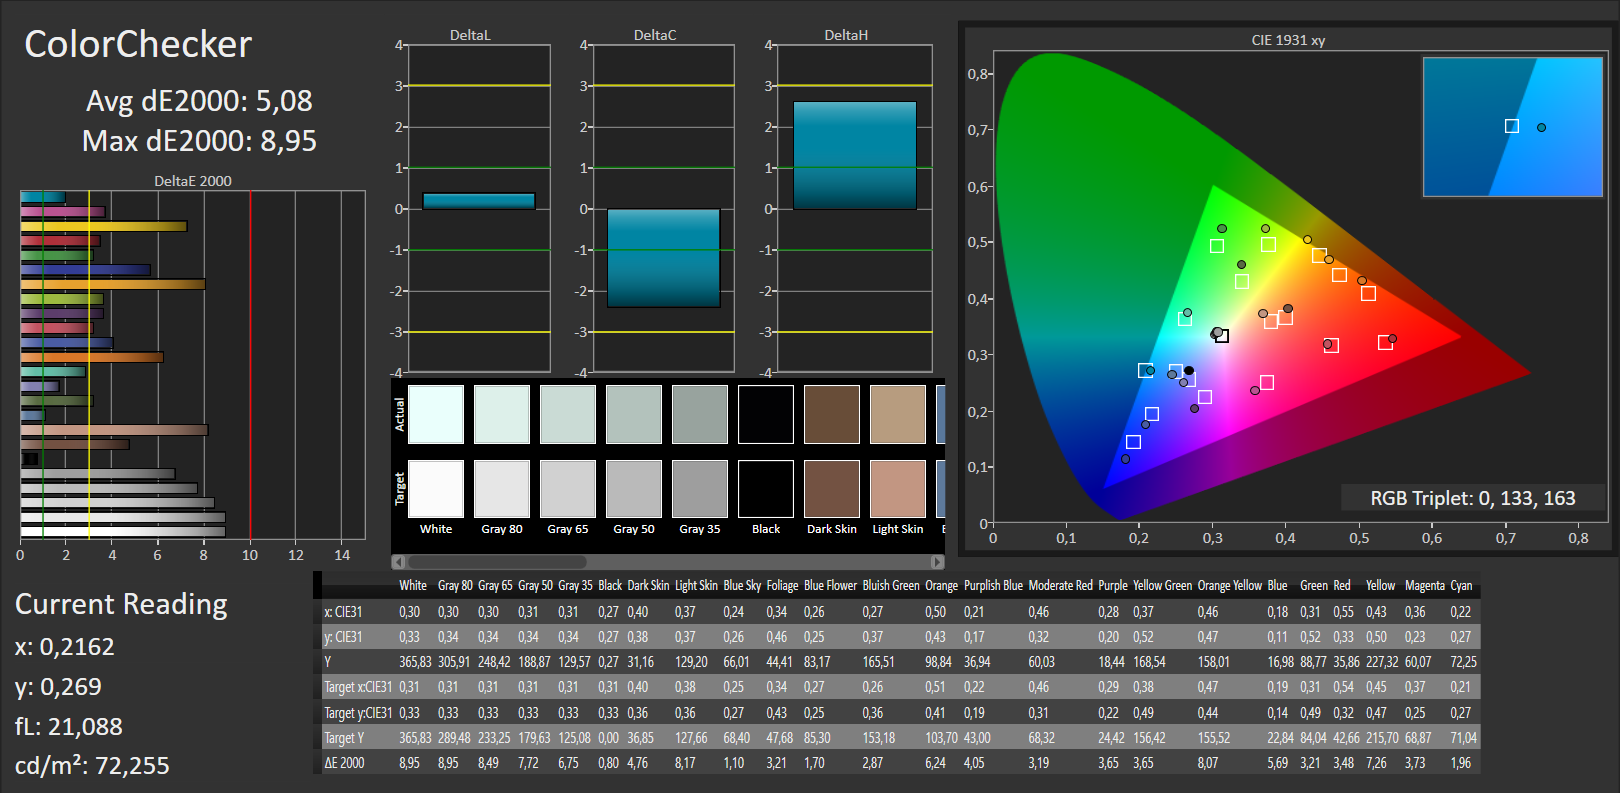
ΔE ColorChecker Calman: 5.08 | ∀{0.5-29.43 Ø4.71}
ΔE Greyscale Calman: 6.21 | ∀{0.09-98 Ø4.96}
92% sRGB (Argyll 1.6.3 3D)
60% AdobeRGB 1998 (Argyll 1.6.3 3D)
65.3% AdobeRGB 1998 (Argyll 3D)
92.2% sRGB (Argyll 3D)
64.1% Display P3 (Argyll 3D)
Gamma: 2.4
CCT: 6817 K
| Asus UX310UQ-FC396T AU Optronics AUO272D, 1920x1080, 13.3" | Asus Zenbook UX310UQ-GL011T AU Optronics AUO142D, 1920x1080, 13.3" | Asus Zenbook UX310UA-FC347T iGP AU Optronics AUO272D, 1920x1080, 13.3" | Asus Zenbook UX3410UA ChiMei N140HCE-EN1, 1920x1080, 14" | Acer Swift 7 SF713-51 Chimei Innolux, N133HCE-GP1, 1920x1080, 13.3" | Dell XPS 13 9360 FHD i5 Sharp SHP1449 LQ133M1, 1920x1080, 13.3" | |
|---|---|---|---|---|---|---|
| Display | -4% | -10% | 6% | -1% | -22% | |
| Display P3 Coverage (%) | 64.1 | 61.9 -3% | 64.2 0% | 67.7 6% | 64.6 1% | 48.94 -24% |
| sRGB Coverage (%) | 92.2 | 88.3 -4% | 65.3 -29% | 99.1 7% | 89.1 -3% | 73.3 -20% |
| AdobeRGB 1998 Coverage (%) | 65.3 | 63 -4% | 65.3 0% | 69.4 6% | 64.8 -1% | 50.5 -23% |
| Response Times | -20% | -17% | -34% | -15% | -32% | |
| Response Time Grey 50% / Grey 80% * (ms) | 31 ? | 39 ? -26% | 40 ? -29% | 33 ? -6% | 31 ? -0% | 32.8 ? -6% |
| Response Time Black / White * (ms) | 21 ? | 24 ? -14% | 22 ? -5% | 34 ? -62% | 27 ? -29% | 33.2 ? -58% |
| PWM Frequency (Hz) | 192 ? | 50 ? | 200 ? | |||
| Screen | -16% | -1% | 8% | 4% | -3% | |
| Brightness middle (cd/m²) | 362 | 247 -32% | 358 -1% | 376 4% | 359 -1% | 351.2 -3% |
| Brightness (cd/m²) | 343 | 240 -30% | 347 1% | 355 3% | 344 0% | 325 -5% |
| Brightness Distribution (%) | 92 | 90 -2% | 87 -5% | 87 -5% | 92 0% | 89 -3% |
| Black Level * (cd/m²) | 0.28 | 0.43 -54% | 0.26 7% | 0.32 -14% | 0.25 11% | 0.195 30% |
| Contrast (:1) | 1293 | 574 -56% | 1377 6% | 1175 -9% | 1436 11% | 1801 39% |
| Colorchecker dE 2000 * | 5.08 | 4.74 7% | 5.22 -3% | 3.2 37% | 4.57 10% | 7.4 -46% |
| Colorchecker dE 2000 max. * | 8.95 | 9.14 -2% | 9.19 -3% | 7.1 21% | 9.25 -3% | 9.08 -1% |
| Greyscale dE 2000 * | 6.21 | 4.87 22% | 6.69 -8% | 4.4 29% | 5.2 16% | 6.71 -8% |
| Gamma | 2.4 92% | 2.57 86% | 2.35 94% | 2.12 104% | 2.47 89% | 2.74 80% |
| CCT | 6817 95% | 7450 87% | 6745 96% | 7440 87% | 6887 94% | 7222 90% |
| Color Space (Percent of AdobeRGB 1998) (%) | 60 | 57 -5% | 59 -2% | 63.78 6% | 58 -3% | 50.48 -16% |
| Color Space (Percent of sRGB) (%) | 92 | 88 -4% | 91 -1% | 98.98 8% | 89 -3% | 73.31 -20% |
| Media totale (Programma / Settaggio) | -13% /
-14% | -9% /
-5% | -7% /
2% | -4% /
0% | -19% /
-11% |
* ... Meglio usare valori piccoli
Tempi di risposta del Display
| ↔ Tempi di risposta dal Nero al Bianco | ||
|---|---|---|
| 21 ms ... aumenta ↗ e diminuisce ↘ combinato | ↗ 4 ms Incremento | 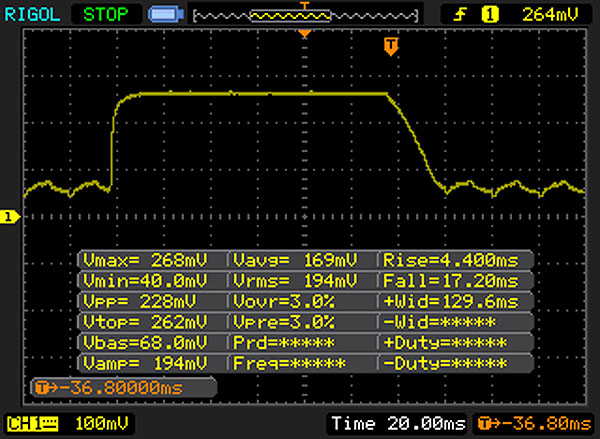 |
| ↘ 17 ms Calo | ||
| Lo schermo mostra buoni tempi di risposta durante i nostri tests, ma potrebbe essere troppo lento per i gamers competitivi. In confronto, tutti i dispositivi di test variano da 0.1 (minimo) a 240 (massimo) ms. » 47 % di tutti i dispositivi è migliore. Questo significa che i tempi di risposta rilevati sono simili alla media di tutti i dispositivi testati (19.8 ms). | ||
| ↔ Tempo di risposta dal 50% Grigio all'80% Grigio | ||
| 31 ms ... aumenta ↗ e diminuisce ↘ combinato | ↗ 12 ms Incremento | 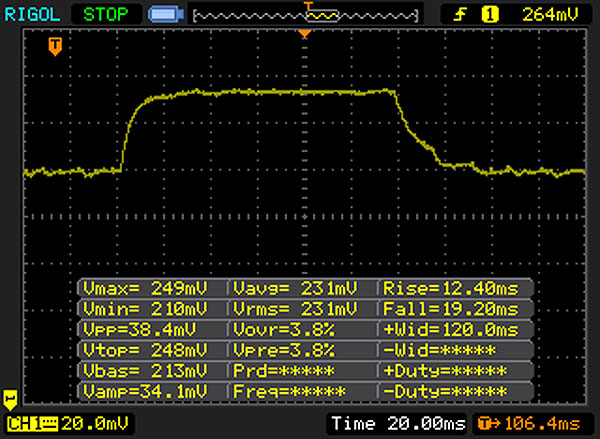 |
| ↘ 19 ms Calo | ||
| Lo schermo mostra tempi di risposta lenti nei nostri tests e sarà insoddisfacente per i gamers. In confronto, tutti i dispositivi di test variano da 0.165 (minimo) a 636 (massimo) ms. » 42 % di tutti i dispositivi è migliore. Questo significa che i tempi di risposta rilevati sono simili alla media di tutti i dispositivi testati (31 ms). | ||
Sfarfallio dello schermo / PWM (Pulse-Width Modulation)
| flickering dello schermo / PWM rilevato | 192 Hz | ≤ 10 % settaggio luminosita' | 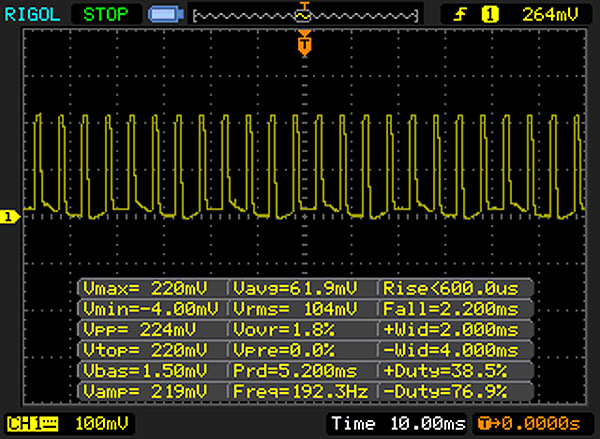 |
Il display sfarfalla a 192 Hz (Probabilmente a causa dell'uso di PWM) Flickering rilevato ad una luminosita' di 10 % o inferiore. Non dovrebbe verificarsi flickering o PWM sopra questo valore di luminosita'. La frequenza di 192 Hz è relativamente bassa, quindi gli utenti sensibili potrebbero notare il flickering ed accusare stanchezza agli occhi a questo livello di luminosità e a livelli inferiori. In confronto: 52 % di tutti i dispositivi testati non utilizza PWM per ridurre la luminosita' del display. Se è rilevato PWM, una media di 7754 (minimo: 5 - massimo: 343500) Hz è stata rilevata. | |||
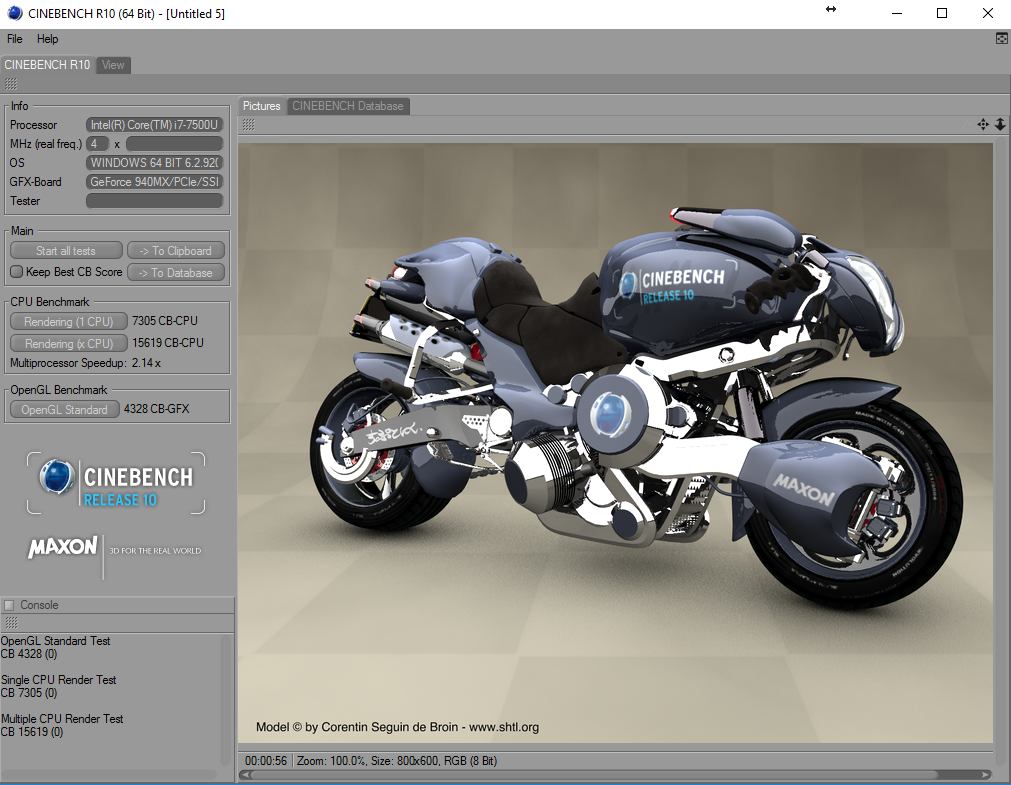
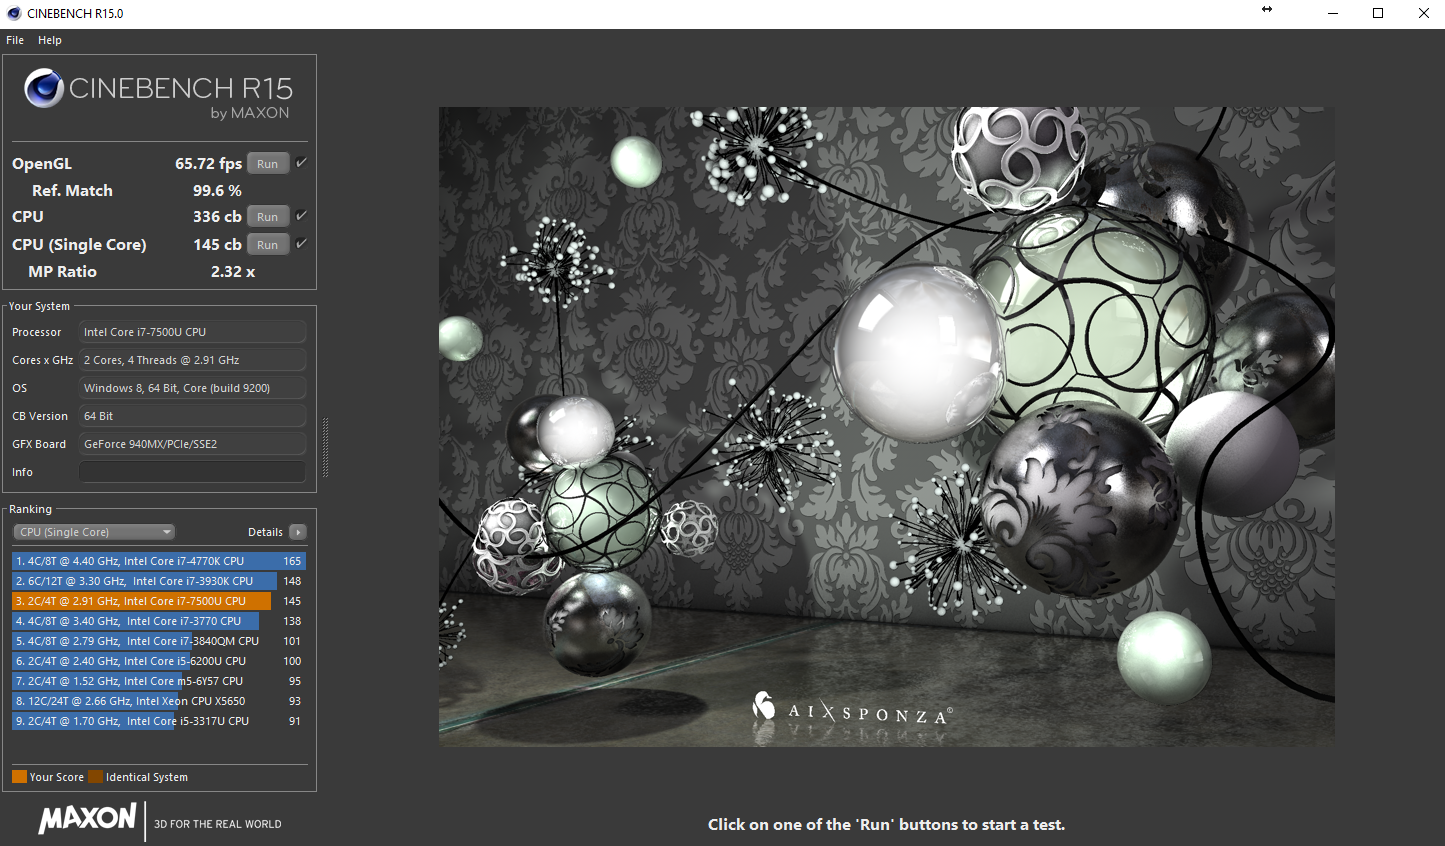
| Cinebench R10 | |
| Rendering Single CPUs 64Bit | |
| Asus UX310UQ-FC396T | |
| Asus Zenbook UX310UA-FC347T iGP | |
| Asus Zenbook UX310UQ-GL011T | |
| Acer Swift 7 SF713-51 | |
| Rendering Multiple CPUs 64Bit | |
| Asus Zenbook UX310UA-FC347T iGP | |
| Asus UX310UQ-FC396T | |
| Asus Zenbook UX310UQ-GL011T | |
| Acer Swift 7 SF713-51 | |
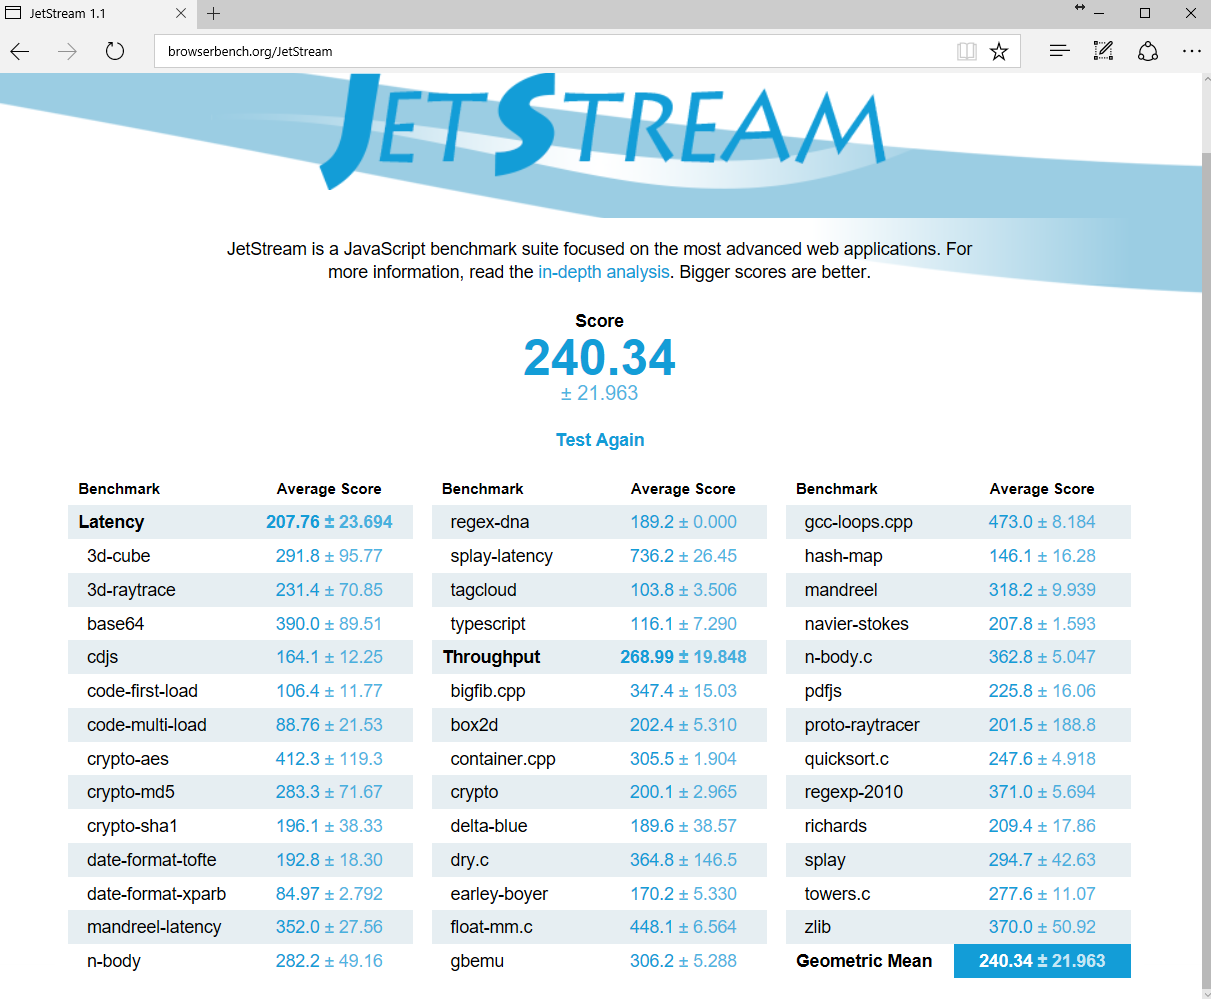
| JetStream 1.1 - 1.1 Total | |
| Asus UX310UQ-FC396T | |
| Asus Zenbook UX310UA-FC347T iGP | |
| Asus Zenbook UX310UQ-GL011T | |
| Asus Zenbook UX3410UA | |
| Acer Swift 7 SF713-51 | |
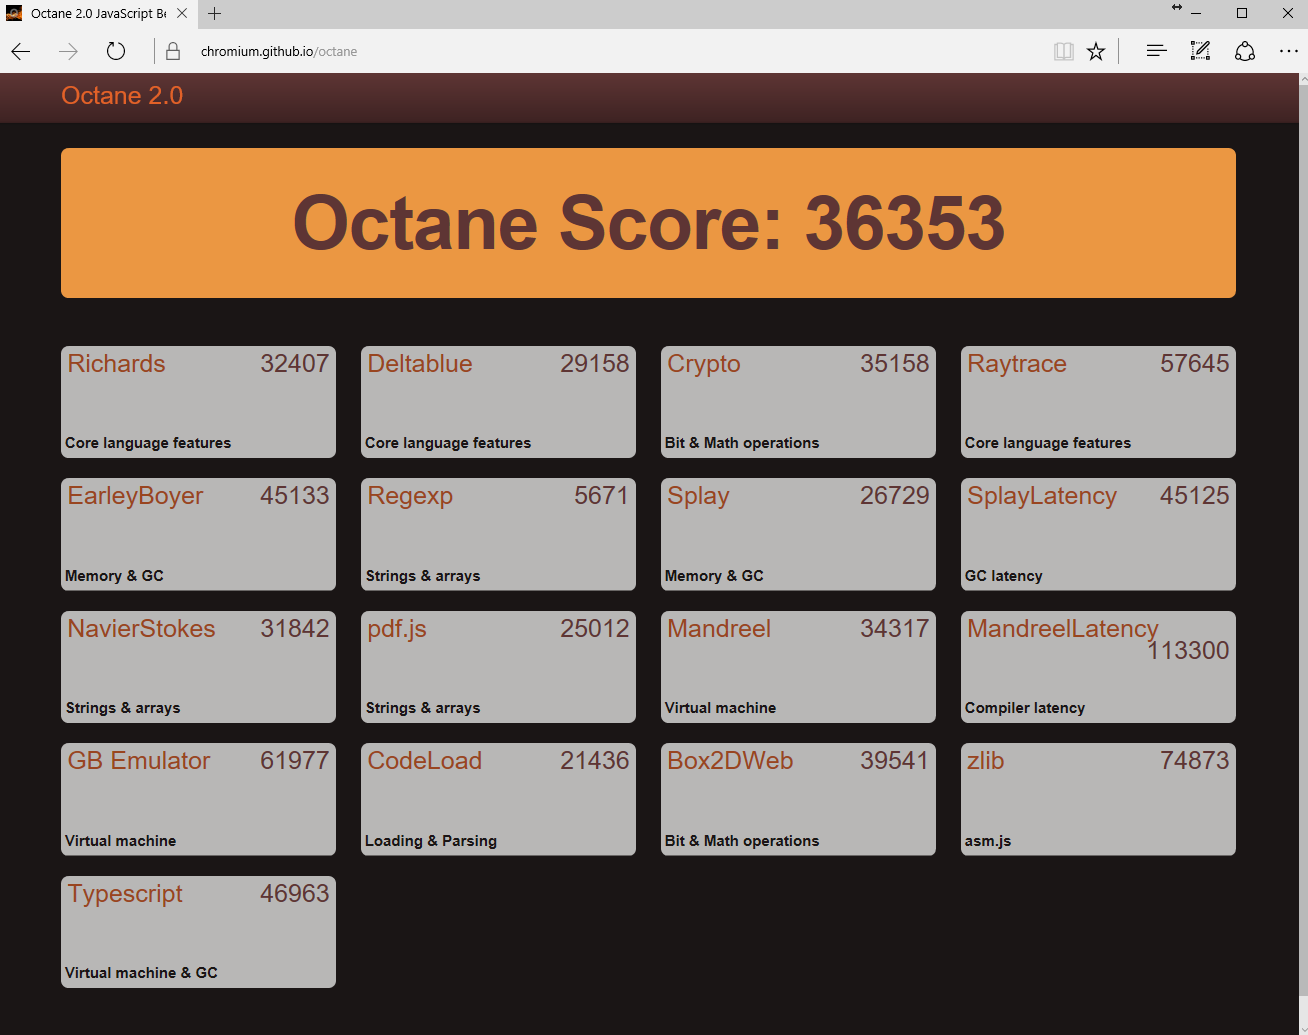
| Octane V2 - Total Score | |
| Asus UX310UQ-FC396T | |
| Asus Zenbook UX310UA-FC347T iGP | |
| Dell XPS 13 9360 FHD i5 | |
| Asus Zenbook UX3410UA | |
| Asus Zenbook UX310UQ-GL011T | |
| Acer Swift 7 SF713-51 | |
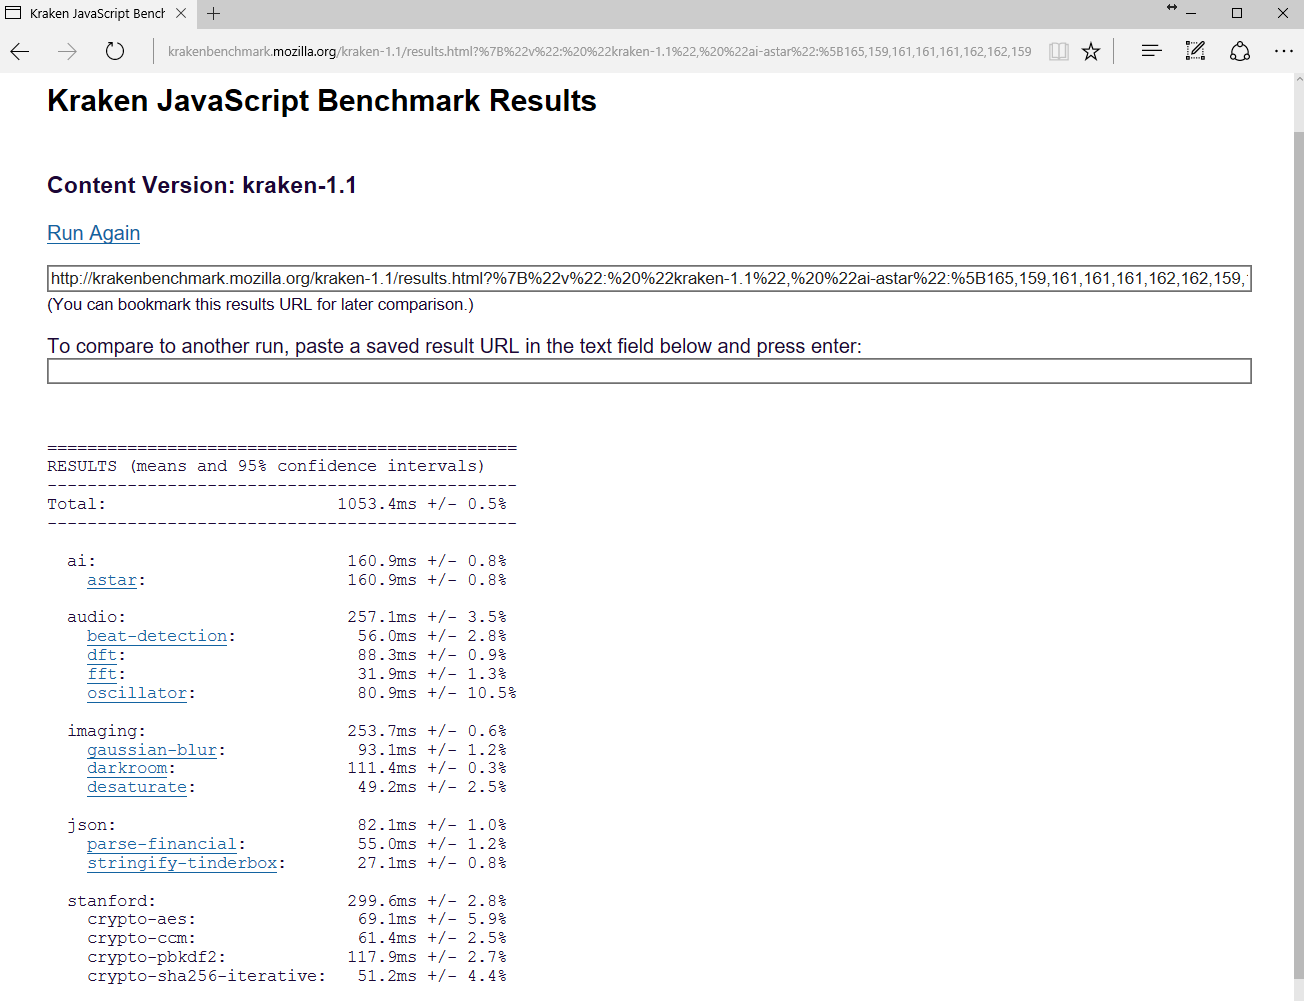
| Mozilla Kraken 1.1 - Total | |
| Acer Swift 7 SF713-51 | |
| Asus Zenbook UX310UQ-GL011T | |
| Asus Zenbook UX3410UA | |
| Asus Zenbook UX310UA-FC347T iGP | |
| Asus UX310UQ-FC396T | |
* ... Meglio usare valori piccoli
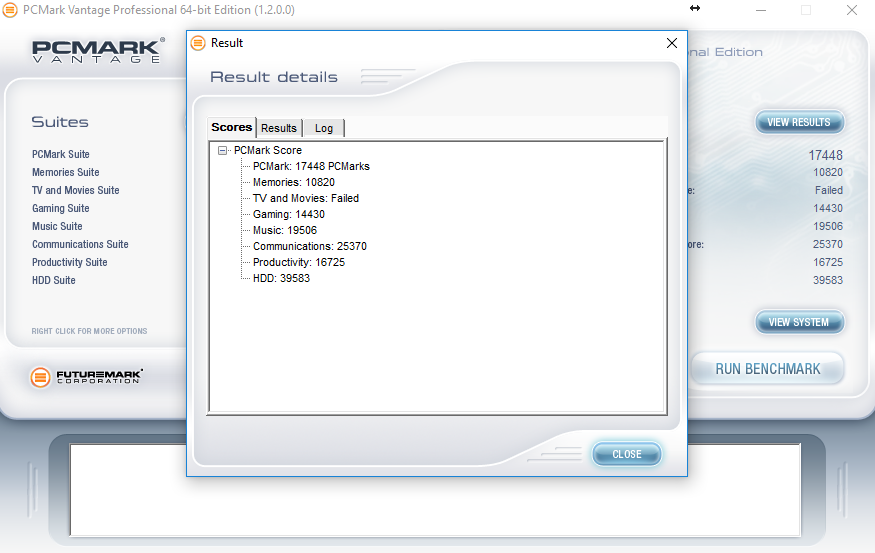
| PCMark Vantage Result | 17448 punti | |
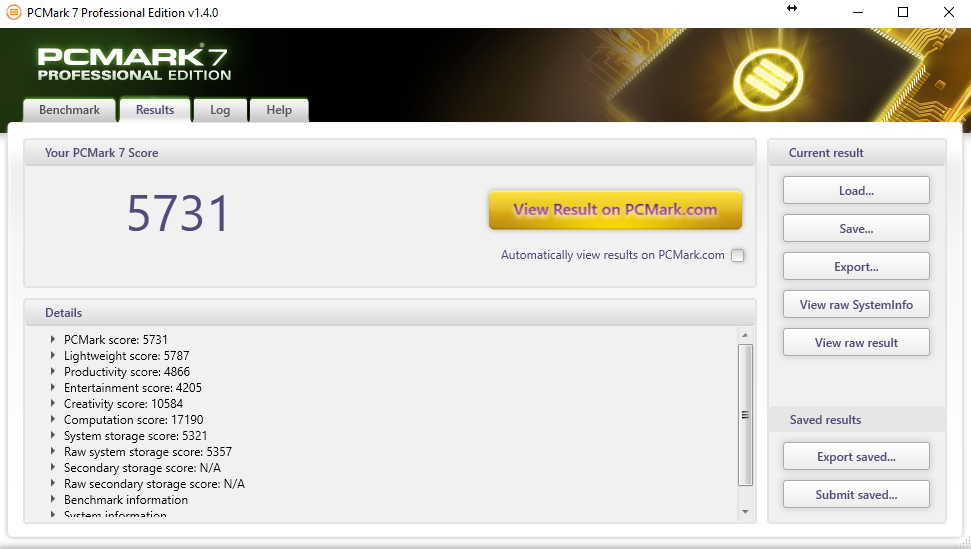
| PCMark 7 Score | 5731 punti | |
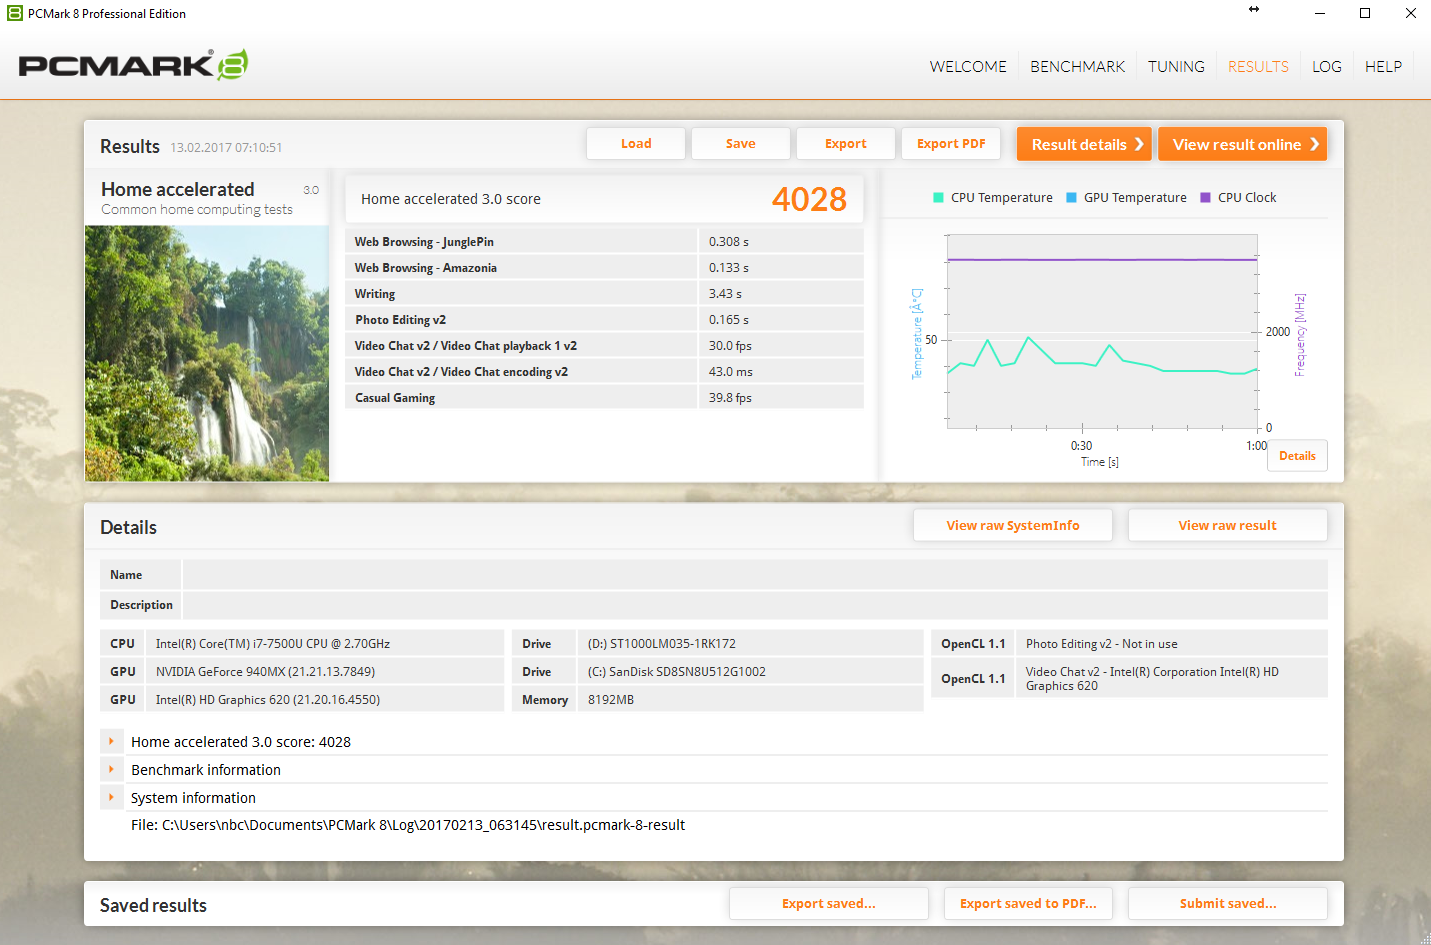
| PCMark 8 Home Score Accelerated v2 | 4028 punti | |
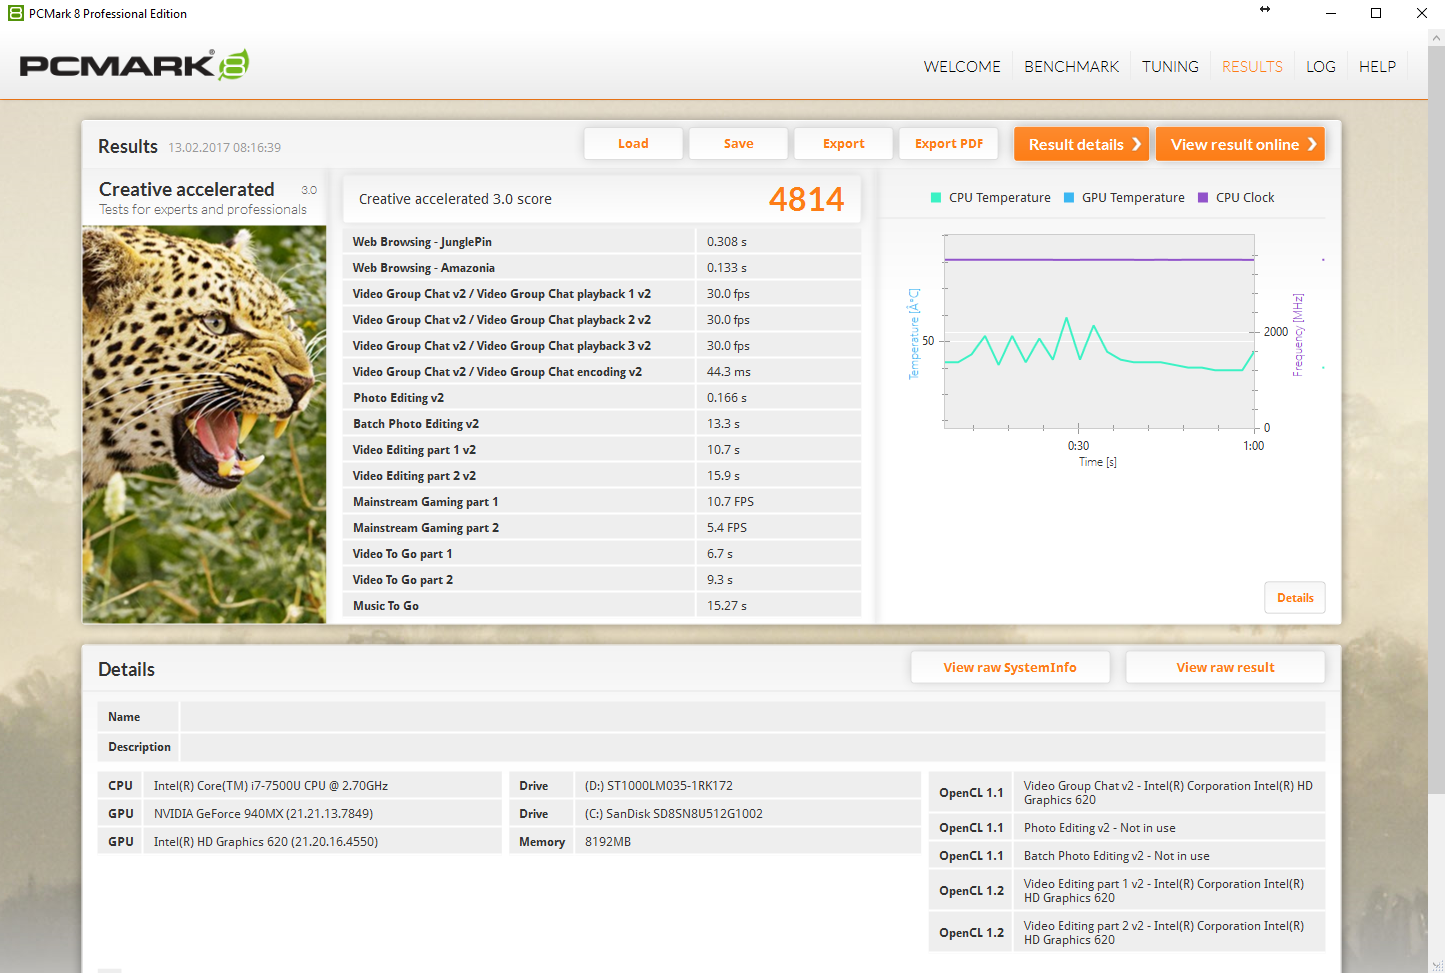
| PCMark 8 Creative Score Accelerated v2 | 4814 punti | |
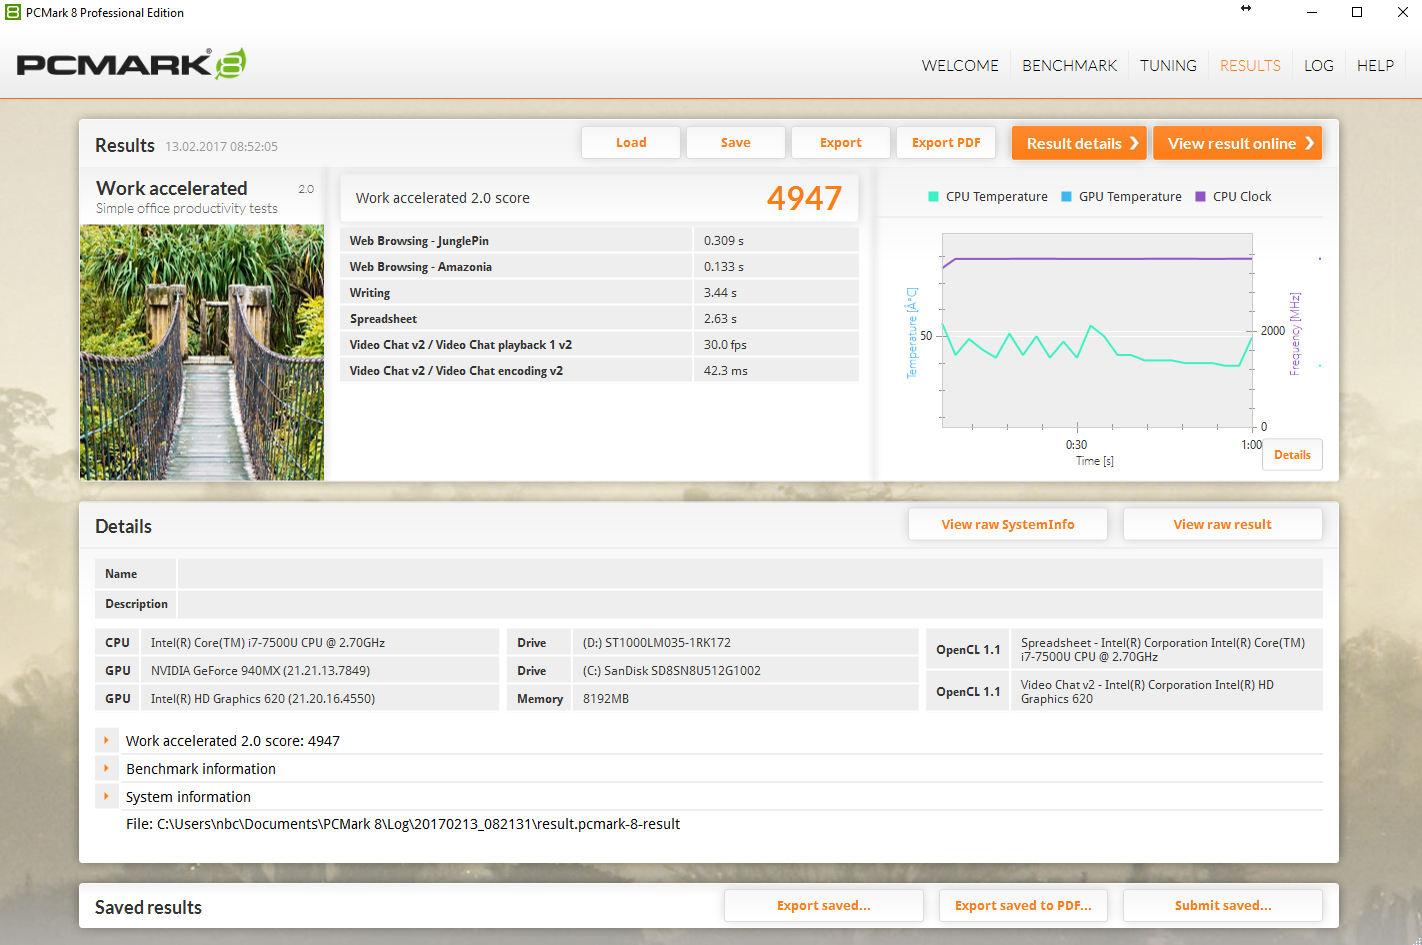
| PCMark 8 Work Score Accelerated v2 | 4947 punti | |
Aiuto | ||
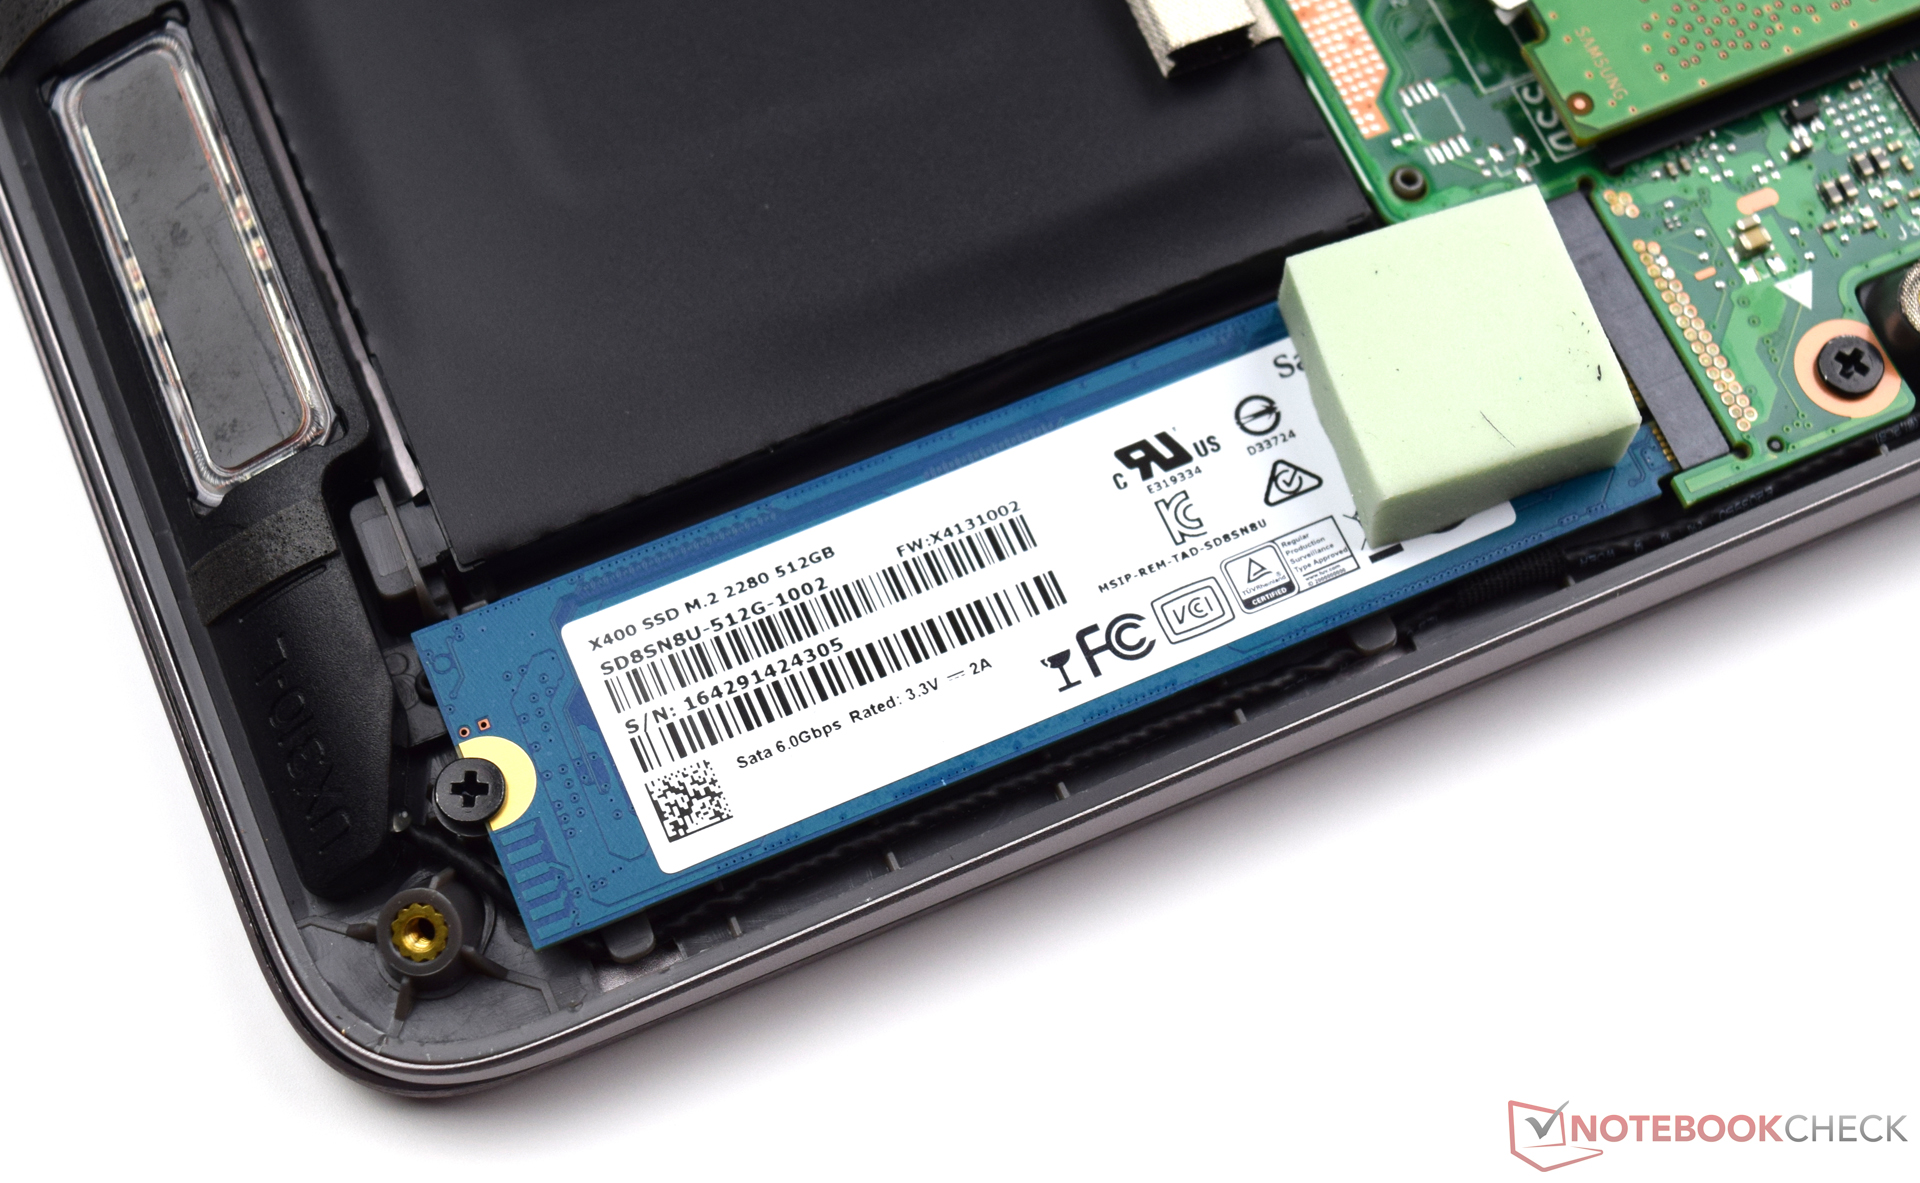
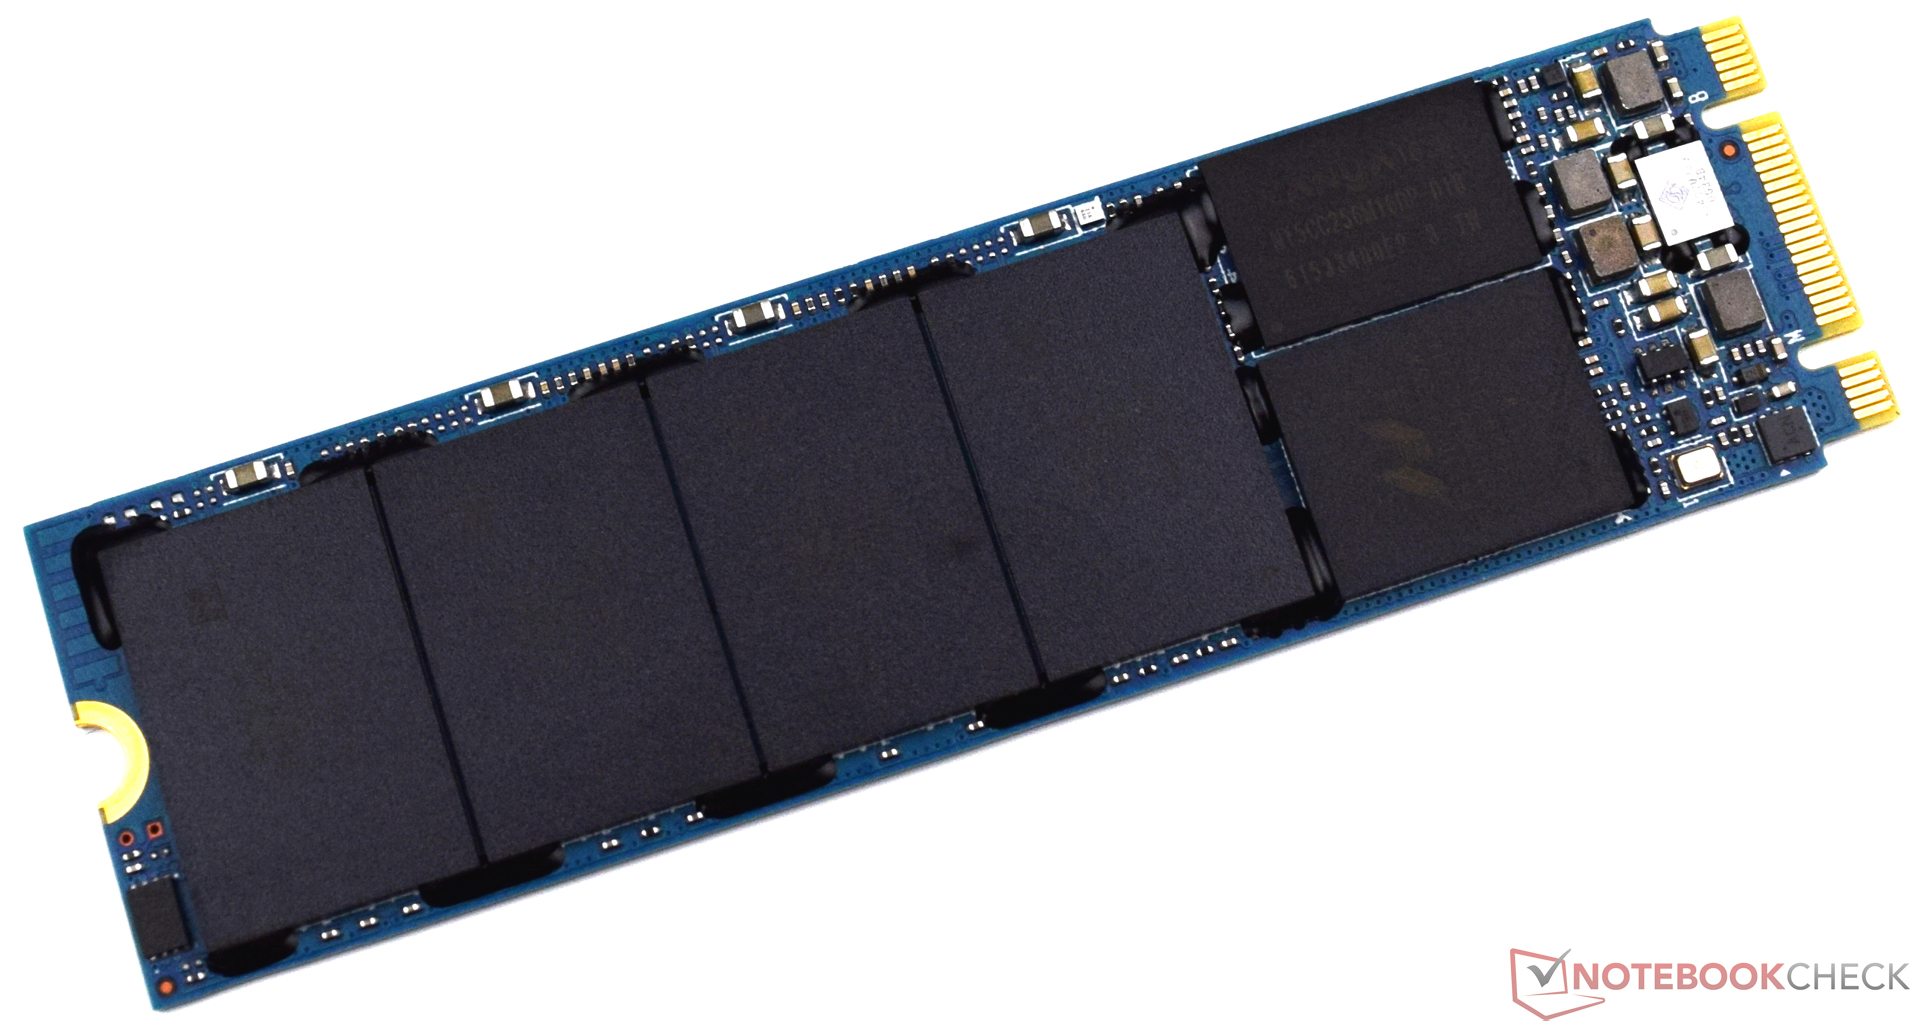
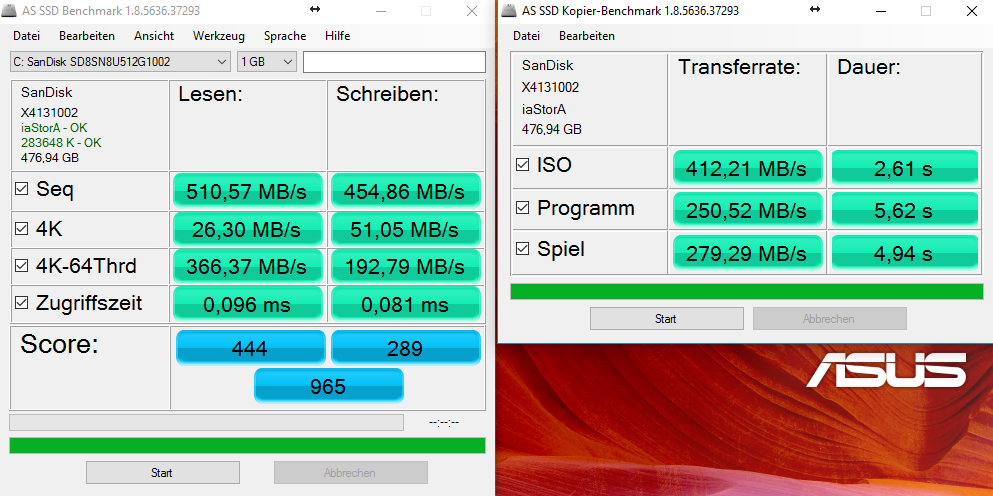
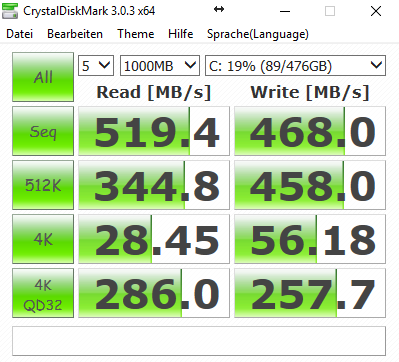
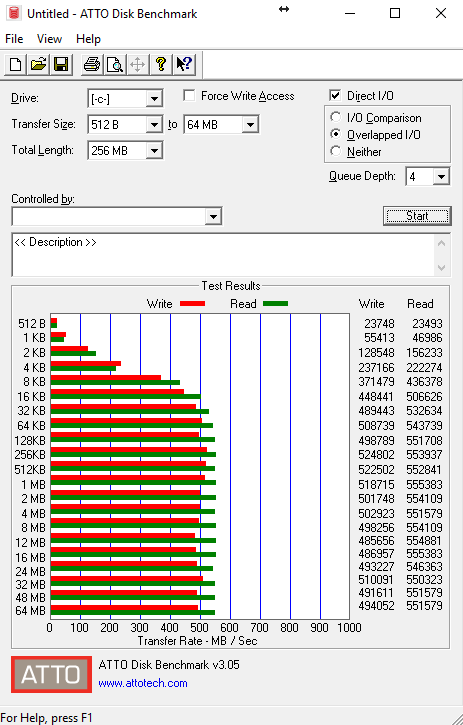
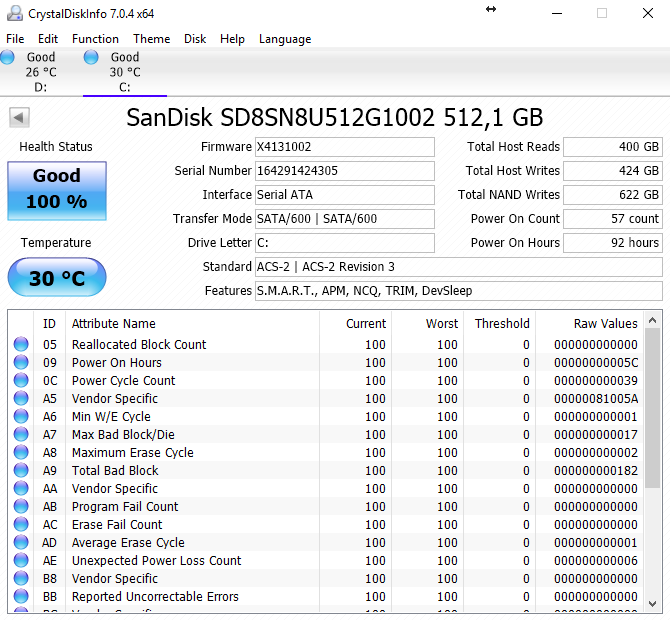
| Asus UX310UQ-FC396T SanDisk SD8SN8U512G1002 | Asus Zenbook UX310UQ-GL011T SanDisk SD8SNAT256G1002 | Asus Zenbook UX310UA-FC347T iGP Micron SSD 1100 (MTFDDAV256TBN) | Asus Zenbook UX3410UA SanDisk SD8SN8U512G1002 | Acer Swift 7 SF713-51 Kingston RBU-SNS4180S3256GG | Dell XPS 13 9360 FHD i5 Toshiba NVMe THNSN5256GPUK | |
|---|---|---|---|---|---|---|
| CrystalDiskMark 3.0 | -19% | 1% | -0% | 3% | 69% | |
| Read Seq (MB/s) | 519 | 468.1 -10% | 489.4 -6% | 494.5 -5% | 431.2 -17% | 1233 138% |
| Write Seq (MB/s) | 468 | 319.2 -32% | 431.6 -8% | 461.7 -1% | 401 -14% | 733 57% |
| Read 512 (MB/s) | 344.8 | 318.6 -8% | 356.7 3% | 328 -5% | 283.7 -18% | 1036 200% |
| Write 512 (MB/s) | 458 | 272.8 -40% | 389.1 -15% | 419.7 -8% | 313.6 -32% | 439.9 -4% |
| Read 4k (MB/s) | 28.45 | 22.03 -23% | 26.68 -6% | 27.53 -3% | 36.62 29% | 29.31 3% |
| Write 4k (MB/s) | 56.2 | 72.1 28% | 88.7 58% | 56.5 1% | 76.1 35% | 116.9 108% |
| Read 4k QD32 (MB/s) | 286 | 147.4 -48% | 246.3 -14% | 351 23% | 329.4 15% | 479.2 68% |
| Write 4k QD32 (MB/s) | 257.7 | 200.2 -22% | 251.5 -2% | 249.3 -3% | 325.6 26% | 218.3 -15% |

| 3DMark | |
| 1280x720 Cloud Gate Standard Graphics | |
| Asus Zenbook UX310UA-FC347T iGP | |
| Asus Zenbook UX3410UA | |
| Asus UX310UQ-FC396T | |
| Asus Zenbook UX310UQ-GL011T | |
| Dell XPS 13 9360 FHD i5 | |
| Acer Swift 7 SF713-51 | |
| 1920x1080 Fire Strike Graphics | |
| Asus Zenbook UX310UQ-GL011T | |
| Asus UX310UQ-FC396T | |
| Asus Zenbook UX310UA-FC347T iGP | |
| Asus Zenbook UX3410UA | |
| Dell XPS 13 9360 FHD i5 | |
| Acer Swift 7 SF713-51 | |
| 3DMark 11 - 1280x720 Performance GPU | |
| Asus Zenbook UX310UQ-GL011T | |
| Asus UX310UQ-FC396T | |
| Asus Zenbook UX3410UA | |
| Asus Zenbook UX310UA-FC347T iGP | |
| Dell XPS 13 9360 FHD i5 | |
| Acer Swift 7 SF713-51 | |
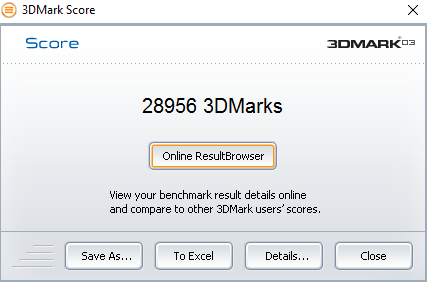
| 3DMark 03 Standard | 28956 punti | |
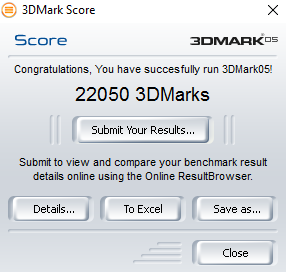
| 3DMark 05 Standard | 22050 punti | |
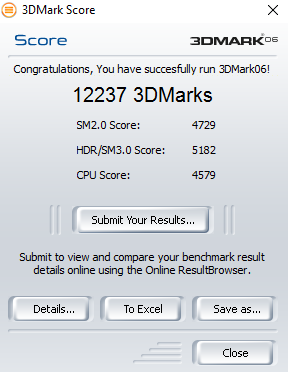
| 3DMark 06 Standard Score | 12237 punti | |
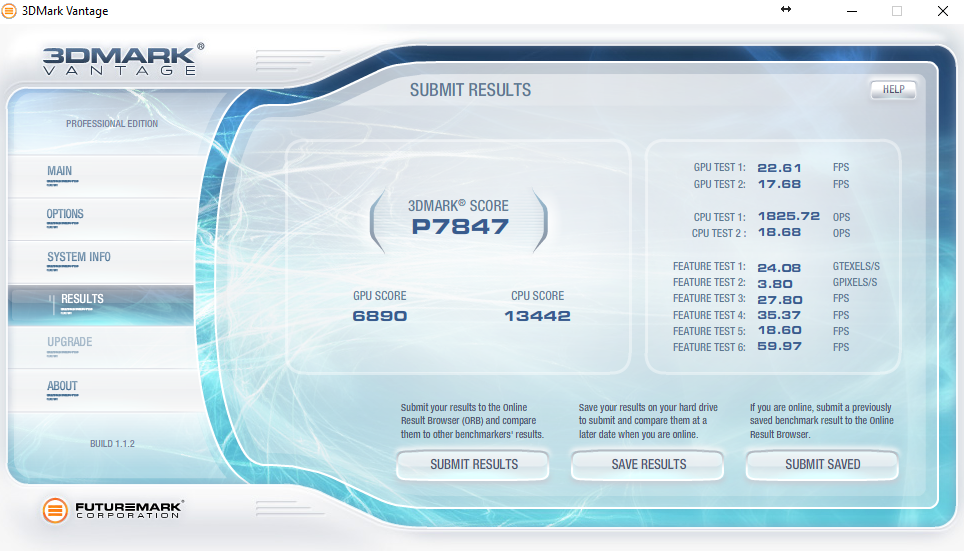
| 3DMark Vantage P Result | 7847 punti | |
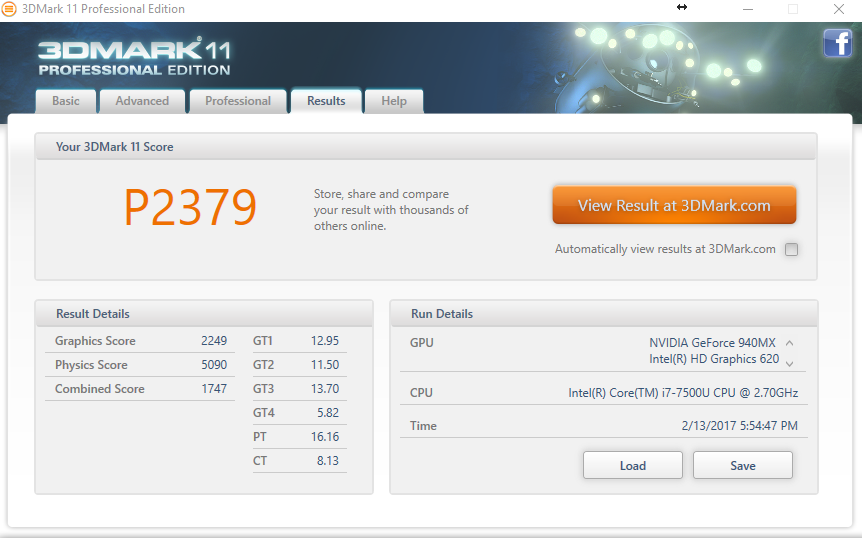
| 3DMark 11 Performance | 2379 punti | |
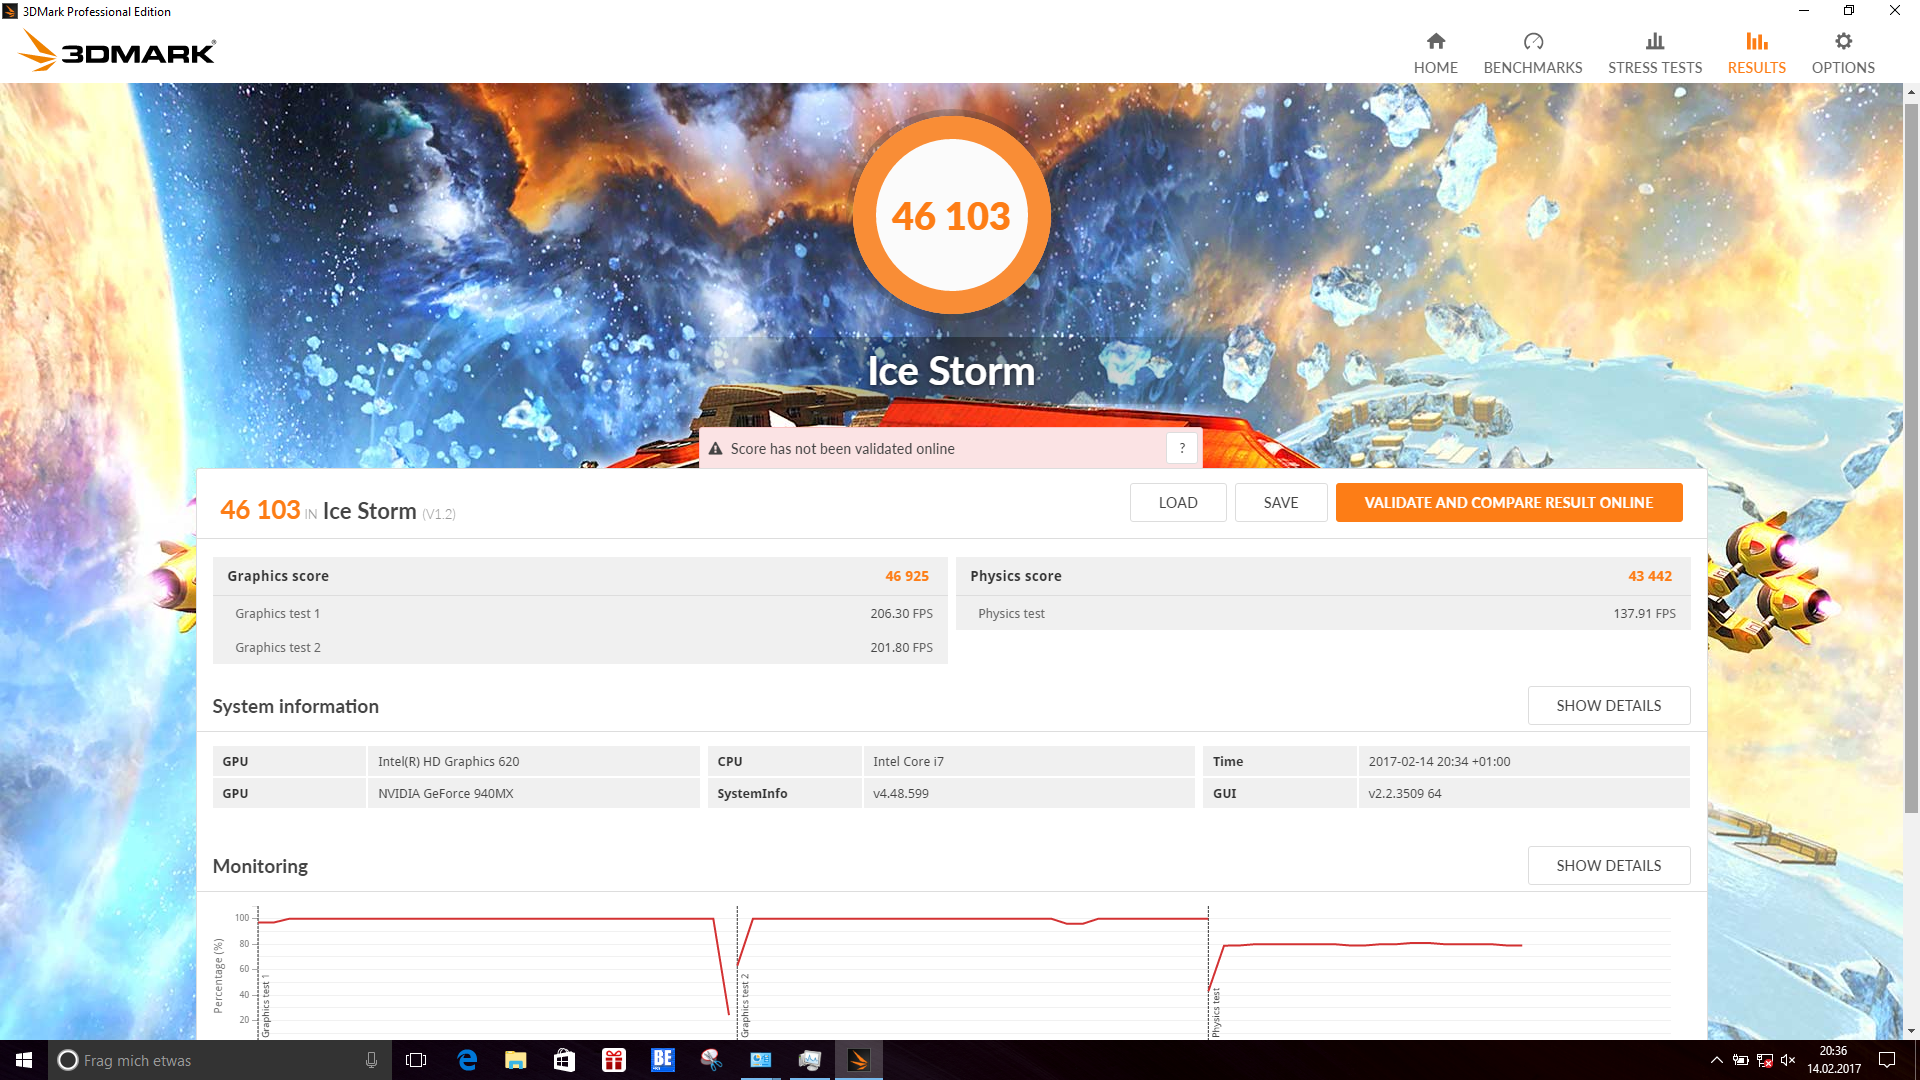
| 3DMark Ice Storm Standard Score | 46103 punti | |
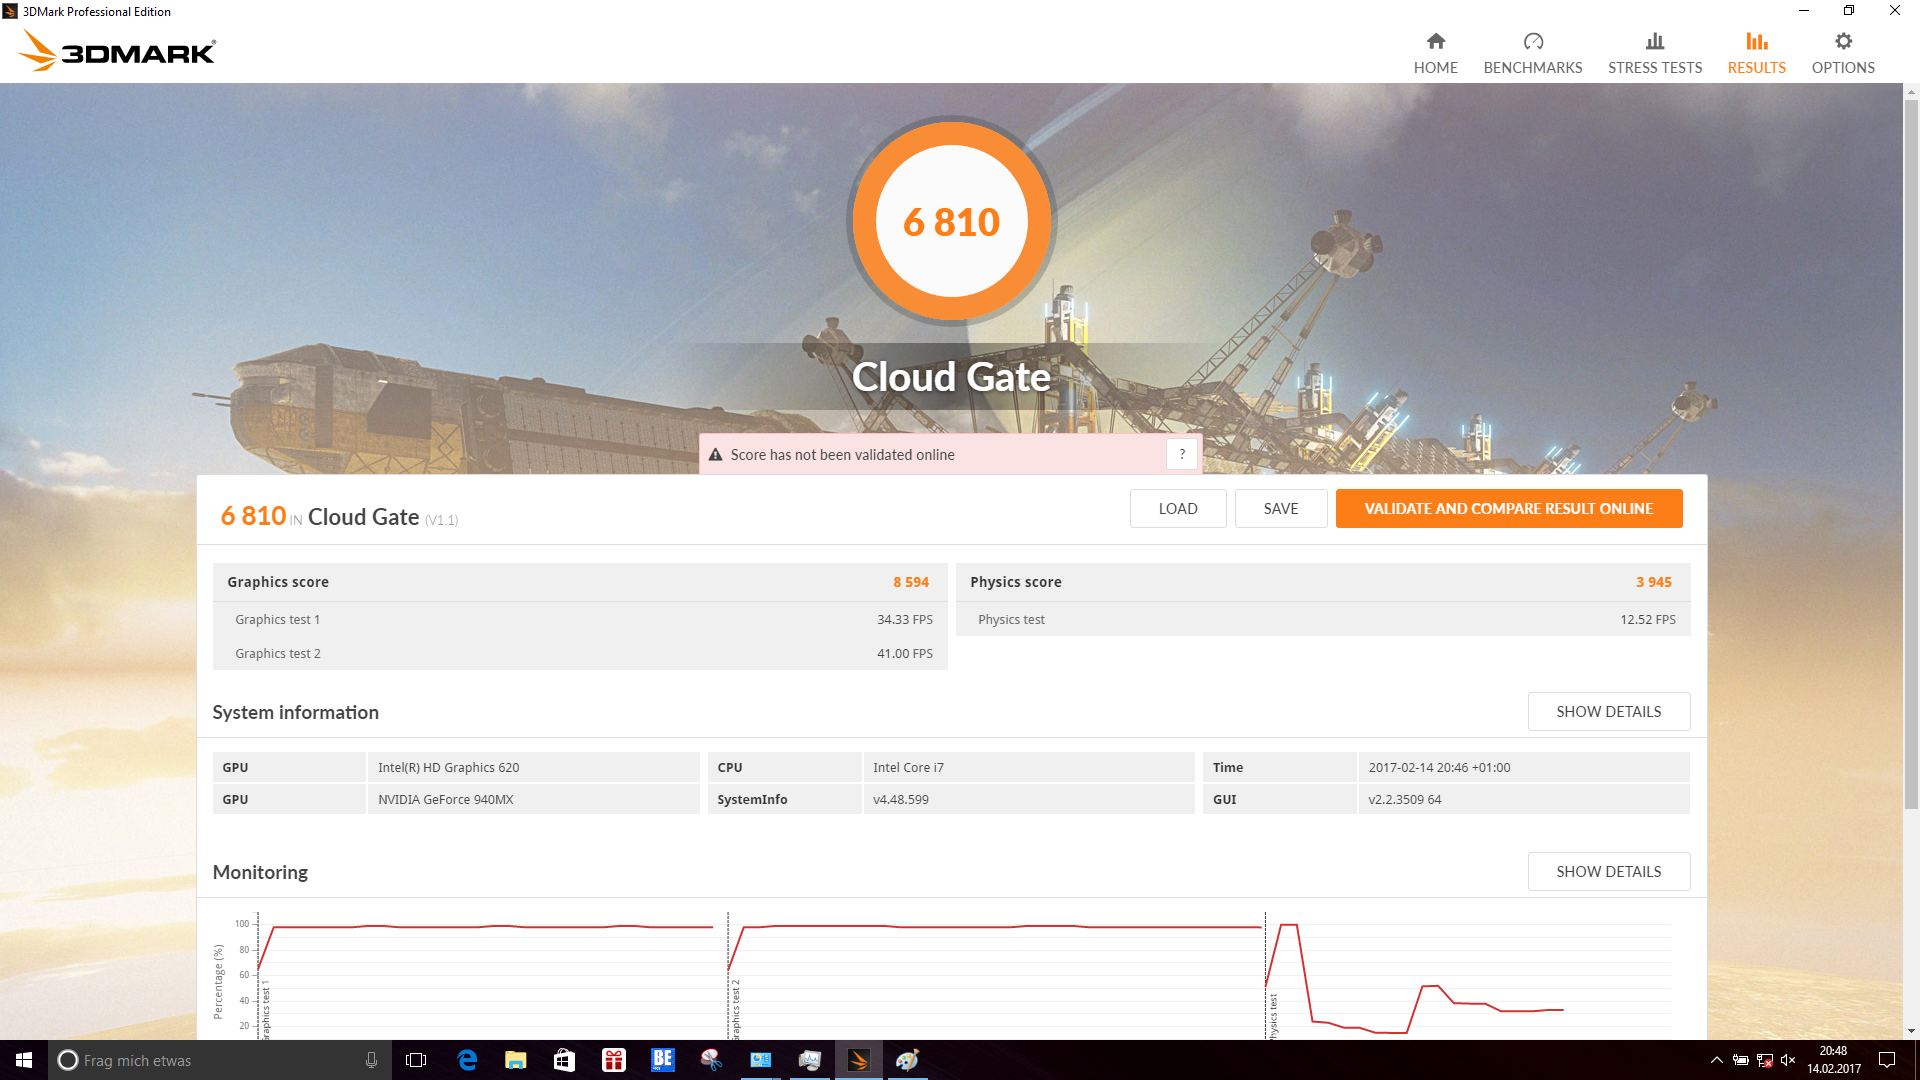
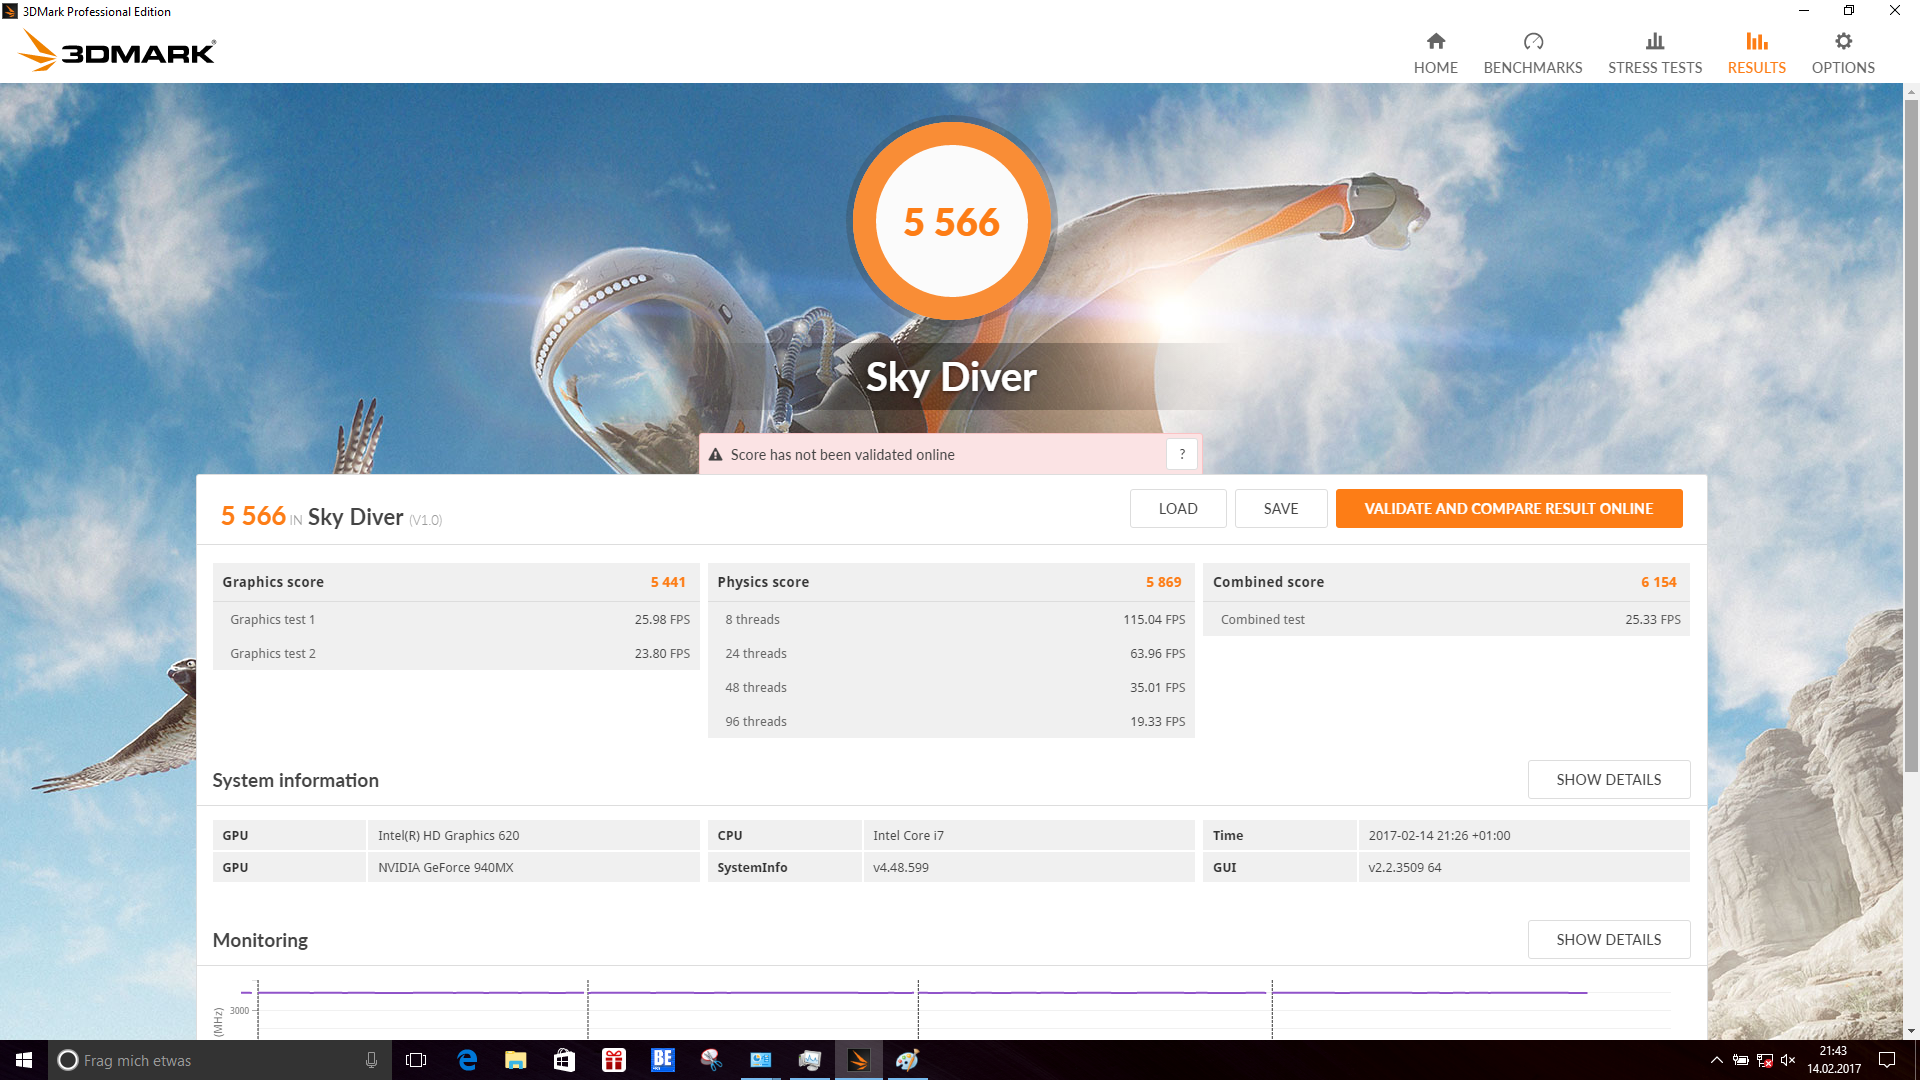
| 3DMark Cloud Gate Standard Score | 6810 punti | |
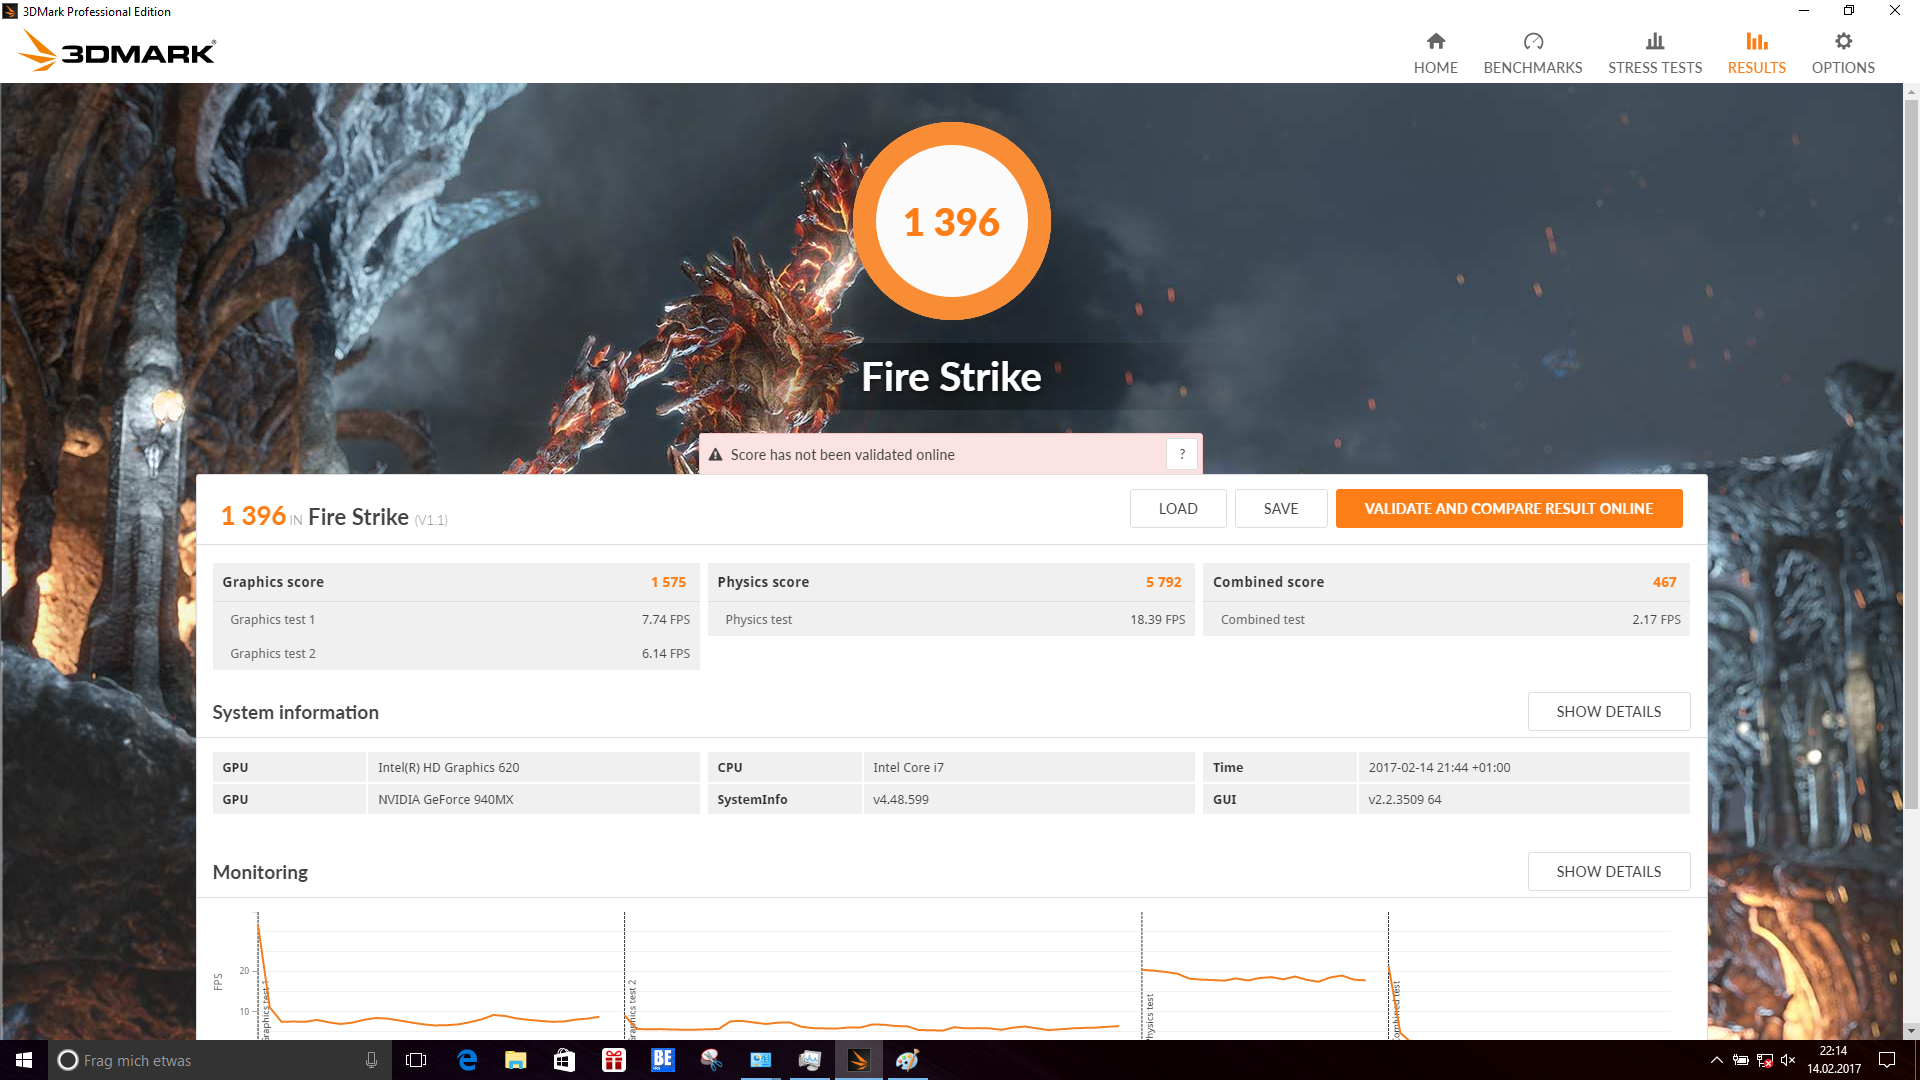
| 3DMark Fire Strike Score | 1396 punti | |
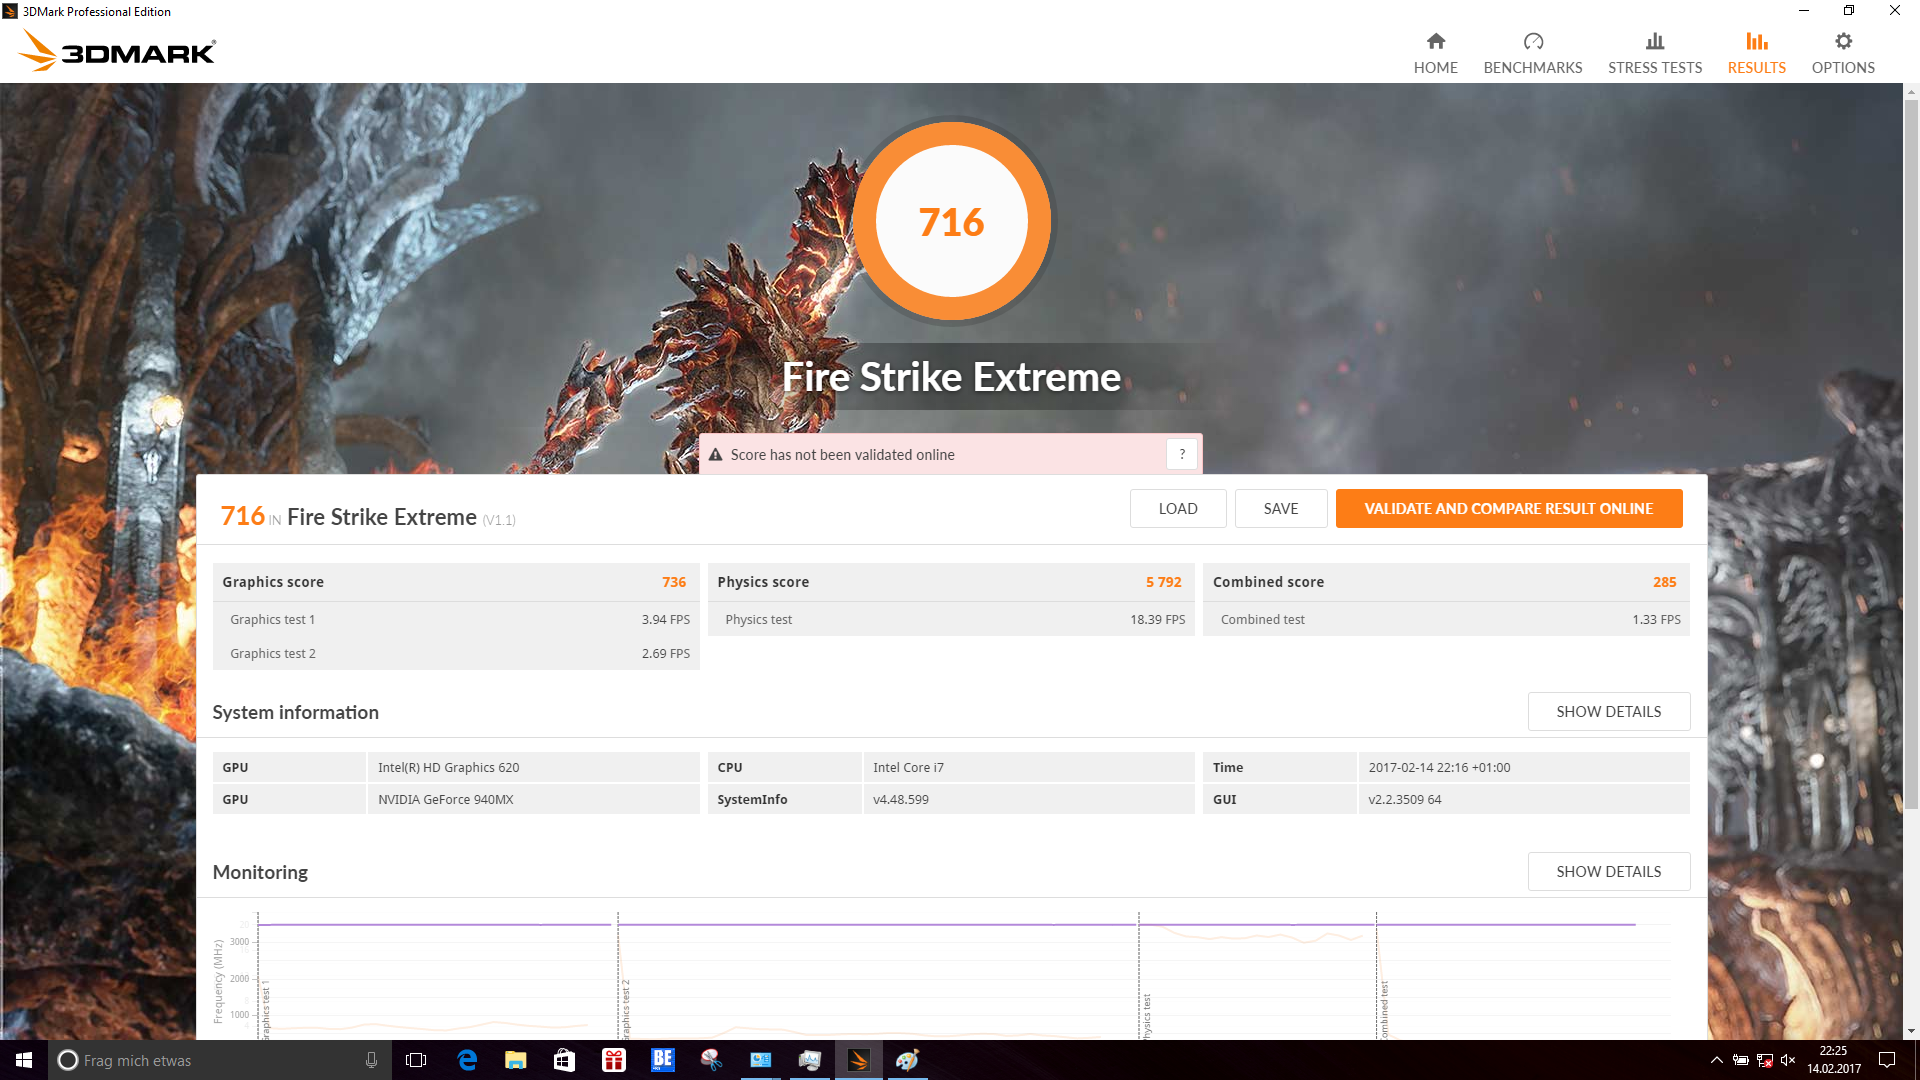
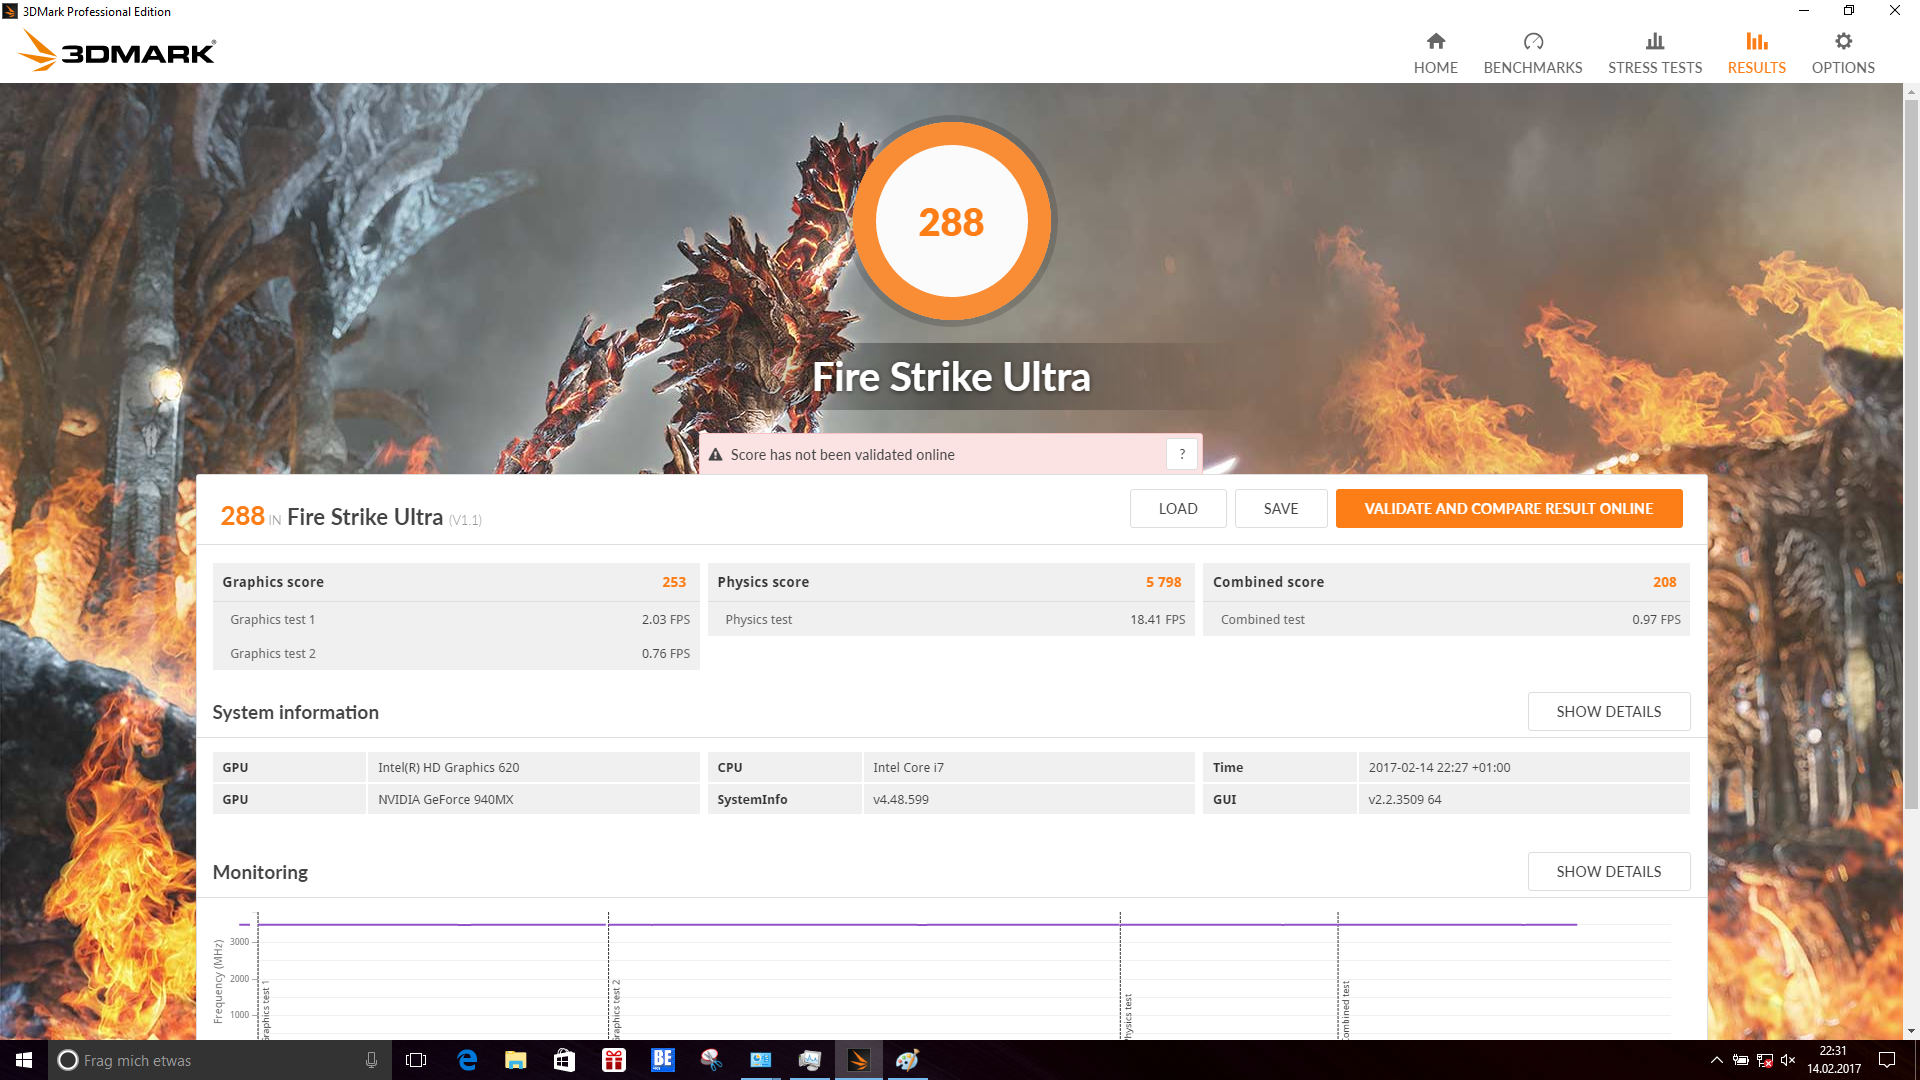
| 3DMark Fire Strike Extreme Score | 716 punti | |
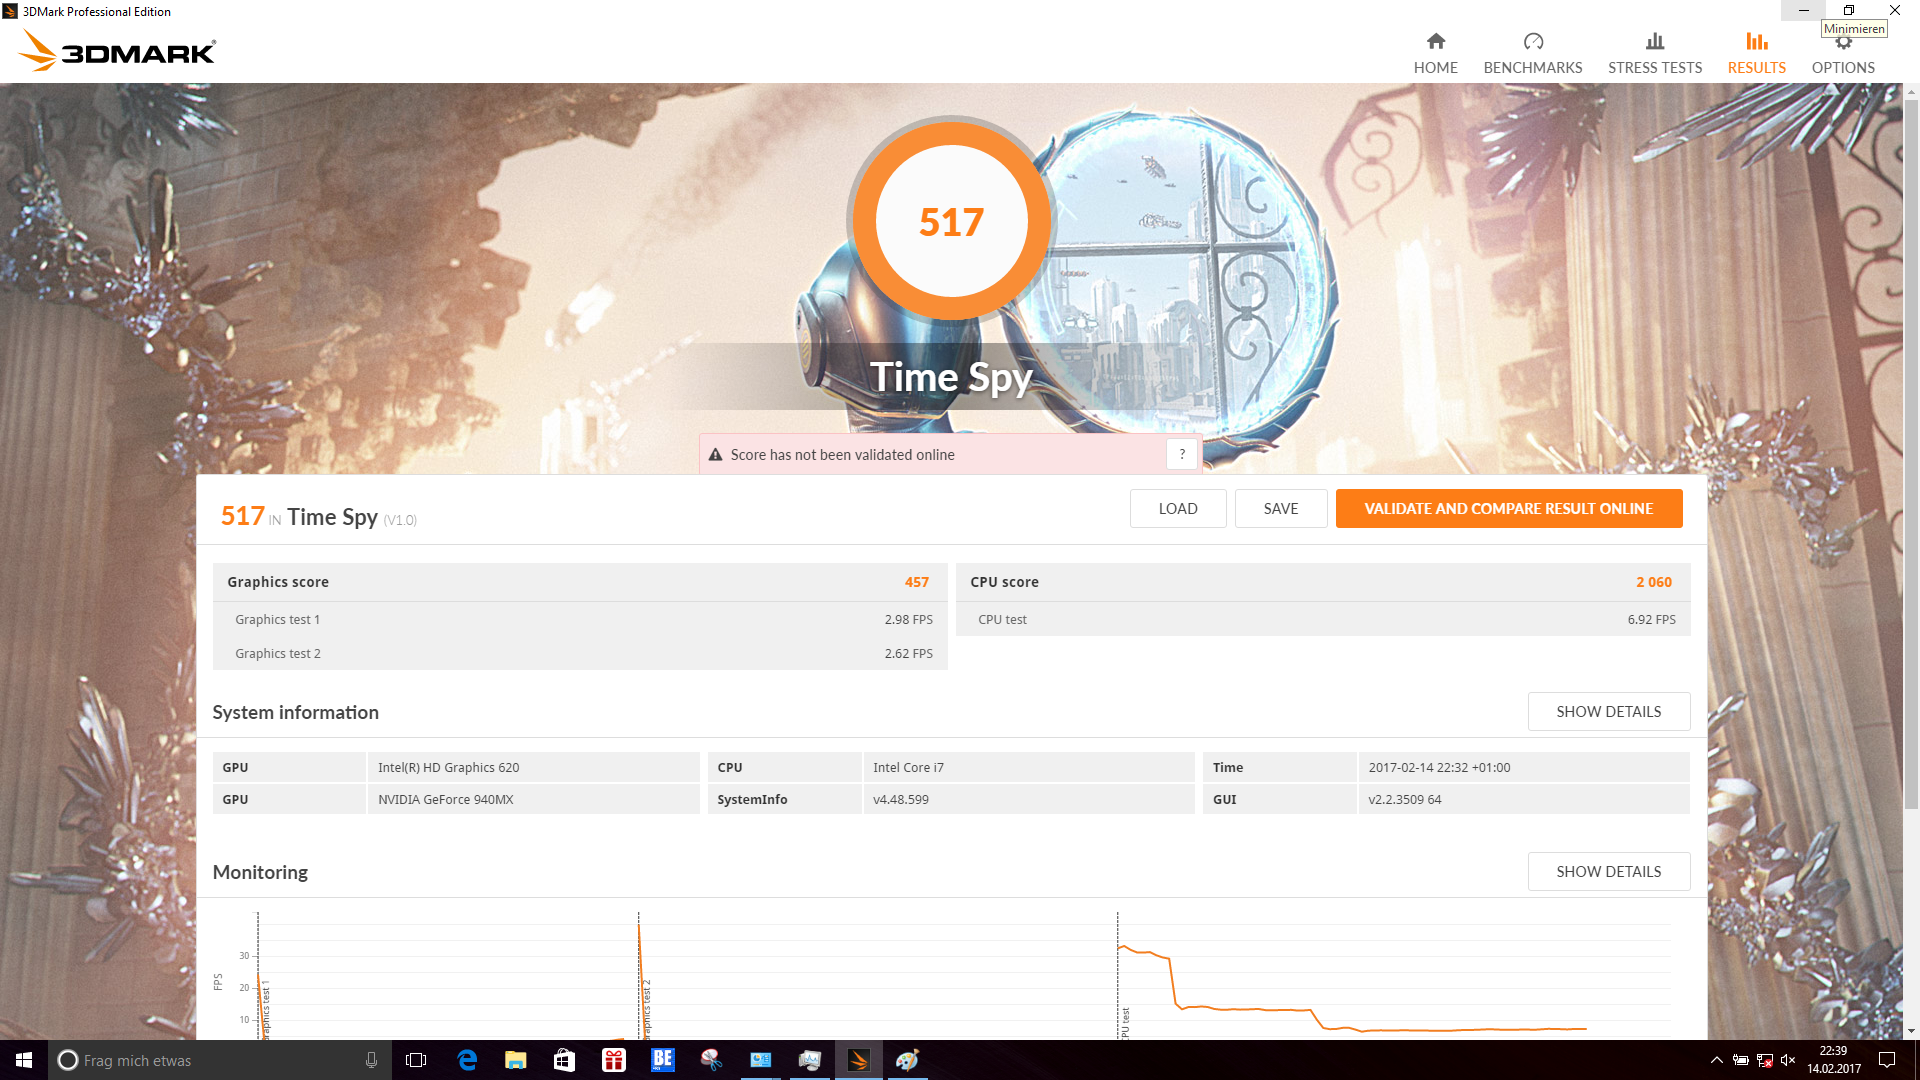
| 3DMark Time Spy Score | 517 punti | |
Aiuto | ||
| BioShock Infinite - 1366x768 Medium Preset | |
| Asus UX310UQ-FC396T | |
| Asus Zenbook UX310UQ-GL011T | |
| Asus Zenbook UX310UA-FC347T iGP | |
| Asus Zenbook UX3410UA | |
| Acer Swift 7 SF713-51 | |
| Battlefield 4 - 1366x768 Medium Preset | |
| Asus UX310UQ-FC396T | |
| Asus Zenbook UX310UQ-GL011T | |
| Asus Zenbook UX3410UA | |
| Asus Zenbook UX310UA-FC347T iGP | |
| Acer Swift 7 SF713-51 | |
| The Witcher 3 - 1366x768 Medium Graphics & Postprocessing | |
| Asus Zenbook UX310UA-FC347T iGP | |
| Asus UX310UQ-FC396T | |
| Asus Zenbook UX310UQ-GL011T | |
| Asus Zenbook UX3410UA | |
| basso | medio | alto | ultra | |
|---|---|---|---|---|
| BioShock Infinite (2013) | 85.3 | 49.4 | 39.8 | 13.6 |
| Battlefield 4 (2013) | 67.6 | 44.1 | 29.5 | 11.2 |
| The Witcher 3 (2015) | 24.6 | 16.8 | 8.9 | 5.6 |
Rumorosità
| Idle |
| 31.1 / 31.1 / 31.5 dB(A) |
| HDD |
| 31.3 dB(A) |
| Sotto carico |
| 38.5 / 39.7 dB(A) |
 | ||
30 dB silenzioso 40 dB(A) udibile 50 dB(A) rumoroso |
||
min: | ||
| Asus UX310UQ-FC396T Intel Core i7-7500U, GeForce 940MX | Asus Zenbook UX310UQ-GL011T Intel Core i7-6500U, GeForce 940MX | Asus Zenbook UX310UA-FC347T iGP Intel Core i7-7500U, HD Graphics 620 | Asus Zenbook UX3410UA Intel Core i7-7500U, HD Graphics 620 | Acer Swift 7 SF713-51 Intel Core i5-7Y54, HD Graphics 615 | Dell XPS 13 9360 FHD i5 Intel Core i5-7200U, HD Graphics 620 | |
|---|---|---|---|---|---|---|
| Noise | 2% | 4% | -4% | 12% | ||
| off /ambiente * (dB) | 30.7 | 30.5 1% | 30.7 -0% | 29.9 3% | ||
| Idle Minimum * (dB) | 31.1 | 30.5 2% | 30.9 1% | 29.9 4% | 28.9 7% | |
| Idle Average * (dB) | 31.1 | 30.5 2% | 30.9 1% | 29.9 4% | 28.9 7% | |
| Idle Maximum * (dB) | 31.5 | 31.5 -0% | 30.9 2% | 35.2 -12% | 28.9 8% | |
| Load Average * (dB) | 38.5 | 36.2 6% | 35.6 8% | 43.5 -13% | 30.9 20% | |
| Load Maximum * (dB) | 39.7 | 40 -1% | 34.1 14% | 43.8 -10% | 33.5 16% |
* ... Meglio usare valori piccoli
| Asus UX310UQ-FC396T GeForce 940MX, i7-7500U, SanDisk SD8SN8U512G1002 | Asus Zenbook UX310UQ-GL011T GeForce 940MX, 6500U, SanDisk SD8SNAT256G1002 | Asus Zenbook UX310UA-FC347T iGP HD Graphics 620, i7-7500U, Micron SSD 1100 (MTFDDAV256TBN) | Asus Zenbook UX3410UA HD Graphics 620, i7-7500U, SanDisk SD8SN8U512G1002 | Acer Swift 7 SF713-51 HD Graphics 615, i5-7Y54, Kingston RBU-SNS4180S3256GG | Dell XPS 13 9360 FHD i5 HD Graphics 620, i5-7200U, Toshiba NVMe THNSN5256GPUK | |
|---|---|---|---|---|---|---|
| Heat | 6% | 12% | 0% | -6% | -6% | |
| Maximum Upper Side * (°C) | 40 | 38.5 4% | 33.7 16% | 39.4 1% | 45.7 -14% | 43.4 -9% |
| Maximum Bottom * (°C) | 42.4 | 40.4 5% | 34.1 20% | 35.2 17% | 48.7 -15% | 49.2 -16% |
| Idle Upper Side * (°C) | 23.9 | 24.8 -4% | 25.2 -5% | 29.4 -23% | 25.5 -7% | 26.4 -10% |
| Idle Bottom * (°C) | 29.3 | 23.8 19% | 24.1 18% | 27.6 6% | 25.2 14% | 26.4 10% |
* ... Meglio usare valori piccoli
(±) La temperatura massima sul lato superiore è di 40 °C / 104 F, rispetto alla media di 35.9 °C / 97 F, che varia da 21.4 a 59 °C per questa classe Subnotebook.
(±) Il lato inferiore si riscalda fino ad un massimo di 42.4 °C / 108 F, rispetto alla media di 39.2 °C / 103 F
(+) In idle, la temperatura media del lato superiore è di 22.9 °C / 73 F, rispetto alla media deld ispositivo di 30.8 °C / 87 F.
(+) I poggiapolsi e il touchpad sono piu' freddi della temperatura della pelle con un massimo di 29 °C / 84.2 F e sono quindi freddi al tatto.
(±) La temperatura media della zona del palmo della mano di dispositivi simili e'stata di 28.2 °C / 82.8 F (-0.8 °C / -1.4 F).
Asus UX310UQ-FC396T analisi audio
(±) | potenza degli altiparlanti media ma buona (72 dB)
Bassi 100 - 315 Hz
(±) | bassi ridotti - in media 13.1% inferiori alla media
(+) | bassi in lineaa (6.5% delta rispetto alla precedente frequenza)
Medi 400 - 2000 Hz
(+) | medi bilanciati - solo only 2.8% rispetto alla media
(+) | medi lineari (3.3% delta rispetto alla precedente frequenza)
Alti 2 - 16 kHz
(±) | alti elevati - circa 6.6% superiori alla media
(+) | alti lineari (4.3% delta rispetto alla precedente frequenza)
Nel complesso 100 - 16.000 Hz
(±) | la linearità complessiva del suono è media (16.1% di differenza rispetto alla media
Rispetto alla stessa classe
» 39% di tutti i dispositivi testati in questa classe è stato migliore, 4% simile, 56% peggiore
» Il migliore ha avuto un delta di 5%, medio di 18%, peggiore di 53%
Rispetto a tutti i dispositivi testati
» 26% di tutti i dispositivi testati in questa classe è stato migliore, 5% similare, 69% peggiore
» Il migliore ha avuto un delta di 4%, medio di 23%, peggiore di 134%
Apple MacBook 12 (Early 2016) 1.1 GHz analisi audio
(+) | gli altoparlanti sono relativamente potenti (83.6 dB)
Bassi 100 - 315 Hz
(±) | bassi ridotti - in media 11.3% inferiori alla media
(±) | la linearità dei bassi è media (14.2% delta rispetto alla precedente frequenza)
Medi 400 - 2000 Hz
(+) | medi bilanciati - solo only 2.4% rispetto alla media
(+) | medi lineari (5.5% delta rispetto alla precedente frequenza)
Alti 2 - 16 kHz
(+) | Alti bilanciati - appena 2% dalla media
(+) | alti lineari (4.5% delta rispetto alla precedente frequenza)
Nel complesso 100 - 16.000 Hz
(+) | suono nel complesso lineare (10.2% differenza dalla media)
Rispetto alla stessa classe
» 7% di tutti i dispositivi testati in questa classe è stato migliore, 2% simile, 90% peggiore
» Il migliore ha avuto un delta di 5%, medio di 18%, peggiore di 53%
Rispetto a tutti i dispositivi testati
» 5% di tutti i dispositivi testati in questa classe è stato migliore, 1% similare, 94% peggiore
» Il migliore ha avuto un delta di 4%, medio di 23%, peggiore di 134%
| Off / Standby | |
| Idle | |
| Sotto carico |
|
Leggenda:
min: | |
| Asus UX310UQ-FC396T i7-7500U, GeForce 940MX, SanDisk SD8SN8U512G1002, IPS, LED, 1920x1080, 13.3" | Asus Zenbook UX310UQ-GL011T 6500U, GeForce 940MX, SanDisk SD8SNAT256G1002, TN LED, 1920x1080, 13.3" | Asus Zenbook UX310UA-FC347T iGP i7-7500U, HD Graphics 620, Micron SSD 1100 (MTFDDAV256TBN), IPS, LED, 1920x1080, 13.3" | Asus Zenbook UX3410UA i7-7500U, HD Graphics 620, SanDisk SD8SN8U512G1002, IPS, 1920x1080, 14" | Acer Swift 7 SF713-51 i5-7Y54, HD Graphics 615, Kingston RBU-SNS4180S3256GG, IPS, WLED, 1920x1080, 13.3" | Dell XPS 13 9360 FHD i5 i5-7200U, HD Graphics 620, Toshiba NVMe THNSN5256GPUK, IPS, 1920x1080, 13.3" | |
|---|---|---|---|---|---|---|
| Power Consumption | 17% | 23% | 22% | 37% | 40% | |
| Idle Minimum * (Watt) | 4.1 | 3 27% | 3.5 15% | 3.7 10% | 4.1 -0% | 4.1 -0% |
| Idle Average * (Watt) | 8.2 | 5.6 32% | 6.6 20% | 6 27% | 6.4 22% | 4.2 49% |
| Idle Maximum * (Watt) | 8.9 | 6.8 24% | 7.5 16% | 6.78 24% | 6.8 24% | 5.1 43% |
| Load Average * (Watt) | 48 | 48.7 -1% | 34.7 28% | 37.3 22% | 16 67% | 22.1 54% |
| Load Maximum * (Watt) | 64.1 | 63 2% | 39.6 38% | 47.4 26% | 18.7 71% | 29.4 54% |
* ... Meglio usare valori piccoli
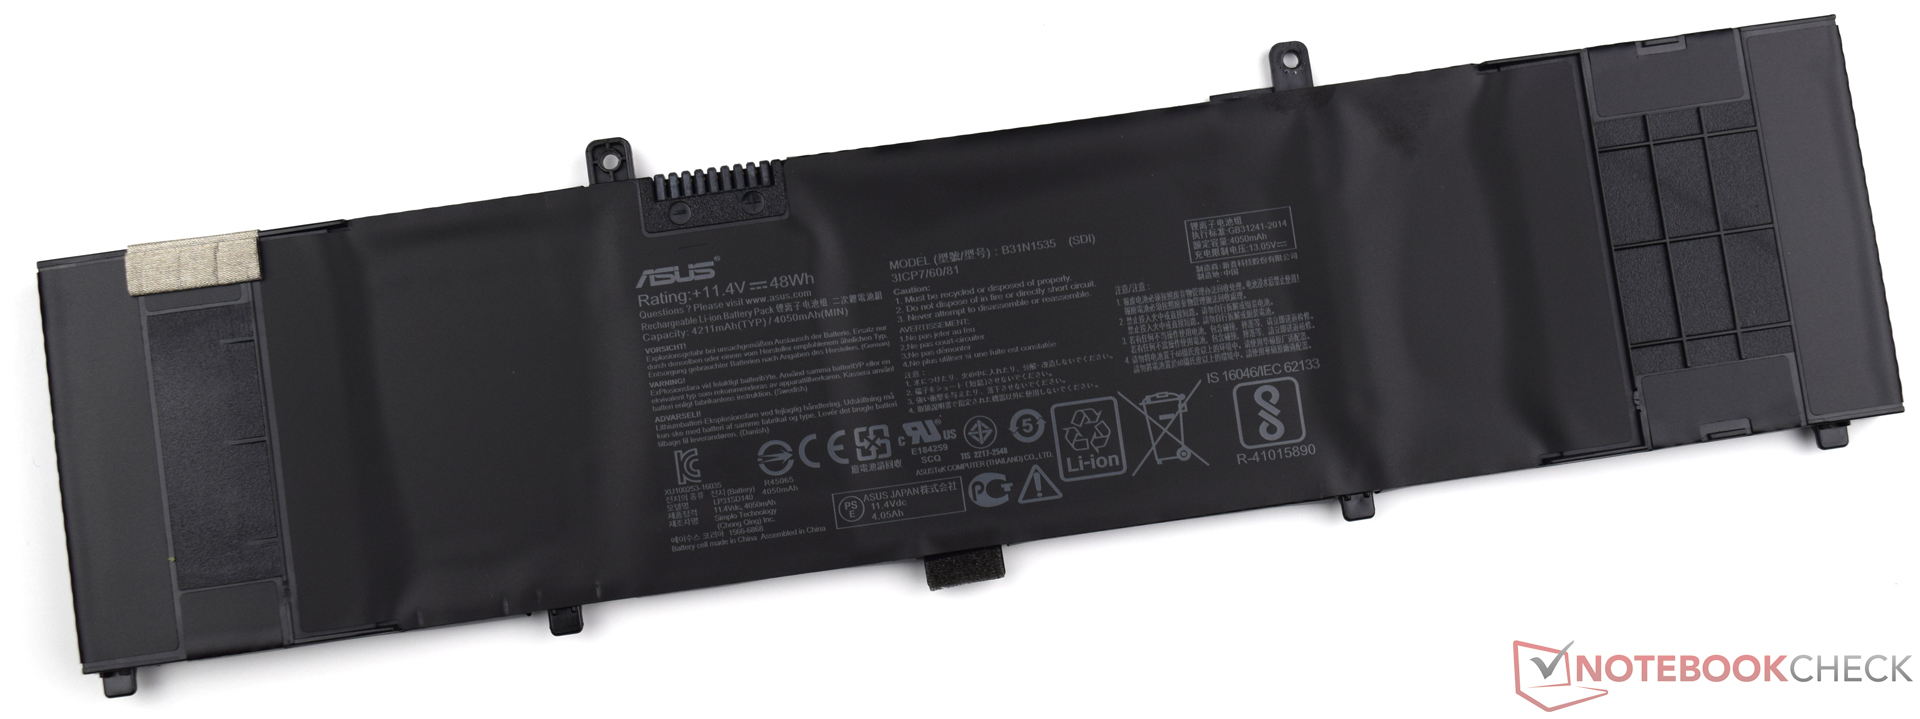
| Asus UX310UQ-FC396T i7-7500U, GeForce 940MX, 48 Wh | Asus Zenbook UX310UQ-GL011T 6500U, GeForce 940MX, 48 Wh | Asus Zenbook UX310UA-FC347T iGP i7-7500U, HD Graphics 620, 48 Wh | Asus Zenbook UX3410UA i7-7500U, HD Graphics 620, 48 Wh | Acer Swift 7 SF713-51 i5-7Y54, HD Graphics 615, 41.58 Wh | Dell XPS 13 9360 FHD i5 i5-7200U, HD Graphics 620, 60 Wh | |
|---|---|---|---|---|---|---|
| Autonomia della batteria | -6% | 4% | 7% | 7% | 38% | |
| Reader / Idle (h) | 15.3 | 14.6 -5% | 16.1 5% | 17.7 16% | 13.2 -14% | 21.6 41% |
| H.264 (h) | 7.3 | 7 -4% | 6.9 -5% | 10.1 38% | 6.8 -7% | |
| WiFi v1.3 (h) | 8.8 | 8.1 -8% | 9.6 9% | 7.4 -16% | 7.3 -17% | 11.3 28% |
| Load (h) | 1.8 | 1.7 -6% | 1.9 6% | 1.6 -11% | 3 67% | 2.6 44% |
Pro
Contro
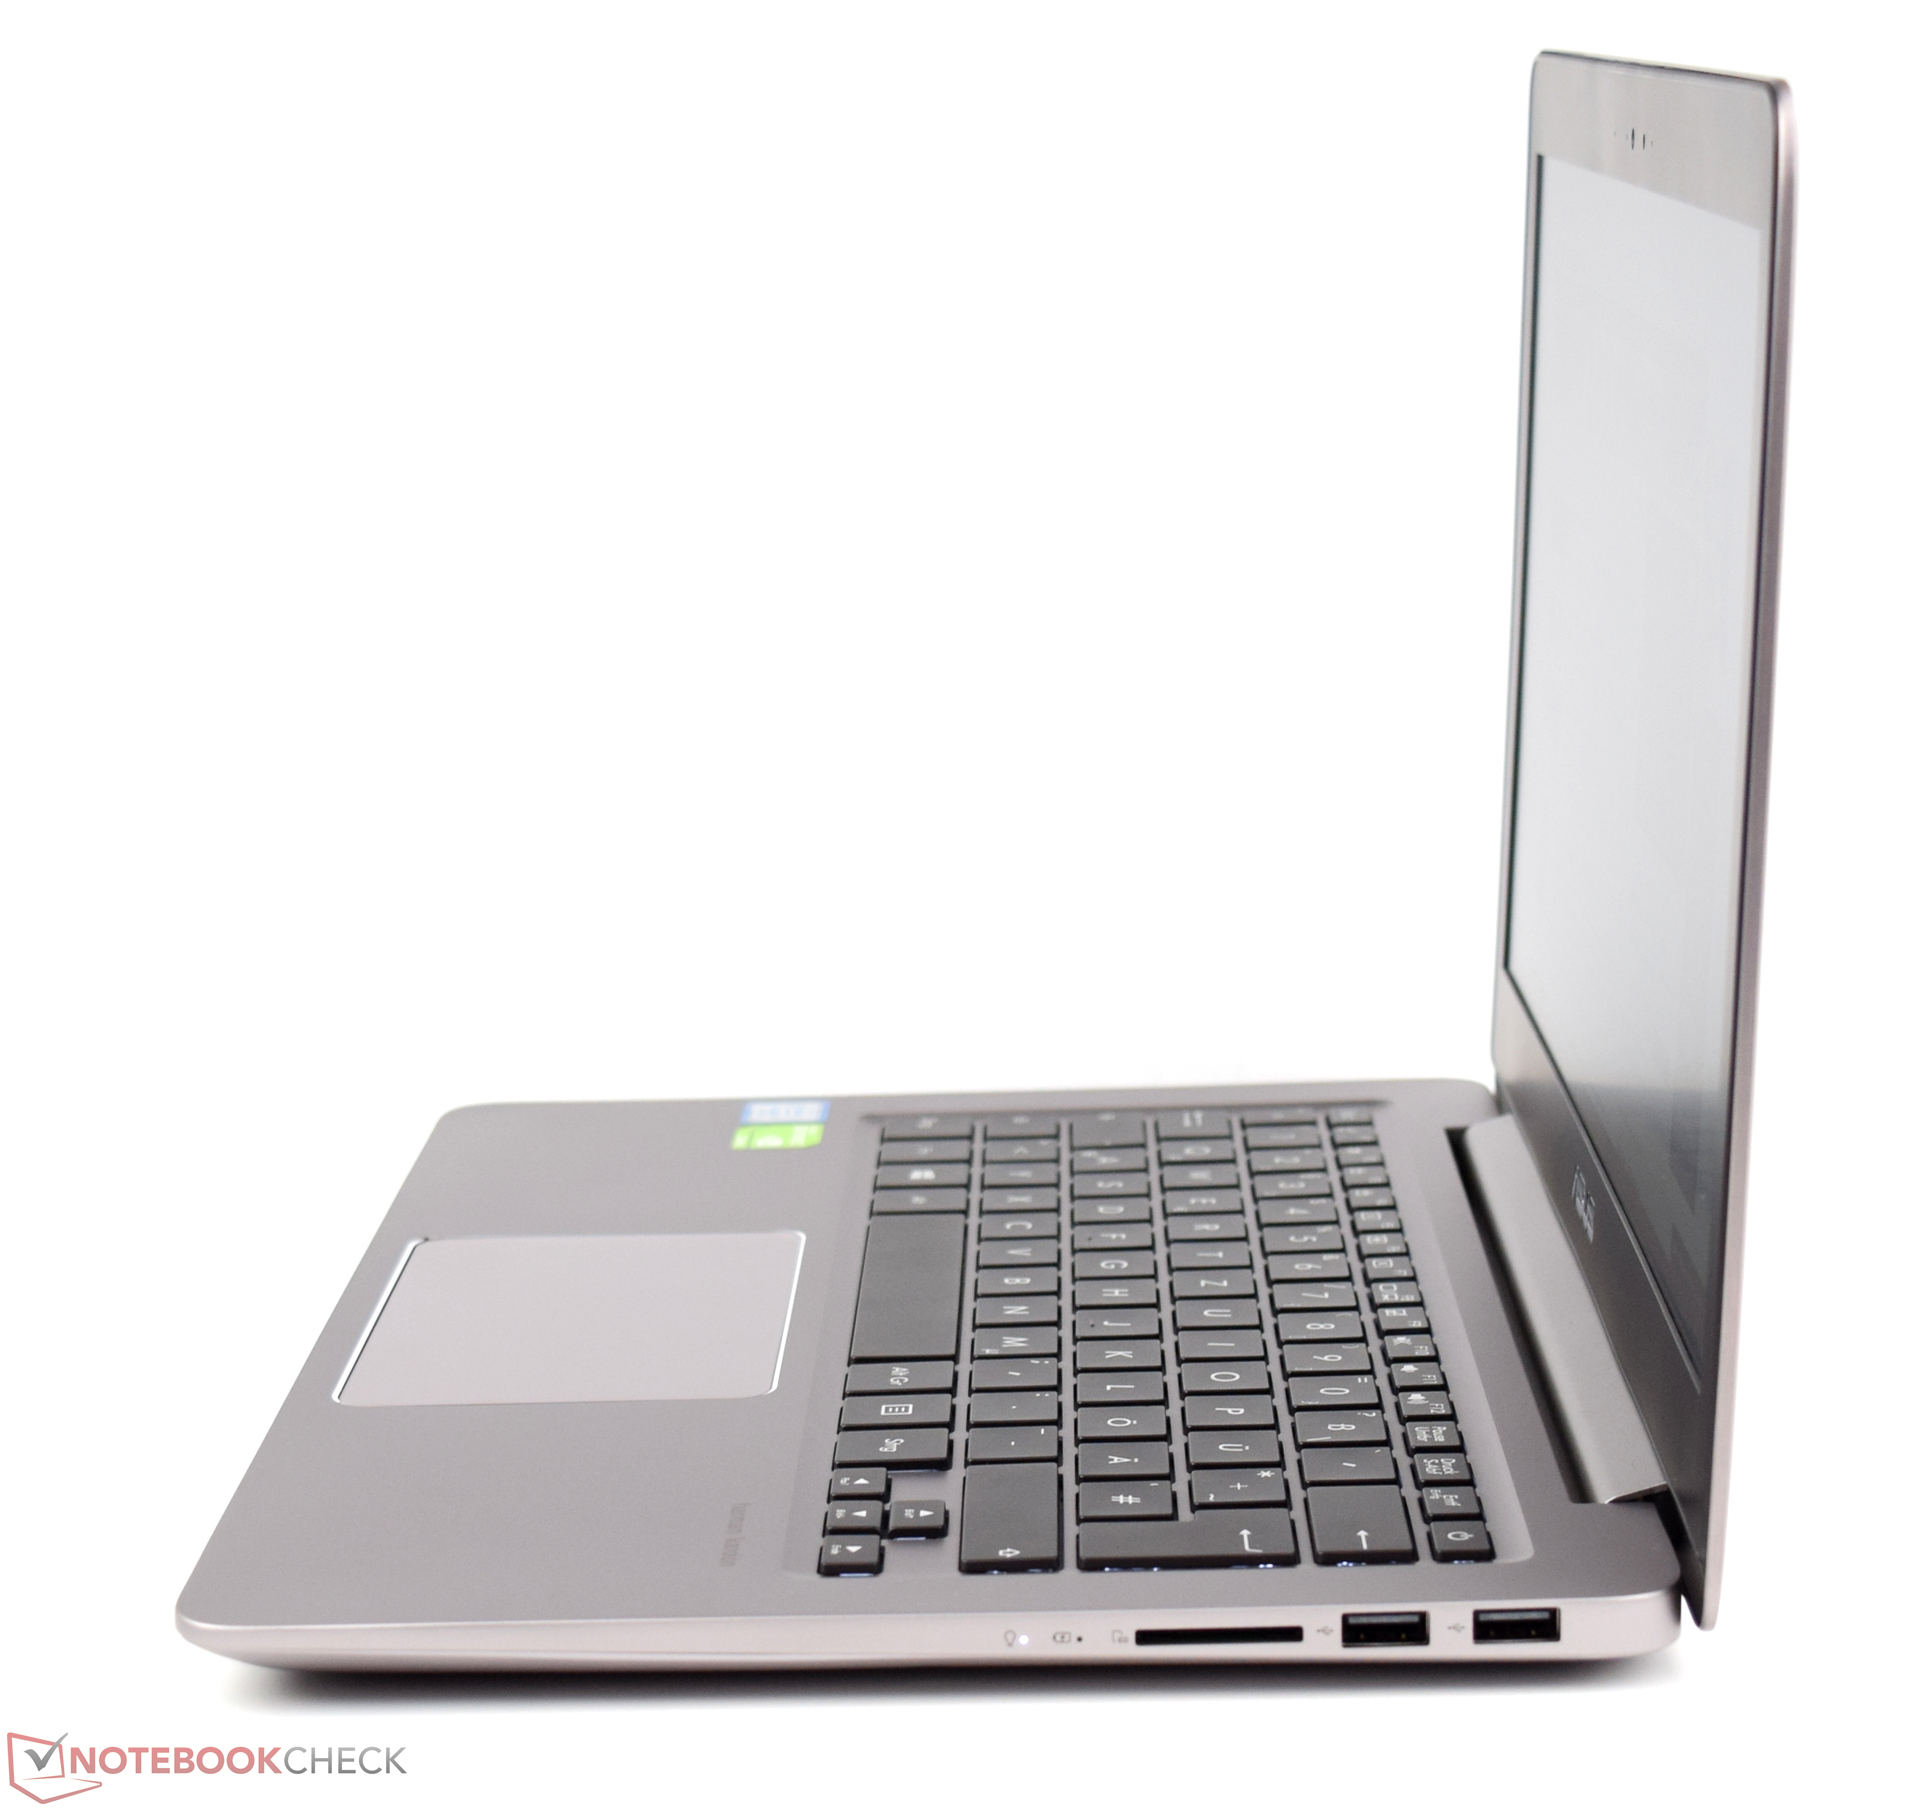
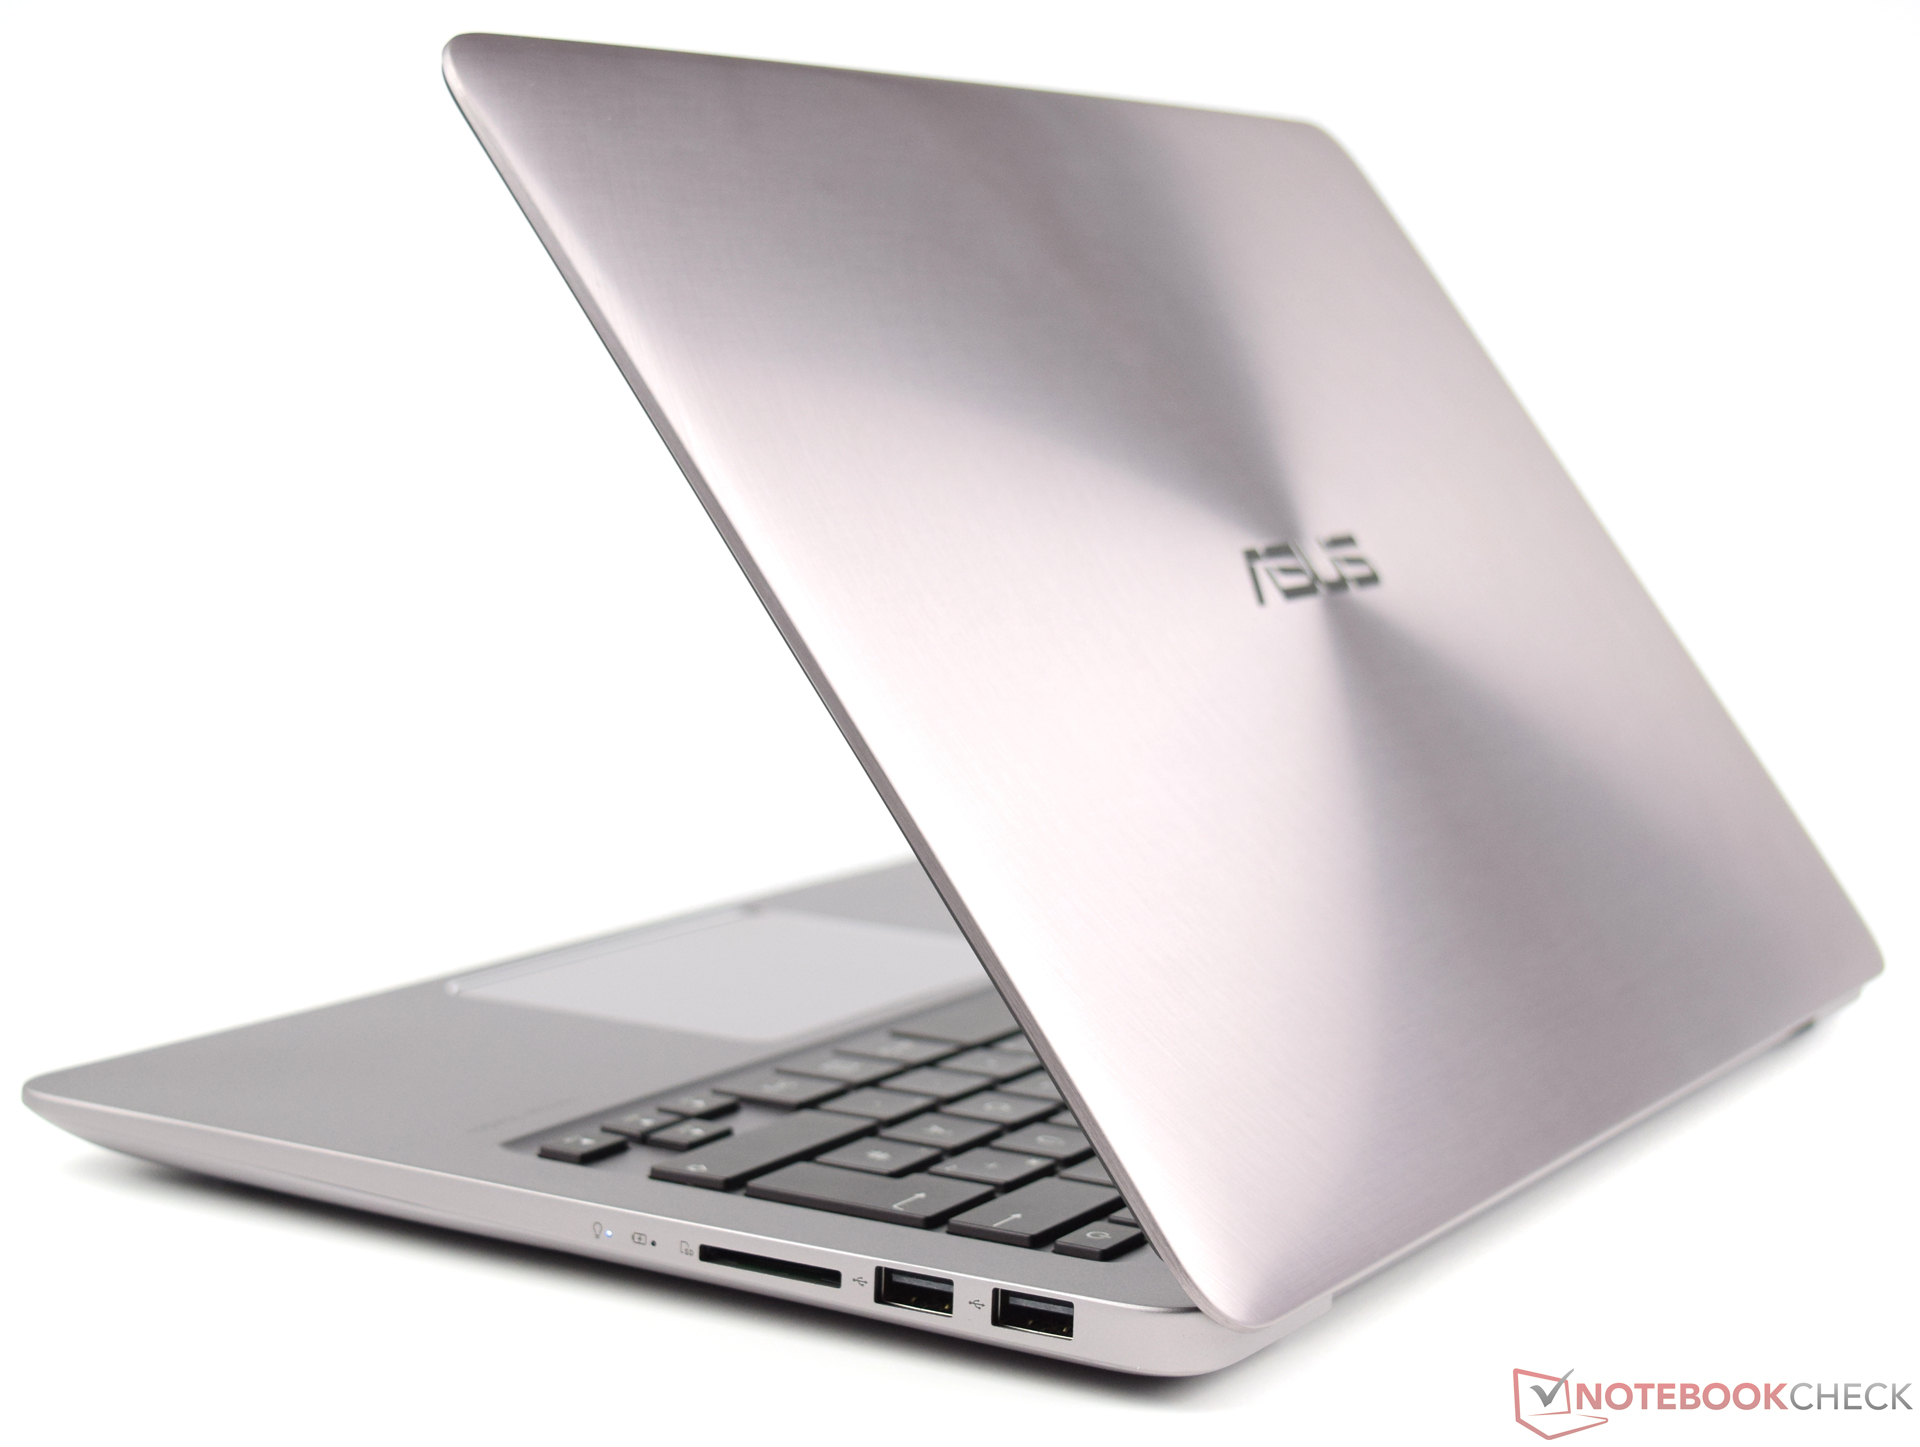
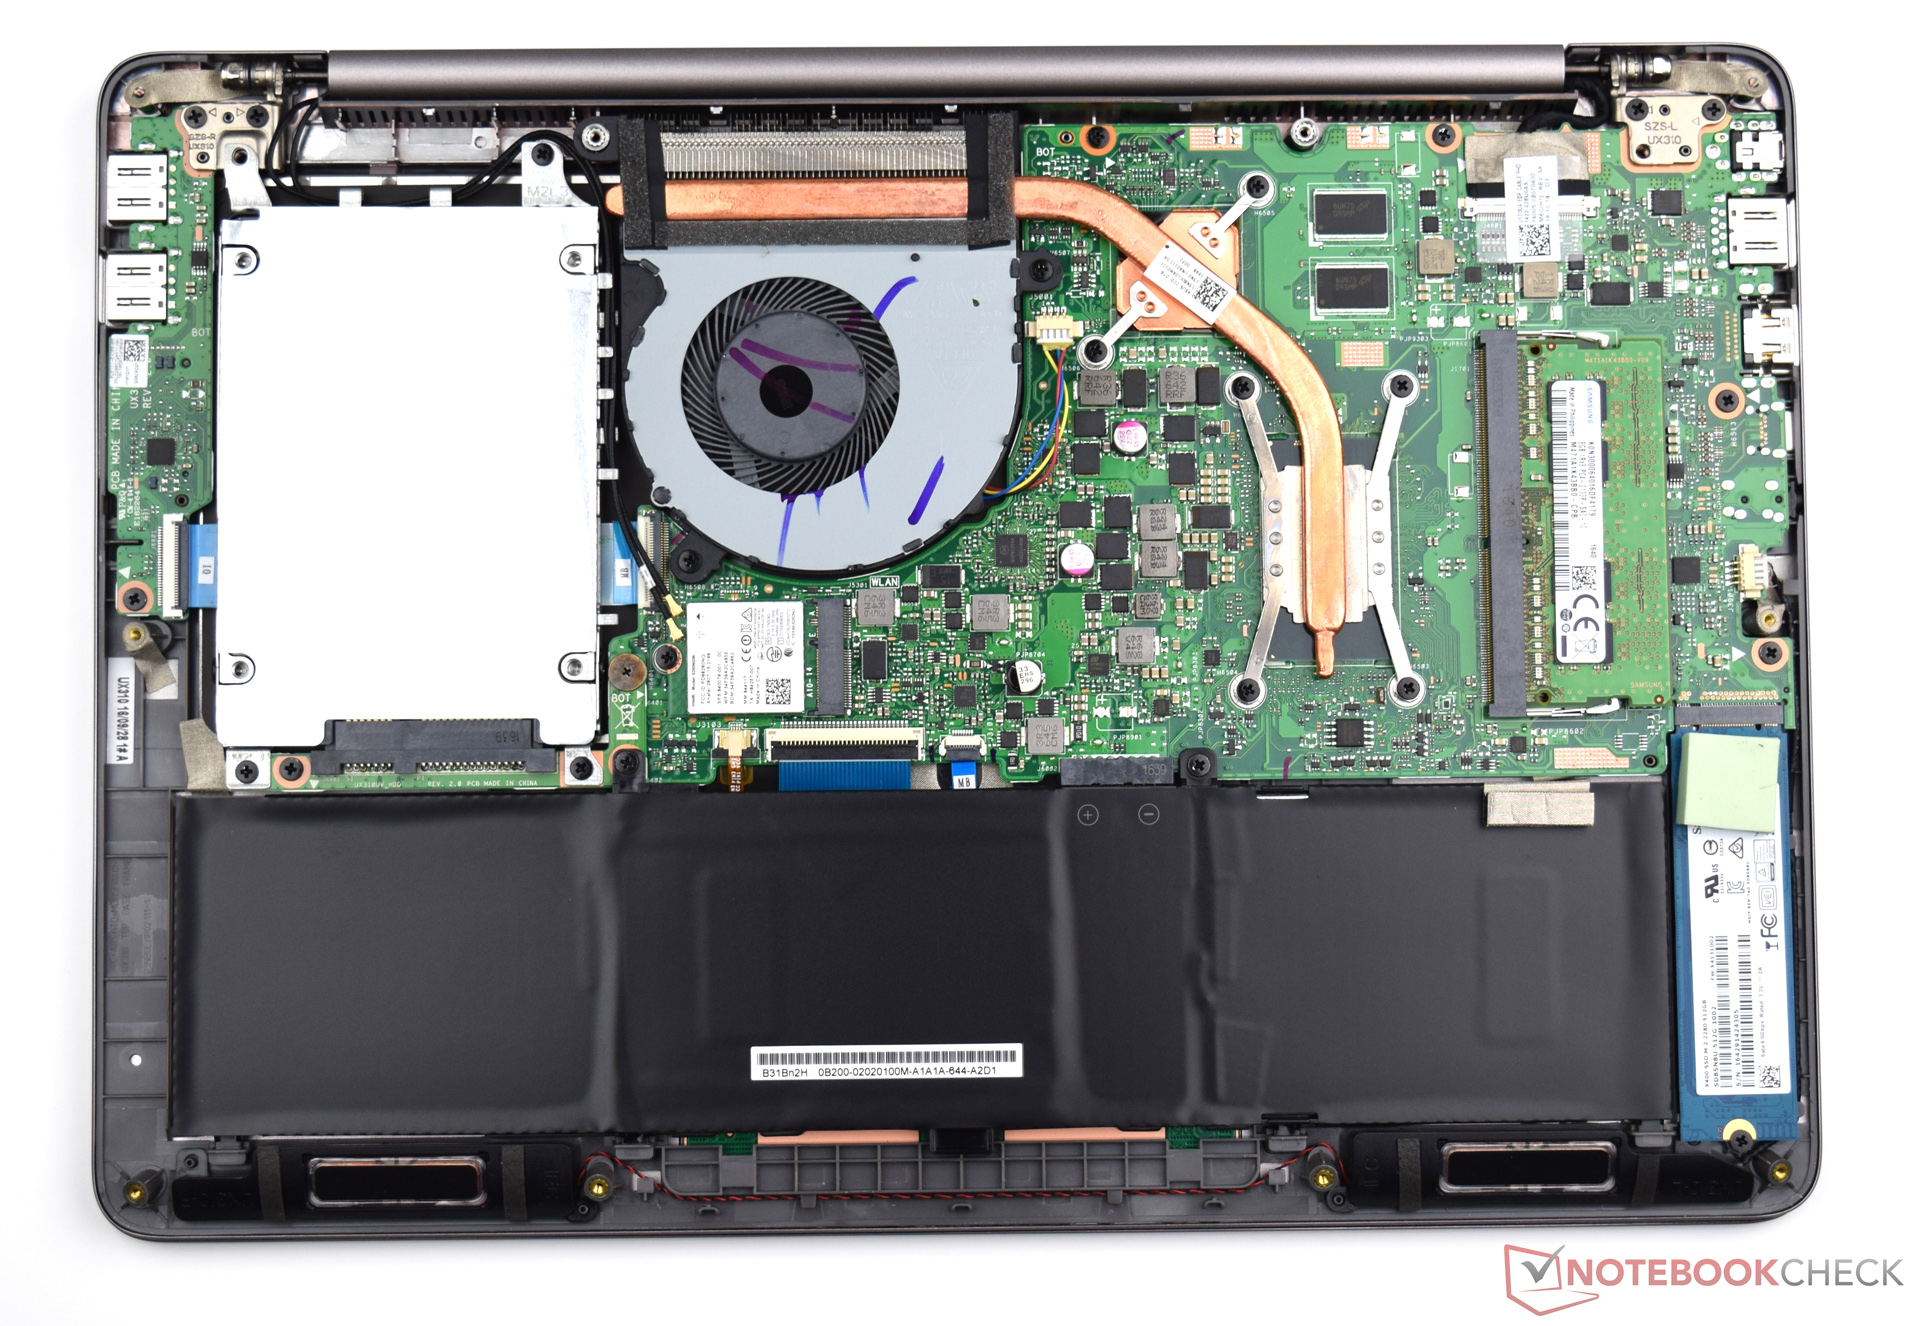
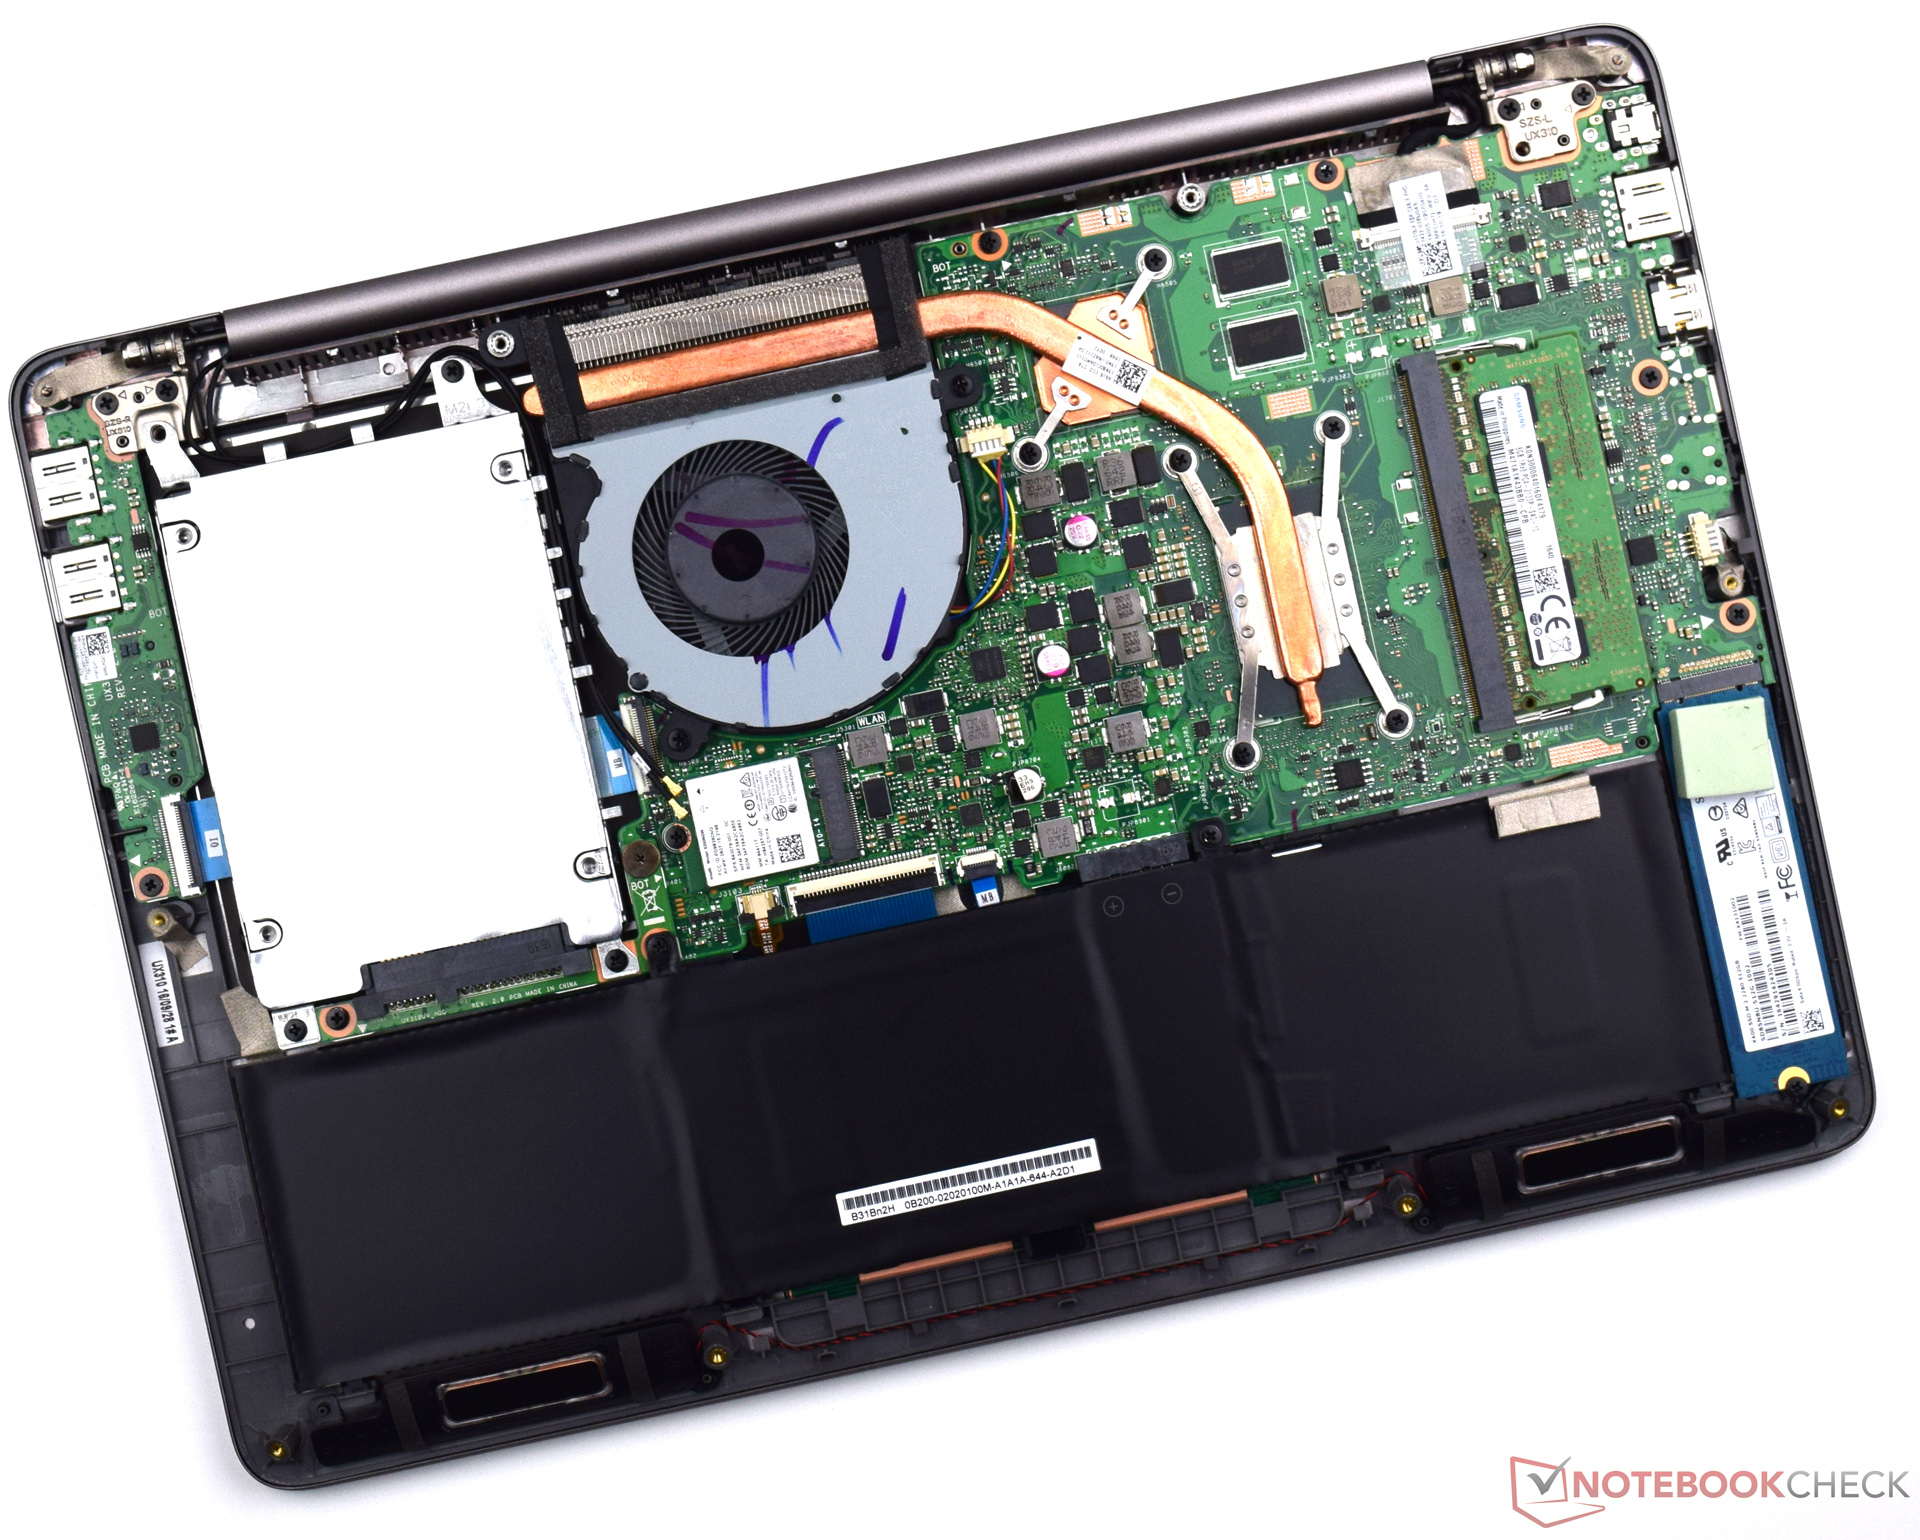
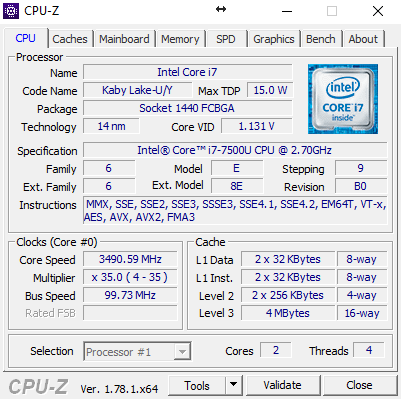
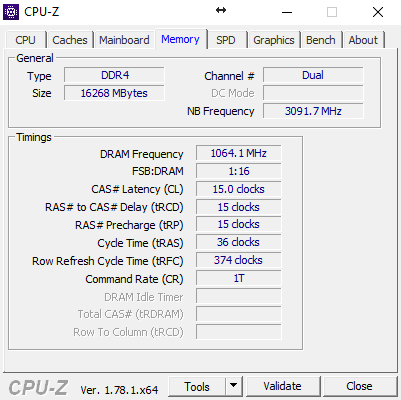
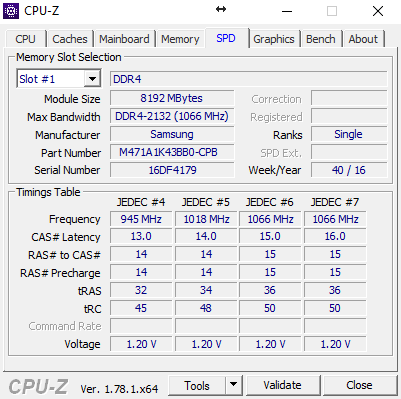
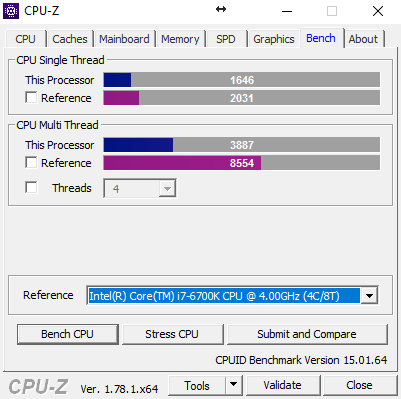
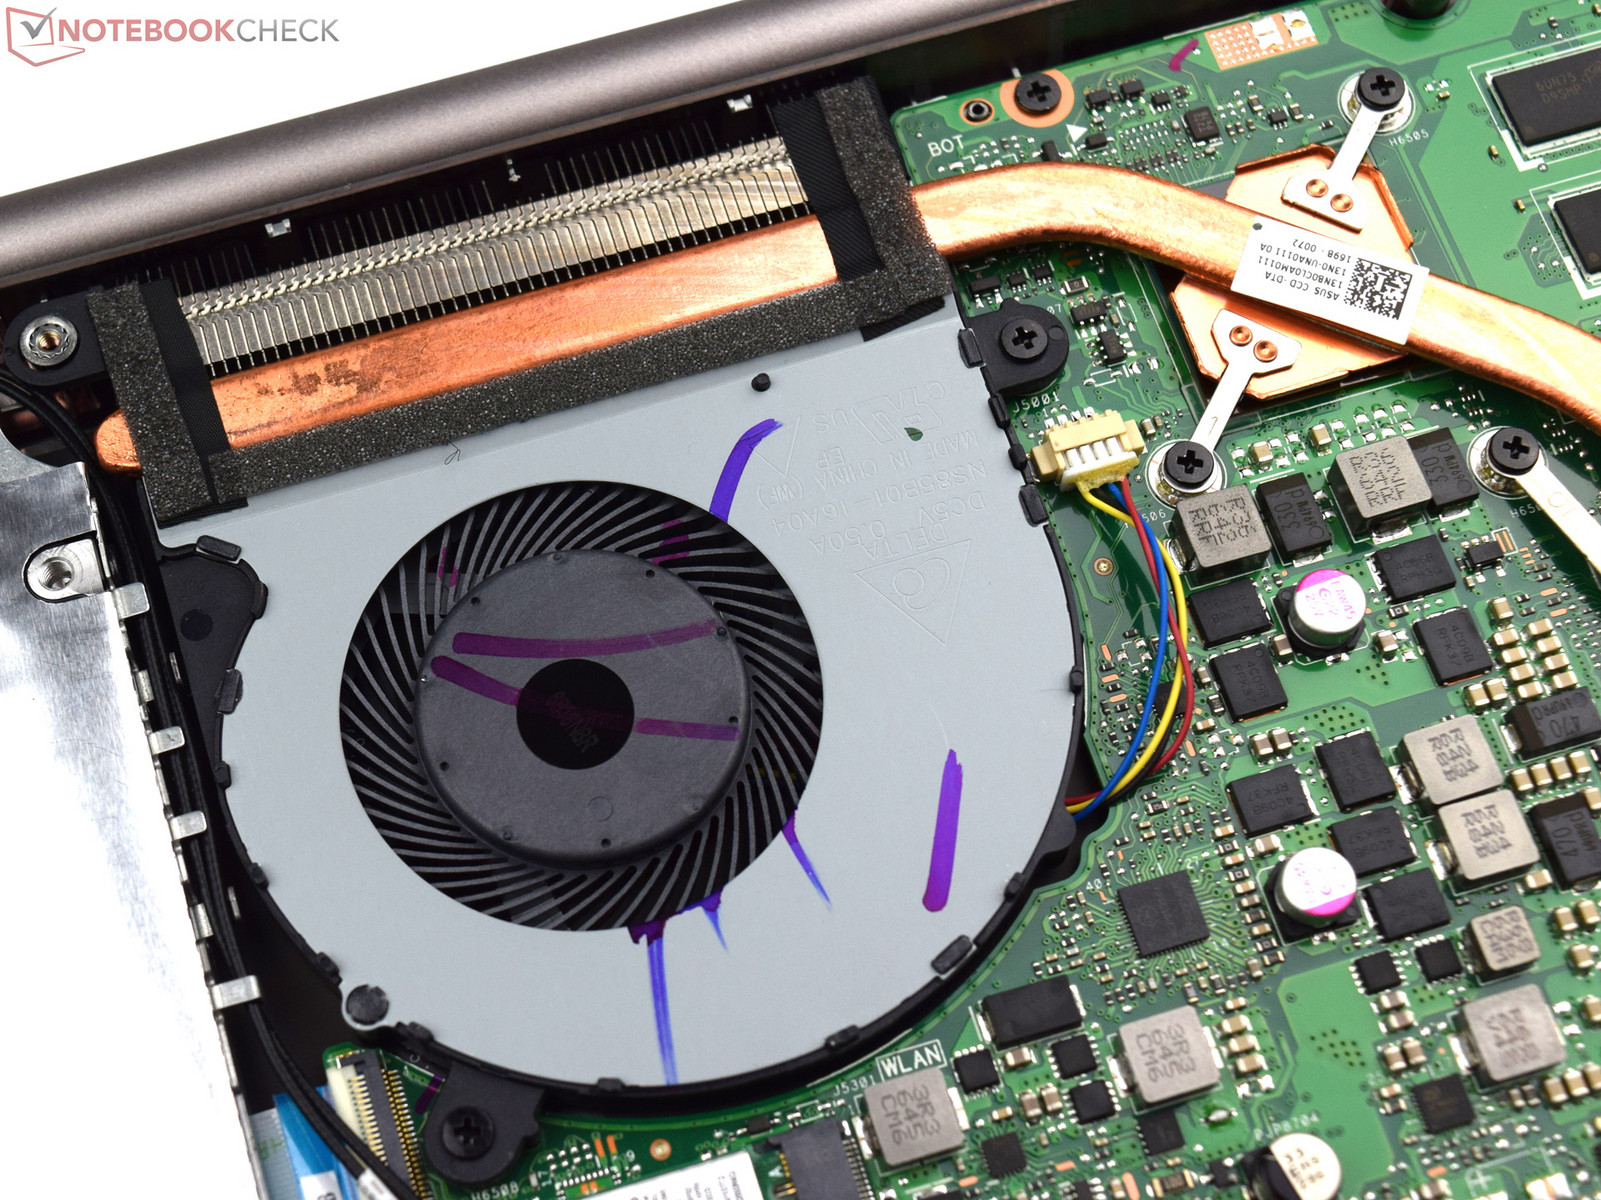
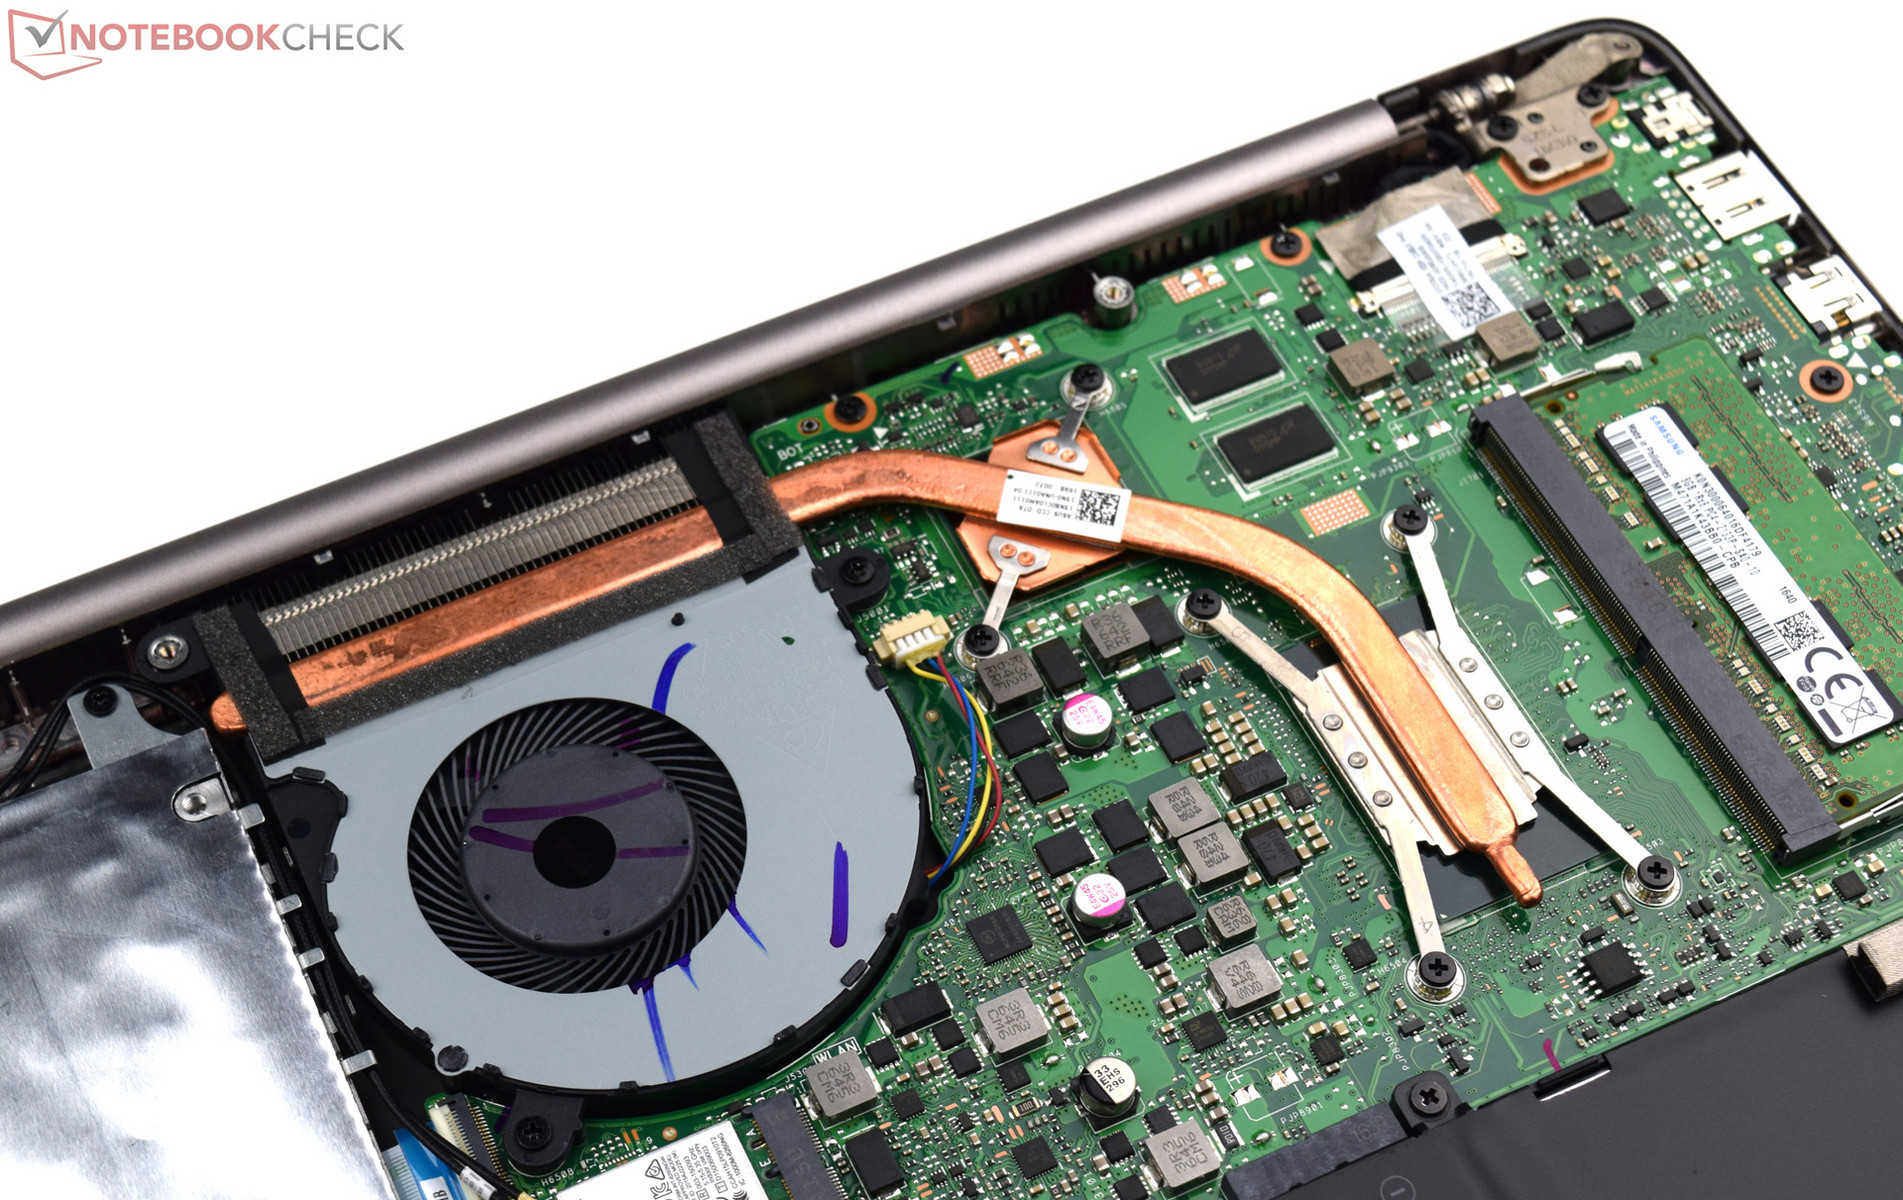
L'Asus ZenBook UX310UQ-FC396T conserva molte delle caratteristiche positive del suo predecessore,le features esterne del laptop non sono cambiate. L'Asus ZenBook UX310UQ-FC396T è un elegante, subnotebook leggero che può vantare di ottima qualità di manifattura. Con il suo aggiornato processore Kaby Lake, le sue perfomance di sistema sono leggermente migliori rispetto al suo predecessore. Il processore Intel Core i7-7500U offre potenza più che sufficiente per il nostro ZenBook. Ha anche un'ampia memoria (16 GB di RAM DDR4), e con una capacità di 1.5 TB, ci vorrà del tempo affinchè un utente medio finisca lo spazio .
L'Asus ZenBook UX310UQ-FC396T sottile e con design di classe, fa girare la testa, ed è fatto di materiali piacevoli e di alta qualità. Né il display o le perfomance del sistema lasciano molto spazio critiche.
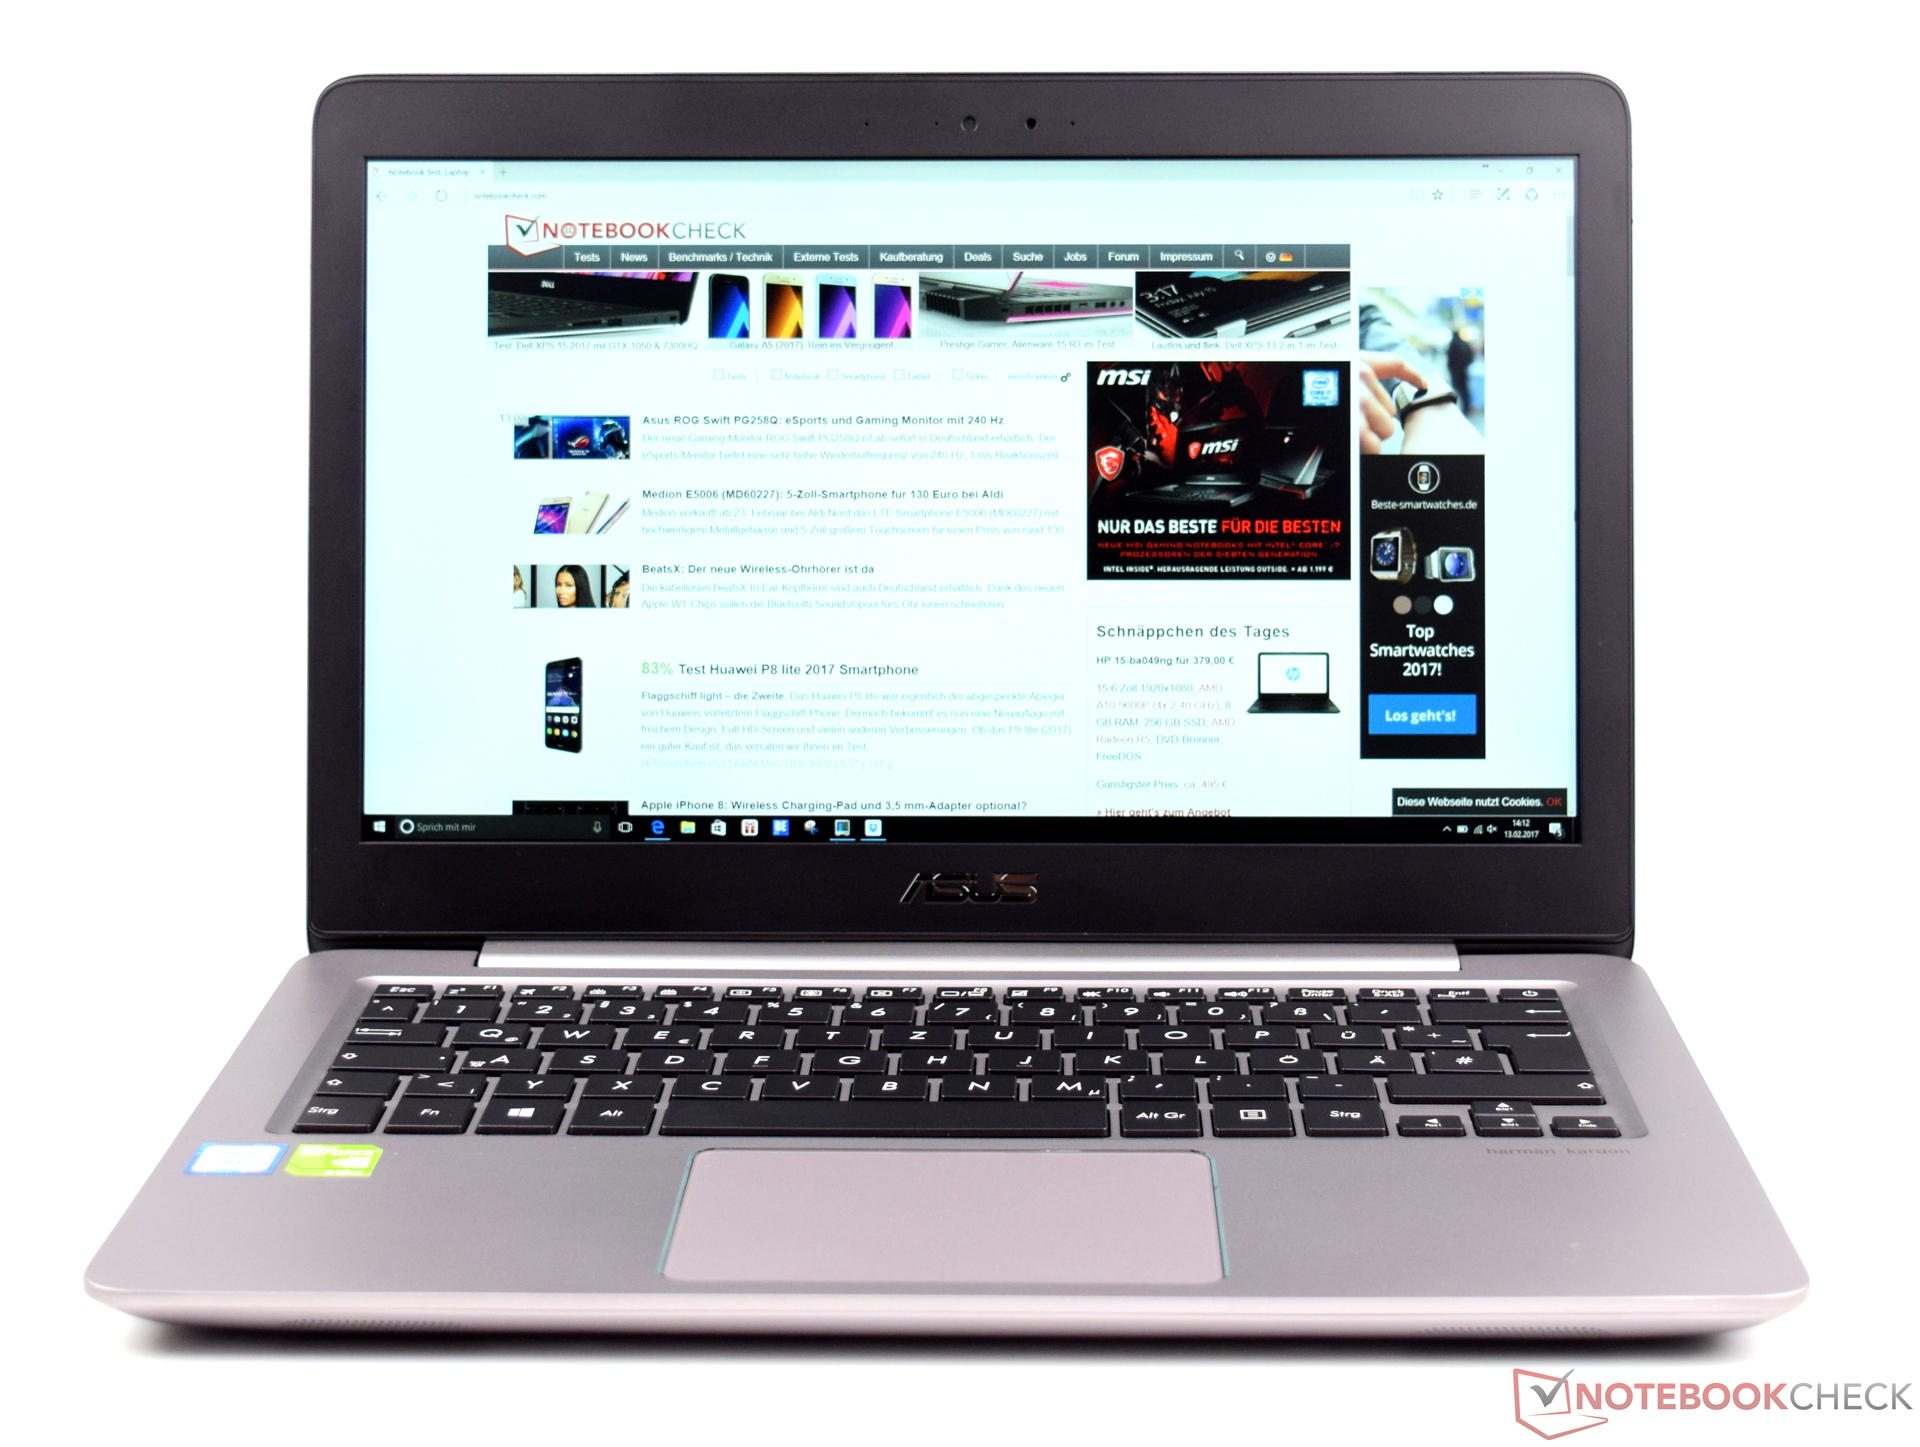
In conclusione, possiamo confermare che Asus lo ha fatto di nuovo: lo ZenBook UX310UQ-FC396T offre sia una lunga durata della batteria e riserve di perfomance sufficienti per rimanere veloci nei prossimi anni. Il display offre una buona qualità delle immagini, e grazie alla tecnologia IPS, il contenuto dello schermo appare stabile da quasi ogni angolo. Un bel bonus: Il dispositivo che abbiamo testato è dotato di una custodia per proteggere il computer da sporco e graffi durante il trasporto.
Nota: si tratta di una recensione breve, con alcune sezioni non tradotte, per la versione integrale in inglese guardate qui.
Asus UX310UQ-FC396T
- 02/24/2017 v6 (old)
Sebastian Bade