Recensione breve del Portatile Asus ZenBook UX310UQ-GL011T
| SD Card Reader | |
| average JPG Copy Test (av. of 3 runs) | |
| Lenovo Yoga 710-14ISK | |
| HP Pavilion 14-al003ng | |
| Lenovo ThinkPad T460p-20FXS05500 | |
| Asus Zenbook UX310UQ-GL011T | |
| Asus Zenbook UX330UA-FC059T | |
| maximum AS SSD Seq Read Test (1GB) | |
| Lenovo Yoga 710-14ISK | |
| Lenovo ThinkPad T460p-20FXS05500 | |
| HP Pavilion 14-al003ng | |
| Asus Zenbook UX310UQ-GL011T | |
| Asus Zenbook UX330UA-FC059T | |
| Networking | |
| iperf Server (receive) TCP 1 m | |
| Asus Zenbook UX310UQ-GL011T (jseb) | |
| Asus Zenbook UX330UA-FC059T | |
| Asus Zenbook UX360UA-C4159T | |
| HP Spectre x2 12-a001ng | |
| iperf Client (transmit) TCP 1 m | |
| Asus Zenbook UX310UQ-GL011T (jseb) | |
| Asus Zenbook UX360UA-C4159T | |
| Asus Zenbook UX330UA-FC059T (jseb) | |
| HP Spectre x2 12-a001ng | |
| |||||||||||||||||||||||||
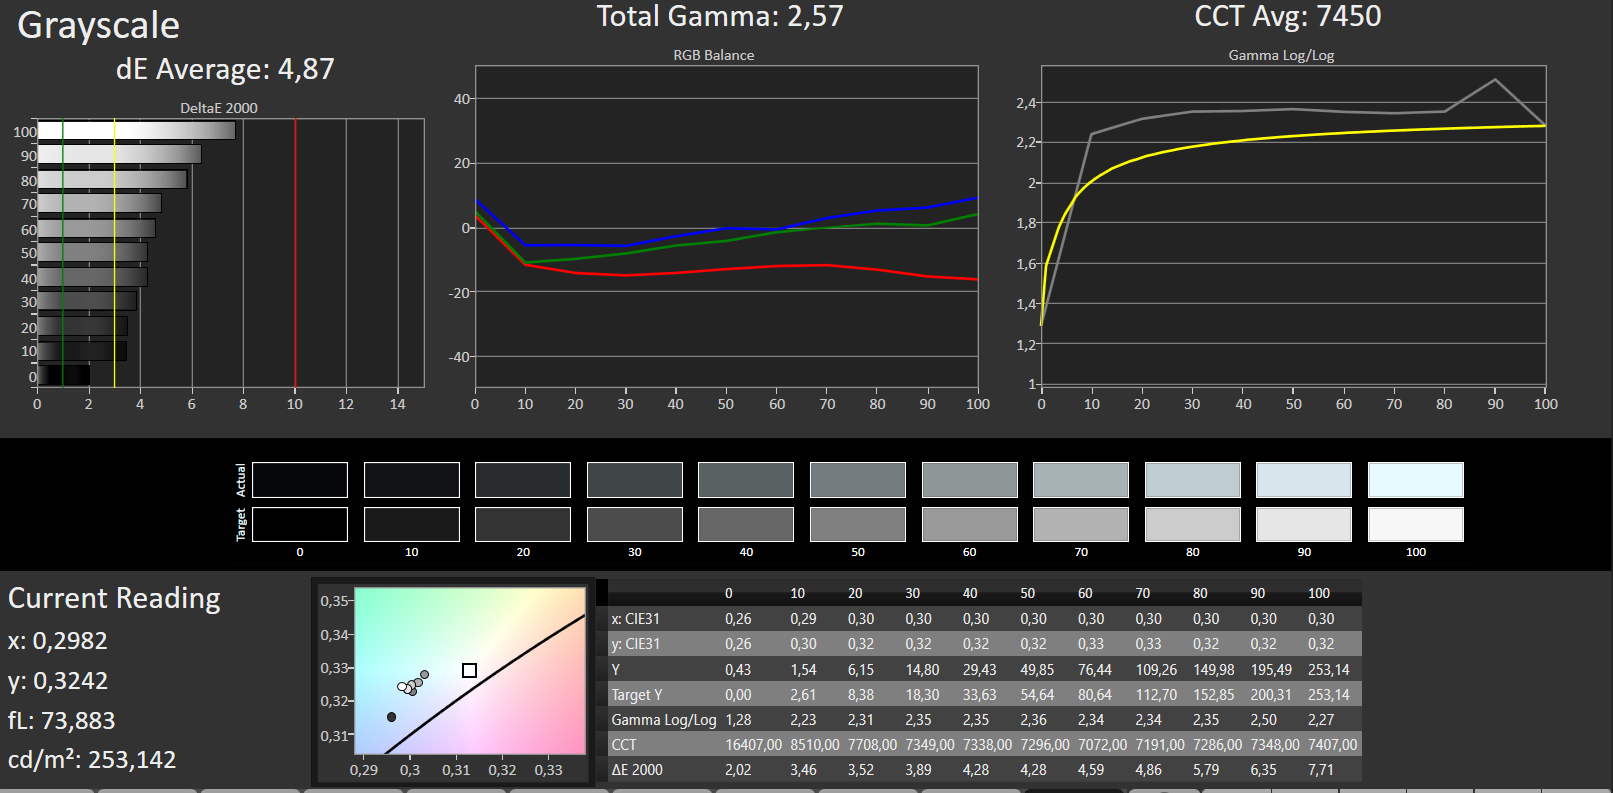
Distribuzione della luminosità: 90 %
Al centro con la batteria: 247 cd/m²
Contrasto: 574:1 (Nero: 0.43 cd/m²)
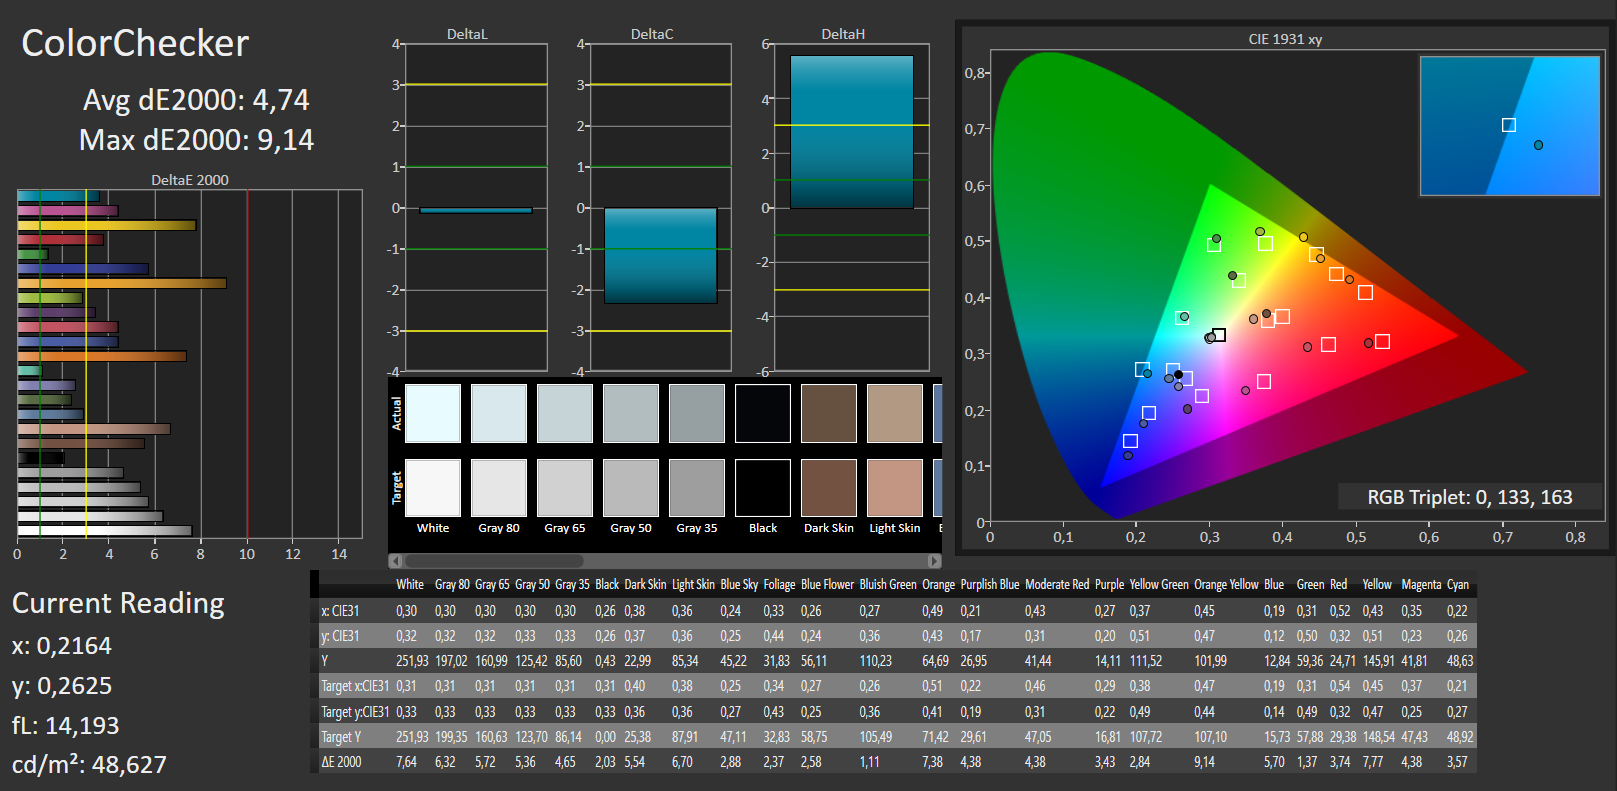
ΔE ColorChecker Calman: 4.74 | ∀{0.5-29.43 Ø4.73}
ΔE Greyscale Calman: 4.87 | ∀{0.09-98 Ø4.97}
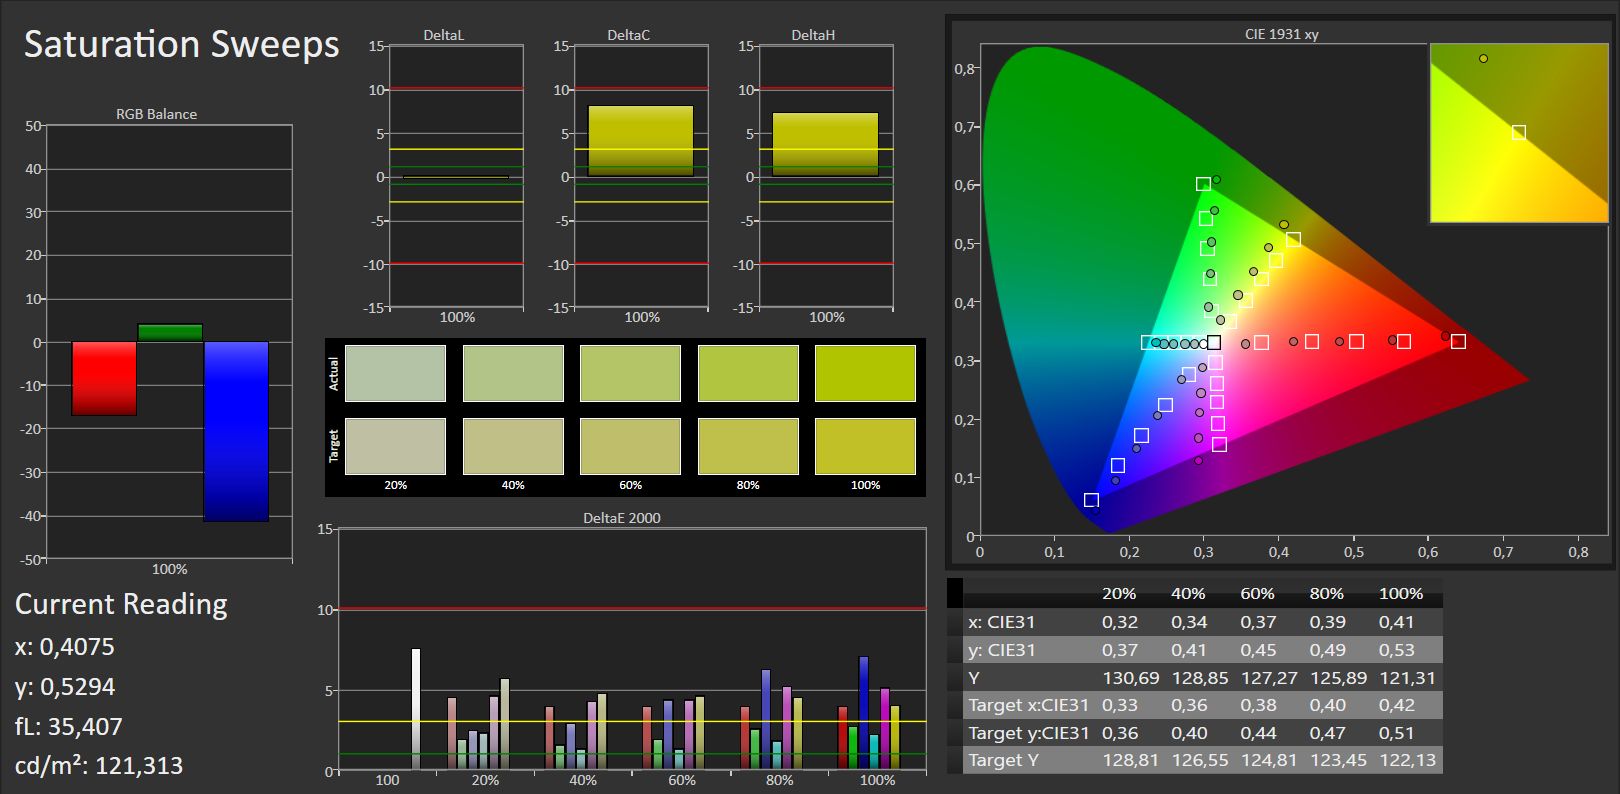
88% sRGB (Argyll 1.6.3 3D)
57% AdobeRGB 1998 (Argyll 1.6.3 3D)
63% AdobeRGB 1998 (Argyll 3D)
88.3% sRGB (Argyll 3D)
61.9% Display P3 (Argyll 3D)
Gamma: 2.57
CCT: 7450 K
| Asus Zenbook UX310UQ-GL011T TN LED, 1920x1080, 13.3" | Lenovo Yoga 710-14ISK a-Si WLED TFT, IPS, 1920x1080, 14" | Xiaomi Mi Notebook Air 13.3 2016 IPS, 1920x1080, 13.3" | Lenovo ThinkPad T460p-20FXS05500 IPS-Panel, 2560x1440, 14" | HP Pavilion 14-al003ng LED IPS, 1920x1080, 14" | |
|---|---|---|---|---|---|
| Display | 8% | 9% | |||
| Display P3 Coverage (%) | 61.9 | 66 7% | 66.9 8% | ||
| sRGB Coverage (%) | 88.3 | 95.5 8% | 96.5 9% | ||
| AdobeRGB 1998 Coverage (%) | 63 | 67.8 8% | 68.8 9% | ||
| Response Times | -10% | -20% | -1% | 1% | |
| Response Time Grey 50% / Grey 80% * (ms) | 39 ? | 35 ? 10% | 49 ? -26% | 38.4 ? 2% | 36.4 ? 7% |
| Response Time Black / White * (ms) | 24 ? | 31 ? -29% | 27 ? -13% | 24.8 ? -3% | 25.2 ? -5% |
| PWM Frequency (Hz) | 50 ? | 50 ? | 50 ? | 220 | |
| Screen | 6% | 35% | 17% | -0% | |
| Brightness middle (cd/m²) | 247 | 325 32% | 347 40% | 290 17% | 220 -11% |
| Brightness (cd/m²) | 240 | 298 24% | 334 39% | 280 17% | 209 -13% |
| Brightness Distribution (%) | 90 | 88 -2% | 80 -11% | 93 3% | 88 -2% |
| Black Level * (cd/m²) | 0.43 | 0.35 19% | 0.27 37% | 0.31 28% | 0.28 35% |
| Contrast (:1) | 574 | 929 62% | 1285 124% | 935 63% | 786 37% |
| Colorchecker dE 2000 * | 4.74 | 6.2 -31% | 3.29 31% | 3.88 18% | 4.58 3% |
| Colorchecker dE 2000 max. * | 9.14 | 10.82 -18% | 4.69 49% | 8.19 10% | 11.47 -25% |
| Greyscale dE 2000 * | 4.87 | 6.32 -30% | 3.62 26% | 5.47 -12% | 2.34 52% |
| Gamma | 2.57 86% | 2.3 96% | 2.23 99% | 2.33 94% | 2.26 97% |
| CCT | 7450 87% | 6926 94% | 7307 89% | 6469 100% | 6661 98% |
| Color Space (Percent of AdobeRGB 1998) (%) | 57 | 58 2% | 62 9% | 63.3 11% | 34.6 -39% |
| Color Space (Percent of sRGB) (%) | 88 | 90 2% | 95 8% | 96.64 10% | 54.2 -38% |
| Media totale (Programma / Settaggio) | -2% /
3% | 8% /
22% | 8% /
13% | 1% /
0% |
* ... Meglio usare valori piccoli
Tempi di risposta del Display
| ↔ Tempi di risposta dal Nero al Bianco | ||
|---|---|---|
| 24 ms ... aumenta ↗ e diminuisce ↘ combinato | ↗ 7 ms Incremento | 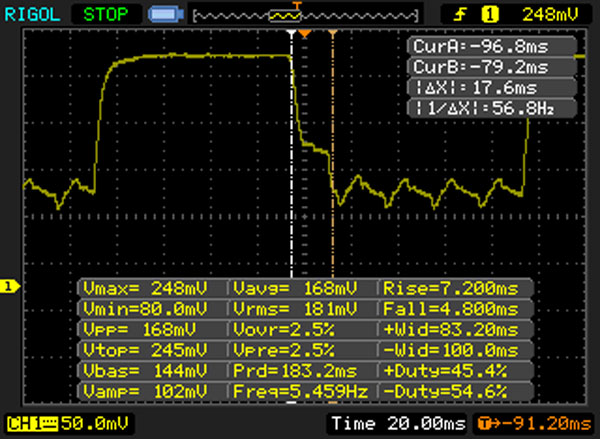 |
| ↘ 17 ms Calo | ||
| Lo schermo mostra buoni tempi di risposta durante i nostri tests, ma potrebbe essere troppo lento per i gamers competitivi. In confronto, tutti i dispositivi di test variano da 0.1 (minimo) a 240 (massimo) ms. » 54 % di tutti i dispositivi è migliore. Questo significa che i tempi di risposta rilevati sono peggiori rispetto alla media di tutti i dispositivi testati (19.9 ms). | ||
| ↔ Tempo di risposta dal 50% Grigio all'80% Grigio | ||
| 39 ms ... aumenta ↗ e diminuisce ↘ combinato | ↗ 20 ms Incremento | 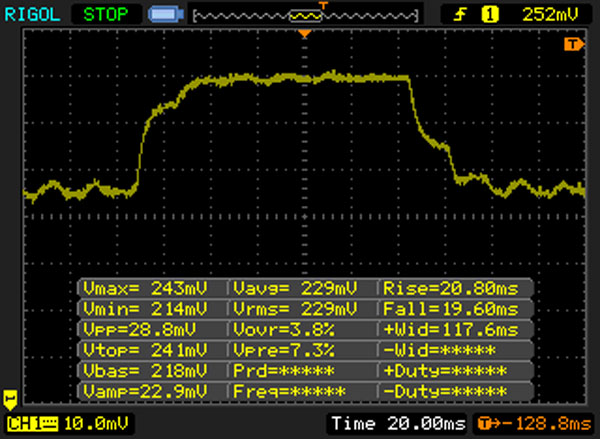 |
| ↘ 19 ms Calo | ||
| Lo schermo mostra tempi di risposta lenti nei nostri tests e sarà insoddisfacente per i gamers. In confronto, tutti i dispositivi di test variano da 0.165 (minimo) a 636 (massimo) ms. » 59 % di tutti i dispositivi è migliore. Questo significa che i tempi di risposta rilevati sono peggiori rispetto alla media di tutti i dispositivi testati (31.1 ms). | ||
Sfarfallio dello schermo / PWM (Pulse-Width Modulation)
| flickering dello schermo / PWM rilevato | 50 Hz | ≤ 30 % settaggio luminosita' | 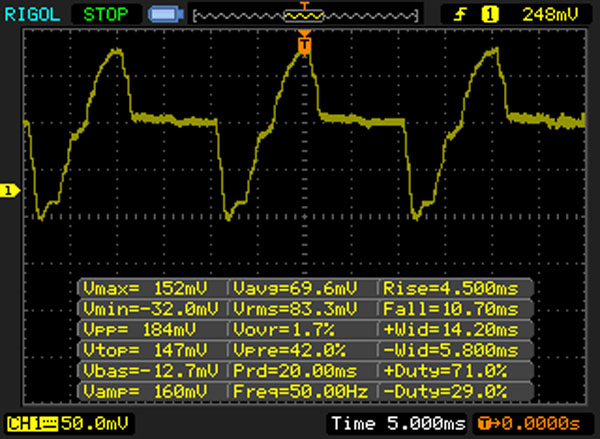 |
Il display sfarfalla a 50 Hz (Probabilmente a causa dell'uso di PWM) Flickering rilevato ad una luminosita' di 30 % o inferiore. Non dovrebbe verificarsi flickering o PWM sopra questo valore di luminosita'. La frequenza di 50 Hz è molto bassa, quindi il flickering potrebbe causare stanchezza agli occhi e mal di testa con un utilizzo prolungato. In confronto: 52 % di tutti i dispositivi testati non utilizza PWM per ridurre la luminosita' del display. Se è rilevato PWM, una media di 7801 (minimo: 5 - massimo: 343500) Hz è stata rilevata. | |||
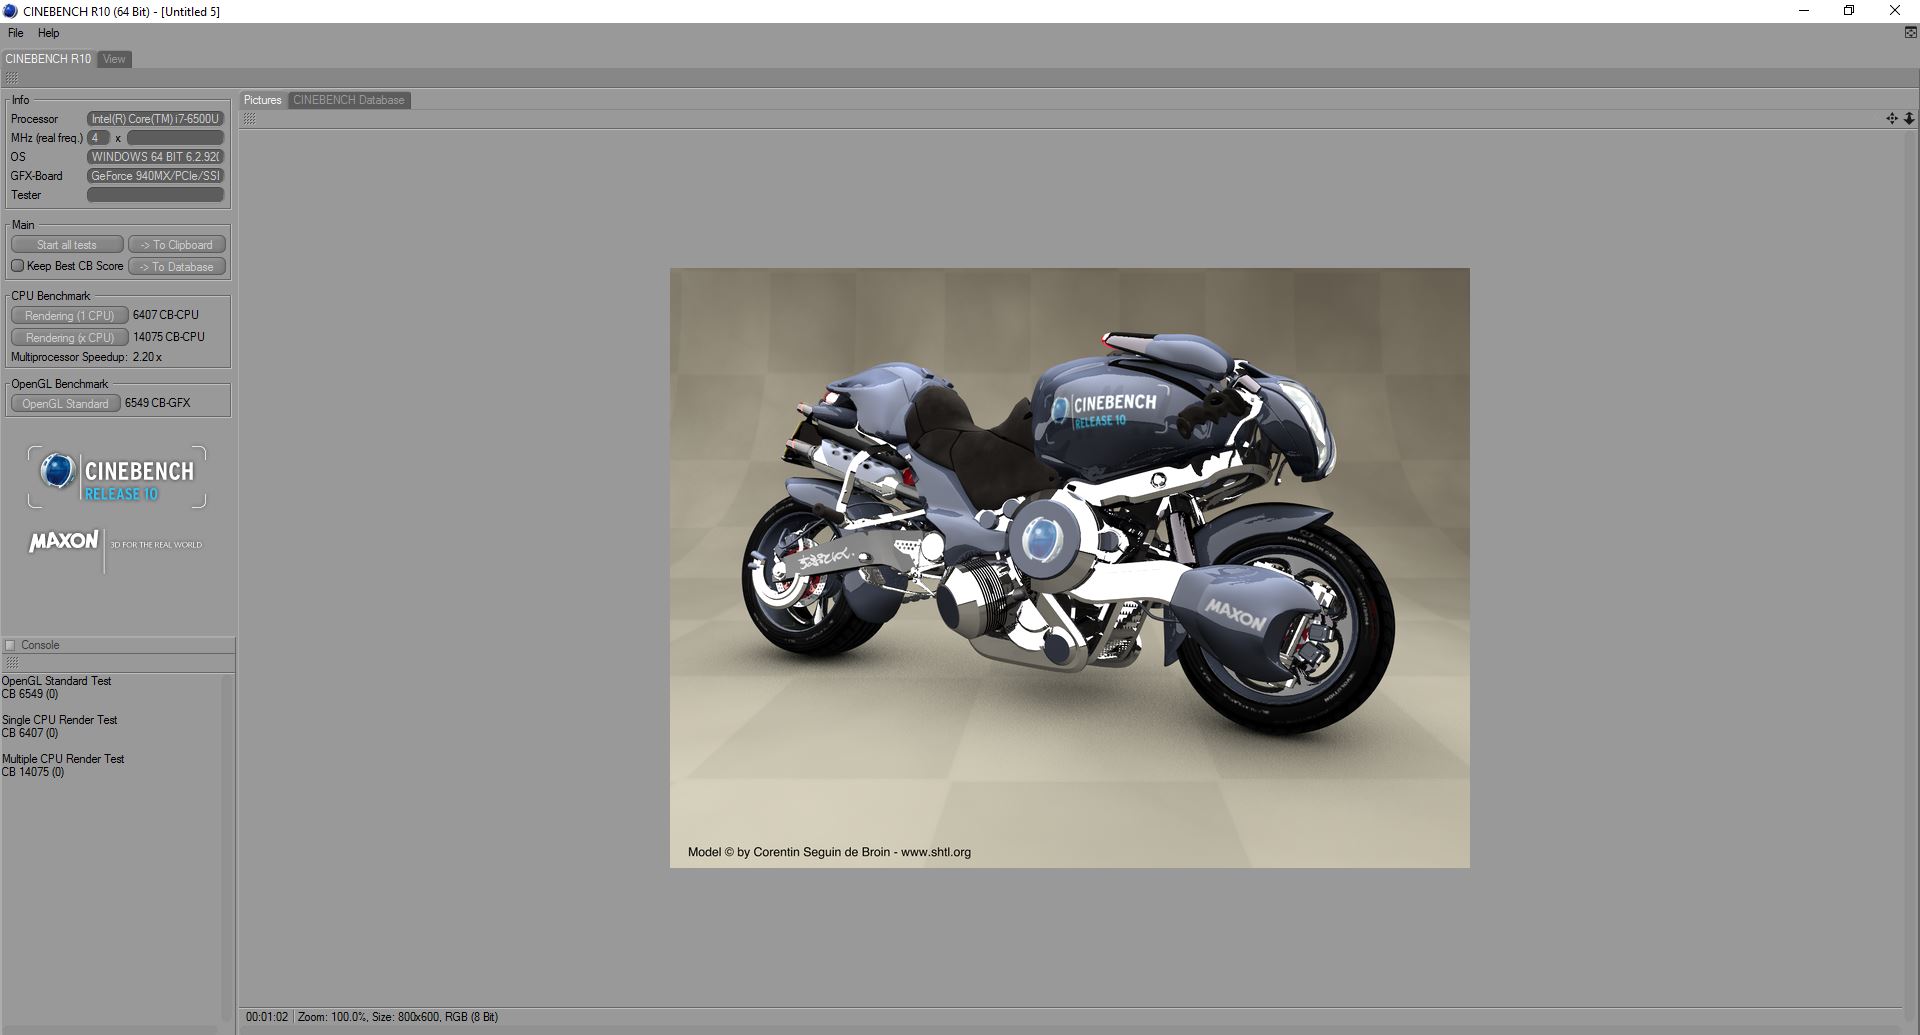
| Cinebench R10 | |
| Rendering Single CPUs 64Bit | |
| Asus Zenbook UX310UQ-GL011T | |
| Lenovo Yoga 710-14ISK | |
| Rendering Multiple CPUs 64Bit | |
| Asus Zenbook UX310UQ-GL011T | |
| Lenovo Yoga 710-14ISK | |
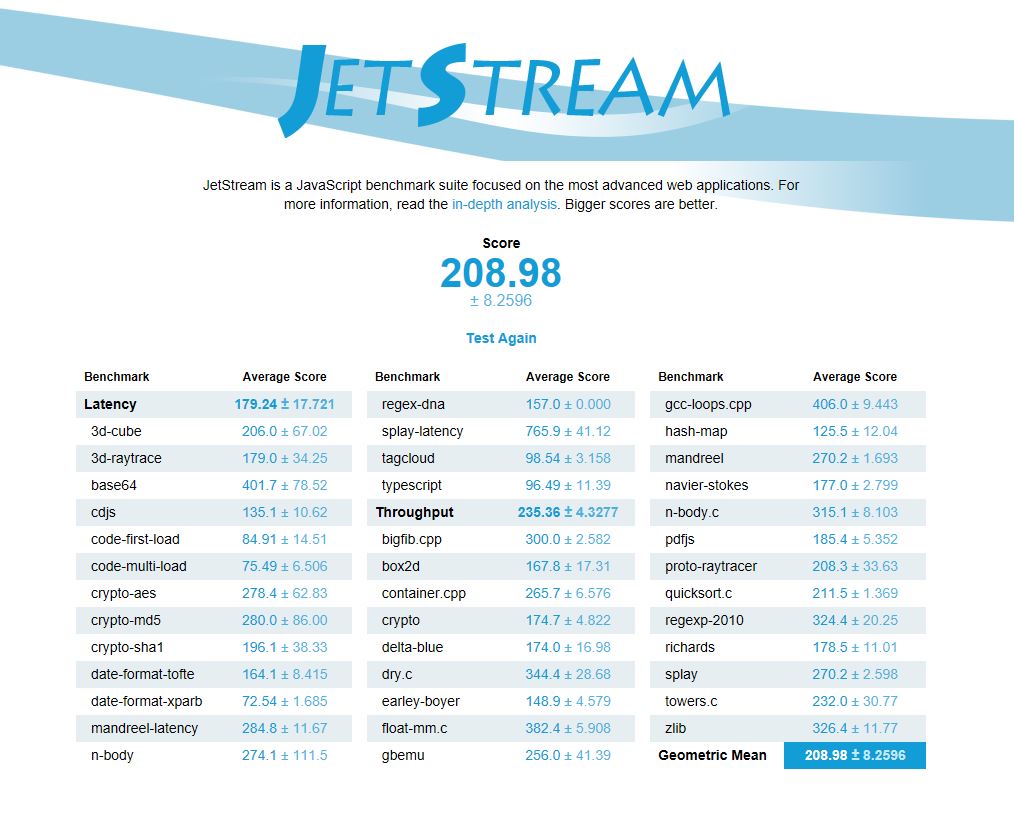
| JetStream 1.1 - 1.1 Total | |
| Lenovo ThinkPad T460p-20FXS05500 | |
| Asus Zenbook UX310UQ-GL011T | |
| HP Pavilion 14-al003ng | |
| Xiaomi Mi Notebook Air 13.3 2016 | |
| Lenovo Yoga 710-14ISK | |
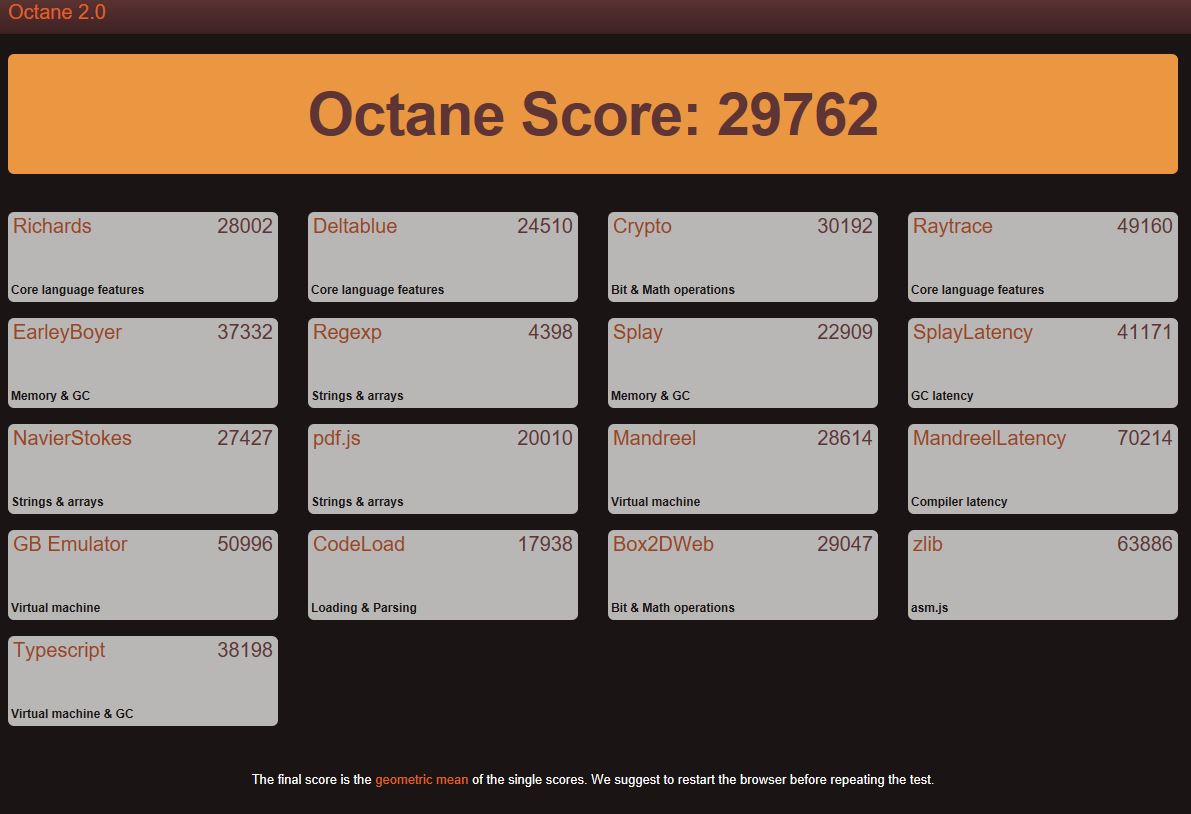
| Octane V2 - Total Score | |
| Lenovo ThinkPad T460p-20FXS05500 | |
| Asus Zenbook UX310UQ-GL011T | |
| Xiaomi Mi Notebook Air 13.3 2016 | |
| Lenovo Yoga 710-14ISK | |
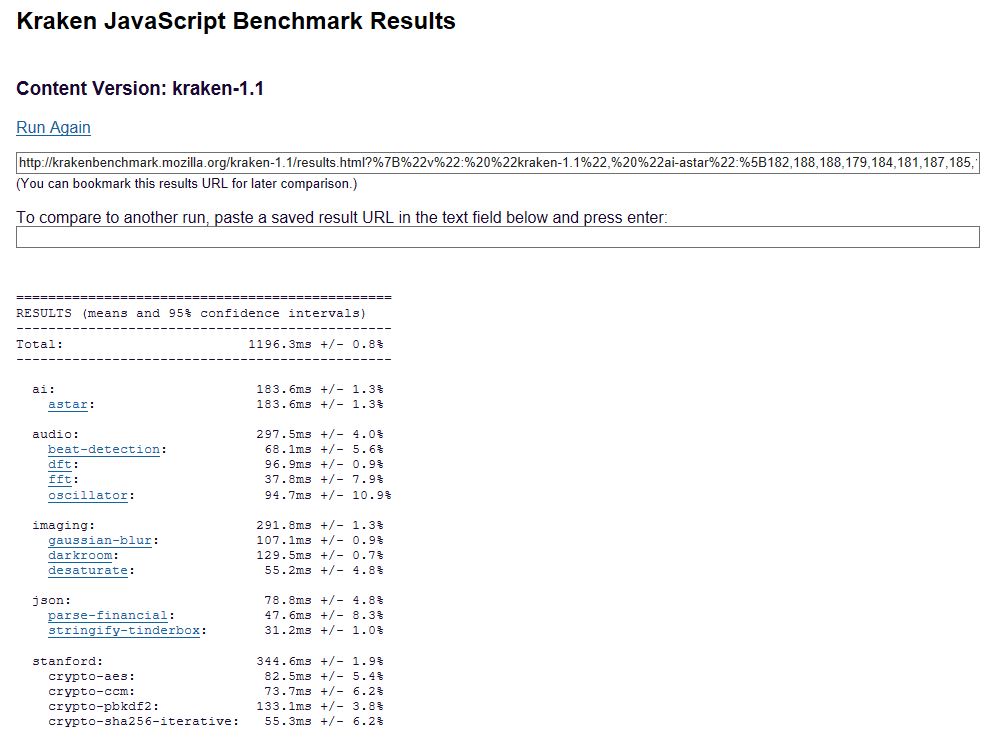
| Mozilla Kraken 1.1 - Total | |
| Xiaomi Mi Notebook Air 13.3 2016 | |
| Lenovo Yoga 710-14ISK | |
| Asus Zenbook UX310UQ-GL011T | |
| Lenovo ThinkPad T460p-20FXS05500 | |
* ... Meglio usare valori piccoli
| PCMark 8 | |
| Home Score Accelerated v2 | |
| Asus Zenbook UX310UQ-GL011T | |
| Lenovo Yoga 710-14ISK | |
| Lenovo ThinkPad T460p-20FXS05500 | |
| HP Pavilion 14-al003ng | |
| Xiaomi Mi Notebook Air 13.3 2016 | |
| Work Score Accelerated v2 | |
| Asus Zenbook UX310UQ-GL011T | |
| Lenovo ThinkPad T460p-20FXS05500 | |
| Lenovo Yoga 710-14ISK | |
| Xiaomi Mi Notebook Air 13.3 2016 | |
| Creative Score Accelerated v2 | |
| Asus Zenbook UX310UQ-GL011T | |
| Lenovo ThinkPad T460p-20FXS05500 | |
| Lenovo Yoga 710-14ISK | |
| PCMark 7 | |
| Productivity | |
| Lenovo ThinkPad T460p-20FXS05500 | |
| Asus Zenbook UX310UQ-GL011T | |
| Lenovo Yoga 710-14ISK | |
| Score | |
| Lenovo ThinkPad T460p-20FXS05500 | |
| Asus Zenbook UX310UQ-GL011T | |
| Lenovo Yoga 710-14ISK | |
| PCMark Vantage Result | 13885 punti | |
| PCMark 7 Score | 5305 punti | |
| PCMark 8 Home Score Accelerated v2 | 3769 punti | |
| PCMark 8 Creative Score Accelerated v2 | 4440 punti | |
| PCMark 8 Work Score Accelerated v2 | 4603 punti | |
Aiuto | ||
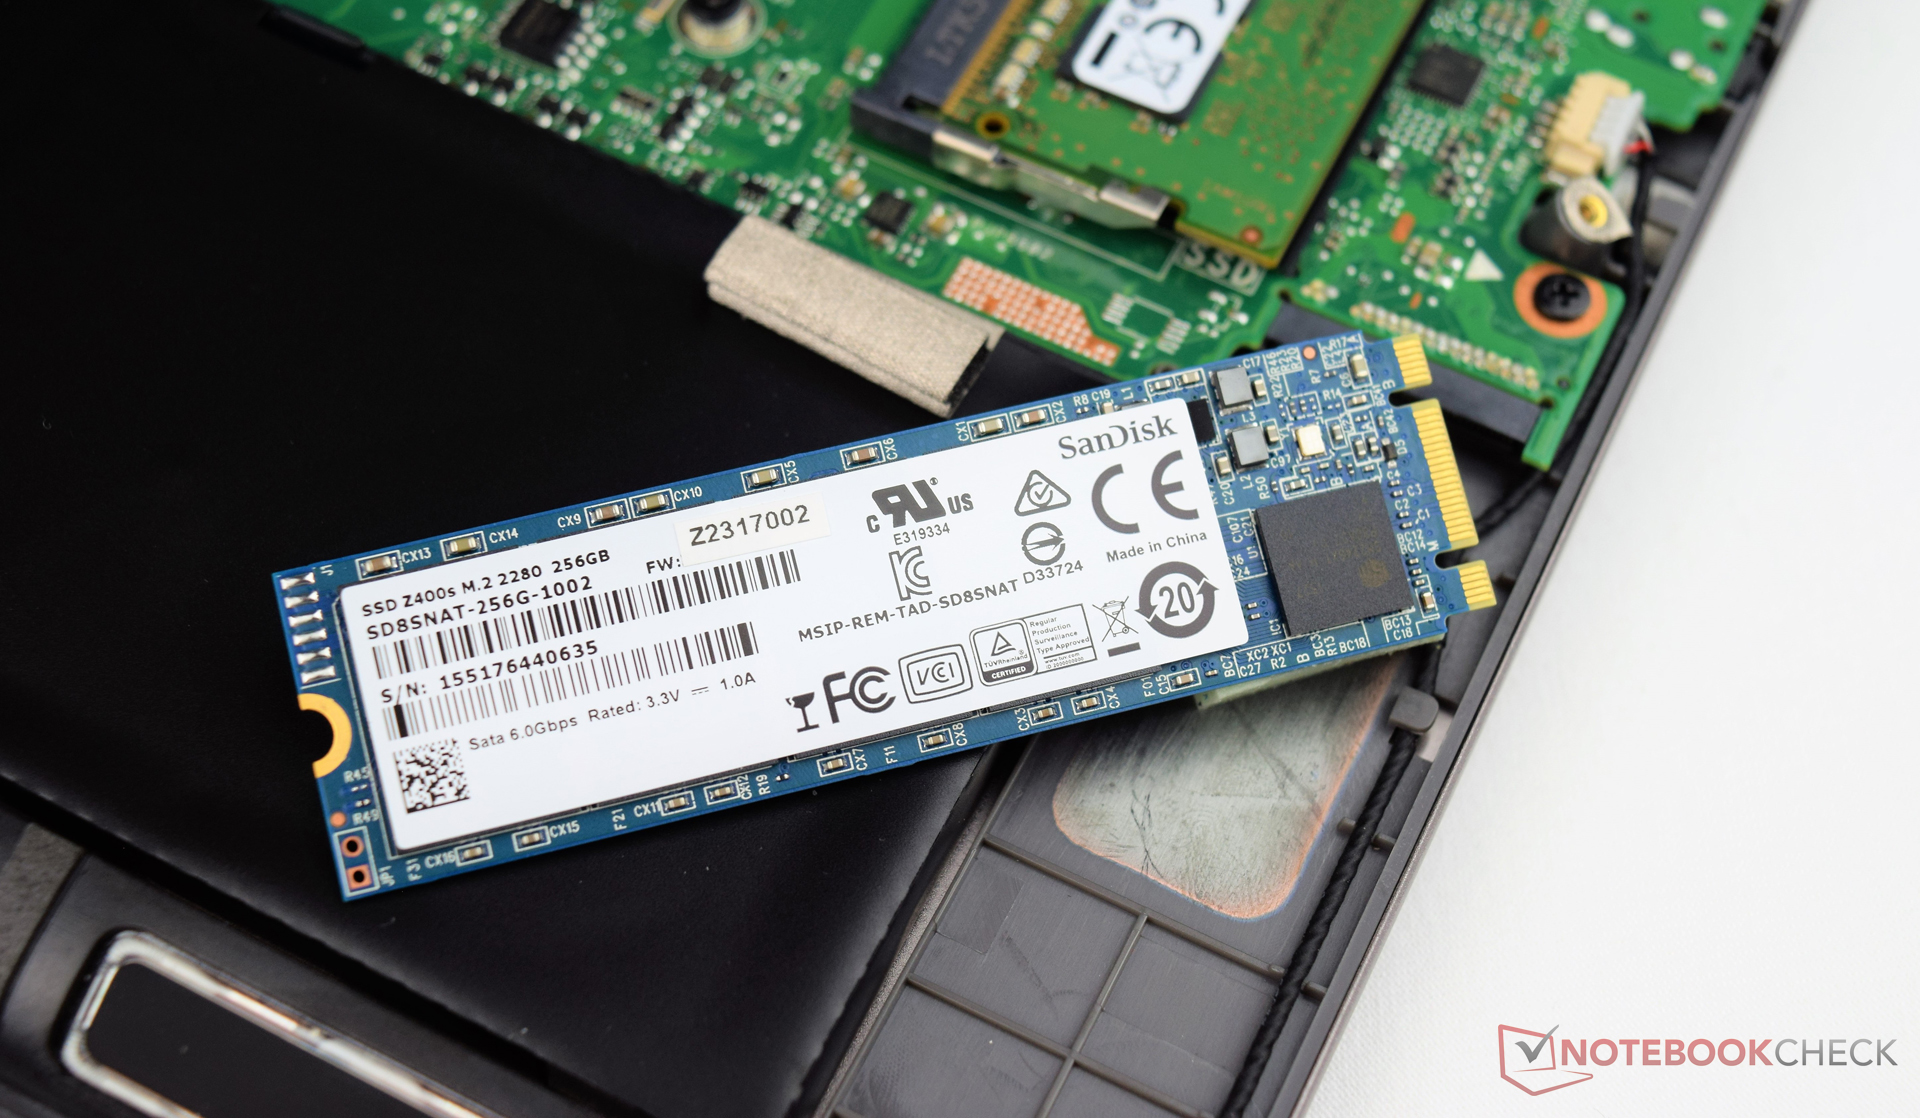
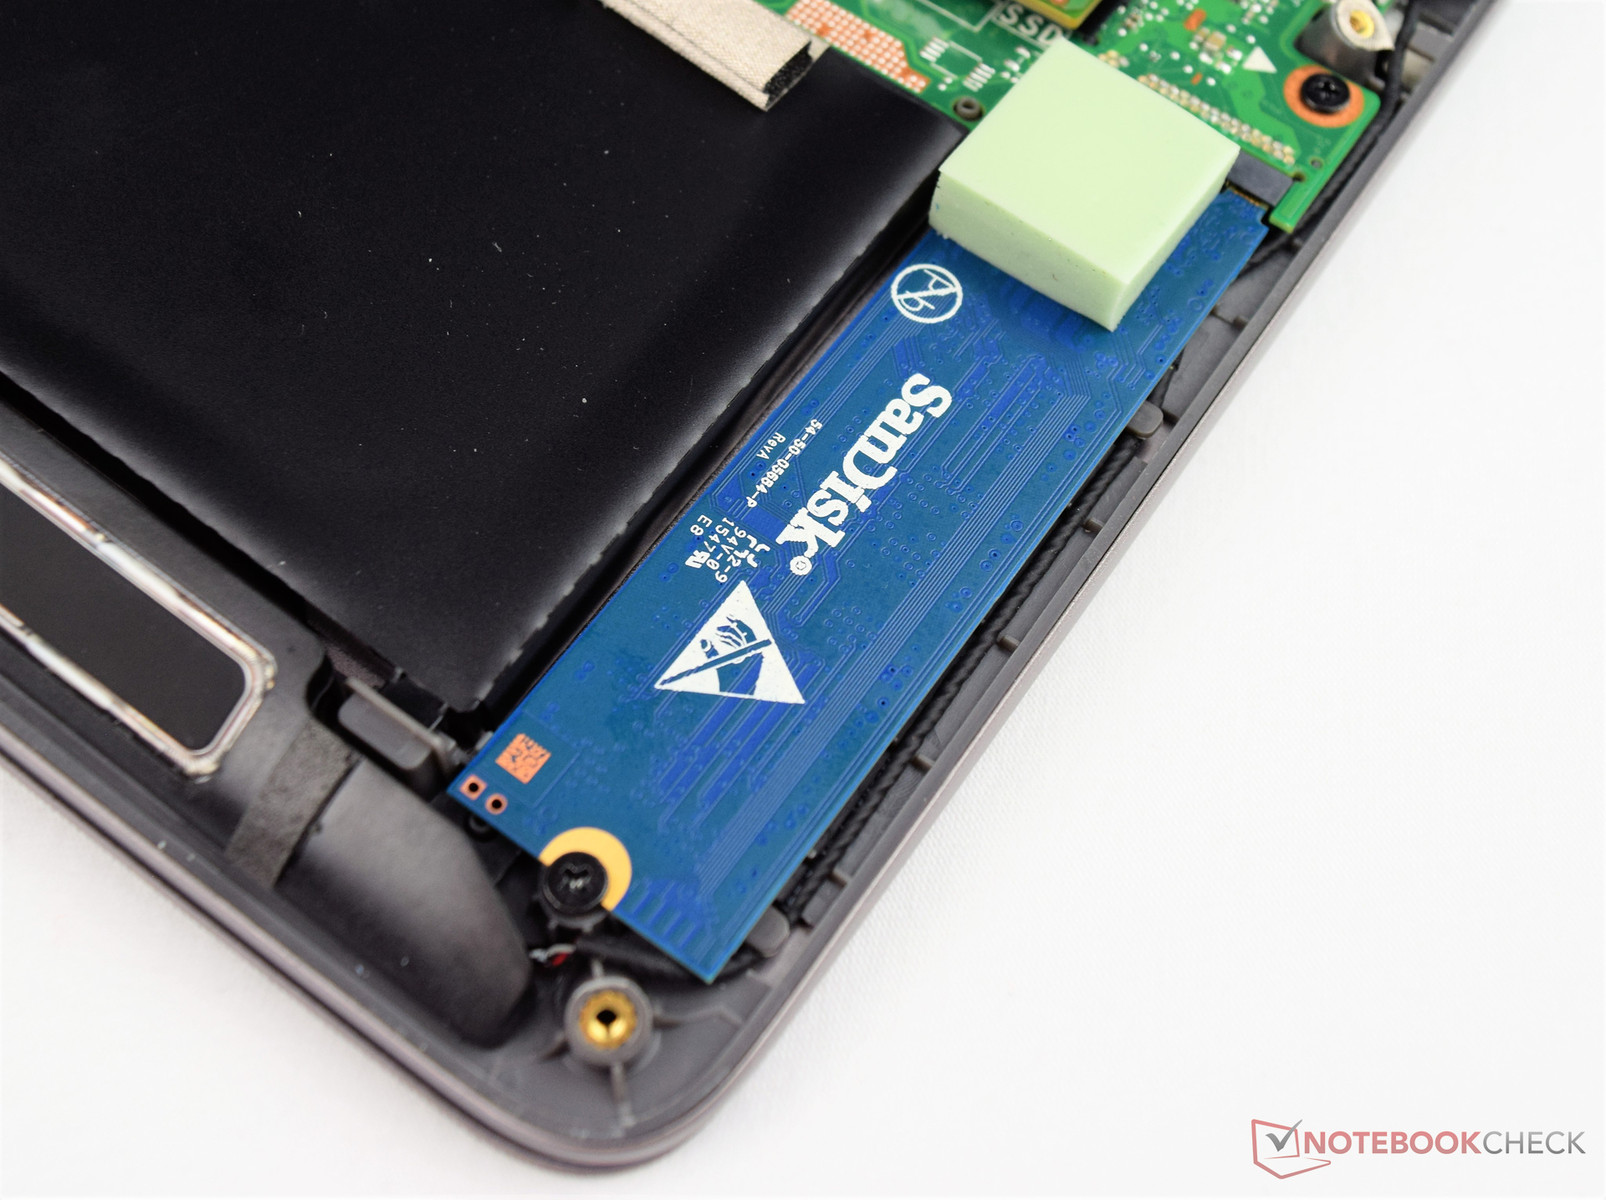
| Asus Zenbook UX310UQ-GL011T SanDisk SD8SNAT256G1002 | Lenovo Yoga 710-14ISK Samsung SSD PM871 MZNLN256HCHP | Xiaomi Mi Notebook Air 13.3 2016 Samsung PM951 NVMe MZVLV256 | Lenovo ThinkPad T460p-20FXS05500 Samsung SSD PM871 MZ7LN512HCHP | HP Pavilion 14-al003ng SanDisk Z400s 256 GB M.2 2280 | |
|---|---|---|---|---|---|
| CrystalDiskMark 3.0 | 42% | 109% | 48% | -6% | |
| Read Seq (MB/s) | 468.1 | 508 9% | 1209 158% | 502 7% | 469.3 0% |
| Write Seq (MB/s) | 319.2 | 302.7 -5% | 314 -2% | 442 38% | 309.1 -3% |
| Read 512 (MB/s) | 318.6 | 419.9 32% | 411.4 29% | ||
| Write 512 (MB/s) | 272.8 | 302.6 11% | 414.3 52% | ||
| Read 4k (MB/s) | 22.03 | 33.3 51% | 43.4 97% | 29.18 32% | 14 -36% |
| Write 4k (MB/s) | 72.1 | 85.8 19% | 153.4 113% | 86.5 20% | 73.9 2% |
| Read 4k QD32 (MB/s) | 147.4 | 395.8 169% | 487.6 231% | 358.1 143% | 149.5 1% |
| Write 4k QD32 (MB/s) | 200.2 | 294.3 47% | 312.2 56% | 319.8 60% | 204.6 2% |

| 3DMark | |
| 1280x720 Cloud Gate Standard Graphics | |
| Xiaomi Mi Notebook Air 13.3 2016 | |
| Lenovo ThinkPad T460p-20FXS05500 | |
| Lenovo Yoga 710-14ISK | |
| Asus Zenbook UX310UQ-GL011T | |
| 1920x1080 Fire Strike Graphics | |
| Xiaomi Mi Notebook Air 13.3 2016 | |
| Lenovo ThinkPad T460p-20FXS05500 | |
| Asus Zenbook UX310UQ-GL011T | |
| Lenovo Yoga 710-14ISK | |
| 1280x720 Ice Storm Standard Graphics | |
| Asus Zenbook UX310UQ-GL011T | |
| Lenovo Yoga 710-14ISK | |
| Lenovo ThinkPad T460p-20FXS05500 | |
| 3DMark 06 - 1280x1024 Standard Score AA:0x AF:0x | |
| Lenovo ThinkPad T460p-20FXS05500 | |
| Lenovo Yoga 710-14ISK | |
| Asus Zenbook UX310UQ-GL011T | |
| 3DMark 2001SE Standard | 28793 punti | |
| 3DMark 03 Standard | 28408 punti | |
| 3DMark 05 Standard | 20654 punti | |
| 3DMark 06 Standard Score | 10351 punti | |
| 3DMark 11 Performance | 2424 punti | |
| 3DMark Ice Storm Standard Score | 44072 punti | |
| 3DMark Cloud Gate Standard Score | 6264 punti | |
| 3DMark Fire Strike Score | 1394 punti | |
| 3DMark Fire Strike Extreme Score | 716 punti | |
| 3DMark Time Spy Score | 514 punti | |
Aiuto | ||
| basso | medio | alto | ultra | |
|---|---|---|---|---|
| BioShock Infinite (2013) | 85.9 | 48.7 | 39.4 | 13.3 |
| Battlefield 4 (2013) | 67.2 | 43.8 | 29.1 | 10.7 |
| The Witcher 3 (2015) | 24 | 16.3 | 8.7 | 5.3 |
Rumorosità
| Idle |
| 30.5 / 30.5 / 31.5 dB(A) |
| HDD |
| 30.9 dB(A) |
| Sotto carico |
| 36.2 / 40 dB(A) |
 | ||
30 dB silenzioso 40 dB(A) udibile 50 dB(A) rumoroso |
||
min: | ||
| Asus Zenbook UX310UQ-GL011T Intel Core i7-6500U, GeForce 940MX | Lenovo Yoga 710-14ISK Intel Core i5-6200U, GeForce 940MX | Xiaomi Mi Notebook Air 13.3 2016 Intel Core i5-6200U, GeForce 940MX | Lenovo ThinkPad T460p-20FXS05500 Intel Core i7-6700HQ, GeForce 940MX | HP Pavilion 14-al003ng Intel Core i5-6200U, GeForce 940MX | |
|---|---|---|---|---|---|
| Noise | -7% | -3% | 5% | -0% | |
| off /ambiente * (dB) | 30.5 | 32.2 -6% | 31.15 -2% | 29.2 4% | 28.9 5% |
| Idle Minimum * (dB) | 30.5 | 32.5 -7% | 31.15 -2% | 29.2 4% | 29.2 4% |
| Idle Average * (dB) | 30.5 | 34.6 -13% | 31.15 -2% | 29.2 4% | 29.2 4% |
| Idle Maximum * (dB) | 31.5 | 34.6 -10% | 31.15 1% | 29.2 7% | 30.8 2% |
| Load Average * (dB) | 36.2 | 38.7 -7% | 38.2 -6% | 33.5 7% | 38 -5% |
| Load Maximum * (dB) | 40 | 39.9 -0% | 41.7 -4% | 38.8 3% | 44.3 -11% |
* ... Meglio usare valori piccoli
| Asus Zenbook UX310UQ-GL011T GeForce 940MX, 6500U, SanDisk SD8SNAT256G1002 | Lenovo Yoga 710-14ISK GeForce 940MX, 6200U, Samsung SSD PM871 MZNLN256HCHP | Xiaomi Mi Notebook Air 13.3 2016 GeForce 940MX, 6200U, Samsung PM951 NVMe MZVLV256 | Lenovo ThinkPad T460p-20FXS05500 GeForce 940MX, 6700HQ, Samsung SSD PM871 MZ7LN512HCHP | HP Pavilion 14-al003ng GeForce 940MX, 6200U, SanDisk Z400s 256 GB M.2 2280 | |
|---|---|---|---|---|---|
| Heat | -13% | -12% | -32% | -21% | |
| Maximum Upper Side * (°C) | 38.5 | 43.4 -13% | 51 -32% | 51.6 -34% | 44.1 -15% |
| Maximum Bottom * (°C) | 40.4 | 43.2 -7% | 47 -16% | 55.2 -37% | 44.9 -11% |
| Idle Upper Side * (°C) | 24.8 | 28 -13% | 24.4 2% | 30.7 -24% | 32.4 -31% |
| Idle Bottom * (°C) | 23.8 | 28.2 -18% | 24.6 -3% | 31.5 -32% | 30.2 -27% |
* ... Meglio usare valori piccoli
(+) La temperatura massima sul lato superiore è di 38.5 °C / 101 F, rispetto alla media di 35.9 °C / 97 F, che varia da 21.4 a 59 °C per questa classe Subnotebook.
(±) Il lato inferiore si riscalda fino ad un massimo di 40.4 °C / 105 F, rispetto alla media di 39.2 °C / 103 F
(+) In idle, la temperatura media del lato superiore è di 23.6 °C / 74 F, rispetto alla media deld ispositivo di 30.8 °C / 87 F.
(+) I poggiapolsi e il touchpad sono piu' freddi della temperatura della pelle con un massimo di 27.7 °C / 81.9 F e sono quindi freddi al tatto.
(±) La temperatura media della zona del palmo della mano di dispositivi simili e'stata di 28.2 °C / 82.8 F (+0.5 °C / 0.9 F).
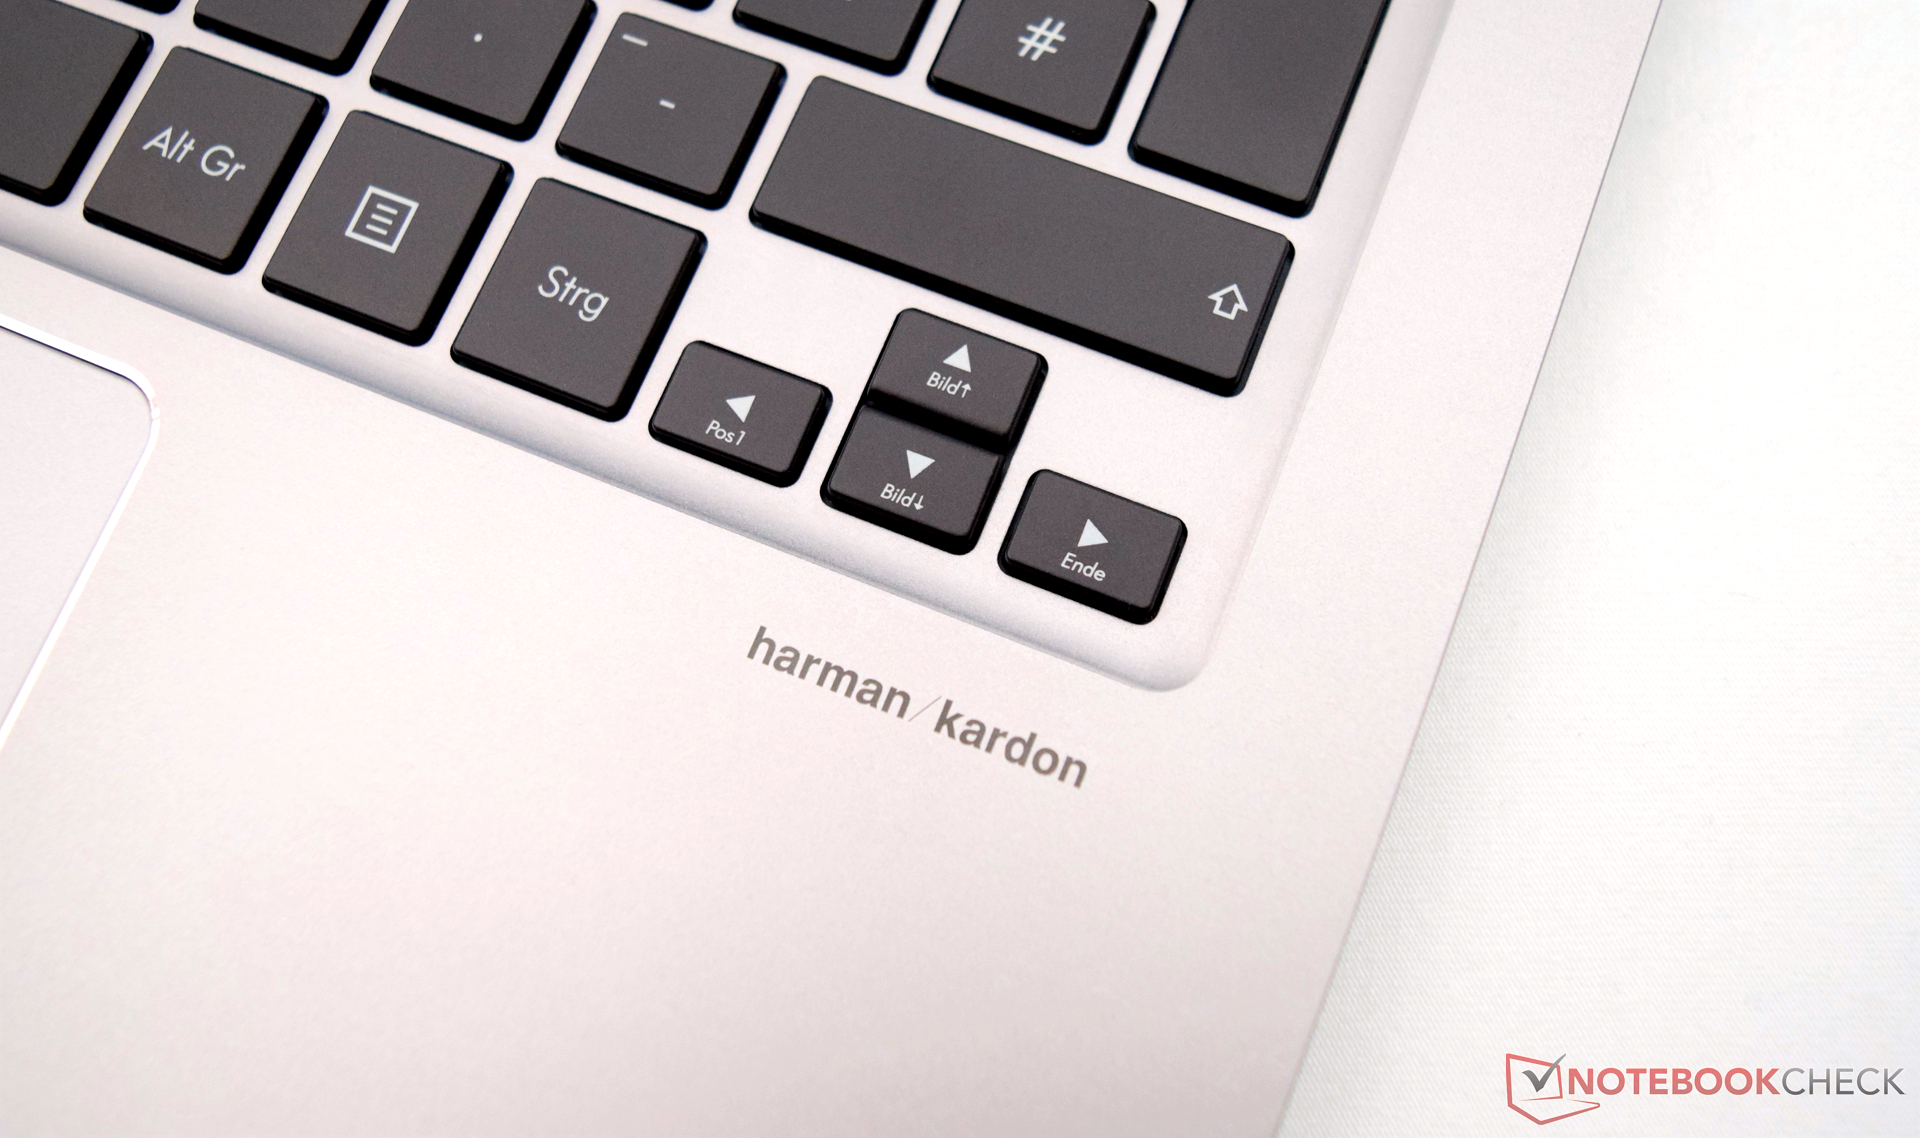
Asus Zenbook UX310UQ-GL011T analisi audio
(±) | potenza degli altiparlanti media ma buona (73 dB)
Bassi 100 - 315 Hz
(-) | quasi nessun basso - in media 20.4% inferiori alla media
(±) | la linearità dei bassi è media (10.6% delta rispetto alla precedente frequenza)
Medi 400 - 2000 Hz
(+) | medi bilanciati - solo only 2.5% rispetto alla media
(+) | medi lineari (3.1% delta rispetto alla precedente frequenza)
Alti 2 - 16 kHz
(±) | alti elevati - circa 6.3% superiori alla media
(+) | alti lineari (2.3% delta rispetto alla precedente frequenza)
Nel complesso 100 - 16.000 Hz
(±) | la linearità complessiva del suono è media (19.3% di differenza rispetto alla media
Rispetto alla stessa classe
» 59% di tutti i dispositivi testati in questa classe è stato migliore, 7% simile, 34% peggiore
» Il migliore ha avuto un delta di 5%, medio di 18%, peggiore di 53%
Rispetto a tutti i dispositivi testati
» 47% di tutti i dispositivi testati in questa classe è stato migliore, 8% similare, 46% peggiore
» Il migliore ha avuto un delta di 4%, medio di 24%, peggiore di 134%
Apple MacBook 12 (Early 2016) 1.1 GHz analisi audio
(+) | gli altoparlanti sono relativamente potenti (83.6 dB)
Bassi 100 - 315 Hz
(±) | bassi ridotti - in media 11.3% inferiori alla media
(±) | la linearità dei bassi è media (14.2% delta rispetto alla precedente frequenza)
Medi 400 - 2000 Hz
(+) | medi bilanciati - solo only 2.4% rispetto alla media
(+) | medi lineari (5.5% delta rispetto alla precedente frequenza)
Alti 2 - 16 kHz
(+) | Alti bilanciati - appena 2% dalla media
(+) | alti lineari (4.5% delta rispetto alla precedente frequenza)
Nel complesso 100 - 16.000 Hz
(+) | suono nel complesso lineare (10.2% differenza dalla media)
Rispetto alla stessa classe
» 7% di tutti i dispositivi testati in questa classe è stato migliore, 2% simile, 91% peggiore
» Il migliore ha avuto un delta di 5%, medio di 18%, peggiore di 53%
Rispetto a tutti i dispositivi testati
» 5% di tutti i dispositivi testati in questa classe è stato migliore, 1% similare, 94% peggiore
» Il migliore ha avuto un delta di 4%, medio di 24%, peggiore di 134%
| Off / Standby | |
| Idle | |
| Sotto carico |
|
Leggenda:
min: | |
| Asus Zenbook UX310UQ-GL011T 6500U, GeForce 940MX, SanDisk SD8SNAT256G1002, TN LED, 1920x1080, 13.3" | Lenovo Yoga 710-14ISK 6200U, GeForce 940MX, Samsung SSD PM871 MZNLN256HCHP, a-Si WLED TFT, IPS, 1920x1080, 14" | Xiaomi Mi Notebook Air 13.3 2016 6200U, GeForce 940MX, Samsung PM951 NVMe MZVLV256, IPS, 1920x1080, 13.3" | Lenovo ThinkPad T460p-20FXS05500 6700HQ, GeForce 940MX, Samsung SSD PM871 MZ7LN512HCHP, IPS-Panel, 2560x1440, 14" | HP Pavilion 14-al003ng 6200U, GeForce 940MX, SanDisk Z400s 256 GB M.2 2280, LED IPS, 1920x1080, 14" | |
|---|---|---|---|---|---|
| Power Consumption | -31% | -6% | -51% | -8% | |
| Idle Minimum * (Watt) | 3 | 4.9 -63% | 4 -33% | 5 -67% | 4 -33% |
| Idle Average * (Watt) | 5.6 | 9.4 -68% | 6.6 -18% | 9.9 -77% | 6.4 -14% |
| Idle Maximum * (Watt) | 6.8 | 10.7 -57% | 7.4 -9% | 10.8 -59% | 7 -3% |
| Load Average * (Watt) | 48.7 | 46 6% | 41.7 14% | 52.4 -8% | 45.5 7% |
| Load Maximum * (Watt) | 63 | 47.2 25% | 52.4 17% | 89.8 -43% | 62.2 1% |
* ... Meglio usare valori piccoli
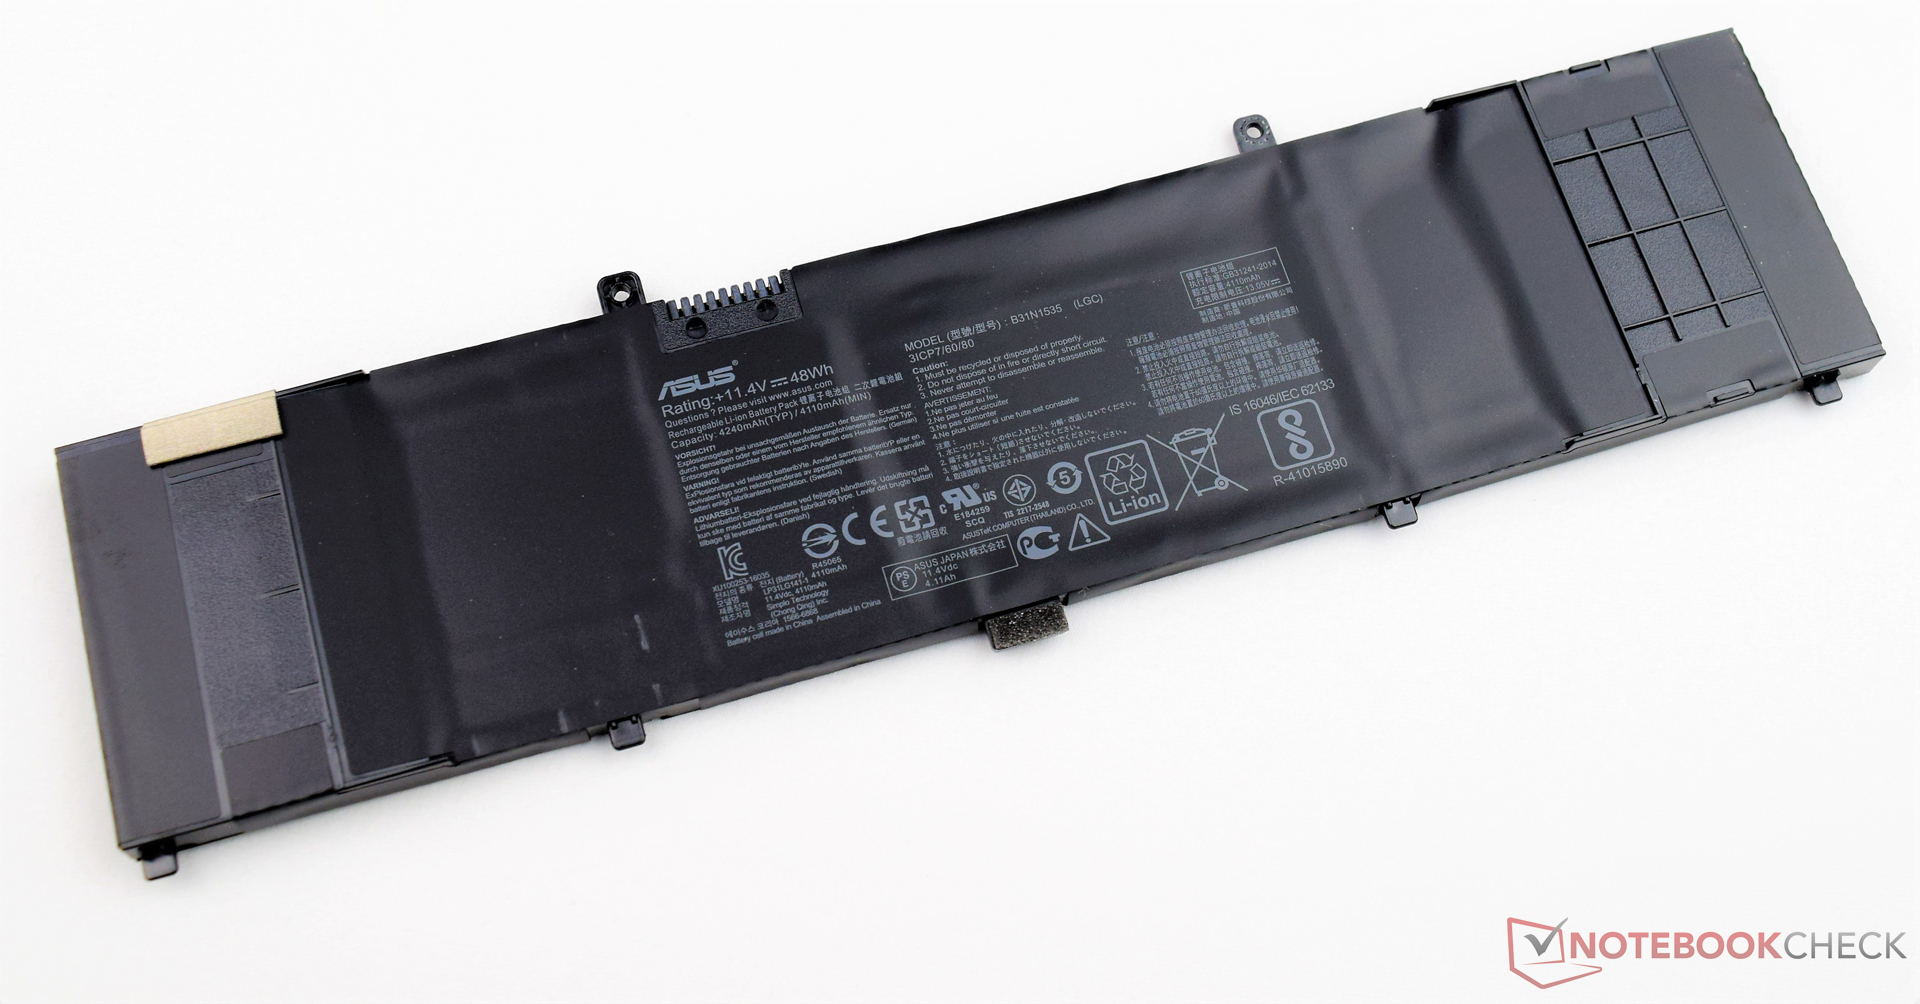
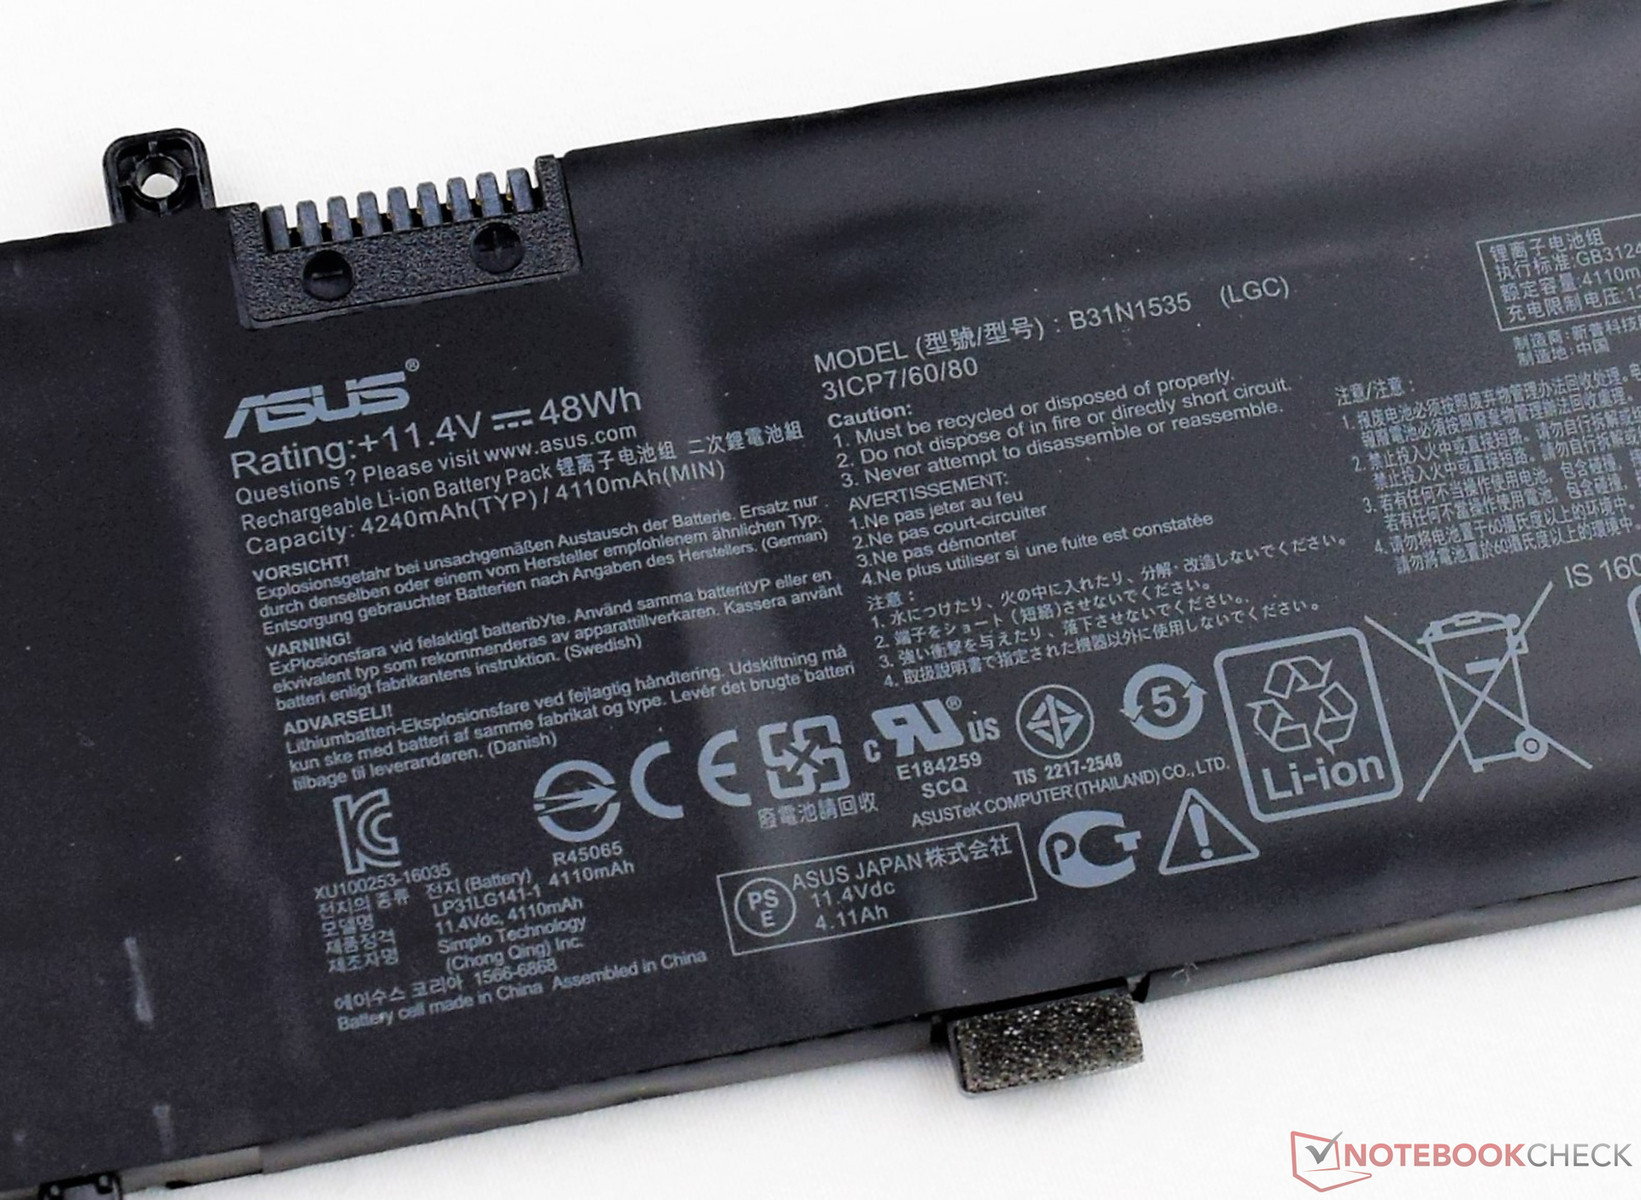
| Asus Zenbook UX310UQ-GL011T 6500U, GeForce 940MX, 48 Wh | Lenovo Yoga 710-14ISK 6200U, GeForce 940MX, 53 Wh | Xiaomi Mi Notebook Air 13.3 2016 6200U, GeForce 940MX, 40 Wh | Lenovo ThinkPad T460p-20FXS05500 6700HQ, GeForce 940MX, 48 Wh | HP Pavilion 14-al003ng 6200U, GeForce 940MX, 41 Wh | |
|---|---|---|---|---|---|
| Autonomia della batteria | 12% | -14% | -30% | -32% | |
| Reader / Idle (h) | 14.6 | 16 10% | 12 -18% | 11 -25% | |
| H.264 (h) | 7 | 7.1 1% | 7.1 1% | 6 -14% | |
| WiFi v1.3 (h) | 8.1 | 7.2 -11% | 6.5 -20% | 5 -38% | 5.5 -32% |
| Load (h) | 1.7 | 2.5 47% | 1.4 -18% | 1 -41% |
Pro
Contro
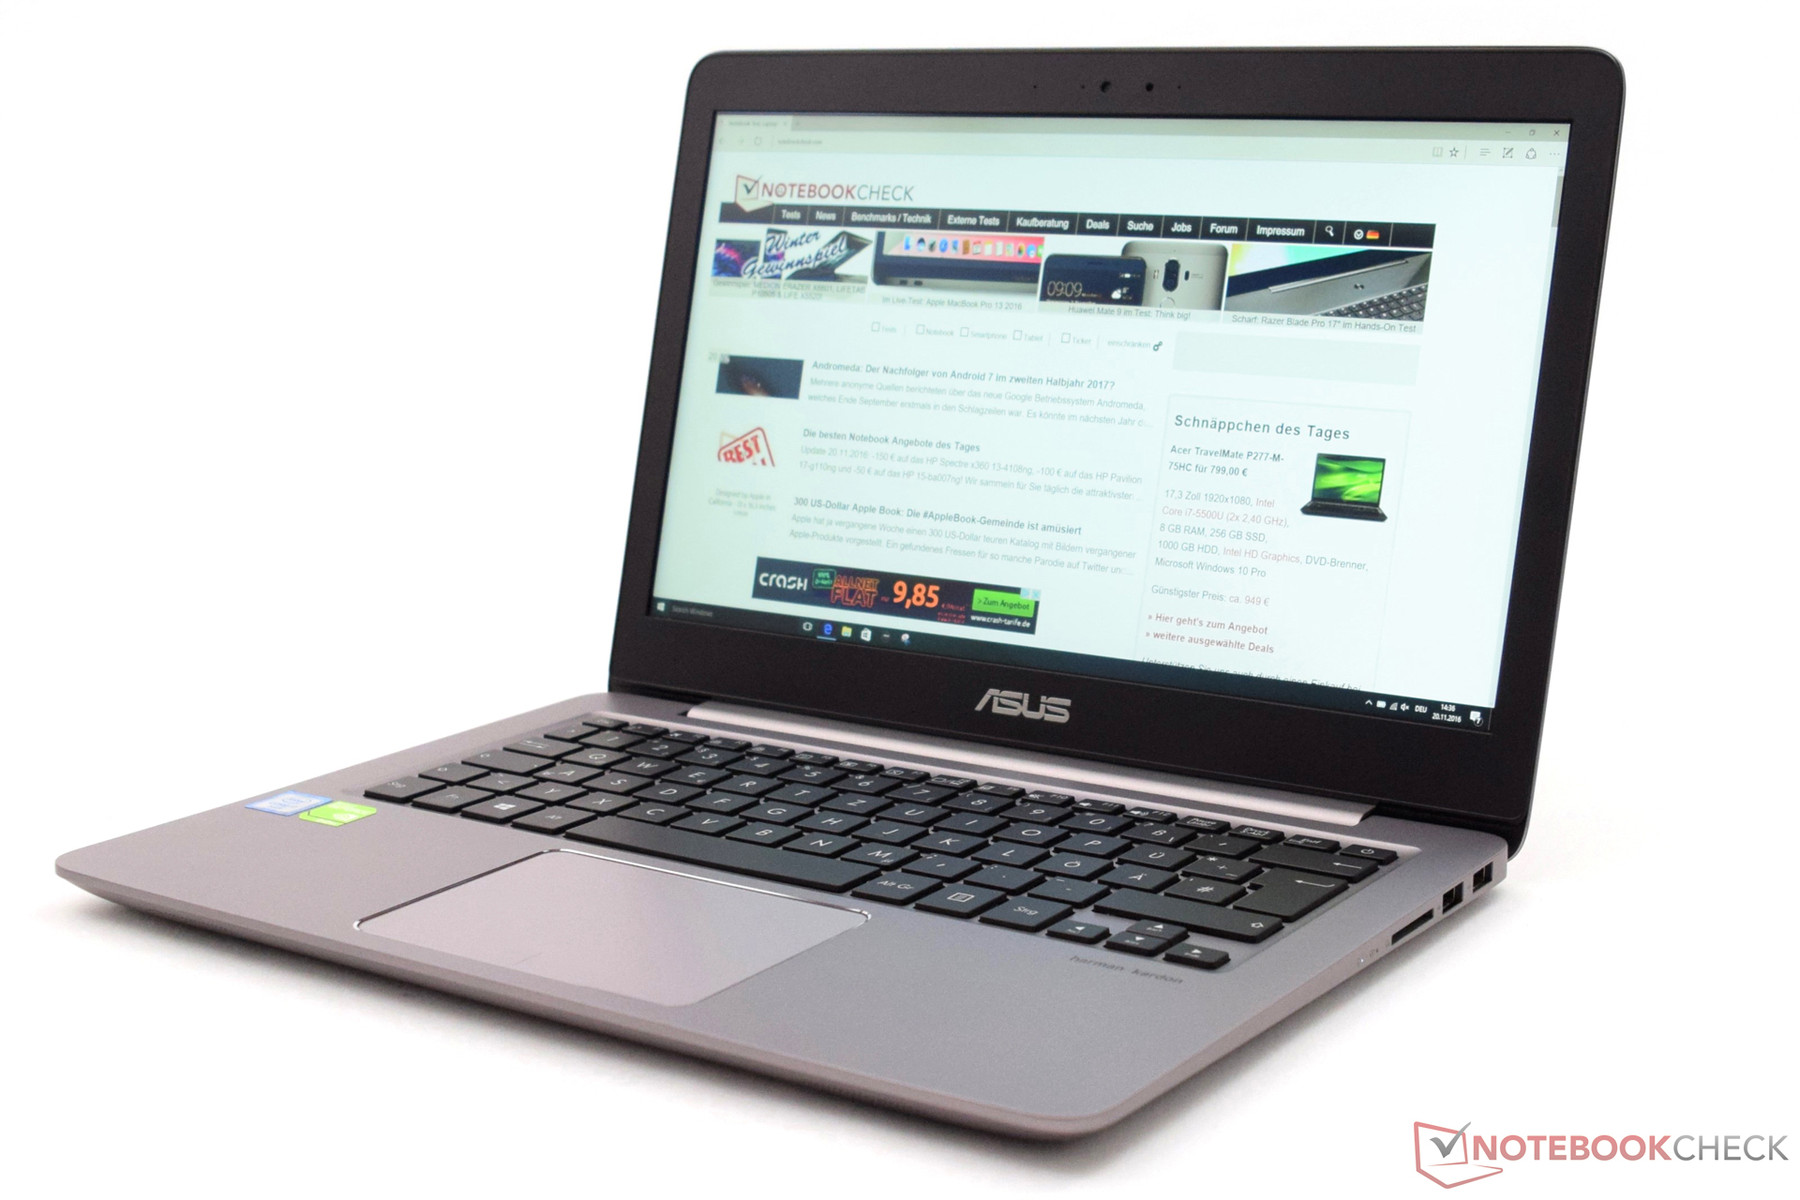
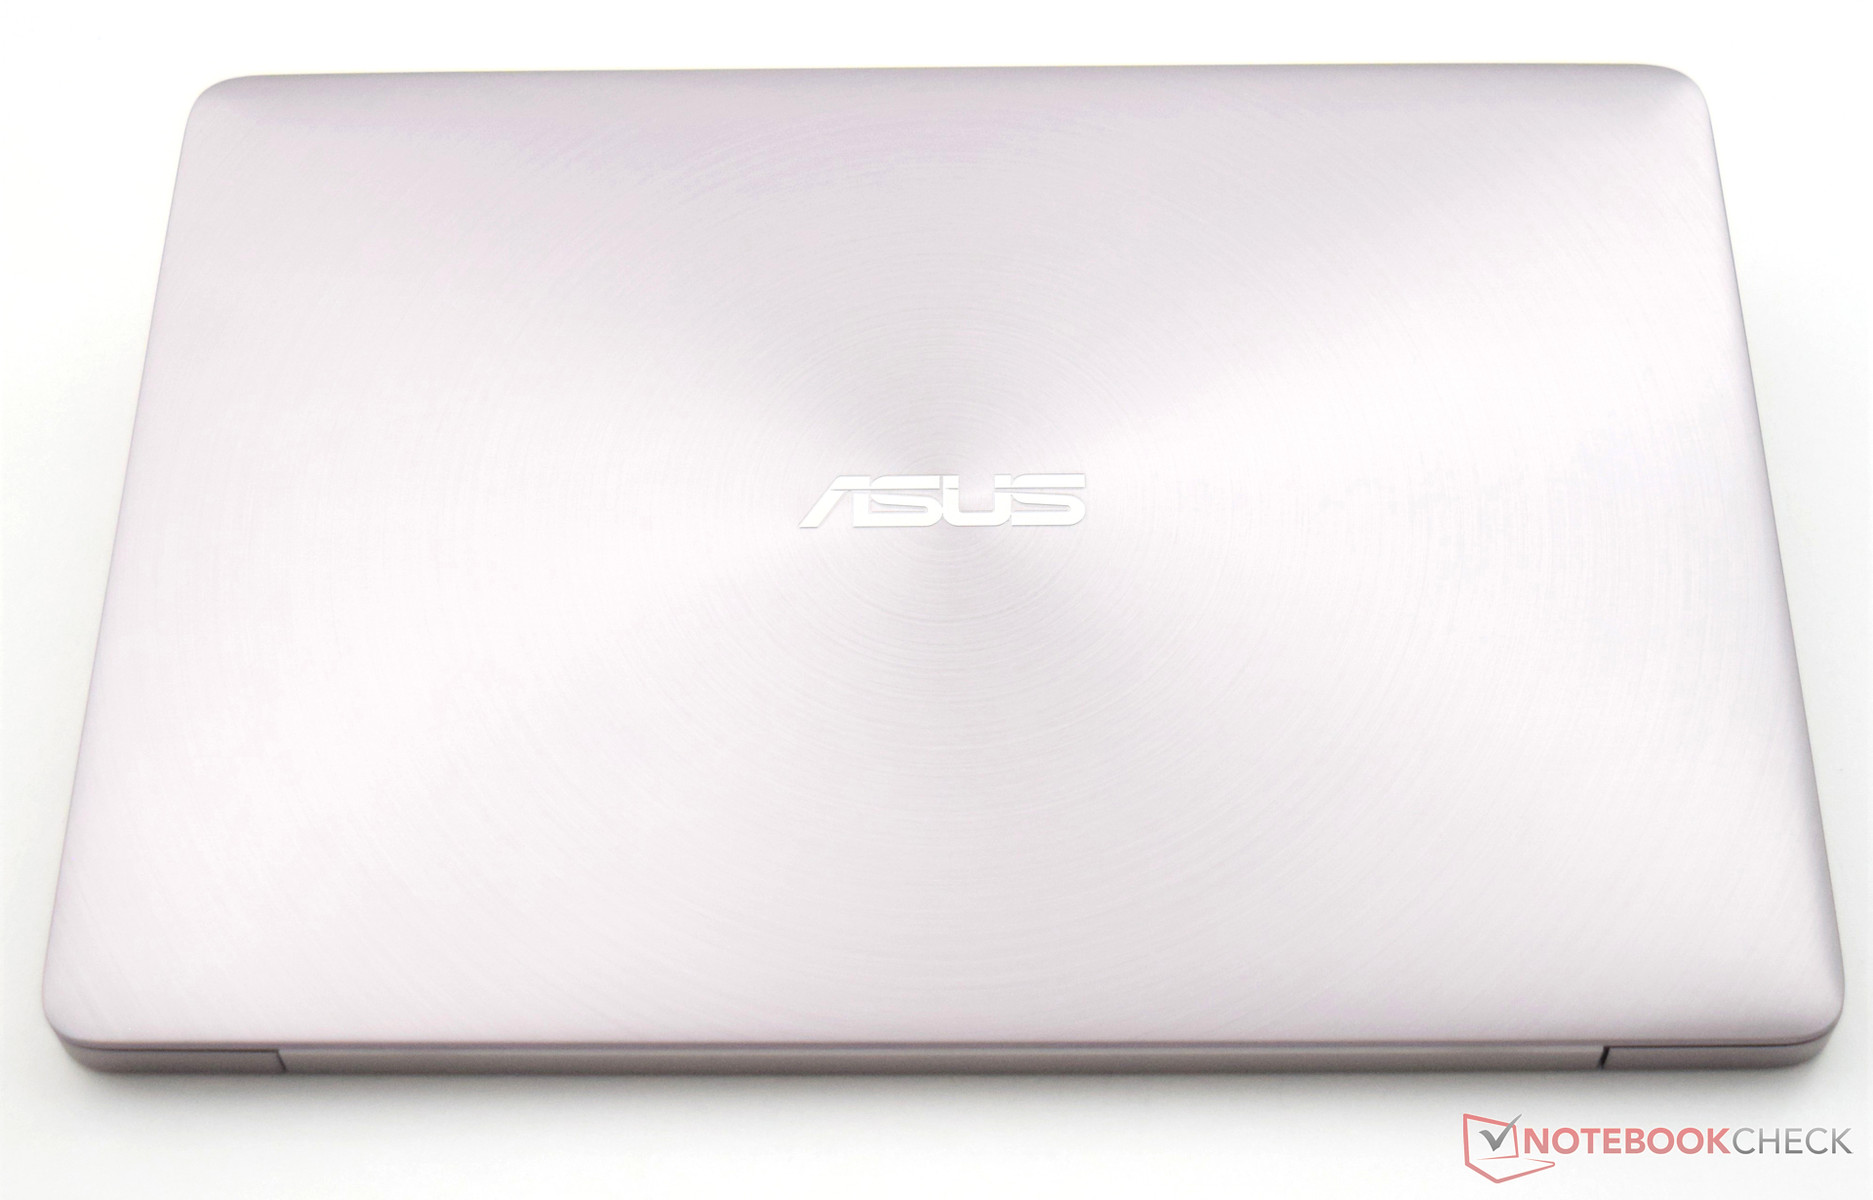
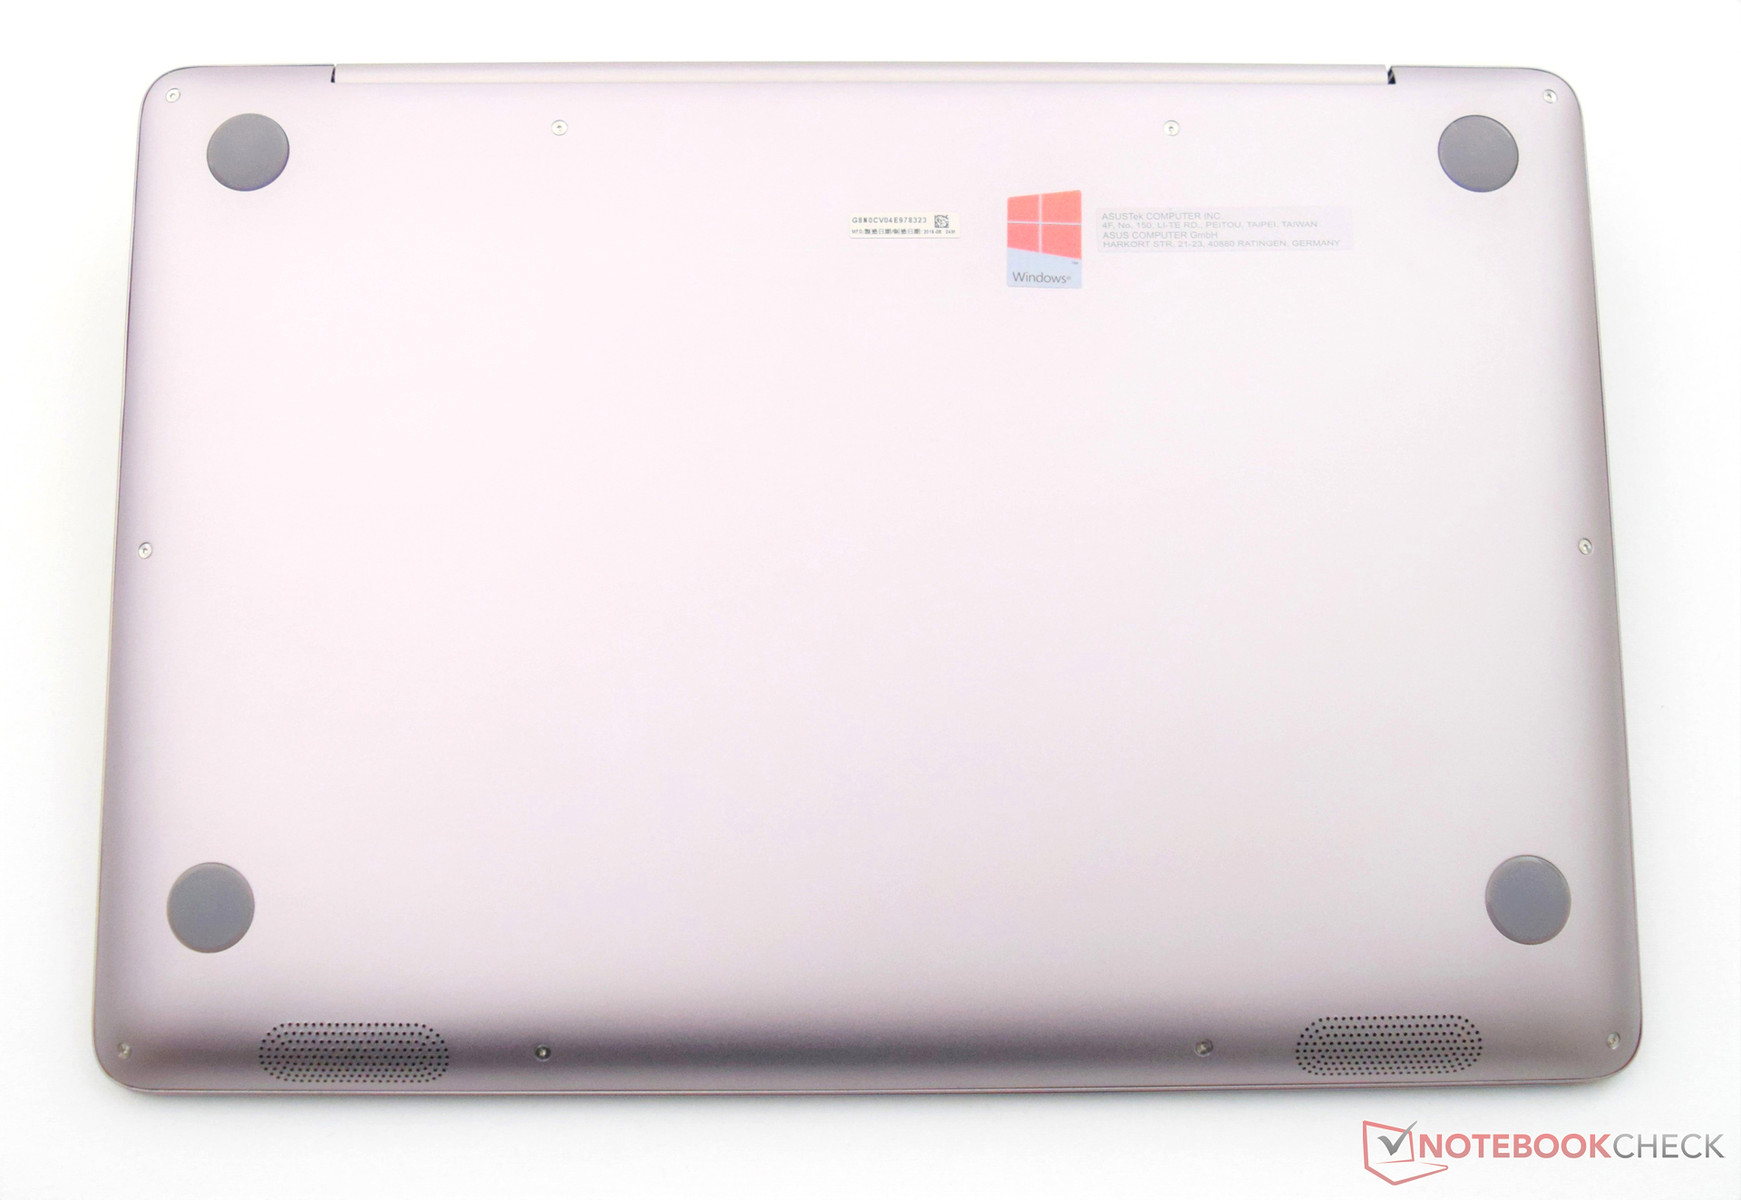
La serie ZenBook Asus è conosciuta per i suoi dispositivi leggeri e mobile e possiamo dirlo anche per l'Asus ZenBook UX310UQ. Con lo ZenBook UX310UQ, ASUS offre un subnotebook duraturo, che convince con materiali di alta qualità e buona costruzione. La configurazione testata costa circa 1200 Euro (~$1267) ed offre buone prestazioni di sistema e ampia autonomia.
A primo impatto, l'Asus ZenBook UX310UQ appare high-end. Peso contenuto e autonomia ampia rendono questo dispositivo un compagno per le nostre attività quotidiane. I clienti avranno un dispositivo elegante per 1200 Euro (~$1267).
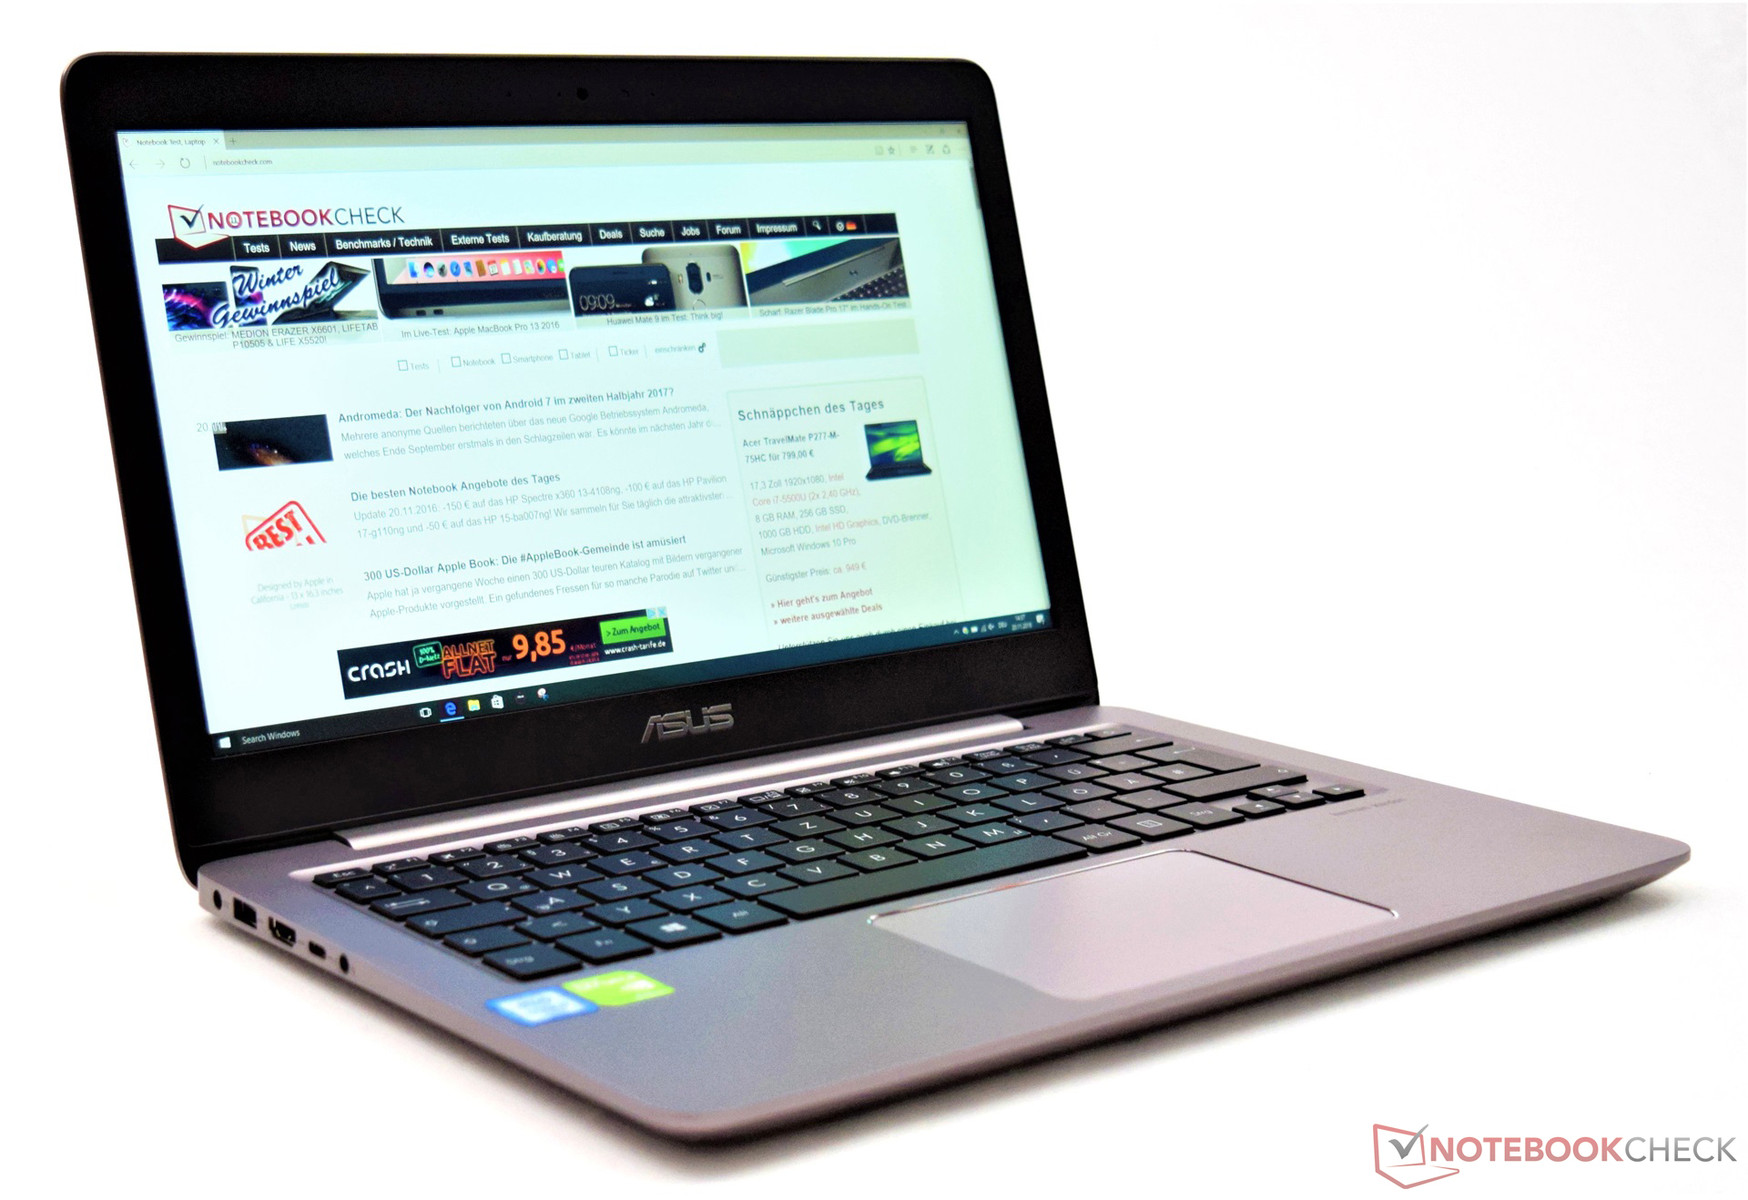
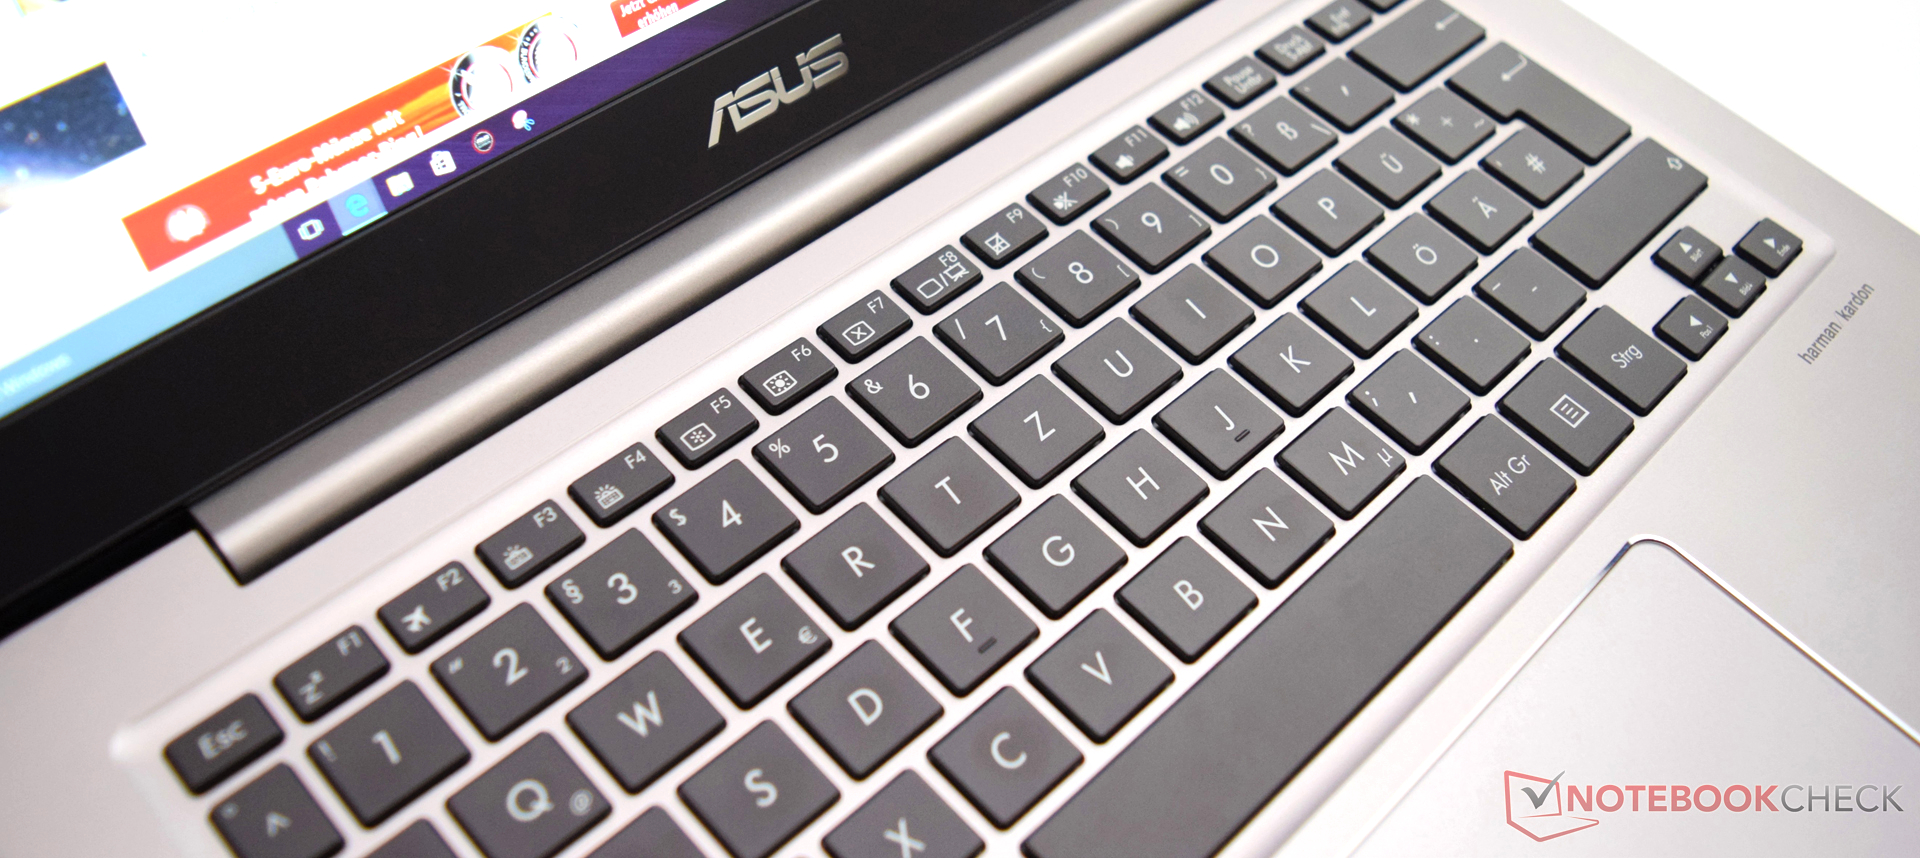
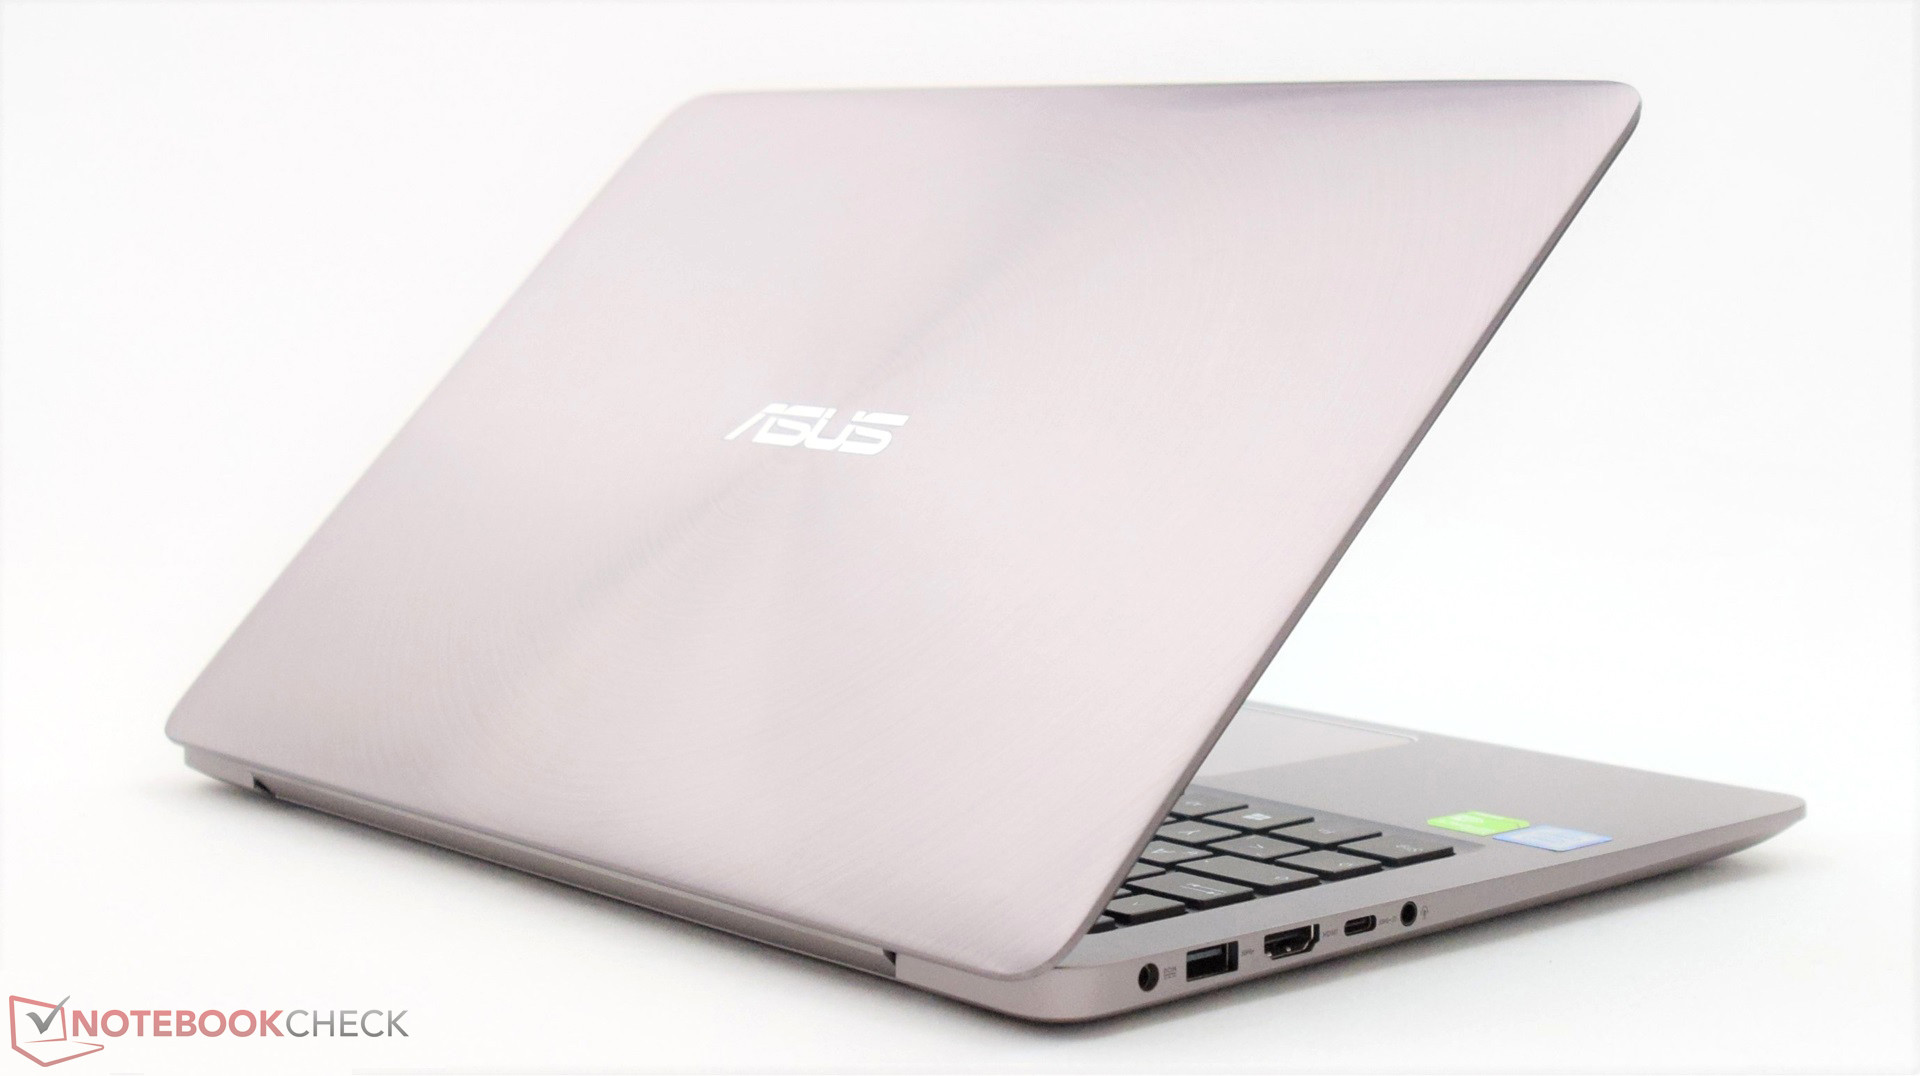
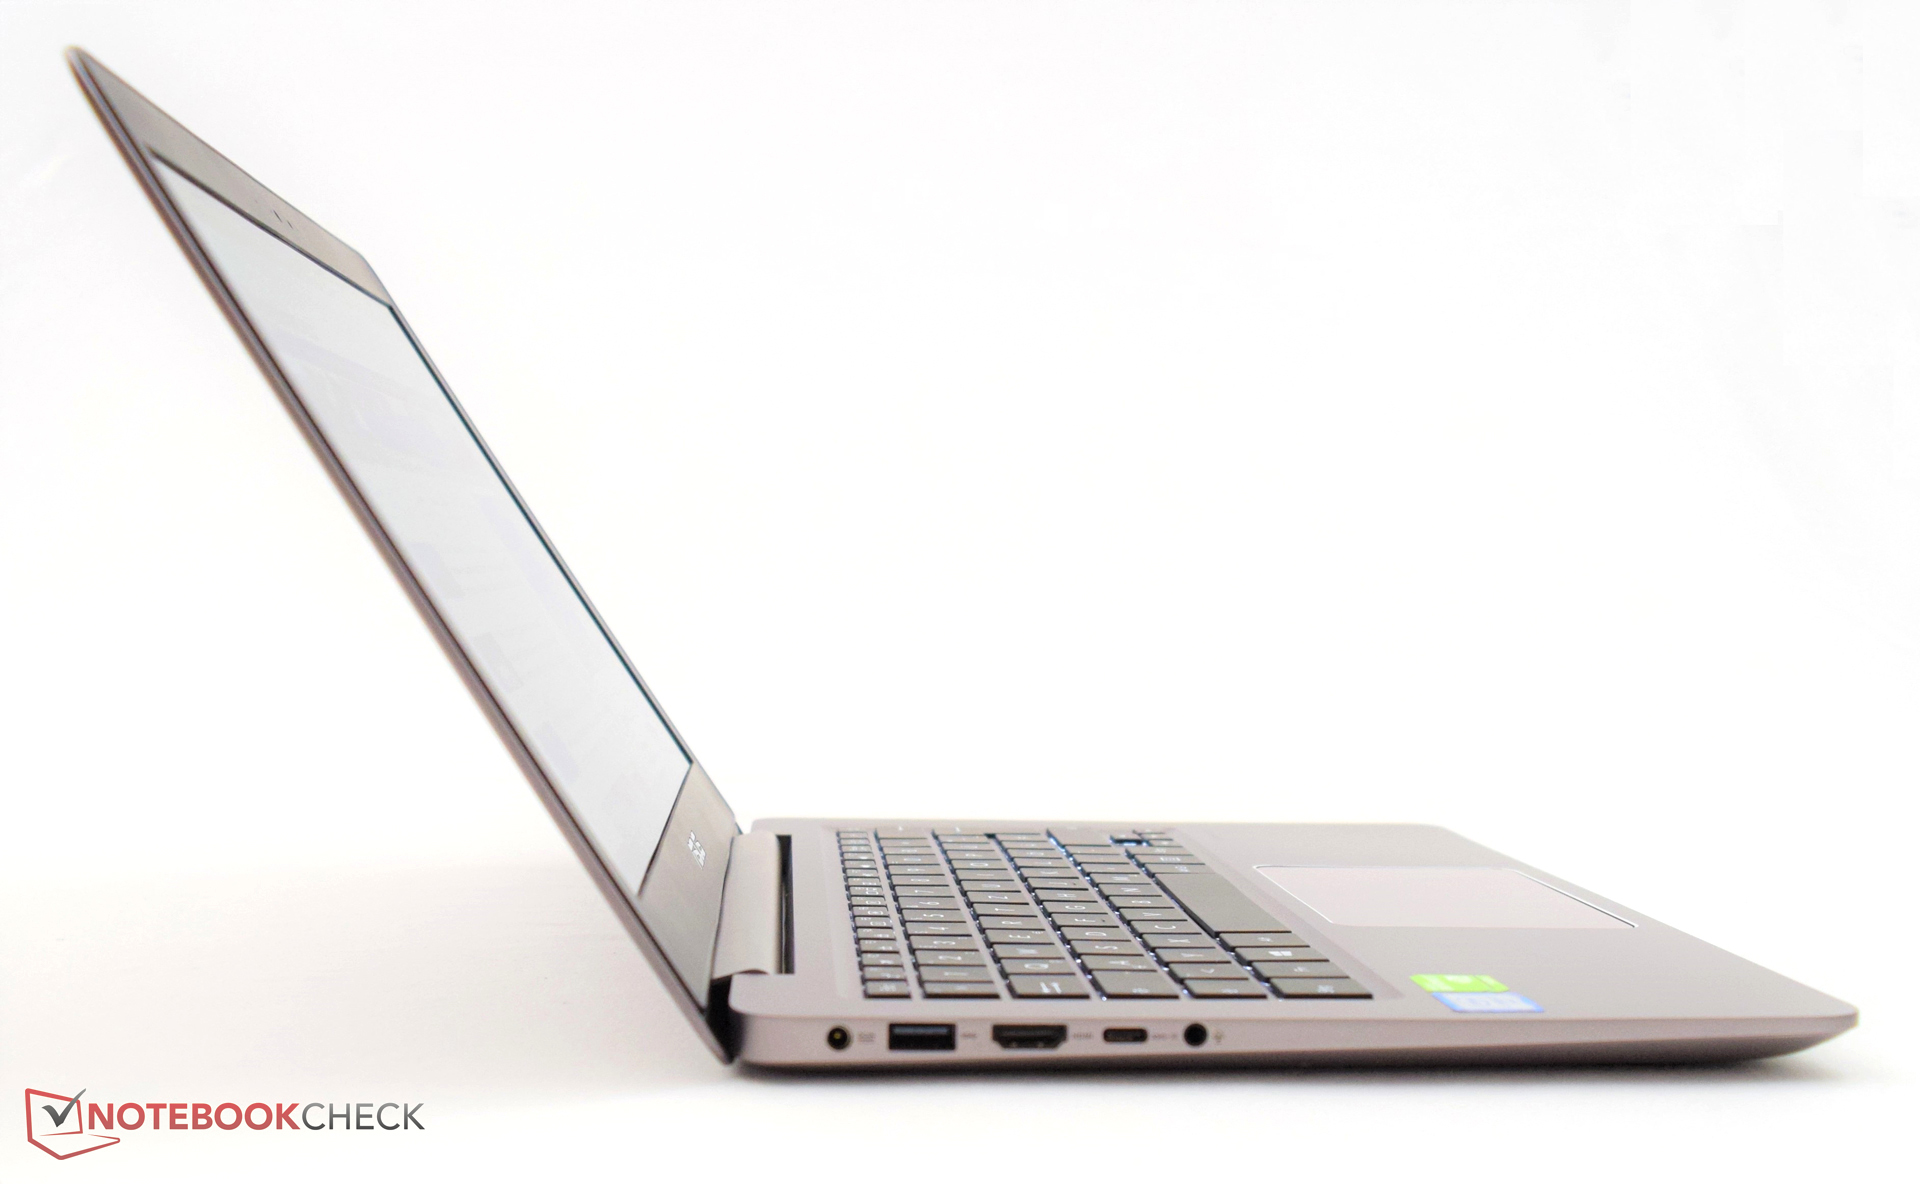
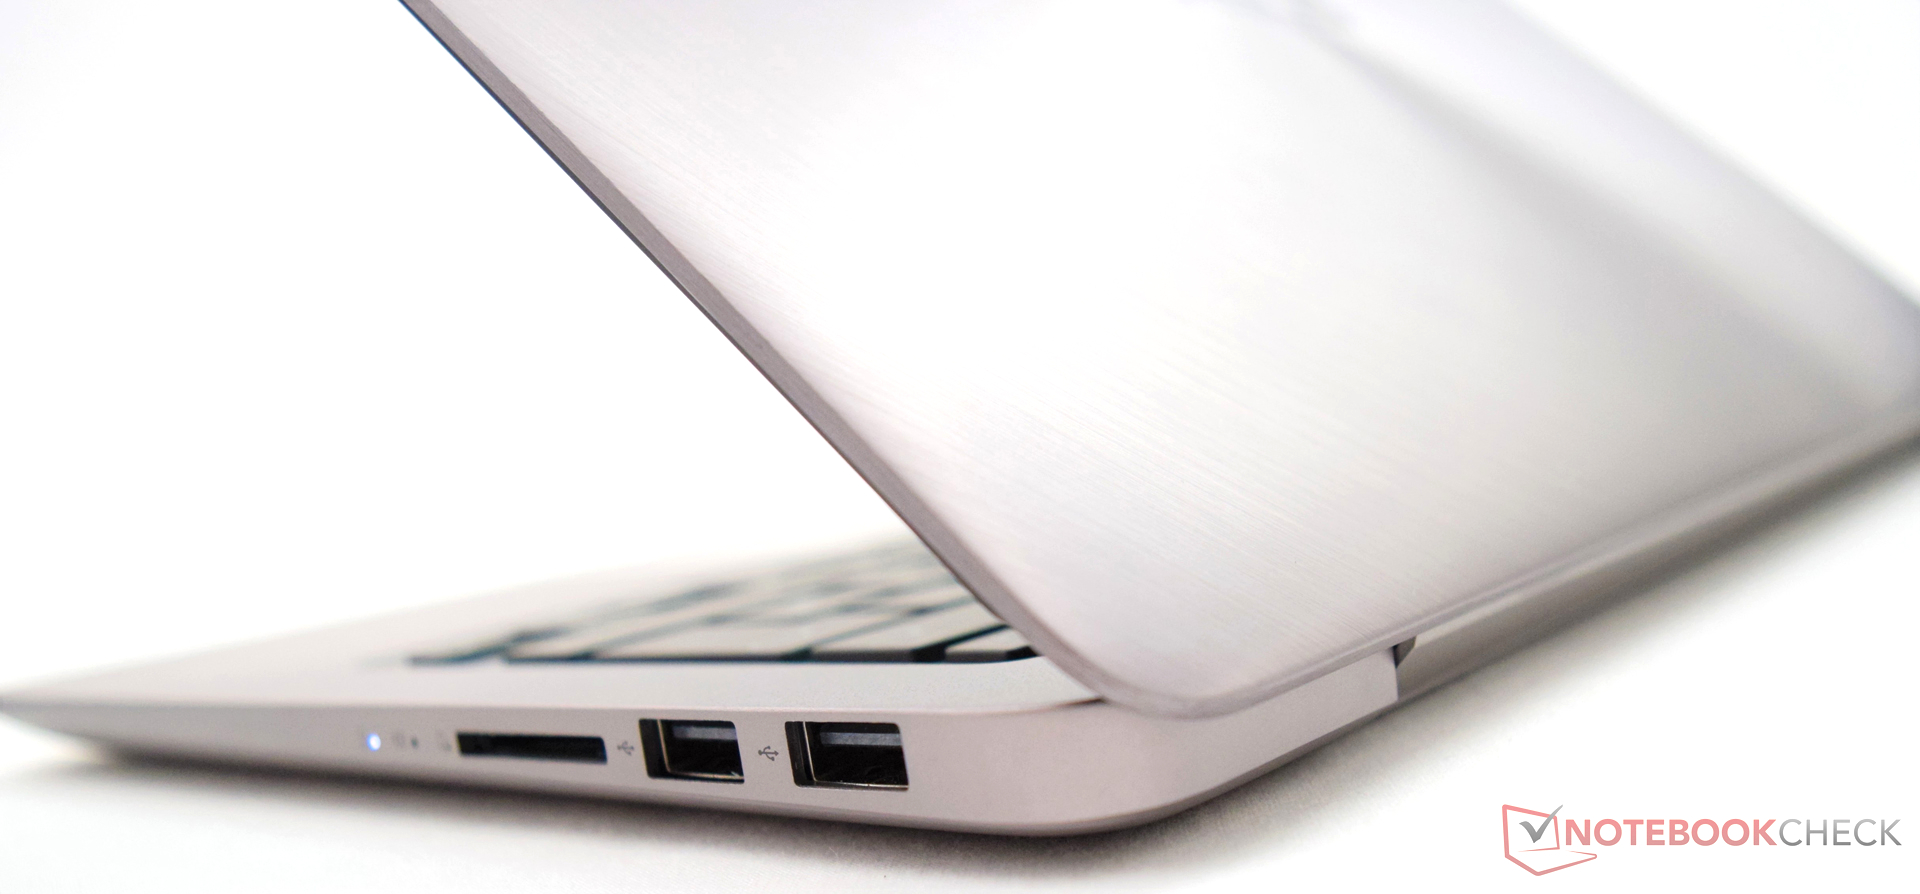
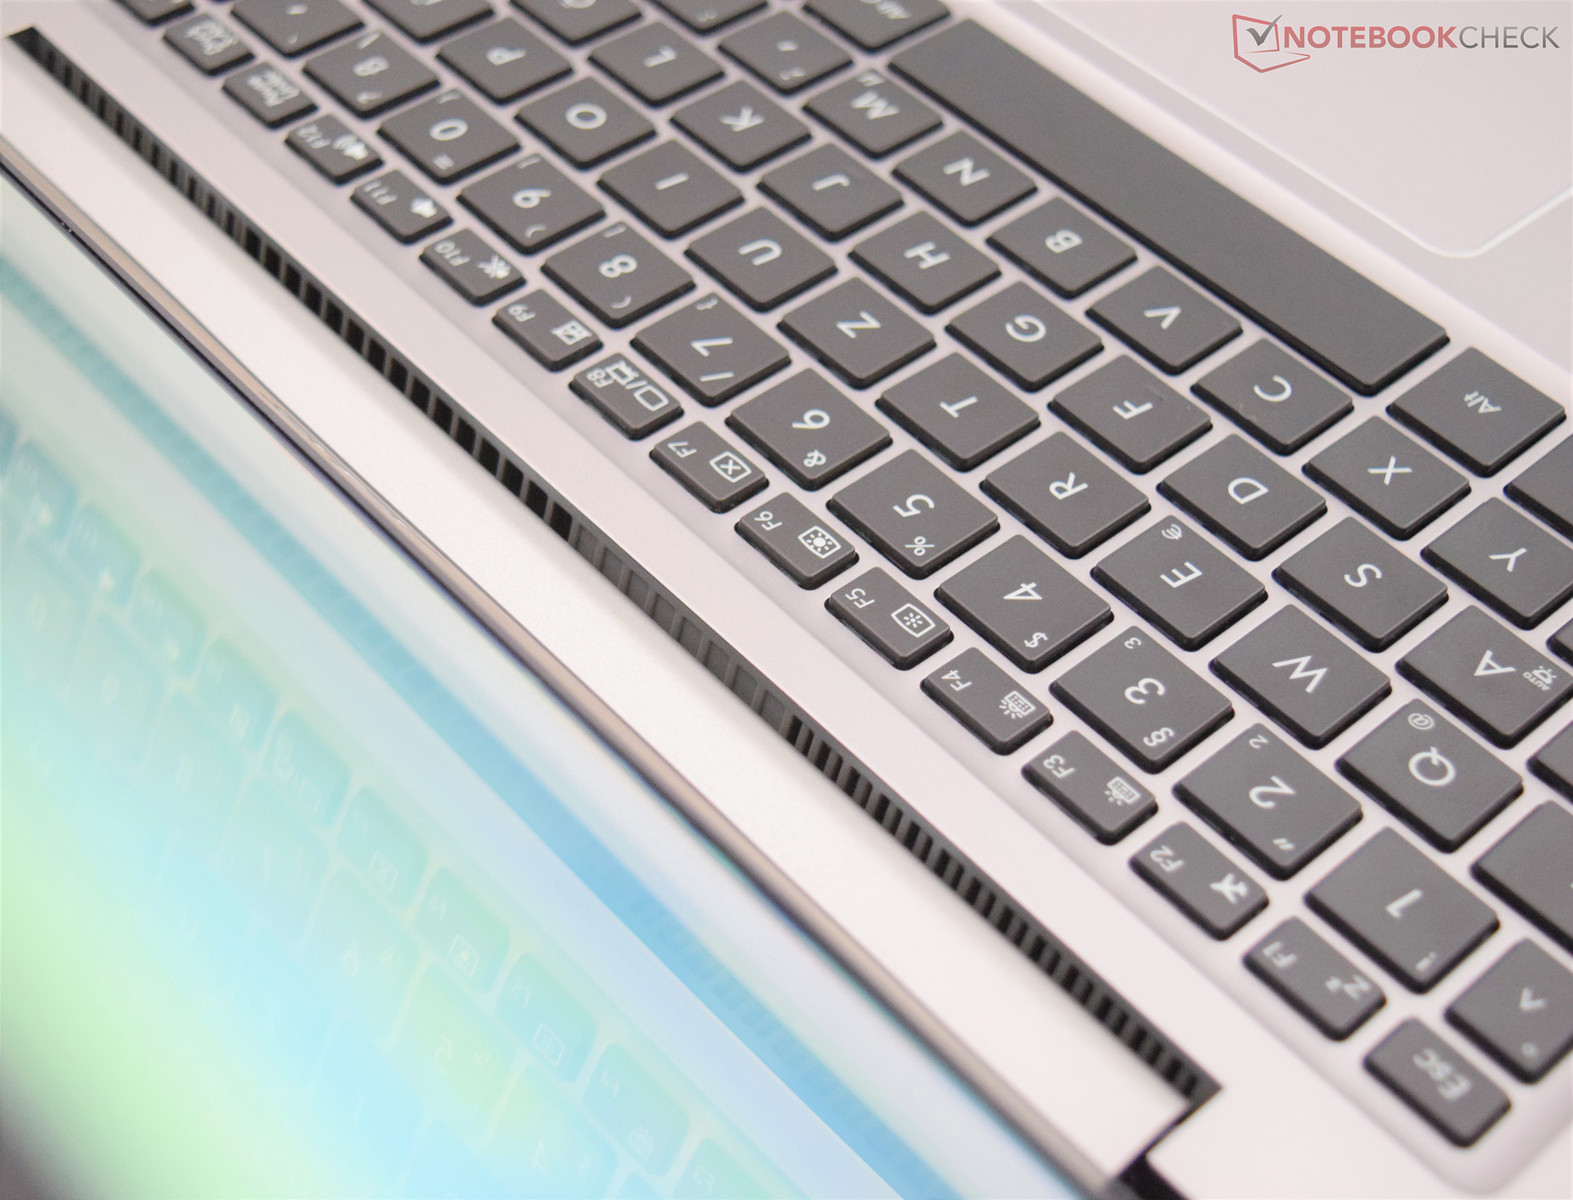
Il pannello TN è sotto le attese. Un dispositivo di questo prezzo dovrebbe avere un display nettamente migliore. I dispositivo di input non convincono in pieno. Quindi chi scrive molto non sarà contento dello ZenBook UX310UQ a lungo andare. La custodia in dotazione per trasportare il dispositivo è comoda. In aggiunta, Asus ha fatto un buon lavoro per la connettività. Per essere un 13", ha abbastanza interfacce per collegare le periferiche.
Nota: si tratta di una recensione breve, con alcune sezioni non tradotte, per la versione integrale in inglese guardate qui.
Asus Zenbook UX310UQ-GL011T
- 12/06/2016 v6 (old)
Sebastian Bade