Recensione breve del convertibile Lenovo Yoga 710-14ISK
| SD Card Reader | |
| average JPG Copy Test (av. of 3 runs) | |
| Lenovo Yoga 710-14ISK | |
| Lenovo Yoga 510-15ISK | |
| HP Envy 15-w103ng x360 | |
| maximum AS SSD Seq Read Test (1GB) | |
| HP Envy 15-w103ng x360 | |
| Lenovo Yoga 710-14ISK | |
| Lenovo Yoga 510-15ISK | |
| Networking | |
| Wi-Fi Client 1m | |
| Wi-Fi Server 1m |
| |||||||||||||||||||||||||
Distribuzione della luminosità: 88 %
Al centro con la batteria: 325 cd/m²
Contrasto: 929:1 (Nero: 0.35 cd/m²)
ΔE ColorChecker Calman: 6.2 | ∀{0.5-29.43 Ø4.71}
ΔE Greyscale Calman: 6.32 | ∀{0.09-98 Ø4.96}
90% sRGB (Argyll 1.6.3 3D)
58% AdobeRGB 1998 (Argyll 1.6.3 3D)
Gamma: 2.3
CCT: 6926 K
| Lenovo Yoga 710-14ISK AU Optronics B140HAN03.0, , 1920x1080, 14" | Lenovo Yoga 510-15ISK BOE HF NV156FHM-N42, , 1920x1080, 15.6" | Lenovo Yoga 3 14-80JH0035GE LG Philips LGD047A (LP140WF3-SPL2), , 1920x1080, 14" | HP Envy 15-w103ng x360 LG Philips, , 1920x1080, 15.6" | |
|---|---|---|---|---|
| Display | ||||
| Display P3 Coverage (%) | 42.58 | 39.31 | 39.97 | |
| sRGB Coverage (%) | 63.9 | 58.8 | 59.8 | |
| AdobeRGB 1998 Coverage (%) | 43.99 | 40.65 | 41.32 | |
| Response Times | -11% | 2% | ||
| Response Time Grey 50% / Grey 80% * (ms) | 35 ? | 43.2 ? -23% | 37 ? -6% | |
| Response Time Black / White * (ms) | 31 ? | 30.8 ? 1% | 28 ? 10% | |
| PWM Frequency (Hz) | 50 ? | |||
| Screen | 2% | -2% | -18% | |
| Brightness middle (cd/m²) | 325 | 254 -22% | 239 -26% | 208 -36% |
| Brightness (cd/m²) | 298 | 230 -23% | 227 -24% | 205 -31% |
| Brightness Distribution (%) | 88 | 86 -2% | 88 0% | 80 -9% |
| Black Level * (cd/m²) | 0.35 | 0.26 26% | 0.21 40% | 0.26 26% |
| Contrast (:1) | 929 | 977 5% | 1138 22% | 800 -14% |
| Colorchecker dE 2000 * | 6.2 | 4.23 32% | 5.4 13% | 6.97 -12% |
| Colorchecker dE 2000 max. * | 10.82 | 9.5 12% | ||
| Greyscale dE 2000 * | 6.32 | 2.87 55% | 4.71 25% | 7.37 -17% |
| Gamma | 2.3 96% | 2.35 94% | 2.51 88% | 2.34 94% |
| CCT | 6926 94% | 5965 109% | 6354 102% | 6823 95% |
| Color Space (Percent of AdobeRGB 1998) (%) | 58 | 40.35 -30% | 37 -36% | 38 -34% |
| Color Space (Percent of sRGB) (%) | 90 | 63.48 -29% | 59 -34% | 59 -34% |
| Media totale (Programma / Settaggio) | -5% /
0% | -2% /
-2% | -8% /
-14% |
* ... Meglio usare valori piccoli
Tempi di risposta del Display
| ↔ Tempi di risposta dal Nero al Bianco | ||
|---|---|---|
| 31 ms ... aumenta ↗ e diminuisce ↘ combinato | ↗ 9 ms Incremento | 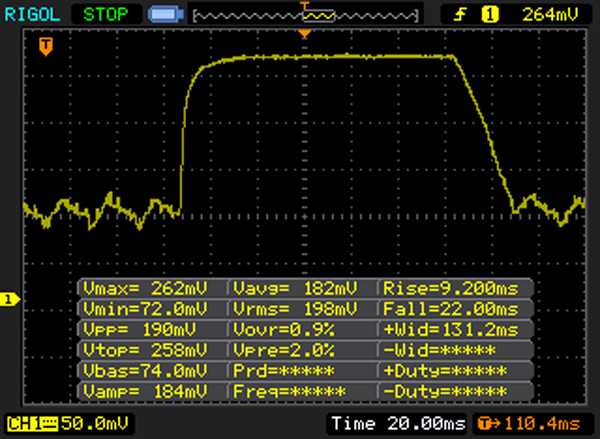 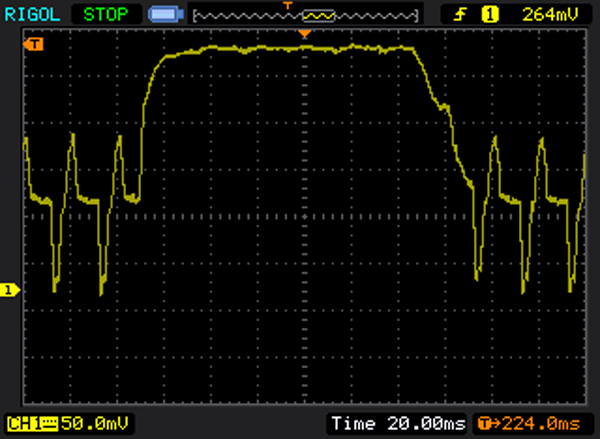 |
| ↘ 22 ms Calo | ||
| Lo schermo mostra tempi di risposta lenti nei nostri tests e sarà insoddisfacente per i gamers. In confronto, tutti i dispositivi di test variano da 0.1 (minimo) a 240 (massimo) ms. » 84 % di tutti i dispositivi è migliore. Questo significa che i tempi di risposta rilevati sono peggiori rispetto alla media di tutti i dispositivi testati (19.8 ms). | ||
| ↔ Tempo di risposta dal 50% Grigio all'80% Grigio | ||
| 35 ms ... aumenta ↗ e diminuisce ↘ combinato | ↗ 16 ms Incremento | 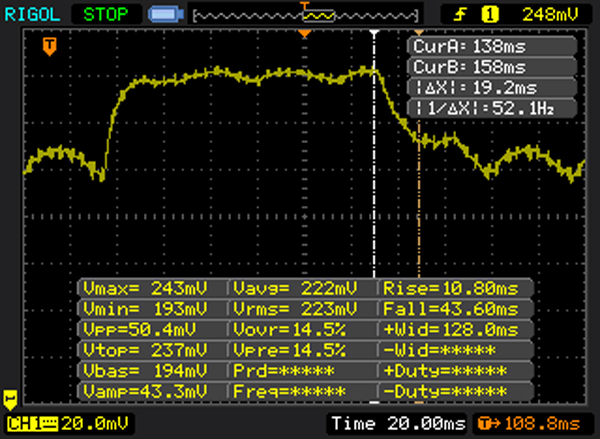 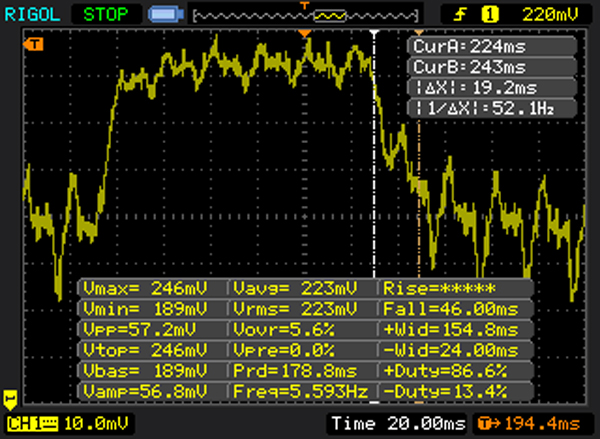 |
| ↘ 19 ms Calo | ||
| Lo schermo mostra tempi di risposta lenti nei nostri tests e sarà insoddisfacente per i gamers. In confronto, tutti i dispositivi di test variano da 0.165 (minimo) a 636 (massimo) ms. » 49 % di tutti i dispositivi è migliore. Questo significa che i tempi di risposta rilevati sono peggiori rispetto alla media di tutti i dispositivi testati (31 ms). | ||
Sfarfallio dello schermo / PWM (Pulse-Width Modulation)
| flickering dello schermo / PWM rilevato | 50 Hz | ≤ 50 % settaggio luminosita' | 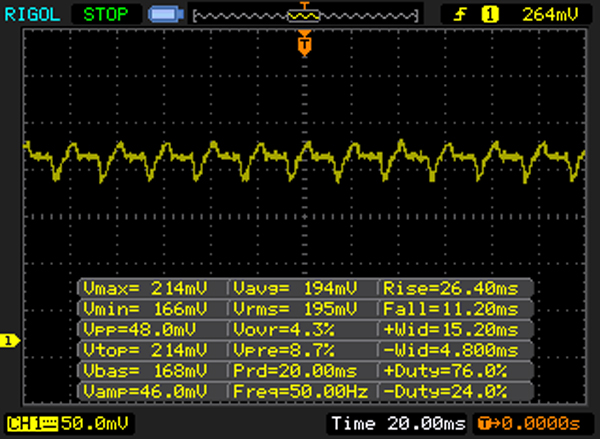 |
Il display sfarfalla a 50 Hz (Probabilmente a causa dell'uso di PWM) Flickering rilevato ad una luminosita' di 50 % o inferiore. Non dovrebbe verificarsi flickering o PWM sopra questo valore di luminosita'. La frequenza di 50 Hz è molto bassa, quindi il flickering potrebbe causare stanchezza agli occhi e mal di testa con un utilizzo prolungato. In confronto: 52 % di tutti i dispositivi testati non utilizza PWM per ridurre la luminosita' del display. Se è rilevato PWM, una media di 7757 (minimo: 5 - massimo: 343500) Hz è stata rilevata. | |||
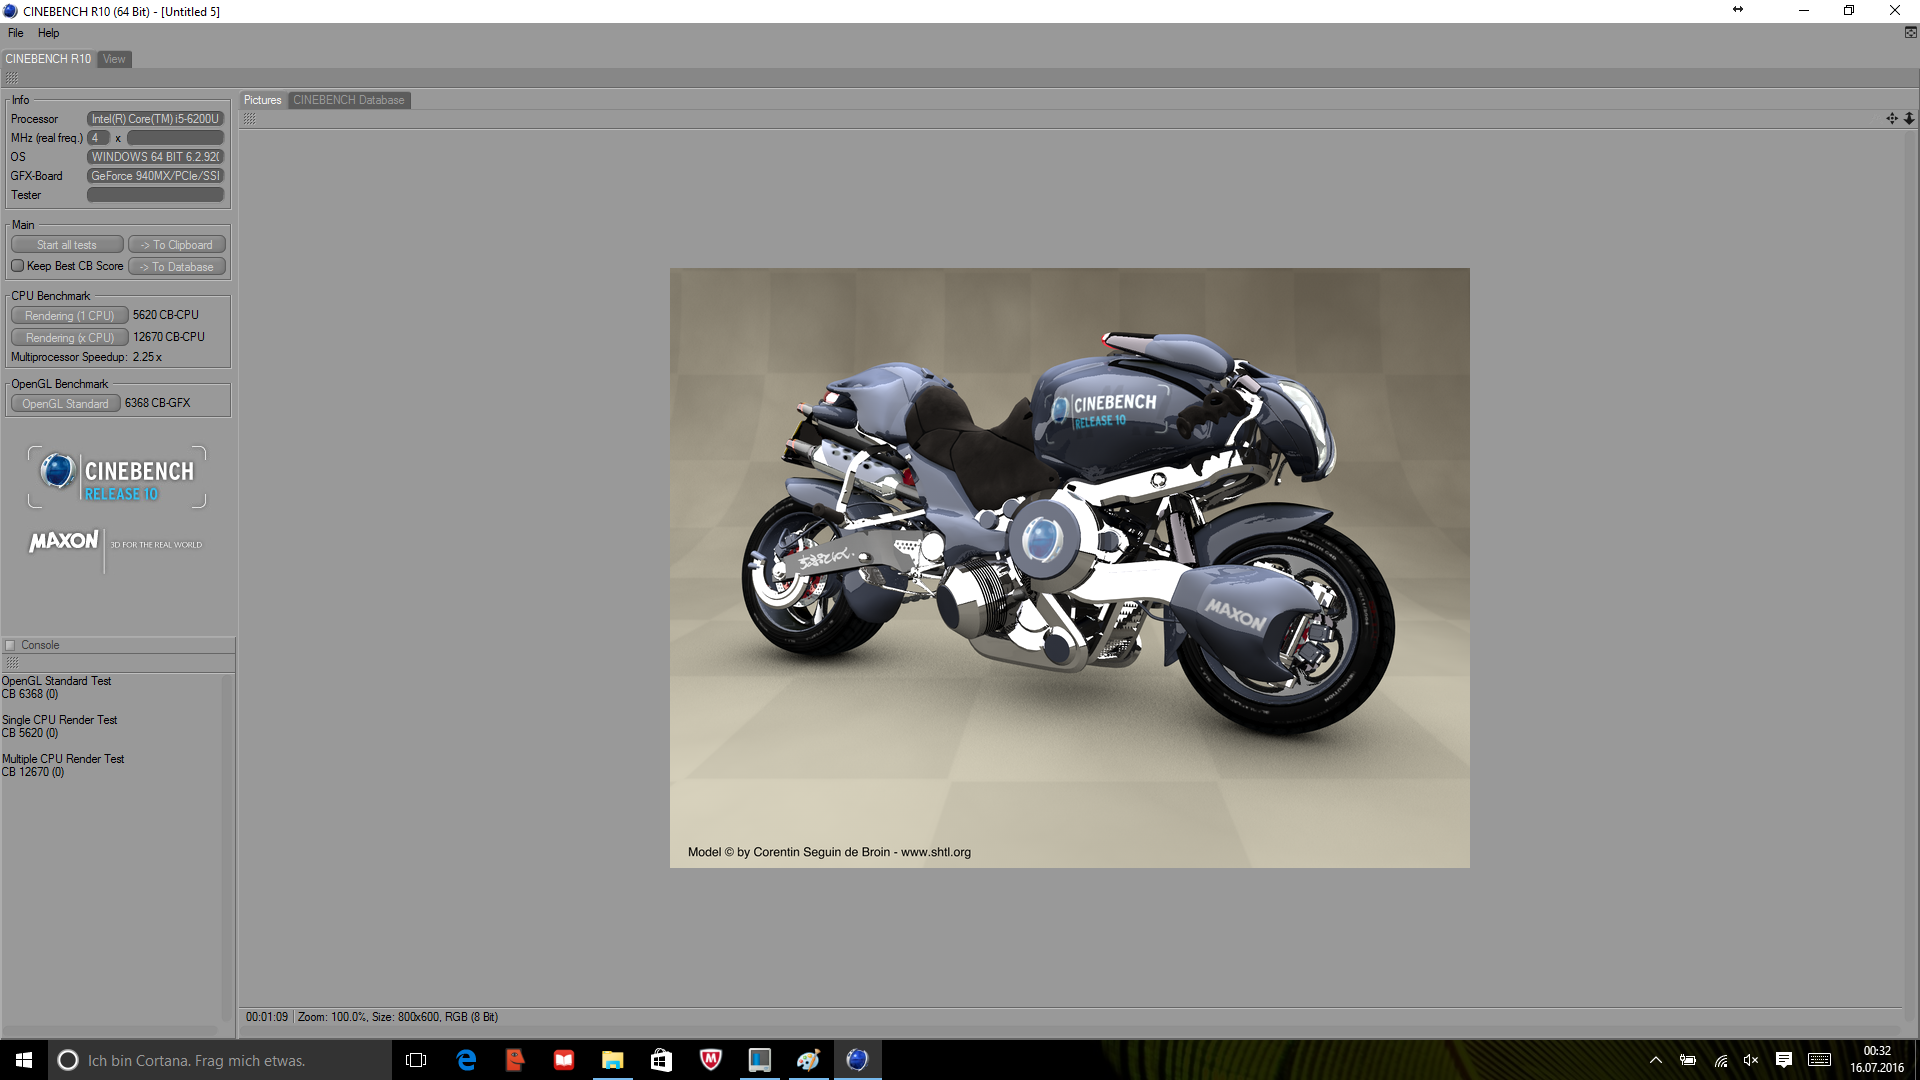
| Cinebench R10 | |
| Rendering Single CPUs 64Bit (ordina per valore) | |
| Lenovo Yoga 710-14ISK | |
| Lenovo Yoga 3 14-80JH0035GE | |
| Rendering Multiple CPUs 64Bit (ordina per valore) | |
| Lenovo Yoga 710-14ISK | |
| Lenovo Yoga 3 14-80JH0035GE | |
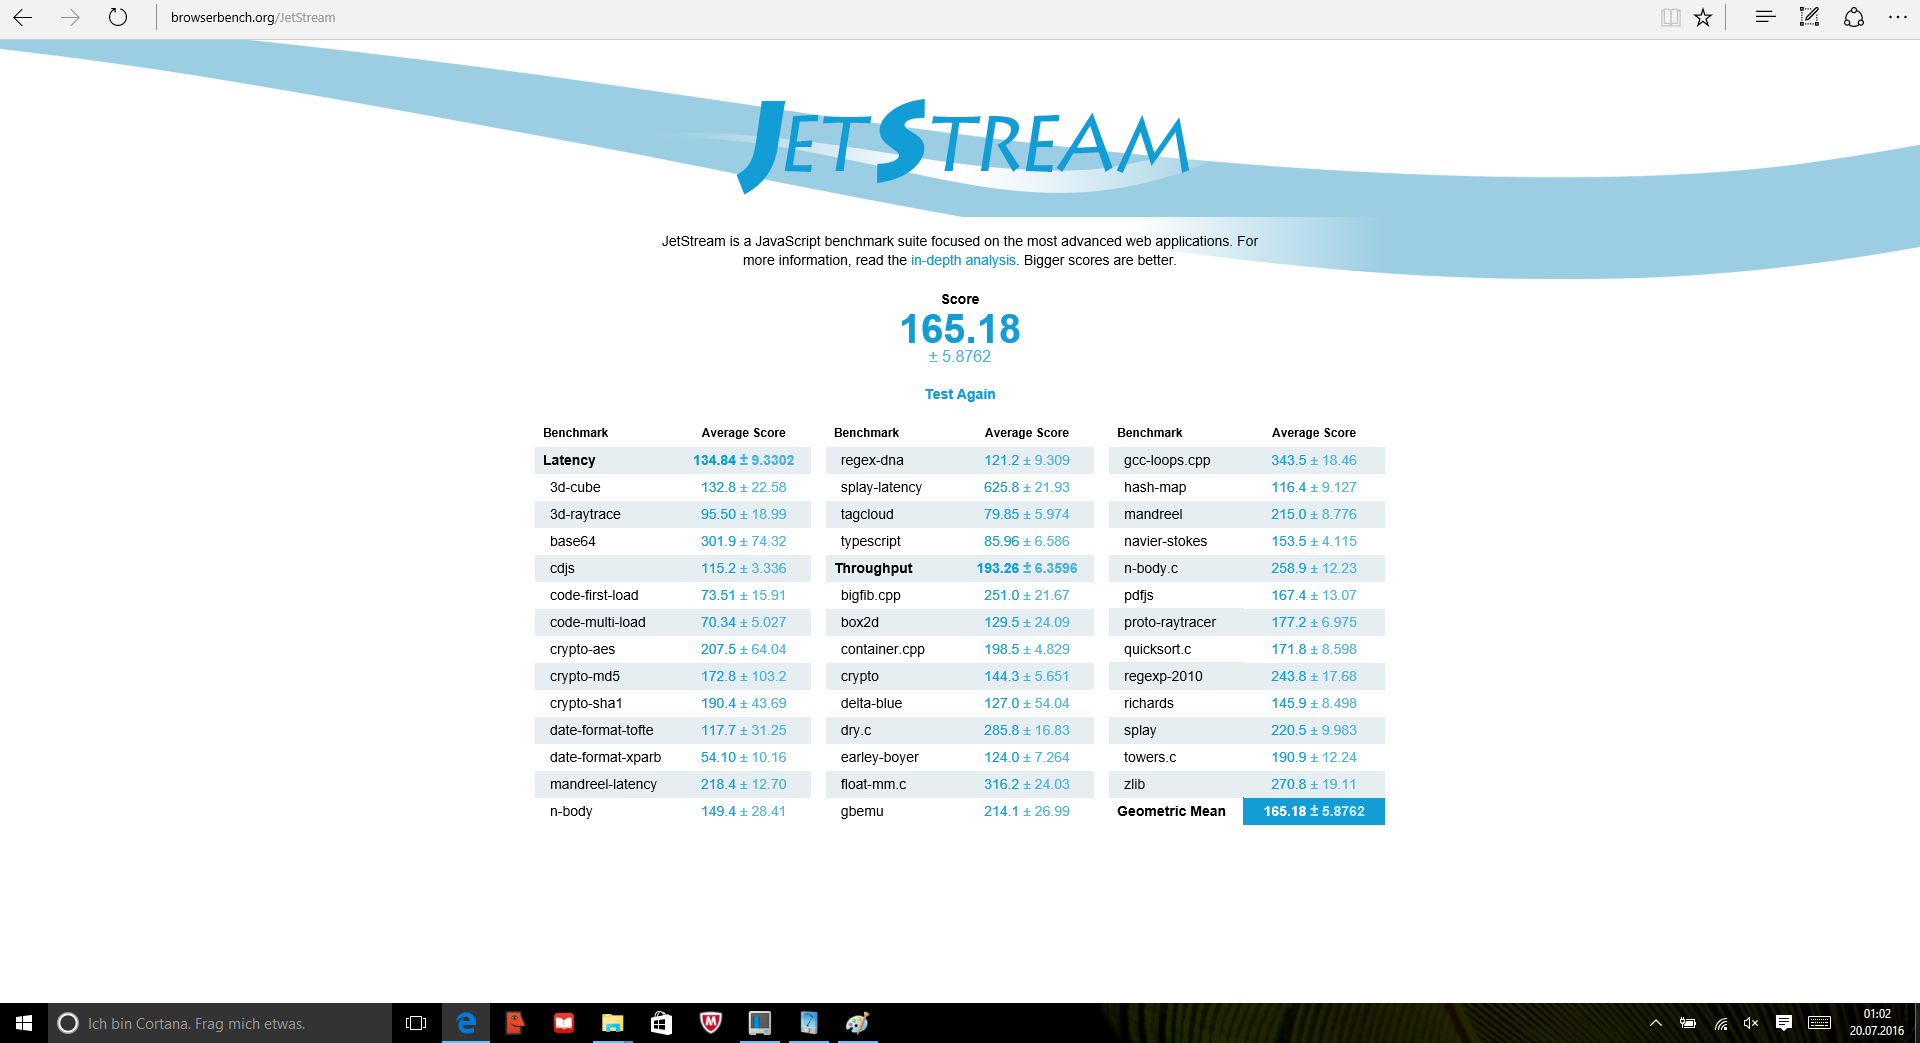
| JetStream 1.1 - 1.1 Total (ordina per valore) | |
| Lenovo Yoga 710-14ISK | |
| Lenovo Yoga 510-15ISK | |
| HP Envy 15-w103ng x360 | |
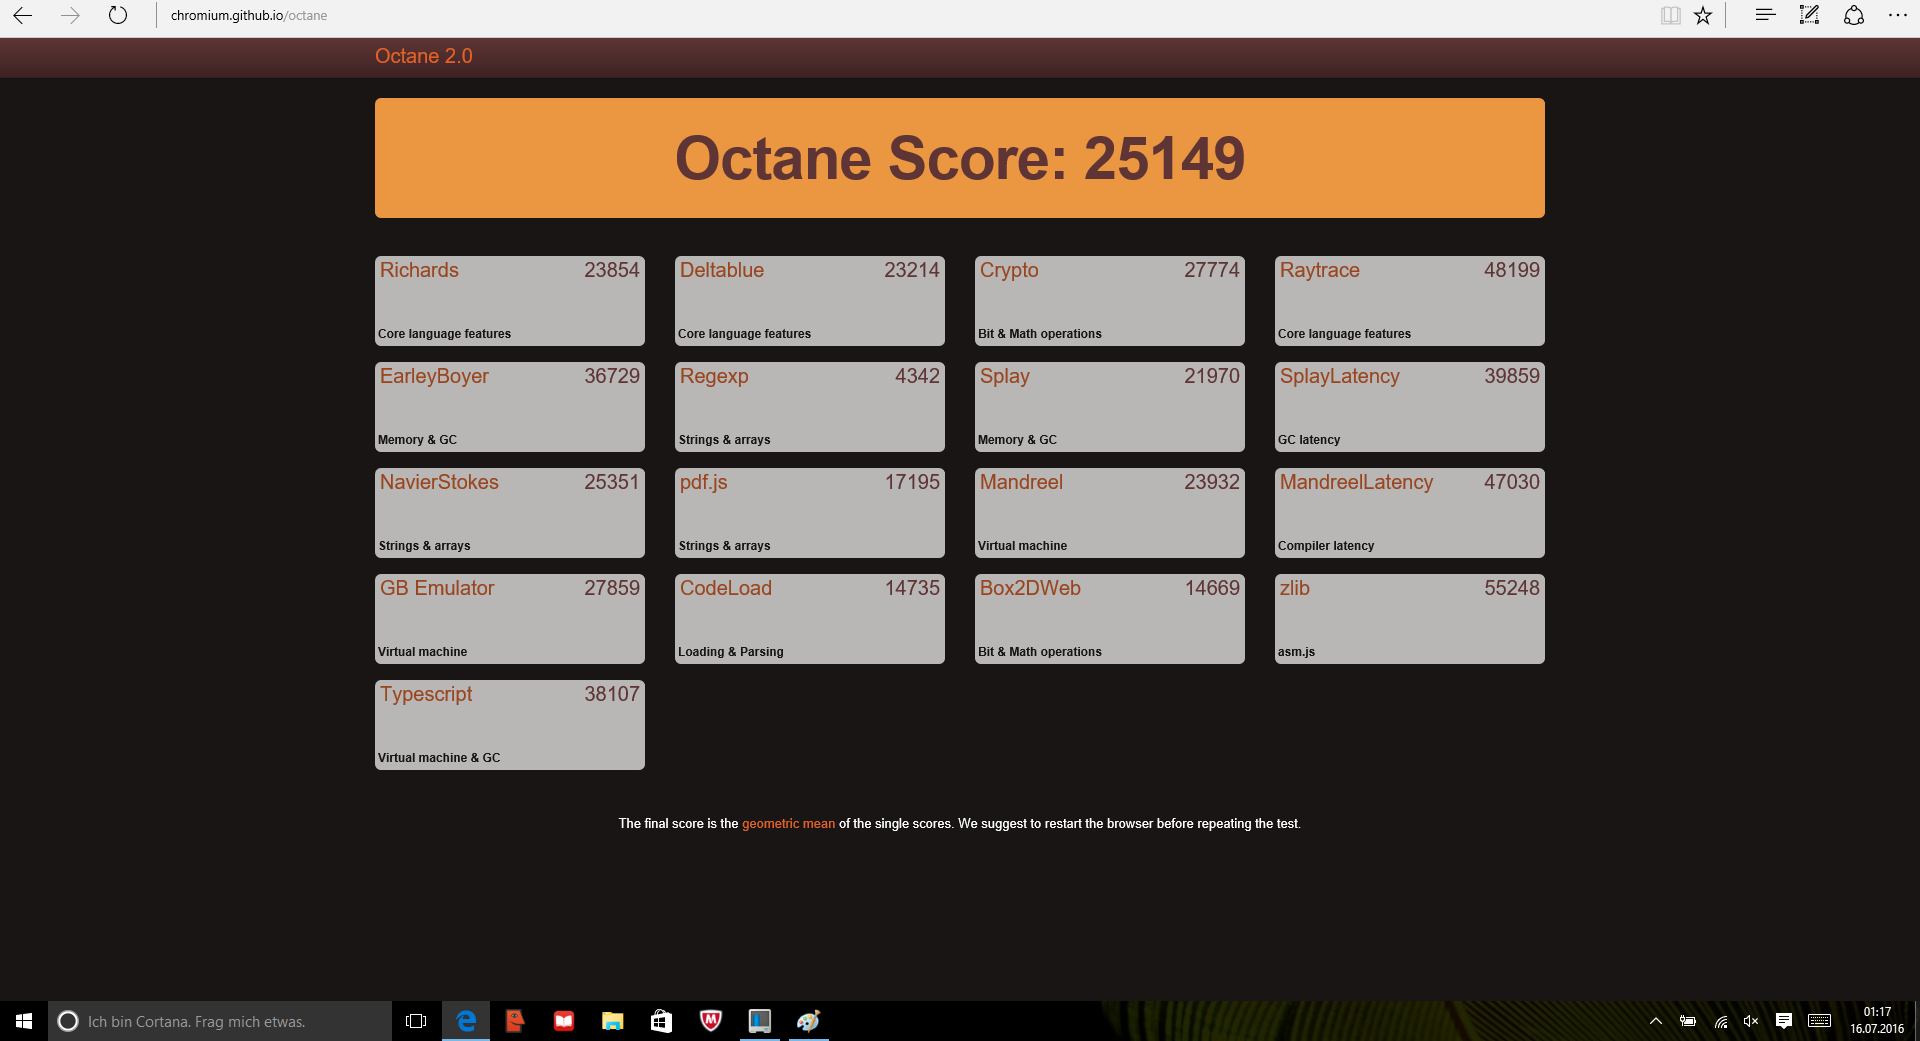
| Octane V2 - Total Score (ordina per valore) | |
| Lenovo Yoga 710-14ISK | |
| Lenovo Yoga 510-15ISK | |
| Lenovo Yoga 3 14-80JH0035GE | |
| HP Envy 15-w103ng x360 | |
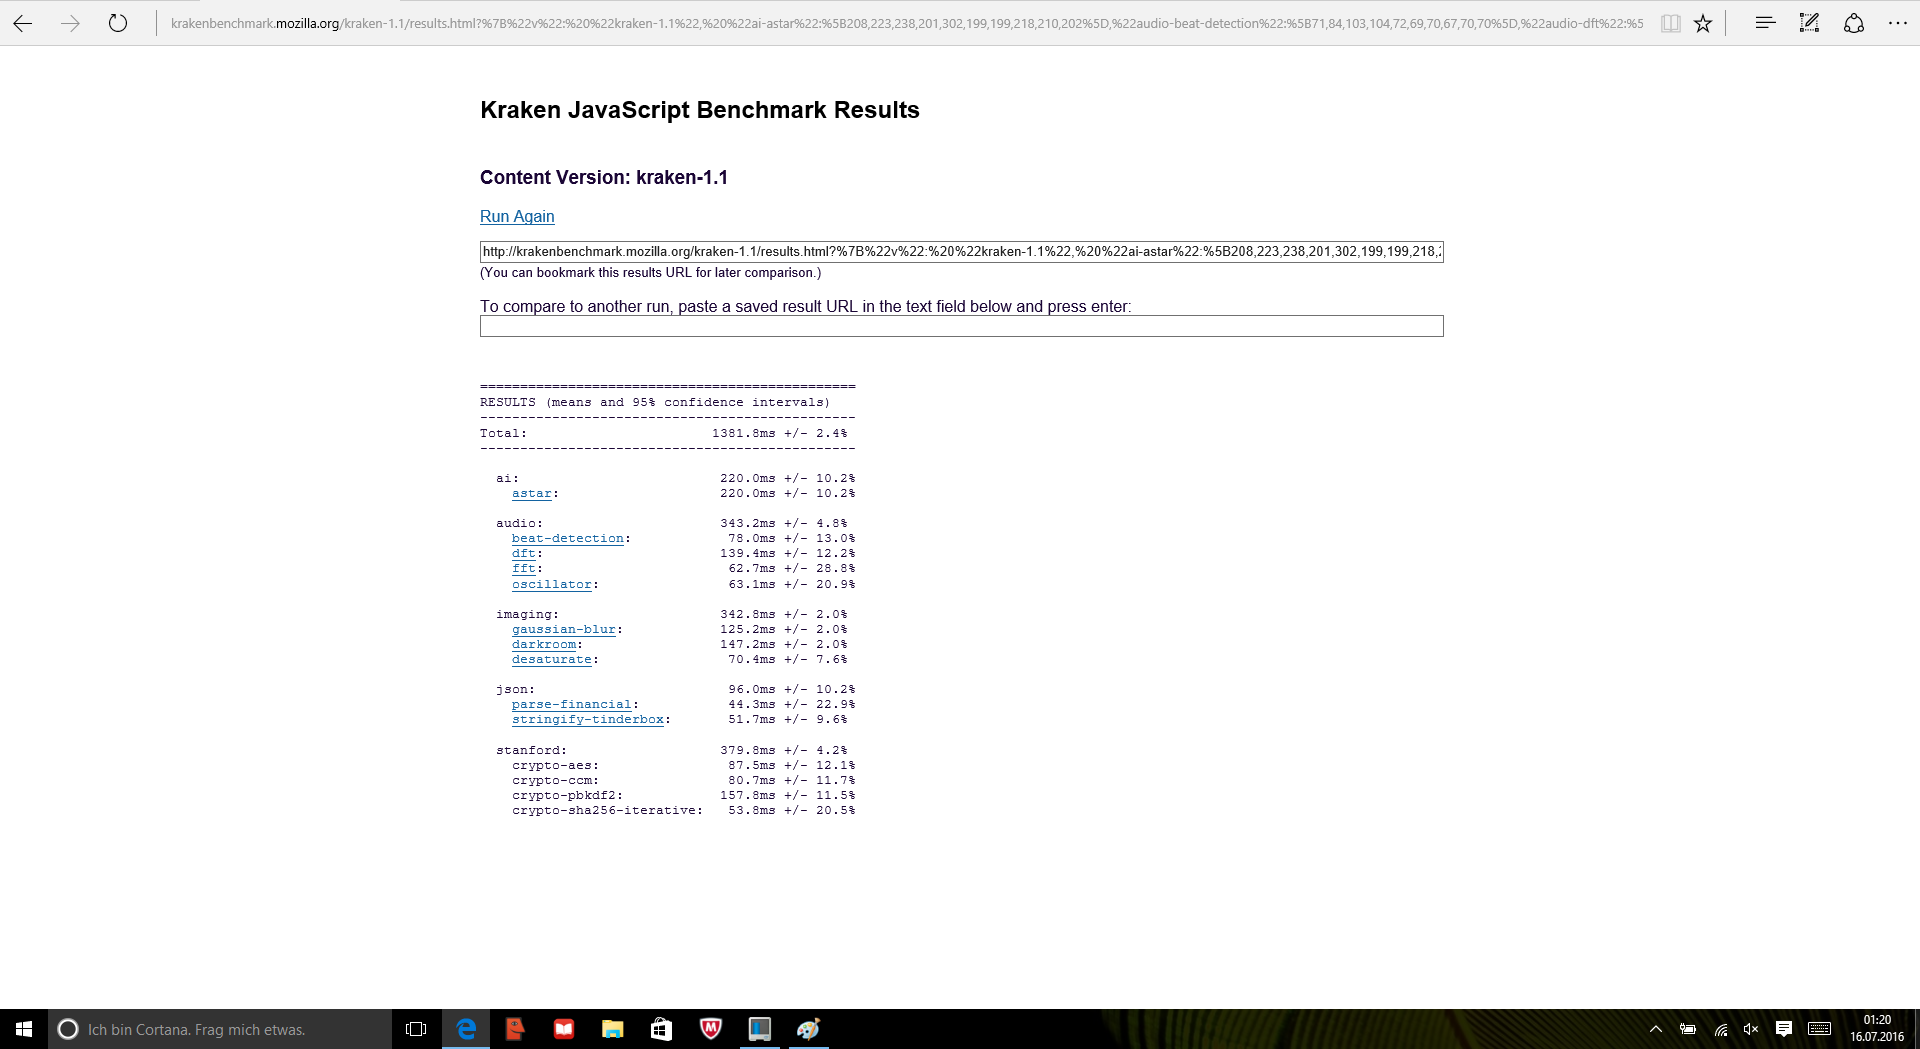
| Mozilla Kraken 1.1 - Total (ordina per valore) | |
| Lenovo Yoga 710-14ISK | |
| Lenovo Yoga 510-15ISK | |
| Lenovo Yoga 3 14-80JH0035GE | |
| HP Envy 15-w103ng x360 | |
* ... Meglio usare valori piccoli
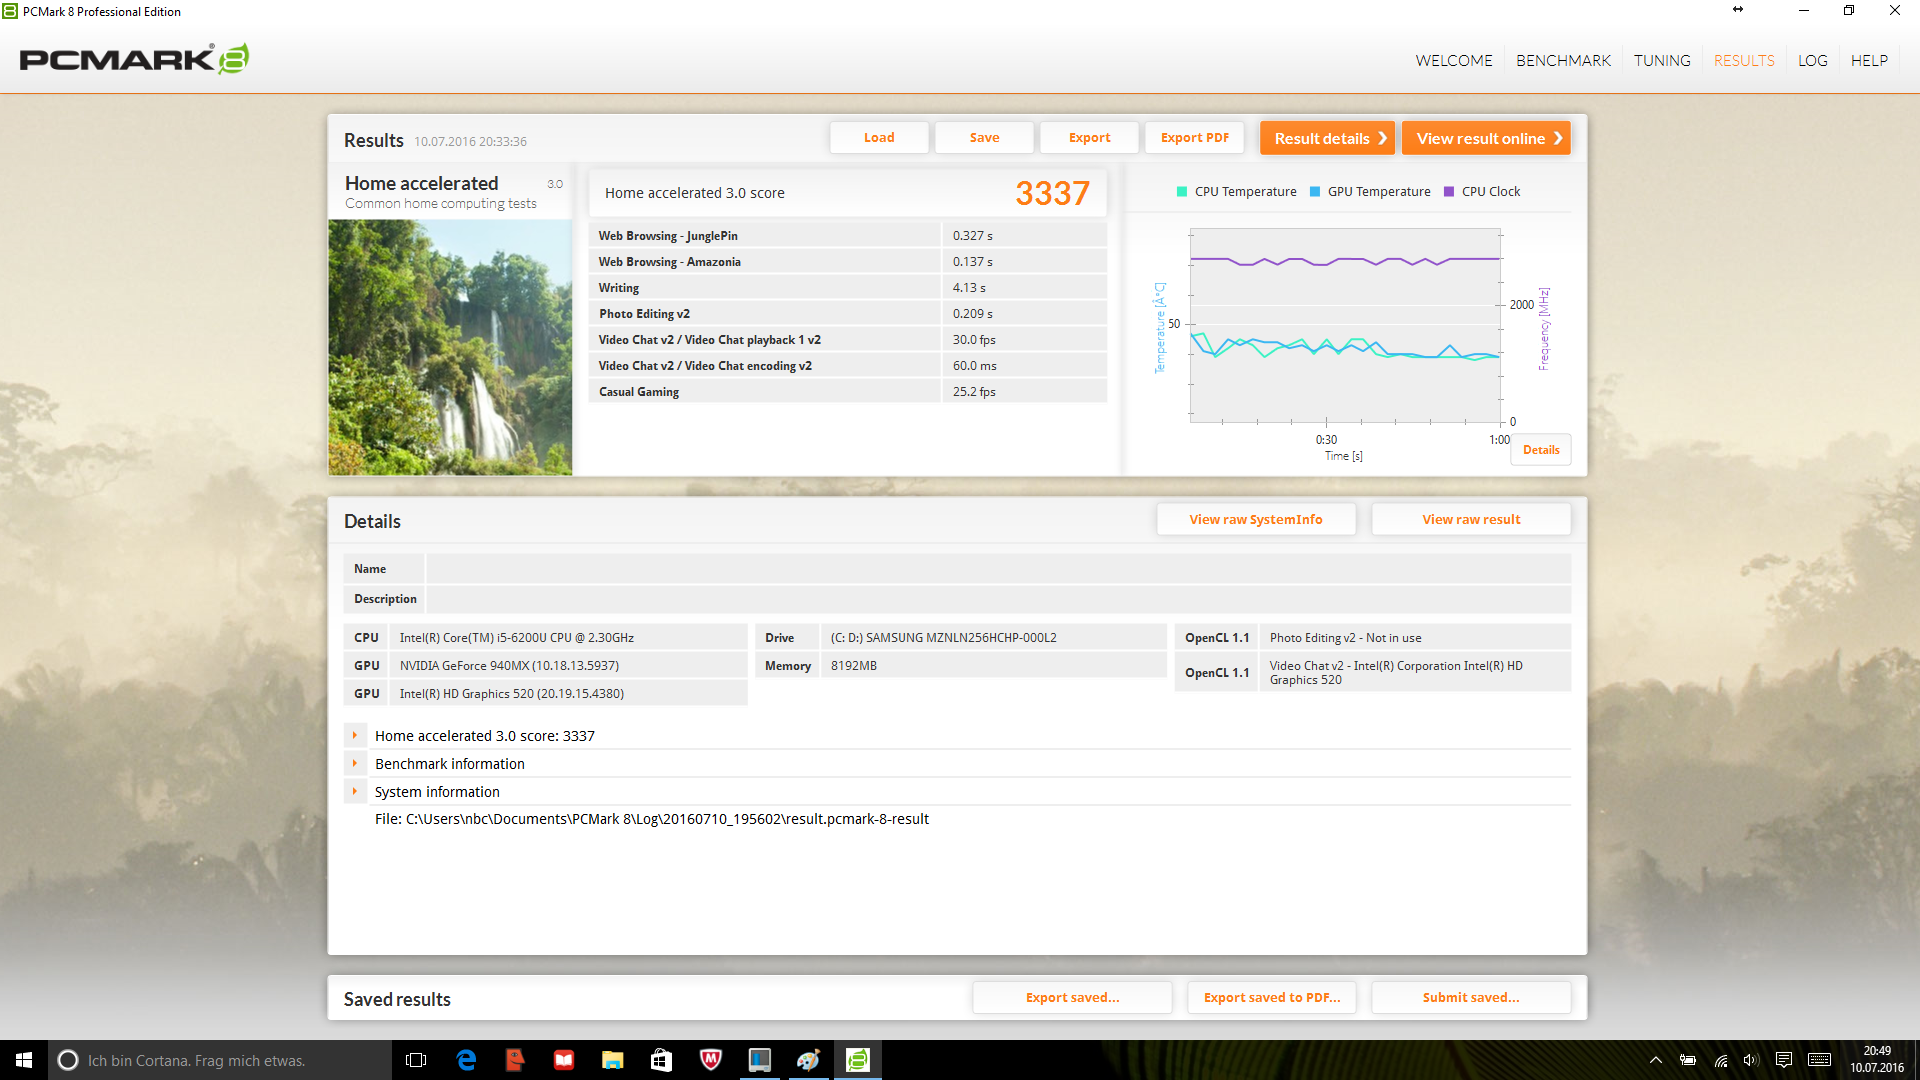
| PCMark 8 | |
| Home Score Accelerated v2 (ordina per valore) | |
| Lenovo Yoga 710-14ISK | |
| Lenovo Yoga 510-15ISK | |
| Lenovo Yoga 3 14-80JH0035GE | |
| HP Envy 15-w103ng x360 | |
| Creative Score Accelerated v2 (ordina per valore) | |
| Lenovo Yoga 710-14ISK | |
| Lenovo Yoga 510-15ISK | |
| Lenovo Yoga 3 14-80JH0035GE | |
| HP Envy 15-w103ng x360 | |
| Work Score Accelerated v2 (ordina per valore) | |
| Lenovo Yoga 710-14ISK | |
| Lenovo Yoga 510-15ISK | |
| Lenovo Yoga 3 14-80JH0035GE | |
| HP Envy 15-w103ng x360 | |
| PCMark 7 | |
| Score (ordina per valore) | |
| Lenovo Yoga 710-14ISK | |
| Lenovo Yoga 510-15ISK | |
| Lenovo Yoga 3 14-80JH0035GE | |
| Productivity (ordina per valore) | |
| Lenovo Yoga 710-14ISK | |
| Lenovo Yoga 510-15ISK | |
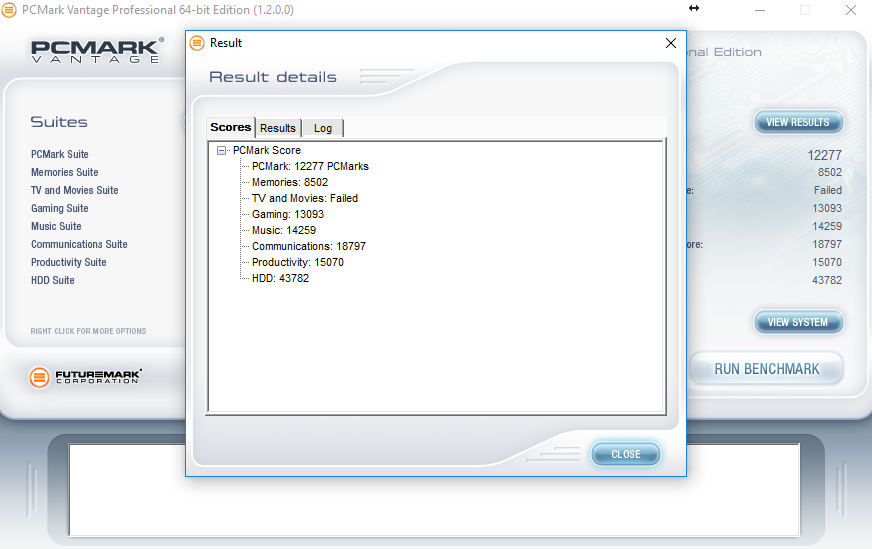
| PCMark Vantage Result | 12277 punti | |
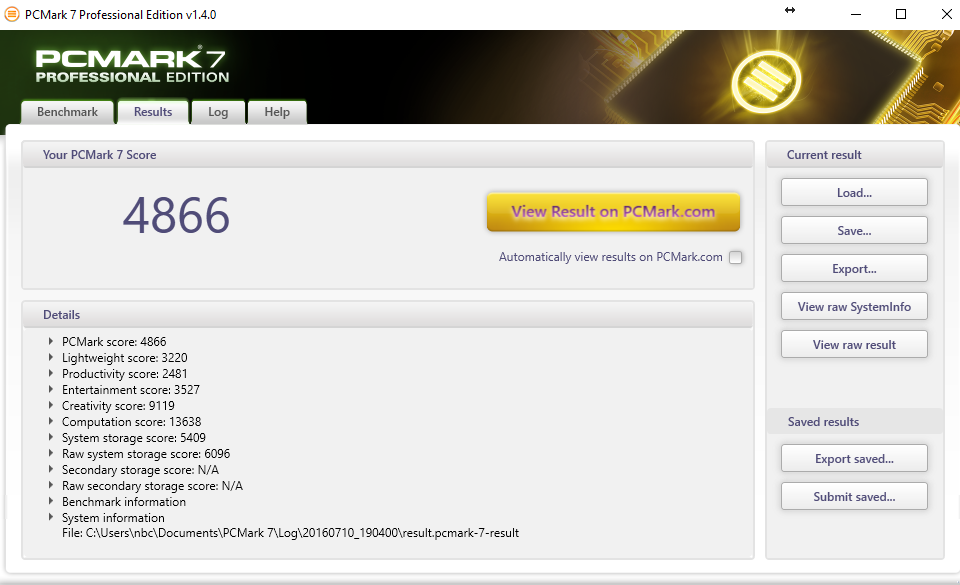
| PCMark 7 Score | 4866 punti | |
| PCMark 8 Home Score Accelerated v2 | 3337 punti | |
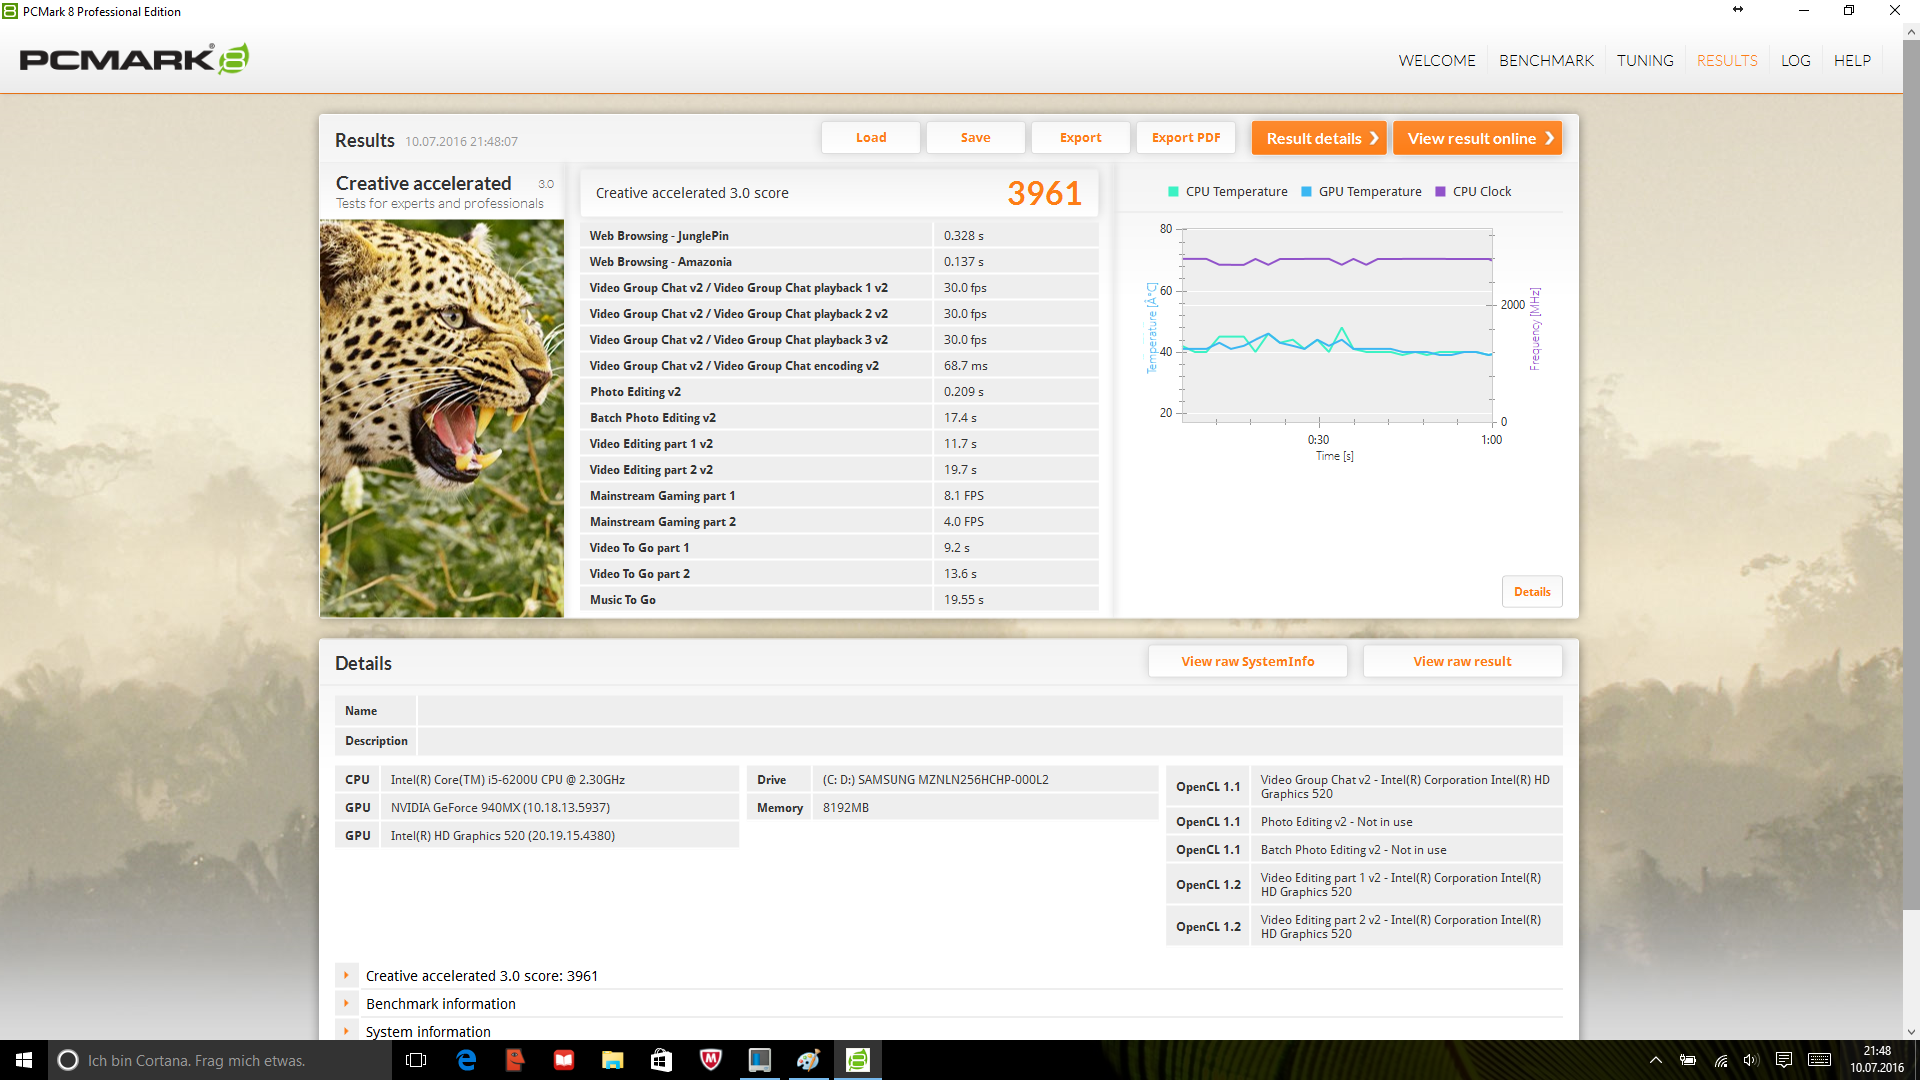
| PCMark 8 Creative Score Accelerated v2 | 3961 punti | |
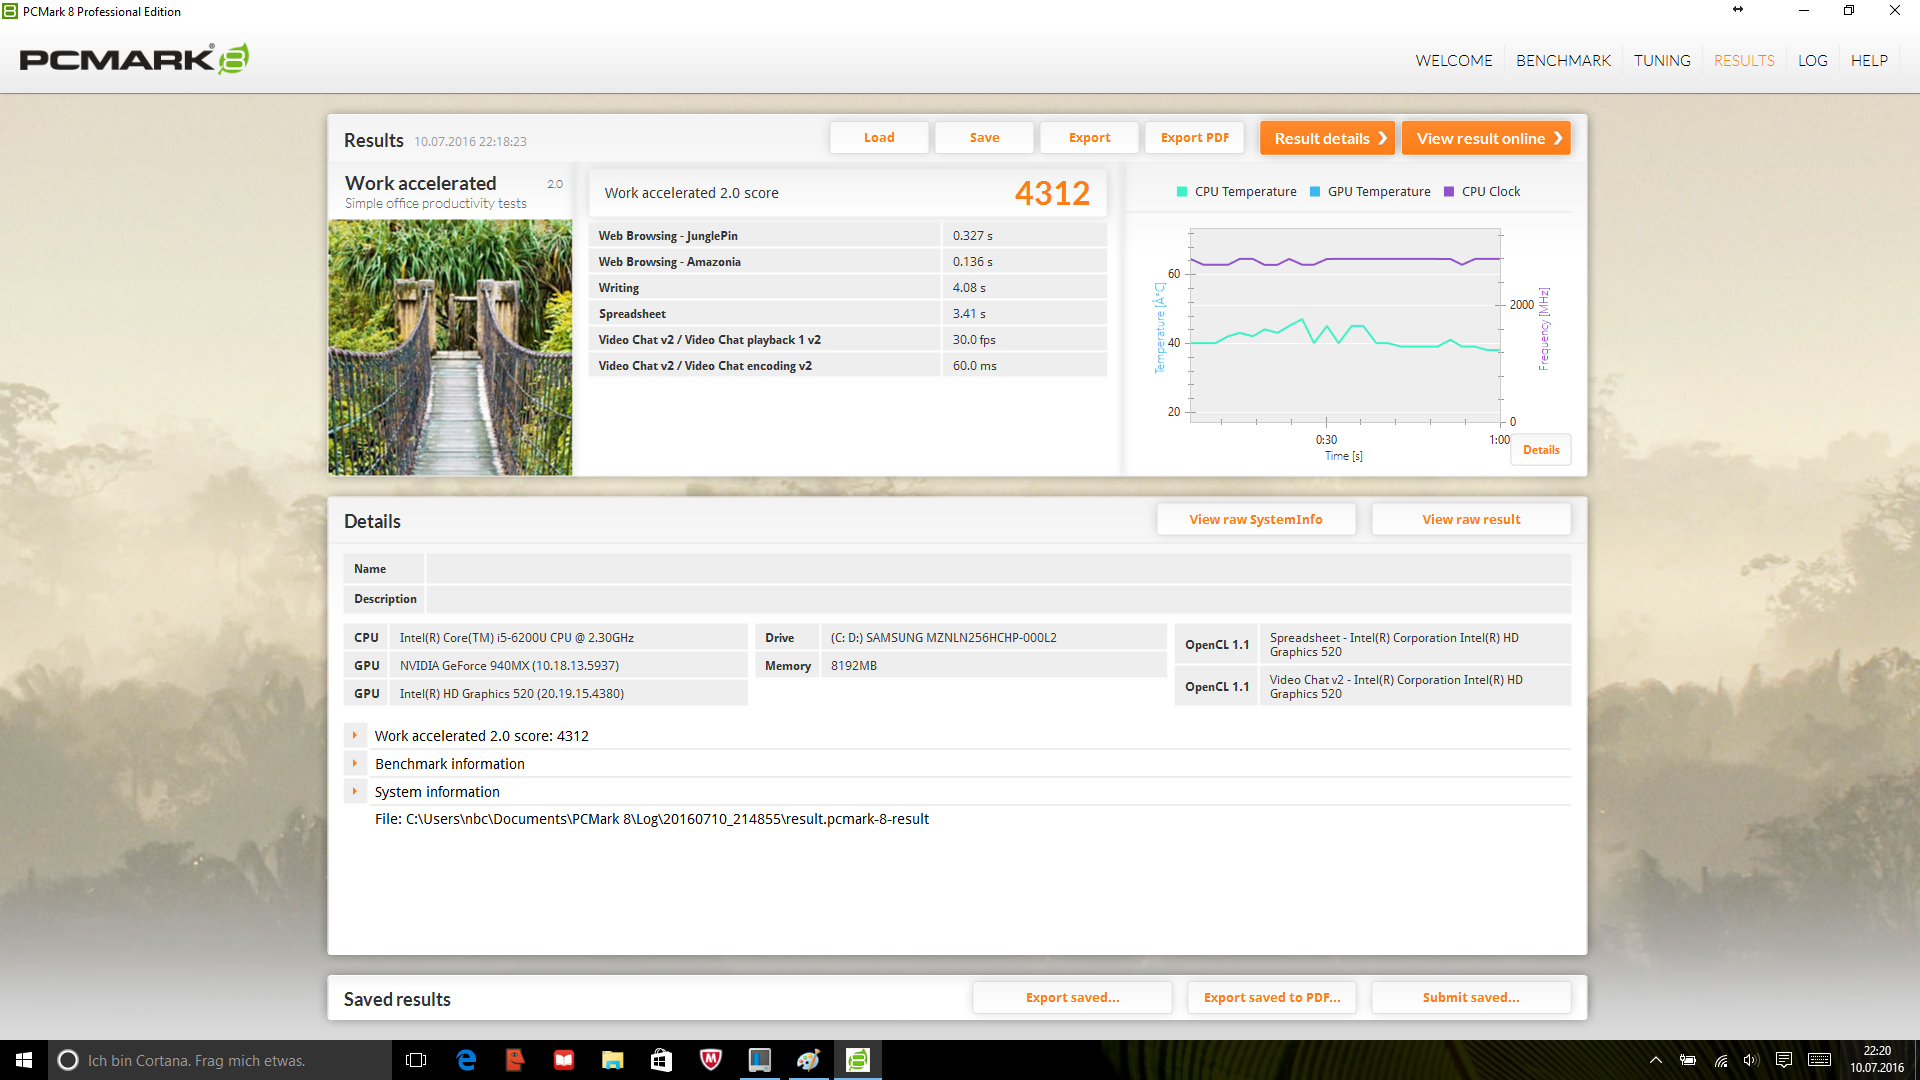
| PCMark 8 Work Score Accelerated v2 | 4312 punti | |
Aiuto | ||
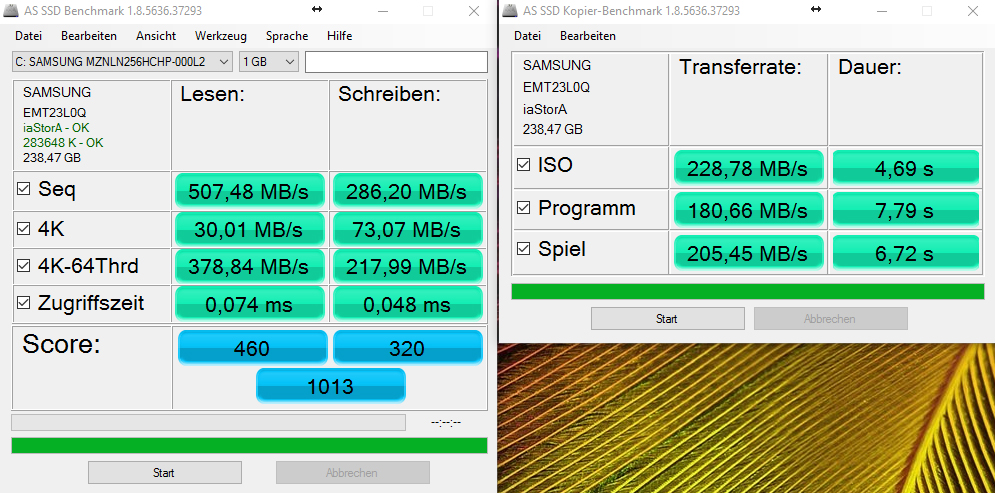
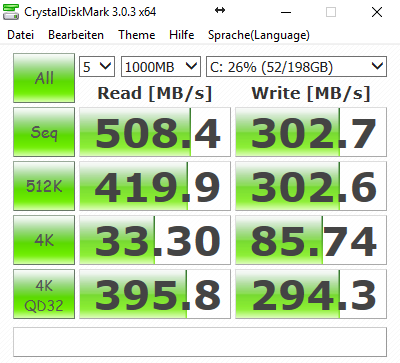
| Lenovo Yoga 710-14ISK Samsung SSD PM871 MZNLN256HCHP | Lenovo Yoga 510-15ISK Liteonit CV3-DE256 | Lenovo Yoga 3 14-80JH0035GE Samsung SSD PM851 256 GB MZYTE256HMHP | HP Envy 15-w103ng x360 Samsung SSD PM851 256 GB MZNTE256HMHP | |
|---|---|---|---|---|
| CrystalDiskMark 3.0 | -5% | -2% | -10% | |
| Read Seq (MB/s) | 508 | 487 -4% | 525 3% | 515 1% |
| Write Seq (MB/s) | 302.7 | 450.7 49% | 265.8 -12% | 240.7 -20% |
| Read 512 (MB/s) | 419.9 | 384.5 -8% | 428.9 2% | 391.3 -7% |
| Write 512 (MB/s) | 302.6 | 356.3 18% | 266.1 -12% | 240 -21% |
| Read 4k (MB/s) | 33.3 | 27.05 -19% | 35.18 6% | 27.64 -17% |
| Write 4k (MB/s) | 85.8 | 63.7 -26% | 97.6 14% | 95.2 11% |
| Read 4k QD32 (MB/s) | 395.8 | 281.5 -29% | 354.6 -10% | 367.9 -7% |
| Write 4k QD32 (MB/s) | 294.3 | 232 -21% | 265.4 -10% | 239 -19% |

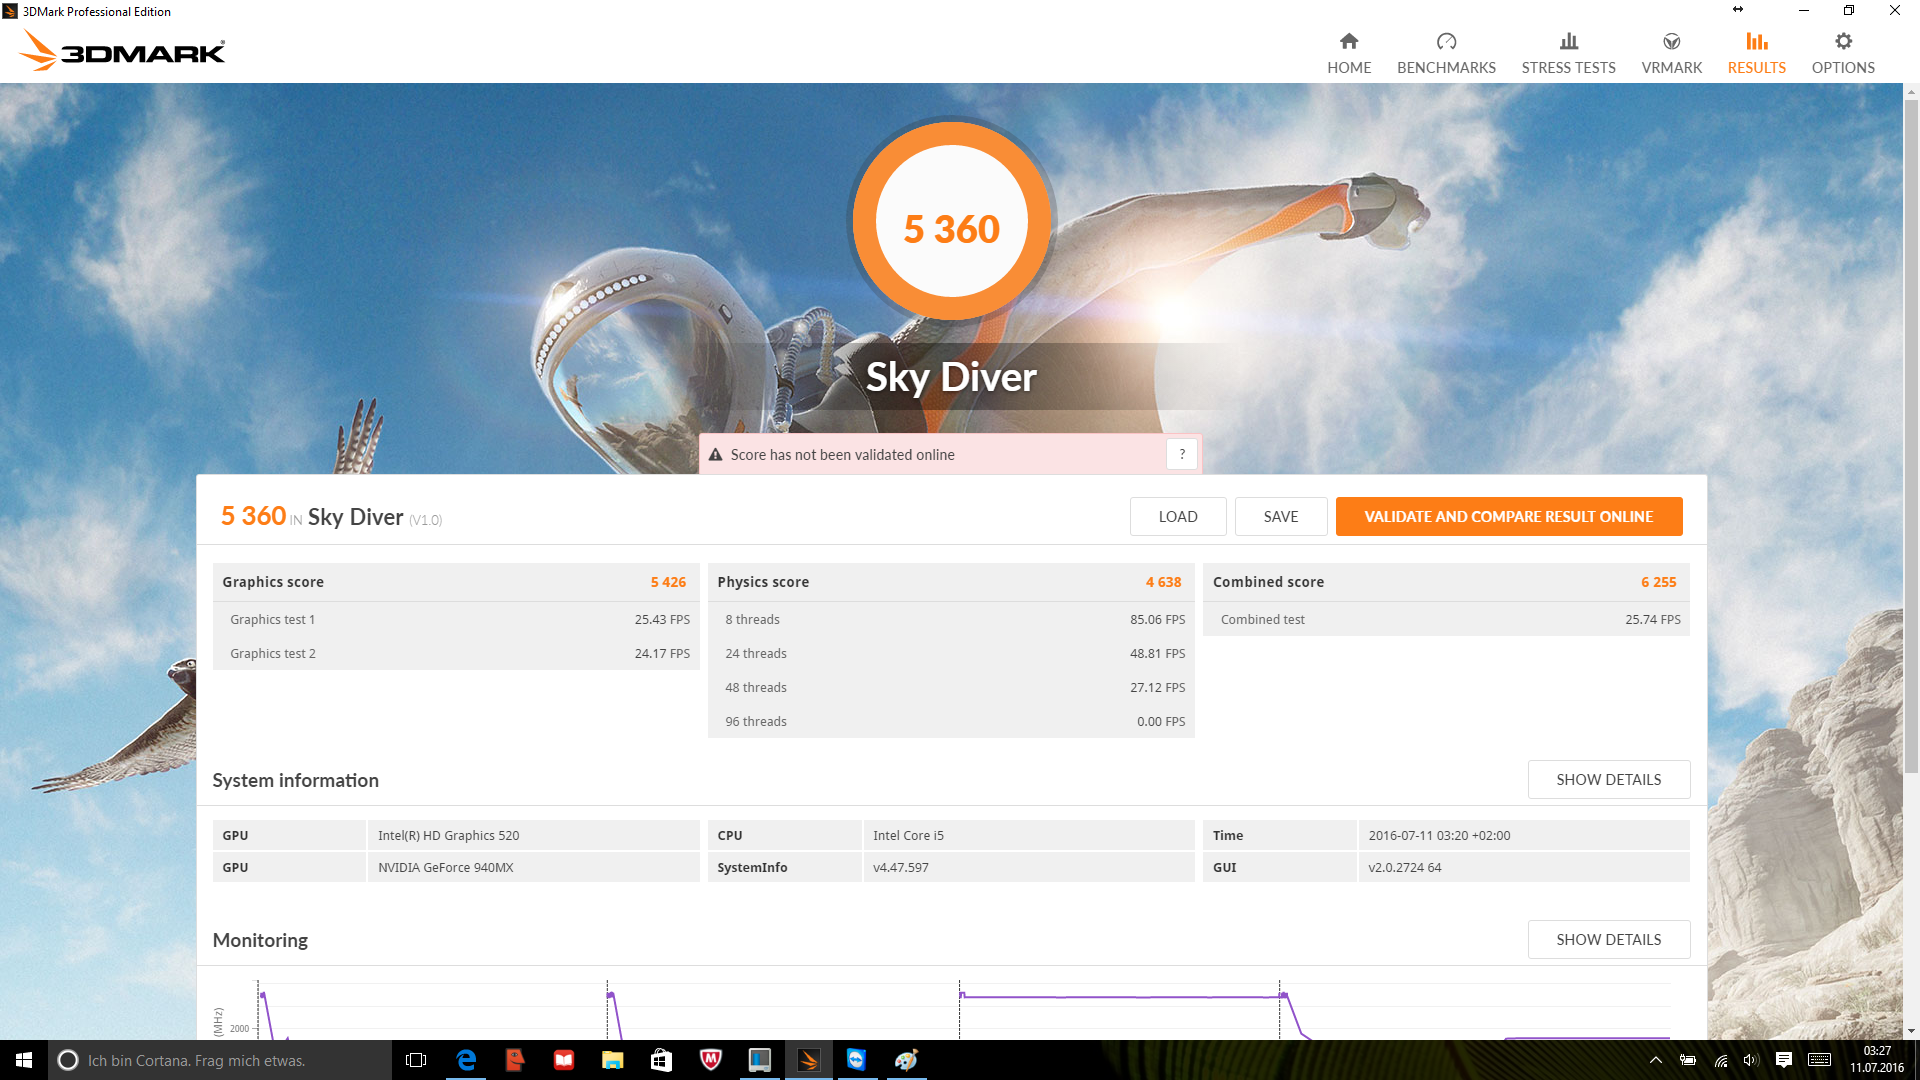
| 3DMark | |
| 1280x720 Cloud Gate Standard Graphics | |
| Lenovo Yoga 710-14ISK | |
| Lenovo Yoga 3 14-80JH0035GE | |
| HP Envy 15-w103ng x360 | |
| Lenovo Yoga 510-15ISK | |
| 1920x1080 Fire Strike Graphics | |
| Lenovo Yoga 3 14-80JH0035GE | |
| Lenovo Yoga 710-14ISK | |
| HP Envy 15-w103ng x360 | |
| Lenovo Yoga 510-15ISK | |
| 1280x720 Ice Storm Standard Graphics | |
| HP Envy 15-w103ng x360 | |
| Lenovo Yoga 510-15ISK | |
| Lenovo Yoga 710-14ISK | |
| Lenovo Yoga 3 14-80JH0035GE | |
| 3DMark 11 | |
| 1280x720 Performance | |
| Lenovo Yoga 710-14ISK | |
| Lenovo Yoga 3 14-80JH0035GE | |
| HP Envy 15-w103ng x360 | |
| Lenovo Yoga 510-15ISK | |
| 1280x720 Performance GPU | |
| Lenovo Yoga 710-14ISK | |
| Lenovo Yoga 3 14-80JH0035GE | |
| HP Envy 15-w103ng x360 | |
| Lenovo Yoga 510-15ISK | |
| 3DMark 06 - 1280x1024 Standard Score AA:0x AF:0x | |
| Lenovo Yoga 710-14ISK | |
| Lenovo Yoga 510-15ISK | |
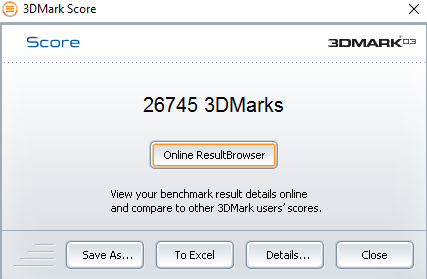
| 3DMark 03 Standard | 26745 punti | |
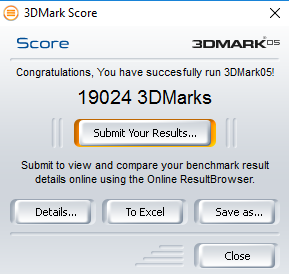
| 3DMark 05 Standard | 19024 punti | |
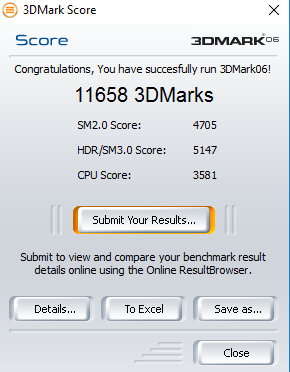
| 3DMark 06 Standard Score | 11658 punti | |
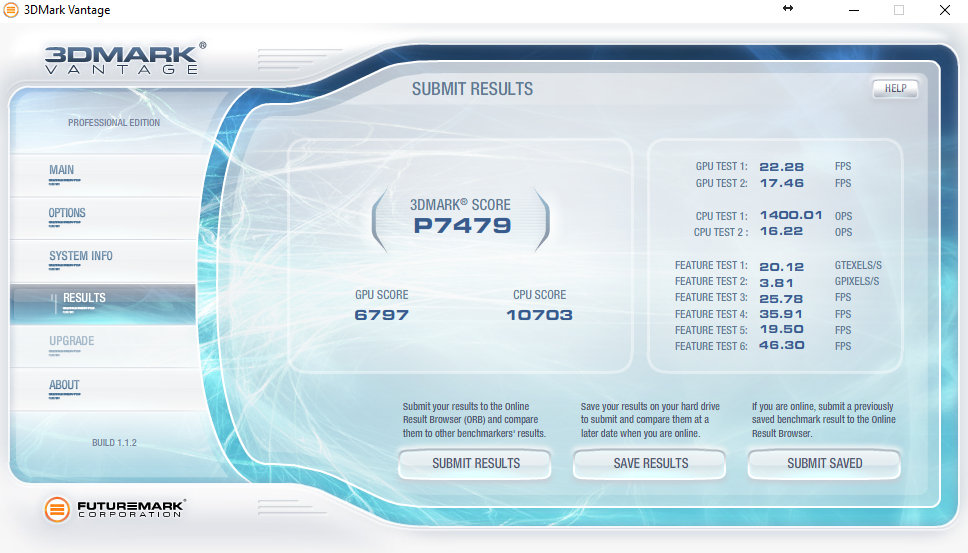
| 3DMark Vantage P Result | 7479 punti | |
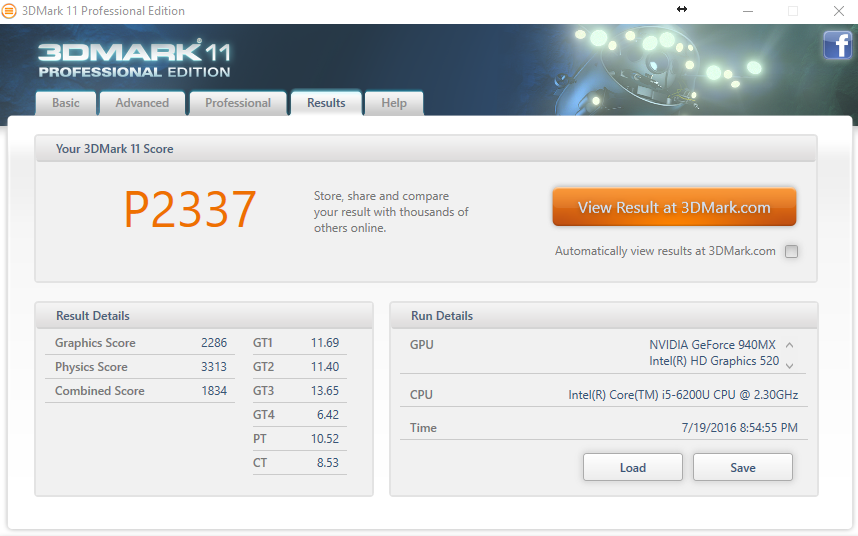
| 3DMark 11 Performance | 2330 punti | |
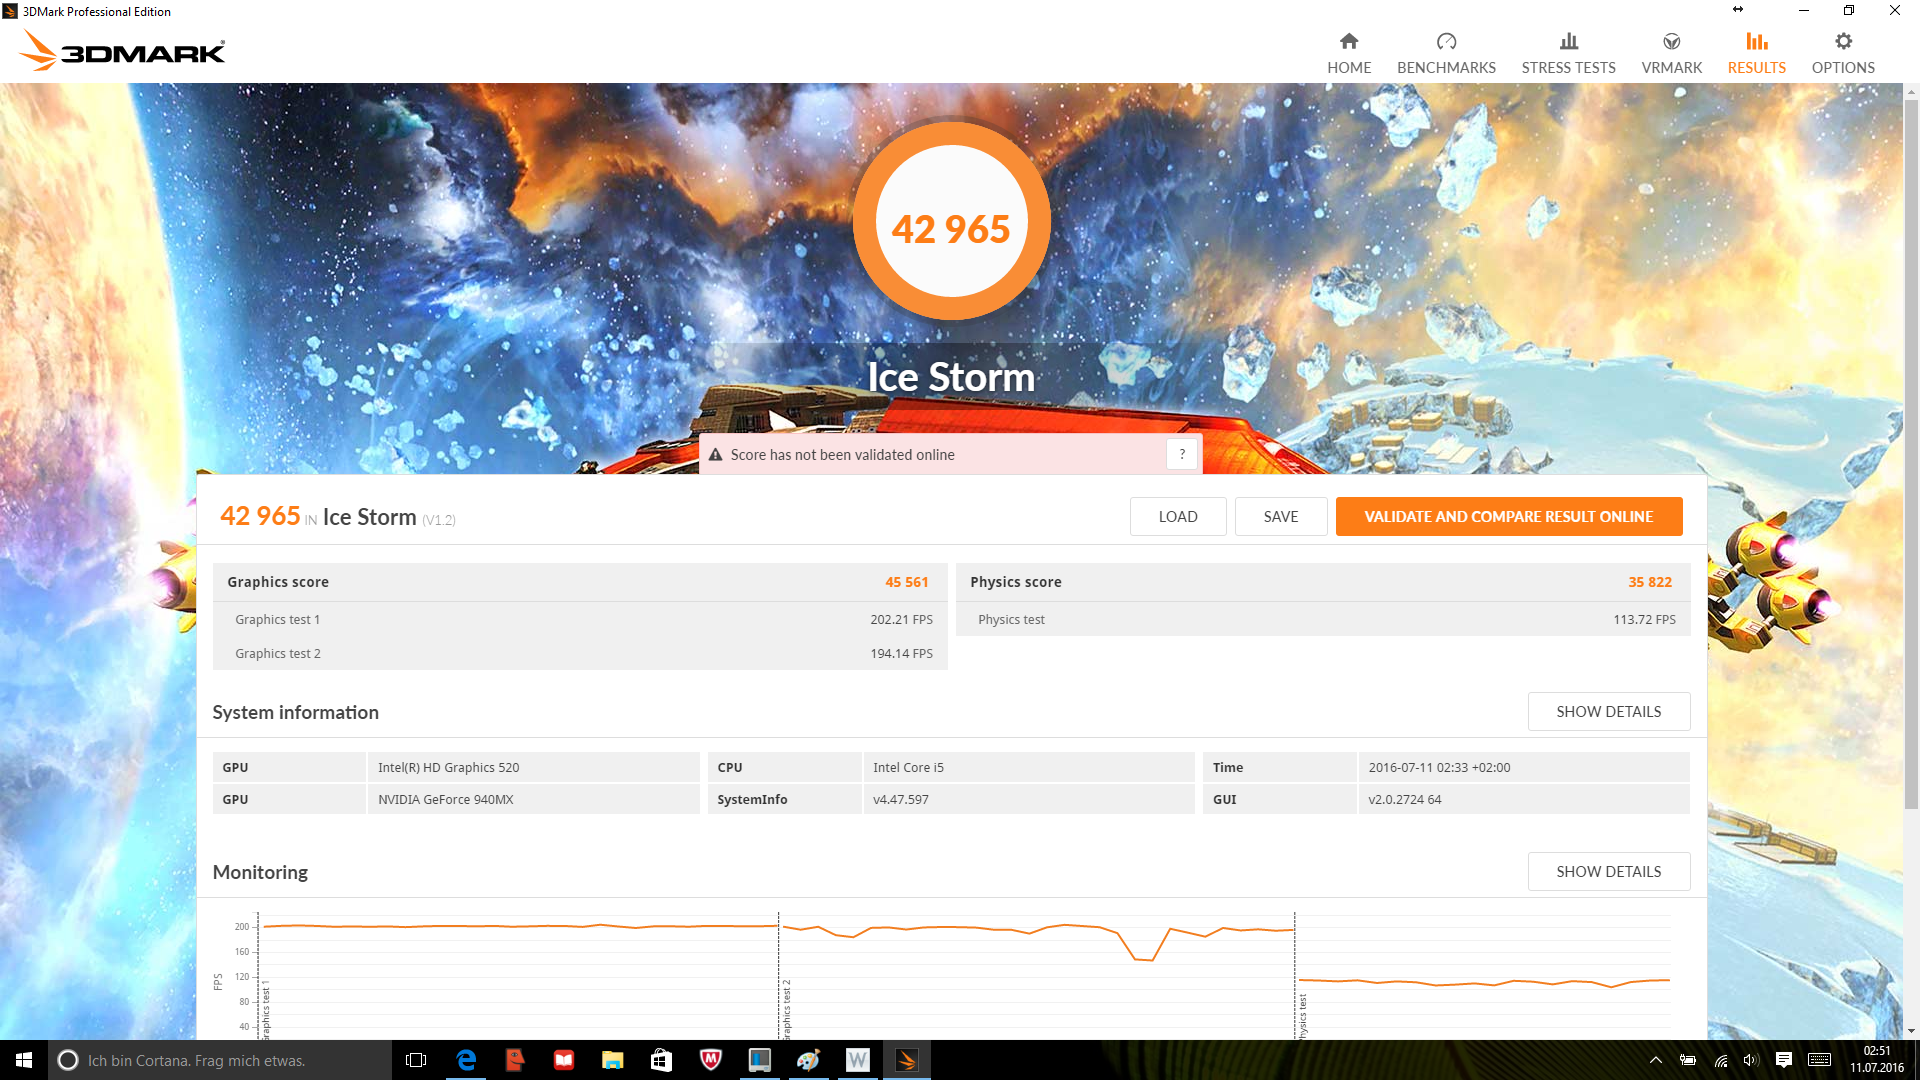
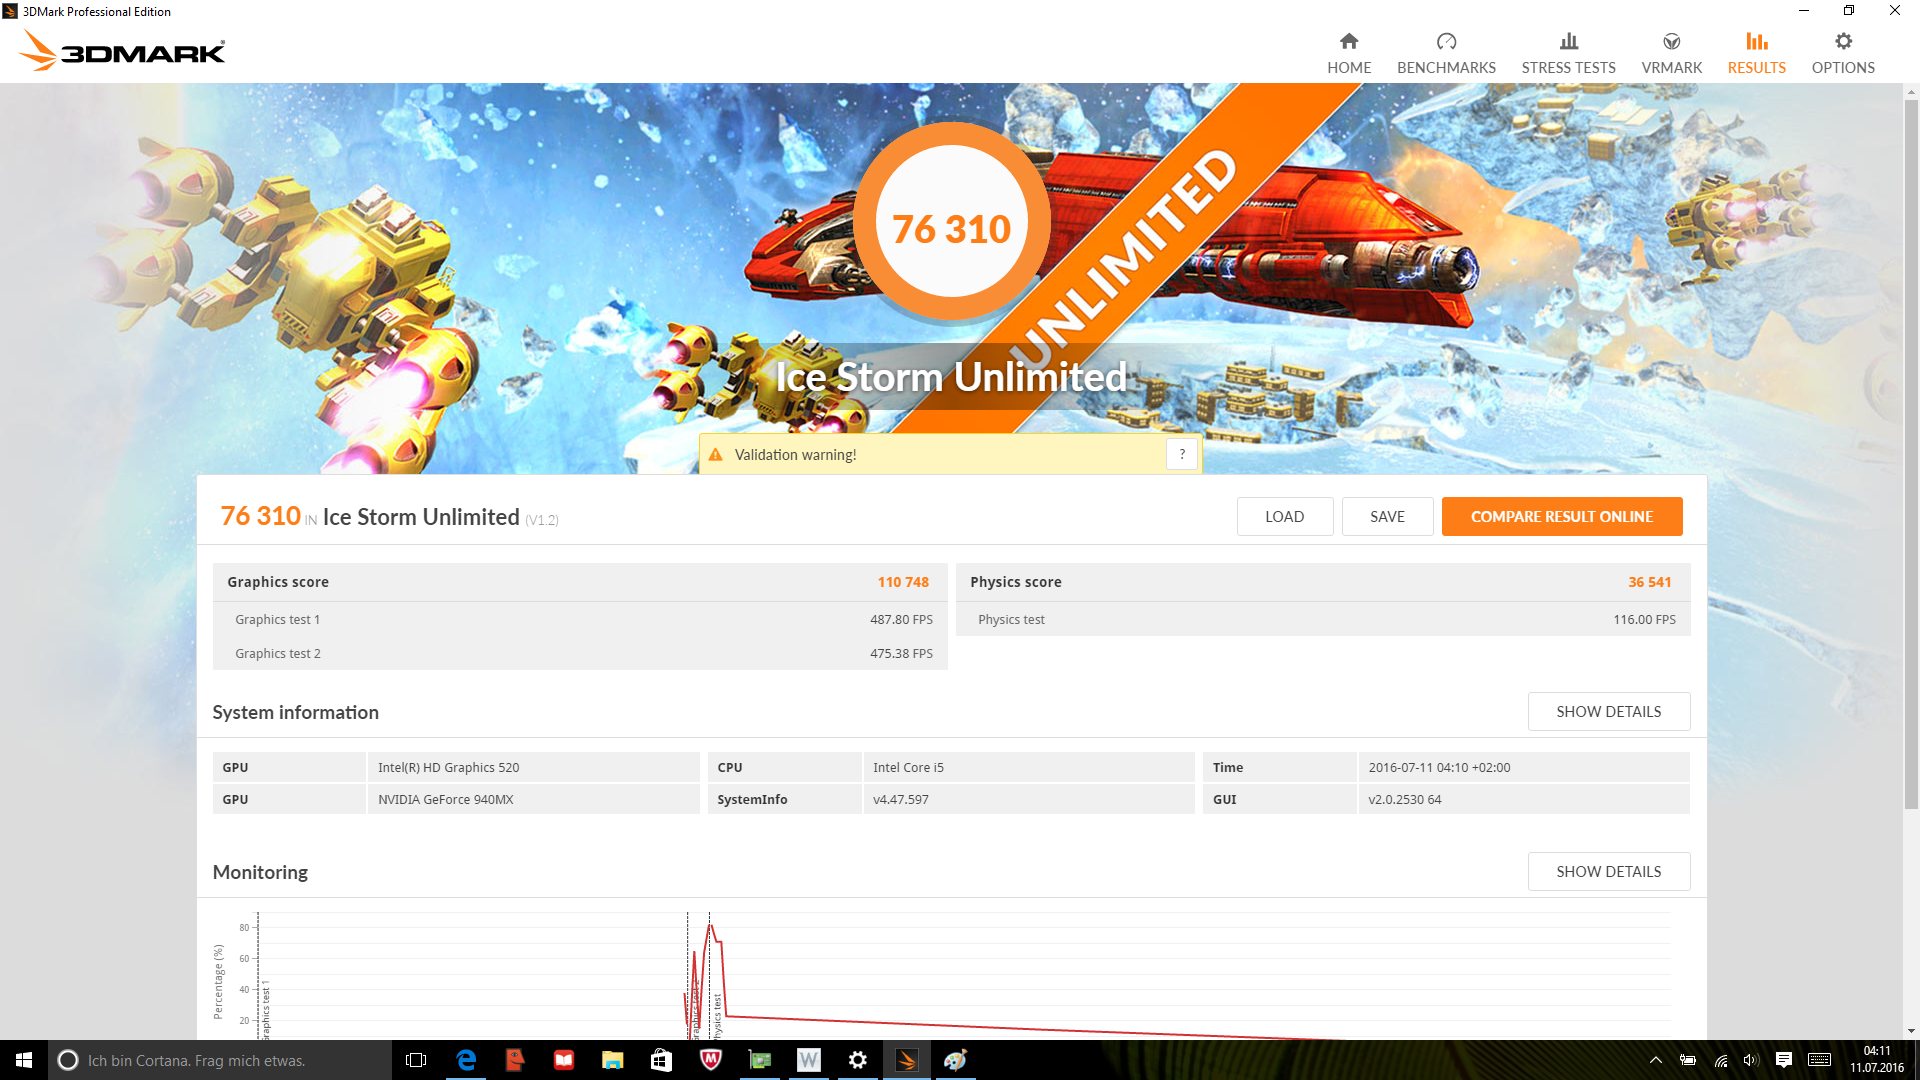
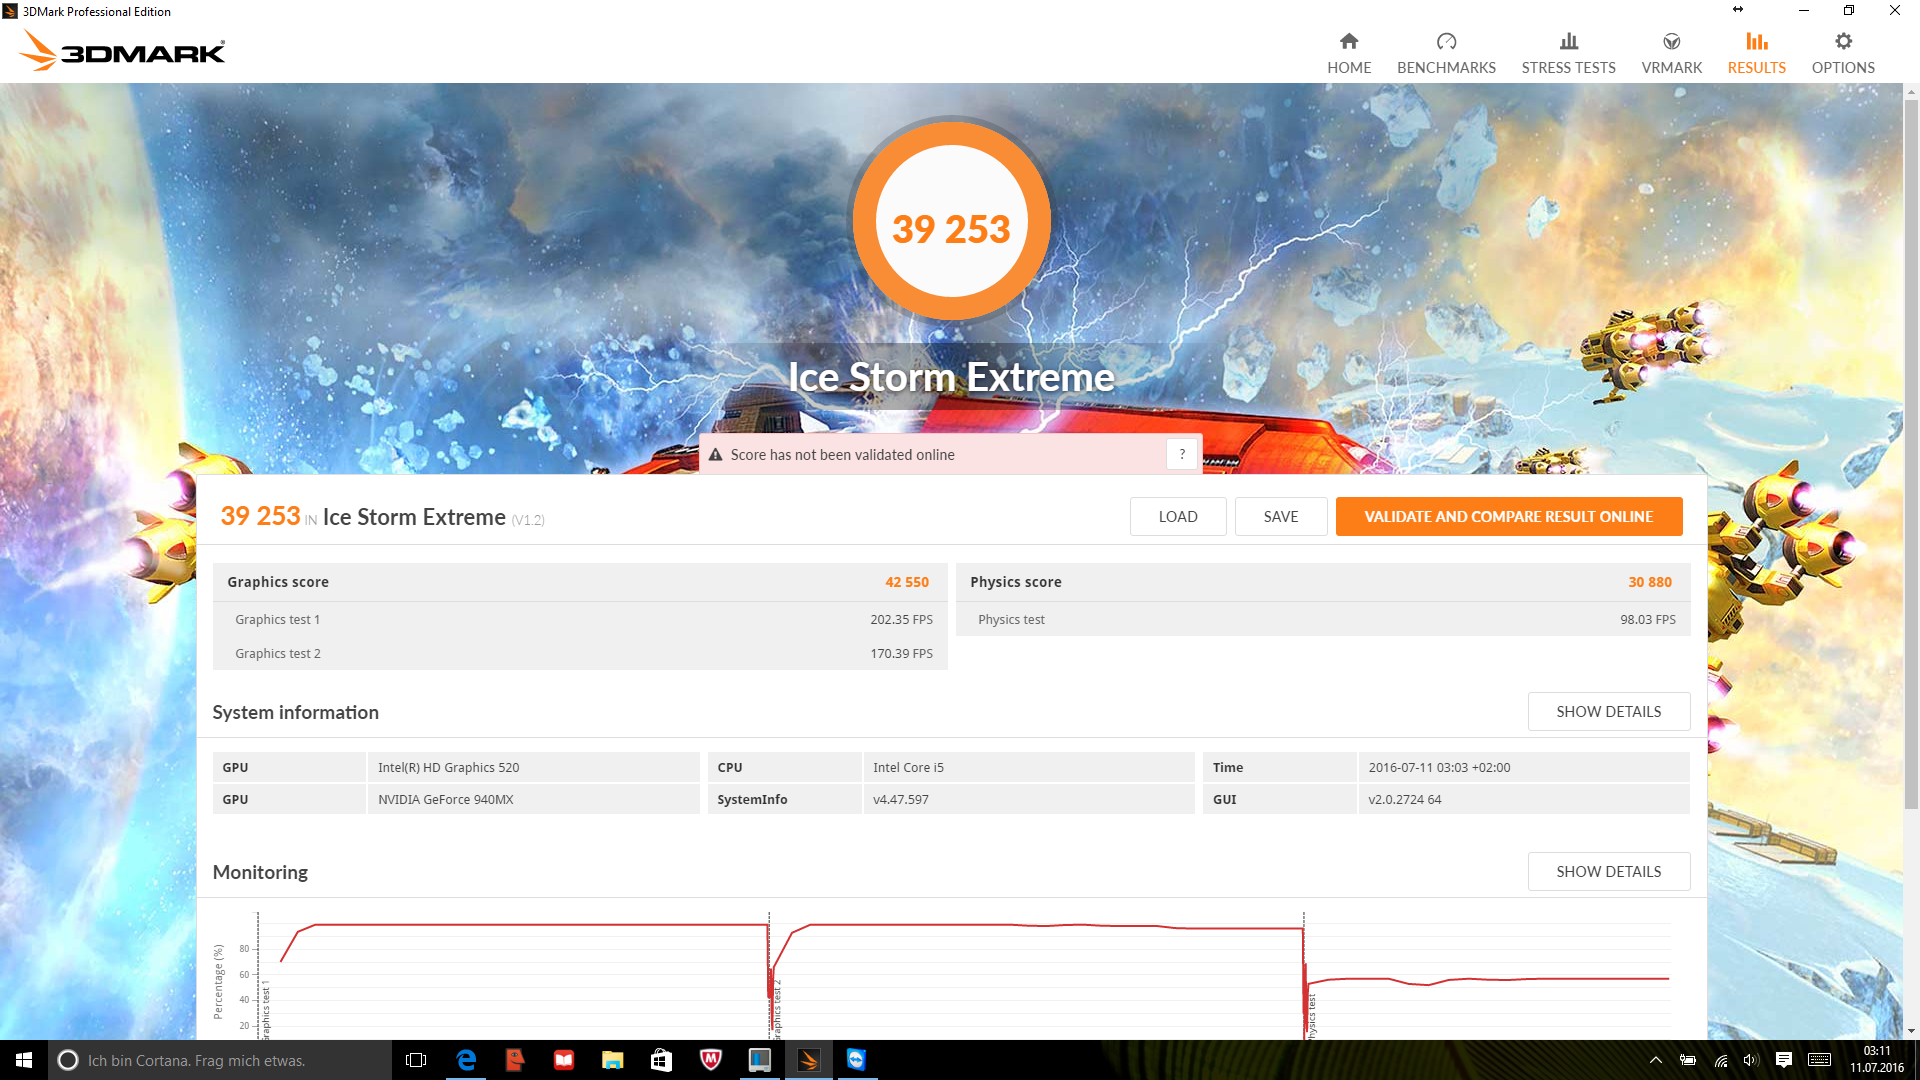
| 3DMark Ice Storm Standard Score | 42965 punti | |
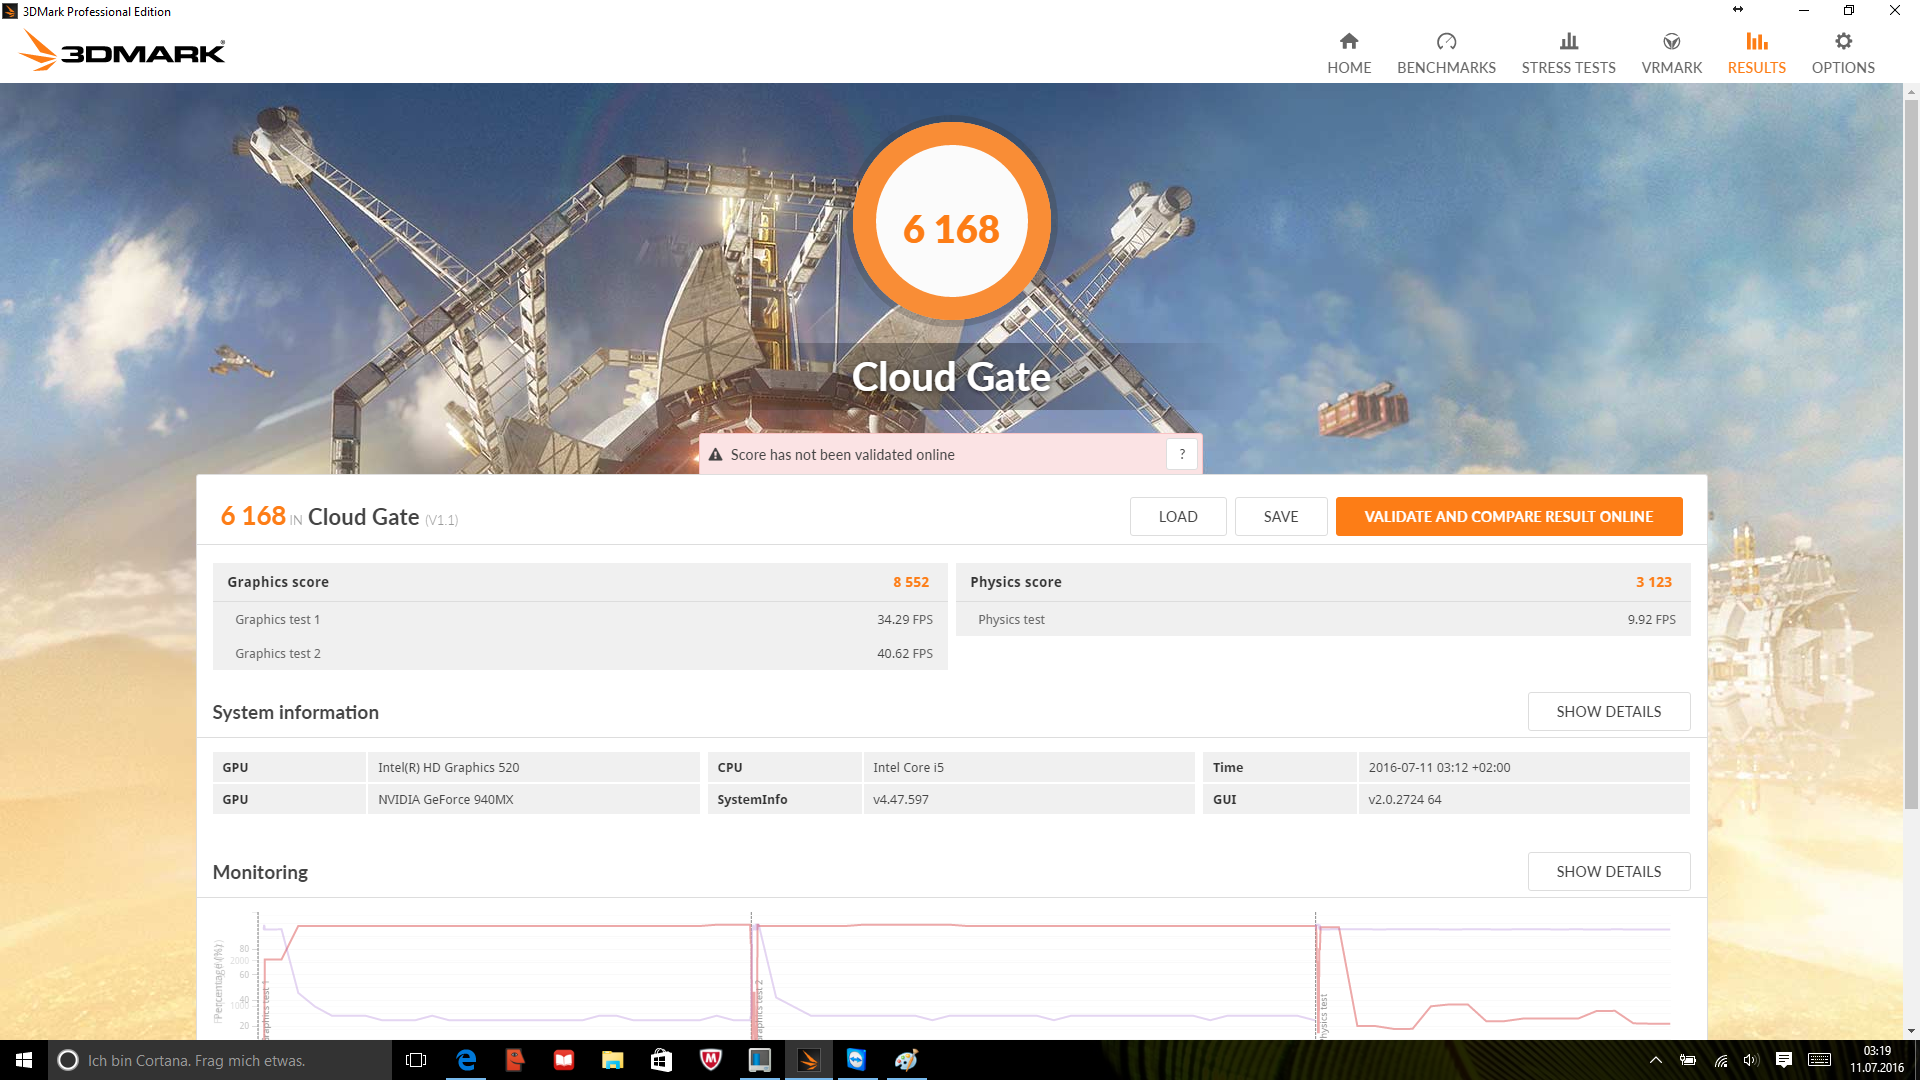
| 3DMark Cloud Gate Standard Score | 6168 punti | |
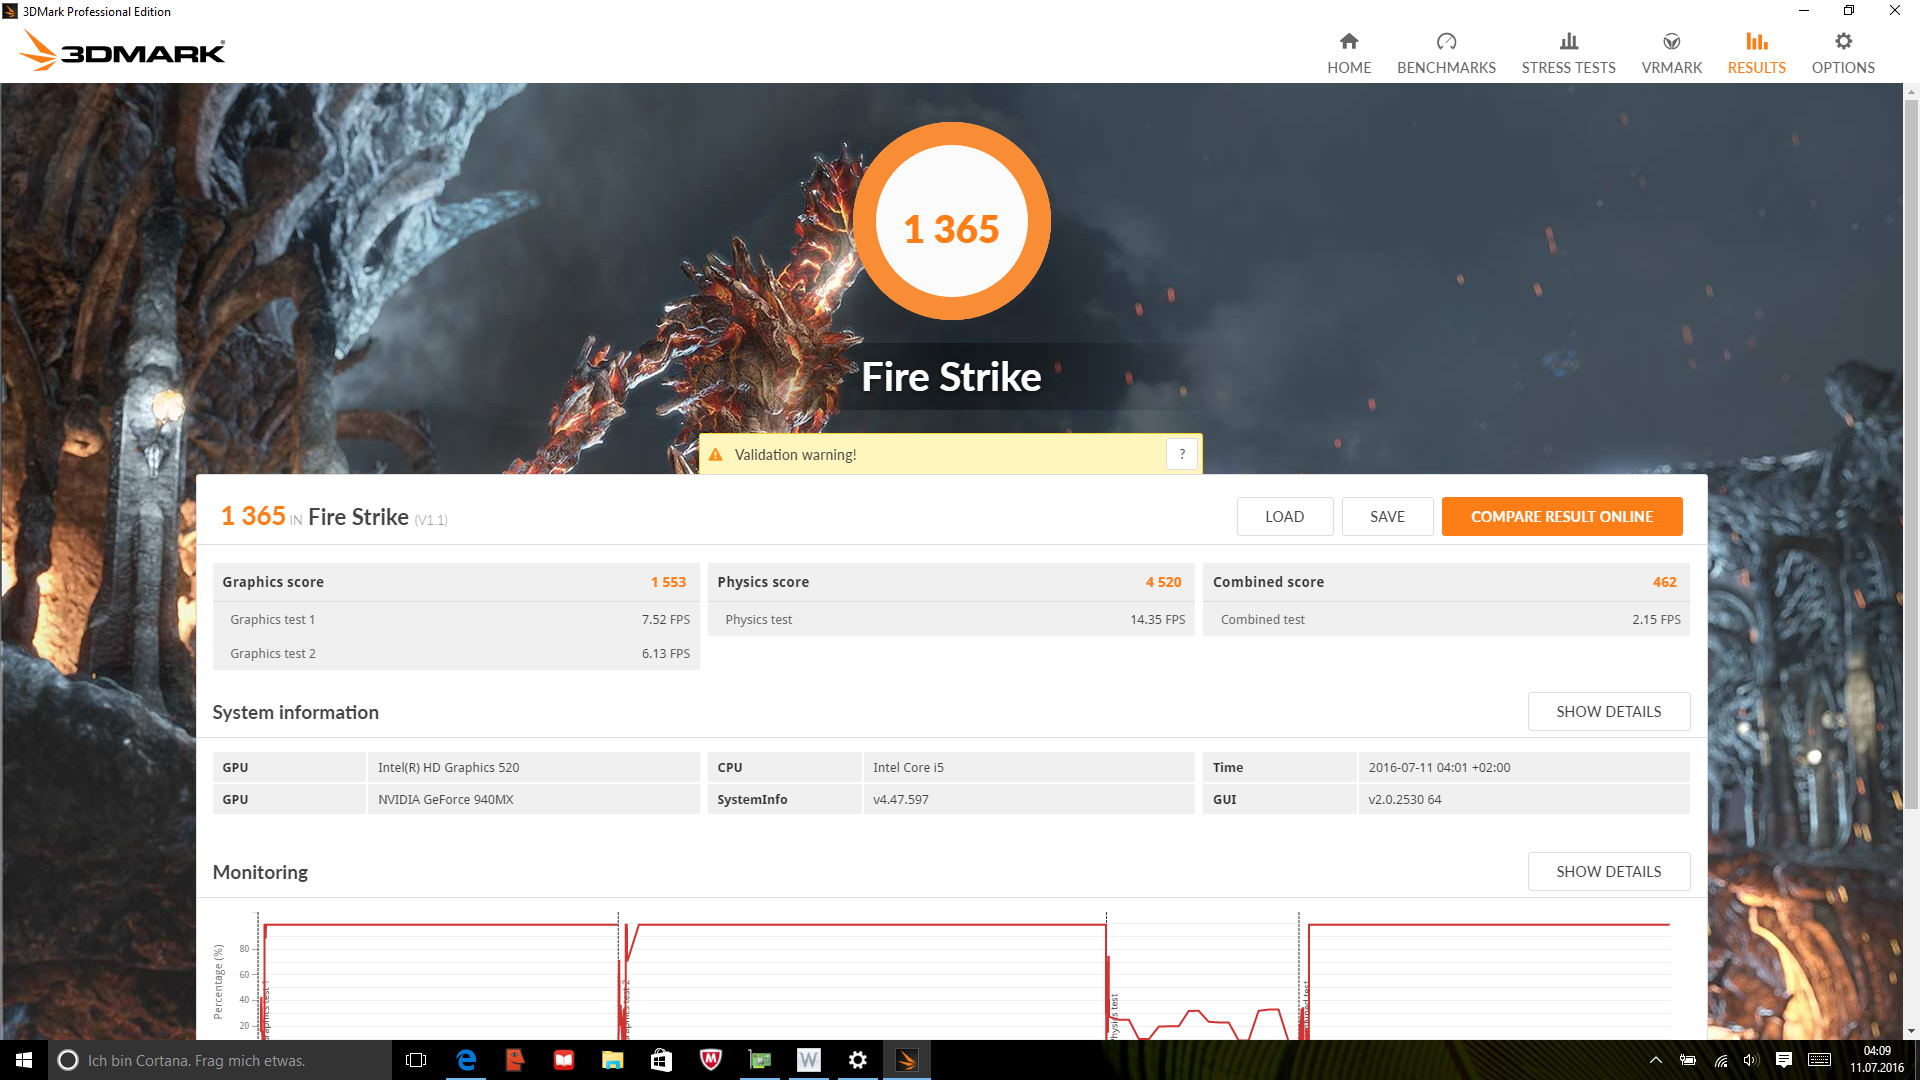
| 3DMark Fire Strike Score | 1365 punti | |
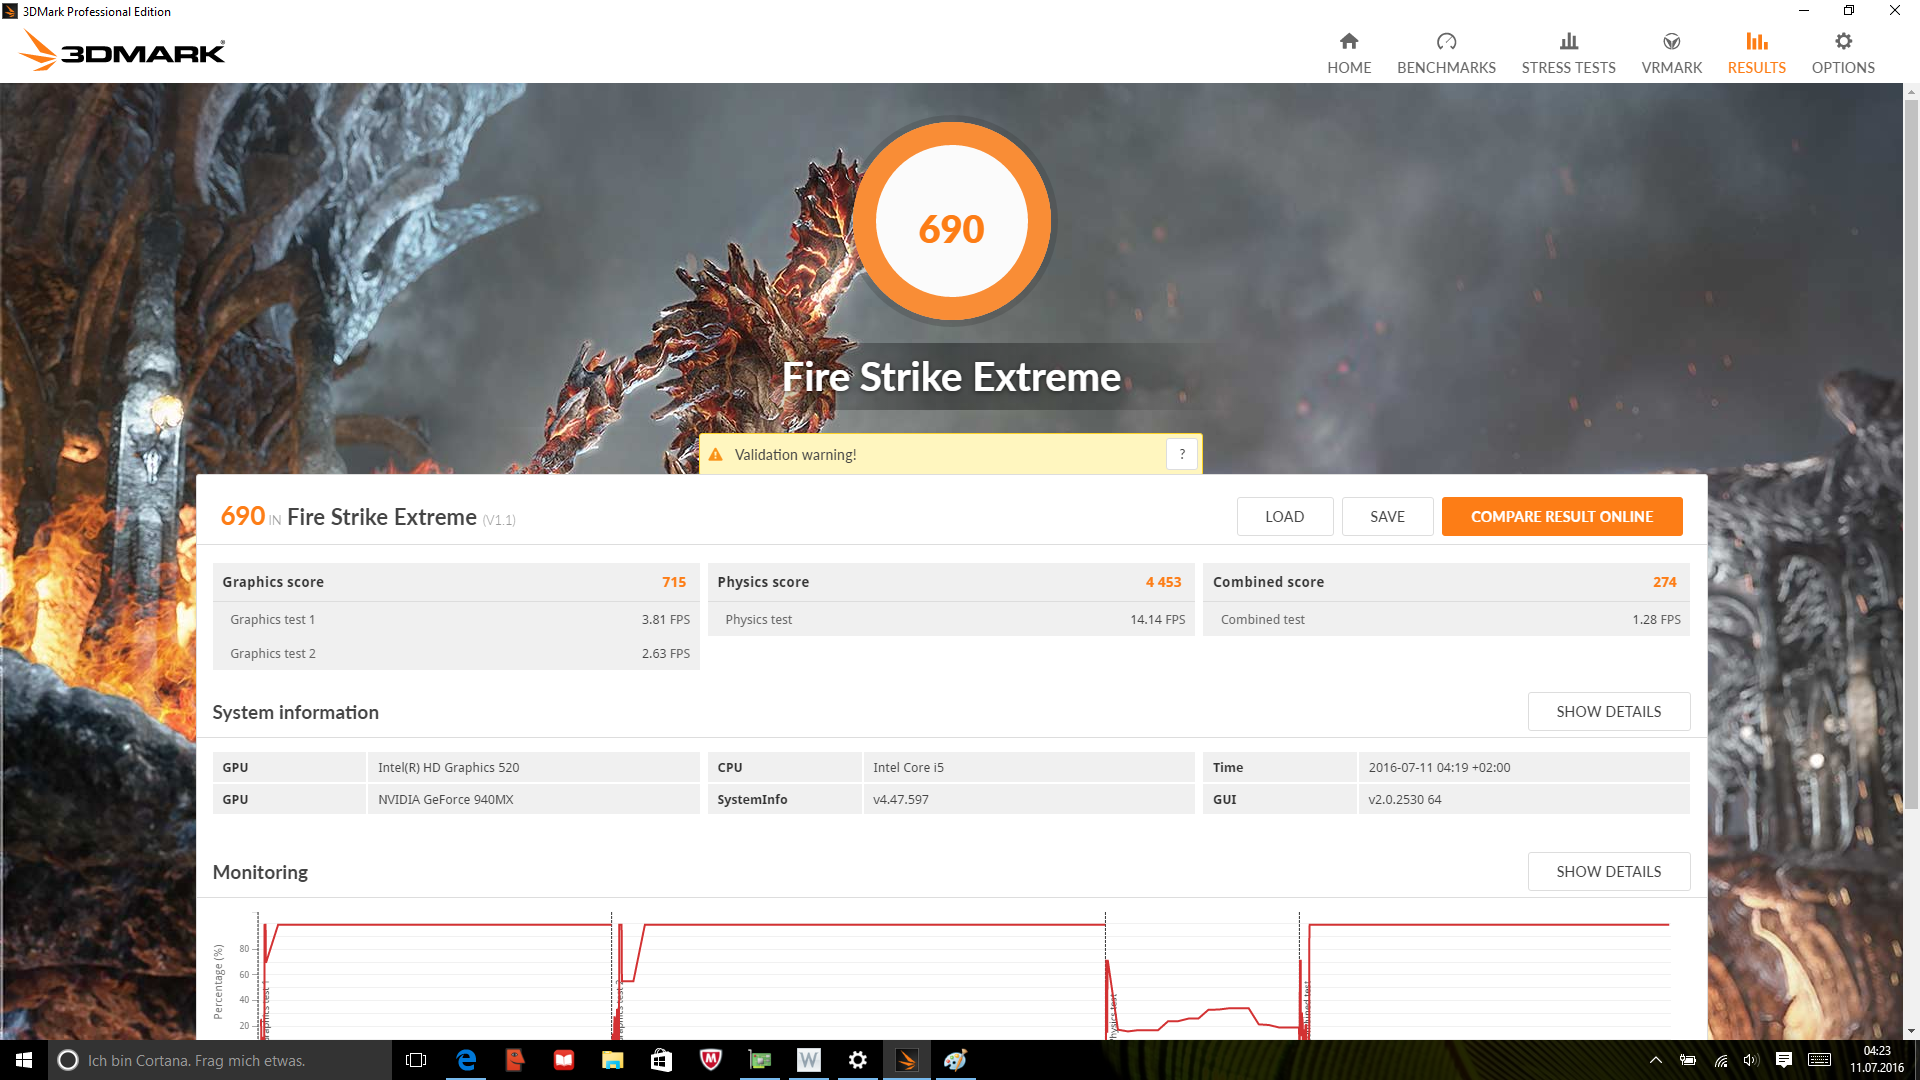
| 3DMark Fire Strike Extreme Score | 690 punti | |
Aiuto | ||
| basso | medio | alto | ultra | |
|---|---|---|---|---|
| Dirt 3 (2011) | 60.3 | 55.7 | 40.7 | 16.3 |
| Hitman: Absolution (2012) | 54.9 | 35.7 | 25.1 | 13.4 |
| BioShock Infinite (2013) | 85.3 | 47.7 | 39.5 | 13.6 |
| GRID 2 (2013) | 121.5 | 80.4 | 56.3 | 19.6 |
| Battlefield 4 (2013) | 66.5 | 43.2 | 28.6 | 10.4 |
| Thief (2014) | 31.3 | 23 | 18.5 | 9.1 |
| Titanfall (2014) | 60 | 49.2 | 40.1 | 23.6 |
| The Elder Scrolls Online (2014) | 79.6 | 77.4 | 58.3 | 31.4 |
| GRID: Autosport (2014) | 137 | 70.9 | 21.8 | 15.7 |
| Risen 3: Titan Lords (2014) | 50.7 | 36.8 | 11.2 | 7.8 |
| Fifa 15 (2014) | 96.3 | 72.7 | 47.9 | |
| Ryse: Son of Rome (2014) | 24.5 | 18.7 | 8.9 | 8.4 |
| The Evil Within (2014) | 39.2 | 27.9 | 16.7 | |
| F1 2014 (2014) | 99 | 85 | 48 | 29 |
| Civilization: Beyond Earth (2014) | 67.2 | 29.7 | 21.4 | 17.3 |
| Call of Duty: Advanced Warfare (2014) | 50.4 | 30.4 | 13 | 12.1 |
| Assassin's Creed Unity (2014) | 29.4 | 17.9 | 12.1 | 8.3 |
| Far Cry 4 (2014) | 44.2 | 31.4 | 14.2 | 13.3 |
| The Crew (2014) | 43.4 | 36.7 | 17.2 | 9.8 |
| The Witcher 3 (2015) | 23.8 | 16 | 8.5 | 5.4 |
| Batman: Arkham Knight (2015) | 28 | 24 | 10 | 10 |
| Rise of the Tomb Raider (2016) | 27.4 | 17.7 | 10.4 | 8.2 |
Rumorosità
| Idle |
| 32.5 / 34.6 / 34.6 dB(A) |
| Sotto carico |
| 38.7 / 39.9 dB(A) |
 | ||
30 dB silenzioso 40 dB(A) udibile 50 dB(A) rumoroso |
||
min: | ||
| Lenovo Yoga 710-14ISK Intel Core i5-6200U, GeForce 940MX | Lenovo Yoga 510-15ISK Intel Core i5-6200U, Radeon R7 M460 | Lenovo Yoga 3 14-80JH0035GE Intel Core i5-5200U, GeForce 940M | HP Envy 15-w103ng x360 Intel Core i5-6200U, GeForce 930M | |
|---|---|---|---|---|
| Noise | 10% | 1% | -0% | |
| off /ambiente * (dB) | 32.2 | 29 10% | ||
| Idle Minimum * (dB) | 32.5 | 29 11% | 32 2% | 32.9 -1% |
| Idle Average * (dB) | 34.6 | 29 16% | 32.6 6% | 32.9 5% |
| Idle Maximum * (dB) | 34.6 | 29 16% | 33.9 2% | 32.9 5% |
| Load Average * (dB) | 38.7 | 35.9 7% | 40.1 -4% | 37 4% |
| Load Maximum * (dB) | 39.9 | 41 -3% | 39.8 -0% | 46 -15% |
* ... Meglio usare valori piccoli
(±) La temperatura massima sul lato superiore è di 43.4 °C / 110 F, rispetto alla media di 35.4 °C / 96 F, che varia da 19.6 a 60 °C per questa classe Convertible.
(±) Il lato inferiore si riscalda fino ad un massimo di 43.2 °C / 110 F, rispetto alla media di 36.9 °C / 98 F
(+) In idle, la temperatura media del lato superiore è di 26.7 °C / 80 F, rispetto alla media deld ispositivo di 30.3 °C / 87 F.
(+) I poggiapolsi e il touchpad raggiungono la temperatura massima della pelle (32 °C / 89.6 F) e quindi non sono caldi.
(-) La temperatura media della zona del palmo della mano di dispositivi simili e'stata di 28 °C / 82.4 F (-4 °C / -7.2 F).
Lenovo Yoga 710-14ISK analisi audio
(-) | altoparlanti non molto potenti (67 dB)
Bassi 100 - 315 Hz
(±) | bassi ridotti - in media 9.5% inferiori alla media
(±) | la linearità dei bassi è media (8.2% delta rispetto alla precedente frequenza)
Medi 400 - 2000 Hz
(+) | medi bilanciati - solo only 2.4% rispetto alla media
(+) | medi lineari (5% delta rispetto alla precedente frequenza)
Alti 2 - 16 kHz
(+) | Alti bilanciati - appena 2.7% dalla media
(±) | la linearità degli alti è media (7.1% delta rispetto alla precedente frequenza)
Nel complesso 100 - 16.000 Hz
(+) | suono nel complesso lineare (13.8% differenza dalla media)
Rispetto alla stessa classe
» 19% di tutti i dispositivi testati in questa classe è stato migliore, 4% simile, 77% peggiore
» Il migliore ha avuto un delta di 6%, medio di 20%, peggiore di 57%
Rispetto a tutti i dispositivi testati
» 15% di tutti i dispositivi testati in questa classe è stato migliore, 4% similare, 81% peggiore
» Il migliore ha avuto un delta di 4%, medio di 23%, peggiore di 134%
Apple MacBook 12 (Early 2016) 1.1 GHz analisi audio
(+) | gli altoparlanti sono relativamente potenti (83.6 dB)
Bassi 100 - 315 Hz
(±) | bassi ridotti - in media 11.3% inferiori alla media
(±) | la linearità dei bassi è media (14.2% delta rispetto alla precedente frequenza)
Medi 400 - 2000 Hz
(+) | medi bilanciati - solo only 2.4% rispetto alla media
(+) | medi lineari (5.5% delta rispetto alla precedente frequenza)
Alti 2 - 16 kHz
(+) | Alti bilanciati - appena 2% dalla media
(+) | alti lineari (4.5% delta rispetto alla precedente frequenza)
Nel complesso 100 - 16.000 Hz
(+) | suono nel complesso lineare (10.2% differenza dalla media)
Rispetto alla stessa classe
» 7% di tutti i dispositivi testati in questa classe è stato migliore, 2% simile, 90% peggiore
» Il migliore ha avuto un delta di 5%, medio di 18%, peggiore di 53%
Rispetto a tutti i dispositivi testati
» 5% di tutti i dispositivi testati in questa classe è stato migliore, 1% similare, 94% peggiore
» Il migliore ha avuto un delta di 4%, medio di 23%, peggiore di 134%
| Off / Standby | |
| Idle | |
| Sotto carico |
|
Leggenda:
min: | |
| Lenovo Yoga 710-14ISK 6200U, GeForce 940MX, Samsung SSD PM871 MZNLN256HCHP, a-Si WLED TFT, IPS, 1920x1080, 14" | Lenovo Yoga 510-15ISK 6200U, Radeon R7 M460, Liteonit CV3-DE256, IPS, 1920x1080, 15.6" | Lenovo Yoga 3 14-80JH0035GE 5200U, GeForce 940M, Samsung SSD PM851 256 GB MZYTE256HMHP, IPS, 1920x1080, 14" | HP Envy 15-w103ng x360 6200U, GeForce 930M, Samsung SSD PM851 256 GB MZNTE256HMHP, IPS, 1920x1080, 15.6" | |
|---|---|---|---|---|
| Power Consumption | 10% | 28% | 15% | |
| Idle Minimum * (Watt) | 4.9 | 4 18% | 3.2 35% | 4.15 15% |
| Idle Average * (Watt) | 9.4 | 7.5 20% | 5.5 41% | 8.2 13% |
| Idle Maximum * (Watt) | 10.7 | 8.1 24% | 6.8 36% | 8.2 23% |
| Load Average * (Watt) | 46 | 40.8 11% | 40 13% | 34.6 25% |
| Load Maximum * (Watt) | 47.2 | 57.3 -21% | 40.4 14% | 48 -2% |
* ... Meglio usare valori piccoli

| Lenovo Yoga 710-14ISK 6200U, GeForce 940MX, 53 Wh | Lenovo Yoga 510-15ISK 6200U, Radeon R7 M460, 35 Wh | Lenovo Yoga 3 14-80JH0035GE 5200U, GeForce 940M, 47 Wh | HP Envy 15-w103ng x360 6200U, GeForce 930M, 48 Wh | |
|---|---|---|---|---|
| Autonomia della batteria | -25% | -10% | -8% | |
| Reader / Idle (h) | 16 | 12.2 -24% | 14.8 -7% | |
| H.264 (h) | 7.1 | 5.6 -21% | ||
| WiFi v1.3 (h) | 7.2 | 5.6 -22% | 6.4 -11% | 6.6 -8% |
| Load (h) | 2.5 | 1.7 -32% | 2.2 -12% |
Pro
Contro
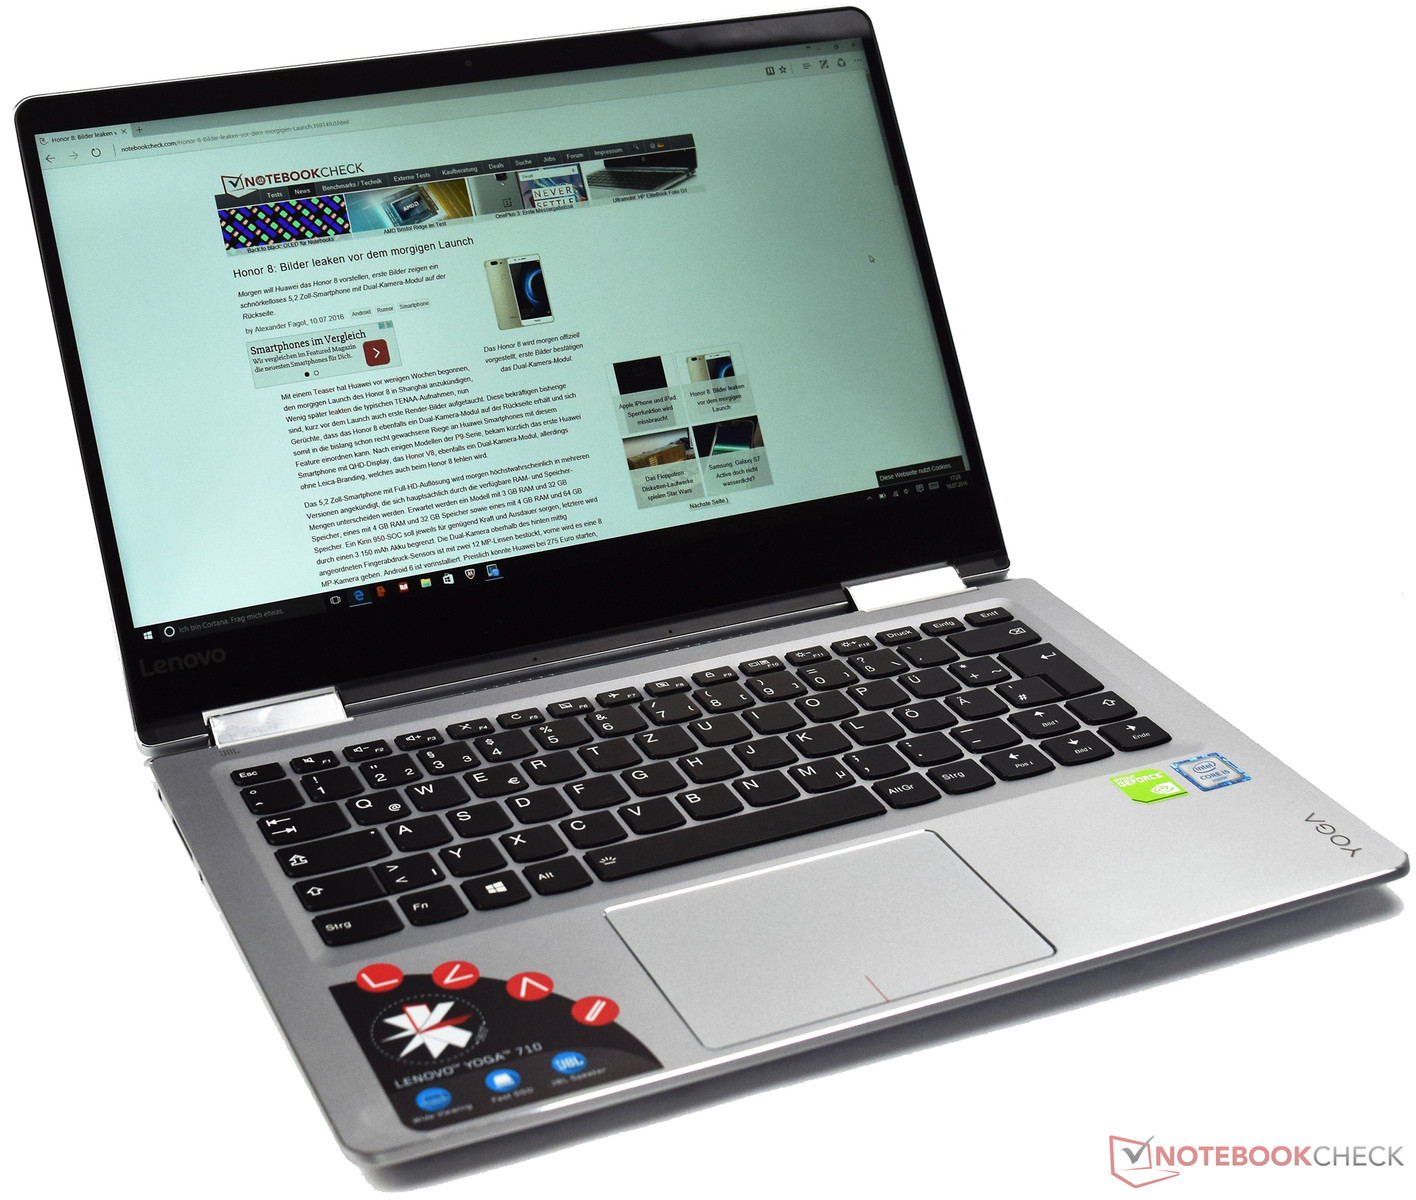
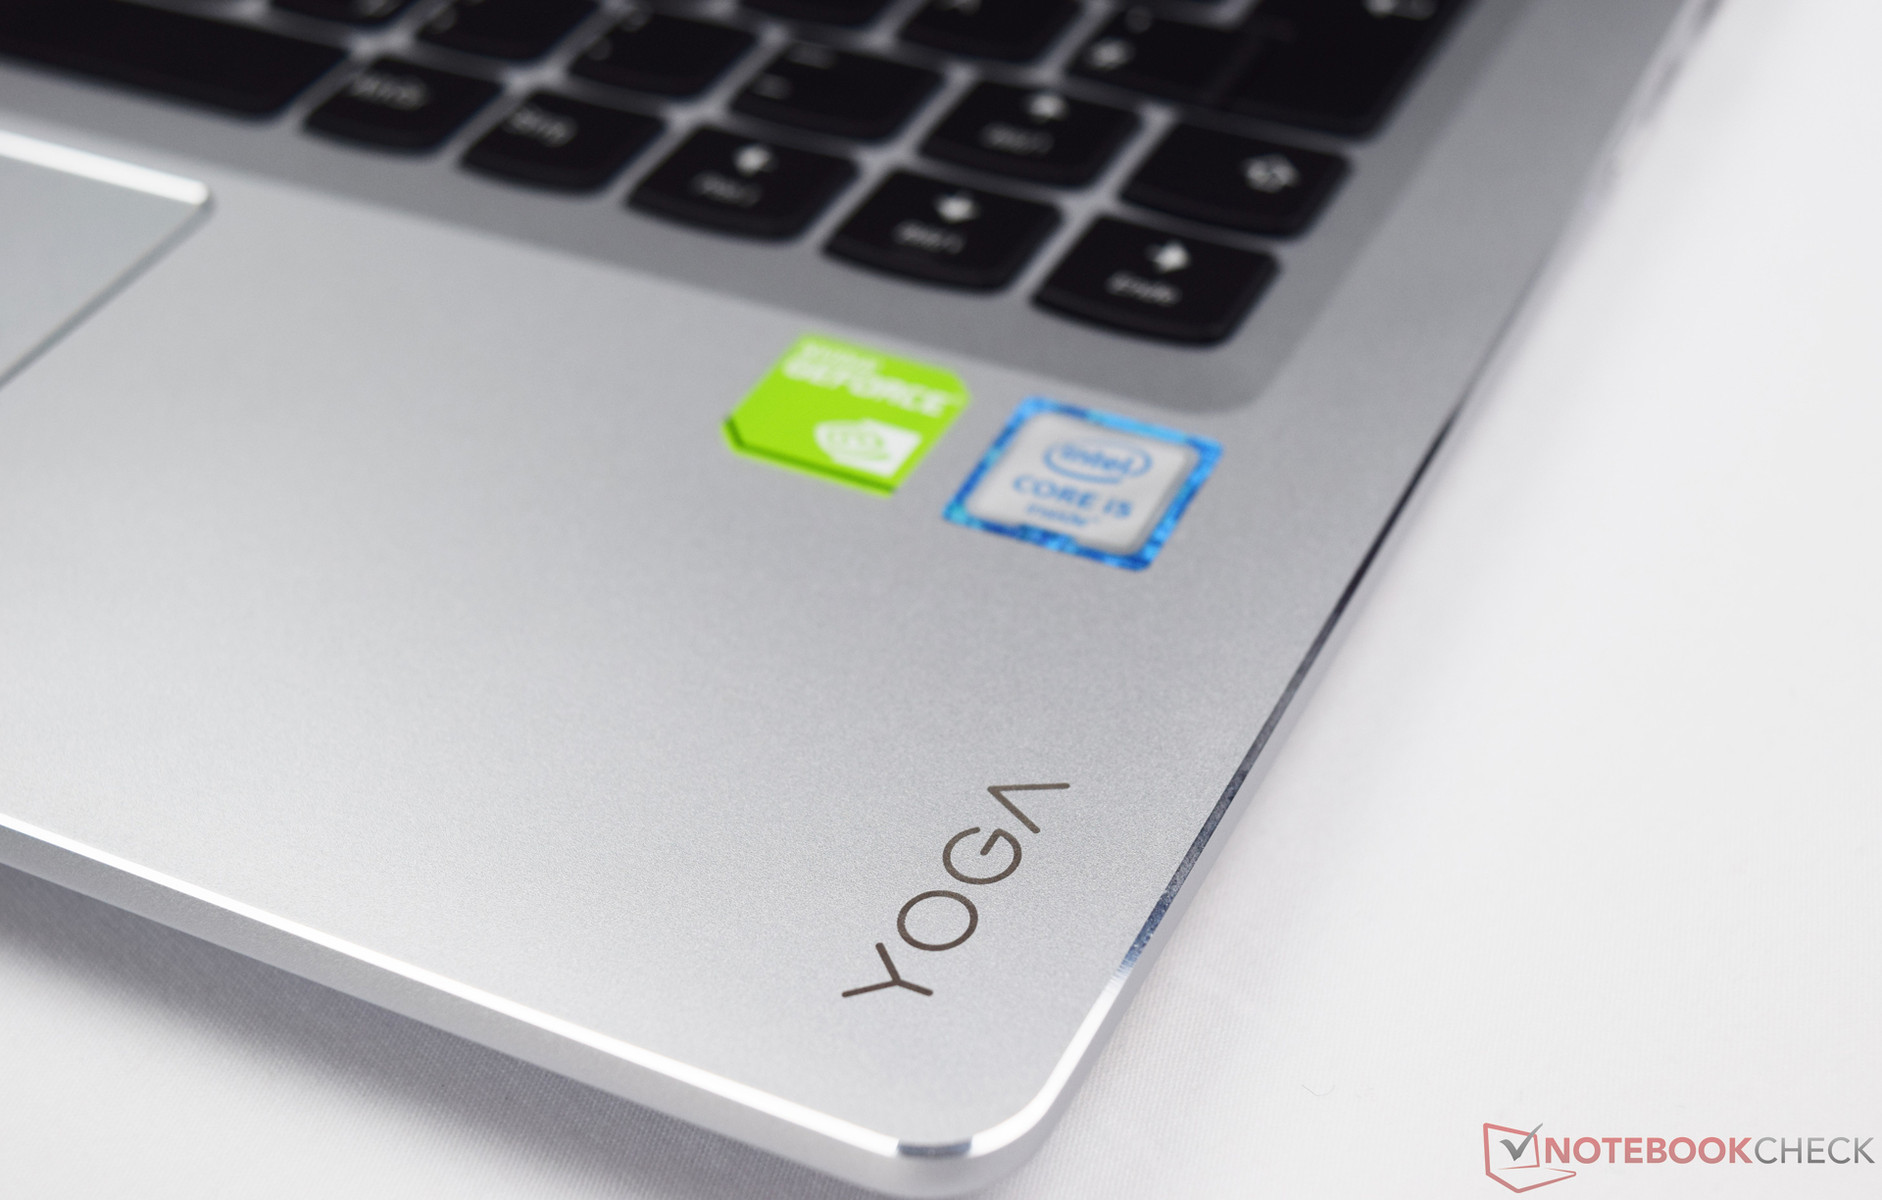
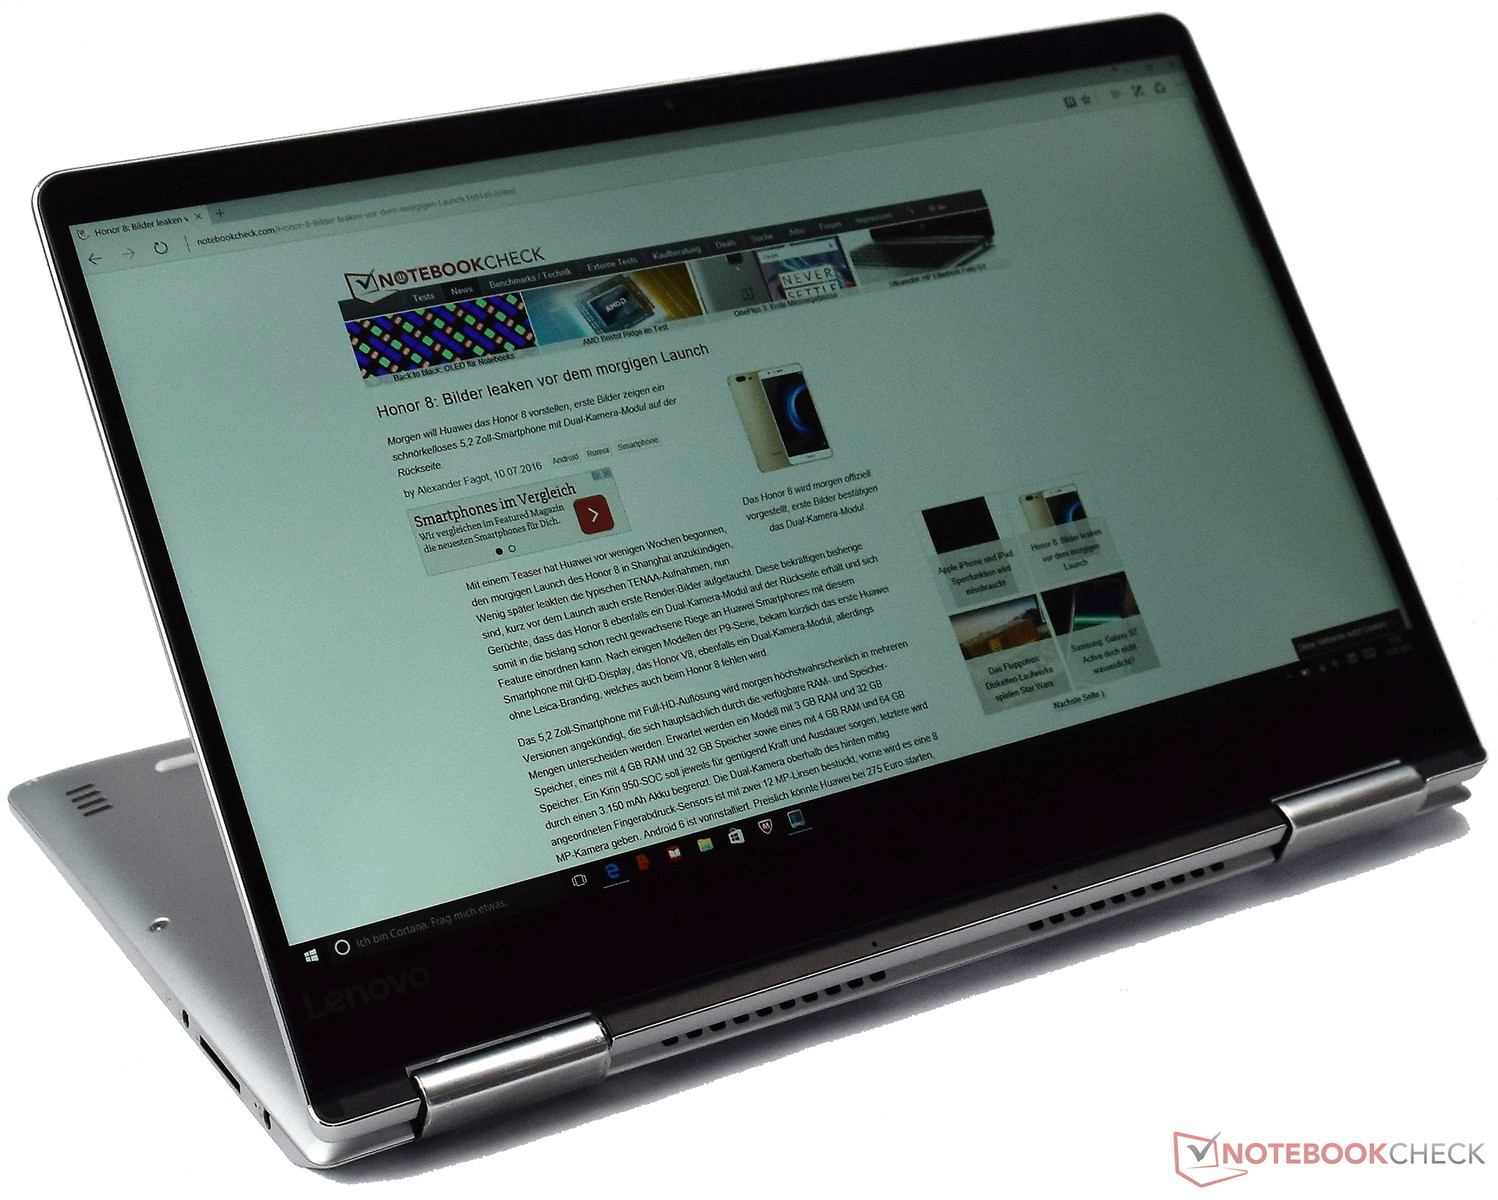
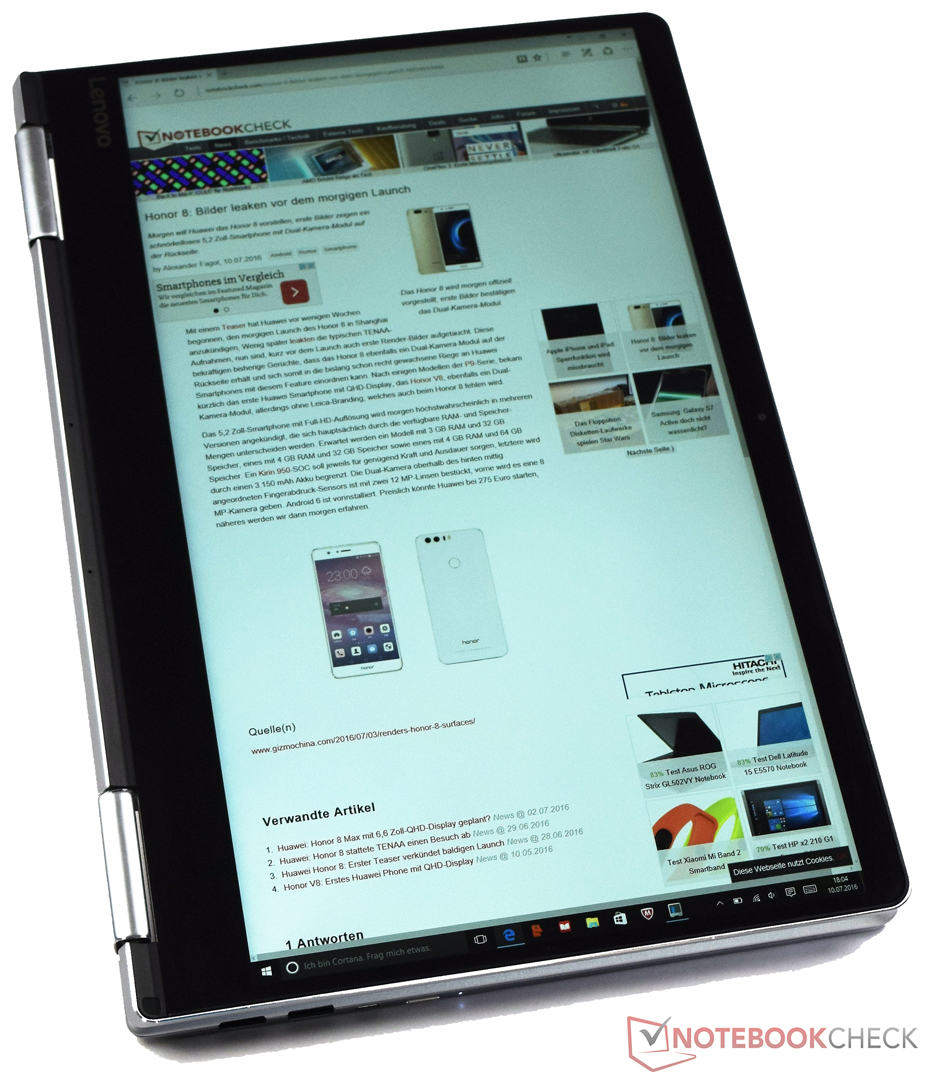
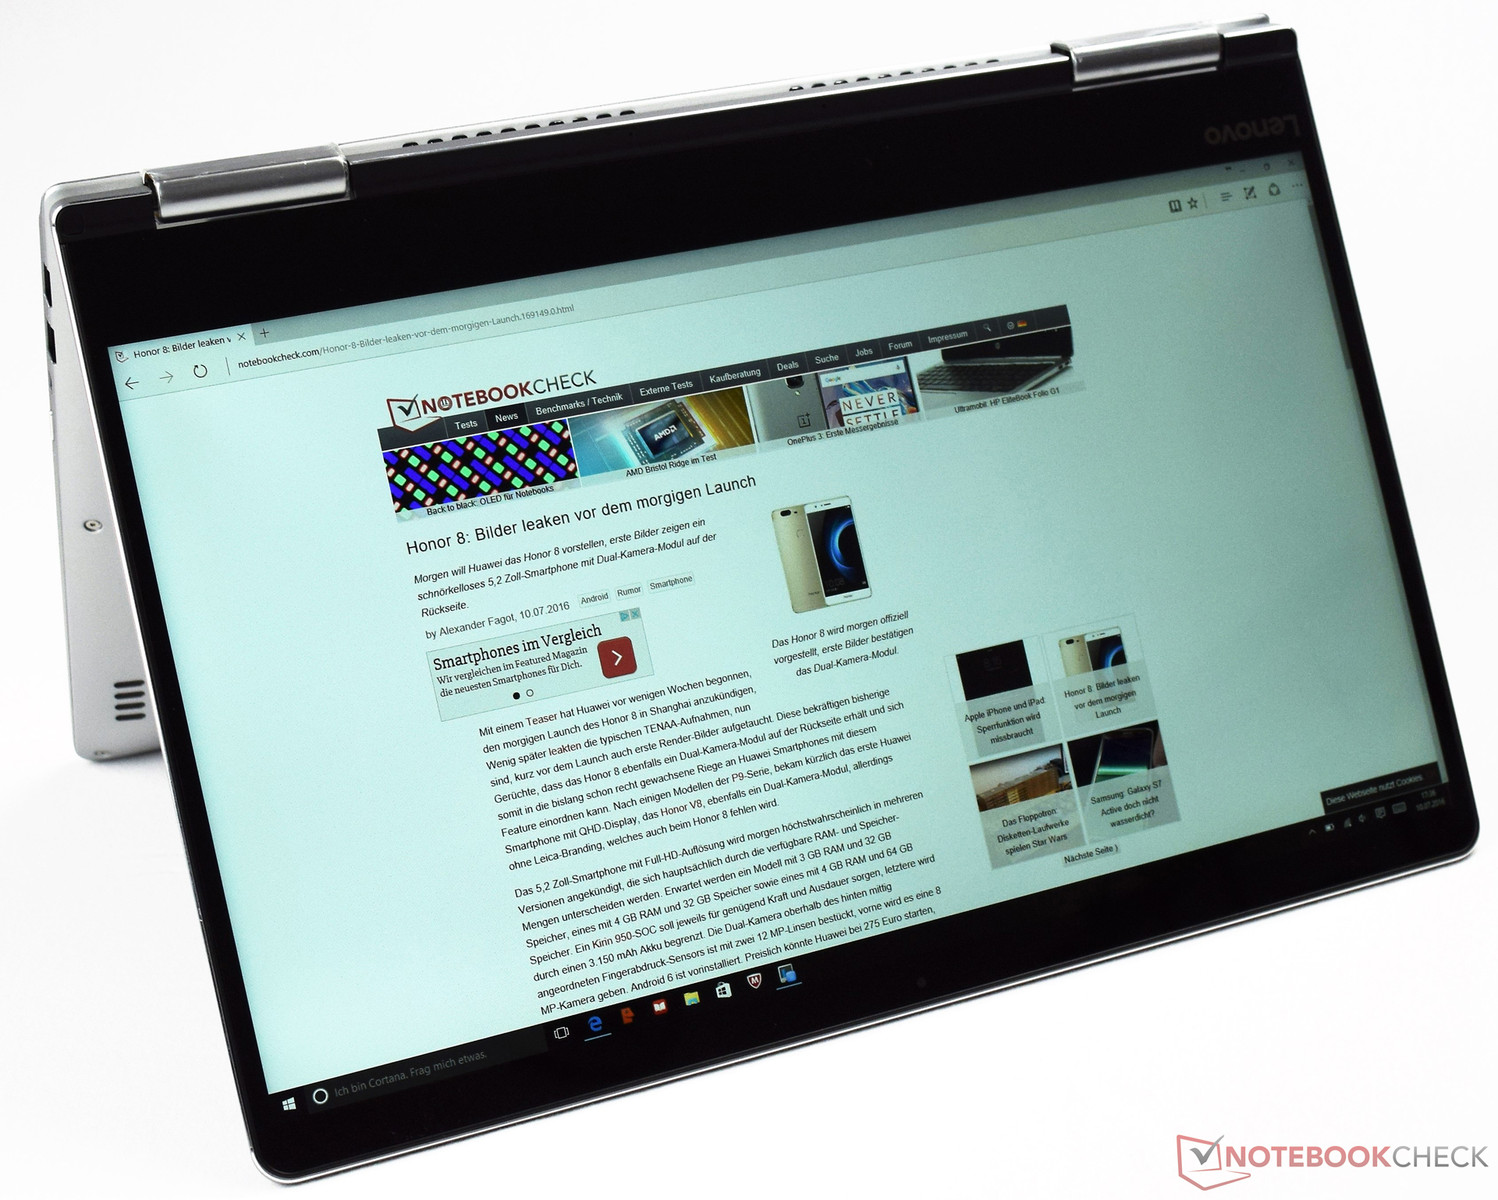
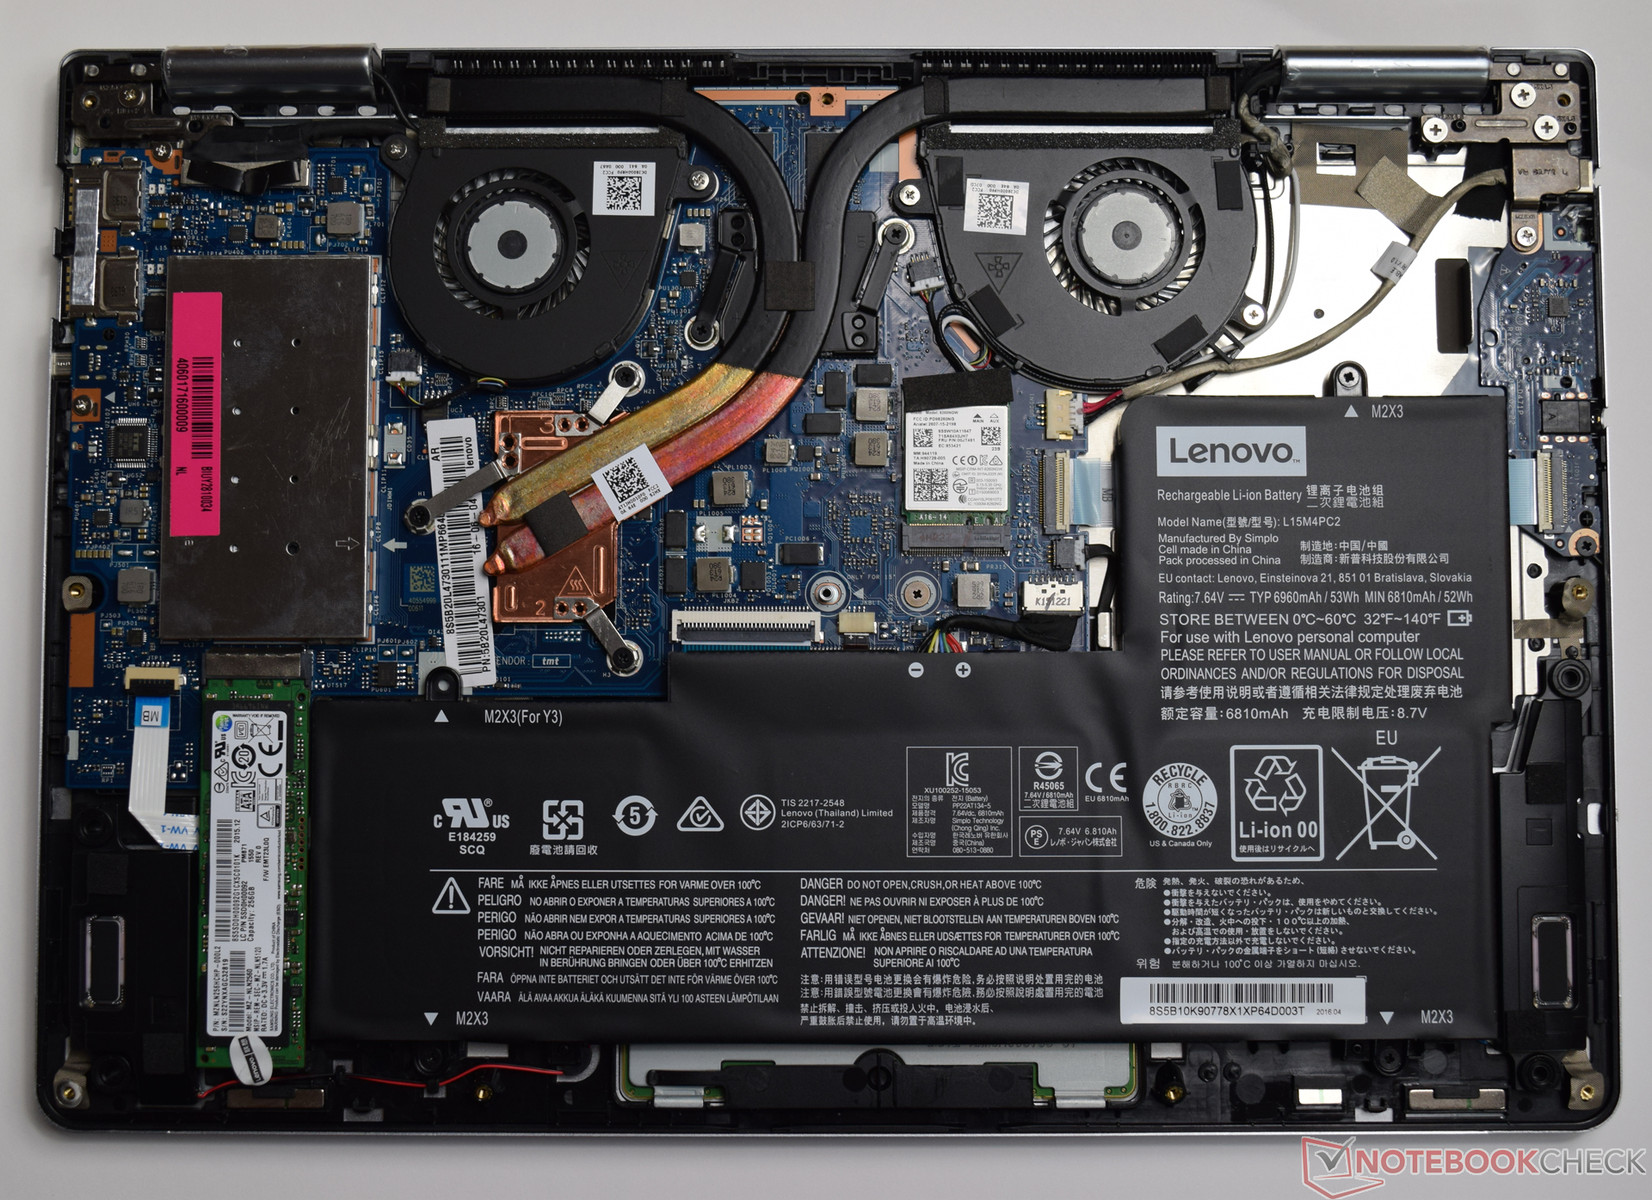
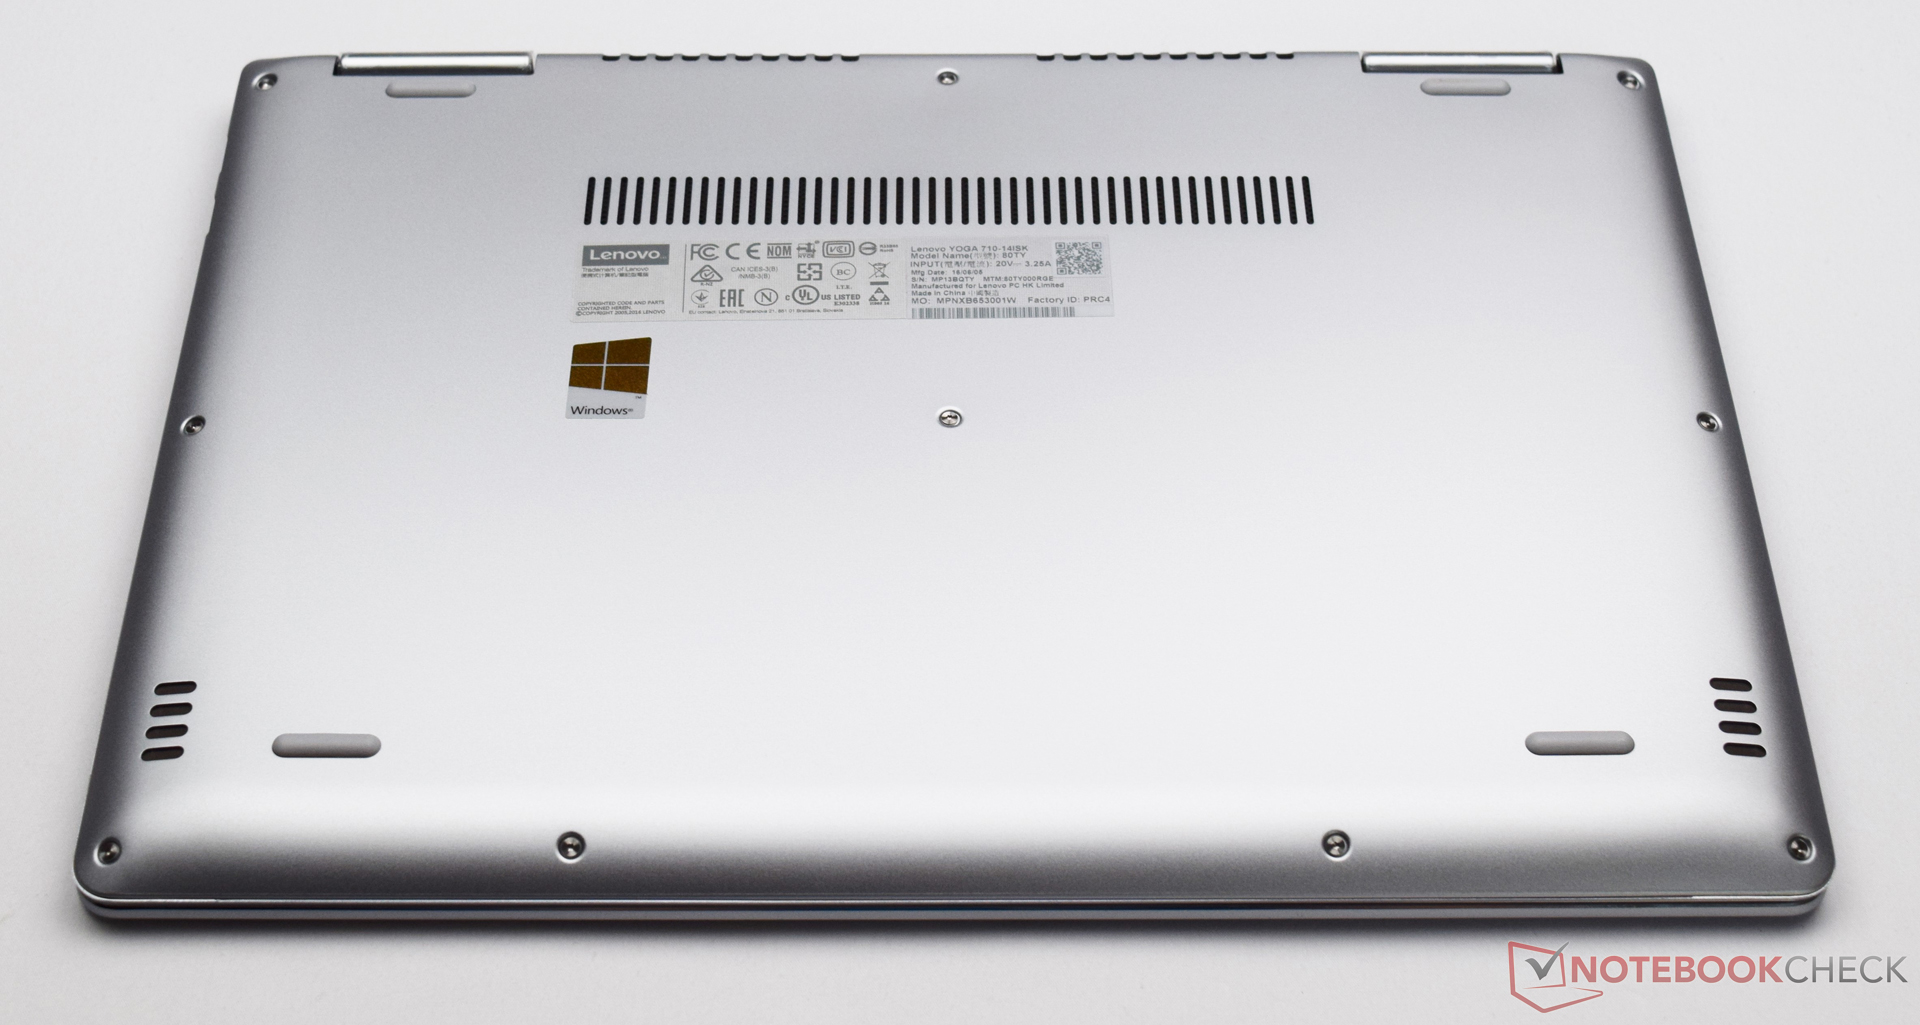
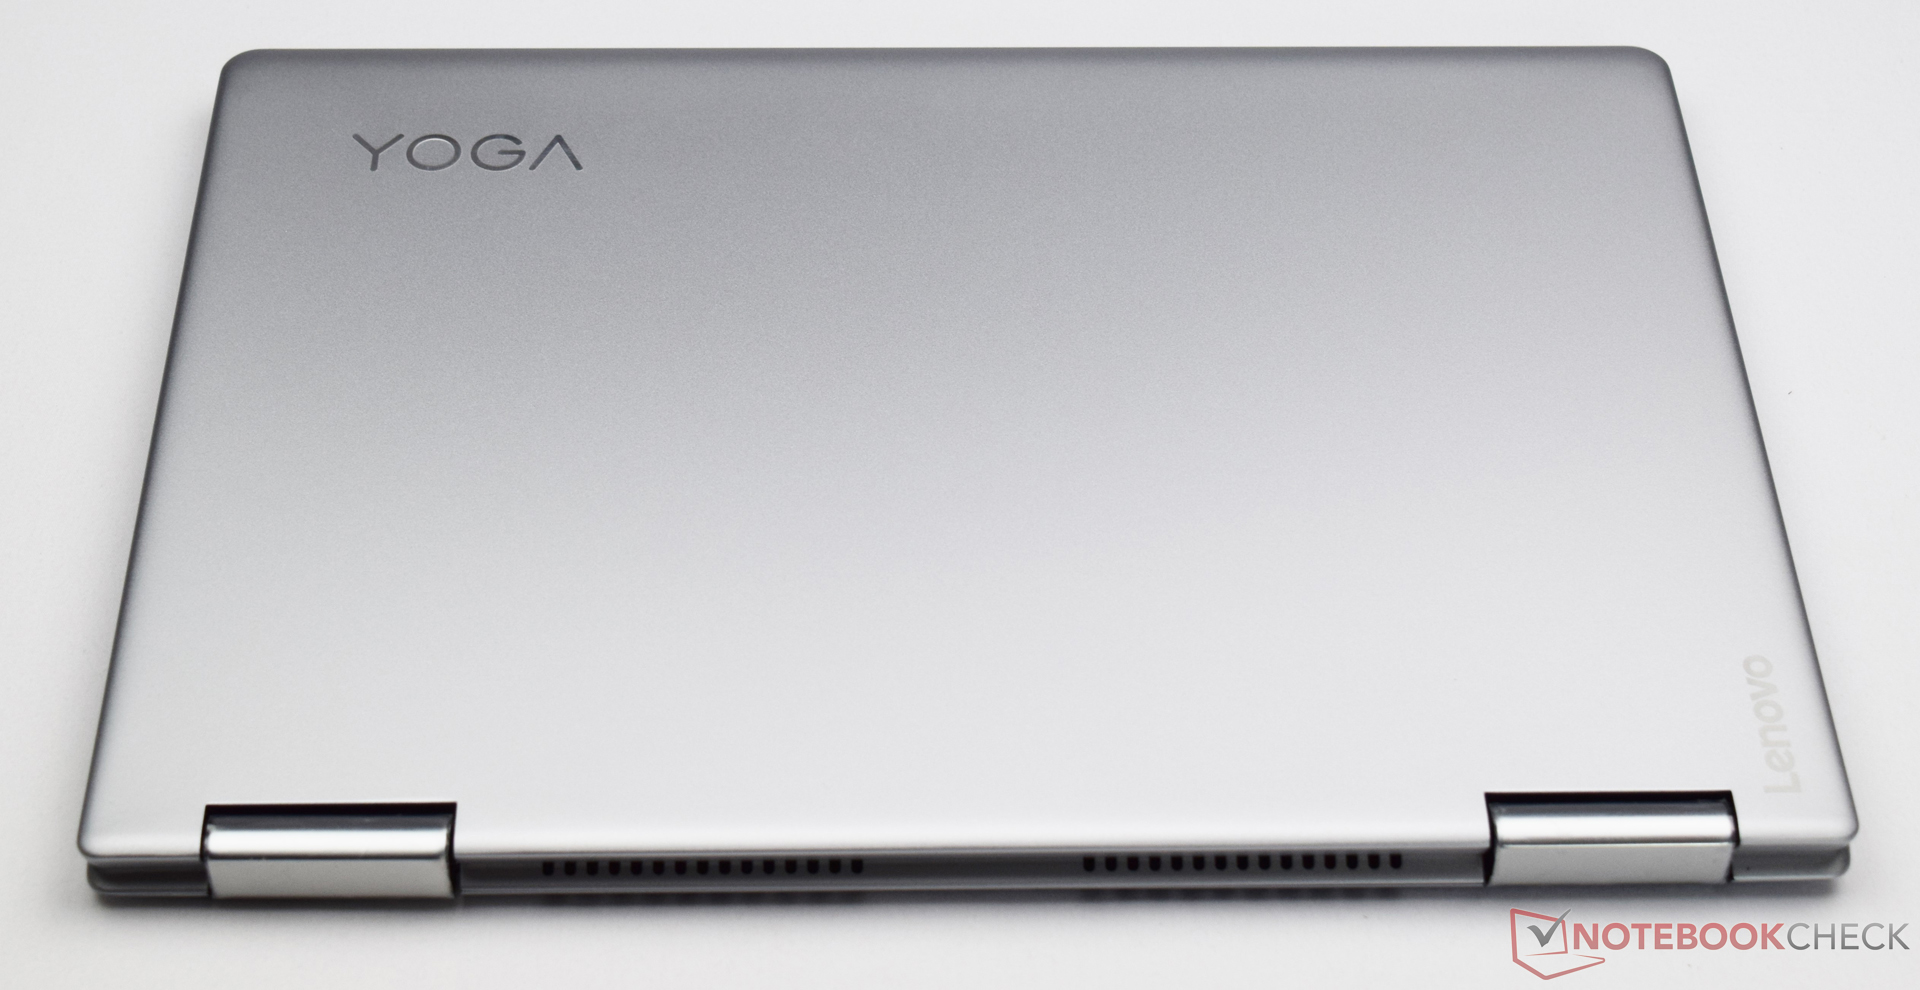
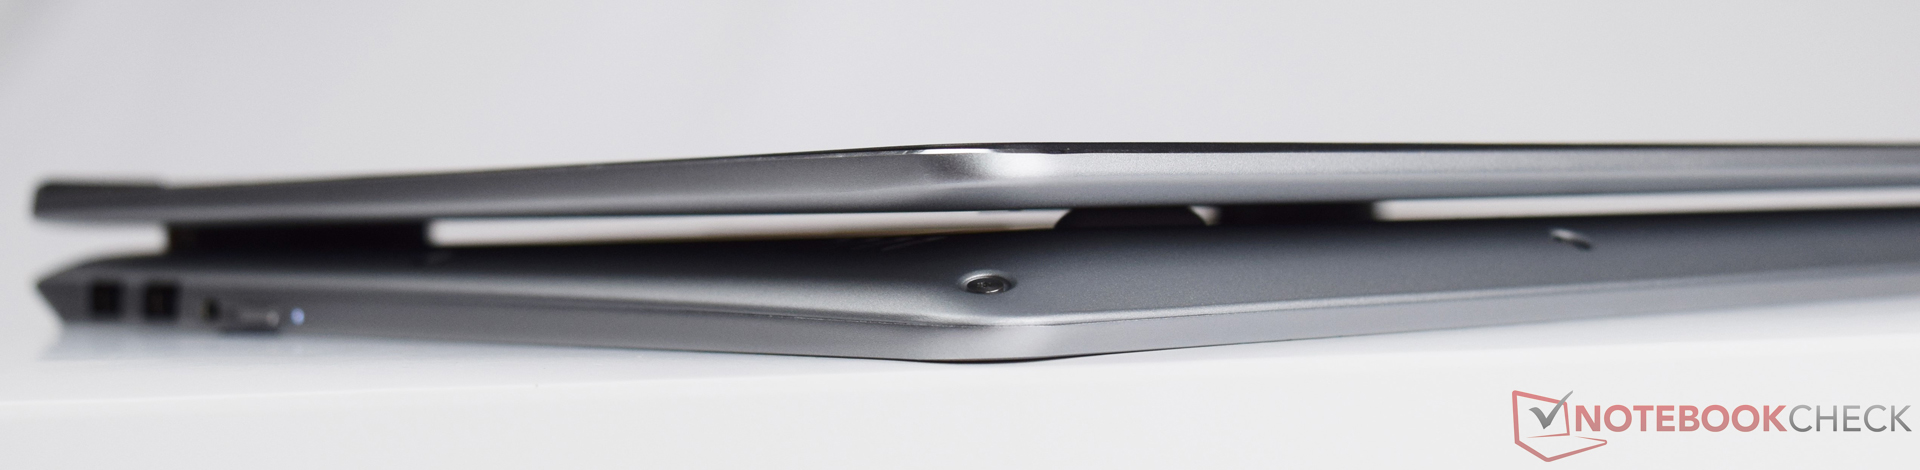
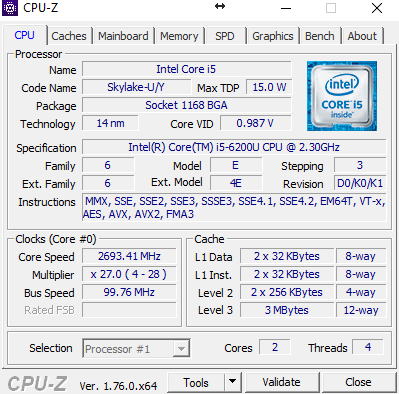
Il convertibile Lenovo Yoga 710-14ISK 14" offre una buona durata nel tempo. Il dispositivo testato costa circa 1.000 Euro (~$1120). Per questo prezzo, avrete un portatile carino con un buon chassis in alluminio. Le performance sono buone grazie all'Intel Core i5-6200U, agli 8 GB di RAM DDR4 ed alla Nvidia GeForce 940MX. Abbiamo apprezzato anche l'SSD Samsung, che con 256 GB offre abbastanza spazio per le applicazioni più grandi. La GPU dedicata ha abbastanza potenza per gestire qualche gioco se volete.
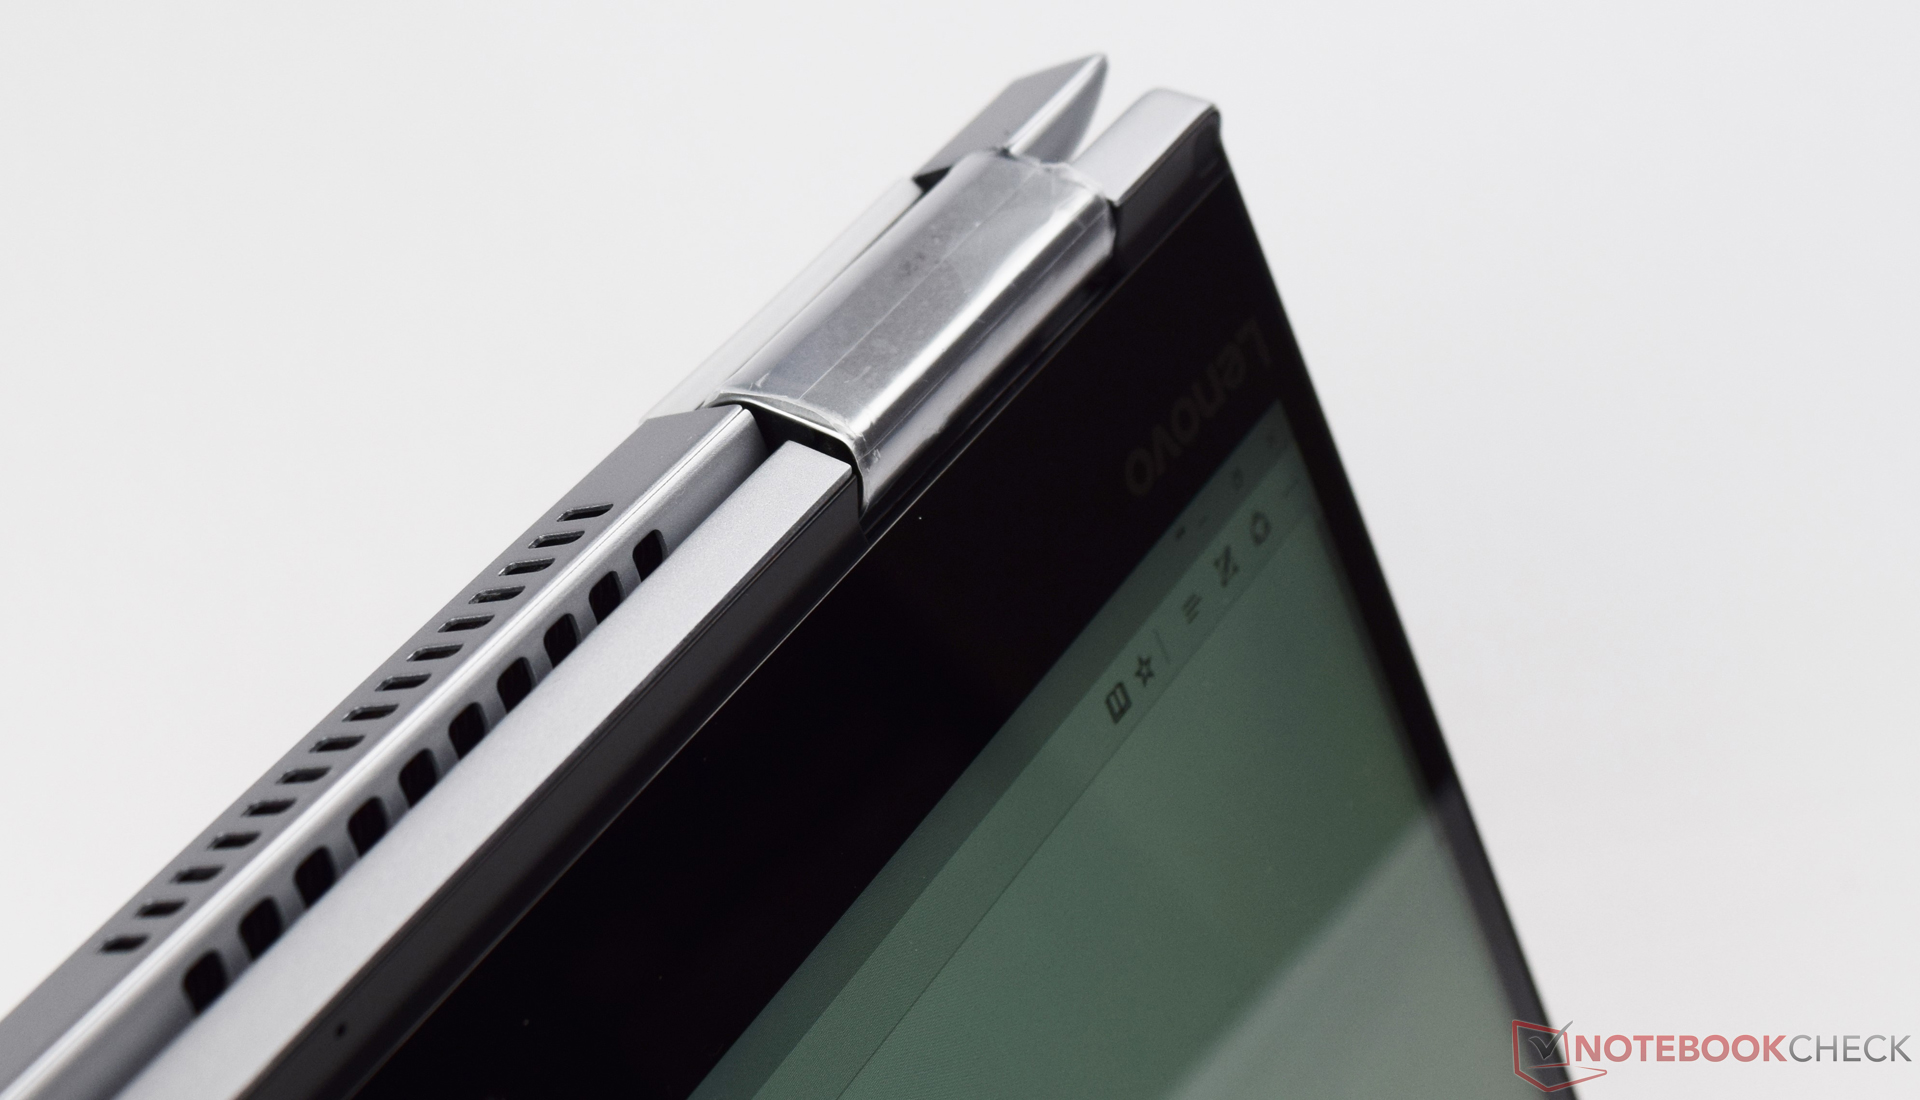
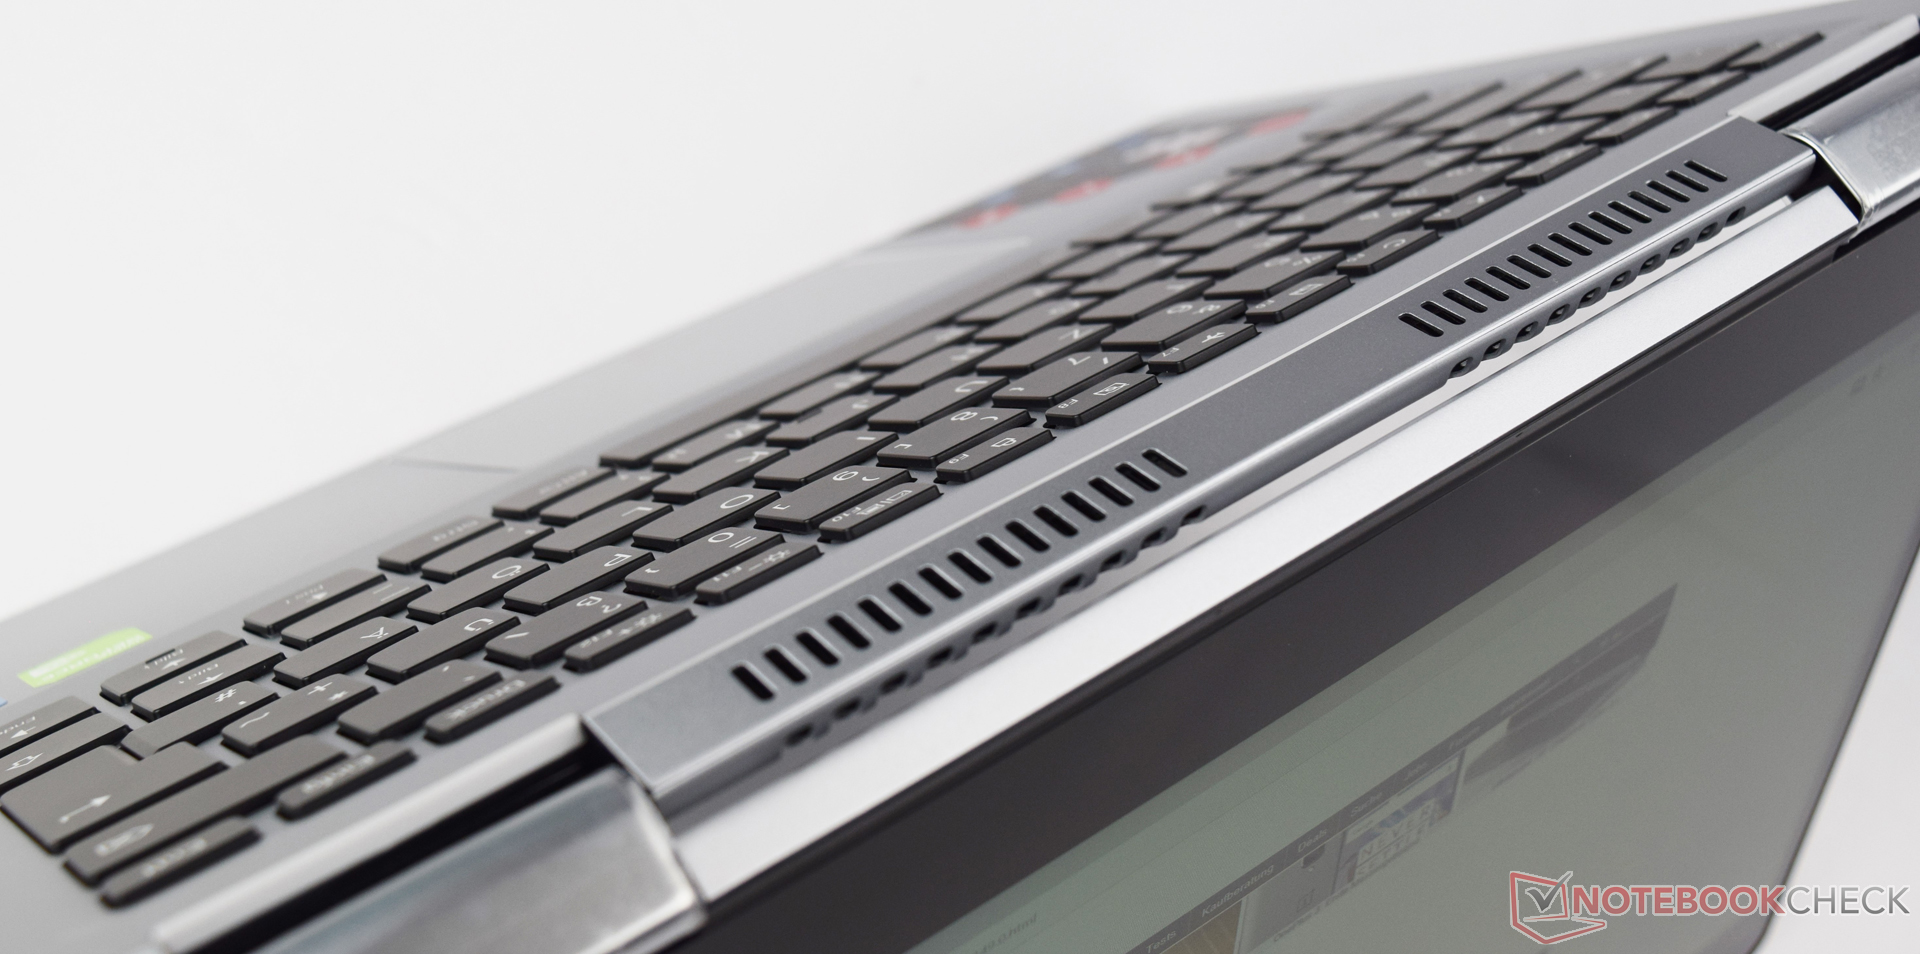
Abbiamo apprezzato il Lenovo Yoga 710-14ISK per il design semplice ed elegante, ma anche per la robustezza. L'aspetto di questo convertibile è appealing. Dal punto di vista delle performance, lo Yoga è nella media. Un'area che Lenovo potrebbe migliorare sono i consumi, che dovrebbero essere ridotti.
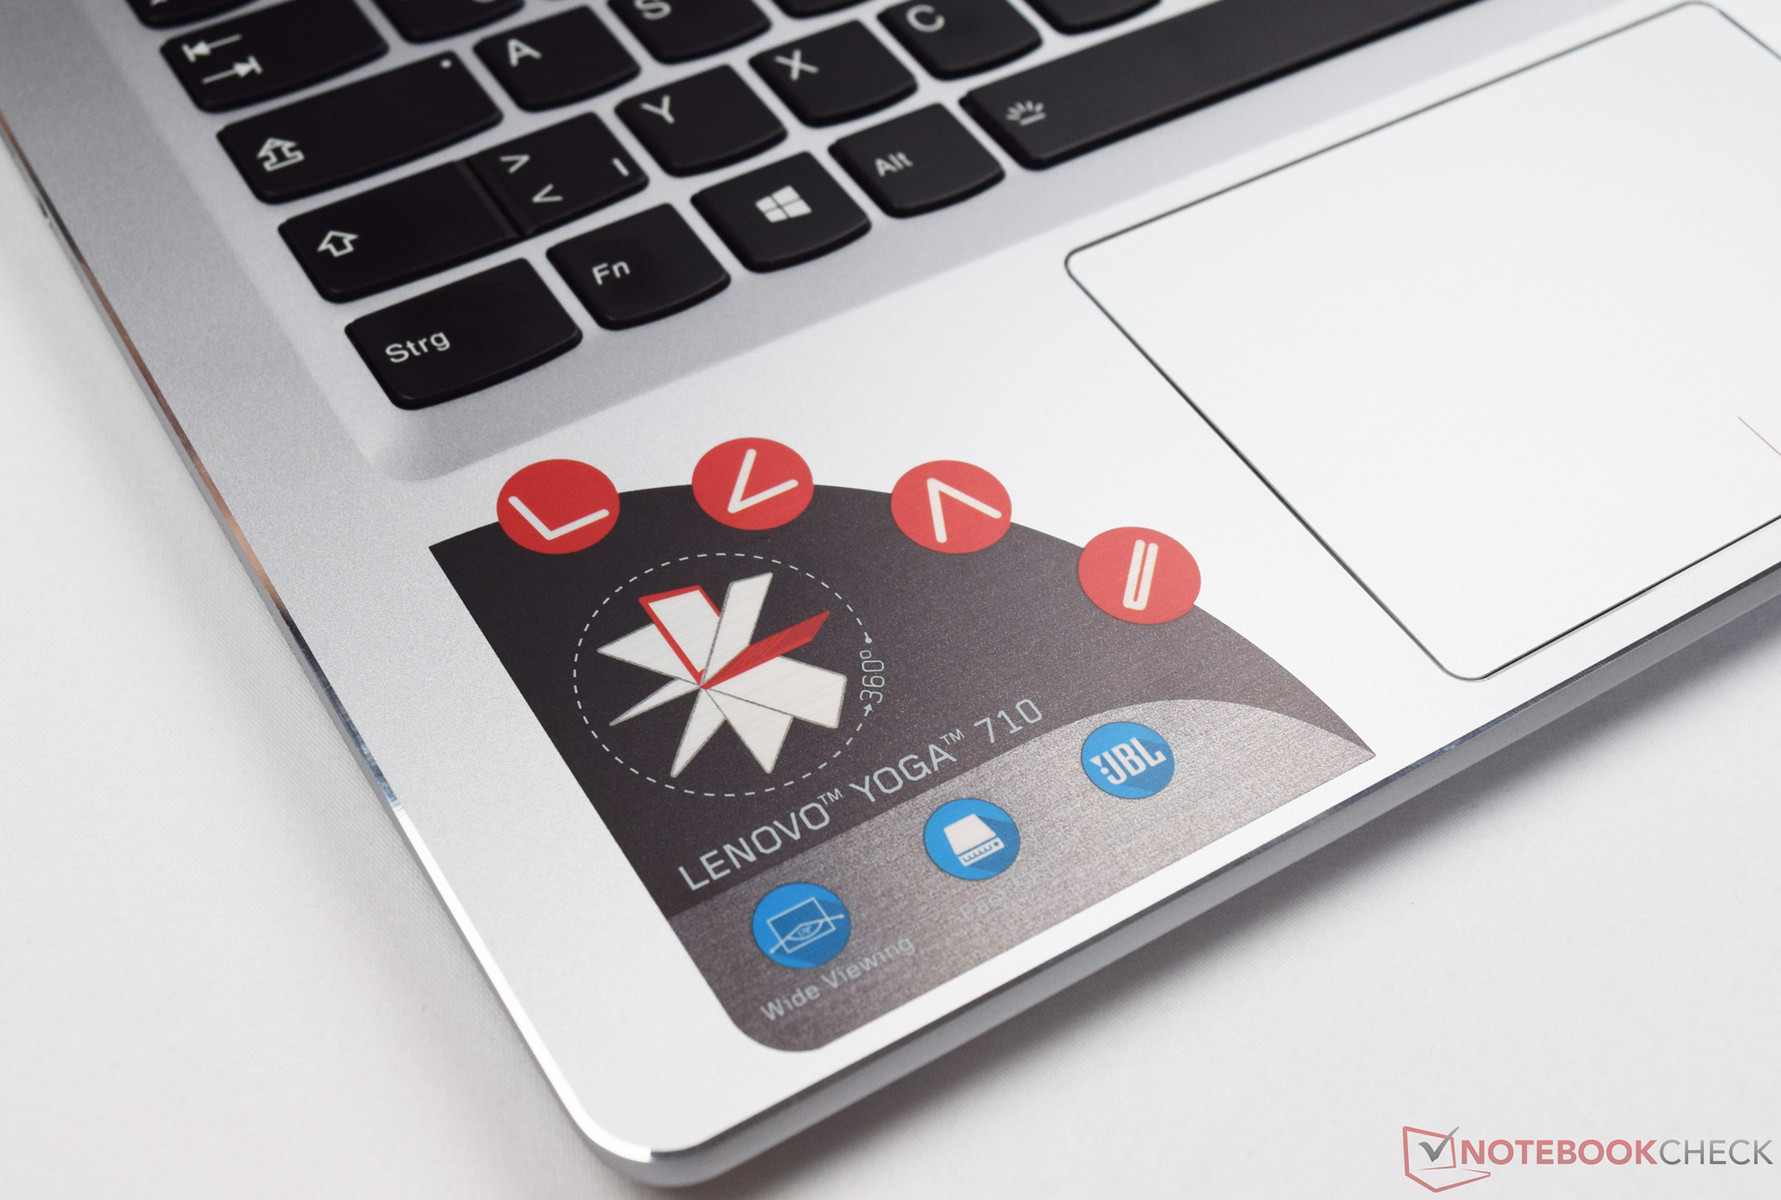
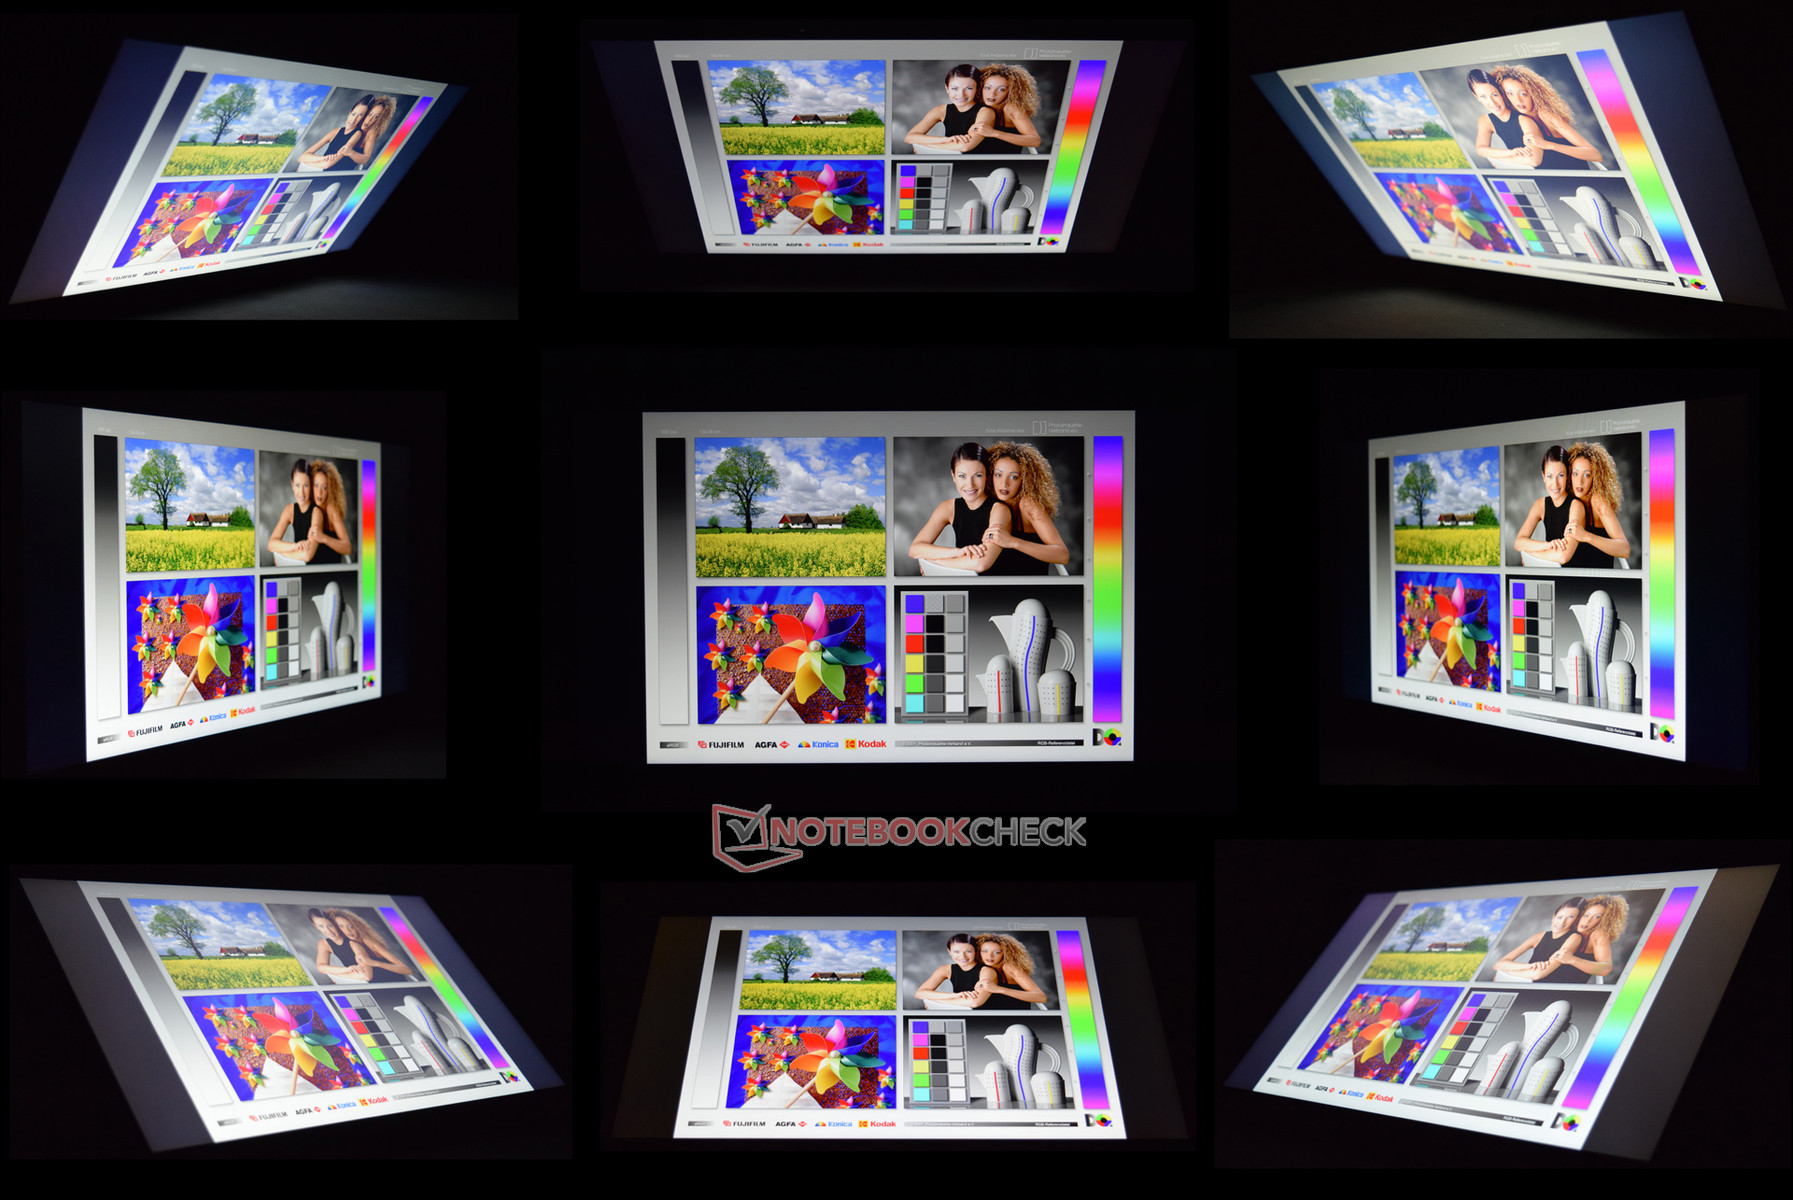
I dispositivi di input sono abbastanza buoni, il display ha ampi angoli di visuale e la costruzione è impeccabile. La selezione dei materiali è convincente e difficilmente si notano le ditate. Considerando il tutto, il Lenovo Yoga 710 è un solido convertibile adatto ad essere un compagno quotidiano.
Nota: si tratta di una recensione breve, con alcune sezioni non tradotte, per la versione integrale in inglese guardate qui.
Lenovo Yoga 710-14ISK
- 11/03/2016 v5.1 (old)
Sebastian Bade
Price comparison
