Recensione breve del portatile Acer TravelMate P449-M-7407
| SD Card Reader | |
| average JPG Copy Test (av. of 3 runs) | |
| HP ProBook 450 G4 Y8B60EA | |
| Acer TravelMate P259-MG-71UU | |
| Lenovo ThinkPad E470-20H2S00400 | |
| Acer TravelMate P449-M-7407 | |
| maximum AS SSD Seq Read Test (1GB) | |
| HP ProBook 450 G4 Y8B60EA | |
| Lenovo ThinkPad E470-20H2S00400 | |
| Acer TravelMate P449-M-7407 | |
| Networking | |
| iperf3 transmit AX12 | |
| Acer TravelMate P259-MG-71UU | |
| Acer TravelMate P449-M-7407 | |
| Lenovo ThinkPad E470-20H2S00400 | |
| iperf3 receive AX12 | |
| Acer TravelMate P259-MG-71UU | |
| Lenovo ThinkPad E470-20H2S00400 | |
| Acer TravelMate P449-M-7407 | |
| |||||||||||||||||||||||||
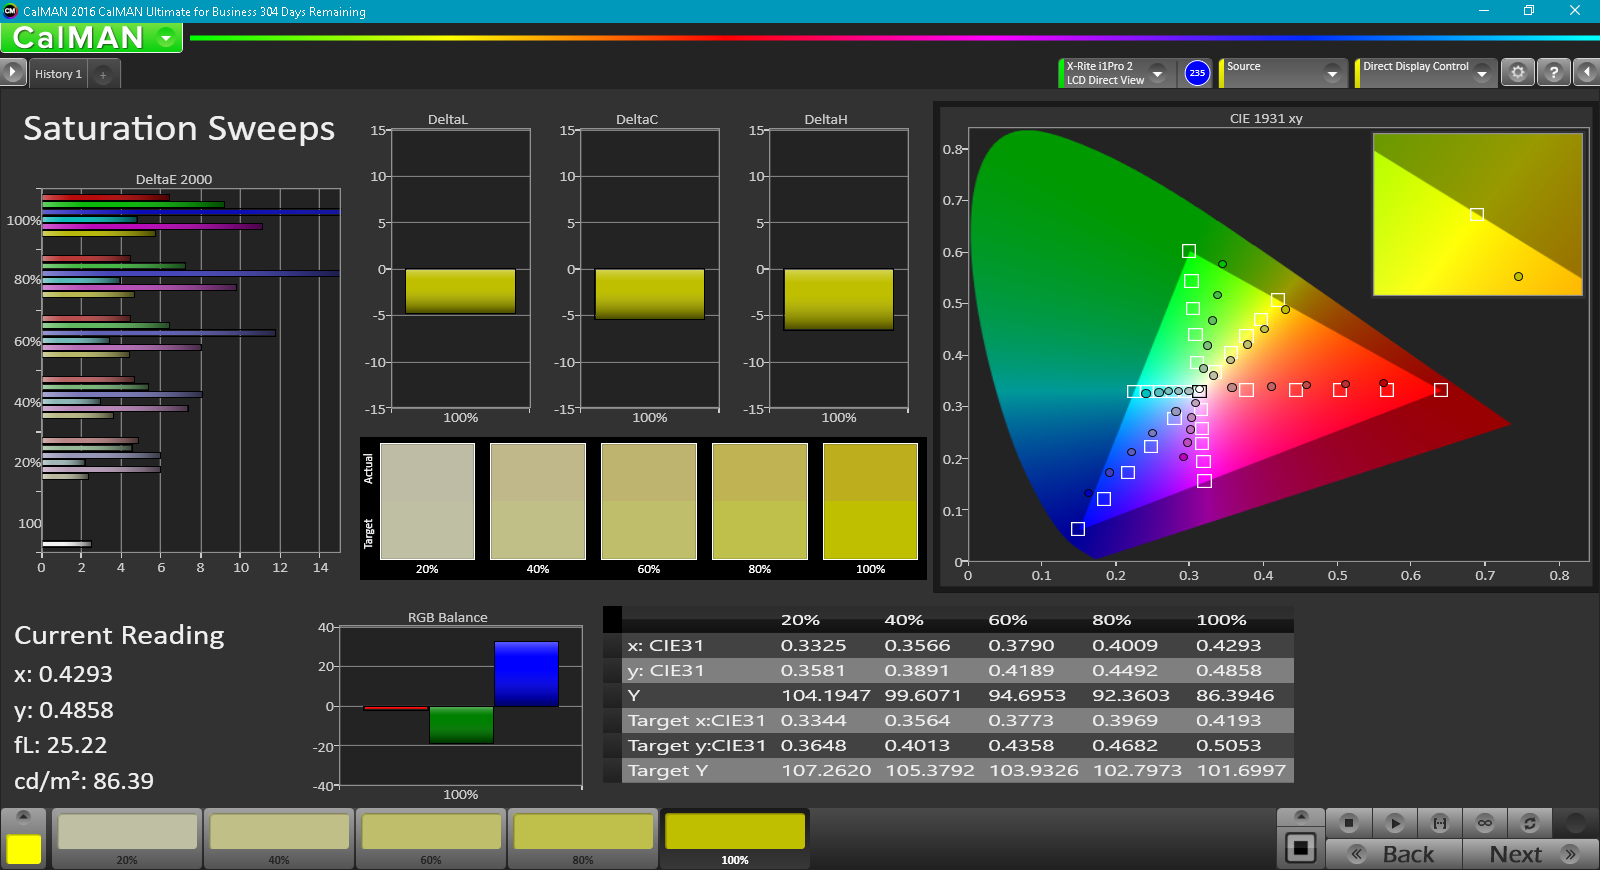
Distribuzione della luminosità: 90 %
Al centro con la batteria: 208.3 cd/m²
Contrasto: 1096:1 (Nero: 0.19 cd/m²)
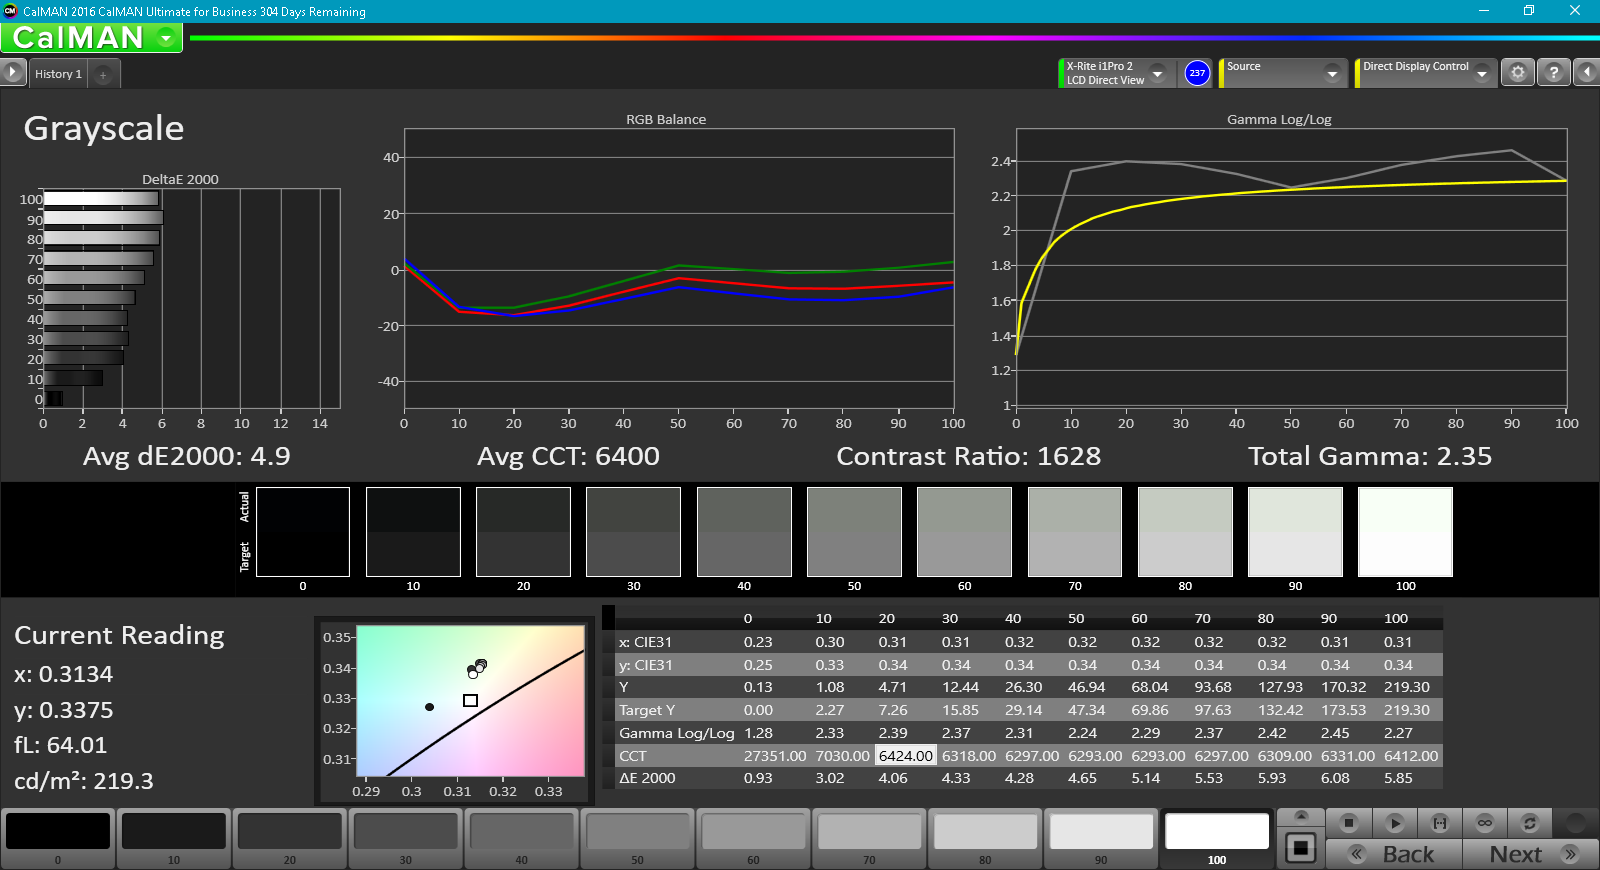
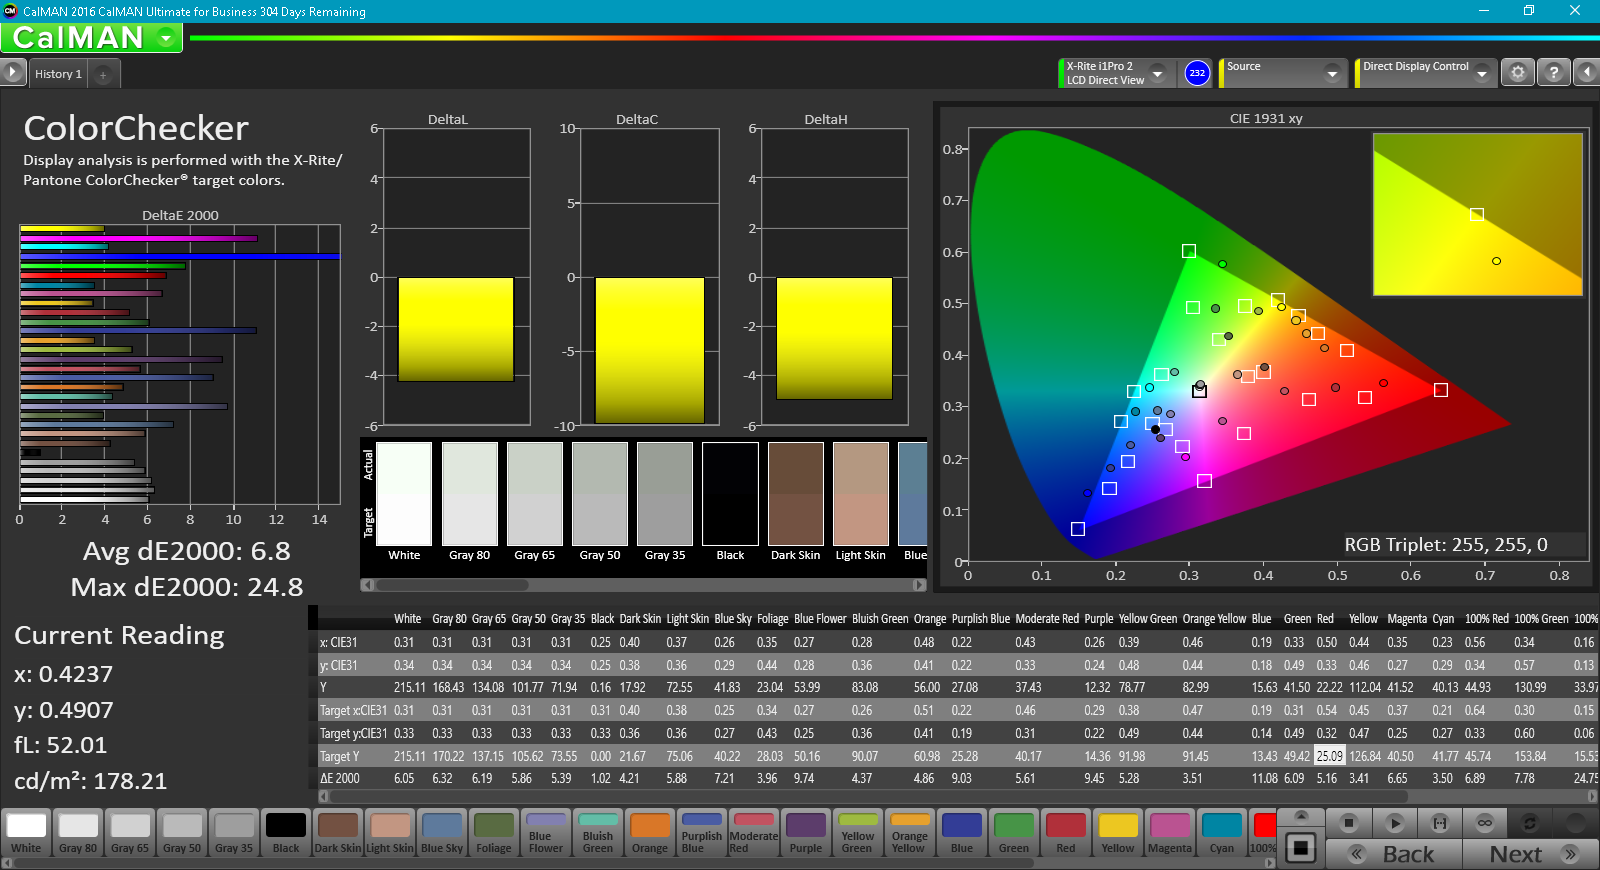
ΔE ColorChecker Calman: 6.8 | ∀{0.5-29.43 Ø4.71}
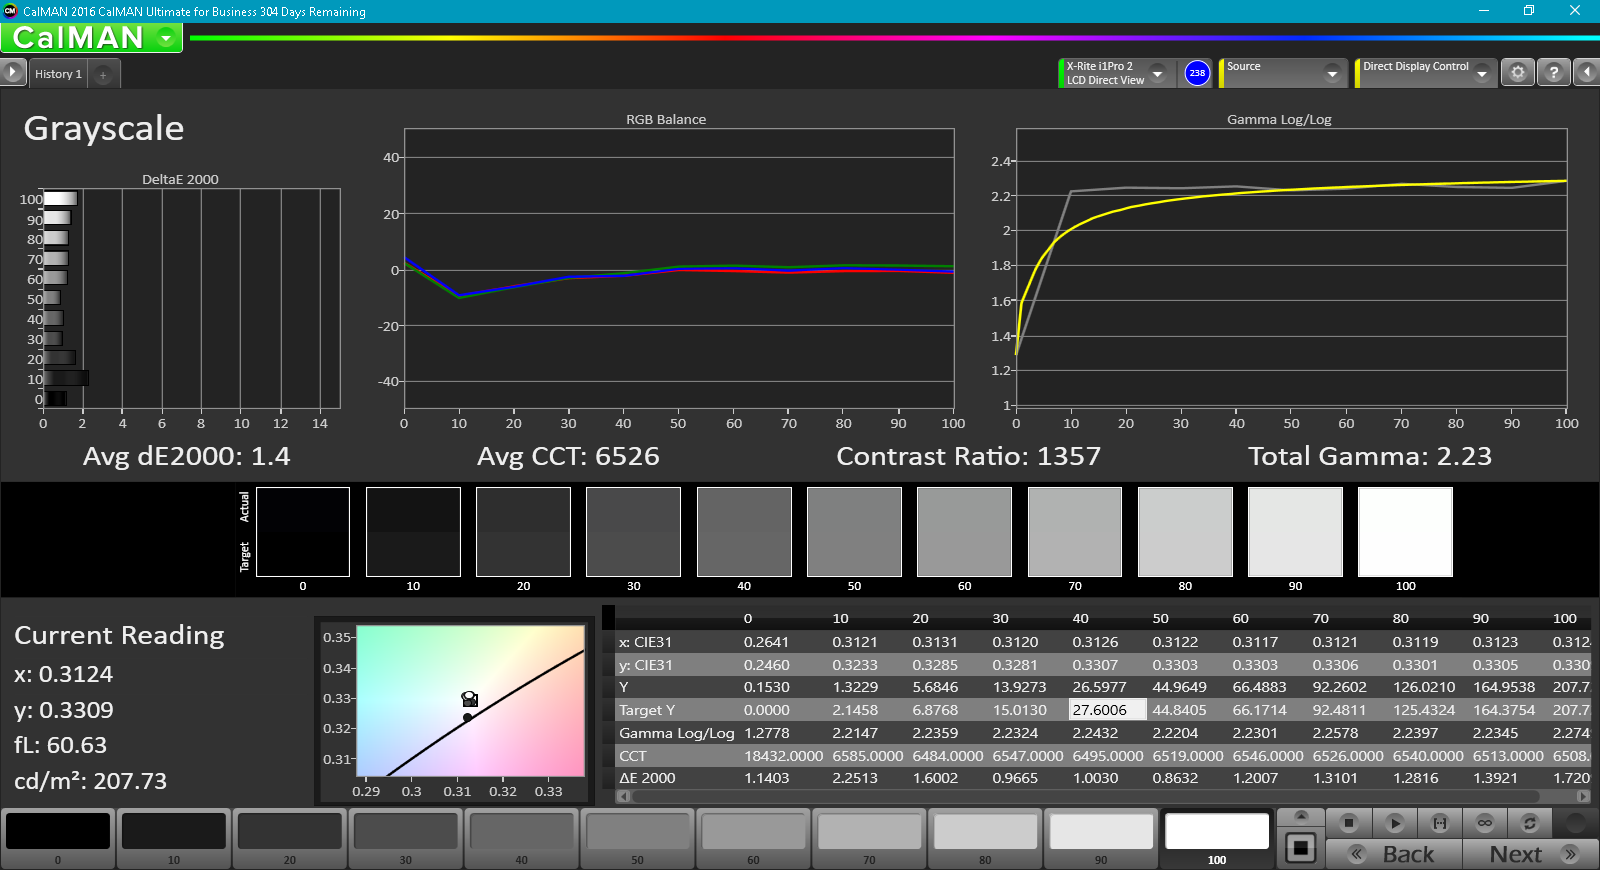
ΔE Greyscale Calman: 4.9 | ∀{0.09-98 Ø4.96}
54% sRGB (Argyll 1.6.3 3D)
34% AdobeRGB 1998 (Argyll 1.6.3 3D)
37.02% AdobeRGB 1998 (Argyll 3D)
53.9% sRGB (Argyll 3D)
35.83% Display P3 (Argyll 3D)
Gamma: 2.35
CCT: 6400 K
| Acer TravelMate P449-M-7407 AU Optronics AU0213D, IPS, 14", 1920x1080 | Acer TravelMate P259-MG-71UU BOE NT156FHM-N41, TN LED, 15.6", 1920x1080 | HP ProBook 450 G4 Y8B60EA Chi Mei CMN15C4, TN LED, 15.6", 1920x1080 | Lenovo ThinkPad E470-20H2S00400 N140HCA-EAB, IPS, 14", 1920x1080 | |
|---|---|---|---|---|
| Display | 8% | 11% | 15% | |
| Display P3 Coverage (%) | 35.83 | 38.58 8% | 39.89 11% | 41.23 15% |
| sRGB Coverage (%) | 53.9 | 58 8% | 59.5 10% | 61.4 14% |
| AdobeRGB 1998 Coverage (%) | 37.02 | 39.85 8% | 41.24 11% | 42.67 15% |
| Response Times | 21% | -1% | 9% | |
| Response Time Grey 50% / Grey 80% * (ms) | 50.8 ? | 43 ? 15% | 51 ? -0% | 40.8 ? 20% |
| Response Time Black / White * (ms) | 29.6 ? | 22 ? 26% | 30 ? -1% | 30.4 ? -3% |
| PWM Frequency (Hz) | 50 ? | |||
| Screen | -36% | -33% | -5% | |
| Brightness middle (cd/m²) | 208.3 | 180 -14% | 214 3% | 244 17% |
| Brightness (cd/m²) | 203 | 178 -12% | 201 -1% | 231 14% |
| Brightness Distribution (%) | 90 | 93 3% | 77 -14% | 89 -1% |
| Black Level * (cd/m²) | 0.19 | 0.45 -137% | 0.43 -126% | 0.37 -95% |
| Contrast (:1) | 1096 | 400 -64% | 498 -55% | 659 -40% |
| Colorchecker dE 2000 * | 6.8 | 9.91 -46% | 10.68 -57% | 6.41 6% |
| Colorchecker dE 2000 max. * | 24.8 | 18.19 27% | 18.07 27% | 13.4 46% |
| Greyscale dE 2000 * | 4.9 | 11.25 -130% | 11.32 -131% | 5.94 -21% |
| Gamma | 2.35 94% | 2.35 94% | 2.26 97% | 2.28 96% |
| CCT | 6400 102% | 12115 54% | 12204 53% | 6101 107% |
| Color Space (Percent of AdobeRGB 1998) (%) | 34 | 37 9% | 38 12% | 39.3 16% |
| Color Space (Percent of sRGB) (%) | 54 | 58 7% | 59 9% | 61.1 13% |
| Media totale (Programma / Settaggio) | -2% /
-19% | -8% /
-20% | 6% /
1% |
* ... Meglio usare valori piccoli
Tempi di risposta del Display
| ↔ Tempi di risposta dal Nero al Bianco | ||
|---|---|---|
| 29.6 ms ... aumenta ↗ e diminuisce ↘ combinato | ↗ 6.8 ms Incremento | 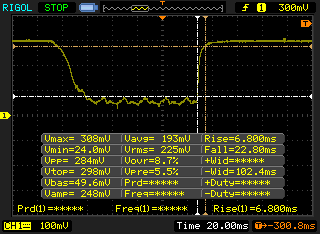 |
| ↘ 22.8 ms Calo | ||
| Lo schermo mostra tempi di risposta relativamente lenti nei nostri tests e potrebbe essere troppo lento per i gamers. In confronto, tutti i dispositivi di test variano da 0.1 (minimo) a 240 (massimo) ms. » 79 % di tutti i dispositivi è migliore. Questo significa che i tempi di risposta rilevati sono peggiori rispetto alla media di tutti i dispositivi testati (19.8 ms). | ||
| ↔ Tempo di risposta dal 50% Grigio all'80% Grigio | ||
| 50.8 ms ... aumenta ↗ e diminuisce ↘ combinato | ↗ 18.8 ms Incremento | 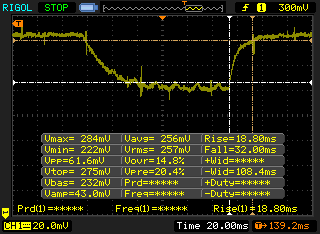 |
| ↘ 32 ms Calo | ||
| Lo schermo mostra tempi di risposta lenti nei nostri tests e sarà insoddisfacente per i gamers. In confronto, tutti i dispositivi di test variano da 0.165 (minimo) a 636 (massimo) ms. » 87 % di tutti i dispositivi è migliore. Questo significa che i tempi di risposta rilevati sono peggiori rispetto alla media di tutti i dispositivi testati (31 ms). | ||
Sfarfallio dello schermo / PWM (Pulse-Width Modulation)
| flickering dello schermo / PWM non rilevato | ||
In confronto: 52 % di tutti i dispositivi testati non utilizza PWM per ridurre la luminosita' del display. Se è rilevato PWM, una media di 7757 (minimo: 5 - massimo: 343500) Hz è stata rilevata. | ||
| Cinebench R15 | |
| CPU Single 64Bit | |
| HP Pavilion 17t-ab200 | |
| HP ProBook 450 G4 Y8B60EA | |
| Asus UX310UQ-FC396T | |
| Acer TravelMate P259-MG-71UU | |
| Lenovo ThinkPad E470-20H2S00400 | |
| Acer TravelMate P449-M-7407 | |
| Acer Spin 5 SP513-51 | |
| HP ProBook 440 G4 Z2Y47ES | |
| CPU Multi 64Bit | |
| HP Pavilion 17t-ab200 | |
| HP ProBook 450 G4 Y8B60EA | |
| Asus UX310UQ-FC396T | |
| Lenovo ThinkPad E470-20H2S00400 | |
| Acer TravelMate P259-MG-71UU | |
| Acer TravelMate P449-M-7407 | |
| HP ProBook 440 G4 Z2Y47ES | |
| Acer Spin 5 SP513-51 | |
| Cinebench R10 | |
| Rendering Multiple CPUs 32Bit | |
| Asus UX310UQ-FC396T | |
| Acer TravelMate P259-MG-71UU | |
| Acer TravelMate P449-M-7407 | |
| Rendering Single 32Bit | |
| Asus UX310UQ-FC396T | |
| Acer TravelMate P259-MG-71UU | |
| Acer TravelMate P449-M-7407 | |
| wPrime 2.10 - 1024m | |
| HP ProBook 440 G4 Z2Y47ES | |
| Acer TravelMate P449-M-7407 | |
| HP Pavilion 17t-ab200 | |
* ... Meglio usare valori piccoli
| PCMark 8 | |
| Home Score Accelerated v2 | |
| Acer TravelMate P259-MG-71UU | |
| Acer TravelMate P449-M-7407 | |
| Lenovo ThinkPad E470-20H2S00400 | |
| HP ProBook 450 G4 Y8B60EA | |
| Work Score Accelerated v2 | |
| HP ProBook 450 G4 Y8B60EA | |
| Acer TravelMate P259-MG-71UU | |
| Lenovo ThinkPad E470-20H2S00400 | |
| Acer TravelMate P449-M-7407 | |
| Creative Score Accelerated v2 | |
| Lenovo ThinkPad E470-20H2S00400 | |
| Acer TravelMate P449-M-7407 | |
| Acer TravelMate P259-MG-71UU | |
| PCMark 7 Score | 5504 punti | |
| PCMark 8 Home Score Accelerated v2 | 3648 punti | |
| PCMark 8 Creative Score Accelerated v2 | 4350 punti | |
| PCMark 8 Work Score Accelerated v2 | 4511 punti | |
Aiuto | ||
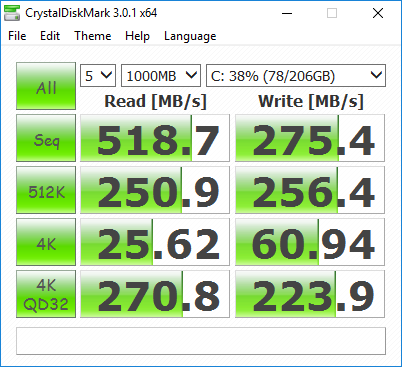
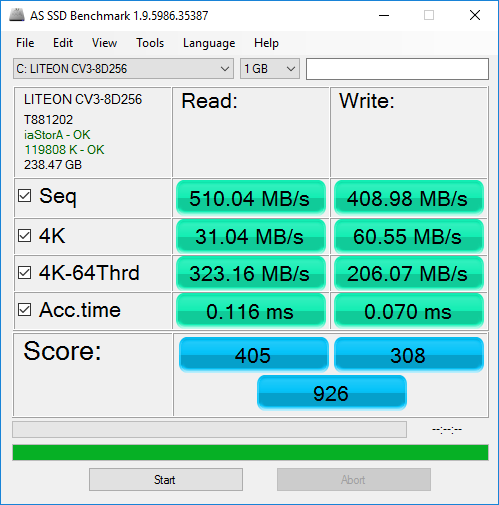
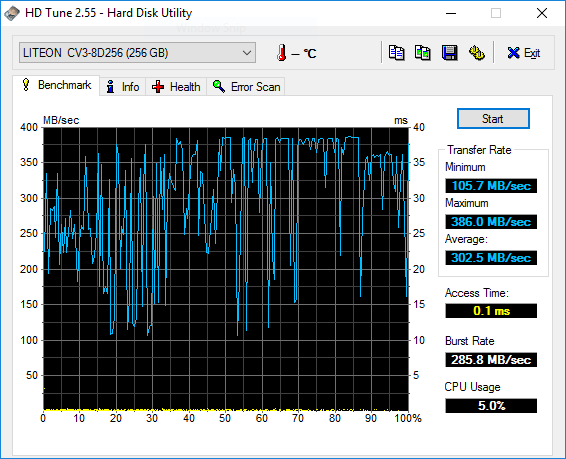
| Acer TravelMate P449-M-7407 Liteonit CV3-8D256 | Acer TravelMate P259-MG-71UU Liteonit CV3-8D256 | Lenovo ThinkPad E470-20H2S00400 SanDisk X400 SED 256GB, SATA (SD8TB8U-256G) | Asus Zenbook UX310UA-FC347T iGP Micron SSD 1100 (MTFDDAV256TBN) | HP Spectre x360 15-bl002xx Toshiba XG4 NVMe (THNSN5512GPUK) | |
|---|---|---|---|---|---|
| CrystalDiskMark 3.0 | 8% | 20% | 25% | 146% | |
| Read Seq (MB/s) | 519 | 478.5 -8% | 476.5 -8% | 489.4 -6% | 1266 144% |
| Write Seq (MB/s) | 275.4 | 258.2 -6% | 458.7 67% | 431.6 57% | 982 257% |
| Read 512 (MB/s) | 250.9 | 254.3 1% | 346.4 38% | 356.7 42% | 834 232% |
| Write 512 (MB/s) | 256.4 | 264.8 3% | 291.1 14% | 389.1 52% | 714 178% |
| Read 4k (MB/s) | 25.6 | 28.32 11% | 35.15 37% | 26.68 4% | 40.72 59% |
| Write 4k (MB/s) | 60.9 | 76.3 25% | 78.8 29% | 88.7 46% | 139.4 129% |
| Read 4k QD32 (MB/s) | 270.8 | 346.2 28% | 276 2% | 246.3 -9% | 527 95% |
| Write 4k QD32 (MB/s) | 223.9 | 240.2 7% | 178.3 -20% | 251.5 12% | 395.2 77% |

| 3DMark 11 Performance | 1578 punti | |
| 3DMark Ice Storm Standard Score | 55532 punti | |
| 3DMark Cloud Gate Standard Score | 5590 punti | |
| 3DMark Fire Strike Score | 722 punti | |
Aiuto | ||
Rumorosità
| Idle |
| 29.2 / 29.2 / 31.2 dB(A) |
| Sotto carico |
| 35.6 / 40.8 dB(A) |
 | ||
30 dB silenzioso 40 dB(A) udibile 50 dB(A) rumoroso |
||
min: | ||
| Acer TravelMate P449-M-7407 HD Graphics 520, 6500U, Liteonit CV3-8D256 | Acer TravelMate P259-MG-71UU GeForce 940MX, 6500U, Liteonit CV3-8D256 | HP ProBook 450 G4 Y8B60EA GeForce 930MX, i7-7500U, SanDisk SD8SNAT256G1002 | Lenovo ThinkPad E470-20H2S00400 GeForce 940MX, i5-7200U, SanDisk X400 SED 256GB, SATA (SD8TB8U-256G) | Asus Zenbook UX310UQ-GL011T GeForce 940MX, 6500U, SanDisk SD8SNAT256G1002 | |
|---|---|---|---|---|---|
| Noise | -3% | -7% | 3% | -2% | |
| off /ambiente * (dB) | 29.2 | 30.5 -4% | 31.6 -8% | 29 1% | 30.5 -4% |
| Idle Minimum * (dB) | 29.2 | 31.6 -8% | 32.6 -12% | 29 1% | 30.5 -4% |
| Idle Average * (dB) | 29.2 | 31.6 -8% | 32.6 -12% | 29 1% | 30.5 -4% |
| Idle Maximum * (dB) | 31.2 | 32 -3% | 33 -6% | 29 7% | 31.5 -1% |
| Load Average * (dB) | 35.6 | 35.5 -0% | 38.9 -9% | 35.6 -0% | 36.2 -2% |
| Load Maximum * (dB) | 40.8 | 38.3 6% | 38.9 5% | 38.5 6% | 40 2% |
* ... Meglio usare valori piccoli
(+) La temperatura massima sul lato superiore è di 35.2 °C / 95 F, rispetto alla media di 34.3 °C / 94 F, che varia da 21.2 a 62.5 °C per questa classe Office.
(+) Il lato inferiore si riscalda fino ad un massimo di 37 °C / 99 F, rispetto alla media di 36.8 °C / 98 F
(+) In idle, la temperatura media del lato superiore è di 22.6 °C / 73 F, rispetto alla media deld ispositivo di 29.5 °C / 85 F.
(+) I poggiapolsi e il touchpad sono piu' freddi della temperatura della pelle con un massimo di 21.8 °C / 71.2 F e sono quindi freddi al tatto.
(+) La temperatura media della zona del palmo della mano di dispositivi simili e'stata di 27.5 °C / 81.5 F (+5.7 °C / 10.3 F).
Acer TravelMate P449-M-7407 analisi audio
(±) | potenza degli altiparlanti media ma buona (78.9 dB)
Bassi 100 - 315 Hz
(-) | quasi nessun basso - in media 18.2% inferiori alla media
(±) | la linearità dei bassi è media (14% delta rispetto alla precedente frequenza)
Medi 400 - 2000 Hz
(+) | medi bilanciati - solo only 4.1% rispetto alla media
(±) | linearità dei medi adeguata (10.1% delta rispetto alla precedente frequenza)
Alti 2 - 16 kHz
(±) | alti elevati - circa 5.6% superiori alla media
(±) | la linearità degli alti è media (10.5% delta rispetto alla precedente frequenza)
Nel complesso 100 - 16.000 Hz
(±) | la linearità complessiva del suono è media (23.8% di differenza rispetto alla media
Rispetto alla stessa classe
» 68% di tutti i dispositivi testati in questa classe è stato migliore, 8% simile, 23% peggiore
» Il migliore ha avuto un delta di 7%, medio di 21%, peggiore di 53%
Rispetto a tutti i dispositivi testati
» 71% di tutti i dispositivi testati in questa classe è stato migliore, 6% similare, 22% peggiore
» Il migliore ha avuto un delta di 4%, medio di 23%, peggiore di 134%
Lenovo ThinkPad E470-20H2S00400 analisi audio
(+) | gli altoparlanti sono relativamente potenti (84.8 dB)
Bassi 100 - 315 Hz
(-) | quasi nessun basso - in media 15.7% inferiori alla media
(±) | la linearità dei bassi è media (11.2% delta rispetto alla precedente frequenza)
Medi 400 - 2000 Hz
(±) | medi elevati - circa 9% superiore alla media
(±) | linearità dei medi adeguata (11.1% delta rispetto alla precedente frequenza)
Alti 2 - 16 kHz
(±) | alti elevati - circa 5.1% superiori alla media
(±) | la linearità degli alti è media (10.5% delta rispetto alla precedente frequenza)
Nel complesso 100 - 16.000 Hz
(±) | la linearità complessiva del suono è media (23.8% di differenza rispetto alla media
Rispetto alla stessa classe
» 68% di tutti i dispositivi testati in questa classe è stato migliore, 8% simile, 23% peggiore
» Il migliore ha avuto un delta di 7%, medio di 21%, peggiore di 53%
Rispetto a tutti i dispositivi testati
» 71% di tutti i dispositivi testati in questa classe è stato migliore, 6% similare, 22% peggiore
» Il migliore ha avuto un delta di 4%, medio di 23%, peggiore di 134%
| Off / Standby | |
| Idle | |
| Sotto carico |
|
Leggenda:
min: | |
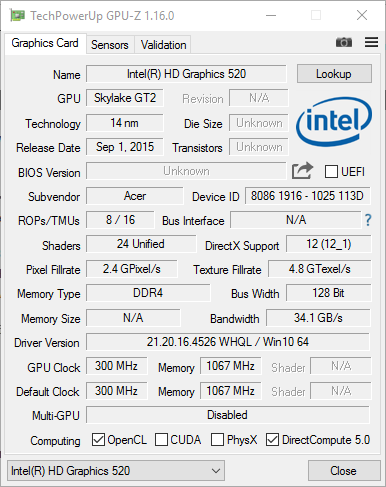
| Acer TravelMate P449-M-7407 6500U, HD Graphics 520, Liteonit CV3-8D256, IPS, 1920x1080, 14" | Acer TravelMate P259-MG-71UU 6500U, GeForce 940MX, Liteonit CV3-8D256, TN LED, 1920x1080, 15.6" | HP ProBook 450 G4 Y8B60EA i7-7500U, GeForce 930MX, SanDisk SD8SNAT256G1002, TN LED, 1920x1080, 15.6" | Lenovo ThinkPad E470-20H2S00400 i5-7200U, GeForce 940MX, SanDisk X400 SED 256GB, SATA (SD8TB8U-256G), IPS, 1920x1080, 14" | Asus Zenbook UX310UQ-GL011T 6500U, GeForce 940MX, SanDisk SD8SNAT256G1002, TN LED, 1920x1080, 13.3" | |
|---|---|---|---|---|---|
| Power Consumption | -62% | -34% | -27% | -32% | |
| Idle Minimum * (Watt) | 3.4 | 7 -106% | 3.8 -12% | 2.7 21% | 3 12% |
| Idle Average * (Watt) | 5.2 | 8 -54% | 6.6 -27% | 5.5 -6% | 5.6 -8% |
| Idle Maximum * (Watt) | 7.2 | 10.6 -47% | 11.3 -57% | 6.5 10% | 6.8 6% |
| Load Average * (Watt) | 28.2 | 39.7 -41% | 38 -35% | 44.2 -57% | 48.7 -73% |
| Load Maximum * (Watt) | 32 | 51.9 -62% | 45 -41% | 65.2 -104% | 63 -97% |
* ... Meglio usare valori piccoli
| Acer TravelMate P449-M-7407 6500U, HD Graphics 520, 48.3 Wh | Acer TravelMate P259-MG-71UU 6500U, GeForce 940MX, 41 Wh | HP ProBook 450 G4 Y8B60EA i7-7500U, GeForce 930MX, 45 Wh | Lenovo ThinkPad E470-20H2S00400 i5-7200U, GeForce 940MX, 45 Wh | Asus Zenbook UX310UQ-GL011T 6500U, GeForce 940MX, 48 Wh | |
|---|---|---|---|---|---|
| Autonomia della batteria | -26% | 21% | 27% | 19% | |
| Reader / Idle (h) | 9.4 | 10.3 10% | 12.4 32% | 17.4 85% | 14.6 55% |
| WiFi v1.3 (h) | 8.5 | 4.7 -45% | 8.6 1% | 5.4 -36% | 8.1 -5% |
| Load (h) | 1.6 | 0.9 -44% | 2.1 31% | 2.1 31% | 1.7 6% |
Pro
Contro
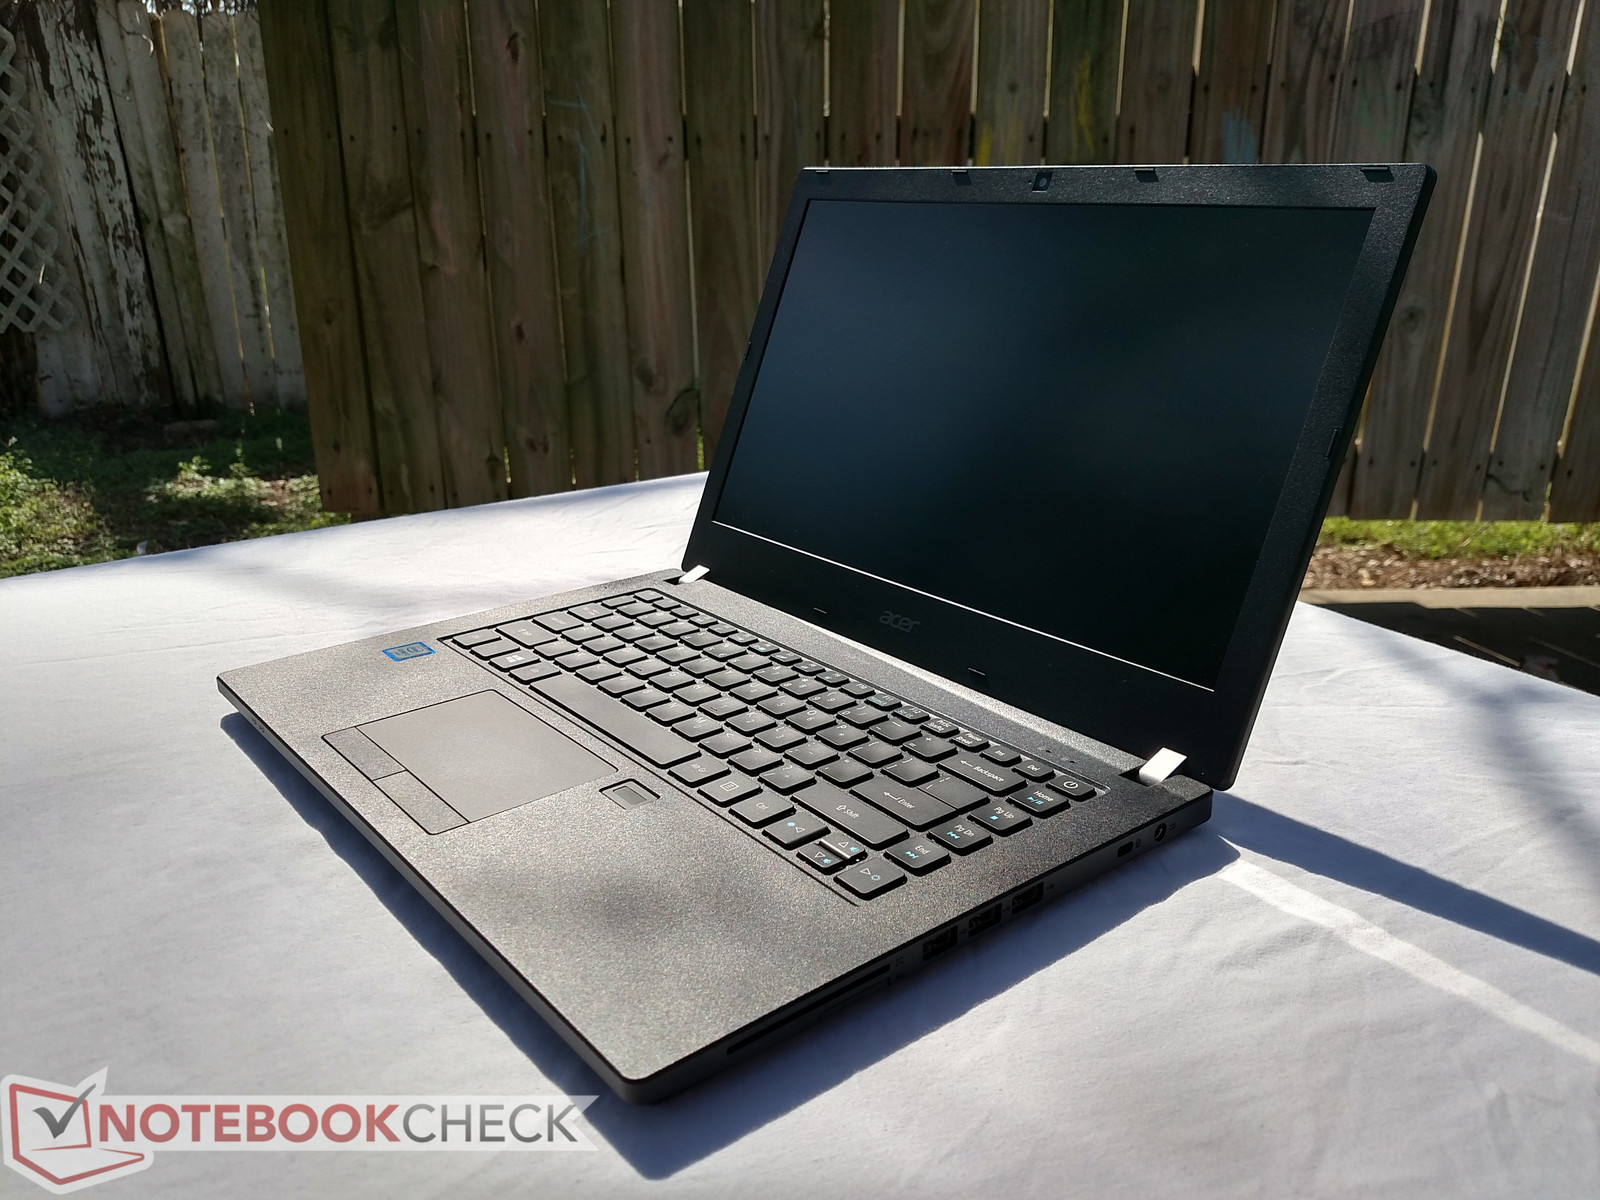
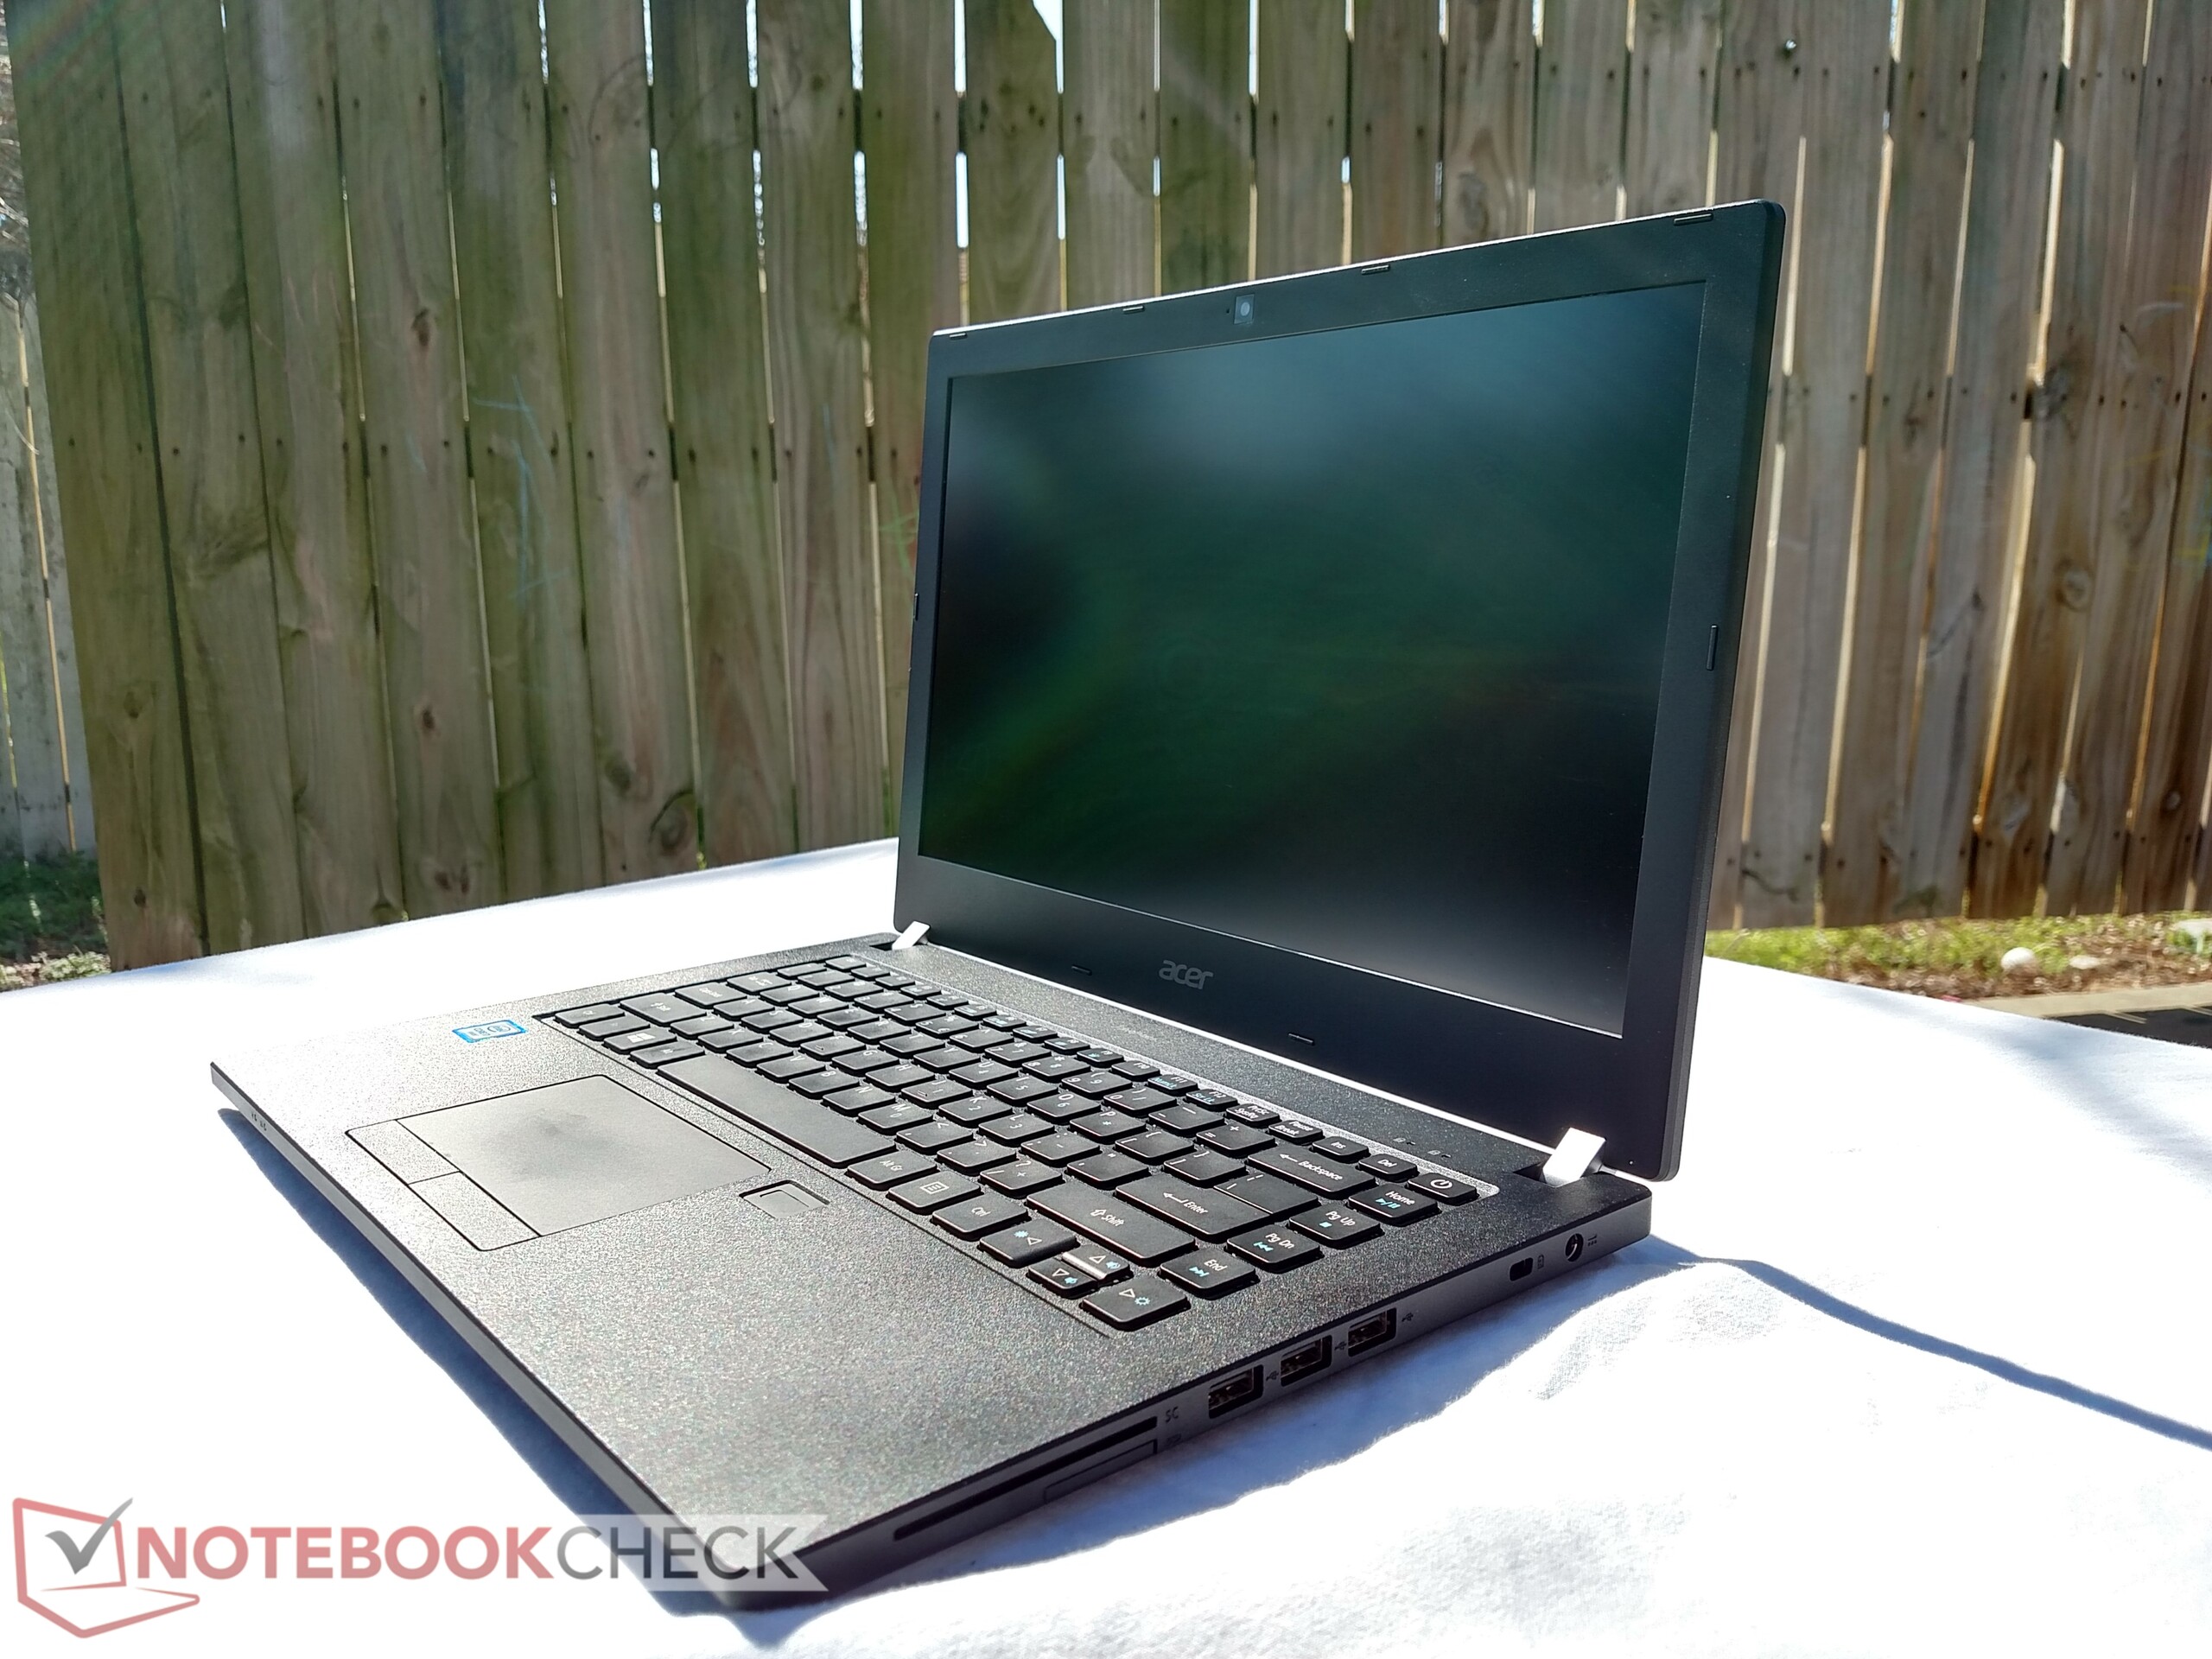
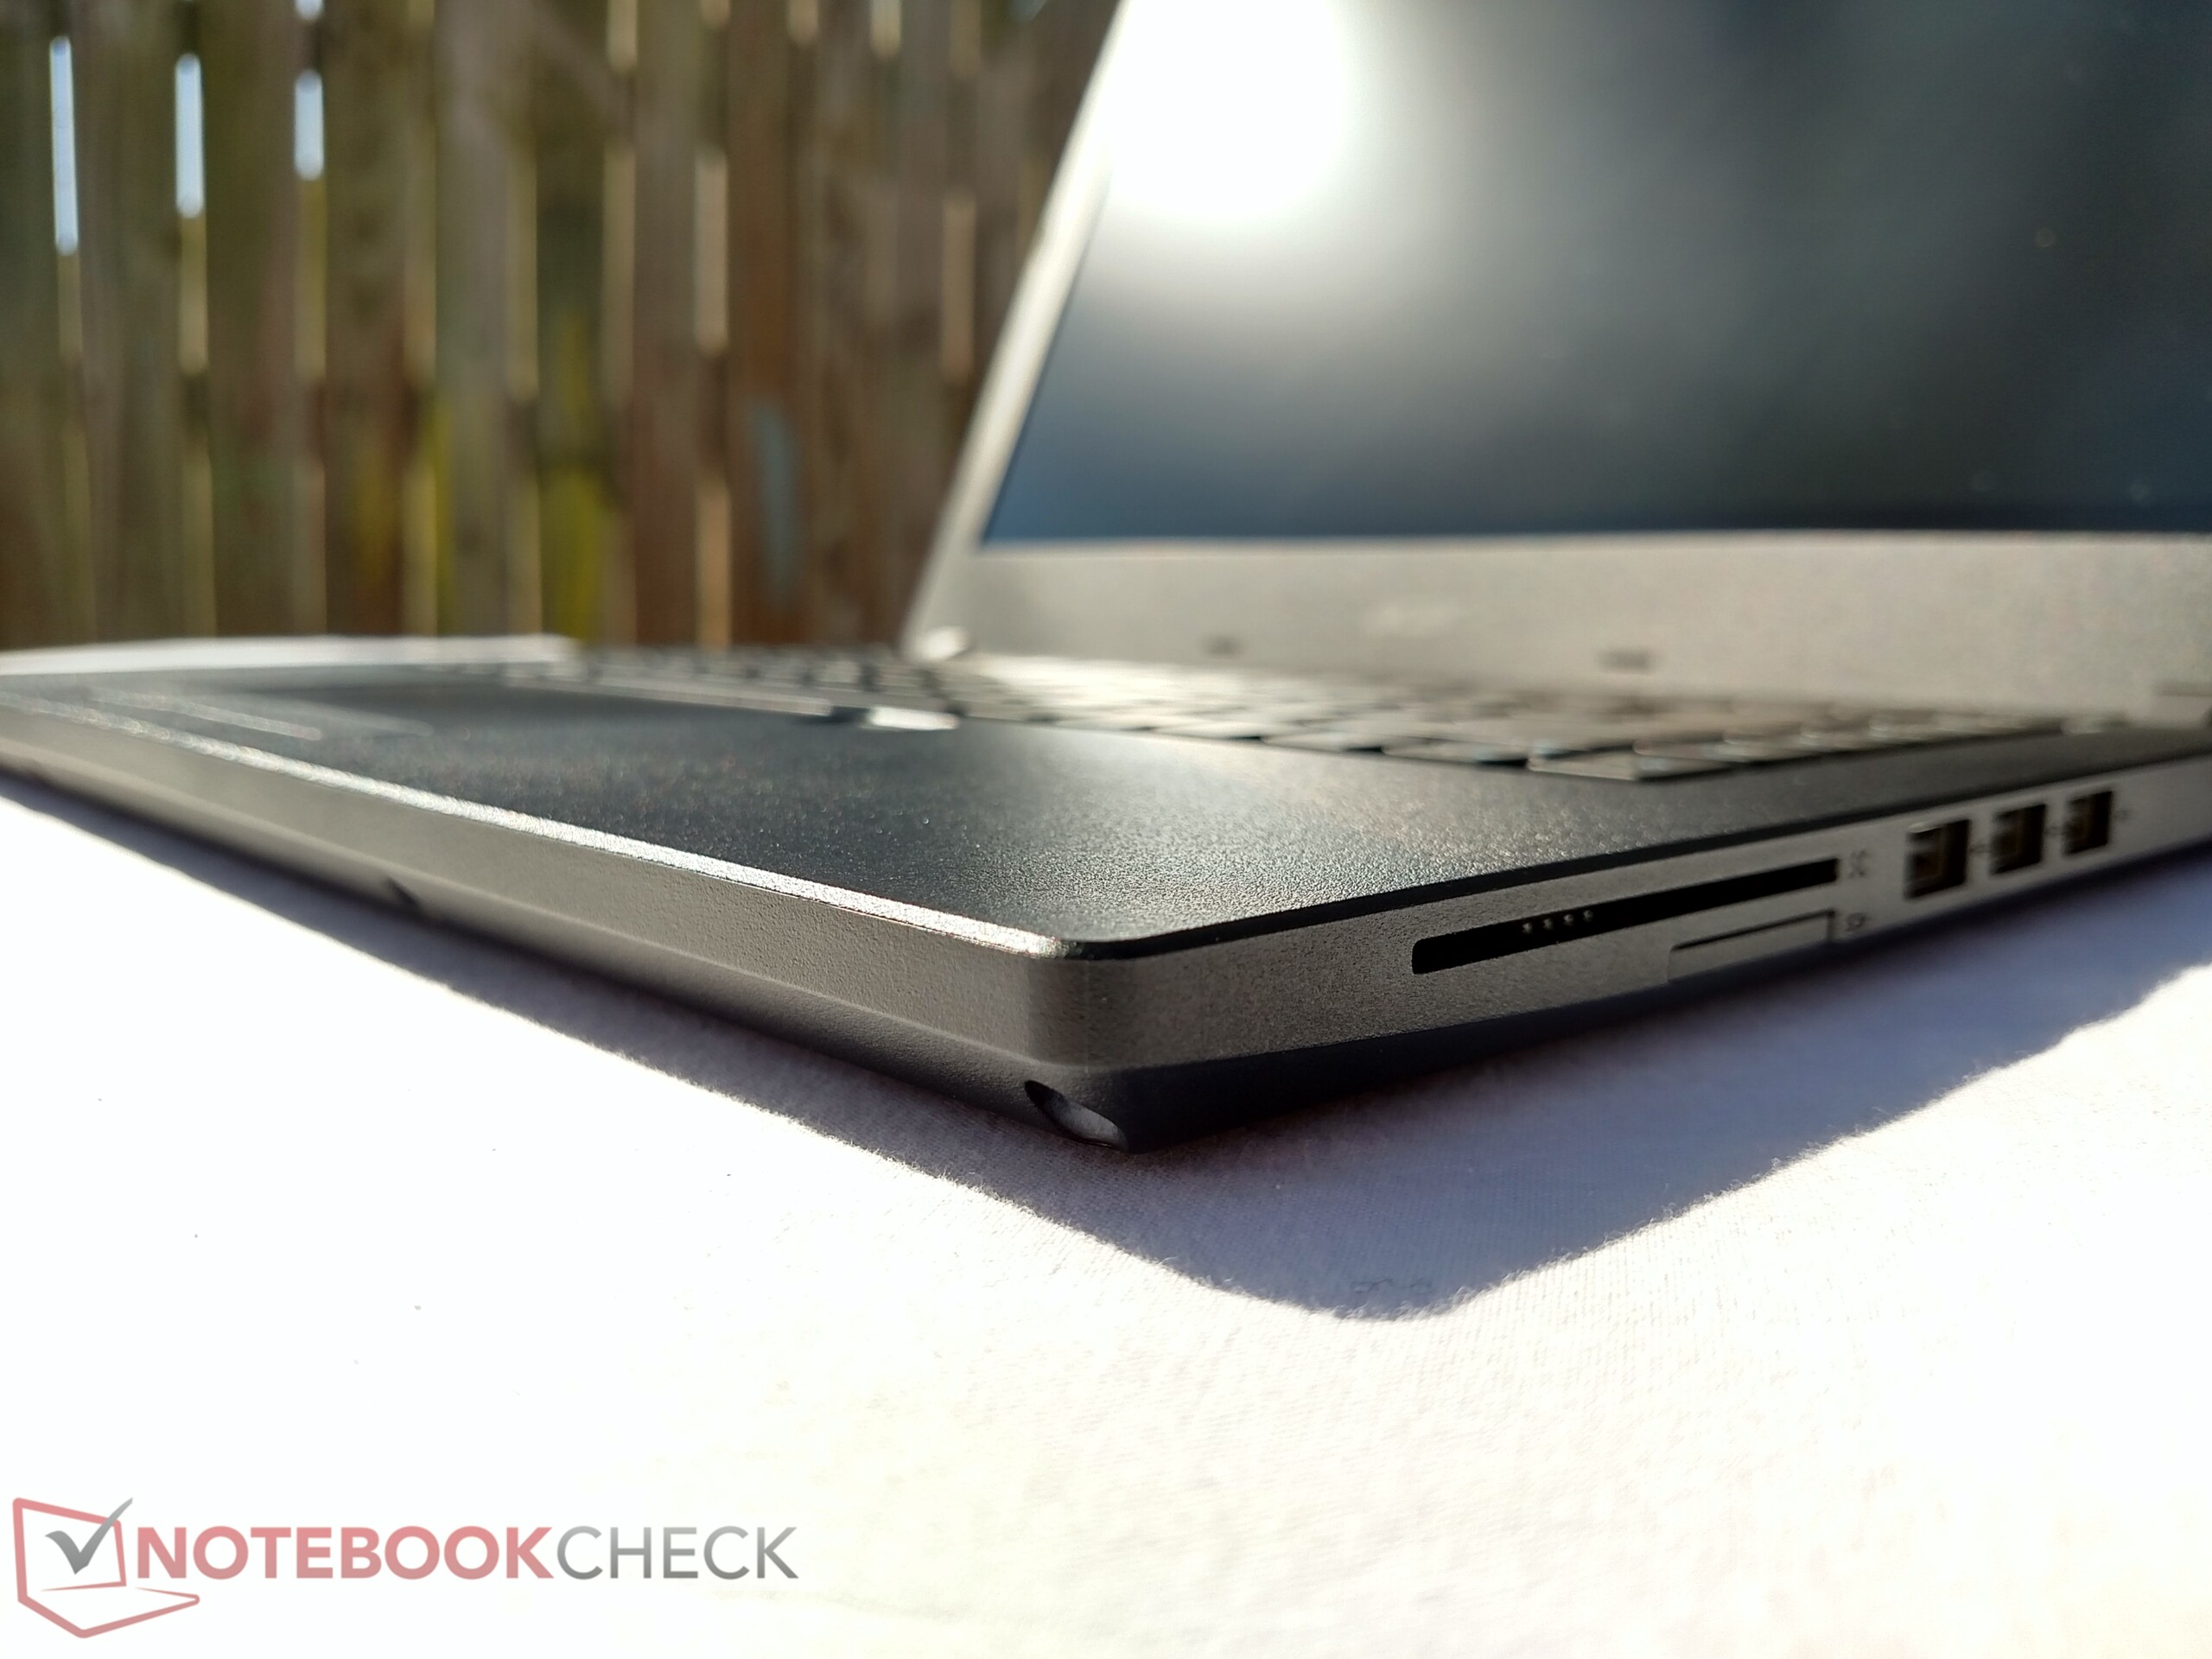
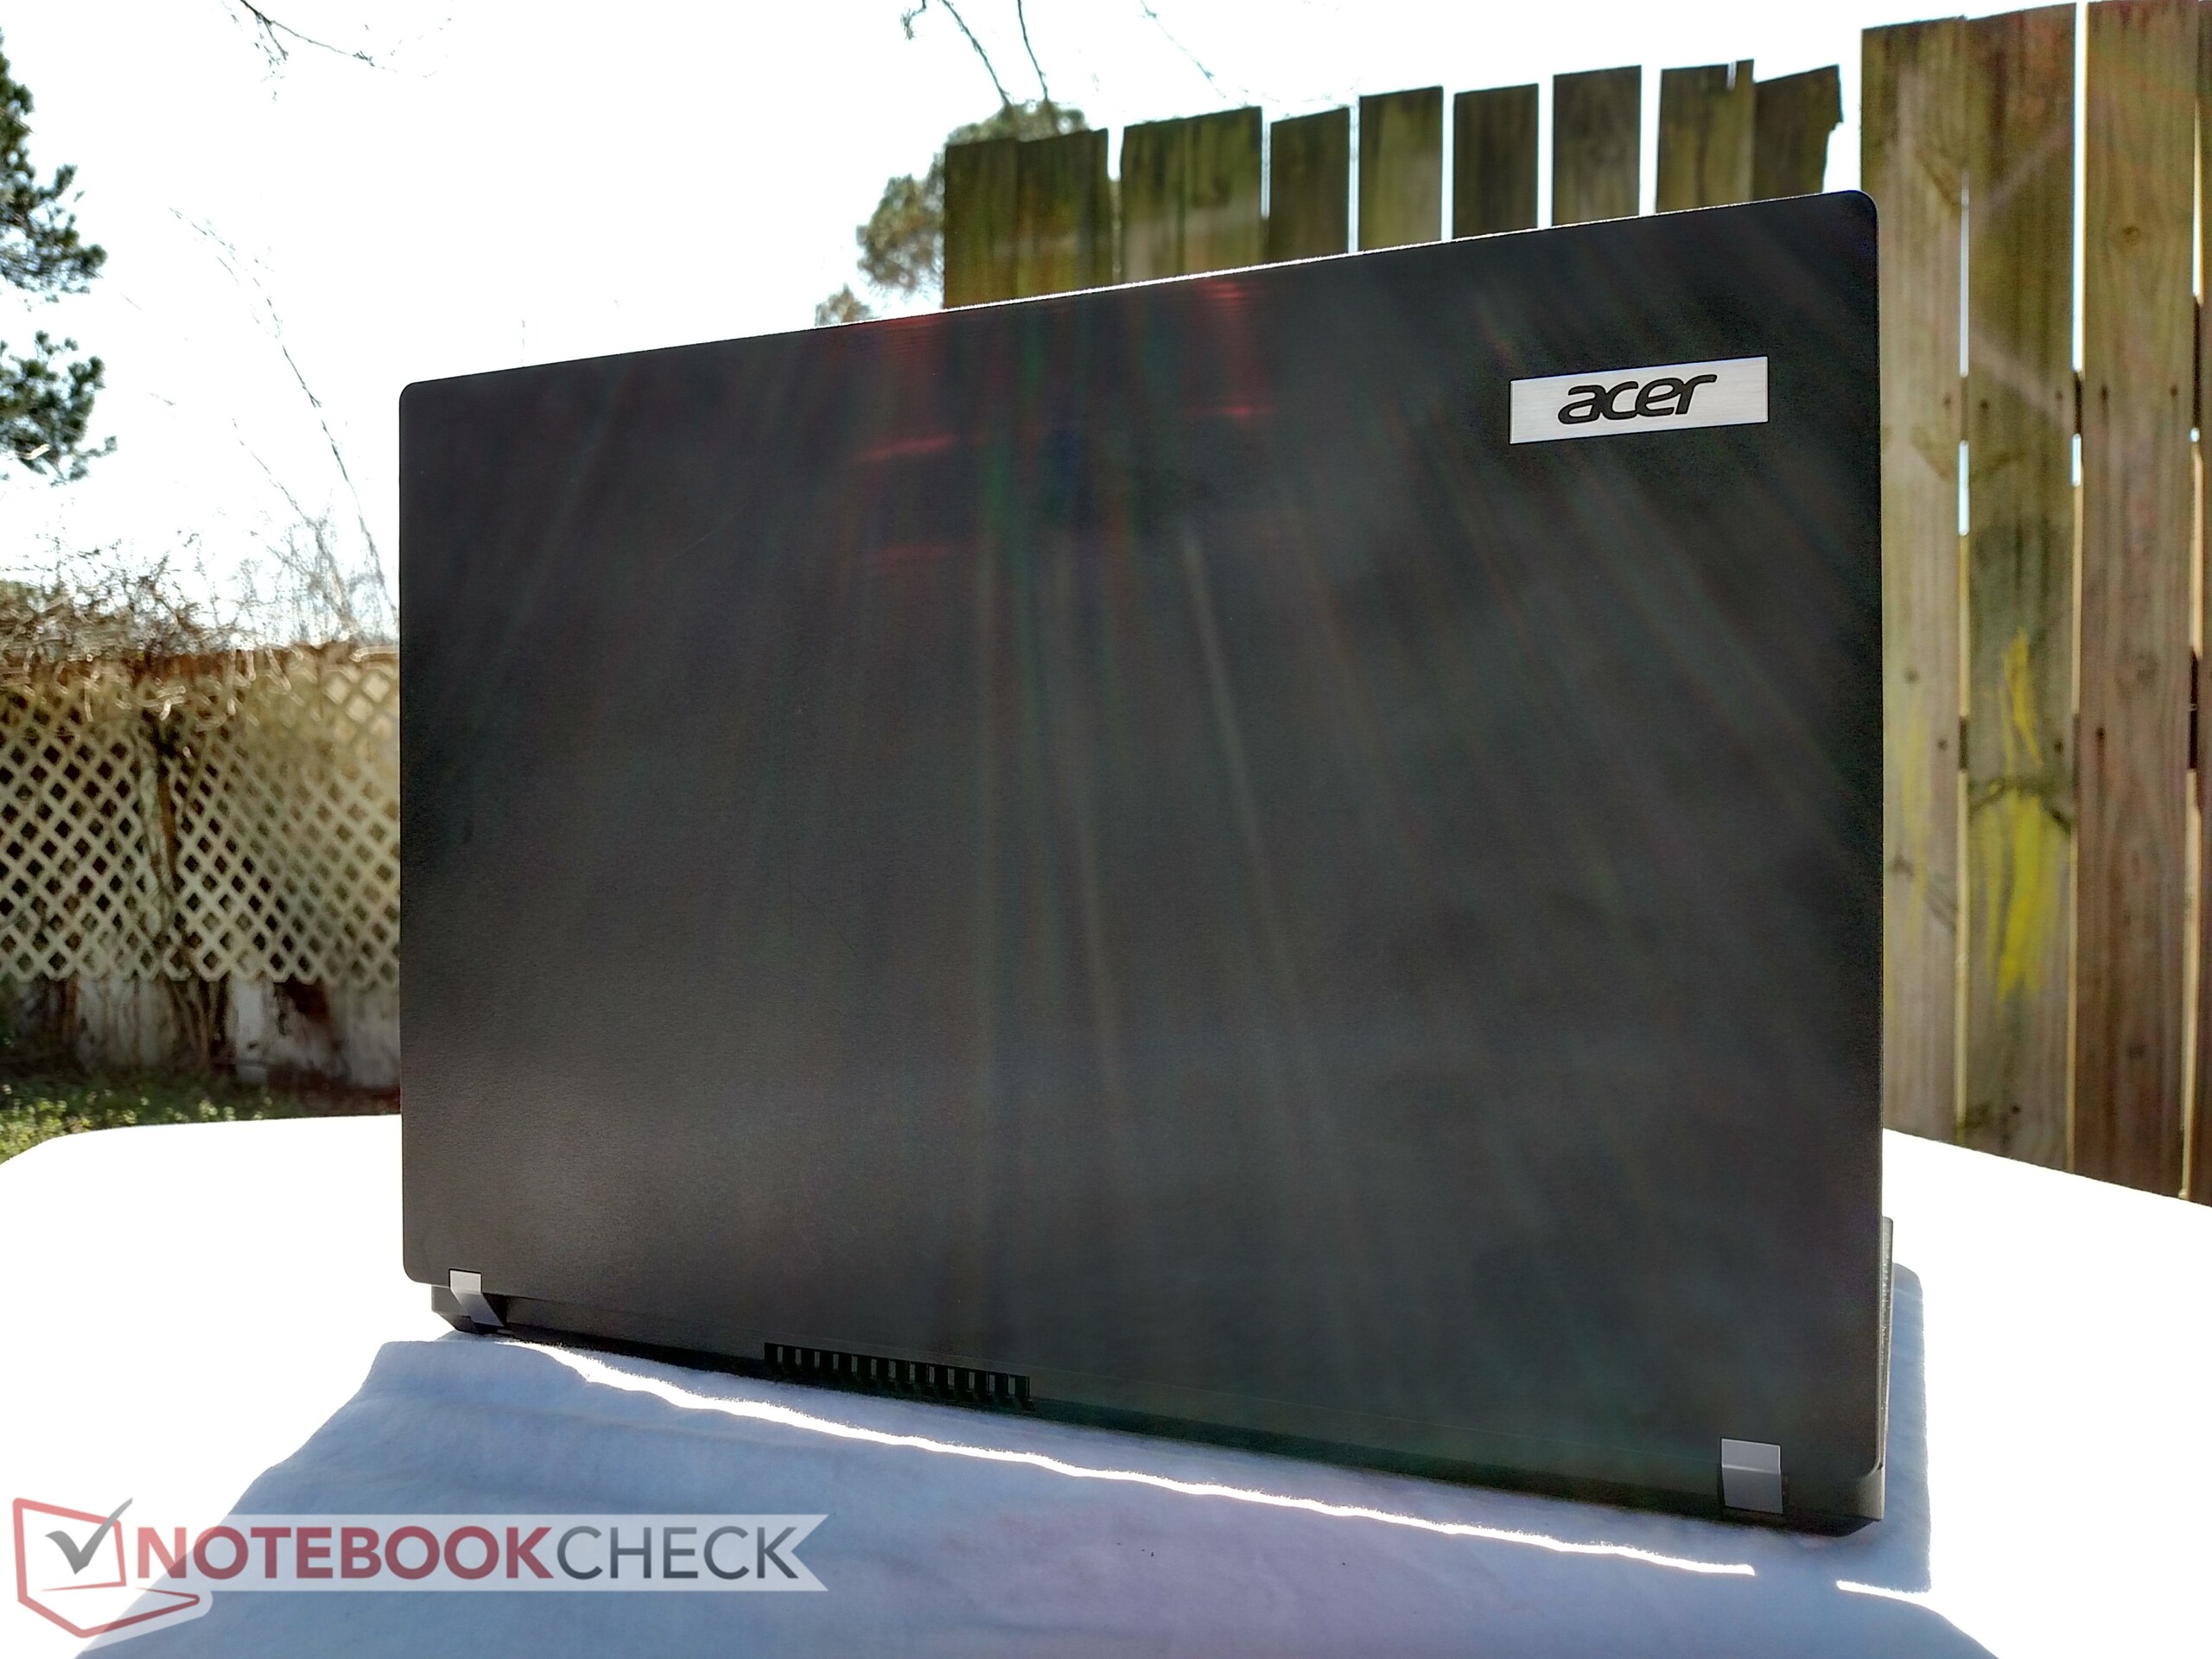
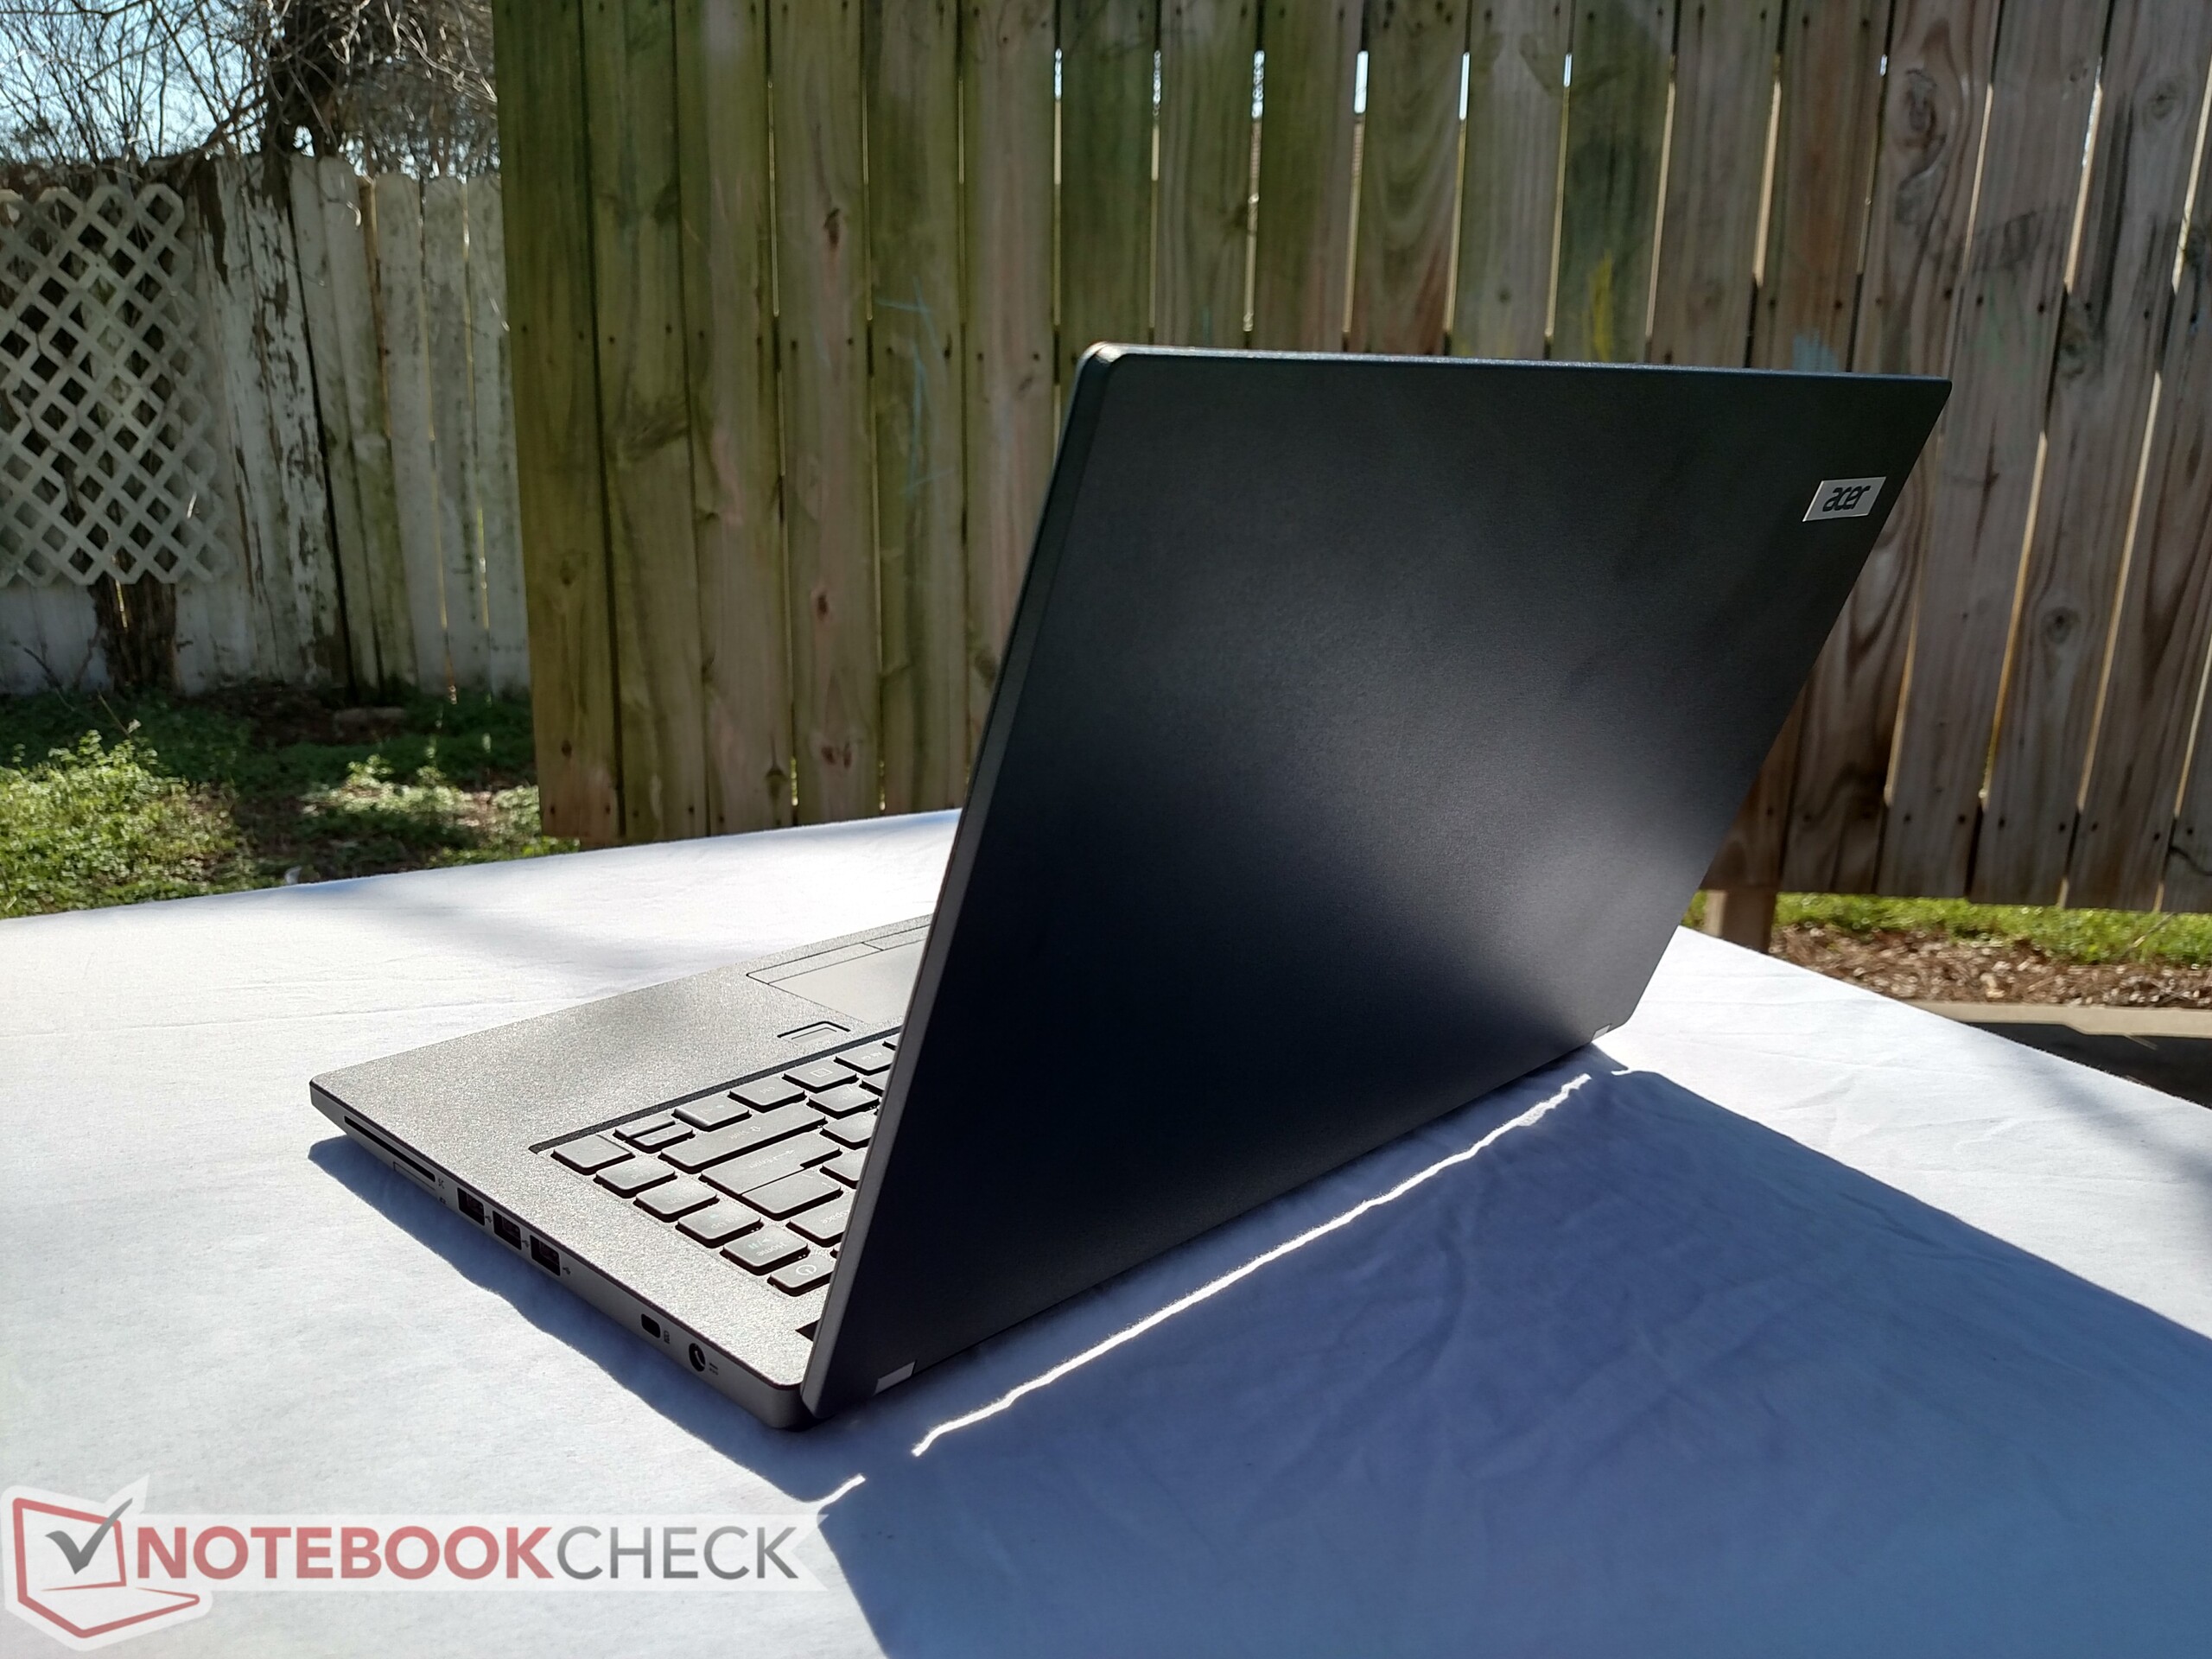
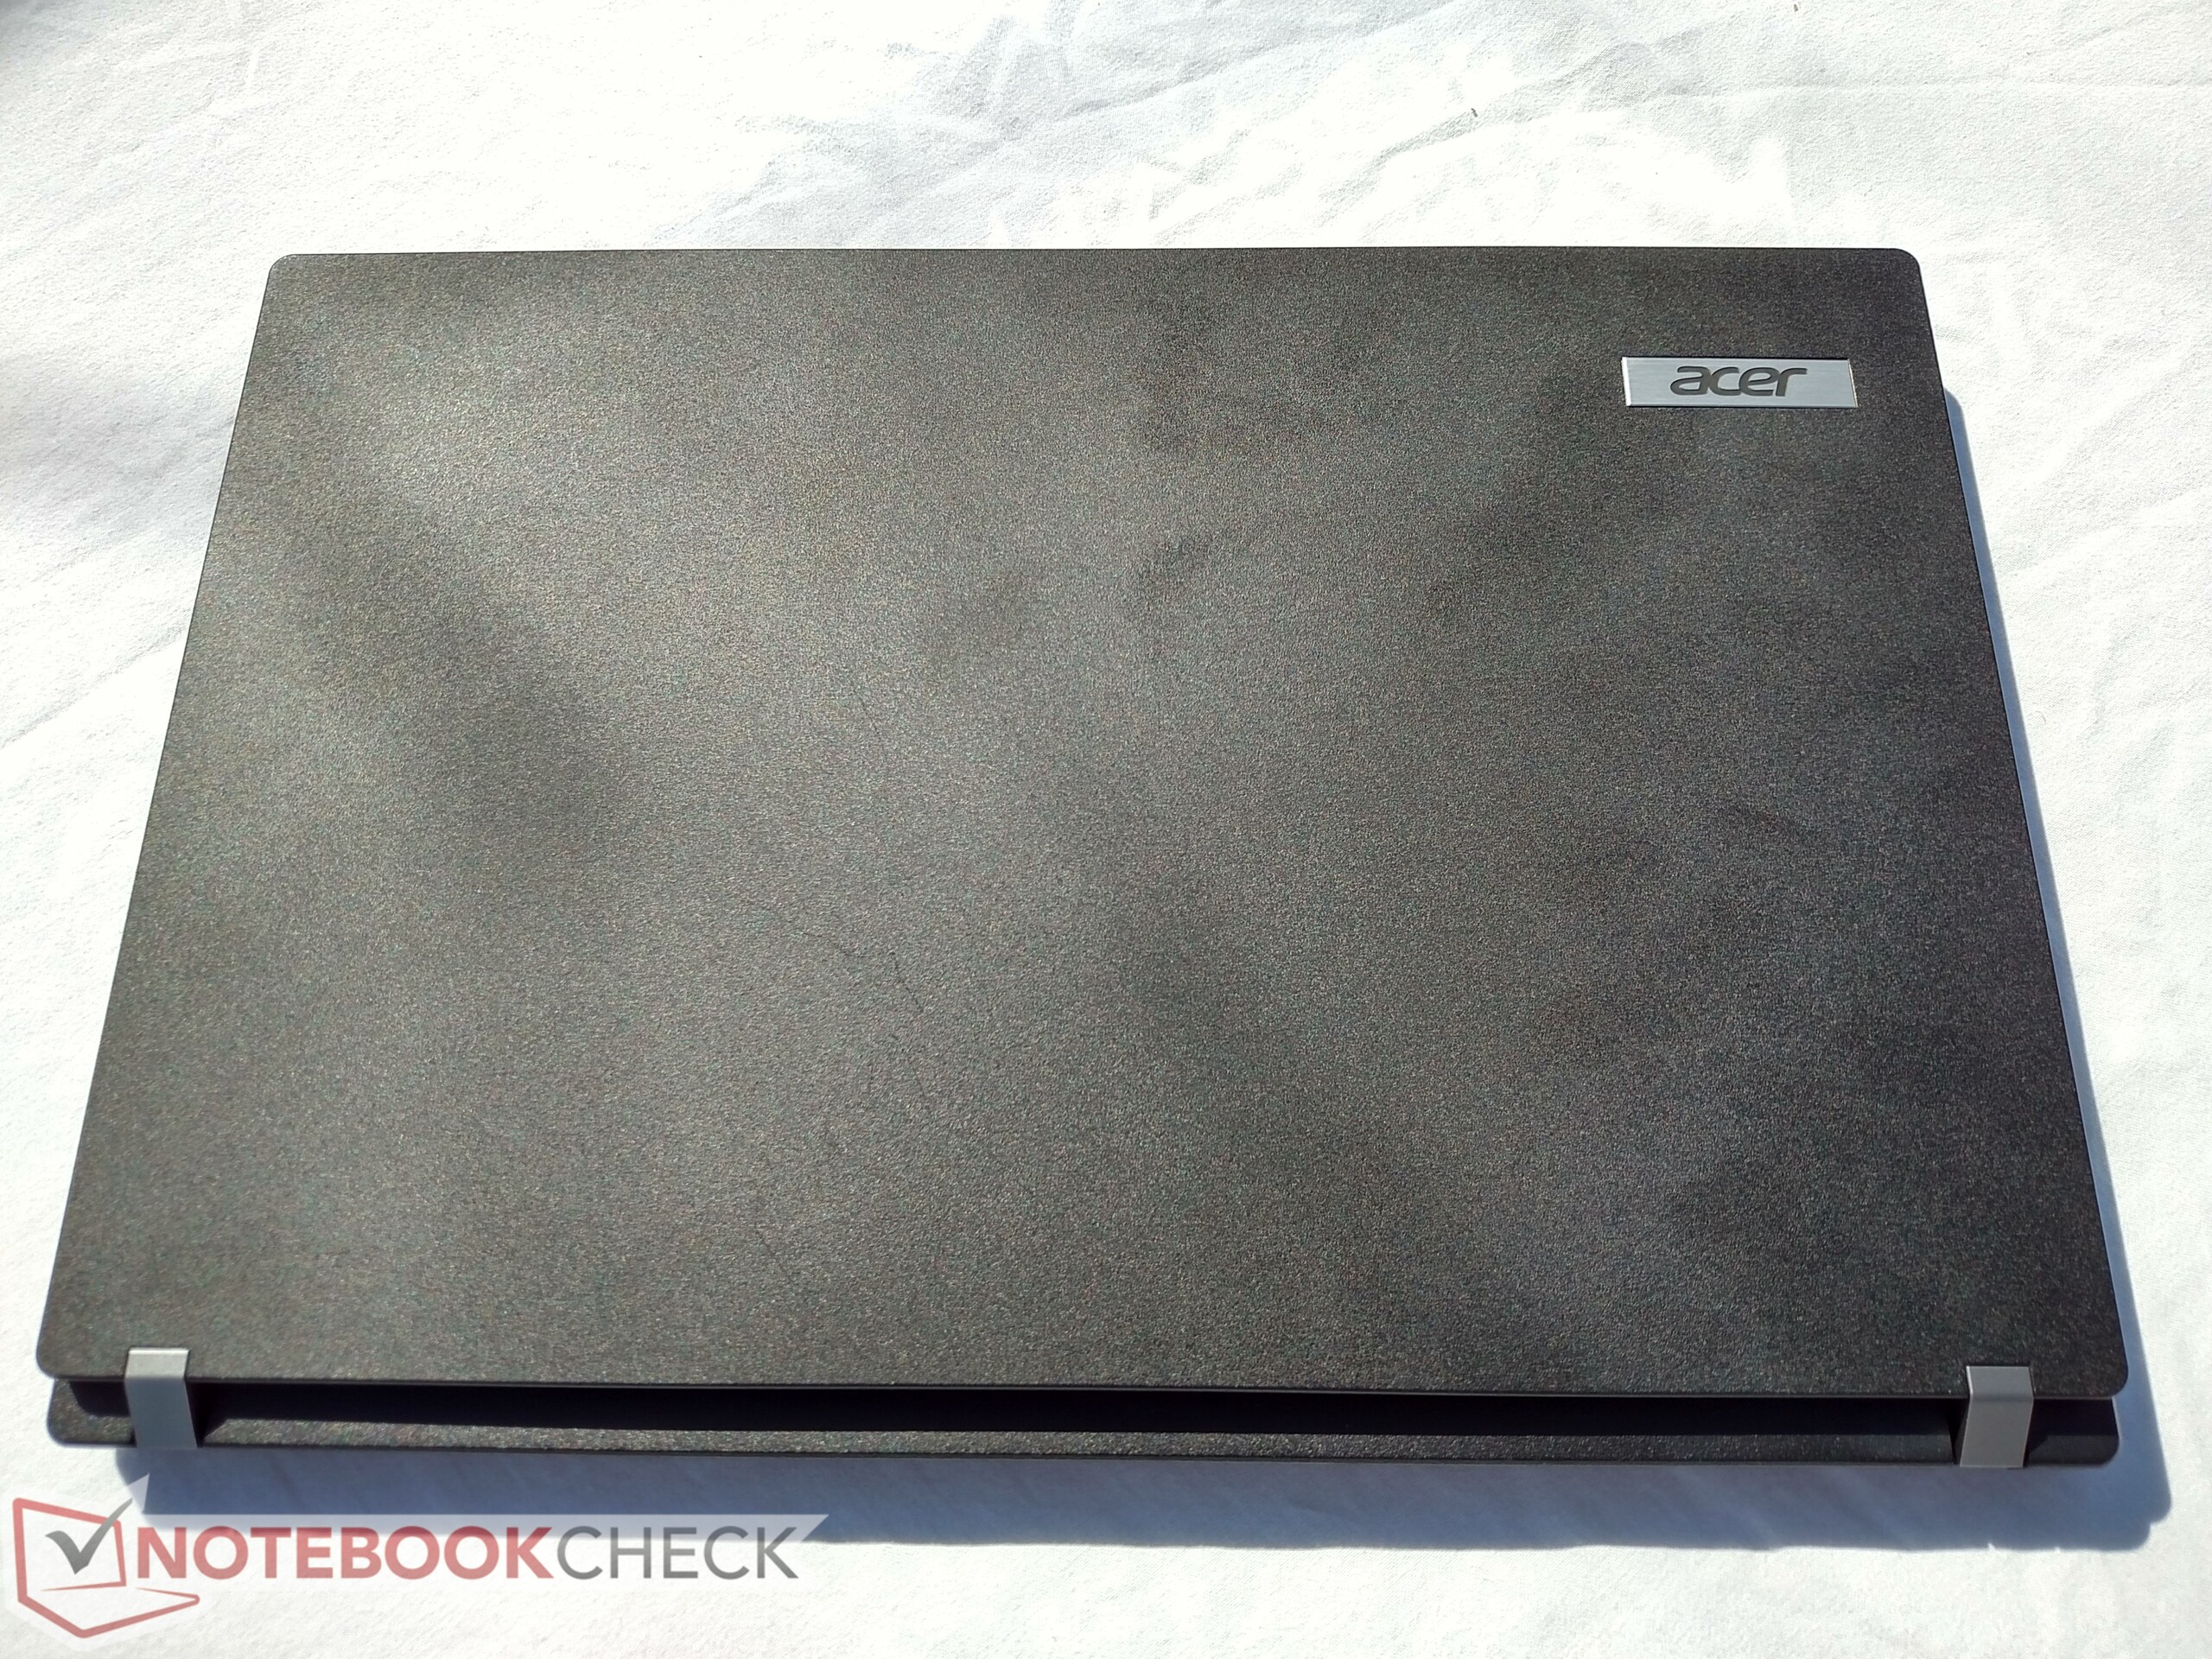
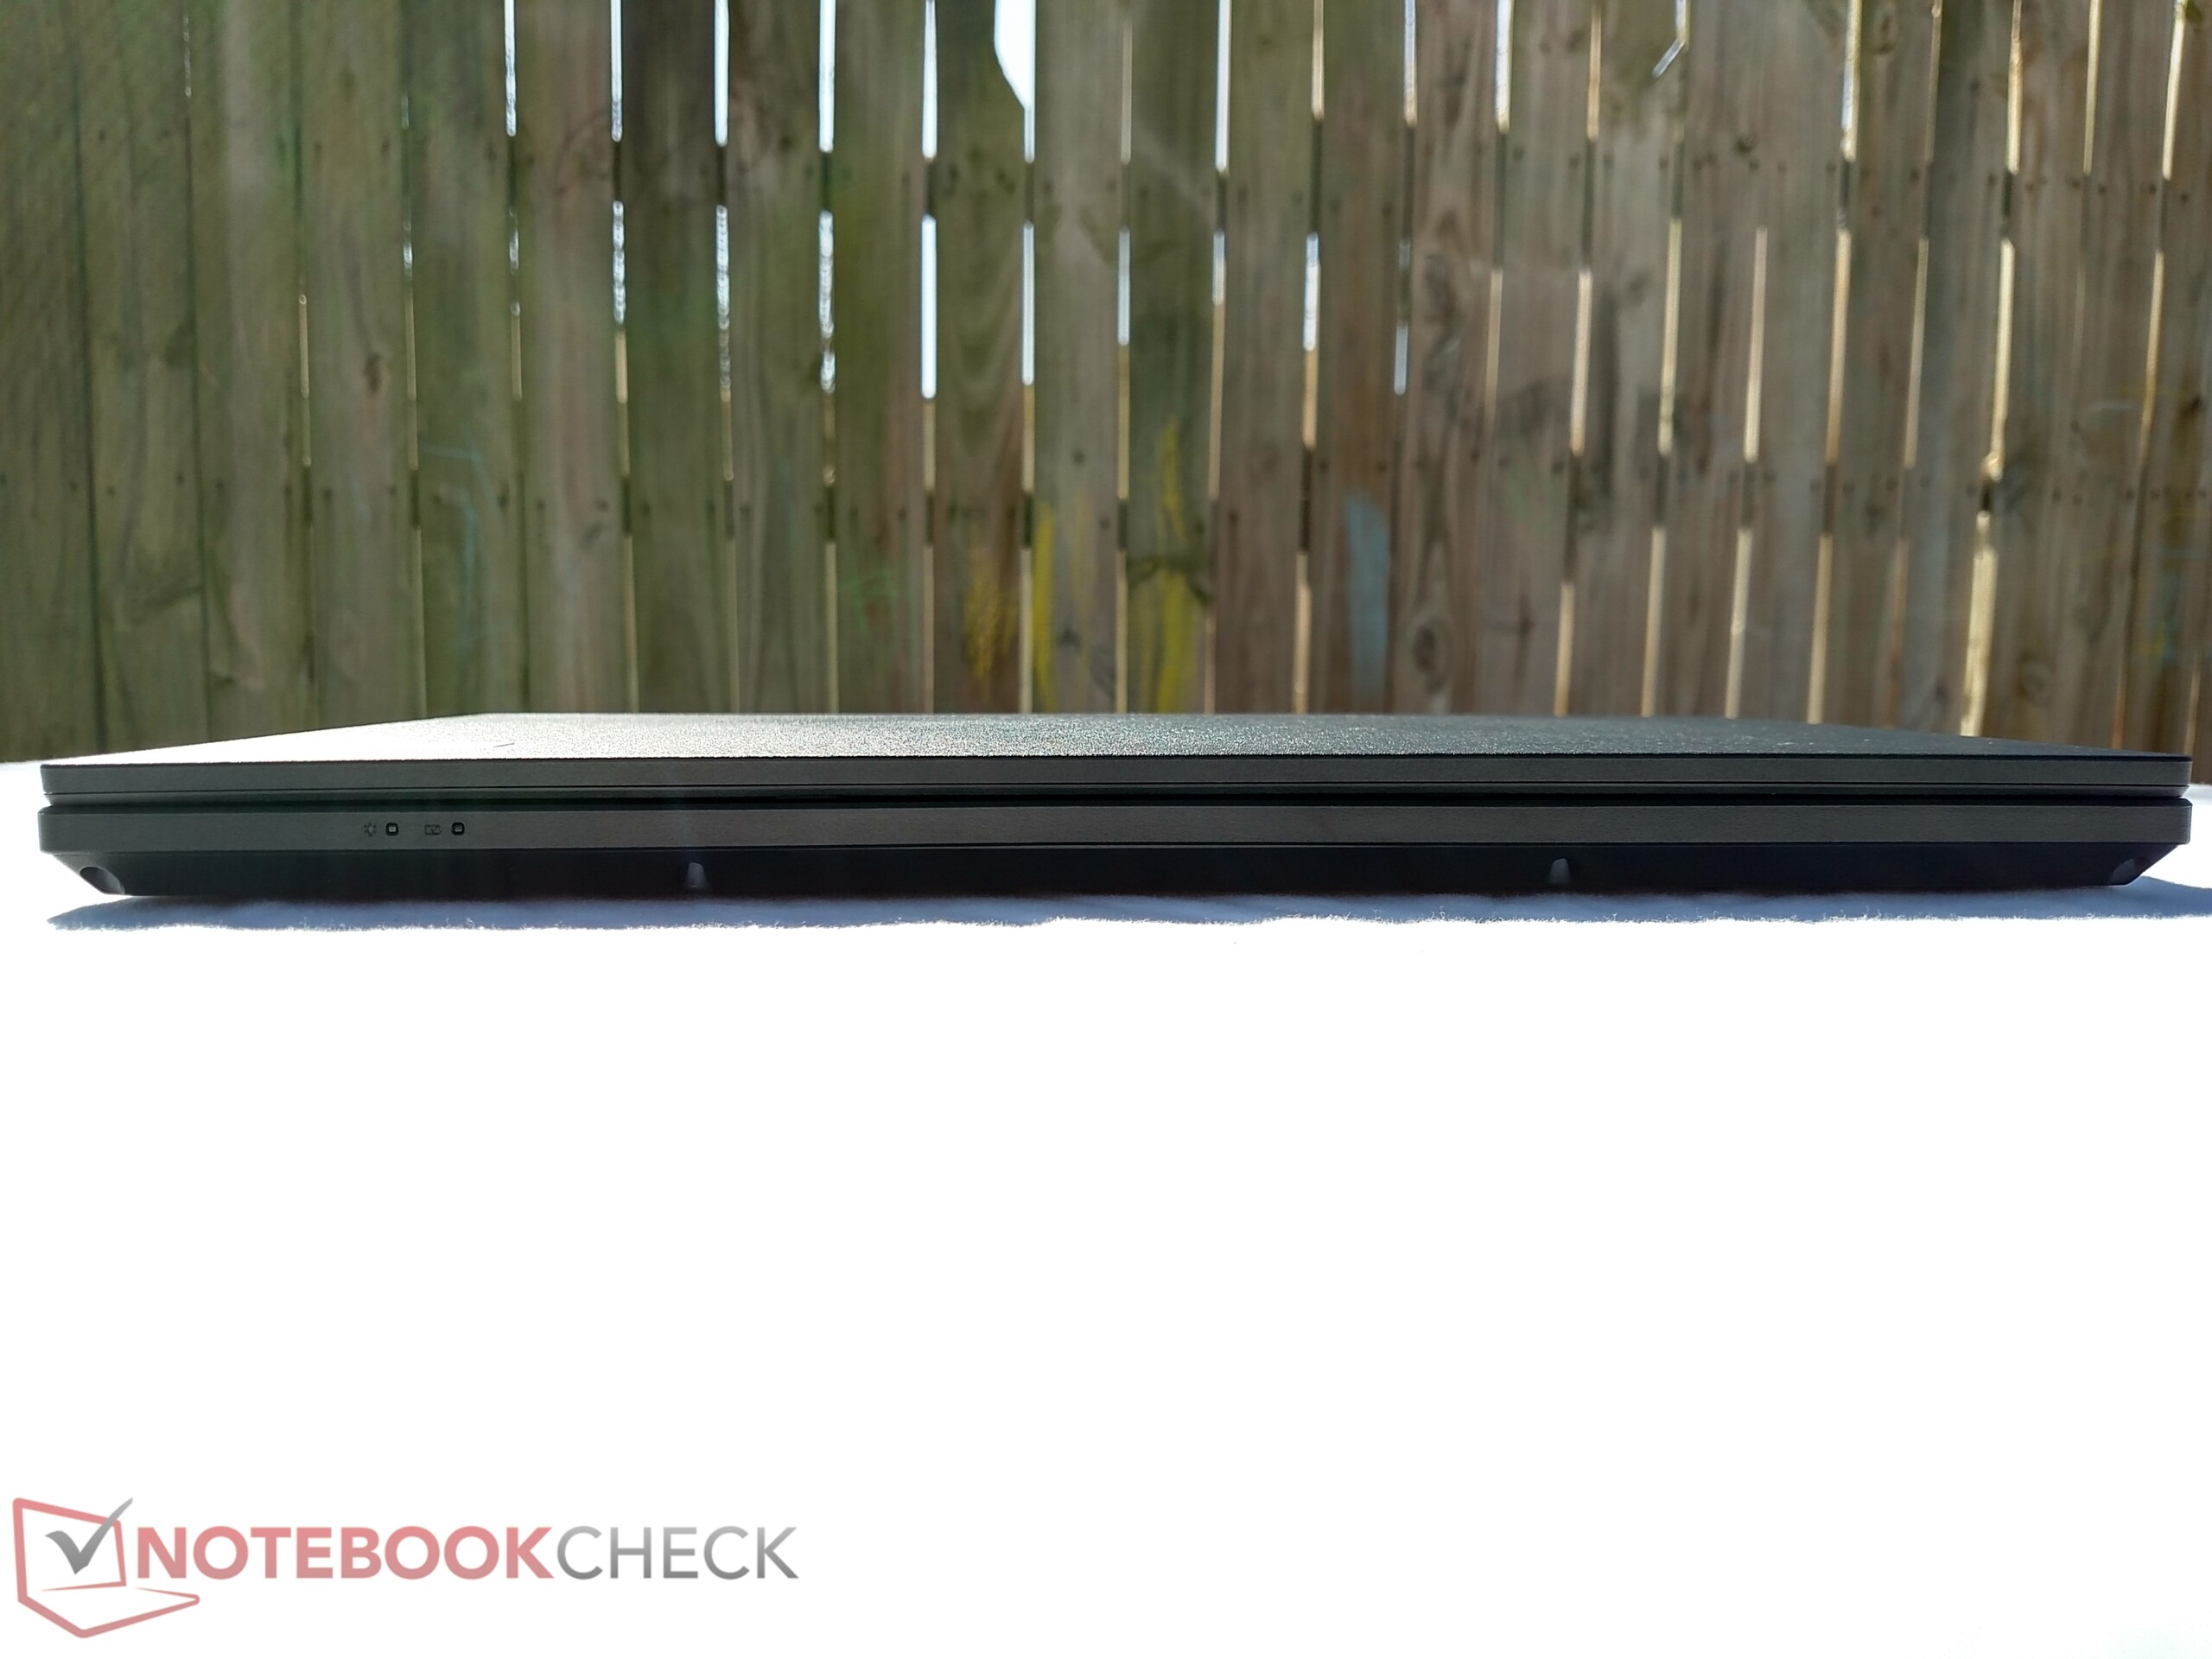
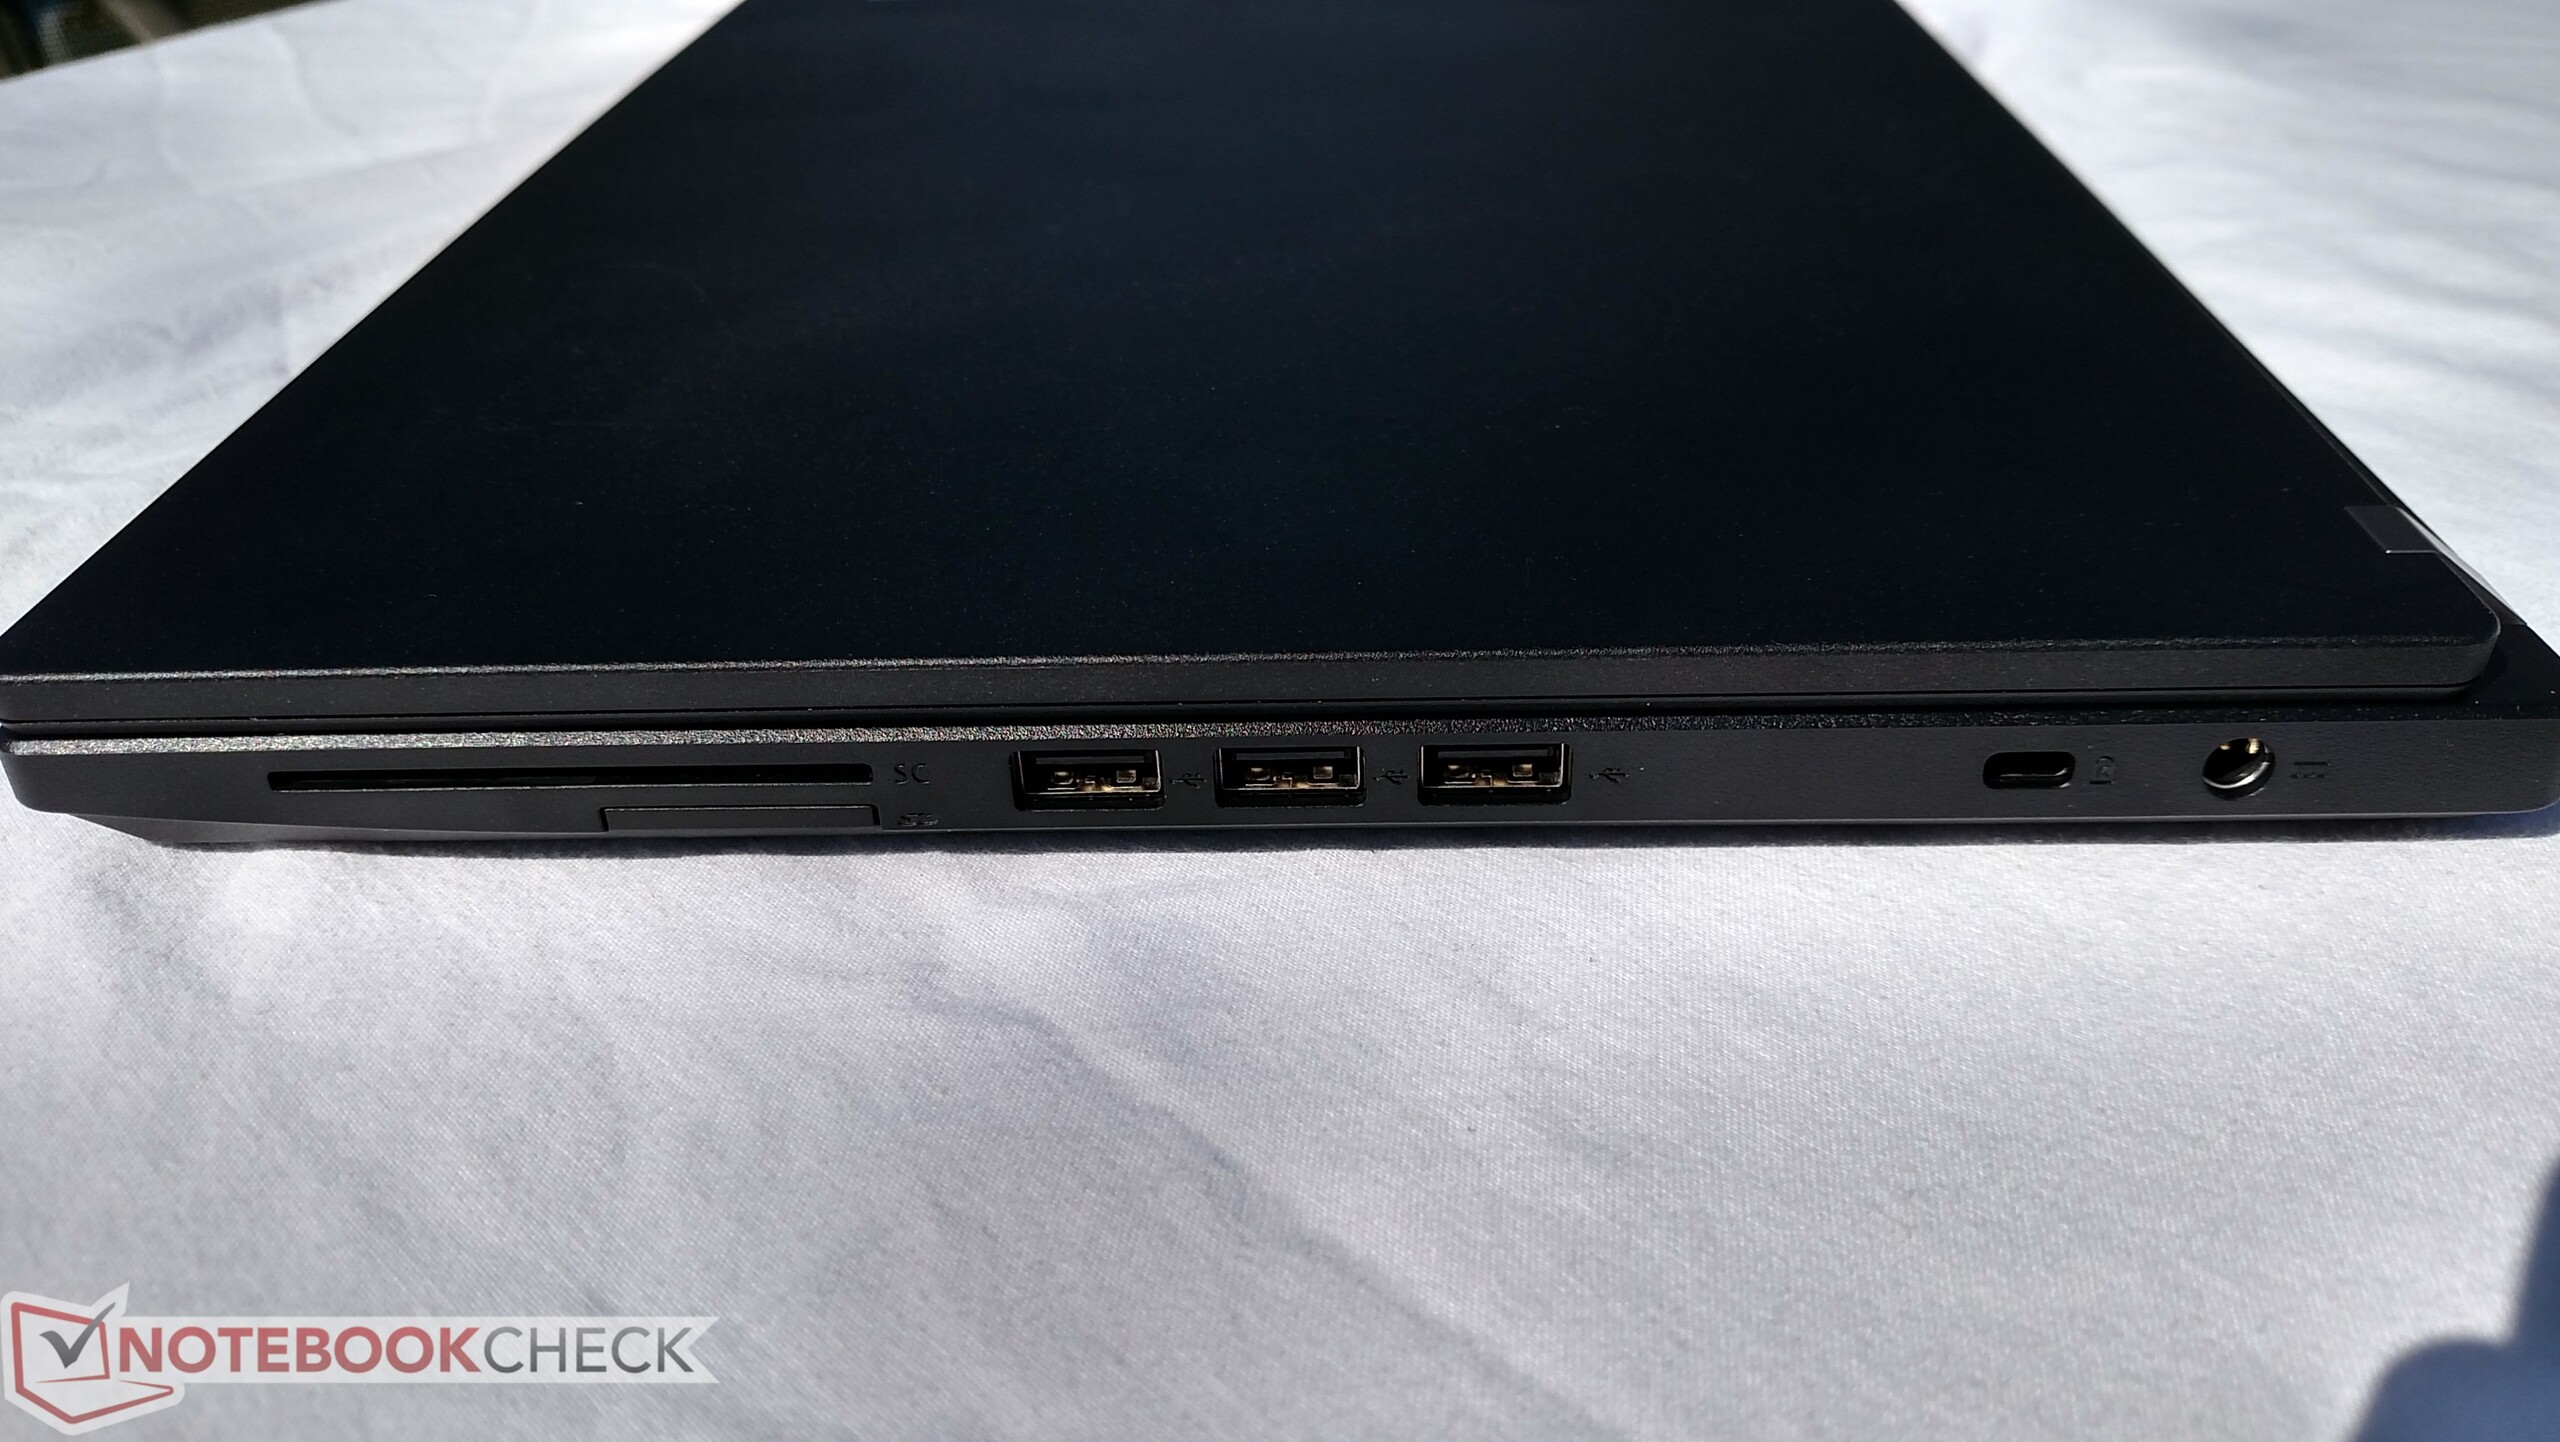
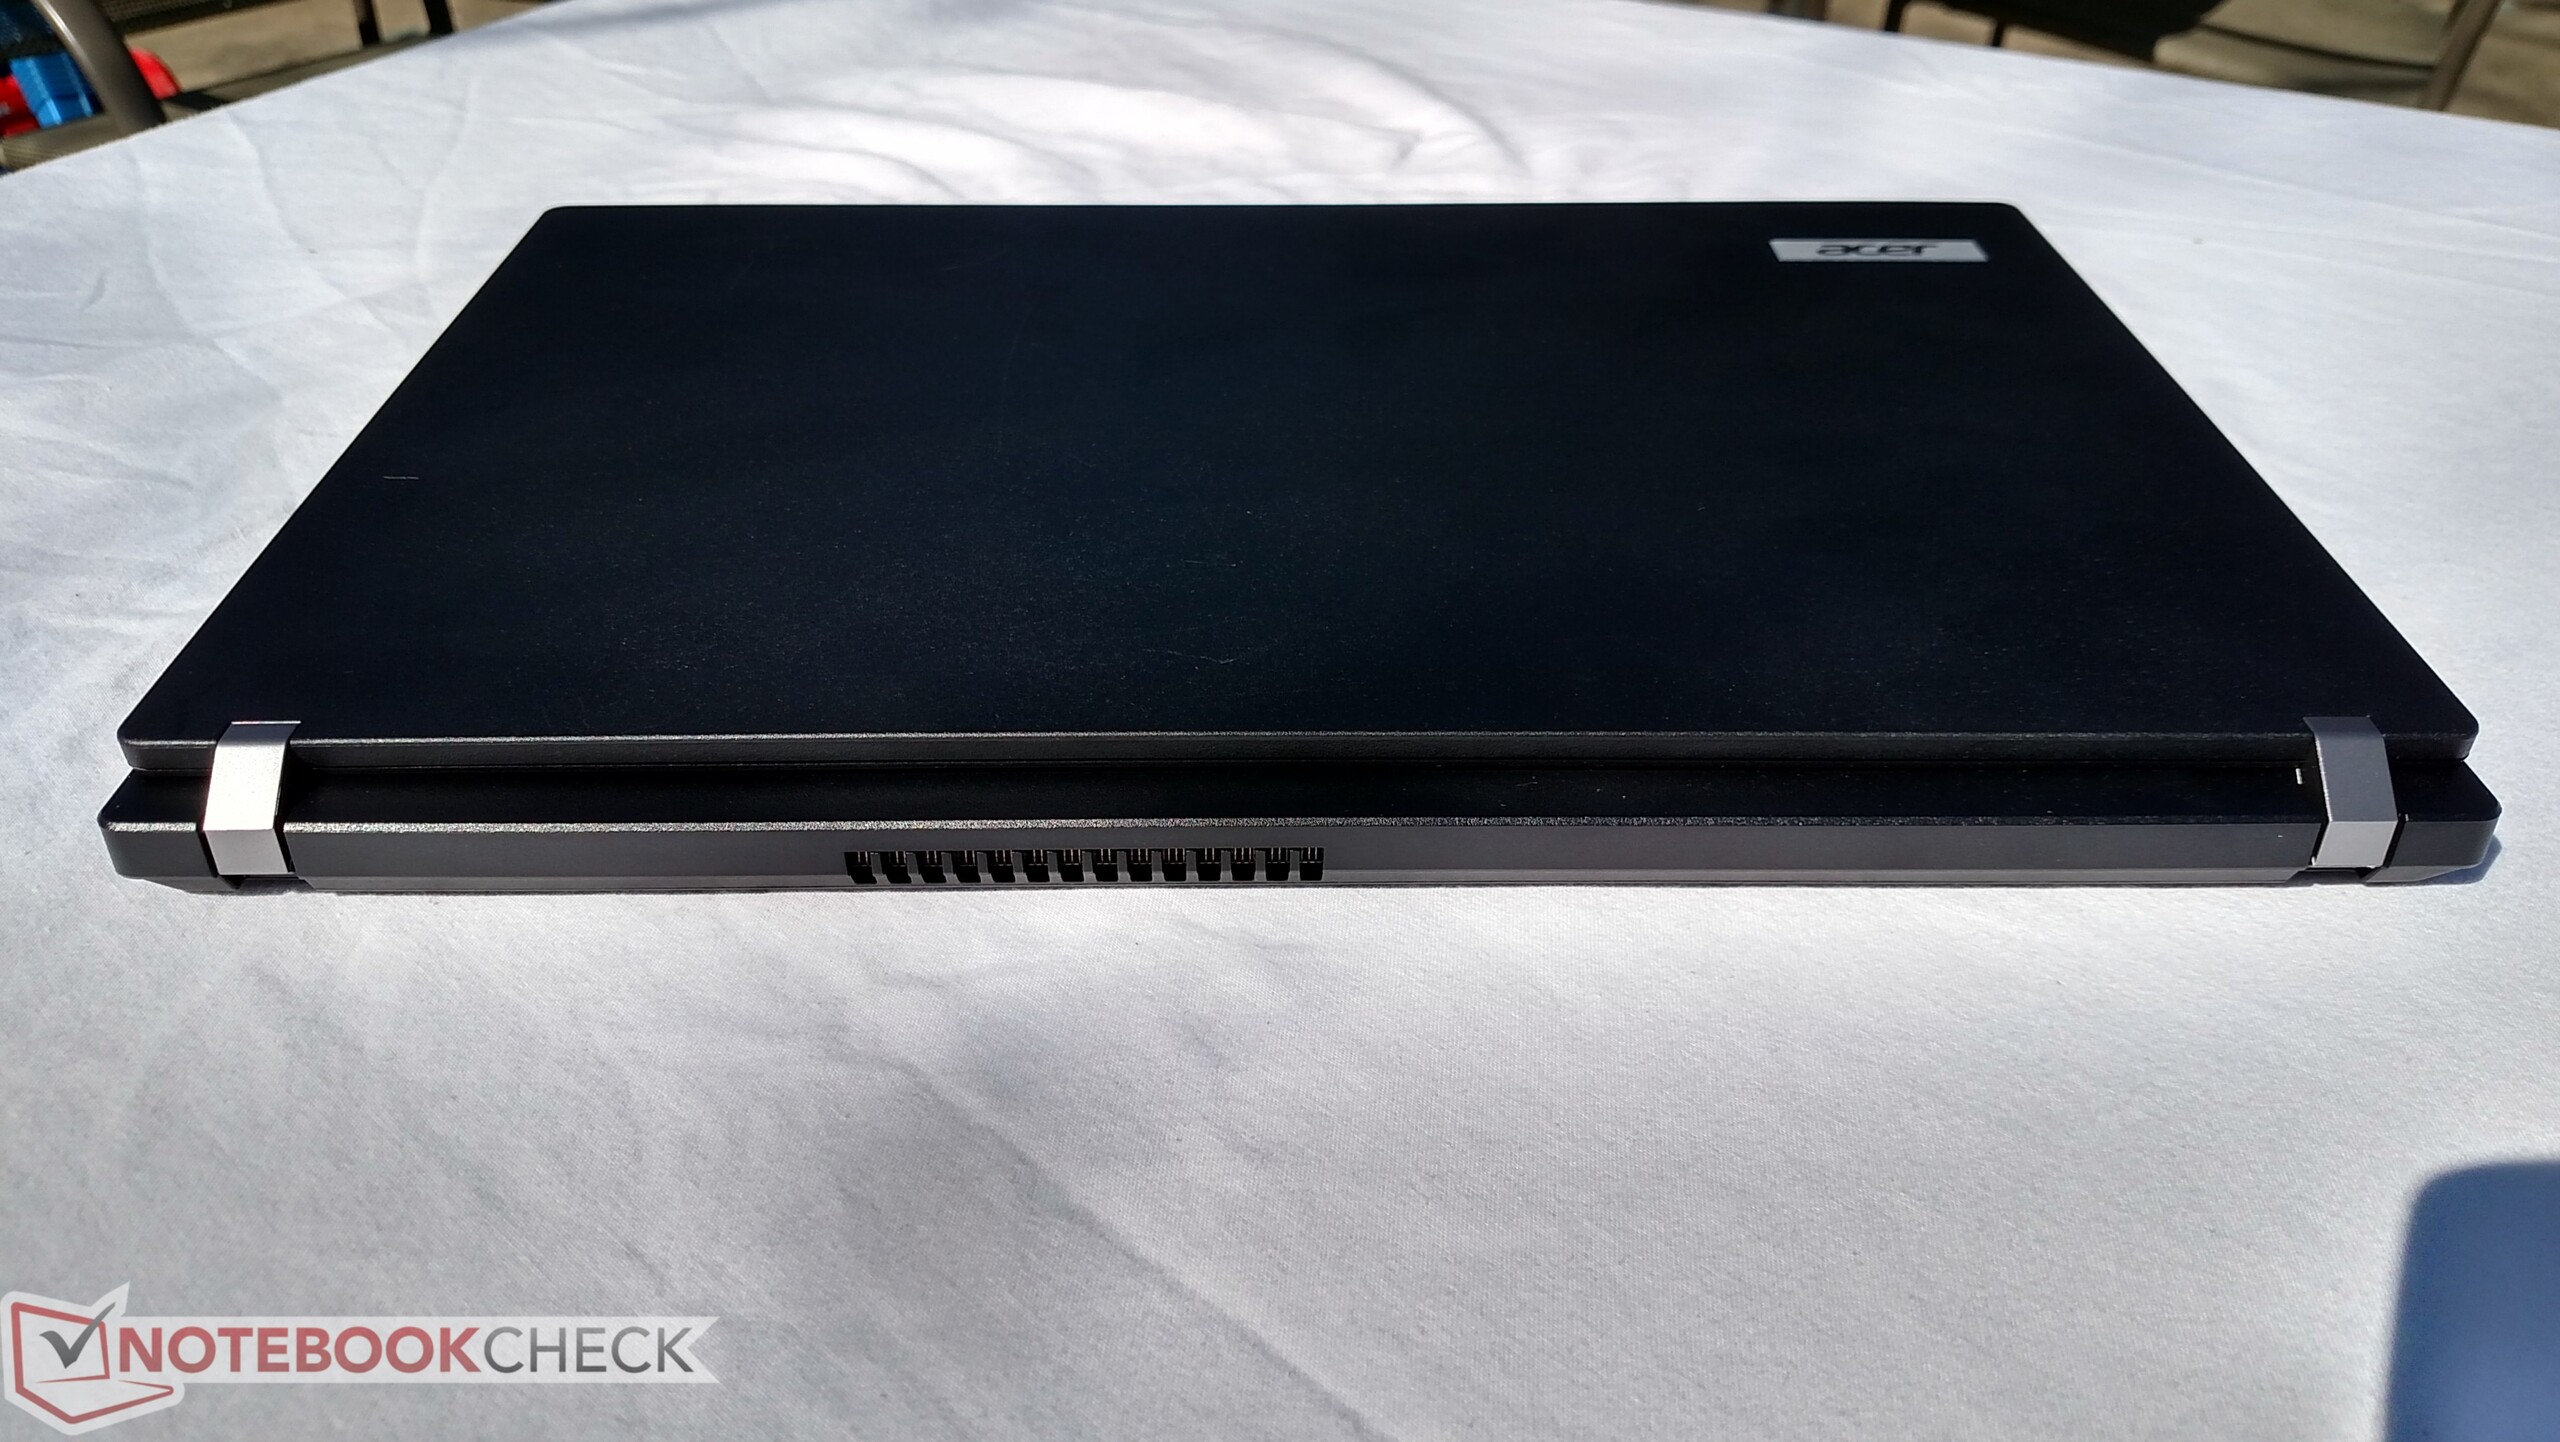
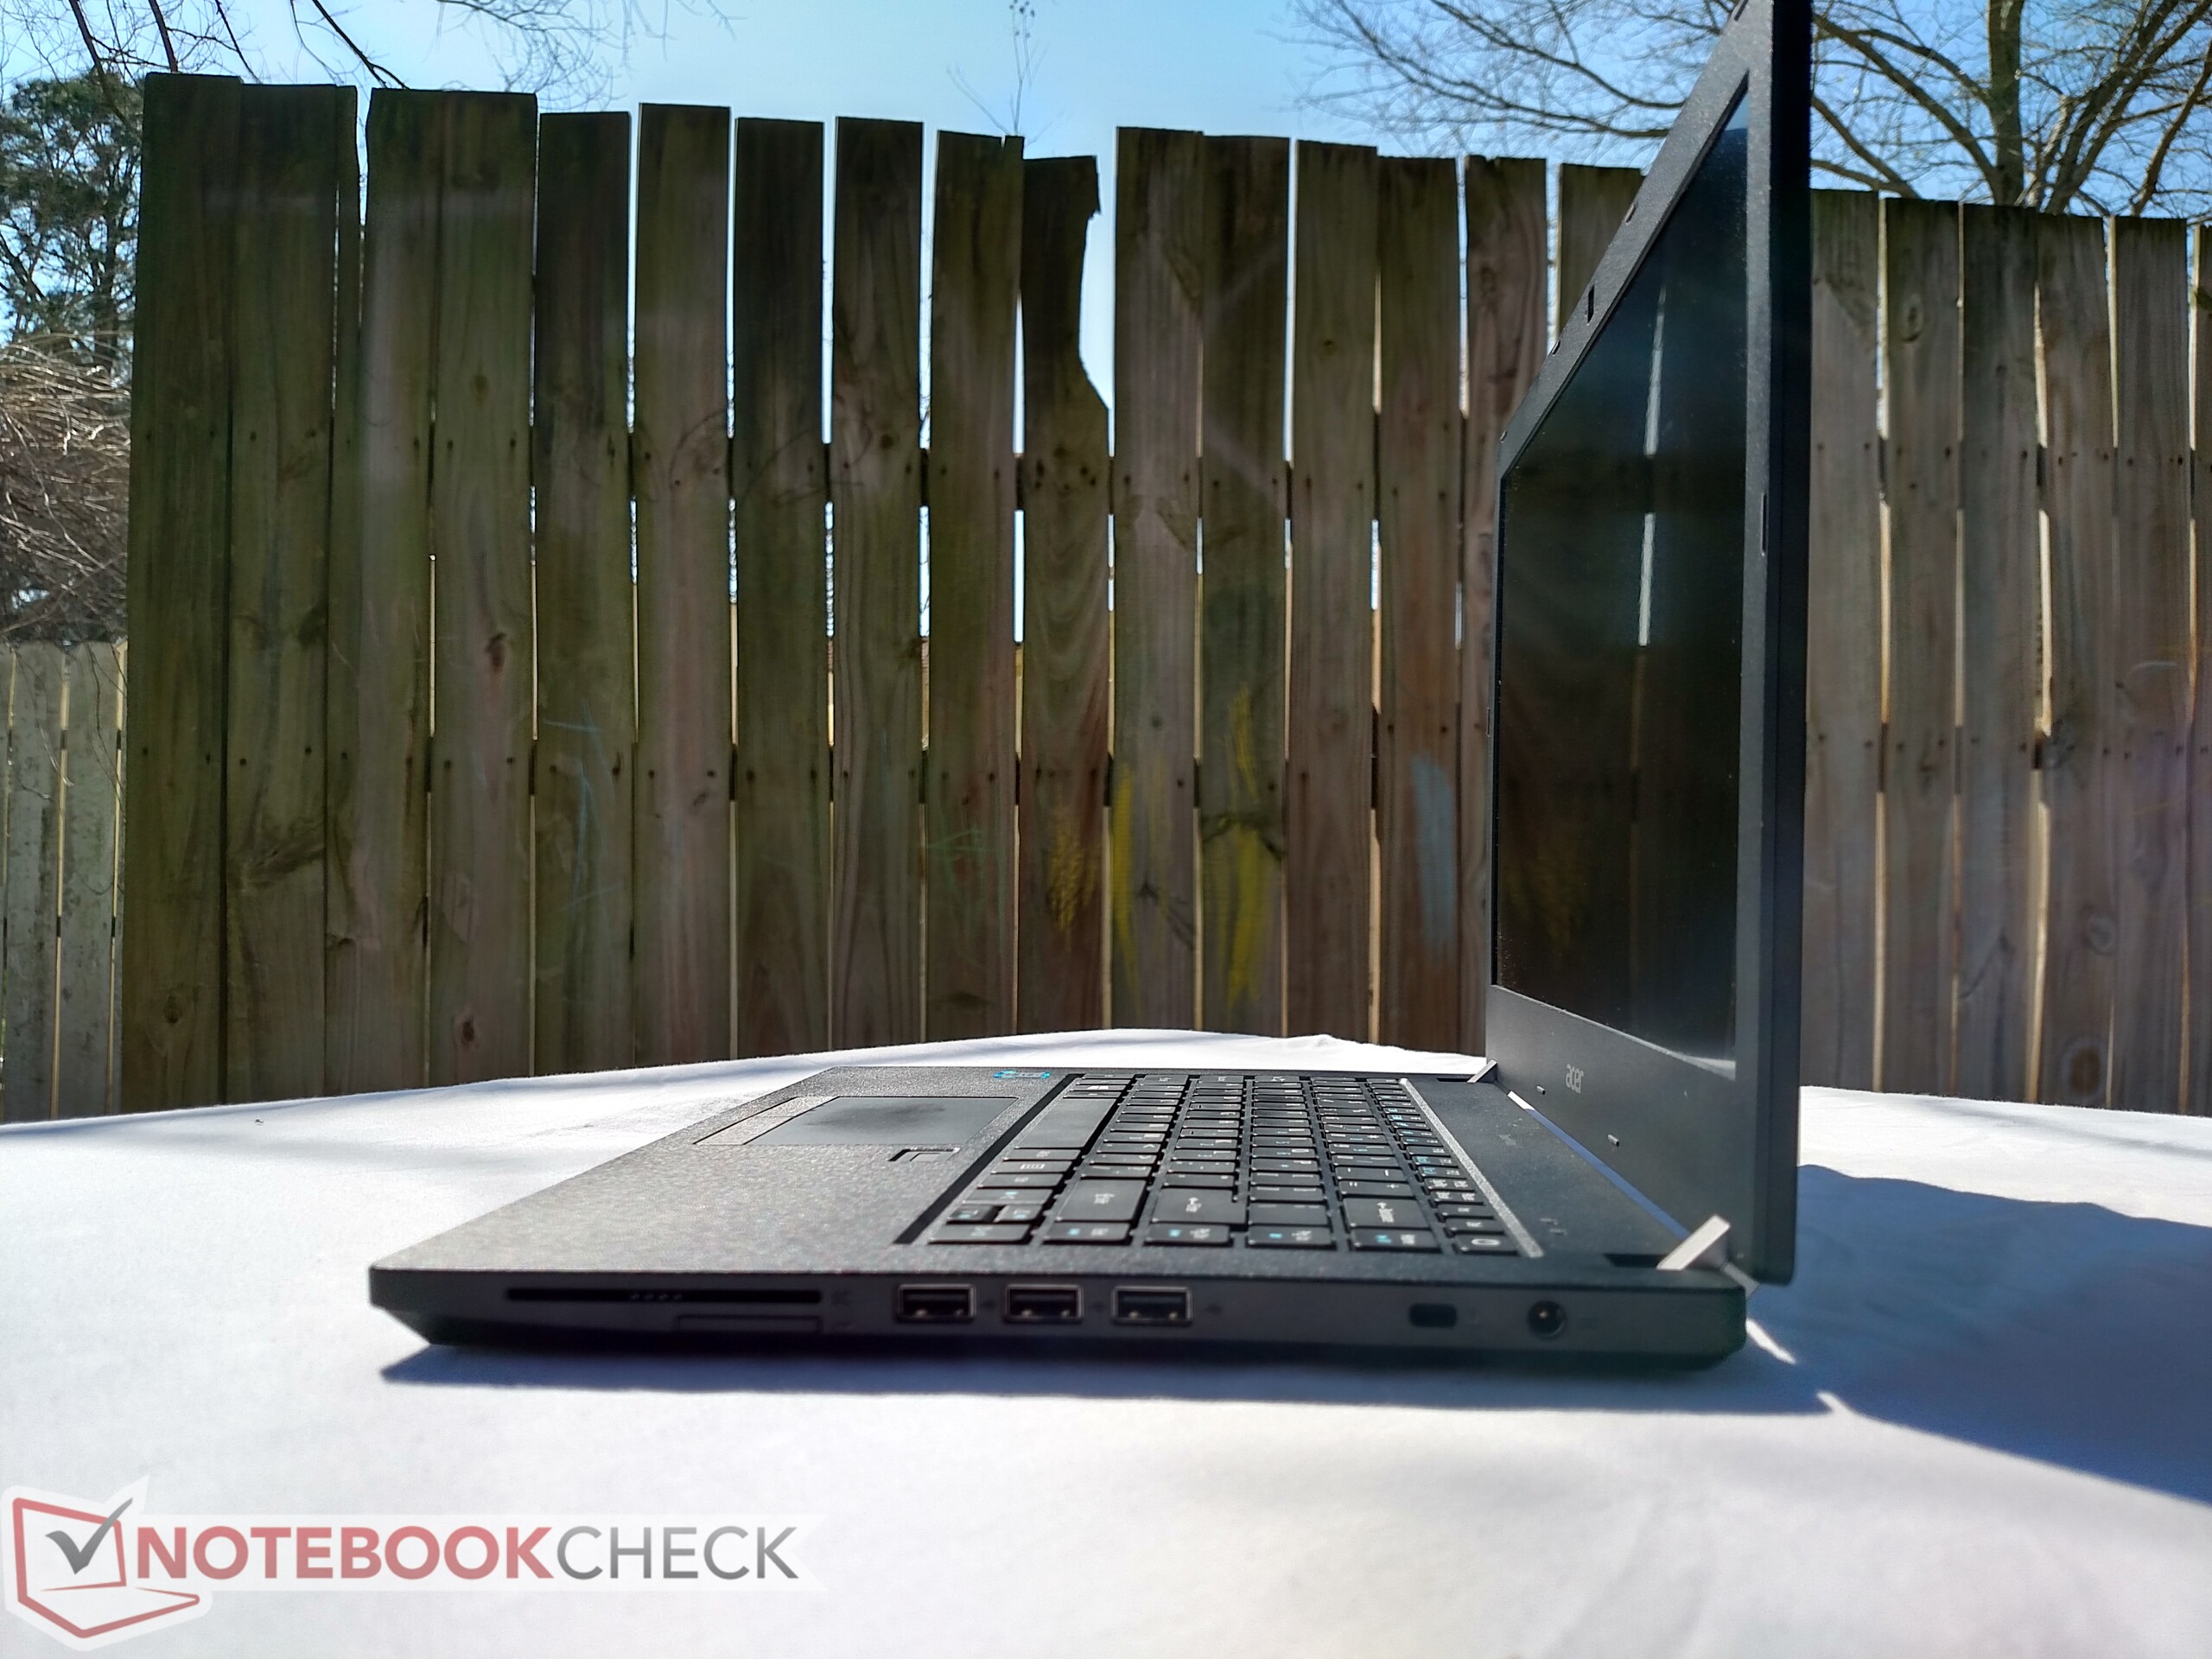
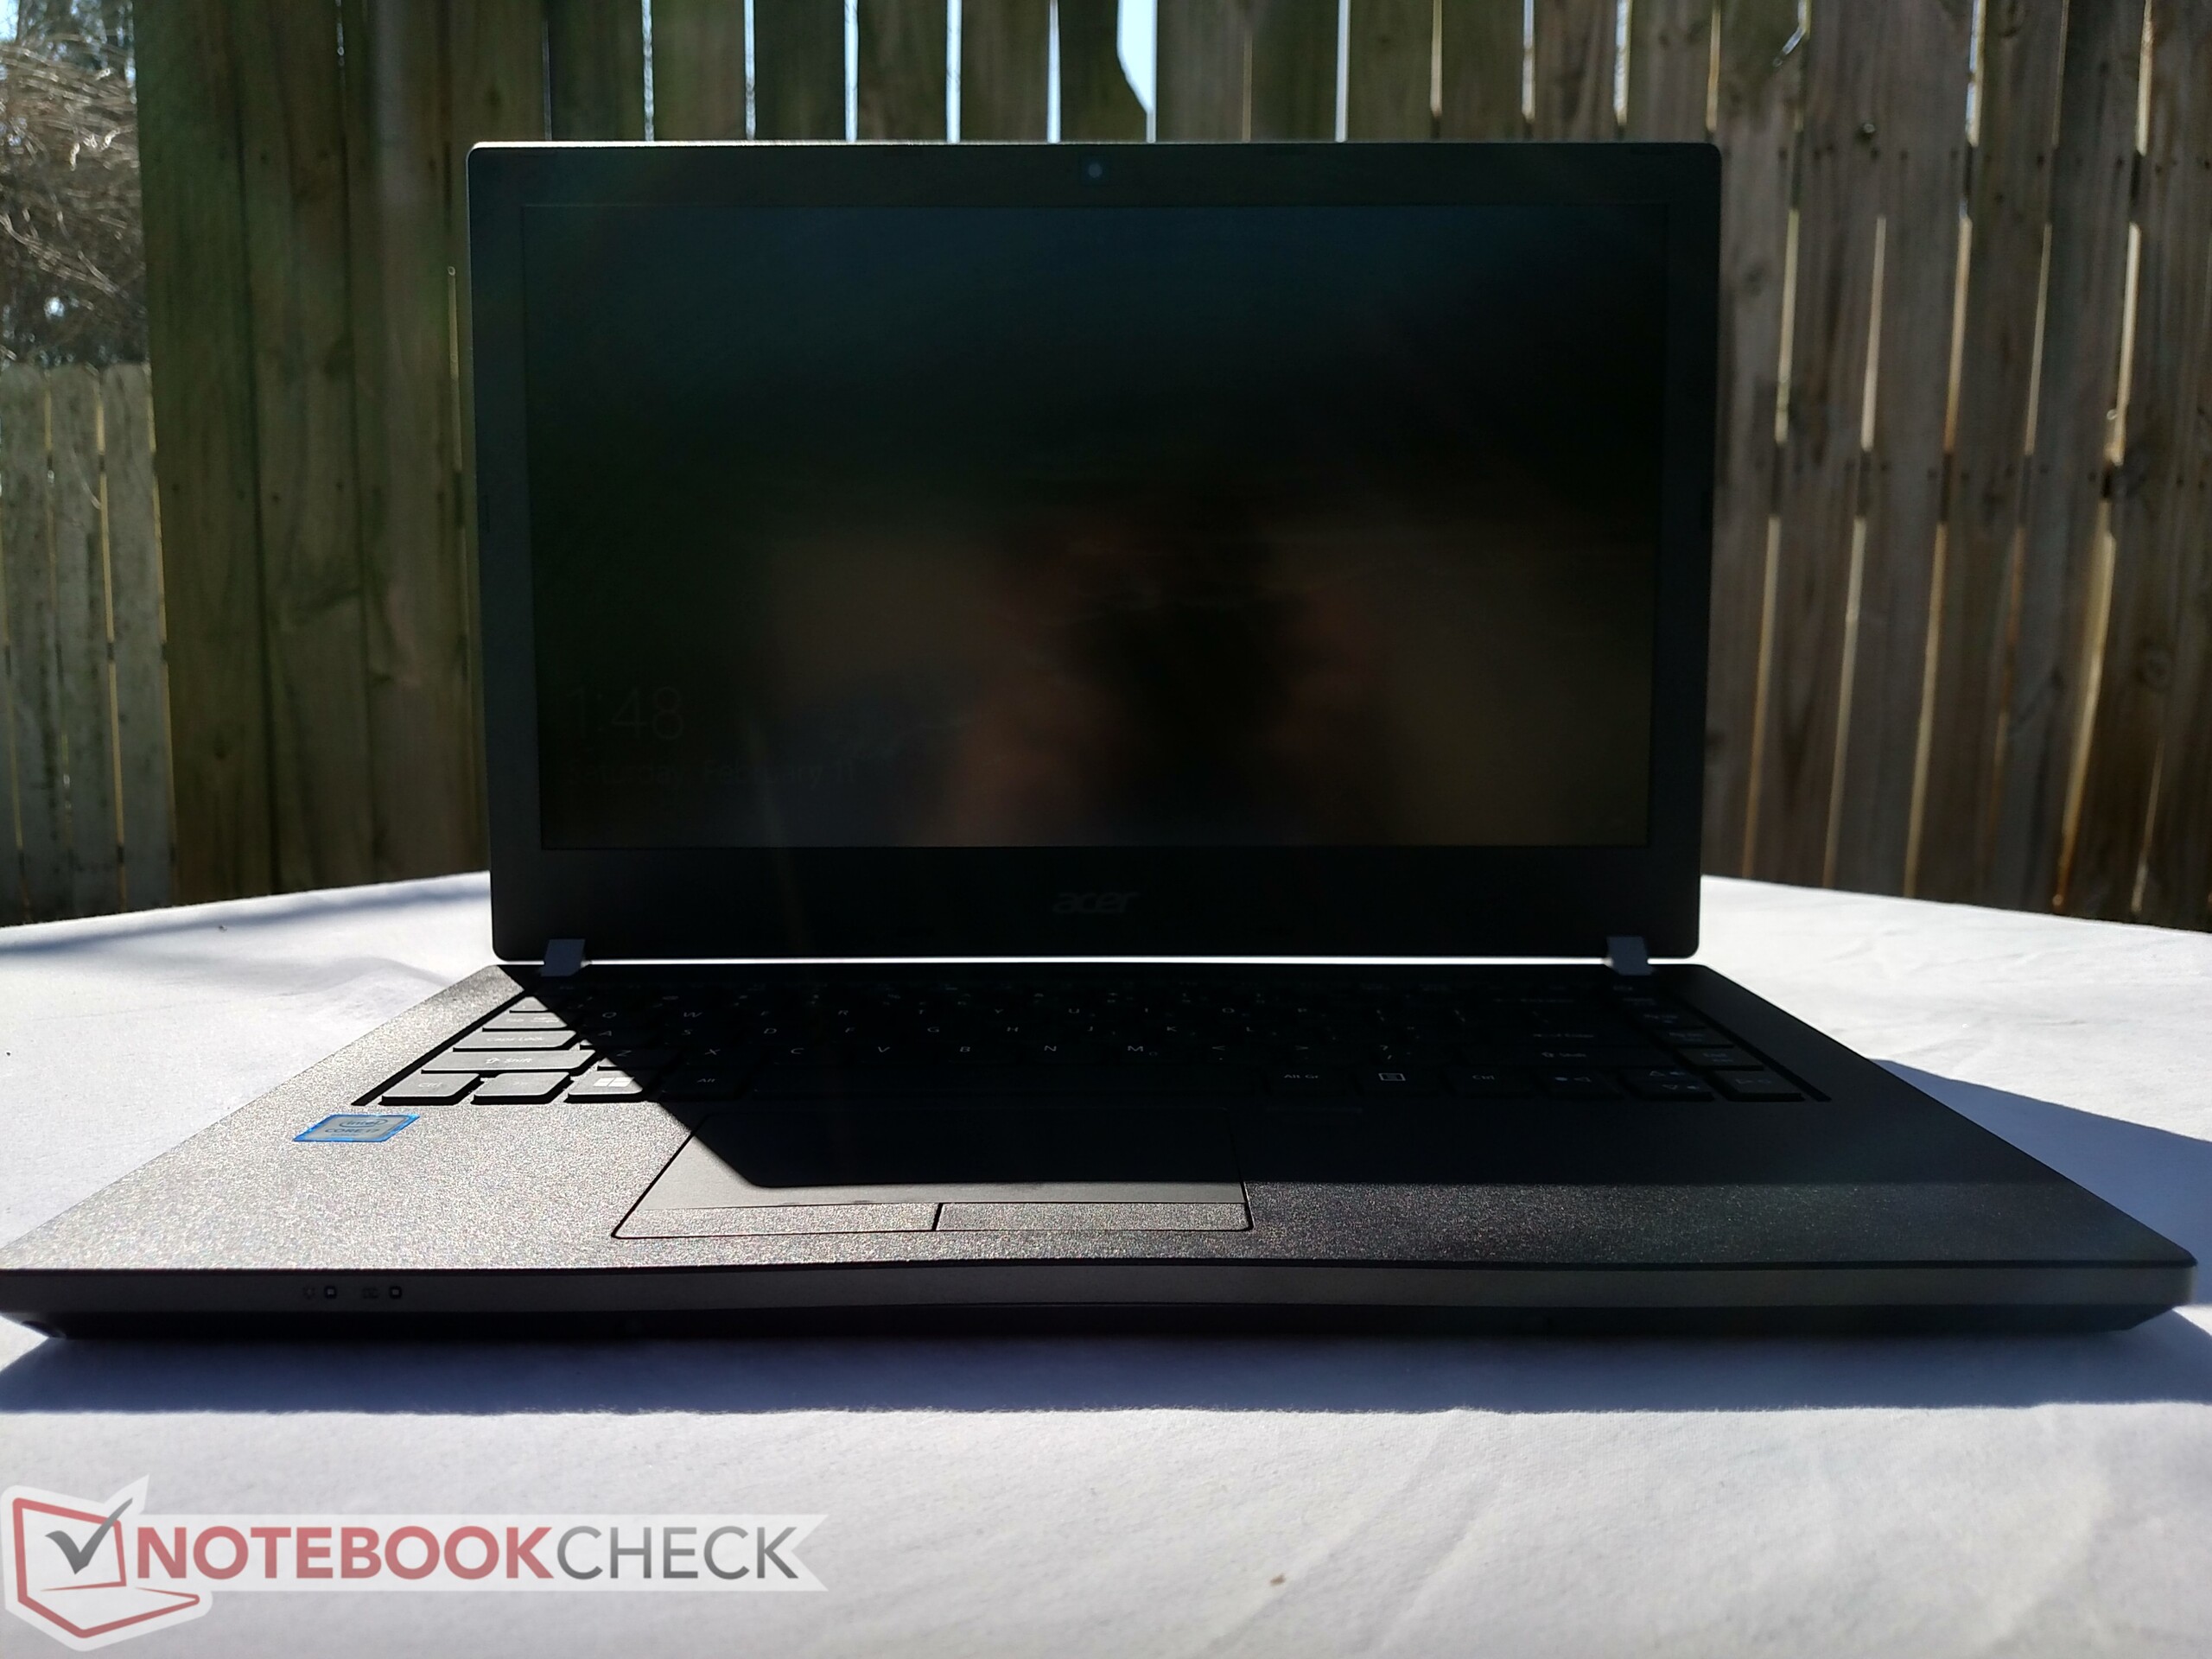
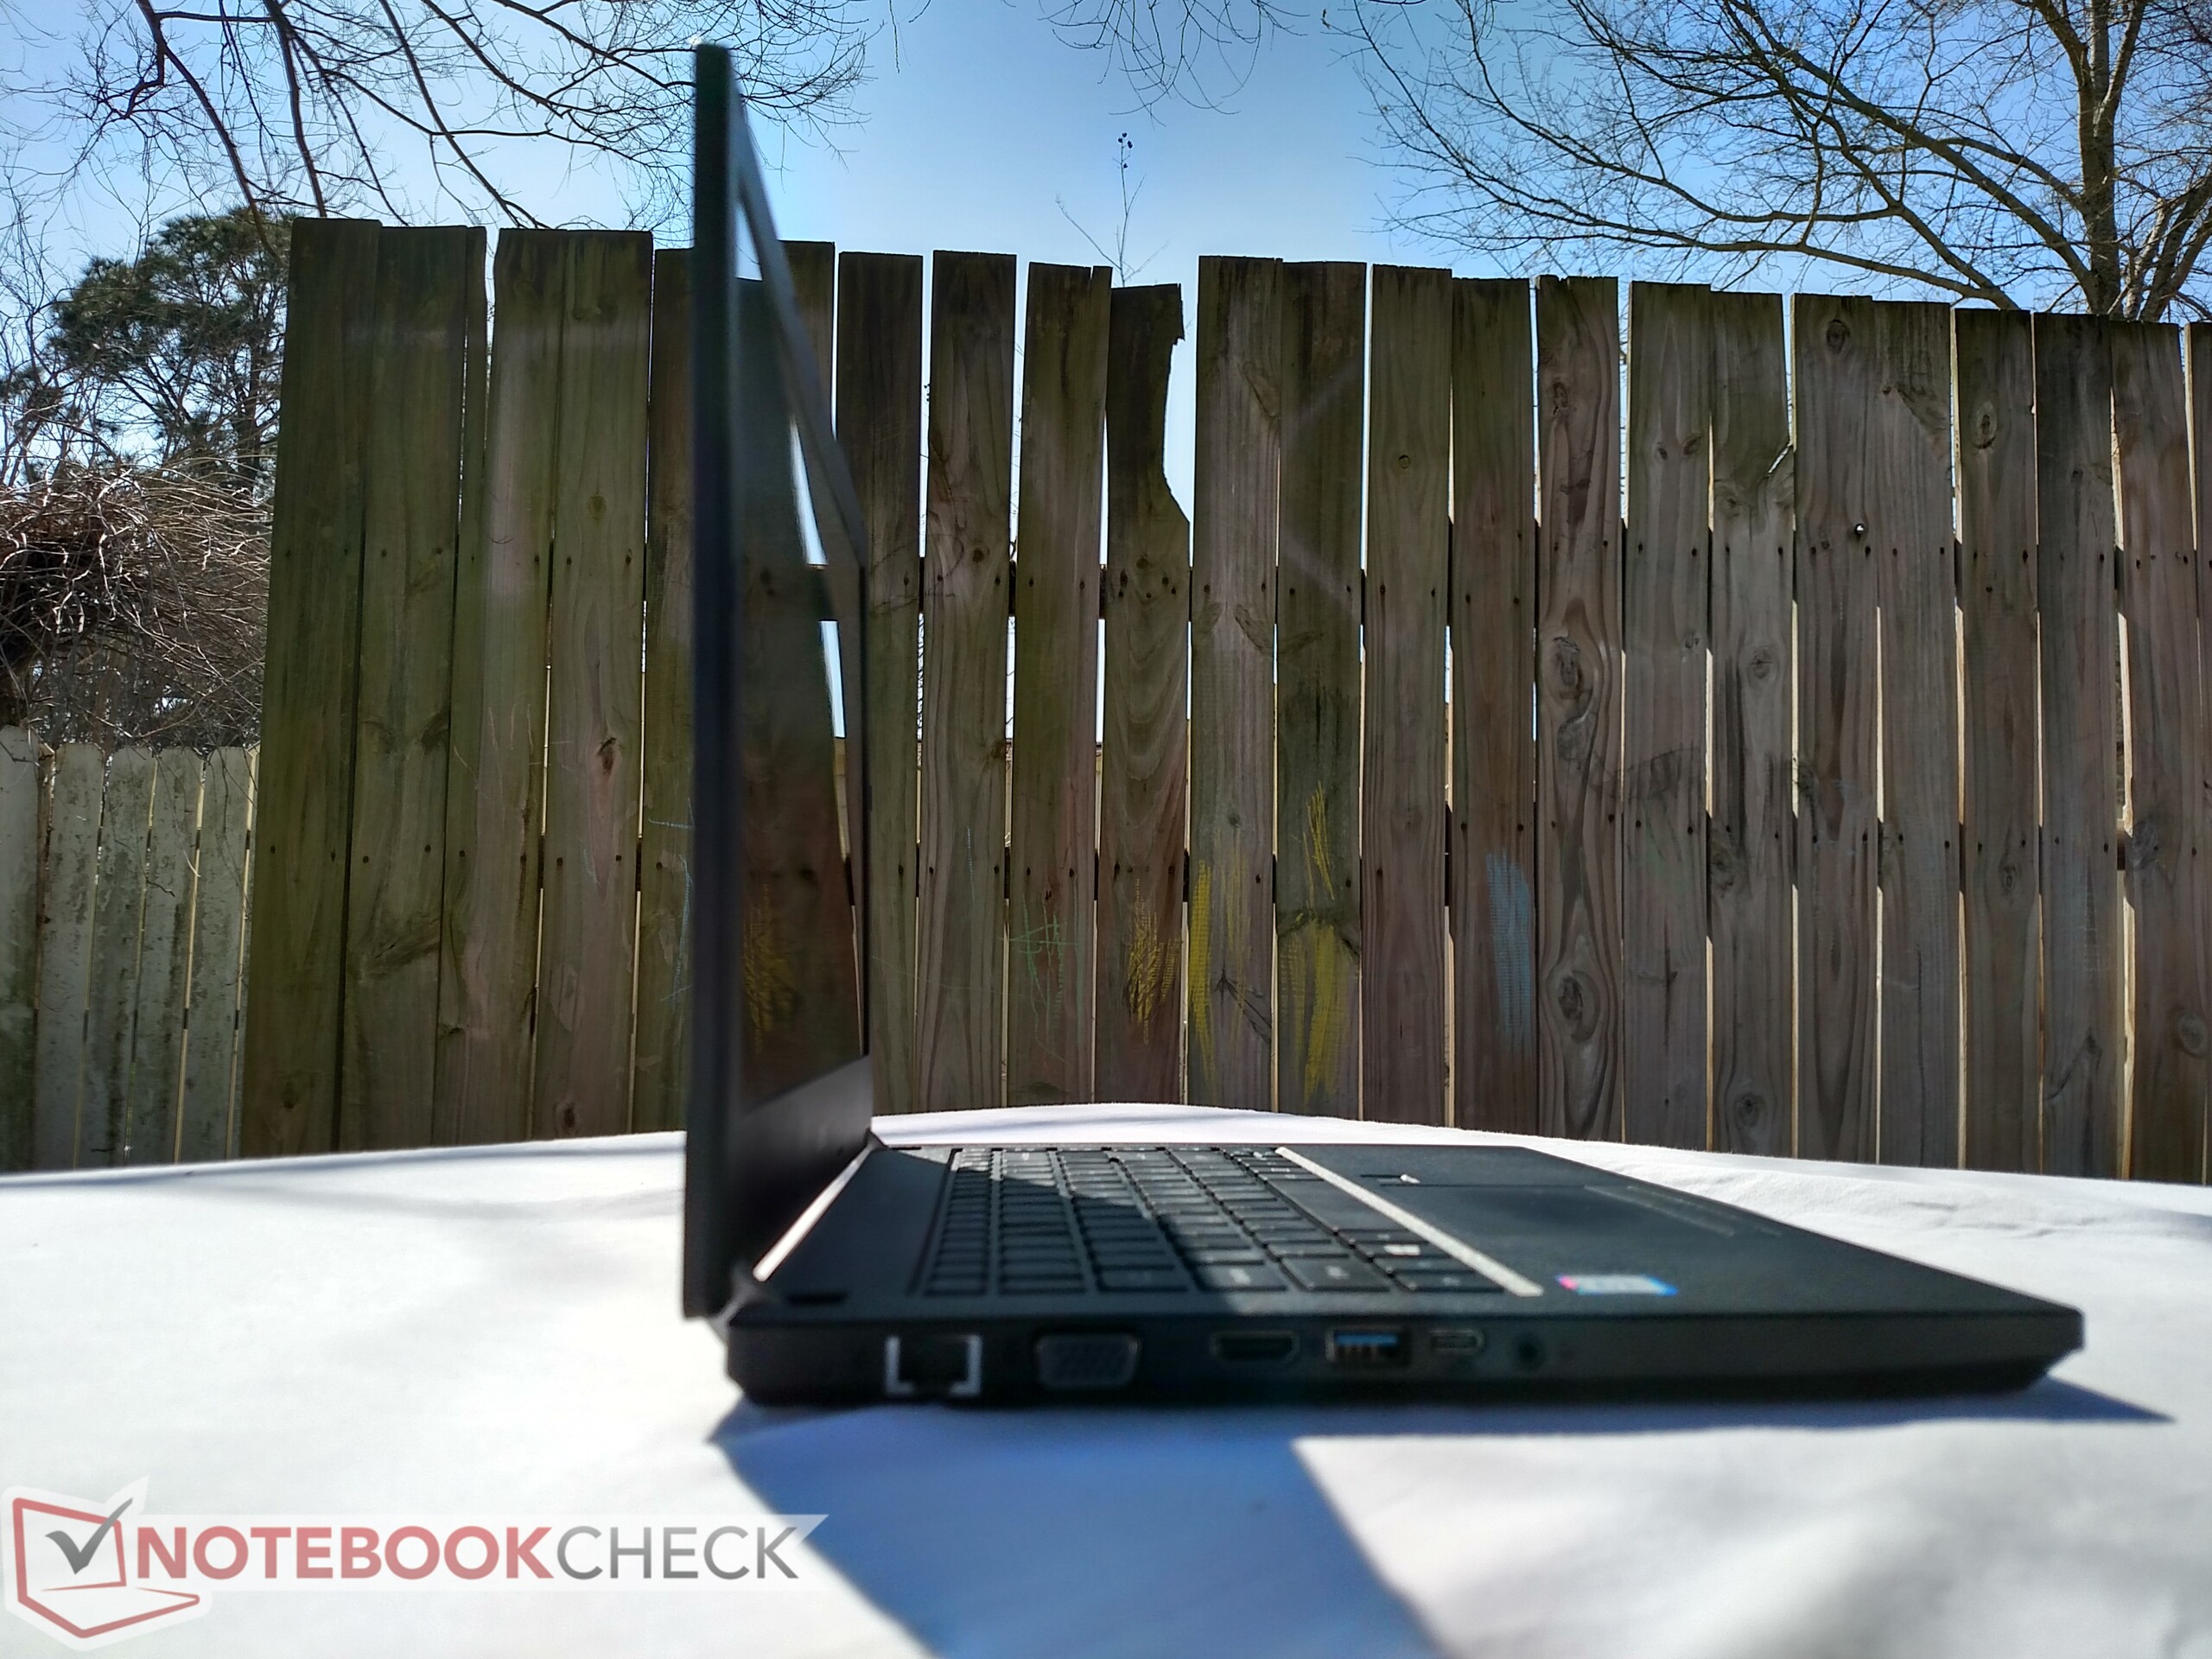
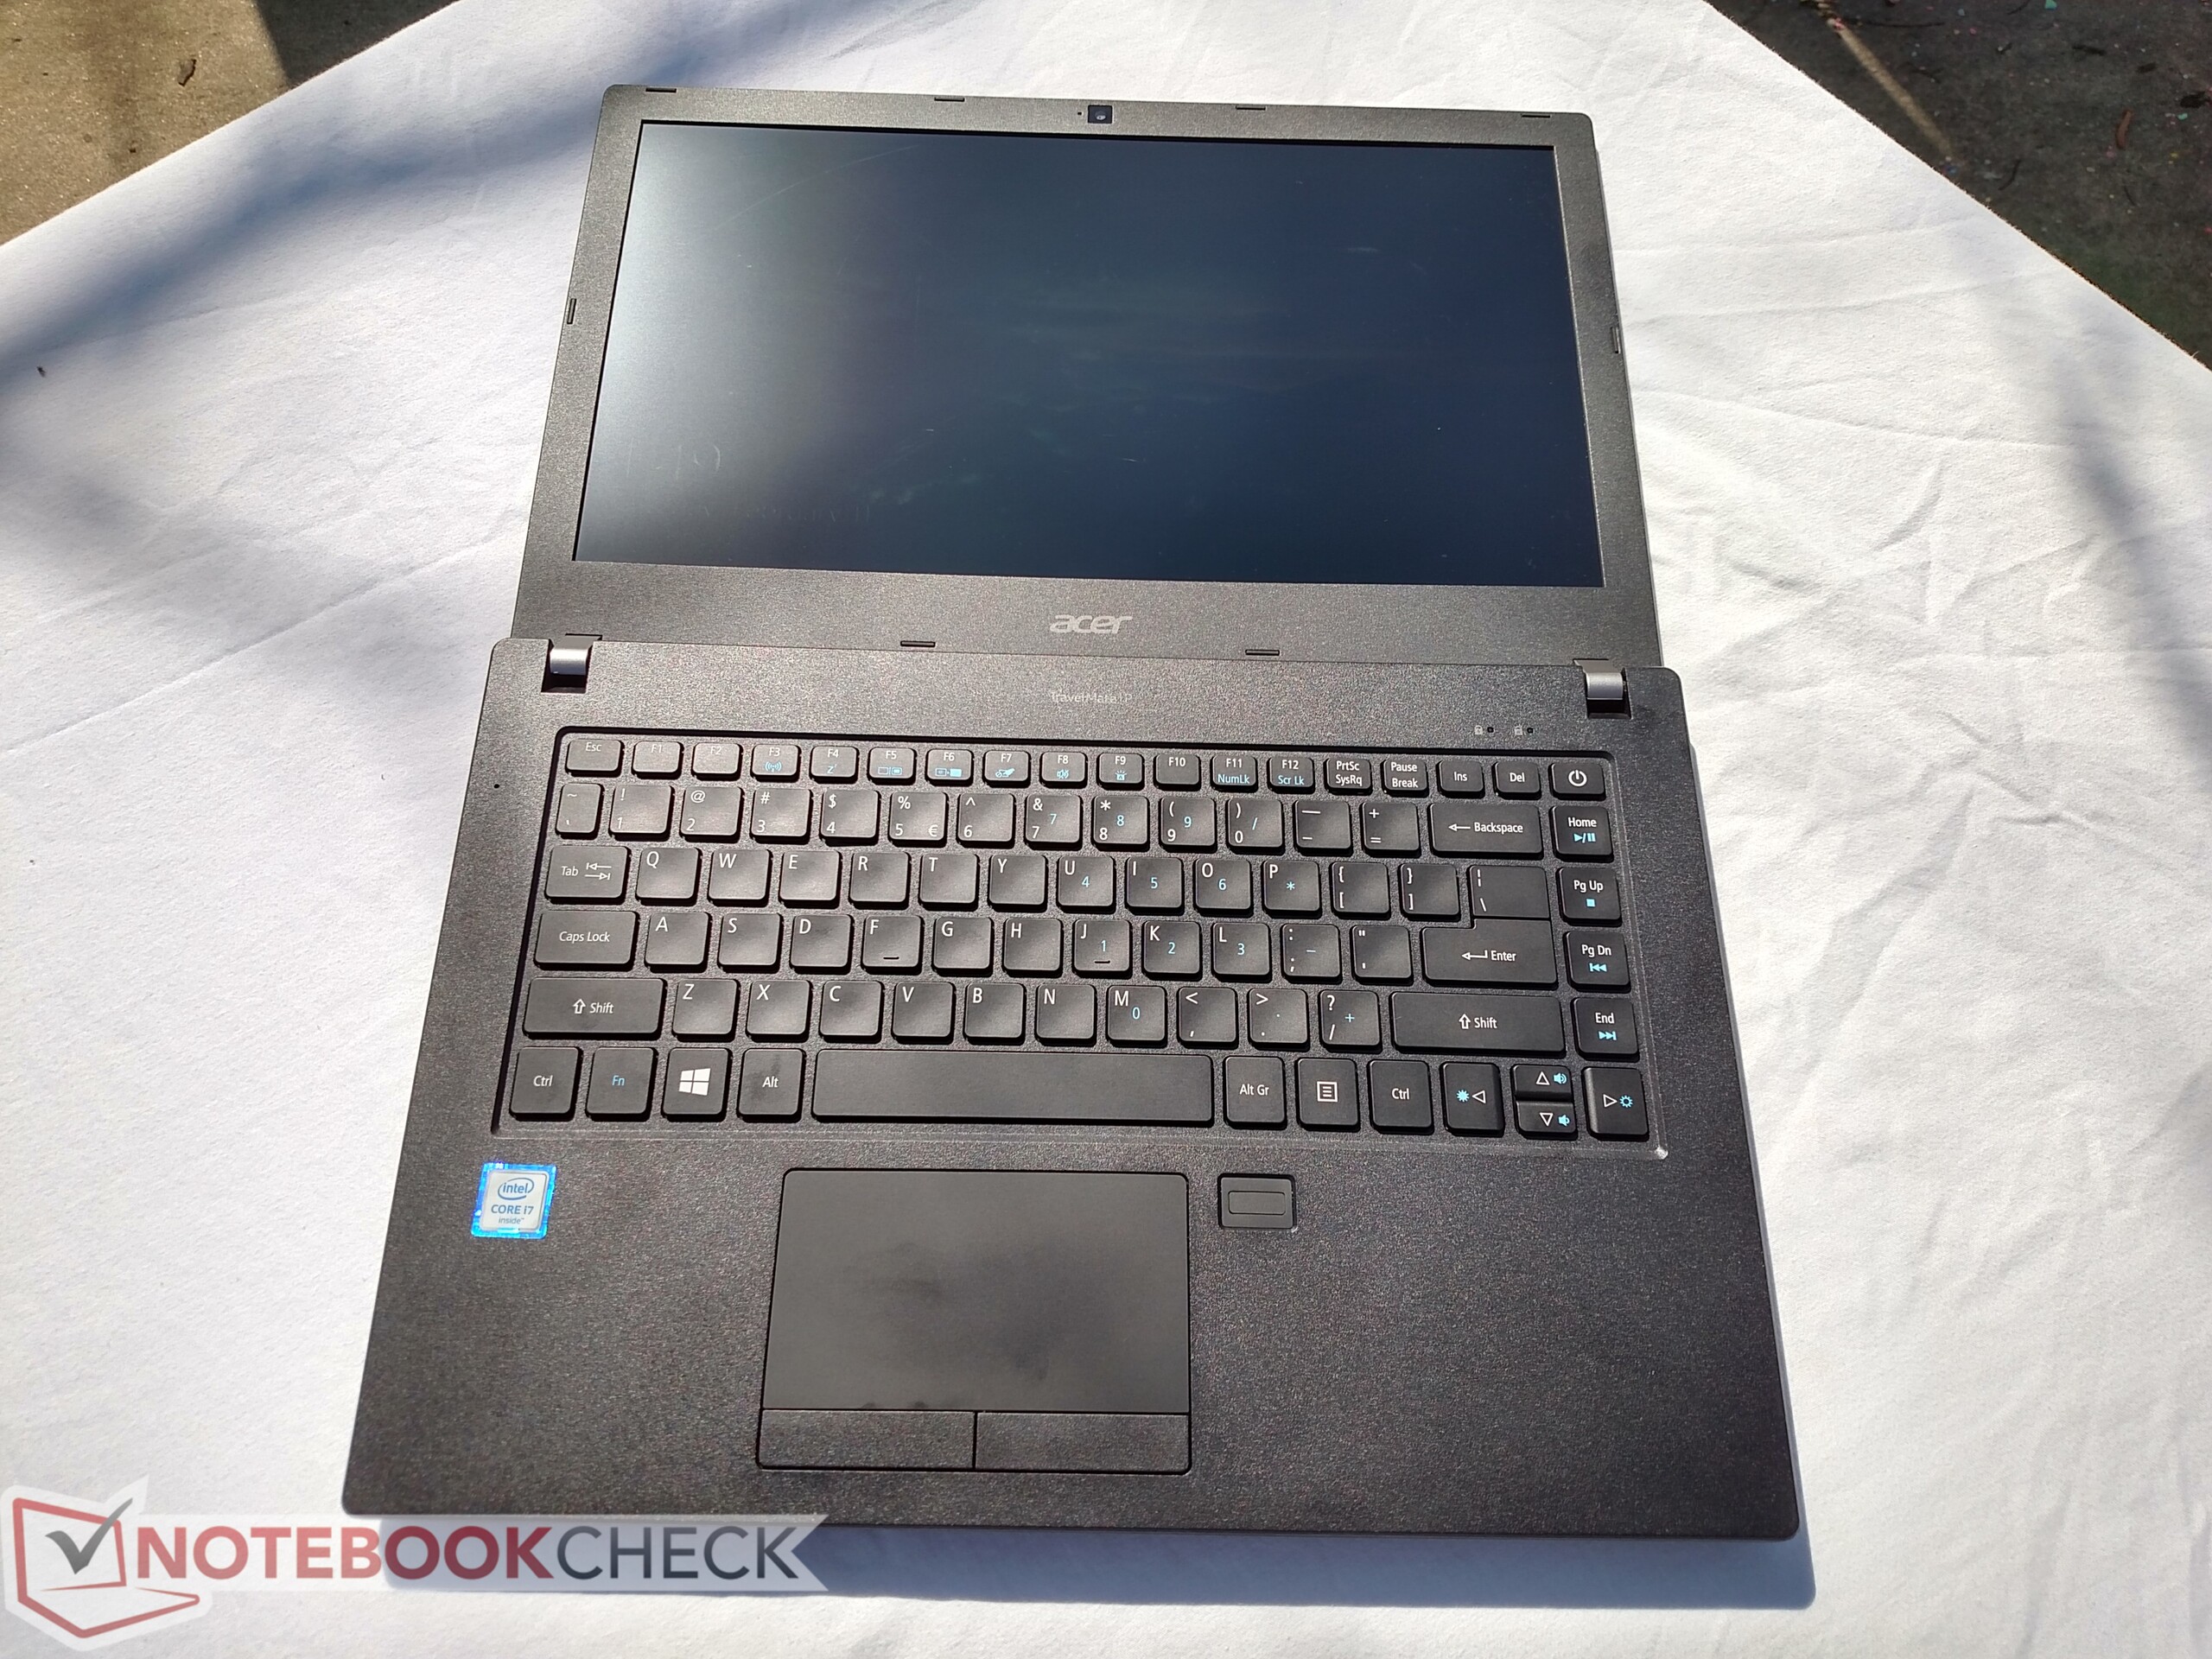
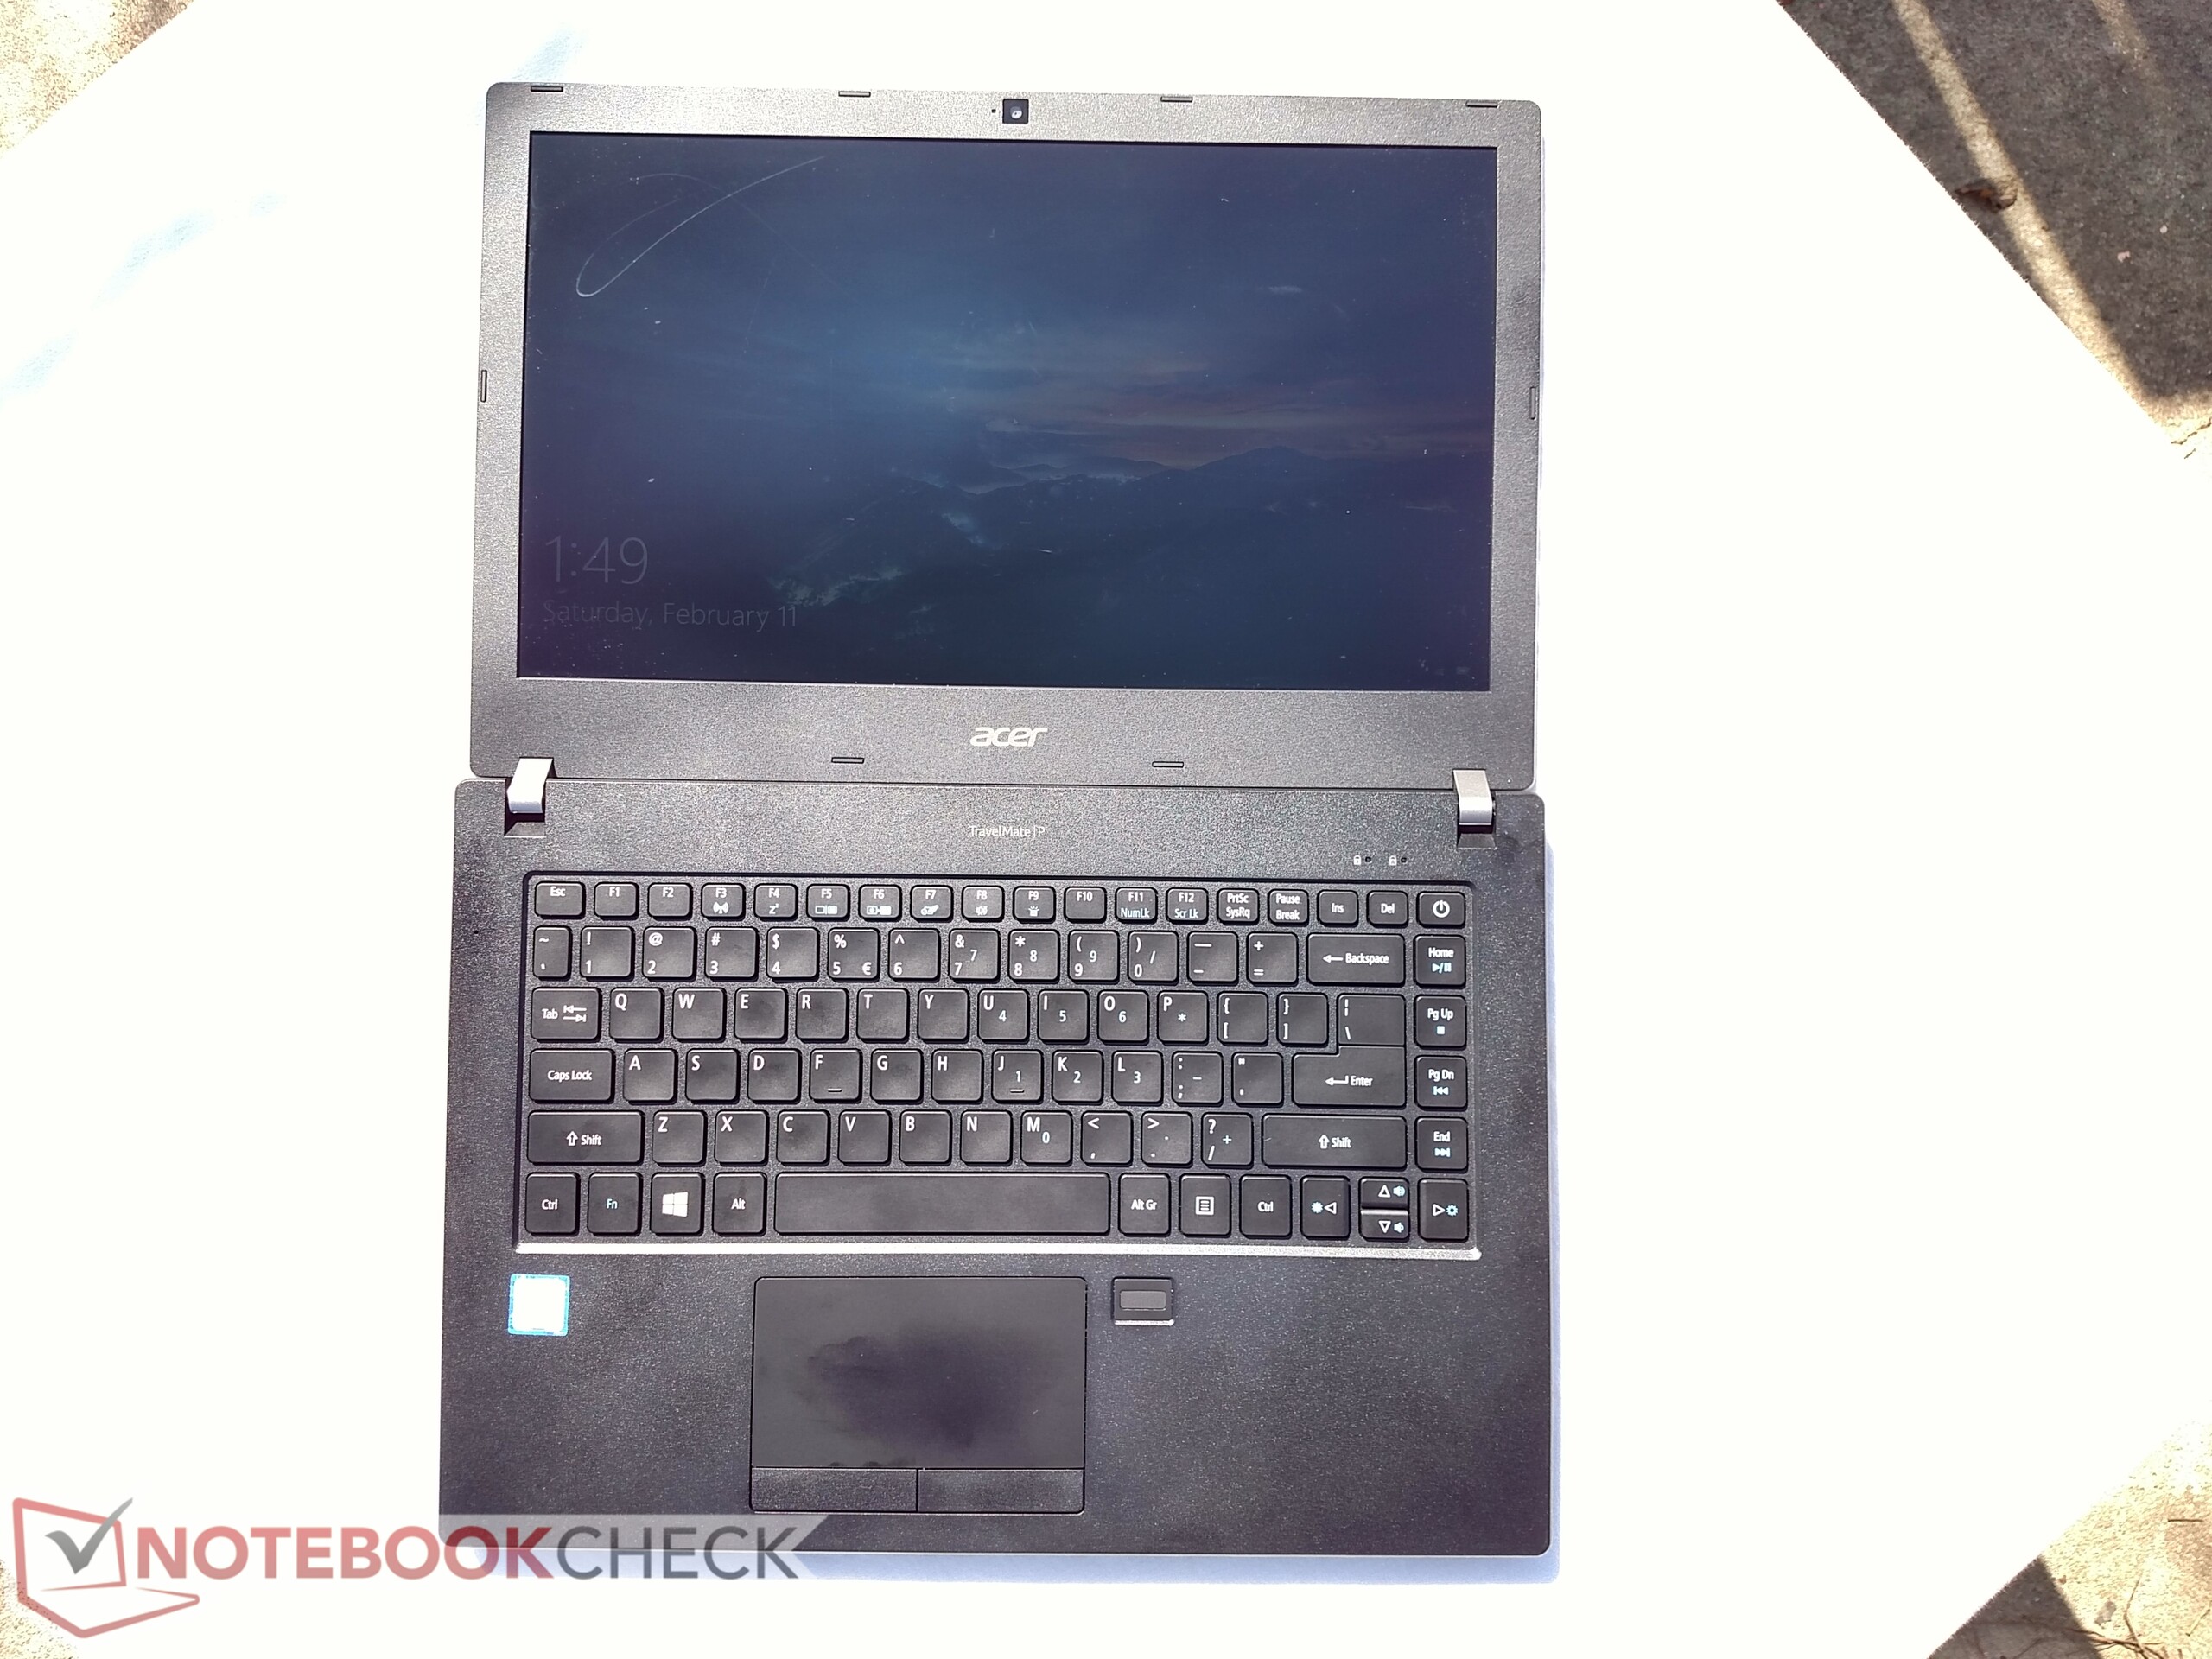
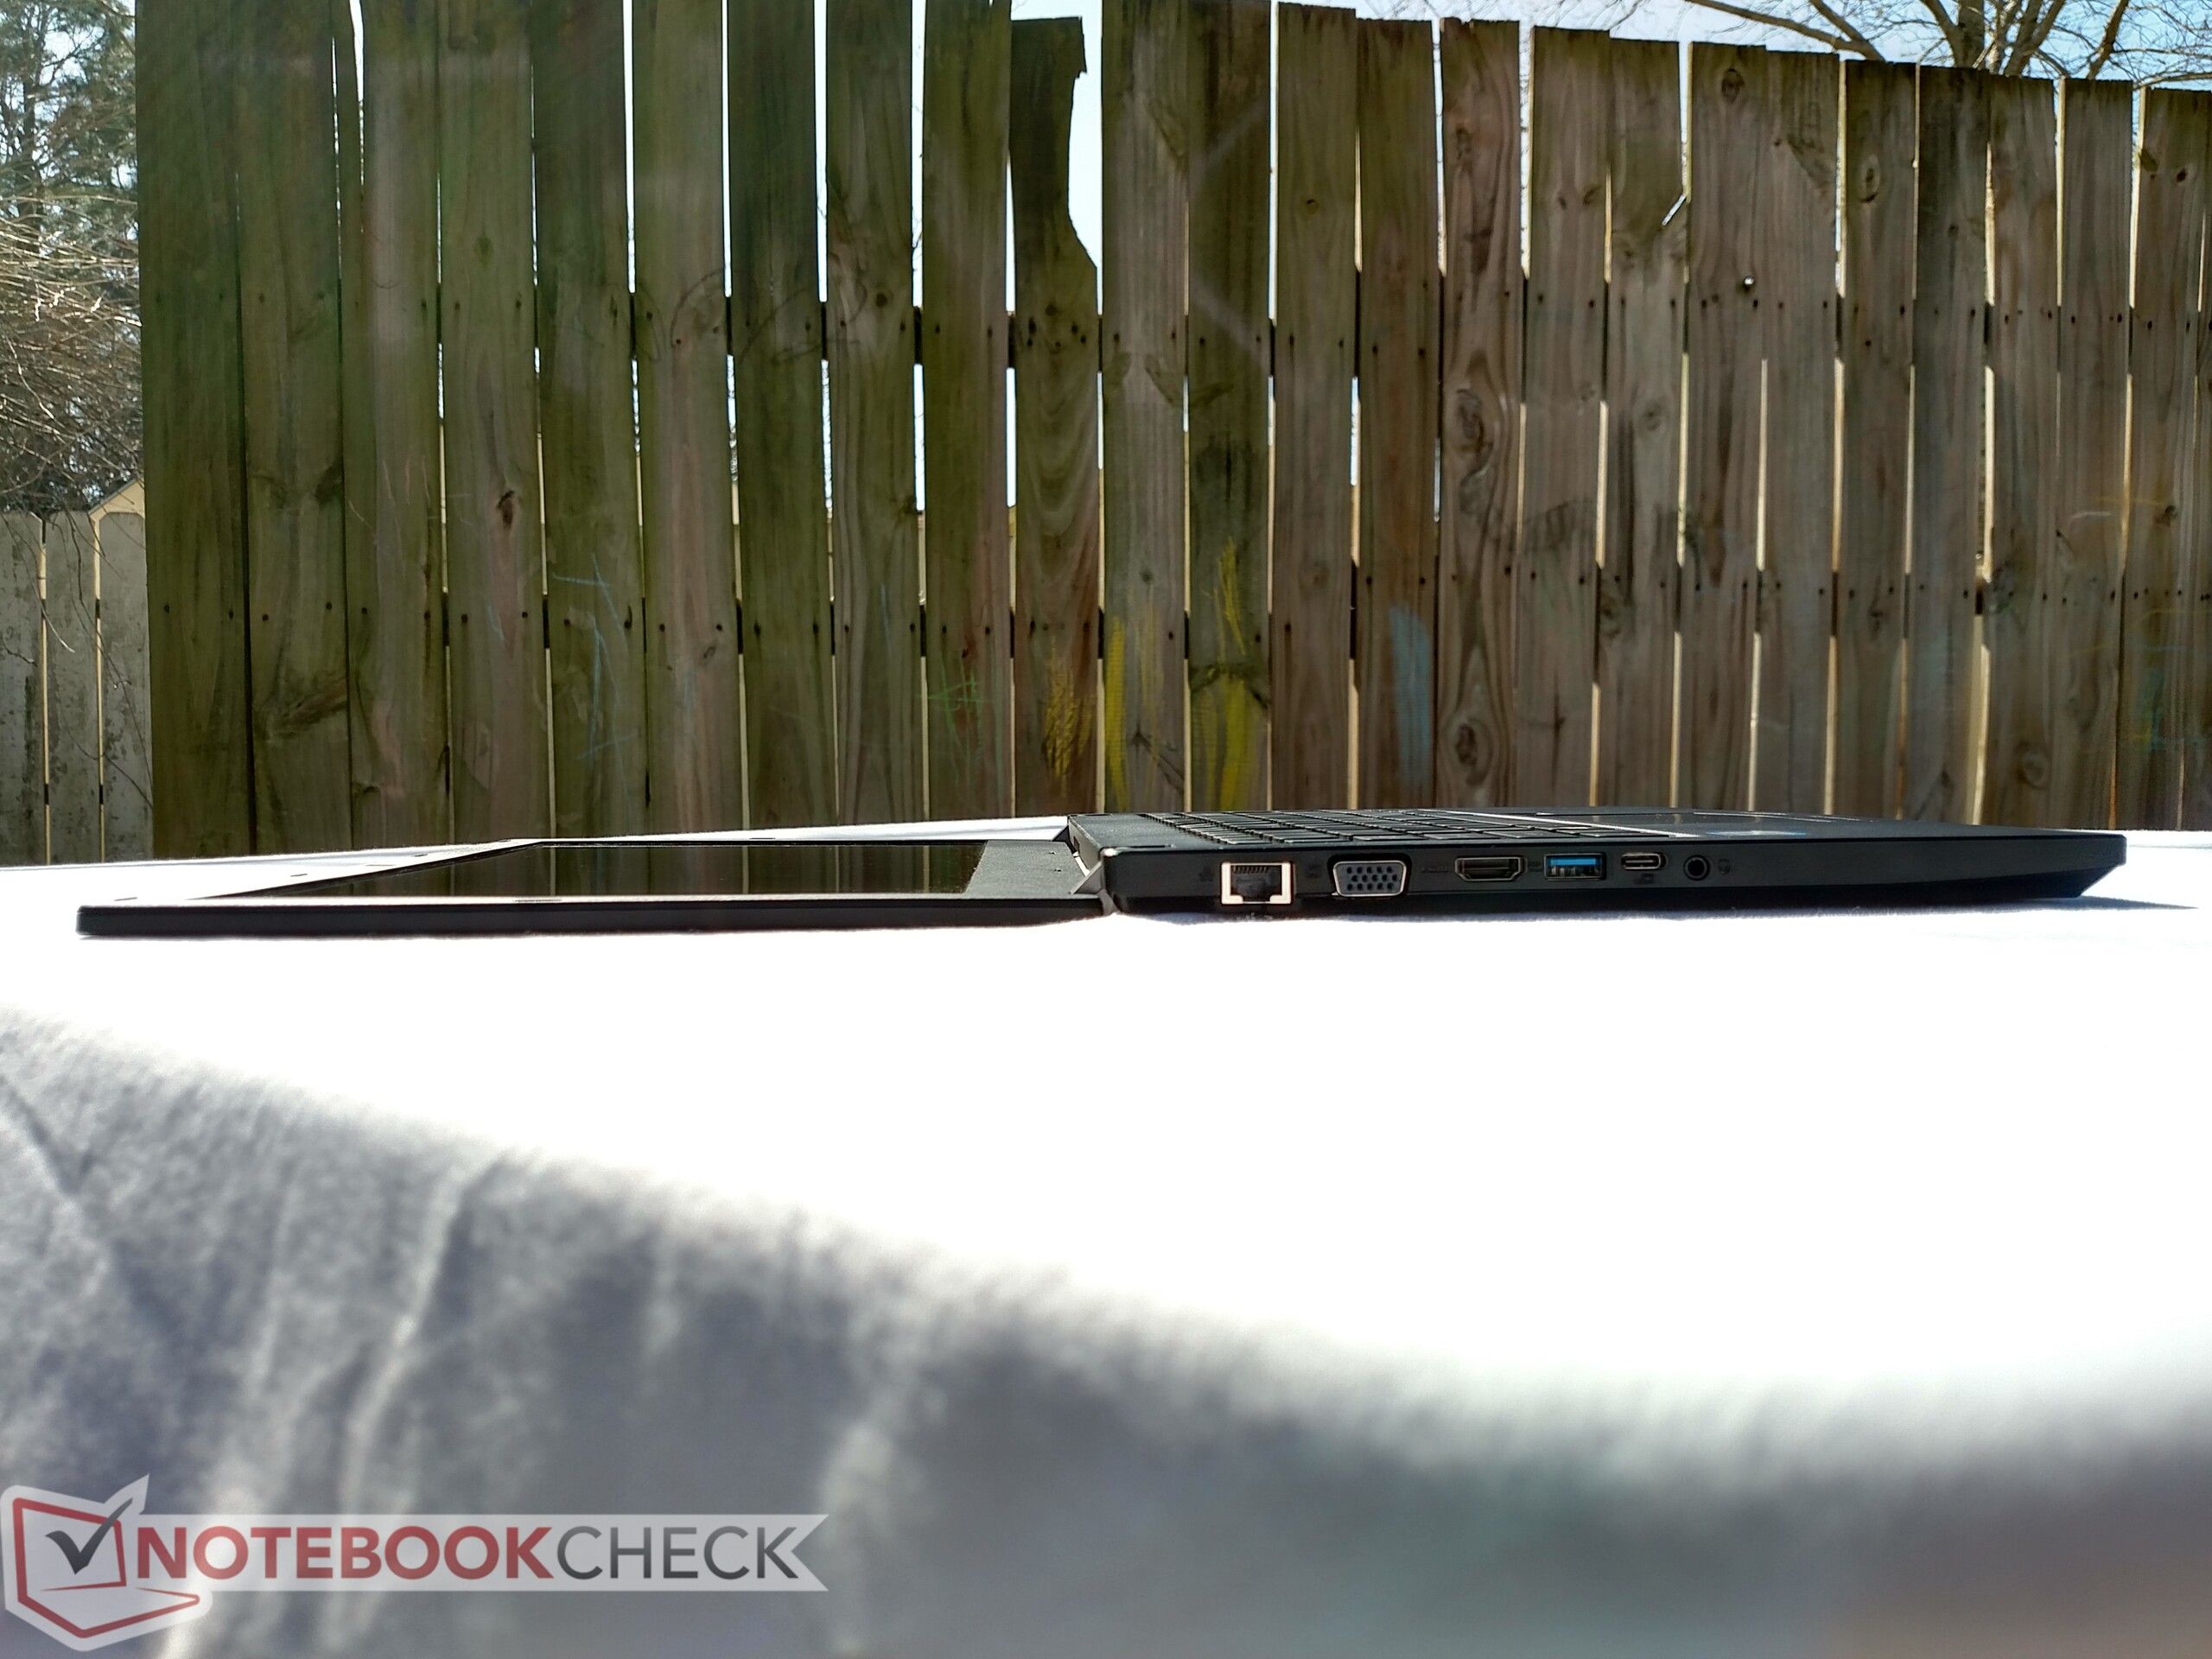
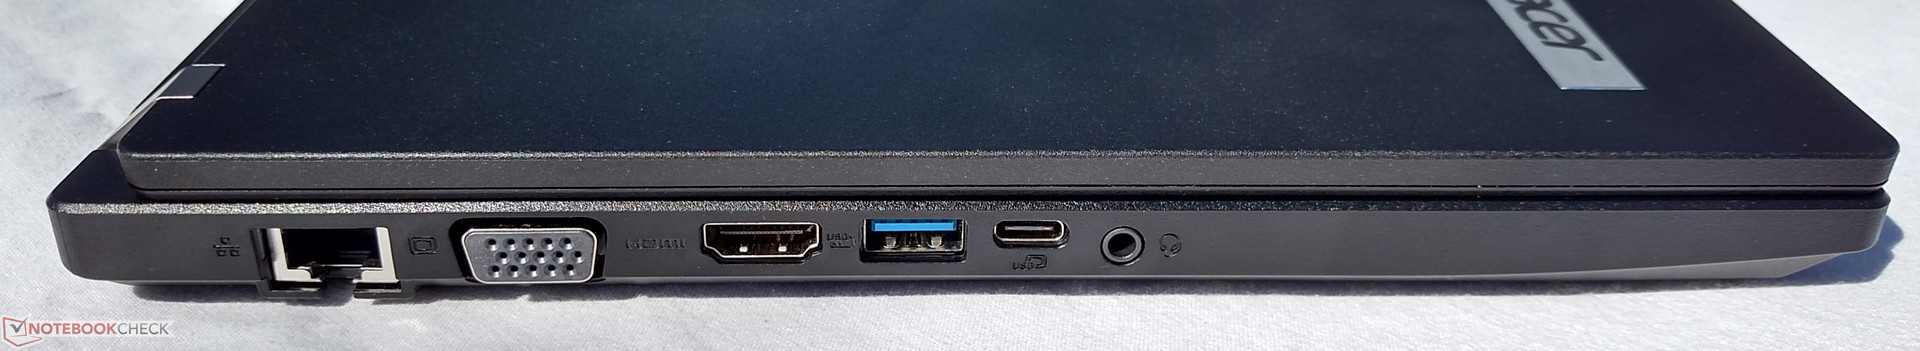
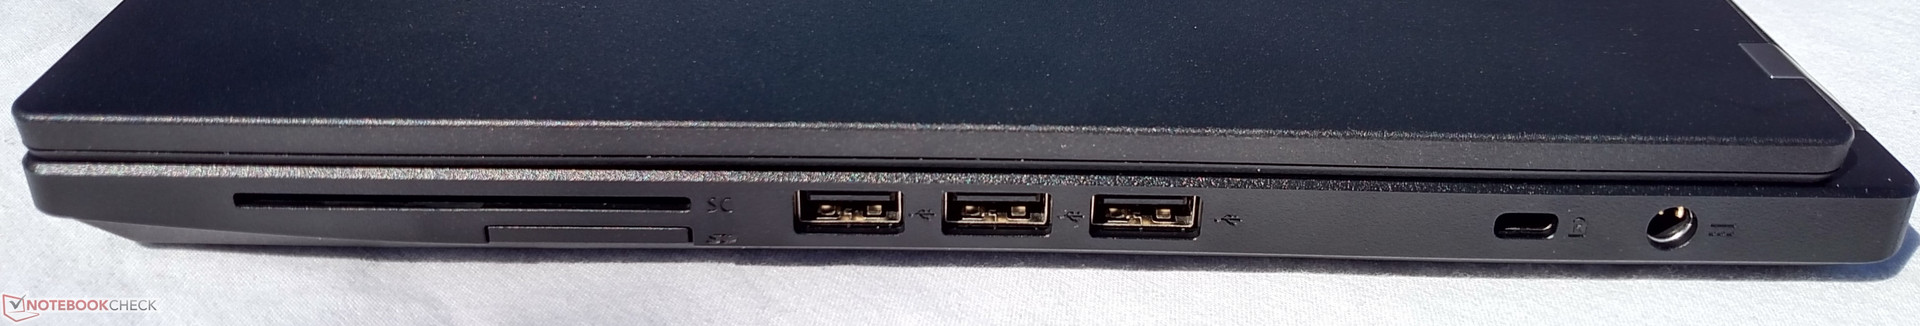
L'Acer TravelMate P449 merita il titolo di "tuttofare". Si tratta di un dispositivo completo che offre molto. Si fa notare per le dimensioni; lo chassis è piccolo e abbastanza leggero da portare in giro, ma lo schermo è grande abbastanza per multitasking e lavori da ufficio. Il case è attraente e professionale, la tastiera è eccellente, le prestazioni più che adeguate per il settore business. Il display ha un contrasto elevato e colori eccellenti. La ventola si fa notare sotto carico estremo, ma le temperature sono gestite bene e il dispositivo resta fresco, anche sotto carico massimo. La selezione delle porte è generosa con 5 USB, 2 opzioni display, e porta ethernet, e la batteria resiste un intero giorno di lavoro.
L'Acer TravelMate P449 è una buona opzione per professionisti che cercano una macchina portatile e duratura. Nonostante le poche pecche, è una ottima opzione per chi è molto in giro e ha un budget limitato.
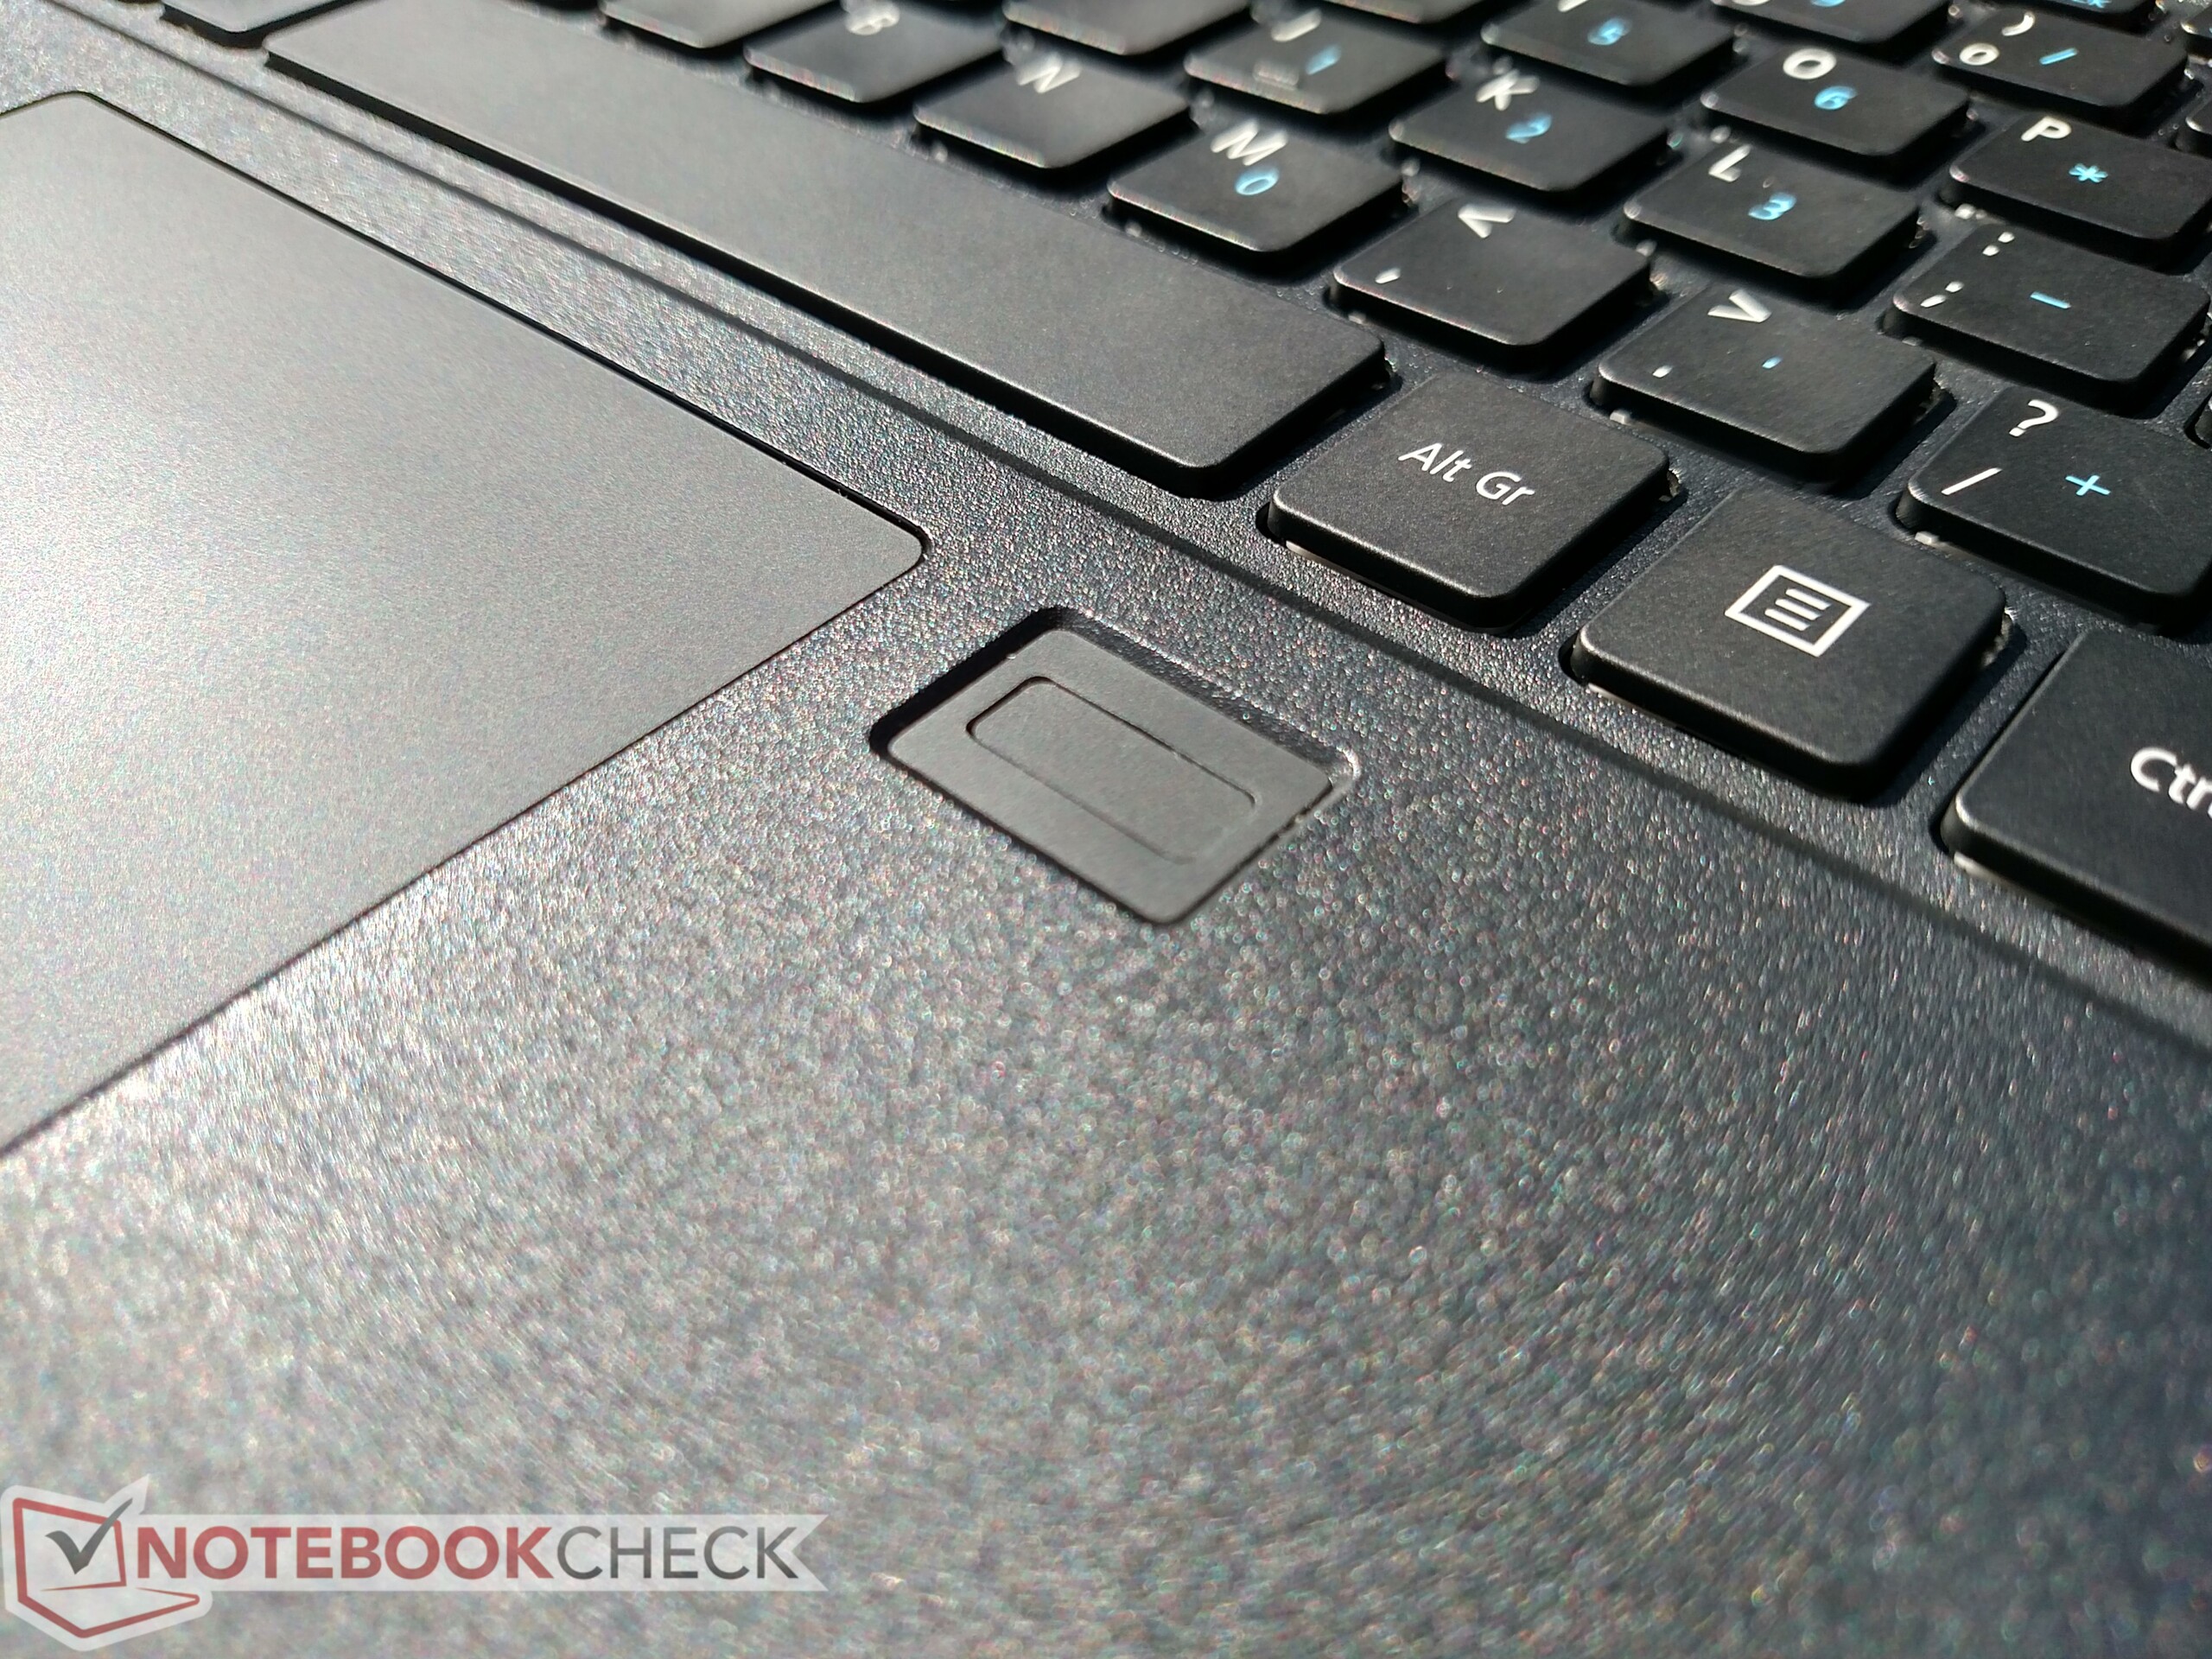
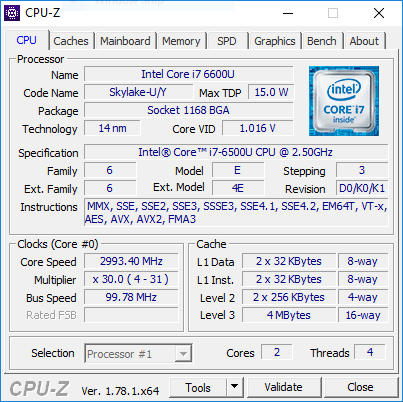
Il TravelMate deve fare qualche sacrificio per contenere il prezzo. Il case è sottile e appare cheap, quindi si intacca la durabilità. Il touchpad è inconsistente e frustrante da usare mentre il lettore di impronte digitali è quasi inutile. Lo schermo è scuro e si vede poco in ambienti luminosi. La maggioranza delle connessioni sono lente o datate, e la CPU Skylake è outdated con evidente throttling.
Nonostante questi limiti. L'Acer TravelMate P449-M-7407 resta una buona opzione nel mercato business sotto i $1000. Tuttavia, il prezzo del Lenovo ThinkPad E470 si fa notare. Per circa $720, l'E470 offre prestazioni e qualità di costruzione migliori, autonomia simile, e un buon display IPS, oltre alla GPU dedicata. Per $130 in più, il ThinkPad può essere dotato di Kaby Lake i7-7500U e 16 GB di RAM. Ricordate che questi modelli non hanno sistema operativo e sono disponibili sono nei mercati education. Il ThinkPad E470 è sicuramente più raccomandabile del TravelMate. Tuttavia, se l'E470 non è disponibile, il P449 è un'ottima seconda scelta.
Nota: si tratta di una recensione breve, con alcune sezioni non tradotte, per la versione integrale in inglese guardate qui.
Acer TravelMate P449-M-7407
- 01/16/2024 v7 (old)
Sam Medley
Price comparison
