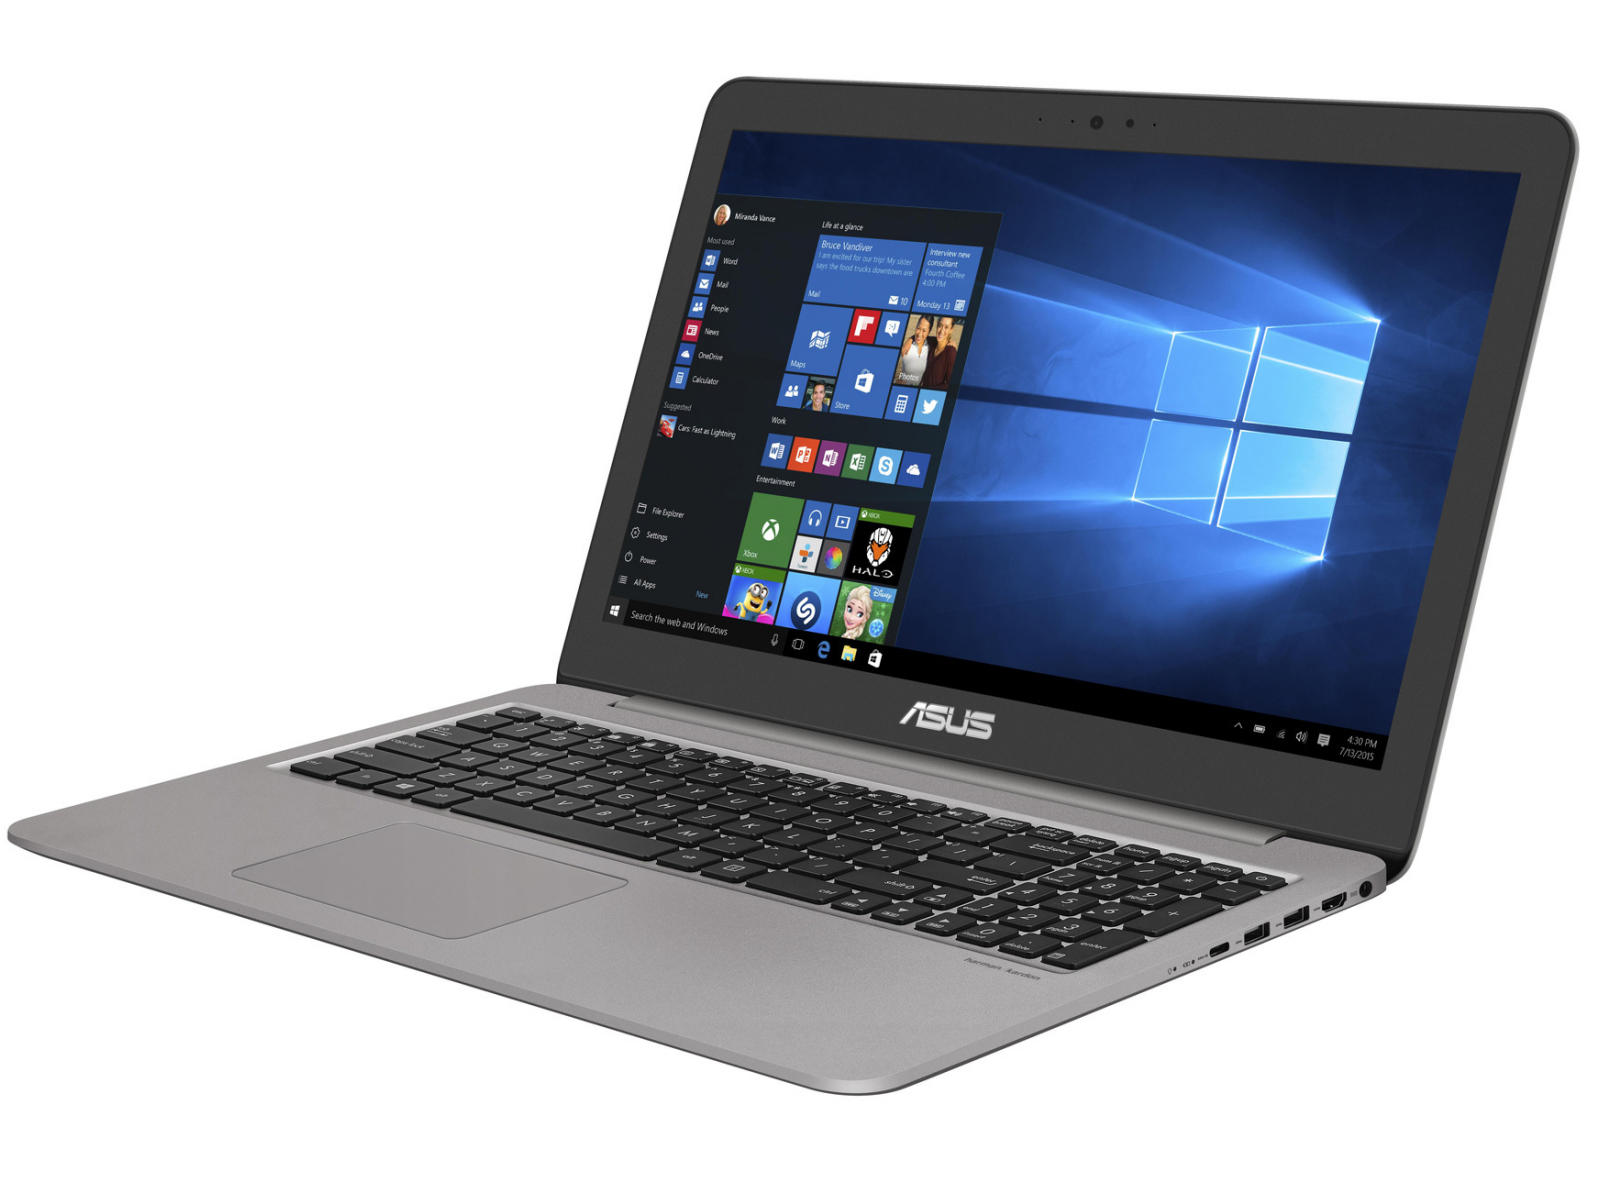
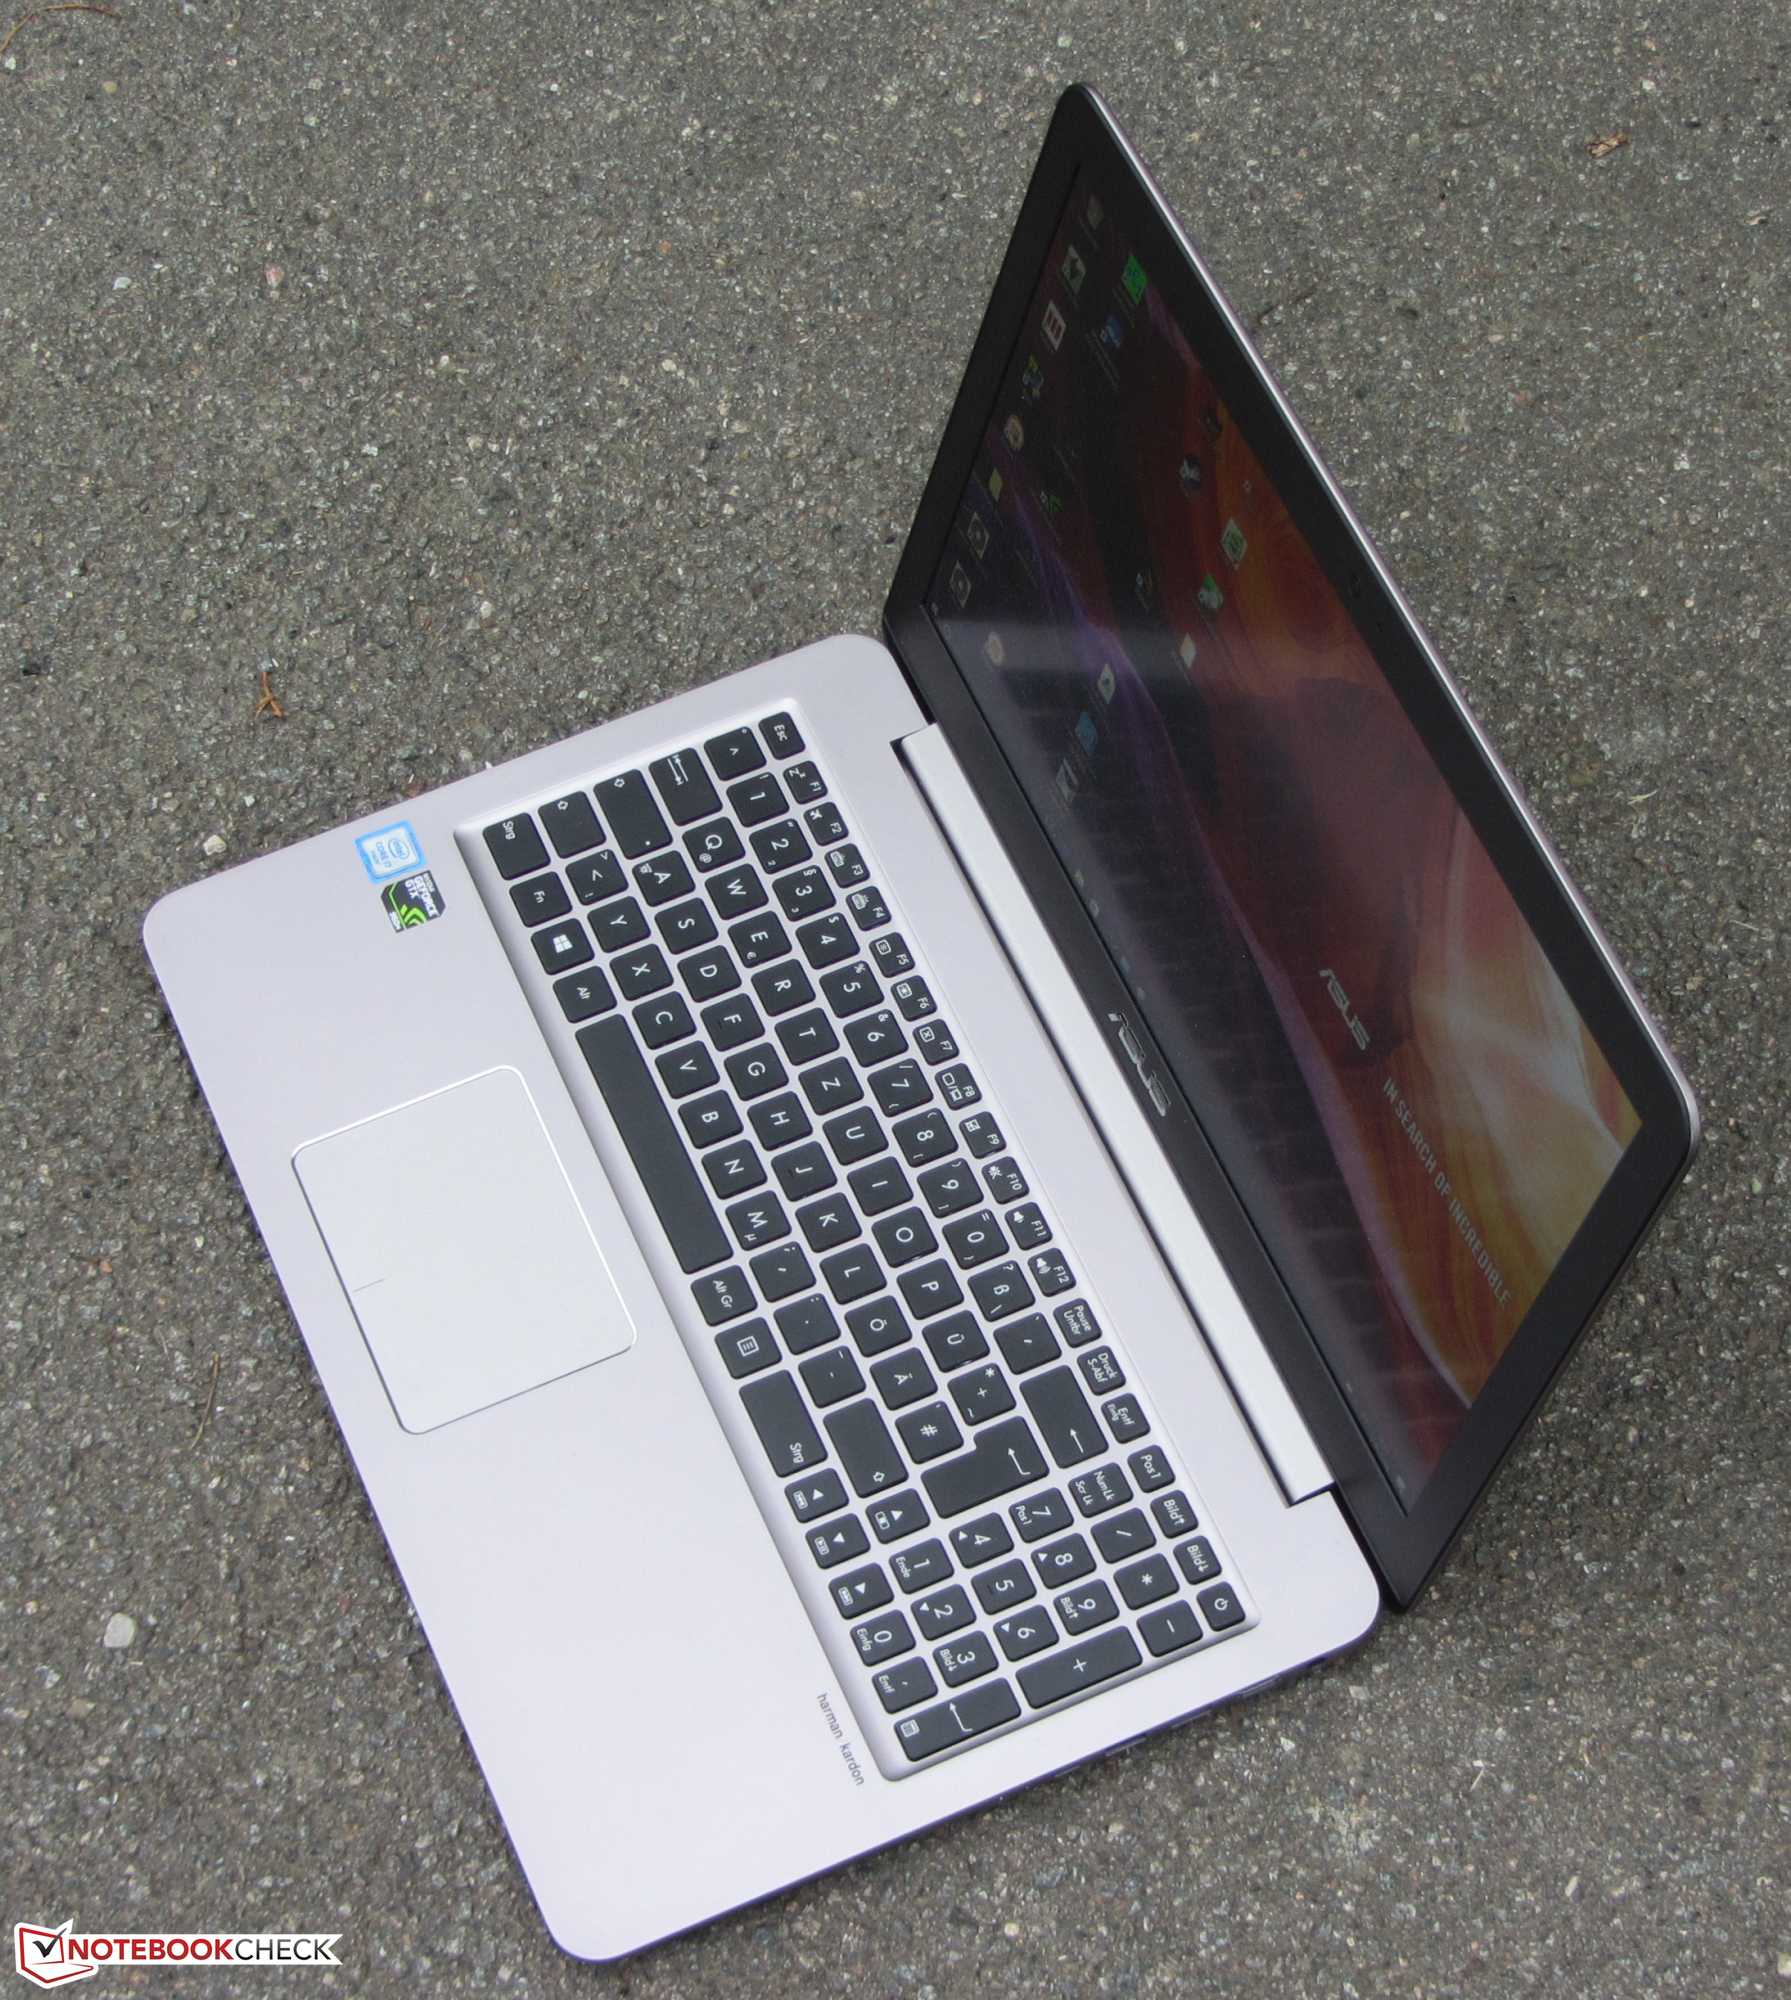
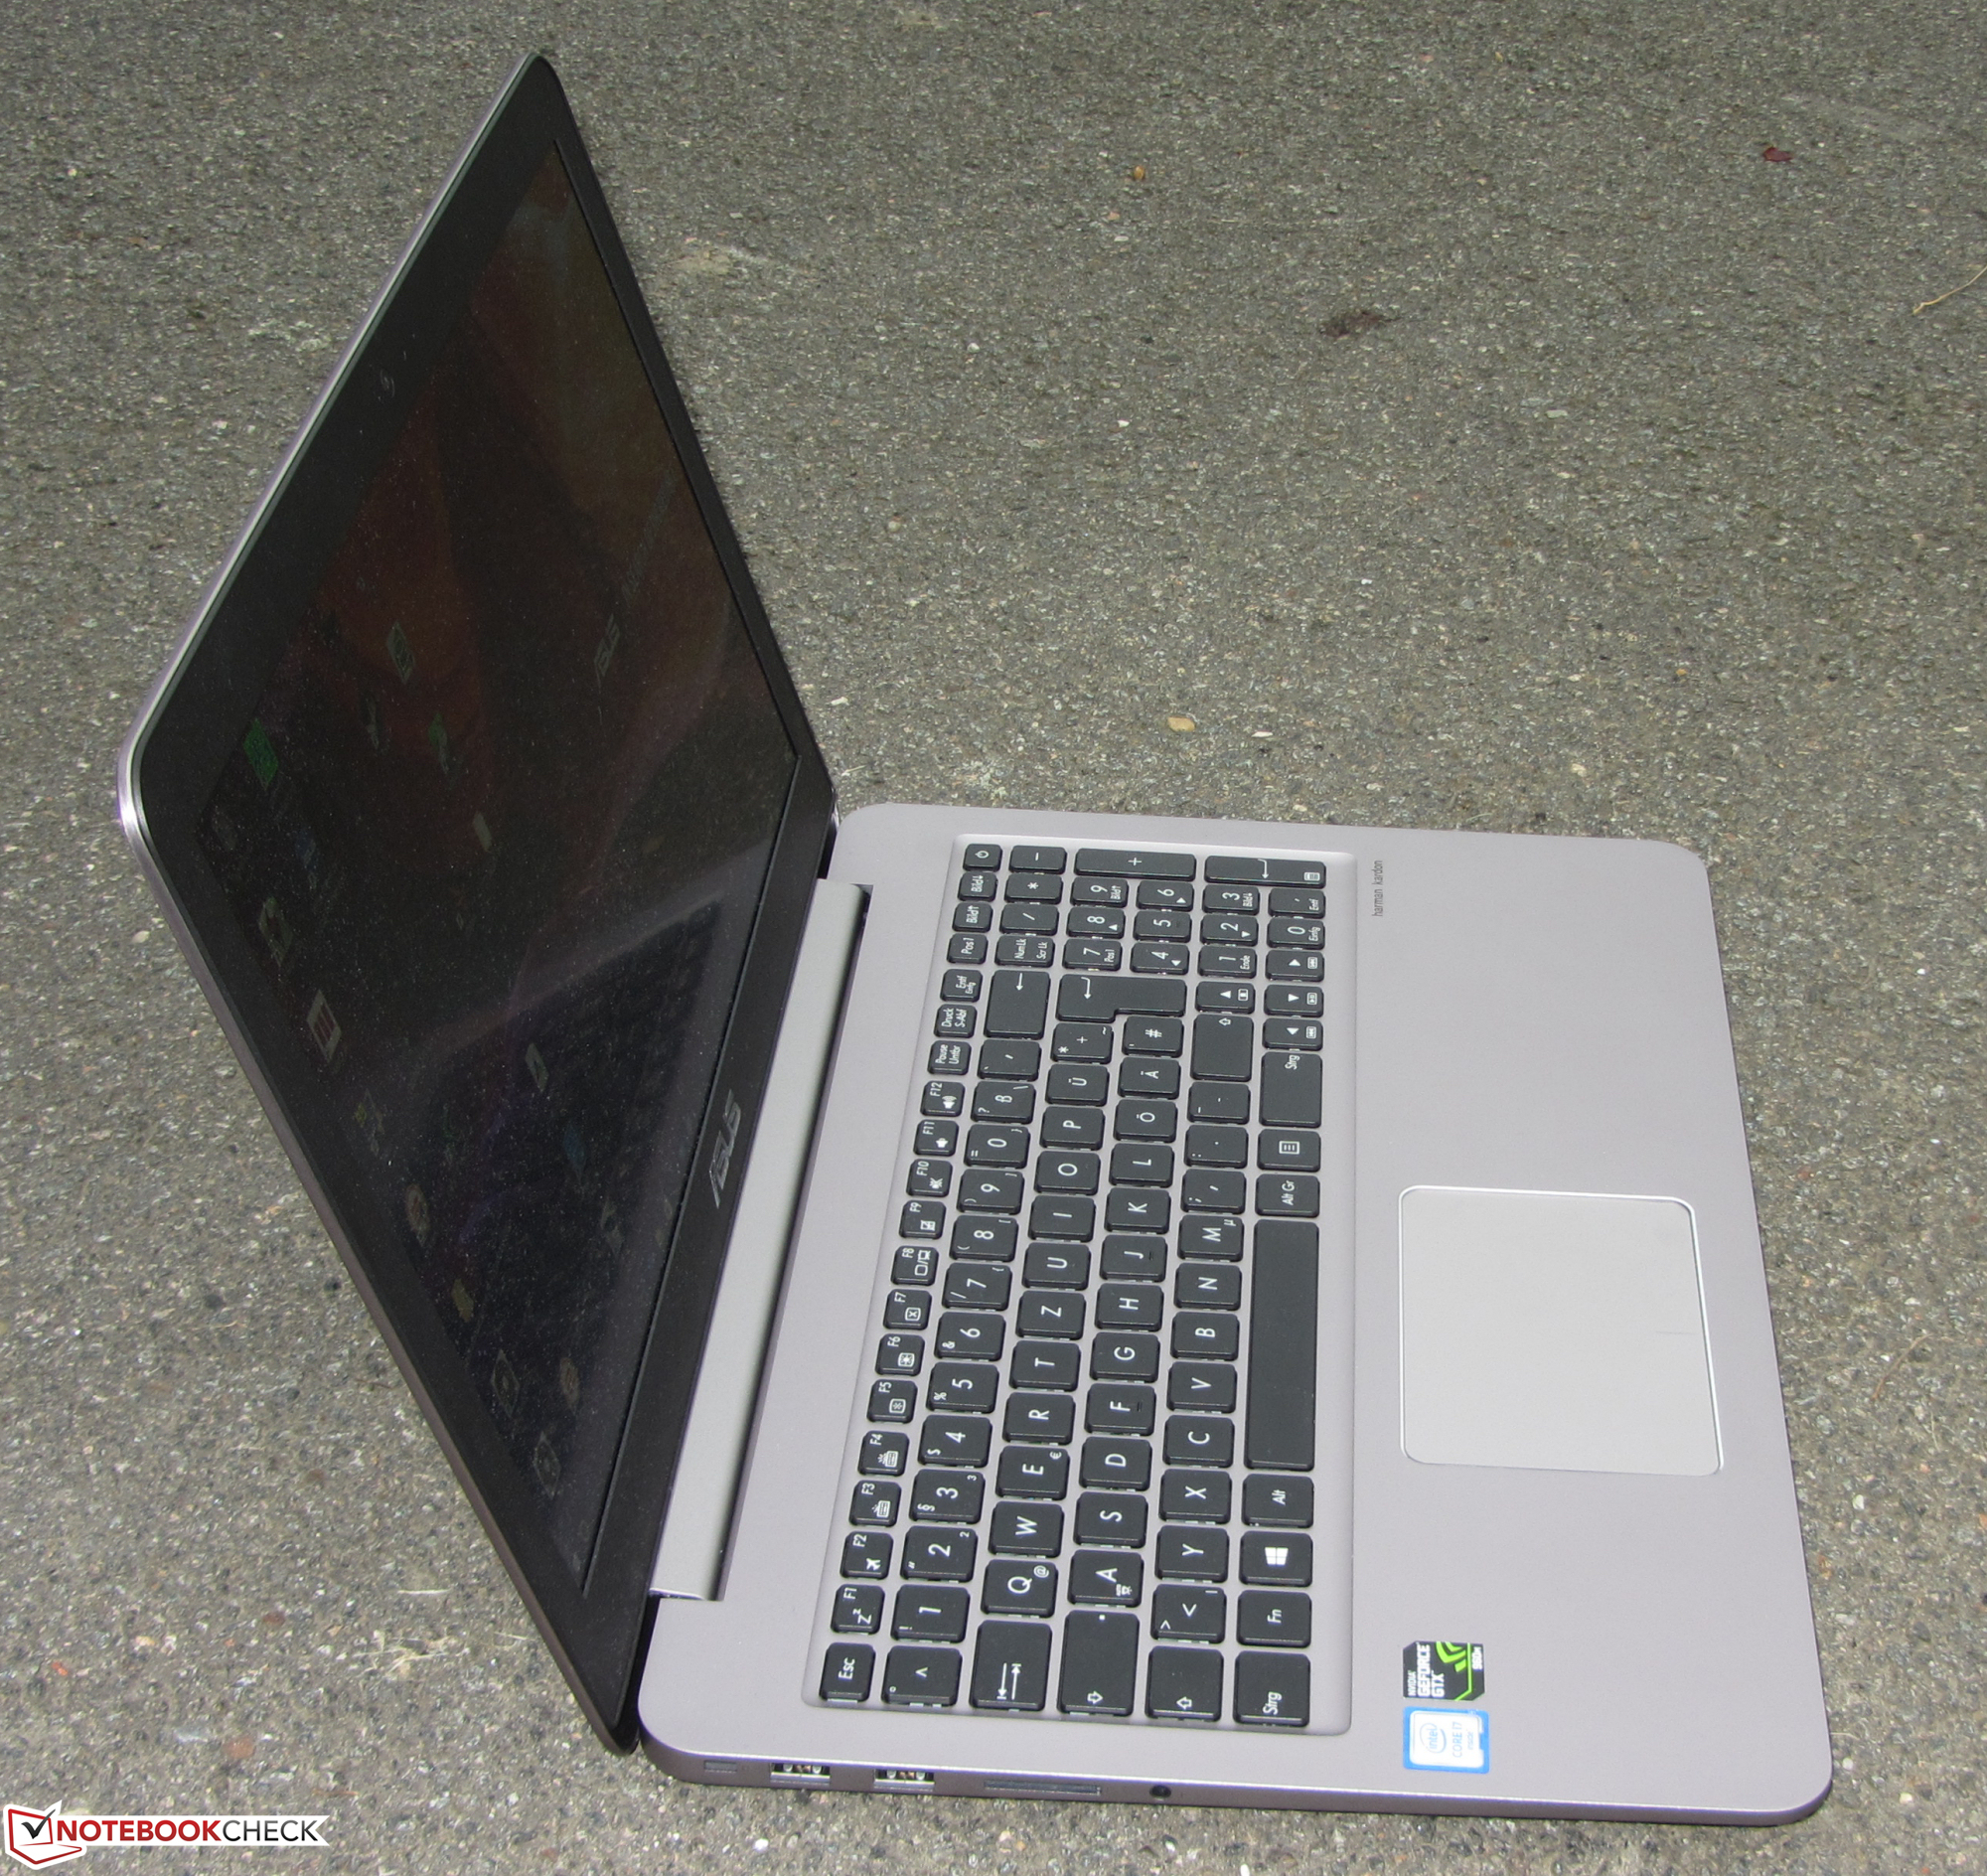
Recensione breve del Portatile Asus Zenbook UX510UW-CN044T


| SD Card Reader | |
| average JPG Copy Test (av. of 3 runs) | |
| HP Omen 15-ax007ng | |
| Asus G501VW-FY081T | |
| Asus Zenbook UX510UW-CN044T | |
| Acer Aspire V15 Nitro BE VN7-592G-79DV | |
| maximum AS SSD Seq Read Test (1GB) | |
| HP Omen 15-ax007ng | |
| Asus G501VW-FY081T | |
| Asus Zenbook UX510UW-CN044T | |
| Acer Aspire V15 Nitro BE VN7-592G-79DV | |
| Networking | |
| iperf Server (receive) TCP 1 m | |
| Asus Zenbook UX510UW-CN044T | |
| HP Omen 15-ax007ng | |
| iperf Client (transmit) TCP 1 m | |
| Asus Zenbook UX510UW-CN044T (jseb) | |
| HP Omen 15-ax007ng | |
| |||||||||||||||||||||||||
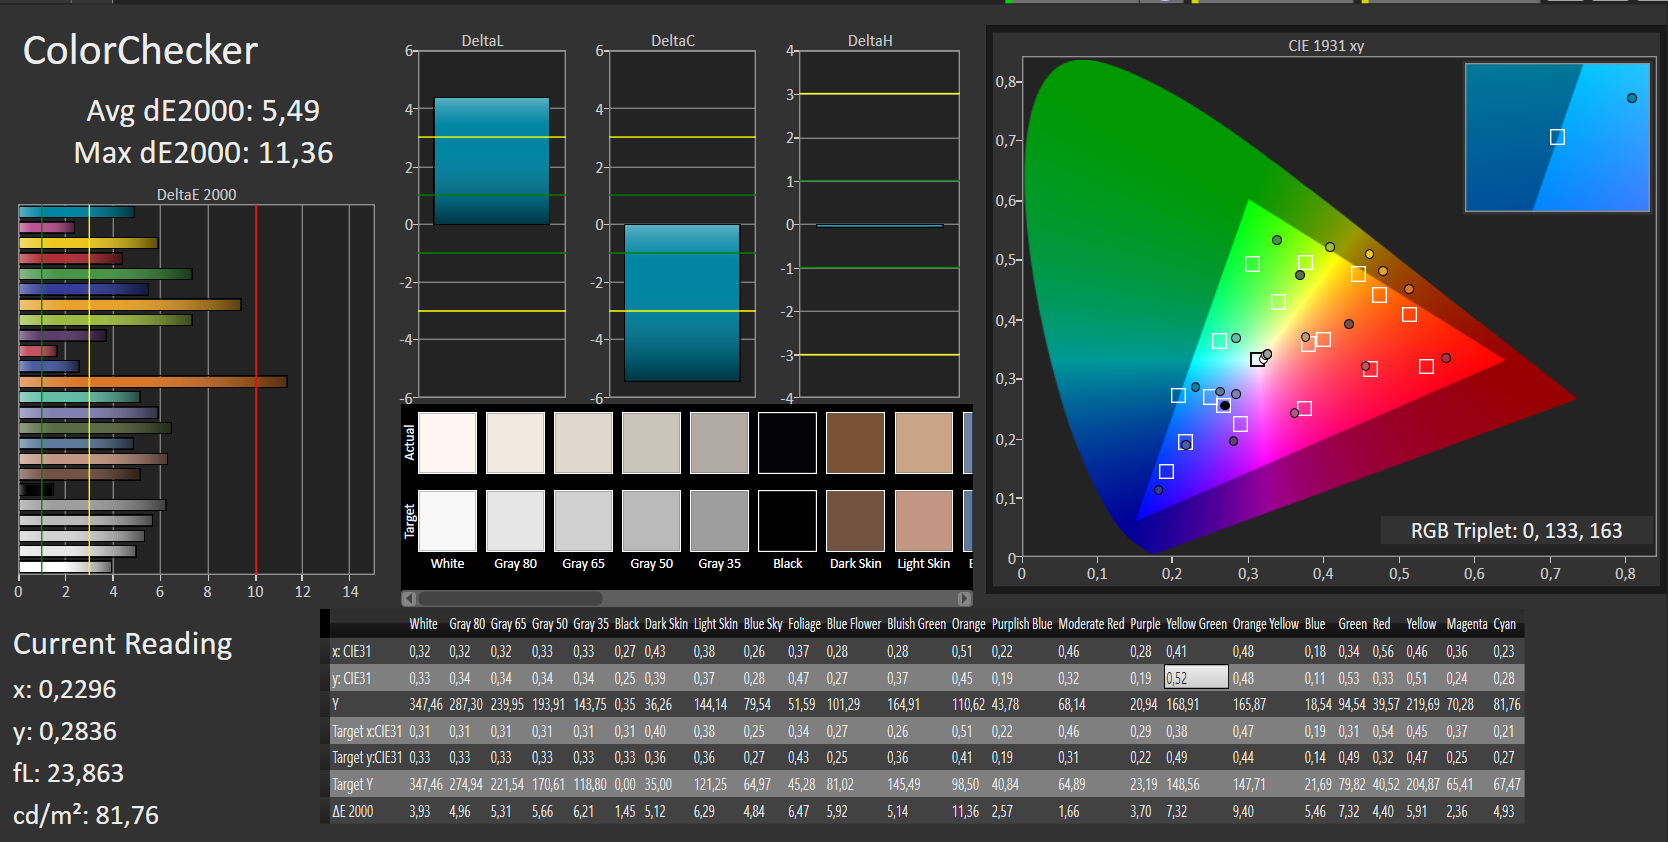
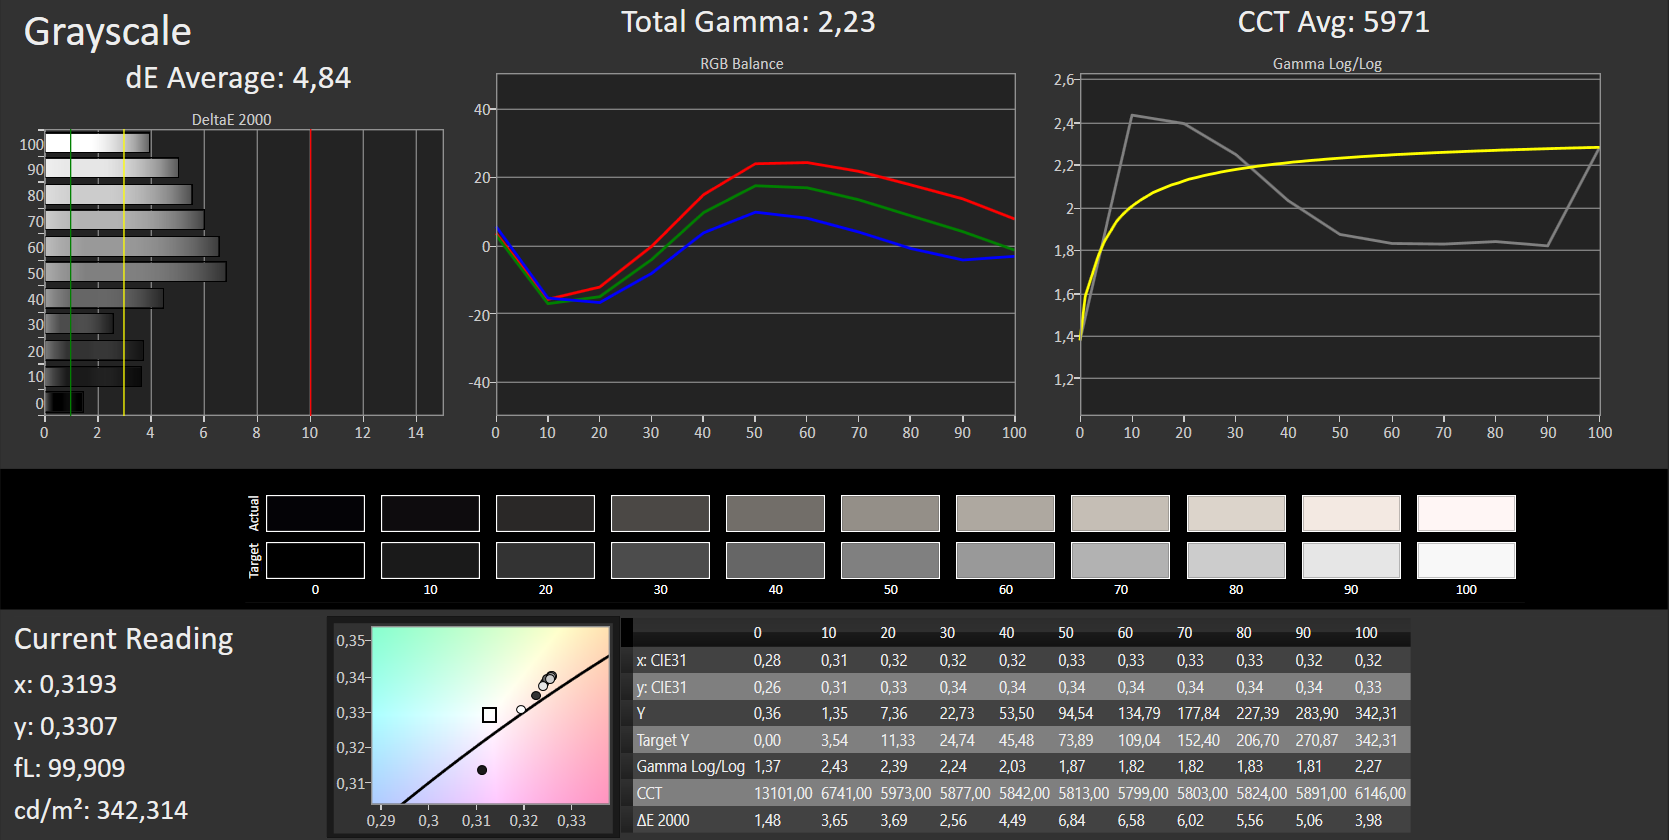
Distribuzione della luminosità: 80 %
Al centro con la batteria: 341 cd/m²
Contrasto: 931:1 (Nero: 0.35 cd/m²)
ΔE ColorChecker Calman: 5.49 | ∀{0.5-29.43 Ø4.71}
ΔE Greyscale Calman: 4.84 | ∀{0.09-98 Ø4.96}
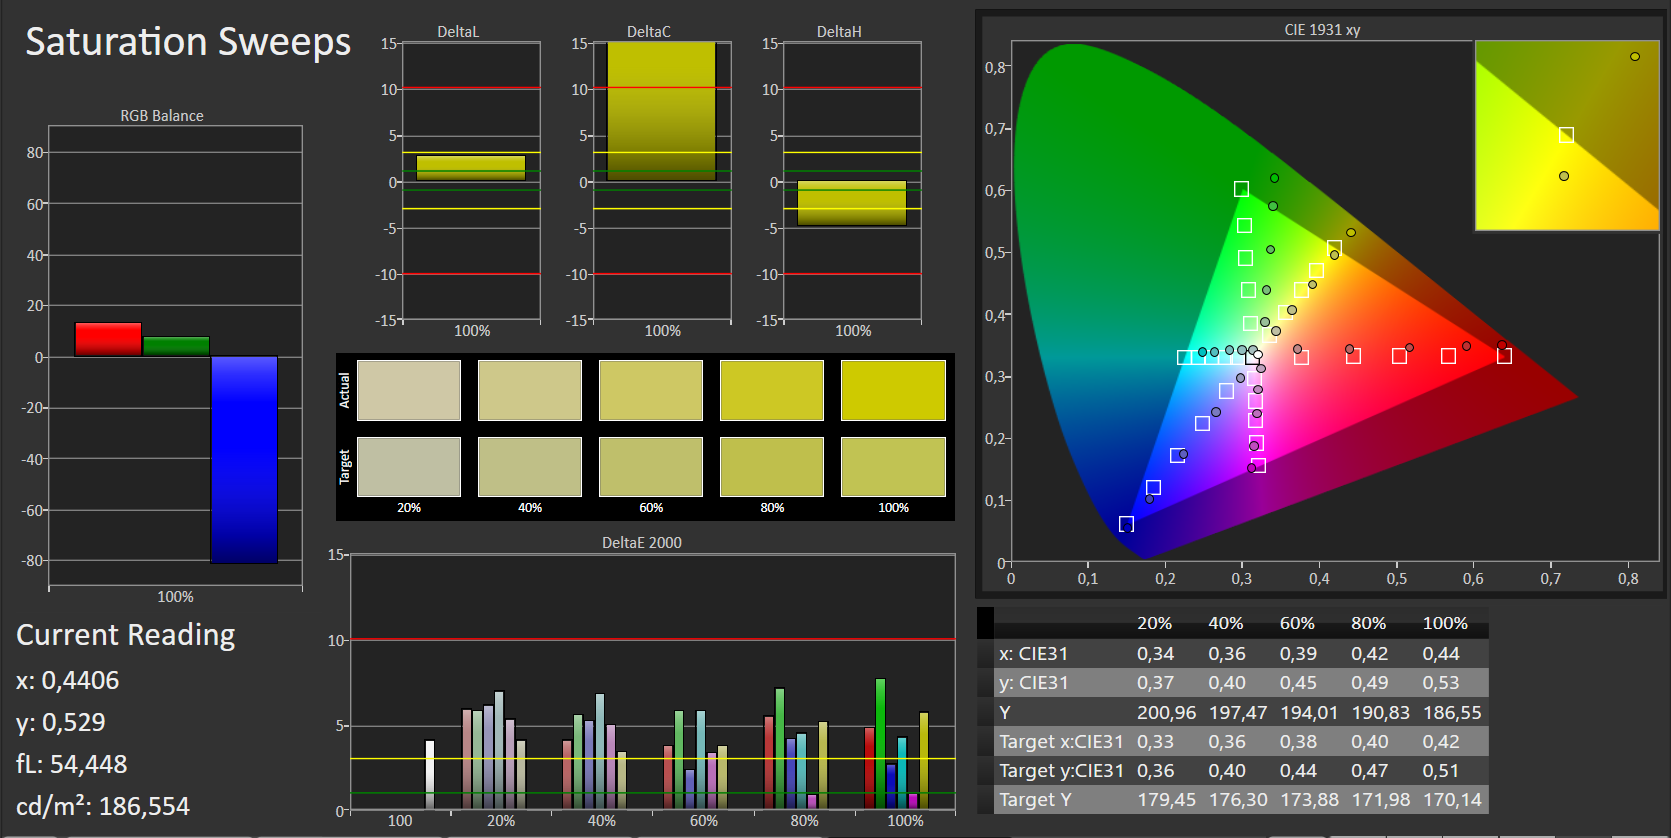
80% sRGB (Argyll 1.6.3 3D)
53% AdobeRGB 1998 (Argyll 1.6.3 3D)
58.8% AdobeRGB 1998 (Argyll 3D)
80.4% sRGB (Argyll 3D)
61.5% Display P3 (Argyll 3D)
Gamma: 2.23
CCT: 5971 K
| Asus Zenbook UX510UW-CN044T IPS, 1920x1080 | Asus ZenBook Pro UX501VW-DS71T IPS, 3840x2160 | Apple MacBook Pro Retina 15 inch 2015-05 IPS-Panel, 2880x1800 | Dell XPS 15 2016 9550 IPS, 1920x1080 | Acer Aspire VN7-572G-72L0 AH-IPS, Normally Black, Transmissive, 1920x1080 | HP Omen 15-ax007ng IPS, 1920x1080 | Asus G501VW-FY081T IPS, 1920x1080 | |
|---|---|---|---|---|---|---|---|
| Display | 9% | 7% | 18% | 2% | -13% | 16% | |
| Display P3 Coverage (%) | 61.5 | 64.3 5% | 61.4 0% | 68.8 12% | 63.6 3% | 59.9 -3% 40.34 -34% | 66.8 9% |
| sRGB Coverage (%) | 80.4 | 89.9 12% | 90.8 13% | 97.9 22% | 82 2% | 85.9 7% 60.3 -25% | 97.3 21% |
| AdobeRGB 1998 Coverage (%) | 58.8 | 65.4 11% | 62.9 7% | 70.7 20% | 59.9 2% | 61.6 5% 41.73 -29% | 68.6 17% |
| Response Times | -7% | -55% | 5% | -29% | -38% | ||
| Response Time Grey 50% / Grey 80% * (ms) | 40 ? | 43.2 ? -8% | 62 ? -55% | 50 ? -25% | 55 ? -38% | 50 ? -25% | |
| Response Time Black / White * (ms) | 26 ? | 27.2 ? -5% | 40 ? -54% | 17 ? 35% | 31 ? -19% | 39 ? -50% | |
| PWM Frequency (Hz) | 362 ? | 200 ? | |||||
| Screen | -11% | 24% | 14% | 8% | -16% | 13% | |
| Brightness middle (cd/m²) | 326 | 252.9 -22% | 341 5% | 399 22% | 328 1% | 214 -34% | 341 5% |
| Brightness (cd/m²) | 316 | 250 -21% | 315 0% | 394 25% | 310 -2% | 203 -36% | 312 -1% |
| Brightness Distribution (%) | 80 | 89 11% | 82 2% | 89 11% | 86 8% | 79 -1% | 83 4% |
| Black Level * (cd/m²) | 0.35 | 0.5 -43% | 0.34 3% | 0.24 31% | 0.33 6% | 0.28 20% | 0.32 9% |
| Contrast (:1) | 931 | 506 -46% | 1003 8% | 1663 79% | 994 7% | 764 -18% | 1066 15% |
| Colorchecker dE 2000 * | 5.49 | 5.22 5% | 2.07 62% | 5.95 -8% | 4.74 14% | 6.04 -10% | 4.23 23% |
| Colorchecker dE 2000 max. * | 11.36 | 8.33 27% | 3.27 71% | 12 -6% | 8.02 29% | ||
| Greyscale dE 2000 * | 4.84 | 6.74 -39% | 1.9 61% | 8.41 -74% | 3.15 35% | 5.91 -22% | 4.69 3% |
| Gamma | 2.23 99% | 2.45 90% | 2.62 84% | 2.35 94% | 2.51 88% | 2.44 90% | 2.53 87% |
| CCT | 5971 109% | 6026 108% | 6514 100% | 7010 93% | 6336 103% | 7362 88% | 7549 86% |
| Color Space (Percent of AdobeRGB 1998) (%) | 53 | 58.4 10% | 58 9% | 64 21% | 54 2% | 38 -28% | 63 19% |
| Color Space (Percent of sRGB) (%) | 80 | 89.7 12% | 91 14% | 98 23% | 82 2% | 60 -25% | 97 21% |
| Media totale (Programma / Settaggio) | -3% /
-6% | 16% /
20% | -8% /
5% | 5% /
6% | -19% /
-16% | -3% /
7% |
* ... Meglio usare valori piccoli
Sfarfallio dello schermo / PWM (Pulse-Width Modulation)
| flickering dello schermo / PWM non rilevato | ||
In confronto: 52 % di tutti i dispositivi testati non utilizza PWM per ridurre la luminosita' del display. Se è rilevato PWM, una media di 7741 (minimo: 5 - massimo: 343500) Hz è stata rilevata. | ||
Tempi di risposta del Display
| ↔ Tempi di risposta dal Nero al Bianco | ||
|---|---|---|
| 26 ms ... aumenta ↗ e diminuisce ↘ combinato | ↗ 6 ms Incremento | 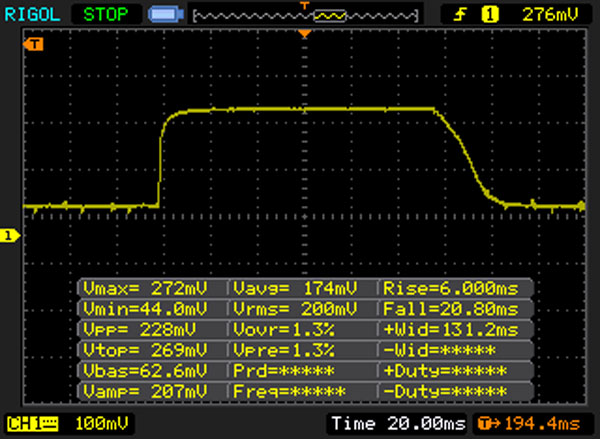 |
| ↘ 20 ms Calo | ||
| Lo schermo mostra tempi di risposta relativamente lenti nei nostri tests e potrebbe essere troppo lento per i gamers. In confronto, tutti i dispositivi di test variano da 0.1 (minimo) a 240 (massimo) ms. » 63 % di tutti i dispositivi è migliore. Questo significa che i tempi di risposta rilevati sono peggiori rispetto alla media di tutti i dispositivi testati (19.8 ms). | ||
| ↔ Tempo di risposta dal 50% Grigio all'80% Grigio | ||
| 40 ms ... aumenta ↗ e diminuisce ↘ combinato | ↗ 20 ms Incremento | 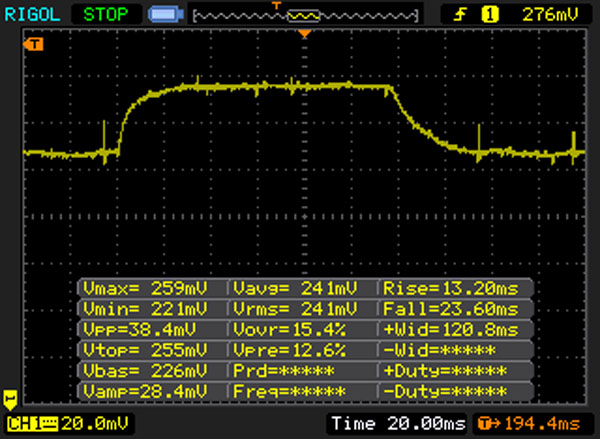 |
| ↘ 20 ms Calo | ||
| Lo schermo mostra tempi di risposta lenti nei nostri tests e sarà insoddisfacente per i gamers. In confronto, tutti i dispositivi di test variano da 0.165 (minimo) a 636 (massimo) ms. » 61 % di tutti i dispositivi è migliore. Questo significa che i tempi di risposta rilevati sono peggiori rispetto alla media di tutti i dispositivi testati (30.9 ms). | ||
| Geekbench 4.0 | |
| 64 Bit Single-Core Score | |
| Asus Zenbook UX510UW-CN044T | |
| 64 Bit Multi-Core Score | |
| Asus Zenbook UX510UW-CN044T | |
| JetStream 1.1 - 1.1 Total | |
| Asus G501VW-FY081T | |
| Acer Aspire V15 Nitro BE VN7-592G-79DV | |
| Asus Zenbook UX510UW-CN044T | |
| PCMark 7 Score | 4986 punti | |
| PCMark 8 Home Score Accelerated v2 | 3370 punti | |
| PCMark 8 Creative Score Accelerated v2 | 4118 punti | |
| PCMark 8 Work Score Accelerated v2 | 4341 punti | |
Aiuto | ||
| PCMark 8 | |
| Home Score Accelerated v2 | |
| HP Omen 15-ax007ng | |
| Apple MacBook Pro Retina 15 inch 2015-05 | |
| Dell XPS 15 2016 9550 | |
| Asus G501VW-FY081T | |
| Acer Aspire VN7-572G-72L0 | |
| Asus Zenbook UX510UW-CN044T | |
| Acer Aspire V15 Nitro BE VN7-592G-79DV | |
| Asus ZenBook Pro UX501VW-DS71T | |
| Work Score Accelerated v2 | |
| HP Omen 15-ax007ng | |
| Apple MacBook Pro Retina 15 inch 2015-05 | |
| Asus G501VW-FY081T | |
| Acer Aspire VN7-572G-72L0 | |
| Asus Zenbook UX510UW-CN044T | |
| Acer Aspire V15 Nitro BE VN7-592G-79DV | |
| Asus ZenBook Pro UX501VW-DS71T | |

| Asus Zenbook UX510UW-CN044T SanDisk SD8SNAT256G1002 | Asus ZenBook Pro UX501VW-DS71T Samsung SM951 MZVPV512HDGL m.2 PCI-e | Apple MacBook Pro Retina 15 inch 2015-05 Apple SSD SM0512G | Dell XPS 15 2016 9550 WDC WD10SPCX-75KHST0 + LiteON CS1-SP32-11 M.2 2242 32GB | Acer Aspire VN7-572G-72L0 Lite-On CV1-8B128 | HP Omen 15-ax007ng Adata IM2S3138E-128GM-B | |
|---|---|---|---|---|---|---|
| CrystalDiskMark 3.0 | 236% | 172% | -40% | -34% | 6% | |
| Read Seq (MB/s) | 459.3 | 1633 256% | 1442 214% | 238.6 -48% | 435.3 -5% | 475.7 4% |
| Write Seq (MB/s) | 325.5 | 1579 385% | 1558 379% | 64 -80% | 178.2 -45% | 169.2 -48% |
| Read 512 (MB/s) | 279.2 | 1068 283% | 897 221% | 321 15% | 310 11% | 327.6 17% |
| Write 512 (MB/s) | 280.1 | 1570 461% | 1430 411% | 44.78 -84% | 167.8 -40% | 169.6 -39% |
| Read 4k (MB/s) | 22.43 | 50.4 125% | 19.27 -14% | 31.36 40% | 13.7 -39% | 33.14 48% |
| Write 4k (MB/s) | 74.9 | 128.6 72% | 30.98 -59% | 1.051 -99% | 27.86 -63% | 81.4 9% |
| Read 4k QD32 (MB/s) | 149 | 534 258% | 403.1 171% | 199.5 34% | 121.1 -19% | 276.8 86% |
| Write 4k QD32 (MB/s) | 234 | 344 47% | 353.2 51% | 1.085 -100% | 74.8 -68% | 168 -28% |
| 3DMark 06 Standard Score | 19872 punti | |
| 3DMark 11 Performance | 4732 punti | |
| 3DMark Ice Storm Standard Score | 47117 punti | |
| 3DMark Cloud Gate Standard Score | 10115 punti | |
| 3DMark Fire Strike Score | 3651 punti | |
| 3DMark Fire Strike Extreme Score | 1915 punti | |
| 3DMark Time Spy Score | 1206 punti | |
Aiuto | ||
| basso | medio | alto | ultra | |
|---|---|---|---|---|
| Tomb Raider (2013) | 232.6 | 153.6 | 110.2 | 50.1 |
| BioShock Infinite (2013) | 143.6 | 103.5 | 92.3 | 39.4 |
| Battlefield 4 (2013) | 110.7 | 93.5 | 70.9 | 33 |
| Batman: Arkham Knight (2015) | 64 | 57 | 31 | 18 |
| Star Wars Battlefront (2015) | 104.8 | 69.7 | 35 | 30.2 |
| Far Cry Primal (2016) | 61 | 29 | 26 | 19 |
| Ashes of the Singularity (2016) | 31.2 | 23.1 | 20.5 | |
| Doom (2016) | 73.9 | 60.4 | 35.1 | 34.7 |
| Mirror's Edge Catalyst (2016) | 64.8 | 49 | 26.2 | 23.3 |
| No Man's Sky (2016) | 46.2 | 39.7 | 24.3 | 10.9 |
| Deus Ex Mankind Divided (2016) | 38.1 | 30.2 | 17.1 | 9.8 |
| FIFA 17 (2016) | 147.6 | 132.7 | 83 | 81.5 |
| Mafia 3 (2016) | 34.2 | 24.2 | 11 |
| BioShock Infinite - 1366x768 High Preset | |
| Saelic Veni G731 | |
| Hyperbook SL502 VR | |
| Acer Aspire V15 Nitro BE VN7-592G-79DV | |
| Asus ZenBook Pro UX501VW-DS71T | |
| Asus G501VW-FY081T | |
| Dell XPS 15 2016 9550 | |
| Asus Zenbook UX510UW-CN044T | |
| Lenovo Y700-15ACZ | |
| Apple MacBook Pro Retina 15 inch 2015-05 | |
| Battlefield 4 - 1366x768 High Preset | |
| Acer Aspire V15 Nitro BE VN7-592G-79DV | |
| Dell XPS 15 2016 9550 | |
| Asus G501VW-FY081T | |
| Asus Zenbook UX510UW-CN044T | |
| Lenovo Y700-15ACZ | |
| Apple MacBook Pro Retina 15 inch 2015-05 | |
| Tomb Raider - 1920x1080 Ultra Preset AA:FX AF:16x | |
| Acer Aspire V15 Nitro BE VN7-592G-79DV | |
| Asus G501VW-FY081T | |
| Asus ZenBook Pro UX501VW-DS71T | |
| Asus Zenbook UX510UW-CN044T | |
| Lenovo Y700-15ACZ | |
| Apple MacBook Pro Retina 15 inch 2015-05 | |
| Doom - 1366x768 Medium Preset | |
| HP Omen 15-ax007ng | |
| Asus Zenbook UX510UW-CN044T | |
| Batman: Arkham Knight - 1366x768 Normal / Off AF:4x | |
| Asus ZenBook Pro UX501VW-DS71T | |
| Asus Zenbook UX510UW-CN044T | |
| Lenovo Y700-15ACZ | |
| Star Wars Battlefront - 1366x768 Medium Preset AA:FX | |
| Asus Zenbook UX510UW-CN044T | |
| Lenovo Y700-15ACZ | |
| Deus Ex Mankind Divided - 1920x1080 High Preset AF:4x | |
| MSI GS63VR-6RF16H22 Stealth Pro | |
| Asus Zenbook UX510UW-CN044T | |
Rumorosità
| Idle |
| 31.6 / 31.6 / 33.4 dB(A) |
| Sotto carico |
| 41.7 / 44.8 dB(A) |
 | ||
30 dB silenzioso 40 dB(A) udibile 50 dB(A) rumoroso |
||
min: | ||
| Asus Zenbook UX510UW-CN044T 6500U, GeForce GTX 960M | Asus ZenBook Pro UX501VW-DS71T 6700HQ, GeForce GTX 960M | Apple MacBook Pro Retina 15 inch 2015-05 4870HQ, Radeon R9 M370X | Dell XPS 15 2016 9550 6300HQ, GeForce GTX 960M | Acer Aspire V15 Nitro BE VN7-592G-79DV 6700HQ, GeForce GTX 960M | Acer Aspire VN7-572G-72L0 6500U, GeForce GTX 950M | HP Omen 15-ax007ng 6700HQ, GeForce GTX 965M | Asus G501VW-FY081T 6700HQ, GeForce GTX 960M | |
|---|---|---|---|---|---|---|---|---|
| Noise | 6% | 4% | -1% | -3% | -0% | -3% | -0% | |
| off /ambiente * (dB) | 31.6 | 31.3 1% | 30 5% | 31.2 1% | ||||
| Idle Minimum * (dB) | 31.6 | 28.9 9% | 28.9 9% | 32.6 -3% | 31.2 1% | 29.6 6% | 32 -1% | 32.1 -2% |
| Idle Average * (dB) | 31.6 | 28.9 9% | 28.9 9% | 33.6 -6% | 31.2 1% | 32.1 -2% | 33 -4% | 32.1 -2% |
| Idle Maximum * (dB) | 33.4 | 30.2 10% | 28.9 13% | 33.6 -1% | 36.2 -8% | 32.8 2% | 36 -8% | 32.1 4% |
| Load Average * (dB) | 41.7 | 41.8 -0% | 46 -10% | 37.1 11% | 45.3 -9% | 41.4 1% | 43 -3% | 43.3 -4% |
| Load Maximum * (dB) | 44.8 | 43.9 2% | 46 -3% | 47.5 -6% | 47.3 -6% | 48.4 -8% | 49 -9% | 44.3 1% |
* ... Meglio usare valori piccoli
(+) La temperatura massima sul lato superiore è di 35.6 °C / 96 F, rispetto alla media di 36.8 °C / 98 F, che varia da 21 a 71 °C per questa classe Multimedia.
(+) Il lato inferiore si riscalda fino ad un massimo di 37 °C / 99 F, rispetto alla media di 39.1 °C / 102 F
(+) In idle, la temperatura media del lato superiore è di 23.4 °C / 74 F, rispetto alla media deld ispositivo di 31.3 °C / 88 F.
(+) I poggiapolsi e il touchpad sono piu' freddi della temperatura della pelle con un massimo di 26.2 °C / 79.2 F e sono quindi freddi al tatto.
(+) La temperatura media della zona del palmo della mano di dispositivi simili e'stata di 28.7 °C / 83.7 F (+2.5 °C / 4.5 F).
| Asus Zenbook UX510UW-CN044T 6500U, GeForce GTX 960M | Asus ZenBook Pro UX501VW-DS71T 6700HQ, GeForce GTX 960M | Apple MacBook Pro Retina 15 inch 2015-05 4870HQ, Radeon R9 M370X | Dell XPS 15 2016 9550 6300HQ, GeForce GTX 960M | Acer Aspire V15 Nitro BE VN7-592G-79DV 6700HQ, GeForce GTX 960M | Acer Aspire VN7-572G-72L0 6500U, GeForce GTX 950M | HP Omen 15-ax007ng 6700HQ, GeForce GTX 965M | Asus G501VW-FY081T 6700HQ, GeForce GTX 960M | |
|---|---|---|---|---|---|---|---|---|
| Heat | -19% | -17% | -53% | -34% | -23% | -30% | -16% | |
| Maximum Upper Side * (°C) | 35.6 | 44.2 -24% | 43.2 -21% | 62.5 -76% | 50.1 -41% | 48.4 -36% | 48.5 -36% | 41 -15% |
| Maximum Bottom * (°C) | 37 | 48 -30% | 39 -5% | 54.4 -47% | 56.2 -52% | 46 -24% | 59 -59% | 48.2 -30% |
| Idle Upper Side * (°C) | 24.8 | 26.2 -6% | 30 -21% | 33.5 -35% | 28.3 -14% | 28.9 -17% | 28.7 -16% | 26.4 -6% |
| Idle Bottom * (°C) | 24.1 | 27.8 -15% | 29.3 -22% | 36.7 -52% | 31.1 -29% | 27.9 -16% | 25.7 -7% | 26.7 -11% |
* ... Meglio usare valori piccoli
Asus Zenbook UX510UW-CN044T analisi audio
(±) | potenza degli altiparlanti media ma buona (73 dB)
Bassi 100 - 315 Hz
(±) | bassi ridotti - in media 14.8% inferiori alla media
(±) | la linearità dei bassi è media (7.2% delta rispetto alla precedente frequenza)
Medi 400 - 2000 Hz
(+) | medi bilanciati - solo only 3% rispetto alla media
(+) | medi lineari (6.3% delta rispetto alla precedente frequenza)
Alti 2 - 16 kHz
(±) | alti elevati - circa 6% superiori alla media
(+) | alti lineari (4.6% delta rispetto alla precedente frequenza)
Nel complesso 100 - 16.000 Hz
(±) | la linearità complessiva del suono è media (16.6% di differenza rispetto alla media
Rispetto alla stessa classe
» 44% di tutti i dispositivi testati in questa classe è stato migliore, 7% simile, 50% peggiore
» Il migliore ha avuto un delta di 5%, medio di 17%, peggiore di 45%
Rispetto a tutti i dispositivi testati
» 29% di tutti i dispositivi testati in questa classe è stato migliore, 6% similare, 65% peggiore
» Il migliore ha avuto un delta di 4%, medio di 23%, peggiore di 134%
Apple MacBook 12 (Early 2016) 1.1 GHz analisi audio
(+) | gli altoparlanti sono relativamente potenti (83.6 dB)
Bassi 100 - 315 Hz
(±) | bassi ridotti - in media 11.3% inferiori alla media
(±) | la linearità dei bassi è media (14.2% delta rispetto alla precedente frequenza)
Medi 400 - 2000 Hz
(+) | medi bilanciati - solo only 2.4% rispetto alla media
(+) | medi lineari (5.5% delta rispetto alla precedente frequenza)
Alti 2 - 16 kHz
(+) | Alti bilanciati - appena 2% dalla media
(+) | alti lineari (4.5% delta rispetto alla precedente frequenza)
Nel complesso 100 - 16.000 Hz
(+) | suono nel complesso lineare (10.2% differenza dalla media)
Rispetto alla stessa classe
» 7% di tutti i dispositivi testati in questa classe è stato migliore, 2% simile, 90% peggiore
» Il migliore ha avuto un delta di 5%, medio di 18%, peggiore di 53%
Rispetto a tutti i dispositivi testati
» 5% di tutti i dispositivi testati in questa classe è stato migliore, 1% similare, 94% peggiore
» Il migliore ha avuto un delta di 4%, medio di 23%, peggiore di 134%
| Off / Standby | |
| Idle | |
| Sotto carico |
|
Leggenda:
min: | |
| Asus Zenbook UX510UW-CN044T 6500U, GeForce GTX 960M | Apple MacBook Pro Retina 15 inch 2015-05 4870HQ, Radeon R9 M370X | Dell XPS 15 2016 9550 6300HQ, GeForce GTX 960M | Acer Aspire V15 Nitro BE VN7-592G-79DV 6700HQ, GeForce GTX 960M | Acer Aspire VN7-572G-72L0 6500U, GeForce GTX 950M | HP Omen 15-ax007ng 6700HQ, GeForce GTX 965M | Asus G501VW-FY081T 6700HQ, GeForce GTX 960M | |
|---|---|---|---|---|---|---|---|
| Power Consumption | -25% | -46% | -51% | 0% | -39% | -24% | |
| Idle Minimum * (Watt) | 5 | 6 -20% | 9.9 -98% | 8.9 -78% | 5.2 -4% | 7 -40% | 6.9 -38% |
| Idle Average * (Watt) | 8.9 | 12.8 -44% | 12.6 -42% | 13.9 -56% | 9.4 -6% | 11 -24% | 10.7 -20% |
| Idle Maximum * (Watt) | 11.8 | 13.3 -13% | 16.8 -42% | 15.6 -32% | 10.8 8% | 19 -61% | 13.2 -12% |
| Load Average * (Watt) | 55 | 82.4 -50% | 70 -27% | 89 -62% | 60 -9% | 79 -44% | 82 -49% |
| Load Maximum * (Watt) | 93 | 91.8 1% | 114 -23% | 118 -27% | 80.9 13% | 119 -28% | 94 -1% |
* ... Meglio usare valori piccoli
| Asus Zenbook UX510UW-CN044T 6500U, 48 Wh | Asus ZenBook Pro UX501VW-DS71T 6700HQ, 96 Wh | Apple MacBook Pro Retina 15 inch 2015-05 4870HQ, 100 Wh | Dell XPS 15 2016 9550 6300HQ, 56 Wh | Acer Aspire V15 Nitro BE VN7-592G-79DV 6700HQ, 52 Wh | Acer Aspire VN7-572G-72L0 6500U, 53 Wh | HP Omen 15-ax007ng 6700HQ, 61.5 Wh | Asus G501VW-FY081T 6700HQ, 60 Wh | |
|---|---|---|---|---|---|---|---|---|
| Autonomia della batteria | -1% | 9% | -7% | -37% | 0% | -31% | -27% | |
| Reader / Idle (h) | 13.6 | 11.5 -15% | 17.3 27% | 9.1 -33% | 8.8 -35% | 12.7 -7% | 7.8 -43% | 10.2 -25% |
| H.264 (h) | 7.1 | 6.9 -3% | 6 -15% | 3.9 -45% | 4.1 -42% | 5.1 -28% | ||
| WiFi v1.3 (h) | 7.2 | 6.3 -12% | 7.2 0% | 5.5 -24% | 3.6 -50% | 6 -17% | 4.5 -37% | 5.5 -24% |
| Load (h) | 1.6 | 2 25% | 1.8 13% | 2.3 44% | 1.3 -19% | 2 25% | 1.6 0% | 1.1 -31% |
Pro
Contro
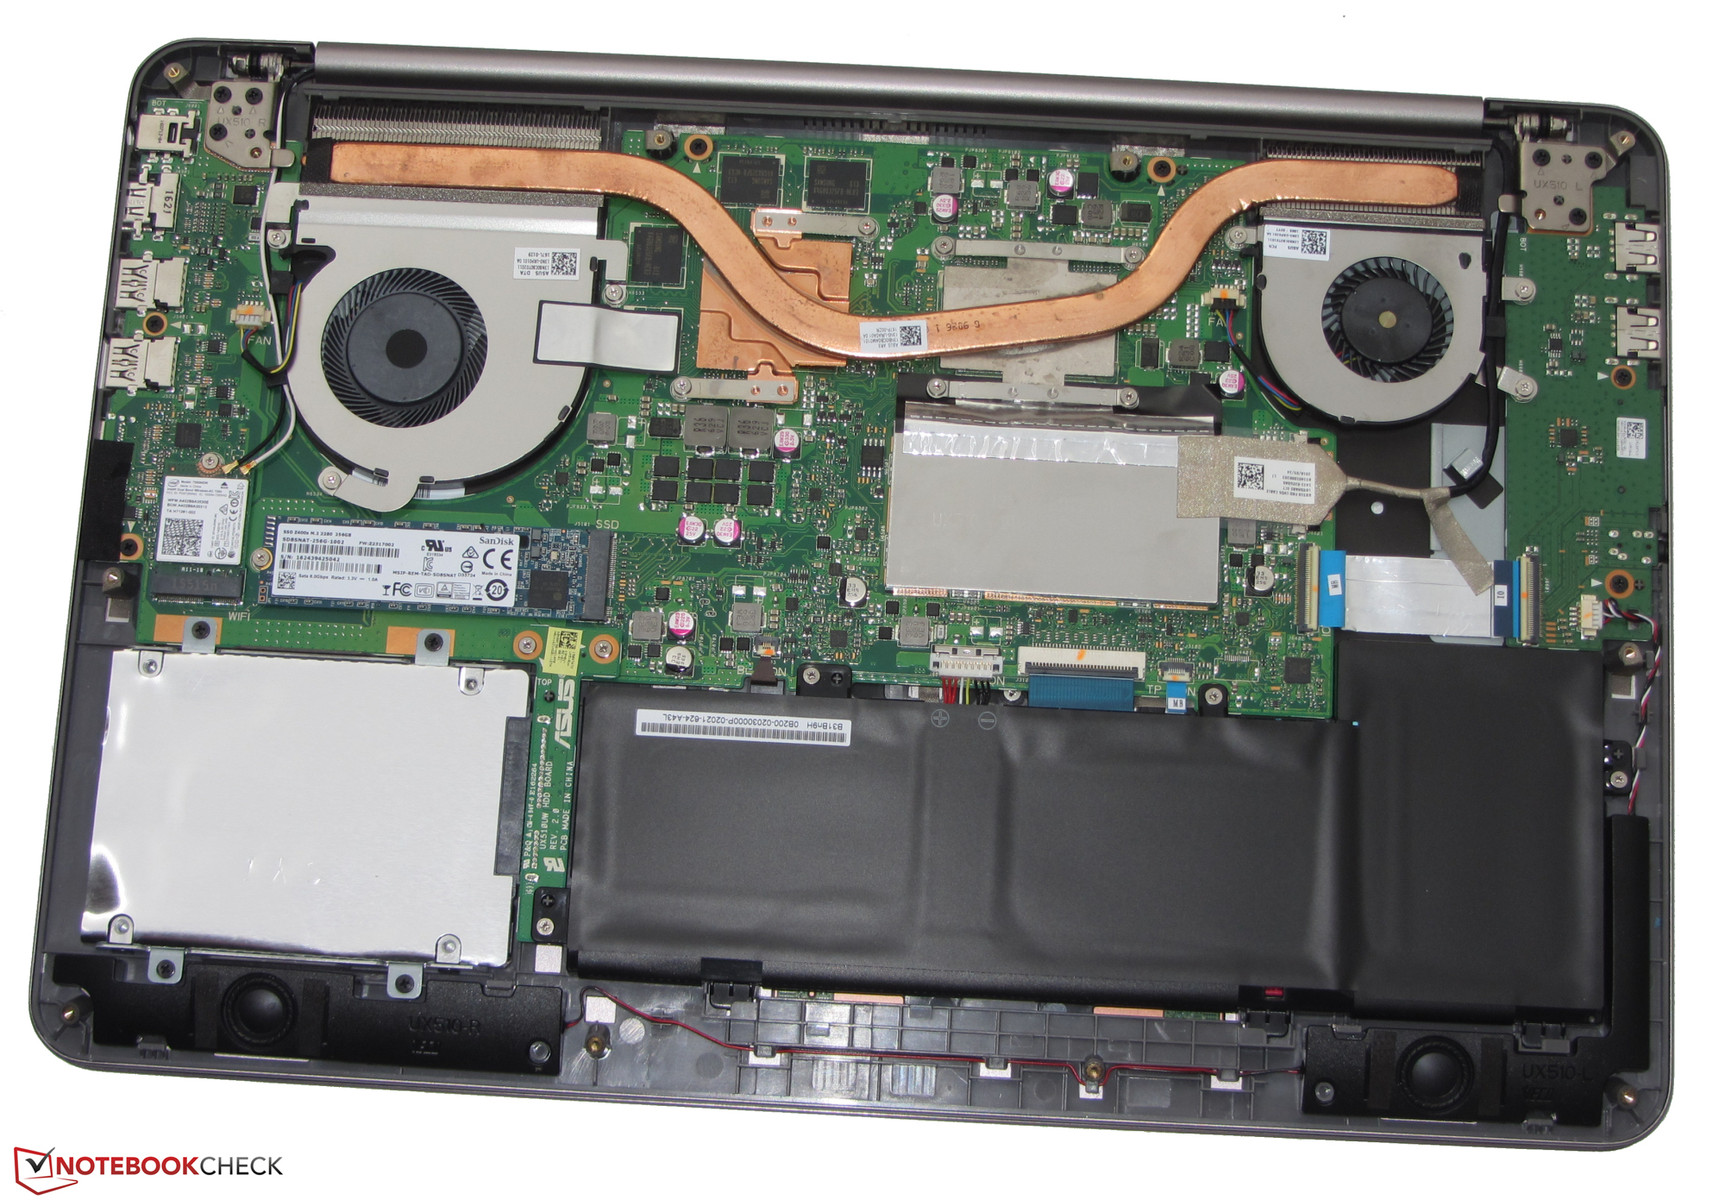
Lo è dotato di un processore Core i7 che ha una potenza più che sufficiente per l'uso quotidiano. Asus rinuncia ad un processore quad-core ed invece installa un processore dual-core ULV. Questo ha un effetto positivo sulla ergonomia e durata della batteria. Tuttavia, lo Zenbook resta un po' dietro il frame rate di altri computer gaming con GTX 960m. Ciò nonostante, quasi tutti i giochi attuali possono essere utilizzati sullo Zenbook. Il laptop funziona in modo silenzioso, almeno in modalità inattiva e si riscalda poco anche sotto sforzo. Un SSD veloce garantisce un sistema scattante. Il disco rigido da 2,5 pollici installato inoltre fornisce la capacità di memorizzazione necessaria. Il pannello opaco IPS dello Zenbook soddisfa con una buona luminosità, un buon contrasto e angoli di visualizzazione stabili. L'intero pacchetto è completato da una decente durata della batteria.
Con lo Zenbook UX510UW, Asus ha un successo a tutto tondo con le qualità di gioco che permetteno anche l'uso mobile grazie ad una buona durata della batteria nella sua offerta.
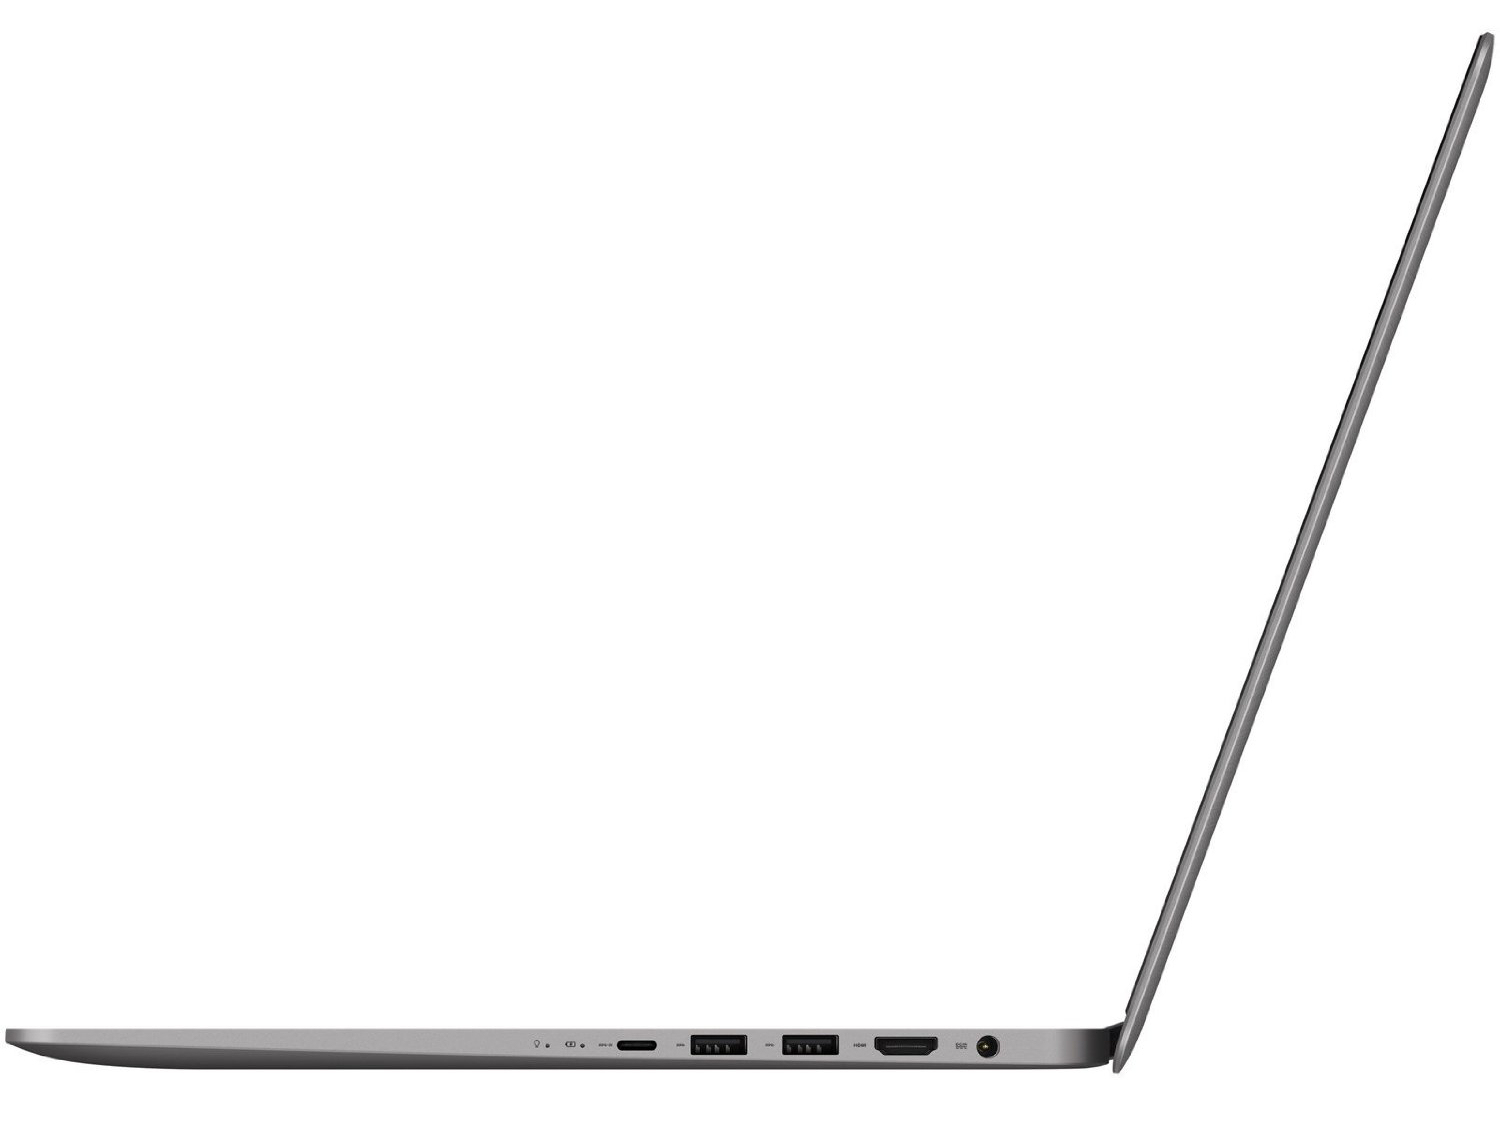
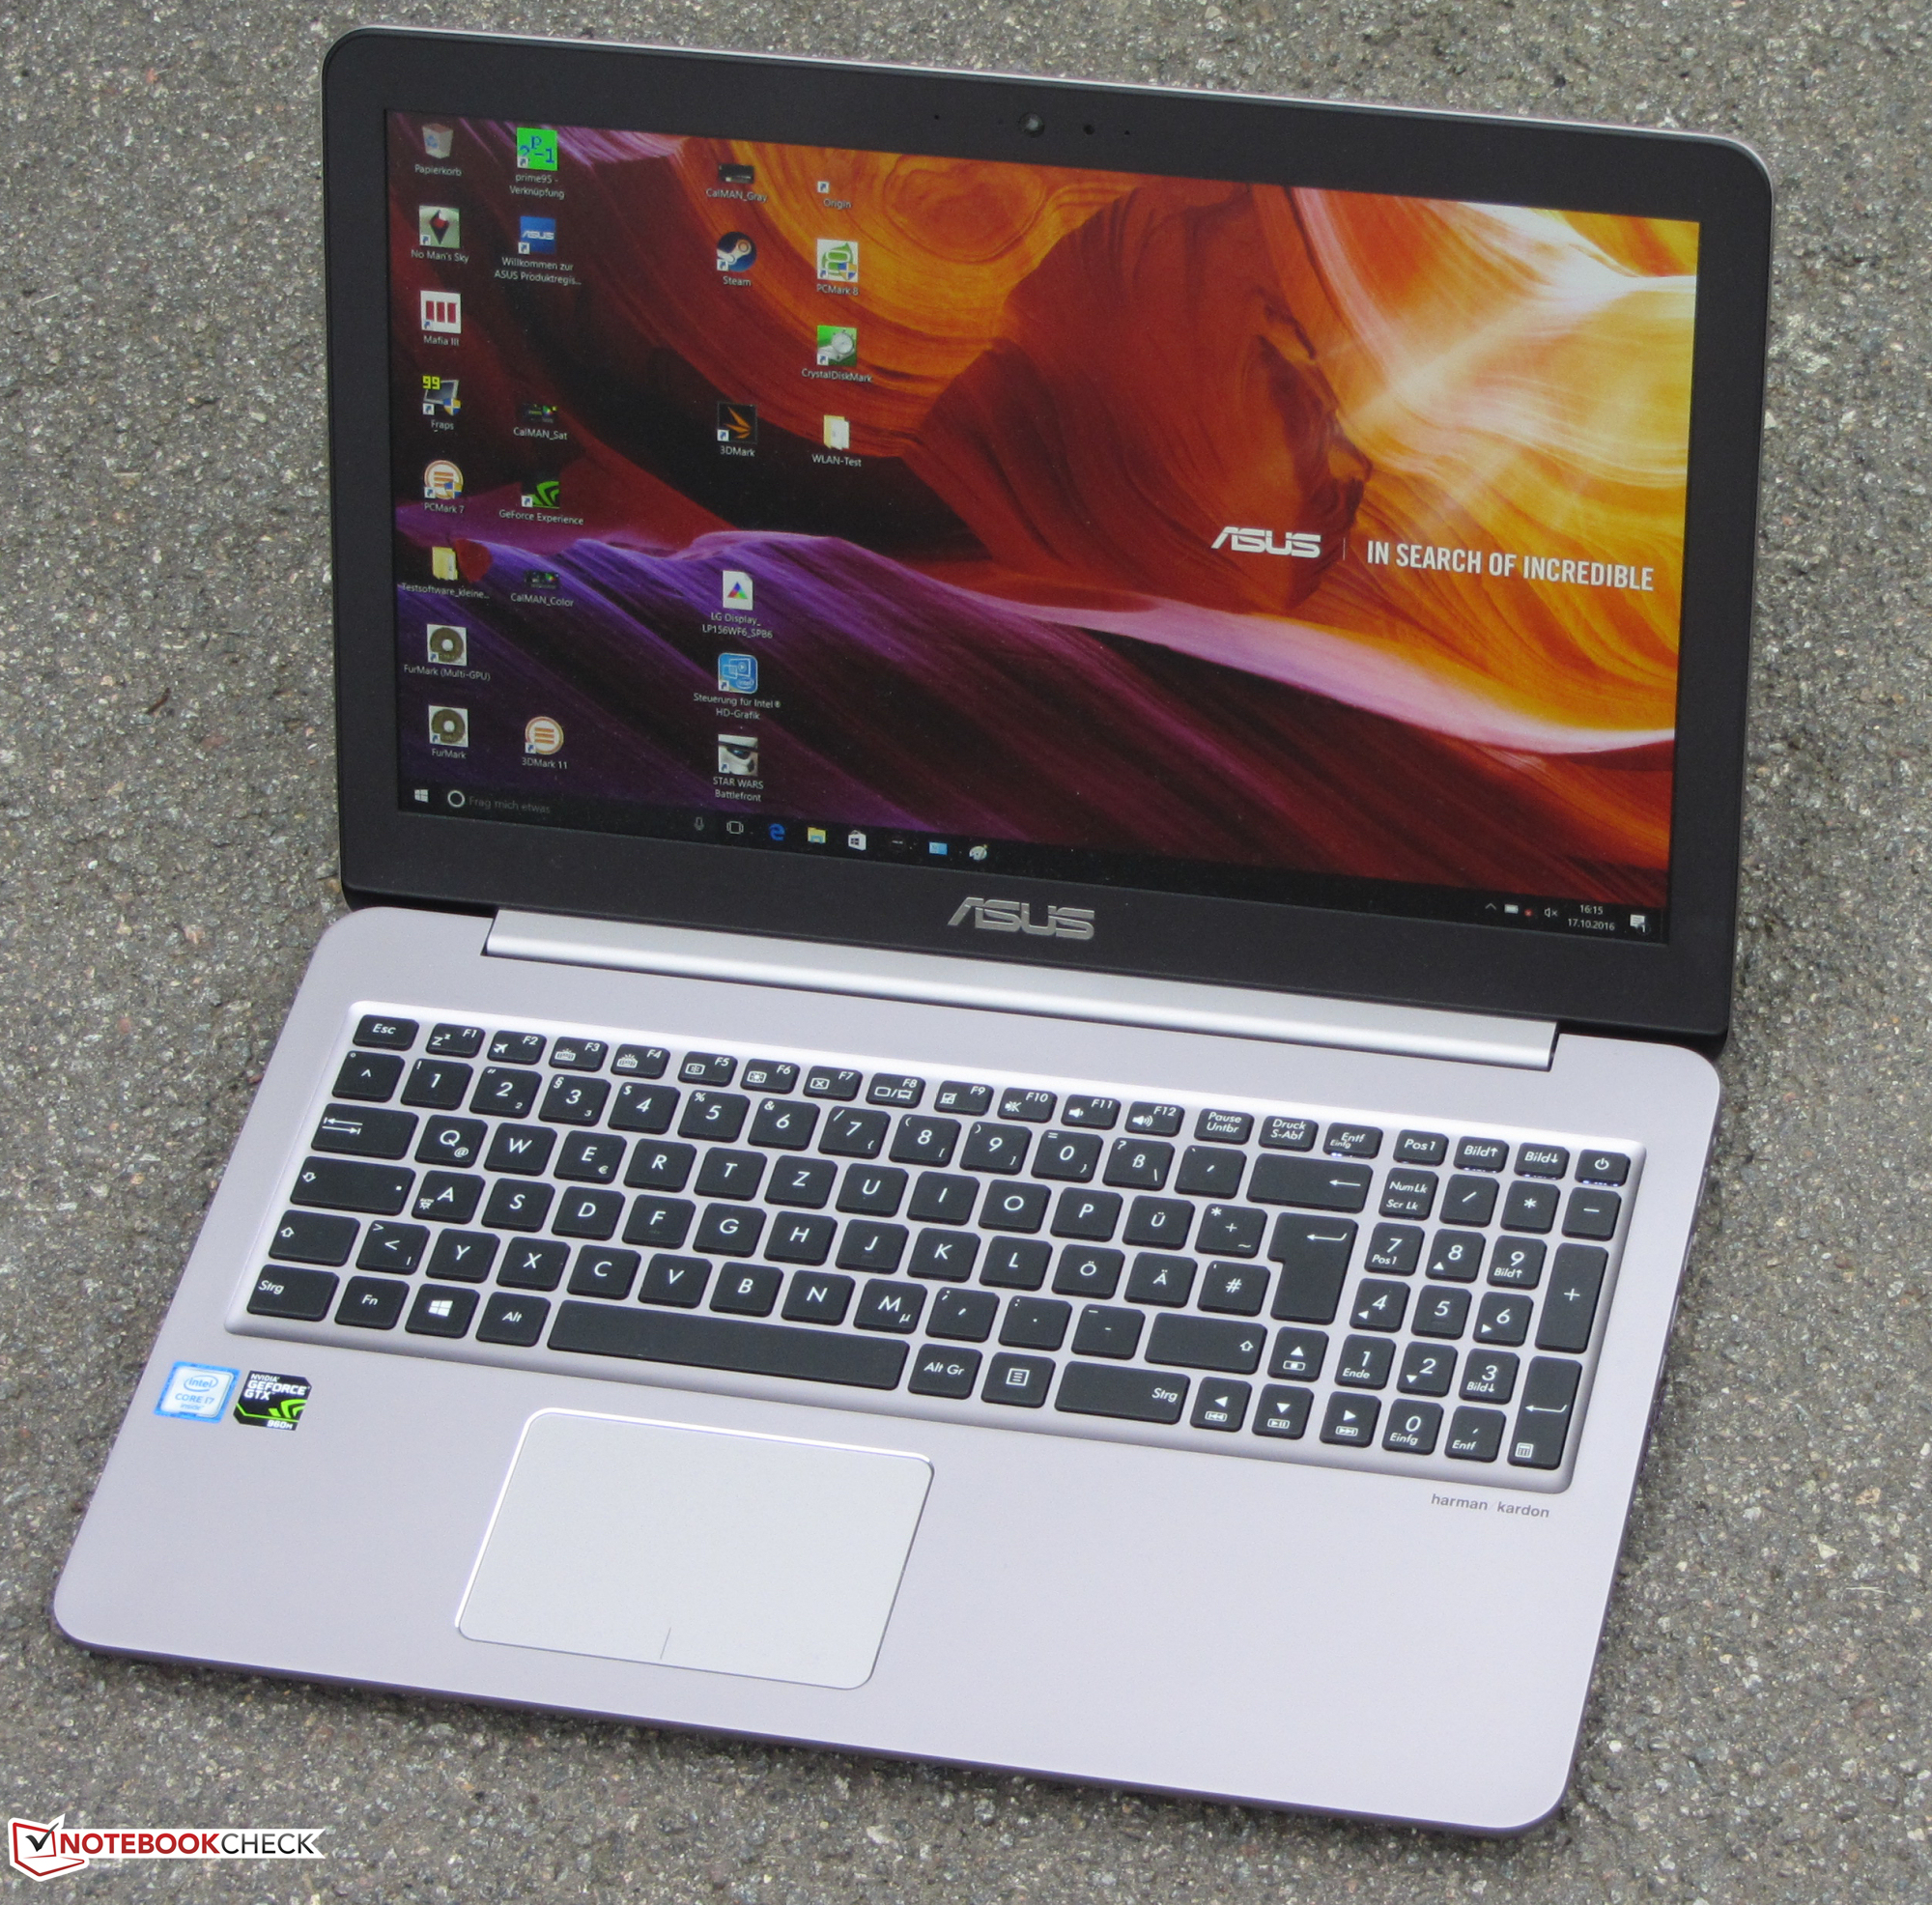
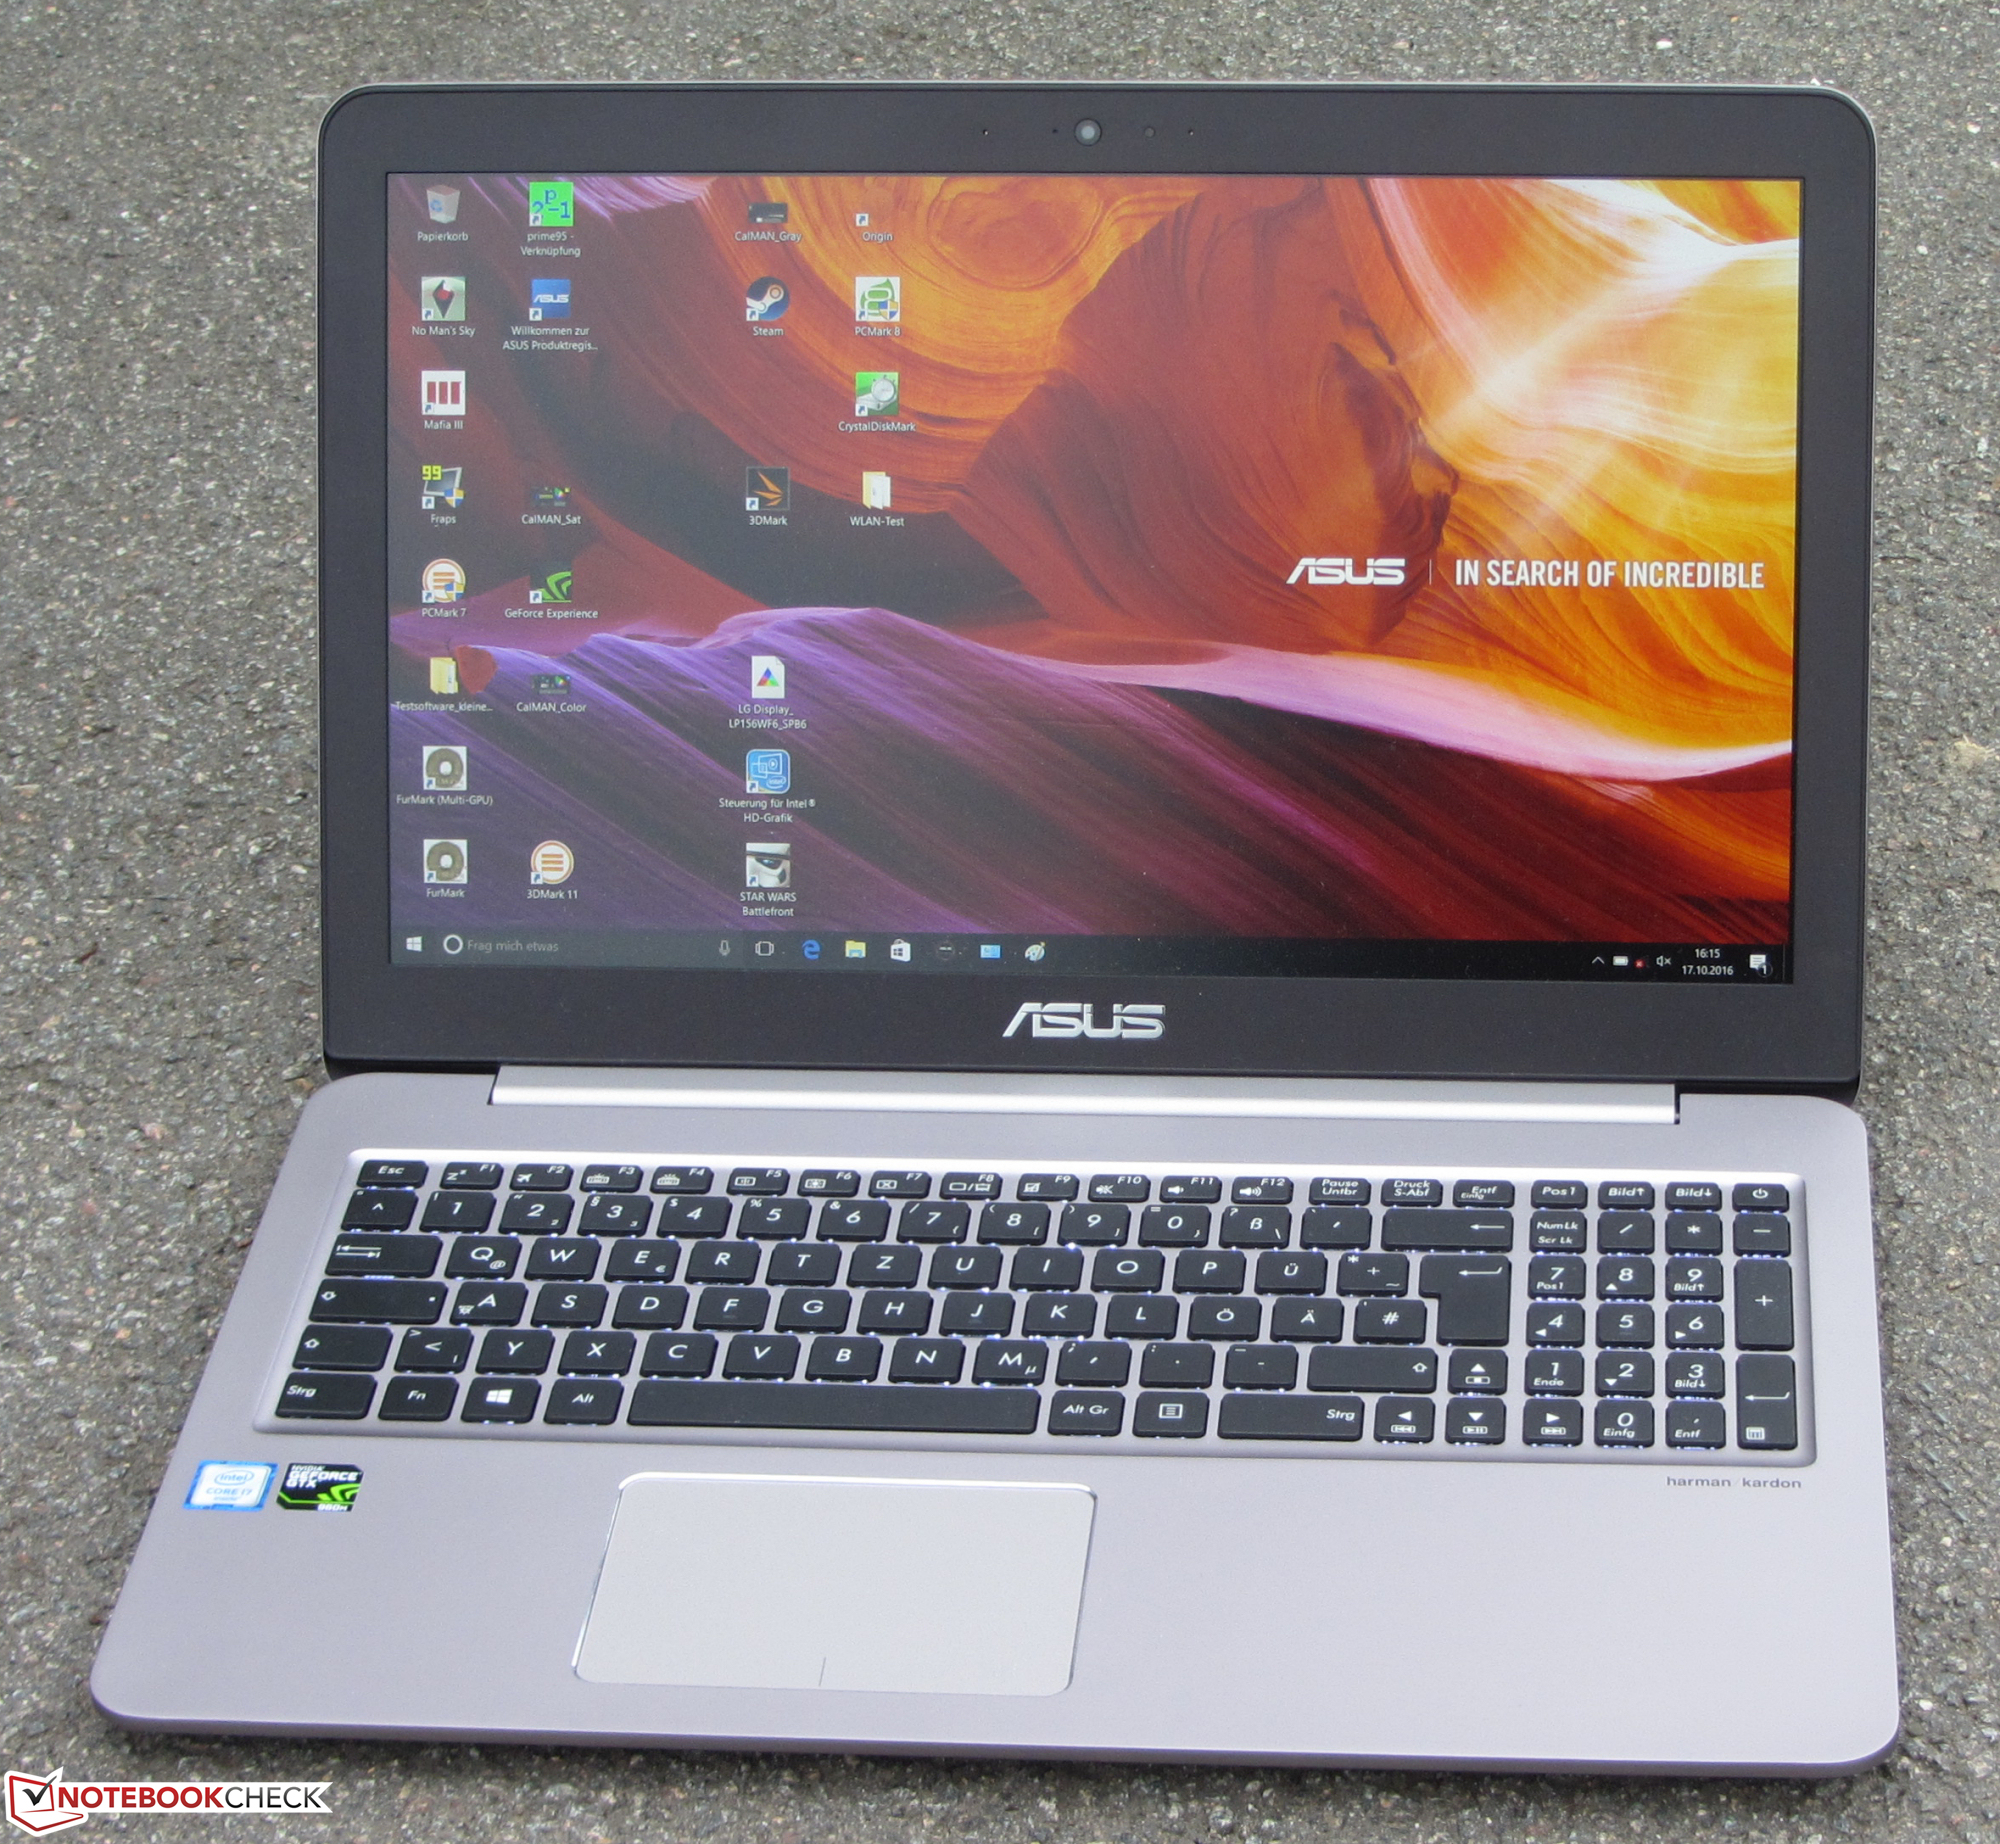
Tuttavia, lo Zenbook non è esente da critiche. La tastiera potrebbe avere una resistenza più netta e un punto di pressione più definito. L'unità di base potrebbe essere più rigida. Questo ci si aspetterebbe in considerazione del prezzo del laptop. Oltre a ciò, una porta Ethernet non è presente - una decisione insolita.
Nota: si tratta di una recensione breve, con alcune sezioni non tradotte, per la versione integrale in inglese guardate qui.
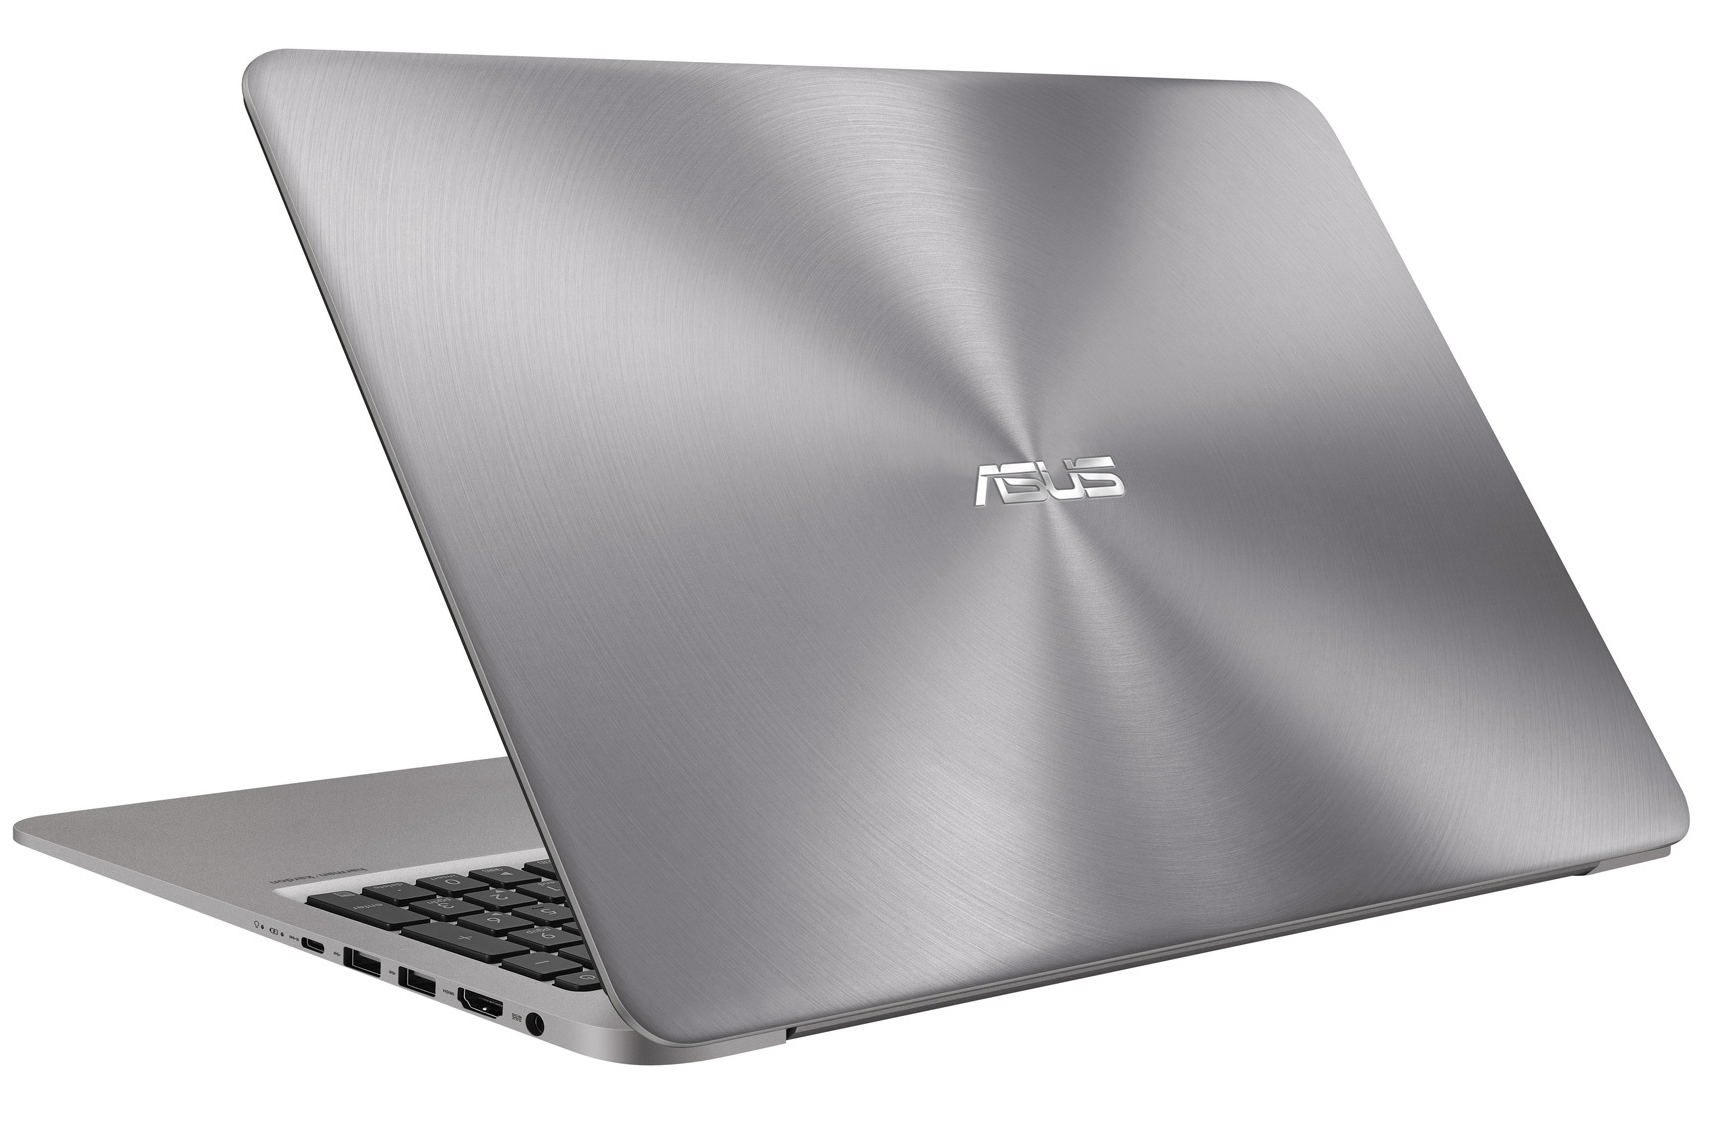
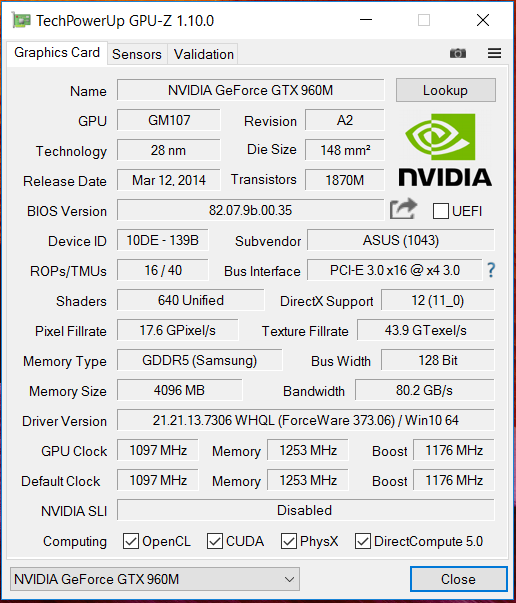
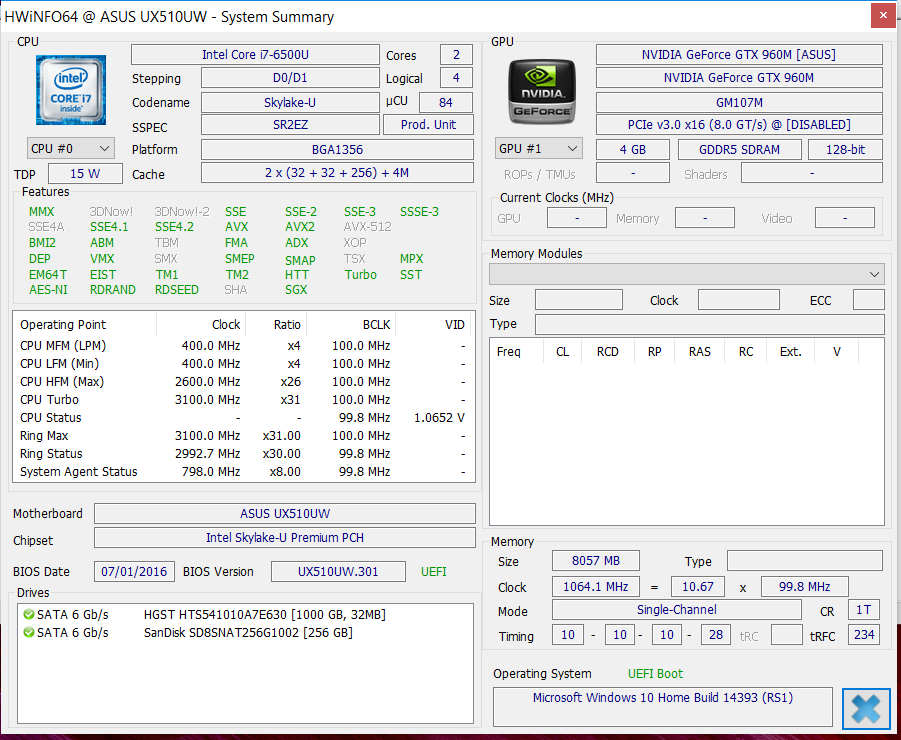
Asus Zenbook UX510UW-CN044T
- 12/09/2016 v6 (old)
Sascha Mölck